UNITED STATES
SECURITIES AND EXCHANGE COMMISSION
Washington, D.C. 20549
FORM N-CSR
CERTIFIED SHAREHOLDER REPORT OF REGISTERED
MANAGEMENT INVESTMENT COMPANIES
|
| | | | | | |
| Investment Company Act file number | 811-05447 |
| | |
| AMERICAN CENTURY QUANTITATIVE EQUITY FUNDS, INC. |
| (Exact name of registrant as specified in charter) |
| | |
| 4500 MAIN STREET, KANSAS CITY, MISSOURI | 64111 |
| (Address of principal executive offices) | (Zip Code) |
| | |
CHARLES A. ETHERINGTON 4500 MAIN STREET, KANSAS CITY, MISSOURI 64111 |
| (Name and address of agent for service) |
| | |
| Registrant’s telephone number, including area code: | 816-531-5575 |
| | |
| Date of fiscal year end: | 06-30 |
| | |
| Date of reporting period: | 06-30-15 |
ITEM 1. REPORTS TO STOCKHOLDERS.
|
| |
| ANNUAL REPORT | JUNE 30, 2015 |
Core Equity Plus Fund
|
| | |
| President's Letter | 2 |
|
| Performance | 3 |
|
| Portfolio Commentary | |
|
| Fund Characteristics | |
|
| Shareholder Fee Example | |
|
| Schedule of Investments | |
|
| Statement of Assets and Liabilities | |
|
| Statement of Operations | |
|
| Statement of Changes in Net Assets | |
|
| Statement of Cash Flows | |
|
| Notes to Financial Statements | |
|
| Financial Highlights | |
|
| Report of Independent Registered Public Accounting Firm | |
|
| Management | |
|
| Approval of Management Agreement | |
|
| Additional Information | |
|
Any opinions expressed in this report reflect those of the author as of the date of the report, and do not necessarily represent the opinions of American Century Investments® or any other person in the American Century Investments organization. Any such opinions are subject to change at any time based upon market or other conditions and American Century Investments disclaims any responsibility to update such opinions. These opinions may not be relied upon as investment advice and, because investment decisions made by American Century Investments funds are based on numerous factors, may not be relied upon as an indication of trading intent on behalf of any American Century Investments fund. Security examples are used for representational purposes only and are not intended as recommendations to purchase or sell securities. Performance information for comparative indices and securities is provided to American Century Investments by third party vendors. To the best of American Century Investments’ knowledge, such information is accurate at the time of printing.
|
| |
| Dear Investor:
Thank you for reviewing this annual report for the 12 months ended June 30, 2015. It provides investment performance and portfolio information for the reporting period, plus longer-term historical performance data.
Annual reports remain important vehicles for conveying information about fund returns, including market and economic factors that affected performance during the reporting period. For additional, updated investment and market insights, we encourage you to visit our website, americancentury.com. |
| Jonathan Thomas |
Global Divergence Favored U.S. Assets
“Global divergence” between the U.S. and the rest of the world emerged as a prevalent theme during the reporting period. This theme embraced not only the relatively stronger economic growth enjoyed by the U.S. compared with most of the world, but also the related contrast between the U.S. Federal Reserve’s unwinding of monetary stimulus compared with the continuation and expansion of stimulus by other major central banks. Low inflation also prevailed, after crude oil prices plunged over 40% amid muted demand for commodities in general. In this environment, the U.S. dollar, U.S. growth stocks, and longer-maturity U.S. Treasuries generally benefited from “flight to quality” capital flows, reinforced by geopolitical and financial turmoil, particularly in Greece, Russia/Ukraine, China, and the Middle East.
Strong global capital flows into U.S. assets generated a global divergence between investment returns for U.S. and non-U.S. markets, especially for U.S. investors who realized their returns in dollar terms. For the reporting period, the U.S. Dollar Index, the S&P 500 Index, and the Barclays U.S. Aggregate Bond Index returned 19.74%, 7.42%, and 1.86%, respectively. By contrast, the MSCI EAFE Index, the MSCI Emerging Markets Index, and the Barclays Global Aggregate Bond ex-USD (Unhedged) Index returned -4.22%, -5.12%, and -13.19%, respectively, for U.S. investors unhedged for the strong dollar’s impact on non-dollar-denominated returns.
We expect more monetary policy divergence between the U.S. and other major developed economies in the coming months, accompanied by continued market volatility. This could present both challenges and opportunities for active investment managers. Upward pressures on inflation and interest rates could develop as the massive amount of global monetary stimulus in progress takes hold and economies improve. In this environment, we continue to believe in a disciplined, diversified, long-term investment approach, using professionally managed stock and bond portfolios to meet financial goals. We appreciate your continued trust in us.
Sincerely,
Jonathan Thomas
President and Chief Executive Officer
American Century Investments
|
| | | | |
| Total Returns as of June 30, 2015 | | |
| | Average Annual Returns | |
| | Ticker Symbol | 1 year | Since Inception | Inception Date |
| Investor Class | ACPVX | 4.84% | 16.61% | 10/31/11 |
| S&P 500 Index | — | 7.42% | 17.06% | — |
| Institutional Class | ACPKX | 5.04% | 16.85% | 10/31/11 |
| A Class | ACPQX | | | 10/31/11 |
| No sales charge* | | 4.59% | 16.33% | |
| With sales charge* | | -1.41% | 14.46% | |
| C Class | ACPHX | 3.77% | 15.44% | 10/31/11 |
| R Class | ACPWX | 4.28% | 16.03% | 10/31/11 |
| |
| * | Sales charges include initial sales charges and contingent deferred sales charges (CDSCs), as applicable. A Class shares have a 5.75% maximum initial sales charge and may be subject to a maximum CDSC of 1.00%. C Class shares redeemed within 12 months of purchase are subject to a maximum CDSC of 1.00%. The SEC requires that mutual funds provide performance information net of maximum sales charges in all cases where charges could be applied. |
Data presented reflect past performance. Past performance is no guarantee of future results. Current performance may be higher or lower than the performance shown. Investment return and principal value will fluctuate, and redemption value may be more or less than original cost. Data assumes reinvestment of dividends and capital gains, and none of the charts reflect the deduction of taxes that a shareholder would pay on fund distributions or the redemption of fund shares. To obtain performance data current to the most recent month end, please call 1-800-345-2021 or visit americancentury.com. For additional information about the fund, please consult the prospectus.
|
|
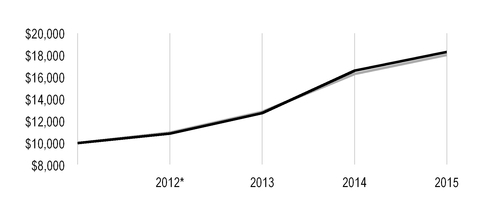
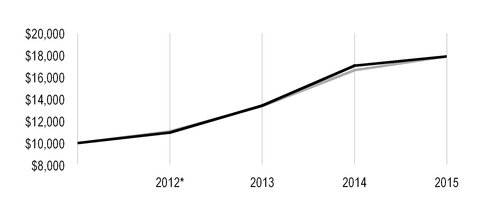
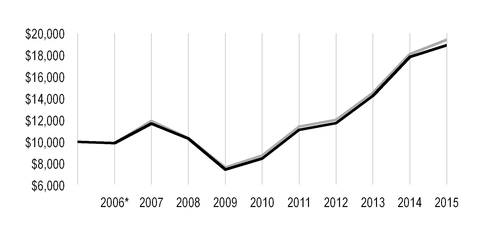
| Growth of $10,000 Over Life of Class |
| $10,000 investment made October 31, 2011 |
| Performance for other share classes will vary due to differences in fee structure. |
|
| |
| Value on June 30, 2015 |
| | Investor Class — $17,564 |
| |
| | S&P 500 Index — $17,816 |
| |
*From October 31, 2011, the Investor Class’s inception date. Not annualized.
|
| | | | |
| Total Annual Fund Operating Expenses |
| Investor Class | Institutional Class | A Class | C Class | R Class |
| 1.77% | 1.57% | 2.02% | 2.77% | 2.27% |
The total annual fund operating expenses shown is as stated in the fund’s prospectus current as of the date of this report. The prospectus may vary from the expense ratio shown elsewhere in this report because it is based on a different time period, includes acquired fund fees and expenses, and, if applicable, does not include fee waivers or expense reimbursements.
Data presented reflect past performance. Past performance is no guarantee of future results. Current performance may be higher or lower than the performance shown. Investment return and principal value will fluctuate, and redemption value may be more or less than original cost. Data assumes reinvestment of dividends and capital gains, and none of the charts reflect the deduction of taxes that a shareholder would pay on fund distributions or the redemption of fund shares. To obtain performance data current to the most recent month end, please call 1-800-345-2021 or visit americancentury.com. For additional information about the fund, please consult the prospectus.
Portfolio Managers: Scott Wittman, Bill Martin and Claudia Musat
Performance Summary
Core Equity Plus returned 4.84%* for the fiscal year ended June 30, 2015, compared with the 7.42% return of its benchmark, the S&P 500 Index.
U.S. equity markets endured substantial volatility, but ended the 12-month period with advances. Core Equity Plus produced gains for the 12-month period, but was unable to match the return of its benchmark. The fund is managed to have a 100% net exposure to the equity market by investing approximately 130% of its net assets in long positions, while 30% of its net assets are sold short. The proceeds from the securities sold short are used to fund the purchase of the additional 30% of long positions. The fund’s stock selection process incorporates factors of valuation, quality, growth, and sentiment while striving to minimize unintended risks along industries and other risk characteristics. Within the fund, growth-based factors proved most difficult, although valuation and sentiment indicators also detracted modestly. Security selection in the information technology and consumer discretionary sectors weighed on relative performance the most, while energy sector positioning and stock selection among industrials contributed to relative gains.
Information Technology Was Leading Detractor
Security selection in the information technology sector was the principal detractor from the fund’s 12-month results. The IT services and computers and peripherals industries were leading drivers of sector underperformance, although leading individual detraction came from a short position (a trade made to benefit from a stock’s decline) in travel and expense management software provider Concur Technologies, which rallied on its acquisition by Germany-based enterprise software giant SAP. The company’s acquisition was completed during the reporting period and the fund’s short position was exited.
The consumer discretionary sector was another area of underperformance, driven by a number of declining specialty retailers including Abercrombie & Fitch. The teen apparel retailer’s stock sank on weak sales, both in the U.S. and in Europe, as young shoppers turned away from clothing sporting the retailer’s logo. The non-benchmark position was ultimately liquidated. Elsewhere in the sector, a portfolio-only position in casino operator Las Vegas Sands was detrimental. The company’s stock price fell dramatically on weaker-than-expected revenue and earnings, and management’s announced dividend increase and two-billion-dollar buyback program were not enough to stave off price declines. Our conviction in the holding is driven by strong quality and valuation insights.
Key detraction came from a short position in Puma Biotechnology, which advanced strongly after the release of positive phase three data for its breast cancer treatment. Despite generally weak fundamentals overall, the trial’s results led us to cover the fund’s short position. A number of portfolio-only positions in the financials sector weighed on the fund’s returns. Shares of real estate management company Altisource Portfolio Solutions declined steeply on disappointing quarterly earnings and again after a New York State investigation implicated a subsidiary. We ultimately eliminated the holding. A position in Nationstar Mortgage Holdings also weighed on results. The residential mortgage servicer reported subdued earnings due to declines in mortgage origination and real estate services. Despite these difficulties, the holding remains strong across sentiment and valuation and has above-average growth insights.
| |
| * | All fund returns referenced in this commentary are for Investor Class shares. Performance for other share classes will vary due to differences in fee structure; when Investor Class performance exceeds that of the fund's benchmark, other share classes may not. See page 3 for returns for all share classes. |
Energy Sector was Leading Contributor
Limited exposure to the underperforming energy sector, particularly underweight positioning, relative to the benchmark, in oil, gas, and consumable fuels holdings, bolstered the fund’s relative returns. Key contribution stemmed from holding less than the benchmark weighting in Chevron, which declined steadily throughout the period together with the price of oil.
Stock selection in the industrials sector also contributed to the fund’s relative returns. A short position in equipment manufacturer Chart Industries bolstered the sector’s return after the company’s stock fell on soft demand in the liquefied natural gas market, for which the company manufactures equipment. We covered the short position during the reporting period. Elsewhere in the sector, shipping company Matson appreciated steeply, rising on unexpectedly strong quarterly results driven by container volume increases.
Gains were also bolstered by an overweight position in Broadcom. The semiconductor designer’s stock rose following strong quarterly results, and again after a merger announcement with industry rival Avago in a deal that is expected to create the world’s leading communications semiconductor company. Our valuation and quality indicators showed modest deterioration late in the period and we liquidated the position. Insurance and managed care provider Aetna was a key contributor, advancing amid merger speculation in the recent wave of health insurance industry consolidation.
A Look Ahead
The U.S. economy seems poised to continue to experience hesitant economic growth through the second half of 2015. Economic activity appears to have somewhat diminished in breadth, though it remains slow yet steady. We believe that divergence in monetary policy between the U.S. and much of the rest of the world is likely to continue. Therefore, questions surrounding when and how much the U.S. Federal Reserve might act to tighten money supply, and the potential impact of such a move, are likely to continue driving investor sentiment in equity markets. Our disciplined, objective, and systematic investment strategy is designed to take advantage of opportunities at the individual company level in both the long and short portions of the portfolio. We believe this approach is the most powerful way to capitalize on market inefficiencies that lead to the mispricing of individual stocks. The fund’s largest overweights are in industrials, health care, and information technology, while the underweights are led by the utilities, energy, and financials sectors.
|
| |
| JUNE 30, 2015 |
| Top Ten Long Holdings | % of net assets |
| Apple, Inc. | 3.99% |
| Johnson & Johnson | 2.21% |
| Microsoft Corp. | 2.18% |
| Pfizer, Inc. | 1.95% |
| Procter & Gamble Co. (The) | 1.91% |
| Bank of America Corp. | 1.74% |
| Merck & Co., Inc. | 1.64% |
| International Business Machines Corp. | 1.57% |
| Cisco Systems, Inc. | 1.56% |
| Intel Corp. | 1.52% |
| | |
| Top Five Short Holdings | % of net assets |
| WEX, Inc. | (0.86)% |
| SunEdison, Inc. | (0.86)% |
| Advisory Board Co. (The) | (0.85)% |
| Louisiana-Pacific Corp. | (0.84)% |
| WR Grace & Co. | (0.81)% |
| | |
| Types of Investments in Portfolio | % of net assets |
| Common Stocks | 128.4% |
| Common Stocks Sold Short | (29.5)% |
| Temporary Cash Investments | 0.9% |
| Other Assets and Liabilities | 0.2% |
Fund shareholders may incur two types of costs: (1) transaction costs, including sales charges (loads) on purchase payments and redemption/exchange fees; and (2) ongoing costs, including management fees; distribution and service (12b-1) fees; and other fund expenses. This example is intended to help you understand your ongoing costs (in dollars) of investing in your fund and to compare these costs with the ongoing cost of investing in other mutual funds.
The example is based on an investment of $1,000 made at the beginning of the period and held for the entire period from January 1, 2015 to June 30, 2015.
Actual Expenses
The table provides information about actual account values and actual expenses for each class. You may use the information, together with the amount you invested, to estimate the expenses that you paid over the period. First, identify the share class you own. Then simply divide your account value by $1,000 (for example, an $8,600 account value divided by $1,000 = 8.6), then multiply the result by the number under the heading “Expenses Paid During Period” to estimate the expenses you paid on your account during this period.
If you hold Investor Class shares of any American Century Investments fund, or Institutional Class shares of the American Century Diversified Bond Fund, in an American Century Investments account (i.e., not a financial intermediary or retirement plan account), American Century Investments may charge you a $12.50 semiannual account maintenance fee if the value of those shares is less than $10,000. We will redeem shares automatically in one of your accounts to pay the $12.50 fee. In determining your total eligible investment amount, we will include your investments in all personal accounts (including American Century Investments Brokerage accounts) registered under your Social Security number. Personal accounts include individual accounts, joint accounts, UGMA/UTMA accounts, personal trusts, Coverdell Education Savings Accounts and IRAs (including traditional, Roth, Rollover, SEP-, SARSEP- and SIMPLE-IRAs), and certain other retirement accounts. If you have only business, business retirement, employer-sponsored or American Century Investments Brokerage accounts, you are currently not subject to this fee. If you are subject to the Account Maintenance Fee, your account value could be reduced by the fee amount.
Hypothetical Example for Comparison Purposes
The table also provides information about hypothetical account values and hypothetical expenses based on the actual expense ratio of each class of your fund and an assumed rate of return of 5% per year before expenses, which is not the actual return of a fund’s share class. The hypothetical account values and expenses may not be used to estimate the actual ending account balance or expenses you paid for the period. You may use this information to compare the ongoing costs of investing in your fund and other funds. To do so, compare this 5% hypothetical example with the 5% hypothetical examples that appear in the shareholder reports of the other funds.
Please note that the expenses shown in the table are meant to highlight your ongoing costs only and do not reflect any transactional costs, such as sales charges (loads) or redemption/exchange fees. Therefore, the table is useful in comparing ongoing costs only, and will not help you determine the relative total costs of owning different funds. In addition, if these transactional costs were included, your costs would have been higher.
|
| | | | |
| | Beginning
Account Value
1/1/15 | Ending
Account Value
6/30/15 | Expenses Paid
During Period(1)1/1/15 - 6/30/15 | Annualized Expense Ratio(1) |
| Actual |
| Investor Class | $1,000 | $989.10 | $8.68 | 1.76% |
| Institutional Class | $1,000 | $989.90 | $7.70 | 1.56% |
| A Class | $1,000 | $988.00 | $9.91 | 2.01% |
| C Class | $1,000 | $984.20 | $13.58 | 2.76% |
| R Class | $1,000 | $986.20 | $11.13 | 2.26% |
| Hypothetical |
| Investor Class | $1,000 | $1,016.07 | $8.80 | 1.76% |
| Institutional Class | $1,000 | $1,017.06 | $7.80 | 1.56% |
| A Class | $1,000 | $1,014.83 | $10.04 | 2.01% |
| C Class | $1,000 | $1,011.11 | $13.76 | 2.76% |
| R Class | $1,000 | $1,013.59 | $11.28 | 2.26% |
| |
| (1) | Expenses are equal to the class's annualized expense ratio listed in the table above, multiplied by the average account value over the period, multiplied by 181, the number of days in the most recent fiscal half-year, divided by 365, to reflect the one-half year period. |
JUNE 30, 2015
|
| | | | | |
| | Shares | Value |
| COMMON STOCKS — 128.4% | | |
| Aerospace and Defense — 5.1% | | |
Boeing Co. (The)(1) | 9,495 |
| $ | 1,317,146 |
|
Honeywell International, Inc.(1) | 19,405 |
| 1,978,728 |
|
| Huntington Ingalls Industries, Inc. | 10,965 |
| 1,234,549 |
|
Moog, Inc., Class A(2) | 5,439 |
| 384,429 |
|
Spirit AeroSystems Holdings, Inc., Class A(2) | 22,978 |
| 1,266,318 |
|
Teledyne Technologies, Inc.(1)(2) | 3,301 |
| 348,288 |
|
Textron, Inc.(1) | 31,175 |
| 1,391,340 |
|
| Triumph Group, Inc. | 8,506 |
| 561,311 |
|
| | | 8,482,109 |
|
| Air Freight and Logistics — 0.1% | | |
United Parcel Service, Inc., Class B(1) | 1,981 |
| 191,979 |
|
| Airlines — 1.4% | | |
Southwest Airlines Co.(1) | 34,524 |
| 1,142,399 |
|
United Continental Holdings, Inc.(1)(2) | 24,073 |
| 1,276,110 |
|
| | | 2,418,509 |
|
| Auto Components — 0.1% | | |
| Delphi Automotive plc | 2,296 |
| 195,367 |
|
| Automobiles — 0.1% | | |
| General Motors Co. | 7,344 |
| 244,776 |
|
| Banks — 3.7% | | |
Bank of America Corp.(1) | 170,981 |
| 2,910,097 |
|
Citigroup, Inc.(1) | 22,052 |
| 1,218,152 |
|
JPMorgan Chase & Co.(1) | 14,392 |
| 975,202 |
|
Wells Fargo & Co.(1) | 17,829 |
| 1,002,703 |
|
| | | 6,106,154 |
|
| Beverages — 2.6% | | |
Coca-Cola Co. (The)(1) | 4,501 |
| 176,574 |
|
Dr Pepper Snapple Group, Inc.(1) | 21,533 |
| 1,569,756 |
|
PepsiCo, Inc.(1) | 26,975 |
| 2,517,846 |
|
| | | 4,264,176 |
|
| Biotechnology — 4.0% | | |
Amgen, Inc.(1) | 9,447 |
| 1,450,304 |
|
Biogen, Inc.(1)(2) | 3,138 |
| 1,267,564 |
|
Celgene Corp.(1)(2) | 10,465 |
| 1,211,167 |
|
Gilead Sciences, Inc.(1) | 16,703 |
| 1,955,587 |
|
Medivation, Inc.(2) | 3,737 |
| 426,765 |
|
United Therapeutics Corp.(1)(2) | 2,393 |
| 416,262 |
|
| | | 6,727,649 |
|
| Building Products — 0.5% | | |
USG Corp.(1)(2) | 29,365 |
| 816,053 |
|
|
| | | | | |
| | Shares | Value |
| Capital Markets — 4.1% | | |
Ameriprise Financial, Inc.(1) | 11,778 |
| $ | 1,471,425 |
|
| Artisan Partners Asset Management, Inc., Class A | 14,567 |
| 676,783 |
|
Evercore Partners, Inc., Class A(1) | 26,230 |
| 1,415,371 |
|
Franklin Resources, Inc.(1) | 28,284 |
| 1,386,764 |
|
Legg Mason, Inc.(1) | 24,907 |
| 1,283,458 |
|
Waddell & Reed Financial, Inc., Class A(1) | 12,096 |
| 572,262 |
|
| | | 6,806,063 |
|
| Chemicals — 3.3% | | |
Cabot Corp.(1) | 30,783 |
| 1,147,898 |
|
Dow Chemical Co. (The)(1) | 35,622 |
| 1,822,778 |
|
E.I. du Pont de Nemours & Co.(1) | 24,428 |
| 1,562,170 |
|
LyondellBasell Industries NV, Class A(1) | 10,034 |
| 1,038,720 |
|
| | | 5,571,566 |
|
| Commercial Services and Supplies — 2.4% | | |
Deluxe Corp.(1) | 17,495 |
| 1,084,690 |
|
Herman Miller, Inc.(1) | 43,020 |
| 1,244,569 |
|
Pitney Bowes, Inc.(1) | 51,444 |
| 1,070,550 |
|
| Waste Management, Inc. | 14,438 |
| 669,201 |
|
| | | 4,069,010 |
|
| Communications Equipment — 3.7% | | |
Brocade Communications Systems, Inc.(1) | 119,948 |
| 1,424,982 |
|
Cisco Systems, Inc.(1) | 94,966 |
| 2,607,766 |
|
QUALCOMM, Inc.(1) | 34,001 |
| 2,129,483 |
|
| | | 6,162,231 |
|
| Consumer Finance — 1.0% | | |
Credit Acceptance Corp.(1)(2) | 6,521 |
| 1,605,340 |
|
| Containers and Packaging — 0.3% | | |
Berry Plastics Group, Inc.(2) | 13,048 |
| 422,755 |
|
| Diversified Consumer Services — 0.7% | | |
H&R Block, Inc.(1) | 41,886 |
| 1,241,920 |
|
| Diversified Financial Services — 0.5% | | |
Berkshire Hathaway, Inc., Class B(1)(2) | 6,295 |
| 856,812 |
|
| Diversified Telecommunication Services — 0.5% | | |
AT&T, Inc.(1) | 9,339 |
| 331,721 |
|
Verizon Communications, Inc.(1) | 10,921 |
| 509,028 |
|
| | | 840,749 |
|
| Electric Utilities — 0.5% | | |
Entergy Corp.(1) | 7,827 |
| 551,803 |
|
| NextEra Energy, Inc. | 2,164 |
| 212,137 |
|
| | | 763,940 |
|
| Electrical Equipment — 1.8% | | |
Emerson Electric Co.(1) | 28,604 |
| 1,585,519 |
|
Rockwell Automation, Inc.(1) | 11,248 |
| 1,401,951 |
|
| | | 2,987,470 |
|
|
| | | | | |
| | Shares | Value |
| Electronic Equipment, Instruments and Components — 1.1% | | |
Corning, Inc.(1) | 73,322 |
| $ | 1,446,643 |
|
Dolby Laboratories, Inc., Class A(1) | 8,633 |
| 342,558 |
|
| | | 1,789,201 |
|
| Energy Equipment and Services — 2.6% | | |
Dril-Quip, Inc.(2) | 11,123 |
| 837,006 |
|
FMC Technologies, Inc.(2) | 6,552 |
| 271,842 |
|
Schlumberger Ltd.(1) | 26,273 |
| 2,264,470 |
|
Superior Energy Services, Inc.(1) | 48,627 |
| 1,023,112 |
|
| | | 4,396,430 |
|
| Food and Staples Retailing — 3.5% | | |
CVS Health Corp.(1) | 22,502 |
| 2,360,010 |
|
| Kroger Co. (The) | 6,688 |
| 484,947 |
|
SUPERVALU, Inc.(1)(2) | 83,112 |
| 672,376 |
|
Wal-Mart Stores, Inc.(1) | 31,636 |
| 2,243,941 |
|
| | | 5,761,274 |
|
| Food Products — 4.3% | | |
Archer-Daniels-Midland Co.(1) | 32,978 |
| 1,590,199 |
|
Bunge Ltd.(1) | 13,974 |
| 1,226,917 |
|
ConAgra Foods, Inc.(1) | 21,987 |
| 961,272 |
|
| Dean Foods Co. | 26,272 |
| 424,818 |
|
| Ingredion, Inc. | 3,566 |
| 284,603 |
|
Pilgrim's Pride Corp.(1) | 42,817 |
| 983,507 |
|
Sanderson Farms, Inc.(1) | 14,540 |
| 1,092,826 |
|
Seaboard Corp.(2) | 150 |
| 539,850 |
|
| | | 7,103,992 |
|
| Health Care Equipment and Supplies — 3.2% | | |
Boston Scientific Corp.(2) | 10,442 |
| 184,823 |
|
| C.R. Bard, Inc. | 855 |
| 145,949 |
|
DENTSPLY International, Inc.(1) | 19,878 |
| 1,024,711 |
|
Hologic, Inc.(2) | 7,935 |
| 302,006 |
|
St. Jude Medical, Inc.(1) | 21,417 |
| 1,564,940 |
|
Stryker Corp.(1) | 16,114 |
| 1,540,015 |
|
| Teleflex, Inc. | 4,519 |
| 612,099 |
|
| | | 5,374,543 |
|
| Health Care Providers and Services — 4.4% | | |
Aetna, Inc.(1) | 13,901 |
| 1,771,821 |
|
| Cardinal Health, Inc. | 2,786 |
| 233,049 |
|
Express Scripts Holding Co.(2) | 15,100 |
| 1,342,994 |
|
HCA Holdings, Inc.(1)(2) | 19,327 |
| 1,753,345 |
|
Health Net, Inc.(1)(2) | 12,740 |
| 816,889 |
|
Molina Healthcare, Inc.(2) | 8,543 |
| 600,573 |
|
| UnitedHealth Group, Inc. | 6,520 |
| 795,440 |
|
| | | 7,314,111 |
|
| Health Care Technology — 1.2% | | |
Allscripts Healthcare Solutions, Inc.(1)(2) | 44,801 |
| 612,878 |
|
Cerner Corp.(1)(2) | 20,472 |
| 1,413,796 |
|
| | | 2,026,674 |
|
|
| | | | | |
| | Shares | Value |
| Hotels, Restaurants and Leisure — 4.6% | | |
Brinker International, Inc.(1) | 23,168 |
| $ | 1,335,635 |
|
| Cracker Barrel Old Country Store, Inc. | 9,084 |
| 1,354,969 |
|
| Darden Restaurants, Inc. | 9,664 |
| 686,917 |
|
Diamond Resorts International, Inc.(2) | 22,279 |
| 702,903 |
|
Las Vegas Sands Corp.(1) | 24,001 |
| 1,261,733 |
|
| Marriott Vacations Worldwide Corp. | 7,724 |
| 708,677 |
|
| SeaWorld Entertainment, Inc. | 11,335 |
| 209,017 |
|
| Vail Resorts, Inc. | 8,419 |
| 919,355 |
|
Wyndham Worldwide Corp.(1) | 6,915 |
| 566,408 |
|
| | | 7,745,614 |
|
| Household Durables — 0.7% | | |
| Garmin Ltd. | 7,078 |
| 310,937 |
|
| Harman International Industries, Inc. | 7,393 |
| 879,323 |
|
| | | 1,190,260 |
|
| Household Products — 1.9% | | |
Procter & Gamble Co. (The)(1) | 40,718 |
| 3,185,776 |
|
| Industrial Conglomerates — 2.9% | | |
3M Co.(1) | 13,943 |
| 2,151,405 |
|
Danaher Corp.(1) | 17,264 |
| 1,477,626 |
|
General Electric Co.(1) | 44,209 |
| 1,174,633 |
|
| | | 4,803,664 |
|
| Insurance — 1.3% | | |
| Allstate Corp. (The) | 18,365 |
| 1,191,338 |
|
Amtrust Financial Services, Inc.(1) | 4,590 |
| 300,691 |
|
| Hanover Insurance Group, Inc. (The) | 8,312 |
| 615,337 |
|
| | | 2,107,366 |
|
| Internet and Catalog Retail — 0.3% | | |
Expedia, Inc.(1) | 3,688 |
| 403,283 |
|
Liberty Interactive Corp. QVC Group, Class A(2) | 2,951 |
| 81,890 |
|
| | | 485,173 |
|
| Internet Software and Services — 2.6% | | |
eBay, Inc.(1)(2) | 32,678 |
| 1,968,523 |
|
Facebook, Inc., Class A(2) | 3,892 |
| 333,797 |
|
Google, Inc., Class A(1)(2) | 3,540 |
| 1,911,742 |
|
VeriSign, Inc.(2) | 1,459 |
| 90,049 |
|
| | | 4,304,111 |
|
| IT Services — 3.9% | | |
Accenture plc, Class A(1) | 19,461 |
| 1,883,436 |
|
Amdocs Ltd.(1) | 6,764 |
| 369,247 |
|
Computer Sciences Corp.(1) | 14,117 |
| 926,640 |
|
| Convergys Corp. | 7,593 |
| 193,546 |
|
International Business Machines Corp.(1) | 16,120 |
| 2,622,079 |
|
Teradata Corp.(1)(2) | 5,383 |
| 199,171 |
|
| Western Union Co. (The) | 6,461 |
| 131,352 |
|
| Xerox Corp. | 12,810 |
| 136,298 |
|
| | | 6,461,769 |
|
|
| | | | | |
| | Shares | Value |
| Life Sciences Tools and Services — 1.0% | | |
Bio-Rad Laboratories, Inc., Class A(1)(2) | 10,433 |
| $ | 1,571,314 |
|
Bruker Corp.(1)(2) | 5,245 |
| 107,051 |
|
| | | 1,678,365 |
|
| Machinery — 4.4% | | |
Caterpillar, Inc.(1) | 20,510 |
| 1,739,658 |
|
Cummins, Inc.(1) | 10,949 |
| 1,436,399 |
|
| Illinois Tool Works, Inc. | 9,048 |
| 830,516 |
|
| PACCAR, Inc. | 6,185 |
| 394,665 |
|
Parker-Hannifin Corp.(1) | 11,844 |
| 1,377,813 |
|
Stanley Black & Decker, Inc.(1) | 14,462 |
| 1,521,981 |
|
| | | 7,301,032 |
|
| Marine — 0.5% | | |
Matson, Inc.(1) | 19,768 |
| 831,047 |
|
| Media — 3.3% | | |
Cablevision Systems Corp., Class A(1) | 66,272 |
| 1,586,552 |
|
Comcast Corp., Class A(1) | 19,904 |
| 1,197,027 |
|
DIRECTV(2) | 4,233 |
| 392,780 |
|
| Omnicom Group, Inc. | 11,751 |
| 816,577 |
|
| Scripps Networks Interactive, Inc., Class A | 13,176 |
| 861,315 |
|
| Viacom, Inc., Class B | 6,216 |
| 401,802 |
|
Walt Disney Co. (The)(1) | 2,616 |
| 298,590 |
|
| | | 5,554,643 |
|
| Metals and Mining — 1.4% | | |
Alcoa, Inc.(1) | 103,944 |
| 1,158,976 |
|
United States Steel Corp.(1) | 58,296 |
| 1,202,063 |
|
| | | 2,361,039 |
|
| Multi-Utilities — 0.3% | | |
| Public Service Enterprise Group, Inc. | 14,002 |
| 549,999 |
|
| Multiline Retail — 3.2% | | |
Big Lots, Inc.(1) | 30,850 |
| 1,387,942 |
|
Dillard's, Inc., Class A(1) | 8,136 |
| 855,826 |
|
| Kohl's Corp. | 21,112 |
| 1,321,822 |
|
Macy's, Inc.(1) | 1,202 |
| 81,099 |
|
Target Corp.(1) | 21,554 |
| 1,759,453 |
|
| | | 5,406,142 |
|
| Oil, Gas and Consumable Fuels — 5.4% | | |
Chevron Corp.(1) | 4,240 |
| 409,033 |
|
| CVR Energy, Inc. | 33,612 |
| 1,265,156 |
|
Denbury Resources, Inc.(1) | 38,164 |
| 242,723 |
|
EOG Resources, Inc.(1) | 8,532 |
| 746,977 |
|
Exxon Mobil Corp.(1) | 22,807 |
| 1,897,542 |
|
Murphy Oil Corp.(1) | 31,194 |
| 1,296,734 |
|
Valero Energy Corp.(1) | 30,377 |
| 1,901,600 |
|
Western Refining, Inc.(1) | 28,484 |
| 1,242,472 |
|
| | | 9,002,237 |
|
|
| | | | | |
| | Shares | Value |
| Paper and Forest Products — 0.2% | | |
| Domtar Corp. | 3,343 |
| $ | 138,400 |
|
| International Paper Co. | 2,934 |
| 139,629 |
|
| | | 278,029 |
|
| Personal Products — 0.2% | | |
Avon Products, Inc.(1) | 50,305 |
| 314,909 |
|
| Pharmaceuticals — 7.2% | | |
AbbVie, Inc.(1) | 36,010 |
| 2,419,512 |
|
Johnson & Johnson(1) | 37,768 |
| 3,680,869 |
|
Merck & Co., Inc.(1) | 47,941 |
| 2,729,281 |
|
Pfizer, Inc.(1) | 96,987 |
| 3,251,974 |
|
| | | 12,081,636 |
|
| Professional Services — 0.2% | | |
ManpowerGroup, Inc.(1) | 2,925 |
| 261,436 |
|
TriNet Group, Inc.(2) | 4,739 |
| 120,134 |
|
| | | 381,570 |
|
| Real Estate Investment Trusts (REITs) — 3.0% | | |
Hospitality Properties Trust(1) | 41,091 |
| 1,184,243 |
|
Lamar Advertising Co., Class A(1) | 21,461 |
| 1,233,578 |
|
| Plum Creek Timber Co., Inc. | 3,912 |
| 158,710 |
|
| RLJ Lodging Trust | 42,031 |
| 1,251,683 |
|
Ryman Hospitality Properties, Inc.(1) | 21,433 |
| 1,138,307 |
|
| | | 4,966,521 |
|
| Real Estate Management and Development — 1.6% | | |
CBRE Group, Inc.(1)(2) | 34,925 |
| 1,292,225 |
|
| Jones Lang LaSalle, Inc. | 7,620 |
| 1,303,020 |
|
| | | 2,595,245 |
|
| Semiconductors and Semiconductor Equipment — 2.7% | | |
Fairchild Semiconductor International, Inc.(2) | 5,624 |
| 97,745 |
|
Intel Corp.(1) | 83,507 |
| 2,539,865 |
|
| Marvell Technology Group Ltd. | 9,479 |
| 124,981 |
|
Micron Technology, Inc.(1)(2) | 20,750 |
| 390,930 |
|
Texas Instruments, Inc.(1) | 25,261 |
| 1,301,194 |
|
| | | 4,454,715 |
|
| Software — 6.2% | | |
| Activision Blizzard, Inc. | 12,803 |
| 309,961 |
|
Cadence Design Systems, Inc.(1)(2) | 66,598 |
| 1,309,317 |
|
Electronic Arts, Inc.(2) | 7,870 |
| 523,355 |
|
Mentor Graphics Corp.(1) | 31,358 |
| 828,792 |
|
Microsoft Corp.(1) | 82,339 |
| 3,635,267 |
|
Oracle Corp.(1) | 59,724 |
| 2,406,877 |
|
Symantec Corp.(1) | 4,926 |
| 114,529 |
|
Synopsys, Inc.(1)(2) | 25,422 |
| 1,287,624 |
|
| | | 10,415,722 |
|
| Specialty Retail — 3.7% | | |
Best Buy Co., Inc.(1) | 20,617 |
| 672,320 |
|
|
| | | | | |
| | Shares | Value |
Foot Locker, Inc.(1) | 22,490 |
| $ | 1,507,055 |
|
Gap, Inc. (The)(1) | 33,641 |
| 1,284,077 |
|
Lowe's Cos., Inc.(1) | 28,855 |
| 1,932,419 |
|
Murphy USA, Inc.(1)(2) | 13,585 |
| 758,315 |
|
| | | 6,154,186 |
|
| Technology Hardware, Storage and Peripherals — 7.1% | | |
Apple, Inc.(1) | 53,098 |
| 6,659,816 |
|
EMC Corp.(1) | 68,390 |
| 1,804,812 |
|
Hewlett-Packard Co.(1) | 53,005 |
| 1,590,680 |
|
| NetApp, Inc. | 2,940 |
| 92,786 |
|
SanDisk Corp.(1) | 8,480 |
| 493,706 |
|
Seagate Technology plc(1) | 4,964 |
| 235,790 |
|
Western Digital Corp.(1) | 12,438 |
| 975,388 |
|
| | | 11,852,978 |
|
| Textiles, Apparel and Luxury Goods — 0.7% | | |
| Wolverine World Wide, Inc. | 40,084 |
| 1,141,592 |
|
| Thrifts and Mortgage Finance — 1.2% | | |
Essent Group Ltd.(2) | 47,914 |
| 1,310,448 |
|
Nationstar Mortgage Holdings, Inc.(1)(2) | 43,313 |
| 727,658 |
|
| | | 2,038,106 |
|
TOTAL COMMON STOCKS (Cost $191,375,967) | | 214,184,299 |
|
| TEMPORARY CASH INVESTMENTS — 0.9% | | |
Repurchase Agreement, Bank of America Merrill Lynch, (collateralized by various U.S. Treasury obligations, 1.50%, 1/31/19 - 11/30/19, valued at $264,657), in a joint trading account at 0.10%, dated 6/30/15, due 7/1/15 (Delivery value $259,377) | | 259,376 |
|
| Repurchase Agreement, Fixed Income Clearing Corp., (collateralized by various U.S. Treasury obligations, 2.375%, 8/15/24, valued at $1,063,378), at 0.01%, dated 6/30/15, due 7/1/15 (Delivery value $1,038,000) | | 1,038,000 |
|
| State Street Institutional Liquid Reserves Fund, Premier Class | 257,595 |
| 257,595 |
|
TOTAL TEMPORARY CASH INVESTMENTS (Cost $1,554,971) | | 1,554,971 |
|
TOTAL INVESTMENT SECURITIES BEFORE SECURITIES SOLD SHORT — 129.3% (Cost $192,930,938) | 215,739,270 |
|
| COMMON STOCKS SOLD SHORT — (29.5)% | | |
| Aerospace and Defense — (1.2)% | | |
| DigitalGlobe, Inc. | (41,710 | ) | (1,159,121 | ) |
| Orbital ATK, Inc. | (11,007 | ) | (807,473 | ) |
| | | (1,966,594 | ) |
| Air Freight and Logistics — (0.2)% | | |
| UTi Worldwide, Inc. | (31,634 | ) | (316,024 | ) |
| Airlines — (0.9)% | | |
| Allegiant Travel Co. | (4,115 | ) | (731,976 | ) |
| Spirit Airlines, Inc. | (13,230 | ) | (821,583 | ) |
| | | (1,553,559 | ) |
| Auto Components — (0.9)% | | |
| BorgWarner, Inc. | (10,221 | ) | (580,962 | ) |
| Visteon Corp. | (8,388 | ) | (880,572 | ) |
| | | (1,461,534 | ) |
|
| | | | | |
| | Shares | Value |
| Chemicals — (1.1)% | | |
| Platform Specialty Products Corp. | (4,131 | ) | $ | (105,671 | ) |
| Tronox Ltd., Class A | (23,248 | ) | (340,118 | ) |
| WR Grace & Co. | (13,454 | ) | (1,349,436 | ) |
| | | (1,795,225 | ) |
| Communications Equipment — (0.9)% | | |
| Motorola Solutions, Inc. | (19,559 | ) | (1,121,513 | ) |
| ViaSat, Inc. | (6,955 | ) | (419,108 | ) |
| | | (1,540,621 | ) |
| Construction and Engineering — (1.4)% | | |
| AECOM | (40,495 | ) | (1,339,574 | ) |
| Granite Construction, Inc. | (30,482 | ) | (1,082,416 | ) |
| | | (2,421,990 | ) |
| Diversified Financial Services — (0.7)% | | |
| Leucadia National Corp. | (47,703 | ) | (1,158,229 | ) |
| Electric Utilities — (0.1)% | | |
| ALLETE, Inc. | (5,087 | ) | (235,986 | ) |
| Electrical Equipment — (0.3)% | | |
| Franklin Electric Co., Inc. | (16,211 | ) | (524,102 | ) |
| Electronic Equipment, Instruments and Components — (1.6)% | | |
| Anixter International, Inc. | (18,727 | ) | (1,220,064 | ) |
| FEI Co. | (12,227 | ) | (1,013,985 | ) |
| SYNNEX Corp. | (2,554 | ) | (186,928 | ) |
| Zebra Technologies Corp., Class A | (1,825 | ) | (202,666 | ) |
| | | (2,623,643 | ) |
| Energy Equipment and Services — (1.3)% | | |
| Bristow Group, Inc. | (14,942 | ) | (796,409 | ) |
| Rowan Cos. plc | (60,640 | ) | (1,280,110 | ) |
| RPC, Inc. | (8,763 | ) | (121,192 | ) |
| | | (2,197,711 | ) |
| Food and Staples Retailing — (1.2)% | | |
| PriceSmart, Inc. | (14,187 | ) | (1,294,422 | ) |
| United Natural Foods, Inc. | (10,819 | ) | (688,954 | ) |
| | | (1,983,376 | ) |
| Food Products — (0.6)% | | |
| Post Holdings, Inc. | (17,270 | ) | (931,371 | ) |
| Gas Utilities — (0.2)% | | |
| South Jersey Industries, Inc. | (13,401 | ) | (331,407 | ) |
| Health Care Equipment and Supplies — (0.1)% | | |
| Cooper Cos., Inc. (The) | (668 | ) | (118,884 | ) |
| Health Care Providers and Services — (3.1)% | | |
| Acadia Healthcare Co., Inc. | (16,601 | ) | (1,300,357 | ) |
| Brookdale Senior Living, Inc. | (34,936 | ) | (1,212,279 | ) |
| Henry Schein, Inc. | (4,611 | ) | (655,315 | ) |
| Owens & Minor, Inc. | (25,702 | ) | (873,868 | ) |
| Tenet Healthcare Corp. | (18,917 | ) | (1,094,916 | ) |
| | | (5,136,735 | ) |
|
| | | | | |
| | Shares | Value |
| Hotels, Restaurants and Leisure — (0.4)% | | |
| MGM Resorts International | (34,983 | ) | $ | (638,440 | ) |
| Household Durables — (1.0)% | | |
| Lennar Corp., Class A | (13,312 | ) | (679,445 | ) |
| M.D.C. Holdings, Inc. | (33,589 | ) | (1,006,662 | ) |
| | | (1,686,107 | ) |
| Insurance — (0.8)% | | |
| MBIA, Inc. | (131,996 | ) | (793,296 | ) |
| Old Republic International Corp. | (30,518 | ) | (476,996 | ) |
| | | (1,270,292 | ) |
| Internet Software and Services — (0.5)% | | |
| Yahoo!, Inc. | (22,457 | ) | (882,336 | ) |
| IT Services — (1.4)% | | |
| Gartner, Inc. | (997 | ) | (85,523 | ) |
| Global Payments, Inc. | (7,190 | ) | (743,805 | ) |
| WEX, Inc. | (12,647 | ) | (1,441,379 | ) |
| | | (2,270,707 | ) |
| Machinery — (0.7)% | | |
| Donaldson Co., Inc. | (33,473 | ) | (1,198,333 | ) |
| Media — (0.7)% | | |
| Loral Space & Communications, Inc. | (18,706 | ) | (1,180,723 | ) |
| Metals and Mining — (0.5)% | | |
| Allegheny Technologies, Inc. | (3,178 | ) | (95,975 | ) |
| Freeport-McMoRan, Inc. | (4,832 | ) | (89,972 | ) |
| Hecla Mining Co. | (280,354 | ) | (737,331 | ) |
| | | (923,278 | ) |
| Multi-Utilities — (0.1)% | | |
| Dominion Resources, Inc. | (3,210 | ) | (214,653 | ) |
| Oil, Gas and Consumable Fuels — (1.3)% | | |
| Cobalt International Energy, Inc. | (39,021 | ) | (378,894 | ) |
| Diamondback Energy, Inc. | (9,757 | ) | (735,483 | ) |
| Gulfport Energy Corp. | (21,577 | ) | (868,474 | ) |
| Teekay Corp. | (5,693 | ) | (243,774 | ) |
| | | (2,226,625 | ) |
| Paper and Forest Products — (0.8)% | | |
| Louisiana-Pacific Corp. | (81,890 | ) | (1,394,587 | ) |
| Pharmaceuticals — (0.2)% | | |
| Akorn, Inc. | (9,346 | ) | (408,046 | ) |
| Professional Services — (0.9)% | | |
| Advisory Board Co. (The) | (26,008 | ) | (1,421,857 | ) |
| Real Estate Management and Development — (0.6)% | | |
| Howard Hughes Corp. (The) | (3,501 | ) | (502,534 | ) |
| Kennedy-Wilson Holdings, Inc. | (24,319 | ) | (598,004 | ) |
| | | (1,100,538 | ) |
| Road and Rail — (0.6)% | | |
| Kansas City Southern | (10,124 | ) | (923,309 | ) |
|
| | | | | |
| | Shares | Value |
| Semiconductors and Semiconductor Equipment — (0.9)% | | |
| SunEdison, Inc. | (48,096 | ) | $ | (1,438,551 | ) |
| Software — (0.1)% | | |
| FireEye, Inc. | (2,748 | ) | (134,405 | ) |
| Specialty Retail — (1.2)% | | |
| Cabela's, Inc. | (19,983 | ) | (998,750 | ) |
| CarMax, Inc. | (15,509 | ) | (1,026,851 | ) |
| | | (2,025,601 | ) |
| Textiles, Apparel and Luxury Goods — (0.2)% | | |
| Under Armour, Inc., Class A | (3,837 | ) | (320,159 | ) |
| Trading Companies and Distributors — (0.1)% | | |
| Watsco, Inc. | (854 | ) | (105,674 | ) |
| Transportation Infrastructure — (0.7)% | | |
| Macquarie Infrastructure Corp. | (13,599 | ) | (1,123,685 | ) |
TOTAL COMMON STOCKS SOLD SHORT — (29.5)% (Proceeds $48,254,336) | | (49,184,897 | ) |
| OTHER ASSETS AND LIABILITIES — 0.2% | | 332,660 |
|
| TOTAL NET ASSETS — 100.0% | | $ | 166,887,033 |
|
|
| | |
| NOTES TO SCHEDULE OF INVESTMENTS |
| |
| (1) | Security, or a portion thereof, has been pledged at the custodian bank or with a broker for collateral requirements on securities sold short. At the period end, the aggregate value of securities pledged was $149,709,293. |
See Notes to Financial Statements.
|
|
| Statement of Assets and Liabilities |
|
| | | |
| JUNE 30, 2015 |
| Assets |
| Investment securities, at value (cost of $192,930,938) | $ | 215,739,270 |
|
| Deposits with broker for securities sold short | 156,023 |
|
| Receivable for investments sold | 10,043,312 |
|
| Receivable for capital shares sold | 3,893 |
|
| Dividends and interest receivable | 222,013 |
|
| | 226,164,511 |
|
| | |
| Liabilities | |
| Securities sold short, at value (proceeds of $48,254,336) | 49,184,897 |
|
| Payable for investments purchased | 9,861,119 |
|
| Payable for capital shares redeemed | 25,213 |
|
| Accrued management fees | 181,120 |
|
| Distribution and service fees payable | 783 |
|
| Dividend expense payable on securities sold short | 24,346 |
|
| | 59,277,478 |
|
| | |
| Net Assets | $ | 166,887,033 |
|
| | |
| Net Assets Consist of: |
| Capital (par value and paid-in surplus) | $ | 132,107,141 |
|
| Undistributed net investment income | 57,387 |
|
| Undistributed net realized gain | 12,844,734 |
|
| Net unrealized appreciation | 21,877,771 |
|
| | $ | 166,887,033 |
|
|
| | | | | | |
| | Net Assets | Shares Outstanding | Net Asset Value Per Share |
| Investor Class, $0.01 Par Value |
| $163,486,502 |
| 11,805,836 |
| $13.85 |
| Institutional Class, $0.01 Par Value |
| $1,853,598 |
| 133,799 |
| $13.85 |
| A Class, $0.01 Par Value |
| $801,403 |
| 57,885 |
| $13.84* |
| C Class, $0.01 Par Value |
| $736,083 |
| 53,778 |
| $13.69 |
| R Class, $0.01 Par Value |
| $9,447 |
| 683 |
| $13.83 |
*Maximum offering price $14.68 (net asset value divided by 0.9425).
See Notes to Financial Statements.
|
| | | |
| YEAR ENDED JUNE 30, 2015 |
| Investment Income (Loss) |
| Income: | |
| Dividends (net of foreign taxes withheld of $2,537) | $ | 4,190,422 |
|
| Interest | 1,137 |
|
| | 4,191,559 |
|
| | |
| Expenses: | |
| Dividend expense on securities sold short | 418,706 |
|
| Broker fees and charges on securities sold short | 288,046 |
|
| Management fees | 2,117,965 |
|
| Distribution and service fees: | |
| A Class | 1,969 |
|
| C Class | 6,721 |
|
| R Class | 770 |
|
| Directors' fees and expenses | 8,161 |
|
| | 2,842,338 |
|
| | |
| Net investment income (loss) | 1,349,221 |
|
| | |
| Realized and Unrealized Gain (Loss) | |
| Net realized gain (loss) on: | |
| Investment transactions | 23,074,086 |
|
| Securities sold short transactions | (3,235,774 | ) |
| | 19,838,312 |
|
| | |
| Change in net unrealized appreciation (depreciation) on: | |
| Investments | (16,347,005 | ) |
| Securities sold short | 2,704,235 |
|
| | (13,642,770 | ) |
| | |
| Net realized and unrealized gain (loss) | 6,195,542 |
|
| | |
| Net Increase (Decrease) in Net Assets Resulting from Operations | $ | 7,544,763 |
|
See Notes to Financial Statements.
|
|
| Statement of Changes in Net Assets |
|
| | | | | | |
| YEARS ENDED JUNE 30, 2015 AND JUNE 30, 2014 |
| Increase (Decrease) in Net Assets | June 30, 2015 | June 30, 2014 |
| Operations | | |
| Net investment income (loss) | $ | 1,349,221 |
| $ | 967,747 |
|
| Net realized gain (loss) | 19,838,312 |
| 17,231,018 |
|
| Change in net unrealized appreciation (depreciation) | (13,642,770 | ) | 14,388,597 |
|
| Net increase (decrease) in net assets resulting from operations | 7,544,763 |
| 32,587,362 |
|
| | | |
| Distributions to Shareholders | | |
| From net investment income: | | |
| Investor Class | (1,232,745 | ) | (1,048,352 | ) |
| Institutional Class | (26,296 | ) | (49,529 | ) |
| A Class | (4,050 | ) | (3,670 | ) |
| R Class | (277 | ) | (421 | ) |
| From net realized gains: | | |
| Investor Class | (18,776,418 | ) | (8,566,466 | ) |
| Institutional Class | (402,248 | ) | (326,217 | ) |
| A Class | (95,019 | ) | (46,967 | ) |
| C Class | (78,672 | ) | (61,677 | ) |
| R Class | (22,123 | ) | (10,354 | ) |
| Decrease in net assets from distributions | (20,637,848 | ) | (10,113,653 | ) |
| | | |
| Capital Share Transactions | | |
Net increase (decrease) in net assets from capital share transactions (Note 5) | 23,670,442 |
| 13,863,840 |
|
| | | |
| Net increase (decrease) in net assets | 10,577,357 |
| 36,337,549 |
|
| | | |
| Net Assets | | |
| Beginning of period | 156,309,676 |
| 119,972,127 |
|
| End of period | $ | 166,887,033 |
| $ | 156,309,676 |
|
| | | |
| Undistributed net investment income | $ | 57,387 |
| — |
|
See Notes to Financial Statements.
|
| | | |
| YEAR ENDED JUNE 30, 2015 | |
| Cash Flows From (Used In) Operating Activities | |
| Net increase (decrease) in net assets resulting from operations | $ | 7,544,763 |
|
| Adjustments to reconcile net increase (decrease) in net assets resulting from operations to net cash from (used in) operating activities: | |
| Purchases of investment securities | (174,941,581 | ) |
| Proceeds from investments sold | 168,576,131 |
|
| Purchases to cover securities sold short | (52,056,440 | ) |
| Proceeds from securities sold short | 53,549,281 |
|
| (Increase) decrease in short-term investments | 832,999 |
|
| (Increase) decrease in deposits with broker for securities sold short | 641,234 |
|
| (Increase) decrease in receivable for investments sold | (9,613,908 | ) |
| (Increase) decrease in dividends and interest receivable | (46,003 | ) |
| Increase (decrease) in payable for investments purchased | 8,649,902 |
|
| Increase (decrease) in accrued management fees | 16,764 |
|
| Increase (decrease) in distribution and service fees payable | (60 | ) |
| Increase (decrease) in dividend expense payable on securities sold short | 2,212 |
|
| Change in net unrealized (appreciation) depreciation on investments | 16,347,005 |
|
| Net realized (gain) loss on investment transactions | (23,074,086 | ) |
| Change in net unrealized (appreciation) depreciation on securities sold short | (2,704,235 | ) |
| Net realized (gain) loss on securities sold short transactions | 3,235,774 |
|
| Net cash from (used in) operating activities | (3,040,248 | ) |
| | |
| Cash Flows From (Used In) Financing Activities | |
| Proceeds from shares sold | 20,755,721 |
|
| Payments for shares redeemed | (17,674,926 | ) |
| Distributions paid, net of reinvestments | (43,281 | ) |
| Net cash from (used in) financing activities | 3,037,514 |
|
| | |
| Net Increase (Decrease) In Cash | (2,734 | ) |
| Cash at beginning of period | 2,734 |
|
| Cash at end of period | — |
|
| | |
| Supplemental disclosure of cash flow information: | |
| Non cash financing activities not included herein consist of all reinvestment of distributions of $20,594,567. |
See Notes to Financial Statements.
|
|
| Notes to Financial Statements |
JUNE 30, 2015
1. Organization
American Century Quantitative Equity Funds, Inc. (the corporation) is registered under the Investment Company Act of 1940, as amended (the 1940 Act), as an open-end management investment company and is organized as a Maryland corporation. Core Equity Plus Fund (the fund) is one fund in a series issued by the corporation. The fund is diversified as defined under the 1940 Act. The fund’s investment objective is to seek long-term capital growth.
The fund offers the Investor Class, the Institutional Class, the A Class, the C Class and the R Class. The A Class may incur an initial sales charge. The A Class and C Class may be subject to a contingent deferred sales charge. The share classes differ principally in their respective sales charges and distribution and shareholder servicing expenses and arrangements. The Institutional Class is made available to institutional shareholders or through financial intermediaries whose clients do not require the same level of shareholder and administrative services as shareholders of other classes. As a result, the Institutional Class is charged a lower unified management fee.
2. Significant Accounting Policies
The following is a summary of significant accounting policies consistently followed by the fund in preparation of its financial statements. The fund is an investment company and follows accounting and reporting guidance in accordance with accounting principles generally accepted in the United States of America. This may require management to make certain estimates and assumptions at the date of the financial statements. Actual results could differ from these estimates. Management evaluated the impact of events or transactions occurring through the date the financial statements were issued that would merit recognition or disclosure.
Investment Valuations — The fund determines the fair value of its investments and computes its net asset value per share at the close of regular trading (usually 4 p.m. Eastern time) on the New York Stock Exchange (NYSE) on each day the NYSE is open. The Board of Directors has adopted valuation policies and procedures to guide the investment advisor in the fund’s investment valuation process and to provide methodologies for the oversight of the fund’s pricing function.
Equity securities that are listed or traded on a domestic securities exchange are valued at the last reported sales price or at the official closing price as provided by the exchange. Equity securities traded on foreign securities exchanges are generally valued at the closing price of such securities on the exchange where primarily traded or at the close of the NYSE, if that is earlier. If no last sales price is reported, or if local convention or regulation so provides, the mean of the latest bid and asked prices may be used. Securities traded over-the-counter are valued at the mean of the latest bid and asked prices, the last sales price, or the official closing price.
Fixed income securities maturing within 60 days at the time of purchase may be valued at cost, plus or minus any amortized discount or premium or at the evaluated mean as provided by an independent pricing service. Evaluated mean prices are commonly derived through utilization of market models, which may consider, among other factors: trade data, quotations from dealers and active market makers, relevant yield curve and spread data, related sector levels, creditworthiness, trade data or market information on comparable securities, and other relevant security specific information.
Open-end management investment companies are valued at the reported net asset value per share. Repurchase agreements are valued at cost, which approximates fair value.
If the fund determines that the market price for an investment is not readily available or the valuation methods mentioned above do not reflect an investment’s fair value, such investment is valued as determined in good faith by the Board of Directors or its delegate, in accordance with policies and procedures adopted by the Board of Directors. In its determination of fair value, the fund may review several factors including, but not limited to, market information regarding the specific investment or comparable investments and correlation with other investment types, futures indices or general market indicators. Circumstances that may cause the fund to use these procedures to value an investment include, but are not limited to: an investment has been declared in default or is distressed; trading in a security has been suspended during the trading day or a
security is not actively trading on its principal exchange; prices received from a regular pricing source are deemed unreliable; or there is a foreign market holiday and no trading occurred.
The fund monitors for significant events occurring after the close of an investment’s primary exchange but before the fund’s net asset value per share is determined. Significant events may include, but are not limited to: corporate announcements and transactions; governmental action and political unrest that could impact a specific investment or an investment sector; or armed conflicts, natural disasters and similar events that could affect investments in a specific country or region. The fund also monitors for significant fluctuations between domestic and foreign markets, as evidenced by the U.S. market or such other indicators that the Board of Directors, or its delegate, deems appropriate. If significant fluctuations in foreign markets are identified, the fund may apply a model-derived factor to the closing price of equity securities traded on foreign securities exchanges. The factor is based on observable market data as provided by an independent pricing service.
Security Transactions — Security transactions are accounted for as of the trade date. Net realized gains and losses are determined on the identified cost basis, which is also used for federal income tax purposes.
Investment Income — Dividend income less foreign taxes withheld, if any, is recorded as of the ex-dividend date. Distributions received on securities that represent a return of capital or long-term capital gain are recorded as a reduction of cost of investments and/or as a realized gain. The fund may estimate the components of distributions received that may be considered nontaxable distributions or long-term capital gain distributions for income tax purposes. Interest income is recorded on the accrual basis and includes accretion of discounts and amortization of premiums.
Securities Sold Short — The fund enters into short sales, which is selling securities it does not own, as part of its normal investment activities. Upon selling a security short, the fund will segregate cash, cash equivalents or other appropriate liquid securities in at least an amount equal to the current market value of the securities sold short until the fund replaces the borrowed security. Interest earned on segregated cash for securities sold short is reflected as interest income. The fund is required to pay any dividends or interest due on securities sold short. Such dividends and interest are recorded as an expense. The fund may pay fees or charges to the broker on the assets borrowed for securities sold short. These fees are calculated daily based upon the value of each security sold short and a rate that is dependent on the availability of such security. Liabilities for securities sold short are valued daily and changes in value are recorded as change in net unrealized appreciation (depreciation) on securities sold short. The fund records realized gain (loss) on a security sold short when it is terminated by the fund and includes as a component of net realized gain (loss) on securities sold short transactions.
Repurchase Agreements — The fund may enter into repurchase agreements with institutions that American Century Investment Management, Inc. (ACIM) (the investment advisor) has determined are creditworthy pursuant to criteria adopted by the Board of Directors. The fund requires that the collateral, represented by securities, received in a repurchase transaction be transferred to the custodian in a manner sufficient to enable the fund to obtain those securities in the event of a default under the repurchase agreement. ACIM monitors, on a daily basis, the securities transferred to ensure the value, including accrued interest, of the securities under each repurchase agreement is equal to or greater than amounts owed to the fund under each repurchase agreement.
Joint Trading Account — Pursuant to an Exemptive Order issued by the Securities and Exchange Commission, the fund, along with certain other funds in the American Century Investments family of funds, may transfer uninvested cash balances into a joint trading account. These balances are invested in one or more repurchase agreements that are collateralized by U.S. Treasury or Agency obligations.
Segregated Assets — In accordance with the 1940 Act, the fund segregates assets on its books and records to cover certain types of investments, including, but not limited to, futures contracts and short sales. ACIM monitors, on a daily basis, the securities segregated to ensure the fund designates a sufficient amount of liquid assets, marked-to-market daily. The fund may also receive assets or be required to pledge assets at the custodian bank or with a broker for margin requirements on futures contracts and short sales.
Income Tax Status — It is the fund’s policy to distribute substantially all net investment income and net realized gains to shareholders and to otherwise qualify as a regulated investment company under provisions of the Internal Revenue Code. Accordingly, no provision has been made for income taxes. The fund files U.S. federal, state, local and non-U.S. tax returns as applicable. The fund's tax returns are subject to examination by the relevant taxing authority until expiration of the applicable statute of limitations, which is generally three years from the date of filing but can be longer in certain jurisdictions. At this time, management believes there are no uncertain tax positions which, based on their technical merit, would not be sustained upon examination
and for which it is reasonably possible that the total amounts of unrecognized tax benefits will significantly change in the next twelve months.
Multiple Class — All shares of the fund represent an equal pro rata interest in the net assets of the class to which such shares belong, and have identical voting, dividend, liquidation and other rights and the same terms and conditions, except for class specific expenses and exclusive rights to vote on matters affecting only individual classes. Income, non-class specific expenses, and realized and unrealized capital gains and losses of the fund are allocated to each class of shares based on their relative net assets.
Distributions to Shareholders — Distributions from net investment income, if any, are generally declared and paid semiannually. Distributions from net realized gains, if any, are generally declared and paid annually.
Indemnifications — Under the corporation’s organizational documents, its officers and directors are indemnified against certain liabilities arising out of the performance of their duties to the fund. In addition, in the normal course of business, the fund enters into contracts that provide general indemnifications. The maximum exposure under these arrangements is unknown as this would involve future claims that may be made against a fund. The risk of material loss from such claims is considered by management to be remote.
Statement of Cash Flows — The Statement of Cash Flows has been prepared using the indirect method which requires net increase (decrease) in net assets resulting from operations to be adjusted to reconcile to net cash from (used in) operating activities. The beginning of period and end of period cash is the amount of domestic and foreign currency included in the fund's Statement of Assets and Liabilities and represents the cash on hand at the custodian bank and does not include any short-term investments or deposits with brokers for securities sold short.
3. Fees and Transactions with Related Parties
Certain officers and directors of the corporation are also officers and/or directors of American Century Companies, Inc. (ACC). The corporation’s investment advisor, ACIM, the corporation's distributor, American Century Investment Services, Inc. (ACIS), and the corporation’s transfer agent, American Century Services, LLC, are wholly owned, directly or indirectly, by ACC. Various funds issued by American Century Asset Allocation Portfolios, Inc. and American Century Strategic Asset Allocations, Inc. own, in aggregate, 91% of the shares of the fund. Related parties do not invest in the fund for the purpose of exercising management or control.
Management Fees — The corporation has entered into a management agreement with ACIM, under which ACIM provides the fund with investment advisory and management services in exchange for a single, unified management fee (the fee) per class. The agreement provides that all expenses of managing and operating the fund, except distribution and service fees, expenses on securities sold short, brokerage expenses, taxes, interest, fees and expenses of the independent directors (including legal counsel fees), and extraordinary expenses, will be paid by ACIM. The fee is computed and accrued daily based on each class’s daily net assets and paid monthly in arrears. The fee consists of (1) an Investment Category Fee based on the daily net assets of the fund and certain other accounts managed by the investment advisor that are in the same broad investment category as the fund and (2) a Complex Fee based on the assets of all the funds in the American Century Investments family of funds. The rates for the Investment Category Fee range from 0.9680% to 1.1500%. The rates for the Complex Fee range from 0.2500% to 0.3100% for the Investor Class, A Class, C Class and R Class. The rates for the Complex Fee range from 0.0500% to 0.1100% for the Institutional Class. The effective annual management fee for each class for the year ended June 30, 2015 was 1.29% for the Investor Class, A Class, C Class and R Class and 1.09% for the Institutional Class.
Distribution and Service Fees — The Board of Directors has adopted a separate Master Distribution and Individual Shareholder Services Plan for each of the A Class, C Class and R Class (collectively the plans), pursuant to Rule 12b-1 of the 1940 Act. The plans provide that the A Class will pay ACIS an annual distribution and service fee of 0.25%. The plans provide that the C Class will pay ACIS an annual distribution and service fee of 1.00%, of which 0.25% is paid for individual shareholder services and 0.75% is paid for distribution services. The plans provide that the R Class will pay ACIS an annual distribution and service fee of 0.50%. The fees are computed and accrued daily based on each class’s daily net assets and paid monthly in arrears. The fees are used to pay financial intermediaries for distribution and individual shareholder services. Fees incurred under the plans during the year ended June 30, 2015 are detailed in the Statement of Operations.
Directors' Fees and Expenses — The Board of Directors is responsible for overseeing the investment advisor’s management and operations of the fund. The directors receive detailed information about the fund and its investment advisor regularly throughout the year, and meet at least quarterly with management of the
investment advisor to review reports about fund operations. The fund’s officers do not receive compensation from the fund.
4. Investment Transactions
Purchases and sales of investment securities and securities sold short, excluding short-term investments, for the year ended June 30, 2015 were $226,998,021 and $222,013,556, respectively.
5. Capital Share Transactions
Transactions in shares of the fund were as follows:
|
| | | | | | | | | | |
| | Year ended
June 30, 2015 | Year ended June 30, 2014 |
| | Shares | Amount | Shares | Amount |
| Investor Class/Shares Authorized | 100,000,000 |
| | 50,000,000 |
| |
| Sold | 1,406,752 |
| $ | 20,361,600 |
| 754,248 |
| $ | 10,606,746 |
|
| Issued in reinvestment of distributions | 1,445,917 |
| 19,965,882 |
| 686,141 |
| 9,588,838 |
|
| Redeemed | (874,930 | ) | (12,704,161 | ) | (525,553 | ) | (7,370,989 | ) |
| | 1,977,739 |
| 27,623,321 |
| 914,836 |
| 12,824,595 |
|
| Institutional Class/Shares Authorized | 30,000,000 |
| | 10,000,000 |
| |
| Sold | 3,136 |
| 48,379 |
| 214,905 |
| 2,995,143 |
|
| Issued in reinvestment of distributions | 30,989 |
| 428,544 |
| 26,818 |
| 375,746 |
|
| Redeemed | (296,499 | ) | (4,411,976 | ) | (190,289 | ) | (2,702,023 | ) |
| | (262,374 | ) | (3,935,053 | ) | 51,434 |
| 668,866 |
|
| A Class/Shares Authorized | 15,000,000 |
| | 10,000,000 |
| |
| Sold | 11,300 |
| 166,833 |
| 28,772 |
| 402,615 |
|
| Issued in reinvestment of distributions | 7,183 |
| 99,069 |
| 3,632 |
| 50,637 |
|
| Redeemed | (10,400 | ) | (149,820 | ) | (22,752 | ) | (318,636 | ) |
| | 8,083 |
| 116,082 |
| 9,652 |
| 134,616 |
|
| C Class/Shares Authorized | 15,000,000 |
| | 10,000,000 |
| |
| Sold | 10,465 |
| 147,523 |
| 32,457 |
| 463,111 |
|
| Issued in reinvestment of distributions | 5,781 |
| 78,672 |
| 4,473 |
| 61,677 |
|
| Redeemed | (13,629 | ) | (202,879 | ) | (20,863 | ) | (303,218 | ) |
| | 2,617 |
| 23,316 |
| 16,067 |
| 221,570 |
|
| R Class/Shares Authorized | 15,000,000 |
| | 10,000,000 |
| |
| Sold | 1,175 |
| 16,782 |
| 241 |
| 3,418 |
|
| Issued in reinvestment of distributions | 1,630 |
| 22,400 |
| 775 |
| 10,775 |
|
| Redeemed | (13,801 | ) | (196,406 | ) | — |
| — |
|
| | (10,996 | ) | (157,224 | ) | 1,016 |
| 14,193 |
|
| Net increase (decrease) | 1,715,069 |
| $ | 23,670,442 |
| 993,005 |
| $ | 13,863,840 |
|
6. Fair Value Measurements
The fund’s investments valuation process is based on several considerations and may use multiple inputs to determine the fair value of the investments held by the fund. In conformity with accounting principles generally accepted in the United States of America, the inputs used to determine a valuation are classified into three broad levels.
| |
| • | Level 1 valuation inputs consist of unadjusted quoted prices in an active market for identical investments. |
| |
| • | Level 2 valuation inputs consist of direct or indirect observable market data (including quoted prices for comparable investments, evaluations of subsequent market events, interest rates, prepayment speeds, |
credit risk, etc.). These inputs also consist of quoted prices for identical investments initially expressed in local currencies that are adjusted through translation into U.S. dollars.
| |
| • | Level 3 valuation inputs consist of unobservable data (including a fund’s own assumptions). |
The level classification is based on the lowest level input that is significant to the fair valuation measurement. The valuation inputs are not necessarily an indication of the risks associated with investing in these securities or other financial instruments. There were no significant transfers between levels during the period.
The following is a summary of the level classifications as of period end. The Schedule of Investments provides additional information on the fund’s portfolio holdings.
|
| | | | | | | | |
| | Level 1 | Level 2 | Level 3 |
| Assets |
| Investment Securities |
| Common Stocks | $ | 214,184,299 |
| — |
| — |
|
| Temporary Cash Investments | 257,595 |
| $ | 1,297,376 |
| — |
|
| | $ | 214,441,894 |
| $ | 1,297,376 |
| — |
|
| | | | |
| Liabilities |
| Securities Sold Short |
| Common Stocks | $ | (49,184,897 | ) | — |
| — |
|
7. Risk Factors
The fund is subject to short sales risk. If the market price of a security increases after the fund borrows the security, the fund may suffer a loss when it replaces the borrowed security at the higher price. Any loss will be increased by the amount of compensation, interest or dividends, and transaction costs the fund must pay to the lender of the borrowed security.
The fund's investment strategy utilizes leverage, which can increase market exposure and subject the fund to greater risk and higher volatility.
If the fund is overweighted in a stock or sector, any negative development related to that stock or sector will have a greater impact on the fund than other funds that are not overweighted in that stock or sector.
The fund’s investment process may result in high portfolio turnover, which could mean high transaction costs, affecting both performance and capital gains tax liabilities to investors.
8. Federal Tax Information
The tax character of distributions paid during the years ended June 30, 2015 and June 30, 2014 were as follows:
|
| | | | | | |
| | 2015 | 2014 |
| Distributions Paid From | | |
| Ordinary income | $ | 2,984,097 |
| $ | 2,724,056 |
|
| Long-term capital gains | $ | 17,653,751 |
| $ | 7,389,597 |
|
The book-basis character of distributions made during the year from net investment income or net realized gains may differ from their ultimate characterization for federal income tax purposes. These differences reflect the differing character of certain income items and net realized gains and losses for financial statement and tax purposes, and may result in reclassification among certain capital accounts on the financial statements.
As of June 30, 2015, the federal tax cost of investments and the components of distributable earnings on a tax-basis were as follows:
|
| | | |
| Federal tax cost of investments | $ | 192,954,377 |
|
| Gross tax appreciation of investments | $ | 31,353,257 |
|
| Gross tax depreciation of investments | (8,568,364 | ) |
| Net tax appreciation (depreciation) of investments | 22,784,893 |
|
| Net tax appreciation (depreciation) on securities sold short | (1,043,144 | ) |
| Net tax appreciation (depreciation) | $ | 21,741,749 |
|
| Undistributed ordinary income | $ | 57,387 |
|
| Accumulated long-term gains | $ | 13,498,358 |
|
| Post-October capital loss deferral | $ | (517,602 | ) |
The difference between book-basis and tax-basis unrealized appreciation (depreciation) is attributable primarily to deferral of losses on unsettled short positions.
Loss deferrals represent certain qualified losses that the fund has elected to treat as having been incurred in the following fiscal year for federal income tax purposes.
|
| | | | | | | | | | | | | | | | |
| For a Share Outstanding Throughout the Years Ended June 30 (except as noted) |
| Per-Share Data | Ratios and Supplemental Data |
| | | Income From Investment Operations: | Distributions From: | | | Ratio to Average Net Assets of: | | |
| | Net Asset Value, Beginning of Period | Net Investment Income (Loss)(1) | Net Realized and Unrealized Gain (Loss) | Total From Investment Operations | Net Investment Income | Net Realized Gains | Total Distributions | Net Asset Value, End of Period | Total Return(2) | Operating Expenses | Operating Expenses (excluding expenses on securities sold short) | Net Investment Income (Loss) | Portfolio Turnover Rate | Net Assets, End of Period (in thousands) |
| Investor Class |
| 2015 | $15.12 | 0.12 | 0.59 | 0.71 | (0.11) | (1.87) | (1.98) | $13.85 | 4.84% | 1.73% | 1.30% | 0.82% | 106% |
| $163,487 |
|
| 2014 | $12.84 | 0.10 | 3.25 | 3.35 | (0.11) | (0.96) | (1.07) | $15.12 | 26.86% | 1.77% | 1.30% | 0.69% | 104% |
| $148,620 |
|
| 2013 | $10.79 | 0.14 | 2.23 | 2.37 | (0.14) | (0.18) | (0.32) | $12.84 | 22.33% | 1.87% | 1.30% | 1.15% | 107% |
| $114,444 |
|
2012(3) | $10.00 | 0.03 | 0.76 | 0.79 | —(4) | — | —(4) | $10.79 | 7.95% | 2.06%(5) | 1.31%(5) | 0.39%(5) | 105% |
| $84,116 |
|
| Institutional Class |
| 2015 | $15.13 | 0.15 | 0.57 | 0.72 | (0.13) | (1.87) | (2.00) | $13.85 | 5.04% | 1.53% | 1.10% | 1.02% | 106% |
| $1,854 |
|
| 2014 | $12.84 | 0.13 | 3.26 | 3.39 | (0.14) | (0.96) | (1.10) | $15.13 | 27.19% | 1.57% | 1.10% | 0.89% | 104% |
| $5,993 |
|
| 2013 | $10.80 | 0.15 | 2.25 | 2.40 | (0.18) | (0.18) | (0.36) | $12.84 | 22.45% | 1.67% | 1.10% | 1.35% | 107% |
| $4,427 |
|
2012(3) | $10.00 | 0.06 | 0.75 | 0.81 | (0.01) | — | (0.01) | $10.80 | 8.19% | 1.86%(5) | 1.11%(5) | 0.59%(5) | 105% |
| $534 |
|
| A Class |
| 2015 | $15.12 | 0.08 | 0.58 | 0.66 | (0.07) | (1.87) | (1.94) | $13.84 | 4.59% | 1.98% | 1.55% | 0.57% | 106% |
| $801 |
|
| 2014 | $12.84 | 0.06 | 3.25 | 3.31 | (0.07) | (0.96) | (1.03) | $15.12 | 26.55% | 2.02% | 1.55% | 0.44% | 104% |
| $753 |
|
| 2013 | $10.78 | 0.10 | 2.24 | 2.34 | (0.10) | (0.18) | (0.28) | $12.84 | 22.01% | 2.12% | 1.55% | 0.90% | 107% |
| $515 |
|
2012(3) | $10.00 | 0.04 | 0.74 | 0.78 | —(4) | — | —(4) | $10.78 | 7.80% | 2.31%(5) | 1.56%(5) | 0.14%(5) | 105% |
| $231 |
|
|
| | | | | | | | | | | | | | | | |
| For a Share Outstanding Throughout the Years Ended June 30 (except as noted) |
| Per-Share Data | Ratios and Supplemental Data |
| | | Income From Investment Operations: | Distributions From: | | | Ratio to Average Net Assets of: | | |
| | Net Asset Value, Beginning of Period | Net Investment Income (Loss)(1) | Net Realized and Unrealized Gain (Loss) | Total From Investment Operations | Net Investment Income | Net Realized Gains | Total Distributions | Net Asset Value, End of Period | Total Return(2) | Operating Expenses | Operating Expenses (excluding expenses on securities sold short) | Net Investment Income (Loss) | Portfolio Turnover Rate | Net Assets, End of Period (in thousands) |
| C Class |
| 2015 | $15.01 | (0.03) | 0.58 | 0.55 | — | (1.87) | (1.87) | $13.69 | 3.77% | 2.73% | 2.30% | (0.18)% | 106% |
| $736 |
|
| 2014 | $12.78 | (0.05) | 3.24 | 3.19 | — | (0.96) | (0.96) | $15.01 | 25.66% | 2.77% | 2.30% | (0.31)% | 104% |
| $768 |
|
| 2013 | $10.73 | 0.01 | 2.22 | 2.23 | — | (0.18) | (0.18) | $12.78 | 20.99% | 2.87% | 2.30% | 0.15% | 107% |
| $449 |
|
2012(3) | $10.00 | —(4) | 0.73 | 0.73 | — | — | — | $10.73 | 7.30% | 3.06%(5) | 2.31%(5) | (0.61)%(5) | 105% |
| $112 |
|
| R Class |
| 2015 | $15.11 | 0.04 | 0.59 | 0.63 | (0.04) | (1.87) | (1.91) | $13.83 | 4.28% | 2.23% | 1.80% | 0.32% | 106% |
| $9 |
|
| 2014 | $12.83 | 0.03 | 3.25 | 3.28 | (0.04) | (0.96) | (1.00) | $15.11 | 26.27% | 2.27% | 1.80% | 0.19% | 104% |
| $176 |
|
| 2013 | $10.76 | 0.08 | 2.23 | 2.31 | (0.06) | (0.18) | (0.24) | $12.83 | 21.70% | 2.37% | 1.80% | 0.65% | 107% |
| $137 |
|
2012(3) | $10.00 | 0.03 | 0.73 | 0.76 | — | — | — | $10.76 | 7.60% | 2.56%(5) | 1.81%(5) | (0.11)%(5) | 105% |
| $112 |
|
|
|
| Notes to Financial Highlights |
| |
| (1) | Computed using average shares outstanding throughout the period. |
| |
| (2) | Total returns are calculated based on the net asset value of the last business day and do not reflect applicable sales charges, if any. Total returns for periods less than one year are not annualized. |
| |
| (3) | October 31, 2011 (fund inception) through June 30, 2012. |
| |
| (4) | Per-share amount was less than $0.005. |
See Notes to Financial Statements.
|
|
| Report of Independent Registered Public Accounting Firm |
To the Directors of the American Century Quantitative Equity Funds, Inc. and Shareholders of the Core Equity Plus Fund:
In our opinion, the accompanying statement of assets and liabilities, including the schedule of investments, and the related statements of operations, of changes in net assets and of cash flows and the financial highlights present fairly, in all material respects, the financial position of the Core Equity Plus Fund (one of the sixteen funds comprising the American Century Quantitative Equity Funds, Inc., hereafter referred to as the “Fund”) at June 30, 2015, the results of its operations and its cash flows for the year then ended, the changes in its net assets for each of the two years in the period then ended and the financial highlights for each of the periods presented, in conformity with accounting principles generally accepted in the United States of America. These financial statements and financial highlights (hereafter referred to as "financial statements") are the responsibility of the Fund's management. Our responsibility is to express an opinion on these financial statements based on our audits. We conducted our audits of these financial statements in accordance with the standards of the Public Company Accounting Oversight Board (United States). Those standards require that we plan and perform the audit to obtain reasonable assurance about whether the financial statements are free of material misstatement. An audit includes examining, on a test basis, evidence supporting the amounts and disclosures in the financial statements, assessing the accounting principles used and significant estimates made by management, and evaluating the overall financial statement presentation. We believe that our audits, which included confirmation of securities at June 30, 2015 by correspondence with the custodian and brokers, provide a reasonable basis for our opinion.
PricewaterhouseCoopers LLP
Kansas City, Missouri
August 21, 2015
Board of Directors
The individuals listed below serve as directors of the funds. Each director will continue to serve in this capacity until death, retirement, resignation or removal from office. The board has adopted a mandatory retirement age for directors who are not “interested persons,” as that term is defined in the Investment Company Act (independent directors). Independent directors shall retire on December 31 of the year in which they reach their 75th birthday; provided, however, that on or after January 1, 2022, independent directors shall retire on December 31 of the year in which they reach their 76th birthday.
Mr. Thomas is an “interested person” because he currently serves as President and Chief Executive Officer of American Century Companies, Inc. (ACC), the parent company of American Century Investment Management, Inc. (ACIM or the advisor). The other directors (more than three-fourths of the total number) are independent. They are not employees, directors or officers of, and have no financial interest in, ACC or any of its wholly owned, direct or indirect, subsidiaries, including ACIM, American Century Investment Services, Inc. (ACIS) and American Century Services, LLC (ACS), and they do not have any other affiliations, positions or relationships that would cause them to be considered “interested persons” under the Investment Company Act. The directors serve in this capacity for eight (in the case of Mr. Thomas, 15) registered investment companies in the American Century Investments family of funds.
The following table presents additional information about the directors. The mailing address for each director other than Mr. Thomas is 1665 Charleston Road, Mountain View, California 94043. The mailing address for Mr. Thomas is 4500 Main Street, Kansas City, Missouri 64111.
|
| | | | | |
Name (Year of Birth) | Position(s) Held with Funds | Length of Time Served | Principal Occupation(s) During Past 5 Years | Number of American Century Portfolios Overseen by Director | Other Directorships Held During Past 5 Years |
Independent Directors | | |
Tanya S. Beder
(1955) | Director | Since 2011 | Chairman and CEO, SBCC Group Inc. (independent advisory services) (2006 to present) | 46 | CYS Investments, Inc. (NYSE mortgage arbitrage REIT) |
Jeremy I. Bulow
(1954) | Director | Since 2011 | Professor of Economics, Stanford University, Graduate School of Business (1979 to present) | 46 | None |
Ronald J. Gilson
(1946) | Director and Chairman of the Board | Since 1995
(Chairman since 2005) | Charles J. Meyers Professor of Law and Business, Stanford Law School (1979 to present); Marc and Eva Stern Professor of Law and Business, Columbia University School of Law (1992 to present) | 46 | None |
Frederick L. A. Grauer
(1946) | Director | Since 2008 | Senior Advisor, BlackRock, Inc. (investment management firm) (2010 to 2011, 2013 to present) | 46 | None |
Peter F. Pervere
(1947) | Director | Since 2007 | Retired | 46 | None |
|
| | | | | |
Name (Year of Birth) | Position(s) Held with Funds | Length of Time Served | Principal Occupation(s) During Past 5 Years | Number of American Century Portfolios Overseen by Director | Other Directorships Held During Past 5 Years |
| Independent Directors | | |
John B. Shoven
(1947) | Director | Since 2002 | Professor of Economics, Stanford University (1973 to present) | 46 | Cadence Design Systems; Exponent; Financial Engines |
| Interested Director | | |
Jonathan S. Thomas
(1963) | Director and President | Since 2007 | President and Chief Executive Officer, ACC (March 2007 to present). Also serves as Chief Executive Officer, ACS; Executive Vice President, ACIM; Director, ACC, ACIM and other ACC subsidiaries | 124 | BioMed Valley Discoveries, Inc. |
The Statement of Additional Information has additional information about the fund's directors and is available without charge, upon request, by calling 1-800-345-2021.
Officers
The following table presents certain information about the executive officers of the funds. Each officer serves as an officer for each of the 15 investment companies in the American Century family of funds, unless otherwise noted. No officer is compensated for his or her service as an officer of the funds. The listed officers are interested persons of the funds and are appointed or re-appointed on an annual basis. The mailing address for each of the officers listed below is 4500 Main Street, Kansas City, Missouri 64111.
|
| | |
Name (Year of Birth) | Offices with
the Funds | Principal Occupation(s) During the Past Five Years |
Jonathan S.
Thomas
(1963) | Director and President
since 2007 | President and Chief Executive Officer, ACC (March 2007 to present). Also serves as Chief Executive Officer, ACS; Executive Vice President, ACIM; Director, ACC, ACIM and other ACC subsidiaries |
Amy D. Shelton
(1964) | Chief Compliance Officer and Vice President since 2014 | Chief Compliance Officer, American Century funds, (March 2014 to present); Chief Compliance Officer, ACIM (February 2014 to present); Chief Compliance Officer, ACIS (October 2009 to present); Vice President, Client Interactions and Marketing, ACIS (February 2013 to January 2014); Director, Client Interactions and Marketing, ACIS (June 2007 to January 2013). Also serves as Vice President, ACIS |
Charles A. Etherington
(1957) | General Counsel since 2007 and Senior Vice President since 2006 | Attorney, ACC (February 1994 to present); Vice President, ACC (November 2005 to present); General Counsel, ACC (March 2007 to present). Also serves as General Counsel, ACIM, ACS, ACIS and other ACC subsidiaries; and Senior Vice President, ACIM and ACS |
C. Jean Wade
(1964) | Vice President,
Treasurer and
Chief Financial
Officer since 2012 | Vice President, ACS (February 2000 to present) |
Robert J. Leach
(1966) | Vice President
since 2006 and
Assistant Treasurer
since 2012 | Vice President, ACS (February 2000 to present) |
David H. Reinmiller
(1963) | Vice President since 2001 | Attorney, ACC (January 1994 to present); Associate General Counsel, ACC (January 2001 to present). Also serves as Vice President, ACIM and ACS |
Ward D. Stauffer
(1960) | Secretary since 2005 | Attorney, ACC (June 2003 to present) |
|
|
| Approval of Management Agreement |
At a meeting held on June 16, 2015, the Fund’s Board of Directors unanimously approved the renewal of the management agreement pursuant to which American Century Investment Management, Inc. (the “Advisor”) acts as the investment advisor for the Fund. Under Section 15(c) of the Investment Company Act, contracts for investment advisory services are required to be reviewed, evaluated, and approved by a majority of a fund’s directors/trustees, including a majority of the independent Directors, each year. The Board regards this annual evaluation and renewal as one of its most important responsibilities.
The independent Directors have memorialized a statement regarding the relationship between their ongoing obligations to oversee and evaluate the performance of the Advisor and their annual consideration of renewal of the management agreement. In that statement, the independent Directors noted that their assessment of the Advisor’s performance is an ongoing process that takes place over the entire year and is informed by all of the extensive information that the Board and its committees receive and consider over time. This information, together with the materials provided in connection with the review, are central to the Board’s assessment of the Advisor’s performance and its determination whether to renew the Fund’s management agreement.
Prior to its consideration of the renewal of the management agreement, the Board requested and reviewed extensive data and analysis relating to the proposed renewal. This information and analysis was compiled by the Advisor and certain independent providers of evaluation data concerning the Fund and the services provided to the Fund by the Advisor.
In connection with its consideration of the renewal of the management agreement, the Board’s review and evaluation of the services provided by the Advisor included, but was not limited to, the following:
| |
| • | the nature, extent, and quality of investment management, shareholder services, and other services provided by the Advisor to the Fund; |
| |
| • | the wide range of other programs and services the Advisor provides to the Fund and its shareholders on a routine and non-routine basis; |
| |
| • | the investment performance of the Fund, including data comparing the Fund’s performance to appropriate benchmarks and/or a peer group of other mutual funds with similar investment objectives and strategies; |
| |
| • | the cost of owning the Fund compared to the cost of owning similar funds; |
| |
| • | the Advisor’s compliance policies, procedures, and regulatory experience; |
| |
| • | financial data showing the cost of services provided to the Fund, the profitability of the Fund to the Advisor, and the overall profitability of the Advisor; |
| |
| • | possible economies of scale associated with the Advisor’s management of the Fund and other accounts under its management; |
| |
| • | data comparing services provided and charges to other investment management clients of the Advisor; |
| |
| • | acquired fund fees and expenses; |
| |
| • | payments by the Fund and the Advisor to financial intermediaries whose clients are investors in the Fund; and |
| |
| • | any collateral benefits derived by the Advisor from the management of the Fund. |
In keeping with its practice, the Board held two in-person meetings to review and discuss the information provided in response to their request. The independent Directors also had the benefit of the advice of their independent counsel throughout the process.
Factors Considered
The Directors considered all of the information provided by the Advisor, the independent data providers, and the independent Directors’ independent counsel in connection with the review, and evaluated such information for the Fund. In connection with their review, the Directors did not identify any single factor as being all-important or controlling and each Director may have attributed different levels of importance to different factors. In deciding to renew the management agreement, the Board based its decision on a number of factors, including the following:
Nature, Extent and Quality of Services - Generally. Under the management agreement, the Advisor is responsible for providing or arranging for all services necessary for the operation of the Fund. The Board noted that under the management agreement, the Advisor provides or arranges at its own expense a wide variety of services including:
| |
| • | constructing and designing the Fund |
| |
| • | portfolio research and security selection |
| |
| • | initial capitalization/funding |
| |
| • | daily valuation of the Fund’s portfolio |
| |
| • | shareholder servicing and transfer agency, including shareholder confirmations, recordkeeping, and communications |
| |
| • | legal services (except the independent Directors’ counsel) |
| |
| • | regulatory and portfolio compliance |
| |
| • | marketing and distribution (except amounts paid by the Fund under Rule 12b-1 plans) |
The Board noted that many of these services have expanded over time both in terms of quantity and complexity in response to shareholder demands, competition in the industry, changing distribution channels, and the changing regulatory environment.
Investment Management, Shareholder, and Other Services. The nature of the investment management services provided to the Fund is quite complex and allows Fund shareholders access to professional money management, instant diversification of their investments within an asset class, the opportunity to easily diversify among asset classes by investing in or exchanging among various American Century Investments funds, and liquidity. In evaluating investment performance, the Board expects the Advisor to manage the Fund in accordance with its investment objectives and approved strategies. Further, the Directors recognize that the Advisor has an obligation to seek the best execution of fund trades. In providing these services, the Advisor utilizes teams of investment professionals (portfolio managers, analysts, research assistants, and securities traders) who require extensive information technology, research, training, compliance, and other systems to conduct their business. The Board, directly and through its Portfolio Committee, regularly reviews investment performance information for the Fund, together with comparative information for appropriate benchmarks and/or peer groups of similarly-managed funds, over different time horizons. The Directors also review detailed performance information during the management agreement approval process. If performance concerns are identified, the Fund receives special reviews until performance improves, during which the Board discusses with the Advisor the reasons for such results (e.g., market conditions, security selection) and any efforts being undertaken to improve performance. The Fund’s performance was above its benchmark for the one- and three-year periods reviewed by the Board. The Board found the investment management services provided by the Advisor to the Fund to be satisfactory and consistent with the management agreement.
Under the management agreement, the Advisor provides the Fund with a comprehensive package of transfer agency, shareholder, and other services. The Board, directly and through various committees of the Board, regularly reviews reports and evaluations of such services at its regular
meetings. These reports include, but are not limited to, information regarding the operational efficiency and accuracy of the shareholder and transfer agency services provided, staffing levels, shareholder satisfaction (as measured by external as well as internal sources), technology support, new products and services offered to Fund shareholders, securities trading activities, portfolio valuation services, auditing services, and legal and operational compliance activities.
Certain aspects of shareholder and transfer agency service level efficiency and the quality of securities trading activities are measured by independent third party providers and are presented in comparison to other fund groups not managed by the Advisor. The Board found the services provided by the Advisor to the Fund under the management agreement to be competitive and of high quality.
Costs of Services and Profitability. The Advisor provides detailed information concerning its cost of providing various services to the Fund, its profitability in managing the Fund, its overall profitability, and its financial condition. The Directors have reviewed with the Advisor the methodology used to prepare this financial information. This information is considered in evaluating the Advisor’s financial condition, its ability to continue to provide services under the management agreement, and the reasonableness of the current management fee. The Board concluded that the Advisor’s profits were reasonable in light of the services provided to the Fund.
Ethics. The Board generally considers the Advisor’s commitment to providing quality services to shareholders and to conducting its business ethically. They noted that the Advisor’s practices generally meet or exceed industry best practices.
Economies of Scale. The Board also reviewed information provided by the Advisor regarding the possible existence of economies of scale in connection with the management of the Fund. The Board concluded that economies of scale are difficult to measure and predict with precision, especially on a fund-by-fund basis. The Board concluded that the Advisor is appropriately sharing economies of scale through its competitive fee structure, offering competitive fees from fund inception, and through reinvestment in its business to provide shareholders enhanced and expanded services.
Comparison to Other Funds’ Fees. The management agreement provides that the Fund pays the Advisor a single, all-inclusive (or unified) management fee for providing all services necessary for the management and operation of the Fund, other than brokerage expenses, taxes, interest, extraordinary expenses, the fees and expenses of the Fund’s independent Directors (including their independent legal counsel), and expenses incurred in connection with the provision of shareholder services and distribution services under a plan adopted pursuant to Rule 12b-1 under the 1940 Act. Under the unified fee structure, the Advisor is responsible for providing all investment advisory, custody, audit, administrative, compliance, recordkeeping, marketing, and shareholder services, or arranging and supervising third parties to provide such services. By contrast, most other funds are charged a variety of fees, including an investment advisory fee, a transfer agency fee, an administrative fee, distribution charges, and other expenses. Other than their investment advisory fees and any applicable Rule 12b-1 fees, all other components of the total fees charged by these other funds may be increased without shareholder approval. The Board believes the unified fee structure is a benefit to Fund shareholders because it clearly discloses to shareholders the cost of owning Fund shares, and, since the unified fee cannot be increased without a vote of Fund shareholders, it shifts to the Advisor the risk of increased costs of operating the Fund and provides a direct incentive to minimize administrative inefficiencies. Part of the Board’s analysis of fee levels involves reviewing certain evaluative data compiled by an independent provider and comparing the Fund’s unified fee to the total expense ratio of peer funds. The unified fee charged to shareholders of the Fund was below the median of the total expense ratios of the Fund’s peer group. The Board concluded that the management fee paid by the Fund to the Advisor under the management agreement is reasonable in light of the services provided to the Fund.
Comparison to Fees and Services Provided to Other Clients of the Advisor. The Board also requested and received information from the Advisor concerning the nature of the services, fees, costs, and profitability of its advisory services to advisory clients other than the Fund. They observed that these varying types of client accounts require different services and involve different regulatory and entrepreneurial risks than the management of the Fund. The Board analyzed this information and concluded that the fees charged and services provided to the Fund were reasonable by comparison.
Payments to Intermediaries. The Directors also requested and received a description of payments made to intermediaries by the Fund and the Advisor. These payments include various payments made by the Fund or the Advisor to different types of intermediaries and recordkeepers for distribution and service activities provided for the Fund.
Collateral or “Fall-Out” Benefits Derived by the Advisor. The Board considered the existence of collateral benefits the Advisor may receive as a result of its relationship with the Fund. The Board noted that the Advisor’s primary business is managing mutual funds and it generally does not use fund or shareholder information to generate profits in other lines of business, and therefore does not derive any significant collateral benefits from them. The Board noted that the Advisor receives proprietary research from broker-dealers that execute fund portfolio transactions. The Board also determined that the Advisor is able to provide investment management services to certain clients other than the Fund, at least in part, due to its existing infrastructure built to serve the fund complex.
Existing Relationship. The Board also considered whether there was any reason for not continuing the existing arrangement with the Advisor. In this regard, the Board was mindful of the potential disruptions of the Fund’s operations and various risks, uncertainties, and other effects that could occur as a result of a decision not to continue such relationship. In particular, the Board recognized that most shareholders have invested in the Fund on the strength of the Advisor’s industry standing and reputation and in the expectation that the Advisor will have a continuing role in providing advisory services to the Fund.
Conclusion of the Directors. As a result of this process, the Board, including all of the independent Directors and assisted by the advice of independent legal counsel, taking into account all of the factors discussed above and the information provided by the Advisor and others in connection with its review and throughout the year, concluded that the management agreement between the Fund and the Advisor is fair and reasonable in light of the services provided and should be renewed.
Retirement Account Information
As required by law, distributions you receive from certain IRAs are subject to federal income tax withholding, unless you elect not to have withholding apply. Tax will be withheld on the total amount withdrawn even though you may be receiving amounts that are not subject to withholding, such as nondeductible contributions. In such case, excess amounts of withholding could occur. You may adjust your withholding election so that a greater or lesser amount will be withheld.
If you don’t want us to withhold on this amount, you must notify us to not withhold the federal income tax. You may notify us in writing or in certain situations by telephone or through other electronic means. For systematic withdrawals, your withholding election will remain in effect until revoked or changed by filing a new election. You have the right to revoke your election at any time.
Remember, even if you elect not to have income tax withheld, you are liable for paying income tax on the taxable portion of your withdrawal. If you elect not to have income tax withheld or you don’t have enough income tax withheld, you may be responsible for payment of estimated tax. You may incur penalties under the estimated tax rules if your withholding and estimated tax payments are not sufficient. You can reduce or defer the income tax on a distribution by directly or indirectly rolling such distribution over to another IRA or eligible plan. You should consult your tax advisor for additional information.
State tax will be withheld if, at the time of your distribution, your address is within one of the mandatory withholding states and you have federal income tax withheld (or as otherwise required by state law). State taxes will be withheld from your distribution in accordance with the respective state rules.
Distributions you receive from 403(b), 457 and qualified plans are subject to special tax and withholding rules. Your plan administrator or plan sponsor is required to provide you with a special tax notice explaining those rules at the time you request a distribution. If applicable, federal and/or state taxes may be withheld from your distribution amount.
Proxy Voting Policies
Descriptions of the principles and policies that the fund's investment advisor uses in exercising the voting rights associated with the securities purchased and/or held by the fund are available without charge, upon request, by calling 1-800-345-2021 or visiting the "About Us" page of American Century Investments’ website at americancentury.com. A description of the policies is also available on the Securities and Exchange Commission’s website at sec.gov. Information regarding how the investment advisor voted proxies relating to portfolio securities during the most recent 12-month period ended June 30 is available on the "About Us" page at americancentury.com. It is also available at sec.gov.
Quarterly Portfolio Disclosure
The fund files its complete schedule of portfolio holdings with the Securities and Exchange Commission (SEC) for the first and third quarters of each fiscal year on Form N-Q. The fund’s Forms N-Q are available on the SEC’s website at sec.gov, and may be reviewed and copied at the SEC’s Public Reference Room in Washington, DC. Information on the operation of the Public Reference Room may be obtained by calling 1-800-SEC-0330. The fund also makes its complete schedule of portfolio holdings for the most recent quarter of its fiscal year available on its website at americancentury.com and, upon request, by calling 1-800-345-2021.
Other Tax Information
The following information is provided pursuant to provisions of the Internal Revenue Code.
The fund hereby designates up to the maximum amount allowable as qualified dividend income for the fiscal year ended June 30, 2015.
For corporate taxpayers, the fund hereby designates $2,984,097, or up to the maximum amount allowable, of ordinary income distributions paid during the fiscal year ended June 30, 2015 as qualified for the corporate dividends received deduction.
The fund hereby designates $1,720,729 as qualified short-term capital gain distributions for purposes of Internal Revenue Code Section 871 for the fiscal year ended June 30, 2015.
The fund hereby designates $17,653,751, or up to the maximum amount allowable, as long-term capital gain distributions for the fiscal year ended June 30, 2015.
|
| | |
| |
| | | |
| Contact Us | americancentury.com | |
| Automated Information Line | 1-800-345-8765 | |
| Investor Services Representative | 1-800-345-2021
or 816-531-5575 | |
| Investors Using Advisors | 1-800-378-9878 | |
Business, Not-For-Profit, Employer-Sponsored
Retirement Plans | 1-800-345-3533 | |
Banks and Trust Companies, Broker-Dealers,
Financial Professionals, Insurance Companies | 1-800-345-6488 | |
| Telecommunications Relay Service for the Deaf | 711 | |
| | | |
| American Century Quantitative Equity Funds, Inc. | |
| | | |
Investment Advisor: American Century Investment Management, Inc. Kansas City, Missouri | |
| | | |
| This report and the statements it contains are submitted for the general information of our shareholders. The report is not authorized for distribution to prospective investors unless preceded or accompanied by an effective prospectus. | |
| | | |
©2015 American Century Proprietary Holdings, Inc. All rights reserved.
CL-ANN-86509 1508 | |
|
| |
| ANNUAL REPORT | JUNE 30, 2015 |
Disciplined Growth Fund
|
| | |
| President's Letter | 2 |
|
| Performance | 3 |
|
| Portfolio Commentary | |
|
| Fund Characteristics | |
|
| Shareholder Fee Example | |
|
| Schedule of Investments | |
|
| Statement of Assets and Liabilities | |
|
| Statement of Operations | |
|
| Statement of Changes in Net Assets | |
|
| Notes to Financial Statements | |
|
| Financial Highlights | |
|
| Report of Independent Registered Public Accounting Firm | |
|
| Management | |
|
| Approval of Management Agreement | |
|
| Additional Information | |
|
Any opinions expressed in this report reflect those of the author as of the date of the report, and do not necessarily represent the opinions of American Century Investments® or any other person in the American Century Investments organization. Any such opinions are subject to change at any time based upon market or other conditions and American Century Investments disclaims any responsibility to update such opinions. These opinions may not be relied upon as investment advice and, because investment decisions made by American Century Investments funds are based on numerous factors, may not be relied upon as an indication of trading intent on behalf of any American Century Investments fund. Security examples are used for representational purposes only and are not intended as recommendations to purchase or sell securities. Performance information for comparative indices and securities is provided to American Century Investments by third party vendors. To the best of American Century Investments’ knowledge, such information is accurate at the time of printing.
|
| |
| Dear Investor:
Thank you for reviewing this annual report for the 12 months ended June 30, 2015. It provides investment performance and portfolio information for the reporting period, plus longer-term historical performance data.
Annual reports remain important vehicles for conveying information about fund returns, including market and economic factors that affected performance during the reporting period. For additional, updated investment and market insights, we encourage you to visit our website, americancentury.com. |
| Jonathan Thomas |
Global Divergence Favored U.S. Assets
“Global divergence” between the U.S. and the rest of the world emerged as a prevalent theme during the reporting period. This theme embraced not only the relatively stronger economic growth enjoyed by the U.S. compared with most of the world, but also the related contrast between the U.S. Federal Reserve’s unwinding of monetary stimulus compared with the continuation and expansion of stimulus by other major central banks. Low inflation also prevailed, after crude oil prices plunged over 40% amid muted demand for commodities in general. In this environment, the U.S. dollar, U.S. growth stocks, and longer-maturity U.S. Treasuries generally benefited from “flight to quality” capital flows, reinforced by geopolitical and financial turmoil, particularly in Greece, Russia/Ukraine, China, and the Middle East.
Strong global capital flows into U.S. assets generated a global divergence between investment returns for U.S. and non-U.S. markets, especially for U.S. investors who realized their returns in dollar terms. For the reporting period, the U.S. Dollar Index, the S&P 500 Index, and the Barclays U.S. Aggregate Bond Index returned 19.74%, 7.42%, and 1.86%, respectively. By contrast, the MSCI EAFE Index, the MSCI Emerging Markets Index, and the Barclays Global Aggregate Bond ex-USD (Unhedged) Index returned -4.22%, -5.12%, and -13.19%, respectively, for U.S. investors unhedged for the strong dollar’s impact on non-dollar-denominated returns.
We expect more monetary policy divergence between the U.S. and other major developed economies in the coming months, accompanied by continued market volatility. This could present both challenges and opportunities for active investment managers. Upward pressures on inflation and interest rates could develop as the massive amount of global monetary stimulus in progress takes hold and economies improve. In this environment, we continue to believe in a disciplined, diversified, long-term investment approach, using professionally managed stock and bond portfolios to meet financial goals. We appreciate your continued trust in us.
Sincerely,
Jonathan Thomas
President and Chief Executive Officer
American Century Investments
|
| | | | | |
| Total Returns as of June 30, 2015 |
| | | | Average Annual Returns | |
| | Ticker Symbol | 1 year | 5 years | Since Inception | Inception Date |
| Investor Class | ADSIX | 6.59% | 18.50% | 8.92% | 9/30/05 |
| Russell 1000 Growth Index | — | 10.56% | 18.58% | 8.90% | — |
| Institutional Class | ADCIX | 6.84% | 18.75% | 9.14% | 9/30/05 |
A Class(1) | ADCVX | | | | 9/30/05 |
| No sales charge* | | 6.35% | 18.23% | 8.66% | |
| With sales charge* | | 0.21% | 16.84% | 8.00% | |
| C Class | ADCCX | 5.56% | 17.33% | 6.50% | 9/28/07 |
| R Class | ADRRX | 6.06% | 17.91% | 8.38% | 9/30/05 |
| |
| * | Sales charges include initial sales charges and contingent deferred sales charges (CDSCs), as applicable. A Class shares have a 5.75% maximum initial sales charge and may be subject to a maximum CDSC of 1.00%. C Class shares redeemed within 12 months of purchase are subject to a maximum CDSC of 1.00%. The SEC requires that mutual funds provide performance information net of maximum sales charges in all cases where charges could be applied. |
| |
| (1) | Prior to September 4, 2007, the A Class was referred to as the Advisor Class and did not have a front-end sales charge. Performance prior to that date has been adjusted to reflect this charge. |
Data presented reflect past performance. Past performance is no guarantee of future results. Current performance may be higher or lower than the performance shown. Investment return and principal value will fluctuate, and redemption value may be more or less than original cost. Data assumes reinvestment of dividends and capital gains, and none of the charts reflect the deduction of taxes that a shareholder would pay on fund distributions or the redemption of fund shares. To obtain performance data current to the most recent month end, please call 1-800-345-2021 or visit americancentury.com. For additional information about the fund, please consult the prospectus.
|
|
| Growth of $10,000 Over Life of Class |
| $10,000 investment made September 30, 2005 |
| Performance for other share classes will vary due to differences in fee structure. |
|
| |
| Value on June 30, 2015 |
| | Investor Class — $23,013 |
| |
| | Russell 1000 Growth Index — $22,979 |
| |
*From September 30, 2005, the Investor Class's inception date. Not annualized.
|
| | | | |
| Total Annual Fund Operating Expenses |
| Investor Class | Institutional Class | A Class | C Class | R Class |
| 1.02% | 0.82% | 1.27% | 2.02% | 1.52% |
The total annual fund operating expenses shown is as stated in the fund’s prospectus current as of the date of this report. The prospectus may vary from the expense ratio shown elsewhere in this report because it is based on a different time period, includes acquired fund fees and expenses, and, if applicable, does not include fee waivers or expense reimbursements.
Data presented reflect past performance. Past performance is no guarantee of future results. Current performance may be higher or lower than the performance shown. Investment return and principal value will fluctuate, and redemption value may be more or less than original cost. Data assumes reinvestment of dividends and capital gains, and none of the charts reflect the deduction of taxes that a shareholder would pay on fund distributions or the redemption of fund shares. To obtain performance data current to the most recent month end, please call 1-800-345-2021 or visit americancentury.com. For additional information about the fund, please consult the prospectus.
Portfolio Managers: Bill Martin and Lynette Pang
Performance Summary
Disciplined Growth returned 6.59%* for the fiscal year ended June 30, 2015, compared with the 10.56% return of its benchmark, the Russell 1000 Growth Index and the 7.42%** return of the broad S&P 500 Index.
U.S. equity markets endured substantial volatility, but ended the 12-month period with advances. Disciplined Growth produced gains during the 12-month period, but was unable to match the return of its benchmark, the Russell 1000 Growth Index. Security selection in the consumer discretionary sector was a leading detractor from fund results, while energy sector holdings contributed to relative performance.
Disciplined Growth’s stock selection process incorporates factors of valuation, quality, growth, and sentiment while striving to minimize unintended risks along industries and other risk characteristics. Within the fund, valuation- and quality-based factors proved most difficult, sentiment indicators were mildly negative, and growth indicators benefited returns.
Consumer Discretionary Was Leading Detractor
Security selection in the consumer discretionary sector was the principal detractor from the fund’s twelve-month results. Several portfolio-only sector positions produced substantial declines and weighed on relative gains. These included Tower International, a metal component manufacturer for the auto industry, whose stock declined on lowered analysts ratings despite strong quarterly results. We ultimately exited the position. For-profit education provider Strayer Education weighed on results as lower enrollment due to stricter financial aid funding guidelines imposed on for-profit colleges pressured the company’s revenues. However, the holding remains very attractive across valuation and quality metrics and is strong on sentiment-based factors. Elsewhere in the sector, casino operator Las Vegas Sands was detrimental. The company’s stock price fell dramatically on weaker-than-expected revenue and earnings, and management’s announced dividend increase and two-billion-dollar buyback program were not enough to stave off price declines. Our conviction in the holding is driven by strong valuation and quality insights.
The fund’s information technology holdings also weighed on returns. An overweight position, relative to the benchmark, in data storage solutions manufacturer SanDisk weighed on returns as the company lowered estimates due to an oversupply of inventory. Subsequent analysts downgrades led its stock price to decline, and we liquidated our position.
A number of positions in the financials sector weighed on the fund’s returns. Shares of real estate management company Altisource Portfolio Solutions declined steeply on disappointing quarterly earnings and again after a New York State investigation implicated a subsidiary. We ultimately eliminated the non-benchmark holding. Nationstar Mortgage Holdings also weighed on results. The residential mortgage servicer reported subdued earnings due to declines in mortgage origination and real estate services. We began to exit our position in the holding based on deteriorating quality insights.
| |
| * | All fund returns referenced in this commentary are for Investor Class shares. Performance for other share classes will vary due to differences in fee structure; when Investor Class performance exceeds that of the fund's benchmark, other share classes may not. See page 3 for returns for all share classes. |
**The S&P 500 Index average annual returns were 17.33% for the five-year period ended June 30, 2015, and 7.71% since the fund’s inception on September 30, 2005.
Energy and Health Care Outperformed
Stock selection in the underperforming energy sector bolstered the fund’s relative returns. Much of the contribution stemmed from remaining underweight to or not holding a number of index names that saw sharp declines in their stock prices as price of oil continued to slide. Limited exposure to oil exploration firm Halliburton, which declined nearly 40%, was particularly helpful. We opted to exit the position entirely during the year.
Health care sector outperformance was primarily due to positioning in the strongly appreciating biotechnology industry. Regeneron Pharmaceuticals, where we maintained substantial exposure, appreciated steadily during the year. The holding’s stock price climbed to new highs at period-end after the company released positive phase 3 study results of its cardiovascular drug, Praluent. Higher demand for its therapies led biotechnology company Amgen to consistently beat earnings and revenue expectations over the course of the year. In addition, management’s restructuring and share buyback programs further supported the company’s stock price.
Industrials sector holdings helped to bolster the fund’s relative gains during the period. Southwest Airlines was a leading sector contributor, gaining due to higher travel demand due in part to falling fuel costs. Elsewhere in the fund, an overweight position in video game maker Electronic Arts was beneficial. The company’s rising sales, particularly on mobile platforms, led to stronger-than-expected revenues and earnings.
A Look Ahead
The U.S. economy seems poised to continue to experience hesitant economic growth through the second half of 2015. Economic activity appears to have somewhat diminished in breadth, though remains slow yet steady. We believe that divergence in monetary policy between the U.S. and much of the rest of the world is likely to continue. Therefore, questions surrounding when and how much the Federal Reserve might act to tighten money supply, and the potential impact of such a move, are likely to continue driving investor sentiment in equity markets. Our disciplined, objective, and systematic investment strategy is designed to take advantage of opportunities at the individual company level. We believe this approach is the most powerful way to capitalize on market inefficiencies that lead to the mispricing of individual stocks. The funds largest overweights are in information technology and industrials, while the underweights are led by the materials and consumer discretionary sectors.
|
| |
| JUNE 30, 2015 |
| Top Ten Holdings | % of net assets |
| Apple, Inc. | 7.6% |
| Gilead Sciences, Inc. | 2.4% |
| Verizon Communications, Inc. | 2.1% |
| Google, Inc., Class A | 2.1% |
| Facebook, Inc., Class A | 2.0% |
| PepsiCo, Inc. | 1.9% |
| Amgen, Inc. | 1.8% |
| AbbVie, Inc. | 1.8% |
| 3M Co. | 1.7% |
| Biogen, Inc. | 1.6% |
| | |
| Top Five Industries | % of net assets |
| Biotechnology | 8.7% |
| Technology Hardware, Storage and Peripherals | 8.4% |
| Software | 6.8% |
| Internet Software and Services | 6.3% |
| Pharmaceuticals | 4.4% |
| | |
| Types of Investments in Portfolio | % of net assets |
| Common Stocks | 99.2% |
| Temporary Cash Investments | 2.5% |
| Other Assets and Liabilities | (1.7)% |
Fund shareholders may incur two types of costs: (1) transaction costs, including sales charges (loads) on purchase payments and redemption/exchange fees; and (2) ongoing costs, including management fees; distribution and service (12b-1) fees; and other fund expenses. This example is intended to help you understand your ongoing costs (in dollars) of investing in your fund and to compare these costs with the ongoing cost of investing in other mutual funds.
The example is based on an investment of $1,000 made at the beginning of the period and held for the entire period from January 1, 2015 to June 30, 2015.
Actual Expenses
The table provides information about actual account values and actual expenses for each class. You may use the information, together with the amount you invested, to estimate the expenses that you paid over the period. First, identify the share class you own. Then simply divide your account value by $1,000 (for example, an $8,600 account value divided by $1,000 = 8.6), then multiply the result by the number under the heading “Expenses Paid During Period” to estimate the expenses you paid on your account during this period.
If you hold Investor Class shares of any American Century Investments fund, or Institutional Class shares of the American Century Diversified Bond Fund, in an American Century Investments account (i.e., not a financial intermediary or retirement plan account), American Century Investments may charge you a $12.50 semiannual account maintenance fee if the value of those shares is less than $10,000. We will redeem shares automatically in one of your accounts to pay the $12.50 fee. In determining your total eligible investment amount, we will include your investments in all personal accounts (including American Century Investments Brokerage accounts) registered under your Social Security number. Personal accounts include individual accounts, joint accounts, UGMA/UTMA accounts, personal trusts, Coverdell Education Savings Accounts and IRAs (including traditional, Roth, Rollover, SEP-, SARSEP- and SIMPLE-IRAs), and certain other retirement accounts. If you have only business, business retirement, employer-sponsored or American Century Investments Brokerage accounts, you are currently not subject to this fee. If you are subject to the Account Maintenance Fee, your account value could be reduced by the fee amount.
Hypothetical Example for Comparison Purposes
The table also provides information about hypothetical account values and hypothetical expenses based on the actual expense ratio of each class of your fund and an assumed rate of return of 5% per year before expenses, which is not the actual return of a fund’s share class. The hypothetical account values and expenses may not be used to estimate the actual ending account balance or expenses you paid for the period. You may use this information to compare the ongoing costs of investing in your fund and other funds. To do so, compare this 5% hypothetical example with the 5% hypothetical examples that appear in the shareholder reports of the other funds.
Please note that the expenses shown in the table are meant to highlight your ongoing costs only and do not reflect any transactional costs, such as sales charges (loads) or redemption/exchange fees. Therefore, the table is useful in comparing ongoing costs only, and will not help you determine the relative total costs of owning different funds. In addition, if these transactional costs were included, your costs would have been higher.
|
| | | | |
| | Beginning
Account Value
1/1/15 | Ending
Account Value
6/30/15 | Expenses Paid
During Period(1) 1/1/15 - 6/30/15 | Annualized
Expense Ratio(1) |
| Actual | | | | |
| Investor Class | $1,000 | $1,009.80 | $5.08 | 1.02% |
| Institutional Class | $1,000 | $1,011.20 | $4.09 | 0.82% |
| A Class | $1,000 | $1,009.20 | $6.33 | 1.27% |
| C Class | $1,000 | $1,005.50 | $10.04 | 2.02% |
| R Class | $1,000 | $1,007.70 | $7.57 | 1.52% |
| Hypothetical | | | | |
| Investor Class | $1,000 | $1,019.74 | $5.11 | 1.02% |
| Institutional Class | $1,000 | $1,020.73 | $4.11 | 0.82% |
| A Class | $1,000 | $1,018.50 | $6.36 | 1.27% |
| C Class | $1,000 | $1,014.78 | $10.09 | 2.02% |
| R Class | $1,000 | $1,017.26 | $7.60 | 1.52% |
| |
| (1) | Expenses are equal to the class's annualized expense ratio listed in the table above, multiplied by the average account value over the period, multiplied by 181, the number of days in the most recent fiscal half-year, divided by 365, to reflect the one-half year period. |
JUNE 30, 2015
|
| | | | |
| | Shares | Value |
| COMMON STOCKS — 99.2% | | |
| Aerospace and Defense — 3.0% | | |
Astronics Corp.(1) | 84,052 | $ | 5,958,446 |
|
| Boeing Co. (The) | 16,239 | 2,252,674 |
|
| Honeywell International, Inc. | 86,577 | 8,828,257 |
|
| Huntington Ingalls Industries, Inc. | 69,791 | 7,857,769 |
|
Spirit AeroSystems Holdings, Inc., Class A(1) | 163,046 | 8,985,465 |
|
| | | 33,882,611 |
|
| Airlines — 1.8% | | |
| Southwest Airlines Co. | 296,163 | 9,800,034 |
|
United Continental Holdings, Inc.(1) | 195,754 | 10,376,919 |
|
| | | 20,176,953 |
|
| Beverages — 3.4% | | |
| Coca-Cola Co. (The) | 183,677 | 7,205,649 |
|
| Dr Pepper Snapple Group, Inc. | 127,633 | 9,304,445 |
|
| PepsiCo, Inc. | 225,982 | 21,093,160 |
|
| | | 37,603,254 |
|
| Biotechnology — 8.7% | | |
| Amgen, Inc. | 133,908 | 20,557,556 |
|
Biogen, Inc.(1) | 45,396 | 18,337,260 |
|
Celgene Corp.(1) | 152,943 | 17,700,858 |
|
| Gilead Sciences, Inc. | 225,946 | 26,453,758 |
|
Ophthotech Corp.(1) | 84,978 | 4,423,955 |
|
Regeneron Pharmaceuticals, Inc.(1) | 17,977 | 9,170,607 |
|
| | | 96,643,994 |
|
| Building Products — 0.1% | | |
Continental Building Products, Inc.(1) | 53,081 | 1,124,786 |
|
| Capital Markets — 1.3% | | |
| Ameriprise Financial, Inc. | 5,627 | 702,981 |
|
| Artisan Partners Asset Management, Inc., Class A | 17,813 | 827,592 |
|
| Franklin Resources, Inc. | 116,925 | 5,732,833 |
|
| Legg Mason, Inc. | 106,671 | 5,496,757 |
|
| Moelis & Co., Class A | 63,168 | 1,813,553 |
|
| | | 14,573,716 |
|
| Chemicals — 0.8% | | |
| Cabot Corp. | 142,154 | 5,300,922 |
|
| International Flavors & Fragrances, Inc. | 15,358 | 1,678,476 |
|
| Minerals Technologies, Inc. | 24,170 | 1,646,702 |
|
| | | 8,626,100 |
|
| Commercial Services and Supplies — 0.7% | | |
| Herman Miller, Inc. | 56,082 | 1,622,452 |
|
| Pitney Bowes, Inc. | 57,539 | 1,197,387 |
|
| Waste Management, Inc. | 103,814 | 4,811,779 |
|
| | | 7,631,618 |
|
|
| | | | |
| | Shares | Value |
| Communications Equipment — 1.1% | | |
ARRIS Group, Inc.(1) | 62,014 | $ | 1,897,629 |
|
F5 Networks, Inc.(1) | 1,989 | 239,376 |
|
| QUALCOMM, Inc. | 160,029 | 10,022,616 |
|
| | | 12,159,621 |
|
| Containers and Packaging — 0.5% | | |
Berry Plastics Group, Inc.(1) | 174,887 | 5,666,339 |
|
| Diversified Consumer Services — 1.4% | | |
| Capella Education Co. | 11,593 | 622,197 |
|
| H&R Block, Inc. | 302,474 | 8,968,354 |
|
K12, Inc.(1) | 102,445 | 1,295,929 |
|
Strayer Education, Inc.(1) | 107,971 | 4,653,550 |
|
| | | 15,540,030 |
|
Diversified Financial Services† | | |
| GAIN Capital Holdings, Inc. | 8,882 | 84,912 |
|
| Diversified Telecommunication Services — 2.5% | | |
| CenturyLink, Inc. | 132,357 | 3,888,649 |
|
| Verizon Communications, Inc. | 510,922 | 23,814,074 |
|
| | | 27,702,723 |
|
| Electrical Equipment — 1.9% | | |
| Emerson Electric Co. | 158,360 | 8,777,895 |
|
Enphase Energy, Inc.(1) | 159,820 | 1,216,230 |
|
| Rockwell Automation, Inc. | 87,823 | 10,946,259 |
|
| | | 20,940,384 |
|
| Electronic Equipment, Instruments and Components — 0.4% | | |
| Corning, Inc. | 227,433 | 4,487,253 |
|
| Energy Equipment and Services — 0.9% | | |
FMC Technologies, Inc.(1) | 11,151 | 462,655 |
|
| Schlumberger Ltd. | 114,651 | 9,881,770 |
|
| | | 10,344,425 |
|
| Food and Staples Retailing — 2.3% | | |
| CVS Health Corp. | 76,031 | 7,974,131 |
|
| Kroger Co. (The) | 168,824 | 12,241,428 |
|
| Wal-Mart Stores, Inc. | 71,042 | 5,039,009 |
|
| | | 25,254,568 |
|
| Food Products — 2.1% | | |
| Archer-Daniels-Midland Co. | 106,734 | 5,146,713 |
|
| Hormel Foods Corp. | 162,178 | 9,141,974 |
|
| Pilgrim's Pride Corp. | 367,771 | 8,447,700 |
|
Seaboard Corp.(1) | 69 | 248,331 |
|
| | | 22,984,718 |
|
| Health Care Equipment and Supplies — 4.0% | | |
| Analogic Corp. | 9,185 | 724,696 |
|
| DENTSPLY International, Inc. | 26,165 | 1,348,806 |
|
Edwards Lifesciences Corp.(1) | 72,955 | 10,390,981 |
|
Hologic, Inc.(1) | 241,310 | 9,184,258 |
|
|
| | | | |
| | Shares | Value |
ICU Medical, Inc.(1) | 2,495 | $ | 238,672 |
|
| St. Jude Medical, Inc. | 147,826 | 10,801,646 |
|
| Stryker Corp. | 110,893 | 10,598,044 |
|
Varian Medical Systems, Inc.(1) | 20,269 | 1,709,285 |
|
| | | 44,996,388 |
|
| Health Care Providers and Services — 2.8% | | |
| Aetna, Inc. | 43,499 | 5,544,383 |
|
| Anthem, Inc. | 20,600 | 3,381,284 |
|
| Cardinal Health, Inc. | 64,951 | 5,433,151 |
|
Express Scripts Holding Co.(1) | 156,676 | 13,934,763 |
|
| UnitedHealth Group, Inc. | 25,964 | 3,167,608 |
|
| | | 31,461,189 |
|
| Health Care Technology — 0.1% | | |
Cerner Corp.(1) | 3,103 | 214,293 |
|
Merge Healthcare, Inc.(1) | 52,505 | 252,024 |
|
| Quality Systems, Inc. | 28,128 | 466,081 |
|
| | | 932,398 |
|
| Hotels, Restaurants and Leisure — 4.3% | | |
Boyd Gaming Corp.(1) | 42,989 | 642,686 |
|
| Brinker International, Inc. | 127,274 | 7,337,346 |
|
Chipotle Mexican Grill, Inc.(1) | 15,509 | 9,382,790 |
|
| Cracker Barrel Old Country Store, Inc. | 61,476 | 9,169,760 |
|
| Darden Restaurants, Inc. | 51,732 | 3,677,111 |
|
| Las Vegas Sands Corp. | 197,143 | 10,363,807 |
|
| McDonald's Corp. | 6,722 | 639,060 |
|
| Ruth's Hospitality Group, Inc. | 2,969 | 47,860 |
|
| Vail Resorts, Inc. | 61,114 | 6,673,649 |
|
| | | 47,934,069 |
|
| Household Durables — 0.8% | | |
| Harman International Industries, Inc. | 71,406 | 8,493,030 |
|
| Household Products — 0.9% | | |
Central Garden and Pet Co.(1) | 55,730 | 635,879 |
|
| Clorox Co. (The) | 19,829 | 2,062,612 |
|
| Colgate-Palmolive Co. | 40,424 | 2,644,134 |
|
| Procter & Gamble Co. (The) | 67,286 | 5,264,457 |
|
| | | 10,607,082 |
|
| Industrial Conglomerates — 1.7% | | |
| 3M Co. | 119,549 | 18,446,411 |
|
| Insurance — 0.1% | | |
| Federated National Holding Co. | 8,348 | 202,022 |
|
Heritage Insurance Holdings, Inc.(1) | 25,101 | 577,072 |
|
| | | 779,094 |
|
| Internet and Catalog Retail — 1.2% | | |
Amazon.com, Inc.(1) | 19,723 | 8,561,557 |
|
Liberty Interactive Corp. QVC Group, Class A(1) | 152,660 | 4,236,315 |
|
| PetMed Express, Inc. | 47,553 | 821,240 |
|
| | | 13,619,112 |
|
|
| | | | |
| | Shares | Value |
| Internet Software and Services — 6.3% | | |
eBay, Inc.(1) | 281,917 | $ | 16,982,680 |
|
Endurance International Group Holdings, Inc.(1) | 81,006 | 1,673,584 |
|
Everyday Health, Inc.(1) | 27,191 | 347,501 |
|
Facebook, Inc., Class A(1) | 255,220 | 21,888,943 |
|
Google, Inc., Class A(1) | 42,912 | 23,174,197 |
|
LogMeIn, Inc.(1) | 19,015 | 1,226,277 |
|
VeriSign, Inc.(1) | 80,773 | 4,985,310 |
|
| | | 70,278,492 |
|
| IT Services — 4.1% | | |
| Accenture plc, Class A | 151,651 | 14,676,784 |
|
| CSG Systems International, Inc. | 6,999 | 221,588 |
|
| International Business Machines Corp. | 107,388 | 17,467,732 |
|
Teradata Corp.(1) | 72,041 | 2,665,517 |
|
| Total System Services, Inc. | 148,169 | 6,189,019 |
|
| Visa, Inc., Class A | 60,352 | 4,052,637 |
|
| Western Union Co. (The) | 41,499 | 843,675 |
|
| | | 46,116,952 |
|
| Machinery — 4.0% | | |
| Caterpillar, Inc. | 99,576 | 8,446,036 |
|
| Cummins, Inc. | 78,712 | 10,326,227 |
|
| Illinois Tool Works, Inc. | 20,237 | 1,857,554 |
|
| PACCAR, Inc. | 85,896 | 5,481,024 |
|
| Parker-Hannifin Corp. | 79,571 | 9,256,494 |
|
| Stanley Black & Decker, Inc. | 88,752 | 9,340,261 |
|
| | | 44,707,596 |
|
| Media — 3.6% | | |
| Cablevision Systems Corp., Class A | 19,985 | 478,441 |
|
| Comcast Corp., Class A | 91,805 | 5,521,153 |
|
| Omnicom Group, Inc. | 141,962 | 9,864,939 |
|
| Scripps Networks Interactive, Inc., Class A | 136,533 | 8,925,162 |
|
| Twenty-First Century Fox, Inc. | 93,519 | 3,043,576 |
|
| Viacom, Inc., Class B | 7,931 | 512,660 |
|
| Walt Disney Co. (The) | 99,136 | 11,315,383 |
|
| | | 39,661,314 |
|
| Metals and Mining — 0.3% | | |
| Materion Corp. | 87,320 | 3,078,030 |
|
| Multiline Retail — 2.5% | | |
| Big Lots, Inc. | 125,561 | 5,648,989 |
|
| Dillard's, Inc., Class A | 69,296 | 7,289,246 |
|
| Kohl's Corp. | 96,134 | 6,018,950 |
|
| Target Corp. | 111,842 | 9,129,663 |
|
| | | 28,086,848 |
|
| Oil, Gas and Consumable Fuels — 0.5% | | |
| Valero Energy Corp. | 85,383 | 5,344,976 |
|
| Pharmaceuticals — 4.4% | | |
| AbbVie, Inc. | 303,828 | 20,414,203 |
|
|
| | | | |
| | Shares | Value |
| Bristol-Myers Squibb Co. | 46,069 | $ | 3,065,431 |
|
Jazz Pharmaceuticals plc(1) | 46,137 | 8,123,342 |
|
| Johnson & Johnson | 54,967 | 5,357,084 |
|
| Merck & Co., Inc. | 189,568 | 10,792,106 |
|
Nektar Therapeutics(1) | 104,378 | 1,305,769 |
|
| | | 49,057,935 |
|
| Professional Services — 0.1% | | |
RPX Corp.(1) | 77,647 | 1,312,234 |
|
| Real Estate Investment Trusts (REITs) — 0.8% | | |
| Lamar Advertising Co., Class A | 152,760 | 8,780,645 |
|
| Real Estate Management and Development — 1.1% | | |
| Jones Lang LaSalle, Inc. | 51,881 | 8,871,651 |
|
Marcus & Millichap, Inc.(1) | 69,038 | 3,185,413 |
|
| | | 12,057,064 |
|
| Road and Rail — 0.1% | | |
| Union Pacific Corp. | 8,969 | 855,373 |
|
| Semiconductors and Semiconductor Equipment — 2.2% | | |
| Intel Corp. | 306,102 | 9,310,092 |
|
| Texas Instruments, Inc. | 286,854 | 14,775,850 |
|
| | | 24,085,942 |
|
| Software — 6.8% | | |
| Activision Blizzard, Inc. | 130,086 | 3,149,382 |
|
Cadence Design Systems, Inc.(1) | 476,841 | 9,374,694 |
|
Electronic Arts, Inc.(1) | 188,914 | 12,562,781 |
|
| Intuit, Inc. | 120,086 | 12,101,066 |
|
| Microsoft Corp. | 348,650 | 15,392,898 |
|
| Oracle Corp. | 404,749 | 16,311,385 |
|
Synopsys, Inc.(1) | 17,465 | 884,602 |
|
Tableau Software, Inc., Class A(1) | 23,835 | 2,748,176 |
|
VMware, Inc., Class A(1) | 32,110 | 2,753,111 |
|
| | | 75,278,095 |
|
| Specialty Retail — 4.4% | | |
Bed Bath & Beyond, Inc.(1) | 116,962 | 8,068,039 |
|
Build-A-Bear Workshop, Inc.(1) | 83,022 | 1,327,522 |
|
| Foot Locker, Inc. | 149,101 | 9,991,258 |
|
| Gap, Inc. (The) | 238,090 | 9,087,895 |
|
| Home Depot, Inc. (The) | 53,632 | 5,960,124 |
|
| Lowe's Cos., Inc. | 183,232 | 12,271,047 |
|
Murphy USA, Inc.(1) | 31,535 | 1,760,284 |
|
| | | 48,466,169 |
|
| Technology Hardware, Storage and Peripherals — 8.4% | | |
| Apple, Inc. | 669,709 | 83,998,251 |
|
| EMC Corp. | 344,842 | 9,100,381 |
|
| | | 93,098,632 |
|
| Textiles, Apparel and Luxury Goods — 0.5% | | |
Michael Kors Holdings Ltd.(1) | 15,478 | 651,469 |
|
|
| | | | |
| | Shares | Value |
| Wolverine World Wide, Inc. | 182,042 | $ | 5,184,556 |
|
| | | 5,836,025 |
|
| Thrifts and Mortgage Finance — 0.3% | | |
Essent Group Ltd.(1) | 138,882 | 3,798,423 |
|
Nationstar Mortgage Holdings, Inc.(1) | 360 | 6,048 |
|
| | | 3,804,471 |
|
Trading Companies and Distributors† | | |
| Kaman Corp. | 10,923 | 458,111 |
|
Wireless Telecommunication Services† | | |
| Shenandoah Telecommunications Co. | 9,153 | 313,307 |
|
TOTAL COMMON STOCKS (Cost $1,037,876,259) | | 1,103,374,989 |
|
| TEMPORARY CASH INVESTMENTS — 2.5% | | |
Repurchase Agreement, Bank of America Merrill Lynch, (collateralized by various U.S. Treasury obligations, 1.50%, 1/31/19 - 11/30/19, valued at $4,709,823), in a joint trading account at 0.10%, dated 6/30/15, due 7/1/15 (Delivery value $4,615,852) | | 4,615,839 |
|
| Repurchase Agreement, Fixed Income Clearing Corp., (collateralized by various U.S. Treasury obligations, 2.375%, 08/15/24, valued at $18,836,975), at 0.01%, dated 6/30/15, due 7/1/15 (Delivery value $18,466,005) | | 18,466,000 |
|
| State Street Institutional Liquid Reserves Fund, Premier Class | 4,590,273 | 4,590,273 |
|
TOTAL TEMPORARY CASH INVESTMENTS (Cost $27,672,112) | | 27,672,112 |
|
TOTAL INVESTMENT SECURITIES — 101.7% (Cost $1,065,548,371) | | 1,131,047,101 |
|
| OTHER ASSETS AND LIABILITIES — (1.7)% | | (18,543,205) |
|
| TOTAL NET ASSETS — 100.0% | | $ | 1,112,503,896 |
|
|
| | |
| NOTES TO SCHEDULE OF INVESTMENTS |
| |
| † | Category is less than 0.05% of total net assets. |
See Notes to Financial Statements.
|
|
| Statement of Assets and Liabilities |
|
| | | |
| JUNE 30, 2015 | |
| Assets | |
| Investment securities, at value (cost of $1,065,548,371) | $ | 1,131,047,101 |
|
| Receivable for investments sold | 71,148,844 |
|
| Receivable for capital shares sold | 1,600,215 |
|
| Dividends and interest receivable | 695,321 |
|
| | 1,204,491,481 |
|
| | |
| Liabilities | |
| Payable for investments purchased | 89,905,902 |
|
| Payable for capital shares redeemed | 1,125,297 |
|
| Accrued management fees | 872,383 |
|
| Distribution and service fees payable | 84,003 |
|
| | 91,987,585 |
|
| | |
| Net Assets | $ | 1,112,503,896 |
|
| | |
| Net Assets Consist of: | |
| Capital (par value and paid-in surplus) | $ | 1,034,753,953 |
|
| Undistributed net investment income | 311,872 |
|
| Undistributed net realized gain | 11,939,341 |
|
| Net unrealized appreciation | 65,498,730 |
|
| | $ | 1,112,503,896 |
|
|
| | | | | | |
| | Net Assets | Shares Outstanding | Net Asset Value Per Share |
| Investor Class, $0.01 Par Value |
| $502,388,876 |
| 26,240,942 |
| $19.15 |
| Institutional Class, $0.01 Par Value |
| $372,011,435 |
| 19,379,958 |
| $19.20 |
| A Class, $0.01 Par Value |
| $173,299,645 |
| 9,079,554 |
| $19.09* |
| C Class, $0.01 Par Value |
| $50,354,667 |
| 2,735,332 |
| $18.41 |
| R Class, $0.01 Par Value |
| $14,449,273 |
| 764,735 |
| $18.89 |
*Maximum offering price $20.25 (net asset value divided by 0.9425).
See Notes to Financial Statements.
|
| | | |
| YEAR ENDED JUNE 30, 2015 | |
| Investment Income (Loss) | |
| Income: | |
| Dividends | $ | 14,073,575 |
|
| Interest | 4,632 |
|
| | 14,078,207 |
|
| | |
| Expenses: | |
| Management fees | 7,674,915 |
|
| Distribution and service fees: | |
| A Class | 335,768 |
|
| C Class | 375,719 |
|
| R Class | 48,317 |
|
| Directors' fees and expenses | 35,371 |
|
| | 8,470,090 |
|
| | |
| Net investment income (loss) | 5,608,117 |
|
| | |
| Realized and Unrealized Gain (Loss) | |
| Net realized gain (loss) on investment transactions | 28,675,321 |
|
| Change in net unrealized appreciation (depreciation) on investments | 6,359,529 |
|
| | |
| Net realized and unrealized gain (loss) | 35,034,850 |
|
| | |
| Net Increase (Decrease) in Net Assets Resulting from Operations | $ | 40,642,967 |
|
See Notes to Financial Statements.
|
|
| Statement of Changes in Net Assets |
|
| | | | | | |
| YEARS ENDED JUNE 30, 2015 AND JUNE 30, 2014 |
| Increase (Decrease) in Net Assets | June 30, 2015 | June 30, 2014 |
| Operations | | |
| Net investment income (loss) | $ | 5,608,117 |
| $ | 1,611,515 |
|
| Net realized gain (loss) | 28,675,321 |
| 21,798,137 |
|
| Change in net unrealized appreciation (depreciation) | 6,359,529 |
| 41,666,448 |
|
| Net increase (decrease) in net assets resulting from operations | 40,642,967 |
| 65,076,100 |
|
| | | |
| Distributions to Shareholders | | |
| From net investment income: | | |
| Investor Class | (2,671,637 | ) | (1,118,387 | ) |
| Institutional Class | (2,014,427 | ) | (161,505 | ) |
| A Class | (490,407 | ) | (263,244 | ) |
| R Class | (18,566 | ) | (6,853 | ) |
| From net realized gains: | | |
| Investor Class | (18,348,244 | ) | (8,175,308 | ) |
| Institutional Class | (5,613,156 | ) | (783,055 | ) |
| A Class | (5,223,057 | ) | (3,202,886 | ) |
| C Class | (1,471,637 | ) | (806,884 | ) |
| R Class | (294,749 | ) | (355,074 | ) |
| Decrease in net assets from distributions | (36,145,880 | ) | (14,873,196 | ) |
| | | |
| Capital Share Transactions | | |
Net increase (decrease) in net assets from capital share transactions (Note 5) | 728,536,103 |
| 142,933,604 |
|
| | | |
| Net increase (decrease) in net assets | 733,033,190 |
| 193,136,508 |
|
| | | |
| Net Assets | | |
| Beginning of period | 379,470,706 |
| 186,334,198 |
|
| End of period | $ | 1,112,503,896 |
| $ | 379,470,706 |
|
| | | |
| Undistributed net investment income | $ | 311,872 |
| $ | 23,157 |
|
See Notes to Financial Statements.
|
|
| Notes to Financial Statements |
JUNE 30, 2015
1. Organization
American Century Quantitative Equity Funds, Inc. (the corporation) is registered under the Investment Company Act of 1940, as amended (the 1940 Act), as an open-end management investment company and is organized as a Maryland corporation. Disciplined Growth Fund (the fund) is one fund in a series issued by the corporation. The fund is diversified as defined under the 1940 Act. The fund’s investment objective is to seek long-term capital growth.
The fund offers the Investor Class, the Institutional Class, the A Class, the C Class and the R Class. The A Class may incur an initial sales charge. The A Class and C Class may be subject to a contingent deferred sales charge. The share classes differ principally in their respective sales charges and distribution and shareholder servicing expenses and arrangements. The Institutional Class is made available to institutional shareholders or through financial intermediaries whose clients do not require the same level of shareholder and administrative services as shareholders of other classes. As a result, the Institutional Class is charged a lower unified management fee.
2. Significant Accounting Policies
The following is a summary of significant accounting policies consistently followed by the fund in preparation of its financial statements. The fund is an investment company and follows accounting and reporting guidance in accordance with accounting principles generally accepted in the United States of America. This may require management to make certain estimates and assumptions at the date of the financial statements. Actual results could differ from these estimates. Management evaluated the impact of events or transactions occurring through the date the financial statements were issued that would merit recognition or disclosure.
Investment Valuations — The fund determines the fair value of its investments and computes its net asset value per share at the close of regular trading (usually 4 p.m. Eastern time) on the New York Stock Exchange (NYSE) on each day the NYSE is open. The Board of Directors has adopted valuation policies and procedures to guide the investment advisor in the fund’s investment valuation process and to provide methodologies for the oversight of the fund’s pricing function.
Equity securities that are listed or traded on a domestic securities exchange are valued at the last reported sales price or at the official closing price as provided by the exchange. Equity securities traded on foreign securities exchanges are generally valued at the closing price of such securities on the exchange where primarily traded or at the close of the NYSE, if that is earlier. If no last sales price is reported, or if local convention or regulation so provides, the mean of the latest bid and asked prices may be used. Securities traded over-the-counter are valued at the mean of the latest bid and asked prices, the last sales price, or the official closing price.
Fixed income securities maturing within 60 days at the time of purchase may be valued at cost, plus or minus any amortized discount or premium or at the evaluated mean as provided by an independent pricing service. Evaluated mean prices are commonly derived through utilization of market models, which may consider, among other factors: trade data, quotations from dealers and active market makers, relevant yield curve and spread data, related sector levels, creditworthiness, trade data or market information on comparable securities, and other relevant security specific information.
Open-end management investment companies are valued at the reported net asset value per share. Repurchase agreements are valued at cost, which approximates fair value.
If the fund determines that the market price for an investment is not readily available or the valuation methods mentioned above do not reflect an investment’s fair value, such investment is valued as determined in good faith by the Board of Directors or its delegate, in accordance with policies and procedures adopted by the Board of Directors. In its determination of fair value, the fund may review several factors including, but not limited to, market information regarding the specific investment or comparable investments and correlation with other investment types, futures indices or general market indicators. Circumstances that may cause the fund to use these procedures to value an investment include, but are not limited to: an investment has been declared in default or is distressed; trading in a security has been suspended during the trading day or a
security is not actively trading on its principal exchange; prices received from a regular pricing source are deemed unreliable; or there is a foreign market holiday and no trading occurred.
The fund monitors for significant events occurring after the close of an investment’s primary exchange but before the fund’s net asset value per share is determined. Significant events may include, but are not limited to: corporate announcements and transactions; governmental action and political unrest that could impact a specific investment or an investment sector; or armed conflicts, natural disasters and similar events that could affect investments in a specific country or region. The fund also monitors for significant fluctuations between domestic and foreign markets, as evidenced by the U.S. market or such other indicators that the Board of Directors, or its delegate, deems appropriate. If significant fluctuations in foreign markets are identified, the fund may apply a model-derived factor to the closing price of equity securities traded on foreign securities exchanges. The factor is based on observable market data as provided by an independent pricing service.
Security Transactions — Security transactions are accounted for as of the trade date. Net realized gains and losses are determined on the identified cost basis, which is also used for federal income tax purposes.
Investment Income — Dividend income less foreign taxes withheld, if any, is recorded as of the ex-dividend date. Distributions received on securities that represent a return of capital or long-term capital gain are recorded as a reduction of cost of investments and/or as a realized gain. The fund may estimate the components of distributions received that may be considered nontaxable distributions or long-term capital gain distributions for income tax purposes. Interest income is recorded on the accrual basis and includes accretion of discounts and amortization of premiums.
Repurchase Agreements — The fund may enter into repurchase agreements with institutions that American Century Investment Management, Inc. (ACIM) (the investment advisor) has determined are creditworthy pursuant to criteria adopted by the Board of Directors. The fund requires that the collateral, represented by securities, received in a repurchase transaction be transferred to the custodian in a manner sufficient to enable the fund to obtain those securities in the event of a default under the repurchase agreement. ACIM monitors, on a daily basis, the securities transferred to ensure the value, including accrued interest, of the securities under each repurchase agreement is equal to or greater than amounts owed to the fund under each repurchase agreement.
Joint Trading Account — Pursuant to an Exemptive Order issued by the Securities and Exchange Commission, the fund, along with certain other funds in the American Century Investments family of funds, may transfer uninvested cash balances into a joint trading account. These balances are invested in one or more repurchase agreements that are collateralized by U.S. Treasury or Agency obligations.
Income Tax Status — It is the fund’s policy to distribute substantially all net investment income and net realized gains to shareholders and to otherwise qualify as a regulated investment company under provisions of the Internal Revenue Code. Accordingly, no provision has been made for income taxes. The fund files U.S. federal, state, local and non-U.S. tax returns as applicable. The fund's tax returns are subject to examination by the relevant taxing authority until expiration of the applicable statute of limitations, which is generally three years from the date of filing but can be longer in certain jurisdictions. At this time, management believes there are no uncertain tax positions which, based on their technical merit, would not be sustained upon examination and for which it is reasonably possible that the total amounts of unrecognized tax benefits will significantly change in the next twelve months.
Multiple Class — All shares of the fund represent an equal pro rata interest in the net assets of the class to which such shares belong, and have identical voting, dividend, liquidation and other rights and the same terms and conditions, except for class specific expenses and exclusive rights to vote on matters affecting only individual classes. Income, non-class specific expenses, and realized and unrealized capital gains and losses of the fund are allocated to each class of shares based on their relative net assets.
Distributions to Shareholders — Distributions from net investment income, if any, are generally declared and paid semiannually. Distributions from net realized gains, if any, are generally declared and paid annually.
Indemnifications — Under the corporation’s organizational documents, its officers and directors are indemnified against certain liabilities arising out of the performance of their duties to the fund. In addition, in the normal course of business, the fund enters into contracts that provide general indemnifications. The maximum exposure under these arrangements is unknown as this would involve future claims that may be made against a fund. The risk of material loss from such claims is considered by management to be remote.
3. Fees and Transactions with Related Parties
Certain officers and directors of the corporation are also officers and/or directors of American Century Companies, Inc. (ACC). The corporation’s investment advisor, ACIM, the corporation's distributor, American Century Investment Services, Inc. (ACIS), and the corporation’s transfer agent, American Century Services, LLC, are wholly owned, directly or indirectly, by ACC.
Management Fees — The corporation has entered into a management agreement with ACIM, under which ACIM provides the fund with investment advisory and management services in exchange for a single, unified management fee (the fee) per class. The agreement provides that all expenses of managing and operating the fund, except distribution and service fees, brokerage expenses, taxes, interest, fees and expenses of the independent directors (including legal counsel fees), and extraordinary expenses, will be paid by ACIM. The fee is computed and accrued daily based on each class’s daily net assets and paid monthly in arrears. The fee consists of (1) an Investment Category Fee based on the daily net assets of the fund and certain other accounts managed by the investment advisor that are in the same broad investment category as the fund and (2) a Complex Fee based on the assets of all the funds in the American Century Investments family of funds. The rates for the Investment Category Fee range from 0.6880% to 0.8700%. The rates for the Complex Fee range from 0.2500% to 0.3100% for the Investor Class, A Class, C Class and R Class. The rates for the Complex Fee range from 0.0500% to 0.1100% for the Institutional Class. The effective annual management fee for each class for the year ended June 30, 2015 was 1.01% for the Investor Class, A Class, C Class and R Class and 0.81% for the Institutional Class.
Distribution and Service Fees — The Board of Directors has adopted a separate Master Distribution and Individual Shareholder Services Plan for each of the A Class, C Class and R Class (collectively the plans), pursuant to Rule 12b-1 of the 1940 Act. The plans provide that the A Class will pay ACIS an annual distribution and service fee of 0.25%. The plans provide that the C Class will pay ACIS an annual distribution and service fee of 1.00%, of which 0.25% is paid for individual shareholder services and 0.75% is paid for distribution services. The plans provide that the R Class will pay ACIS an annual distribution and service fee of 0.50%. The fees are computed and accrued daily based on each class’s daily net assets and paid monthly in arrears. The fees are used to pay financial intermediaries for distribution and individual shareholder services. Fees incurred under the plans during the year ended June 30, 2015 are detailed in the Statement of Operations.
Directors' Fees and Expenses — The Board of Directors is responsible for overseeing the investment advisor’s management and operations of the fund. The directors receive detailed information about the fund and its investment advisor regularly throughout the year, and meet at least quarterly with management of the investment advisor to review reports about fund operations. The fund’s officers do not receive compensation from the fund.
4. Investment Transactions
Purchases and sales of investment securities, excluding short-term investments, for the year ended June 30, 2015 were $1,535,513,149 and $838,517,633, respectively.
5. Capital Share Transactions
Transactions in shares of the fund were as follows:
|
| | | | | | | | | | |
| | Year ended
June 30, 2015 | Year ended June 30, 2014 |
| | Shares | Amount | Shares | Amount |
| Investor Class/Shares Authorized | 200,000,000 |
| | 50,000,000 |
| |
| Sold | 21,236,844 |
| $ | 406,035,361 |
| 6,893,130 |
| $ | 119,853,193 |
|
| Issued in reinvestment of distributions | 1,099,840 |
| 20,609,340 |
| 525,527 |
| 9,094,991 |
|
| Redeemed | (8,122,681 | ) | (156,118,768 | ) | (2,418,185 | ) | (42,063,379 | ) |
| | 14,214,003 |
| 270,525,933 |
| 5,000,472 |
| 86,884,805 |
|
| Institutional Class/Shares Authorized | 150,000,000 |
| | 10,000,000 |
| |
| Sold | 20,277,130 |
| 392,872,857 |
| 1,308,290 |
| 22,677,090 |
|
| Issued in reinvestment of distributions | 283,822 |
| 5,357,757 |
| 54,256 |
| 944,560 |
|
| Redeemed | (2,576,823 | ) | (50,045,269 | ) | (615,721 | ) | (10,652,473 | ) |
| | 17,984,129 |
| 348,185,345 |
| 746,825 |
| 12,969,177 |
|
| A Class/Shares Authorized | 70,000,000 |
| | 35,000,000 |
| |
| Sold | 6,484,498 |
| 124,219,376 |
| 3,522,429 |
| 61,683,117 |
|
| Issued in reinvestment of distributions | 275,678 |
| 5,138,431 |
| 195,823 |
| 3,368,533 |
|
| Redeemed | (2,769,790 | ) | (52,912,280 | ) | (1,972,503 | ) | (34,230,449 | ) |
| | 3,990,386 |
| 76,445,527 |
| 1,745,749 |
| 30,821,201 |
|
| C Class/Shares Authorized | 20,000,000 |
| | 10,000,000 |
| |
| Sold | 1,569,146 |
| 29,150,005 |
| 773,894 |
| 13,114,904 |
|
| Issued in reinvestment of distributions | 74,840 |
| 1,343,387 |
| 42,877 |
| 713,903 |
|
| Redeemed | (262,184 | ) | (4,852,263 | ) | (95,810 | ) | (1,637,289 | ) |
| | 1,381,802 |
| 25,641,129 |
| 720,961 |
| 12,191,518 |
|
| R Class/Shares Authorized | 20,000,000 |
| | 10,000,000 |
| |
| Sold | 568,739 |
| 10,787,048 |
| 170,076 |
| 2,913,012 |
|
| Issued in reinvestment of distributions | 16,996 |
| 313,315 |
| 21,306 |
| 361,927 |
|
| Redeemed | (176,423 | ) | (3,362,194 | ) | (184,695 | ) | (3,208,036 | ) |
| | 409,312 |
| 7,738,169 |
| 6,687 |
| 66,903 |
|
| Net increase (decrease) | 37,979,632 |
| $ | 728,536,103 |
| 8,220,694 |
| $ | 142,933,604 |
|
6. Fair Value Measurements
The fund’s investments valuation process is based on several considerations and may use multiple inputs to determine the fair value of the investments held by the fund. In conformity with accounting principles generally accepted in the United States of America, the inputs used to determine a valuation are classified into three broad levels.
| |
| • | Level 1 valuation inputs consist of unadjusted quoted prices in an active market for identical investments. |
| |
| • | Level 2 valuation inputs consist of direct or indirect observable market data (including quoted prices for comparable investments, evaluations of subsequent market events, interest rates, prepayment speeds, credit risk, etc.). These inputs also consist of quoted prices for identical investments initially expressed in local currencies that are adjusted through translation into U.S. dollars. |
| |
| • | Level 3 valuation inputs consist of unobservable data (including a fund’s own assumptions). |
The level classification is based on the lowest level input that is significant to the fair valuation measurement. The valuation inputs are not necessarily an indication of the risks associated with investing in these securities or other financial instruments. There were no significant transfers between levels during the period.
The following is a summary of the level classifications as of period end. The Schedule of Investments provides additional information on the fund’s portfolio holdings.
|
| | | | | | | | |
| | Level 1 | Level 2 | Level 3 |
| Assets | | | |
| Investment Securities | | | |
| Common Stocks | $ | 1,103,374,989 |
| — |
| — |
|
| Temporary Cash Investments | 4,590,273 |
| $ | 23,081,839 |
| — |
|
| | $ | 1,107,965,262 |
| $ | 23,081,839 |
| — |
|
7. Risk Factors
The fund’s investment process may result in high portfolio turnover, which could mean high transaction costs, affecting both performance and capital gains tax liabilities to investors.
8. Federal Tax Information
The tax character of distributions paid during the years ended June 30, 2015 and June 30, 2014 were as follows:
|
| | | | | | |
| | 2015 | 2014 |
| Distributions Paid From | | |
| Ordinary income | $ | 17,573,781 |
| $ | 9,121,736 |
|
| Long-term capital gains | $ | 18,572,099 |
| $ | 5,751,460 |
|
The book-basis character of distributions made during the year from net investment income or net realized gains may differ from their ultimate characterization for federal income tax purposes. These differences reflect the differing character of certain income items and net realized gains and losses for financial statement and tax purposes, and may result in reclassification among certain capital accounts on the financial statements.
As of June 30, 2015, the federal tax cost of investments and the components of distributable earnings on a tax-basis were as follows: |
| | | |
| Federal tax cost of investments | $ | 1,067,678,765 |
|
| Gross tax appreciation of investments | $ | 90,677,370 |
|
| Gross tax depreciation of investments | (27,309,034 | ) |
| Net tax appreciation (depreciation) of investments | $ | 63,368,336 |
|
| Undistributed ordinary income | $ | 8,934,052 |
|
| Accumulated long-term gains | $ | 5,447,555 |
|
The difference between book-basis and tax-basis unrealized appreciation (depreciation) is attributable primarily to the tax deferral of losses on wash sales.
|
| | | | | | | | | | | | | | | |
| For a Share Outstanding Throughout the Years Ended June 30 (except as noted) | | |
| Per-Share Data | | | | | Ratios and Supplemental Data |
| | | Income From Investment Operations: | Distributions From: | | | Ratio to Average Net Assets of: | |
| | Net Asset
Value,
Beginning
of Period | Net
Investment
Income
(Loss)(1) | Net
Realized
and
Unrealized
Gain (Loss) | Total From
Investment
Operations | Net
Investment
Income | Net
Realized
Gains | Total
Distributions | Net Asset
Value,
End
of Period | Total
Return(2) | Operating
Expenses | Net
Investment
Income
(Loss) | Portfolio
Turnover
Rate | Net
Assets,
End of
Period
(in thousands) |
| Investor Class | | | | | | | | | | | |
| 2015 | $18.82 | 0.14 | 1.09 | 1.23 | (0.11) | (0.79) | (0.90) | $19.15 | 6.59% | 1.02% | 0.75% | 108% |
| $502,389 |
|
| 2014 | $15.56 | 0.12 | 4.15 | 4.27 | (0.11) | (0.90) | (1.01) | $18.82 | 28.05% | 1.02% | 0.70% | 102% |
| $226,370 |
|
| 2013 | $13.38 | 0.16 | 2.19 | 2.35 | (0.17) | — | (0.17) | $15.56 | 17.70% | 1.03% | 1.07% | 94% |
| $109,366 |
|
| 2012 | $12.85 | 0.09 | 0.50 | 0.59 | (0.06) | — | (0.06) | $13.38 | 4.68% | 1.04% | 0.73% | 94% |
| $57,780 |
|
| 2011 | $9.27 | 0.04 | 3.57 | 3.61 | (0.03) | — | (0.03) | $12.85 | 39.00% | 1.04% | 0.37% | 117% |
| $31,450 |
|
| Institutional Class | | | | | | | | | | | |
| 2015 | $18.87 | 0.20 | 1.06 | 1.26 | (0.14) | (0.79) | (0.93) | $19.20 | 6.84% | 0.82% | 0.95% | 108% |
| $372,011 |
|
| 2014 | $15.60 | 0.16 | 4.15 | 4.31 | (0.14) | (0.90) | (1.04) | $18.87 | 28.30% | 0.82% | 0.90% | 102% |
| $26,334 |
|
| 2013 | $13.42 | 0.19 | 2.20 | 2.39 | (0.21) | — | (0.21) | $15.60 | 17.99% | 0.83% | 1.27% | 94% |
| $10,124 |
|
| 2012 | $12.89 | 0.10 | 0.52 | 0.62 | (0.09) | — | (0.09) | $13.42 | 4.87% | 0.84% | 0.93% | 94% |
| $878 |
|
| 2011 | $9.30 | 0.06 | 3.59 | 3.65 | (0.06) | — | (0.06) | $12.89 | 39.26% | 0.84% | 0.57% | 117% |
| $3,097 |
|
| A Class | | | | | | | | | | |
| 2015 | $18.77 | 0.09 | 1.08 | 1.17 | (0.06) | (0.79) | (0.85) | $19.09 | 6.35% | 1.27% | 0.50% | 108% |
| $173,300 |
|
| 2014 | $15.52 | 0.08 | 4.13 | 4.21 | (0.06) | (0.90) | (0.96) | $18.77 | 27.75% | 1.27% | 0.45% | 102% |
| $95,509 |
|
| 2013 | $13.33 | 0.12 | 2.19 | 2.31 | (0.12) | — | (0.12) | $15.52 | 17.42% | 1.28% | 0.82% | 94% |
| $51,897 |
|
| 2012 | $12.80 | 0.07 | 0.49 | 0.56 | (0.03) | — | (0.03) | $13.33 | 4.44% | 1.29% | 0.48% | 94% |
| $15,726 |
|
| 2011 | $9.23 | 0.02 | 3.55 | 3.57 | —(3) | — | —(3) | $12.80 | 38.71% | 1.29% | 0.12% | 117% |
| $3,026 |
|
|
| | | | | | | | | | | | | | | |
| For a Share Outstanding Throughout the Years Ended June 30 (except as noted) | | |
| Per-Share Data | | | | | Ratios and Supplemental Data |
| | | Income From Investment Operations: | Distributions From: | | | Ratio to Average Net Assets of: | |
| | Net Asset
Value,
Beginning
of Period | Net
Investment
Income
(Loss)(1) | Net
Realized
and
Unrealized
Gain (Loss) | Total From
Investment
Operations | Net
Investment
Income | Net
Realized
Gains | Total
Distributions | Net Asset
Value,
End
of Period | Total
Return(2) | Operating
Expenses | Net
Investment
Income
(Loss) | Portfolio
Turnover
Rate | Net
Assets,
End of
Period
(in thousands) |
| C Class | | | | | | | | | | | |
| 2015 | $18.21 | (0.05) | 1.04 | 0.99 | — | (0.79) | (0.79) | $18.41 | 5.56% | 2.02% | (0.25)% | 108% |
| $50,355 |
|
| 2014 | $15.14 | (0.05) | 4.02 | 3.97 | — | (0.90) | (0.90) | $18.21 | 26.80% | 2.02% | (0.30)% | 102% |
| $24,646 |
|
| 2013 | $12.99 | 0.01 | 2.14 | 2.15 | — | — | — | $15.14 | 16.55% | 2.03% | 0.07% | 94% |
| $9,580 |
|
| 2012 | $12.53 | (0.03) | 0.49 | 0.46 | — | — | — | $12.99 | 3.67% | 2.04% | (0.27)% | 94% |
| $3,389 |
|
| 2011 | $9.11 | (0.07) | 3.49 | 3.42 | — | — | — | $12.53 | 37.54% | 2.04% | (0.63)% | 117% |
| $167 |
|
| R Class | | | | | | | | | | |
| 2015 | $18.60 | 0.04 | 1.06 | 1.10 | (0.02) | (0.79) | (0.81) | $18.89 | 6.06% | 1.52% | 0.25% | 108% |
| $14,449 |
|
| 2014 | $15.39 | 0.03 | 4.10 | 4.13 | (0.02) | (0.90) | (0.92) | $18.60 | 27.41% | 1.52% | 0.20% | 102% |
| $6,611 |
|
| 2013 | $13.20 | 0.09 | 2.17 | 2.26 | (0.07) | — | (0.07) | $15.39 | 17.16% | 1.53% | 0.57% | 94% |
| $5,368 |
|
| 2012 | $12.68 | 0.02 | 0.50 | 0.52 | —(3) | — | —(3) | $13.20 | 4.13% | 1.54% | 0.23% | 94% |
| $897 |
|
| 2011 | $9.17 | (0.01) | 3.52 | 3.51 | — | — | — | $12.68 | 38.28% | 1.54% | (0.13)% | 117% |
| $493 |
|
|
|
| Notes to Financial Highlights |
| |
| (1) | Computed using average shares outstanding throughout the period. |
| |
| (2) | Total returns are calculated based on the net asset value of the last business day and do not reflect applicable sales charges, if any. Total returns for periods less than one year are not annualized. |
| |
| (3) | Per-share amount was less than $0.005. |
See Notes to Financial Statements.
|
|
| Report of Independent Registered Public Accounting Firm |
To the Directors of the American Century Quantitative Equity Funds, Inc. and Shareholders of the Disciplined Growth Fund:
In our opinion, the accompanying statement of assets and liabilities, including the schedule of investments, and the related statements of operations and of changes in net assets and the financial highlights present fairly, in all material respects, the financial position of the Disciplined Growth Fund (one of the sixteen funds comprising the American Century Quantitative Equity Funds, Inc., hereafter referred to as the “Fund”) at June 30, 2015, the results of its operations for the year then ended, the changes in its net assets for each of the two years in the period then ended and the financial highlights for each of the five years in the period then ended, in conformity with accounting principles generally accepted in the United States of America. These financial statements and financial highlights (hereafter referred to as "financial statements") are the responsibility of the Fund's management. Our responsibility is to express an opinion on these financial statements based on our audits. We conducted our audits of these financial statements in accordance with the standards of the Public Company Accounting Oversight Board (United States). Those standards require that we plan and perform the audit to obtain reasonable assurance about whether the financial statements are free of material misstatement. An audit includes examining, on a test basis, evidence supporting the amounts and disclosures in the financial statements, assessing the accounting principles used and significant estimates made by management, and evaluating the overall financial statement presentation. We believe that our audits, which included confirmation of securities at June 30, 2015 by correspondence with the custodian and brokers, provide a reasonable basis for our opinion.
PricewaterhouseCoopers LLP
Kansas City, Missouri
August 21, 2015
Board of Directors
The individuals listed below serve as directors of the funds. Each director will continue to serve in this capacity until death, retirement, resignation or removal from office. The board has adopted a mandatory retirement age for directors who are not “interested persons,” as that term is defined in the Investment Company Act (independent directors). Independent directors shall retire on December 31 of the year in which they reach their 75th birthday; provided, however, that on or after January 1, 2022, independent directors shall retire on December 31 of the year in which they reach their 76th birthday.
Mr. Thomas is an “interested person” because he currently serves as President and Chief Executive Officer of American Century Companies, Inc. (ACC), the parent company of American Century Investment Management, Inc. (ACIM or the advisor). The other directors (more than three-fourths of the total number) are independent. They are not employees, directors or officers of, and have no financial interest in, ACC or any of its wholly owned, direct or indirect, subsidiaries, including ACIM, American Century Investment Services, Inc. (ACIS) and American Century Services, LLC (ACS), and they do not have any other affiliations, positions or relationships that would cause them to be considered “interested persons” under the Investment Company Act. The directors serve in this capacity for eight (in the case of Mr. Thomas, 15) registered investment companies in the American Century Investments family of funds.
The following table presents additional information about the directors. The mailing address for each director other than Mr. Thomas is 1665 Charleston Road, Mountain View, California 94043. The mailing address for Mr. Thomas is 4500 Main Street, Kansas City, Missouri 64111.
|
| | | | | |
Name (Year of Birth) | Position(s) Held with Funds | Length of Time Served | Principal Occupation(s) During Past 5 Years | Number of American Century Portfolios Overseen by Director | Other Directorships Held During Past 5 Years |
Independent Directors | | |
Tanya S. Beder
(1955) | Director | Since 2011 | Chairman and CEO, SBCC Group Inc. (independent advisory services) (2006 to present) | 46 | CYS Investments, Inc. (NYSE mortgage arbitrage REIT) |
Jeremy I. Bulow
(1954) | Director | Since 2011 | Professor of Economics, Stanford University, Graduate School of Business (1979 to present) | 46 | None |
Ronald J. Gilson
(1946) | Director and Chairman of the Board | Since 1995
(Chairman since 2005) | Charles J. Meyers Professor of Law and Business, Stanford Law School (1979 to present); Marc and Eva Stern Professor of Law and Business, Columbia University School of Law (1992 to present) | 46 | None |
Frederick L. A. Grauer
(1946) | Director | Since 2008 | Senior Advisor, BlackRock, Inc. (investment management firm) (2010 to 2011, 2013 to present) | 46 | None |
Peter F. Pervere
(1947) | Director | Since 2007 | Retired | 46 | None |
|
| | | | | |
Name (Year of Birth) | Position(s) Held with Funds | Length of Time Served | Principal Occupation(s) During Past 5 Years | Number of American Century Portfolios Overseen by Director | Other Directorships Held During Past 5 Years |
| Independent Directors | | |
John B. Shoven
(1947) | Director | Since 2002 | Professor of Economics, Stanford University (1973 to present) | 46 | Cadence Design Systems; Exponent; Financial Engines |
| Interested Director | | |
Jonathan S. Thomas
(1963) | Director and President | Since 2007 | President and Chief Executive Officer, ACC (March 2007 to present). Also serves as Chief Executive Officer, ACS; Executive Vice President, ACIM; Director, ACC, ACIM and other ACC subsidiaries | 124 | BioMed Valley Discoveries, Inc. |
The Statement of Additional Information has additional information about the fund's directors and is available without charge, upon request, by calling 1-800-345-2021.
Officers
The following table presents certain information about the executive officers of the funds. Each officer serves as an officer for each of the 15 investment companies in the American Century family of funds, unless otherwise noted. No officer is compensated for his or her service as an officer of the funds. The listed officers are interested persons of the funds and are appointed or re-appointed on an annual basis. The mailing address for each of the officers listed below is 4500 Main Street, Kansas City, Missouri 64111.
|
| | |
Name (Year of Birth) | Offices with the Funds | Principal Occupation(s) During the Past Five Years |
Jonathan S.
Thomas
(1963) | Director and President
since 2007 | President and Chief Executive Officer, ACC (March 2007 to present). Also serves as Chief Executive Officer, ACS; Executive Vice President, ACIM; Director, ACC, ACIM and other ACC subsidiaries |
Amy D. Shelton
(1964) | Chief Compliance Officer and Vice President since 2014 | Chief Compliance Officer, American Century funds, (March 2014 to present); Chief Compliance Officer, ACIM (February 2014 to present); Chief Compliance Officer, ACIS (October 2009 to present); Vice President, Client Interactions and Marketing, ACIS (February 2013 to January 2014); Director, Client Interactions and Marketing, ACIS (June 2007 to January 2013). Also serves as Vice President, ACIS |
Charles A. Etherington
(1957) | General Counsel since 2007 and Senior Vice President since 2006 | Attorney, ACC (February 1994 to present); Vice President, ACC (November 2005 to present); General Counsel, ACC (March 2007 to present). Also serves as General Counsel, ACIM, ACS, ACIS and other ACC subsidiaries; and Senior Vice President, ACIM and ACS |
C. Jean Wade
(1964) | Vice President, Treasurer and Chief Financial Officer since 2012 | Vice President, ACS (February 2000 to present) |
Robert J. Leach
(1966) | Vice President since 2006 and Assistant Treasurer since 2012 | Vice President, ACS (February 2000 to present) |
David H. Reinmiller
(1963) | Vice President since 2001 | Attorney, ACC (January 1994 to present); Associate General Counsel, ACC (January 2001 to present). Also serves as Vice President, ACIM and ACS |
Ward D. Stauffer
(1960) | Secretary since 2005 | Attorney, ACC (June 2003 to present) |
|
|
| Approval of Management Agreement |
At a meeting held on June 16, 2015, the Fund’s Board of Directors unanimously approved the renewal of the management agreement pursuant to which American Century Investment Management, Inc. (the “Advisor”) acts as the investment advisor for the Fund. Under Section 15(c) of the Investment Company Act, contracts for investment advisory services are required to be reviewed, evaluated, and approved by a majority of a fund’s directors/trustees, including a majority of the independent Directors, each year. The Board regards this annual evaluation and renewal as one of its most important responsibilities.
The independent Directors have memorialized a statement regarding the relationship between their ongoing obligations to oversee and evaluate the performance of the Advisor and their annual consideration of renewal of the management agreement. In that statement, the independent Directors noted that their assessment of the Advisor’s performance is an ongoing process that takes place over the entire year and is informed by all of the extensive information that the Board and its committees receive and consider over time. This information, together with the materials provided in connection with the review, are central to the Board’s assessment of the Advisor’s performance and its determination whether to renew the Fund’s management agreement.
Prior to its consideration of the renewal of the management agreement, the Board requested and reviewed extensive data and analysis relating to the proposed renewal. This information and analysis was compiled by the Advisor and certain independent providers of evaluation data concerning the Fund and the services provided to the Fund by the Advisor.
In connection with its consideration of the renewal of the management agreement, the Board’s review and evaluation of the services provided by the Advisor included, but was not limited to, the following:
| |
| • | the nature, extent, and quality of investment management, shareholder services, and other services provided by the Advisor to the Fund; |
| |
| • | the wide range of other programs and services the Advisor provides to the Fund and its shareholders on a routine and non-routine basis; |
| |
| • | the investment performance of the Fund, including data comparing the Fund’s performance to appropriate benchmarks and/or a peer group of other mutual funds with similar investment objectives and strategies; |
| |
| • | the cost of owning the Fund compared to the cost of owning similar funds; |
| |
| • | the Advisor’s compliance policies, procedures, and regulatory experience; |
| |
| • | financial data showing the cost of services provided to the Fund, the profitability of the Fund to the Advisor, and the overall profitability of the Advisor; |
| |
| • | possible economies of scale associated with the Advisor’s management of the Fund and other accounts under its management; |
| |
| • | data comparing services provided and charges to other investment management clients of the Advisor; |
| |
| • | acquired fund fees and expenses; |
| |
| • | payments by the Fund and the Advisor to financial intermediaries whose clients are investors in the Fund; and |
| |
| • | any collateral benefits derived by the Advisor from the management of the Fund. |
In keeping with its practice, the Board held two in-person meetings to review and discuss the information provided in response to their request. The independent Directors also had the benefit of the advice of their independent counsel throughout the process.
Factors Considered
The Directors considered all of the information provided by the Advisor, the independent data providers, and the independent Directors’ independent counsel in connection with the review, and evaluated such information for the Fund. In connection with their review, the Directors did not identify any single factor as being all-important or controlling and each Director may have attributed different levels of importance to different factors. In deciding to renew the management agreement, the Board based its decision on a number of factors, including the following:
Nature, Extent and Quality of Services - Generally. Under the management agreement, the Advisor is responsible for providing or arranging for all services necessary for the operation of the Fund. The Board noted that under the management agreement, the Advisor provides or arranges at its own expense a wide variety of services including:
| |
| • | constructing and designing the Fund |
| |
| • | portfolio research and security selection |
| |
| • | initial capitalization/funding |
| |
| • | daily valuation of the Fund’s portfolio |
| |
| • | shareholder servicing and transfer agency, including shareholder confirmations, recordkeeping, and communications |
| |
| • | legal services (except the independent Directors’ counsel) |
| |
| • | regulatory and portfolio compliance |
| |
| • | marketing and distribution (except amounts paid by the Fund under Rule 12b-1 plans) |
The Board noted that many of these services have expanded over time both in terms of quantity and complexity in response to shareholder demands, competition in the industry, changing distribution channels, and the changing regulatory environment.
Investment Management, Shareholder, and Other Services. The nature of the investment management services provided to the Fund is quite complex and allows Fund shareholders access to professional money management, instant diversification of their investments within an asset class, the opportunity to easily diversify among asset classes by investing in or exchanging among various American Century Investments funds, and liquidity. In evaluating investment performance, the Board expects the Advisor to manage the Fund in accordance with its investment objectives and approved strategies. Further, the Directors recognize that the Advisor has an obligation to seek the best execution of fund trades. In providing these services, the Advisor utilizes teams of investment professionals (portfolio managers, analysts, research assistants, and securities traders) who require extensive information technology, research, training, compliance, and other systems to conduct their business. The Board, directly and through its Portfolio Committee, regularly reviews investment performance information for the Fund, together with comparative information for appropriate benchmarks and/or peer groups of similarly-managed funds, over different time horizons. The Directors also review detailed performance information during the management agreement approval process. If performance concerns are identified, the Fund receives special reviews until performance improves, during which the Board discusses with the Advisor the reasons for such results (e.g., market conditions, security selection) and any efforts being undertaken to improve performance. The Fund’s performance was above its benchmark for the one-, three-, and five-year periods reviewed by the Board. The Board found the investment management services provided by the Advisor to the Fund to be satisfactory and consistent with the management agreement.
Under the management agreement, the Advisor provides the Fund with a comprehensive package of transfer agency, shareholder, and other services. The Board, directly and through various committees of the Board, regularly reviews reports and evaluations of such services at its regular
meetings. These reports include, but are not limited to, information regarding the operational efficiency and accuracy of the shareholder and transfer agency services provided, staffing levels, shareholder satisfaction (as measured by external as well as internal sources), technology support, new products and services offered to Fund shareholders, securities trading activities, portfolio valuation services, auditing services, and legal and operational compliance activities.
Certain aspects of shareholder and transfer agency service level efficiency and the quality of securities trading activities are measured by independent third party providers and are presented in comparison to other fund groups not managed by the Advisor. The Board found the services provided by the Advisor to the Fund under the management agreement to be competitive and of high quality.
Costs of Services and Profitability. The Advisor provides detailed information concerning its cost of providing various services to the Fund, its profitability in managing the Fund, its overall profitability, and its financial condition. The Directors have reviewed with the Advisor the methodology used to prepare this financial information. This information is considered in evaluating the Advisor’s financial condition, its ability to continue to provide services under the management agreement, and the reasonableness of the current management fee. The Board concluded that the Advisor’s profits were reasonable in light of the services provided to the Fund.
Ethics. The Board generally considers the Advisor’s commitment to providing quality services to shareholders and to conducting its business ethically. They noted that the Advisor’s practices generally meet or exceed industry best practices.
Economies of Scale. The Board also reviewed information provided by the Advisor regarding the possible existence of economies of scale in connection with the management of the Fund. The Board concluded that economies of scale are difficult to measure and predict with precision, especially on a fund-by-fund basis. The Board concluded that the Advisor is appropriately sharing economies of scale through its competitive fee structure, offering competitive fees from fund inception, and through reinvestment in its business to provide shareholders enhanced and expanded services.
Comparison to Other Funds’ Fees. The management agreement provides that the Fund pays the Advisor a single, all-inclusive (or unified) management fee for providing all services necessary for the management and operation of the Fund, other than brokerage expenses, taxes, interest, extraordinary expenses, the fees and expenses of the Fund’s independent Directors (including their independent legal counsel), and expenses incurred in connection with the provision of shareholder services and distribution services under a plan adopted pursuant to Rule 12b-1 under the 1940 Act. Under the unified fee structure, the Advisor is responsible for providing all investment advisory, custody, audit, administrative, compliance, recordkeeping, marketing, and shareholder services, or arranging and supervising third parties to provide such services. By contrast, most other funds are charged a variety of fees, including an investment advisory fee, a transfer agency fee, an administrative fee, distribution charges, and other expenses. Other than their investment advisory fees and any applicable Rule 12b-1 fees, all other components of the total fees charged by these other funds may be increased without shareholder approval. The Board believes the unified fee structure is a benefit to Fund shareholders because it clearly discloses to shareholders the cost of owning Fund shares, and, since the unified fee cannot be increased without a vote of Fund shareholders, it shifts to the Advisor the risk of increased costs of operating the Fund and provides a direct incentive to minimize administrative inefficiencies. Part of the Board’s analysis of fee levels involves reviewing certain evaluative data compiled by an independent provider and comparing the Fund’s unified fee to the total expense ratio of peer funds. The unified fee charged to shareholders of the Fund was below the median of the total expense ratios of the Fund’s peer group. The Board concluded that the management fee paid by the Fund to the Advisor under the management agreement is reasonable in light of the services provided to the Fund.
Comparison to Fees and Services Provided to Other Clients of the Advisor. The Board also requested and received information from the Advisor concerning the nature of the services, fees, costs, and profitability of its advisory services to advisory clients other than the Fund. They observed that these varying types of client accounts require different services and involve different regulatory and entrepreneurial risks than the management of the Fund. The Board analyzed this information and concluded that the fees charged and services provided to the Fund were reasonable by comparison.
Payments to Intermediaries. The Directors also requested and received a description of payments made to intermediaries by the Fund and the Advisor. These payments include various payments made by the Fund or the Advisor to different types of intermediaries and recordkeepers for distribution and service activities provided for the Fund.
Collateral or “Fall-Out” Benefits Derived by the Advisor. The Board considered the existence of collateral benefits the Advisor may receive as a result of its relationship with the Fund. The Board noted that the Advisor’s primary business is managing mutual funds and it generally does not use fund or shareholder information to generate profits in other lines of business, and therefore does not derive any significant collateral benefits from them. The Board noted that the Advisor receives proprietary research from broker-dealers that execute fund portfolio transactions. The Board also determined that the Advisor is able to provide investment management services to certain clients other than the Fund, at least in part, due to its existing infrastructure built to serve the fund complex.
Existing Relationship. The Board also considered whether there was any reason for not continuing the existing arrangement with the Advisor. In this regard, the Board was mindful of the potential disruptions of the Fund’s operations and various risks, uncertainties, and other effects that could occur as a result of a decision not to continue such relationship. In particular, the Board recognized that most shareholders have invested in the Fund on the strength of the Advisor’s industry standing and reputation and in the expectation that the Advisor will have a continuing role in providing advisory services to the Fund.
Conclusion of the Directors. As a result of this process, the Board, including all of the independent Directors and assisted by the advice of independent legal counsel, taking into account all of the factors discussed above and the information provided by the Advisor and others in connection with its review and throughout the year, concluded that the management agreement between the Fund and the Advisor is fair and reasonable in light of the services provided and should be renewed.
Retirement Account Information
As required by law, distributions you receive from certain IRAs are subject to federal income tax withholding, unless you elect not to have withholding apply. Tax will be withheld on the total amount withdrawn even though you may be receiving amounts that are not subject to withholding, such as nondeductible contributions. In such case, excess amounts of withholding could occur. You may adjust your withholding election so that a greater or lesser amount will be withheld.
If you don’t want us to withhold on this amount, you must notify us to not withhold the federal income tax. You may notify us in writing or in certain situations by telephone or through other electronic means. For systematic withdrawals, your withholding election will remain in effect until revoked or changed by filing a new election. You have the right to revoke your election at any time.
Remember, even if you elect not to have income tax withheld, you are liable for paying income tax on the taxable portion of your withdrawal. If you elect not to have income tax withheld or you don’t have enough income tax withheld, you may be responsible for payment of estimated tax. You may incur penalties under the estimated tax rules if your withholding and estimated tax payments are not sufficient. You can reduce or defer the income tax on a distribution by directly or indirectly rolling such distribution over to another IRA or eligible plan. You should consult your tax advisor for additional information.
State tax will be withheld if, at the time of your distribution, your address is within one of the mandatory withholding states and you have federal income tax withheld (or as otherwise required by state law). State taxes will be withheld from your distribution in accordance with the respective state rules.
Distributions you receive from 403(b), 457 and qualified plans are subject to special tax and withholding rules. Your plan administrator or plan sponsor is required to provide you with a special tax notice explaining those rules at the time you request a distribution. If applicable, federal and/or state taxes may be withheld from your distribution amount.
Proxy Voting Policies
Descriptions of the principles and policies that the fund's investment advisor uses in exercising the voting rights associated with the securities purchased and/or held by the fund are available without charge, upon request, by calling 1-800-345-2021 or visiting the "About Us" page of American Century Investments’ website at americancentury.com. A description of the policies is also available on the Securities and Exchange Commission’s website at sec.gov. Information regarding how the investment advisor voted proxies relating to portfolio securities during the most recent 12-month period ended June 30 is available on the "About Us" page at americancentury.com. It is also available at sec.gov.
Quarterly Portfolio Disclosure
The fund files its complete schedule of portfolio holdings with the Securities and Exchange Commission (SEC) for the first and third quarters of each fiscal year on Form N-Q. The fund’s Forms N-Q are available on the SEC’s website at sec.gov, and may be reviewed and copied at the SEC’s Public Reference Room in Washington, DC. Information on the operation of the Public Reference Room may be obtained by calling 1-800-SEC-0330. The fund also makes its complete schedule of portfolio holdings for the most recent quarter of its fiscal year available on its website at americancentury.com and, upon request, by calling 1-800-345-2021.
Other Tax Information
The following information is provided pursuant to provisions of the Internal Revenue Code.
The fund hereby designates up to the maximum amount allowable as qualified dividend income for the fiscal year ended June 30, 2015.
For corporate taxpayers, the fund hereby designates $9,275,932, or up to the maximum amount allowable, of ordinary income distributions paid during the fiscal year ended June 30, 2015 as qualified for the corporate dividends received deduction.
The fund hereby designates $12,378,744 as qualified short-term capital gain distributions for purposes of Internal Revenue Code Section 871 for the fiscal year ended June 30, 2015.
The fund hereby designates $18,572,099, or up to the maximum amount allowable, as long-term capital gain distributions for the fiscal year ended June 30, 2015.
|
| | |
| |
| | | |
| Contact Us | americancentury.com | |
| Automated Information Line | 1-800-345-8765 | |
| Investor Services Representative | 1-800-345-2021
or 816-531-5575 | |
| Investors Using Advisors | 1-800-378-9878 | |
Business, Not-For-Profit, Employer-Sponsored
Retirement Plans | 1-800-345-3533 | |
Banks and Trust Companies, Broker-Dealers,
Financial Professionals, Insurance Companies | 1-800-345-6488 | |
| Telecommunications Relay Service for the Deaf | 711 | |
| | | |
| American Century Quantitative Equity Funds, Inc. | |
| | | |
Investment Advisor: American Century Investment Management, Inc. Kansas City, Missouri | |
| | | |
| This report and the statements it contains are submitted for the general information of our shareholders. The report is not authorized for distribution to prospective investors unless preceded or accompanied by an effective prospectus. | |
| | | |
©2015 American Century Proprietary Holdings, Inc. All rights reserved.
CL-ANN-86503 1508 | |
|
| |
| ANNUAL REPORT | JUNE 30, 2015 |
Disciplined Growth Plus Fund
|
| | |
| President's Letter | 2 |
|
| Performance | 3 |
|
| Portfolio Commentary | |
|
| Fund Characteristics | |
|
| Shareholder Fee Example | |
|
| Schedule of Investments | |
|
| Statement of Assets and Liabilities | |
|
| Statement of Operations | |
|
| Statement of Changes in Net Assets | |
|
| Statement of Cash Flows | |
|
| Notes to Financial Statements | |
|
| Financial Highlights | |
|
| Report of Independent Registered Public Accounting Firm | |
|
| Management | |
|
| Approval of Management Agreement | |
|
| Additional Information | |
|
Any opinions expressed in this report reflect those of the author as of the date of the report, and do not necessarily represent the opinions of American Century Investments® or any other person in the American Century Investments organization. Any such opinions are subject to change at any time based upon market or other conditions and American Century Investments disclaims any responsibility to update such opinions. These opinions may not be relied upon as investment advice and, because investment decisions made by American Century Investments funds are based on numerous factors, may not be relied upon as an indication of trading intent on behalf of any American Century Investments fund. Security examples are used for representational purposes only and are not intended as recommendations to purchase or sell securities. Performance information for comparative indices and securities is provided to American Century Investments by third party vendors. To the best of American Century Investments’ knowledge, such information is accurate at the time of printing.
|
| |
| Dear Investor:
Thank you for reviewing this annual report for the 12 months ended June 30, 2015. It provides investment performance and portfolio information for the reporting period, plus longer-term historical performance data.
Annual reports remain important vehicles for conveying information about fund returns, including market and economic factors that affected performance during the reporting period. For additional, updated investment and market insights, we encourage you to visit our website, americancentury.com. |
| Jonathan Thomas |
Global Divergence Favored U.S. Assets
“Global divergence” between the U.S. and the rest of the world emerged as a prevalent theme during the reporting period. This theme embraced not only the relatively stronger economic growth enjoyed by the U.S. compared with most of the world, but also the related contrast between the U.S. Federal Reserve’s unwinding of monetary stimulus compared with the continuation and expansion of stimulus by other major central banks. Low inflation also prevailed, after crude oil prices plunged over 40% amid muted demand for commodities in general. In this environment, the U.S. dollar, U.S. growth stocks, and longer-maturity U.S. Treasuries generally benefited from “flight to quality” capital flows, reinforced by geopolitical and financial turmoil, particularly in Greece, Russia/Ukraine, China, and the Middle East.
Strong global capital flows into U.S. assets generated a global divergence between investment returns for U.S. and non-U.S. markets, especially for U.S. investors who realized their returns in dollar terms. For the reporting period, the U.S. Dollar Index, the S&P 500 Index, and the Barclays U.S. Aggregate Bond Index returned 19.74%, 7.42%, and 1.86%, respectively. By contrast, the MSCI EAFE Index, the MSCI Emerging Markets Index, and the Barclays Global Aggregate Bond ex-USD (Unhedged) Index returned -4.22%, -5.12%, and -13.19%, respectively, for U.S. investors unhedged for the strong dollar’s impact on non-dollar-denominated returns.
We expect more monetary policy divergence between the U.S. and other major developed economies in the coming months, accompanied by continued market volatility. This could present both challenges and opportunities for active investment managers. Upward pressures on inflation and interest rates could develop as the massive amount of global monetary stimulus in progress takes hold and economies improve. In this environment, we continue to believe in a disciplined, diversified, long-term investment approach, using professionally managed stock and bond portfolios to meet financial goals. We appreciate your continued trust in us.
Sincerely,
Jonathan Thomas
President and Chief Executive Officer
American Century Investments
|
| | | | |
| Total Returns as of June 30, 2015 |
| | Average Annual Returns | |
| | Ticker Symbol | 1 year | Since Inception | Inception Date |
| Investor Class | ACDJX | 10.22% | 17.91% | 10/31/11 |
| Russell 1000 Growth Index | — | 10.56% | 17.43% | — |
| Institutional Class | ACDKX | 10.49% | 18.15% | 10/31/11 |
| A Class | ACDQX | | | 10/31/11 |
| No sales charge* | | 9.97% | 17.62% | |
| With sales charge* | | 3.67% | 15.74% | |
| C Class | ACDHX | 9.16% | 16.74% | 10/31/11 |
| R Class | ACDWX | 9.69% | 17.32% | 10/31/11 |
| |
| * | Sales charges include initial sales charges and contingent deferred sales charges (CDSCs), as applicable. A Class shares have a 5.75% maximum initial sales charge and may be subject to a maximum CDSC of 1.00%. C Class shares redeemed within 12 months of purchase are subject to a maximum CDSC of 1.00%. The SEC requires that mutual funds provide performance information net of maximum sales charges in all cases where charges could be applied. |
Data presented reflect past performance. Past performance is no guarantee of future results. Current performance may be higher or lower than the performance shown. Investment return and principal value will fluctuate, and redemption value may be more or less than original cost. Data assumes reinvestment of dividends and capital gains, and none of the charts reflect the deduction of taxes that a shareholder would pay on fund distributions or the redemption of fund shares. To obtain performance data current to the most recent month end, please call 1-800-345-2021 or visit americancentury.com. For additional information about the fund, please consult the prospectus.
|
|
| Growth of $10,000 Over Life of Class |
| $10,000 investment made October 31, 2011 |
| Performance for other share classes will vary due to differences in fee structure. |
|
| |
| Value on June 30, 2015 |
| | Investor Class — $18,292 |
| |
| | Russell 1000 Growth Index — $18,022 |
| |
*From October 31, 2011, the Investor Class’s inception date. Not annualized.
|
| | | | |
| Total Annual Fund Operating Expenses |
| Investor Class | Institutional Class | A Class | C Class | R Class |
| 1.81% | 1.61% | 2.06% | 2.81% | 2.31% |
The total annual fund operating expenses shown is as stated in the fund’s prospectus current as of the date of this report. The prospectus may vary from the expense ratio shown elsewhere in this report because it is based on a different time period, includes acquired fund fees and expenses, and, if applicable, does not include fee waivers or expense reimbursements.
Data presented reflect past performance. Past performance is no guarantee of future results. Current performance may be higher or lower than the performance shown. Investment return and principal value will fluctuate, and redemption value may be more or less than original cost. Data assumes reinvestment of dividends and capital gains, and none of the charts reflect the deduction of taxes that a shareholder would pay on fund distributions or the redemption of fund shares. To obtain performance data current to the most recent month end, please call 1-800-345-2021 or visit americancentury.com. For additional information about the fund, please consult the prospectus.
Portfolio Managers: Scott Wittman, Bill Martin and Lynette Pang
Performance Summary
Disciplined Growth Plus returned 10.22%* for the fiscal year ended June 30, 2015, compared with the 10.56% return of its benchmark, the Russell 1000 Growth Index and the 7.42%** return of the broad S&P 500 Index.
U.S. equity markets endured substantial volatility, but ended the 12-month period with advances. Disciplined Growth Plus produced gains during the 12-month period, performing in line with the Russell 1000 Growth Index. The fund is managed to have a 100% net exposure to the equity market by investing approximately 130% of its net assets in long positions, while 30% of its net assets are sold short. The proceeds from the securities sold short are used to fund the purchase of the additional 30% of long positions.
The fund’s stock selection process incorporates factors of valuation, quality, growth, and sentiment while striving to minimize unintended risks along industries and other risk characteristics. Within the investment universe, more expensive growth names led the markets over the past year, and our focus on reasonably priced growth names limited fund gains. Financials sector holdings and positioning in the health care sector contributed the most to fund results, while consumer staples holdings weighed on relative performance.
Financials and Health Care Outperformed
Stock selection among financials holdings, particularly in real estate management companies, was a leading contributor to the fund’s 12-month results. Prominent contribution stemmed from a short position (a trade made to benefit from a stock’s decline) in real estate developer Tejon Ranch, whose stock fell nearly 20%.
Positioning in the health care sector was also favorable to results, particularly among health care equipment and supplies manufacturers and health care technology holdings. A portfolio-only position in Merge Healthcare bolstered the fund’s returns due to strong earnings and revenues stemming from rising transaction revenue on the health care software maker’s eClinicalOS platform.
The energy sector, especially positioning in the oil, gas, and consumable fuels industry, also added to relative gains. A short position in oil and natural gas producer W&T Offshore was beneficial as the company’s stock price declined steeply as the price of oil continued to slide. Likewise, limited exposure to oil exploration firm Halliburton, which declined nearly 40%, was particularly helpful. We opted to exit both positions entirely during the year. Elsewhere in the fund, key contribution came from a short position in Rentech, a wood fiber products producer, as the company’s stock price dropped after management announced losses.
| |
| * | All fund returns referenced in this commentary are for Investor Class shares. Performance for other share classes will vary due to differences in fee structure; when Investor Class performance exceeds that of the fund's benchmark, other share classes may not. See page 3 for returns for all share classes. |
**The S&P 500 Index average return was 17.06% since the fund’s inception on October 31, 2011.
Consumer Staples Sector Led Detractors
The consumer staples sector was the leading detractor from the fund’s relative returns. Stock choices in food and staples retailers, food products manufacturers, and personal products companies were especially difficult, driving the sector’s underperformance. Among the top sector detractors was an overweight position, relative to the benchmark, in cosmetics and skincare company Avon, which declined steadily throughout the period on falling revenues as consumers increasingly turned toward online purchases, undermining its independent consultant business model. We ultimately exited the position.
Elsewhere in the fund, detraction also came from several holdings in the information technology sector. An overweight position in data storage solutions manufacturer SanDisk weighed on returns as the company lowered estimates due to an oversupply of inventory. Nevertheless, the holding's quality- and valuation-based factors remain very strong. Several portfolio-only consumer discretionary sector positions produced substantial declines and weighed on relative gains. These included Tower International, a metal component manufacturer for the auto industry, whose stock declined on lowered analysts ratings despite strong quarterly results. We ultimately exited the position. For-profit education provider Strayer Education weighed on results as lower enrollment due to stricter financial aid funding guidelines imposed on for-profit colleges pressured the company’s revenues. However, the holding remains very attractive across valuation and quality metrics and is strong on sentiment-based factors.
A Look Ahead
The U.S. economy seems poised to continue to experience hesitant economic growth through the second half of 2015. Economic activity appears to have somewhat diminished in breadth, though remains slow yet steady. We believe that divergence in monetary policy between the U.S. and much of the rest of the world is likely to continue. Therefore, questions surrounding when and how much the U.S. Federal Reserve might act to tighten money supply, and the potential impact of such a move, are likely to continue driving investor sentiment in equity markets. Our disciplined, objective, and systematic investment strategy is designed to take advantage of opportunities at the individual company level in both the long and short portions of the portfolio. We believe this approach is the most powerful way to capitalize on market inefficiencies that lead to the mispricing of individual stocks. The fund’s largest overweights are in health care, information technology, and industrials, while the underweights are led by the consumer staples, materials, and financials sectors.
|
| |
| JUNE 30, 2015 |
| Top Ten Long Holdings | % of net assets |
| Apple, Inc. | 7.52% |
| Microsoft Corp. | 2.65% |
| Google, Inc., Class A | 2.15% |
| PepsiCo, Inc. | 1.89% |
| Gilead Sciences, Inc. | 1.86% |
| AbbVie, Inc. | 1.63% |
| 3M Co. | 1.51% |
| Boeing Co. (The) | 1.51% |
| Oracle Corp. | 1.51% |
| eBay, Inc. | 1.42% |
| | |
| Top Five Short Holdings | % of net assets |
| William Lyon Homes, Class A | (0.85)% |
| Cray, Inc. | (0.77)% |
| Builders FirstSource, Inc. | (0.74)% |
| Beacon Roofing Supply, Inc. | (0.74)% |
| InnerWorkings, Inc. | (0.74)% |
| | |
| Types of Investments in Portfolio | % of net assets |
| Common Stocks | 127.4% |
| Common Stocks Sold Short | (29.0)% |
| Temporary Cash Investments | 2.0% |
| Other Assets and Liabilities | (0.4)% |
Fund shareholders may incur two types of costs: (1) transaction costs, including sales charges (loads) on purchase payments and redemption/exchange fees; and (2) ongoing costs, including management fees; distribution and service (12b-1) fees; and other fund expenses. This example is intended to help you understand your ongoing costs (in dollars) of investing in your fund and to compare these costs with the ongoing cost of investing in other mutual funds.
The example is based on an investment of $1,000 made at the beginning of the period and held for the entire period from January 1, 2015 to June 30, 2015.
Actual Expenses
The table provides information about actual account values and actual expenses for each class. You may use the information, together with the amount you invested, to estimate the expenses that you paid over the period. First, identify the share class you own. Then simply divide your account value by $1,000 (for example, an $8,600 account value divided by $1,000 = 8.6), then multiply the result by the number under the heading “Expenses Paid During Period” to estimate the expenses you paid on your account during this period.
If you hold Investor Class shares of any American Century Investments fund, or Institutional Class shares of the American Century Diversified Bond Fund, in an American Century Investments account (i.e., not a financial intermediary or retirement plan account), American Century Investments may charge you a $12.50 semiannual account maintenance fee if the value of those shares is less than $10,000. We will redeem shares automatically in one of your accounts to pay the $12.50 fee. In determining your total eligible investment amount, we will include your investments in all personal accounts (including American Century Investments Brokerage accounts) registered under your Social Security number. Personal accounts include individual accounts, joint accounts, UGMA/UTMA accounts, personal trusts, Coverdell Education Savings Accounts and IRAs (including traditional, Roth, Rollover, SEP-, SARSEP- and SIMPLE-IRAs), and certain other retirement accounts. If you have only business, business retirement, employer-sponsored or American Century Investments Brokerage accounts, you are currently not subject to this fee. If you are subject to the Account Maintenance Fee, your account value could be reduced by the fee amount.
Hypothetical Example for Comparison Purposes
The table also provides information about hypothetical account values and hypothetical expenses based on the actual expense ratio of each class of your fund and an assumed rate of return of 5% per year before expenses, which is not the actual return of a fund’s share class. The hypothetical account values and expenses may not be used to estimate the actual ending account balance or expenses you paid for the period. You may use this information to compare the ongoing costs of investing in your fund and other funds. To do so, compare this 5% hypothetical example with the 5% hypothetical examples that appear in the shareholder reports of the other funds.
Please note that the expenses shown in the table are meant to highlight your ongoing costs only and do not reflect any transactional costs, such as sales charges (loads) or redemption/exchange fees. Therefore, the table is useful in comparing ongoing costs only, and will not help you determine the relative total costs of owning different funds. In addition, if these transactional costs were included, your costs would have been higher.
|
| | | | |
| | Beginning
Account Value
1/1/15 | Ending
Account Value
6/30/15 | Expenses Paid
During Period(1)
1/1/15 - 6/30/15 | Annualized Expense Ratio(1) |
| Actual |
| Investor Class | $1,000 | $1,034.10 | $9.13 | 1.81% |
| Institutional Class | $1,000 | $1,035.40 | $8.13 | 1.61% |
| A Class | $1,000 | $1,033.00 | $10.38 | 2.06% |
| C Class | $1,000 | $1,029.30 | $14.14 | 2.81% |
| R Class | $1,000 | $1,031.30 | $11.63 | 2.31% |
| Hypothetical |
| Investor Class | $1,000 | $1,015.82 | $9.05 | 1.81% |
| Institutional Class | $1,000 | $1,016.81 | $8.05 | 1.61% |
| A Class | $1,000 | $1,014.58 | $10.29 | 2.06% |
| C Class | $1,000 | $1,010.86 | $14.01 | 2.81% |
| R Class | $1,000 | $1,013.34 | $11.53 | 2.31% |
| |
| (1) | Expenses are equal to the class's annualized expense ratio listed in the table above, multiplied by the average account value over the period, multiplied by 181, the number of days in the most recent fiscal half-year, divided by 365, to reflect the one-half year period. |
JUNE 30, 2015
|
| | | | | |
| | Shares | Value |
| COMMON STOCKS — 127.4% | | |
| Aerospace and Defense — 5.1% | | |
Astronics Corp.(1)(2) | 5,365 |
| $ | 380,325 |
|
Boeing Co. (The)(1) | 6,139 |
| 851,602 |
|
Honeywell International, Inc.(1) | 5,851 |
| 596,626 |
|
| Huntington Ingalls Industries, Inc. | 2,276 |
| 256,255 |
|
Moog, Inc., Class A(2) | 1,143 |
| 80,787 |
|
Spirit AeroSystems Holdings, Inc., Class A(1)(2) | 5,389 |
| 296,988 |
|
Teledyne Technologies, Inc.(1)(2) | 2,148 |
| 226,636 |
|
United Technologies Corp.(1) | 1,580 |
| 175,269 |
|
| | | 2,864,488 |
|
| Air Freight and Logistics — 0.6% | | |
| FedEx Corp. | 922 |
| 157,109 |
|
United Parcel Service, Inc., Class B(1) | 1,966 |
| 190,525 |
|
| | | 347,634 |
|
| Airlines — 0.7% | | |
Southwest Airlines Co.(1) | 6,114 |
| 202,312 |
|
United Continental Holdings, Inc.(2) | 3,978 |
| 210,874 |
|
| | | 413,186 |
|
| Auto Components — 0.2% | | |
Gentex Corp.(1) | 6,974 |
| 114,513 |
|
| Automobiles — 0.3% | | |
Harley-Davidson, Inc.(1) | 3,060 |
| 172,431 |
|
| Beverages — 3.2% | | |
Coca-Cola Co. (The)(1) | 9,331 |
| 366,055 |
|
Dr Pepper Snapple Group, Inc.(1) | 4,742 |
| 345,692 |
|
PepsiCo, Inc.(1) | 11,421 |
| 1,066,036 |
|
| | | 1,777,783 |
|
| Biotechnology — 9.2% | | |
Acorda Therapeutics, Inc.(1)(2) | 3,651 |
| 121,688 |
|
Alexion Pharmaceuticals, Inc.(2) | 932 |
| 168,478 |
|
Amgen, Inc.(1) | 4,933 |
| 757,314 |
|
Biogen, Inc.(1)(2) | 1,594 |
| 643,880 |
|
Celgene Corp.(1)(2) | 5,400 |
| 624,969 |
|
CTI BioPharma Corp.(1)(2) | 66,998 |
| 130,646 |
|
Emergent Biosolutions, Inc.(1)(2) | 2,690 |
| 88,636 |
|
Five Prime Therapeutics, Inc.(1)(2) | 5,502 |
| 136,670 |
|
Gilead Sciences, Inc.(1) | 8,956 |
| 1,048,568 |
|
Incyte Corp.(2) | 2,207 |
| 229,991 |
|
Infinity Pharmaceuticals, Inc.(1)(2) | 13,600 |
| 148,920 |
|
Medivation, Inc.(2) | 1,680 |
| 191,856 |
|
Ophthotech Corp.(2) | 2,622 |
| 136,501 |
|
Orexigen Therapeutics, Inc.(1)(2) | 27,721 |
| 137,219 |
|
|
| | | | | |
| | Shares | Value |
Progenics Pharmaceuticals, Inc.(1)(2) | 11,179 |
| $ | 83,395 |
|
Regeneron Pharmaceuticals, Inc.(2) | 690 |
| 351,990 |
|
United Therapeutics Corp.(1)(2) | 1,060 |
| 184,387 |
|
Vertex Pharmaceuticals, Inc.(2) | 229 |
| 28,277 |
|
| | | 5,213,385 |
|
| Building Products — 1.7% | | |
American Woodmark Corp.(1)(2) | 7,112 |
| 390,094 |
|
Continental Building Products, Inc.(1)(2) | 18,664 |
| 395,490 |
|
USG Corp.(1)(2) | 6,661 |
| 185,109 |
|
| | | 970,693 |
|
| Capital Markets — 2.5% | | |
Affiliated Managers Group, Inc.(2) | 344 |
| 75,199 |
|
| Ameriprise Financial, Inc. | 318 |
| 39,728 |
|
Artisan Partners Asset Management, Inc., Class A(1) | 6,655 |
| 309,191 |
|
| Diamond Hill Investment Group, Inc. | 1,264 |
| 252,370 |
|
Evercore Partners, Inc., Class A(1) | 6,719 |
| 362,557 |
|
Franklin Resources, Inc.(1) | 4,672 |
| 229,068 |
|
| Moelis & Co., Class A | 5,740 |
| 164,796 |
|
| | | 1,432,909 |
|
| Chemicals — 2.4% | | |
Cabot Corp.(1) | 5,427 |
| 202,373 |
|
Chase Corp.(1) | 5,999 |
| 238,460 |
|
Dow Chemical Co. (The)(1) | 2,538 |
| 129,870 |
|
E.I. du Pont de Nemours & Co.(1) | 4,174 |
| 266,927 |
|
| International Flavors & Fragrances, Inc. | 2,005 |
| 219,126 |
|
| LyondellBasell Industries NV, Class A | 2,827 |
| 292,651 |
|
| | | 1,349,407 |
|
| Commercial Services and Supplies — 2.4% | | |
ARC Document Solutions, Inc.(1)(2) | 56,509 |
| 430,034 |
|
Deluxe Corp.(1) | 878 |
| 54,436 |
|
Herman Miller, Inc.(1) | 11,595 |
| 335,443 |
|
| Multi-Color Corp. | 2,051 |
| 131,018 |
|
Pitney Bowes, Inc.(1) | 8,410 |
| 175,012 |
|
Waste Management, Inc.(1) | 5,378 |
| 249,270 |
|
| | | 1,375,213 |
|
| Communications Equipment — 2.4% | | |
Arista Networks, Inc.(2) | 1,413 |
| 115,499 |
|
ARRIS Group, Inc.(1)(2) | 6,456 |
| 197,554 |
|
F5 Networks, Inc.(2) | 1,646 |
| 198,096 |
|
Harris Corp.(1) | 643 |
| 49,453 |
|
Juniper Networks, Inc.(1) | 5,297 |
| 137,563 |
|
Polycom, Inc.(1)(2) | 11,687 |
| 133,699 |
|
QUALCOMM, Inc.(1) | 7,981 |
| 499,850 |
|
| | | 1,331,714 |
|
| Construction Materials — 0.1% | | |
| United States Lime & Minerals, Inc. | 630 |
| 36,616 |
|
|
| | | | | |
| | Shares | Value |
| Containers and Packaging — 0.2% | | |
Berry Plastics Group, Inc.(2) | 2,310 |
| $ | 74,844 |
|
| Graphic Packaging Holding Co. | 3,096 |
| 43,127 |
|
| | | 117,971 |
|
| Diversified Consumer Services — 1.3% | | |
Capella Education Co.(1) | 1,674 |
| 89,844 |
|
H&R Block, Inc.(1) | 13,647 |
| 404,634 |
|
K12, Inc.(1)(2) | 4,213 |
| 53,294 |
|
Strayer Education, Inc.(1)(2) | 4,935 |
| 212,698 |
|
| | | 760,470 |
|
| Diversified Financial Services — 0.1% | | |
| GAIN Capital Holdings, Inc. | 6,033 |
| 57,676 |
|
| Diversified Telecommunication Services — 1.3% | | |
CenturyLink, Inc.(1) | 6,225 |
| 182,891 |
|
Verizon Communications, Inc.(1) | 11,771 |
| 548,646 |
|
| | | 731,537 |
|
| Electrical Equipment — 2.1% | | |
Emerson Electric Co.(1) | 9,503 |
| 526,751 |
|
Enphase Energy, Inc.(1)(2) | 11,946 |
| 90,909 |
|
Rockwell Automation, Inc.(1) | 4,074 |
| 507,784 |
|
Thermon Group Holdings, Inc.(1)(2) | 2,411 |
| 58,033 |
|
| | | 1,183,477 |
|
| Electronic Equipment, Instruments and Components — 0.7% | | |
Corning, Inc.(1) | 11,311 |
| 223,166 |
|
OSI Systems, Inc.(1)(2) | 2,611 |
| 184,833 |
|
| | | 407,999 |
|
| Energy Equipment and Services — 1.4% | | |
FMC Technologies, Inc.(1)(2) | 3,729 |
| 154,716 |
|
Schlumberger Ltd.(1) | 5,688 |
| 490,249 |
|
Superior Energy Services, Inc.(1) | 6,462 |
| 135,960 |
|
| | | 780,925 |
|
| Food and Staples Retailing — 2.6% | | |
CVS Health Corp.(1) | 4,620 |
| 484,546 |
|
Fresh Market, Inc. (The)(2) | 5,703 |
| 183,294 |
|
Kroger Co. (The)(1) | 8,191 |
| 593,929 |
|
Wal-Mart Stores, Inc.(1) | 3,276 |
| 232,367 |
|
| | | 1,494,136 |
|
| Food Products — 2.3% | | |
Archer-Daniels-Midland Co.(1) | 4,484 |
| 216,218 |
|
| Cal-Maine Foods, Inc. | 867 |
| 45,257 |
|
| Hormel Foods Corp. | 4,950 |
| 279,032 |
|
Ingredion, Inc.(1) | 2,102 |
| 167,761 |
|
Pilgrim's Pride Corp.(1) | 17,543 |
| 402,963 |
|
Seaboard Corp.(2) | 44 |
| 158,356 |
|
| | | 1,269,587 |
|
|
| | | | | |
| | Shares | Value |
| Health Care Equipment and Supplies — 5.0% | | |
Align Technology, Inc.(2) | 956 |
| $ | 59,951 |
|
Boston Scientific Corp.(1)(2) | 13,107 |
| 231,994 |
|
| C.R. Bard, Inc. | 703 |
| 120,002 |
|
Cyberonics, Inc.(2) | 575 |
| 34,190 |
|
DENTSPLY International, Inc.(1) | 5,257 |
| 270,998 |
|
DexCom, Inc.(2) | 637 |
| 50,947 |
|
Edwards Lifesciences Corp.(1)(2) | 3,282 |
| 467,455 |
|
HeartWare International, Inc.(2) | 1,080 |
| 78,505 |
|
Hologic, Inc.(1)(2) | 9,082 |
| 345,661 |
|
Integra LifeSciences Holdings Corp.(2) | 2,246 |
| 151,313 |
|
St. Jude Medical, Inc.(1) | 6,925 |
| 506,010 |
|
Stryker Corp.(1) | 5,286 |
| 505,183 |
|
| | | 2,822,209 |
|
| Health Care Providers and Services — 3.2% | | |
Aetna, Inc.(1) | 1,998 |
| 254,665 |
|
Alliance HealthCare Services, Inc.(1)(2) | 5,464 |
| 102,122 |
|
| Cardinal Health, Inc. | 3,326 |
| 278,220 |
|
Express Scripts Holding Co.(1)(2) | 6,309 |
| 561,123 |
|
Health Net, Inc.(2) | 2,477 |
| 158,825 |
|
| Landauer, Inc. | 3,413 |
| 121,639 |
|
Molina Healthcare, Inc.(2) | 2,582 |
| 181,515 |
|
| UnitedHealth Group, Inc. | 1,327 |
| 161,894 |
|
| | | 1,820,003 |
|
| Health Care Technology — 1.2% | | |
HealthStream, Inc.(1)(2) | 4,533 |
| 137,894 |
|
Merge Healthcare, Inc.(1)(2) | 85,651 |
| 411,125 |
|
Quality Systems, Inc.(1) | 8,335 |
| 138,111 |
|
| | | 687,130 |
|
| Hotels, Restaurants and Leisure — 6.1% | | |
Boyd Gaming Corp.(1)(2) | 30,323 |
| 453,329 |
|
| Brinker International, Inc. | 8,000 |
| 461,200 |
|
Chipotle Mexican Grill, Inc.(2) | 334 |
| 202,067 |
|
| Cracker Barrel Old Country Store, Inc. | 2,528 |
| 377,077 |
|
| Darden Restaurants, Inc. | 2,639 |
| 187,580 |
|
Denny's Corp.(1)(2) | 13,459 |
| 156,259 |
|
Diamond Resorts International, Inc.(2) | 1,143 |
| 36,062 |
|
| DineEquity, Inc. | 338 |
| 33,492 |
|
Las Vegas Sands Corp.(1) | 8,991 |
| 472,657 |
|
McDonald's Corp.(1) | 360 |
| 34,225 |
|
Pinnacle Entertainment, Inc.(1)(2) | 2,518 |
| 93,871 |
|
Ruth's Hospitality Group, Inc.(1) | 5,061 |
| 81,583 |
|
| SeaWorld Entertainment, Inc. | 1,498 |
| 27,623 |
|
Starbucks Corp.(1) | 2,992 |
| 160,416 |
|
Vail Resorts, Inc.(1) | 3,968 |
| 433,306 |
|
Wyndham Worldwide Corp.(1) | 2,642 |
| 216,406 |
|
| | | 3,427,153 |
|
|
| | | | | |
| | Shares | Value |
| Household Durables — 1.1% | | |
Harman International Industries, Inc.(1) | 3,286 |
| $ | 390,837 |
|
iRobot Corp.(1)(2) | 3,962 |
| 126,308 |
|
Universal Electronics, Inc.(1)(2) | 1,734 |
| 86,423 |
|
| | | 603,568 |
|
| Household Products — 1.2% | | |
Central Garden and Pet Co.(1)(2) | 29,029 |
| 331,221 |
|
| Colgate-Palmolive Co. | 1,915 |
| 125,260 |
|
Procter & Gamble Co. (The)(1) | 2,774 |
| 217,038 |
|
| | | 673,519 |
|
| Independent Power and Renewable Electricity Producers — 0.5% | |
Calpine Corp.(1)(2) | 6,634 |
| 119,346 |
|
Ormat Technologies, Inc.(1) | 5,035 |
| 189,719 |
|
| | | 309,065 |
|
| Industrial Conglomerates — 1.5% | | |
3M Co.(1) | 5,541 |
| 854,976 |
|
| Insurance — 0.1% | | |
Federated National Holding Co.(1) | 3,250 |
| 78,650 |
|
| Internet and Catalog Retail — 2.7% | | |
Amazon.com, Inc.(1)(2) | 965 |
| 418,897 |
|
Expedia, Inc.(1) | 1,938 |
| 211,920 |
|
Nutrisystem, Inc.(1) | 5,902 |
| 146,842 |
|
Priceline Group, Inc. (The)(2) | 274 |
| 315,475 |
|
Shutterfly, Inc.(1)(2) | 8,710 |
| 416,425 |
|
| | | 1,509,559 |
|
| Internet Software and Services — 7.0% | | |
Cimpress NV(1)(2) | 1,845 |
| 155,275 |
|
eBay, Inc.(1)(2) | 13,294 |
| 800,831 |
|
Endurance International Group Holdings, Inc.(1)(2) | 15,393 |
| 318,019 |
|
Everyday Health, Inc.(1)(2) | 20,497 |
| 261,952 |
|
Facebook, Inc., Class A(1)(2) | 8,204 |
| 703,616 |
|
Google, Inc., Class A(1)(2) | 2,247 |
| 1,213,470 |
|
LogMeIn, Inc.(2) | 2,578 |
| 166,255 |
|
RetailMeNot, Inc.(1)(2) | 4,567 |
| 81,430 |
|
VeriSign, Inc.(1)(2) | 2,385 |
| 147,202 |
|
Web.com Group, Inc.(1)(2) | 1,938 |
| 46,938 |
|
XO Group, Inc.(1)(2) | 1,786 |
| 29,201 |
|
| | | 3,924,189 |
|
| IT Services — 5.0% | | |
Accenture plc, Class A(1) | 7,525 |
| 728,269 |
|
Computer Sciences Corp.(1) | 2,372 |
| 155,698 |
|
CSG Systems International, Inc.(1) | 5,199 |
| 164,600 |
|
EVERTEC, Inc.(1) | 4,311 |
| 91,566 |
|
International Business Machines Corp.(1) | 4,771 |
| 776,051 |
|
Teradata Corp.(1)(2) | 8,111 |
| 300,107 |
|
Total System Services, Inc.(1) | 4,319 |
| 180,405 |
|
VeriFone Systems, Inc.(2) | 1,894 |
| 64,320 |
|
|
| | | | | |
| | Shares | Value |
Visa, Inc., Class A(1) | 3,978 |
| $ | 267,123 |
|
| Western Union Co. (The) | 3,520 |
| 71,562 |
|
| | | 2,799,701 |
|
| Life Sciences Tools and Services — 0.2% | | |
Luminex Corp.(1)(2) | 6,813 |
| 117,592 |
|
| Machinery — 4.4% | | |
Blount International, Inc.(1)(2) | 27,866 |
| 304,297 |
|
Caterpillar, Inc.(1) | 4,888 |
| 414,600 |
|
Cummins, Inc.(1) | 3,736 |
| 490,126 |
|
| Illinois Tool Works, Inc. | 1,081 |
| 99,225 |
|
Meritor, Inc.(2) | 4,261 |
| 55,904 |
|
| PACCAR, Inc. | 2,075 |
| 132,406 |
|
Parker-Hannifin Corp.(1) | 3,835 |
| 446,126 |
|
Stanley Black & Decker, Inc.(1) | 4,230 |
| 445,165 |
|
Wabash National Corp.(1)(2) | 7,999 |
| 100,307 |
|
| | | 2,488,156 |
|
| Marine — 0.1% | | |
Matson, Inc.(1) | 729 |
| 30,647 |
|
| Media — 3.9% | | |
Cablevision Systems Corp., Class A(1) | 22,545 |
| 539,727 |
|
Cinedigm Corp.(1)(2) | 34,568 |
| 24,367 |
|
Comcast Corp., Class A(1) | 5,838 |
| 351,097 |
|
| Interpublic Group of Cos., Inc. (The) | 1,889 |
| 36,401 |
|
Omnicom Group, Inc.(1) | 4,167 |
| 289,565 |
|
| Scripps Networks Interactive, Inc., Class A | 5,631 |
| 368,099 |
|
| Walt Disney Co. (The) | 5,263 |
| 600,719 |
|
| | | 2,209,975 |
|
| Metals and Mining — 0.6% | | |
Materion Corp.(1) | 9,009 |
| 317,567 |
|
Stillwater Mining Co.(2) | 4,016 |
| 46,546 |
|
| | | 364,113 |
|
| Multiline Retail — 2.2% | | |
Big Lots, Inc.(1) | 9,722 |
| 437,393 |
|
| Dillard's, Inc., Class A | 477 |
| 50,175 |
|
Kohl's Corp.(1) | 4,024 |
| 251,943 |
|
Macy's, Inc.(1) | 438 |
| 29,552 |
|
Target Corp.(1) | 5,531 |
| 451,495 |
|
| | | 1,220,558 |
|
| Oil, Gas and Consumable Fuels — 1.0% | | |
EOG Resources, Inc.(1) | 4,356 |
| 381,368 |
|
Valero Energy Corp.(1) | 2,576 |
| 161,257 |
|
| | | 542,625 |
|
| Paper and Forest Products — 0.5% | | |
| International Paper Co. | 5,839 |
| 277,878 |
|
|
| | | | | |
| | Shares | Value |
| Personal Products — 0.1% | | |
Medifast, Inc.(1)(2) | 2,218 |
| $ | 71,686 |
|
| Pharmaceuticals — 5.2% | | |
AbbVie, Inc.(1) | 13,709 |
| 921,108 |
|
Allergan plc(2) | 112 |
| 33,987 |
|
| Bristol-Myers Squibb Co. | 2,468 |
| 164,221 |
|
Endo International plc(2) | 2,474 |
| 197,054 |
|
Jazz Pharmaceuticals plc(2) | 1,139 |
| 200,544 |
|
Johnson & Johnson(1) | 5,100 |
| 497,046 |
|
Lannett Co., Inc.(2) | 598 |
| 35,545 |
|
Merck & Co., Inc.(1) | 8,845 |
| 503,546 |
|
Mylan NV(1)(2) | 2,176 |
| 147,663 |
|
Nektar Therapeutics(2) | 19,073 |
| 238,603 |
|
| | | 2,939,317 |
|
| Professional Services — 1.0% | | |
RPX Corp.(1)(2) | 27,477 |
| 464,361 |
|
TrueBlue, Inc.(2) | 3,145 |
| 94,036 |
|
| | | 558,397 |
|
| Real Estate Investment Trusts (REITs) — 0.9% | | |
Lamar Advertising Co., Class A(1) | 7,527 |
| 432,652 |
|
| Ryman Hospitality Properties, Inc. | 917 |
| 48,702 |
|
| | | 481,354 |
|
| Real Estate Management and Development — 2.1% | | |
CBRE Group, Inc.(1)(2) | 7,101 |
| 262,737 |
|
| Jones Lang LaSalle, Inc. | 2,378 |
| 406,638 |
|
Marcus & Millichap, Inc.(1)(2) | 10,917 |
| 503,710 |
|
| | | 1,173,085 |
|
| Road and Rail — 1.0% | | |
ArcBest Corp.(1) | 8,024 |
| 255,163 |
|
PAM Transportation Services, Inc.(2) | 4,572 |
| 265,404 |
|
Union Pacific Corp.(1) | 399 |
| 38,053 |
|
| | | 558,620 |
|
| Semiconductors and Semiconductor Equipment — 2.9% | | |
Intel Corp.(1) | 14,678 |
| 446,431 |
|
| Lam Research Corp. | 1,227 |
| 99,816 |
|
MaxLinear, Inc., Class A(1)(2) | 9,577 |
| 115,882 |
|
Micron Technology, Inc.(1)(2) | 4,726 |
| 89,038 |
|
Microsemi Corp.(2) | 1,033 |
| 36,103 |
|
ON Semiconductor Corp.(1)(2) | 4,070 |
| 47,578 |
|
Semtech Corp.(1)(2) | 2,143 |
| 42,539 |
|
Texas Instruments, Inc.(1) | 13,602 |
| 700,639 |
|
| Xilinx, Inc. | 867 |
| 38,287 |
|
| | | 1,616,313 |
|
| Software — 8.5% | | |
Activision Blizzard, Inc.(1) | 10,009 |
| 242,318 |
|
Aspen Technology, Inc.(1)(2) | 3,042 |
| 138,563 |
|
Cadence Design Systems, Inc.(1)(2) | 16,254 |
| 319,554 |
|
|
| | | | | |
| | Shares | Value |
Electronic Arts, Inc.(1)(2) | 8,294 |
| $ | 551,551 |
|
Glu Mobile, Inc.(1)(2) | 49,726 |
| 308,798 |
|
Intuit, Inc.(1) | 5,552 |
| 559,475 |
|
Microsoft Corp.(1) | 33,811 |
| 1,492,756 |
|
NetScout Systems, Inc.(2) | 881 |
| 32,306 |
|
Oracle Corp.(1) | 21,079 |
| 849,484 |
|
| Pegasystems, Inc. | 1,642 |
| 37,585 |
|
PTC, Inc.(2) | 973 |
| 39,912 |
|
Verint Systems, Inc.(2) | 627 |
| 38,087 |
|
VMware, Inc., Class A(1)(2) | 2,402 |
| 205,948 |
|
| | | 4,816,337 |
|
| Specialty Retail — 4.8% | | |
Bed Bath & Beyond, Inc.(1)(2) | 3,433 |
| 236,808 |
|
Build-A-Bear Workshop, Inc.(1)(2) | 24,439 |
| 390,780 |
|
Cato Corp. (The), Class A(1) | 8,143 |
| 315,623 |
|
Foot Locker, Inc.(1) | 5,788 |
| 387,854 |
|
Gap, Inc. (The)(1) | 11,588 |
| 442,314 |
|
Home Depot, Inc. (The)(1) | 2,319 |
| 257,710 |
|
Lowe's Cos., Inc.(1) | 7,329 |
| 490,823 |
|
Murphy USA, Inc.(1)(2) | 3,810 |
| 212,674 |
|
| | | 2,734,586 |
|
| Technology Hardware, Storage and Peripherals — 8.8% | | |
Apple, Inc.(1) | 33,856 |
| 4,246,389 |
|
EMC Corp.(1) | 17,097 |
| 451,190 |
|
NetApp, Inc.(1) | 3,861 |
| 121,853 |
|
SanDisk Corp.(1) | 2,499 |
| 145,492 |
|
| | | 4,964,924 |
|
| Textiles, Apparel and Luxury Goods — 0.7% | | |
Deckers Outdoor Corp.(2) | 768 |
| 55,273 |
|
Vera Bradley, Inc.(1)(2) | 12,412 |
| 139,883 |
|
Vince Holding Corp.(2) | 4,449 |
| 53,299 |
|
Wolverine World Wide, Inc.(1) | 6,067 |
| 172,788 |
|
| | | 421,243 |
|
| Thrifts and Mortgage Finance — 0.1% | | |
Essent Group Ltd.(2) | 2,324 |
| 63,561 |
|
| Tobacco — 0.1% | | |
Altria Group, Inc.(1) | 754 |
| 36,878 |
|
| Trading Companies and Distributors — 0.5% | | |
| Kaman Corp. | 6,661 |
| 279,362 |
|
| Wireless Telecommunication Services — 0.4% | | |
| Shenandoah Telecommunications Co. | 6,468 |
| 221,400 |
|
TOTAL COMMON STOCKS (Cost $67,722,888) | | 71,902,079 |
|
| TEMPORARY CASH INVESTMENTS — 2.0% | | |
Repurchase Agreement, Bank of America Merrill Lynch, (collateralized by various U.S. Treasury obligations, 1.50%, 1/31/19 - 11/30/19, valued at $192,899), in a joint trading account at 0.10%, dated 6/30/15, due 7/1/15 (Delivery value $189,050) | | 189,049 |
|
|
| | | | | |
| | Shares | Value |
| Repurchase Agreement, Fixed Income Clearing Corp., (collateralized by various U.S. Treasury obligations, 2.375%, 8/15/24, valued at $774,747), at 0.01%, dated 6/30/15, due 7/1/15 (Delivery value $756,000) | | $ | 756,000 |
|
| State Street Institutional Liquid Reserves Fund, Premier Class | 188,305 |
| 188,305 |
|
TOTAL TEMPORARY CASH INVESTMENTS (Cost $1,133,354) | | 1,133,354 |
|
TOTAL INVESTMENT SECURITIES BEFORE SECURITIES SOLD SHORT — 129.4% (Cost $68,856,242) | 73,035,433 |
|
| COMMON STOCKS SOLD SHORT — (29.0)% | | |
| Aerospace and Defense — (0.6)% | | |
| SIFCO Industries, Inc. | (6,847 | ) | (102,020 | ) |
| Sparton Corp. | (8,724 | ) | (238,340 | ) |
| | | (340,360 | ) |
| Air Freight and Logistics — (0.1)% | | |
| Hub Group, Inc., Class A | (1,322 | ) | (53,329 | ) |
| Airlines — (0.5)% | | |
| Allegiant Travel Co. | (1,437 | ) | (255,613 | ) |
| Spirit Airlines, Inc. | (498 | ) | (30,926 | ) |
| | | (286,539 | ) |
| Auto Components — (0.2)% | | |
| Remy International, Inc. | (5,717 | ) | (126,403 | ) |
| Beverages — (0.3)% | | |
| Craft Brew Alliance, Inc. | (13,358 | ) | (147,739 | ) |
| Biotechnology — (0.5)% | | |
| Bluebird Bio, Inc. | (653 | ) | (109,946 | ) |
| Insmed, Inc. | (5,771 | ) | (140,928 | ) |
| Oncothyreon, Inc. | (9,184 | ) | (34,348 | ) |
| | | (285,222 | ) |
| Building Products — (0.7)% | | |
| Builders FirstSource, Inc. | (32,692 | ) | (419,765 | ) |
| Capital Markets — (0.5)% | | |
| Cowen Group, Inc., Class A | (44,141 | ) | (282,502 | ) |
| Chemicals — (0.4)% | | |
| Rentech, Inc. | (102,888 | ) | (110,090 | ) |
| WR Grace & Co. | (1,038 | ) | (104,112 | ) |
| | | (214,202 | ) |
| Commercial Services and Supplies — (0.7)% | | |
| InnerWorkings, Inc. | (62,507 | ) | (416,922 | ) |
| Communications Equipment — (0.5)% | | |
| Motorola Solutions, Inc. | (4,830 | ) | (276,952 | ) |
| Construction and Engineering — (1.4)% | | |
| Furmanite Corp. | (3,800 | ) | (30,856 | ) |
| Great Lakes Dredge & Dock Corp. | (24,600 | ) | (146,616 | ) |
| Primoris Services Corp. | (17,287 | ) | (342,283 | ) |
| Sterling Construction Co., Inc. | (61,420 | ) | (245,680 | ) |
| | | (765,435 | ) |
|
| | | | | |
| | Shares | Value |
| Containers and Packaging — (0.2)% | | |
| AEP Industries, Inc. | (2,601 | ) | $ | (143,575 | ) |
| Diversified Financial Services — (0.1)% | | |
| Leucadia National Corp. | (1,477 | ) | (35,862 | ) |
| Diversified Telecommunication Services — (0.2)% | | |
| Cogent Communications Holdings, Inc. | (3,336 | ) | (112,890 | ) |
| Electronic Equipment, Instruments and Components — (1.8)% | | |
| Anixter International, Inc. | (2,515 | ) | (163,852 | ) |
| Badger Meter, Inc. | (3,422 | ) | (217,263 | ) |
| CUI Global, Inc. | (54,017 | ) | (273,326 | ) |
| FARO Technologies, Inc. | (6,364 | ) | (297,199 | ) |
| Mesa Laboratories, Inc. | (619 | ) | (55,029 | ) |
| | | (1,006,669 | ) |
| Food and Staples Retailing — (1.0)% | | |
| Chefs' Warehouse, Inc. (The) | (12,553 | ) | (266,626 | ) |
| PriceSmart, Inc. | (482 | ) | (43,977 | ) |
| United Natural Foods, Inc. | (3,826 | ) | (243,640 | ) |
| | | (554,243 | ) |
| Food Products — (0.3)% | | |
| Inventure Foods, Inc. | (3,994 | ) | (40,539 | ) |
| Lifeway Foods, Inc. | (5,507 | ) | (105,679 | ) |
| | | (146,218 | ) |
| Health Care Equipment and Supplies — (1.1)% | | |
| Endologix, Inc. | (5,986 | ) | (91,825 | ) |
| NxStage Medical, Inc. | (8,751 | ) | (125,008 | ) |
| Spectranetics Corp. (The) | (11,375 | ) | (261,739 | ) |
| STAAR Surgical Co. | (14,269 | ) | (137,838 | ) |
| Tornier NV | (1,317 | ) | (32,912 | ) |
| | | (649,322 | ) |
| Health Care Providers and Services — (1.7)% | | |
| Aceto Corp. | (6,980 | ) | (171,917 | ) |
| Addus HomeCare Corp. | (1,921 | ) | (53,519 | ) |
| Brookdale Senior Living, Inc. | (10,358 | ) | (359,423 | ) |
| Providence Service Corp. (The) | (5,364 | ) | (237,518 | ) |
| Tenet Healthcare Corp. | (2,173 | ) | (125,773 | ) |
| | | (948,150 | ) |
| Hotels, Restaurants and Leisure — (0.3)% | | |
| Wynn Resorts Ltd. | (1,545 | ) | (152,445 | ) |
| Household Durables — (1.2)% | | |
| D.R. Horton, Inc. | (1,084 | ) | (29,658 | ) |
| Dixie Group, Inc. (The) | (17,014 | ) | (178,647 | ) |
| William Lyon Homes, Class A | (18,720 | ) | (480,543 | ) |
| | | (688,848 | ) |
| Insurance — (0.9)% | | |
| Ambac Financial Group, Inc. | (14,124 | ) | (235,023 | ) |
| Arthur J Gallagher & Co. | (1,947 | ) | (92,093 | ) |
|
| | | | | |
| | Shares | Value |
| Crawford & Co., Class B | (6,906 | ) | $ | (58,218 | ) |
| eHealth, Inc. | (8,771 | ) | (111,304 | ) |
| National Interstate Corp. | (1,309 | ) | (35,762 | ) |
| | | (532,400 | ) |
| Internet Software and Services — (0.6)% | | |
| GTT Communications, Inc. | (13,962 | ) | (333,273 | ) |
| IT Services — (0.8)% | | |
| Global Payments, Inc. | (329 | ) | (34,035 | ) |
| Heartland Payment Systems, Inc. | (3,412 | ) | (184,419 | ) |
| WEX, Inc. | (2,287 | ) | (260,649 | ) |
| | | (479,103 | ) |
| Leisure Products — (0.1)% | | |
| Marine Products Corp. | (4,757 | ) | (29,684 | ) |
| Life Sciences Tools and Services — (0.1)% | | |
| Fluidigm Corp. | (1,859 | ) | (44,988 | ) |
| Machinery — (1.6)% | | |
| Donaldson Co., Inc. | (2,324 | ) | (83,199 | ) |
| EnPro Industries, Inc. | (4,361 | ) | (249,537 | ) |
| Gorman-Rupp Co. (The) | (5,929 | ) | (166,486 | ) |
| NN, Inc. | (16,314 | ) | (416,333 | ) |
| | | (915,555 | ) |
| Media — (0.2)% | | |
| Loral Space & Communications, Inc. | (2,140 | ) | (135,077 | ) |
| Metals and Mining — (0.5)% | | |
| Haynes International, Inc. | (1,219 | ) | (60,121 | ) |
| Olympic Steel, Inc. | (14,408 | ) | (251,276 | ) |
| | | (311,397 | ) |
| Oil, Gas and Consumable Fuels — (2.1)% | | |
| Cabot Oil & Gas Corp. | (1,631 | ) | (51,442 | ) |
| Matador Resources Co. | (7,047 | ) | (176,175 | ) |
| Parsley Energy, Inc., Class A | (16,137 | ) | (281,106 | ) |
| Rice Energy, Inc. | (6,046 | ) | (125,938 | ) |
| SemGroup Corp., Class A | (1,495 | ) | (118,822 | ) |
| Synergy Resources Corp. | (24,390 | ) | (278,778 | ) |
| Williams Cos., Inc. (The) | (2,607 | ) | (149,616 | ) |
| | | (1,181,877 | ) |
| Paper and Forest Products — (1.0)% | | |
| Deltic Timber Corp. | (5,968 | ) | (403,676 | ) |
| Wausau Paper Corp. | (20,950 | ) | (192,321 | ) |
| | | (595,997 | ) |
| Pharmaceuticals — (0.1)% | | |
| Pain Therapeutics, Inc. | (37,875 | ) | (65,524 | ) |
| Professional Services — (0.5)% | | |
| Advisory Board Co. (The) | (5,111 | ) | (279,418 | ) |
| Real Estate Management and Development — (0.9)% | | |
| Kennedy-Wilson Holdings, Inc. | (9,123 | ) | (224,335 | ) |
|
| | | | | |
| | Shares | Value |
| Tejon Ranch Co. | (10,145 | ) | $ | (260,828 | ) |
| | | (485,163 | ) |
| Road and Rail — (0.2)% | | |
| Roadrunner Transportation Systems, Inc. | (4,873 | ) | (125,723 | ) |
| Semiconductors and Semiconductor Equipment — (0.5)% | | |
| Exar Corp. | (26,550 | ) | (259,659 | ) |
| Software — (0.9)% | | |
| Comverse, Inc. | (20,071 | ) | (403,026 | ) |
| Paylocity Holding Corp. | (2,577 | ) | (92,385 | ) |
| | | (495,411 | ) |
| Specialty Retail — (0.8)% | | |
| Cabela's, Inc. | (4,920 | ) | (245,902 | ) |
| Destination XL Group, Inc. | (7,709 | ) | (38,622 | ) |
| New York & Co., Inc. | (6,000 | ) | (16,080 | ) |
| Signet Jewelers Ltd. | (1,216 | ) | (155,940 | ) |
| | | (456,544 | ) |
| Technology Hardware, Storage and Peripherals — (1.2)% | | |
| Cray, Inc. | (14,729 | ) | (434,653 | ) |
| Electronics For Imaging, Inc. | (1,758 | ) | (76,491 | ) |
| Silicon Graphics International Corp. | (25,254 | ) | (163,393 | ) |
| | | (674,537 | ) |
| Thrifts and Mortgage Finance — (0.2)% | | |
| United Financial Bancorp, Inc. | (7,358 | ) | (98,965 | ) |
| Trading Companies and Distributors — (1.5)% | | |
| Beacon Roofing Supply, Inc. | (12,632 | ) | (419,635 | ) |
| MRC Global, Inc. | (9,079 | ) | (140,180 | ) |
| Stock Building Supply Holdings, Inc. | (8,122 | ) | (158,785 | ) |
| Watsco, Inc. | (944 | ) | (116,810 | ) |
| | | (835,410 | ) |
TOTAL COMMON STOCKS SOLD SHORT — (29.0)% (Proceeds $16,169,746) | | (16,389,297 | ) |
| OTHER ASSETS AND LIABILITIES — (0.4)% | | (209,962 | ) |
| TOTAL NET ASSETS — 100.0% | | $ | 56,436,174 |
|
|
| | |
| NOTES TO SCHEDULE OF INVESTMENTS |
| |
| (1) | Security, or a portion thereof, has been pledged at the custodian bank or with a broker for collateral requirements on securities sold short. At the period end, the aggregate value of securities pledged was $49,344,075. |
See Notes to Financial Statements.
|
|
| Statement of Assets and Liabilities |
|
| | | |
| JUNE 30, 2015 |
| Assets |
| Investment securities, at value (cost of $68,856,242) | $ | 73,035,433 |
|
| Deposits with broker for securities sold short | 17,260 |
|
| Receivable for investments sold | 7,240,702 |
|
| Receivable for capital shares sold | 41,803 |
|
| Dividends and interest receivable | 43,911 |
|
| | 80,379,109 |
|
| | |
| Liabilities | |
| Securities sold short, at value (proceeds of $16,169,746) | 16,389,297 |
|
| Payable for investments purchased | 7,464,476 |
|
| Payable for capital shares redeemed | 15,054 |
|
| Accrued management fees | 67,862 |
|
| Distribution and service fees payable | 2,372 |
|
| Dividend expense payable on securities sold short | 3,874 |
|
| | 23,942,935 |
|
| | |
| Net Assets | $ | 56,436,174 |
|
| | |
| Net Assets Consist of: | |
| Capital (par value and paid-in surplus) | $ | 51,849,293 |
|
| Undistributed net investment income | 5,940 |
|
| Undistributed net realized gain | 621,301 |
|
| Net unrealized appreciation | 3,959,640 |
|
| | $ | 56,436,174 |
|
|
| | | | | | |
| | Net Assets | Shares Outstanding | Net Asset Value Per Share |
| Investor Class, $0.01 Par Value |
| $47,975,544 |
| 2,877,252 |
| $16.67 |
| Institutional Class, $0.01 Par Value |
| $1,027,031 |
| 61,531 |
| $16.69 |
| A Class, $0.01 Par Value |
| $6,083,431 |
| 366,725 |
| $16.59* |
| C Class, $0.01 Par Value |
| $1,306,114 |
| 80,707 |
| $16.18 |
| R Class, $0.01 Par Value |
| $44,054 |
| 2,673 |
| $16.48 |
*Maximum offering price $17.60 (net asset value divided by 0.9425).
See Notes to Financial Statements.
|
| | | |
| YEAR ENDED JUNE 30, 2015 |
| Investment Income (Loss) |
| Income: | |
| Dividends (net of foreign taxes withheld of $60) | $ | 672,771 |
|
| Interest | 660 |
|
| | 673,431 |
|
| | |
| Expenses: | |
| Dividend expense on securities sold short | 55,710 |
|
| Broker fees and charges on securities sold short | 61,338 |
|
| Management fees | 479,361 |
|
| Distribution and service fees: | |
| A Class | 7,333 |
|
| C Class | 9,943 |
|
| R Class | 2,470 |
|
| Directors' fees and expenses | 1,414 |
|
| Other expenses | 345 |
|
| | 617,914 |
|
| | |
| Net investment income (loss) | 55,517 |
|
| | |
| Realized and Unrealized Gain (Loss) | |
| Net realized gain (loss) on: | |
| Investment transactions | 1,498,167 |
|
| Securities sold short transactions | (239,627 | ) |
| | 1,258,540 |
|
| | |
| Change in net unrealized appreciation (depreciation) on: | |
| Investments | 207,396 |
|
| Securities sold short | 190,231 |
|
| | 397,627 |
|
| | |
| Net realized and unrealized gain (loss) | 1,656,167 |
|
| | |
| Net Increase (Decrease) in Net Assets Resulting from Operations | $ | 1,711,684 |
|
See Notes to Financial Statements.
|
|
| Statement of Changes in Net Assets |
|
| | | | | | |
| YEARS ENDED JUNE 30, 2015 AND JUNE 30, 2014 |
| Increase (Decrease) in Net Assets | June 30, 2015 | June 30, 2014 |
| Operations | | |
| Net investment income (loss) | $ | 55,517 |
| $ | 15,833 |
|
| Net realized gain (loss) | 1,258,540 |
| 1,327,952 |
|
| Change in net unrealized appreciation (depreciation) | 397,627 |
| 2,318,770 |
|
| Net increase (decrease) in net assets resulting from operations | 1,711,684 |
| 3,662,555 |
|
| | | |
| Distributions to Shareholders | | |
| From net investment income: | | |
| Investor Class | (17,925 | ) | (9,913 | ) |
| Institutional Class | (1,515 | ) | (1,286 | ) |
| From net realized gains: | | |
| Investor Class | (1,163,616 | ) | (331,823 | ) |
| Institutional Class | (28,971 | ) | (12,402 | ) |
| A Class | (103,386 | ) | (25,398 | ) |
| C Class | (44,166 | ) | (16,154 | ) |
| R Class | (30,426 | ) | (12,826 | ) |
| Decrease in net assets from distributions | (1,390,005 | ) | (409,802 | ) |
| | | |
| Capital Share Transactions | | |
Net increase (decrease) in net assets from capital share transactions (Note 5) | 37,951,086 |
| 4,419,523 |
|
| | | |
| Net increase (decrease) in net assets | 38,272,765 |
| 7,672,276 |
|
| | | |
| Net Assets | | |
| Beginning of period | 18,163,409 |
| 10,491,133 |
|
| End of period | $ | 56,436,174 |
| $ | 18,163,409 |
|
| | | |
| Undistributed net investment income | $ | 5,940 |
| $ | 1,171 |
|
See Notes to Financial Statements.
|
| | | |
| YEAR ENDED JUNE 30, 2015 | |
| Cash Flows From (Used In) Operating Activities | |
| Net increase (decrease) in net assets resulting from operations | $ | 1,711,684 |
|
| Adjustments to reconcile net increase (decrease) in net assets resulting from operations to net cash from (used in) operating activities: | |
| Purchases of investment securities | (73,749,732 | ) |
| Proceeds from investments sold | 26,696,049 |
|
| Purchases to cover securities sold short | (11,711,511 | ) |
| Proceeds from securities sold short | 22,562,997 |
|
| (Increase) decrease in short-term investments | (868,596 | ) |
| (Increase) decrease in deposits with broker for securities sold short | 209,625 |
|
| (Increase) decrease in receivable for investments sold | (7,240,702 | ) |
| (Increase) decrease in dividends and interest receivable | (28,614 | ) |
| Increase (decrease) in payable for investments purchased | 7,464,476 |
|
| Increase (decrease) in accrued management fees | 46,784 |
|
| Increase (decrease) in distribution and service fees payable | 1,346 |
|
| Increase (decrease) in dividend expense payable on securities sold short | 2,221 |
|
| Change in net unrealized (appreciation) depreciation on investments | (207,396 | ) |
| Net realized (gain) loss on investment transactions | (1,498,167 | ) |
| Change in net unrealized (appreciation) depreciation on securities sold short | (190,231 | ) |
| Net realized (gain) loss on securities sold short transactions | 239,627 |
|
| Net cash from (used in) operating activities | (36,560,140 | ) |
| | |
| Cash Flows From (Used In) Financing Activities | |
| Proceeds from shares sold | 52,450,528 |
|
| Payments for shares redeemed | (15,870,613 | ) |
| Distributions paid, net of reinvestments | (19,775 | ) |
| Net cash from (used in) financing activities | 36,560,140 |
|
| | |
| Net Increase (Decrease) In Cash | — |
|
| Cash at beginning of period | — |
|
| Cash at end of period | — |
|
| | |
| Supplemental disclosure of cash flow information: | |
| Non cash financing activities not included herein consist of all reinvestment of distributions of $1,370,230. |
See Notes to Financial Statements.
|
|
| Notes to Financial Statements |
JUNE 30, 2015
1. Organization
American Century Quantitative Equity Funds, Inc. (the corporation) is registered under the Investment Company Act of 1940, as amended (the 1940 Act), as an open-end management investment company and is organized as a Maryland corporation. Disciplined Growth Plus Fund (the fund) is one fund in a series issued by the corporation. The fund is diversified as defined under the 1940 Act. The fund’s investment objective is to seek long-term capital growth.
The fund offers the Investor Class, the Institutional Class, the A Class, the C Class and the R Class. The A Class may incur an initial sales charge. The A Class and C Class may be subject to a contingent deferred sales charge. The share classes differ principally in their respective sales charges and distribution and shareholder servicing expenses and arrangements. The Institutional Class is made available to institutional shareholders or through financial intermediaries whose clients do not require the same level of shareholder and administrative services as shareholders of other classes. As a result, the Institutional Class is charged a lower unified management fee.
2. Significant Accounting Policies
The following is a summary of significant accounting policies consistently followed by the fund in preparation of its financial statements. The fund is an investment company and follows accounting and reporting guidance in accordance with accounting principles generally accepted in the United States of America. This may require management to make certain estimates and assumptions at the date of the financial statements. Actual results could differ from these estimates. Management evaluated the impact of events or transactions occurring through the date the financial statements were issued that would merit recognition or disclosure.
Investment Valuations — The fund determines the fair value of its investments and computes its net asset value per share at the close of regular trading (usually 4 p.m. Eastern time) on the New York Stock Exchange (NYSE) on each day the NYSE is open. The Board of Directors has adopted valuation policies and procedures to guide the investment advisor in the fund’s investment valuation process and to provide methodologies for the oversight of the fund’s pricing function.
Equity securities that are listed or traded on a domestic securities exchange are valued at the last reported sales price or at the official closing price as provided by the exchange. Equity securities traded on foreign securities exchanges are generally valued at the closing price of such securities on the exchange where primarily traded or at the close of the NYSE, if that is earlier. If no last sales price is reported, or if local convention or regulation so provides, the mean of the latest bid and asked prices may be used. Securities traded over-the-counter are valued at the mean of the latest bid and asked prices, the last sales price, or the official closing price.
Fixed income securities maturing within 60 days at the time of purchase may be valued at cost, plus or minus any amortized discount or premium or at the evaluated mean as provided by an independent pricing service. Evaluated mean prices are commonly derived through utilization of market models, which may consider, among other factors: trade data, quotations from dealers and active market makers, relevant yield curve and spread data, related sector levels, creditworthiness, trade data or market information on comparable securities, and other relevant security specific information.
Open-end management investment companies are valued at the reported net asset value per share. Repurchase agreements are valued at cost, which approximates fair value.
If the fund determines that the market price for an investment is not readily available or the valuation methods mentioned above do not reflect an investment’s fair value, such investment is valued as determined in good faith by the Board of Directors or its delegate, in accordance with policies and procedures adopted by the Board of Directors. In its determination of fair value, the fund may review several factors including, but not limited to, market information regarding the specific investment or comparable investments and correlation with other investment types, futures indices or general market indicators. Circumstances that may cause the fund to use these procedures to value an investment include, but are not limited to: an investment has been declared in default or is distressed; trading in a security has been suspended during the trading day or a
security is not actively trading on its principal exchange; prices received from a regular pricing source are deemed unreliable; or there is a foreign market holiday and no trading occurred.
The fund monitors for significant events occurring after the close of an investment’s primary exchange but before the fund’s net asset value per share is determined. Significant events may include, but are not limited to: corporate announcements and transactions; governmental action and political unrest that could impact a specific investment or an investment sector; or armed conflicts, natural disasters and similar events that could affect investments in a specific country or region. The fund also monitors for significant fluctuations between domestic and foreign markets, as evidenced by the U.S. market or such other indicators that the Board of Directors, or its delegate, deems appropriate. If significant fluctuations in foreign markets are identified, the fund may apply a model-derived factor to the closing price of equity securities traded on foreign securities exchanges. The factor is based on observable market data as provided by an independent pricing service.
Security Transactions — Security transactions are accounted for as of the trade date. Net realized gains and losses are determined on the identified cost basis, which is also used for federal income tax purposes.
Investment Income — Dividend income less foreign taxes withheld, if any, is recorded as of the ex-dividend date. Distributions received on securities that represent a return of capital or long-term capital gain are recorded as a reduction of cost of investments and/or as a realized gain. The fund may estimate the components of distributions received that may be considered nontaxable distributions or long-term capital gain distributions for income tax purposes. Interest income is recorded on the accrual basis and includes accretion of discounts and amortization of premiums.
Securities Sold Short — The fund enters into short sales, which is selling securities it does not own, as part of its normal investment activities. Upon selling a security short, the fund will segregate cash, cash equivalents or other appropriate liquid securities in at least an amount equal to the current market value of the securities sold short until the fund replaces the borrowed security. Interest earned on segregated cash for securities sold short is reflected as interest income. The fund is required to pay any dividends or interest due on securities sold short. Such dividends and interest are recorded as an expense. The fund may pay fees or charges to the broker on the assets borrowed for securities sold short. These fees are calculated daily based upon the value of each security sold short and a rate that is dependent on the availability of such security. Liabilities for securities sold short are valued daily and changes in value are recorded as change in net unrealized appreciation (depreciation) on securities sold short. The fund records realized gain (loss) on a security sold short when it is terminated by the fund and includes as a component of net realized gain (loss) on securities sold short transactions.
Repurchase Agreements — The fund may enter into repurchase agreements with institutions that American Century Investment Management, Inc. (ACIM) (the investment advisor) has determined are creditworthy pursuant to criteria adopted by the Board of Directors. The fund requires that the collateral, represented by securities, received in a repurchase transaction be transferred to the custodian in a manner sufficient to enable the fund to obtain those securities in the event of a default under the repurchase agreement. ACIM monitors, on a daily basis, the securities transferred to ensure the value, including accrued interest, of the securities under each repurchase agreement is equal to or greater than amounts owed to the fund under each repurchase agreement.
Joint Trading Account — Pursuant to an Exemptive Order issued by the Securities and Exchange Commission, the fund, along with certain other funds in the American Century Investments family of funds, may transfer uninvested cash balances into a joint trading account. These balances are invested in one or more repurchase agreements that are collateralized by U.S. Treasury or Agency obligations.
Segregated Assets — In accordance with the 1940 Act, the fund segregates assets on its books and records to cover certain types of investments, including, but not limited to, futures contracts and short sales. ACIM monitors, on a daily basis, the securities segregated to ensure the fund designates a sufficient amount of liquid assets, marked-to-market daily. The fund may also receive assets or be required to pledge assets at the custodian bank or with a broker for margin requirements on futures contracts and short sales.
Income Tax Status — It is the fund’s policy to distribute substantially all net investment income and net realized gains to shareholders and to otherwise qualify as a regulated investment company under provisions of the Internal Revenue Code. Accordingly, no provision has been made for income taxes. The fund files U.S. federal, state, local and non-U.S. tax returns as applicable. The fund's tax returns are subject to examination by the relevant taxing authority until expiration of the applicable statute of limitations, which is generally three years from the date of filing but can be longer in certain jurisdictions. At this time, management believes there are no uncertain tax positions which, based on their technical merit, would not be sustained upon examination
and for which it is reasonably possible that the total amounts of unrecognized tax benefits will significantly change in the next twelve months.
Multiple Class — All shares of the fund represent an equal pro rata interest in the net assets of the class to which such shares belong, and have identical voting, dividend, liquidation and other rights and the same terms and conditions, except for class specific expenses and exclusive rights to vote on matters affecting only individual classes. Income, non-class specific expenses, and realized and unrealized capital gains and losses of the fund are allocated to each class of shares based on their relative net assets.
Distributions to Shareholders — Distributions from net investment income, if any, are generally declared and paid semiannually. Distributions from net realized gains, if any, are generally declared and paid annually. The fund may elect to treat a portion of its payment to a redeeming shareholder, which represents the pro rata share of undistributed net investment income and net realized gains, as a distribution for federal income tax purposes (tax equalization).
Indemnifications — Under the corporation’s organizational documents, its officers and directors are indemnified against certain liabilities arising out of the performance of their duties to the fund. In addition, in the normal course of business, the fund enters into contracts that provide general indemnifications. The maximum exposure under these arrangements is unknown as this would involve future claims that may be made against a fund. The risk of material loss from such claims is considered by management to be remote.
Statement of Cash Flows — The Statement of Cash Flows has been prepared using the indirect method which requires net increase (decrease) in net assets resulting from operations to be adjusted to reconcile to net cash from (used in) operating activities. The beginning of period and end of period cash is the amount of domestic and foreign currency included in the fund's Statement of Assets and Liabilities and represents the cash on hand at the custodian bank and does not include any short-term investments or deposits with brokers for securities sold short.
3. Fees and Transactions with Related Parties
Certain officers and directors of the corporation are also officers and/or directors of American Century Companies, Inc. (ACC). The corporation’s investment advisor, ACIM, the corporation's distributor, American Century Investment Services, Inc. (ACIS), and the corporation’s transfer agent, American Century Services, LLC, are wholly owned, directly or indirectly, by ACC.
Management Fees — The corporation has entered into a management agreement with ACIM, under which ACIM provides the fund with investment advisory and management services in exchange for a single, unified management fee (the fee) per class. The agreement provides that all expenses of managing and operating the fund, except distribution and service fees, expenses on securities sold short, brokerage expenses, taxes, interest, fees and expenses of the independent directors (including legal counsel fees), and extraordinary expenses, will be paid by ACIM. The fee is computed and accrued daily based on each class’s daily net assets and paid monthly in arrears. The fee consists of (1) an Investment Category Fee based on the daily net assets of the fund and certain other accounts managed by the investment advisor that are in the same broad investment category as the fund and (2) a Complex Fee based on the assets of all the funds in the American Century Investments family of funds. The rates for the Investment Category Fee range from 1.1180% to 1.3000%. The rates for the Complex Fee range from 0.2500% to 0.3100% for the Investor Class, A Class, C Class and R Class. The rates for the Complex Fee range from 0.0500% to 0.1100% for the Institutional Class. The effective annual management fee for each class for the year ended June 30, 2015 was 1.44% for the Investor Class, A Class, C Class and R Class and 1.24% for the Institutional Class.
Distribution and Service Fees — The Board of Directors has adopted a separate Master Distribution and Individual Shareholder Services Plan for each of the A Class, C Class and R Class (collectively the plans), pursuant to Rule 12b-1 of the 1940 Act. The plans provide that the A Class will pay ACIS an annual distribution and service fee of 0.25%. The plans provide that the C Class will pay ACIS an annual distribution and service fee of 1.00%, of which 0.25% is paid for individual shareholder services and 0.75% is paid for distribution services. The plans provide that the R Class will pay ACIS an annual distribution and service fee of 0.50%. The fees are computed and accrued daily based on each class’s daily net assets and paid monthly in arrears. The fees are used to pay financial intermediaries for distribution and individual shareholder services. Fees incurred under the plans during the year ended June 30, 2015 are detailed in the Statement of Operations.
Directors' Fees and Expenses — The Board of Directors is responsible for overseeing the investment advisor’s management and operations of the fund. The directors receive detailed information about the fund and its investment advisor regularly throughout the year, and meet at least quarterly with management of the investment advisor to review reports about fund operations. The fund’s officers do not receive compensation from the fund.
4. Investment Transactions
Purchases and sales of investment securities and securities sold short, excluding short-term investments, for the year ended June 30, 2015 were $85,150,296 and $48,922,763, respectively.
5. Capital Share Transactions
Transactions in shares of the fund were as follows:
|
| | | | | | | | | | |
| | Year ended
June 30, 2015 | Year ended June 30, 2014 |
| | Shares | Amount | Shares | Amount |
| Investor Class/Shares Authorized | 50,000,000 |
| | 10,000,000 |
| |
| Sold | 2,658,117 |
| $ | 44,752,766 |
| 631,052 |
| $ | 9,140,599 |
|
| Issued in reinvestment of distributions | 73,450 |
| 1,161,766 |
| 23,160 |
| 336,874 |
|
| Redeemed | (802,518 | ) | (13,346,874 | ) | (385,706 | ) | (5,592,567 | ) |
| | 1,929,049 |
| 32,567,658 |
| 268,506 |
| 3,884,906 |
|
| Institutional Class/Shares Authorized | 30,000,000 |
| | 10,000,000 |
| |
| Sold | 60,759 |
| 1,028,313 |
| 222 |
| 2,976 |
|
| Issued in reinvestment of distributions | 1,922 |
| 30,486 |
| 939 |
| 13,688 |
|
| Redeemed | (32,548 | ) | (561,840 | ) | (44 | ) | (700 | ) |
| | 30,133 |
| 496,959 |
| 1,117 |
| 15,964 |
|
| A Class/Shares Authorized | 20,000,000 |
| | 10,000,000 |
| |
| Sold | 330,337 |
| 5,529,284 |
| 25,900 |
| 379,280 |
|
| Issued in reinvestment of distributions | 6,568 |
| 103,386 |
| 1,752 |
| 25,398 |
|
| Redeemed | (48,590 | ) | (822,100 | ) | (998 | ) | (14,611 | ) |
| | 288,315 |
| 4,810,570 |
| 26,654 |
| 390,067 |
|
| C Class/Shares Authorized | 15,000,000 |
| | 10,000,000 |
| |
| Sold | 69,160 |
| 1,141,909 |
| 5,530 |
| 78,582 |
|
| Issued in reinvestment of distributions | 2,866 |
| 44,166 |
| 1,127 |
| 16,154 |
|
| Redeemed | (35,817 | ) | (594,138 | ) | (47 | ) | (697 | ) |
| | 36,209 |
| 591,937 |
| 6,610 |
| 94,039 |
|
| R Class/Shares Authorized | 15,000,000 |
| | 10,000,000 |
| |
| Sold | 736 |
| 12,148 |
| 1,528 |
| 21,908 |
|
| Issued in reinvestment of distributions | 1,943 |
| 30,426 |
| 886 |
| 12,826 |
|
| Redeemed | (32,725 | ) | (558,612 | ) | (12 | ) | (187 | ) |
| | (30,046 | ) | (516,038 | ) | 2,402 |
| 34,547 |
|
| Net increase (decrease) | 2,253,660 |
| $ | 37,951,086 |
| 305,289 |
| $ | 4,419,523 |
|
6. Fair Value Measurements
The fund’s investments valuation process is based on several considerations and may use multiple inputs to determine the fair value of the investments held by the fund. In conformity with accounting principles generally accepted in the United States of America, the inputs used to determine a valuation are classified into three broad levels.
| |
| • | Level 1 valuation inputs consist of unadjusted quoted prices in an active market for identical investments. |
| |
| • | Level 2 valuation inputs consist of direct or indirect observable market data (including quoted prices for comparable investments, evaluations of subsequent market events, interest rates, prepayment speeds, credit risk, etc.). These inputs also consist of quoted prices for identical investments initially expressed in local currencies that are adjusted through translation into U.S. dollars. |
| |
| • | Level 3 valuation inputs consist of unobservable data (including a fund’s own assumptions). |
The level classification is based on the lowest level input that is significant to the fair valuation measurement. The valuation inputs are not necessarily an indication of the risks associated with investing in these securities or other financial instruments. There were no significant transfers between levels during the period.
The following is a summary of the level classifications as of period end. The Schedule of Investments provides additional information on the fund’s portfolio holdings.
|
| | | | | | | | |
| | Level 1 | Level 2 | Level 3 |
| Assets |
| Investment Securities |
| Common Stocks | $ | 71,902,079 |
| — |
| — |
|
| Temporary Cash Investments | 188,305 |
| $ | 945,049 |
| — |
|
| | $ | 72,090,384 |
| $ | 945,049 |
| — |
|
| | | | |
| Liabilities |
| Securities Sold Short |
| Common Stocks | $ | (16,389,297 | ) | — |
| — |
|
7. Risk Factors
The fund is subject to short sales risk. If the market price of a security increases after the fund borrows the security, the fund may suffer a loss when it replaces the borrowed security at the higher price. Any loss will be increased by the amount of compensation, interest or dividends, and transaction costs the fund must pay to the lender of the borrowed security.
The fund's investment strategy utilizes leverage, which can increase market exposure and subject the fund to greater risk and higher volatility.
If the fund is overweighted in a stock or sector, any negative development related to that stock or sector will have a greater impact on the fund than other funds that are not overweighted in that stock or sector.
The fund’s investment process may result in high portfolio turnover, which could mean high transaction costs, affecting both performance and capital gains tax liabilities to investors.
8. Federal Tax Information
The tax character of distributions paid during the years ended June 30, 2015 and June 30, 2014 were as follows:
|
| | | | | | |
| | 2015 | 2014 |
| Distributions Paid From | | |
| Ordinary income | $ | 160,700 |
| $ | 84,724 |
|
| Long-term capital gains | $ | 1,229,305 |
| $ | 325,078 |
|
The book-basis character of distributions made during the year from net investment income or net realized gains may differ from their ultimate characterization for federal income tax purposes. These differences reflect the differing character of certain income items and net realized gains and losses for financial statement and tax purposes, and may result in reclassification among certain capital accounts on the financial statements.
As of June 30, 2015, the federal tax cost of investments and the components of distributable earnings on a tax-basis were as follows:
|
| | | |
| Federal tax cost of investments | $ | 68,919,356 |
|
| Gross tax appreciation of investments | $ | 6,036,390 |
|
| Gross tax depreciation of investments | (1,920,313 | ) |
| Net tax appreciation (depreciation) of investments | 4,116,077 |
|
| Net tax appreciation (depreciation) on securities sold short | (383,808 | ) |
| Net tax appreciation (depreciation) | $ | 3,732,269 |
|
| Undistributed ordinary income | $ | 5,940 |
|
| Accumulated long-term gains | $ | 848,672 |
|
The difference between book-basis and tax-basis unrealized appreciation (depreciation) is attributable primarily to deferral of losses on unsettled short positions.
|
| | | | | | | | | | | | | | | | |
| For a Share Outstanding Throughout the Years Ended June 30 (except as noted) |
| Per-Share Data | Ratios and Supplemental Data |
| | | Income From Investment Operations: | Distributions From: | | | Ratio to Average Net Assets of: | | |
| | Net Asset Value, Beginning of Period | Net Investment Income (Loss)(1) | Net Realized and Unrealized Gain (Loss) | Total From Investment Operations | Net Investment Income | Net Realized Gains | Total Distributions | Net Asset Value, End of Period | Total Return(2) | Operating Expenses | Operating Expenses (excluding expenses on securities sold short) | Net Investment Income (Loss) | Portfolio Turnover Rate | Net Assets, End of Period (in thousands) |
| Investor Class |
| 2015 | $16.02 | 0.04 | 1.54 | 1.58 | (0.01) | (0.92) | (0.93) | $16.67 | 10.22% | 1.80% | 1.45% | 0.22% | 115% |
| $47,976 |
|
| 2014 | $12.65 | 0.03 | 3.76 | 3.79 | (0.01) | (0.41) | (0.42) | $16.02 | 30.29% | 1.81% | 1.46% | 0.17% | 96% |
| $15,188 |
|
| 2013 | $10.86 | 0.04 | 1.81 | 1.85 | (0.06) | — | (0.06) | $12.65 | 17.15% | 1.87% | 1.46% | 0.42% | 100% |
| $8,597 |
|
2012(3) | $10.00 | (0.03) | 0.90 | 0.87 | (0.01) | — | (0.01) | $10.86 | 8.73% | 2.48%(4) | 1.47%(4) | (0.38)%(4) | 89% |
| $2,249 |
|
| Institutional Class |
| 2015 | $16.03 | 0.06 | 1.57 | 1.63 | (0.05) | (0.92) | (0.97) | $16.69 | 10.49% | 1.60% | 1.25% | 0.42% | 115% |
| $1,027 |
|
| 2014 | $12.66 | 0.05 | 3.77 | 3.82 | (0.04) | (0.41) | (0.45) | $16.03 | 30.52% | 1.61% | 1.26% | 0.37% | 96% |
| $503 |
|
| 2013 | $10.87 | 0.09 | 1.79 | 1.88 | (0.09) | — | (0.09) | $12.66 | 17.37% | 1.67% | 1.26% | 0.62% | 100% |
| $383 |
|
2012(3) | $10.00 | (0.01) | 0.90 | 0.89 | (0.02) | — | (0.02) | $10.87 | 8.87% | 2.28%(4) | 1.27%(4) | (0.18)%(4) | 89% |
| $327 |
|
| A Class |
| 2015 | $15.97 | (0.01) | 1.55 | 1.54 | — | (0.92) | (0.92) | $16.59 | 9.97% | 2.05% | 1.70% | (0.03)% | 115% |
| $6,083 |
|
| 2014 | $12.63 | (0.01) | 3.76 | 3.75 | — | (0.41) | (0.41) | $15.97 | 29.99% | 2.06% | 1.71% | (0.08)% | 96% |
| $1,252 |
|
| 2013 | $10.85 | 0.04 | 1.78 | 1.82 | (0.04) | — | (0.04) | $12.63 | 16.79% | 2.12% | 1.71% | 0.17% | 100% |
| $654 |
|
2012(3) | $10.00 | (0.05) | 0.91 | 0.86 | (0.01) | — | (0.01) | $10.85 | 8.59% | 2.73%(4) | 1.72%(4) | (0.63)%(4) | 89% |
| $567 |
|
|
| | | | | | | | | | | | | | | | |
| For a Share Outstanding Throughout the Years Ended June 30 (except as noted) |
| Per-Share Data | Ratios and Supplemental Data |
| | | Income From Investment Operations: | Distributions From: | | | Ratio to Average Net Assets of: | | |
| | Net Asset Value, Beginning of Period | Net Investment Income (Loss)(1) | Net Realized and Unrealized Gain (Loss) | Total From Investment Operations | Net Investment Income | Net Realized Gains | Total Distributions | Net Asset Value, End of Period | Total Return(2) | Operating Expenses | Operating Expenses (excluding expenses on securities sold short) | Net Investment Income (Loss) | Portfolio Turnover Rate | Net Assets, End of Period (in thousands) |
| C Class |
| 2015 | $15.71 | (0.13) | 1.52 | 1.39 | — | (0.92) | (0.92) | $16.18 | 9.16% | 2.80% | 2.45% | (0.78)% | 115% |
| $1,306 |
|
| 2014 | $12.53 | (0.12) | 3.71 | 3.59 | — | (0.41) | (0.41) | $15.71 | 28.94% | 2.81% | 2.46% | (0.83)% | 96% |
| $699 |
|
| 2013 | $10.80 | (0.05) | 1.78 | 1.73 | — | — | — | $12.53 | 16.02% | 2.87% | 2.46% | (0.58)% | 100% |
| $475 |
|
2012(3) | $10.00 | (0.09) | 0.89 | 0.80 | — | — | — | $10.80 | 8.00% | 3.48%(4) | 2.47%(4) | (1.38)%(4) | 89% |
| $332 |
|
| R Class |
| 2015 | $15.91 | (0.04) | 1.53 | 1.49 | — | (0.92) | (0.92) | $16.48 | 9.69% | 2.30% | 1.95% | (0.28)% | 115% |
| $44 |
|
| 2014 | $12.62 | (0.05) | 3.75 | 3.70 | — | (0.41) | (0.41) | $15.91 | 29.61% | 2.31% | 1.96% | (0.33)% | 96% |
| $521 |
|
| 2013 | $10.83 | 0.01 | 1.79 | 1.80 | (0.01) | — | (0.01) | $12.62 | 16.62% | 2.37% | 1.96% | (0.08)% | 100% |
| $382 |
|
2012(3) | $10.00 | (0.06) | 0.89 | 0.83 | —(5) | — | —(5) | $10.83 | 8.34% | 2.98%(4) | 1.97%(4) | (0.88)%(4) | 89% |
| $326 |
|
|
|
| Notes to Financial Highlights |
| |
| (1) | Computed using average shares outstanding throughout the period. |
| |
| (2) | Total returns are calculated based on the net asset value of the last business day and do not reflect applicable sales charges, if any. Total returns for periods less than one year are not annualized. |
| |
| (3) | October 31, 2011 (fund inception) through June 30, 2012. |
| |
| (5) | Per-share amount was less than $0.005. |
See Notes to Financial Statements.
|
|
| Report of Independent Registered Public Accounting Firm |
To the Directors of the American Century Quantitative Equity Funds, Inc. and Shareholders of the Disciplined Growth Plus Fund:
In our opinion, the accompanying statement of assets and liabilities, including the schedule of investments, and the related statements of operations, of changes in net assets and of cash flows and the financial highlights present fairly, in all material respects, the financial position of the Disciplined Growth Plus Fund (one of the sixteen funds comprising the American Century Quantitative Equity Funds, Inc., hereafter referred to as the “Fund”) at June 30, 2015, the results of its operations and its cash flows for the year then ended, the changes in its net assets for each of the two years in the period then ended and the financial highlights for each of the periods presented, in conformity with accounting principles generally accepted in the United States of America. These financial statements and financial highlights (hereafter referred to as "financial statements") are the responsibility of the Fund's management. Our responsibility is to express an opinion on these financial statements based on our audits. We conducted our audits of these financial statements in accordance with the standards of the Public Company Accounting Oversight Board (United States). Those standards require that we plan and perform the audit to obtain reasonable assurance about whether the financial statements are free of material misstatement. An audit includes examining, on a test basis, evidence supporting the amounts and disclosures in the financial statements, assessing the accounting principles used and significant estimates made by management, and evaluating the overall financial statement presentation. We believe that our audits, which included confirmation of securities at June 30, 2015 by correspondence with the custodian and brokers, provide a reasonable basis for our opinion.
PricewaterhouseCoopers LLP
Kansas City, Missouri
August 21, 2015
Board of Directors
The individuals listed below serve as directors of the funds. Each director will continue to serve in this capacity until death, retirement, resignation or removal from office. The board has adopted a mandatory retirement age for directors who are not “interested persons,” as that term is defined in the Investment Company Act (independent directors). Independent directors shall retire on December 31 of the year in which they reach their 75th birthday; provided, however, that on or after January 1, 2022, independent directors shall retire on December 31 of the year in which they reach their 76th birthday.
Mr. Thomas is an “interested person” because he currently serves as President and Chief Executive Officer of American Century Companies, Inc. (ACC), the parent company of American Century Investment Management, Inc. (ACIM or the advisor). The other directors (more than three-fourths of the total number) are independent. They are not employees, directors or officers of, and have no financial interest in, ACC or any of its wholly owned, direct or indirect, subsidiaries, including ACIM, American Century Investment Services, Inc. (ACIS) and American Century Services, LLC (ACS), and they do not have any other affiliations, positions or relationships that would cause them to be considered “interested persons” under the Investment Company Act. The directors serve in this capacity for eight (in the case of Mr. Thomas, 15) registered investment companies in the American Century Investments family of funds.
The following table presents additional information about the directors. The mailing address for each director other than Mr. Thomas is 1665 Charleston Road, Mountain View, California 94043. The mailing address for Mr. Thomas is 4500 Main Street, Kansas City, Missouri 64111.
|
| | | | | |
Name (Year of Birth) | Position(s) Held with Funds | Length of Time Served | Principal Occupation(s) During Past 5 Years | Number of American Century Portfolios Overseen by Director | Other Directorships Held During Past 5 Years |
Independent Directors | | |
Tanya S. Beder
(1955) | Director | Since 2011 | Chairman and CEO, SBCC Group Inc. (independent advisory services) (2006 to present) | 46 | CYS Investments, Inc. (NYSE mortgage arbitrage REIT) |
Jeremy I. Bulow
(1954) | Director | Since 2011 | Professor of Economics, Stanford University, Graduate School of Business (1979 to present) | 46 | None |
Ronald J. Gilson
(1946) | Director and Chairman of the Board | Since 1995
(Chairman since 2005) | Charles J. Meyers Professor of Law and Business, Stanford Law School (1979 to present); Marc and Eva Stern Professor of Law and Business, Columbia University School of Law (1992 to present) | 46 | None |
Frederick L. A. Grauer
(1946) | Director | Since 2008 | Senior Advisor, BlackRock, Inc. (investment management firm) (2010 to 2011, 2013 to present) | 46 | None |
Peter F. Pervere
(1947) | Director | Since 2007 | Retired | 46 | None |
|
| | | | | |
Name (Year of Birth) | Position(s) Held with Funds | Length of Time Served | Principal Occupation(s) During Past 5 Years | Number of American Century Portfolios Overseen by Director | Other Directorships Held During Past 5 Years |
| Independent Directors | | |
John B. Shoven
(1947) | Director | Since 2002 | Professor of Economics, Stanford University (1973 to present) | 46 | Cadence Design Systems; Exponent; Financial Engines |
| Interested Director | | |
Jonathan S. Thomas
(1963) | Director and President | Since 2007 | President and Chief Executive Officer, ACC (March 2007 to present). Also serves as Chief Executive Officer, ACS; Executive Vice President, ACIM; Director, ACC, ACIM and other ACC subsidiaries | 124 | BioMed Valley Discoveries, Inc. |
The Statement of Additional Information has additional information about the fund's directors and is available without charge, upon request, by calling 1-800-345-2021.
Officers
The following table presents certain information about the executive officers of the funds. Each officer serves as an officer for each of the 15 investment companies in the American Century family of funds, unless otherwise noted. No officer is compensated for his or her service as an officer of the funds. The listed officers are interested persons of the funds and are appointed or re-appointed on an annual basis. The mailing address for each of the officers listed below is 4500 Main Street, Kansas City, Missouri 64111.
|
| | |
Name (Year of Birth) | Offices with
the Funds | Principal Occupation(s) During the Past Five Years |
Jonathan S.
Thomas
(1963) | Director and President
since 2007 | President and Chief Executive Officer, ACC (March 2007 to present). Also serves as Chief Executive Officer, ACS; Executive Vice President, ACIM; Director, ACC, ACIM and other ACC subsidiaries |
Amy D. Shelton
(1964) | Chief Compliance Officer and Vice President since 2014 | Chief Compliance Officer, American Century funds, (March 2014 to present); Chief Compliance Officer, ACIM (February 2014 to present); Chief Compliance Officer, ACIS (October 2009 to present); Vice President, Client Interactions and Marketing, ACIS (February 2013 to January 2014); Director, Client Interactions and Marketing, ACIS (June 2007 to January 2013). Also serves as Vice President, ACIS |
Charles A. Etherington
(1957) | General Counsel since 2007 and Senior Vice President since 2006 | Attorney, ACC (February 1994 to present); Vice President, ACC (November 2005 to present); General Counsel, ACC (March 2007 to present). Also serves as General Counsel, ACIM, ACS, ACIS and other ACC subsidiaries; and Senior Vice President, ACIM and ACS |
C. Jean Wade
(1964) | Vice President,
Treasurer and
Chief Financial
Officer since 2012 | Vice President, ACS (February 2000 to present) |
Robert J. Leach
(1966) | Vice President
since 2006 and
Assistant Treasurer
since 2012 | Vice President, ACS (February 2000 to present) |
David H. Reinmiller
(1963) | Vice President since 2001 | Attorney, ACC (January 1994 to present); Associate General Counsel, ACC (January 2001 to present). Also serves as Vice President, ACIM and ACS |
Ward D. Stauffer
(1960) | Secretary since 2005 | Attorney, ACC (June 2003 to present) |
|
|
| Approval of Management Agreement |
At a meeting held on June 16, 2015, the Fund’s Board of Directors unanimously approved the renewal of the management agreement pursuant to which American Century Investment Management, Inc. (the “Advisor”) acts as the investment advisor for the Fund. Under Section 15(c) of the Investment Company Act, contracts for investment advisory services are required to be reviewed, evaluated, and approved by a majority of a fund’s directors/trustees, including a majority of the independent Directors, each year. The Board regards this annual evaluation and renewal as one of its most important responsibilities.
The independent Directors have memorialized a statement regarding the relationship between their ongoing obligations to oversee and evaluate the performance of the Advisor and their annual consideration of renewal of the management agreement. In that statement, the independent Directors noted that their assessment of the Advisor’s performance is an ongoing process that takes place over the entire year and is informed by all of the extensive information that the Board and its committees receive and consider over time. This information, together with the materials provided in connection with the review, are central to the Board’s assessment of the Advisor’s performance and its determination whether to renew the Fund’s management agreement.
Prior to its consideration of the renewal of the management agreement, the Board requested and reviewed extensive data and analysis relating to the proposed renewal. This information and analysis was compiled by the Advisor and certain independent providers of evaluation data concerning the Fund and the services provided to the Fund by the Advisor.
In connection with its consideration of the renewal of the management agreement, the Board’s review and evaluation of the services provided by the Advisor included, but was not limited to, the following:
| |
| • | the nature, extent, and quality of investment management, shareholder services, and other services provided by the Advisor to the Fund; |
| |
| • | the wide range of other programs and services the Advisor provides to the Fund and its shareholders on a routine and non-routine basis; |
| |
| • | the investment performance of the Fund, including data comparing the Fund’s performance to appropriate benchmarks and/or a peer group of other mutual funds with similar investment objectives and strategies; |
| |
| • | the cost of owning the Fund compared to the cost of owning similar funds; |
| |
| • | the Advisor’s compliance policies, procedures, and regulatory experience; |
| |
| • | financial data showing the cost of services provided to the Fund, the profitability of the Fund to the Advisor, and the overall profitability of the Advisor; |
| |
| • | possible economies of scale associated with the Advisor’s management of the Fund and other accounts under its management; |
| |
| • | data comparing services provided and charges to other investment management clients of the Advisor; |
| |
| • | acquired fund fees and expenses; |
| |
| • | payments by the Fund and the Advisor to financial intermediaries whose clients are investors in the Fund; and |
| |
| • | any collateral benefits derived by the Advisor from the management of the Fund. |
In keeping with its practice, the Board held two in-person meetings to review and discuss the information provided in response to their request. The independent Directors also had the benefit of the advice of their independent counsel throughout the process.
Factors Considered
The Directors considered all of the information provided by the Advisor, the independent data providers, and the independent Directors’ independent counsel in connection with the review, and evaluated such information for the Fund. In connection with their review, the Directors did not identify any single factor as being all-important or controlling and each Director may have attributed different levels of importance to different factors. In deciding to renew the management agreement, the Board based its decision on a number of factors, including the following:
Nature, Extent and Quality of Services - Generally. Under the management agreement, the Advisor is responsible for providing or arranging for all services necessary for the operation of the Fund. The Board noted that under the management agreement, the Advisor provides or arranges at its own expense a wide variety of services including:
| |
| • | constructing and designing the Fund |
| |
| • | portfolio research and security selection |
| |
| • | initial capitalization/funding |
| |
| • | daily valuation of the Fund’s portfolio |
| |
| • | shareholder servicing and transfer agency, including shareholder confirmations, recordkeeping, and communications |
| |
| • | legal services (except the independent Directors’ counsel) |
| |
| • | regulatory and portfolio compliance |
| |
| • | marketing and distribution (except amounts paid by the Fund under Rule 12b-1 plans) |
The Board noted that many of these services have expanded over time both in terms of quantity and complexity in response to shareholder demands, competition in the industry, changing distribution channels, and the changing regulatory environment.
Investment Management, Shareholder, and Other Services. The nature of the investment management services provided to the Fund is quite complex and allows Fund shareholders access to professional money management, instant diversification of their investments within an asset class, the opportunity to easily diversify among asset classes by investing in or exchanging among various American Century Investments funds, and liquidity. In evaluating investment performance, the Board expects the Advisor to manage the Fund in accordance with its investment objectives and approved strategies. Further, the Directors recognize that the Advisor has an obligation to seek the best execution of fund trades. In providing these services, the Advisor utilizes teams of investment professionals (portfolio managers, analysts, research assistants, and securities traders) who require extensive information technology, research, training, compliance, and other systems to conduct their business. The Board, directly and through its Portfolio Committee, regularly reviews investment performance information for the Fund, together with comparative information for appropriate benchmarks and/or peer groups of similarly-managed funds, over different time horizons. The Directors also review detailed performance information during the management agreement approval process. If performance concerns are identified, the Fund receives special reviews until performance improves, during which the Board discusses with the Advisor the reasons for such results (e.g., market conditions, security selection) and any efforts being undertaken to improve performance. The Fund’s performance was above its benchmark for the one- and three- year periods reviewed by the Board. The Board found the investment management services provided by the Advisor to the Fund to be satisfactory and consistent with the management agreement.
Under the management agreement, the Advisor provides the Fund with a comprehensive package of transfer agency, shareholder, and other services. The Board, directly and through various committees of the Board, regularly reviews reports and evaluations of such services at its regular
meetings. These reports include, but are not limited to, information regarding the operational efficiency and accuracy of the shareholder and transfer agency services provided, staffing levels, shareholder satisfaction (as measured by external as well as internal sources), technology support, new products and services offered to Fund shareholders, securities trading activities, portfolio valuation services, auditing services, and legal and operational compliance activities.
Certain aspects of shareholder and transfer agency service level efficiency and the quality of securities trading activities are measured by independent third party providers and are presented in comparison to other fund groups not managed by the Advisor. The Board found the services provided by the Advisor to the Fund under the management agreement to be competitive and of high quality.
Costs of Services and Profitability. The Advisor provides detailed information concerning its cost of providing various services to the Fund, its profitability in managing the Fund, its overall profitability, and its financial condition. The Directors have reviewed with the Advisor the methodology used to prepare this financial information. This information is considered in evaluating the Advisor’s financial condition, its ability to continue to provide services under the management agreement, and the reasonableness of the current management fee. The Board concluded that the Advisor’s profits were reasonable in light of the services provided to the Fund.
Ethics. The Board generally considers the Advisor’s commitment to providing quality services to shareholders and to conducting its business ethically. They noted that the Advisor’s practices generally meet or exceed industry best practices.
Economies of Scale. The Board also reviewed information provided by the Advisor regarding the possible existence of economies of scale in connection with the management of the Fund. The Board concluded that economies of scale are difficult to measure and predict with precision, especially on a fund-by-fund basis. The Board concluded that the Advisor is appropriately sharing economies of scale through its competitive fee structure, offering competitive fees from fund inception, and through reinvestment in its business to provide shareholders enhanced and expanded services.
Comparison to Other Funds’ Fees. The management agreement provides that the Fund pays the Advisor a single, all-inclusive (or unified) management fee for providing all services necessary for the management and operation of the Fund, other than brokerage expenses, taxes, interest, extraordinary expenses, the fees and expenses of the Fund’s independent Directors (including their independent legal counsel), and expenses incurred in connection with the provision of shareholder services and distribution services under a plan adopted pursuant to Rule 12b-1 under the 1940 Act. Under the unified fee structure, the Advisor is responsible for providing all investment advisory, custody, audit, administrative, compliance, recordkeeping, marketing, and shareholder services, or arranging and supervising third parties to provide such services. By contrast, most other funds are charged a variety of fees, including an investment advisory fee, a transfer agency fee, an administrative fee, distribution charges, and other expenses. Other than their investment advisory fees and any applicable Rule 12b-1 fees, all other components of the total fees charged by these other funds may be increased without shareholder approval. The Board believes the unified fee structure is a benefit to Fund shareholders because it clearly discloses to shareholders the cost of owning Fund shares, and, since the unified fee cannot be increased without a vote of Fund shareholders, it shifts to the Advisor the risk of increased costs of operating the Fund and provides a direct incentive to minimize administrative inefficiencies. Part of the Board’s analysis of fee levels involves reviewing certain evaluative data compiled by an independent provider and comparing the Fund’s unified fee to the total expense ratio of peer funds. The unified fee charged to shareholders of the Fund was below the median of the total expense ratios of the Fund’s peer group. The Board concluded that the management fee paid by the Fund to the Advisor under the management agreement is reasonable in light of the services provided to the Fund.
Comparison to Fees and Services Provided to Other Clients of the Advisor. The Board also requested and received information from the Advisor concerning the nature of the services, fees, costs, and profitability of its advisory services to advisory clients other than the Fund. They observed that these varying types of client accounts require different services and involve different regulatory and entrepreneurial risks than the management of the Fund. The Board analyzed this information and concluded that the fees charged and services provided to the Fund were reasonable by comparison.
Payments to Intermediaries. The Directors also requested and received a description of payments made to intermediaries by the Fund and the Advisor. These payments include various payments made by the Fund or the Advisor to different types of intermediaries and recordkeepers for distribution and service activities provided for the Fund.
Collateral or “Fall-Out” Benefits Derived by the Advisor. The Board considered the existence of collateral benefits the Advisor may receive as a result of its relationship with the Fund. The Board noted that the Advisor’s primary business is managing mutual funds and it generally does not use fund or shareholder information to generate profits in other lines of business, and therefore does not derive any significant collateral benefits from them. The Board noted that the Advisor receives proprietary research from broker-dealers that execute fund portfolio transactions. The Board also determined that the Advisor is able to provide investment management services to certain clients other than the Fund, at least in part, due to its existing infrastructure built to serve the fund complex.
Existing Relationship. The Board also considered whether there was any reason for not continuing the existing arrangement with the Advisor. In this regard, the Board was mindful of the potential disruptions of the Fund’s operations and various risks, uncertainties, and other effects that could occur as a result of a decision not to continue such relationship. In particular, the Board recognized that most shareholders have invested in the Fund on the strength of the Advisor’s industry standing and reputation and in the expectation that the Advisor will have a continuing role in providing advisory services to the Fund.
Conclusion of the Directors. As a result of this process, the Board, including all of the independent Directors and assisted by the advice of independent legal counsel, taking into account all of the factors discussed above and the information provided by the Advisor and others in connection with its review and throughout the year, concluded that the management agreement between the Fund and the Advisor is fair and reasonable in light of the services provided and should be renewed.
Retirement Account Information
As required by law, distributions you receive from certain IRAs are subject to federal income tax withholding, unless you elect not to have withholding apply. Tax will be withheld on the total amount withdrawn even though you may be receiving amounts that are not subject to withholding, such as nondeductible contributions. In such case, excess amounts of withholding could occur. You may adjust your withholding election so that a greater or lesser amount will be withheld.
If you don’t want us to withhold on this amount, you must notify us to not withhold the federal income tax. You may notify us in writing or in certain situations by telephone or through other electronic means. For systematic withdrawals, your withholding election will remain in effect until revoked or changed by filing a new election. You have the right to revoke your election at any time.
Remember, even if you elect not to have income tax withheld, you are liable for paying income tax on the taxable portion of your withdrawal. If you elect not to have income tax withheld or you don’t have enough income tax withheld, you may be responsible for payment of estimated tax. You may incur penalties under the estimated tax rules if your withholding and estimated tax payments are not sufficient. You can reduce or defer the income tax on a distribution by directly or indirectly rolling such distribution over to another IRA or eligible plan. You should consult your tax advisor for additional information.
State tax will be withheld if, at the time of your distribution, your address is within one of the mandatory withholding states and you have federal income tax withheld (or as otherwise required by state law). State taxes will be withheld from your distribution in accordance with the respective state rules.
Distributions you receive from 403(b), 457 and qualified plans are subject to special tax and withholding rules. Your plan administrator or plan sponsor is required to provide you with a special tax notice explaining those rules at the time you request a distribution. If applicable, federal and/or state taxes may be withheld from your distribution amount.
Proxy Voting Policies
Descriptions of the principles and policies that the fund's investment advisor uses in exercising the voting rights associated with the securities purchased and/or held by the fund are available without charge, upon request, by calling 1-800-345-2021 or visiting the "About Us" page of American Century Investments’ website at americancentury.com. A description of the policies is also available on the Securities and Exchange Commission’s website at sec.gov. Information regarding how the investment advisor voted proxies relating to portfolio securities during the most recent 12-month period ended June 30 is available on the "About Us" page at americancentury.com. It is also available at sec.gov.
Quarterly Portfolio Disclosure
The fund files its complete schedule of portfolio holdings with the Securities and Exchange Commission (SEC) for the first and third quarters of each fiscal year on Form N-Q. The fund’s Forms N-Q are available on the SEC’s website at sec.gov, and may be reviewed and copied at the SEC’s Public Reference Room in Washington, DC. Information on the operation of the Public Reference Room may be obtained by calling 1-800-SEC-0330. The fund also makes its complete schedule of portfolio holdings for the most recent quarter of its fiscal year available on its website at americancentury.com and, upon request, by calling 1-800-345-2021.
Other Tax Information
The following information is provided pursuant to provisions of the Internal Revenue Code.
The fund hereby designates up to the maximum amount allowable as qualified dividend income for the fiscal year ended June 30, 2015.
For corporate taxpayers, the fund hereby designates $160,700, or up to the maximum amount allowable, of ordinary income distributions paid during the fiscal year ended June 30, 2015 as qualified for the corporate dividends received deduction.
The fund hereby designates $118,494 as qualified short-term capital gain distributions for purposes of Internal Revenue Code Section 871 for the fiscal year ended June 30, 2015.
The fund hereby designates $1,434,712, or up to the maximum amount allowable, as long-term capital gain distributions for the fiscal year ended June 30, 2015.
The fund utilized earnings and profits of $210,626 distributed to shareholders on redemption of shares as part of the dividends paid deduction (tax equalization).
|
| | |
| |
| | | |
| Contact Us | americancentury.com | |
| Automated Information Line | 1-800-345-8765 | |
| Investor Services Representative | 1-800-345-2021
or 816-531-5575 | |
| Investors Using Advisors | 1-800-378-9878 | |
Business, Not-For-Profit, Employer-Sponsored
Retirement Plans | 1-800-345-3533 | |
Banks and Trust Companies, Broker-Dealers,
Financial Professionals, Insurance Companies | 1-800-345-6488 | |
| Telecommunications Relay Service for the Deaf | 711 | |
| | | |
| American Century Quantitative Equity Funds, Inc. | |
| | | |
Investment Advisor: American Century Investment Management, Inc. Kansas City, Missouri | |
| | | |
| This report and the statements it contains are submitted for the general information of our shareholders. The report is not authorized for distribution to prospective investors unless preceded or accompanied by an effective prospectus. | |
| | | |
©2015 American Century Proprietary Holdings, Inc. All rights reserved.
CL-ANN-86510 1508 | |
|
| |
| ANNUAL REPORT | JUNE 30, 2015 |
Emerging Markets Value Fund
|
| | |
| President's Letter | 2 |
|
| Performance | 3 |
|
| Portfolio Commentary | |
|
| Fund Characteristics | |
|
| Shareholder Fee Example | |
|
| Schedule of Investments | |
|
| Statement of Assets and Liabilities | |
|
| Statement of Operations | |
|
| Statement of Changes in Net Assets | |
|
| Notes to Financial Statements | |
|
| Financial Highlights | |
|
| Report of Independent Registered Public Accounting Firm | |
|
| Management | |
|
| Approval of Management Agreement | |
|
| Additional Information | |
|
Any opinions expressed in this report reflect those of the author as of the date of the report, and do not necessarily represent the opinions of American Century Investments® or any other person in the American Century Investments organization. Any such opinions are subject to change at any time based upon market or other conditions and American Century Investments disclaims any responsibility to update such opinions. These opinions may not be relied upon as investment advice and, because investment decisions made by American Century Investments funds are based on numerous factors, may not be relied upon as an indication of trading intent on behalf of any American Century Investments fund. Security examples are used for representational purposes only and are not intended as recommendations to purchase or sell securities. Performance information for comparative indices and securities is provided to American Century Investments by third party vendors. To the best of American Century Investments’ knowledge, such information is accurate at the time of printing.
|
| |
| Dear Investor:
Thank you for reviewing this annual report for the 12 months ended June 30, 2015. It provides investment performance and portfolio information for the reporting period, plus longer-term historical performance data.
Annual reports remain important vehicles for conveying information about fund returns, including market and economic factors that affected performance during the reporting period. For additional, updated investment and market insights, we encourage you to visit our website, americancentury.com. |
| Jonathan Thomas |
Global Divergence Favored U.S. Assets
“Global divergence” between the U.S. and the rest of the world emerged as a prevalent theme during the reporting period. This theme embraced not only the relatively stronger economic growth enjoyed by the U.S. compared with most of the world, but also the related contrast between the U.S. Federal Reserve’s unwinding of monetary stimulus compared with the continuation and expansion of stimulus by other major central banks. Low inflation also prevailed, after crude oil prices plunged over 40% amid muted demand for commodities in general. In this environment, the U.S. dollar, U.S. growth stocks, and longer-maturity U.S. Treasuries generally benefited from “flight to quality” capital flows, reinforced by geopolitical and financial turmoil, particularly in Greece, Russia/Ukraine, China, and the Middle East.
Strong global capital flows into U.S. assets generated a global divergence between investment returns for U.S. and non-U.S. markets, especially for U.S. investors who realized their returns in dollar terms. For the reporting period, the U.S. Dollar Index, the S&P 500 Index, and the Barclays U.S. Aggregate Bond Index returned 19.74%, 7.42%, and 1.86%, respectively. By contrast, the MSCI EAFE Index, the MSCI Emerging Markets Index, and the Barclays Global Aggregate Bond ex-USD (Unhedged) Index returned -4.22%, -5.12%, and -13.19%, respectively, for U.S. investors unhedged for the strong dollar’s impact on non-dollar-denominated returns.
We expect more monetary policy divergence between the U.S. and other major developed economies in the coming months, accompanied by continued market volatility. This could present both challenges and opportunities for active investment managers. Upward pressures on inflation and interest rates could develop as the massive amount of global monetary stimulus in progress takes hold and economies improve. In this environment, we continue to believe in a disciplined, diversified, long-term investment approach, using professionally managed stock and bond portfolios to meet financial goals. We appreciate your continued trust in us.
Sincerely,
Jonathan Thomas
President and Chief Executive Officer
American Century Investments
|
| | | | |
| Total Returns as of June 30, 2015 |
| | Average Annual Returns | |
| | Ticker Symbol | 1 year | Since Inception | Inception Date |
| Investor Class | AEVVX | -9.36%(1) | -5.51%(1) | 10/31/13 |
| MSCI Emerging Markets Value Index | — | -7.67% | -3.27% | — |
| MSCI Emerging Markets Index | — | -5.12% | -1.33% | — |
| Institutional Class | AEVNX | -9.26%(1) | -5.33%(1) | 10/31/13 |
| A Class | AEVLX | | | 10/31/13 |
| No sales charge* | | -9.71%(1) | -5.79%(1) | |
| With sales charge* | | -14.89%(1) | -9.08%(1) | |
| C Class | AEVTX | -10.36%(1) | -6.48%(1) | 10/31/13 |
| R Class | AEVRX | -9.86%(1) | -6.00%(1) | 10/31/13 |
| |
| * | Sales charges include initial sales charges and contingent deferred sales charges (CDSCs), as applicable. A Class shares have a 5.75% maximum initial sales charge and may be subject to a maximum CDSC of 1.00%. C Class shares redeemed within 12 months of purchase are subject to a maximum CDSC of 1.00%. The SEC requires that mutual funds provide performance information net of maximum sales charges in all cases where charges could be applied. |
| |
| (1) | Returns would have been lower if a portion of the management fee had not been waived. |
Data presented reflect past performance. Past performance is no guarantee of future results. Current performance may be higher or lower than the performance shown. Investment return and principal value will fluctuate, and redemption value may be more or less than original cost. Data assumes reinvestment of dividends and capital gains, and none of the charts reflect the deduction of taxes that a shareholder would pay on fund distributions or the redemption of fund shares. To obtain performance data current to the most recent month end, please call 1-800-345-2021 or visit americancentury.com. For additional information about the fund, please consult the prospectus.
|
|
| Growth of $10,000 Over Life of Class |
| $10,000 investment made October 31, 2013 |
| Performance for other share classes will vary due to differences in fee structure. |
|
| |
| Value on June 30, 2015 |
| | Investor Class — $9,100** |
| |
| | MSCI Emerging Markets Value Index — $9,462 |
| |
| | MSCI Emerging Markets Index — $9,779 |
| |
* From October 31, 2013, the Investor Class’s inception date. Not annualized.
**Ending value would have been lower if a portion of the management fee had not been waived.
|
| | | | |
| Total Annual Fund Operating Expenses |
| Investor Class | Institutional Class | A Class | C Class | R Class |
| 1.56% | 1.36% | 1.81% | 2.56% | 2.06% |
The total annual fund operating expenses shown is as stated in the fund’s prospectus current as of the date of this report. The prospectus may vary from the expense ratio shown elsewhere in this report because it is based on a different time period, includes acquired fund fees and expenses, and, if applicable, does not include fee waivers or expense reimbursements.
Data presented reflect past performance. Past performance is no guarantee of future results. Current performance may be higher or lower than the performance shown. Investment return and principal value will fluctuate, and redemption value may be more or less than original cost. Data assumes reinvestment of dividends and capital gains, and none of the charts reflect the deduction of taxes that a shareholder would pay on fund distributions or the redemption of fund shares. To obtain performance data current to the most recent month end, please call 1-800-345-2021 or visit americancentury.com. For additional information about the fund, please consult the prospectus.
Portfolio Managers: Elizabeth Xie, Yulin Long, and Vinod Chandrashekaran
Performance Summary
Emerging Markets Value returned -9.36%* for the fiscal year ended June 30, 2015, compared with the -7.67% return of the fund’s benchmark, the MSCI Emerging Markets Value Index.
During a challenging investment environment for emerging markets equities (see page 2
for details), Emerging Markets Value declined, underperforming the MSCI Emerging Markets
Value Index. The fund’s stock selection process incorporates factors of valuation, quality,
growth, and momentum, while striving to minimize unintended risks along industries and other
risk characteristics. The funds’ valuation and quality insights detracted from results, while
growth- and momentum-based factors were modestly positive. Security selection in the energy
and telecommunication services sectors drove underperformance, while materials holdings contributed to relative results. From a regional perspective, holdings in China and Russia were leading detractors from performance, while stock selection in South Korea contributed to relative results.
Energy Sector Leading Detractor
Security selection in the energy sector largely drove relative underperformance. Falling oil prices negatively impacted energy companies in general, positioning the sector as the weakest performer in the index. Within the fund, Russia-based oil production and refinery holding Rosneft was a leading detractor, declining during the first half of the period on oil price weakness as well as currency and geopolitical instability as the conflict between Russian and Ukraine intensified and western governments imposed economic sanctions on Russia. Other leading underperformers based in Russia included Sistema, a diversified investment company with interests across a number of industries including oil and telecommunications. The company’s stock plunged following the arrest of its billionaire owner on charges of money laundering, adding to the telecommunication services sector’s underperformance. The position was ultimately liquidated.
A number of declining financials sector holdings positioned that sector as a key detractor. These included Alpha Bank, a financial services company based in Greece, whose steep decline was attributed largely to instability surrounding the Greek debt crisis and the country’s probable default on loans owed to its creditors. We exited the holding amid this uncertainty. In China, financial institutions rallied during the second half of the period as the country’s central bank cut interest rates and eased lenders’ reserve requirements, and the fund’s underweight position, relative to the benchmark, in Bank of China negatively impacted results.
Elsewhere in the fund, a portfolio-only position in Brazil-based specialty retailer Via Varejo also imparted a negative impact. The company’s stock price declined nearly 67% during the period as consumers grappled with high inflation and rising unemployment, which dampened spending on home goods.
| |
| * | All fund returns referenced in this commentary are for Investor Class shares. Returns would have been lower if a portion of the management fee had not been waived. Performance for other share classes will vary due to differences in fee structure; when Investor Class performance exceeds that of the fund's benchmark, other share classes may not. See page 3 for returns for all share classes. |
Materials Sectors Main Relative Outperformer
Prominent relative contribution to performance came from security selection in the fund’s materials holdings, particularly among South Korean “chaebols”–conglomerates with interests in a number
of industries. An overweight position in Hanwha Corp. aided portfolio relative returns as the company’s stock appreciated 67% during the year, driven in part by revenue gains of the company’s solar cell division. Similarly, an overweight exposure in Hyosung Corp. was also successful as its stock more than doubled in value during the period.
Outside of the materials sector, an underweight position in Hyundai Motor Co. proved beneficial as the automobile manufacturer’s shares slumped on weaker-than-expected car sales in the U.S. and China. A number of information technology holdings also added relative value including Taiwan-based smartphone assembler Pegatron Corp., whose stock price rallied to record highs on strong iPhone sales.
A Look Ahead
We believe that global economic growth is likely to remain moderate and somewhat uneven, particularly in the emerging markets, which continue to face a number of challenges. Credit growth is no longer leading to higher investment activity in major economies such as China, Russia and Brazil, and capital-spending growth remains weak. While the near-term outlook seems uncertain and could lead to heightened levels of market volatility, our disciplined, objective, and systematic investment strategy is designed to take advantage of opportunities at the individual company level. We believe this approach is the most powerful way to capitalize on market inefficiencies that lead to the mispricing of individual stocks.
|
| |
| JUNE 30, 2015 |
| Top Ten Holdings | % of net assets |
| iShares MSCI India ETF | 4.3% |
| China Construction Bank Corp., H Shares | 3.8% |
| China Mobile Ltd. | 3.6% |
| Industrial & Commercial Bank of China Ltd., H Shares | 2.9% |
| Sasol Ltd. | 2.1% |
| Bank of China Ltd., H Shares | 1.8% |
| Samsung Electronics Co. Ltd. | 1.8% |
| MTN Group Ltd. | 1.8% |
| Fubon Financial Holding Co. Ltd. | 1.7% |
| America Movil SAB de CV, Series L ADR | 1.6% |
|
| |
| Types of Investments in Portfolio | % of net assets |
| Foreign Common Stocks | 93.7% |
| Exchange-Traded Funds | 5.3% |
| Total Equity Exposure | 99.0% |
| Temporary Cash Investments | 0.1% |
| Other Assets and Liabilities | 0.9% |
|
| |
| Investments by Country | % of net assets |
| China | 25.7% |
| South Korea | 14.5% |
| Taiwan | 11.8% |
| South Africa | 8.4% |
| Brazil | 7.5% |
| Mexico | 3.5% |
| Malaysia | 3.3% |
| Russia | 3.1% |
| Indonesia | 2.5% |
| Poland | 2.4% |
| India | 2.3% |
| Chile | 2.1% |
| Other Countries | 6.6% |
Exchange-Traded Funds(1) | 5.3% |
Cash and Equivalents(2) | 1.0% |
| |
| (1) | Category may increase exposure to the countries indicated. The Schedule of Investments provides additional information on the fund's portfolio holdings. |
| |
| (2) | Includes temporary cash investments and other assets and liabilities. |
Fund shareholders may incur two types of costs: (1) transaction costs, including sales charges (loads) on purchase payments and redemption/exchange fees; and (2) ongoing costs, including management fees; distribution and service (12b-1) fees; and other fund expenses. This example is intended to help you understand your ongoing costs (in dollars) of investing in your fund and to compare these costs with the ongoing cost of investing in other mutual funds.
The example is based on an investment of $1,000 made at the beginning of the period and held for the entire period from January 1, 2015 to June 30, 2015.
Actual Expenses
The table provides information about actual account values and actual expenses for each class. You may use the information, together with the amount you invested, to estimate the expenses that you paid over the period. First, identify the share class you own. Then simply divide your account value by $1,000 (for example, an $8,600 account value divided by $1,000 = 8.6), then multiply the result by the number under the heading “Expenses Paid During Period” to estimate the expenses you paid on your account during this period.
If you hold Investor Class shares of any American Century Investments fund, or Institutional Class shares of the American Century Diversified Bond Fund, in an American Century Investments account (i.e., not a financial intermediary or retirement plan account), American Century Investments may charge you a $12.50 semiannual account maintenance fee if the value of those shares is less than $10,000. We will redeem shares automatically in one of your accounts to pay the $12.50 fee. In determining your total eligible investment amount, we will include your investments in all personal accounts (including American Century Investments Brokerage accounts) registered under your Social Security number. Personal accounts include individual accounts, joint accounts, UGMA/UTMA accounts, personal trusts, Coverdell Education Savings Accounts and IRAs (including traditional, Roth, Rollover, SEP-, SARSEP- and SIMPLE-IRAs), and certain other retirement accounts. If you have only business, business retirement, employer-sponsored or American Century Investments Brokerage accounts, you are currently not subject to this fee. If you are subject to the Account Maintenance Fee, your account value could be reduced by the fee amount.
Hypothetical Example for Comparison Purposes
The table also provides information about hypothetical account values and hypothetical expenses based on the actual expense ratio of each class of your fund and an assumed rate of return of 5% per year before expenses, which is not the actual return of a fund’s share class. The hypothetical account values and expenses may not be used to estimate the actual ending account balance or expenses you paid for the period. You may use this information to compare the ongoing costs of investing in your fund and other funds. To do so, compare this 5% hypothetical example with the 5% hypothetical examples that appear in the shareholder reports of the other funds.
Please note that the expenses shown in the table are meant to highlight your ongoing costs only and do not reflect any transactional costs, such as sales charges (loads) or redemption/exchange fees. Therefore, the table is useful in comparing ongoing costs only, and will not help you determine the relative total costs of owning different funds. In addition, if these transactional costs were included, your costs would have been higher.
|
| | | | |
| | Beginning
Account Value
1/1/15 | Ending
Account Value
6/30/15 | Expenses Paid
During Period(1)
1/1/15 - 6/30/15 | Annualized
Expense Ratio(1) |
| Actual | | | | |
| Investor Class (after waiver) | $1,000 | $1,009.20 | $7.22 | 1.45% |
| Investor Class (before waiver) | $1,000 | $1,009.20(2) | $7.57 | 1.52% |
| Institutional Class (after waiver) | $1,000 | $1,010.30 | $6.23 | 1.25% |
| Institutional Class (before waiver) | $1,000 | $1,010.30(2) | $6.58 | 1.32% |
| A Class (after waiver) | $1,000 | $1,006.90 | $8.46 | 1.70% |
| A Class (before waiver) | $1,000 | $1,006.90(2) | $8.81 | 1.77% |
| C Class (after waiver) | $1,000 | $1,003.40 | $12.17 | 2.45% |
| C Class (before waiver) | $1,000 | $1,003.40(2) | $12.52 | 2.52% |
| R Class (after waiver) | $1,000 | $1,006.90 | $9.70 | 1.95% |
| R Class (before waiver) | $1,000 | $1,006.90(2) | $10.05 | 2.02% |
| Hypothetical | | | | |
| Investor Class (after waiver) | $1,000 | $1,017.60 | $7.25 | 1.45% |
| Investor Class (before waiver) | $1,000 | $1,017.26 | $7.60 | 1.52% |
| Institutional Class (after waiver) | $1,000 | $1,018.60 | $6.26 | 1.25% |
| Institutional Class (before waiver) | $1,000 | $1,018.25 | $6.61 | 1.32% |
| A Class (after waiver) | $1,000 | $1,016.36 | $8.50 | 1.70% |
| A Class (before waiver) | $1,000 | $1,016.02 | $8.85 | 1.77% |
| C Class (after waiver) | $1,000 | $1,012.65 | $12.23 | 2.45% |
| C Class (before waiver) | $1,000 | $1,012.30 | $12.57 | 2.52% |
| R Class (after waiver) | $1,000 | $1,015.13 | $9.74 | 1.95% |
| R Class (before waiver) | $1,000 | $1,014.78 | $10.09 | 2.02% |
| |
| (1) | Expenses are equal to the class's annualized expense ratio listed in the table above, multiplied by the average account value over the period, multiplied by 181, the number of days in the most recent fiscal half-year, divided by 365, to reflect the one-half year period. |
| |
| (2) | Ending account value assumes the return earned after waiver and would have been lower if a portion of the management fee had not been waived. |
JUNE 30, 2015
|
| | | | |
| | Shares | Value |
| COMMON STOCKS — 93.7% | | |
| Brazil — 7.5% | | |
| Banco Bradesco SA Preference Shares | 1,440 | $ | 13,200 |
|
| Banco do Brasil SA | 5,000 | 38,838 |
|
| Banco do Estado do Rio Grande do Sul SA Preference Shares | 10,700 | 30,870 |
|
| BB Seguridade Participacoes SA | 4,900 | 53,963 |
|
| Cia Energetica de Minas Gerais-CEMIG ADR | 11,384 | 43,373 |
|
| Cia Energetica de Sao Paulo Preference Shares | 7,900 | 49,726 |
|
| JBS SA | 10,500 | 55,284 |
|
Petroleo Brasileiro SA Preference Shares ADR(1) | 10,376 | 84,668 |
|
| Qualicorp SA | 2,000 | 12,602 |
|
| Transmissora Alianca de Energia Eletrica SA | 7,800 | 51,681 |
|
| Via Varejo SA | 4,500 | 16,254 |
|
| | | 450,459 |
|
| Chile — 2.1% | | |
| Banco Santander Chile ADR | 1,700 | 34,425 |
|
| Corpbanca SA | 4,925,089 | 54,392 |
|
| Empresa Nacional de Electricidad SA | 26,693 | 36,786 |
|
| | | 125,603 |
|
| China — 25.7% | | |
| Agricultural Bank of China Ltd., H Shares | 76,000 | 40,885 |
|
| Bank of China Ltd., H Shares | 168,000 | 109,232 |
|
| Belle International Holdings Ltd. | 14,000 | 16,128 |
|
China CITIC Bank Corp. Ltd., H Shares(1) | 95,000 | 75,740 |
|
| China Communications Services Corp. Ltd., H Shares | 56,000 | 28,319 |
|
| China Construction Bank Corp., H Shares | 253,000 | 231,082 |
|
| China Everbright Bank Co. Ltd., H Shares | 46,000 | 27,594 |
|
| China Galaxy Securities Co. Ltd., H Shares | 12,000 | 15,636 |
|
| China Medical System Holdings Ltd. | 12,000 | 16,812 |
|
| China Merchants Bank Co. Ltd., H Shares | 15,500 | 45,191 |
|
| China Mobile Ltd. | 17,000 | 217,666 |
|
| China National Building Material Co. Ltd., H Shares | 48,000 | 45,390 |
|
| China Petroleum & Chemical Corp., H Shares | 54,000 | 46,605 |
|
| China Railway Group Ltd., H Shares | 34,000 | 36,713 |
|
| China Shenhua Energy Co. Ltd., H Shares | 33,500 | 76,408 |
|
| China Telecom Corp. Ltd., H Shares | 60,000 | 35,219 |
|
| China Unicom Ltd. | 10,000 | 15,739 |
|
| Chongqing Rural Commercial Bank Co. Ltd., H Shares | 1,000 | 801 |
|
| CNOOC Ltd. | 30,000 | 42,572 |
|
| Evergrande Real Estate Group Ltd. | 29,000 | 17,322 |
|
| Franshion Properties China Ltd. | 62,000 | 22,156 |
|
| Haier Electronics Group Co. Ltd. | 10,000 | 26,962 |
|
| Huadian Power International Corp. Ltd., H Shares | 40,000 | 44,327 |
|
|
| | | | |
| | Shares | Value |
| Huaneng Power International, Inc., H Shares | 2,000 | $ | 2,787 |
|
| Industrial & Commercial Bank of China Ltd., H Shares | 217,000 | 172,445 |
|
| PetroChina Co. Ltd., H Shares | 16,000 | 17,854 |
|
| PICC Property & Casualty Co. Ltd., H Shares | 6,000 | 13,669 |
|
| Shimao Property Holdings Ltd. | 9,500 | 18,751 |
|
| Sunac China Holdings Ltd. | 20,000 | 21,905 |
|
| Tencent Holdings Ltd. | 900 | 17,962 |
|
| Zhejiang Expressway Co. Ltd., H Shares | 36,000 | 49,972 |
|
| | | 1,549,844 |
|
| Colombia — 0.4% | | |
| Banco Davivienda SA Preference Shares | 1,620 | 16,628 |
|
Cemex Latam Holdings SA(1) | 2,067 | 10,124 |
|
| | | 26,752 |
|
| Egypt — 1.1% | | |
| Commercial International Bank Egypt SAE | 8,906 | 66,125 |
|
| India — 2.3% | | |
| HDFC Bank Ltd. ADR | 1,000 | 60,530 |
|
| ICICI Bank Ltd. ADR | 600 | 6,252 |
|
| Infosys Ltd. ADR | 1,400 | 22,190 |
|
| Tata Motors Ltd. ADR | 1,424 | 49,085 |
|
| | | 138,057 |
|
| Indonesia — 2.5% | | |
| PT Adaro Energy Tbk | 648,000 | 36,938 |
|
| PT Bank Negara Indonesia (Persero) Tbk | 104,900 | 41,701 |
|
| PT Bank Rakyat Indonesia (Persero) Tbk | 79,900 | 62,026 |
|
| PT Indo Tambangraya Megah Tbk | 11,800 | 11,373 |
|
| | | 152,038 |
|
| Malaysia — 3.3% | | |
| Alliance Financial Group Bhd | 4,800 | 5,585 |
|
| Berjaya Sports Toto Bhd | 22,100 | 19,212 |
|
| Hong Leong Bank Bhd | 17,200 | 61,087 |
|
| Hong Leong Financial Group Bhd | 4,900 | 19,689 |
|
| Malayan Banking Bhd | 20,300 | 49,176 |
|
| Maxis Bhd | 8,700 | 14,688 |
|
| RHB Capital Bhd | 15,000 | 29,300 |
|
| | | 198,737 |
|
| Mexico — 3.5% | | |
| America Movil SAB de CV, Series L ADR | 4,408 | 93,935 |
|
| Gentera SAB de CV | 5,200 | 9,247 |
|
| Gruma SAB de CV, B Shares | 5,200 | 67,078 |
|
| Grupo Aeroportuario del Pacifico SAB de CV, B Shares | 500 | 3,423 |
|
| Kimberly-Clark de Mexico SAB de CV, A Shares | 6,000 | 12,975 |
|
OHL Mexico SAB de CV(1) | 19,200 | 24,920 |
|
| | | 211,578 |
|
| Philippines — 0.2% | | |
| Philippine Long Distance Telephone Co. | 220 | 13,710 |
|
|
| | | | |
| | Shares | Value |
| Poland — 2.4% | | |
Bank Millennium SA(1) | 20,350 | $ | 35,450 |
|
| Energa SA | 2,884 | 17,442 |
|
| Polskie Gornictwo Naftowe i Gazownictwo SA | 44,721 | 78,500 |
|
| Powszechny Zaklad Ubezpieczen SA | 118 | 13,578 |
|
| | | 144,970 |
|
| Qatar — 1.0% | | |
| Barwa Real Estate Co. | 4,134 | 60,172 |
|
| Russia — 3.1% | | |
| Gazprom OAO ADR | 13,381 | 68,912 |
|
| MMC Norilsk Nickel PJSC ADR | 2,429 | 40,977 |
|
| Rosneft Oil Co. OJSC GDR | 7,269 | 29,948 |
|
| Tatneft OAO ADR | 1,566 | 50,081 |
|
| | | 189,918 |
|
| South Africa — 8.4% | | |
AngloGold Ashanti Ltd. ADR(1) | 1,700 | 15,215 |
|
| Coronation Fund Managers Ltd. | 7,060 | 47,823 |
|
| Growthpoint Properties Ltd. | 17,716 | 38,531 |
|
| Kumba Iron Ore Ltd. | 3,744 | 46,457 |
|
| MMI Holdings Ltd. | 13,643 | 33,810 |
|
| MTN Group Ltd. | 5,666 | 106,534 |
|
| Redefine Properties Ltd. | 4,084 | 3,427 |
|
Sappi Ltd.(1) | 11,615 | 41,196 |
|
| Sasol Ltd. | 3,433 | 126,981 |
|
| Vodacom Group Ltd. | 3,976 | 45,329 |
|
| | | 505,303 |
|
| South Korea — 14.5% | | |
| BNK Financial Group, Inc. | 4,284 | 54,537 |
|
| CJ Corp. | 237 | 62,891 |
|
| Dongbu Insurance Co. Ltd. | 247 | 12,511 |
|
| Hanwha Corp. | 1,942 | 82,175 |
|
| Hyosung Corp. | 527 | 68,034 |
|
| Hyundai Engineering & Construction Co. Ltd. | 1,053 | 38,752 |
|
| Hyundai Motor Co. | 241 | 29,384 |
|
| Hyundai Steel Co. | 450 | 27,312 |
|
| Kangwon Land, Inc. | 639 | 21,196 |
|
| Kia Motors Corp. | 2,249 | 91,335 |
|
| Korea Zinc Co. Ltd. | 34 | 16,612 |
|
| KT&G Corp. | 176 | 14,974 |
|
| LG Chem Ltd. | 194 | 48,437 |
|
| LG Corp. | 152 | 8,421 |
|
| LS Industrial Systems Co. Ltd. | 1,085 | 44,452 |
|
| NCSoft Corp. | 167 | 29,718 |
|
| Samsung Electronics Co. Ltd. | 94 | 106,856 |
|
| Shinhan Financial Group Co. Ltd. | 190 | 7,077 |
|
| SK Hynix, Inc. | 1,442 | 54,683 |
|
| SK Telecom Co. Ltd. | 265 | 59,393 |
|
| | | 878,750 |
|
|
| | | | |
| | Shares | Value |
| Taiwan — 11.8% | | |
| Asustek Computer, Inc. | 1,000 | $ | 9,739 |
|
| AU Optronics Corp. | 120,000 | 53,088 |
|
| Cathay Financial Holding Co. Ltd. | 37,300 | 65,160 |
|
| Compal Electronics, Inc. | 27,000 | 20,564 |
|
| Fubon Financial Holding Co. Ltd. | 51,000 | 101,489 |
|
| Highwealth Construction Corp. | 28,000 | 66,791 |
|
| Hon Hai Precision Industry Co. Ltd. | 29,480 | 92,679 |
|
| Innolux Corp. | 132,000 | 68,878 |
|
Inotera Memories, Inc.(1) | 44,000 | 35,081 |
|
| Pegatron Corp. | 27,000 | 79,019 |
|
| Vanguard International Semiconductor Corp. | 13,000 | 20,814 |
|
| Wan Hai Lines Ltd. | 52,000 | 41,290 |
|
| Zhen Ding Technology Holding Ltd. | 16,000 | 56,005 |
|
| | | 710,597 |
|
| Thailand — 1.3% | | |
| PTT Exploration & Production PCL | 12,800 | 41,308 |
|
| PTT PCL | 3,800 | 40,390 |
|
| | | 81,698 |
|
| Turkey — 1.8% | | |
| Emlak Konut Gayrimenkul Yatirim Ortakligi AS | 27,263 | 28,076 |
|
| Eregli Demir ve Celik Fabrikalari TAS | 40,284 | 65,234 |
|
| Turkiye Vakiflar Bankasi TAO, D Shares | 8,847 | 14,227 |
|
| | | 107,537 |
|
| United Arab Emirates — 0.8% | | |
| Dubai Islamic Bank PJSC | 25,909 | 48,250 |
|
TOTAL COMMON STOCKS (Cost $5,979,906) | | 5,660,098 |
|
| EXCHANGE-TRADED FUNDS — 5.3% | | |
| iShares MSCI India ETF | 8,661 | 262,515 |
|
| iShares MSCI Emerging Markets ETF | 1,387 | 54,953 |
|
TOTAL EXCHANGE-TRADED FUNDS (Cost $285,446) | | 317,468 |
|
| TEMPORARY CASH INVESTMENTS — 0.1% | | |
Repurchase Agreement, Bank of America Merrill Lynch, (collateralized by various U.S. Treasury obligations, 1.50%, 1/31/19 - 11/30/19, valued at $1,206), in a joint trading account at 0.10%, dated 6/30/15, due 7/1/15 (Delivery value $1,181) | | 1,181 |
|
| State Street Institutional Liquid Reserves Fund, Premier Class | 5,903 | 5,903 |
|
TOTAL TEMPORARY CASH INVESTMENTS (Cost $7,084) | | 7,084 |
|
TOTAL INVESTMENT SECURITIES — 99.1% (Cost $6,272,436) | | 5,984,650 |
|
| OTHER ASSETS AND LIABILITIES — 0.9% | | 55,945 |
|
| TOTAL NET ASSETS — 100.0% | | $ | 6,040,595 |
|
|
| | |
| MARKET SECTOR DIVERSIFICATION | |
| (as a % of net assets) | |
| Financials | 34.8 | % |
| Energy | 12.4 | % |
| Information Technology | 11.1 | % |
| Telecommunication Services | 10.6 | % |
| Materials | 8.4 | % |
| Industrials | 5.0 | % |
| Consumer Discretionary | 4.5 | % |
| Utilities | 4.0 | % |
| Consumer Staples | 2.4 | % |
| Health Care | 0.5 | % |
| Exchange-Traded Funds | 5.3 | % |
| Cash and Equivalents* | 1.0 | % |
*Includes temporary cash investments and other assets and liabilities.
|
| | |
| NOTES TO SCHEDULE OF INVESTMENTS |
| ADR | - | American Depositary Receipt |
| GDR | - | Global Depositary Receipt |
| OJSC | - | Open Joint Stock Company |
| PJSC | - | Public Joint Stock Company |
See Notes to Financial Statements.
|
|
| Statement of Assets and Liabilities |
|
| | | |
| JUNE 30, 2015 | |
| Assets | |
| Investment securities, at value (cost of $6,272,436) | $ | 5,984,650 |
|
| Foreign currency holdings, at value (cost of $6,468) | 6,474 |
|
| Receivable for capital shares sold | 647 |
|
| Dividends and interest receivable | 56,548 |
|
| | 6,048,319 |
|
| | |
| Liabilities | |
| Accrued management fees | 7,155 |
|
| Distribution and service fees payable | 569 |
|
| | 7,724 |
|
| | |
| Net Assets | $ | 6,040,595 |
|
| | |
| Net Assets Consist of: | |
| Capital (par value and paid-in surplus) | $ | 6,805,828 |
|
| Undistributed net investment income | 17,550 |
|
| Accumulated net realized loss | (494,748 | ) |
| Net unrealized depreciation | (288,035 | ) |
| | $ | 6,040,595 |
|
|
| | | | | | |
| | Net Assets | Shares Outstanding | Net Asset Value Per Share |
| Investor Class, $0.01 Par Value |
| $2,838,955 |
| 323,024 |
| $8.79 |
| Institutional Class, $0.01 Par Value |
| $1,369,253 |
| 155,614 |
| $8.80 |
| A Class, $0.01 Par Value |
| $1,382,969 |
| 157,632 |
| $8.77* |
| C Class, $0.01 Par Value |
| $223,684 |
| 25,620 |
| $8.73 |
| R Class, $0.01 Par Value |
| $225,734 |
| 25,771 |
| $8.76 |
*Maximum offering price $9.31 (net asset value divided by 0.9425).
See Notes to Financial Statements.
|
| | | |
| YEAR ENDED JUNE 30, 2015 | |
| Investment Income (Loss) | |
| Income: | |
| Dividends (net of foreign taxes withheld of $28,560) | $ | 224,622 |
|
| Interest | 20 |
|
| | 224,642 |
|
| | |
| Expenses: | |
| Management fees | 91,449 |
|
| Distribution and service fees: | |
| A Class | 3,598 |
|
| C Class | 2,359 |
|
| R Class | 1,186 |
|
| Directors' fees and expenses | 313 |
|
| Other expenses | 157 |
|
| | 99,062 |
|
| Fees waived | (4,344 | ) |
| | 94,718 |
|
| | |
| Net investment income (loss) | 129,924 |
|
| | |
| Realized and Unrealized Gain (Loss) | |
| Net realized gain (loss) on: | |
| Investment transactions | (357,073 | ) |
| Foreign currency transactions | (6,337 | ) |
| | (363,410 | ) |
| | |
| Change in net unrealized appreciation (depreciation) on: | |
| Investments | (431,690 | ) |
| Translation of assets and liabilities in foreign currencies | (288 | ) |
| | (431,978 | ) |
| | |
| Net realized and unrealized gain (loss) | (795,388 | ) |
| | |
| Net Increase (Decrease) in Net Assets Resulting from Operations | $ | (665,464 | ) |
See Notes to Financial Statements.
|
|
| Statement of Changes in Net Assets |
|
| | | | | | |
| YEAR ENDED JUNE 30, 2015 AND PERIOD ENDED JUNE 30, 2014 |
| Increase (Decrease) in Net Assets | June 30, 2015 | June 30, 2014(1) |
| Operations | | |
| Net investment income (loss) | $ | 129,924 |
| $ | 66,569 |
|
| Net realized gain (loss) | (363,410 | ) | (127,660 | ) |
| Change in net unrealized appreciation (depreciation) | (431,978 | ) | 143,943 |
|
| Net increase (decrease) in net assets resulting from operations | (665,464 | ) | 82,852 |
|
| | | |
| Distributions to Shareholders | | |
| From net investment income: | | |
| Investor Class | (83,206 | ) | — |
|
| Institutional Class | (47,628 | ) | — |
|
| A Class | (41,993 | ) | — |
|
| C Class | (5,260 | ) | — |
|
| R Class | (6,375 | ) | — |
|
| Decrease in net assets from distributions | (184,462 | ) | — |
|
| | | |
| Capital Share Transactions | | |
| Net increase (decrease) in net assets from capital share transactions (Note 5) | 630,244 |
| 6,177,425 |
|
| | | |
| Net increase (decrease) in net assets | (219,682 | ) | 6,260,277 |
|
| | | |
| Net Assets | | |
| Beginning of period | 6,260,277 |
| — |
|
| End of period | $ | 6,040,595 |
| $ | 6,260,277 |
|
| | | |
| Undistributed net investment income | $ | 17,550 |
| $ | 75,487 |
|
| |
| (1) | October 31, 2013 (fund inception) through June 30, 2014. |
See Notes to Financial Statements.
|
|
| Notes to Financial Statements |
JUNE 30, 2015
1. Organization
American Century Quantitative Equity Funds, Inc. (the corporation) is registered under the Investment Company Act of 1940, as amended (the 1940 Act), as an open-end management investment company and is organized as a Maryland corporation. Emerging Markets Value Fund (the fund) is one fund in a series issued by the corporation. The fund is diversified as defined under the 1940 Act. The fund’s investment objective is to seek capital growth.
The fund offers the Investor Class, the Institutional Class, the A Class, the C Class and the R Class. The A Class may incur an initial sales charge. The A Class and C Class may be subject to a contingent deferred sales charge. The share classes differ principally in their respective sales charges and distribution and shareholder servicing expenses and arrangements. The Institutional Class is made available to institutional shareholders or through financial intermediaries whose clients do not require the same level of shareholder and administrative services as shareholders of other classes. As a result, the Institutional Class is charged a lower unified management fee. All classes of the fund commenced sale on October 31, 2013, the fund's inception date.
2. Significant Accounting Policies
The following is a summary of significant accounting policies consistently followed by the fund in preparation of its financial statements. The fund is an investment company and follows accounting and reporting guidance in accordance with accounting principles generally accepted in the United States of America. This may require management to make certain estimates and assumptions at the date of the financial statements. Actual results could differ from these estimates. Management evaluated the impact of events or transactions occurring through the date the financial statements were issued that would merit recognition or disclosure.
Investment Valuations — The fund determines the fair value of its investments and computes its net asset value per share at the close of regular trading (usually 4 p.m. Eastern time) on the New York Stock Exchange (NYSE) on each day the NYSE is open. The Board of Directors has adopted valuation policies and procedures to guide the investment advisor in the fund’s investment valuation process and to provide methodologies for the oversight of the fund’s pricing function.
Equity securities that are listed or traded on a domestic securities exchange are valued at the last reported sales price or at the official closing price as provided by the exchange. Equity securities traded on foreign securities exchanges are generally valued at the closing price of such securities on the exchange where primarily traded or at the close of the NYSE, if that is earlier. If no last sales price is reported, or if local convention or regulation so provides, the mean of the latest bid and asked prices may be used. Securities traded over-the-counter are valued at the mean of the latest bid and asked prices, the last sales price, or the official closing price. Equity securities initially expressed in local currencies are translated into U.S. dollars at the mean of the appropriate currency exchange rate at the close of the NYSE as provided by an independent pricing service.
Fixed income securities maturing within 60 days at the time of purchase may be valued at cost, plus or minus any amortized discount or premium or at the evaluated mean as provided by an independent pricing service. Evaluated mean prices are commonly derived through utilization of market models, which may consider, among other factors: trade data, quotations from dealers and active market makers, relevant yield curve and spread data, related sector levels, creditworthiness, trade data or market information on comparable securities, and other relevant security specific information.
Open-end management investment companies are valued at the reported net asset value per share. Repurchase agreements are valued at cost, which approximates fair value.
If the fund determines that the market price for an investment is not readily available or the valuation methods mentioned above do not reflect an investment’s fair value, such investment is valued as determined in good faith by the Board of Directors or its delegate, in accordance with policies and procedures adopted by the Board of Directors. In its determination of fair value, the fund may review several factors including, but not limited to, market information regarding the specific investment or comparable investments and correlation
with other investment types, futures indices or general market indicators. Circumstances that may cause the fund to use these procedures to value an investment include, but are not limited to: an investment has been declared in default or is distressed; trading in a security has been suspended during the trading day or a security is not actively trading on its principal exchange; prices received from a regular pricing source are deemed unreliable; or there is a foreign market holiday and no trading occurred.
The fund monitors for significant events occurring after the close of an investment’s primary exchange but before the fund’s net asset value per share is determined. Significant events may include, but are not limited to: corporate announcements and transactions; governmental action and political unrest that could impact a specific investment or an investment sector; or armed conflicts, natural disasters and similar events that could affect investments in a specific country or region. The fund also monitors for significant fluctuations between domestic and foreign markets, as evidenced by the U.S. market or such other indicators that the Board of Directors, or its delegate, deems appropriate. If significant fluctuations in foreign markets are identified, the fund may apply a model-derived factor to the closing price of equity securities traded on foreign securities exchanges. The factor is based on observable market data as provided by an independent pricing service.
Security Transactions — Security transactions are accounted for as of the trade date. Net realized gains and losses are determined on the identified cost basis, which is also used for federal income tax purposes.
Investment Income — Dividend income less foreign taxes withheld, if any, is recorded as of the ex-dividend date. Distributions received on securities that represent a return of capital or long-term capital gain are recorded as a reduction of cost of investments and/or as a realized gain. The fund may estimate the components of distributions received that may be considered nontaxable distributions or long-term capital gain distributions for income tax purposes. Interest income is recorded on the accrual basis and includes accretion of discounts and amortization of premiums.
Foreign Currency Translations — All assets and liabilities initially expressed in foreign currencies are translated into U.S. dollars at prevailing exchange rates at period end. The fund may enter into spot foreign currency exchange contracts to facilitate transactions denominated in a foreign currency. Purchases and sales of investment securities, dividend and interest income, spot foreign currency exchange contracts, and expenses are translated at the rates of exchange prevailing on the respective dates of such transactions. Net realized and unrealized foreign currency exchange gains or losses related to investment securities are a component of net realized gain (loss) on investment transactions and change in net unrealized appreciation (depreciation) on investments, respectively.
Repurchase Agreements — The fund may enter into repurchase agreements with institutions that American Century Investment Management, Inc. (ACIM) (the investment advisor) has determined are creditworthy pursuant to criteria adopted by the Board of Directors. The fund requires that the collateral, represented by securities, received in a repurchase transaction be transferred to the custodian in a manner sufficient to enable the fund to obtain those securities in the event of a default under the repurchase agreement. ACIM monitors, on a daily basis, the securities transferred to ensure the value, including accrued interest, of the securities under each repurchase agreement is equal to or greater than amounts owed to the fund under each repurchase agreement.
Joint Trading Account — Pursuant to an Exemptive Order issued by the Securities and Exchange Commission, the fund, along with certain other funds in the American Century Investments family of funds, may transfer uninvested cash balances into a joint trading account. These balances are invested in one or more repurchase agreements that are collateralized by U.S. Treasury or Agency obligations.
Income Tax Status — It is the fund’s policy to distribute substantially all net investment income and net realized gains to shareholders and to otherwise qualify as a regulated investment company under provisions of the Internal Revenue Code. Accordingly, no provision has been made for income taxes. The fund files U.S. federal, state, local and non-U.S. tax returns as applicable. The fund's tax returns are subject to examination by the relevant taxing authority until expiration of the applicable statute of limitations, which is generally three years from the date of filing but can be longer in certain jurisdictions. At this time, management believes there are no uncertain tax positions which, based on their technical merit, would not be sustained upon examination and for which it is reasonably possible that the total amounts of unrecognized tax benefits will significantly change in the next twelve months.
Multiple Class — All shares of the fund represent an equal pro rata interest in the net assets of the class to which such shares belong, and have identical voting, dividend, liquidation and other rights and the same terms and conditions, except for class specific expenses and exclusive rights to vote on matters affecting only individual classes. Income, non-class specific expenses, and realized and unrealized capital gains and losses of the fund are allocated to each class of shares based on their relative net assets.
Distributions to Shareholders — Distributions from net investment income and net realized gains, if any, are generally declared and paid annually.
Indemnifications — Under the corporation’s organizational documents, its officers and directors are indemnified against certain liabilities arising out of the performance of their duties to the fund. In addition, in the normal course of business, the fund enters into contracts that provide general indemnifications. The maximum exposure under these arrangements is unknown as this would involve future claims that may be made against a fund. The risk of material loss from such claims is considered by management to be remote.
3. Fees and Transactions with Related Parties
Certain officers and directors of the corporation are also officers and/or directors of American Century Companies, Inc. (ACC). The corporation’s investment advisor, ACIM, the corporation's distributor, American Century Investment Services, Inc. (ACIS), and the corporation’s transfer agent, American Century Services, LLC, are wholly owned, directly or indirectly, by ACC. ACIM owns 75% of the shares of the fund. Related parties do not invest in the fund for the purpose of exercising management or control.
Management Fees — The corporation has entered into a management agreement with ACIM, under which ACIM provides the fund with investment advisory and management services in exchange for a single, unified management fee (the fee) per class. The agreement provides that all expenses of managing and operating the fund, except distribution and service fees, brokerage expenses, taxes, interest, fees and expenses of the independent directors (including legal counsel fees), and extraordinary expenses, will be paid by ACIM. The fee is computed and accrued daily based on each class’s daily net assets and paid monthly in arrears. The annual management fee is 1.52% for the Investor Class, A Class, C Class and R Class and 1.32% for the Institutional Class. During the year ended June 30, 2015, the investment advisor voluntarily agreed to waive 0.07% of the fund's management fee. The investment advisor expects this waiver to continue until October 31, 2015, and cannot terminate it prior to such date without the approval of the Board of Directors. The total amount of the waiver for each class for the year ended June 30, 2015 was $2,001, $1,004, $1,008, $165 and $166 for the Investor Class, Institutional Class, A Class, C Class and R Class, respectively. The effective annual management fee after waiver for each class for the year ended June 30, 2015 was 1.45% for the Investor Class, A Class, C Class and R Class and 1.25% for the Institutional Class.
Distribution and Service Fees — The Board of Directors has adopted a separate Master Distribution and Individual Shareholder Services Plan for each of the A Class, C Class and R Class (collectively the plans), pursuant to Rule 12b-1 of the 1940 Act. The plans provide that the A Class will pay ACIS an annual distribution and service fee of 0.25%. The plans provide that the C Class will pay ACIS an annual distribution and service fee of 1.00%, of which 0.25% is paid for individual shareholder services and 0.75% is paid for distribution services. The plans provide that the R Class will pay ACIS an annual distribution and service fee of 0.50%. The fees are computed and accrued daily based on each class’s daily net assets and paid monthly in arrears. The fees are used to pay financial intermediaries for distribution and individual shareholder services. Fees incurred under the plans during the year ended June 30, 2015 are detailed in the Statement of Operations.
Directors' Fees and Expenses — The Board of Directors is responsible for overseeing the investment advisor’s management and operations of the fund. The directors receive detailed information about the fund and its investment advisor regularly throughout the year, and meet at least quarterly with management of the investment advisor to review reports about fund operations. The fund’s officers do not receive compensation from the fund.
Acquired Fund Fees and Expenses — The fund may invest in mutual funds, exchange-traded funds, and business development companies (the acquired funds). The fund will indirectly realize its pro rata share of the fees and expenses of the acquired funds in which it invests. These indirect fees and expenses are not paid out of the fund's assets but are reflected in the return realized by the fund on its investment in the acquired funds.
4. Investment Transactions
Purchases and sales of investment securities, excluding short-term investments, for the year ended June 30, 2015 were $5,729,560 and $5,119,362, respectively.
5. Capital Share Transactions
Transactions in shares of the fund were as follows:
|
| | | | | | | | | | |
| | Year ended
June 30, 2015 | Period ended June 30, 2014(1) |
| | Shares | Amount | Shares | Amount |
| Investor Class/Shares Authorized | 50,000,000 |
| | 50,000,000 |
| |
| Sold | 168,694 |
| $ | 1,631,142 |
| 310,768 |
| $ | 3,023,635 |
|
| Issued in reinvestment of distributions | 9,713 |
| 82,559 |
| — |
| — |
|
| Redeemed | (129,020 | ) | (1,209,216 | ) | (37,131 | ) | (346,555 | ) |
| | 49,387 |
| 504,485 |
| 273,637 |
| 2,677,080 |
|
| Institutional Class/Shares Authorized | 30,000,000 |
| | 50,000,000 |
| |
| Sold | 11 |
| 100 |
| 150,000 |
| 1,500,000 |
|
| Issued in reinvestment of distributions | 5,603 |
| 47,628 |
| — |
| — |
|
| | 5,614 |
| 47,728 |
| 150,000 |
| 1,500,000 |
|
| A Class/Shares Authorized | 20,000,000 |
| | 50,000,000 |
| |
| Sold | 3,214 |
| 29,454 |
| 150,035 |
| 1,500,345 |
|
| Issued in reinvestment of distributions | 4,940 |
| 41,993 |
| — |
| — |
|
| Redeemed | (557 | ) | (5,237 | ) | — |
| — |
|
| | 7,597 |
| 66,210 |
| 150,035 |
| 1,500,345 |
|
| C Class/Shares Authorized | 15,000,000 |
| | 50,000,000 |
| |
| Sold | — |
| — |
| 25,000 |
| 250,000 |
|
| Issued in reinvestment of distributions | 620 |
| 5,260 |
| — |
| — |
|
| | 620 |
| 5,260 |
| 25,000 |
| 250,000 |
|
| R Class/Shares Authorized | 15,000,000 |
| | 10,000,000 |
| |
| Sold | 21 |
| 186 |
| 25,000 |
| 250,000 |
|
| Issued in reinvestment of distributions | 750 |
| 6,375 |
| — |
| — |
|
| | 771 |
| 6,561 |
| 25,000 |
| 250,000 |
|
| Net increase (decrease) | 63,989 |
| $ | 630,244 |
| 623,672 |
| $ | 6,177,425 |
|
| |
| (1) | October 31, 2013 (fund inception) through June 30, 2014. |
6. Fair Value Measurements
The fund’s investments valuation process is based on several considerations and may use multiple inputs to determine the fair value of the investments held by the fund. In conformity with accounting principles generally accepted in the United States of America, the inputs used to determine a valuation are classified into three broad levels.
| |
| • | Level 1 valuation inputs consist of unadjusted quoted prices in an active market for identical investments. |
| |
| • | Level 2 valuation inputs consist of direct or indirect observable market data (including quoted prices for comparable investments, evaluations of subsequent market events, interest rates, prepayment speeds, credit risk, etc.). These inputs also consist of quoted prices for identical investments initially expressed in local currencies that are adjusted through translation into U.S. dollars. |
| |
| • | Level 3 valuation inputs consist of unobservable data (including a fund’s own assumptions). |
The level classification is based on the lowest level input that is significant to the fair valuation measurement. The valuation inputs are not necessarily an indication of the risks associated with investing in these securities or other financial instruments. There were no significant transfers between levels during the period.
The following is a summary of the level classifications as of period end. The Schedule of Investments provides additional information on the fund’s portfolio holdings.
|
| | | | | | | | |
| | Level 1 | Level 2 | Level 3 |
| Assets | | | |
| Investment Securities | | | |
| Common Stocks | | | |
| Brazil | $ | 128,041 |
| $ | 322,418 |
| — |
|
| Chile | 34,425 |
| 91,178 |
| — |
|
| India | 138,057 |
| — |
| — |
|
| Mexico | 93,935 |
| 117,643 |
| — |
|
| South Africa | 15,215 |
| 490,088 |
| — |
|
| Other Countries | — |
| 4,229,098 |
| — |
|
| Exchange-Traded Funds | 317,468 |
| — |
| — |
|
| Temporary Cash Investments | 5,903 |
| 1,181 |
| — |
|
| | $ | 733,044 |
| $ | 5,251,606 |
| — |
|
7. Risk Factors
There are certain risks involved in investing in foreign securities. These risks include those resulting from future adverse political, social and economic developments, fluctuations in currency exchange rates, the possible imposition of exchange controls, and other foreign laws or restrictions. Investing in emerging markets may accentuate these risks.
8. Federal Tax Information
The tax character of distributions paid during the year ended June 30, 2015 and the period ended June 30, 2014 were as follows:
|
| | | | | |
| | 2015 | 2014(1) |
| Distributions Paid From | | |
| Ordinary income | $ | 184,462 |
| — |
|
| Long-term capital gains | — |
| — |
|
(1) October 31, 2013 (fund inception) through June 30, 2014.
The book-basis character of distributions made during the year from net investment income or net realized gains may differ from their ultimate characterization for federal income tax purposes. These differences reflect the differing character of certain income items and net realized gains and losses for financial statement and tax purposes, and may result in reclassification among certain capital accounts on the financial statements.
As of June 30, 2015, the federal tax cost of investments and the components of distributable earnings on a tax-basis were as follows:
|
| | | |
| Federal tax cost of investments | $ | 6,315,665 |
|
| Gross tax appreciation of investments | $ | 431,514 |
|
| Gross tax depreciation of investments | (762,529 | ) |
| Net tax appreciation (depreciation) of investments | (331,015 | ) |
Net tax appreciation (depreciation) on translation of assets and liabilities in foreign currencies | (249 | ) |
| Net tax appreciation (depreciation) | $ | (331,264 | ) |
| Undistributed ordinary income | $ | 50,185 |
|
| Accumulated short-term capital losses | $ | (341,226 | ) |
| Accumulated long-term capital losses | $ | (142,928 | ) |
The difference between book-basis and tax-basis unrealized appreciation (depreciation) is attributable primarily to the realization to ordinary income for tax purposes of unrealized gains on investments in passive foreign investment companies.
Accumulated capital losses represent net capital loss carryovers that may be used to offset future realized capital gains for federal income tax purposes. The capital loss carryovers may be carried forward for an unlimited period. Future capital loss carryover utilization in any given year may be subject to Internal Revenue Code limitations.
|
| | | | | | | | | | | | | | | |
| For a Share Outstanding Throughout the Years Ended June 30 (except as noted) | | | | |
| Per-Share Data | | | | | | Ratios and Supplemental Data | | | |
| | | Income From Investment Operations: | | | | Ratio to Average Net Assets of: | | |
| | Net Asset
Value,
Beginning
of Period | Net
Investment
Income
(Loss)(1) | Net
Realized
and
Unrealized
Gain (Loss) | Total From
Investment
Operations | Distributions From Net Investment Income | Net Asset
Value,
End
of Period | Total
Return(2) | Operating
Expenses(3) | Operating
Expenses
(before
expense
waiver)(3) | Net
Investment
Income
(Loss) | Net
Investment
Income (Loss)
(before expense
waiver) | Portfolio
Turnover
Rate | Net Assets,
End of
Period
(in thousands) |
| Investor Class | | | | | | | | | | | | |
| 2015 | $10.04 | 0.21 | (1.16) | (0.95) | (0.30) | $8.79 | (9.36)% | 1.46% | 1.53% | 2.16% | 2.09% | 83% |
| $2,839 |
|
2014(4) | $10.00 | 0.13 | (0.09) | 0.04 | — | $10.04 | 0.40% | 1.46%(5) | 1.53%(5) | 1.91%(5) | 1.84%(5) | 44% |
| $2,748 |
|
| Institutional Class | | | | | | | | | | | | |
| 2015 | $10.06 | 0.22 | (1.16) | (0.94) | (0.32) | $8.80 | (9.26)% | 1.26% | 1.33% | 2.36% | 2.29% | 83% |
| $1,369 |
|
2014(4) | $10.00 | 0.13 | (0.07) | 0.06 | — | $10.06 | 0.60% | 1.26%(5) | 1.33%(5) | 2.11%(5) | 2.04%(5) | 44% |
| $1,508 |
|
| A Class | | | | | | | | | | | | | |
| 2015 | $10.03 | 0.18 | (1.16) | (0.98) | (0.28) | $8.77 | (9.71)% | 1.71% | 1.78% | 1.91% | 1.84% | 83% |
| $1,383 |
|
2014(4) | $10.00 | 0.10 | (0.07) | 0.03 | — | $10.03 | 0.30% | 1.71%(5) | 1.78%(5) | 1.66%(5) | 1.59%(5) | 44% |
| $1,504 |
|
| C Class | | | | | | | | | | | | | |
| 2015 | $9.98 | 0.11 | (1.15) | (1.04) | (0.21) | $8.73 | (10.36)% | 2.46% | 2.53% | 1.16% | 1.09% | 83% |
| $224 |
|
2014(4) | $10.00 | 0.05 | (0.07) | (0.02) | — | $9.98 | (0.20)% | 2.46%(5) | 2.53%(5) | 0.91%(5) | 0.84%(5) | 44% |
| $249 |
|
| R Class | | | | | | | | | | | | | |
| 2015 | $10.01 | 0.15 | (1.14) | (0.99) | (0.26) | $8.76 | (9.86)% | 1.96% | 2.03% | 1.66% | 1.59% | 83% |
| $226 |
|
2014(4) | $10.00 | 0.08 | (0.07) | 0.01 | — | $10.01 | 0.10% | 1.96%(5) | 2.03%(5) | 1.41%(5) | 1.34%(5) | 44% |
| $250 |
|
|
|
| Notes to Financial Highlights |
| |
| (1) | Computed using average shares outstanding throughout the period. |
| |
| (2) | Total returns are calculated based on the net asset value of the last business day and do not reflect applicable sales charges, if any. Total returns for periods less than one year are not annualized. |
| |
| (3) | Ratio of operating expenses to average net assets does not include any fees and expenses of the acquired funds. |
| |
| (4) | October 31, 2013 (fund inception) through June 30, 2014. |
See Notes to Financial Statements.
|
|
| Report of Independent Registered Public Accounting Firm |
To the Directors of the American Century Quantitative Equity Funds, Inc. and Shareholders of the Emerging Markets Value Fund:
In our opinion, the accompanying statement of assets and liabilities, including the schedule of investments, and the related statements of operations and of changes in net assets and the financial highlights present fairly, in all material respects, the financial position of the Emerging Markets Value Fund (one of the sixteen funds comprising the American Century Quantitative Equity Funds, Inc., hereafter referred to as the “Fund”) at June 30, 2015, the results of its operations for the year then ended, and the changes in its net assets and the financial highlights for the year then ended and for the period October 31, 2013 (commencement of operations) through June 30, 2014, in conformity with accounting principles generally accepted in the United States of America. These financial statements and financial highlights (hereafter referred to as "financial statements") are the responsibility of the Fund's management. Our responsibility is to express an opinion on these financial statements based on our audits. We conducted our audits of these financial statements in accordance with the standards of the Public Company Accounting Oversight Board (United States). Those standards require that we plan and perform the audit to obtain reasonable assurance about whether the financial statements are free of material misstatement. An audit includes examining, on a test basis, evidence supporting the amounts and disclosures in the financial statements, assessing the accounting principles used and significant estimates made by management, and evaluating the overall financial statement presentation. We believe that our audits, which included confirmation of securities at June 30, 2015 by correspondence with the custodian and brokers, provide a reasonable basis for our opinion.
PricewaterhouseCoopers LLP
Kansas City, Missouri
August 21, 2015
Board of Directors
The individuals listed below serve as directors of the funds. Each director will continue to serve in this capacity until death, retirement, resignation or removal from office. The board has adopted a mandatory retirement age for directors who are not “interested persons,” as that term is defined in the Investment Company Act (independent directors). Independent directors shall retire on December 31 of the year in which they reach their 75th birthday; provided, however, that on or after January 1, 2022, independent directors shall retire on December 31 of the year in which they reach their 76th birthday.
Mr. Thomas is an “interested person” because he currently serves as President and Chief Executive Officer of American Century Companies, Inc. (ACC), the parent company of American Century Investment Management, Inc. (ACIM or the advisor). The other directors (more than three-fourths of the total number) are independent. They are not employees, directors or officers of, and have no financial interest in, ACC or any of its wholly owned, direct or indirect, subsidiaries, including ACIM, American Century Investment Services, Inc. (ACIS) and American Century Services, LLC (ACS), and they do not have any other affiliations, positions or relationships that would cause them to be considered “interested persons” under the Investment Company Act. The directors serve in this capacity for eight (in the case of Mr. Thomas, 15) registered investment companies in the American Century Investments family of funds.
The following table presents additional information about the directors. The mailing address for each director other than Mr. Thomas is 1665 Charleston Road, Mountain View, California 94043. The mailing address for Mr. Thomas is 4500 Main Street, Kansas City, Missouri 64111.
|
| | | | | |
Name (Year of Birth) | Position(s) Held with Funds | Length of Time Served | Principal Occupation(s) During Past 5 Years | Number of American Century Portfolios Overseen by Director | Other Directorships Held During Past 5 Years |
Independent Directors | | |
Tanya S. Beder
(1955) | Director | Since 2011 | Chairman and CEO, SBCC Group Inc. (independent advisory services) (2006 to present) | 46 | CYS Investments, Inc. (NYSE mortgage arbitrage REIT) |
Jeremy I. Bulow
(1954) | Director | Since 2011 | Professor of Economics, Stanford University, Graduate School of Business (1979 to present) | 46 | None |
Ronald J. Gilson
(1946) | Director and Chairman of the Board | Since 1995
(Chairman since 2005) | Charles J. Meyers Professor of Law and Business, Stanford Law School (1979 to present); Marc and Eva Stern Professor of Law and Business, Columbia University School of Law (1992 to present) | 46 | None |
Frederick L. A. Grauer
(1946) | Director | Since 2008 | Senior Advisor, BlackRock, Inc. (investment management firm) (2010 to 2011, 2013 to present) | 46 | None |
Peter F. Pervere
(1947) | Director | Since 2007 | Retired | 46 | None |
|
| | | | | |
Name (Year of Birth) | Position(s) Held with Funds | Length of Time Served | Principal Occupation(s) During Past 5 Years | Number of American Century Portfolios Overseen by Director | Other Directorships Held During Past 5 Years |
| Independent Directors | | |
John B. Shoven
(1947) | Director | Since 2002 | Professor of Economics, Stanford University (1973 to present) | 46 | Cadence Design Systems; Exponent; Financial Engines |
| Interested Director | | |
Jonathan S. Thomas
(1963) | Director and President | Since 2007 | President and Chief Executive Officer, ACC (March 2007 to present). Also serves as Chief Executive Officer, ACS; Executive Vice President, ACIM; Director, ACC, ACIM and other ACC subsidiaries | 124 | BioMed Valley Discoveries, Inc. |
The Statement of Additional Information has additional information about the fund's directors and is available without charge, upon request, by calling 1-800-345-2021.
Officers
The following table presents certain information about the executive officers of the funds. Each officer serves as an officer for each of the 15 investment companies in the American Century family of funds, unless otherwise noted. No officer is compensated for his or her service as an officer of the funds. The listed officers are interested persons of the funds and are appointed or re-appointed on an annual basis. The mailing address for each of the officers listed below is 4500 Main Street, Kansas City, Missouri 64111.
|
| | |
Name (Year of Birth) | Offices with the Funds | Principal Occupation(s) During the Past Five Years |
Jonathan S.
Thomas
(1963) | Director and President
since 2007 | President and Chief Executive Officer, ACC (March 2007 to present). Also serves as Chief Executive Officer, ACS; Executive Vice President, ACIM; Director, ACC, ACIM and other ACC subsidiaries |
Amy D. Shelton
(1964) | Chief Compliance Officer and Vice President since 2014 | Chief Compliance Officer, American Century funds, (March 2014 to present); Chief Compliance Officer, ACIM (February 2014 to present); Chief Compliance Officer, ACIS (October 2009 to present); Vice President, Client Interactions and Marketing, ACIS (February 2013 to January 2014); Director, Client Interactions and Marketing, ACIS (June 2007 to January 2013). Also serves as Vice President, ACIS |
Charles A. Etherington
(1957) | General Counsel since 2007 and Senior Vice President since 2006 | Attorney, ACC (February 1994 to present); Vice President, ACC (November 2005 to present); General Counsel, ACC (March 2007 to present). Also serves as General Counsel, ACIM, ACS, ACIS and other ACC subsidiaries; and Senior Vice President, ACIM and ACS |
C. Jean Wade
(1964) | Vice President, Treasurer and Chief Financial Officer since 2012 | Vice President, ACS (February 2000 to present) |
Robert J. Leach
(1966) | Vice President since 2006 and Assistant Treasurer since 2012 | Vice President, ACS (February 2000 to present) |
David H. Reinmiller
(1963) | Vice President since 2001 | Attorney, ACC (January 1994 to present); Associate General Counsel, ACC (January 2001 to present). Also serves as Vice President, ACIM and ACS |
Ward D. Stauffer
(1960) | Secretary since 2005 | Attorney, ACC (June 2003 to present) |
|
|
| Approval of Management Agreement |
At a meeting held on June 16, 2015, the Fund’s Board of Directors unanimously approved the renewal of the management agreement pursuant to which American Century Investment Management, Inc. (the “Advisor”) acts as the investment advisor for the Fund. Under Section 15(c) of the Investment Company Act, contracts for investment advisory services are required to be reviewed, evaluated, and approved by a majority of a fund’s directors/trustees, including a majority of the independent Directors, each year. The Board regards this annual evaluation and renewal as one of its most important responsibilities.
The independent Directors have memorialized a statement regarding the relationship between their ongoing obligations to oversee and evaluate the performance of the Advisor and their annual consideration of renewal of the management agreement. In that statement, the independent Directors noted that their assessment of the Advisor’s performance is an ongoing process that takes place over the entire year and is informed by all of the extensive information that the Board and its committees receive and consider over time. This information, together with the materials provided in connection with the review, are central to the Board’s assessment of the Advisor’s performance and its determination whether to renew the Fund’s management agreement.
Prior to its consideration of the renewal of the management agreement, the Board requested and reviewed extensive data and analysis relating to the proposed renewal. This information and analysis was compiled by the Advisor and certain independent providers of evaluation data concerning the Fund and the services provided to the Fund by the Advisor.
In connection with its consideration of the renewal of the management agreement, the Board’s review and evaluation of the services provided by the Advisor included, but was not limited to, the following:
| |
| • | the nature, extent, and quality of investment management, shareholder services, and other services provided by the Advisor to the Fund; |
| |
| • | the wide range of other programs and services the Advisor provides to the Fund and its shareholders on a routine and non-routine basis; |
| |
| • | the investment performance of the Fund, including data comparing the Fund’s performance to appropriate benchmarks and/or a peer group of other mutual funds with similar investment objectives and strategies; |
| |
| • | the cost of owning the Fund compared to the cost of owning similar funds; |
| |
| • | the Advisor’s compliance policies, procedures, and regulatory experience; |
| |
| • | financial data showing the cost of services provided to the Fund, the profitability of the Fund to the Advisor, and the overall profitability of the Advisor; |
| |
| • | possible economies of scale associated with the Advisor’s management of the Fund and other accounts under its management; |
| |
| • | data comparing services provided and charges to other investment management clients of the Advisor; |
| |
| • | acquired fund fees and expenses; |
| |
| • | payments by the Fund and the Advisor to financial intermediaries whose clients are investors in the Fund; and |
| |
| • | any collateral benefits derived by the Advisor from the management of the Fund. |
In keeping with its practice, the Board held two in-person meetings to review and discuss the information provided in response to their request. The independent Directors also had the benefit of the advice of their independent counsel throughout the process.
Factors Considered
The Directors considered all of the information provided by the Advisor, the independent data providers, and the independent Directors’ independent counsel in connection with the review, and evaluated such information for the Fund. In connection with their review, the Directors did not identify any single factor as being all-important or controlling and each Director may have attributed different levels of importance to different factors. In deciding to renew the management agreement, the Board based its decision on a number of factors, including the following:
Nature, Extent and Quality of Services - Generally. Under the management agreement, the Advisor is responsible for providing or arranging for all services necessary for the operation of the Fund. The Board noted that under the management agreement, the Advisor provides or arranges at its own expense a wide variety of services including:
| |
| • | constructing and designing the Fund |
| |
| • | portfolio research and security selection |
| |
| • | initial capitalization/funding |
| |
| • | daily valuation of the Fund’s portfolio |
| |
| • | shareholder servicing and transfer agency, including shareholder confirmations, recordkeeping, and communications |
| |
| • | legal services (except the independent Directors’ counsel) |
| |
| • | regulatory and portfolio compliance |
| |
| • | marketing and distribution (except amounts paid by the Fund under Rule 12b-1 plans) |
The Board noted that many of these services have expanded over time both in terms of quantity and complexity in response to shareholder demands, competition in the industry, changing distribution channels, and the changing regulatory environment.
Investment Management, Shareholder, and Other Services. The nature of the investment management services provided to the Fund is quite complex and allows Fund shareholders access to professional money management, instant diversification of their investments within an asset class, the opportunity to easily diversify among asset classes by investing in or exchanging among various American Century Investments funds, and liquidity. In evaluating investment performance, the Board expects the Advisor to manage the Fund in accordance with its investment objectives and approved strategies. Further, the Directors recognize that the Advisor has an obligation to seek the best execution of fund trades. In providing these services, the Advisor utilizes teams of investment professionals (portfolio managers, analysts, research assistants, and securities traders) who require extensive information technology, research, training, compliance, and other systems to conduct their business. The Board, directly and through its Portfolio Committee, regularly reviews investment performance information for the Fund, together with comparative information for appropriate benchmarks and/or peer groups of similarly-managed funds, over different time horizons. The Directors also review detailed performance information during the management agreement approval process. If performance concerns are identified, the Fund receives special reviews until performance improves, during which the Board discusses with the Advisor the reasons for such results (e.g., market conditions, security selection) and any efforts being undertaken to improve performance. The Fund’s performance was below its benchmark for the one-year period reviewed by the Board. The Board found the investment management services provided by the Advisor to the Fund to be satisfactory and consistent with the management agreement.
Under the management agreement, the Advisor provides the Fund with a comprehensive package of transfer agency, shareholder, and other services. The Board, directly and through various committees of the Board, regularly reviews reports and evaluations of such services at its regular
meetings. These reports include, but are not limited to, information regarding the operational efficiency and accuracy of the shareholder and transfer agency services provided, staffing levels, shareholder satisfaction (as measured by external as well as internal sources), technology support, new products and services offered to Fund shareholders, securities trading activities, portfolio valuation services, auditing services, and legal and operational compliance activities.
Certain aspects of shareholder and transfer agency service level efficiency and the quality of securities trading activities are measured by independent third party providers and are presented in comparison to other fund groups not managed by the Advisor. The Board found the services provided by the Advisor to the Fund under the management agreement to be competitive and of high quality.
Costs of Services and Profitability. The Advisor provides detailed information concerning its cost of providing various services to the Fund, its profitability in managing the Fund, its overall profitability, and its financial condition. The Directors have reviewed with the Advisor the methodology used to prepare this financial information. This information is considered in evaluating the Advisor’s financial condition, its ability to continue to provide services under the management agreement, and the reasonableness of the current management fee. The Board concluded that the Advisor’s profits were reasonable in light of the services provided to the Fund.
Ethics. The Board generally considers the Advisor’s commitment to providing quality services to shareholders and to conducting its business ethically. They noted that the Advisor’s practices generally meet or exceed industry best practices.
Economies of Scale. The Board also reviewed information provided by the Advisor regarding the possible existence of economies of scale in connection with the management of the Fund. The Board concluded that economies of scale are difficult to measure and predict with precision, especially on a fund-by-fund basis. The Board concluded that the Advisor is appropriately sharing economies of scale through its competitive fee structure, offering competitive fees from fund inception, and through reinvestment in its business to provide shareholders enhanced and expanded services.
Comparison to Other Funds’ Fees. The management agreement provides that the Fund pays the Advisor a single, all-inclusive (or unified) management fee for providing all services necessary for the management and operation of the Fund, other than brokerage expenses, taxes, interest, extraordinary expenses, the fees and expenses of the Fund’s independent Directors (including their independent legal counsel), and expenses incurred in connection with the provision of shareholder services and distribution services under a plan adopted pursuant to Rule 12b-1 under the 1940 Act. Under the unified fee structure, the Advisor is responsible for providing all investment advisory, custody, audit, administrative, compliance, recordkeeping, marketing, and shareholder services, or arranging and supervising third parties to provide such services. By contrast, most other funds are charged a variety of fees, including an investment advisory fee, a transfer agency fee, an administrative fee, distribution charges, and other expenses. Other than their investment advisory fees and any applicable Rule 12b-1 fees, all other components of the total fees charged by these other funds may be increased without shareholder approval. The Board believes the unified fee structure is a benefit to Fund shareholders because it clearly discloses to shareholders the cost of owning Fund shares, and, since the unified fee cannot be increased without a vote of Fund shareholders, it shifts to the Advisor the risk of increased costs of operating the Fund and provides a direct incentive to minimize administrative inefficiencies. Part of the Board’s analysis of fee levels involves reviewing certain evaluative data compiled by an independent provider and comparing the Fund’s unified fee to the total expense ratio of peer funds. The unified fee charged to shareholders of the Fund was above the median of the total expense ratios of the Fund’s peer universe. The Board concluded that the management fee paid by the Fund to the Advisor under the management agreement is reasonable in light of the services provided to the Fund.
Comparison to Fees and Services Provided to Other Clients of the Advisor. The Board also requested and received information from the Advisor concerning the nature of the services, fees, costs, and profitability of its advisory services to advisory clients other than the Fund. They observed that these varying types of client accounts require different services and involve different regulatory and entrepreneurial risks than the management of the Fund. The Board analyzed this information and concluded that the fees charged and services provided to the Fund were reasonable by comparison.
Payments to Intermediaries. The Directors also requested and received a description of payments made to intermediaries by the Fund and the Advisor. These payments include various payments made by the Fund or the Advisor to different types of intermediaries and recordkeepers for distribution and service activities provided for the Fund.
Collateral or “Fall-Out” Benefits Derived by the Advisor. The Board considered the existence of collateral benefits the Advisor may receive as a result of its relationship with the Fund. The Board noted that the Advisor’s primary business is managing mutual funds and it generally does not use fund or shareholder information to generate profits in other lines of business, and therefore does not derive any significant collateral benefits from them. The Board noted that the Advisor receives proprietary research from broker-dealers that execute fund portfolio transactions. The Board also determined that the Advisor is able to provide investment management services to certain clients other than the Fund, at least in part, due to its existing infrastructure built to serve the fund complex.
Existing Relationship. The Board also considered whether there was any reason for not continuing the existing arrangement with the Advisor. In this regard, the Board was mindful of the potential disruptions of the Fund’s operations and various risks, uncertainties, and other effects that could occur as a result of a decision not to continue such relationship. In particular, the Board recognized that most shareholders have invested in the Fund on the strength of the Advisor’s industry standing and reputation and in the expectation that the Advisor will have a continuing role in providing advisory services to the Fund.
Conclusion of the Directors. As a result of this process, the Board, including all of the independent Directors and assisted by the advice of independent legal counsel, taking into account all of the factors discussed above and the information provided by the Advisor and others in connection with its review and throughout the year, concluded that the management agreement between the Fund and the Advisor is fair and reasonable in light of the services provided and should be renewed.
Retirement Account Information
As required by law, distributions you receive from certain IRAs are subject to federal income tax withholding, unless you elect not to have withholding apply. Tax will be withheld on the total amount withdrawn even though you may be receiving amounts that are not subject to withholding, such as nondeductible contributions. In such case, excess amounts of withholding could occur. You may adjust your withholding election so that a greater or lesser amount will be withheld.
If you don’t want us to withhold on this amount, you must notify us to not withhold the federal income tax. You may notify us in writing or in certain situations by telephone or through other electronic means. For systematic withdrawals, your withholding election will remain in effect until revoked or changed by filing a new election. You have the right to revoke your election at any time.
Remember, even if you elect not to have income tax withheld, you are liable for paying income tax on the taxable portion of your withdrawal. If you elect not to have income tax withheld or you don’t have enough income tax withheld, you may be responsible for payment of estimated tax. You may incur penalties under the estimated tax rules if your withholding and estimated tax payments are not sufficient. You can reduce or defer the income tax on a distribution by directly or indirectly rolling such distribution over to another IRA or eligible plan. You should consult your tax advisor for additional information.
State tax will be withheld if, at the time of your distribution, your address is within one of the mandatory withholding states and you have federal income tax withheld (or as otherwise required by state law). State taxes will be withheld from your distribution in accordance with the respective state rules.
Distributions you receive from 403(b), 457 and qualified plans are subject to special tax and withholding rules. Your plan administrator or plan sponsor is required to provide you with a special tax notice explaining those rules at the time you request a distribution. If applicable, federal and/or state taxes may be withheld from your distribution amount.
Proxy Voting Policies
Descriptions of the principles and policies that the fund's investment advisor uses in exercising the voting rights associated with the securities purchased and/or held by the fund are available without charge, upon request, by calling 1-800-345-2021 or visiting the "About Us" page of American Century Investments’ website at americancentury.com. A description of the policies is also available on the Securities and Exchange Commission’s website at sec.gov. Information regarding how the investment advisor voted proxies relating to portfolio securities during the most recent 12-month period ended June 30 is available on the "About Us" page at americancentury.com. It is also available at sec.gov.
Quarterly Portfolio Disclosure
The fund files its complete schedule of portfolio holdings with the Securities and Exchange Commission (SEC) for the first and third quarters of each fiscal year on Form N-Q. The fund’s Forms N-Q are available on the SEC’s website at sec.gov, and may be reviewed and copied at the SEC’s Public Reference Room in Washington, DC. Information on the operation of the Public Reference Room may be obtained by calling 1-800-SEC-0330. The fund also makes its complete schedule of portfolio holdings for the most recent quarter of its fiscal year available on its website at americancentury.com and, upon request, by calling 1-800-345-2021.
Other Tax Information
The following information is provided pursuant to provisions of the Internal Revenue Code.
The fund hereby designates up to the maximum amount allowable as qualified dividend income for the fiscal year ended June 30, 2015.
For corporate taxpayers, the fund hereby designates $318, or up to the maximum amount allowable, of ordinary income distributions paid during the fiscal year ended June 30, 2015 as qualified for the corporate dividends received deduction.
For the fiscal year ended June 30, 2015, the fund intends to pass through to shareholders foreign source income of $249,687 and foreign taxes paid of $28,560, or up to the maximum amount allowable, as a foreign tax credit. Foreign source income and foreign tax expense per outstanding share on June 30, 2015 are $0.3631 and $0.0415, respectively.
|
| | |
| |
| | | |
| Contact Us | americancentury.com | |
| Automated Information Line | 1-800-345-8765 | |
| Investor Services Representative | 1-800-345-2021
or 816-531-5575 | |
| Investors Using Advisors | 1-800-378-9878 | |
Business, Not-For-Profit, Employer-Sponsored
Retirement Plans | 1-800-345-3533 | |
Banks and Trust Companies, Broker-Dealers,
Financial Professionals, Insurance Companies | 1-800-345-6488 | |
| Telecommunications Relay Service for the Deaf | 711 | |
| | | |
| American Century Quantitative Equity Funds, Inc. | |
| | | |
Investment Advisor: American Century Investment Management, Inc. Kansas City, Missouri | |
| | | |
| This report and the statements it contains are submitted for the general information of our shareholders. The report is not authorized for distribution to prospective investors unless preceded or accompanied by an effective prospectus. | |
| | | |
©2015 American Century Proprietary Holdings, Inc. All rights reserved.
CL-ANN-86512 1508 | |
|
| |
| ANNUAL REPORT | JUNE 30, 2015 |
Equity Growth Fund
|
| | |
| President's Letter | 2 |
|
| Performance | 3 |
|
| Portfolio Commentary | |
|
| Fund Characteristics | |
|
| Shareholder Fee Example | |
|
| Schedule of Investments | |
|
| Statement of Assets and Liabilities | |
|
| Statement of Operations | |
|
| Statement of Changes in Net Assets | |
|
| Notes to Financial Statements | |
|
| Financial Highlights | |
|
| Report of Independent Registered Public Accounting Firm | |
|
| Management | |
|
| Approval of Management Agreement | |
|
| Additional Information | |
|
Any opinions expressed in this report reflect those of the author as of the date of the report, and do not necessarily represent the opinions of American Century Investments® or any other person in the American Century Investments organization. Any such opinions are subject to change at any time based upon market or other conditions and American Century Investments disclaims any responsibility to update such opinions. These opinions may not be relied upon as investment advice and, because investment decisions made by American Century Investments funds are based on numerous factors, may not be relied upon as an indication of trading intent on behalf of any American Century Investments fund. Security examples are used for representational purposes only and are not intended as recommendations to purchase or sell securities. Performance information for comparative indices and securities is provided to American Century Investments by third party vendors. To the best of American Century Investments’ knowledge, such information is accurate at the time of printing.
|
| |
| Dear Investor:
Thank you for reviewing this annual report for the 12 months ended June 30, 2015. It provides investment performance and portfolio information for the reporting period, plus longer-term historical performance data.
Annual reports remain important vehicles for conveying information about fund returns, including market and economic factors that affected performance during the reporting period. For additional, updated investment and market insights, we encourage you to visit our website, americancentury.com. |
| Jonathan Thomas |
Global Divergence Favored U.S. Assets
“Global divergence” between the U.S. and the rest of the world emerged as a prevalent theme during the reporting period. This theme embraced not only the relatively stronger economic growth enjoyed by the U.S. compared with most of the world, but also the related contrast between the U.S. Federal Reserve’s unwinding of monetary stimulus compared with the continuation and expansion of stimulus by other major central banks. Low inflation also prevailed, after crude oil prices plunged over 40% amid muted demand for commodities in general. In this environment, the U.S. dollar, U.S. growth stocks, and longer-maturity U.S. Treasuries generally benefited from “flight to quality” capital flows, reinforced by geopolitical and financial turmoil, particularly in Greece, Russia/Ukraine, China, and the Middle East.
Strong global capital flows into U.S. assets generated a global divergence between investment returns for U.S. and non-U.S. markets, especially for U.S. investors who realized their returns in dollar terms. For the reporting period, the U.S. Dollar Index, the S&P 500 Index, and the Barclays U.S. Aggregate Bond Index returned 19.74%, 7.42%, and 1.86%, respectively. By contrast, the MSCI EAFE Index, the MSCI Emerging Markets Index, and the Barclays Global Aggregate Bond ex-USD (Unhedged) Index returned -4.22%, -5.12%, and -13.19%, respectively, for U.S. investors unhedged for the strong dollar’s impact on non-dollar-denominated returns.
We expect more monetary policy divergence between the U.S. and other major developed economies in the coming months, accompanied by continued market volatility. This could present both challenges and opportunities for active investment managers. Upward pressures on inflation and interest rates could develop as the massive amount of global monetary stimulus in progress takes hold and economies improve. In this environment, we continue to believe in a disciplined, diversified, long-term investment approach, using professionally managed stock and bond portfolios to meet financial goals. We appreciate your continued trust in us.
Sincerely,
Jonathan Thomas
President and Chief Executive Officer
American Century Investments
|
| | | | | | |
| Total Returns as of June 30, 2015 |
| | | | Average Annual Returns | |
| | Ticker Symbol | 1 year | 5 years | 10 years | Since Inception | Inception Date |
| Investor Class | BEQGX | 5.93% | 17.42% | 7.43% | 9.62% | 5/9/91 |
| S&P 500 Index | — | 7.42% | 17.33% | 7.89% | 9.50% | — |
| Institutional Class | AMEIX | 6.13% | 17.65% | 7.65% | 6.48% | 1/2/98 |
A Class(1) | BEQAX | | | | | 10/9/97 |
| No sales charge* | | 5.67% | 17.13% | 7.17% | 5.90% | |
| With sales charge* | | -0.41% | 15.75% | 6.53% | 5.55% | |
| C Class | AEYCX | 4.87% | 16.26% | 6.37% | 5.25% | 7/18/01 |
| R Class | AEYRX | 5.38% | 16.83% | — | 6.51% | 7/29/05 |
| |
| * | Sales charges include initial sales charges and contingent deferred sales charges (CDSCs), as applicable. A Class shares have a 5.75% maximum initial sales charge and may be subject to a maximum CDSC of 1.00%. C Class shares redeemed within 12 months of purchase are subject to a maximum CDSC of 1.00%. The SEC requires that mutual funds provide performance information net of maximum sales charges in all cases where charges could be applied. |
| |
| (1) | Prior to September 4, 2007, the A Class was referred to as the Advisor Class and did not have a front-end sales charge. Performance prior to that date has been adjusted to reflect this charge. |
Data presented reflect past performance. Past performance is no guarantee of future results. Current performance may be higher or lower than the performance shown. Investment return and principal value will fluctuate, and redemption value may be more or less than original cost. Data assumes reinvestment of dividends and capital gains, and none of the charts reflect the deduction of taxes that a shareholder would pay on fund distributions or the redemption of fund shares. To obtain performance data current to the most recent month end, please call 1-800-345-2021 or visit americancentury.com. For additional information about the fund, please consult the prospectus.
|
|
| Growth of $10,000 Over 10 Years |
| $10,000 investment made June 30, 2005 |
| Performance for other share classes will vary due to differences in fee structure. |
|
| |
| Value on June 30, 2015 |
| | Investor Class — $20,494 |
| |
| | S&P 500 Index — $21,377 |
| |
|
| | | | |
| Total Annual Fund Operating Expenses | | |
| Investor Class | Institutional Class | A Class | C Class | R Class |
| 0.67% | 0.47% | 0.92% | 1.67% | 1.17% |
The total annual fund operating expenses shown is as stated in the fund’s prospectus current as of the date of this report. The prospectus may vary from the expense ratio shown elsewhere in this report because it is based on a different time period, includes acquired fund fees and expenses, and, if applicable, does not include fee waivers or expense reimbursements.
Data presented reflect past performance. Past performance is no guarantee of future results. Current performance may be higher or lower than the performance shown. Investment return and principal value will fluctuate, and redemption value may be more or less than original cost. Data assumes reinvestment of dividends and capital gains, and none of the charts reflect the deduction of taxes that a shareholder would pay on fund distributions or the redemption of fund shares. To obtain performance data current to the most recent month end, please call 1-800-345-2021 or visit americancentury.com. For additional information about the fund, please consult the prospectus.
Portfolio Managers: Bill Martin and Claudia Musat
Performance Summary
Equity Growth returned 5.93%* for the fiscal year ended June 30, 2015, compared with the 7.42% return of its benchmark, the S&P 500 Index.
U.S. equity markets endured substantial volatility, but ended the 12-month period with advances. Equity Growth produced gains during the fiscal year, but was unable to match the return of its benchmark. Security selection in the information technology, financials, and consumer discretionary sectors detracted from fund results, while positioning in the energy and utilities sectors contributed to relative performance.
Equity Growth’s stock selection process incorporates factors of valuation, quality, growth, and sentiment while striving to minimize unintended risks along industries and other risk characteristics. Within the fund, valuation- and growth-based factors proved most difficult, while quality and sentiment indicators were mildly positive.
Security Selection Across a Number of Sectors Hampered Relative Gains
Information technology sector holdings diminished the fund’s gains, with detraction spread across a number of industries. Leading underperformance on a security level came from an overweight position, relative to the benchmark, in QUALCOMM. The semiconductor manufacturer’s stock price fell sharply after company management reduced revenue and earnings estimates for the coming year based on the supposition that a major smartphone customer would turn to a different processor supplier rather than using QUALCOMM’s high-end Snapdragon 810 processor.
The financials sector was also an area of underperformance, stemming largely from a number of capital markets holdings and stock selection in real estate investment trusts, although no individual position was a leading fund detractor. In the consumer discretionary sector, positioning among specialty and internet retailers weighed on fund results. Not holding home improvement retailer Home Depot, which continued to benefit from rising sales due to historically low interest rates that have driven new home purchases and existing home renovation plans, hurt results. Nevertheless, the company’s valuation metrics remain weak. Similarly, an underweight position in internet retailer Amazon.com, whose stock price continued to rise on strength in the company’s cloud computing business, was detrimental. We exited out of the position due to weak valuation signals as we believe that stock demonstrates the market’s preference for expensive growth names.
Although the energy sector was an overall contributor to relative gains, a number of individual holdings weighed on results. An overweight position in Baker Hughes, a provider of services to the oilfield industry, was detrimental, particularly during the first half of the period when the company’s stock declined amid concerns about falling oil prices and the effects of sanctions on its Russia-based operations. Similarly, EOG Resources, a crude oil producer, was impacted by the slump in oil prices. Both positions were sold out of the fund.
| |
| * | All fund returns referenced in this commentary are for Investor Class shares. Performance for other share classes will vary due to differences in fee structure; when Investor Class performance exceeds that of the fund's benchmark, other share classes may not. See page 3 for returns for all share classes. |
Energy was Leading Sector Contributor
Positioning in the energy sector, particularly underweight exposure to oil, gas, and consumable fuels holdings, bolstered the fund’s relative returns. Key contribution stemmed from holding less than the benchmark weighting in Chevron, which declined steadily throughout the period together with the price of oil.
A number of individual outperformers were health care sector names. An overweight position in insurance and managed care provider Aetna was a key contributor in the space, advancing amid merger speculation in the recent wave of health insurance industry consolidation. Higher demand for its therapies led biotechnology company Amgen to consistently beat earnings and revenue expectations. In addition, management’s restructuring and share buyback programs further supported the company’s stock price.
Elsewhere, gains were bolstered by an overweight position in Broadcom. The semiconductor designer’s stock rose following strong quarterly results, and again after a merger announcement with industry rival Avago in a deal that is expected to create the world’s leading communications semiconductor company. Our valuation, quality, and growth indicators showed modest deterioration late in the period and we liquidated the position.
A Look Ahead
The U.S. economy seems poised to continue to experience hesitant economic growth through the second half of 2015. Economic activity appears to have somewhat diminished in breadth, though remains slow yet steady. We believe that divergence in monetary policy between the U.S. and much of the rest of the world is likely to continue. Therefore, questions surrounding when and how much the U.S. Federal Reserve might act to tighten money supply, and the potential impact of such a move, are likely to continue driving investor sentiment in equity markets. Our disciplined, objective, and systematic investment strategy is designed to take advantage of opportunities at the individual company level. We believe this approach is the most powerful way to capitalize on market inefficiencies that lead to the mispricing of individual stocks. Our strategy is designed to provide investors with well-diversified and risk-controlled exposure to broad U.S. equities. As such we do not see significant deviations versus the S&P 500. The fund’s largest, but modest, overweights are in the industrials and health care sectors, while the underweights are led by the utilities and financials sectors.
|
| |
| JUNE 30, 2015 |
| Top Ten Holdings | % of net assets |
| Apple, Inc. | 3.5% |
| Microsoft Corp. | 2.6% |
| Pfizer, Inc. | 1.9% |
| Procter & Gamble Co. (The) | 1.9% |
| JPMorgan Chase & Co. | 1.8% |
| Gilead Sciences, Inc. | 1.8% |
| Citigroup, Inc. | 1.7% |
| Comcast Corp., Class A | 1.6% |
| Merck & Co., Inc. | 1.6% |
| Intel Corp. | 1.6% |
| | |
| Top Five Industries | % of net assets |
| Pharmaceuticals | 6.4% |
| Biotechnology | 5.6% |
| Technology Hardware, Storage and Peripherals | 5.5% |
| Software | 4.9% |
| Banks | 4.7% |
| | |
| Types of Investments in Portfolio | % of net assets |
| Common Stocks | 99.1% |
| Temporary Cash Investments | 0.9% |
| Other Assets and Liabilities | —* |
*Category is less than 0.05% of total net assets.
Fund shareholders may incur two types of costs: (1) transaction costs, including sales charges (loads) on purchase payments and redemption/exchange fees; and (2) ongoing costs, including management fees; distribution and service (12b-1) fees; and other fund expenses. This example is intended to help you understand your ongoing costs (in dollars) of investing in your fund and to compare these costs with the ongoing cost of investing in other mutual funds.
The example is based on an investment of $1,000 made at the beginning of the period and held for the entire period from January 1, 2015 to June 30, 2015.
Actual Expenses
The table provides information about actual account values and actual expenses for each class. You may use the information, together with the amount you invested, to estimate the expenses that you paid over the period. First, identify the share class you own. Then simply divide your account value by $1,000 (for example, an $8,600 account value divided by $1,000 = 8.6), then multiply the result by the number under the heading “Expenses Paid During Period” to estimate the expenses you paid on your account during this period.
If you hold Investor Class shares of any American Century Investments fund, or Institutional Class shares of the American Century Diversified Bond Fund, in an American Century Investments account (i.e., not a financial intermediary or retirement plan account), American Century Investments may charge you a $12.50 semiannual account maintenance fee if the value of those shares is less than $10,000. We will redeem shares automatically in one of your accounts to pay the $12.50 fee. In determining your total eligible investment amount, we will include your investments in all personal accounts (including American Century Investments Brokerage accounts) registered under your Social Security number. Personal accounts include individual accounts, joint accounts, UGMA/UTMA accounts, personal trusts, Coverdell Education Savings Accounts and IRAs (including traditional, Roth, Rollover, SEP-, SARSEP- and SIMPLE-IRAs), and certain other retirement accounts. If you have only business, business retirement, employer-sponsored or American Century Investments Brokerage accounts, you are currently not subject to this fee. If you are subject to the Account Maintenance Fee, your account value could be reduced by the fee amount.
Hypothetical Example for Comparison Purposes
The table also provides information about hypothetical account values and hypothetical expenses based on the actual expense ratio of each class of your fund and an assumed rate of return of 5% per year before expenses, which is not the actual return of a fund’s share class. The hypothetical account values and expenses may not be used to estimate the actual ending account balance or expenses you paid for the period. You may use this information to compare the ongoing costs of investing in your fund and other funds. To do so, compare this 5% hypothetical example with the 5% hypothetical examples that appear in the shareholder reports of the other funds.
Please note that the expenses shown in the table are meant to highlight your ongoing costs only and do not reflect any transactional costs, such as sales charges (loads) or redemption/exchange fees. Therefore, the table is useful in comparing ongoing costs only, and will not help you determine the relative total costs of owning different funds. In addition, if these transactional costs were included, your costs would have been higher.
|
| | | | |
| | Beginning
Account Value
1/1/15 | Ending
Account Value
6/30/15 | Expenses Paid
During Period(1)
1/1/15 - 6/30/15 | Annualized
Expense Ratio(1) |
| Actual | | | | |
| Investor Class | $1,000 | $1,000.90 | $3.32 | 0.67% |
| Institutional Class | $1,000 | $1,001.80 | $2.33 | 0.47% |
| A Class | $1,000 | $999.80 | $4.56 | 0.92% |
| C Class | $1,000 | $996.10 | $8.27 | 1.67% |
| R Class | $1,000 | $998.40 | $5.80 | 1.17% |
| Hypothetical | | | | |
| Investor Class | $1,000 | $1,021.47 | $3.36 | 0.67% |
| Institutional Class | $1,000 | $1,022.46 | $2.36 | 0.47% |
| A Class | $1,000 | $1,020.23 | $4.61 | 0.92% |
| C Class | $1,000 | $1,016.51 | $8.35 | 1.67% |
| R Class | $1,000 | $1,018.99 | $5.86 | 1.17% |
| |
| (1) | Expenses are equal to the class's annualized expense ratio listed in the table above, multiplied by the average account value over the period, multiplied by 181, the number of days in the most recent fiscal half-year, divided by 365, to reflect the one-half year period. |
JUNE 30, 2015
|
| | | | |
| | Shares | Value |
| COMMON STOCKS — 99.1% | | |
| Aerospace and Defense — 3.7% | | |
| Boeing Co. (The) | 137,412 | $ | 19,061,793 |
|
| General Dynamics Corp. | 123,436 | 17,489,647 |
|
| Honeywell International, Inc. | 417,994 | 42,622,848 |
|
| Huntington Ingalls Industries, Inc. | 60,689 | 6,832,974 |
|
Spirit AeroSystems Holdings, Inc., Class A(1) | 334,910 | 18,456,890 |
|
| Textron, Inc. | 648,479 | 28,941,618 |
|
| | | 133,405,770 |
|
| Airlines — 1.9% | | |
| Delta Air Lines, Inc. | 283,107 | 11,630,036 |
|
| Southwest Airlines Co. | 901,659 | 29,835,896 |
|
United Continental Holdings, Inc.(1) | 521,978 | 27,670,054 |
|
| | | 69,135,986 |
|
| Auto Components — 0.1% | | |
| Delphi Automotive plc | 48,883 | 4,159,454 |
|
| Banks — 4.7% | | |
| Bank of America Corp. | 1,219,889 | 20,762,511 |
|
| Citigroup, Inc. | 1,091,352 | 60,286,284 |
|
| JPMorgan Chase & Co. | 954,267 | 64,661,132 |
|
| Wells Fargo & Co. | 415,649 | 23,376,100 |
|
| | | 169,086,027 |
|
| Beverages — 2.1% | | |
| Coca-Cola Co. (The) | 89,153 | 3,497,472 |
|
| Dr Pepper Snapple Group, Inc. | 259,883 | 18,945,471 |
|
| PepsiCo, Inc. | 577,883 | 53,939,599 |
|
| | | 76,382,542 |
|
| Biotechnology — 5.6% | | |
| Amgen, Inc. | 352,724 | 54,150,188 |
|
Biogen, Inc.(1) | 116,290 | 46,974,183 |
|
Celgene Corp.(1) | 341,782 | 39,556,140 |
|
| Gilead Sciences, Inc. | 544,831 | 63,788,813 |
|
| | | 204,469,324 |
|
| Capital Markets — 2.8% | | |
| Ameriprise Financial, Inc. | 250,453 | 31,289,093 |
|
| Artisan Partners Asset Management, Inc., Class A | 75,462 | 3,505,965 |
|
| Franklin Resources, Inc. | 621,706 | 30,482,245 |
|
| Legg Mason, Inc. | 522,786 | 26,939,163 |
|
| Waddell & Reed Financial, Inc., Class A | 229,227 | 10,844,729 |
|
| | | 103,061,195 |
|
| Chemicals — 2.9% | | |
| Cabot Corp. | 602,596 | 22,470,805 |
|
| Dow Chemical Co. (The) | 798,869 | 40,878,126 |
|
|
| | | | |
| | Shares | Value |
| E.I. du Pont de Nemours & Co. | 35,099 | $ | 2,244,581 |
|
| LyondellBasell Industries NV, Class A | 380,319 | 39,370,623 |
|
| | | 104,964,135 |
|
| Commercial Services and Supplies — 0.1% | | |
| Pitney Bowes, Inc. | 75,505 | 1,571,259 |
|
| Waste Management, Inc. | 75,071 | 3,479,541 |
|
| | | 5,050,800 |
|
| Communications Equipment — 2.8% | | |
| Cisco Systems, Inc. | 2,044,535 | 56,142,931 |
|
| QUALCOMM, Inc. | 720,962 | 45,153,850 |
|
| | | 101,296,781 |
|
| Consumer Finance — 0.1% | | |
Credit Acceptance Corp.(1) | 9,437 | 2,323,201 |
|
| Diversified Consumer Services — 0.5% | | |
| H&R Block, Inc. | 609,980 | 18,085,907 |
|
| Diversified Financial Services — 0.5% | | |
Berkshire Hathaway, Inc., Class B(1) | 138,098 | 18,796,519 |
|
| Diversified Telecommunication Services — 0.5% | | |
| AT&T, Inc. | 199,881 | 7,099,773 |
|
| Verizon Communications, Inc. | 257,516 | 12,002,821 |
|
| | | 19,102,594 |
|
| Electric Utilities — 0.2% | | |
| NextEra Energy, Inc. | 86,798 | 8,508,808 |
|
| Electrical Equipment — 0.9% | | |
| Emerson Electric Co. | 586,265 | 32,496,669 |
|
| Electronic Equipment, Instruments and Components — 0.9% | | |
| Corning, Inc. | 1,574,071 | 31,056,421 |
|
| Energy Equipment and Services — 1.3% | | |
| Schlumberger Ltd. | 566,674 | 48,841,632 |
|
| Food and Staples Retailing — 3.5% | | |
| CVS Health Corp. | 432,068 | 45,315,292 |
|
| Kroger Co. (The) | 459,673 | 33,330,889 |
|
| Wal-Mart Stores, Inc. | 694,741 | 49,277,979 |
|
| | | 127,924,160 |
|
| Food Products — 3.5% | | |
| Archer-Daniels-Midland Co. | 743,437 | 35,848,532 |
|
| Bunge Ltd. | 307,224 | 26,974,267 |
|
| ConAgra Foods, Inc. | 367,304 | 16,058,531 |
|
| Ingredion, Inc. | 248,171 | 19,806,528 |
|
| Pilgrim's Pride Corp. | 892,097 | 20,491,468 |
|
| Sanderson Farms, Inc. | 110,951 | 8,339,077 |
|
| | | 127,518,403 |
|
| Health Care Equipment and Supplies — 1.8% | | |
| St. Jude Medical, Inc. | 458,817 | 33,525,758 |
|
| Stryker Corp. | 349,974 | 33,447,015 |
|
| | | 66,972,773 |
|
|
| | | | |
| | Shares | Value |
| Health Care Providers and Services — 2.9% | | |
| Aetna, Inc. | 285,790 | $ | 36,426,793 |
|
| Cardinal Health, Inc. | 48,647 | 4,069,322 |
|
Express Scripts Holding Co.(1) | 325,794 | 28,976,118 |
|
HCA Holdings, Inc.(1) | 378,243 | 34,314,205 |
|
| UnitedHealth Group, Inc. | 13,964 | 1,703,608 |
|
| | | 105,490,046 |
|
| Health Care Technology — 0.8% | | |
Cerner Corp.(1) | 424,493 | 29,315,487 |
|
| Hotels, Restaurants and Leisure — 2.4% | | |
| Brinker International, Inc. | 487,110 | 28,081,891 |
|
| Cracker Barrel Old Country Store, Inc. | 54,418 | 8,116,989 |
|
| Darden Restaurants, Inc. | 219,949 | 15,633,975 |
|
| Las Vegas Sands Corp. | 470,818 | 24,750,902 |
|
| Wyndham Worldwide Corp. | 104,501 | 8,559,677 |
|
| | | 85,143,434 |
|
| Household Products — 1.9% | | |
| Procter & Gamble Co. (The) | 886,444 | 69,355,379 |
|
| Industrial Conglomerates — 1.9% | | |
| 3M Co. | 300,055 | 46,298,487 |
|
| General Electric Co. | 871,858 | 23,165,267 |
|
| | | 69,463,754 |
|
| Insurance — 2.7% | | |
| Allstate Corp. (The) | 497,696 | 32,285,539 |
|
| Amtrust Financial Services, Inc. | 404,603 | 26,505,543 |
|
| Aspen Insurance Holdings Ltd. | 326,108 | 15,620,573 |
|
| Hanover Insurance Group, Inc. (The) | 318,929 | 23,610,314 |
|
| | | 98,021,969 |
|
| Internet Software and Services — 2.1% | | |
eBay, Inc.(1) | 704,117 | 42,416,008 |
|
Google, Inc., Class A(1) | 58,965 | 31,843,459 |
|
| | | 74,259,467 |
|
| IT Services — 3.2% | | |
| Accenture plc, Class A | 415,397 | 40,202,122 |
|
| Amdocs Ltd. | 362,646 | 19,796,845 |
|
| International Business Machines Corp. | 345,858 | 56,257,262 |
|
| | | 116,256,229 |
|
| Life Sciences Tools and Services — 0.2% | | |
Bio-Rad Laboratories, Inc., Class A(1) | 48,503 | 7,305,037 |
|
| Machinery — 4.0% | | |
| Caterpillar, Inc. | 430,831 | 36,543,085 |
|
| Cummins, Inc. | 230,949 | 30,298,199 |
|
| PACCAR, Inc. | 253,765 | 16,192,745 |
|
| Parker-Hannifin Corp. | 248,259 | 28,879,970 |
|
| Stanley Black & Decker, Inc. | 301,859 | 31,767,641 |
|
| | | 143,681,640 |
|
|
| | | | |
| | Shares | Value |
| Media — 3.3% | | |
| Comcast Corp., Class A | 988,546 | $ | 59,451,157 |
|
DIRECTV(1) | 97,232 | 9,022,157 |
|
| Omnicom Group, Inc. | 243,800 | 16,941,662 |
|
| Twenty-First Century Fox, Inc. | 377,472 | 12,284,826 |
|
| Viacom, Inc., Class B | 279,691 | 18,079,226 |
|
| Walt Disney Co. (The) | 20,012 | 2,284,170 |
|
| | | 118,063,198 |
|
| Metals and Mining — 0.5% | | |
| Alcoa, Inc. | 1,490,792 | 16,622,331 |
|
| Multi-Utilities — 0.1% | | |
| Public Service Enterprise Group, Inc. | 70,211 | 2,757,888 |
|
| Multiline Retail — 2.9% | | |
| Big Lots, Inc. | 385,558 | 17,346,255 |
|
| Dillard's, Inc., Class A | 185,817 | 19,546,090 |
|
| Kohl's Corp. | 475,879 | 29,794,784 |
|
| Target Corp. | 479,854 | 39,170,482 |
|
| | | 105,857,611 |
|
| Oil, Gas and Consumable Fuels — 4.1% | | |
| Chevron Corp. | 93,776 | 9,046,571 |
|
| CVR Energy, Inc. | 78,899 | 2,969,758 |
|
| Exxon Mobil Corp. | 491,477 | 40,890,886 |
|
| Marathon Petroleum Corp. | 169,818 | 8,883,180 |
|
| Murphy Oil Corp. | 681,405 | 28,326,006 |
|
| Valero Energy Corp. | 666,182 | 41,702,993 |
|
| Western Refining, Inc. | 377,997 | 16,488,229 |
|
| | | 148,307,623 |
|
| Pharmaceuticals — 6.4% | | |
| AbbVie, Inc. | 778,749 | 52,324,145 |
|
| Johnson & Johnson | 533,311 | 51,976,490 |
|
| Merck & Co., Inc. | 1,026,279 | 58,426,064 |
|
| Pfizer, Inc. | 2,071,565 | 69,459,574 |
|
| | | 232,186,273 |
|
| Real Estate Investment Trusts (REITs) — 2.1% | | |
| Hospitality Properties Trust | 518,988 | 14,957,234 |
|
| Lamar Advertising Co., Class A | 476,101 | 27,366,285 |
|
| Plum Creek Timber Co., Inc. | 132,696 | 5,383,477 |
|
| RLJ Lodging Trust | 390,969 | 11,643,057 |
|
| Ryman Hospitality Properties, Inc. | 286,154 | 15,197,639 |
|
| | | 74,547,692 |
|
| Real Estate Management and Development — 0.8% | | |
CBRE Group, Inc.(1) | 54,298 | 2,009,026 |
|
| Jones Lang LaSalle, Inc. | 147,944 | 25,298,424 |
|
| | | 27,307,450 |
|
| Semiconductors and Semiconductor Equipment — 2.6% | | |
| Intel Corp. | 1,859,630 | 56,560,646 |
|
|
| | | | |
| | Shares | Value |
| Texas Instruments, Inc. | 713,990 | $ | 36,777,625 |
|
| | | 93,338,271 |
|
| Software — 4.9% | | |
| Activision Blizzard, Inc. | 196,145 | 4,748,671 |
|
| Microsoft Corp. | 2,143,556 | 94,637,997 |
|
| Oracle Corp. | 1,330,494 | 53,618,908 |
|
Synopsys, Inc.(1) | 513,990 | 26,033,594 |
|
| | | 179,039,170 |
|
| Specialty Retail — 2.9% | | |
Bed Bath & Beyond, Inc.(1) | 112,721 | 7,775,494 |
|
| Foot Locker, Inc. | 506,366 | 33,931,586 |
|
| Gap, Inc. (The) | 670,048 | 25,575,732 |
|
| Lowe's Cos., Inc. | 590,480 | 39,544,446 |
|
| | | 106,827,258 |
|
| Technology Hardware, Storage and Peripherals — 5.5% | | |
| Apple, Inc. | 1,000,695 | 125,512,170 |
|
| EMC Corp. | 278,812 | 7,357,849 |
|
| Hewlett-Packard Co. | 1,159,367 | 34,792,604 |
|
| Seagate Technology plc | 191,289 | 9,086,228 |
|
| Western Digital Corp. | 299,870 | 23,515,805 |
|
| | | 200,264,656 |
|
| Textiles, Apparel and Luxury Goods — 0.1% | | |
| Wolverine World Wide, Inc. | 93,344 | 2,658,437 |
|
| Thrifts and Mortgage Finance — 0.4% | | |
Essent Group Ltd.(1) | 272,639 | 7,456,677 |
|
| EverBank Financial Corp. | 305,059 | 5,994,409 |
|
| | | 13,451,086 |
|
TOTAL COMMON STOCKS (Cost $3,073,225,707) | | 3,592,160,487 |
|
| TEMPORARY CASH INVESTMENTS — 0.9% | | |
Repurchase Agreement, Bank of America Merrill Lynch, (collateralized by various U.S. Treasury obligations, 1.50%, 1/31/19 - 11/30/19, valued at $5,577,302), in a joint trading account at 0.10%, dated 6/30/15, due 7/1/15 (Delivery value $5,466,023) | | 5,466,008 |
|
| Repurchase Agreement, Fixed Income Clearing Corp., (collateralized by various U.S. Treasury obligations, 1.625%, 8/15/22, valued at $22,304,808), at 0.01%, dated 6/30/15, due 7/1/15 (Delivery value $21,867,006) | | 21,867,000 |
|
| State Street Institutional Liquid Reserves Fund, Premier Class | 5,413,691 | 5,413,691 |
|
TOTAL TEMPORARY CASH INVESTMENTS (Cost $32,746,699) | | 32,746,699 |
|
TOTAL INVESTMENT SECURITIES — 100.0% (Cost $3,105,972,406) | | 3,624,907,186 |
|
OTHER ASSETS AND LIABILITIES† | | 1,276,901 |
|
| TOTAL NET ASSETS — 100.0% | | $ | 3,626,184,087 |
|
|
| | |
| NOTES TO SCHEDULE OF INVESTMENTS |
| |
| † | Category is less than 0.05% of total net assets. |
See Notes to Financial Statements.
|
|
| Statement of Assets and Liabilities |
|
| | | |
| JUNE 30, 2015 | |
| Assets | |
| Investment securities, at value (cost of $3,105,972,406) | $ | 3,624,907,186 |
|
| Receivable for investments sold | 12,633,857 |
|
| Receivable for capital shares sold | 4,365,188 |
|
| Dividends and interest receivable | 4,293,539 |
|
| | 3,646,199,770 |
|
| | |
| Liabilities | |
| Payable for investments purchased | 10,651,513 |
|
| Payable for capital shares redeemed | 7,338,535 |
|
| Accrued management fees | 1,937,631 |
|
| Distribution and service fees payable | 88,004 |
|
| | 20,015,683 |
|
| | |
| Net Assets | $ | 3,626,184,087 |
|
| | |
| Net Assets Consist of: | |
| Capital (par value and paid-in surplus) | $ | 2,897,807,102 |
|
| Undistributed net investment income | 732,783 |
|
| Undistributed net realized gain | 208,709,422 |
|
| Net unrealized appreciation | 518,934,780 |
|
| | $ | 3,626,184,087 |
|
|
| | | | | | |
| | Net Assets | Shares Outstanding | Net Asset Value Per Share |
| Investor Class, $0.01 Par Value |
| $2,886,975,807 |
| 94,472,358 |
| $30.56 |
| Institutional Class, $0.01 Par Value |
| $497,333,418 |
| 16,263,393 |
| $30.58 |
| A Class, $0.01 Par Value |
| $195,261,732 |
| 6,396,078 |
| $30.53* |
| C Class, $0.01 Par Value |
| $16,342,441 |
| 539,529 |
| $30.29 |
| R Class, $0.01 Par Value |
| $30,270,689 |
| 991,056 |
| $30.54 |
*Maximum offering price $32.39 (net asset value divided by 0.9425).
See Notes to Financial Statements.
|
| | | |
| YEAR ENDED JUNE 30, 2015 | |
| Investment Income (Loss) | |
| Income: | |
| Dividends (net of foreign taxes withheld of $52,565) | $ | 74,569,219 |
|
| Interest | 9,544 |
|
| | 74,578,763 |
|
| | |
| Expenses: | |
| Management fees | 22,342,686 |
|
| Distribution and service fees: | |
| A Class | 805,064 |
|
| C Class | 152,997 |
|
| R Class | 122,516 |
|
| Directors' fees and expenses | 174,536 |
|
| | 23,597,799 |
|
| | |
| Net investment income (loss) | 50,980,964 |
|
| | |
| Realized and Unrealized Gain (Loss) | |
| Net realized gain (loss) on investment transactions | 363,455,274 |
|
| Change in net unrealized appreciation (depreciation) on investments | (217,200,573 | ) |
| | |
| Net realized and unrealized gain (loss) | 146,254,701 |
|
| | |
| Net Increase (Decrease) in Net Assets Resulting from Operations | $ | 197,235,665 |
|
See Notes to Financial Statements.
|
|
| Statement of Changes in Net Assets |
|
| | | | | | |
| YEARS ENDED JUNE 30, 2015 AND JUNE 30, 2014 |
| Increase (Decrease) in Net Assets | June 30, 2015 | June 30, 2014 |
| Operations | | |
| Net investment income (loss) | $ | 50,980,964 |
| $ | 43,730,070 |
|
| Net realized gain (loss) | 363,455,274 |
| 343,786,771 |
|
| Change in net unrealized appreciation (depreciation) | (217,200,573 | ) | 274,003,480 |
|
| Net increase (decrease) in net assets resulting from operations | 197,235,665 |
| 661,520,321 |
|
| | | |
| Distributions to Shareholders | | |
| From net investment income: | | |
| Investor Class | (37,349,584 | ) | (33,042,705 | ) |
| Institutional Class | (7,409,434 | ) | (6,326,318 | ) |
| A Class | (3,702,487 | ) | (3,111,946 | ) |
| C Class | (59,419 | ) | (43,709 | ) |
| R Class | (227,876 | ) | (103,113 | ) |
| From net realized gains: | | |
| Investor Class | (282,828,250 | ) | (97,419,589 | ) |
| Institutional Class | (48,133,435 | ) | (16,453,295 | ) |
| A Class | (33,969,356 | ) | (11,119,624 | ) |
| C Class | (1,618,433 | ) | (452,244 | ) |
| R Class | (2,983,117 | ) | (534,564 | ) |
| Decrease in net assets from distributions | (418,281,391 | ) | (168,607,107 | ) |
| | | |
| Capital Share Transactions | | |
Net increase (decrease) in net assets from capital share transactions (Note 5) | 503,434,509 |
| 208,528,008 |
|
| | | |
| Net increase (decrease) in net assets | 282,388,783 |
| 701,441,222 |
|
| | | |
| Net Assets | | |
| Beginning of period | 3,343,795,304 |
| 2,642,354,082 |
|
| End of period | $ | 3,626,184,087 |
| $ | 3,343,795,304 |
|
| | | |
| Undistributed net investment income | $ | 732,783 |
| $ | 2,227,251 |
|
See Notes to Financial Statements.
|
|
| Notes to Financial Statements |
JUNE 30, 2015
1. Organization
American Century Quantitative Equity Funds, Inc. (the corporation) is registered under the Investment Company Act of 1940, as amended (the 1940 Act), as an open-end management investment company and is organized as a Maryland corporation. Equity Growth Fund (the fund) is one fund in a series issued by the corporation. The fund is diversified as defined under the 1940 Act. The fund’s investment objective is to seek long-term capital growth by investing in common stocks.
The fund offers the Investor Class, the Institutional Class, the A Class, the C Class and the R Class. The A Class may incur an initial sales charge. The A Class and C Class may be subject to a contingent deferred sales charge. The share classes differ principally in their respective sales charges and distribution and shareholder servicing expenses and arrangements. The Institutional Class is made available to institutional shareholders or through financial intermediaries whose clients do not require the same level of shareholder and administrative services as shareholders of other classes. As a result, the Institutional Class is charged a lower unified management fee.
2. Significant Accounting Policies
The following is a summary of significant accounting policies consistently followed by the fund in preparation of its financial statements. The fund is an investment company and follows accounting and reporting guidance in accordance with accounting principles generally accepted in the United States of America. This may require management to make certain estimates and assumptions at the date of the financial statements. Actual results could differ from these estimates. Management evaluated the impact of events or transactions occurring through the date the financial statements were issued that would merit recognition or disclosure.
Investment Valuations — The fund determines the fair value of its investments and computes its net asset value per share at the close of regular trading (usually 4 p.m. Eastern time) on the New York Stock Exchange (NYSE) on each day the NYSE is open. The Board of Directors has adopted valuation policies and procedures to guide the investment advisor in the fund’s investment valuation process and to provide methodologies for the oversight of the fund’s pricing function.
Equity securities that are listed or traded on a domestic securities exchange are valued at the last reported sales price or at the official closing price as provided by the exchange. Equity securities traded on foreign securities exchanges are generally valued at the closing price of such securities on the exchange where primarily traded or at the close of the NYSE, if that is earlier. If no last sales price is reported, or if local convention or regulation so provides, the mean of the latest bid and asked prices may be used. Securities traded over-the-counter are valued at the mean of the latest bid and asked prices, the last sales price, or the official closing price.
Fixed income securities maturing within 60 days at the time of purchase may be valued at cost, plus or minus any amortized discount or premium or at the evaluated mean as provided by an independent pricing service. Evaluated mean prices are commonly derived through utilization of market models, which may consider, among other factors: trade data, quotations from dealers and active market makers, relevant yield curve and spread data, related sector levels, creditworthiness, trade data or market information on comparable securities, and other relevant security specific information.
Open-end management investment companies are valued at the reported net asset value per share. Repurchase agreements are valued at cost, which approximates fair value.
If the fund determines that the market price for an investment is not readily available or the valuation methods mentioned above do not reflect an investment’s fair value, such investment is valued as determined in good faith by the Board of Directors or its delegate, in accordance with policies and procedures adopted by the Board of Directors. In its determination of fair value, the fund may review several factors including, but not limited to, market information regarding the specific investment or comparable investments and correlation with other investment types, futures indices or general market indicators. Circumstances that may cause the fund to use these procedures to value an investment include, but are not limited to: an investment has been declared in default or is distressed; trading in a security has been suspended during the trading day or a
security is not actively trading on its principal exchange; prices received from a regular pricing source are deemed unreliable; or there is a foreign market holiday and no trading occurred.
The fund monitors for significant events occurring after the close of an investment’s primary exchange but before the fund’s net asset value per share is determined. Significant events may include, but are not limited to: corporate announcements and transactions; governmental action and political unrest that could impact a specific investment or an investment sector; or armed conflicts, natural disasters and similar events that could affect investments in a specific country or region. The fund also monitors for significant fluctuations between domestic and foreign markets, as evidenced by the U.S. market or such other indicators that the Board of Directors, or its delegate, deems appropriate. If significant fluctuations in foreign markets are identified, the fund may apply a model-derived factor to the closing price of equity securities traded on foreign securities exchanges. The factor is based on observable market data as provided by an independent pricing service.
Security Transactions — Security transactions are accounted for as of the trade date. Net realized gains and losses are determined on the identified cost basis, which is also used for federal income tax purposes.
Investment Income — Dividend income less foreign taxes withheld, if any, is recorded as of the ex-dividend date. Distributions received on securities that represent a return of capital or long-term capital gain are recorded as a reduction of cost of investments and/or as a realized gain. The fund may estimate the components of distributions received that may be considered nontaxable distributions or long-term capital gain distributions for income tax purposes. Interest income is recorded on the accrual basis and includes accretion of discounts and amortization of premiums.
Repurchase Agreements — The fund may enter into repurchase agreements with institutions that American Century Investment Management, Inc. (ACIM) (the investment advisor) has determined are creditworthy pursuant to criteria adopted by the Board of Directors. The fund requires that the collateral, represented by securities, received in a repurchase transaction be transferred to the custodian in a manner sufficient to enable the fund to obtain those securities in the event of a default under the repurchase agreement. ACIM monitors, on a daily basis, the securities transferred to ensure the value, including accrued interest, of the securities under each repurchase agreement is equal to or greater than amounts owed to the fund under each repurchase agreement.
Joint Trading Account — Pursuant to an Exemptive Order issued by the Securities and Exchange Commission, the fund, along with certain other funds in the American Century Investments family of funds, may transfer uninvested cash balances into a joint trading account. These balances are invested in one or more repurchase agreements that are collateralized by U.S. Treasury or Agency obligations.
Income Tax Status — It is the fund’s policy to distribute substantially all net investment income and net realized gains to shareholders and to otherwise qualify as a regulated investment company under provisions of the Internal Revenue Code. Accordingly, no provision has been made for income taxes. The fund files U.S. federal, state, local and non-U.S. tax returns as applicable. The fund's tax returns are subject to examination by the relevant taxing authority until expiration of the applicable statute of limitations, which is generally three years from the date of filing but can be longer in certain jurisdictions. At this time, management believes there are no uncertain tax positions which, based on their technical merit, would not be sustained upon examination and for which it is reasonably possible that the total amounts of unrecognized tax benefits will significantly change in the next twelve months.
Multiple Class — All shares of the fund represent an equal pro rata interest in the net assets of the class to which such shares belong, and have identical voting, dividend, liquidation and other rights and the same terms and conditions, except for class specific expenses and exclusive rights to vote on matters affecting only individual classes. Income, non-class specific expenses, and realized and unrealized capital gains and losses of the fund are allocated to each class of shares based on their relative net assets.
Distributions to Shareholders — Distributions from net investment income, if any, are generally declared and paid quarterly. Distributions from net realized gains, if any, are generally declared and paid annually. The fund may elect to treat a portion of its payment to a redeeming shareholder, which represents the pro rata share of undistributed net investment income and net realized gains, as a distribution for federal income tax purposes (tax equalization).
Indemnifications — Under the corporation’s organizational documents, its officers and directors are indemnified against certain liabilities arising out of the performance of their duties to the fund. In addition, in the normal course of business, the fund enters into contracts that provide general indemnifications. The maximum exposure under these arrangements is unknown as this would involve future claims that may be made against a fund. The risk of material loss from such claims is considered by management to be remote.
3. Fees and Transactions with Related Parties
Certain officers and directors of the corporation are also officers and/or directors of American Century Companies, Inc. (ACC). The corporation’s investment advisor, ACIM, the corporation's distributor, American Century Investment Services, Inc. (ACIS), and the corporation’s transfer agent, American Century Services, LLC, are wholly owned, directly or indirectly, by ACC. Various funds issued by American Century Asset Allocation Portfolios, Inc. own, in aggregate, 11% of the shares of the fund.
Management Fees — The corporation has entered into a management agreement with ACIM, under which ACIM provides the fund with investment advisory and management services in exchange for a single, unified management fee (the fee) per class. The agreement provides that all expenses of managing and operating the fund, except distribution and service fees, brokerage expenses, taxes, interest, fees and expenses of the independent directors (including legal counsel fees), and extraordinary expenses, will be paid by ACIM. The fee is computed and accrued daily based on each class’s daily net assets and paid monthly in arrears. The fee consists of (1) an Investment Category Fee based on the daily net assets of the fund and certain other accounts managed by the investment advisor that are in the same broad investment category as the fund and (2) a Complex Fee based on the assets of all the funds in the American Century Investments family of funds. The rates for the Investment Category Fee range from 0.3380% to 0.5200%. The rates for the Complex Fee range from 0.2500% to 0.3100% for the Investor Class, A Class, C Class and R Class. The rates for the Complex Fee range from 0.0500% to 0.1100% for the Institutional Class. The effective annual management fee for each class for the year ended June 30, 2015 was 0.66% for the Investor Class, A Class, C Class and R Class and 0.46% for the Institutional Class.
Distribution and Service Fees — The Board of Directors has adopted a separate Master Distribution and Individual Shareholder Services Plan for each of the A Class, C Class and R Class (collectively the plans), pursuant to Rule 12b-1 of the 1940 Act. The plans provide that the A Class will pay ACIS an annual distribution and service fee of 0.25%. The plans provide that the C Class will pay ACIS an annual distribution and service fee of 1.00%, of which 0.25% is paid for individual shareholder services and 0.75% is paid for distribution services. The plans provide that the R Class will pay ACIS an annual distribution and service fee of 0.50%. The fees are computed and accrued daily based on each class’s daily net assets and paid monthly in arrears. The fees are used to pay financial intermediaries for distribution and individual shareholder services. Fees incurred under the plans during the year ended June 30, 2015 are detailed in the Statement of Operations.
Directors' Fees and Expenses — The Board of Directors is responsible for overseeing the investment advisor’s management and operations of the fund. The directors receive detailed information about the fund and its investment advisor regularly throughout the year, and meet at least quarterly with management of the investment advisor to review reports about fund operations. The fund’s officers do not receive compensation from the fund.
4. Investment Transactions
Purchases and sales of investment securities, excluding short-term investments, for the year ended June 30, 2015 were $3,122,410,220 and $2,989,284,964, respectively.
5. Capital Share Transactions
Transactions in shares of the fund were as follows:
|
| | | | | | | | | | |
| | Year ended
June 30, 2015 | Year ended June 30, 2014 |
| | Shares | Amount | Shares | Amount |
| Investor Class/Shares Authorized | 540,000,000 |
| | 400,000,000 |
| |
| Sold | 20,258,376 |
| $ | 639,302,774 |
| 10,817,509 |
| $ | 328,452,026 |
|
| Issued in reinvestment of distributions | 10,481,982 |
| 316,028,595 |
| 4,256,773 |
| 128,872,644 |
|
| Redeemed | (14,708,804 | ) | (464,454,934 | ) | (11,629,899 | ) | (352,671,700 | ) |
| | 16,031,554 |
| 490,876,435 |
| 3,444,383 |
| 104,652,970 |
|
| Institutional Class/Shares Authorized | 100,000,000 |
| | 90,000,000 |
| |
| Sold | 3,926,959 |
| 123,462,438 |
| 4,665,915 |
| 141,911,794 |
|
| Issued in reinvestment of distributions | 1,829,155 |
| 55,233,638 |
| 748,636 |
| 22,705,520 |
|
| Redeemed | (3,231,529 | ) | (102,105,104 | ) | (2,603,995 | ) | (79,289,381 | ) |
| | 2,524,585 |
| 76,590,972 |
| 2,810,556 |
| 85,327,933 |
|
| A Class/Shares Authorized | 70,000,000 |
| | 50,000,000 |
| |
| Sold | 2,679,859 |
| 85,038,764 |
| 1,649,958 |
| 50,403,488 |
|
| Issued in reinvestment of distributions | 1,225,614 |
| 36,863,988 |
| 461,154 |
| 13,933,693 |
|
| Redeemed | (6,638,188 | ) | (208,956,030 | ) | (1,642,181 | ) | (49,790,221 | ) |
| | (2,732,715 | ) | (87,053,278 | ) | 468,931 |
| 14,546,960 |
|
| C Class/Shares Authorized | 20,000,000 |
| | 10,000,000 |
| |
| Sold | 147,521 |
| 4,689,887 |
| 118,288 |
| 3,619,781 |
|
| Issued in reinvestment of distributions | 52,859 |
| 1,570,942 |
| 15,240 |
| 455,468 |
|
| Redeemed | (74,620 | ) | (2,374,222 | ) | (47,976 | ) | (1,444,342 | ) |
| | 125,760 |
| 3,886,607 |
| 85,552 |
| 2,630,907 |
|
| R Class/Shares Authorized | 20,000,000 |
| | 10,000,000 |
| |
| Sold | 820,406 |
| 26,240,916 |
| 182,812 |
| 5,509,223 |
|
| Issued in reinvestment of distributions | 106,935 |
| 3,210,993 |
| 21,122 |
| 637,563 |
|
| Redeemed | (327,138 | ) | (10,318,136 | ) | (159,249 | ) | (4,777,548 | ) |
| | 600,203 |
| 19,133,773 |
| 44,685 |
| 1,369,238 |
|
| Net increase (decrease) | 16,549,387 |
| $ | 503,434,509 |
| 6,854,107 |
| $ | 208,528,008 |
|
6. Fair Value Measurements
The fund’s investments valuation process is based on several considerations and may use multiple inputs to determine the fair value of the investments held by the fund. In conformity with accounting principles generally accepted in the United States of America, the inputs used to determine a valuation are classified into three broad levels.
| |
| • | Level 1 valuation inputs consist of unadjusted quoted prices in an active market for identical investments. |
| |
| • | Level 2 valuation inputs consist of direct or indirect observable market data (including quoted prices for comparable investments, evaluations of subsequent market events, interest rates, prepayment speeds, credit risk, etc.). These inputs also consist of quoted prices for identical investments initially expressed in local currencies that are adjusted through translation into U.S. dollars. |
| |
| • | Level 3 valuation inputs consist of unobservable data (including a fund’s own assumptions). |
The level classification is based on the lowest level input that is significant to the fair valuation measurement. The valuation inputs are not necessarily an indication of the risks associated with investing in these securities or other financial instruments. There were no significant transfers between levels during the period.
The following is a summary of the level classifications as of period end. The Schedule of Investments provides additional information on the fund’s portfolio holdings.
|
| | | | | | | | |
| | Level 1 | Level 2 | Level 3 |
| Assets | | | |
| Investment Securities | | | |
| Common Stocks | $ | 3,592,160,487 |
| — |
| — |
|
| Temporary Cash Investments | 5,413,691 |
| $ | 27,333,008 |
| — |
|
| | $ | 3,597,574,178 |
| $ | 27,333,008 |
| — |
|
7. Federal Tax Information
The tax character of distributions paid during the years ended June 30, 2015 and June 30, 2014 were as follows:
|
| | | | | | |
| | 2015 | 2014 |
| Distributions Paid From | | |
| Ordinary income | $ | 151,497,997 |
| $ | 92,093,892 |
|
| Long-term capital gains | $ | 266,783,394 |
| $ | 76,513,215 |
|
The book-basis character of distributions made during the year from net investment income or net realized gains may differ from their ultimate characterization for federal income tax purposes. These differences reflect the differing character of certain income items and net realized gains and losses for financial statement and tax purposes, and may result in reclassification among certain capital accounts on the financial statements.
As of June 30, 2015, the federal tax cost of investments and the components of distributable earnings on a tax-basis were as follows:
|
| | | |
| Federal tax cost of investments | $ | 3,109,371,792 |
|
| Gross tax appreciation of investments | $ | 599,932,597 |
|
| Gross tax depreciation of investments | (84,397,203 | ) |
| Net tax appreciation (depreciation) of investments | $ | 515,535,394 |
|
| Undistributed ordinary income | $ | 37,699,039 |
|
| Accumulated long-term gains | $ | 175,142,552 |
|
The difference between book-basis and tax-basis unrealized appreciation (depreciation) is attributable primarily to the tax deferral of losses on wash sales.
|
| | | | | | | | | | | | | | | |
| For a Share Outstanding Throughout the Years Ended June 30 (except as noted) | | | | | | |
| Per-Share Data | | | | | | | | Ratios and Supplemental Data | | |
| | | Income From Investment Operations: | Distributions From: | | | Ratio to Average Net Assets of: | | |
| | Net Asset
Value,
Beginning
of Period | Net
Investment
Income
(Loss)(1) | Net
Realized
and
Unrealized
Gain (Loss) | Total From
Investment
Operations | Net
Investment
Income | Net
Realized
Gains | Total
Distributions | Net Asset
Value,
End
of Period | Total
Return(2) | Operating
Expenses | Net
Investment
Income
(Loss) | Portfolio
Turnover
Rate | Net
Assets,
End of
Period
(in thousands) |
| Investor Class | | | | | | | | | | | |
| 2015 | $32.75 | 0.46 | 1.37 | 1.83 | (0.43) | (3.59) | (4.02) | $30.56 | 5.93% | 0.67% | 1.45% | 86% |
| $2,886,976 |
|
| 2014 | $27.74 | 0.44 | 6.31 | 6.75 | (0.43) | (1.31) | (1.74) | $32.75 | 24.92% | 0.67% | 1.45% | 80% |
| $2,568,711 |
|
| 2013 | $23.30 | 0.47 | 4.43 | 4.90 | (0.46) | — | (0.46) | $27.74 | 21.19% | 0.68% | 1.82% | 94% |
| $2,080,375 |
|
| 2012 | $22.37 | 0.34 | 0.93 | 1.27 | (0.34) | — | (0.34) | $23.30 | 5.76% | 0.68% | 1.55% | 86% |
| $1,654,130 |
|
| 2011 | $17.20 | 0.26 | 5.16 | 5.42 | (0.25) | — | (0.25) | $22.37 | 31.66% | 0.69% | 1.28% | 74% |
| $1,615,829 |
|
| Institutional Class | | | | | | | | | | | |
| 2015 | $32.77 | 0.53 | 1.37 | 1.90 | (0.50) | (3.59) | (4.09) | $30.58 | 6.13% | 0.47% | 1.65% | 86% |
| $497,333 |
|
| 2014 | $27.75 | 0.50 | 6.32 | 6.82 | (0.49) | (1.31) | (1.80) | $32.77 | 25.19% | 0.47% | 1.65% | 80% |
| $450,166 |
|
| 2013 | $23.31 | 0.52 | 4.43 | 4.95 | (0.51) | — | (0.51) | $27.75 | 21.42% | 0.48% | 2.02% | 94% |
| $303,312 |
|
| 2012 | $22.38 | 0.38 | 0.93 | 1.31 | (0.38) | — | (0.38) | $23.31 | 5.97% | 0.48% | 1.75% | 86% |
| $216,802 |
|
| 2011 | $17.21 | 0.30 | 5.17 | 5.47 | (0.30) | — | (0.30) | $22.38 | 31.91% | 0.49% | 1.48% | 74% |
| $200,191 |
|
| A Class | | | | | | | | | | | | | |
| 2015 | $32.72 | 0.38 | 1.37 | 1.75 | (0.35) | (3.59) | (3.94) | $30.53 | 5.67% | 0.92% | 1.20% | 86% |
| $195,262 |
|
| 2014 | $27.72 | 0.37 | 6.29 | 6.66 | (0.35) | (1.31) | (1.66) | $32.72 | 24.59% | 0.92% | 1.20% | 80% |
| $298,677 |
|
| 2013 | $23.28 | 0.40 | 4.43 | 4.83 | (0.39) | — | (0.39) | $27.72 | 20.91% | 0.93% | 1.57% | 94% |
| $240,027 |
|
| 2012 | $22.35 | 0.28 | 0.93 | 1.21 | (0.28) | — | (0.28) | $23.28 | 5.51% | 0.93% | 1.30% | 86% |
| $183,498 |
|
| 2011 | $17.19 | 0.20 | 5.16 | 5.36 | (0.20) | — | (0.20) | $22.35 | 31.30% | 0.94% | 1.03% | 74% |
| $182,195 |
|
|
| | | | | | | | | | | | | | | |
| For a Share Outstanding Throughout the Years Ended June 30 (except as noted) | | | | | | |
| Per-Share Data | | | | | | | | Ratios and Supplemental Data | | |
| | | Income From Investment Operations: | Distributions From: | | | Ratio to Average Net Assets of: | | |
| | Net Asset
Value,
Beginning
of Period | Net
Investment
Income
(Loss)(1) | Net
Realized
and
Unrealized
Gain (Loss) | Total From
Investment
Operations | Net
Investment
Income | Net
Realized
Gains | Total
Distributions | Net Asset
Value,
End
of Period | Total
Return(2) | Operating
Expenses | Net
Investment
Income
(Loss) | Portfolio
Turnover
Rate | Net
Assets,
End of
Period
(in thousands) |
| C Class | | | | | | | | | | | | | |
| 2015 | $32.50 | 0.15 | 1.35 | 1.50 | (0.12) | (3.59) | (3.71) | $30.29 | 4.87% | 1.67% | 0.45% | 86% |
| $16,342 |
|
| 2014 | $27.54 | 0.14 | 6.25 | 6.39 | (0.12) | (1.31) | (1.43) | $32.50 | 23.68% | 1.67% | 0.45% | 80% |
| $13,447 |
|
| 2013 | $23.13 | 0.21 | 4.40 | 4.61 | (0.20) | — | (0.20) | $27.54 | 20.02% | 1.68% | 0.82% | 94% |
| $9,039 |
|
| 2012 | $22.21 | 0.12 | 0.92 | 1.04 | (0.12) | — | (0.12) | $23.13 | 4.71% | 1.68% | 0.55% | 86% |
| $7,013 |
|
| 2011 | $17.08 | 0.06 | 5.12 | 5.18 | (0.05) | — | (0.05) | $22.21 | 30.34% | 1.69% | 0.28% | 74% |
| $6,611 |
|
| R Class | | | | | | | | | | | | | |
| 2015 | $32.74 | 0.32 | 1.35 | 1.67 | (0.28) | (3.59) | (3.87) | $30.54 | 5.38% | 1.17% | 0.95% | 86% |
| $30,271 |
|
| 2014 | $27.73 | 0.29 | 6.30 | 6.59 | (0.27) | (1.31) | (1.58) | $32.74 | 24.31% | 1.17% | 0.95% | 80% |
| $12,795 |
|
| 2013 | $23.29 | 0.34 | 4.43 | 4.77 | (0.33) | — | (0.33) | $27.73 | 20.60% | 1.18% | 1.32% | 94% |
| $9,600 |
|
| 2012 | $22.36 | 0.23 | 0.93 | 1.16 | (0.23) | — | (0.23) | $23.29 | 5.24% | 1.18% | 1.05% | 86% |
| $6,848 |
|
| 2011 | $17.20 | 0.16 | 5.15 | 5.31 | (0.15) | — | (0.15) | $22.36 | 30.95% | 1.19% | 0.78% | 74% |
| $5,189 |
|
|
|
| Notes to Financial Highlights |
| |
| (1) | Computed using average shares outstanding throughout the period. |
| |
| (2) | Total returns are calculated based on the net asset value of the last business day and do not reflect applicable sales charges, if any. Total returns for periods less than one year are not annualized. |
See Notes to Financial Statements.
|
|
| Report of Independent Registered Public Accounting Firm |
To the Directors of the American Century Quantitative Equity Funds, Inc. and Shareholders of the Equity Growth Fund:
In our opinion, the accompanying statement of assets and liabilities, including the schedule of investments, and the related statements of operations and of changes in net assets and the financial highlights present fairly, in all material respects, the financial position of the Equity Growth Fund (one of the sixteen funds comprising the American Century Quantitative Equity Funds, Inc., hereafter referred to as the “Fund”) at June 30, 2015, the results of its operations for the year then ended, the changes in its net assets for each of the two years in the period then ended and the financial highlights for each of the five years in the period then ended, in conformity with accounting principles generally accepted in the United States of America. These financial statements and financial highlights (hereafter referred to as "financial statements") are the responsibility of the Fund's management. Our responsibility is to express an opinion on these financial statements based on our audits. We conducted our audits of these financial statements in accordance with the standards of the Public Company Accounting Oversight Board (United States). Those standards require that we plan and perform the audit to obtain reasonable assurance about whether the financial statements are free of material misstatement. An audit includes examining, on a test basis, evidence supporting the amounts and disclosures in the financial statements, assessing the accounting principles used and significant estimates made by management, and evaluating the overall financial statement presentation. We believe that our audits, which included confirmation of securities at June 30, 2015 by correspondence with the custodian and brokers, provide a reasonable basis for our opinion.
PricewaterhouseCoopers LLP
Kansas City, Missouri
August 21, 2015
Board of Directors
The individuals listed below serve as directors of the funds. Each director will continue to serve in this capacity until death, retirement, resignation or removal from office. The board has adopted a mandatory retirement age for directors who are not “interested persons,” as that term is defined in the Investment Company Act (independent directors). Independent directors shall retire on December 31 of the year in which they reach their 75th birthday; provided, however, that on or after January 1, 2022, independent directors shall retire on December 31 of the year in which they reach their 76th birthday.
Mr. Thomas is an “interested person” because he currently serves as President and Chief Executive Officer of American Century Companies, Inc. (ACC), the parent company of American Century Investment Management, Inc. (ACIM or the advisor). The other directors (more than three-fourths of the total number) are independent. They are not employees, directors or officers of, and have no financial interest in, ACC or any of its wholly owned, direct or indirect, subsidiaries, including ACIM, American Century Investment Services, Inc. (ACIS) and American Century Services, LLC (ACS), and they do not have any other affiliations, positions or relationships that would cause them to be considered “interested persons” under the Investment Company Act. The directors serve in this capacity for eight (in the case of Mr. Thomas, 15) registered investment companies in the American Century Investments family of funds.
The following table presents additional information about the directors. The mailing address for each director other than Mr. Thomas is 1665 Charleston Road, Mountain View, California 94043. The mailing address for Mr. Thomas is 4500 Main Street, Kansas City, Missouri 64111.
|
| | | | | |
Name (Year of Birth) | Position(s) Held with Funds | Length of Time Served | Principal Occupation(s) During Past 5 Years | Number of American Century Portfolios Overseen by Director | Other Directorships Held During Past 5 Years |
Independent Directors | | |
Tanya S. Beder
(1955) | Director | Since 2011 | Chairman and CEO, SBCC Group Inc. (independent advisory services) (2006 to present) | 46 | CYS Investments, Inc. (NYSE mortgage arbitrage REIT) |
Jeremy I. Bulow
(1954) | Director | Since 2011 | Professor of Economics, Stanford University, Graduate School of Business (1979 to present) | 46 | None |
Ronald J. Gilson
(1946) | Director and Chairman of the Board | Since 1995
(Chairman since 2005) | Charles J. Meyers Professor of Law and Business, Stanford Law School (1979 to present); Marc and Eva Stern Professor of Law and Business, Columbia University School of Law (1992 to present) | 46 | None |
Frederick L. A. Grauer
(1946) | Director | Since 2008 | Senior Advisor, BlackRock, Inc. (investment management firm) (2010 to 2011, 2013 to present) | 46 | None |
Peter F. Pervere
(1947) | Director | Since 2007 | Retired | 46 | None |
|
| | | | | |
Name (Year of Birth) | Position(s) Held with Funds | Length of Time Served | Principal Occupation(s) During Past 5 Years | Number of American Century Portfolios Overseen by Director | Other Directorships Held During Past 5 Years |
| Independent Directors | | |
John B. Shoven
(1947) | Director | Since 2002 | Professor of Economics, Stanford University (1973 to present) | 46 | Cadence Design Systems; Exponent; Financial Engines |
| Interested Director | | |
Jonathan S. Thomas
(1963) | Director and President | Since 2007 | President and Chief Executive Officer, ACC (March 2007 to present). Also serves as Chief Executive Officer, ACS; Executive Vice President, ACIM; Director, ACC, ACIM and other ACC subsidiaries | 124 | BioMed Valley Discoveries, Inc. |
The Statement of Additional Information has additional information about the fund's directors and is available without charge, upon request, by calling 1-800-345-2021.
Officers
The following table presents certain information about the executive officers of the funds. Each officer serves as an officer for each of the 15 investment companies in the American Century family of funds, unless otherwise noted. No officer is compensated for his or her service as an officer of the funds. The listed officers are interested persons of the funds and are appointed or re-appointed on an annual basis. The mailing address for each of the officers listed below is 4500 Main Street, Kansas City, Missouri 64111.
|
| | |
Name (Year of Birth) | Offices with
the Funds | Principal Occupation(s) During the Past Five Years |
Jonathan S.
Thomas
(1963) | Director and President
since 2007 | President and Chief Executive Officer, ACC (March 2007 to present). Also serves as Chief Executive Officer, ACS; Executive Vice President, ACIM; Director, ACC, ACIM and other ACC subsidiaries |
Amy D. Shelton
(1964) | Chief Compliance Officer and Vice President since 2014 | Chief Compliance Officer, American Century funds, (March 2014 to present); Chief Compliance Officer, ACIM (February 2014 to present); Chief Compliance Officer, ACIS (October 2009 to present); Vice President, Client Interactions and Marketing, ACIS (February 2013 to January 2014); Director, Client Interactions and Marketing, ACIS (June 2007 to January 2013). Also serves as Vice President, ACIS |
Charles A. Etherington
(1957) | General Counsel since 2007 and Senior Vice President since 2006 | Attorney, ACC (February 1994 to present); Vice President, ACC (November 2005 to present); General Counsel, ACC (March 2007 to present). Also serves as General Counsel, ACIM, ACS, ACIS and other ACC subsidiaries; and Senior Vice President, ACIM and ACS |
C. Jean Wade
(1964) | Vice President,
Treasurer and
Chief Financial
Officer since 2012 | Vice President, ACS (February 2000 to present) |
Robert J. Leach
(1966) | Vice President
since 2006 and
Assistant Treasurer
since 2012 | Vice President, ACS (February 2000 to present) |
David H. Reinmiller
(1963) | Vice President since 2001 | Attorney, ACC (January 1994 to present); Associate General Counsel, ACC (January 2001 to present). Also serves as Vice President, ACIM and ACS |
Ward D. Stauffer
(1960) | Secretary since 2005 | Attorney, ACC (June 2003 to present) |
|
|
| Approval of Management Agreement |
At a meeting held on June 16, 2015, the Fund’s Board of Directors unanimously approved the renewal of the management agreement pursuant to which American Century Investment Management, Inc. (the “Advisor”) acts as the investment advisor for the Fund. Under Section 15(c) of the Investment Company Act, contracts for investment advisory services are required to be reviewed, evaluated, and approved by a majority of a fund’s directors/trustees, including a majority of the independent Directors, each year. The Board regards this annual evaluation and renewal as one of its most important responsibilities.
The independent Directors have memorialized a statement regarding the relationship between their ongoing obligations to oversee and evaluate the performance of the Advisor and their annual consideration of renewal of the management agreement. In that statement, the independent Directors noted that their assessment of the Advisor’s performance is an ongoing process that takes place over the entire year and is informed by all of the extensive information that the Board and its committees receive and consider over time. This information, together with the materials provided in connection with the review, are central to the Board’s assessment of the Advisor’s performance and its determination whether to renew the Fund’s management agreement.
Prior to its consideration of the renewal of the management agreement, the Board requested and reviewed extensive data and analysis relating to the proposed renewal. This information and analysis was compiled by the Advisor and certain independent providers of evaluation data concerning the Fund and the services provided to the Fund by the Advisor.
In connection with its consideration of the renewal of the management agreement, the Board’s review and evaluation of the services provided by the Advisor included, but was not limited to, the following:
| |
| • | the nature, extent, and quality of investment management, shareholder services, and other services provided by the Advisor to the Fund; |
| |
| • | the wide range of other programs and services the Advisor provides to the Fund and its shareholders on a routine and non-routine basis; |
| |
| • | the investment performance of the Fund, including data comparing the Fund’s performance to appropriate benchmarks and/or a peer group of other mutual funds with similar investment objectives and strategies; |
| |
| • | the cost of owning the Fund compared to the cost of owning similar funds; |
| |
| • | the Advisor’s compliance policies, procedures, and regulatory experience; |
| |
| • | financial data showing the cost of services provided to the Fund, the profitability of the Fund to the Advisor, and the overall profitability of the Advisor; |
| |
| • | possible economies of scale associated with the Advisor’s management of the Fund and other accounts under its management; |
| |
| • | data comparing services provided and charges to other investment management clients of the Advisor; |
| |
| • | acquired fund fees and expenses; |
| |
| • | payments by the Fund and the Advisor to financial intermediaries whose clients are investors in the Fund; and |
| |
| • | any collateral benefits derived by the Advisor from the management of the Fund. |
In keeping with its practice, the Board held two in-person meetings to review and discuss the information provided in response to their request. The independent Directors also had the benefit of the advice of their independent counsel throughout the process.
Factors Considered
The Directors considered all of the information provided by the Advisor, the independent data providers, and the independent Directors’ independent counsel in connection with the review, and evaluated such information for the Fund. In connection with their review, the Directors did not identify any single factor as being all-important or controlling and each Director may have attributed different levels of importance to different factors. In deciding to renew the management agreement, the Board based its decision on a number of factors, including the following:
Nature, Extent and Quality of Services - Generally. Under the management agreement, the Advisor is responsible for providing or arranging for all services necessary for the operation of the Fund. The Board noted that under the management agreement, the Advisor provides or arranges at its own expense a wide variety of services including:
| |
| • | constructing and designing the Fund |
| |
| • | portfolio research and security selection |
| |
| • | initial capitalization/funding |
| |
| • | daily valuation of the Fund’s portfolio |
| |
| • | shareholder servicing and transfer agency, including shareholder confirmations, recordkeeping, and communications |
| |
| • | legal services (except the independent Directors’ counsel) |
| |
| • | regulatory and portfolio compliance |
| |
| • | marketing and distribution (except amounts paid by the Fund under Rule 12b-1 plans) |
The Board noted that many of these services have expanded over time both in terms of quantity and complexity in response to shareholder demands, competition in the industry, changing distribution channels, and the changing regulatory environment.
Investment Management, Shareholder, and Other Services. The nature of the investment management services provided to the Fund is quite complex and allows Fund shareholders access to professional money management, instant diversification of their investments within an asset class, the opportunity to easily diversify among asset classes by investing in or exchanging among various American Century Investments funds, and liquidity. In evaluating investment performance, the Board expects the Advisor to manage the Fund in accordance with its investment objectives and approved strategies. Further, the Directors recognize that the Advisor has an obligation to seek the best execution of fund trades. In providing these services, the Advisor utilizes teams of investment professionals (portfolio managers, analysts, research assistants, and securities traders) who require extensive information technology, research, training, compliance, and other systems to conduct their business. The Board, directly and through its Portfolio Committee, regularly reviews investment performance information for the Fund, together with comparative information for appropriate benchmarks and/or peer groups of similarly-managed funds, over different time horizons. The Directors also review detailed performance information during the management agreement approval process. If performance concerns are identified, the Fund receives special reviews until performance improves, during which the Board discusses with the Advisor the reasons for such results (e.g., market conditions, security selection) and any efforts being undertaken to improve performance. The Fund’s performance was above its benchmark for the one-, three-, five-, and ten-year periods reviewed by the Board. The Board found the investment management services provided by the Advisor to the Fund to be satisfactory and consistent with the management agreement.
Under the management agreement, the Advisor provides the Fund with a comprehensive package of transfer agency, shareholder, and other services. The Board, directly and through various committees of the Board, regularly reviews reports and evaluations of such services at its regular
meetings. These reports include, but are not limited to, information regarding the operational efficiency and accuracy of the shareholder and transfer agency services provided, staffing levels, shareholder satisfaction (as measured by external as well as internal sources), technology support, new products and services offered to Fund shareholders, securities trading activities, portfolio valuation services, auditing services, and legal and operational compliance activities.
Certain aspects of shareholder and transfer agency service level efficiency and the quality of securities trading activities are measured by independent third party providers and are presented in comparison to other fund groups not managed by the Advisor. The Board found the services provided by the Advisor to the Fund under the management agreement to be competitive and of high quality.
Costs of Services and Profitability. The Advisor provides detailed information concerning its cost of providing various services to the Fund, its profitability in managing the Fund, its overall profitability, and its financial condition. The Directors have reviewed with the Advisor the methodology used to prepare this financial information. This information is considered in evaluating the Advisor’s financial condition, its ability to continue to provide services under the management agreement, and the reasonableness of the current management fee. The Board concluded that the Advisor’s profits were reasonable in light of the services provided to the Fund.
Ethics. The Board generally considers the Advisor’s commitment to providing quality services to shareholders and to conducting its business ethically. They noted that the Advisor’s practices generally meet or exceed industry best practices.
Economies of Scale. The Board also reviewed information provided by the Advisor regarding the possible existence of economies of scale in connection with the management of the Fund. The Board concluded that economies of scale are difficult to measure and predict with precision, especially on a fund-by-fund basis. The Board concluded that the Advisor is appropriately sharing economies of scale through its competitive fee structure, offering competitive fees from fund inception, and through reinvestment in its business to provide shareholders enhanced and expanded services.
Comparison to Other Funds’ Fees. The management agreement provides that the Fund pays the Advisor a single, all-inclusive (or unified) management fee for providing all services necessary for the management and operation of the Fund, other than brokerage expenses, taxes, interest, extraordinary expenses, the fees and expenses of the Fund’s independent Directors (including their independent legal counsel), and expenses incurred in connection with the provision of shareholder services and distribution services under a plan adopted pursuant to Rule 12b-1 under the 1940 Act. Under the unified fee structure, the Advisor is responsible for providing all investment advisory, custody, audit, administrative, compliance, recordkeeping, marketing, and shareholder services, or arranging and supervising third parties to provide such services. By contrast, most other funds are charged a variety of fees, including an investment advisory fee, a transfer agency fee, an administrative fee, distribution charges, and other expenses. Other than their investment advisory fees and any applicable Rule 12b-1 fees, all other components of the total fees charged by these other funds may be increased without shareholder approval. The Board believes the unified fee structure is a benefit to Fund shareholders because it clearly discloses to shareholders the cost of owning Fund shares, and, since the unified fee cannot be increased without a vote of Fund shareholders, it shifts to the Advisor the risk of increased costs of operating the Fund and provides a direct incentive to minimize administrative inefficiencies. Part of the Board’s analysis of fee levels involves reviewing certain evaluative data compiled by an independent provider and comparing the Fund’s unified fee to the total expense ratio of peer funds. The unified fee charged to shareholders of the Fund was below the median of the total expense ratios of the Fund’s peer group. The Board concluded that the management fee paid by the Fund to the Advisor under the management agreement is reasonable in light of the services provided to the Fund.
Comparison to Fees and Services Provided to Other Clients of the Advisor. The Board also requested and received information from the Advisor concerning the nature of the services, fees, costs, and profitability of its advisory services to advisory clients other than the Fund. They observed that these varying types of client accounts require different services and involve different regulatory and entrepreneurial risks than the management of the Fund. The Board analyzed this information and concluded that the fees charged and services provided to the Fund were reasonable by comparison.
Payments to Intermediaries. The Directors also requested and received a description of payments made to intermediaries by the Fund and the Advisor. These payments include various payments made by the Fund or the Advisor to different types of intermediaries and recordkeepers for distribution and service activities provided for the Fund.
Collateral or “Fall-Out” Benefits Derived by the Advisor. The Board considered the existence of collateral benefits the Advisor may receive as a result of its relationship with the Fund. The Board noted that the Advisor’s primary business is managing mutual funds and it generally does not use fund or shareholder information to generate profits in other lines of business, and therefore does not derive any significant collateral benefits from them. The Board noted that the Advisor receives proprietary research from broker-dealers that execute fund portfolio transactions. The Board also determined that the Advisor is able to provide investment management services to certain clients other than the Fund, at least in part, due to its existing infrastructure built to serve the fund complex.
Existing Relationship. The Board also considered whether there was any reason for not continuing the existing arrangement with the Advisor. In this regard, the Board was mindful of the potential disruptions of the Fund’s operations and various risks, uncertainties, and other effects that could occur as a result of a decision not to continue such relationship. In particular, the Board recognized that most shareholders have invested in the Fund on the strength of the Advisor’s industry standing and reputation and in the expectation that the Advisor will have a continuing role in providing advisory services to the Fund.
Conclusion of the Directors. As a result of this process, the Board, including all of the independent Directors and assisted by the advice of independent legal counsel, taking into account all of the factors discussed above and the information provided by the Advisor and others in connection with its review and throughout the year, concluded that the management agreement between the Fund and the Advisor is fair and reasonable in light of the services provided and should be renewed.
Retirement Account Information
As required by law, distributions you receive from certain IRAs are subject to federal income tax withholding, unless you elect not to have withholding apply. Tax will be withheld on the total amount withdrawn even though you may be receiving amounts that are not subject to withholding, such as nondeductible contributions. In such case, excess amounts of withholding could occur. You may adjust your withholding election so that a greater or lesser amount will be withheld.
If you don’t want us to withhold on this amount, you must notify us to not withhold the federal income tax. You may notify us in writing or in certain situations by telephone or through other electronic means. For systematic withdrawals, your withholding election will remain in effect until revoked or changed by filing a new election. You have the right to revoke your election at any time.
Remember, even if you elect not to have income tax withheld, you are liable for paying income tax on the taxable portion of your withdrawal. If you elect not to have income tax withheld or you don’t have enough income tax withheld, you may be responsible for payment of estimated tax. You may incur penalties under the estimated tax rules if your withholding and estimated tax payments are not sufficient. You can reduce or defer the income tax on a distribution by directly or indirectly rolling such distribution over to another IRA or eligible plan. You should consult your tax advisor for additional information.
State tax will be withheld if, at the time of your distribution, your address is within one of the mandatory withholding states and you have federal income tax withheld (or as otherwise required by state law). State taxes will be withheld from your distribution in accordance with the respective state rules.
Distributions you receive from 403(b), 457 and qualified plans are subject to special tax and withholding rules. Your plan administrator or plan sponsor is required to provide you with a special tax notice explaining those rules at the time you request a distribution. If applicable, federal and/or state taxes may be withheld from your distribution amount.
Proxy Voting Policies
Descriptions of the principles and policies that the fund's investment advisor uses in exercising the voting rights associated with the securities purchased and/or held by the fund are available without charge, upon request, by calling 1-800-345-2021 or visiting the "About Us" page of American Century Investments’ website at americancentury.com. A description of the policies is also available on the Securities and Exchange Commission’s website at sec.gov. Information regarding how the investment advisor voted proxies relating to portfolio securities during the most recent 12-month period ended June 30 is available on the "About Us" page at americancentury.com. It is also available at sec.gov.
Quarterly Portfolio Disclosure
The fund files its complete schedule of portfolio holdings with the Securities and Exchange Commission (SEC) for the first and third quarters of each fiscal year on Form N-Q. The fund’s Forms N-Q are available on the SEC’s website at sec.gov, and may be reviewed and copied at the SEC’s Public Reference Room in Washington, DC. Information on the operation of the Public Reference Room may be obtained by calling 1-800-SEC-0330. The fund also makes its complete schedule of portfolio holdings for the most recent quarter of its fiscal year available on its website at americancentury.com and, upon request, by calling 1-800-345-2021.
Other Tax Information
The following information is provided pursuant to provisions of the Internal Revenue Code.
The fund hereby designates up to the maximum amount allowable as qualified dividend income for the fiscal year ended June 30, 2015.
For corporate taxpayers, the fund hereby designates $67,480,194, or up to the maximum amount allowable, of ordinary income distributions paid during the fiscal year ended June 30, 2015 as qualified for the corporate dividends received deduction.
The fund hereby designates $105,934,645 as qualified short-term capital gain distributions for purposes of Internal Revenue Code Section 871 for the fiscal year ended June 30, 2015.
The fund hereby designates $281,845,359, or up to the maximum amount allowable, as long-term capital gain distributions for the fiscal year ended June 30, 2015.
The fund utilized earnings and profits of $20,736,193 distributed to shareholders on redemption of shares as part of the dividends paid deduction (tax equalization).
|
| | |
| |
| | | |
| Contact Us | americancentury.com | |
| Automated Information Line | 1-800-345-8765 | |
| Investor Services Representative | 1-800-345-2021
or 816-531-5575 | |
| Investors Using Advisors | 1-800-378-9878 | |
Business, Not-For-Profit, Employer-Sponsored
Retirement Plans | 1-800-345-3533 | |
Banks and Trust Companies, Broker-Dealers,
Financial Professionals, Insurance Companies | 1-800-345-6488 | |
| Telecommunications Relay Service for the Deaf | 711 | |
| | | |
| American Century Quantitative Equity Funds, Inc. | |
| | | |
Investment Advisor: American Century Investment Management, Inc. Kansas City, Missouri | |
| | | |
| This report and the statements it contains are submitted for the general information of our shareholders. The report is not authorized for distribution to prospective investors unless preceded or accompanied by an effective prospectus. | |
| | | |
©2015 American Century Proprietary Holdings, Inc. All rights reserved.
CL-ANN-86504 1508 | |
|
| |
| ANNUAL REPORT | |
| JUNE 30, 2015 |
| |
AC Alternatives™ Equity Market Neutral Fund
|
| | |
| President's Letter | 2 |
|
| Performance | 3 |
|
| Portfolio Commentary | |
|
| Fund Characteristics | |
|
| Shareholder Fee Example | |
|
| Schedule of Investments | |
|
| Statement of Assets and Liabilities | |
|
| Statement of Operations | |
|
| Statement of Changes in Net Assets | |
|
| Notes to Financial Statements | |
|
| Financial Highlights | |
|
| Report of Independent Registered Public Accounting Firm | |
|
| Management | |
|
| Approval of Management Agreement | |
|
| Additional Information | |
|
Any opinions expressed in this report reflect those of the author as of the date of the report, and do not necessarily represent the opinions of American Century Investments® or any other person in the American Century Investments organization. Any such opinions are subject to change at any time based upon market or other conditions and American Century Investments disclaims any responsibility to update such opinions. These opinions may not be relied upon as investment advice and, because investment decisions made by American Century Investments funds are based on numerous factors, may not be relied upon as an indication of trading intent on behalf of any American Century Investments fund. Security examples are used for representational purposes only and are not intended as recommendations to purchase or sell securities. Performance information for comparative indices and securities is provided to American Century Investments by third party vendors. To the best of American Century Investments’ knowledge, such information is accurate at the time of printing.
|
| |
| Dear Investor:
Thank you for reviewing this annual report for the 12 months ended June 30, 2015. It provides investment performance and portfolio information for the reporting period, plus longer-term historical performance data.
Annual reports remain important vehicles for conveying information about fund returns, including market and economic factors that affected performance during the reporting period. For additional, updated investment and market insights, we encourage you to visit our website, americancentury.com. |
| Jonathan Thomas |
Global Divergence Favored U.S. Assets
“Global divergence” between the U.S. and the rest of the world emerged as a prevalent theme during the reporting period. This theme embraced not only the relatively stronger economic growth enjoyed by the U.S. compared with most of the world, but also the related contrast between the U.S. Federal Reserve’s unwinding of monetary stimulus compared with the continuation and expansion of stimulus by other major central banks. Low inflation also prevailed, after crude oil prices plunged over 40% amid muted demand for commodities in general. In this environment, the U.S. dollar, U.S. growth stocks, and longer-maturity U.S. Treasuries generally benefited from “flight to quality” capital flows, reinforced by geopolitical and financial turmoil, particularly in Greece, Russia/Ukraine, China, and the Middle East.
Strong global capital flows into U.S. assets generated a global divergence between investment returns for U.S. and non-U.S. markets, especially for U.S. investors who realized their returns in dollar terms. For the reporting period, the U.S. Dollar Index, the S&P 500 Index, and the Barclays U.S. Aggregate Bond Index returned 19.74%, 7.42%, and 1.86%, respectively. By contrast, the MSCI EAFE Index, the MSCI Emerging Markets Index, and the Barclays Global Aggregate Bond ex-USD (Unhedged) Index returned -4.22%, -5.12%, and -13.19%, respectively, for U.S. investors unhedged for the strong dollar’s impact on non-dollar-denominated returns.
We expect more monetary policy divergence between the U.S. and other major developed economies in the coming months, accompanied by continued market volatility. This could present both challenges and opportunities for active investment managers. Upward pressures on inflation and interest rates could develop as the massive amount of global monetary stimulus in progress takes hold and economies improve. In this environment, we continue to believe in a disciplined, diversified, long-term investment approach, using professionally managed stock and bond portfolios to meet financial goals. We appreciate your continued trust in us.
Sincerely,
Jonathan Thomas
President and Chief Executive Officer
American Century Investments
|
| | | | | |
| Total Returns as of June 30, 2015 |
| | Average Annual Returns | |
| | Ticker Symbol | 1 year | 5 years | Since Inception | Inception Date |
| Investor Class | ALHIX | -1.07% | 2.14% | 1.38% | 9/30/05 |
Barclays U.S. 1-3 Month Treasury Bill Index | — | 0.01% | 0.06% | 1.29% | — |
| Institutional Class | ALISX | -0.96% | 2.33% | 1.58% | 9/30/05 |
| A Class | ALIAX | | | | 9/30/05 |
| No sales charge* | | -1.27% | 1.88% | 1.14% | |
| With sales charge* | | -6.92% | 0.67% | 0.52% | |
| C Class | ALICX | -2.11% | 1.11% | 0.36% | 9/30/05 |
| R Class | ALIRX | -1.57% | 1.61% | 0.87% | 9/30/05 |
| |
| * | Sales charges include initial sales charges and contingent deferred sales charges (CDSCs), as applicable. A Class shares have a 5.75% maximum initial sales charge and may be subject to a maximum CDSC of 1.00%. C Class shares redeemed within 12 months of purchase are subject to a maximum CDSC of 1.00%. The SEC requires that mutual funds provide performance information net of maximum sales charges in all cases where charges could be applied. |
Data presented reflect past performance. Past performance is no guarantee of future results. Current performance may be higher or lower than the performance shown. Investment return and principal value will fluctuate, and redemption value may be more or less than original cost. Data assumes reinvestment of dividends and capital gains, and none of the charts reflect the deduction of taxes that a shareholder would pay on fund distributions or the redemption of fund shares. To obtain performance data current to the most recent month end, please call 1-800-345-2021 or visit americancentury.com. For additional information about the fund, please consult the prospectus.
|
|
| Growth of $10,000 Over Life of Class |
| $10,000 investment made September 30, 2005 |
| Performance for other share classes will vary due to differences in fee structure. |
|
| |
| Value on June 30, 2015 |
| | Investor Class — $11,433 |
| |
| | Barclays U.S. 1-3 Month Treasury Bill Index — $11,333 |
| |
*From September 30, 2005, the Investor Class’s inception date. Not annualized.
|
| | | | |
| Total Annual Fund Operating Expenses |
| Investor Class | Institutional Class | A Class | C Class | R Class |
| 2.92% | 2.72% | 3.17% | 3.92% | 3.42% |
The total annual fund operating expenses shown is as stated in the fund’s prospectus current as of the date of this report. The prospectus may vary from the expense ratio shown elsewhere in this report because it is based on a different time period, includes acquired fund fees and expenses, and, if applicable, does not include fee waivers or expense reimbursements.
Data presented reflect past performance. Past performance is no guarantee of future results. Current performance may be higher or lower than the performance shown. Investment return and principal value will fluctuate, and redemption value may be more or less than original cost. Data assumes reinvestment of dividends and capital gains, and none of the charts reflect the deduction of taxes that a shareholder would pay on fund distributions or the redemption of fund shares. To obtain performance data current to the most recent month end, please call 1-800-345-2021 or visit americancentury.com. For additional information about the fund, please consult the prospectus.
Portfolio Managers: Brian Garbe and Claudia Musat
Performance Summary
AC Alternatives Equity Market Neutral returned -1.07%* for the fiscal year ended June 30, 2015, compared with the 0.01% return of its benchmark, the Barclays U.S. 1-3 Month Treasury Bill Index.
AC Alternatives Equity Market Neutral is managed to produce capital appreciation independent of equity market conditions, so its benchmark is a cash-equivalent asset: the three-month U.S. Treasury bill. During a period of significant market volatility, the fund declined and was unable to keep pace with its benchmark (see pages 3 and 4 for details).
The portfolio’s stock selection process incorporates factors of valuation, quality, growth, and sentiment, while striving to minimize unintended risks along industries and other risk characteristics. The fund’s underperformance was driven primarily by valuation indicators.
Consumer Discretionary Led Detractors
The consumer discretionary sector was a leading detractor from returns. Declines across several private education providers in the diversified consumer services industry were key underperformers. Among them, Apollo Education Group, which continued to see lower enrollment due to stricter financial aid funding guidelines imposed on for-profit colleges, declined over 50%. However, the holding remains very attractive on valuation metrics and is strong across quality- and sentiment-based factors. The fund’s retail holdings likewise imparted a negative contribution, particularly Abercrombie & Fitch. The teen apparel retailer’s stock sank on weak sales, both in the U.S. and in Europe, as young shoppers turned away from clothing sporting the retailer’s logo. The position was ultimately liquidated.
A number of positions in the health care sector were also detrimental. Key detraction came from a short position (a trade made to benefit from a stock’s decline) in Puma Biotechnology, which advanced strongly after the release of positive phase three data for its breast cancer treatment. Despite generally weak fundamentals overall, the trial’s results led us to cover the fund’s short position. A short position in Synageva BioPharma proved challenging as the biopharmaceutical manufacturer’s stock price more than doubled on its acquisition by Alexion Pharmaceuticals. The position was ultimately exited.
Likewise, a number of individual financials sector positions weighed on the fund’s returns. Key detraction stemmed from a long position in Altisource Portfolio Solutions, a real estate management company. The company’s stock price declined steeply on disappointing quarterly earnings and again after a New York State investigation implicated a subsidiary. The position was eliminated after it became less attractive according to the investment team’s metrics. A position in Nationstar Mortgage Holdings also weighed on results. The residential mortgage servicer reported subdued earnings due to declines in mortgage origination and real estate services. Despite these difficulties, the holding remains strong across sentiment and valuation and has above-average growth insights.
| |
| * | All fund returns referenced in this commentary are for Investor Class shares. Performance for other share classes will vary due to differences in fee structure; when Investor Class performance exceeds that of the fund's benchmark, other share classes may not. See page 3 for returns for all share classes. |
Industrials Sector Produced Gains
Industrials sector holdings helped to limit the fund’s losses during the period. Southwest Airlines was a leading sector contributor, gaining due to higher travel demand due in part to falling fuel costs. The position was exited during the year to lock in gains. Elsewhere in the sector, shipping company Matson appreciated steeply, rising on unexpectedly strong quarterly results driven by container volume increases.
Several consumer discretionary holdings were top individual outperformers despite the sector’s overall detraction. These included a long position in shoe and apparel manufacturer Skechers, whose stock price advanced over 90% on strong sales and management’s guidance. The team opted to exit the holding following its strong appreciation. Elsewhere in the sector, a short position in casino operator Wynn Resorts benefited the fund after the company’s stock fell sharply following a quarterly earnings disappointment and dividend cut amid declining gambling revenue from Macau, the company’s biggest market.
Another short position that made a substantive relative contribution was Tidewater, a provider of offshore service vessels and marine support services to the global offshore energy industry. Persistent declines in oil and natural gas prices, and the subsequent effect on levels of exploration and production spending, pressured the company’s share price. We ultimately exited the short position.
A Look Ahead
The U.S. economy seems poised to continue to experience hesitant economic growth through the second half of 2015. Economic activity appears to have somewhat diminished in breadth, though remains slow yet steady. We believe that divergence in monetary policy between the U.S. and much of the rest of the world is likely to continue. Therefore, questions surrounding when and how much the Federal Reserve might act to tighten money supply, and the potential impact of such a move, are likely to continue driving investor sentiment in equity markets. Our disciplined, objective, and systematic investment strategy is designed to take advantage of opportunities at the individual company level, in both the long and short portions of the portfolio. We believe this approach is the most powerful way to capitalize on market inefficiencies that lead to the mispricing of individual stocks.
|
| |
| JUNE 30, 2015 |
| Top Ten Long Holdings | % of net assets |
| Foot Locker, Inc. | 0.80% |
| ConAgra Foods, Inc. | 0.79% |
| Hanover Insurance Group, Inc. (The) | 0.75% |
| Essent Group Ltd. | 0.74% |
| Synopsys, Inc. | 0.73% |
| Sensient Technologies Corp. | 0.73% |
| Cracker Barrel Old Country Store, Inc. | 0.72% |
| Allscripts Healthcare Solutions, Inc. | 0.72% |
| Archer-Daniels-Midland Co. | 0.70% |
| Parker-Hannifin Corp. | 0.69% |
| | |
| Top Ten Short Holdings | % of net assets |
| Williams Cos., Inc. (The) | (0.85)% |
| M.D.C. Holdings, Inc. | (0.76)% |
| Watsco, Inc. | (0.76)% |
| Northern Trust Corp. | (0.76)% |
| CF Industries Holdings, Inc. | (0.76)% |
| Charles Schwab Corp. (The) | (0.76)% |
| Tenet Healthcare Corp. | (0.76)% |
| Restoration Hardware Holdings, Inc. | (0.75)% |
| Cooper Cos., Inc. (The) | (0.75)% |
| Brown-Forman Corp., Class B | (0.75)% |
| | |
| Types of Investments in Portfolio | % of net assets |
| Common Stocks | 95.3% |
| Common Stocks Sold Short | (95.3)% |
| Temporary Cash Investments | 2.1% |
| Other Assets and Liabilities* | 97.9% |
*Amount relates primarily to deposits with broker for securities sold short at period end.
Fund shareholders may incur two types of costs: (1) transaction costs, including sales charges (loads) on purchase payments and redemption/exchange fees; and (2) ongoing costs, including management fees; distribution and service (12b-1) fees; and other fund expenses. This example is intended to help you understand your ongoing costs (in dollars) of investing in your fund and to compare these costs with the ongoing cost of investing in other mutual funds.
The example is based on an investment of $1,000 made at the beginning of the period and held for the entire period from January 1, 2015 to June 30, 2015.
Actual Expenses
The table provides information about actual account values and actual expenses for each class. You may use the information, together with the amount you invested, to estimate the expenses that you paid over the period. First, identify the share class you own. Then simply divide your account value by $1,000 (for example, an $8,600 account value divided by $1,000 = 8.6), then multiply the result by the number under the heading “Expenses Paid During Period” to estimate the expenses you paid on your account during this period.
If you hold Investor Class shares of any American Century Investments fund, or Institutional Class shares of the American Century Diversified Bond Fund, in an American Century Investments account (i.e., not a financial intermediary or retirement plan account), American Century Investments may charge you a $12.50 semiannual account maintenance fee if the value of those shares is less than $10,000. We will redeem shares automatically in one of your accounts to pay the $12.50 fee. In determining your total eligible investment amount, we will include your investments in all personal accounts (including American Century Investments Brokerage accounts) registered under your Social Security number. Personal accounts include individual accounts, joint accounts, UGMA/UTMA accounts, personal trusts, Coverdell Education Savings Accounts and IRAs (including traditional, Roth, Rollover, SEP-, SARSEP- and SIMPLE-IRAs), and certain other retirement accounts. If you have only business, business retirement, employer-sponsored or American Century Investments Brokerage accounts, you are currently not subject to this fee. If you are subject to the Account Maintenance Fee, your account value could be reduced by the fee amount.
Hypothetical Example for Comparison Purposes
The table also provides information about hypothetical account values and hypothetical expenses based on the actual expense ratio of each class of your fund and an assumed rate of return of 5% per year before expenses, which is not the actual return of a fund’s share class. The hypothetical account values and expenses may not be used to estimate the actual ending account balance or expenses you paid for the period. You may use this information to compare the ongoing costs of investing in your fund and other funds. To do so, compare this 5% hypothetical example with the 5% hypothetical examples that appear in the shareholder reports of the other funds.
Please note that the expenses shown in the table are meant to highlight your ongoing costs only and do not reflect any transactional costs, such as sales charges (loads) or redemption/exchange fees. Therefore, the table is useful in comparing ongoing costs only, and will not help you determine the relative total costs of owning different funds. In addition, if these transactional costs were included, your costs would have been higher.
|
| | | | |
| | Beginning
Account Value
1/1/15 | Ending
Account Value
6/30/15 | Expenses Paid
During Period(1)1/1/15 - 6/30/15 | Annualized
Expense Ratio(1) |
| Actual | | | | |
| Investor Class | $1,000 | $982.30 | $14.25 | 2.90% |
| Institutional Class | $1,000 | $982.60 | $13.27 | 2.70% |
| A Class | $1,000 | $981.10 | $15.47 | 3.15% |
| C Class | $1,000 | $977.00 | $19.12 | 3.90% |
| R Class | $1,000 | $978.90 | $16.68 | 3.40% |
| Hypothetical | | | | |
| Investor Class | $1,000 | $1,010.41 | $14.46 | 2.90% |
| Institutional Class | $1,000 | $1,011.41 | $13.47 | 2.70% |
| A Class | $1,000 | $1,009.17 | $15.69 | 3.15% |
| C Class | $1,000 | $1,005.46 | $19.39 | 3.90% |
| R Class | $1,000 | $1,007.93 | $16.93 | 3.40% |
| |
| (1) | Expenses are equal to the class's annualized expense ratio listed in the table above, multiplied by the average account value over the period, multiplied by 181, the number of days in the most recent fiscal half-year, divided by 365, to reflect the one-half year period. |
JUNE 30, 2015
|
| | | | | |
| | Shares | Value |
| COMMON STOCKS — 95.3% | | |
| Aerospace and Defense — 3.6% | | |
| Huntington Ingalls Industries, Inc. | 4,115 |
| $ | 463,308 |
|
Moog, Inc., Class A(1)(2) | 8,321 |
| 588,128 |
|
Spirit Aerosystems Holdings, Inc., Class A(1)(2) | 9,054 |
| 498,966 |
|
Teledyne Technologies, Inc.(2) | 6,095 |
| 643,083 |
|
Textron, Inc.(1) | 14,060 |
| 627,498 |
|
| Triumph Group, Inc. | 7,681 |
| 506,869 |
|
| | | 3,327,852 |
|
| Air Freight and Logistics — 0.5% | | |
CH Robinson Worldwide, Inc.(1) | 8,236 |
| 513,844 |
|
| Airlines — 0.7% | | |
JetBlue Airways Corp.(2) | 6,837 |
| 141,936 |
|
United Continental Holdings, Inc.(2) | 9,084 |
| 481,543 |
|
| | | 623,479 |
|
| Auto Components — 0.6% | | |
Gentex Corp.(1) | 33,486 |
| 549,840 |
|
| Banks — 0.4% | | |
| PacWest Bancorp | 7,813 |
| 365,336 |
|
| Beverages — 1.0% | | |
Dr Pepper Snapple Group, Inc.(1) | 6,084 |
| 443,524 |
|
| PepsiCo, Inc. | 5,303 |
| 494,982 |
|
| | | 938,506 |
|
| Biotechnology — 1.3% | | |
| Amgen, Inc. | 1,430 |
| 219,534 |
|
Biogen, Inc.(2) | 600 |
| 242,364 |
|
Celgene Corp.(2) | 2,060 |
| 238,414 |
|
Medivation, Inc.(2) | 1,980 |
| 226,116 |
|
Regeneron Pharmaceuticals, Inc.(2) | 162 |
| 82,641 |
|
United Therapeutics Corp.(2) | 1,282 |
| 223,004 |
|
| | | 1,232,073 |
|
| Building Products — 1.1% | | |
| Owens Corning | 12,076 |
| 498,135 |
|
USG Corp.(1)(2) | 20,609 |
| 572,724 |
|
| | | 1,070,859 |
|
| Capital Markets — 3.8% | | |
| Ameriprise Financial, Inc. | 3,850 |
| 480,981 |
|
Artisan Partners Asset Management, Inc., Class A(1) | 12,338 |
| 573,224 |
|
Evercore Partners, Inc., Class A(1) | 11,964 |
| 645,577 |
|
Franklin Resources, Inc.(1) | 10,939 |
| 536,339 |
|
Janus Capital Group, Inc.(1) | 6,083 |
| 104,141 |
|
Legg Mason, Inc.(1) | 11,087 |
| 571,313 |
|
Waddell & Reed Financial, Inc., Class A(1) | 12,852 |
| 608,028 |
|
| | | 3,519,603 |
|
|
| | | | | |
| | Shares | Value |
| Chemicals — 3.2% | | |
Cabot Corp.(1) | 14,169 |
| $ | 528,362 |
|
Dow Chemical Co. (The)(1) | 8,289 |
| 424,148 |
|
| International Flavors & Fragrances, Inc. | 4,250 |
| 464,483 |
|
Minerals Technologies, Inc.(1) | 8,532 |
| 581,285 |
|
Sensient Technologies Corp.(1) | 10,002 |
| 683,537 |
|
| Westlake Chemical Corp. | 4,972 |
| 341,029 |
|
| | | 3,022,844 |
|
| Commercial Services and Supplies — 2.5% | | |
Deluxe Corp.(1) | 9,198 |
| 570,276 |
|
Herman Miller, Inc.(1) | 20,881 |
| 604,087 |
|
| KAR Auction Services, Inc. | 4,120 |
| 154,088 |
|
Pitney Bowes, Inc.(1) | 24,741 |
| 514,860 |
|
RR Donnelley & Sons Co.(1) | 27,330 |
| 476,362 |
|
| | | 2,319,673 |
|
| Communications Equipment — 2.2% | | |
ARRIS Group, Inc.(1)(2) | 13,295 |
| 406,827 |
|
Brocade Communications Systems, Inc.(1) | 44,305 |
| 526,344 |
|
Ciena Corp.(2) | 17,557 |
| 415,750 |
|
| Juniper Networks, Inc. | 3,588 |
| 93,180 |
|
Polycom, Inc.(1)(2) | 53,148 |
| 608,013 |
|
| | | 2,050,114 |
|
| Consumer Finance — 0.6% | | |
Credit Acceptance Corp.(2) | 2,221 |
| 546,766 |
|
| Containers and Packaging — 1.6% | | |
| Avery Dennison Corp. | 769 |
| 46,863 |
|
Berry Plastics Group, Inc.(1)(2) | 14,764 |
| 478,354 |
|
Crown Holdings, Inc.(1)(2) | 8,684 |
| 459,470 |
|
Graphic Packaging Holding Co.(1) | 38,641 |
| 538,269 |
|
| | | 1,522,956 |
|
| Diversified Consumer Services — 1.4% | | |
Apollo Education Group, Inc., Class A(1)(2) | 22,374 |
| 288,177 |
|
DeVry Education Group, Inc.(1) | 15,953 |
| 478,271 |
|
H&R Block, Inc.(1) | 19,892 |
| 589,798 |
|
| | | 1,356,246 |
|
| Electric Utilities — 1.0% | | |
Entergy Corp.(1) | 7,409 |
| 522,335 |
|
NextEra Energy, Inc.(1) | 3,903 |
| 382,611 |
|
| | | 904,946 |
|
| Electrical Equipment — 1.2% | | |
Emerson Electric Co.(1) | 7,234 |
| 400,980 |
|
Generac Holdings, Inc.(1)(2) | 3,777 |
| 150,136 |
|
Rockwell Automation, Inc.(1) | 4,473 |
| 557,515 |
|
| | | 1,108,631 |
|
| Electronic Equipment, Instruments and Components — 1.4% | | |
Corning, Inc.(1) | 24,499 |
| 483,365 |
|
|
| | | | | |
| | Shares | Value |
Dolby Laboratories, Inc., Class A(1) | 15,138 |
| $ | 600,676 |
|
| National Instruments Corp. | 3,715 |
| 109,444 |
|
Vishay Intertechnology, Inc.(1) | 6,520 |
| 76,154 |
|
| | | 1,269,639 |
|
| Energy Equipment and Services — 2.5% | | |
Cameron International Corp.(2) | 7,897 |
| 413,566 |
|
Dril-Quip, Inc.(1)(2) | 8,139 |
| 612,460 |
|
FMC Technologies, Inc.(1)(2) | 7,754 |
| 321,713 |
|
Forum Energy Technologies, Inc.(1)(2) | 18,004 |
| 365,121 |
|
| Schlumberger Ltd. | 1,725 |
| 148,678 |
|
Superior Energy Services, Inc.(1) | 22,231 |
| 467,740 |
|
| | | 2,329,278 |
|
| Food and Staples Retailing — 0.9% | | |
SUPERVALU, Inc.(1)(2) | 47,530 |
| 384,518 |
|
| Wal-Mart Stores, Inc. | 6,594 |
| 467,712 |
|
| | | 852,230 |
|
| Food Products — 5.8% | | |
Archer-Daniels-Midland Co.(1) | 13,542 |
| 652,995 |
|
| Bunge Ltd. | 6,331 |
| 555,862 |
|
ConAgra Foods, Inc.(1) | 16,838 |
| 736,158 |
|
| Dean Foods Co. | 27,487 |
| 444,465 |
|
| Hormel Foods Corp. | 8,409 |
| 474,015 |
|
Ingredion, Inc.(1) | 4,368 |
| 348,610 |
|
Pilgrim's Pride Corp.(1) | 22,890 |
| 525,783 |
|
Pinnacle Foods, Inc.(1) | 11,176 |
| 508,955 |
|
Sanderson Farms, Inc.(1) | 7,144 |
| 536,943 |
|
Seaboard Corp.(2) | 174 |
| 626,226 |
|
| | | 5,410,012 |
|
| Gas Utilities — 0.1% | | |
| UGI Corp. | 3,212 |
| 110,653 |
|
| Health Care Equipment and Supplies — 2.3% | | |
C.R. Bard, Inc.(1) | 2,555 |
| 436,139 |
|
DexCom, Inc.(2) | 3,354 |
| 268,253 |
|
Hologic, Inc.(1)(2) | 13,741 |
| 522,982 |
|
| St. Jude Medical, Inc. | 6,236 |
| 455,665 |
|
| Stryker Corp. | 5,299 |
| 506,425 |
|
| | | 2,189,464 |
|
| Health Care Providers and Services — 3.7% | | |
Aetna, Inc.(1) | 3,294 |
| 419,853 |
|
| Cardinal Health, Inc. | 3,723 |
| 311,429 |
|
Centene Corp.(1)(2) | 2,445 |
| 196,578 |
|
Express Scripts Holding Co.(2) | 3,494 |
| 310,756 |
|
HCA Holdings, Inc.(2) | 6,052 |
| 549,037 |
|
Health Net, Inc.(1)(2) | 8,247 |
| 528,798 |
|
LifePoint Health, Inc.(2) | 6,585 |
| 572,566 |
|
Molina Healthcare, Inc.(1)(2) | 7,560 |
| 531,468 |
|
| | | 3,420,485 |
|
|
| | | | | |
| | Shares | Value |
| Health Care Technology — 0.8% | | |
Allscripts Healthcare Solutions, Inc.(1)(2) | 49,130 |
| $ | 672,098 |
|
Veeva Systems, Inc., Class A(2) | 1,936 |
| 54,266 |
|
| | | 726,364 |
|
| Hotels, Restaurants and Leisure — 4.3% | | |
Brinker International, Inc.(1) | 10,906 |
| 628,731 |
|
| Cracker Barrel Old Country Store, Inc. | 4,518 |
| 673,905 |
|
Diamond Resorts International, Inc.(2) | 16,137 |
| 509,123 |
|
| Jack in the Box, Inc. | 1,276 |
| 112,492 |
|
La Quinta Holdings, Inc.(2) | 19,111 |
| 436,686 |
|
| Marriott Vacations Worldwide Corp. | 6,219 |
| 570,593 |
|
SeaWorld Entertainment, Inc.(1) | 13,896 |
| 256,242 |
|
| Vail Resorts, Inc. | 5,163 |
| 563,800 |
|
Wyndham Worldwide Corp.(1) | 3,766 |
| 308,473 |
|
| | | 4,060,045 |
|
| Household Durables — 2.0% | | |
Garmin Ltd.(1) | 11,250 |
| 494,212 |
|
| Harman International Industries, Inc. | 4,184 |
| 497,645 |
|
Helen of Troy Ltd.(2) | 3,981 |
| 388,108 |
|
Toll Brothers, Inc.(1)(2) | 13,995 |
| 534,469 |
|
| | | 1,914,434 |
|
| Household Products — 0.3% | | |
| Spectrum Brands Holdings, Inc. | 3,061 |
| 312,191 |
|
| Independent Power and Renewable Electricity Producers — 0.5% | |
Calpine Corp.(1)(2) | 25,513 |
| 458,979 |
|
| Industrial Conglomerates — 0.2% | | |
| 3M Co. | 944 |
| 145,659 |
|
| Insurance — 3.3% | | |
Allstate Corp. (The)(1) | 7,809 |
| 506,570 |
|
American International Group, Inc.(1) | 9,888 |
| 611,276 |
|
Amtrust Financial Services, Inc.(1) | 9,590 |
| 628,241 |
|
Aspen Insurance Holdings Ltd.(1) | 12,931 |
| 619,395 |
|
Hanover Insurance Group, Inc. (The)(1) | 9,503 |
| 703,507 |
|
| | | 3,068,989 |
|
| Internet and Catalog Retail — 0.7% | | |
Expedia, Inc.(1) | 2,378 |
| 260,034 |
|
Liberty Interactive Corp. QVC Group, Class A(2) | 13,593 |
| 377,206 |
|
| | | 637,240 |
|
| Internet Software and Services — 2.3% | | |
Cimpress NV(1)(2) | 7,256 |
| 610,665 |
|
eBay, Inc.(2) | 7,373 |
| 444,149 |
|
Endurance International Group Holdings, Inc.(1)(2) | 12,763 |
| 263,684 |
|
GrubHub, Inc.(2) | 5,268 |
| 179,481 |
|
| IAC/InterActiveCorp | 2,165 |
| 172,464 |
|
VeriSign, Inc.(1)(2) | 7,184 |
| 443,396 |
|
| | | 2,113,839 |
|
|
| | | | | |
| | Shares | Value |
| IT Services — 3.0% | | |
Amdocs Ltd.(1) | 10,157 |
| $ | 554,471 |
|
Computer Sciences Corp.(1) | 9,644 |
| 633,032 |
|
| Jack Henry & Associates, Inc. | 5,220 |
| 337,734 |
|
| Science Applications International Corp. | 6,360 |
| 336,126 |
|
Teradata Corp.(1)(2) | 9,154 |
| 338,698 |
|
VeriFone Systems, Inc.(1)(2) | 11,597 |
| 393,834 |
|
| Xerox Corp. | 18,375 |
| 195,510 |
|
| | | 2,789,405 |
|
| Life Sciences Tools and Services — 1.0% | | |
Bio-Rad Laboratories, Inc., Class A(2) | 2,457 |
| 370,049 |
|
Bruker Corp.(1)(2) | 26,315 |
| 537,089 |
|
| | | 907,138 |
|
| Machinery — 3.9% | | |
| Allison Transmission Holdings, Inc. | 4,146 |
| 121,312 |
|
Caterpillar, Inc.(1) | 7,002 |
| 593,910 |
|
| Cummins, Inc. | 4,359 |
| 571,857 |
|
| Kennametal, Inc. | 14,365 |
| 490,134 |
|
| PACCAR, Inc. | 2,208 |
| 140,892 |
|
Parker-Hannifin Corp.(1) | 5,563 |
| 647,144 |
|
Rexnord Corp.(1)(2) | 23,008 |
| 550,121 |
|
Stanley Black & Decker, Inc.(1) | 4,975 |
| 523,569 |
|
| | | 3,638,939 |
|
| Marine — 0.6% | | |
Matson, Inc.(1) | 14,475 |
| 608,529 |
|
| Media — 1.5% | | |
Cablevision Systems Corp., Class A(1) | 20,760 |
| 496,994 |
|
Omnicom Group, Inc.(1) | 6,322 |
| 439,316 |
|
Scripps Networks Interactive, Inc., Class A(1) | 7,678 |
| 501,911 |
|
| | | 1,438,221 |
|
| Metals and Mining — 1.8% | | |
Alcoa, Inc.(1) | 41,993 |
| 468,222 |
|
Steel Dynamics, Inc.(1) | 30,094 |
| 623,397 |
|
United States Steel Corp.(1) | 27,787 |
| 572,968 |
|
| | | 1,664,587 |
|
| Multi-Utilities — 0.5% | | |
| Public Service Enterprise Group, Inc. | 11,921 |
| 468,257 |
|
| Multiline Retail — 2.0% | | |
Big Lots, Inc.(1) | 11,053 |
| 497,275 |
|
Dillard's, Inc., Class A(1) | 3,522 |
| 370,479 |
|
Kohl's Corp.(1) | 7,509 |
| 470,139 |
|
| Target Corp. | 6,434 |
| 525,207 |
|
| | | 1,863,100 |
|
| Oil, Gas and Consumable Fuels — 2.8% | | |
CVR Energy, Inc.(1) | 14,239 |
| 535,956 |
|
Denbury Resources, Inc.(1) | 69,262 |
| 440,506 |
|
|
| | | | | |
| | Shares | Value |
EOG Resources, Inc.(1) | 2,881 |
| $ | 252,232 |
|
Murphy Oil Corp.(1) | 11,635 |
| 483,667 |
|
Valero Energy Corp.(1) | 9,472 |
| 592,947 |
|
| Western Refining, Inc. | 7,038 |
| 306,998 |
|
| | | 2,612,306 |
|
| Paper and Forest Products — 0.2% | | |
| Domtar Corp. | 3,748 |
| 155,167 |
|
| Personal Products — 0.5% | | |
Avon Products, Inc.(1) | 76,577 |
| 479,372 |
|
| Pharmaceuticals — 0.8% | | |
Merck & Co., Inc.(1) | 6,149 |
| 350,062 |
|
Pfizer, Inc.(1) | 11,988 |
| 401,958 |
|
| | | 752,020 |
|
| Professional Services — 1.8% | | |
FTI Consulting, Inc.(2) | 10,591 |
| 436,773 |
|
IHS, Inc., Class A(2) | 1,539 |
| 197,961 |
|
Manpowergroup, Inc.(1) | 6,579 |
| 588,031 |
|
TriNet Group, Inc.(2) | 17,200 |
| 436,020 |
|
| | | 1,658,785 |
|
| Real Estate Investment Trusts (REITs) — 4.0% | | |
CBL & Associates Properties, Inc.(1) | 28,344 |
| 459,173 |
|
DuPont Fabros Technology, Inc.(1) | 18,782 |
| 553,130 |
|
Gaming and Leisure Properties, Inc.(1) | 15,264 |
| 559,578 |
|
Lamar Advertising Co., Class A(1) | 9,943 |
| 571,524 |
|
LaSalle Hotel Properties(1) | 3,293 |
| 116,770 |
|
Plum Creek Timber Co., Inc.(1) | 12,359 |
| 501,404 |
|
RLJ Lodging Trust(1) | 16,662 |
| 496,194 |
|
Ryman Hospitality Properties, Inc.(1) | 9,052 |
| 480,752 |
|
| | | 3,738,525 |
|
| Real Estate Management and Development — 1.4% | | |
CBRE Group, Inc.(1)(2) | 15,806 |
| 584,822 |
|
| Jones Lang LaSalle, Inc. | 2,952 |
| 504,792 |
|
Realogy Holdings Corp.(2) | 5,165 |
| 241,309 |
|
| | | 1,330,923 |
|
| Road and Rail — 1.1% | | |
Con-way, Inc.(1) | 12,492 |
| 479,318 |
|
Swift Transportation Co.(1)(2) | 22,707 |
| 514,768 |
|
| | | 994,086 |
|
| Semiconductors and Semiconductor Equipment — 2.1% | | |
Fairchild Semiconductor International, Inc.(1)(2) | 25,887 |
| 449,916 |
|
| Marvell Technology Group Ltd. | 3,632 |
| 47,888 |
|
ON Semiconductor Corp.(1)(2) | 36,761 |
| 429,736 |
|
Semtech Corp.(1)(2) | 25,535 |
| 506,870 |
|
Teradyne, Inc.(1) | 26,398 |
| 509,217 |
|
| | | 1,943,627 |
|
|
| | | | | |
| | Shares | Value |
| Software — 2.5% | | |
Cadence Design Systems, Inc.(1)(2) | 30,720 |
| $ | 603,955 |
|
Electronic Arts, Inc.(2) | 8,134 |
| 540,911 |
|
Mentor Graphics Corp.(1) | 10,861 |
| 287,056 |
|
PTC, Inc.(1)(2) | 6,307 |
| 258,713 |
|
Synopsys, Inc.(1)(2) | 13,533 |
| 685,447 |
|
| | | 2,376,082 |
|
| Specialty Retail — 2.7% | | |
Bed Bath & Beyond, Inc.(1)(2) | 8,018 |
| 553,082 |
|
Best Buy Co., Inc.(1) | 9,751 |
| 317,980 |
|
| Chico's FAS, Inc. | 17,902 |
| 297,710 |
|
Foot Locker, Inc.(1) | 11,098 |
| 743,677 |
|
| Lowe's Cos., Inc. | 2,842 |
| 190,329 |
|
Murphy USA, Inc.(1)(2) | 8,337 |
| 465,371 |
|
| | | 2,568,149 |
|
| Technology Hardware, Storage and Peripherals — 0.6% | | |
NetApp, Inc.(1) | 11,442 |
| 361,110 |
|
| Western Digital Corp. | 3,039 |
| 238,318 |
|
| | | 599,428 |
|
| Textiles, Apparel and Luxury Goods — 1.6% | | |
| Carter's, Inc. | 4,826 |
| 513,004 |
|
Deckers Outdoor Corp.(1)(2) | 638 |
| 45,917 |
|
Fossil Group, Inc.(2) | 5,975 |
| 414,426 |
|
Wolverine World Wide, Inc.(1) | 17,554 |
| 499,938 |
|
| | | 1,473,285 |
|
| Thrifts and Mortgage Finance — 0.9% | | |
Essent Group Ltd.(1)(2) | 25,300 |
| 691,955 |
|
Nationstar Mortgage Holdings, Inc.(1)(2) | 10,989 |
| 184,615 |
|
| | | 876,570 |
|
| Trading Companies and Distributors — 0.2% | | |
WESCO International, Inc.(2) | 2,105 |
| 144,487 |
|
TOTAL COMMON STOCKS (Cost $85,135,732) | | 89,074,057 |
|
| TEMPORARY CASH INVESTMENTS — 2.1% | | |
Repurchase Agreement, Bank of America Merrill Lynch, (collateralized by various U.S. Treasury obligations, 1.50%, 1/31/19 - 11/30/19, valued at $341,123), in a joint trading account at 0.10%, dated 6/30/15, due 7/1/15 (Delivery value $334,317) | | 334,316 |
|
| Repurchase Agreement, Fixed Income Clearing Corp., (collateralized by various U.S. Treasury obligations, 2.375%, 8/15/24, valued at $1,367,200), at 0.01%, dated 6/30/15, due 7/1/15 (Delivery value $1,337,000) | | 1,337,000 |
|
| State Street Institutional Liquid Reserves Fund, Premier Class | 327,185 |
| 327,185 |
|
TOTAL TEMPORARY CASH INVESTMENTS (Cost $1,998,501) | | 1,998,501 |
|
TOTAL INVESTMENT SECURITIES BEFORE SECURITIES SOLD SHORT — 97.4% (Cost $87,134,233) | 91,072,558 |
|
|
| | | | | |
| | Shares | Value |
| COMMON STOCKS SOLD SHORT — (95.3)% | | |
| Aerospace and Defense — (2.8)% | | |
| B/E Aerospace, Inc. | (9,710 | ) | $ | (533,079 | ) |
| DigitalGlobe, Inc. | (21,115 | ) | (586,786 | ) |
| Hexcel Corp. | (10,418 | ) | (518,191 | ) |
| Orbital ATK, Inc. | (7,033 | ) | (515,941 | ) |
| Precision Castparts Corp. | (2,405 | ) | (480,687 | ) |
| | | (2,634,684 | ) |
| Air Freight and Logistics — (0.3)% | | |
| UTi Worldwide, Inc. | (24,243 | ) | (242,188 | ) |
| Airlines — (1.2)% | | |
| Allegiant Travel Co. | (3,438 | ) | (611,552 | ) |
| Spirit Airlines, Inc. | (8,621 | ) | (535,364 | ) |
| | | (1,146,916 | ) |
| Auto Components — (1.3)% | | |
| BorgWarner, Inc. | (10,449 | ) | (593,921 | ) |
| Visteon Corp. | (5,584 | ) | (586,208 | ) |
| | | (1,180,129 | ) |
| Banks — (2.0)% | | |
| BankUnited, Inc. | (13,508 | ) | (485,343 | ) |
| Cullen/Frost Bankers, Inc. | (2,647 | ) | (208,001 | ) |
| First Citizens BancShares, Inc., Class A | (2,459 | ) | (646,815 | ) |
| Investors Bancorp, Inc. | (9,807 | ) | (120,626 | ) |
| SVB Financial Group | (2,555 | ) | (367,869 | ) |
| | | (1,828,654 | ) |
| Beverages — (1.3)% | | |
| Brown-Forman Corp., Class B | (6,973 | ) | (698,555 | ) |
| Constellation Brands, Inc., Class A | (4,108 | ) | (476,610 | ) |
| | | (1,175,165 | ) |
| Biotechnology — (0.8)% | | |
| ACADIA Pharmaceuticals, Inc. | (5,721 | ) | (239,596 | ) |
| Bluebird Bio, Inc. | (1,339 | ) | (225,447 | ) |
| Clovis Oncology, Inc. | (2,527 | ) | (222,073 | ) |
| Ultragenyx Pharmaceutical, Inc. | (492 | ) | (50,376 | ) |
| | | (737,492 | ) |
| Building Products — (0.7)% | | |
| Armstrong World Industries, Inc. | (11,938 | ) | (636,057 | ) |
| Capital Markets — (2.9)% | | |
| Bank of New York Mellon Corp. (The) | (15,839 | ) | (664,763 | ) |
| Charles Schwab Corp. (The) | (21,663 | ) | (707,297 | ) |
| Northern Trust Corp. | (9,266 | ) | (708,478 | ) |
| State Street Corp. | (8,833 | ) | (680,141 | ) |
| | | (2,760,679 | ) |
| Chemicals — (4.1)% | | |
| Agrium, Inc. | (4,951 | ) | (524,558 | ) |
| CF Industries Holdings, Inc. | (11,020 | ) | (708,366 | ) |
|
| | | | | |
| | Shares | Value |
| FMC Corp. | (9,038 | ) | $ | (474,947 | ) |
| HB Fuller Co. | (15,048 | ) | (611,250 | ) |
| Platform Specialty Products Corp. | (18,434 | ) | (471,542 | ) |
| Tronox Ltd., Class A | (24,177 | ) | (353,709 | ) |
| WR Grace & Co. | (6,868 | ) | (688,860 | ) |
| | | (3,833,232 | ) |
| Commercial Services and Supplies — (1.3)% | | |
| Covanta Holding Corp. | (26,178 | ) | (554,712 | ) |
| Stericycle, Inc. | (4,992 | ) | (668,479 | ) |
| | | (1,223,191 | ) |
| Communications Equipment — (1.2)% | | |
| Motorola Solutions, Inc. | (8,998 | ) | (515,945 | ) |
| ViaSat, Inc. | (10,395 | ) | (626,403 | ) |
| | | (1,142,348 | ) |
| Construction and Engineering — (1.4)% | | |
| AECOM | (20,237 | ) | (669,440 | ) |
| Granite Construction, Inc. | (16,786 | ) | (596,071 | ) |
| | | (1,265,511 | ) |
| Construction Materials — (0.5)% | | |
| Vulcan Materials Co. | (5,241 | ) | (439,877 | ) |
| Consumer Finance — (1.0)% | | |
| Capital One Financial Corp. | (7,580 | ) | (666,813 | ) |
| SLM Corp. | (24,388 | ) | (240,709 | ) |
| | | (907,522 | ) |
| Containers and Packaging — (0.7)% | | |
| Bemis Co., Inc. | (11,714 | ) | (527,247 | ) |
| Silgan Holdings, Inc. | (1,865 | ) | (98,398 | ) |
| | | (625,645 | ) |
| Distributors — (0.6)% | | |
| Pool Corp. | (7,653 | ) | (537,087 | ) |
| Diversified Consumer Services — (0.1)% | | |
| Sotheby's | (2,257 | ) | (102,107 | ) |
| Diversified Financial Services — (0.9)% | | |
| Leucadia National Corp. | (26,720 | ) | (648,762 | ) |
| McGraw Hill Financial, Inc. | (1,711 | ) | (171,870 | ) |
| | | (820,632 | ) |
| Electric Utilities — (1.6)% | | |
| ALLETE, Inc. | (12,049 | ) | (558,953 | ) |
| FirstEnergy Corp. | (14,151 | ) | (460,615 | ) |
| Great Plains Energy, Inc. | (3,331 | ) | (80,477 | ) |
| ITC Holdings Corp. | (7,743 | ) | (249,170 | ) |
| Southern Co. (The) | (2,484 | ) | (104,079 | ) |
| Xcel Energy, Inc. | (2,294 | ) | (73,821 | ) |
| | | (1,527,115 | ) |
| Electrical Equipment — (0.6)% | | |
| Franklin Electric Co., Inc. | (2,942 | ) | (95,115 | ) |
|
| | | | | |
| | Shares | Value |
| Hubbell, Inc., Class B | (4,754 | ) | $ | (514,763 | ) |
| | | (609,878 | ) |
| Electronic Equipment, Instruments and Components — (2.8)% | | |
| Amphenol Corp., Class A | (11,372 | ) | (659,235 | ) |
| Anixter International, Inc. | (7,498 | ) | (488,495 | ) |
| FEI Co. | (5,589 | ) | (463,496 | ) |
| Ingram Micro, Inc., Class A | (6,285 | ) | (157,314 | ) |
| SYNNEX Corp. | (6,139 | ) | (449,313 | ) |
| Zebra Technologies Corp., Class A | (3,928 | ) | (436,204 | ) |
| | | (2,654,057 | ) |
| Energy Equipment and Services — (2.5)% | | |
| Bristow Group, Inc. | (9,832 | ) | (524,046 | ) |
| Patterson-UTI Energy, Inc. | (25,577 | ) | (481,231 | ) |
| Rowan Cos. plc | (27,580 | ) | (582,214 | ) |
| RPC, Inc. | (30,771 | ) | (425,563 | ) |
| Unit Corp. | (10,911 | ) | (295,906 | ) |
| | | (2,308,960 | ) |
| Food and Staples Retailing — (1.3)% | | |
| PriceSmart, Inc. | (7,305 | ) | (666,508 | ) |
| United Natural Foods, Inc. | (9,381 | ) | (597,382 | ) |
| | | (1,263,890 | ) |
| Food Products — (4.4)% | | |
| Darling Ingredients, Inc. | (13,159 | ) | (192,911 | ) |
| General Mills, Inc. | (7,890 | ) | (439,631 | ) |
| Hain Celestial Group, Inc. (The) | (8,466 | ) | (557,571 | ) |
| Hershey Co. (The) | (5,649 | ) | (501,801 | ) |
| JM Smucker Co. (The) | (5,788 | ) | (627,477 | ) |
| Keurig Green Mountain, Inc. | (3,755 | ) | (287,745 | ) |
| Lancaster Colony Corp. | (5,682 | ) | (516,210 | ) |
| Post Holdings, Inc. | (7,566 | ) | (408,034 | ) |
| TreeHouse Foods, Inc. | (669 | ) | (54,209 | ) |
| WhiteWave Foods Co., Class A | (11,708 | ) | (572,287 | ) |
| | | (4,157,876 | ) |
| Gas Utilities — (1.0)% | | |
| South Jersey Industries, Inc. | (20,566 | ) | (508,597 | ) |
| WGL Holdings, Inc. | (8,574 | ) | (465,483 | ) |
| | | (974,080 | ) |
| Health Care Equipment and Supplies — (1.6)% | | |
| Becton Dickinson and Co. | (3,633 | ) | (514,614 | ) |
| Cooper Cos., Inc. (The) | (3,950 | ) | (702,982 | ) |
| IDEXX Laboratories, Inc. | (3,742 | ) | (240,012 | ) |
| | | (1,457,608 | ) |
| Health Care Providers and Services — (5.1)% | | |
| Acadia Healthcare Co., Inc. | (6,821 | ) | (534,289 | ) |
| Brookdale Senior Living, Inc. | (17,473 | ) | (606,313 | ) |
| DaVita HealthCare Partners, Inc. | (6,098 | ) | (484,608 | ) |
| Henry Schein, Inc. | (4,128 | ) | (586,671 | ) |
|
| | | | | |
| | Shares | Value |
| Laboratory Corp. of America Holdings | (4,310 | ) | $ | (522,458 | ) |
| Owens & Minor, Inc. | (18,134 | ) | (616,556 | ) |
| Team Health Holdings, Inc. | (8,644 | ) | (564,713 | ) |
| Tenet Healthcare Corp. | (12,197 | ) | (705,962 | ) |
| WellCare Health Plans, Inc. | (2,261 | ) | (191,801 | ) |
| | | (4,813,371 | ) |
| Hotels, Restaurants and Leisure — (2.8)% | | |
| MGM Resorts International | (26,125 | ) | (476,781 | ) |
| Norwegian Cruise Line Holdings Ltd. | (10,215 | ) | (572,449 | ) |
| Panera Bread Co., Class A | (2,821 | ) | (493,026 | ) |
| Wendy's Co. (The) | (46,001 | ) | (518,891 | ) |
| Wynn Resorts Ltd. | (5,204 | ) | (513,479 | ) |
| | | (2,574,626 | ) |
| Household Durables — (2.9)% | | |
| D.R. Horton, Inc. | (8,437 | ) | (230,836 | ) |
| KB Home | (10,239 | ) | (169,968 | ) |
| Lennar Corp., Class A | (10,150 | ) | (518,056 | ) |
| M.D.C. Holdings, Inc. | (23,717 | ) | (710,799 | ) |
| Mohawk Industries, Inc. | (3,439 | ) | (656,505 | ) |
| TRI Pointe Homes, Inc. | (26,591 | ) | (406,842 | ) |
| | | (2,693,006 | ) |
| Insurance — (4.6)% | | |
| Arthur J Gallagher & Co. | (12,837 | ) | (607,190 | ) |
| Assurant, Inc. | (7,521 | ) | (503,907 | ) |
| First American Financial Corp. | (15,850 | ) | (589,779 | ) |
| Loews Corp. | (13,036 | ) | (502,016 | ) |
| MBIA, Inc. | (55,956 | ) | (336,296 | ) |
| Old Republic International Corp. | (41,689 | ) | (651,599 | ) |
| Validus Holdings Ltd. | (11,871 | ) | (522,205 | ) |
| White Mountains Insurance Group Ltd. | (878 | ) | (575,037 | ) |
| | | (4,288,029 | ) |
| Internet Software and Services — (1.1)% | | |
| Equinix, Inc. | (2,324 | ) | (590,296 | ) |
| Yahoo!, Inc. | (12,111 | ) | (475,841 | ) |
| | | (1,066,137 | ) |
| IT Services — (4.3)% | | |
| Alliance Data Systems Corp. | (2,308 | ) | (673,797 | ) |
| Cognizant Technology Solutions Corp. | (8,971 | ) | (548,038 | ) |
| FleetCor Technologies, Inc. | (1,078 | ) | (168,233 | ) |
| Gartner, Inc. | (5,360 | ) | (459,781 | ) |
| Genpact Ltd. | (30,155 | ) | (643,206 | ) |
| Global Payments, Inc. | (4,741 | ) | (490,456 | ) |
| Vantiv, Inc., Class A | (8,330 | ) | (318,123 | ) |
| WEX, Inc. | (6,012 | ) | (685,188 | ) |
| | | (3,986,822 | ) |
| Life Sciences Tools and Services — (0.2)% | | |
| Bio-Techne Corp. | (2,367 | ) | (233,078 | ) |
|
| | | | | |
| | Shares | Value |
| Machinery — (2.5)% | | |
| CLARCOR, Inc. | (9,642 | ) | $ | (600,118 | ) |
| Donaldson Co., Inc. | (15,791 | ) | (565,318 | ) |
| SPX Corp. | (6,884 | ) | (498,333 | ) |
| Toro Co. (The) | (4,577 | ) | (310,229 | ) |
| WABCO Holdings, Inc. | (1,957 | ) | (242,120 | ) |
| Woodward, Inc. | (1,867 | ) | (102,666 | ) |
| | | (2,318,784 | ) |
| Marine — (0.5)% | | |
| Kirby Corp. | (6,630 | ) | (508,256 | ) |
| Media — (2.6)% | | |
| Charter Communications, Inc., Class A | (842 | ) | (144,193 | ) |
| DISH Network Corp., Class A | (4,373 | ) | (296,096 | ) |
| Live Nation Entertainment, Inc. | (14,656 | ) | (402,893 | ) |
| Loral Space & Communications, Inc. | (7,986 | ) | (504,076 | ) |
| Morningstar, Inc. | (7,317 | ) | (582,067 | ) |
| Tribune Media Co. | (9,227 | ) | (492,630 | ) |
| | | (2,421,955 | ) |
| Metals and Mining — (2.6)% | | |
| Allegheny Technologies, Inc. | (17,917 | ) | (541,093 | ) |
| Carpenter Technology Corp. | (13,623 | ) | (526,938 | ) |
| Freeport-McMoRan, Inc. | (29,277 | ) | (545,138 | ) |
| Goldcorp, Inc. | (15,769 | ) | (255,458 | ) |
| Worthington Industries, Inc. | (19,624 | ) | (589,897 | ) |
| | | (2,458,524 | ) |
| Multi-Utilities — (0.8)% | | |
| Dominion Resources, Inc. | (8,600 | ) | (575,082 | ) |
| Sempra Energy | (1,416 | ) | (140,099 | ) |
| | | (715,181 | ) |
| Multiline Retail — (0.5)% | | |
| Nordstrom, Inc. | (6,773 | ) | (504,588 | ) |
| Oil, Gas and Consumable Fuels — (4.4)% | | |
| Cabot Oil & Gas Corp. | (7,997 | ) | (252,225 | ) |
| Diamondback Energy, Inc. | (6,789 | ) | (511,755 | ) |
| Enbridge, Inc. | (10,589 | ) | (495,459 | ) |
| EQT Corp. | (5,367 | ) | (436,552 | ) |
| Gulfport Energy Corp. | (13,583 | ) | (546,716 | ) |
| Noble Energy, Inc. | (6,230 | ) | (265,896 | ) |
| Occidental Petroleum Corp. | (4,453 | ) | (346,310 | ) |
| QEP Resources, Inc. | (3,330 | ) | (61,638 | ) |
| Rice Energy, Inc. | (10,757 | ) | (224,068 | ) |
| SemGroup Corp., Class A | (1,998 | ) | (158,801 | ) |
| Williams Cos., Inc. (The) | (13,919 | ) | (798,812 | ) |
| | | (4,098,232 | ) |
| Paper and Forest Products — (0.5)% | | |
| Louisiana-Pacific Corp. | (27,965 | ) | (476,244 | ) |
|
| | | | | |
| | Shares | Value |
| Pharmaceuticals — (0.6)% | | |
| Akorn, Inc. | (12,094 | ) | $ | (528,024 | ) |
| Professional Services — (0.7)% | | |
| Advisory Board Co. (The) | (12,055 | ) | (659,047 | ) |
| Real Estate Investment Trusts (REITs) — (2.5)% | | |
| Alexandria Real Estate Equities, Inc. | (6,208 | ) | (542,952 | ) |
| Essex Property Trust, Inc. | (543 | ) | (115,387 | ) |
| Kite Realty Group Trust | (20,036 | ) | (490,281 | ) |
| Potlatch Corp. | (13,822 | ) | (488,193 | ) |
| SL Green Realty Corp. | (1,585 | ) | (174,176 | ) |
| WP Carey, Inc. | (8,631 | ) | (508,711 | ) |
| | | (2,319,700 | ) |
| Real Estate Management and Development — (1.3)% | | |
| Howard Hughes Corp. (The) | (4,277 | ) | (613,920 | ) |
| Kennedy-Wilson Holdings, Inc. | (23,347 | ) | (574,103 | ) |
| | | (1,188,023 | ) |
| Road and Rail — (2.5)% | | |
| Genesee & Wyoming, Inc., Class A | (6,177 | ) | (470,564 | ) |
| JB Hunt Transport Services, Inc. | (6,164 | ) | (506,003 | ) |
| Kansas City Southern | (5,529 | ) | (504,245 | ) |
| Knight Transportation, Inc. | (17,955 | ) | (480,116 | ) |
| Landstar System, Inc. | (6,113 | ) | (408,776 | ) |
| | | (2,369,704 | ) |
| Semiconductors and Semiconductor Equipment — (2.0)% | | |
| Cree, Inc. | (16,228 | ) | (422,415 | ) |
| Cypress Semiconductor Corp. | (37,014 | ) | (435,285 | ) |
| SunEdison, Inc. | (18,038 | ) | (539,516 | ) |
| SunPower Corp. | (17,034 | ) | (483,936 | ) |
| | | (1,881,152 | ) |
| Software — (1.1)% | | |
| CommVault Systems, Inc. | (12,389 | ) | (525,417 | ) |
| Solera Holdings, Inc. | (11,078 | ) | (493,636 | ) |
| | | (1,019,053 | ) |
| Specialty Retail — (4.3)% | | |
| Asbury Automotive Group, Inc. | (6,353 | ) | (575,709 | ) |
| Ascena Retail Group, Inc. | (34,869 | ) | (580,743 | ) |
| Cabela's, Inc. | (11,425 | ) | (571,022 | ) |
| CarMax, Inc. | (7,862 | ) | (520,543 | ) |
| CST Brands, Inc. | (12,425 | ) | (485,320 | ) |
| Men's Wearhouse, Inc. (The) | (8,548 | ) | (547,670 | ) |
| Restoration Hardware Holdings, Inc. | (7,203 | ) | (703,229 | ) |
| | | (3,984,236 | ) |
| Textiles, Apparel and Luxury Goods — (0.6)% | | |
| Under Armour, Inc., Class A | (7,211 | ) | (601,686 | ) |
| Thrifts and Mortgage Finance — (0.7)% | | |
| TFS Financial Corp. | (40,930 | ) | (688,443 | ) |
|
| | | | | |
| | Shares | Value |
| Trading Companies and Distributors — (1.5)% | | |
| MRC Global, Inc. | (32,339 | ) | $ | (499,314 | ) |
| Watsco, Inc. | (5,744 | ) | (710,763 | ) |
| WW Grainger, Inc. | (789 | ) | (186,717 | ) |
| | | (1,396,794 | ) |
| Transportation Infrastructure — (0.5)% | | |
| Macquarie Infrastructure Corp. | (5,976 | ) | (493,797 | ) |
| Wireless Telecommunication Services — (0.7)% | | |
| United States Cellular Corp. | (16,734 | ) | (630,370 | ) |
TOTAL COMMON STOCKS SOLD SHORT — (95.3)% (Proceeds $86,259,335) | | (89,109,442 | ) |
OTHER ASSETS AND LIABILITIES(3) — 97.9% | | 91,537,531 |
|
| TOTAL NET ASSETS — 100.0% | | $ | 93,500,647 |
|
|
| | |
| NOTES TO SCHEDULE OF INVESTMENTS |
| |
| (1) | Security, or a portion thereof, has been pledged at the custodian bank or with a broker for collateral requirements on securities sold short. At the period end, the aggregate value of securities pledged was $52,999,672. |
| |
| (3) | Amount relates primarily to deposits with broker for securities sold short at period end. |
See Notes to Financial Statements.
|
|
| Statement of Assets and Liabilities |
|
| | | |
| JUNE 30, 2015 |
| Assets |
| Investment securities, at value (cost of $87,134,233) | $ | 91,072,558 |
|
| Cash | 5,738 |
|
| Deposits with broker for securities sold short | 92,117,769 |
|
| Receivable for investments sold | 503,081 |
|
| Receivable for capital shares sold | 127,392 |
|
| Dividends and interest receivable | 98,456 |
|
| | 183,924,994 |
|
| | |
| Liabilities | |
| Securities sold short, at value (proceeds of $86,259,335) | 89,109,442 |
|
| Payable for investments purchased | 624,822 |
|
| Payable for capital shares redeemed | 493,402 |
|
| Accrued management fees | 109,251 |
|
| Distribution and service fees payable | 10,001 |
|
| Dividend expense payable on securities sold short | 77,429 |
|
| | 90,424,347 |
|
| | |
| Net Assets | $ | 93,500,647 |
|
| | |
| Net Assets Consist of: | |
| Capital (par value and paid-in surplus) | $ | 97,109,794 |
|
| Accumulated net investment loss | (1,453,092 | ) |
| Accumulated net realized loss | (3,244,273 | ) |
| Net unrealized appreciation | 1,088,218 |
|
| | $ | 93,500,647 |
|
|
| | | | | | |
| | Net Assets | Shares Outstanding | Net Asset Value Per Share |
| Investor Class, $0.01 Par Value |
| $57,262,877 |
| 5,151,592 |
| $11.12 |
| Institutional Class, $0.01 Par Value |
| $9,509,362 |
| 841,173 |
| $11.30 |
| A Class, $0.01 Par Value |
| $18,128,716 |
| 1,663,684 |
| $10.90* |
| C Class, $0.01 Par Value |
| $6,412,641 |
| 628,395 |
| $10.20 |
| R Class, $0.01 Par Value |
| $2,187,051 |
| 205,099 |
| $10.66 |
See Notes to Financial Statements.
|
| | | |
| YEAR ENDED JUNE 30, 2015 | |
| Investment Income (Loss) | |
| Income: | |
| Dividends (net of foreign taxes withheld of $2,452) | $ | 1,645,484 |
|
| Interest | 957 |
|
| | 1,646,441 |
|
| | |
| Expenses: | |
| Dividend expense on securities sold short | 1,502,361 |
|
| Broker fees and charges on securities sold short | 196,232 |
|
| Management fees | 1,483,377 |
|
| Distribution and service fees: | |
| A Class | 49,688 |
|
| C Class | 61,788 |
|
| R Class | 9,721 |
|
| Directors' fees and expenses | 5,615 |
|
| Other expenses | 2,392 |
|
| | 3,311,174 |
|
| | |
| Net investment income (loss) | (1,664,733 | ) |
| | |
| Realized and Unrealized Gain (Loss) | |
| Net realized gain (loss) on: | |
| Investment transactions | 15,719,973 |
|
| Securities sold short transactions | (10,411,791 | ) |
| Foreign currency transactions | 428 |
|
| | 5,308,610 |
|
| | |
| Change in net unrealized appreciation (depreciation) on: | |
| Investments | (10,990,355 | ) |
| Securities sold short | 6,117,846 |
|
| | (4,872,509 | ) |
| | |
| Net realized and unrealized gain (loss) | 436,101 |
|
| | |
| Net Increase (Decrease) in Net Assets Resulting from Operations | $ | (1,228,632 | ) |
See Notes to Financial Statements.
|
|
| Statement of Changes in Net Assets |
|
| | | | | | |
| YEARS ENDED JUNE 30, 2015 AND JUNE 30, 2014 |
| Increase (Decrease) in Net Assets | June 30, 2015 | June 30, 2014 |
| Operations | | |
| Net investment income (loss) | $ | (1,664,733 | ) | $ | (1,228,559 | ) |
| Net realized gain (loss) | 5,308,610 |
| 2,462,143 |
|
| Change in net unrealized appreciation (depreciation) | (4,872,509 | ) | 979,045 |
|
| Net increase (decrease) in net assets resulting from operations | (1,228,632 | ) | 2,212,629 |
|
| | | |
| Capital Share Transactions | | |
Net increase (decrease) in net assets from capital share transactions (Note 5) | (11,523,563 | ) | 58,107,021 |
|
| | | |
| Net increase (decrease) in net assets | (12,752,195 | ) | 60,319,650 |
|
| | | |
| Net Assets | | |
| Beginning of period | 106,252,842 |
| 45,933,192 |
|
| End of period | $ | 93,500,647 |
| $ | 106,252,842 |
|
| | | |
| Accumulated net investment loss | $ | (1,453,092 | ) | $ | (754,355 | ) |
See Notes to Financial Statements.
|
|
| Notes to Financial Statements |
JUNE 30, 2015
1. Organization
American Century Quantitative Equity Funds, Inc. (the corporation) is registered under the Investment Company Act of 1940, as amended (the 1940 Act), as an open-end management investment company and is organized as a Maryland corporation. AC Alternatives Equity Market Neutral Fund (formerly Equity Market Neutral Fund) (the fund) is one fund in a series issued by the corporation. The fund is diversified as defined under the 1940 Act. The fund’s investment objective is to seek capital appreciation independent of equity market conditions.
The fund offers the Investor Class, the Institutional Class, the A Class, the C Class and the R Class. The A Class may incur an initial sales charge. The A Class and C Class may be subject to a contingent deferred sales charge. The share classes differ principally in their respective sales charges and distribution and shareholder servicing expenses and arrangements. The Institutional Class is made available to institutional shareholders or through financial intermediaries whose clients do not require the same level of shareholder and administrative services as shareholders of other classes. As a result, the Institutional Class is charged a lower unified management fee.
2. Significant Accounting Policies
The following is a summary of significant accounting policies consistently followed by the fund in preparation of its financial statements. The fund is an investment company and follows accounting and reporting guidance in accordance with accounting principles generally accepted in the United States of America. This may require management to make certain estimates and assumptions at the date of the financial statements. Actual results could differ from these estimates. Management evaluated the impact of events or transactions occurring through the date the financial statements were issued that would merit recognition or disclosure.
Investment Valuations — The fund determines the fair value of its investments and computes its net asset value per share at the close of regular trading (usually 4 p.m. Eastern time) on the New York Stock Exchange (NYSE) on each day the NYSE is open. The Board of Directors has adopted valuation policies and procedures to guide the investment advisor in the fund’s investment valuation process and to provide methodologies for the oversight of the fund’s pricing function.
Equity securities that are listed or traded on a domestic securities exchange are valued at the last reported sales price or at the official closing price as provided by the exchange. Equity securities traded on foreign securities exchanges are generally valued at the closing price of such securities on the exchange where primarily traded or at the close of the NYSE, if that is earlier. If no last sales price is reported, or if local convention or regulation so provides, the mean of the latest bid and asked prices may be used. Securities traded over-the-counter are valued at the mean of the latest bid and asked prices, the last sales price, or the official closing price. Equity securities initially expressed in local currencies are translated into U.S. dollars at the mean of the appropriate currency exchange rate at the close of the NYSE as provided by an independent pricing service.
Fixed income securities maturing within 60 days at the time of purchase may be valued at cost, plus or minus any amortized discount or premium or at the evaluated mean as provided by an independent pricing service. Evaluated mean prices are commonly derived through utilization of market models, which may consider, among other factors: trade data, quotations from dealers and active market makers, relevant yield curve and spread data, related sector levels, creditworthiness, trade data or market information on comparable securities, and other relevant security specific information.
Open-end management investment companies are valued at the reported net asset value per share. Repurchase agreements are valued at cost, which approximates fair value.
If the fund determines that the market price for an investment is not readily available or the valuation methods mentioned above do not reflect an investment’s fair value, such investment is valued as determined in good faith by the Board of Directors or its delegate, in accordance with policies and procedures adopted by the Board of Directors. In its determination of fair value, the fund may review several factors including, but not limited to, market information regarding the specific investment or comparable investments and correlation with other investment types, futures indices or general market indicators. Circumstances that may cause the
fund to use these procedures to value an investment include, but are not limited to: an investment has been declared in default or is distressed; trading in a security has been suspended during the trading day or a security is not actively trading on its principal exchange; prices received from a regular pricing source are deemed unreliable; or there is a foreign market holiday and no trading occurred.
The fund monitors for significant events occurring after the close of an investment’s primary exchange but before the fund’s net asset value per share is determined. Significant events may include, but are not limited to: corporate announcements and transactions; governmental action and political unrest that could impact a specific investment or an investment sector; or armed conflicts, natural disasters and similar events that could affect investments in a specific country or region. The fund also monitors for significant fluctuations between domestic and foreign markets, as evidenced by the U.S. market or such other indicators that the Board of Directors, or its delegate, deems appropriate. If significant fluctuations in foreign markets are identified, the fund may apply a model-derived factor to the closing price of equity securities traded on foreign securities exchanges. The factor is based on observable market data as provided by an independent pricing service.
Security Transactions — Security transactions are accounted for as of the trade date. Net realized gains and losses are determined on the identified cost basis, which is also used for federal income tax purposes.
Investment Income — Dividend income less foreign taxes withheld, if any, is recorded as of the ex-dividend date. Distributions received on securities that represent a return of capital or long-term capital gain are recorded as a reduction of cost of investments and/or as a realized gain. The fund may estimate the components of distributions received that may be considered nontaxable distributions or long-term capital gain distributions for income tax purposes. Interest income is recorded on the accrual basis and includes accretion of discounts and amortization of premiums.
Securities Sold Short — The fund enters into short sales, which is selling securities it does not own, as part of its normal investment activities. Upon selling a security short, the fund will segregate cash, cash equivalents or other appropriate liquid securities in at least an amount equal to the current market value of the securities sold short until the fund replaces the borrowed security. Interest earned on segregated cash for securities sold short is reflected as interest income. The fund is required to pay any dividends or interest due on securities sold short. Such dividends and interest are recorded as an expense. The fund may pay fees or charges to the broker on the assets borrowed for securities sold short. These fees are calculated daily based upon the value of each security sold short and a rate that is dependent on the availability of such security. Liabilities for securities sold short are valued daily and changes in value are recorded as change in net unrealized appreciation (depreciation) on securities sold short. The fund records realized gain (loss) on a security sold short when it is terminated by the fund and includes as a component of net realized gain (loss) on securities sold short transactions.
Foreign Currency Translations — All assets and liabilities initially expressed in foreign currencies are translated into U.S. dollars at prevailing exchange rates at period end. The fund may enter into spot foreign currency exchange contracts to facilitate transactions denominated in a foreign currency. Purchases and sales of investment securities, dividend and interest income, spot foreign currency exchange contracts, and expenses are translated at the rates of exchange prevailing on the respective dates of such transactions. Net realized and unrealized foreign currency exchange gains or losses related to investment securities are a component of net realized gain (loss) on investment transactions and change in net unrealized appreciation (depreciation) on investments, respectively. Net realized and unrealized foreign currency exchange gains or losses related to securities sold short are a component of net realized gain (loss) on securities sold short transactions and change in net unrealized appreciation (depreciation) on securities sold short, respectively.
Repurchase Agreements — The fund may enter into repurchase agreements with institutions that American Century Investment Management, Inc. (ACIM) (the investment advisor) has determined are creditworthy pursuant to criteria adopted by the Board of Directors. The fund requires that the collateral, represented by securities, received in a repurchase transaction be transferred to the custodian in a manner sufficient to enable the fund to obtain those securities in the event of a default under the repurchase agreement. ACIM monitors, on a daily basis, the securities transferred to ensure the value, including accrued interest, of the securities under each repurchase agreement is equal to or greater than amounts owed to the fund under each repurchase agreement.
Joint Trading Account — Pursuant to an Exemptive Order issued by the Securities and Exchange Commission, the fund, along with certain other funds in the American Century Investments family of funds, may transfer uninvested cash balances into a joint trading account. These balances are invested in one or more repurchase agreements that are collateralized by U.S. Treasury or Agency obligations.
Segregated Assets — In accordance with the 1940 Act, the fund segregates assets on its books and records to cover certain types of investments, including, but not limited to, futures contracts and short sales. ACIM monitors, on a daily basis, the securities segregated to ensure the fund designates a sufficient amount of liquid assets, marked-to-market daily. The fund may also receive assets or be required to pledge assets at the custodian bank or with a broker for margin requirements on futures contracts and short sales.
Income Tax Status — It is the fund’s policy to distribute substantially all net investment income and net realized gains to shareholders and to otherwise qualify as a regulated investment company under provisions of the Internal Revenue Code. Accordingly, no provision has been made for income taxes. The fund files U.S. federal, state, local and non-U.S. tax returns as applicable. The fund's tax returns are subject to examination by the relevant taxing authority until expiration of the applicable statute of limitations, which is generally three years from the date of filing but can be longer in certain jurisdictions. At this time, management believes there are no uncertain tax positions which, based on their technical merit, would not be sustained upon examination and for which it is reasonably possible that the total amounts of unrecognized tax benefits will significantly change in the next twelve months.
Multiple Class — All shares of the fund represent an equal pro rata interest in the net assets of the class to which such shares belong, and have identical voting, dividend, liquidation and other rights and the same terms and conditions, except for class specific expenses and exclusive rights to vote on matters affecting only individual classes. Income, non-class specific expenses, and realized and unrealized capital gains and losses of the fund are allocated to each class of shares based on their relative net assets.
Distributions to Shareholders — Distributions from net investment income, if any, are generally declared and paid semiannually. Distributions from net realized gains, if any, are generally declared and paid annually.
Indemnifications — Under the corporation’s organizational documents, its officers and directors are indemnified against certain liabilities arising out of the performance of their duties to the fund. In addition, in the normal course of business, the fund enters into contracts that provide general indemnifications. The maximum exposure under these arrangements is unknown as this would involve future claims that may be made against a fund. The risk of material loss from such claims is considered by management to be remote.
3. Fees and Transactions with Related Parties
Certain officers and directors of the corporation are also officers and/or directors of American Century Companies, Inc. (ACC). The corporation’s investment advisor, ACIM, the corporation's distributor, American Century Investment Services, Inc. (ACIS), and the corporation’s transfer agent, American Century Services, LLC, are wholly owned, directly or indirectly, by ACC.
Management Fees — The corporation has entered into a management agreement with ACIM, under which ACIM provides the fund with investment advisory and management services in exchange for a single, unified management fee (the fee) per class. The agreement provides that all expenses of managing and operating the fund, except distribution and service fees, expenses on securities sold short, brokerage expenses, taxes, interest, fees and expenses of the independent directors (including legal counsel fees), and extraordinary expenses, will be paid by ACIM. The fee is computed and accrued daily based on each class’s daily net assets and paid monthly in arrears. The fee consists of (1) an Investment Category Fee based on the daily net assets of the fund and certain other accounts managed by the investment advisor that are in the same broad investment category as the fund and (2) a Complex Fee based on the assets of all the funds in the American Century Investments family of funds. The rates for the Investment Category Fee range from 1.0480% to 1.2300%. The rates for the Complex Fee range from 0.2500% to 0.3100% for the Investor Class, A Class, C Class and R Class. The rates for the Complex Fee range from 0.0500% to 0.1100% for the Institutional Class. The effective annual management fee for each class for the year ended June 30, 2015 was 1.37% for the Investor Class, A Class, C Class and R Class and 1.17% for the Institutional Class.
Distribution and Service Fees — The Board of Directors has adopted a separate Master Distribution and Individual Shareholder Services Plan for each of the A Class, C Class and R Class (collectively the plans), pursuant to Rule 12b-1 of the 1940 Act. The plans provide that the A Class will pay ACIS an annual distribution and service fee of 0.25%. The plans provide that the C Class will pay ACIS an annual distribution and service fee of 1.00%, of which 0.25% is paid for individual shareholder services and 0.75% is paid for distribution services. The plans provide that the R Class will pay ACIS an annual distribution and service fee of 0.50%. The fees are computed and accrued daily based on each class’s daily net assets and paid monthly in arrears. The fees are used to pay financial intermediaries for distribution and individual shareholder services. Fees incurred under the plans during the year ended June 30, 2015 are detailed in the Statement of Operations.
Directors' Fees and Expenses — The Board of Directors is responsible for overseeing the investment advisor’s management and operations of the fund. The directors receive detailed information about the fund and its investment advisor regularly throughout the year, and meet at least quarterly with management of the investment advisor to review reports about fund operations. The fund’s officers do not receive compensation from the fund.
4. Investment Transactions
Purchases and sales of investment securities and securities sold short, excluding short-term investments, for the year ended June 30, 2015 were $251,716,607 and $251,672,491, respectively.
5. Capital Share Transactions
Transactions in shares of the fund were as follows:
|
| | | | | | | | | | |
| | Year ended
June 30, 2015 | Year ended June 30, 2014 |
| | Shares | Amount | Shares | Amount |
| Investor Class/Shares Authorized | 40,000,000 |
| | 40,000,000 |
| |
| Sold | 5,311,573 |
| $ | 59,900,281 |
| 4,167,692 |
| $ | 46,504,446 |
|
| Redeemed | (4,666,469 | ) | (52,488,240 | ) | (1,322,752 | ) | (14,744,863 | ) |
| | 645,104 |
| 7,412,041 |
| 2,844,940 |
| 31,759,583 |
|
| Institutional Class/Shares Authorized | 30,000,000 |
| | 10,000,000 |
| |
| Sold | 976,227 |
| 11,193,730 |
| 1,584,808 |
| 17,845,989 |
|
| Redeemed | (1,608,708 | ) | (18,384,088 | ) | (522,372 | ) | (5,868,679 | ) |
| | (632,481 | ) | (7,190,358 | ) | 1,062,436 |
| 11,977,310 |
|
| A Class/Shares Authorized | 20,000,000 |
| | 20,000,000 |
| |
| Sold | 829,380 |
| 9,205,624 |
| 2,785,296 |
| 30,631,505 |
|
| Redeemed | (2,005,491 | ) | (22,268,911 | ) | (1,597,487 | ) | (17,540,509 | ) |
| | (1,176,111 | ) | (13,063,287 | ) | 1,187,809 |
| 13,090,996 |
|
| C Class/Shares Authorized | 20,000,000 |
| | 10,000,000 |
| |
| Sold | 180,581 |
| 1,875,918 |
| 205,123 |
| 2,127,456 |
|
| Redeemed | (102,013 | ) | (1,059,772 | ) | (88,675 | ) | (914,954 | ) |
| | 78,568 |
| 816,146 |
| 116,448 |
| 1,212,502 |
|
| R Class/Shares Authorized | 20,000,000 |
| | 10,000,000 |
| |
| Sold | 133,226 |
| 1,443,496 |
| 66,960 |
| 724,675 |
|
| Redeemed | (86,698 | ) | (941,601 | ) | (61,969 | ) | (658,045 | ) |
| | 46,528 |
| 501,895 |
| 4,991 |
| 66,630 |
|
| Net increase (decrease) | (1,038,392 | ) | $ | (11,523,563 | ) | 5,216,624 |
| $ | 58,107,021 |
|
6. Fair Value Measurements
The fund’s investments valuation process is based on several considerations and may use multiple inputs to determine the fair value of the investments held by the fund. In conformity with accounting principles generally accepted in the United States of America, the inputs used to determine a valuation are classified into three broad levels.
| |
| • | Level 1 valuation inputs consist of unadjusted quoted prices in an active market for identical investments. |
| |
| • | Level 2 valuation inputs consist of direct or indirect observable market data (including quoted prices for comparable investments, evaluations of subsequent market events, interest rates, prepayment speeds, credit risk, etc.). These inputs also consist of quoted prices for identical investments initially expressed in local currencies that are adjusted through translation into U.S. dollars. |
| |
| • | Level 3 valuation inputs consist of unobservable data (including a fund’s own assumptions). |
The level classification is based on the lowest level input that is significant to the fair valuation measurement. The valuation inputs are not necessarily an indication of the risks associated with investing in these securities or other financial instruments. There were no significant transfers between levels during the period.
The following is a summary of the level classifications as of period end. The Schedule of Investments provides additional information on the fund’s portfolio holdings.
|
| | | | | | | | |
| | Level 1 | Level 2 | Level 3 |
| Assets | | | |
| Investment Securities | | | |
| Common Stocks | $ | 89,074,057 |
| — |
| — |
|
| Temporary Cash Investments | 327,185 |
| $ | 1,671,316 |
| — |
|
| | $ | 89,401,242 |
| $ | 1,671,316 |
| — |
|
| | | | |
| Liabilities | | | |
| Securities Sold Short | | | |
| Common Stocks | $ | (89,109,442 | ) | — |
| — |
|
7. Risk Factors
The fund’s investment process may result in high portfolio turnover, which could mean high transaction costs, affecting both performance and capital gains tax liabilities to investors.
The fund is subject to short sales risk. If the market price of a security increases after the fund borrows the security, the fund may suffer a loss when it replaces the borrowed security at the higher price. Any loss will be increased by the amount of compensation, interest or dividends, and transaction costs the fund must pay to the lender of the borrowed security.
If the fund is overweighted in a stock or sector, any negative development related to that stock or sector will have a greater impact on the fund than other funds that are not overweighted in that stock or sector.
8. Federal Tax Information
The book-basis character of distributions made during the year from net investment income or net realized gains may differ from their ultimate characterization for federal income tax purposes. These differences reflect the differing character of certain income items and net realized gains and losses for financial statement and tax purposes, and may result in reclassification among certain capital accounts on the financial statements. There were no distributions paid by the fund during the years ended June 30, 2015 and June 30, 2014.
The reclassifications, which are primarily due to net operating losses, were made to capital $(969,276), accumulated net investment loss $965,996, and accumulated net realized loss $3,280.
As of June 30, 2015, the federal tax cost of investments and the components of distributable earnings on a tax-basis were as follows:
|
| | | |
| Federal tax cost of investments | $ | 87,275,578 |
|
| Gross tax appreciation of investments | $ | 9,054,191 |
|
| Gross tax depreciation of investments | (5,257,211 | ) |
| Net tax appreciation (depreciation) of investments | 3,796,980 |
|
| Net tax appreciation (depreciation) on securities sold short | (3,109,689 | ) |
| Net tax appreciation (depreciation) | $ | 687,291 |
|
| Undistributed ordinary income | — |
|
| Late-year ordinary loss deferral | $ | (1,453,092 | ) |
Post-October capital loss deferral
| $ | (2,843,346 | ) |
The difference between book-basis and tax-basis unrealized appreciation (depreciation) is attributable primarily to the tax deferral of losses on wash sales.
Loss deferrals represent certain qualified losses that the fund has elected to treat as having been incurred in the following fiscal year for federal income tax purposes.
|
| | | | | | | | | | | | | |
| For a Share Outstanding Throughout the Years Ended June 30 (except as noted) |
| Per-Share Data | | | Ratios and Supplemental Data | | |
| | | Income From Investment Operations: | | | Ratio to Average Net Assets of: | | |
| | Net Asset Value, Beginning of Period | Net Investment Income (Loss)(1) | Net Realized and Unrealized Gain (Loss) | Total From Investment Operations | Net Asset Value, End of Period | Total Return(2) | Operating Expenses | Operating Expenses (excluding expenses on securities sold short) | Net Investment Income (Loss) | Portfolio Turnover Rate | Net Assets, End of Period (in thousands) |
| Investor Class | | | | | | | | | |
| 2015 | $11.24 | (0.16) | 0.04 | (0.12) | $11.12 | (1.07)% | 2.91% | 1.38% | (1.42)% | 243% |
| $57,263 |
|
| 2014 | $10.78 | (0.17) | 0.63 | 0.46 | $11.24 | 4.27% | 2.92% | 1.38% | (1.56)% | 226% |
| $50,641 |
|
| 2013 | $10.54 | (0.11) | 0.35 | 0.24 | $10.78 | 2.28% | 3.07% | 1.39% | (1.00)% | 222% |
| $17,916 |
|
| 2012 | $10.37 | (0.22) | 0.39 | 0.17 | $10.54 | 1.64% | 3.38% | 1.40% | (2.07)% | 252% |
| $23,019 |
|
| 2011 | $10.00 | (0.22) | 0.59 | 0.37 | $10.37 | 3.70% | 3.50% | 1.42% | (2.34)% | 261% |
| $21,866 |
|
| Institutional Class | | | | | | | | | |
| 2015 | $11.41 | (0.14) | 0.03 | (0.11) | $11.30 | (0.96)% | 2.71% | 1.18% | (1.22)% | 243% |
| $9,509 |
|
| 2014 | $10.92 | (0.15) | 0.64 | 0.49 | $11.41 | 4.49% | 2.72% | 1.18% | (1.36)% | 226% |
| $16,810 |
|
| 2013 | $10.65 | (0.08) | 0.35 | 0.27 | $10.92 | 2.54% | 2.87% | 1.19% | (0.80)% | 222% |
| $4,491 |
|
| 2012 | $10.46 | (0.20) | 0.39 | 0.19 | $10.65 | 1.82% | 3.18% | 1.20% | (1.87)% | 252% |
| $5,618 |
|
| 2011 | $10.07 | (0.26) | 0.65 | 0.39 | $10.46 | 3.87% | 3.30% | 1.22% | (2.14)% | 261% |
| $4,194 |
|
| A Class | | | | | | | | |
| 2015 | $11.04 | (0.19) | 0.05 | (0.14) | $10.90 | (1.27)% | 3.16% | 1.63% | (1.67)% | 243% |
| $18,129 |
|
| 2014 | $10.62 | (0.20) | 0.62 | 0.42 | $11.04 | 3.95% | 3.17% | 1.63% | (1.81)% | 226% |
| $31,354 |
|
| 2013 | $10.41 | (0.13) | 0.34 | 0.21 | $10.62 | 2.02% | 3.32% | 1.64% | (1.25)% | 222% |
| $17,545 |
|
| 2012 | $10.27 | (0.24) | 0.38 | 0.14 | $10.41 | 1.36% | 3.63% | 1.65% | (2.32)% | 252% |
| $32,386 |
|
| 2011 | $9.93 | (0.26) | 0.60 | 0.34 | $10.27 | 3.42% | 3.75% | 1.67% | (2.59)% | 261% |
| $28,691 |
|
|
| | | | | | | | | | | | | |
| For a Share Outstanding Throughout the Years Ended June 30 (except as noted) |
| Per-Share Data | | | Ratios and Supplemental Data | | |
| | | Income From Investment Operations: | | | Ratio to Average Net Assets of: | | |
| | Net Asset Value, Beginning of Period | Net Investment Income (Loss)(1) | Net Realized and Unrealized Gain (Loss) | Total From Investment Operations | Net Asset Value, End of Period | Total Return(2) | Operating Expenses | Operating Expenses (excluding expenses on securities sold short) | Net Investment Income (Loss) | Portfolio Turnover Rate | Net Assets, End of Period (in thousands) |
| C Class | | | | | | | | |
| 2015 | $10.42 | (0.25) | 0.03 | (0.22) | $10.20 | (2.11)% | 3.91% | 2.38% | (2.42)% | 243% |
| $6,413 |
|
| 2014 | $10.10 | (0.26) | 0.58 | 0.32 | $10.42 | 3.17% | 3.92% | 2.38% | (2.56)% | 226% |
| $5,729 |
|
| 2013 | $9.97 | (0.20) | 0.33 | 0.13 | $10.10 | 1.30% | 4.07% | 2.39% | (2.00)% | 222% |
| $4,377 |
|
| 2012 | $9.91 | (0.31) | 0.37 | 0.06 | $9.97 | 0.61% | 4.38% | 2.40% | (3.07)% | 252% |
| $5,815 |
|
| 2011 | $9.65 | (0.32) | 0.58 | 0.26 | $9.91 | 2.69% | 4.50% | 2.42% | (3.34)% | 261% |
| $6,845 |
|
| R Class | | | | | | | | |
| 2015 | $10.83 | (0.21) | 0.04 | (0.17) | $10.66 | (1.57)% | 3.41% | 1.88% | (1.92)% | 243% |
| $2,187 |
|
| 2014 | $10.45 | (0.22) | 0.60 | 0.38 | $10.83 | 3.64% | 3.42% | 1.88% | (2.06)% | 226% |
| $1,718 |
|
| 2013 | $10.26 | (0.16) | 0.35 | 0.19 | $10.45 | 1.85% | 3.57% | 1.89% | (1.50)% | 222% |
| $1,604 |
|
| 2012 | $10.15 | (0.26) | 0.37 | 0.11 | $10.26 | 1.08% | 3.88% | 1.90% | (2.57)% | 252% |
| $1,039 |
|
| 2011 | $9.84 | (0.26) | 0.57 | 0.31 | $10.15 | 3.15% | 4.00% | 1.92% | (2.84)% | 261% |
| $837 |
|
|
|
| Notes to Financial Highlights |
| |
| (1) | Computed using average shares outstanding throughout the period. |
| |
| (2) | Total returns are calculated based on the net asset value of the last business day and do not reflect applicable sales charges, if any. Total returns for periods less than one year are not annualized. |
See Notes to Financial Statements.
|
|
| Report of Independent Registered Public Accounting Firm |
To the Directors of the American Century Quantitative Equity Funds, Inc. and Shareholders of the
AC Alternatives Equity Market Neutral Fund:
In our opinion, the accompanying statement of assets and liabilities, including the schedule of investments, and the related statements of operations and of changes in net assets and the financial highlights present fairly, in all material respects, the financial position of the AC Alternatives Equity Market Neutral Fund (formerly Equity Market Neutral Fund) (one of the sixteen funds comprising the American Century Quantitative Equity Funds, Inc., hereafter referred to as the “Fund”) at June 30, 2015, the results of its operations for the year then ended, the changes in its net assets for each of the two years in the period then ended and the financial highlights for each of the five years in the period then ended, in conformity with accounting principles generally accepted in the United States of America. These financial statements and financial highlights (hereafter referred to as "financial statements") are the responsibility of the Fund's management. Our responsibility is to express an opinion on these financial statements based on our audits. We conducted our audits of these financial statements in accordance with the standards of the Public Company Accounting Oversight Board (United States). Those standards require that we plan and perform the audit to obtain reasonable assurance about whether the financial statements are free of material misstatement. An audit includes examining, on a test basis, evidence supporting the amounts and disclosures in the financial statements, assessing the accounting principles used and significant estimates made by management, and evaluating the overall financial statement presentation. We believe that our audits, which included confirmation of securities at June 30, 2015 by correspondence with the custodian and brokers, provide a reasonable basis for our opinion.
PricewaterhouseCoopers LLP
Kansas City, Missouri
August 21, 2015
Board of Directors
The individuals listed below serve as directors of the funds. Each director will continue to serve in this capacity until death, retirement, resignation or removal from office. The board has adopted a mandatory retirement age for directors who are not “interested persons,” as that term is defined in the Investment Company Act (independent directors). Independent directors shall retire on December 31 of the year in which they reach their 75th birthday; provided, however, that on or after January 1, 2022, independent directors shall retire on December 31 of the year in which they reach their 76th birthday.
Mr. Thomas is an “interested person” because he currently serves as President and Chief Executive Officer of American Century Companies, Inc. (ACC), the parent company of American Century Investment Management, Inc. (ACIM or the advisor). The other directors (more than three-fourths of the total number) are independent. They are not employees, directors or officers of, and have no financial interest in, ACC or any of its wholly owned, direct or indirect, subsidiaries, including ACIM, American Century Investment Services, Inc. (ACIS) and American Century Services, LLC (ACS), and they do not have any other affiliations, positions or relationships that would cause them to be considered “interested persons” under the Investment Company Act. The directors serve in this capacity for eight (in the case of Mr. Thomas, 15) registered investment companies in the American Century Investments family of funds.
The following table presents additional information about the directors. The mailing address for each director other than Mr. Thomas is 1665 Charleston Road, Mountain View, California 94043. The mailing address for Mr. Thomas is 4500 Main Street, Kansas City, Missouri 64111.
|
| | | | | |
Name (Year of Birth) | Position(s) Held with Funds | Length of Time Served | Principal Occupation(s) During Past 5 Years | Number of American Century Portfolios Overseen by Director | Other Directorships Held During Past 5 Years |
Independent Directors | | |
Tanya S. Beder
(1955) | Director | Since 2011 | Chairman and CEO, SBCC Group Inc. (independent advisory services) (2006 to present) | 46 | CYS Investments, Inc. (NYSE mortgage arbitrage REIT) |
Jeremy I. Bulow
(1954) | Director | Since 2011 | Professor of Economics, Stanford University, Graduate School of Business (1979 to present) | 46 | None |
Ronald J. Gilson
(1946) | Director and Chairman of the Board | Since 1995
(Chairman since 2005) | Charles J. Meyers Professor of Law and Business, Stanford Law School (1979 to present); Marc and Eva Stern Professor of Law and Business, Columbia University School of Law (1992 to present) | 46 | None |
Frederick L. A. Grauer
(1946) | Director | Since 2008 | Senior Advisor, BlackRock, Inc. (investment management firm) (2010 to 2011, 2013 to present) | 46 | None |
Peter F. Pervere
(1947) | Director | Since 2007 | Retired | 46 | None |
|
| | | | | |
Name (Year of Birth) | Position(s) Held with Funds | Length of Time Served | Principal Occupation(s) During Past 5 Years | Number of American Century Portfolios Overseen by Director | Other Directorships Held During Past 5 Years |
| Independent Directors | | |
John B. Shoven
(1947) | Director | Since 2002 | Professor of Economics, Stanford University (1973 to present) | 46 | Cadence Design Systems; Exponent; Financial Engines |
| Interested Director | | |
Jonathan S. Thomas
(1963) | Director and President | Since 2007 | President and Chief Executive Officer, ACC (March 2007 to present). Also serves as Chief Executive Officer, ACS; Executive Vice President, ACIM; Director, ACC, ACIM and other ACC subsidiaries | 124 | BioMed Valley Discoveries, Inc. |
The Statement of Additional Information has additional information about the fund's directors and is available without charge, upon request, by calling 1-800-345-2021.
Officers
The following table presents certain information about the executive officers of the funds. Each officer serves as an officer for each of the 15 investment companies in the American Century family of funds, unless otherwise noted. No officer is compensated for his or her service as an officer of the funds. The listed officers are interested persons of the funds and are appointed or re-appointed on an annual basis. The mailing address for each of the officers listed below is 4500 Main Street, Kansas City, Missouri 64111.
|
| | |
Name (Year of Birth) | Offices with the Funds | Principal Occupation(s) During the Past Five Years |
Jonathan S.
Thomas
(1963) | Director and President
since 2007 | President and Chief Executive Officer, ACC (March 2007 to present). Also serves as Chief Executive Officer, ACS; Executive Vice President, ACIM; Director, ACC, ACIM and other ACC subsidiaries |
Amy D. Shelton
(1964) | Chief Compliance Officer and Vice President since 2014 | Chief Compliance Officer, American Century funds, (March 2014 to present); Chief Compliance Officer, ACIM (February 2014 to present); Chief Compliance Officer, ACIS (October 2009 to present); Vice President, Client Interactions and Marketing, ACIS (February 2013 to January 2014); Director, Client Interactions and Marketing, ACIS (June 2007 to January 2013). Also serves as Vice President, ACIS |
Charles A. Etherington
(1957) | General Counsel since 2007 and Senior Vice President since 2006 | Attorney, ACC (February 1994 to present); Vice President, ACC (November 2005 to present); General Counsel, ACC (March 2007 to present). Also serves as General Counsel, ACIM, ACS, ACIS and other ACC subsidiaries; and Senior Vice President, ACIM and ACS |
C. Jean Wade
(1964) | Vice President, Treasurer and Chief Financial Officer since 2012 | Vice President, ACS (February 2000 to present) |
Robert J. Leach
(1966) | Vice President since 2006 and Assistant Treasurer since 2012 | Vice President, ACS (February 2000 to present) |
David H. Reinmiller
(1963) | Vice President since 2001 | Attorney, ACC (January 1994 to present); Associate General Counsel, ACC (January 2001 to present). Also serves as Vice President, ACIM and ACS |
Ward D. Stauffer
(1960) | Secretary since 2005 | Attorney, ACC (June 2003 to present) |
|
|
| Approval of Management Agreement |
At a meeting held on June 16, 2015, the Fund’s Board of Directors unanimously approved the renewal of the management agreement pursuant to which American Century Investment Management, Inc. (the “Advisor”) acts as the investment advisor for the Fund. Under Section 15(c) of the Investment Company Act, contracts for investment advisory services are required to be reviewed, evaluated, and approved by a majority of a fund’s directors/trustees, including a majority of the independent Directors, each year. The Board regards this annual evaluation and renewal as one of its most important responsibilities.
The independent Directors have memorialized a statement regarding the relationship between their ongoing obligations to oversee and evaluate the performance of the Advisor and their annual consideration of renewal of the management agreement. In that statement, the independent Directors noted that their assessment of the Advisor’s performance is an ongoing process that takes place over the entire year and is informed by all of the extensive information that the Board and its committees receive and consider over time. This information, together with the materials provided in connection with the review, are central to the Board’s assessment of the Advisor’s performance and its determination whether to renew the Fund’s management agreement.
Prior to its consideration of the renewal of the management agreement, the Board requested and reviewed extensive data and analysis relating to the proposed renewal. This information and analysis was compiled by the Advisor and certain independent providers of evaluation data concerning the Fund and the services provided to the Fund by the Advisor.
In connection with its consideration of the renewal of the management agreement, the Board’s review and evaluation of the services provided by the Advisor included, but was not limited to, the following:
| |
| • | the nature, extent, and quality of investment management, shareholder services, and other services provided by the Advisor to the Fund; |
| |
| • | the wide range of other programs and services the Advisor provides to the Fund and its shareholders on a routine and non-routine basis; |
| |
| • | the investment performance of the Fund, including data comparing the Fund’s performance to appropriate benchmarks and/or a peer group of other mutual funds with similar investment objectives and strategies; |
| |
| • | the cost of owning the Fund compared to the cost of owning similar funds; |
| |
| • | the Advisor’s compliance policies, procedures, and regulatory experience; |
| |
| • | financial data showing the cost of services provided to the Fund, the profitability of the Fund to the Advisor, and the overall profitability of the Advisor; |
| |
| • | possible economies of scale associated with the Advisor’s management of the Fund and other accounts under its management; |
| |
| • | data comparing services provided and charges to other investment management clients of the Advisor; |
| |
| • | acquired fund fees and expenses; |
| |
| • | payments by the Fund and the Advisor to financial intermediaries whose clients are investors in the Fund; and |
| |
| • | any collateral benefits derived by the Advisor from the management of the Fund. |
In keeping with its practice, the Board held two in-person meetings to review and discuss the information provided in response to their request. The independent Directors also had the benefit of the advice of their independent counsel throughout the process.
Factors Considered
The Directors considered all of the information provided by the Advisor, the independent data providers, and the independent Directors’ independent counsel in connection with the review, and evaluated such information for the Fund. In connection with their review, the Directors did not identify any single factor as being all-important or controlling and each Director may have attributed different levels of importance to different factors. In deciding to renew the management agreement, the Board based its decision on a number of factors, including the following:
Nature, Extent and Quality of Services - Generally. Under the management agreement, the Advisor is responsible for providing or arranging for all services necessary for the operation of the Fund. The Board noted that under the management agreement, the Advisor provides or arranges at its own expense a wide variety of services including:
| |
| • | constructing and designing the Fund |
| |
| • | portfolio research and security selection |
| |
| • | initial capitalization/funding |
| |
| • | daily valuation of the Fund’s portfolio |
| |
| • | shareholder servicing and transfer agency, including shareholder confirmations, recordkeeping, and communications |
| |
| • | legal services (except the independent Directors’ counsel) |
| |
| • | regulatory and portfolio compliance |
| |
| • | marketing and distribution (except amounts paid by the Fund under Rule 12b-1 plans) |
The Board noted that many of these services have expanded over time both in terms of quantity and complexity in response to shareholder demands, competition in the industry, changing distribution channels, and the changing regulatory environment.
Investment Management, Shareholder, and Other Services. The nature of the investment management services provided to the Fund is quite complex and allows Fund shareholders access to professional money management, instant diversification of their investments within an asset class, the opportunity to easily diversify among asset classes by investing in or exchanging among various American Century Investments funds, and liquidity. In evaluating investment performance, the Board expects the Advisor to manage the Fund in accordance with its investment objectives and approved strategies. Further, the Directors recognize that the Advisor has an obligation to seek the best execution of fund trades. In providing these services, the Advisor utilizes teams of investment professionals (portfolio managers, analysts, research assistants, and securities traders) who require extensive information technology, research, training, compliance, and other systems to conduct their business. The Board, directly and through its Portfolio Committee, regularly reviews investment performance information for the Fund, together with comparative information for appropriate benchmarks and/or peer groups of similarly-managed funds, over different time horizons. The Directors also review detailed performance information during the management agreement approval process. If performance concerns are identified, the Fund receives special reviews until performance improves, during which the Board discusses with the Advisor the reasons for such results (e.g., market conditions, security selection) and any efforts being undertaken to improve performance. The Fund’s performance was above its benchmark for the one-, three-, and five-year periods reviewed by the Board. The Board found the investment management services provided by the Advisor to the Fund to be satisfactory and consistent with the management agreement.
Under the management agreement, the Advisor provides the Fund with a comprehensive package of transfer agency, shareholder, and other services. The Board, directly and through various committees of the Board, regularly reviews reports and evaluations of such services at its regular
meetings. These reports include, but are not limited to, information regarding the operational efficiency and accuracy of the shareholder and transfer agency services provided, staffing levels, shareholder satisfaction (as measured by external as well as internal sources), technology support, new products and services offered to Fund shareholders, securities trading activities, portfolio valuation services, auditing services, and legal and operational compliance activities.
Certain aspects of shareholder and transfer agency service level efficiency and the quality of securities trading activities are measured by independent third party providers and are presented in comparison to other fund groups not managed by the Advisor. The Board found the services provided by the Advisor to the Fund under the management agreement to be competitive and of high quality.
Costs of Services and Profitability. The Advisor provides detailed information concerning its cost of providing various services to the Fund, its profitability in managing the Fund, its overall profitability, and its financial condition. The Directors have reviewed with the Advisor the methodology used to prepare this financial information. This information is considered in evaluating the Advisor’s financial condition, its ability to continue to provide services under the management agreement, and the reasonableness of the current management fee. The Board concluded that the Advisor’s profits were reasonable in light of the services provided to the Fund.
Ethics. The Board generally considers the Advisor’s commitment to providing quality services to shareholders and to conducting its business ethically. They noted that the Advisor’s practices generally meet or exceed industry best practices.
Economies of Scale. The Board also reviewed information provided by the Advisor regarding the possible existence of economies of scale in connection with the management of the Fund. The Board concluded that economies of scale are difficult to measure and predict with precision, especially on a fund-by-fund basis. The Board concluded that the Advisor is appropriately sharing economies of scale through its competitive fee structure, offering competitive fees from fund inception, and through reinvestment in its business to provide shareholders enhanced and expanded services.
Comparison to Other Funds’ Fees. The management agreement provides that the Fund pays the Advisor a single, all-inclusive (or unified) management fee for providing all services necessary for the management and operation of the Fund, other than brokerage expenses, taxes, interest, extraordinary expenses, the fees and expenses of the Fund’s independent Directors (including their independent legal counsel), and expenses incurred in connection with the provision of shareholder services and distribution services under a plan adopted pursuant to Rule 12b-1 under the 1940 Act. Under the unified fee structure, the Advisor is responsible for providing all investment advisory, custody, audit, administrative, compliance, recordkeeping, marketing, and shareholder services, or arranging and supervising third parties to provide such services. By contrast, most other funds are charged a variety of fees, including an investment advisory fee, a transfer agency fee, an administrative fee, distribution charges, and other expenses. Other than their investment advisory fees and any applicable Rule 12b-1 fees, all other components of the total fees charged by these other funds may be increased without shareholder approval. The Board believes the unified fee structure is a benefit to Fund shareholders because it clearly discloses to shareholders the cost of owning Fund shares, and, since the unified fee cannot be increased without a vote of Fund shareholders, it shifts to the Advisor the risk of increased costs of operating the Fund and provides a direct incentive to minimize administrative inefficiencies. Part of the Board’s analysis of fee levels involves reviewing certain evaluative data compiled by an independent provider and comparing the Fund’s unified fee to the total expense ratio of peer funds. The unified fee charged to shareholders of the Fund was below the median of the total expense ratios of the Fund’s peer universe. The Board concluded that the management fee paid by the Fund to the Advisor under the management agreement is reasonable in light of the services provided to the Fund.
Comparison to Fees and Services Provided to Other Clients of the Advisor. The Board also requested and received information from the Advisor concerning the nature of the services, fees, costs, and profitability of its advisory services to advisory clients other than the Fund. They observed that these varying types of client accounts require different services and involve different regulatory and entrepreneurial risks than the management of the Fund. The Board analyzed this information and concluded that the fees charged and services provided to the Fund were reasonable by comparison.
Payments to Intermediaries. The Directors also requested and received a description of payments made to intermediaries by the Fund and the Advisor. These payments include various payments made by the Fund or the Advisor to different types of intermediaries and recordkeepers for distribution and service activities provided for the Fund.
Collateral or “Fall-Out” Benefits Derived by the Advisor. The Board considered the existence of collateral benefits the Advisor may receive as a result of its relationship with the Fund. The Board noted that the Advisor’s primary business is managing mutual funds and it generally does not use fund or shareholder information to generate profits in other lines of business, and therefore does not derive any significant collateral benefits from them. The Board noted that the Advisor receives proprietary research from broker-dealers that execute fund portfolio transactions. The Board also determined that the Advisor is able to provide investment management services to certain clients other than the Fund, at least in part, due to its existing infrastructure built to serve the fund complex.
Existing Relationship. The Board also considered whether there was any reason for not continuing the existing arrangement with the Advisor. In this regard, the Board was mindful of the potential disruptions of the Fund’s operations and various risks, uncertainties, and other effects that could occur as a result of a decision not to continue such relationship. In particular, the Board recognized that most shareholders have invested in the Fund on the strength of the Advisor’s industry standing and reputation and in the expectation that the Advisor will have a continuing role in providing advisory services to the Fund.
Conclusion of the Directors. As a result of this process, the Board, including all of the independent Directors and assisted by the advice of independent legal counsel, taking into account all of the factors discussed above and the information provided by the Advisor and others in connection with its review and throughout the year, concluded that the management agreement between the Fund and the Advisor is fair and reasonable in light of the services provided and should be renewed.
Retirement Account Information
As required by law, distributions you receive from certain IRAs are subject to federal income tax withholding, unless you elect not to have withholding apply. Tax will be withheld on the total amount withdrawn even though you may be receiving amounts that are not subject to withholding, such as nondeductible contributions. In such case, excess amounts of withholding could occur. You may adjust your withholding election so that a greater or lesser amount will be withheld.
If you don’t want us to withhold on this amount, you must notify us to not withhold the federal income tax. You may notify us in writing or in certain situations by telephone or through other electronic means. For systematic withdrawals, your withholding election will remain in effect until revoked or changed by filing a new election. You have the right to revoke your election at any time.
Remember, even if you elect not to have income tax withheld, you are liable for paying income tax on the taxable portion of your withdrawal. If you elect not to have income tax withheld or you don’t have enough income tax withheld, you may be responsible for payment of estimated tax. You may incur penalties under the estimated tax rules if your withholding and estimated tax payments are not sufficient. You can reduce or defer the income tax on a distribution by directly or indirectly rolling such distribution over to another IRA or eligible plan. You should consult your tax advisor for additional information.
State tax will be withheld if, at the time of your distribution, your address is within one of the mandatory withholding states and you have federal income tax withheld (or as otherwise required by state law). State taxes will be withheld from your distribution in accordance with the respective state rules.
Distributions you receive from 403(b), 457 and qualified plans are subject to special tax and withholding rules. Your plan administrator or plan sponsor is required to provide you with a special tax notice explaining those rules at the time you request a distribution. If applicable, federal and/or state taxes may be withheld from your distribution amount.
Proxy Voting Policies
Descriptions of the principles and policies that the fund's investment advisor uses in exercising the voting rights associated with the securities purchased and/or held by the fund are available without charge, upon request, by calling 1-800-345-2021 or visiting the "About Us" page of American Century Investments’ website at americancentury.com. A description of the policies is also available on the Securities and Exchange Commission’s website at sec.gov. Information regarding how the investment advisor voted proxies relating to portfolio securities during the most recent 12-month period ended June 30 is available on the "About Us" page at americancentury.com. It is also available at sec.gov.
Quarterly Portfolio Disclosure
The fund files its complete schedule of portfolio holdings with the Securities and Exchange Commission (SEC) for the first and third quarters of each fiscal year on Form N-Q. The fund’s Forms N-Q are available on the SEC’s website at sec.gov, and may be reviewed and copied at the SEC’s Public Reference Room in Washington, DC. Information on the operation of the Public Reference Room may be obtained by calling 1-800-SEC-0330. The fund also makes its complete schedule of portfolio holdings for the most recent quarter of its fiscal year available on its website at americancentury.com and, upon request, by calling 1-800-345-2021.
|
| | |
| |
| | | |
| Contact Us | americancentury.com | |
| Automated Information Line | 1-800-345-8765 | |
| Investor Services Representative | 1-800-345-2021
or 816-531-5575 | |
| Investors Using Advisors | 1-800-378-9878 | |
Business, Not-For-Profit, Employer-Sponsored
Retirement Plans | 1-800-345-3533 | |
Banks and Trust Companies, Broker-Dealers,
Financial Professionals, Insurance Companies | 1-800-345-6488 | |
| Telecommunications Relay Service for the Deaf | 711 | |
| | | |
| American Century Quantitative Equity Funds, Inc. | |
| | | |
Investment Advisor: American Century Investment Management, Inc. Kansas City, Missouri | |
| | | |
| This report and the statements it contains are submitted for the general information of our shareholders. The report is not authorized for distribution to prospective investors unless preceded or accompanied by an effective prospectus. | |
| | | |
©2015 American Century Proprietary Holdings, Inc. All rights reserved.
CL-ANN-86501 1508 | |
|
| |
| ANNUAL REPORT | JUNE 30, 2015 |
Global Gold Fund
|
| | |
| President's Letter | 2 |
|
| Performance | 3 |
|
| Portfolio Commentary | |
|
| Fund Characteristics | |
|
| Shareholder Fee Example | |
|
| Schedule of Investments | |
|
| Statement of Assets and Liabilities | |
|
| Statement of Operations | |
|
| Statement of Changes in Net Assets | |
|
| Notes to Financial Statements | |
|
| Financial Highlights | |
|
| Report of Independent Registered Public Accounting Firm | |
|
| Management | |
|
| Approval of Management Agreement | |
|
| Additional Information | |
|
Any opinions expressed in this report reflect those of the author as of the date of the report, and do not necessarily represent the opinions of American Century Investments® or any other person in the American Century Investments organization. Any such opinions are subject to change at any time based upon market or other conditions and American Century Investments disclaims any responsibility to update such opinions. These opinions may not be relied upon as investment advice and, because investment decisions made by American Century Investments funds are based on numerous factors, may not be relied upon as an indication of trading intent on behalf of any American Century Investments fund. Security examples are used for representational purposes only and are not intended as recommendations to purchase or sell securities. Performance information for comparative indices and securities is provided to American Century Investments by third party vendors. To the best of American Century Investments’ knowledge, such information is accurate at the time of printing.
|
| |
| Dear Investor:
Thank you for reviewing this annual report for the 12 months ended June 30, 2015. It provides investment performance and portfolio information for the reporting period, plus longer-term historical performance data.
Annual reports remain important vehicles for conveying information about fund returns, including market and economic factors that affected performance during the reporting period. For additional, updated investment and market insights, we encourage you to visit our website, americancentury.com. |
| Jonathan Thomas |
Global Divergence Favored U.S. Assets
“Global divergence” between the U.S. and the rest of the world emerged as a prevalent theme during the reporting period. This theme embraced not only the relatively stronger economic growth enjoyed by the U.S. compared with most of the world, but also the related contrast between the U.S. Federal Reserve’s unwinding of monetary stimulus compared with the continuation and expansion of stimulus by other major central banks. Low inflation also prevailed, after crude oil prices plunged over 40% amid muted demand for commodities in general. In this environment, the U.S. dollar, U.S. growth stocks, and longer-maturity U.S. Treasuries generally benefited from “flight to quality” capital flows, reinforced by geopolitical and financial turmoil, particularly in Greece, Russia/Ukraine, China, and the Middle East.
Strong global capital flows into U.S. assets generated a global divergence between investment returns for U.S. and non-U.S. markets, especially for U.S. investors who realized their returns in dollar terms. For the reporting period, the U.S. Dollar Index, the S&P 500 Index, and the Barclays U.S. Aggregate Bond Index returned 19.74%, 7.42%, and 1.86%, respectively. By contrast, the MSCI EAFE Index, the MSCI Emerging Markets Index, and the Barclays Global Aggregate Bond ex-USD (Unhedged) Index returned -4.22%, -5.12%, and -13.19%, respectively, for U.S. investors unhedged for the strong dollar’s impact on non-dollar-denominated returns.
We expect more monetary policy divergence between the U.S. and other major developed economies in the coming months, accompanied by continued market volatility. This could present both challenges and opportunities for active investment managers. Upward pressures on inflation and interest rates could develop as the massive amount of global monetary stimulus in progress takes hold and economies improve. In this environment, we continue to believe in a disciplined, diversified, long-term investment approach, using professionally managed stock and bond portfolios to meet financial goals. We appreciate your continued trust in us.
Sincerely,
Jonathan Thomas
President and Chief Executive Officer
American Century Investments
|
| | | | | | |
| Total Returns as of June 30, 2015 |
| | Average Annual Returns | |
| | Ticker Symbol | 1 year | 5 years | 10 years | Since Inception | Inception Date |
| Investor Class | BGEIX | -32.61% | -17.06% | -0.60% | 0.91% | 8/17/88 |
| NYSE Arca Gold Miners Index | — | -31.97% | -18.26% | -1.84% | N/A(1) | — |
| MSCI World Index | — | 1.43% | 13.09% | 6.37% | 7.22%(2) | — |
| Institutional Class | AGGNX | -32.48% | -16.90% | — | -8.76% | 9/28/07 |
A Class(3) | ACGGX | | | | | 5/6/98 |
| No sales charge* | | -32.84% | -17.27% | -0.85% | 2.32% | |
| With sales charge* | | -36.71% | -18.25% | -1.43% | 1.97% | |
| C Class | AGYCX | -33.36% | -17.90% | — | -9.86% | 9/28/07 |
| R Class | AGGWX | -32.98% | -17.47% | — | -9.40% | 9/28/07 |
| |
| * | Sales charges include initial sales charges and contingent deferred sales charges (CDSCs), as applicable. A Class shares have a 5.75% maximum initial sales charge and may be subject to a maximum CDSC of 1.00%. C Class shares redeemed within 12 months of purchase are subject to a maximum CDSC of 1.00%. The SEC requires that mutual funds provide performance information net of maximum sales charges in all cases where charges could be applied. |
| |
| (1) | Benchmark total return data first available October 2004. |
| |
| (2) | Since August 31, 1988, the date nearest the Investor Class’s inception for which data are available. |
| |
| (3) | Prior to September 4, 2007, the A Class was referred to as the Advisor Class and did not have a front-end sales charge. Performance prior to that date has been adjusted to reflect this charge. |
Data presented reflect past performance. Past performance is no guarantee of future results. Current performance may be higher or lower than the performance shown. Investment return and principal value will fluctuate, and redemption value may be more or less than original cost. Data assumes reinvestment of dividends and capital gains, and none of the charts reflect the deduction of taxes that a shareholder would pay on fund distributions or the redemption of fund shares. To obtain performance data current to the most recent month end, please call 1-800-345-2021 or visit americancentury.com. For additional information about the fund, please consult the prospectus.
|
|
| Growth of $10,000 Over 10 Years |
| $10,000 investment made June 30, 2005 |
| Performance for other share classes will vary due to differences in fee structure. |
|
| |
| Value on June 30, 2015 |
| | Investor Class — $9,416 |
| |
| | NYSE Arca Gold Miners Index — $8,303 |
| |
| | MSCI World Index — $18,557 |
| |
|
| | | | |
| Total Annual Fund Operating Expenses |
| Investor Class | Institutional Class | A Class | C Class | R Class |
| 0.67% | 0.47% | 0.92% | 1.67% | 1.17% |
The total annual fund operating expenses shown is as stated in the fund’s prospectus current as of the date of this report. The prospectus may vary from the expense ratio shown elsewhere in this report because it is based on a different time period, includes acquired fund fees and expenses, and, if applicable, does not include fee waivers or expense reimbursements.
Data presented reflect past performance. Past performance is no guarantee of future results. Current performance may be higher or lower than the performance shown. Investment return and principal value will fluctuate, and redemption value may be more or less than original cost. Data assumes reinvestment of dividends and capital gains, and none of the charts reflect the deduction of taxes that a shareholder would pay on fund distributions or the redemption of fund shares. To obtain performance data current to the most recent month end, please call 1-800-345-2021 or visit americancentury.com. For additional information about the fund, please consult the prospectus.
Portfolio Managers: Bill Martin and Lynette Pang
Performance Summary
Global Gold declined -32.61%* for the 12 months ended June 30, 2015. The portfolio’s benchmark, the NYSE Arca Gold Miners Index, declined -31.97%. The fund’s return reflects operating expenses, while the benchmark’s return does not.
Gold Prices Declined
Gold bullion prices were volatile during the 12-month period, but the overall pricing trend was downward. During the first six months, gold prices steadily declined largely due to the conclusion of the Federal Reserve’s (the Fed’s) quantitative easing (QE) program in October 2014 and the U.S. dollar’s mounting strength versus other major currencies. Investors viewed the end of QE as the removal of a key longer-term inflation trigger that had been supporting higher gold bullion prices. Meanwhile, the prospect for higher U.S. interest rates and a stronger U.S. dollar resulting from reduced Fed support and a likely tightening of monetary policy also pressured gold prices. Gold, which is priced in U.S. dollars and generally moves in the opposite direction of the dollar, became more expensive for foreign buyers.
Gold prices rallied in early 2015, as weak U.S. economic data suggested the Fed would extend its timetable for rate hikes. In addition, stimulus measures from the European Central Bank and concerns about Greece’s debt crisis further supported gold. But the rally was short-lived. Waning demand for the precious metal, particularly in China, and an easing of tensions between Greece and its creditors caused gold prices to tumble. Furthermore, improving U.S. economic data reignited investors’ concerns about a near-term Fed rate hike, and gold maintained its downward path through the end of the period.
Additionally, low current inflation decreased gold’s attractiveness as a potential hedge against rising inflation. The U.S. inflation rate, as measured by the 12-month change in the Consumer Price Index, was only 0.1% as of June 30, 2015.
Production Costs Hampered Mining Stocks’ Performance
Overall for the 12-month period, gold prices declined nearly 11%, according to the London Gold Market Fixing. Gold mining stocks generally underperformed the price of gold largely due to rising production costs. For example, the average production cost of an ounce of gold was $1,200 in 2014, according to the World Gold Council. With gold prices steadily declining, from $1,315 an ounce as of June 30, 2014, to $1,171 a year later, profit margins at mining companies also declined. Furthermore, geopolitical risks, which helped lift the price of gold at various points during the 12-month period, had the opposite effect on gold stocks, as investors worried some mining countries would increase fees or taxes to meet political goals.
The fund’s underperformance relative to the benchmark primarily was due to the effects of currency exchange rates in the strong-U.S.-dollar environment. Stock selection was a positive contributor on a relative basis.
* All fund returns referenced in this commentary are for Investor Class shares. Performance for other share classes will vary due to differences in fee structures; when Investor Class performance exceeds that of the fund’s benchmark, other share classes may not. See page 3 for returns for all share classes.
Positioning Favored Quality
The fund typically holds a 20% allocation to explorers and emerging producers, which are more closely tied to the performance of the metal than the larger gold producers. We believe these companies provide most of the growth opportunities in the sector, compared with the senior miners. We maintained the quality of this allocation by focusing on higher-grade projects and operations in “safe” geopolitical jurisdictions, while avoiding companies requiring financing in the next two years.
To counteract concerns about rising production costs, we held an overweight position in stocks of companies with pre-negotiated revenue streams and the ability to participate in the upside of production growth. We believe these companies should perform well when financing is tight.
U.S. Company Was a Main Detractor
Underweight positions relative to the benchmark in China, Australia, and Hong Kong were among the largest detractors from relative results. In terms of individual holdings, a portfolio-only position in Midway Gold, a U.S.-based gold mining company, was a main detractor. The rate of recovery at the company’s Pan Gold Mine in Nevada fell short of expectations, and late in the period Midway filed for bankruptcy protection. We exited the position prior to the bankruptcy announcement.
China’s Zijin Mining, a mining conglomerate, advanced on acquisition-driven growth. During the reporting period, the company spent nearly $1 billion on stakes in mines owned by several global mining companies. This action lifted Zijin to the third-largest gold mining company in terms of market capitalization. Our underweight position in Zijin weighed on relative results.
Canada Led Contributors
Overall, stock selection in Canada, stock selection and an underweight position in South Africa, and an overweight position in the U.K. had positive effects on relative performance. In terms of individual holdings, several positions in Canada were among the top contributors, including portfolio-only positions in Guyana Goldfields and Virginia Mines. Guyana Goldfields, a mineral exploration company, is based in Canada but is primarily engaged in the exploration and development of gold deposits in Guyana, South America. In early September 2014, Guyana announced its wholly-owned Aurora Gold Project was fully funded, and in late March, the company reported the project was on schedule and on budget for mid-2015 commercial gold production. By the end of the reporting period, several analysts had increased their price targets for the company’s stock.
Virginia Mines, a gold-focused royalty company, announced in November 2014 it would merge with rival Osisko Gold Royalties, creating a combined company that would generate cash from Quebec’s two biggest gold mines. Osisko’s purchase price represented a 41% premium to the previous day’s closing price of Virginia Mines’ shares.
Security Selection Remains Key
We remain cautious toward the near-term prospects for gold mining stocks. We believe longer-term support for gold prices could come in the form of strong demand from central banks in the emerging markets, rising inflation stemming from the effects of unprecedented monetary and fiscal policies in the developed world, and rising consumer demand from emerging economies.
With gold mining companies continuing to face production cost and geopolitical challenges, we believe security selection remains crucial. In particular, we favor companies with higher-quality mines, proven reserves, and healthier balance sheets. We will seek to provide an investment that moves in line with gold prices and add value wherever possible.
|
| |
| JUNE 30, 2015 |
| Top Ten Holdings | % of net assets |
Goldcorp, Inc.(1) | 7.1% |
| Franco-Nevada Corp. | 7.1% |
| Randgold Resources Ltd. ADR | 6.5% |
Agnico-Eagle Mines Ltd.(1) | 6.3% |
| Royal Gold, Inc. | 6.0% |
| Barrick Gold Corp. | 5.8% |
| Newmont Mining Corp. | 5.2% |
| Newcrest Mining Ltd. | 4.7% |
| Silver Wheaton Corp. | 4.6% |
Yamana Gold, Inc.(1) | 3.1% |
| (1) Includes shares traded on all exchanges. | |
| | |
| Geographic Composition | % of net assets |
| Canada | 65.5% |
| United States | 12.2% |
| United Kingdom | 7.2% |
| South Africa | 5.1% |
| Australia | 4.9% |
| Peru | 2.6% |
| China | 1.2% |
| Hong Kong | 0.2% |
Cash and Equivalents(2) | 1.1% |
| (2) Includes temporary cash investments and other assets and liabilities. | |
| | |
| Types of Investments in Portfolio | % of net assets |
| Foreign Common Stocks | 86.6% |
| Domestic Common Stocks | 12.2% |
| Warrants | 0.1% |
| Total Equity Exposure | 98.9% |
| Temporary Cash Investments | 1.5% |
| Other Assets and Liabilities | (0.4)% |
Fund shareholders may incur two types of costs: (1) transaction costs, including sales charges (loads) on purchase payments and redemption/exchange fees; and (2) ongoing costs, including management fees; distribution and service (12b-1) fees; and other fund expenses. This example is intended to help you understand your ongoing costs (in dollars) of investing in your fund and to compare these costs with the ongoing cost of investing in other mutual funds.
The example is based on an investment of $1,000 made at the beginning of the period and held for the entire period from January 1, 2015 to June 30, 2015.
Actual Expenses
The table provides information about actual account values and actual expenses for each class. You may use the information, together with the amount you invested, to estimate the expenses that you paid over the period. First, identify the share class you own. Then simply divide your account value by $1,000 (for example, an $8,600 account value divided by $1,000 = 8.6), then multiply the result by the number under the heading “Expenses Paid During Period” to estimate the expenses you paid on your account during this period.
If you hold Investor Class shares of any American Century Investments fund, or Institutional Class shares of the American Century Diversified Bond Fund, in an American Century Investments account (i.e., not a financial intermediary or retirement plan account), American Century Investments may charge you a $12.50 semiannual account maintenance fee if the value of those shares is less than $10,000. We will redeem shares automatically in one of your accounts to pay the $12.50 fee. In determining your total eligible investment amount, we will include your investments in all personal accounts (including American Century Investments Brokerage accounts) registered under your Social Security number. Personal accounts include individual accounts, joint accounts, UGMA/UTMA accounts, personal trusts, Coverdell Education Savings Accounts and IRAs (including traditional, Roth, Rollover, SEP-, SARSEP- and SIMPLE-IRAs), and certain other retirement accounts. If you have only business, business retirement, employer-sponsored or American Century Investments Brokerage accounts, you are currently not subject to this fee. If you are subject to the Account Maintenance Fee, your account value could be reduced by the fee amount.
Hypothetical Example for Comparison Purposes
The table also provides information about hypothetical account values and hypothetical expenses based on the actual expense ratio of each class of your fund and an assumed rate of return of 5% per year before expenses, which is not the actual return of a fund’s share class. The hypothetical account values and expenses may not be used to estimate the actual ending account balance or expenses you paid for the period. You may use this information to compare the ongoing costs of investing in your fund and other funds. To do so, compare this 5% hypothetical example with the 5% hypothetical examples that appear in the shareholder reports of the other funds.
Please note that the expenses shown in the table are meant to highlight your ongoing costs only and do not reflect any transactional costs, such as sales charges (loads) or redemption/exchange fees. Therefore, the table is useful in comparing ongoing costs only, and will not help you determine the relative total costs of owning different funds. In addition, if these transactional costs were included, your costs would have been higher.
|
| | | | |
| | Beginning
Account Value
1/1/15 | Ending
Account Value
6/30/15 | Expenses Paid
During Period(1)1/1/15 - 6/30/15 | Annualized Expense Ratio(1) |
| Actual |
| Investor Class | $1,000 | $967.80 | $3.27 | 0.67% |
| Institutional Class | $1,000 | $968.00 | $2.29 | 0.47% |
| A Class | $1,000 | $966.00 | $4.48 | 0.92% |
| C Class | $1,000 | $962.40 | $8.13 | 1.67% |
| R Class | $1,000 | $964.60 | $5.70 | 1.17% |
| Hypothetical |
| Investor Class | $1,000 | $1,021.47 | $3.36 | 0.67% |
| Institutional Class | $1,000 | $1,022.46 | $2.36 | 0.47% |
| A Class | $1,000 | $1,020.23 | $4.61 | 0.92% |
| C Class | $1,000 | $1,016.51 | $8.35 | 1.67% |
| R Class | $1,000 | $1,018.99 | $5.86 | 1.17% |
| |
| (1) | Expenses are equal to the class's annualized expense ratio listed in the table above, multiplied by the average account value over the period, multiplied by 181, the number of days in the most recent fiscal half-year, divided by 365, to reflect the one-half year period. |
JUNE 30, 2015
|
| | | | |
| | Shares | Value |
| COMMON STOCKS — 98.8% | | |
| Australia — 4.9% | | |
Newcrest Mining Ltd.(1) | 1,450,313 | $ | 14,569,240 |
|
| Northern Star Resources Ltd. | 369,800 | 630,555 |
|
| | | 15,199,795 |
|
| Canada — 65.4% | | |
| Agnico-Eagle Mines Ltd. | 481,466 | 13,669,163 |
|
| Agnico-Eagle Mines Ltd. New York Shares | 202,700 | 5,750,599 |
|
Alacer Gold Corp.(1) | 629,000 | 1,475,556 |
|
| Alamos Gold, Inc. | 359,800 | 2,036,658 |
|
ATAC Resources Ltd.(1) | 2,073,300 | 771,885 |
|
| AuRico Gold, Inc. | 768,531 | 2,196,682 |
|
B2Gold Corp.(1) | 2,780,182 | 4,251,519 |
|
| Barrick Gold Corp. | 1,679,612 | 17,904,664 |
|
Continental Gold, Inc.(1) | 621,000 | 1,496,565 |
|
Detour Gold Corp.(1) | 836,501 | 9,624,115 |
|
| Eldorado Gold Corp. | 2,221,400 | 9,212,852 |
|
First Majestic Silver Corp.(1) | 102,400 | 496,013 |
|
| Franco-Nevada Corp. | 458,994 | 21,891,331 |
|
GoGold Resources, Inc.(1) | 5,794,925 | 6,959,478 |
|
Gold Standard Ventures Corp.(1)(3) | 3,100,000 | 1,469,400 |
|
Gold Standard Ventures Corp. (Acquired 2/25/14, Cost $3,843,794)(1)(2)(3) | 5,918,108 | 3,032,497 |
|
| Goldcorp, Inc. | 1,313,776 | 21,321,249 |
|
| Goldcorp, Inc. New York Shares | 39,500 | 639,900 |
|
Guyana Goldfields, Inc.(1) | 1,621,621 | 5,141,408 |
|
IAMGOLD Corp.(1) | 341,519 | 683,585 |
|
Kinross Gold Corp.(1) | 930,152 | 2,167,128 |
|
Kinross Gold Corp. New York Shares(1) | 996,657 | 2,312,244 |
|
MAG Silver Corp.(1) | 390,500 | 3,060,845 |
|
| Nevsun Resources Ltd. | 220,400 | 829,368 |
|
New Gold, Inc.(1) | 1,764,300 | 4,732,110 |
|
| OceanaGold Corp. | 322,300 | 797,363 |
|
| Osisko Gold Royalties Ltd. | 508,790 | 6,403,666 |
|
| Pan American Silver Corp. | 96,870 | 832,973 |
|
| Pan American Silver Corp. NASDAQ Shares | 145,300 | 1,248,127 |
|
Premier Gold Mines Ltd.(1) | 2,398,800 | 4,647,795 |
|
Pretium Resources, Inc.(1) | 143,400 | 776,128 |
|
Primero Mining Corp.(1) | 786,212 | 3,065,534 |
|
Romarco Minerals, Inc.(1) | 5,903,126 | 2,008,670 |
|
Roxgold, Inc.(1) | 4,969,200 | 3,063,478 |
|
Sandstorm Gold Ltd.(1) | 603,807 | 1,783,865 |
|
SEMAFO, Inc.(1) | 1,463,100 | 3,935,962 |
|
| Silver Wheaton Corp. | 825,100 | 14,307,234 |
|
| Tahoe Resources, Inc. | 343,600 | 4,165,015 |
|
Torex Gold Resources, Inc.(1) | 3,147,390 | 2,847,519 |
|
| Yamana Gold, Inc. | 1,966,822 | 5,920,937 |
|
|
| | | | |
| | Shares | Value |
| Yamana Gold, Inc. New York Shares | 1,252,081 | $ | 3,756,243 |
|
| | | 202,687,323 |
|
| China — 1.2% | | |
| Zhaojin Mining Industry Co. Ltd. | 1,406,500 | 880,021 |
|
| Zijin Mining Group Co. Ltd., H Shares | 7,992,000 | 2,814,683 |
|
| | | 3,694,704 |
|
| Hong Kong — 0.2% | | |
| G-Resources Group Ltd. | 24,249,000 | 782,069 |
|
| Peru — 2.6% | | |
| Cia de Minas Buenaventura SA ADR | 784,700 | 8,145,186 |
|
| South Africa — 5.1% | | |
AngloGold Ashanti Ltd.(1) | 435,302 | 3,896,107 |
|
AngloGold Ashanti Ltd. ADR(1) | 517,376 | 4,630,515 |
|
| Gold Fields Ltd. | 1,566,410 | 5,007,070 |
|
Harmony Gold Mining Co. Ltd.(1) | 773,950 | 1,036,938 |
|
| Sibanye Gold Ltd. ADR | 191,300 | 1,233,885 |
|
| | | 15,804,515 |
|
| United Kingdom — 7.2% | | |
| Fresnillo plc | 200,203 | 2,183,109 |
|
| Randgold Resources Ltd. ADR | 302,500 | 20,252,375 |
|
| | | 22,435,484 |
|
| United States — 12.2% | | |
Coeur Mining, Inc.(1) | 225,959 | 1,290,226 |
|
| Hecla Mining Co. | 650,175 | 1,709,960 |
|
| Newmont Mining Corp. | 694,314 | 16,219,175 |
|
| Royal Gold, Inc. | 300,921 | 18,533,725 |
|
| | | 37,753,086 |
|
TOTAL COMMON STOCKS (Cost $295,873,963) | | 306,502,162 |
|
| WARRANTS — 0.1% | | |
| Canada — 0.1% | | |
Sandstorm Gold Ltd.(1) | 115,000 | 27,622 |
|
Gold Standard Ventures Corp. (Acquired 2/25/14, Cost $—)(1)(2)(3) | 2,959,054 | 94,766 |
|
TOTAL WARRANTS (Cost $—) | | 122,388 |
|
| TEMPORARY CASH INVESTMENTS — 1.5% | | |
| Repurchase Agreement, Bank of America Merrill Lynch, (collateralized by various U.S. Treasury obligations, 1.50%, 1/31/19 - 11/30/19, valued at $788,523), in a joint trading account at 0.10%, dated 6/30/15, due 7/1/15 (Delivery value $772,791) | | 772,789 |
|
| Repurchase Agreement, Fixed Income Clearing Corp., (collateralized by various U.S. Treasury obligations, 2.375%, 8/15/24, valued at $3,154,687), at 0.01%, dated 6/30/15, due 7/1/15 (Delivery value $3,092,001) | | 3,092,000 |
|
| State Street Institutional Liquid Reserves Fund, Premier Class | 773,038 | 773,038 |
|
TOTAL TEMPORARY CASH INVESTMENTS (Cost $4,637,827) | | 4,637,827 |
|
TOTAL INVESTMENT SECURITIES — 100.4% (Cost $300,511,790) | | 311,262,377 |
|
| OTHER ASSETS AND LIABILITIES — (0.4)% | | (1,160,774) |
|
| TOTAL NET ASSETS — 100.0% | | $ | 310,101,603 |
|
|
| | |
| NOTES TO SCHEDULE OF INVESTMENTS |
| ADR | - | American Depositary Receipt |
| |
| (2) | Restricted security that may not be offered for public sale without being registered with the Securities and Exchange Commission and/or may be subject to resale, redemption or transferability restrictions. The aggregate value of these securities at the period end was $3,127,263, which represented 1.0% of total net assets. |
| |
| (3) | Affiliated Company: the fund’s holding represents ownership of 5% or more of the voting securities of the company; therefore, the company is affiliated as defined in the Investment Company Act of 1940. |
See Notes to Financial Statements.
|
|
| Statement of Assets and Liabilities |
|
| | | |
| JUNE 30, 2015 |
| Assets |
| Investment securities - unaffiliated, at value (cost of $294,683,996) | $ | 306,665,714 |
|
| Investment securities - affiliated, at value (cost of $5,827,794) | 4,596,663 |
|
| Total investment securities, at value (cost of $300,511,790) | 311,262,377 |
|
| Foreign currency holdings, at value (cost of $99,566) | 98,494 |
|
| Receivable for investments sold | 14,201 |
|
| Receivable for capital shares sold | 239,635 |
|
| Dividends and interest receivable | 213,363 |
|
| | 311,828,070 |
|
| | |
| Liabilities | |
| Payable for investments purchased | 636,062 |
|
| Payable for capital shares redeemed | 909,995 |
|
| Accrued management fees | 175,911 |
|
| Distribution and service fees payable | 4,499 |
|
| | 1,726,467 |
|
| | |
| Net Assets | $ | 310,101,603 |
|
| | |
| Net Assets Consist of: | |
| Capital (par value and paid-in surplus) | $ | 421,450,457 |
|
| Distributions in excess of net investment income | (11,269,847 | ) |
| Accumulated net realized loss | (110,829,103 | ) |
| Net unrealized appreciation | 10,750,096 |
|
| | $ | 310,101,603 |
|
|
| | | | | | |
| | Net Assets | Shares Outstanding | Net Asset Value Per Share |
| Investor Class, $0.01 Par Value |
| $288,172,452 |
| 39,987,873 |
| $7.21 |
| Institutional Class, $0.01 Par Value |
| $9,638,780 |
| 1,330,066 |
| $7.25 |
| A Class, $0.01 Par Value |
| $7,732,398 |
| 1,087,757 |
| $7.11* |
| C Class, $0.01 Par Value |
| $2,024,217 |
| 292,806 |
| $6.91 |
| R Class, $0.01 Par Value |
| $2,533,756 |
| 358,023 |
| $7.08 |
*Maximum offering price $7.54 (net asset value divided by 0.9425).
See Notes to Financial Statements.
|
| | | |
| YEAR ENDED JUNE 30, 2015 |
| Investment Income (Loss) |
| Income: | |
| Dividends (net of foreign taxes withheld of $473,060) | $ | 3,381,915 |
|
| Interest | 1,449 |
|
| | 3,383,364 |
|
| | |
| Expenses: | |
| Management fees | 2,527,436 |
|
| Distribution and service fees: | |
| A Class | 26,222 |
|
| C Class | 26,817 |
|
| R Class | 14,514 |
|
| Directors' fees and expenses | 20,216 |
|
| Other expenses | 868 |
|
| | 2,616,073 |
|
| | |
| Net investment income (loss) | 767,291 |
|
| | |
| Realized and Unrealized Gain (Loss) | |
| Net realized gain (loss) on: | |
| Investment transactions | (22,444,824 | ) |
| Foreign currency transactions | (19,071 | ) |
| | (22,463,895 | ) |
| | |
| Change in net unrealized appreciation (depreciation) on: | |
| Investments | (138,731,363 | ) |
| Translation of assets and liabilities in foreign currencies | 1,843 |
|
| | (138,729,520 | ) |
| | |
| Net realized and unrealized gain (loss) | (161,193,415 | ) |
| | |
| Net Increase (Decrease) in Net Assets Resulting from Operations | $ | (160,426,124 | ) |
See Notes to Financial Statements.
|
|
| Statement of Changes in Net Assets |
|
| | | | | | |
| YEARS ENDED JUNE 30, 2015 AND JUNE 30, 2014 |
| Increase (Decrease) in Net Assets | June 30, 2015 | June 30, 2014 |
| Operations | | |
| Net investment income (loss) | $ | 767,291 |
| $ | 1,775,926 |
|
| Net realized gain (loss) | (22,463,895 | ) | (43,794,190 | ) |
| Change in net unrealized appreciation (depreciation) | (138,729,520 | ) | 100,865,932 |
|
| Net increase (decrease) in net assets resulting from operations | (160,426,124 | ) | 58,847,668 |
|
| | | |
| Distributions to Shareholders | | |
| From net investment income: | | |
| Investor Class | (10,071,945 | ) | — |
|
| Institutional Class | (349,838 | ) | — |
|
| A Class | (241,144 | ) | — |
|
| C Class | (56,176 | ) | — |
|
| R Class | (72,275 | ) | — |
|
| Decrease in net assets from distributions | (10,791,378 | ) | — |
|
| | | |
| Capital Share Transactions | | |
Net increase (decrease) in net assets from capital share transactions (Note 5) | (13,658,823 | ) | (12,947,944 | ) |
| | | |
| Redemption Fees | | |
| Increase in net assets from redemption fees | 46,235 |
| 116,151 |
|
| | | |
| Net increase (decrease) in net assets | (184,830,090 | ) | 46,015,875 |
|
| | | |
| Net Assets | | |
| Beginning of period | 494,931,693 |
| 448,915,818 |
|
| End of period | $ | 310,101,603 |
| $ | 494,931,693 |
|
| | | |
| Distributions in excess of net investment income | $ | (11,269,847 | ) | $ | (11,279,109 | ) |
See Notes to Financial Statements.
|
|
| Notes to Financial Statements |
JUNE 30, 2015
1. Organization
American Century Quantitative Equity Funds, Inc. (the corporation) is registered under the Investment Company Act of 1940, as amended (the 1940 Act), as an open-end management investment company and is organized as a Maryland corporation. Global Gold Fund (the fund) is one fund in a series issued by the corporation. The fund is nondiversified as defined under the 1940 Act. The fund’s investment objective is to seek to realize a total return (capital growth and dividends) consistent with investment in securities of companies that are engaged in mining, processing, fabricating or distributing gold or other precious metals throughout the world.
The fund offers the Investor Class, the Institutional Class, the A Class, the C Class and the R Class. The A Class may incur an initial sales charge. The A Class and C Class may be subject to a contingent deferred sales charge. The share classes differ principally in their respective sales charges and distribution and shareholder servicing expenses and arrangements. The Institutional Class is made available to institutional shareholders or through financial intermediaries whose clients do not require the same level of shareholder and administrative services as shareholders of other classes. As a result, the Institutional Class is charged a lower unified management fee.
2. Significant Accounting Policies
The following is a summary of significant accounting policies consistently followed by the fund in preparation of its financial statements. The fund is an investment company and follows accounting and reporting guidance in accordance with accounting principles generally accepted in the United States of America. This may require management to make certain estimates and assumptions at the date of the financial statements. Actual results could differ from these estimates. Management evaluated the impact of events or transactions occurring through the date the financial statements were issued that would merit recognition or disclosure.
Investment Valuations — The fund determines the fair value of its investments and computes its net asset value per share at the close of regular trading (usually 4 p.m. Eastern time) on the New York Stock Exchange (NYSE) on each day the NYSE is open. The Board of Directors has adopted valuation policies and procedures to guide the investment advisor in the fund’s investment valuation process and to provide methodologies for the oversight of the fund’s pricing function.
Equity securities that are listed or traded on a domestic securities exchange are valued at the last reported sales price or at the official closing price as provided by the exchange. Equity securities traded on foreign securities exchanges are generally valued at the closing price of such securities on the exchange where primarily traded or at the close of the NYSE, if that is earlier. If no last sales price is reported, or if local convention or regulation so provides, the mean of the latest bid and asked prices may be used. Securities traded over-the-counter are valued at the mean of the latest bid and asked prices, the last sales price, or the official closing price. Equity securities initially expressed in local currencies are translated into U.S. dollars at the mean of the appropriate currency exchange rate at the close of the NYSE as provided by an independent pricing service.
Fixed income securities maturing within 60 days at the time of purchase may be valued at cost, plus or minus any amortized discount or premium or at the evaluated mean as provided by an independent pricing service. Evaluated mean prices are commonly derived through utilization of market models, which may consider, among other factors: trade data, quotations from dealers and active market makers, relevant yield curve and spread data, related sector levels, creditworthiness, trade data or market information on comparable securities, and other relevant security specific information.
Open-end management investment companies are valued at the reported net asset value per share. Repurchase agreements are valued at cost, which approximates fair value.
If the fund determines that the market price for an investment is not readily available or the valuation methods mentioned above do not reflect an investment’s fair value, such investment is valued as determined in good faith by the Board of Directors or its delegate, in accordance with policies and procedures adopted by the Board of Directors. In its determination of fair value, the fund may review several factors including, but not limited to, market information regarding the specific investment or comparable investments and correlation with other investment types, futures indices or general market indicators. Circumstances that may cause the fund to use these procedures to value an investment include, but are not limited to: an investment has been declared in default or is distressed; trading in a security has been suspended during the trading day or a security is not actively trading on its principal exchange; prices received from a regular pricing source are deemed unreliable; or there is a foreign market holiday and no trading occurred.
The fund monitors for significant events occurring after the close of an investment’s primary exchange but before the fund’s net asset value per share is determined. Significant events may include, but are not limited to: corporate announcements and transactions; governmental action and political unrest that could impact a specific investment or an investment sector; or armed conflicts, natural disasters and similar events that could affect investments in a specific country or region. The fund also monitors for significant fluctuations between domestic and foreign markets, as evidenced by the U.S. market or such other indicators that the Board of Directors, or its delegate, deems appropriate. If significant fluctuations in foreign markets are identified, the fund may apply a model-derived factor to the closing price of equity securities traded on foreign securities exchanges. The factor is based on observable market data as provided by an independent pricing service.
Security Transactions — Security transactions are accounted for as of the trade date. Net realized gains and losses are determined on the identified cost basis, which is also used for federal income tax purposes.
Investment Income — Dividend income less foreign taxes withheld, if any, is recorded as of the ex-dividend date. Distributions received on securities that represent a return of capital or long-term capital gain are recorded as a reduction of cost of investments and/or as a realized gain. The fund may estimate the components of distributions received that may be considered nontaxable distributions or long-term capital gain distributions for income tax purposes. Interest income is recorded on the accrual basis and includes accretion of discounts and amortization of premiums.
Foreign Currency Translations — All assets and liabilities initially expressed in foreign currencies are translated into U.S. dollars at prevailing exchange rates at period end. The fund may enter into spot foreign currency exchange contracts to facilitate transactions denominated in a foreign currency. Purchases and sales of investment securities, dividend and interest income, spot foreign currency exchange contracts, and expenses are translated at the rates of exchange prevailing on the respective dates of such transactions. Net realized and unrealized foreign currency exchange gains or losses related to investment securities are a component of net realized gain (loss) on investment transactions and change in net unrealized appreciation (depreciation) on investments, respectively.
Repurchase Agreements — The fund may enter into repurchase agreements with institutions that American Century Investment Management, Inc. (ACIM) (the investment advisor) has determined are creditworthy pursuant to criteria adopted by the Board of Directors. The fund requires that the collateral, represented by securities, received in a repurchase transaction be transferred to the custodian in a manner sufficient to enable the fund to obtain those securities in the event of a default under the repurchase agreement. ACIM monitors, on a daily basis, the securities transferred to ensure the value, including accrued interest, of the securities under each repurchase agreement is equal to or greater than amounts owed to the fund under each repurchase agreement.
Joint Trading Account — Pursuant to an Exemptive Order issued by the Securities and Exchange Commission, the fund, along with certain other funds in the American Century Investments family of funds, may transfer uninvested cash balances into a joint trading account. These balances are invested in one or more repurchase agreements that are collateralized by U.S. Treasury or Agency obligations.
Income Tax Status — It is the fund’s policy to distribute substantially all net investment income and net realized gains to shareholders and to otherwise qualify as a regulated investment company under provisions of the Internal Revenue Code. Accordingly, no provision has been made for income taxes. The fund files U.S. federal, state, local and non-U.S. tax returns as applicable. The fund's tax returns are subject to examination by the relevant taxing authority until expiration of the applicable statute of limitations, which is generally three years from the date of filing but can be longer in certain jurisdictions. At this time, management believes there are no uncertain tax positions which, based on their technical merit, would not be sustained upon examination and for which it is reasonably possible that the total amounts of unrecognized tax benefits will significantly change in the next twelve months.
Multiple Class — All shares of the fund represent an equal pro rata interest in the net assets of the class to which such shares belong, and have identical voting, dividend, liquidation and other rights and the same terms and conditions, except for class specific expenses and exclusive rights to vote on matters affecting only individual classes. Income, non-class specific expenses, and realized and unrealized capital gains and losses of the fund are allocated to each class of shares based on their relative net assets.
Distributions to Shareholders — Distributions from net investment income, if any, are generally declared and paid semiannually. Distributions from net realized gains, if any, are generally declared and paid annually.
Redemption Fees — The fund may impose a 1.00% redemption fee on shares held less than 60 days. The fee may not be applicable to all classes. The redemption fee is retained by the fund and helps cover transaction costs that long-term investors may bear when the fund sells securities to meet investor redemptions.
Indemnifications — Under the corporation’s organizational documents, its officers and directors are indemnified against certain liabilities arising out of the performance of their duties to the fund. In addition, in the normal course of business, the fund enters into contracts that provide general indemnifications. The maximum exposure under these arrangements is unknown as this would involve future claims that may be made against a fund. The risk of material loss from such claims is considered by management to be remote.
3. Fees and Transactions with Related Parties
Certain officers and directors of the corporation are also officers and/or directors of American Century Companies, Inc. (ACC). The corporation’s investment advisor, ACIM, the corporation's distributor, American Century Investment Services, Inc. (ACIS), and the corporation’s transfer agent, American Century Services, LLC, are wholly owned, directly or indirectly, by ACC.
Management Fees — The corporation has entered into a management agreement with ACIM, under which ACIM provides the fund with investment advisory and management services in exchange for a single, unified management fee (the fee) per class. The agreement provides that all expenses of managing and operating the fund, except distribution and service fees, brokerage expenses, taxes, interest, fees and expenses of the independent directors (including legal counsel fees), and extraordinary expenses, will be paid by ACIM. The fee is computed and accrued daily based on each class’s daily net assets and paid monthly in arrears. The fee consists of (1) an Investment Category Fee based on the daily net assets of the fund and certain other accounts managed by the investment advisor that are in the same broad investment category as the fund and (2) a Complex Fee based on the assets of all the funds in the American Century Investments family of funds. The rates for the Investment Category Fee range from 0.3380% to 0.5200%. The rates for the Complex Fee range from 0.2500% to 0.3100% for the Investor Class, A Class, C Class and R Class. The rates for the Complex Fee range from 0.0500% to 0.1100% for the Institutional Class. The effective annual management fee for each class for the year ended June 30, 2015 was 0.66% for the Investor Class, A Class, C Class and R Class and 0.46% for the Institutional Class.
Distribution and Service Fees — The Board of Directors has adopted a separate Master Distribution and Individual Shareholder Services Plan for each of the A Class, C Class and R Class (collectively the plans), pursuant to Rule 12b-1 of the 1940 Act. The plans provide that the A Class will pay ACIS an annual distribution and service fee of 0.25%. The plans provide that the C Class will pay ACIS an annual distribution and service fee of 1.00%, of which 0.25% is paid for individual shareholder services and 0.75% is paid for distribution services. The plans provide that the R Class will pay ACIS an annual distribution and service fee of 0.50%. The fees are computed and accrued daily based on each class’s daily net assets and paid monthly in arrears. The fees are used to pay financial intermediaries for distribution and individual shareholder services. Fees incurred under the plans during the year ended June 30, 2015 are detailed in the Statement of Operations.
Directors' Fees and Expenses — The Board of Directors is responsible for overseeing the investment advisor’s management and operations of the fund. The directors receive detailed information about the fund and its investment advisor regularly throughout the year, and meet at least quarterly with management of the investment advisor to review reports about fund operations. The fund’s officers do not receive compensation from the fund.
4. Investment Transactions
Purchases and sales of investment securities, excluding short-term investments, for the year ended June 30, 2015 were $63,888,431 and $85,730,003, respectively.
5. Capital Share Transactions
Transactions in shares of the fund were as follows:
|
| | | | | | | | | | |
| | Year ended
June 30, 2015 | Year ended June 30, 2014 |
| | Shares | Amount | Shares | Amount |
| Investor Class/Shares Authorized | 300,000,000 |
| | 300,000,000 |
| |
| Sold | 6,245,224 |
| $ | 54,744,954 |
| 8,675,193 |
| $ | 87,122,900 |
|
| Issued in reinvestment of distributions | 1,337,081 |
| 9,359,567 |
| — |
| — |
|
| Redeemed | (8,672,509 | ) | (72,469,815 | ) | (10,791,654 | ) | (105,185,148 | ) |
| | (1,090,204 | ) | (8,365,294 | ) | (2,116,461 | ) | (18,062,248 | ) |
| Institutional Class/Shares Authorized | 30,000,000 |
| | 10,000,000 |
| |
| Sold | 507,084 |
| 4,587,343 |
| 641,890 |
| 6,525,981 |
|
| Issued in reinvestment of distributions | 49,764 |
| 349,838 |
| — |
| — |
|
| Redeemed | (516,894 | ) | (4,501,765 | ) | (785,576 | ) | (7,970,276 | ) |
| | 39,954 |
| 435,416 |
| (143,686 | ) | (1,444,295 | ) |
| A Class/Shares Authorized | 20,000,000 |
| | 10,000,000 |
| |
| Sold | 1,144,536 |
| 10,110,276 |
| 2,178,363 |
| 20,602,231 |
|
| Issued in reinvestment of distributions | 34,064 |
| 235,378 |
| — |
| — |
|
| Redeemed | (1,771,595 | ) | (16,188,007 | ) | (1,596,288 | ) | (15,500,470 | ) |
| | (592,995 | ) | (5,842,353 | ) | 582,075 |
| 5,101,761 |
|
| C Class/Shares Authorized | 20,000,000 |
| | 10,000,000 |
| |
| Sold | 113,525 |
| 975,833 |
| 169,566 |
| 1,601,064 |
|
| Issued in reinvestment of distributions | 6,931 |
| 46,781 |
| — |
| — |
|
| Redeemed | (153,298 | ) | (1,166,484 | ) | (67,047 | ) | (655,016 | ) |
| | (32,842 | ) | (143,870 | ) | 102,519 |
| 946,048 |
|
| R Class/Shares Authorized | 20,000,000 |
| | 10,000,000 |
| |
| Sold | 189,809 |
| 1,580,878 |
| 192,549 |
| 1,877,414 |
|
| Issued in reinvestment of distributions | 10,100 |
| 69,590 |
| — |
| — |
|
| Redeemed | (162,801 | ) | (1,393,190 | ) | (139,953 | ) | (1,366,624 | ) |
| | 37,108 |
| 257,278 |
| 52,596 |
| 510,790 |
|
| Net increase (decrease) | (1,638,979 | ) | $ | (13,658,823 | ) | (1,522,957 | ) | $ | (12,947,944 | ) |
6. Affiliated Company Transactions
If a fund's holding represents ownership of 5% or more of the voting securities of a company, the company is affiliated as defined in the 1940 Act. A summary of transactions for each company which is or was an affiliate at or during the year ended June 30, 2015 follows:
|
| | | | | | | | | | | | | | | |
| Company | Beginning
Value | Purchase
Cost | Sales Cost | Realized
Gain (Loss) | Dividend
Income | Ending
Value |
Gold Standard Ventures Corp.(1)(2)(3) | $ | 5,407,578 |
| $ | 1,984,000 |
| — |
| — |
| — |
| $ | 4,596,663 |
|
| |
| (1) | Includes all common stocks and warrants of the issuer held by the fund. |
| |
| (3) | A portion has been deemed restricted. |
7. Fair Value Measurements
The fund’s investments valuation process is based on several considerations and may use multiple inputs to determine the fair value of the investments held by the fund. In conformity with accounting principles generally accepted in the United States of America, the inputs used to determine a valuation are classified into three broad levels.
| |
| • | Level 1 valuation inputs consist of unadjusted quoted prices in an active market for identical investments. |
| |
| • | Level 2 valuation inputs consist of direct or indirect observable market data (including quoted prices for comparable investments, evaluations of subsequent market events, interest rates, prepayment speeds, credit risk, etc.). These inputs also consist of quoted prices for identical investments initially expressed in local currencies that are adjusted through translation into U.S. dollars. |
| |
| • | Level 3 valuation inputs consist of unobservable data (including a fund’s own assumptions). |
The level classification is based on the lowest level input that is significant to the fair valuation measurement. The valuation inputs are not necessarily an indication of the risks associated with investing in these securities or other financial instruments. There were no significant transfers between levels during the period.
The following is a summary of the level classifications as of period end. The Schedule of Investments provides additional information on the fund’s portfolio holdings.
|
| | | | | | | | |
| | Level 1 | Level 2 | Level 3 |
| Assets | | | |
| Investment Securities | | | |
| Common Stocks | | | |
| Canada | $ | 47,388,411 |
| $ | 155,298,912 |
| — |
|
| Peru | 8,145,186 |
| — |
| — |
|
| South Africa | 5,864,400 |
| 9,940,115 |
| — |
|
| United Kingdom | 20,252,375 |
| 2,183,109 |
| — |
|
| United States | 37,753,086 |
| — |
| — |
|
| Other Countries | — |
| 19,676,568 |
| — |
|
| Warrants | — |
| 122,388 |
| — |
|
| Temporary Cash Investments | 773,038 |
| 3,864,789 |
| — |
|
| | $ | 120,176,496 |
| $ | 191,085,881 |
| — |
|
8. Risk Factors
There are certain risks involved in investing in foreign securities. These risks include those resulting from future adverse political, social and economic developments, fluctuations in currency exchange rates, the possible imposition of exchange controls, and other foreign laws or restrictions. Investing in emerging markets may accentuate these risks.
The fund concentrates its investments in a narrow segment of the total market. Because of this, the fund may be subject to greater risk and market fluctuations than a portfolio representing a broader range of industries. Gold stocks are generally considered speculative because of high share price volatility. The price of gold will likely impact the value of the companies in which the fund invests. The price of gold will fluctuate, sometimes considerably. Though many investors believe that gold investments hedge against inflation, currency devaluations and stock market declines, there is no guarantee that these historical inverse relationships will continue.
9. Federal Tax Information
The tax character of distributions paid during the years ended June 30, 2015 and June 30, 2014 were as follows:
|
| | | | | |
| | 2015 | 2014 |
| Distributions Paid From | | |
| Ordinary income | $ | 10,791,378 |
| — |
|
| Long-term capital gains | — |
| — |
|
The book-basis character of distributions made during the year from net investment income or net realized gains may differ from their ultimate characterization for federal income tax purposes. These differences reflect the differing character of certain income items and net realized gains and losses for financial statement and tax purposes, and may result in reclassification among certain capital accounts on the financial statements.
The reclassifications, which are primarily due to net operating losses, were made to capital $(8,266,436), distributions in excess of net investment income $10,033,349, and accumulated net realized loss $(1,766,913).
As of June 30, 2015, the federal tax cost of investments and the components of distributable earnings on a tax-basis were as follows:
|
| | | |
| Federal tax cost of investments | $ | 319,873,738 |
|
| Gross tax appreciation of investments | $ | 67,682,764 |
|
| Gross tax depreciation of investments | (76,294,125 | ) |
| Net tax appreciation (depreciation) of investments | (8,611,361 | ) |
| Net tax appreciation (depreciation) on translation of assets and liabilities in foreign currencies | (6,139 | ) |
| Net tax appreciation (depreciation) | $ | (8,617,500 | ) |
| Undistributed ordinary income | — |
|
| Accumulated short-term capital losses | $ | (22,892,062 | ) |
| Accumulated long-term capital losses | $ | (79,839,292 | ) |
The difference between book-basis and tax-basis unrealized appreciation (depreciation) is attributable primarily to the realization to ordinary income for tax purposes of unrealized gains on investments in passive foreign investment companies.
Accumulated capital losses represent net capital loss carryovers that may be used to offset future realized capital gains for federal income tax purposes. The capital loss carryovers may be carried forward for an unlimited period. Future capital loss carryover utilization in any given year may be subject to Internal Revenue Code limitations.
|
| | | | | | | | | | | | | | | |
| For a Share Outstanding Throughout the Years Ended June 30 (except as noted) |
| Per-Share Data | | | | | | Ratios and Supplemental Data | |
| | | Income From Investment Operations: | Distributions From: | | | Ratio to Average Net Assets of: | | |
| | Net Asset Value, Beginning of Period | Net Investment Income (Loss)(1) | Net Realized and Unrealized Gain (Loss) | Total From Investment Operations | Net Investment Income | Net Realized Gains | Total Distributions | Net Asset Value, End of Period | Total Return(2) | Operating Expenses | Net Investment Income (Loss) | Portfolio Turnover Rate | Net Assets, End of Period (in thousands) |
| Investor Class | | | | | | | | | | | |
| 2015 | $11.08 | 0.02 | (3.64) | (3.62) | (0.25) | — | (0.25) | $7.21 | (32.61)% | 0.67% | 0.21% | 17% |
| $288,172 |
|
| 2014 | $9.72 | 0.04 | 1.32 | 1.36 | — | — | — | $11.08 | 13.99% | 0.67% | 0.40% | 29% |
| $455,211 |
|
| 2013 | $17.08 | 0.10 | (7.26) | (7.16) | (0.20) | — | (0.20) | $9.72 | (42.43)% | 0.68% | 0.61% | 6% |
| $419,703 |
|
| 2012 | $22.90 | 0.05 | (4.50) | (4.45) | — | (1.37) | (1.37) | $17.08 | (20.43)% | 0.69% | 0.23% | 8% |
| $789,135 |
|
| 2011 | $23.11 | (0.04) | 3.06 | 3.02 | (1.60) | (1.63) | (3.23) | $22.90 | 11.44% | 0.69% | (0.18)% | 32% |
| $1,081,258 |
|
| Institutional Class | | | | | | | | | | | |
| 2015 | $11.14 | 0.04 | (3.67) | (3.63) | (0.26) | — | (0.26) | $7.25 | (32.48)% | 0.47% | 0.41% | 17% |
| $9,639 |
|
| 2014 | $9.75 | 0.06 | 1.33 | 1.39 | — | — | — | $11.14 | 14.26% | 0.47% | 0.60% | 29% |
| $14,375 |
|
| 2013 | $17.13 | 0.14 | (7.28) | (7.14) | (0.24) | — | (0.24) | $9.75 | (42.30)% | 0.48% | 0.81% | 6% |
| $13,976 |
|
| 2012 | $22.92 | 0.10 | (4.52) | (4.42) | — | (1.37) | (1.37) | $17.13 | (20.28)% | 0.49% | 0.43% | 8% |
| $15,971 |
|
| 2011 | $23.13 | 0.01 | 3.06 | 3.07 | (1.65) | (1.63) | (3.28) | $22.92 | 11.64% | 0.49% | 0.02% | 32% |
| $19,854 |
|
| A Class | | | | | | | | | | |
| 2015 | $10.94 | (0.01) | (3.59) | (3.60) | (0.23) | — | (0.23) | $7.11 | (32.84)% | 0.92% | (0.04)% | 17% |
| $7,732 |
|
| 2014 | $9.61 | 0.01 | 1.32 | 1.33 | — | — | — | $10.94 | 13.84% | 0.92% | 0.15% | 29% |
| $18,387 |
|
| 2013 | $16.90 | 0.06 | (7.19) | (7.13) | (0.16) | — | (0.16) | $9.61 | (42.61)% | 0.93% | 0.36% | 6% |
| $10,561 |
|
| 2012 | $22.72 | —(3) | (4.45) | (4.45) | — | (1.37) | (1.37) | $16.90 | (20.60)% | 0.94% | (0.02)% | 8% |
| $15,550 |
|
| 2011 | $22.95 | (0.10) | 3.03 | 2.93 | (1.53) | (1.63) | (3.16) | $22.72 | 11.15% | 0.94% | (0.43)% | 32% |
| $21,292 |
|
|
| | | | | | | | | | | | | | | |
| For a Share Outstanding Throughout the Years Ended June 30 (except as noted) |
| Per-Share Data | | | | | | Ratios and Supplemental Data | |
| | | Income From Investment Operations: | Distributions From: | | | Ratio to Average Net Assets of: | | |
| | Net Asset Value, Beginning of Period | Net Investment Income (Loss)(1) | Net Realized and Unrealized Gain (Loss) | Total From Investment Operations | Net Investment Income | Net Realized Gains | Total Distributions | Net Asset Value, End of Period | Total Return(2) | Operating Expenses | Net Investment Income (Loss) | Portfolio Turnover Rate | Net Assets, End of Period (in thousands) |
| C Class | | | | | | | | | | |
| 2015 | $10.64 | (0.07) | (3.48) | (3.55) | (0.18) | — | (0.18) | $6.91 | (33.36)% | 1.67% | (0.79)% | 17% |
| $2,024 |
|
| 2014 | $9.42 | (0.06) | 1.28 | 1.22 | — | — | — | $10.64 | 12.95% | 1.67% | (0.60)% | 29% |
| $3,465 |
|
| 2013 | $16.56 | (0.05) | (7.06) | (7.11) | (0.03) | — | (0.03) | $9.42 | (43.02)% | 1.68% | (0.39)% | 6% |
| $2,102 |
|
| 2012 | $22.46 | (0.16) | (4.37) | (4.53) | — | (1.37) | (1.37) | $16.56 | (21.21)% | 1.69% | (0.77)% | 8% |
| $2,826 |
|
| 2011 | $22.72 | (0.29) | 2.99 | 2.70 | (1.33) | (1.63) | (2.96) | $22.46 | 10.31% | 1.69% | (1.18)% | 32% |
| $3,593 |
|
| R Class | | | | | | | | | | |
| 2015 | $10.89 | (0.02) | (3.58) | (3.60) | (0.21) | — | (0.21) | $7.08 | (32.98)% | 1.17% | (0.29)% | 17% |
| $2,534 |
|
| 2014 | $9.59 | (0.01) | 1.31 | 1.30 | — | — | — | $10.89 | 13.56% | 1.17% | (0.10)% | 29% |
| $3,494 |
|
| 2013 | $16.86 | 0.03 | (7.18) | (7.15) | (0.12) | — | (0.12) | $9.59 | (42.74)% | 1.18% | 0.11% | 6% |
| $2,574 |
|
| 2012 | $22.73 | (0.05) | (4.45) | (4.50) | — | (1.37) | (1.37) | $16.86 | (20.82)% | 1.19% | (0.27)% | 8% |
| $2,623 |
|
| 2011 | $22.96 | (0.16) | 3.02 | 2.86 | (1.46) | (1.63) | (3.09) | $22.73 | 10.87% | 1.19% | (0.68)% | 32% |
| $2,567 |
|
|
|
| Notes to Financial Highlights |
| |
| (1) | Computed using average shares outstanding throughout the period. |
| |
| (2) | Total returns are calculated based on the net asset value of the last business day and do not reflect applicable sales charges, if any. Total returns for periods less than one year are not annualized. |
| |
| (3) | Per-share amount was less than $0.005. |
See Notes to Financial Statements.
|
|
| Report of Independent Registered Public Accounting Firm |
To the Directors of the American Century Quantitative Equity Funds, Inc. and Shareholders of the Global Gold Fund:
In our opinion, the accompanying statement of assets and liabilities, including the schedule of investments, and the related statements of operations and of changes in net assets and the financial highlights present fairly, in all material respects, the financial position of the Global Gold Fund (one of the sixteen funds comprising the American Century Quantitative Equity Funds, Inc., hereafter referred to as the “Fund”) at June 30, 2015, the results of its operations for the year then ended, the changes in its net assets for each of the two years in the period then ended and the financial highlights for each of the five years in the period then ended, in conformity with accounting principles generally accepted in the United States of America. These financial statements and financial highlights (hereafter referred to as "financial statements") are the responsibility of the Fund's management. Our responsibility is to express an opinion on these financial statements based on our audits. We conducted our audits of these financial statements in accordance with the standards of the Public Company Accounting Oversight Board (United States). Those standards require that we plan and perform the audit to obtain reasonable assurance about whether the financial statements are free of material misstatement. An audit includes examining, on a test basis, evidence supporting the amounts and disclosures in the financial statements, assessing the accounting principles used and significant estimates made by management, and evaluating the overall financial statement presentation. We believe that our audits, which included confirmation of securities at June 30, 2015 by correspondence with the custodian and brokers, provide a reasonable basis for our opinion.
PricewaterhouseCoopers LLP
Kansas City, Missouri
August 21, 2015
Board of Directors
The individuals listed below serve as directors of the funds. Each director will continue to serve in this capacity until death, retirement, resignation or removal from office. The board has adopted a mandatory retirement age for directors who are not “interested persons,” as that term is defined in the Investment Company Act (independent directors). Independent directors shall retire on December 31 of the year in which they reach their 75th birthday; provided, however, that on or after January 1, 2022, independent directors shall retire on December 31 of the year in which they reach their 76th birthday.
Mr. Thomas is an “interested person” because he currently serves as President and Chief Executive Officer of American Century Companies, Inc. (ACC), the parent company of American Century Investment Management, Inc. (ACIM or the advisor). The other directors (more than three-fourths of the total number) are independent. They are not employees, directors or officers of, and have no financial interest in, ACC or any of its wholly owned, direct or indirect, subsidiaries, including ACIM, American Century Investment Services, Inc. (ACIS) and American Century Services, LLC (ACS), and they do not have any other affiliations, positions or relationships that would cause them to be considered “interested persons” under the Investment Company Act. The directors serve in this capacity for eight (in the case of Mr. Thomas, 15) registered investment companies in the American Century Investments family of funds.
The following table presents additional information about the directors. The mailing address for each director other than Mr. Thomas is 1665 Charleston Road, Mountain View, California 94043. The mailing address for Mr. Thomas is 4500 Main Street, Kansas City, Missouri 64111.
|
| | | | | |
Name (Year of Birth) | Position(s) Held with Funds | Length of Time Served | Principal Occupation(s) During Past 5 Years | Number of American Century Portfolios Overseen by Director | Other Directorships Held During Past 5 Years |
Independent Directors | | |
Tanya S. Beder
(1955) | Director | Since 2011 | Chairman and CEO, SBCC Group Inc. (independent advisory services) (2006 to present) | 46 | CYS Investments, Inc. (NYSE mortgage arbitrage REIT) |
Jeremy I. Bulow
(1954) | Director | Since 2011 | Professor of Economics, Stanford University, Graduate School of Business (1979 to present) | 46 | None |
Ronald J. Gilson
(1946) | Director and Chairman of the Board | Since 1995
(Chairman since 2005) | Charles J. Meyers Professor of Law and Business, Stanford Law School (1979 to present); Marc and Eva Stern Professor of Law and Business, Columbia University School of Law (1992 to present) | 46 | None |
Frederick L. A. Grauer
(1946) | Director | Since 2008 | Senior Advisor, BlackRock, Inc. (investment management firm) (2010 to 2011, 2013 to present) | 46 | None |
Peter F. Pervere
(1947) | Director | Since 2007 | Retired | 46 | None |
|
| | | | | |
Name (Year of Birth) | Position(s) Held with Funds | Length of Time Served | Principal Occupation(s) During Past 5 Years | Number of American Century Portfolios Overseen by Director | Other Directorships Held During Past 5 Years |
| Independent Directors | | |
John B. Shoven
(1947) | Director | Since 2002 | Professor of Economics, Stanford University (1973 to present) | 46 | Cadence Design Systems; Exponent; Financial Engines |
| Interested Director | | |
Jonathan S. Thomas
(1963) | Director and President | Since 2007 | President and Chief Executive Officer, ACC (March 2007 to present). Also serves as Chief Executive Officer, ACS; Executive Vice President, ACIM; Director, ACC, ACIM and other ACC subsidiaries | 124 | BioMed Valley Discoveries, Inc. |
The Statement of Additional Information has additional information about the fund's directors and is available without charge, upon request, by calling 1-800-345-2021.
Officers
The following table presents certain information about the executive officers of the funds. Each officer serves as an officer for each of the 15 investment companies in the American Century family of funds, unless otherwise noted. No officer is compensated for his or her service as an officer of the funds. The listed officers are interested persons of the funds and are appointed or re-appointed on an annual basis. The mailing address for each of the officers listed below is 4500 Main Street, Kansas City, Missouri 64111.
|
| | |
Name (Year of Birth) | Offices with
the Funds | Principal Occupation(s) During the Past Five Years |
Jonathan S.
Thomas
(1963) | Director and President
since 2007 | President and Chief Executive Officer, ACC (March 2007 to present). Also serves as Chief Executive Officer, ACS; Executive Vice President, ACIM; Director, ACC, ACIM and other ACC subsidiaries |
Amy D. Shelton
(1964) | Chief Compliance Officer and Vice President since 2014 | Chief Compliance Officer, American Century funds, (March 2014 to present); Chief Compliance Officer, ACIM (February 2014 to present); Chief Compliance Officer, ACIS (October 2009 to present); Vice President, Client Interactions and Marketing, ACIS (February 2013 to January 2014); Director, Client Interactions and Marketing, ACIS (June 2007 to January 2013). Also serves as Vice President, ACIS |
Charles A. Etherington
(1957) | General Counsel since 2007 and Senior Vice President since 2006 | Attorney, ACC (February 1994 to present); Vice President, ACC (November 2005 to present); General Counsel, ACC (March 2007 to present). Also serves as General Counsel, ACIM, ACS, ACIS and other ACC subsidiaries; and Senior Vice President, ACIM and ACS |
C. Jean Wade
(1964) | Vice President,
Treasurer and
Chief Financial
Officer since 2012 | Vice President, ACS (February 2000 to present) |
Robert J. Leach
(1966) | Vice President
since 2006 and
Assistant Treasurer
since 2012 | Vice President, ACS (February 2000 to present) |
David H. Reinmiller
(1963) | Vice President since 2001 | Attorney, ACC (January 1994 to present); Associate General Counsel, ACC (January 2001 to present). Also serves as Vice President, ACIM and ACS |
Ward D. Stauffer
(1960) | Secretary since 2005 | Attorney, ACC (June 2003 to present) |
|
|
| Approval of Management Agreement |
At a meeting held on June 16, 2015, the Fund’s Board of Directors unanimously approved the renewal of the management agreement pursuant to which American Century Investment Management, Inc. (the “Advisor”) acts as the investment advisor for the Fund. Under Section 15(c) of the Investment Company Act, contracts for investment advisory services are required to be reviewed, evaluated, and approved by a majority of a fund’s directors/trustees, including a majority of the independent Directors, each year. The Board regards this annual evaluation and renewal as one of its most important responsibilities.
The independent Directors have memorialized a statement regarding the relationship between their ongoing obligations to oversee and evaluate the performance of the Advisor and their annual consideration of renewal of the management agreement. In that statement, the independent Directors noted that their assessment of the Advisor’s performance is an ongoing process that takes place over the entire year and is informed by all of the extensive information that the Board and its committees receive and consider over time. This information, together with the materials provided in connection with the review, are central to the Board’s assessment of the Advisor’s performance and its determination whether to renew the Fund’s management agreement.
Prior to its consideration of the renewal of the management agreement, the Board requested and reviewed extensive data and analysis relating to the proposed renewal. This information and analysis was compiled by the Advisor and certain independent providers of evaluation data concerning the Fund and the services provided to the Fund by the Advisor.
In connection with its consideration of the renewal of the management agreement, the Board’s review and evaluation of the services provided by the Advisor included, but was not limited to, the following:
| |
| • | the nature, extent, and quality of investment management, shareholder services, and other services provided by the Advisor to the Fund; |
| |
| • | the wide range of other programs and services the Advisor provides to the Fund and its shareholders on a routine and non-routine basis; |
| |
| • | the investment performance of the Fund, including data comparing the Fund’s performance to appropriate benchmarks and/or a peer group of other mutual funds with similar investment objectives and strategies; |
| |
| • | the cost of owning the Fund compared to the cost of owning similar funds; |
| |
| • | the Advisor’s compliance policies, procedures, and regulatory experience; |
| |
| • | financial data showing the cost of services provided to the Fund, the profitability of the Fund to the Advisor, and the overall profitability of the Advisor; |
| |
| • | possible economies of scale associated with the Advisor’s management of the Fund and other accounts under its management; |
| |
| • | data comparing services provided and charges to other investment management clients of the Advisor; |
| |
| • | acquired fund fees and expenses; |
| |
| • | payments by the Fund and the Advisor to financial intermediaries whose clients are investors in the Fund; and |
| |
| • | any collateral benefits derived by the Advisor from the management of the Fund. |
In keeping with its practice, the Board held two in-person meetings to review and discuss the information provided in response to their request. The independent Directors also had the benefit of the advice of their independent counsel throughout the process.
Factors Considered
The Directors considered all of the information provided by the Advisor, the independent data providers, and the independent Directors’ independent counsel in connection with the review, and evaluated such information for the Fund. In connection with their review, the Directors did not identify any single factor as being all-important or controlling and each Director may have attributed different levels of importance to different factors. In deciding to renew the management agreement, the Board based its decision on a number of factors, including the following:
Nature, Extent and Quality of Services - Generally. Under the management agreement, the Advisor is responsible for providing or arranging for all services necessary for the operation of the Fund. The Board noted that under the management agreement, the Advisor provides or arranges at its own expense a wide variety of services including:
| |
| • | constructing and designing the Fund |
| |
| • | portfolio research and security selection |
| |
| • | initial capitalization/funding |
| |
| • | daily valuation of the Fund’s portfolio |
| |
| • | shareholder servicing and transfer agency, including shareholder confirmations, recordkeeping, and communications |
| |
| • | legal services (except the independent Directors’ counsel) |
| |
| • | regulatory and portfolio compliance |
| |
| • | marketing and distribution (except amounts paid by the Fund under Rule 12b-1 plans) |
The Board noted that many of these services have expanded over time both in terms of quantity and complexity in response to shareholder demands, competition in the industry, changing distribution channels, and the changing regulatory environment.
Investment Management, Shareholder, and Other Services. The nature of the investment management services provided to the Fund is quite complex and allows Fund shareholders access to professional money management, instant diversification of their investments within an asset class, the opportunity to easily diversify among asset classes by investing in or exchanging among various American Century Investments funds, and liquidity. In evaluating investment performance, the Board expects the Advisor to manage the Fund in accordance with its investment objectives and approved strategies. Further, the Directors recognize that the Advisor has an obligation to seek the best execution of fund trades. In providing these services, the Advisor utilizes teams of investment professionals (portfolio managers, analysts, research assistants, and securities traders) who require extensive information technology, research, training, compliance, and other systems to conduct their business. The Board, directly and through its Portfolio Committee, regularly reviews investment performance information for the Fund, together with comparative information for appropriate benchmarks and/or peer groups of similarly-managed funds, over different time horizons. The Directors also review detailed performance information during the management agreement approval process. If performance concerns are identified, the Fund receives special reviews until performance improves, during which the Board discusses with the Advisor the reasons for such results (e.g., market conditions, security selection) and any efforts being undertaken to improve performance. The Fund’s performance was above its benchmark for the one-, three-, five-, and ten-year periods reviewed by the Board. The Board found the investment management services provided by the Advisor to the Fund to be satisfactory and consistent with the management agreement.
Under the management agreement, the Advisor provides the Fund with a comprehensive package of transfer agency, shareholder, and other services. The Board, directly and through various committees of the Board, regularly reviews reports and evaluations of such services at its regular
meetings. These reports include, but are not limited to, information regarding the operational efficiency and accuracy of the shareholder and transfer agency services provided, staffing levels, shareholder satisfaction (as measured by external as well as internal sources), technology support, new products and services offered to Fund shareholders, securities trading activities, portfolio valuation services, auditing services, and legal and operational compliance activities.
Certain aspects of shareholder and transfer agency service level efficiency and the quality of securities trading activities are measured by independent third party providers and are presented in comparison to other fund groups not managed by the Advisor. The Board found the services provided by the Advisor to the Fund under the management agreement to be competitive and of high quality.
Costs of Services and Profitability. The Advisor provides detailed information concerning its cost of providing various services to the Fund, its profitability in managing the Fund, its overall profitability, and its financial condition. The Directors have reviewed with the Advisor the methodology used to prepare this financial information. This information is considered in evaluating the Advisor’s financial condition, its ability to continue to provide services under the management agreement, and the reasonableness of the current management fee. The Board concluded that the Advisor’s profits were reasonable in light of the services provided to the Fund.
Ethics. The Board generally considers the Advisor’s commitment to providing quality services to shareholders and to conducting its business ethically. They noted that the Advisor’s practices generally meet or exceed industry best practices.
Economies of Scale. The Board also reviewed information provided by the Advisor regarding the possible existence of economies of scale in connection with the management of the Fund. The Board concluded that economies of scale are difficult to measure and predict with precision, especially on a fund-by-fund basis. The Board concluded that the Advisor is appropriately sharing economies of scale through its competitive fee structure, offering competitive fees from fund inception, and through reinvestment in its business to provide shareholders enhanced and expanded services.
Comparison to Other Funds’ Fees. The management agreement provides that the Fund pays the Advisor a single, all-inclusive (or unified) management fee for providing all services necessary for the management and operation of the Fund, other than brokerage expenses, taxes, interest, extraordinary expenses, the fees and expenses of the Fund’s independent Directors (including their independent legal counsel), and expenses incurred in connection with the provision of shareholder services and distribution services under a plan adopted pursuant to Rule 12b-1 under the 1940 Act. Under the unified fee structure, the Advisor is responsible for providing all investment advisory, custody, audit, administrative, compliance, recordkeeping, marketing, and shareholder services, or arranging and supervising third parties to provide such services. By contrast, most other funds are charged a variety of fees, including an investment advisory fee, a transfer agency fee, an administrative fee, distribution charges, and other expenses. Other than their investment advisory fees and any applicable Rule 12b-1 fees, all other components of the total fees charged by these other funds may be increased without shareholder approval. The Board believes the unified fee structure is a benefit to Fund shareholders because it clearly discloses to shareholders the cost of owning Fund shares, and, since the unified fee cannot be increased without a vote of Fund shareholders, it shifts to the Advisor the risk of increased costs of operating the Fund and provides a direct incentive to minimize administrative inefficiencies. Part of the Board’s analysis of fee levels involves reviewing certain evaluative data compiled by an independent provider and comparing the Fund’s unified fee to the total expense ratio of peer funds. The unified fee charged to shareholders of the Fund was below the median of the total expense ratios of the Fund’s peer group. The Board concluded that the management fee paid by the Fund to the Advisor under the management agreement is reasonable in light of the services provided to the Fund.
Comparison to Fees and Services Provided to Other Clients of the Advisor. The Board also requested and received information from the Advisor concerning the nature of the services, fees, costs, and profitability of its advisory services to advisory clients other than the Fund. They observed that these varying types of client accounts require different services and involve different regulatory and entrepreneurial risks than the management of the Fund. The Board analyzed this information and concluded that the fees charged and services provided to the Fund were reasonable by comparison.
Payments to Intermediaries. The Directors also requested and received a description of payments made to intermediaries by the Fund and the Advisor. These payments include various payments made by the Fund or the Advisor to different types of intermediaries and recordkeepers for distribution and service activities provided for the Fund.
Collateral or “Fall-Out” Benefits Derived by the Advisor. The Board considered the existence of collateral benefits the Advisor may receive as a result of its relationship with the Fund. The Board noted that the Advisor’s primary business is managing mutual funds and it generally does not use fund or shareholder information to generate profits in other lines of business, and therefore does not derive any significant collateral benefits from them. The Board noted that the Advisor receives proprietary research from broker-dealers that execute fund portfolio transactions. The Board also determined that the Advisor is able to provide investment management services to certain clients other than the Fund, at least in part, due to its existing infrastructure built to serve the fund complex.
Existing Relationship. The Board also considered whether there was any reason for not continuing the existing arrangement with the Advisor. In this regard, the Board was mindful of the potential disruptions of the Fund’s operations and various risks, uncertainties, and other effects that could occur as a result of a decision not to continue such relationship. In particular, the Board recognized that most shareholders have invested in the Fund on the strength of the Advisor’s industry standing and reputation and in the expectation that the Advisor will have a continuing role in providing advisory services to the Fund.
Conclusion of the Directors. As a result of this process, the Board, including all of the independent Directors and assisted by the advice of independent legal counsel, taking into account all of the factors discussed above and the information provided by the Advisor and others in connection with its review and throughout the year, concluded that the management agreement between the Fund and the Advisor is fair and reasonable in light of the services provided and should be renewed.
Retirement Account Information
As required by law, distributions you receive from certain IRAs are subject to federal income tax withholding, unless you elect not to have withholding apply. Tax will be withheld on the total amount withdrawn even though you may be receiving amounts that are not subject to withholding, such as nondeductible contributions. In such case, excess amounts of withholding could occur. You may adjust your withholding election so that a greater or lesser amount will be withheld.
If you don’t want us to withhold on this amount, you must notify us to not withhold the federal income tax. You may notify us in writing or in certain situations by telephone or through other electronic means. For systematic withdrawals, your withholding election will remain in effect until revoked or changed by filing a new election. You have the right to revoke your election at any time.
Remember, even if you elect not to have income tax withheld, you are liable for paying income tax on the taxable portion of your withdrawal. If you elect not to have income tax withheld or you don’t have enough income tax withheld, you may be responsible for payment of estimated tax. You may incur penalties under the estimated tax rules if your withholding and estimated tax payments are not sufficient. You can reduce or defer the income tax on a distribution by directly or indirectly rolling such distribution over to another IRA or eligible plan. You should consult your tax advisor for additional information.
State tax will be withheld if, at the time of your distribution, your address is within one of the mandatory withholding states and you have federal income tax withheld (or as otherwise required by state law). State taxes will be withheld from your distribution in accordance with the respective state rules.
Distributions you receive from 403(b), 457 and qualified plans are subject to special tax and withholding rules. Your plan administrator or plan sponsor is required to provide you with a special tax notice explaining those rules at the time you request a distribution. If applicable, federal and/or state taxes may be withheld from your distribution amount.
Proxy Voting Policies
Descriptions of the principles and policies that the fund's investment advisor uses in exercising the voting rights associated with the securities purchased and/or held by the fund are available without charge, upon request, by calling 1-800-345-2021 or visiting the "About Us" page of American Century Investments’ website at americancentury.com. A description of the policies is also available on the Securities and Exchange Commission’s website at sec.gov. Information regarding how the investment advisor voted proxies relating to portfolio securities during the most recent 12-month period ended June 30 is available on the "About Us" page at americancentury.com. It is also available at sec.gov.
Quarterly Portfolio Disclosure
The fund files its complete schedule of portfolio holdings with the Securities and Exchange Commission (SEC) for the first and third quarters of each fiscal year on Form N-Q. The fund’s Forms N-Q are available on the SEC’s website at sec.gov, and may be reviewed and copied at the SEC’s Public Reference Room in Washington, DC. Information on the operation of the Public Reference Room may be obtained by calling 1-800-SEC-0330. The fund also makes its complete schedule of portfolio holdings for the most recent quarter of its fiscal year available on its website at americancentury.com and, upon request, by calling 1-800-345-2021.
Other Tax Information
The following information is provided pursuant to provisions of the Internal Revenue Code.
The fund hereby designates up to the maximum amount allowable as qualified dividend income for the fiscal year ended June 30, 2015.
For corporate taxpayers, the fund hereby designates $1,003,471, or up to the maximum amount allowable, of ordinary income distributions paid during the fiscal year ended June 30, 2015 as qualified for the corporate dividends received deduction.
|
| | |
| |
| | | |
| Contact Us | americancentury.com | |
| Automated Information Line | 1-800-345-8765 | |
| Investor Services Representative | 1-800-345-2021
or 816-531-5575 | |
| Investors Using Advisors | 1-800-378-9878 | |
Business, Not-For-Profit, Employer-Sponsored
Retirement Plans | 1-800-345-3533 | |
Banks and Trust Companies, Broker-Dealers,
Financial Professionals, Insurance Companies | 1-800-345-6488 | |
| Telecommunications Relay Service for the Deaf | 711 | |
| | | |
| American Century Quantitative Equity Funds, Inc. | |
| | | |
Investment Advisor: American Century Investment Management, Inc. Kansas City, Missouri | |
| | | |
| This report and the statements it contains are submitted for the general information of our shareholders. The report is not authorized for distribution to prospective investors unless preceded or accompanied by an effective prospectus. | |
| | | |
©2015 American Century Proprietary Holdings, Inc. All rights reserved.
CL-ANN-86502 1508 | |
|
| |
| ANNUAL REPORT | JUNE 30, 2015 |
Income & Growth Fund
|
| | |
| President's Letter | 2 |
|
| Performance | 3 |
|
| Portfolio Commentary | |
|
| Fund Characteristics | |
|
| Shareholder Fee Example | |
|
| Schedule of Investments | |
|
| Statement of Assets and Liabilities | |
|
| Statement of Operations | |
|
| Statement of Changes in Net Assets | |
|
| Notes to Financial Statements | |
|
| Financial Highlights | |
|
| Report of Independent Registered Public Accounting Firm | |
|
| Management | |
|
| Approval of Management Agreement | |
|
| Additional Information | |
|
Any opinions expressed in this report reflect those of the author as of the date of the report, and do not necessarily represent the opinions of American Century Investments® or any other person in the American Century Investments organization. Any such opinions are subject to change at any time based upon market or other conditions and American Century Investments disclaims any responsibility to update such opinions. These opinions may not be relied upon as investment advice and, because investment decisions made by American Century Investments funds are based on numerous factors, may not be relied upon as an indication of trading intent on behalf of any American Century Investments fund. Security examples are used for representational purposes only and are not intended as recommendations to purchase or sell securities. Performance information for comparative indices and securities is provided to American Century Investments by third party vendors. To the best of American Century Investments’ knowledge, such information is accurate at the time of printing.
|
| |
| Dear Investor:
Thank you for reviewing this annual report for the 12 months ended June 30, 2015. It provides investment performance and portfolio information for the reporting period, plus longer-term historical performance data.
Annual reports remain important vehicles for conveying information about fund returns, including market and economic factors that affected performance during the reporting period. For additional, updated investment and market insights, we encourage you to visit our website, americancentury.com. |
| Jonathan Thomas |
Global Divergence Favored U.S. Assets
“Global divergence” between the U.S. and the rest of the world emerged as a prevalent theme during the reporting period. This theme embraced not only the relatively stronger economic growth enjoyed by the U.S. compared with most of the world, but also the related contrast between the U.S. Federal Reserve’s unwinding of monetary stimulus compared with the continuation and expansion of stimulus by other major central banks. Low inflation also prevailed, after crude oil prices plunged over 40% amid muted demand for commodities in general. In this environment, the U.S. dollar, U.S. growth stocks, and longer-maturity U.S. Treasuries generally benefited from “flight to quality” capital flows, reinforced by geopolitical and financial turmoil, particularly in Greece, Russia/Ukraine, China, and the Middle East.
Strong global capital flows into U.S. assets generated a global divergence between investment returns for U.S. and non-U.S. markets, especially for U.S. investors who realized their returns in dollar terms. For the reporting period, the U.S. Dollar Index, the S&P 500 Index, and the Barclays U.S. Aggregate Bond Index returned 19.74%, 7.42%, and 1.86%, respectively. By contrast, the MSCI EAFE Index, the MSCI Emerging Markets Index, and the Barclays Global Aggregate Bond ex-USD (Unhedged) Index returned -4.22%, -5.12%, and -13.19%, respectively, for U.S. investors unhedged for the strong dollar’s impact on non-dollar-denominated returns.
We expect more monetary policy divergence between the U.S. and other major developed economies in the coming months, accompanied by continued market volatility. This could present both challenges and opportunities for active investment managers. Upward pressures on inflation and interest rates could develop as the massive amount of global monetary stimulus in progress takes hold and economies improve. In this environment, we continue to believe in a disciplined, diversified, long-term investment approach, using professionally managed stock and bond portfolios to meet financial goals. We appreciate your continued trust in us.
Sincerely,
Jonathan Thomas
President and Chief Executive Officer
American Century Investments
|
| | | | | | |
| Total Returns as of June 30, 2015 |
| | | | Average Annual Returns | |
| | Ticker Symbol | 1 year | 5 years | 10 years | Since Inception | Inception Date |
| Investor Class | BIGRX | 2.87% | 16.54% | 6.58% | 10.11% | 12/17/90 |
| S&P 500 Index | — | 7.42% | 17.33% | 7.89% | 10.05% | — |
| Institutional Class | AMGIX | 3.10% | 16.78% | 6.80% | 6.24% | 1/28/98 |
A Class(1) | AMADX | | | | | 12/15/97 |
| No sales charge* | | 2.62% | 16.25% | 6.32% | 5.79% | |
| With sales charge* | | -3.29% | 14.89% | 5.69% | 5.43% | |
| C Class | ACGCX | 1.86% | 15.39% | 5.53% | 4.55% | 6/28/01 |
| R Class | AICRX | 2.36% | 15.97% | 6.05% | 7.22% | 8/29/03 |
| |
| * | Sales charges include initial sales charges and contingent deferred sales charges (CDSCs), as applicable. A Class shares have a 5.75% maximum initial sales charge and may be subject to a maximum CDSC of 1.00%. C Class shares redeemed within 12 months of purchase are subject to a maximum CDSC of 1.00%. The SEC requires that mutual funds provide performance information net of maximum sales charges in all cases where charges could be applied. |
| |
| (1) | Prior to September 4, 2007, the A Class was referred to as the Advisor Class and did not have a front-end sales charge. Performance prior to that date has been adjusted to reflect this charge. |
Data presented reflect past performance. Past performance is no guarantee of future results. Current performance may be higher or lower than the performance shown. Investment return and principal value will fluctuate, and redemption value may be more or less than original cost. Data assumes reinvestment of dividends and capital gains, and none of the charts reflect the deduction of taxes that a shareholder would pay on fund distributions or the redemption of fund shares. To obtain performance data current to the most recent month end, please call 1-800-345-2021 or visit americancentury.com. For additional information about the fund, please consult the prospectus.
|
|
| Growth of $10,000 Over 10 Years |
| $10,000 investment made June 30, 2005 |
| Performance for other share classes will vary due to differences in fee structure. |
|
| |
| Value on June 30, 2015 |
| | Investor Class — $18,920 |
| |
| | S&P 500 Index — $21,377 |
| |
|
| | | | |
| Total Annual Fund Operating Expenses |
| Investor Class | Institutional Class | A Class | C Class | R Class |
| 0.67% | 0.47% | 0.92% | 1.67% | 1.17% |
The total annual fund operating expenses shown is as stated in the fund’s prospectus current as of the date of this report. The prospectus may vary from the expense ratio shown elsewhere in this report because it is based on a different time period, includes acquired fund fees and expenses, and, if applicable, does not include fee waivers or expense reimbursements.
Data presented reflect past performance. Past performance is no guarantee of future results. Current performance may be higher or lower than the performance shown. Investment return and principal value will fluctuate, and redemption value may be more or less than original cost. Data assumes reinvestment of dividends and capital gains, and none of the charts reflect the deduction of taxes that a shareholder would pay on fund distributions or the redemption of fund shares. To obtain performance data current to the most recent month end, please call 1-800-345-2021 or visit americancentury.com. For additional information about the fund, please consult the prospectus.
Portfolio Managers: Brian Garbe and Claudia Musat
Performance Summary
Income & Growth returned 2.87%* for the fiscal year ended June 30, 2015, compared with the 7.42% return of its benchmark, the S&P 500 Index.
U.S. equity markets endured substantial volatility, but ended the 12-month period with advances. Income & Growth produced gains for the 12-month period, but was unable to match the return of its benchmark. Security selection in the consumer discretionary and information technology sectors detracted from fund results, while positioning in the utilities and energy sectors contributed to relative performance.
Income & Growth’s stock selection process incorporates factors of valuation, quality, growth, and sentiment with a valuation tilt, while striving to minimize unintended risks along industries and other risk characteristics. Within the investment universe, more expensive growth names led the markets over the past year. Within the fund, valuation-based factors proved most difficult. Stocks with low or no dividends strongly outperformed companies with higher-than-benchmark dividends. Given the fund’s higher target dividend yield relative to the S&P 500 Index, this proved particularly difficult for excess returns.
Consumer Discretionary, Information Technology Sectors Hampered Relative Gains
The consumer discretionary sector’s underperformance came from a number of industries, with household durables and specialty retailers producing leading detraction. An overweight position, relative to the benchmark, in Garmin weighed on results after the global positioning systems (GPS) maker reported disappointing first-quarter earnings and revenues, due largely to declines in its auto segment as consumers increasingly turned to their smartphones for GPS guidance. Despite the disappointment, the stock continues to look attractive across a number of factors, especially valuation. Elsewhere in the sector, a portfolio-only position in casino operator Las Vegas Sands was detrimental. The company’s stock price fell dramatically on weaker-than-expected revenue and earnings, and management’s announced dividend increase and two-billion-dollar buyback program was not enough to stave off price declines. Our conviction in the holding is driven by strong quality and valuation insights.
Information technology sector holdings diminished the fund’s gains, with detraction spread across a number of industries. Leading underperformance on a security level came from an overweight position, relative to the benchmark, in QUALCOMM. The semiconductor manufacturer’s stock price fell sharply after company management reduced revenue and earnings estimates for the coming year based on the supposition that a major smartphone customer would turn to a different processor supplier rather than using QUALCOMM’s high-end Snapdragon 810 processor.
| |
| * | All fund returns referenced in this commentary are for Investor Class shares. Performance for other share classes will vary due to differences in fee structure; when Investor Class performance exceeds that of the fund's benchmark, other share classes may not. See page 3 for returns for all share classes. |
Although the energy sector was an overall contributor to relative gains, a number of individual holdings weighed on results. Key detractors included Ensco, a provider of offshore drilling services, and equipment supplier National Oilwell Varco, which fell during the first half of the period together with plunging oil prices. Both positions were sold out of the fund. Other individual detractors included an overweight position in construction equipment manufacturer Caterpillar as investors worried that energy sector demand for the company’s equipment would decline due to ongoing weakness in oil prices, thereby negatively impacting revenues. Despite investor jitters the holding’s growth and valuation metrics remain very strong.
Utilities and Energy Sector Positioning Contributed
Limited exposure to the underperforming utilities and energy sectors, particularly underweight positioning in oil, gas, and consumable fuels holdings, bolstered the fund’s relative returns. Key contribution stemmed from holding less than the benchmark weighting in Chevron, which declined steadily throughout the period together with the price of oil.
A number of individual outperformers were health care sector names. An overweight position in insurance and managed care provider Aetna was a key contributor in the space, advancing amid merger speculation in the recent wave of health insurance industry consolidation. Higher demand for its therapies led biotechnology company Amgen to consistently beat earnings and revenue expectations. In addition, management’s restructuring and share buyback programs further supported the company’s stock price.
Elsewhere, gains were bolstered by an overweight position in Staples. The office supplies retailer’s stock rallied on speculation about the benefits of a possible merger with Office Depot. Likewise, an overweight position in beverage manufacturer Dr Pepper Snapple Group helped the fund’s returns following steady appreciation during the first half of the year due to continued revenue and earnings growth. Both positions were exited during the period.
A Look Ahead
The U.S. economy seems poised to continue to experience hesitant economic growth through the second half of 2015. Economic activity appears to have somewhat diminished in breadth, though it remains slow yet steady. We believe that divergence in monetary policy between the U.S. and much of the rest of the world is likely to continue. Therefore, questions surrounding when and how much the Federal Reserve might act to tighten money supply, and the potential impact of such a move, are likely to continue driving investor sentiment in equity markets. Our disciplined, objective, and systematic investment strategy is designed to take advantage of opportunities at the individual company level. We believe this approach is the most powerful way to capitalize on market inefficiencies that lead to the mispricing of individual stocks. Our strategy is designed to provide broad U.S. equity market exposure with strong current income and exceptional risk management. Currently, the fund’s most significant sector overweight positions are in information technology and industrials while financials and energy represent the greatest sector underweights.
|
| |
| JUNE 30, 2015 |
| Top Ten Holdings | % of net assets |
| Apple, Inc. | 4.1% |
| Microsoft Corp. | 2.9% |
| Johnson & Johnson | 2.3% |
| JPMorgan Chase & Co. | 2.3% |
| Pfizer, Inc. | 2.1% |
| Procter & Gamble Co. (The) | 1.9% |
| AT&T, Inc. | 1.9% |
| Verizon Communications, Inc. | 1.8% |
| Merck & Co., Inc. | 1.8% |
| Gilead Sciences, Inc. | 1.7% |
| | |
| Top Five Industries | % of net assets |
| Pharmaceuticals | 7.7% |
| Technology Hardware, Storage and Peripherals | 6.2% |
| Semiconductors and Semiconductor Equipment | 4.8% |
| Software | 4.5% |
| Biotechnology | 4.4% |
| | |
| Types of Investments in Portfolio | % of net assets |
| Common Stocks | 99.0% |
| Temporary Cash Investments | 0.9% |
| Other Assets and Liabilities | 0.1% |
Fund shareholders may incur two types of costs: (1) transaction costs, including sales charges (loads) on purchase payments and redemption/exchange fees; and (2) ongoing costs, including management fees; distribution and service (12b-1) fees; and other fund expenses. This example is intended to help you understand your ongoing costs (in dollars) of investing in your fund and to compare these costs with the ongoing cost of investing in other mutual funds.
The example is based on an investment of $1,000 made at the beginning of the period and held for the entire period from January 1, 2015 to June 30, 2015.
Actual Expenses
The table provides information about actual account values and actual expenses for each class. You may use the information, together with the amount you invested, to estimate the expenses that you paid over the period. First, identify the share class you own. Then simply divide your account value by $1,000 (for example, an $8,600 account value divided by $1,000 = 8.6), then multiply the result by the number under the heading “Expenses Paid During Period” to estimate the expenses you paid on your account during this period.
If you hold Investor Class shares of any American Century Investments fund, or Institutional Class shares of the American Century Diversified Bond Fund, in an American Century Investments account (i.e., not a financial intermediary or retirement plan account), American Century Investments may charge you a $12.50 semiannual account maintenance fee if the value of those shares is less than $10,000. We will redeem shares automatically in one of your accounts to pay the $12.50 fee. In determining your total eligible investment amount, we will include your investments in all personal accounts (including American Century Investments Brokerage accounts) registered under your Social Security number. Personal accounts include individual accounts, joint accounts, UGMA/UTMA accounts, personal trusts, Coverdell Education Savings Accounts and IRAs (including traditional, Roth, Rollover, SEP-, SARSEP- and SIMPLE-IRAs), and certain other retirement accounts. If you have only business, business retirement, employer-sponsored or American Century Investments Brokerage accounts, you are currently not subject to this fee. If you are subject to the Account Maintenance Fee, your account value could be reduced by the fee amount.
Hypothetical Example for Comparison Purposes
The table also provides information about hypothetical account values and hypothetical expenses based on the actual expense ratio of each class of your fund and an assumed rate of return of 5% per year before expenses, which is not the actual return of a fund’s share class. The hypothetical account values and expenses may not be used to estimate the actual ending account balance or expenses you paid for the period. You may use this information to compare the ongoing costs of investing in your fund and other funds. To do so, compare this 5% hypothetical example with the 5% hypothetical examples that appear in the shareholder reports of the other funds.
Please note that the expenses shown in the table are meant to highlight your ongoing costs only and do not reflect any transactional costs, such as sales charges (loads) or redemption/exchange fees. Therefore, the table is useful in comparing ongoing costs only, and will not help you determine the relative total costs of owning different funds. In addition, if these transactional costs were included, your costs would have been higher.
|
| | | | |
| | Beginning
Account Value
1/1/15 | Ending
Account Value
6/30/15 | Expenses Paid
During Period(1)
1/1/15 - 6/30/15 | Annualized
Expense Ratio(1) |
| Actual | | | | |
| Investor Class | $1,000 | $980.60 | $3.29 | 0.67% |
| Institutional Class | $1,000 | $981.80 | $2.31 | 0.47% |
| A Class | $1,000 | $979.50 | $4.52 | 0.92% |
| C Class | $1,000 | $976.00 | $8.18 | 1.67% |
| R Class | $1,000 | $978.50 | $5.74 | 1.17% |
| Hypothetical | | | | |
| Investor Class | $1,000 | $1,021.47 | $3.36 | 0.67% |
| Institutional Class | $1,000 | $1,022.46 | $2.36 | 0.47% |
| A Class | $1,000 | $1,020.23 | $4.61 | 0.92% |
| C Class | $1,000 | $1,016.51 | $8.35 | 1.67% |
| R Class | $1,000 | $1,018.99 | $5.86 | 1.17% |
| |
| (1) | Expenses are equal to the class's annualized expense ratio listed in the table above, multiplied by the average account value over the period, multiplied by 181, the number of days in the most recent fiscal half-year, divided by 365, to reflect the one-half year period. |
JUNE 30, 2015
|
| | | | |
| | Shares | Value |
| COMMON STOCKS — 99.0% | | |
| Aerospace and Defense — 1.6% | | |
| Boeing Co. (The) | 57,659 | $ | 7,998,457 |
|
| Honeywell International, Inc. | 252,899 | 25,788,111 |
|
| | | 33,786,568 |
|
| Automobiles — 1.6% | | |
| Ford Motor Co. | 897,731 | 13,474,942 |
|
| General Motors Co. | 404,486 | 13,481,519 |
|
| Thor Industries, Inc. | 91,150 | 5,129,922 |
|
| | | 32,086,383 |
|
| Banks — 3.7% | | |
| Bank of America Corp. | 184,141 | 3,134,080 |
|
| Citigroup, Inc. | 161,425 | 8,917,117 |
|
| Fifth Third Bancorp | 52,453 | 1,092,072 |
|
| Fulton Financial Corp. | 116,105 | 1,516,331 |
|
| JPMorgan Chase & Co. | 691,050 | 46,825,548 |
|
| Wells Fargo & Co. | 243,572 | 13,698,489 |
|
| | | 75,183,637 |
|
| Beverages — 1.6% | | |
| Coca-Cola Co. (The) | 58,026 | 2,276,360 |
|
| PepsiCo, Inc. | 331,030 | 30,898,340 |
|
| | | 33,174,700 |
|
| Biotechnology — 4.4% | | |
| Amgen, Inc. | 196,694 | 30,196,463 |
|
Biogen, Inc.(1) | 60,818 | 24,566,823 |
|
| Gilead Sciences, Inc. | 302,943 | 35,468,566 |
|
| | | 90,231,852 |
|
| Capital Markets — 3.0% | | |
| Ameriprise Financial, Inc. | 145,586 | 18,188,059 |
|
| Franklin Resources, Inc. | 351,124 | 17,215,610 |
|
| Legg Mason, Inc. | 86,879 | 4,476,875 |
|
| T. Rowe Price Group, Inc. | 100,778 | 7,833,474 |
|
| Waddell & Reed Financial, Inc., Class A | 284,910 | 13,479,092 |
|
| | | 61,193,110 |
|
| Chemicals — 2.7% | | |
| Cabot Corp. | 66,614 | 2,484,036 |
|
| Dow Chemical Co. (The) | 486,470 | 24,892,670 |
|
| E.I. du Pont de Nemours & Co. | 178,321 | 11,403,628 |
|
| Potash Corp. of Saskatchewan, Inc. | 516,388 | 15,992,536 |
|
| | | 54,772,870 |
|
| Commercial Services and Supplies — 1.6% | | |
| Pitney Bowes, Inc. | 733,724 | 15,268,796 |
|
| Waste Management, Inc. | 367,000 | 17,010,450 |
|
| | | 32,279,246 |
|
|
| | | | |
| | Shares | Value |
| Communications Equipment — 2.8% | | |
| Cisco Systems, Inc. | 1,104,486 | $ | 30,329,186 |
|
| QUALCOMM, Inc. | 430,130 | 26,939,042 |
|
| | | 57,268,228 |
|
| Diversified Consumer Services — 0.8% | | |
| H&R Block, Inc. | 536,923 | 15,919,767 |
|
| Diversified Financial Services — 0.6% | | |
Berkshire Hathaway, Inc., Class B(1) | 85,040 | 11,574,794 |
|
| Diversified Telecommunication Services — 3.7% | | |
| AT&T, Inc. | 1,071,404 | 38,056,270 |
|
| Verizon Communications, Inc. | 793,439 | 36,982,192 |
|
| | | 75,038,462 |
|
| Electric Utilities — 1.6% | | |
| Entergy Corp. | 229,492 | 16,179,186 |
|
| NextEra Energy, Inc. | 161,580 | 15,839,687 |
|
| | | 32,018,873 |
|
| Electrical Equipment — 1.7% | | |
| Emerson Electric Co. | 356,889 | 19,782,357 |
|
| Rockwell Automation, Inc. | 120,871 | 15,065,362 |
|
| | | 34,847,719 |
|
| Electronic Equipment, Instruments and Components — 1.0% | | |
| AVX Corp. | 43,608 | 586,964 |
|
| Corning, Inc. | 962,954 | 18,999,082 |
|
| National Instruments Corp. | 66,957 | 1,972,553 |
|
| | | 21,558,599 |
|
| Energy Equipment and Services — 1.6% | | |
| Noble Corp. plc | 1,049,653 | 16,154,159 |
|
| Schlumberger Ltd. | 196,109 | 16,902,635 |
|
| | | 33,056,794 |
|
| Food and Staples Retailing — 1.4% | | |
| Wal-Mart Stores, Inc. | 391,366 | 27,759,590 |
|
| Food Products — 2.0% | | |
| Archer-Daniels-Midland Co. | 431,561 | 20,809,871 |
|
| Bunge Ltd. | 163,740 | 14,376,372 |
|
| ConAgra Foods, Inc. | 135,007 | 5,902,506 |
|
| | | 41,088,749 |
|
| Health Care Equipment and Supplies — 1.9% | | |
| St. Jude Medical, Inc. | 285,198 | 20,839,418 |
|
| Stryker Corp. | 195,798 | 18,712,415 |
|
| | | 39,551,833 |
|
| Health Care Providers and Services — 2.2% | | |
| Aetna, Inc. | 184,917 | 23,569,521 |
|
| Cardinal Health, Inc. | 168,757 | 14,116,523 |
|
| UnitedHealth Group, Inc. | 64,068 | 7,816,296 |
|
| | | 45,502,340 |
|
|
| | | | |
| | Shares | Value |
| Hotels, Restaurants and Leisure — 2.6% | | |
| Darden Restaurants, Inc. | 266,374 | $ | 18,933,864 |
|
| Las Vegas Sands Corp. | 305,393 | 16,054,510 |
|
| McDonald's Corp. | 196,579 | 18,688,766 |
|
| | | 53,677,140 |
|
| Household Durables — 1.6% | | |
| Garmin Ltd. | 357,798 | 15,718,066 |
|
| Tupperware Brands Corp. | 258,051 | 16,654,612 |
|
| | | 32,372,678 |
|
| Household Products — 1.9% | | |
| Procter & Gamble Co. (The) | 498,009 | 38,964,224 |
|
| Industrial Conglomerates — 2.8% | | |
| 3M Co. | 186,482 | 28,774,172 |
|
| General Electric Co. | 1,111,910 | 29,543,449 |
|
| | | 58,317,621 |
|
| Insurance — 0.9% | | |
| Allstate Corp. (The) | 281,938 | 18,289,318 |
|
| Internet Software and Services — 0.9% | | |
Google, Inc., Class A(1) | 16,854 | 9,101,834 |
|
Google, Inc., Class C(1) | 16,900 | 8,796,619 |
|
| | | 17,898,453 |
|
| IT Services — 3.1% | | |
| Accenture plc, Class A | 254,334 | 24,614,445 |
|
| International Business Machines Corp. | 208,802 | 33,963,733 |
|
| Western Union Co. (The) | 205,550 | 4,178,831 |
|
| | | 62,757,009 |
|
| Machinery — 4.0% | | |
| Caterpillar, Inc. | 263,674 | 22,364,829 |
|
| Cummins, Inc. | 134,697 | 17,670,899 |
|
| Illinois Tool Works, Inc. | 40,699 | 3,735,761 |
|
| Parker-Hannifin Corp. | 149,772 | 17,422,977 |
|
| Stanley Black & Decker, Inc. | 187,057 | 19,685,879 |
|
| | | 80,880,345 |
|
| Media — 1.1% | | |
| Comcast Corp., Class A | 40,197 | 2,417,448 |
|
| Omnicom Group, Inc. | 242,553 | 16,855,008 |
|
| Viacom, Inc., Class B | 23,795 | 1,538,109 |
|
| Walt Disney Co. (The) | 14,651 | 1,672,265 |
|
| | | 22,482,830 |
|
| Metals and Mining — 0.1% | | |
| Nucor Corp. | 46,769 | 2,061,110 |
|
| Multi-Utilities — 0.8% | | |
| Public Service Enterprise Group, Inc. | 438,208 | 17,212,810 |
|
| Multiline Retail — 1.9% | | |
| Kohl's Corp. | 267,750 | 16,763,827 |
|
| Target Corp. | 268,511 | 21,918,553 |
|
| | | 38,682,380 |
|
|
| | | | |
| | Shares | Value |
| Oil, Gas and Consumable Fuels — 4.1% | | |
| Chevron Corp. | 64,186 | $ | 6,192,023 |
|
| ConocoPhillips | 8,222 | 504,913 |
|
| Exxon Mobil Corp. | 292,699 | 24,352,557 |
|
| Marathon Petroleum Corp. | 222,456 | 11,636,673 |
|
| Murphy Oil Corp. | 382,401 | 15,896,410 |
|
| Valero Energy Corp. | 398,827 | 24,966,570 |
|
| | | 83,549,146 |
|
| Paper and Forest Products — 1.3% | | |
| Domtar Corp. | 408,292 | 16,903,289 |
|
| International Paper Co. | 221,884 | 10,559,459 |
|
| | | 27,462,748 |
|
| Pharmaceuticals — 7.7% | | |
| AbbVie, Inc. | 480,754 | 32,301,861 |
|
| Johnson & Johnson | 483,222 | 47,094,816 |
|
| Merck & Co., Inc. | 640,893 | 36,486,039 |
|
| Pfizer, Inc. | 1,268,600 | 42,536,158 |
|
| | | 158,418,874 |
|
| Real Estate Investment Trusts (REITs) — 4.2% | | |
| AvalonBay Communities, Inc. | 26,091 | 4,171,168 |
|
| HCP, Inc. | 442,189 | 16,126,633 |
|
| Hospitality Properties Trust | 560,643 | 16,157,731 |
|
| Liberty Property Trust | 228,590 | 7,365,170 |
|
| Mid-America Apartment Communities, Inc. | 94,178 | 6,857,100 |
|
| Plum Creek Timber Co., Inc. | 398,339 | 16,160,613 |
|
| Public Storage | 55,410 | 10,215,942 |
|
| Senior Housing Properties Trust | 565,026 | 9,916,207 |
|
| | | 86,970,564 |
|
| Semiconductors and Semiconductor Equipment — 4.8% | | |
| Applied Materials, Inc. | 693,017 | 13,319,787 |
|
| Intel Corp. | 1,053,676 | 32,047,555 |
|
| Intersil Corp., Class A | 444,260 | 5,557,693 |
|
| Marvell Technology Group Ltd. | 1,114,561 | 14,695,487 |
|
| Teradyne, Inc. | 89,438 | 1,725,259 |
|
| Texas Instruments, Inc. | 409,442 | 21,090,357 |
|
| Xilinx, Inc. | 226,526 | 10,003,388 |
|
| | | 98,439,526 |
|
| Software — 4.5% | | |
| CA, Inc. | 560,156 | 16,406,969 |
|
| Microsoft Corp. | 1,339,004 | 59,117,027 |
|
| Oracle Corp. | 246,280 | 9,925,084 |
|
| Symantec Corp. | 269,279 | 6,260,737 |
|
| | | 91,709,817 |
|
| Specialty Retail — 1.5% | | |
| Best Buy Co., Inc. | 147,890 | 4,822,693 |
|
| DSW, Inc., Class A | 108,230 | 3,611,635 |
|
| Gap, Inc. (The) | 132,492 | 5,057,220 |
|
|
| | | | |
| | Shares | Value |
| Lowe's Cos., Inc. | 249,823 | $ | 16,730,646 |
|
| | | 30,222,194 |
|
| Technology Hardware, Storage and Peripherals — 6.2% | | |
| Apple, Inc. | 665,772 | 83,504,453 |
|
| EMC Corp. | 228,478 | 6,029,534 |
|
| Hewlett-Packard Co. | 385,655 | 11,573,507 |
|
| Lexmark International, Inc., Class A | 74,899 | 3,310,536 |
|
| Seagate Technology plc | 336,359 | 15,977,053 |
|
| Western Digital Corp. | 83,139 | 6,519,760 |
|
| | | 126,914,843 |
|
| Textiles, Apparel and Luxury Goods — 0.5% | | |
| Coach, Inc. | 290,477 | 10,053,409 |
|
Thrifts and Mortgage Finance† | | |
| New York Community Bancorp, Inc. | 27,313 | 502,013 |
|
| Tobacco — 1.0% | | |
| Philip Morris International, Inc. | 247,452 | 19,838,227 |
|
TOTAL COMMON STOCKS (Cost $1,654,094,192) | | 2,025,571,393 |
|
| TEMPORARY CASH INVESTMENTS — 0.9% | | |
Repurchase Agreement, Bank of America Merrill Lynch, (collateralized by various U.S. Treasury obligations, 1.50%, 1/31/19 - 11/30/19, valued at $3,063,562), in a joint trading account at 0.10%, dated 6/30/15, due 7/1/15 (Delivery value $3,002,437) | | 3,002,429 |
|
| Repurchase Agreement, Fixed Income Clearing Corp., (collateralized by various U.S. Treasury obligations, 2.750%, 2/15/24, valued at $12,255,750), at 0.01%, dated 6/30/15, due 7/1/15 (Delivery value $12,011,003) | | 12,011,000 |
|
| State Street Institutional Liquid Reserves Fund, Premier Class | 2,803,776 | 2,803,776 |
|
TOTAL TEMPORARY CASH INVESTMENTS (Cost $17,817,205) | | 17,817,205 |
|
TOTAL INVESTMENT SECURITIES — 99.9% (Cost $1,671,911,397) | | 2,043,388,598 |
|
| OTHER ASSETS AND LIABILITIES — 0.1% | | 1,548,949 |
|
| TOTAL NET ASSETS — 100.0% | | $ | 2,044,937,547 |
|
|
| | |
| NOTES TO SCHEDULE OF INVESTMENTS |
| |
| † | Category is less than 0.05% of total net assets. |
See Notes to Financial Statements.
|
|
| Statement of Assets and Liabilities |
|
| | | |
| JUNE 30, 2015 | |
| Assets | |
| Investment securities, at value (cost of $1,671,911,397) | $ | 2,043,388,598 |
|
| Cash | 182,477 |
|
| Receivable for capital shares sold | 1,933,573 |
|
| Dividends and interest receivable | 3,194,565 |
|
| | 2,048,699,213 |
|
| | |
| Liabilities | |
| Payable for capital shares redeemed | 2,582,830 |
|
| Accrued management fees | 1,117,219 |
|
| Distribution and service fees payable | 61,617 |
|
| | 3,761,666 |
|
| | |
| Net Assets | $ | 2,044,937,547 |
|
| | |
| Net Assets Consist of: | |
| Capital (par value and paid-in surplus) | $ | 1,552,631,310 |
|
| Undistributed net investment income | 2,695,063 |
|
| Undistributed net realized gain | 118,133,973 |
|
| Net unrealized appreciation | 371,477,201 |
|
| | $ | 2,044,937,547 |
|
|
| | | | | | |
| | Net Assets | Shares Outstanding | Net Asset Value Per Share |
| Investor Class, $0.01 Par Value |
| $1,655,693,206 |
| 45,012,347 |
| $36.78 |
| Institutional Class, $0.01 Par Value |
| $125,871,948 |
| 3,418,660 |
| $36.82 |
| A Class, $0.01 Par Value |
| $239,514,842 |
| 6,519,101 |
| $36.74* |
| C Class, $0.01 Par Value |
| $8,194,736 |
| 223,422 |
| $36.68 |
| R Class, $0.01 Par Value |
| $15,662,815 |
| 425,936 |
| $36.77 |
*Maximum offering price $38.98 (net asset value divided by 0.9425).
See Notes to Financial Statements.
|
| | | |
| YEAR ENDED JUNE 30, 2015 | |
| Investment Income (Loss) | |
| Income: | |
| Dividends (net of foreign taxes withheld of $78,982) | $ | 58,353,821 |
|
| Interest | 6,042 |
|
| | 58,359,863 |
|
| | |
| Expenses: | |
| Management fees | 13,702,044 |
|
| Distribution and service fees: | |
| A Class | 610,080 |
|
| C Class | 69,257 |
|
| R Class | 31,946 |
|
| Directors' fees and expenses | 105,165 |
|
| | 14,518,492 |
|
| | |
| Net investment income (loss) | 43,841,371 |
|
| | |
| Realized and Unrealized Gain (Loss) | |
| Net realized gain (loss) on: | |
| Investment transactions | 207,613,641 |
|
| Foreign currency transactions | (2,042 | ) |
| | 207,611,599 |
|
| | |
| Change in net unrealized appreciation (depreciation) on: | |
| Investments | (190,782,967 | ) |
| Translation of assets and liabilities in foreign currencies | (2,829 | ) |
| | (190,785,796 | ) |
| | |
| Net realized and unrealized gain (loss) | 16,825,803 |
|
| | |
| Net Increase (Decrease) in Net Assets Resulting from Operations | $ | 60,667,174 |
|
See Notes to Financial Statements.
|
|
| Statement of Changes in Net Assets |
|
| | | | | | |
| YEARS ENDED JUNE 30, 2015 AND JUNE 30, 2014 |
| Increase (Decrease) in Net Assets | June 30, 2015 | June 30, 2014 |
| Operations | | |
| Net investment income (loss) | $ | 43,841,371 |
| $ | 40,480,260 |
|
| Net realized gain (loss) | 207,611,599 |
| 217,649,111 |
|
| Change in net unrealized appreciation (depreciation) | (190,785,796 | ) | 151,193,931 |
|
| Net increase (decrease) in net assets resulting from operations | 60,667,174 |
| 409,323,302 |
|
| | | |
| Distributions to Shareholders | | |
| From net investment income: | | |
| Investor Class | (35,776,708 | ) | (34,762,952 | ) |
| Institutional Class | (2,466,264 | ) | (1,905,100 | ) |
| A Class | (4,447,473 | ) | (4,161,820 | ) |
| C Class | (75,024 | ) | (43,873 | ) |
| R Class | (100,753 | ) | (42,236 | ) |
| From net realized gains: | | |
| Investor Class | (90,387,647 | ) | — |
|
| Institutional Class | (5,069,239 | ) | — |
|
| A Class | (12,936,597 | ) | — |
|
| C Class | (345,108 | ) | — |
|
| R Class | (310,610 | ) | — |
|
| Decrease in net assets from distributions | (151,915,423 | ) | (40,915,981 | ) |
| | | |
| Capital Share Transactions | | |
Net increase (decrease) in net assets from capital share transactions (Note 5) | 97,184,450 |
| (10,375,855 | ) |
| | | |
| Net increase (decrease) in net assets | 5,936,201 |
| 358,031,466 |
|
| | | |
| Net Assets | | |
| Beginning of period | 2,039,001,346 |
| 1,680,969,880 |
|
| End of period | $ | 2,044,937,547 |
| $ | 2,039,001,346 |
|
| | | |
| Undistributed net investment income | $ | 2,695,063 |
| $ | 2,067,487 |
|
See Notes to Financial Statements.
|
|
| Notes to Financial Statements |
JUNE 30, 2015
1. Organization
American Century Quantitative Equity Funds, Inc. (the corporation) is registered under the Investment Company Act of 1940, as amended (the 1940 Act), as an open-end management investment company and is organized as a Maryland corporation. Income & Growth Fund (the fund) is one fund in a series issued by the corporation. The fund is diversified as defined under the 1940 Act. The fund’s investment objective is to seek long-term capital growth by investing in common stocks. Income is a secondary objective.
The fund offers the Investor Class, the Institutional Class, the A Class, the C Class and the R Class. The A Class may incur an initial sales charge. The A Class and C Class may be subject to a contingent deferred sales charge. The share classes differ principally in their respective sales charges and distribution and shareholder servicing expenses and arrangements. The Institutional Class is made available to institutional shareholders or through financial intermediaries whose clients do not require the same level of shareholder and administrative services as shareholders of other classes. As a result, the Institutional Class is charged a lower unified management fee.
2. Significant Accounting Policies
The following is a summary of significant accounting policies consistently followed by the fund in preparation of its financial statements. The fund is an investment company and follows accounting and reporting guidance in accordance with accounting principles generally accepted in the United States of America. This may require management to make certain estimates and assumptions at the date of the financial statements. Actual results could differ from these estimates. Management evaluated the impact of events or transactions occurring through the date the financial statements were issued that would merit recognition or disclosure.
Investment Valuations — The fund determines the fair value of its investments and computes its net asset value per share at the close of regular trading (usually 4 p.m. Eastern time) on the New York Stock Exchange (NYSE) on each day the NYSE is open. The Board of Directors has adopted valuation policies and procedures to guide the investment advisor in the fund’s investment valuation process and to provide methodologies for the oversight of the fund’s pricing function.
Equity securities that are listed or traded on a domestic securities exchange are valued at the last reported sales price or at the official closing price as provided by the exchange. Equity securities traded on foreign securities exchanges are generally valued at the closing price of such securities on the exchange where primarily traded or at the close of the NYSE, if that is earlier. If no last sales price is reported, or if local convention or regulation so provides, the mean of the latest bid and asked prices may be used. Securities traded over-the-counter are valued at the mean of the latest bid and asked prices, the last sales price, or the official closing price. Equity securities initially expressed in local currencies are translated into U.S. dollars at the mean of the appropriate currency exchange rate at the close of the NYSE as provided by an independent pricing service.
Fixed income securities maturing within 60 days at the time of purchase may be valued at cost, plus or minus any amortized discount or premium or at the evaluated mean as provided by an independent pricing service. Evaluated mean prices are commonly derived through utilization of market models, which may consider, among other factors: trade data, quotations from dealers and active market makers, relevant yield curve and spread data, related sector levels, creditworthiness, trade data or market information on comparable securities, and other relevant security specific information.
Open-end management investment companies are valued at the reported net asset value per share. Repurchase agreements are valued at cost, which approximates fair value.
If the fund determines that the market price for an investment is not readily available or the valuation methods mentioned above do not reflect an investment’s fair value, such investment is valued as determined in good faith by the Board of Directors or its delegate, in accordance with policies and procedures adopted by the Board of Directors. In its determination of fair value, the fund may review several factors including, but not limited to, market information regarding the specific investment or comparable investments and correlation with other investment types, futures indices or general market indicators. Circumstances that may cause the fund to use these procedures to value an investment include, but are not limited to: an investment has been
declared in default or is distressed; trading in a security has been suspended during the trading day or a security is not actively trading on its principal exchange; prices received from a regular pricing source are deemed unreliable; or there is a foreign market holiday and no trading occurred.
The fund monitors for significant events occurring after the close of an investment’s primary exchange but before the fund’s net asset value per share is determined. Significant events may include, but are not limited to: corporate announcements and transactions; governmental action and political unrest that could impact a specific investment or an investment sector; or armed conflicts, natural disasters and similar events that could affect investments in a specific country or region. The fund also monitors for significant fluctuations between domestic and foreign markets, as evidenced by the U.S. market or such other indicators that the Board of Directors, or its delegate, deems appropriate. If significant fluctuations in foreign markets are identified, the fund may apply a model-derived factor to the closing price of equity securities traded on foreign securities exchanges. The factor is based on observable market data as provided by an independent pricing service.
Security Transactions — Security transactions are accounted for as of the trade date. Net realized gains and losses are determined on the identified cost basis, which is also used for federal income tax purposes.
Investment Income — Dividend income less foreign taxes withheld, if any, is recorded as of the ex-dividend date. Distributions received on securities that represent a return of capital or long-term capital gain are recorded as a reduction of cost of investments and/or as a realized gain. The fund may estimate the components of distributions received that may be considered nontaxable distributions or long-term capital gain distributions for income tax purposes. Interest income is recorded on the accrual basis and includes accretion of discounts and amortization of premiums.
Foreign Currency Translations — All assets and liabilities initially expressed in foreign currencies are translated into U.S. dollars at prevailing exchange rates at period end. The fund may enter into spot foreign currency exchange contracts to facilitate transactions denominated in a foreign currency. Purchases and sales of investment securities, dividend and interest income, spot foreign currency exchange contracts, and expenses are translated at the rates of exchange prevailing on the respective dates of such transactions. Net realized and unrealized foreign currency exchange gains or losses related to investment securities are a component of net realized gain (loss) on investment transactions and change in net unrealized appreciation (depreciation) on investments, respectively.
Repurchase Agreements — The fund may enter into repurchase agreements with institutions that American Century Investment Management, Inc. (ACIM) (the investment advisor) has determined are creditworthy pursuant to criteria adopted by the Board of Directors. The fund requires that the collateral, represented by securities, received in a repurchase transaction be transferred to the custodian in a manner sufficient to enable the fund to obtain those securities in the event of a default under the repurchase agreement. ACIM monitors, on a daily basis, the securities transferred to ensure the value, including accrued interest, of the securities under each repurchase agreement is equal to or greater than amounts owed to the fund under each repurchase agreement.
Joint Trading Account — Pursuant to an Exemptive Order issued by the Securities and Exchange Commission, the fund, along with certain other funds in the American Century Investments family of funds, may transfer uninvested cash balances into a joint trading account. These balances are invested in one or more repurchase agreements that are collateralized by U.S. Treasury or Agency obligations.
Income Tax Status — It is the fund’s policy to distribute substantially all net investment income and net realized gains to shareholders and to otherwise qualify as a regulated investment company under provisions of the Internal Revenue Code. Accordingly, no provision has been made for income taxes. The fund files U.S. federal, state, local and non-U.S. tax returns as applicable. The fund's tax returns are subject to examination by the relevant taxing authority until expiration of the applicable statute of limitations, which is generally three years from the date of filing but can be longer in certain jurisdictions. At this time, management believes there are no uncertain tax positions which, based on their technical merit, would not be sustained upon examination and for which it is reasonably possible that the total amounts of unrecognized tax benefits will significantly change in the next twelve months.
Multiple Class — All shares of the fund represent an equal pro rata interest in the net assets of the class to which such shares belong, and have identical voting, dividend, liquidation and other rights and the same terms and conditions, except for class specific expenses and exclusive rights to vote on matters affecting only individual classes. Income, non-class specific expenses, and realized and unrealized capital gains and losses of the fund are allocated to each class of shares based on their relative net assets.
Distributions to Shareholders — Distributions from net investment income, if any, are generally declared and paid quarterly. Distributions from net realized gains, if any, are generally declared and paid annually.
Indemnifications — Under the corporation’s organizational documents, its officers and directors are indemnified against certain liabilities arising out of the performance of their duties to the fund. In addition, in the normal course of business, the fund enters into contracts that provide general indemnifications. The maximum exposure under these arrangements is unknown as this would involve future claims that may be made against a fund. The risk of material loss from such claims is considered by management to be remote.
3. Fees and Transactions with Related Parties
Certain officers and directors of the corporation are also officers and/or directors of American Century Companies, Inc. (ACC). The corporation’s investment advisor, ACIM, the corporation's distributor, American Century Investment Services, Inc. (ACIS), and the corporation’s transfer agent, American Century Services, LLC, are wholly owned, directly or indirectly, by ACC.
Management Fees — The corporation has entered into a management agreement with ACIM, under which ACIM provides the fund with investment advisory and management services in exchange for a single, unified management fee (the fee) per class. The agreement provides that all expenses of managing and operating the fund, except distribution and service fees, brokerage expenses, taxes, interest, fees and expenses of the independent directors (including legal counsel fees), and extraordinary expenses, will be paid by ACIM. The fee is computed and accrued daily based on each class's daily net assets and paid monthly in arrears. The fee consists of (1) an Investment Category Fee based on the daily net assets of the fund and certain other accounts managed by the investment advisor that are in the same broad investment category as the fund and (2) a Complex Fee based on the assets of all the funds in the American Century Investments family of funds. The rates for the Investment Category Fee range from 0.3380% to 0.5200%. The rates for the Complex Fee range from 0.2500% to 0.3100% for the Investor Class, A Class, C Class and R Class. The rates for the Complex Fee range from 0.0500% to 0.1100% for the Institutional Class. The effective annual management fee for each class for the year ended June 30, 2015 was 0.66% for the Investor Class, A Class, C Class and R Class and 0.46% for the Institutional Class.
Distribution and Service Fees — The Board of Directors has adopted a separate Master Distribution and Individual Shareholder Services Plan for each of the A Class, C Class and R Class (collectively the plans), pursuant to Rule 12b-1 of the 1940 Act. The plans provide that the A Class will pay ACIS an annual distribution and service fee of 0.25%. The plans provide that the C Class will pay ACIS an annual distribution and service fee of 1.00%, of which 0.25% is paid for individual shareholder services and 0.75% is paid for distribution services. The plans provide that the R Class will pay ACIS an annual distribution and service fee of 0.50%. The fees are computed and accrued daily based on each class’s daily net assets and paid monthly in arrears. The fees are used to pay financial intermediaries for distribution and individual shareholder services. Fees incurred under the plans during the year ended June 30, 2015 are detailed in the Statement of Operations.
Directors' Fees and Expenses — The Board of Directors is responsible for overseeing the investment advisor’s management and operations of the fund. The directors receive detailed information about the fund and its investment advisor regularly throughout the year, and meet at least quarterly with management of the investment advisor to review reports about fund operations. The fund’s officers do not receive compensation from the fund.
4. Investment Transactions
Purchases and sales of investment securities, excluding short-term investments, for the year ended June 30, 2015 were $1,642,047,954 and $1,644,408,672, respectively.
5. Capital Share Transactions
Transactions in shares of the fund were as follows:
|
| | | | | | | | | | |
| | Year ended
June 30, 2015 | Year ended June 30, 2014 |
| | Shares | Amount | Shares | Amount |
| Investor Class/Shares Authorized | 300,000,000 |
| | 230,000,000 |
| |
| Sold | 4,415,849 |
| $ | 168,672,622 |
| 6,249,991 |
| $ | 221,131,933 |
|
| Issued in reinvestment of distributions | 3,268,566 |
| 121,705,253 |
| 941,777 |
| 33,492,283 |
|
| Redeemed | (7,024,223 | ) | (268,686,559 | ) | (7,736,304 | ) | (274,189,960 | ) |
| | 660,192 |
| 21,691,316 |
| (544,536 | ) | (19,565,744 | ) |
| Institutional Class/Shares Authorized | 40,000,000 |
| | 20,000,000 |
| |
| Sold | 1,560,257 |
| 59,605,348 |
| 773,957 |
| 27,297,836 |
|
| Issued in reinvestment of distributions | 201,775 |
| 7,523,360 |
| 53,104 |
| 1,895,148 |
|
| Redeemed | (657,649 | ) | (25,123,907 | ) | (669,025 | ) | (23,360,411 | ) |
| | 1,104,383 |
| 42,004,801 |
| 158,036 |
| 5,832,573 |
|
| A Class/Shares Authorized | 65,000,000 |
| | 75,000,000 |
| |
| Sold | 1,698,135 |
| 64,741,039 |
| 1,157,163 |
| 40,694,503 |
|
| Issued in reinvestment of distributions | 455,721 |
| 16,933,109 |
| 116,049 |
| 4,120,267 |
|
| Redeemed | (1,676,829 | ) | (63,966,041 | ) | (1,285,925 | ) | (45,308,043 | ) |
| | 477,027 |
| 17,708,107 |
| (12,713 | ) | (493,273 | ) |
| C Class/Shares Authorized | 20,000,000 |
| | 10,000,000 |
| |
| Sold | 93,204 |
| 3,538,958 |
| 93,441 |
| 3,304,247 |
|
| Issued in reinvestment of distributions | 9,705 |
| 358,605 |
| 997 |
| 35,605 |
|
| Redeemed | (21,226 | ) | (806,570 | ) | (15,079 | ) | (536,923 | ) |
| | 81,683 |
| 3,090,993 |
| 79,359 |
| 2,802,929 |
|
| R Class/Shares Authorized | 20,000,000 |
| | 10,000,000 |
| |
| Sold | 373,738 |
| 14,253,451 |
| 43,102 |
| 1,576,774 |
|
| Issued in reinvestment of distributions | 10,528 |
| 390,820 |
| 985 |
| 35,149 |
|
| Redeemed | (51,221 | ) | (1,955,038 | ) | (16,133 | ) | (564,263 | ) |
| | 333,045 |
| 12,689,233 |
| 27,954 |
| 1,047,660 |
|
| Net increase (decrease) | 2,656,330 |
| $ | 97,184,450 |
| (291,900 | ) | $ | (10,375,855 | ) |
6. Fair Value Measurements
The fund’s investments valuation process is based on several considerations and may use multiple inputs to determine the fair value of the investments held by the fund. In conformity with accounting principles generally accepted in the United States of America, the inputs used to determine a valuation are classified into three broad levels.
| |
| • | Level 1 valuation inputs consist of unadjusted quoted prices in an active market for identical investments. |
| |
| • | Level 2 valuation inputs consist of direct or indirect observable market data (including quoted prices for comparable investments, evaluations of subsequent market events, interest rates, prepayment speeds, credit risk, etc.). These inputs also consist of quoted prices for identical investments initially expressed in local currencies that are adjusted through translation into U.S. dollars. |
| |
| • | Level 3 valuation inputs consist of unobservable data (including a fund’s own assumptions). |
The level classification is based on the lowest level input that is significant to the fair valuation measurement. The valuation inputs are not necessarily an indication of the risks associated with investing in these securities or other financial instruments. There were no significant transfers between levels during the period.
The following is a summary of the level classifications as of period end. The Schedule of Investments provides additional information on the fund’s portfolio holdings.
|
| | | | | | | | |
| | Level 1 | Level 2 | Level 3 |
| Assets | | | |
| Investment Securities | | | |
| Common Stocks | $ | 2,025,571,393 |
| — |
| — |
|
| Temporary Cash Investments | 2,803,776 |
| $ | 15,013,429 |
| — |
|
| | $ | 2,028,375,169 |
| $ | 15,013,429 |
| — |
|
7. Federal Tax Information
The tax character of distributions paid during the years ended June 30, 2015 and June 30, 2014 were as follows:
|
| | | | | | |
| | 2015 | 2014 |
| Distributions Paid From | | |
| Ordinary income | $ | 64,654,748 |
| $ | 40,915,981 |
|
| Long-term capital gains | $ | 87,260,675 |
| — |
|
The book-basis character of distributions made during the year from net investment income or net realized gains may differ from their ultimate characterization for federal income tax purposes. These differences reflect the differing character of certain income items and net realized gains and losses for financial statement and tax purposes, and may result in reclassification among certain capital accounts on the financial statements.
As of June 30, 2015, the federal tax cost of investments and the components of distributable earnings on a tax-basis were as follows:
|
| | | |
| Federal tax cost of investments | $ | 1,674,351,857 |
|
| Gross tax appreciation of investments | $ | 421,946,456 |
|
| Gross tax depreciation of investments | (52,909,715 | ) |
| Net tax appreciation (depreciation) of investments | $ | 369,036,741 |
|
| Undistributed ordinary income | $ | 22,374,978 |
|
| Accumulated long-term gains | $ | 100,894,518 |
|
The difference between book-basis and tax-basis unrealized appreciation (depreciation) is attributable primarily to the tax deferral of losses on wash sales.
|
| | | | | | | | | | | | | | | |
| For a Share Outstanding Throughout the Years Ended June 30 (except as noted) |
| Per-Share Data | | | | | | | Ratios and Supplemental Data |
| | | Income From Investment Operations: | Distributions From: | | | Ratio to Average Net Assets of: | | |
| | Net Asset Value, Beginning of Period | Net Investment Income (Loss)(1) | Net Realized and Unrealized Gain (Loss) | Total From Investment Operations | Net Investment Income | Net
Realized
Gains | Total
Distributions | Net Asset Value, End of Period | Total Return(2) | Operating Expenses | Net Investment Income (Loss) | Portfolio Turnover Rate | Net Assets, End of Period (in thousands) |
| Investor Class | | | | | | | | | | | |
| 2015 | $38.52 | 0.81 | 0.29 | 1.10 | (0.79) | (2.05) | (2.84) | $36.78 | 2.87% | 0.67% | 2.11% | 79% |
| $1,655,693 |
|
| 2014 | $31.58 | 0.77 | 6.95 | 7.72 | (0.78) | — | (0.78) | $38.52 | 24.66% | 0.67% | 2.17% | 76% |
| $1,708,291 |
|
| 2013 | $26.29 | 0.68 | 5.27 | 5.95 | (0.66) | — | (0.66) | $31.58 | 22.86% | 0.68% | 2.39% | 74% |
| $1,417,796 |
|
| 2012 | $25.54 | 0.43 | 0.76 | 1.19 | (0.44) | — | (0.44) | $26.29 | 4.75% | 0.68% | 1.73% | 53% |
| $1,306,254 |
|
| 2011 | $19.88 | 0.36 | 5.64 | 6.00 | (0.34) | — | (0.34) | $25.54 | 30.31% | 0.69% | 1.52% | 42% |
| $1,351,936 |
|
| Institutional Class | | | | | | | | | | | |
| 2015 | $38.55 | 0.88 | 0.30 | 1.18 | (0.86) | (2.05) | (2.91) | $36.82 | 3.10% | 0.47% | 2.31% | 79% |
| $125,872 |
|
| 2014 | $31.61 | 0.84 | 6.95 | 7.79 | (0.85) | — | (0.85) | $38.55 | 24.89% | 0.47% | 2.37% | 76% |
| $89,218 |
|
| 2013 | $26.31 | 0.74 | 5.27 | 6.01 | (0.71) | — | (0.71) | $31.61 | 23.12% | 0.48% | 2.59% | 74% |
| $68,152 |
|
| 2012 | $25.56 | 0.48 | 0.76 | 1.24 | (0.49) | — | (0.49) | $26.31 | 4.96% | 0.48% | 1.93% | 53% |
| $97,809 |
|
| 2011 | $19.89 | 0.40 | 5.66 | 6.06 | (0.39) | — | (0.39) | $25.56 | 30.61% | 0.49% | 1.72% | 42% |
| $128,468 |
|
| A Class | | | | | | | | | | | | | |
| 2015 | $38.48 | 0.71 | 0.29 | 1.00 | (0.69) | (2.05) | (2.74) | $36.74 | 2.62% | 0.92% | 1.86% | 79% |
| $239,515 |
|
| 2014 | $31.55 | 0.68 | 6.94 | 7.62 | (0.69) | — | (0.69) | $38.48 | 24.34% | 0.92% | 1.92% | 76% |
| $232,471 |
|
| 2013 | $26.26 | 0.63 | 5.24 | 5.87 | (0.58) | — | (0.58) | $31.55 | 22.58% | 0.93% | 2.14% | 74% |
| $191,007 |
|
| 2012 | $25.52 | 0.37 | 0.74 | 1.11 | (0.37) | — | (0.37) | $26.26 | 4.46% | 0.93% | 1.48% | 53% |
| $116,762 |
|
| 2011 | $19.86 | 0.30 | 5.64 | 5.94 | (0.28) | — | (0.28) | $25.52 | 30.02% | 0.94% | 1.27% | 42% |
| $128,920 |
|
|
| | | | | | | | | | | | | | | |
| For a Share Outstanding Throughout the Years Ended June 30 (except as noted) |
| Per-Share Data | | | | | | | Ratios and Supplemental Data |
| | | Income From Investment Operations: | Distributions From: | | | Ratio to Average Net Assets of: | | |
| | Net Asset Value, Beginning of Period | Net Investment Income (Loss)(1) | Net Realized and Unrealized Gain (Loss) | Total From Investment Operations | Net Investment Income | Net
Realized
Gains | Total
Distributions | Net Asset Value, End of Period | Total Return(2) | Operating Expenses | Net Investment Income (Loss) | Portfolio Turnover Rate | Net Assets, End of Period (in thousands) |
| C Class | | | | | | | | | | | | | |
| 2015 | $38.42 | 0.42 | 0.29 | 0.71 | (0.40) | (2.05) | (2.45) | $36.68 | 1.86% | 1.67% | 1.11% | 79% |
| $8,195 |
|
| 2014 | $31.50 | 0.41 | 6.93 | 7.34 | (0.42) | — | (0.42) | $38.42 | 23.42% | 1.67% | 1.17% | 76% |
| $5,445 |
|
| 2013 | $26.23 | 0.41 | 5.23 | 5.64 | (0.37) | — | (0.37) | $31.50 | 21.63% | 1.68% | 1.39% | 74% |
| $1,965 |
|
| 2012 | $25.48 | 0.18 | 0.76 | 0.94 | (0.19) | — | (0.19) | $26.23 | 3.73% | 1.68% | 0.73% | 53% |
| $1,151 |
|
| 2011 | $19.83 | 0.12 | 5.63 | 5.75 | (0.10) | — | (0.10) | $25.48 | 29.04% | 1.69% | 0.52% | 42% |
| $933 |
|
| R Class | | | | | | | | | | | | | |
| 2015 | $38.51 | 0.60 | 0.31 | 0.91 | (0.60) | (2.05) | (2.65) | $36.77 | 2.36% | 1.17% | 1.61% | 79% |
| $15,663 |
|
| 2014 | $31.57 | 0.59 | 6.95 | 7.54 | (0.60) | — | (0.60) | $38.51 | 24.05% | 1.17% | 1.67% | 76% |
| $3,577 |
|
| 2013 | $26.28 | 0.57 | 5.23 | 5.80 | (0.51) | — | (0.51) | $31.57 | 22.26% | 1.18% | 1.89% | 74% |
| $2,050 |
|
| 2012 | $25.54 | 0.31 | 0.74 | 1.05 | (0.31) | — | (0.31) | $26.28 | 4.19% | 1.18% | 1.23% | 53% |
| $997 |
|
| 2011 | $19.87 | 0.24 | 5.65 | 5.89 | (0.22) | — | (0.22) | $25.54 | 29.73% | 1.19% | 1.02% | 42% |
| $506 |
|
|
|
| Notes to Financial Highlights |
| |
| (1) | Computed using average shares outstanding throughout the period. |
| |
| (2) | Total returns are calculated based on the net asset value of the last business day and do not reflect applicable sales charges, if any. Total returns for periods less than one year are not annualized. |
See Notes to Financial Statements.
|
|
| Report of Independent Registered Public Accounting Firm |
To the Directors of the American Century Quantitative Equity Funds, Inc. and Shareholders of the Income & Growth Fund:
In our opinion, the accompanying statement of assets and liabilities, including the schedule of investments, and the related statements of operations and of changes in net assets and the financial highlights present fairly, in all material respects, the financial position of the Income & Growth Fund (one of the sixteen funds comprising the American Century Quantitative Equity Funds, Inc., hereafter referred to as the “Fund”) at June 30, 2015, the results of its operations for the year then ended, the changes in its net assets for each of the two years in the period then ended and the financial highlights for each of the five years in the period then ended, in conformity with accounting principles generally accepted in the United States of America. These financial statements and financial highlights (hereafter referred to as "financial statements") are the responsibility of the Fund's management. Our responsibility is to express an opinion on these financial statements based on our audits. We conducted our audits of these financial statements in accordance with the standards of the Public Company Accounting Oversight Board (United States). Those standards require that we plan and perform the audit to obtain reasonable assurance about whether the financial statements are free of material misstatement. An audit includes examining, on a test basis, evidence supporting the amounts and disclosures in the financial statements, assessing the accounting principles used and significant estimates made by management, and evaluating the overall financial statement presentation. We believe that our audits, which included confirmation of securities at June 30, 2015 by correspondence with the custodian and brokers, provide a reasonable basis for our opinion.
PricewaterhouseCoopers LLP
Kansas City, Missouri
August 21, 2015
Board of Directors
The individuals listed below serve as directors of the funds. Each director will continue to serve in this capacity until death, retirement, resignation or removal from office. The board has adopted a mandatory retirement age for directors who are not “interested persons,” as that term is defined in the Investment Company Act (independent directors). Independent directors shall retire on December 31 of the year in which they reach their 75th birthday; provided, however, that on or after January 1, 2022, independent directors shall retire on December 31 of the year in which they reach their 76th birthday.
Mr. Thomas is an “interested person” because he currently serves as President and Chief Executive Officer of American Century Companies, Inc. (ACC), the parent company of American Century Investment Management, Inc. (ACIM or the advisor). The other directors (more than three-fourths of the total number) are independent. They are not employees, directors or officers of, and have no financial interest in, ACC or any of its wholly owned, direct or indirect, subsidiaries, including ACIM, American Century Investment Services, Inc. (ACIS) and American Century Services, LLC (ACS), and they do not have any other affiliations, positions or relationships that would cause them to be considered “interested persons” under the Investment Company Act. The directors serve in this capacity for eight (in the case of Mr. Thomas, 15) registered investment companies in the American Century Investments family of funds.
The following table presents additional information about the directors. The mailing address for each director other than Mr. Thomas is 1665 Charleston Road, Mountain View, California 94043. The mailing address for Mr. Thomas is 4500 Main Street, Kansas City, Missouri 64111.
|
| | | | | |
Name (Year of Birth) | Position(s) Held with Funds | Length of Time Served | Principal Occupation(s) During Past 5 Years | Number of American Century Portfolios Overseen by Director | Other Directorships Held During Past 5 Years |
Independent Directors | | |
Tanya S. Beder
(1955) | Director | Since 2011 | Chairman and CEO, SBCC Group Inc. (independent advisory services) (2006 to present) | 46 | CYS Investments, Inc. (NYSE mortgage arbitrage REIT) |
Jeremy I. Bulow
(1954) | Director | Since 2011 | Professor of Economics, Stanford University, Graduate School of Business (1979 to present) | 46 | None |
Ronald J. Gilson
(1946) | Director and Chairman of the Board | Since 1995
(Chairman since 2005) | Charles J. Meyers Professor of Law and Business, Stanford Law School (1979 to present); Marc and Eva Stern Professor of Law and Business, Columbia University School of Law (1992 to present) | 46 | None |
Frederick L. A. Grauer
(1946) | Director | Since 2008 | Senior Advisor, BlackRock, Inc. (investment management firm) (2010 to 2011, 2013 to present) | 46 | None |
Peter F. Pervere
(1947) | Director | Since 2007 | Retired | 46 | None |
|
| | | | | |
Name (Year of Birth) | Position(s) Held with Funds | Length of Time Served | Principal Occupation(s) During Past 5 Years | Number of American Century Portfolios Overseen by Director | Other Directorships Held During Past 5 Years |
| Independent Directors | | |
John B. Shoven
(1947) | Director | Since 2002 | Professor of Economics, Stanford University (1973 to present) | 46 | Cadence Design Systems; Exponent; Financial Engines |
| Interested Director | | |
Jonathan S. Thomas
(1963) | Director and President | Since 2007 | President and Chief Executive Officer, ACC (March 2007 to present). Also serves as Chief Executive Officer, ACS; Executive Vice President, ACIM; Director, ACC, ACIM and other ACC subsidiaries | 124 | BioMed Valley Discoveries, Inc. |
The Statement of Additional Information has additional information about the fund's directors and is available without charge, upon request, by calling 1-800-345-2021.
Officers
The following table presents certain information about the executive officers of the funds. Each officer serves as an officer for each of the 15 investment companies in the American Century family of funds, unless otherwise noted. No officer is compensated for his or her service as an officer of the funds. The listed officers are interested persons of the funds and are appointed or re-appointed on an annual basis. The mailing address for each of the officers listed below is 4500 Main Street, Kansas City, Missouri 64111.
|
| | |
Name (Year of Birth) | Offices with
the Funds | Principal Occupation(s) During the Past Five Years |
Jonathan S.
Thomas
(1963) | Director and President
since 2007 | President and Chief Executive Officer, ACC (March 2007 to present). Also serves as Chief Executive Officer, ACS; Executive Vice President, ACIM; Director, ACC, ACIM and other ACC subsidiaries |
Amy D. Shelton
(1964) | Chief Compliance Officer and Vice President since 2014 | Chief Compliance Officer, American Century funds, (March 2014 to present); Chief Compliance Officer, ACIM (February 2014 to present); Chief Compliance Officer, ACIS (October 2009 to present); Vice President, Client Interactions and Marketing, ACIS (February 2013 to January 2014); Director, Client Interactions and Marketing, ACIS (June 2007 to January 2013). Also serves as Vice President, ACIS |
Charles A. Etherington
(1957) | General Counsel since 2007 and Senior Vice President since 2006 | Attorney, ACC (February 1994 to present); Vice President, ACC (November 2005 to present); General Counsel, ACC (March 2007 to present). Also serves as General Counsel, ACIM, ACS, ACIS and other ACC subsidiaries; and Senior Vice President, ACIM and ACS |
C. Jean Wade
(1964) | Vice President,
Treasurer and
Chief Financial
Officer since 2012 | Vice President, ACS (February 2000 to present) |
Robert J. Leach
(1966) | Vice President
since 2006 and
Assistant Treasurer
since 2012 | Vice President, ACS (February 2000 to present) |
David H. Reinmiller
(1963) | Vice President since 2001 | Attorney, ACC (January 1994 to present); Associate General Counsel, ACC (January 2001 to present). Also serves as Vice President, ACIM and ACS |
Ward D. Stauffer
(1960) | Secretary since 2005 | Attorney, ACC (June 2003 to present) |
|
|
| Approval of Management Agreement |
At a meeting held on June 16, 2015, the Fund’s Board of Directors unanimously approved the renewal of the management agreement pursuant to which American Century Investment Management, Inc. (the “Advisor”) acts as the investment advisor for the Fund. Under Section 15(c) of the Investment Company Act, contracts for investment advisory services are required to be reviewed, evaluated, and approved by a majority of a fund’s directors/trustees, including a majority of the independent Directors, each year. The Board regards this annual evaluation and renewal as one of its most important responsibilities.
The independent Directors have memorialized a statement regarding the relationship between their ongoing obligations to oversee and evaluate the performance of the Advisor and their annual consideration of renewal of the management agreement. In that statement, the independent Directors noted that their assessment of the Advisor’s performance is an ongoing process that takes place over the entire year and is informed by all of the extensive information that the Board and its committees receive and consider over time. This information, together with the materials provided in connection with the review, are central to the Board’s assessment of the Advisor’s performance and its determination whether to renew the Fund’s management agreement.
Prior to its consideration of the renewal of the management agreement, the Board requested and reviewed extensive data and analysis relating to the proposed renewal. This information and analysis was compiled by the Advisor and certain independent providers of evaluation data concerning the Fund and the services provided to the Fund by the Advisor.
In connection with its consideration of the renewal of the management agreement, the Board’s review and evaluation of the services provided by the Advisor included, but was not limited to, the following:
| |
| • | the nature, extent, and quality of investment management, shareholder services, and other services provided by the Advisor to the Fund; |
| |
| • | the wide range of other programs and services the Advisor provides to the Fund and its shareholders on a routine and non-routine basis; |
| |
| • | the investment performance of the Fund, including data comparing the Fund’s performance to appropriate benchmarks and/or a peer group of other mutual funds with similar investment objectives and strategies; |
| |
| • | the cost of owning the Fund compared to the cost of owning similar funds; |
| |
| • | the Advisor’s compliance policies, procedures, and regulatory experience; |
| |
| • | financial data showing the cost of services provided to the Fund, the profitability of the Fund to the Advisor, and the overall profitability of the Advisor; |
| |
| • | possible economies of scale associated with the Advisor’s management of the Fund and other accounts under its management; |
| |
| • | data comparing services provided and charges to other investment management clients of the Advisor; |
| |
| • | acquired fund fees and expenses; |
| |
| • | payments by the Fund and the Advisor to financial intermediaries whose clients are investors in the Fund; and |
| |
| • | any collateral benefits derived by the Advisor from the management of the Fund. |
In keeping with its practice, the Board held two in-person meetings to review and discuss the information provided in response to their request. The independent Directors also had the benefit of the advice of their independent counsel throughout the process.
Factors Considered
The Directors considered all of the information provided by the Advisor, the independent data providers, and the independent Directors’ independent counsel in connection with the review, and evaluated such information for the Fund. In connection with their review, the Directors did not identify any single factor as being all-important or controlling and each Director may have attributed different levels of importance to different factors. In deciding to renew the management agreement, the Board based its decision on a number of factors, including the following:
Nature, Extent and Quality of Services - Generally. Under the management agreement, the Advisor is responsible for providing or arranging for all services necessary for the operation of the Fund. The Board noted that under the management agreement, the Advisor provides or arranges at its own expense a wide variety of services including:
| |
| • | constructing and designing the Fund |
| |
| • | portfolio research and security selection |
| |
| • | initial capitalization/funding |
| |
| • | daily valuation of the Fund’s portfolio |
| |
| • | shareholder servicing and transfer agency, including shareholder confirmations, recordkeeping, and communications |
| |
| • | legal services (except the independent Directors’ counsel) |
| |
| • | regulatory and portfolio compliance |
| |
| • | marketing and distribution (except amounts paid by the Fund under Rule 12b-1 plans) |
The Board noted that many of these services have expanded over time both in terms of quantity and complexity in response to shareholder demands, competition in the industry, changing distribution channels, and the changing regulatory environment.
Investment Management, Shareholder, and Other Services. The nature of the investment management services provided to the Fund is quite complex and allows Fund shareholders access to professional money management, instant diversification of their investments within an asset class, the opportunity to easily diversify among asset classes by investing in or exchanging among various American Century Investments funds, and liquidity. In evaluating investment performance, the Board expects the Advisor to manage the Fund in accordance with its investment objectives and approved strategies. Further, the Directors recognize that the Advisor has an obligation to seek the best execution of fund trades. In providing these services, the Advisor utilizes teams of investment professionals (portfolio managers, analysts, research assistants, and securities traders) who require extensive information technology, research, training, compliance, and other systems to conduct their business. The Board, directly and through its Portfolio Committee, regularly reviews investment performance information for the Fund, together with comparative information for appropriate benchmarks and/or peer groups of similarly-managed funds, over different time horizons. The Directors also review detailed performance information during the management agreement approval process. If performance concerns are identified, the Fund receives special reviews until performance improves, during which the Board discusses with the Advisor the reasons for such results (e.g., market conditions, security selection) and any efforts being undertaken to improve performance. The Fund’s performance was above its benchmark for the three- and five-year periods and slightly below its benchmark for the one- and ten-year periods reviewed by the Board. The Board found the investment management services provided by the Advisor to the Fund to be satisfactory and consistent with the management agreement.
Under the management agreement, the Advisor provides the Fund with a comprehensive package of transfer agency, shareholder, and other services. The Board, directly and through various committees of the Board, regularly reviews reports and evaluations of such services at its regular
meetings. These reports include, but are not limited to, information regarding the operational efficiency and accuracy of the shareholder and transfer agency services provided, staffing levels, shareholder satisfaction (as measured by external as well as internal sources), technology support, new products and services offered to Fund shareholders, securities trading activities, portfolio valuation services, auditing services, and legal and operational compliance activities.
Certain aspects of shareholder and transfer agency service level efficiency and the quality of securities trading activities are measured by independent third party providers and are presented in comparison to other fund groups not managed by the Advisor. The Board found the services provided by the Advisor to the Fund under the management agreement to be competitive and of high quality.
Costs of Services and Profitability. The Advisor provides detailed information concerning its cost of providing various services to the Fund, its profitability in managing the Fund, its overall profitability, and its financial condition. The Directors have reviewed with the Advisor the methodology used to prepare this financial information. This information is considered in evaluating the Advisor’s financial condition, its ability to continue to provide services under the management agreement, and the reasonableness of the current management fee. The Board concluded that the Advisor’s profits were reasonable in light of the services provided to the Fund.
Ethics. The Board generally considers the Advisor’s commitment to providing quality services to shareholders and to conducting its business ethically. They noted that the Advisor’s practices generally meet or exceed industry best practices.
Economies of Scale. The Board also reviewed information provided by the Advisor regarding the possible existence of economies of scale in connection with the management of the Fund. The Board concluded that economies of scale are difficult to measure and predict with precision, especially on a fund-by-fund basis. The Board concluded that the Advisor is appropriately sharing economies of scale through its competitive fee structure, offering competitive fees from fund inception, and through reinvestment in its business to provide shareholders enhanced and expanded services.
Comparison to Other Funds’ Fees. The management agreement provides that the Fund pays the Advisor a single, all-inclusive (or unified) management fee for providing all services necessary for the management and operation of the Fund, other than brokerage expenses, taxes, interest, extraordinary expenses, the fees and expenses of the Fund’s independent Directors (including their independent legal counsel), and expenses incurred in connection with the provision of shareholder services and distribution services under a plan adopted pursuant to Rule 12b-1 under the 1940 Act. Under the unified fee structure, the Advisor is responsible for providing all investment advisory, custody, audit, administrative, compliance, recordkeeping, marketing, and shareholder services, or arranging and supervising third parties to provide such services. By contrast, most other funds are charged a variety of fees, including an investment advisory fee, a transfer agency fee, an administrative fee, distribution charges, and other expenses. Other than their investment advisory fees and any applicable Rule 12b-1 fees, all other components of the total fees charged by these other funds may be increased without shareholder approval. The Board believes the unified fee structure is a benefit to Fund shareholders because it clearly discloses to shareholders the cost of owning Fund shares, and, since the unified fee cannot be increased without a vote of Fund shareholders, it shifts to the Advisor the risk of increased costs of operating the Fund and provides a direct incentive to minimize administrative inefficiencies. Part of the Board’s analysis of fee levels involves reviewing certain evaluative data compiled by an independent provider and comparing the Fund’s unified fee to the total expense ratio of peer funds. The unified fee charged to shareholders of the Fund was below the median of the total expense ratios of the Fund’s peer group. The Board concluded that the management fee paid by the Fund to the Advisor under the management agreement is reasonable in light of the services provided to the Fund.
Comparison to Fees and Services Provided to Other Clients of the Advisor. The Board also requested and received information from the Advisor concerning the nature of the services, fees, costs, and profitability of its advisory services to advisory clients other than the Fund. They observed that these varying types of client accounts require different services and involve different regulatory and entrepreneurial risks than the management of the Fund. The Board analyzed this information and concluded that the fees charged and services provided to the Fund were reasonable by comparison.
Payments to Intermediaries. The Directors also requested and received a description of payments made to intermediaries by the Fund and the Advisor. These payments include various payments made by the Fund or the Advisor to different types of intermediaries and recordkeepers for distribution and service activities provided for the Fund.
Collateral or “Fall-Out” Benefits Derived by the Advisor. The Board considered the existence of collateral benefits the Advisor may receive as a result of its relationship with the Fund. The Board noted that the Advisor’s primary business is managing mutual funds and it generally does not use fund or shareholder information to generate profits in other lines of business, and therefore does not derive any significant collateral benefits from them. The Board noted that the Advisor receives proprietary research from broker-dealers that execute fund portfolio transactions. The Board also determined that the Advisor is able to provide investment management services to certain clients other than the Fund, at least in part, due to its existing infrastructure built to serve the fund complex.
Existing Relationship. The Board also considered whether there was any reason for not continuing the existing arrangement with the Advisor. In this regard, the Board was mindful of the potential disruptions of the Fund’s operations and various risks, uncertainties, and other effects that could occur as a result of a decision not to continue such relationship. In particular, the Board recognized that most shareholders have invested in the Fund on the strength of the Advisor’s industry standing and reputation and in the expectation that the Advisor will have a continuing role in providing advisory services to the Fund.
Conclusion of the Directors. As a result of this process, the Board, including all of the independent Directors and assisted by the advice of independent legal counsel, taking into account all of the factors discussed above and the information provided by the Advisor and others in connection with its review and throughout the year, concluded that the management agreement between the Fund and the Advisor is fair and reasonable in light of the services provided and should be renewed.
Retirement Account Information
As required by law, distributions you receive from certain IRAs are subject to federal income tax withholding, unless you elect not to have withholding apply. Tax will be withheld on the total amount withdrawn even though you may be receiving amounts that are not subject to withholding, such as nondeductible contributions. In such case, excess amounts of withholding could occur. You may adjust your withholding election so that a greater or lesser amount will be withheld.
If you don’t want us to withhold on this amount, you must notify us to not withhold the federal income tax. You may notify us in writing or in certain situations by telephone or through other electronic means. For systematic withdrawals, your withholding election will remain in effect until revoked or changed by filing a new election. You have the right to revoke your election at any time.
Remember, even if you elect not to have income tax withheld, you are liable for paying income tax on the taxable portion of your withdrawal. If you elect not to have income tax withheld or you don’t have enough income tax withheld, you may be responsible for payment of estimated tax. You may incur penalties under the estimated tax rules if your withholding and estimated tax payments are not sufficient. You can reduce or defer the income tax on a distribution by directly or indirectly rolling such distribution over to another IRA or eligible plan. You should consult your tax advisor for additional information.
State tax will be withheld if, at the time of your distribution, your address is within one of the mandatory withholding states and you have federal income tax withheld (or as otherwise required by state law). State taxes will be withheld from your distribution in accordance with the respective state rules.
Distributions you receive from 403(b), 457 and qualified plans are subject to special tax and withholding rules. Your plan administrator or plan sponsor is required to provide you with a special tax notice explaining those rules at the time you request a distribution. If applicable, federal and/or state taxes may be withheld from your distribution amount.
Proxy Voting Policies
Descriptions of the principles and policies that the fund's investment advisor uses in exercising the voting rights associated with the securities purchased and/or held by the fund are available without charge, upon request, by calling 1-800-345-2021 or visiting the "About Us" page of American Century Investments’ website at americancentury.com. A description of the policies is also available on the Securities and Exchange Commission’s website at sec.gov. Information regarding how the investment advisor voted proxies relating to portfolio securities during the most recent 12-month period ended June 30 is available on the "About Us" page at americancentury.com. It is also available at sec.gov.
Quarterly Portfolio Disclosure
The fund files its complete schedule of portfolio holdings with the Securities and Exchange Commission (SEC) for the first and third quarters of each fiscal year on Form N-Q. The fund’s Forms N-Q are available on the SEC’s website at sec.gov, and may be reviewed and copied at the SEC’s Public Reference Room in Washington, DC. Information on the operation of the Public Reference Room may be obtained by calling 1-800-SEC-0330. The fund also makes its complete schedule of portfolio holdings for the most recent quarter of its fiscal year available on its website at americancentury.com and, upon request, by calling 1-800-345-2021.
Other Tax Information
The following information is provided pursuant to provisions of the Internal Revenue Code.
The fund hereby designates up to the maximum amount allowable as qualified dividend income for the fiscal year ended June 30, 2015.
For corporate taxpayers, the fund hereby designates $53,059,973, or up to the maximum amount allowable, of ordinary income distributions paid during the fiscal year ended June 30, 2015 as qualified for the corporate dividends received deduction.
The fund hereby designates $21,788,526 as qualified short-term capital gain distributions for purposes of Internal Revenue Code Section 871 for the fiscal year ended June 30, 2015.
The fund hereby designates $87,260,675, or up to the maximum amount allowable, as long-term capital gain distributions for the fiscal year ended June 30, 2015.
|
| | |
| |
| | | |
| Contact Us | americancentury.com | |
| Automated Information Line | 1-800-345-8765 | |
| Investor Services Representative | 1-800-345-2021
or 816-531-5575 | |
| Investors Using Advisors | 1-800-378-9878 | |
Business, Not-For-Profit, Employer-Sponsored
Retirement Plans | 1-800-345-3533 | |
Banks and Trust Companies, Broker-Dealers,
Financial Professionals, Insurance Companies | 1-800-345-6488 | |
| Telecommunications Relay Service for the Deaf | 711 | |
| | | |
| American Century Quantitative Equity Funds, Inc. | |
| | | |
Investment Advisor: American Century Investment Management, Inc. Kansas City, Missouri | |
| | | |
| This report and the statements it contains are submitted for the general information of our shareholders. The report is not authorized for distribution to prospective investors unless preceded or accompanied by an effective prospectus. | |
| | | |
©2015 American Century Proprietary Holdings, Inc. All rights reserved.
CL-ANN-86505 1508 | |
|
| |
| ANNUAL REPORT | JUNE 30, 2015 |
International Core Equity Fund
|
| | |
| President's Letter | 2 |
|
| Performance | 3 |
|
| Portfolio Commentary | |
|
| Fund Characteristics | |
|
| Shareholder Fee Example | |
|
| Schedule of Investments | |
|
| Statement of Assets and Liabilities | |
|
| Statement of Operations | |
|
| Statement of Changes in Net Assets | |
|
| Notes to Financial Statements | |
|
| Financial Highlights | |
|
| Report of Independent Registered Public Accounting Firm | |
|
| Management | |
|
| Approval of Management Agreement | |
|
| Additional Information | |
|
Any opinions expressed in this report reflect those of the author as of the date of the report, and do not necessarily represent the opinions of American Century Investments® or any other person in the American Century Investments organization. Any such opinions are subject to change at any time based upon market or other conditions and American Century Investments disclaims any responsibility to update such opinions. These opinions may not be relied upon as investment advice and, because investment decisions made by American Century Investments funds are based on numerous factors, may not be relied upon as an indication of trading intent on behalf of any American Century Investments fund. Security examples are used for representational purposes only and are not intended as recommendations to purchase or sell securities. Performance information for comparative indices and securities is provided to American Century Investments by third party vendors. To the best of American Century Investments’ knowledge, such information is accurate at the time of printing.
|
| |
| Dear Investor:
Thank you for reviewing this annual report for the 12 months ended June 30, 2015. It provides investment performance and portfolio information for the reporting period, plus longer-term historical performance data.
Annual reports remain important vehicles for conveying information about fund returns, including market and economic factors that affected performance during the reporting period. For additional, updated investment and market insights, we encourage you to visit our website, americancentury.com. |
| Jonathan Thomas |
Global Divergence Favored U.S. Assets
“Global divergence” between the U.S. and the rest of the world emerged as a prevalent theme during the reporting period. This theme embraced not only the relatively stronger economic growth enjoyed by the U.S. compared with most of the world, but also the related contrast between the U.S. Federal Reserve’s unwinding of monetary stimulus compared with the continuation and expansion of stimulus by other major central banks. Low inflation also prevailed, after crude oil prices plunged over 40% amid muted demand for commodities in general. In this environment, the U.S. dollar, U.S. growth stocks, and longer-maturity U.S. Treasuries generally benefited from “flight to quality” capital flows, reinforced by geopolitical and financial turmoil, particularly in Greece, Russia/Ukraine, China, and the Middle East.
Strong global capital flows into U.S. assets generated a global divergence between investment returns for U.S. and non-U.S. markets, especially for U.S. investors who realized their returns in dollar terms. For the reporting period, the U.S. Dollar Index, the S&P 500 Index, and the Barclays U.S. Aggregate Bond Index returned 19.74%, 7.42%, and 1.86%, respectively. By contrast, the MSCI EAFE Index, the MSCI Emerging Markets Index, and the Barclays Global Aggregate Bond ex-USD (Unhedged) Index returned -4.22%, -5.12%, and -13.19%, respectively, for U.S. investors unhedged for the strong dollar’s impact on non-dollar-denominated returns.
We expect more monetary policy divergence between the U.S. and other major developed economies in the coming months, accompanied by continued market volatility. This could present both challenges and opportunities for active investment managers. Upward pressures on inflation and interest rates could develop as the massive amount of global monetary stimulus in progress takes hold and economies improve. In this environment, we continue to believe in a disciplined, diversified, long-term investment approach, using professionally managed stock and bond portfolios to meet financial goals. We appreciate your continued trust in us.
Sincerely,
Jonathan Thomas
President and Chief Executive Officer
American Century Investments
|
| | | | | |
| Total Returns as of June 30, 2015 |
| | Average Annual Returns | |
| | Ticker Symbol | 1 year | 5 years | Since Inception | Inception Date |
| Investor Class | ACIMX | -5.11% | 10.94% | 1.54% | 11/30/06 |
| MSCI EAFE Index | — | -4.22% | 9.53% | 1.85% | — |
| Institutional Class | ACIUX | -4.91% | 11.15% | 1.74% | 11/30/06 |
| A Class | ACIQX | | | | 11/30/06 |
| No sales charge* | | -5.25% | 10.70% | 1.30% | |
| With sales charge* | | -10.70% | 9.41% | 0.61% | |
| C Class | ACIKX | -6.02% | 9.82% | 0.54% | 11/30/06 |
| R Class | ACIRX | -5.61% | 10.39% | 1.03% | 11/30/06 |
| |
| * | Sales charges include initial sales charges and contingent deferred sales charges (CDSCs), as applicable. A Class shares have a 5.75% maximum initial sales charge and may be subject to a maximum CDSC of 1.00%. C Class shares redeemed within 12 months of purchase are subject to a maximum CDSC of 1.00%. The SEC requires that mutual funds provide performance information net of maximum sales charges in all cases where charges could be applied. |
Data presented reflect past performance. Past performance is no guarantee of future results. Current performance may be higher or lower than the performance shown. Investment return and principal value will fluctuate, and redemption value may be more or less than original cost. Data assumes reinvestment of dividends and capital gains, and none of the charts reflect the deduction of taxes that a shareholder would pay on fund distributions or the redemption of fund shares. To obtain performance data current to the most recent month end, please call 1-800-345-2021 or visit americancentury.com. For additional information about the fund, please consult the prospectus.
|
|
| Growth of $10,000 Over Life of Class |
| $10,000 investment made November 30, 2006 |
| Performance for other share classes will vary due to differences in fee structure. |
|
| |
| Value on June 30, 2015 |
| | Investor Class — $11,400 |
| |
| | MSCI EAFE Index — $11,707 |
| |
*From November 30, 2006, the Investor Class’s inception date. Not annualized.
|
| | | | |
| Total Annual Fund Operating Expenses |
| Investor Class | Institutional Class | A Class | C Class | R Class |
| 1.16% | 0.96% | 1.41% | 2.16% | 1.66% |
The total annual fund operating expenses shown is as stated in the fund’s prospectus current as of the date of this report. The prospectus may vary from the expense ratio shown elsewhere in this report because it is based on a different time period, includes acquired fund fees and expenses, and, if applicable, does not include fee waivers or expense reimbursements.
Data presented reflect past performance. Past performance is no guarantee of future results. Current performance may be higher or lower than the performance shown. Investment return and principal value will fluctuate, and redemption value may be more or less than original cost. Data assumes reinvestment of dividends and capital gains, and none of the charts reflect the deduction of taxes that a shareholder would pay on fund distributions or the redemption of fund shares. To obtain performance data current to the most recent month end, please call 1-800-345-2021 or visit americancentury.com. For additional information about the fund, please consult the prospectus.
Portfolio Managers: Elizabeth Xie, Yulin Long, and Vinod Chandrashekaran
Performance Summary
International Core Equity returned -5.11%* for the fiscal year ended June 30, 2015, compared with the -4.22% return of the fund’s benchmark, the MSCI EAFE Index.
International Core Equity declined, underperforming the MSCI EAFE Index. Difficult stock selection across a number of sectors drove underperformance relative to the index. This was most pronounced in the health care sector. From a geographical perspective, holdings based in Australia and the U.K. pressured results, while stock selection in Japan and Sweden was beneficial. Contribution to results came from the information technology sector. The fund’s stock selection process incorporates factors of valuation, quality, and momentum, while striving to minimize unintended risks along industries and other risk characteristics. Stock selection insights based on valuation proved difficult while quality and momentum drivers were positive.
Australian and U.K. Materials Holdings Underperformed
The materials sector was a leading area of underperformance, due in part to difficult stock selection in U.K.- and Australia-based metals and mining stocks, which were pressured by commodity and precious metals price declines. A portfolio-only position in U.K.-based Vedanta Resources, a diversified metals and mining company, was one of the portfolio’s leading individual detractors. The company’s stock price declined more than 50%, pressured by falling commodity prices and leading to disappointing quarterly earnings. Likewise, Australia-based Fortescue Metals Group was a key detractor; yet we maintain confidence in both companies given their attractive valuation and quality profiles. Mineral Resources, an Australia-based mining services provider in the industrials sector, also suffered due to declining iron ore prices and the portfolio-only position was subsequently eliminated.
A number of European utilities and energy holdings also underperformed. Specifically, an overweight position, relative to the benchmark, in Germany-based RWE was detrimental as ongoing electricity price declines and lower demand for power due to rising renewable energy sources pressured power producers. U.K.-based oil and gas exploration and production company Soco International, a non-benchmark holding, was a casualty of falling oil prices. Both investments were ultimately exited.
Elsewhere, leading detractors stemmed from underweight positions in a number of European pharmaceuticals holdings in the health care sector, although no position was a key individual underperformer.
| |
| * | All fund returns referenced in this commentary are for Investor Class shares. Performance for other share classes will vary due to differences in fee structure; when Investor Class performance exceeds that of the fund's benchmark, other share classes may not. See page 3 for returns for all share classes. |
Japan-based Information Technology Holdings Outperformed
The information technology sector was a leading area of outperformance. In particular, export-driven, Japan-based computer and peripherals and electronic equipment manufacturers benefited from currency depreciation, which aided their products’ competitiveness abroad. An overweight position in Japan-based FUJIFILM Holdings bolstered fund returns as the manufacturer of photo imaging and medical systems products advanced on higher sales and yen weakness. The holding exhibits strength across all factors. Seiko Epson, a printer and computer component manufacturer in which the fund maintained an overweight position, also benefited from currency effects, but was eventually liquidated from the fund. Japan-based consumer discretionary sector holdings were likewise helped by currency tailwinds. An overweight position in Fuji Heavy Industries, manufacturer of Subaru cars, aided the fund’s relative returns due to rising profits from strong sales bolstered by the weak yen. The company’s valuation- and quality-based insights are particularly attractive.
Outside of Japan, leading individual contributors included Germany-based Dialog Semiconductor. The semiconductor manufacturer rose on better-than-expected quarterly results stemming from strong demand for its chips from smartphone makers. The company, which also raised its full-year outlook, is especially strong on quality and momentum metrics. Hong Kong-based Link Real Estate Investment Trust was also a top fund contributor. The company’s strong operating margins and return-on-assets helped to bolster its share price. The holding’s earnings expectations remain favorable and our models show ongoing strength across valuation and quality measures.
A Look Ahead
Global economic activity appears to have diminished in breadth, but remains slow yet steady. Divergence in monetary policy between the U.S., which is preparing to raise interest rates, and central banks around much of the rest of the world that are maintaining monetary stimulus programs, is likely to remain a top story in the near future. The European economy seems to have turned a corner and has begun producing sustainable growth, as evidenced by its fourth-consecutive quarter of expansion. The European Central Bank’s quantitative easing program is likely to support further economic growth, bolster stock prices, and boost investor confidence by increasing the money supply, improving access to credit, and weakening the euro. Meanwhile, the Japanese government’s stimulative policies have weakened the yen, benefiting manufacturers and exporters, including automakers, machinery firms, and technology companies. However, deflationary pressures continue to hamper the consumer-oriented and domestically focused sectors of the economy. Elsewhere in Asia, stocks continue to be pressured by concerns about the pace of global growth, stressed commodities prices, the strong U.S. dollar, and a looming interest rate increase. Although uneven economic recovery and the potential for rising inflation and interest rates could lead to heightened levels of market volatility, our disciplined, objective, and systematic investment strategy is designed to take advantage of opportunities at the individual company level. We believe this approach is the most powerful way to capitalize on market inefficiencies that lead to the mispricing of individual stocks.
|
| |
| JUNE 30, 2015 |
| Top Ten Holdings | % of net assets |
| Roche Holding AG | 2.4% |
| iShares MSCI EAFE ETF | 2.2% |
| Novartis AG | 1.8% |
| ENI SpA | 1.3% |
| Zurich Insurance Group AG | 1.3% |
| Central Japan Railway Co. | 1.2% |
| HSBC Holdings plc | 1.2% |
| Canon, Inc. | 1.2% |
| Sony Corp. | 1.2% |
| Toyota Motor Corp. | 1.1% |
| | |
| Investments by Country | % of net assets |
| Japan | 21.2% |
| United Kingdom | 19.9% |
| Switzerland | 8.1% |
| France | 7.9% |
| Germany | 7.6% |
| Australia | 5.0% |
| Sweden | 3.5% |
| Hong Kong | 3.4% |
| Italy | 3.1% |
| Spain | 2.4% |
| Netherlands | 2.1% |
| Other Countries | 11.1% |
| Exchange-Traded Funds* | 2.6% |
| Cash and Equivalents** | 2.1% |
*Category may increase exposure to the countries indicated. The Schedule of Investments provides additional information on the fund's portfolio holdings. |
| **Includes temporary cash investments and other assets and liabilities. | |
| | |
| Types of Investments in Portfolio | % of net assets |
| Foreign Common Stocks | 95.3% |
| Exchange-Traded Funds | 2.6% |
| Total Equity Exposure | 97.9% |
| Temporary Cash Investments | 1.9% |
| Other Assets and Liabilities | 0.2% |
Fund shareholders may incur two types of costs: (1) transaction costs, including sales charges (loads) on purchase payments and redemption/exchange fees; and (2) ongoing costs, including management fees; distribution and service (12b-1) fees; and other fund expenses. This example is intended to help you understand your ongoing costs (in dollars) of investing in your fund and to compare these costs with the ongoing cost of investing in other mutual funds.
The example is based on an investment of $1,000 made at the beginning of the period and held for the entire period from January 1, 2015 to June 30, 2015.
Actual Expenses
The table provides information about actual account values and actual expenses for each class. You may use the information, together with the amount you invested, to estimate the expenses that you paid over the period. First, identify the share class you own. Then simply divide your account value by $1,000 (for example, an $8,600 account value divided by $1,000 = 8.6), then multiply the result by the number under the heading “Expenses Paid During Period” to estimate the expenses you paid on your account during this period.
If you hold Investor Class shares of any American Century Investments fund, or Institutional Class shares of the American Century Diversified Bond Fund, in an American Century Investments account (i.e., not a financial intermediary or retirement plan account), American Century Investments may charge you a $12.50 semiannual account maintenance fee if the value of those shares is less than $10,000. We will redeem shares automatically in one of your accounts to pay the $12.50 fee. In determining your total eligible investment amount, we will include your investments in all personal accounts (including American Century Investments Brokerage accounts) registered under your Social Security number. Personal accounts include individual accounts, joint accounts, UGMA/UTMA accounts, personal trusts, Coverdell Education Savings Accounts and IRAs (including traditional, Roth, Rollover, SEP-, SARSEP- and SIMPLE-IRAs), and certain other retirement accounts. If you have only business, business retirement, employer-sponsored or American Century Investments Brokerage accounts, you are currently not subject to this fee. If you are subject to the Account Maintenance Fee, your account value could be reduced by the fee amount.
Hypothetical Example for Comparison Purposes
The table also provides information about hypothetical account values and hypothetical expenses based on the actual expense ratio of each class of your fund and an assumed rate of return of 5% per year before expenses, which is not the actual return of a fund’s share class. The hypothetical account values and expenses may not be used to estimate the actual ending account balance or expenses you paid for the period. You may use this information to compare the ongoing costs of investing in your fund and other funds. To do so, compare this 5% hypothetical example with the 5% hypothetical examples that appear in the shareholder reports of the other funds.
Please note that the expenses shown in the table are meant to highlight your ongoing costs only and do not reflect any transactional costs, such as sales charges (loads) or redemption/exchange fees. Therefore, the table is useful in comparing ongoing costs only, and will not help you determine the relative total costs of owning different funds. In addition, if these transactional costs were included, your costs would have been higher.
|
| | | | |
| | Beginning
Account Value
1/1/15 | Ending
Account Value
6/30/15 | Expenses Paid
During Period(1)1/1/15 - 6/30/15 | Annualized
Expense Ratio(1) |
| Actual |
| Investor Class | $1,000 | $1,053.30 | $5.85 | 1.15% |
| Institutional Class | $1,000 | $1,054.50 | $4.84 | 0.95% |
| A Class | $1,000 | $1,053.30 | $7.13 | 1.40% |
| C Class | $1,000 | $1,048.60 | $10.92 | 2.15% |
| R Class | $1,000 | $1,051.00 | $8.39 | 1.65% |
| Hypothetical |
| Investor Class | $1,000 | $1,019.09 | $5.76 | 1.15% |
| Institutional Class | $1,000 | $1,020.08 | $4.76 | 0.95% |
| A Class | $1,000 | $1,017.85 | $7.00 | 1.40% |
| C Class | $1,000 | $1,014.13 | $10.74 | 2.15% |
| R Class | $1,000 | $1,016.61 | $8.25 | 1.65% |
| |
| (1) | Expenses are equal to the class's annualized expense ratio listed in the table above, multiplied by the average account value over the period, multiplied by 181, the number of days in the most recent fiscal half-year, divided by 365, to reflect the one-half year period. |
JUNE 30, 2015
|
| | | | |
| | Shares | Value |
| COMMON STOCKS — 95.3% | | |
| Australia — 5.0% | | |
| Australia & New Zealand Banking Group Ltd. | 7,360 | $ | 182,851 |
|
| BHP Billiton Ltd. | 1,733 | 36,168 |
|
| Coca-Cola Amatil Ltd. | 15,515 | 109,531 |
|
| Commonwealth Bank of Australia | 355 | 23,317 |
|
| Fortescue Metals Group Ltd. | 56,398 | 83,112 |
|
| Lend Lease Group | 21,586 | 250,320 |
|
| National Australia Bank Ltd. | 5,718 | 146,955 |
|
Qantas Airways Ltd.(1) | 1,574 | 3,838 |
|
| Telstra Corp. Ltd. | 68,838 | 326,107 |
|
| Westpac Banking Corp. | 9,528 | 236,345 |
|
| Woodside Petroleum Ltd. | 11,028 | 291,251 |
|
| | | 1,689,795 |
|
| Belgium — 1.9% | | |
| bpost SA | 10,123 | 278,078 |
|
| KBC Groep NV | 5,332 | 356,306 |
|
| | | 634,384 |
|
| Brazil — 0.5% | | |
| JBS SA | 30,100 | 158,482 |
|
| China — 0.7% | | |
China CITIC Bank Corp. Ltd., H Shares(1) | 76,000 | 60,592 |
|
| Industrial & Commercial Bank of China Ltd., H Shares | 242,000 | 192,312 |
|
| | | 252,904 |
|
| Denmark — 1.2% | | |
| Novo Nordisk A/S, B Shares | 1,482 | 80,745 |
|
| Vestas Wind Systems A/S | 6,524 | 325,620 |
|
| | | 406,365 |
|
| Finland — 0.6% | | |
| Orion Oyj, Class B | 3,897 | 136,332 |
|
| UPM-Kymmene Oyj | 3,661 | 64,773 |
|
| | | 201,105 |
|
| France — 7.9% | | |
| AXA SA | 13,452 | 339,381 |
|
| Credit Agricole SA | 14,341 | 213,281 |
|
| Eutelsat Communications SA | 4,896 | 158,018 |
|
| Faurecia | 4,483 | 184,371 |
|
| Metropole Television SA | 12,317 | 239,342 |
|
| Orange SA | 22,063 | 339,684 |
|
Peugeot SA(1) | 10,309 | 211,988 |
|
| Rallye SA | 5,576 | 167,905 |
|
| Safran SA | 4,648 | 315,003 |
|
| Sanofi | 2,869 | 282,236 |
|
|
| | | | |
| | Shares | Value |
| Societe Generale SA | 1,086 | $ | 50,693 |
|
| Valeo SA | 1,084 | 170,821 |
|
| Veolia Environnement SA | 845 | 17,230 |
|
| | | 2,689,953 |
|
| Germany — 7.6% | | |
| Allianz SE | 16 | 2,492 |
|
| Bayer AG | 1,109 | 155,226 |
|
| Continental AG | 814 | 192,614 |
|
| Daimler AG | 1,779 | 161,918 |
|
| Deutsche Telekom AG | 16,750 | 288,509 |
|
Dialog Semiconductor plc(1) | 6,107 | 330,139 |
|
| Duerr AG | 2,222 | 206,995 |
|
| E.ON SE | 13,614 | 181,372 |
|
| Merck KGaA | 1,210 | 120,571 |
|
| Metro AG | 8,599 | 271,109 |
|
| Muenchener Rueckversicherungs-Gesellschaft AG | 200 | 35,452 |
|
Nordex SE(1) | 7,041 | 168,728 |
|
| ProSiebenSat.1 Media AG | 7,514 | 371,100 |
|
| Siemens AG | 767 | 77,257 |
|
| | | 2,563,482 |
|
| Hong Kong — 3.4% | | |
| BOC Hong Kong Holdings Ltd. | 84,500 | 352,104 |
|
| CK Hutchison Holdings Ltd. | 6,500 | 95,510 |
|
| Hang Seng Bank Ltd. | 12,500 | 244,306 |
|
| Link REIT (The) | 33,500 | 196,206 |
|
WH Group Ltd.(1) | 376,500 | 256,454 |
|
| | | 1,144,580 |
|
| India — 0.9% | | |
| Nestle India Ltd. | 3,122 | 311,425 |
|
| Israel — 0.7% | | |
| Bank Hapoalim BM | 25,891 | 139,473 |
|
| Teva Pharmaceutical Industries Ltd. | 1,642 | 97,112 |
|
| | | 236,585 |
|
| Italy — 3.1% | | |
| Assicurazioni Generali SpA | 4,690 | 84,495 |
|
| Enel SpA | 23,237 | 105,281 |
|
| ENI SpA | 25,223 | 447,668 |
|
Fiat Chrysler Automobiles NV(1) | 18,407 | 269,646 |
|
| UnipolSai SpA | 56,641 | 140,311 |
|
| | | 1,047,401 |
|
| Japan — 21.2% | | |
| Alps Electric Co. Ltd. | 2,600 | 80,198 |
|
| Asahi Kasei Corp. | 32,000 | 262,908 |
|
| Bridgestone Corp. | 3,400 | 125,779 |
|
| Canon Marketing Japan, Inc. | 6,600 | 112,332 |
|
| Canon, Inc. | 12,500 | 406,759 |
|
| Central Japan Railway Co. | 2,300 | 415,423 |
|
|
| | | | |
| | Shares | Value |
| Daicel Corp. | 3,200 | $ | 41,103 |
|
| DeNA Co. Ltd. | 2,100 | 41,285 |
|
| Fuji Heavy Industries Ltd. | 9,100 | 335,195 |
|
| FUJIFILM Holdings Corp. | 8,400 | 300,179 |
|
| Honda Motor Co., Ltd. | 3,400 | 110,055 |
|
| Japan Airlines Co. Ltd. | 10,500 | 366,344 |
|
| Japan Tobacco, Inc. | 2,700 | 96,199 |
|
| JX Holdings, Inc. | 71,000 | 306,428 |
|
| Kanamoto Co. Ltd. | 1,800 | 45,667 |
|
| Kao Corp. | 1,900 | 88,383 |
|
| KDDI Corp. | 8,900 | 214,819 |
|
| Kobe Steel Ltd. | 24,000 | 40,397 |
|
| Mitsubishi Chemical Holdings Corp. | 54,900 | 345,634 |
|
| Mitsubishi UFJ Financial Group, Inc. | 25,000 | 179,720 |
|
| Mixi, Inc. | 2,200 | 109,295 |
|
| Mizuho Financial Group, Inc. | 47,900 | 103,718 |
|
| Nippon Telegraph & Telephone Corp. | 2,600 | 94,187 |
|
| NOK Corp. | 2,100 | 65,204 |
|
| Panasonic Corp. | 21,100 | 289,902 |
|
| Seven Bank Ltd. | 72,700 | 336,813 |
|
| Shin-Etsu Chemical Co. Ltd. | 1,900 | 117,973 |
|
Sony Corp.(1) | 14,200 | 401,629 |
|
| Sumitomo Chemical Co. Ltd. | 58,000 | 348,801 |
|
| Sumitomo Heavy Industries Ltd. | 50,000 | 291,702 |
|
| Sumitomo Mitsui Financial Group, Inc. | 2,200 | 98,131 |
|
| Takeda Pharmaceutical Co., Ltd. | 1,600 | 77,277 |
|
| TDK Corp. | 900 | 68,906 |
|
| Teijin Ltd. | 37,000 | 143,604 |
|
| Tokio Marine Holdings, Inc. | 1,900 | 79,083 |
|
| TonenGeneral Sekiyu KK | 7,000 | 65,147 |
|
| Toyota Motor Corp. | 5,700 | 382,049 |
|
| Yamazaki Baking Co. Ltd. | 12,000 | 199,927 |
|
| | | 7,188,155 |
|
| Netherlands — 2.1% | | |
| Heineken Holding NV | 532 | 37,336 |
|
| ING Groep NV CVA | 18,224 | 300,895 |
|
| Koninklijke Ahold NV | 18,763 | 351,421 |
|
| Unilever NV CVA | 819 | 34,107 |
|
| | | 723,759 |
|
| Norway — 0.6% | | |
| TGS Nopec Geophysical Co. ASA | 8,837 | 206,373 |
|
| Portugal — 1.1% | | |
| EDP - Energias de Portugal SA | 93,933 | 356,576 |
|
| Singapore — 1.6% | | |
| Oversea-Chinese Banking Corp. Ltd. | 8,900 | 67,270 |
|
| United Overseas Bank Ltd. | 7,600 | 130,179 |
|
| Yangzijiang Shipbuilding Holdings Ltd. | 324,300 | 340,709 |
|
| | | 538,158 |
|
|
| | | | |
| | Shares | Value |
| South Korea — 0.4% | | |
| SK Hynix, Inc. | 3,349 | $ | 127,001 |
|
| Spain — 2.4% | | |
| Banco Santander SA | 41,605 | 290,545 |
|
| Endesa SA | 15,329 | 293,342 |
|
| Mapfre SA | 17,356 | 59,731 |
|
| Telefonica SA | 10,780 | 153,231 |
|
| | | 796,849 |
|
| Sweden — 3.5% | | |
| Axfood AB | 6,119 | 97,729 |
|
| Electrolux AB | 7,667 | 240,280 |
|
| Investor AB, B Shares | 7,773 | 289,641 |
|
| Kinnevik Investment AB, B Shares | 9,704 | 306,811 |
|
| Peab AB | 36,179 | 267,310 |
|
| | | 1,201,771 |
|
| Switzerland — 8.1% | | |
| Nestle SA | 4,372 | 315,642 |
|
| Novartis AG | 6,353 | 626,161 |
|
| Roche Holding AG | 2,895 | 811,263 |
|
| Swiss Reinsurance Co. | 3,863 | 341,904 |
|
| UBS Group AG | 9,222 | 195,596 |
|
| Zurich Insurance Group AG | 1,470 | 447,470 |
|
| | | 2,738,036 |
|
| Taiwan — 0.9% | | |
| AU Optronics Corp. | 190,000 | 84,056 |
|
| Highwealth Construction Corp. | 22,000 | 52,478 |
|
| Innolux Corp. | 262,000 | 136,713 |
|
Inotera Memories, Inc.(1) | 22,000 | 17,540 |
|
| | | 290,787 |
|
| United Kingdom — 19.9% | | |
| AstraZeneca plc | 5,542 | 349,969 |
|
| Aviva plc | 45,971 | 355,742 |
|
| BHP Billiton plc | 11,254 | 220,859 |
|
| BP plc | 29,489 | 194,675 |
|
| British American Tobacco plc | 1,586 | 85,102 |
|
| British Land Co. plc | 9,051 | 112,847 |
|
| BT Group plc | 49,514 | 350,250 |
|
| Debenhams plc | 118,396 | 166,031 |
|
| Direct Line Insurance Group plc | 55,782 | 294,320 |
|
| Experian plc | 17,836 | 324,808 |
|
| GlaxoSmithKline plc | 8,317 | 172,825 |
|
| Go-Ahead Group plc | 7,947 | 328,900 |
|
| HSBC Holdings plc | 45,559 | 408,104 |
|
| Imperial Tobacco Group plc | 6,858 | 330,489 |
|
| Investec plc | 14,295 | 128,477 |
|
| Land Securities Group plc | 13,603 | 257,339 |
|
| Legal & General Group plc | 93,313 | 364,932 |
|
|
| | | | |
| | Shares | Value |
| Lloyds Banking Group plc | 124,168 | $ | 166,302 |
|
| Man Group plc | 17,861 | 44,032 |
|
| Marks & Spencer Group plc | 43,387 | 365,401 |
|
| Moneysupermarket.com Group plc | 12,627 | 57,775 |
|
| Rio Tinto plc | 6,505 | 267,176 |
|
| Royal Dutch Shell plc, B Shares | 9,226 | 261,949 |
|
| Royal Mail plc | 16,540 | 133,711 |
|
| Shire plc | 3,171 | 253,855 |
|
| Standard Chartered plc | 9,204 | 147,366 |
|
| Vedanta Resources plc | 10,256 | 83,797 |
|
| Vodafone Group plc | 66,590 | 240,491 |
|
| WM Morrison Supermarkets plc | 97,884 | 278,071 |
|
| | | 6,745,595 |
|
TOTAL COMMON STOCKS (Cost $31,518,823) | | 32,249,521 |
|
| EXCHANGE-TRADED FUNDS — 2.6% | | |
| iShares MSCI Japan ETF | 11,995 | 153,656 |
|
| iShares MSCI EAFE ETF | 11,580 | 735,214 |
|
TOTAL EXCHANGE-TRADED FUNDS (Cost $899,649) | | 888,870 |
|
| TEMPORARY CASH INVESTMENTS — 1.9% | | |
Repurchase Agreement, Bank of America Merrill Lynch, (collateralized by various U.S. Treasury obligations, 1.50%, 1/31/19 - 11/30/19, valued at $110,772), in a joint trading account at 0.10%, dated 6/30/15, due 7/1/15 (Delivery value $108,561) | | 108,561 |
|
| Repurchase Agreement, Fixed Income Clearing Corp., (collateralized by various U.S. Treasury obligations, 2.375%, 8/15/24, valued at $445,606), at 0.01%, dated 6/30/15, due 7/1/15 (Delivery value $434,000) | | 434,000 |
|
| State Street Institutional Liquid Reserves Fund, Premier Class | 108,184 | 108,184 |
|
TOTAL TEMPORARY CASH INVESTMENTS (Cost $650,745) | | 650,745 |
|
TOTAL INVESTMENT SECURITIES — 99.8% (Cost $33,069,217) | | 33,789,136 |
|
| OTHER ASSETS AND LIABILITIES — 0.2% | | 71,687 |
|
| TOTAL NET ASSETS — 100.0% | | $ | 33,860,823 |
|
|
| | |
| MARKET SECTOR DIVERSIFICATION | |
| (as a % of net assets) | |
| Financials | 26.2 | % |
| Consumer Discretionary | 13.5 | % |
| Industrials | 11.5 | % |
| Consumer Staples | 9.4 | % |
| Health Care | 9.3 | % |
| Materials | 6.1 | % |
| Telecommunication Services | 5.8 | % |
| Energy | 5.3 | % |
| Information Technology | 5.3 | % |
| Utilities | 2.9 | % |
| Exchange-Traded Funds | 2.6 | % |
| Cash and Equivalents* | 2.1 | % |
| *Includes temporary cash investments and other assets and liabilities. | |
|
| | |
| NOTES TO SCHEDULE OF INVESTMENTS |
| CVA | - | Certificaten Van Aandelen |
See Notes to Financial Statements.
|
|
| Statement of Assets and Liabilities |
|
| | | |
| JUNE 30, 2015 | |
| Assets | |
| Investment securities, at value (cost of $33,069,217) | $ | 33,789,136 |
|
| Foreign currency holdings, at value (cost of $31,135) | 30,928 |
|
| Receivable for capital shares sold | 65,099 |
|
| Dividends and interest receivable | 143,506 |
|
| | 34,028,669 |
|
| | |
| Liabilities | |
| Payable for capital shares redeemed | 132,742 |
|
| Accrued management fees | 31,666 |
|
| Distribution and service fees payable | 2,808 |
|
| Accrued foreign taxes | 630 |
|
| | 167,846 |
|
| | |
| Net Assets | $ | 33,860,823 |
|
| | |
| Net Assets Consist of: | |
| Capital (par value and paid-in surplus) | $ | 35,335,850 |
|
| Undistributed net investment income | 295,161 |
|
| Accumulated net realized loss | (2,488,119 | ) |
| Net unrealized appreciation | 717,931 |
|
| | $ | 33,860,823 |
|
|
| | | | | | |
| | Net Assets | Shares Outstanding | Net Asset Value Per Share |
| Investor Class, $0.01 Par Value |
| $22,365,685 |
| 2,517,043 |
| $8.89 |
| Institutional Class, $0.01 Par Value |
| $1,620,953 |
| 182,029 |
| $8.90 |
| A Class, $0.01 Par Value |
| $8,195,593 |
| 921,733 |
| $8.89* |
| C Class, $0.01 Par Value |
| $1,140,549 |
| 129,050 |
| $8.84 |
| R Class, $0.01 Par Value |
| $538,043 |
| 60,703 |
| $8.86 |
*Maximum offering price $9.43 (net asset value divided by 0.9425).
See Notes to Financial Statements.
|
| | | |
| YEAR ENDED JUNE 30, 2015 |
| Investment Income (Loss) |
| Income: | |
| Dividends (net of foreign taxes withheld of $61,734) | $ | 862,106 |
|
| Interest | 113 |
|
| | 862,219 |
|
| | |
| Expenses: | |
| Management fees | 255,879 |
|
| Distribution and service fees: | |
| A Class | 11,592 |
|
| C Class | 8,331 |
|
| R Class | 2,028 |
|
| Directors' fees and expenses | 1,043 |
|
| Other expenses | 259 |
|
| | 279,132 |
|
| | |
| Net investment income (loss) | 583,087 |
|
| | |
| Realized and Unrealized Gain (Loss) |
| Net realized gain (loss) on: | |
| Investment transactions (net of foreign tax expenses paid (refunded) of $684) | (411,669 | ) |
| Foreign currency transactions | (15,999 | ) |
| | (427,668 | ) |
| | |
| Change in net unrealized appreciation (depreciation) on: | |
| Investments (includes (increase) decrease in accrued foreign taxes of $(630)) | (1,161,418 | ) |
| Translation of assets and liabilities in foreign currencies | (1,886 | ) |
| | (1,163,304 | ) |
| | |
| Net realized and unrealized gain (loss) | (1,590,972 | ) |
| | |
| Net Increase (Decrease) in Net Assets Resulting from Operations | $ | (1,007,885 | ) |
See Notes to Financial Statements.
|
|
| Statement of Changes in Net Assets |
|
| | | | | | |
| YEARS ENDED JUNE 30, 2015 AND JUNE 30, 2014 |
| Increase (Decrease) in Net Assets | June 30, 2015 | June 30, 2014 |
| Operations | | |
| Net investment income (loss) | $ | 583,087 |
| $ | 340,688 |
|
| Net realized gain (loss) | (427,668 | ) | 1,191,470 |
|
| Change in net unrealized appreciation (depreciation) | (1,163,304 | ) | 1,254,477 |
|
| Net increase (decrease) in net assets resulting from operations | (1,007,885 | ) | 2,786,635 |
|
| | | |
| Distributions to Shareholders | | |
| From net investment income: | | |
| Investor Class | (406,457 | ) | (77,129 | ) |
| Institutional Class | (29,164 | ) | (8,863 | ) |
| A Class | (103,878 | ) | (77,654 | ) |
| C Class | (16,337 | ) | (2,727 | ) |
| R Class | (7,243 | ) | (10,425 | ) |
| Decrease in net assets from distributions | (563,079 | ) | (176,798 | ) |
| | | |
| Capital Share Transactions | | |
| Net increase (decrease) in net assets from capital share transactions (Note 5) | 17,157,171 |
| 7,825,443 |
|
| | | |
| Redemption Fees | | |
| Increase in net assets from redemption fees | 7,666 |
| 2,244 |
|
| | | |
| Net increase (decrease) in net assets | 15,593,873 |
| 10,437,524 |
|
| | | |
| Net Assets | | |
| Beginning of period | 18,266,950 |
| 7,829,426 |
|
| End of period | $ | 33,860,823 |
| $ | 18,266,950 |
|
| | | |
| Undistributed net investment income | $ | 295,161 |
| $ | 284,153 |
|
See Notes to Financial Statements.
|
|
| Notes to Financial Statements |
JUNE 30, 2015
1. Organization
American Century Quantitative Equity Funds, Inc. (the corporation) is registered under the Investment Company Act of 1940, as amended (the 1940 Act), as an open-end management investment company and is organized as a Maryland corporation. International Core Equity Fund (the fund) is one fund in a series issued by the corporation. The fund is diversified as defined under the 1940 Act. The fund’s investment objective is to seek long-term capital growth.
The fund offers the Investor Class, the Institutional Class, the A Class, the C Class and the R Class. The A Class may incur an initial sales charge. The A Class and C Class may be subject to a contingent deferred sales charge. The share classes differ principally in their respective sales charges and distribution and shareholder servicing expenses and arrangements. The Institutional Class is made available to institutional shareholders or through financial intermediaries whose clients do not require the same level of shareholder and administrative services as shareholders of other classes. As a result, the Institutional Class is charged a lower unified management fee.
2. Significant Accounting Policies
The following is a summary of significant accounting policies consistently followed by the fund in preparation of its financial statements. The fund is an investment company and follows accounting and reporting guidance in accordance with accounting principles generally accepted in the United States of America. This may require management to make certain estimates and assumptions at the date of the financial statements. Actual results could differ from these estimates. Management evaluated the impact of events or transactions occurring through the date the financial statements were issued that would merit recognition or disclosure.
Investment Valuations — The fund determines the fair value of its investments and computes its net asset value per share at the close of regular trading (usually 4 p.m. Eastern time) on the New York Stock Exchange (NYSE) on each day the NYSE is open. The Board of Directors has adopted valuation policies and procedures to guide the investment advisor in the fund’s investment valuation process and to provide methodologies for the oversight of the fund’s pricing function.
Equity securities that are listed or traded on a domestic securities exchange are valued at the last reported sales price or at the official closing price as provided by the exchange. Equity securities traded on foreign securities exchanges are generally valued at the closing price of such securities on the exchange where primarily traded or at the close of the NYSE, if that is earlier. If no last sales price is reported, or if local convention or regulation so provides, the mean of the latest bid and asked prices may be used. Securities traded over-the-counter are valued at the mean of the latest bid and asked prices, the last sales price, or the official closing price. Equity securities initially expressed in local currencies are translated into U.S. dollars at the mean of the appropriate currency exchange rate at the close of the NYSE as provided by an independent pricing service.
Fixed income securities maturing within 60 days at the time of purchase may be valued at cost, plus or minus any amortized discount or premium or at the evaluated mean as provided by an independent pricing service. Evaluated mean prices are commonly derived through utilization of market models, which may consider, among other factors: trade data, quotations from dealers and active market makers, relevant yield curve and spread data, related sector levels, creditworthiness, trade data or market information on comparable securities, and other relevant security specific information.
Open-end management investment companies are valued at the reported net asset value per share. Repurchase agreements are valued at cost, which approximates fair value.
If the fund determines that the market price for an investment is not readily available or the valuation methods mentioned above do not reflect an investment’s fair value, such investment is valued as determined in good faith by the Board of Directors or its delegate, in accordance with policies and procedures adopted by the Board of Directors. In its determination of fair value, the fund may review several factors including, but not limited to, market information regarding the specific investment or comparable investments and correlation with other investment types, futures indices or general market indicators. Circumstances that may cause the fund to use these procedures to value an investment include, but are not limited to: an investment has been
declared in default or is distressed; trading in a security has been suspended during the trading day or a security is not actively trading on its principal exchange; prices received from a regular pricing source are deemed unreliable; or there is a foreign market holiday and no trading occurred.
The fund monitors for significant events occurring after the close of an investment’s primary exchange but before the fund’s net asset value per share is determined. Significant events may include, but are not limited to: corporate announcements and transactions; governmental action and political unrest that could impact a specific investment or an investment sector; or armed conflicts, natural disasters and similar events that could affect investments in a specific country or region. The fund also monitors for significant fluctuations between domestic and foreign markets, as evidenced by the U.S. market or such other indicators that the Board of Directors, or its delegate, deems appropriate. If significant fluctuations in foreign markets are identified, the fund may apply a model-derived factor to the closing price of equity securities traded on foreign securities exchanges. The factor is based on observable market data as provided by an independent pricing service.
Security Transactions — Security transactions are accounted for as of the trade date. Net realized gains and losses are determined on the identified cost basis, which is also used for federal income tax purposes. Certain countries impose taxes on realized gains on the sale of securities registered in their country. The fund records the foreign tax expense, if any, on an accrual basis. The foreign tax expense on realized gains and unrealized appreciation reduces the net realized gain (loss) on investment transactions and net unrealized appreciation (depreciation) on investments, respectively.
Investment Income — Dividend income less foreign taxes withheld, if any, is recorded as of the ex-dividend date. Distributions received on securities that represent a return of capital or long-term capital gain are recorded as a reduction of cost of investments and/or as a realized gain. The fund may estimate the components of distributions received that may be considered nontaxable distributions or long-term capital gain distributions for income tax purposes. Interest income is recorded on the accrual basis and includes accretion of discounts and amortization of premiums.
Foreign Currency Translations — All assets and liabilities initially expressed in foreign currencies are translated into U.S. dollars at prevailing exchange rates at period end. The fund may enter into spot foreign currency exchange contracts to facilitate transactions denominated in a foreign currency. Purchases and sales of investment securities, dividend and interest income, spot foreign currency exchange contracts, and expenses are translated at the rates of exchange prevailing on the respective dates of such transactions. Net realized and unrealized foreign currency exchange gains or losses related to investment securities are a component of net realized gain (loss) on investment transactions and change in net unrealized appreciation (depreciation) on investments, respectively.
Repurchase Agreements — The fund may enter into repurchase agreements with institutions that American Century Investment Management, Inc. (ACIM) (the investment advisor) has determined are creditworthy pursuant to criteria adopted by the Board of Directors. The fund requires that the collateral, represented by securities, received in a repurchase transaction be transferred to the custodian in a manner sufficient to enable the fund to obtain those securities in the event of a default under the repurchase agreement. ACIM monitors, on a daily basis, the securities transferred to ensure the value, including accrued interest, of the securities under each repurchase agreement is equal to or greater than amounts owed to the fund under each repurchase agreement.
Joint Trading Account — Pursuant to an Exemptive Order issued by the Securities and Exchange Commission, the fund, along with certain other funds in the American Century Investments family of funds, may transfer uninvested cash balances into a joint trading account. These balances are invested in one or more repurchase agreements that are collateralized by U.S. Treasury or Agency obligations.
Income Tax Status — It is the fund’s policy to distribute substantially all net investment income and net realized gains to shareholders and to otherwise qualify as a regulated investment company under provisions of the Internal Revenue Code. Accordingly, no provision has been made for income taxes. The fund files U.S. federal, state, local and non-U.S. tax returns as applicable. The fund's tax returns are subject to examination by the relevant taxing authority until expiration of the applicable statute of limitations, which is generally three years from the date of filing but can be longer in certain jurisdictions. At this time, management believes there are no uncertain tax positions which, based on their technical merit, would not be sustained upon examination and for which it is reasonably possible that the total amounts of unrecognized tax benefits will significantly change in the next twelve months.
Multiple Class — All shares of the fund represent an equal pro rata interest in the net assets of the class to which such shares belong, and have identical voting, dividend, liquidation and other rights and the same terms and conditions, except for class specific expenses and exclusive rights to vote on matters affecting only individual classes. Income, non-class specific expenses, and realized and unrealized capital gains and losses of the fund are allocated to each class of shares based on their relative net assets.
Distributions to Shareholders — Distributions from net investment income and net realized gains, if any, are generally declared and paid annually.
Redemption Fees — The fund may impose a 2.00% redemption fee on shares held less than 60 days. The fee may not be applicable to all classes. The redemption fee is retained by the fund and helps cover transaction costs that long-term investors may bear when the fund sells securities to meet investor redemptions.
Indemnifications — Under the corporation’s organizational documents, its officers and directors are indemnified against certain liabilities arising out of the performance of their duties to the fund. In addition, in the normal course of business, the fund enters into contracts that provide general indemnifications. The maximum exposure under these arrangements is unknown as this would involve future claims that may be made against a fund. The risk of material loss from such claims is considered by management to be remote.
3. Fees and Transactions with Related Parties
Certain officers and directors of the corporation are also officers and/or directors of American Century Companies, Inc. (ACC). The corporation’s investment advisor, ACIM, the corporation's distributor, American Century Investment Services, Inc. (ACIS), and the corporation’s transfer agent, American Century Services, LLC, are wholly owned, directly or indirectly, by ACC.
Management Fees — The corporation has entered into a management agreement with ACIM, under which ACIM provides the fund with investment advisory and management services in exchange for a single, unified management fee (the fee) per class. The agreement provides that all expenses of managing and operating the fund, except distribution and service fees, brokerage expenses, taxes, interest, fees and expenses of the independent directors (including legal counsel fees), and extraordinary expenses, will be paid by ACIM. The fee is computed and accrued daily based on each class's daily net assets and paid monthly in arrears. The fee consists of (1) an Investment Category Fee based on the daily net assets of the fund and certain other accounts managed by the investment advisor that are in the same broad investment category as the fund and (2) a Complex Fee based on the assets of all the funds in the American Century Investments family of funds. The rates for the Investment Category Fee range from 0.8180% to 1.0000%. The rates for the Complex Fee range from 0.2500% to 0.3100% for the Investor Class, A Class, C Class and R Class. The rates for the Complex Fee range from 0.0500% to 0.1100% for the Institutional Class. The effective annual management fee for each class for the year ended June 30, 2015 was 1.14% for the Investor Class, A Class, C Class and R Class and 0.94% for the Institutional Class.
Distribution and Service Fees — The Board of Directors has adopted a separate Master Distribution and Individual Shareholder Services Plan for each of the A Class, C Class and R Class (collectively the plans), pursuant to Rule 12b-1 of the 1940 Act. The plans provide that the A Class will pay ACIS an annual distribution and service fee of 0.25%. The plans provide that the C Class will pay ACIS an annual distribution and service fee of 1.00%, of which 0.25% is paid for individual shareholder services and 0.75% is paid for distribution services. The plans provide that the R Class will pay ACIS an annual distribution and service fee of 0.50%. The fees are computed and accrued daily based on each class’s daily net assets and paid monthly in arrears. The fees are used to pay financial intermediaries for distribution and individual shareholder services. Fees incurred under the plans during the year ended June 30, 2015 are detailed in the Statement of Operations.
Directors' Fees and Expenses — The Board of Directors is responsible for overseeing the investment advisor’s management and operations of the fund. The directors receive detailed information about the fund and its investment advisor regularly throughout the year, and meet at least quarterly with management of the investment advisor to review reports about fund operations. The fund’s officers do not receive compensation from the fund.
Acquired Fund Fees and Expenses — The fund may invest in mutual funds, exchange-traded funds, and business development companies (the acquired funds). The fund will indirectly realize its pro rata share of the fees and expenses of the acquired funds in which it invests. These indirect fees and expenses are not paid out of the fund's assets but are reflected in the return realized by the fund on its investment in the acquired funds.
4. Investment Transactions
Purchases and sales of investment securities, excluding short-term investments, for the year ended June 30, 2015 were $38,451,273 and $21,788,563, respectively.
5. Capital Share Transactions
Transactions in shares of the fund were as follows:
|
| | | | | | | | | | |
| | Year ended
June 30, 2015 | Year ended June 30, 2014 |
| | Shares | Amount | Shares | Amount |
| Investor Class/Shares Authorized | 40,000,000 |
| | 10,000,000 |
| |
| Sold | 1,924,053 |
| $ | 17,329,540 |
| 994,691 |
| $ | 8,981,121 |
|
| Issued in reinvestment of distributions | 47,144 |
| 395,534 |
| 8,579 |
| 75,069 |
|
| Redeemed | (679,341 | ) | (6,153,477 | ) | (194,251 | ) | (1,738,719 | ) |
| | 1,291,856 |
| 11,571,597 |
| 809,019 |
| 7,317,471 |
|
| Institutional Class/Shares Authorized | 30,000,000 |
| | 10,000,000 |
| |
| Sold | 128,621 |
| 1,147,409 |
| 61,382 |
| 571,684 |
|
| Issued in reinvestment of distributions | 3,476 |
| 29,164 |
| 1,013 |
| 8,863 |
|
| Redeemed | (45,068 | ) | (427,394 | ) | (32,166 | ) | (310,273 | ) |
| | 87,029 |
| 749,179 |
| 30,229 |
| 270,274 |
|
| A Class/Shares Authorized | 20,000,000 |
| | 10,000,000 |
| |
| Sold | 777,883 |
| 7,045,308 |
| 916,070 |
| 8,154,414 |
|
| Issued in reinvestment of distributions | 12,262 |
| 102,876 |
| 8,866 |
| 77,574 |
|
| Redeemed | (195,594 | ) | (1,774,912 | ) | (876,480 | ) | (7,879,965 | ) |
| | 594,551 |
| 5,373,272 |
| 48,456 |
| 352,023 |
|
| C Class/Shares Authorized | 20,000,000 |
| | 10,000,000 |
| |
| Sold | 79,712 |
| 722,985 |
| 18,605 |
| 171,940 |
|
| Issued in reinvestment of distributions | 1,806 |
| 15,136 |
| 312 |
| 2,727 |
|
| Redeemed | (64,906 | ) | (604,859 | ) | (32,628 | ) | (308,683 | ) |
| | 16,612 |
| 133,262 |
| (13,711 | ) | (134,016 | ) |
| R Class/Shares Authorized | 15,000,000 |
| | 10,000,000 |
| |
| Sold | 57,990 |
| 531,779 |
| 39,531 |
| 349,832 |
|
| Issued in reinvestment of distributions | 864 |
| 7,243 |
| 1,193 |
| 10,425 |
|
| Redeemed | (126,841 | ) | (1,209,161 | ) | (35,560 | ) | (340,566 | ) |
| | (67,987 | ) | (670,139 | ) | 5,164 |
| 19,691 |
|
| Net increase (decrease) | 1,922,061 |
| $ | 17,157,171 |
| 879,157 |
| $ | 7,825,443 |
|
6. Fair Value Measurements
The fund’s investments valuation process is based on several considerations and may use multiple inputs to determine the fair value of the investments held by the fund. In conformity with accounting principles generally accepted in the United States of America, the inputs used to determine a valuation are classified into three broad levels.
| |
| • | Level 1 valuation inputs consist of unadjusted quoted prices in an active market for identical investments. |
| |
| • | Level 2 valuation inputs consist of direct or indirect observable market data (including quoted prices for comparable investments, evaluations of subsequent market events, interest rates, prepayment speeds, credit risk, etc.). These inputs also consist of quoted prices for identical investments initially expressed in local currencies that are adjusted through translation into U.S. dollars. |
| |
| • | Level 3 valuation inputs consist of unobservable data (including a fund’s own assumptions). |
The level classification is based on the lowest level input that is significant to the fair valuation measurement. The valuation inputs are not necessarily an indication of the risks associated with investing in these securities or other financial instruments. There were no significant transfers between levels during the period.
The following is a summary of the level classifications as of period end. The Schedule of Investments provides additional information on the fund’s portfolio holdings.
|
| | | | | | | | |
| | Level 1 | Level 2 | Level 3 |
| Assets | | | |
| Investment Securities | | | |
| Common Stocks | — |
| $ | 32,249,521 |
| — |
|
| Exchange-Traded Funds | $ | 888,870 |
| — |
| — |
|
| Temporary Cash Investments | 108,184 |
| 542,561 |
| — |
|
| | $ | 997,054 |
| $ | 32,792,082 |
| — |
|
7. Risk Factors
There are certain risks involved in investing in foreign securities. These risks include those resulting from future adverse political, social and economic developments, fluctuations in currency exchange rates, the possible imposition of exchange controls, and other foreign laws or restrictions. Investing in emerging markets may accentuate these risks.
8. Federal Tax Information
The tax character of distributions paid during the years ended June 30, 2015 and June 30, 2014 were as follows:
|
| | | | | | |
| | 2015 | 2014 |
| Distributions Paid From | | |
| Ordinary income | $ | 563,079 |
| $ | 176,798 |
|
| Long-term capital gains | — |
| — |
|
The book-basis character of distributions made during the year from net investment income or net realized gains may differ from their ultimate characterization for federal income tax purposes. These differences reflect the differing character of certain income items and net realized gains and losses for financial statement and tax purposes, and may result in reclassification among certain capital accounts on the financial statements.
As of June 30, 2015, the federal tax cost of investments and the components of distributable earnings on a tax-basis were as follows:
|
| | | |
| Federal tax cost of investments | $ | 33,204,391 |
|
| Gross tax appreciation of investments | $ | 1,945,865 |
|
| Gross tax depreciation of investments | (1,361,120 | ) |
| Net tax appreciation (depreciation) of investments | 584,745 |
|
| Net tax appreciation (depreciation) on translation of assets and liabilities in foreign currencies | (1,988 | ) |
| Net tax appreciation (depreciation) | $ | 582,757 |
|
| Undistributed ordinary income | $ | 357,445 |
|
| Accumulated short-term capital losses | $ | (2,163,061 | ) |
Post-October capital loss deferral
| $ | (252,168 | ) |
The difference between book-basis and tax-basis unrealized appreciation (depreciation) is attributable primarily to the tax deferral of losses on wash sales.
Accumulated capital losses represent net capital loss carryovers that may be used to offset future realized capital gains for federal income tax purposes. As a result of a shift in ownership of the fund, the utilization of current capital loss carryovers are limited. Any remaining accumulated gains after application of this limitation will be distributed to shareholders. Any unlimited losses will be required to be utilized prior to the losses which carry an expiration date. Future capital loss carryover utilization in any given year may be subject to Internal Revenue Code limitations. Capital loss carryovers expire as follows:
|
| | |
| 2017 | 2018 | Unlimited |
| $(47,669) | $(1,979,923) | $(135,469) |
Loss deferrals represent certain qualified losses that the fund has elected to treat as having been incurred in the following fiscal year for federal income tax purposes.
|
| | | | | | | | | | | | | |
| For a Share Outstanding Throughout the Years Ended June 30 (except as noted) |
| Per-Share Data | | | Ratios and Supplemental Data | | |
| | | Income From Investment Operations: | | | | Ratio to Average Net Assets of: | | |
| | Net Asset Value, Beginning of Period | Net Investment Income (Loss)(1) | Net Realized and Unrealized Gain (Loss) | Total From Investment Operations | Distributions From Net Investment Income | Net Asset Value, End of Period | Total Return(2) | Operating Expenses | Net Investment Income (Loss) | Portfolio Turnover Rate | Net Assets, End of Period (in thousands) |
| Investor Class | | | | | | | |
| 2015 | $9.68 | 0.24 | (0.75) | (0.51) | (0.28) | $8.89 | (5.11)% | 1.15% | 2.67% | 96% |
| $22,366 |
|
| 2014 | $7.77 | 0.26 | 1.76 | 2.02 | (0.11) | $9.68 | 26.15% | 1.15% | 2.61% | 125% |
| $11,859 |
|
| 2013 | $6.66 | 0.22 | 1.13 | 1.35 | (0.24) | $7.77 | 20.60% | 1.16% | 2.85% | 101% |
| $3,233 |
|
| 2012 | $8.08 | 0.15 | (1.43) | (1.28) | (0.14) | $6.66 | (15.68)% | 1.18% | 2.42% | 113% |
| $1,917 |
|
| 2011 | $5.95 | 0.20 | 2.05 | 2.25 | (0.12) | $8.08 | 38.09% | 1.18% | 2.53% | 77% |
| $2,755 |
|
| Institutional Class | | | | | | | |
| 2015 | $9.69 | 0.26 | (0.75) | (0.49) | (0.30) | $8.90 | (4.91)% | 0.95% | 2.87% | 96% |
| $1,621 |
|
| 2014 | $7.78 | 0.28 | 1.76 | 2.04 | (0.13) | $9.69 | 26.37% | 0.95% | 2.81% | 125% |
| $921 |
|
| 2013 | $6.67 | 0.22 | 1.15 | 1.37 | (0.26) | $7.78 | 20.81% | 0.96% | 3.05% | 101% |
| $504 |
|
| 2012 | $8.10 | 0.18 | (1.45) | (1.27) | (0.16) | $6.67 | (15.59)% | 0.98% | 2.62% | 113% |
| $419 |
|
| 2011 | $5.96 | 0.21 | 2.07 | 2.28 | (0.14) | $8.10 | 38.47% | 0.98% | 2.73% | 77% |
| $1,116 |
|
| A Class | | | | | | | | | |
| 2015 | $9.67 | 0.24 | (0.76) | (0.52) | (0.26) | $8.89 | (5.25)% | 1.40% | 2.42% | 96% |
| $8,196 |
|
| 2014 | $7.76 | 0.16 | 1.84 | 2.00 | (0.09) | $9.67 | 25.87% | 1.40% | 2.36% | 125% |
| $3,164 |
|
| 2013 | $6.65 | 0.19 | 1.15 | 1.34 | (0.23) | $7.76 | 20.34% | 1.41% | 2.60% | 101% |
| $2,162 |
|
| 2012 | $8.07 | 0.18 | (1.47) | (1.29) | (0.13) | $6.65 | (15.92)% | 1.43% | 2.17% | 113% |
| $1,845 |
|
| 2011 | $5.94 | 0.16 | 2.08 | 2.24 | (0.11) | $8.07 | 37.80% | 1.43% | 2.28% | 77% |
| $1,019 |
|
|
| | | | | | | | | | | | | |
| For a Share Outstanding Throughout the Years Ended June 30 (except as noted) |
| Per-Share Data | | | Ratios and Supplemental Data | | |
| | | Income From Investment Operations: | | | | Ratio to Average Net Assets of: | | |
| | Net Asset Value, Beginning of Period | Net Investment Income (Loss)(1) | Net Realized and Unrealized Gain (Loss) | Total From Investment Operations | Distributions From Net Investment Income | Net Asset Value, End of Period | Total Return(2) | Operating Expenses | Net Investment Income (Loss) | Portfolio Turnover Rate | Net Assets, End of Period (in thousands) |
| C Class | | | | | | | |
| 2015 | $9.62 | 0.13 | (0.72) | (0.59) | (0.19) | $8.84 | (6.02)% | 2.15% | 1.67% | 96% |
| $1,141 |
|
| 2014 | $7.72 | 0.14 | 1.78 | 1.92 | (0.02) | $9.62 | 24.92% | 2.15% | 1.61% | 125% |
| $1,081 |
|
| 2013 | $6.62 | 0.14 | 1.13 | 1.27 | (0.17) | $7.72 | 19.40% | 2.16% | 1.85% | 101% |
| $974 |
|
| 2012 | $8.04 | 0.11 | (1.45) | (1.34) | (0.08) | $6.62 | (16.62)% | 2.18% | 1.42% | 113% |
| $698 |
|
| 2011 | $5.92 | 0.11 | 2.06 | 2.17 | (0.05) | $8.04 | 36.72% | 2.18% | 1.53% | 77% |
| $956 |
|
| R Class | | | | | | | |
| 2015 | $9.65 | 0.16 | (0.72) | (0.56) | (0.23) | $8.86 | (5.61)% | 1.65% | 2.17% | 96% |
| $538 |
|
| 2014 | $7.74 | 0.19 | 1.79 | 1.98 | (0.07) | $9.65 | 25.62% | 1.65% | 2.11% | 125% |
| $1,242 |
|
| 2013 | $6.64 | 0.17 | 1.14 | 1.31 | (0.21) | $7.74 | 19.93% | 1.66% | 2.35% | 101% |
| $956 |
|
| 2012 | $8.06 | 0.14 | (1.45) | (1.31) | (0.11) | $6.64 | (16.15)% | 1.68% | 1.92% | 113% |
| $795 |
|
| 2011 | $5.93 | 0.15 | 2.07 | 2.22 | (0.09) | $8.06 | 37.52% | 1.68% | 2.03% | 77% |
| $988 |
|
|
|
| Notes to Financial Highlights |
| |
| (1) | Computed using average shares outstanding throughout the period. |
| |
| (2) | Total returns are calculated based on the net asset value of the last business day and do not reflect applicable sales charges, if any. Total returns for periods less than one year are not annualized. |
See Notes to Financial Statements.
|
|
| Report of Independent Registered Public Accounting Firm |
To the Directors of the American Century Quantitative Equity Funds, Inc. and Shareholders of the International Core Equity Fund:
In our opinion, the accompanying statement of assets and liabilities, including the schedule of investments, and the related statements of operations and of changes in net assets and the financial highlights present fairly, in all material respects, the financial position of the International Core Equity Fund (one of the sixteen funds comprising the American Century Quantitative Equity Funds, Inc., hereafter referred to as the “Fund”) at June 30, 2015, the results of its operations for the year then ended, the changes in its net assets for each of the two years in the period then ended and the financial highlights for each of the five years in the period then ended, in conformity with accounting principles generally accepted in the United States of America. These financial statements and financial highlights (hereafter referred to as "financial statements") are the responsibility of the Fund's management. Our responsibility is to express an opinion on these financial statements based on our audits. We conducted our audits of these financial statements in accordance with the standards of the Public Company Accounting Oversight Board (United States). Those standards require that we plan and perform the audit to obtain reasonable assurance about whether the financial statements are free of material misstatement. An audit includes examining, on a test basis, evidence supporting the amounts and disclosures in the financial statements, assessing the accounting principles used and significant estimates made by management, and evaluating the overall financial statement presentation. We believe that our audits, which included confirmation of securities at June 30, 2015 by correspondence with the custodian and brokers, provide a reasonable basis for our opinion.
PricewaterhouseCoopers LLP
Kansas City, Missouri
August 21, 2015
Board of Directors
The individuals listed below serve as directors of the funds. Each director will continue to serve in this capacity until death, retirement, resignation or removal from office. The board has adopted a mandatory retirement age for directors who are not “interested persons,” as that term is defined in the Investment Company Act (independent directors). Independent directors shall retire on December 31 of the year in which they reach their 75th birthday; provided, however, that on or after January 1, 2022, independent directors shall retire on December 31 of the year in which they reach their 76th birthday.
Mr. Thomas is an “interested person” because he currently serves as President and Chief Executive Officer of American Century Companies, Inc. (ACC), the parent company of American Century Investment Management, Inc. (ACIM or the advisor). The other directors (more than three-fourths of the total number) are independent. They are not employees, directors or officers of, and have no financial interest in, ACC or any of its wholly owned, direct or indirect, subsidiaries, including ACIM, American Century Investment Services, Inc. (ACIS) and American Century Services, LLC (ACS), and they do not have any other affiliations, positions or relationships that would cause them to be considered “interested persons” under the Investment Company Act. The directors serve in this capacity for eight (in the case of Mr. Thomas, 15) registered investment companies in the American Century Investments family of funds.
The following table presents additional information about the directors. The mailing address for each director other than Mr. Thomas is 1665 Charleston Road, Mountain View, California 94043. The mailing address for Mr. Thomas is 4500 Main Street, Kansas City, Missouri 64111.
|
| | | | | |
Name (Year of Birth) | Position(s) Held with Funds | Length of Time Served | Principal Occupation(s) During Past 5 Years | Number of American Century Portfolios Overseen by Director | Other Directorships Held During Past 5 Years |
Independent Directors | | |
Tanya S. Beder
(1955) | Director | Since 2011 | Chairman and CEO, SBCC Group Inc. (independent advisory services) (2006 to present) | 46 | CYS Investments, Inc. (NYSE mortgage arbitrage REIT) |
Jeremy I. Bulow
(1954) | Director | Since 2011 | Professor of Economics, Stanford University, Graduate School of Business (1979 to present) | 46 | None |
Ronald J. Gilson
(1946) | Director and Chairman of the Board | Since 1995
(Chairman since 2005) | Charles J. Meyers Professor of Law and Business, Stanford Law School (1979 to present); Marc and Eva Stern Professor of Law and Business, Columbia University School of Law (1992 to present) | 46 | None |
Frederick L. A. Grauer
(1946) | Director | Since 2008 | Senior Advisor, BlackRock, Inc. (investment management firm) (2010 to 2011, 2013 to present) | 46 | None |
Peter F. Pervere
(1947) | Director | Since 2007 | Retired | 46 | None |
|
| | | | | |
Name (Year of Birth) | Position(s) Held with Funds | Length of Time Served | Principal Occupation(s) During Past 5 Years | Number of American Century Portfolios Overseen by Director | Other Directorships Held During Past 5 Years |
| Independent Directors | | |
John B. Shoven
(1947) | Director | Since 2002 | Professor of Economics, Stanford University (1973 to present) | 46 | Cadence Design Systems; Exponent; Financial Engines |
| Interested Director | | |
Jonathan S. Thomas
(1963) | Director and President | Since 2007 | President and Chief Executive Officer, ACC (March 2007 to present). Also serves as Chief Executive Officer, ACS; Executive Vice President, ACIM; Director, ACC, ACIM and other ACC subsidiaries | 124 | BioMed Valley Discoveries, Inc. |
The Statement of Additional Information has additional information about the fund's directors and is available without charge, upon request, by calling 1-800-345-2021.
Officers
The following table presents certain information about the executive officers of the funds. Each officer serves as an officer for each of the 15 investment companies in the American Century family of funds, unless otherwise noted. No officer is compensated for his or her service as an officer of the funds. The listed officers are interested persons of the funds and are appointed or re-appointed on an annual basis. The mailing address for each of the officers listed below is 4500 Main Street, Kansas City, Missouri 64111.
|
| | |
Name (Year of Birth) | Offices with
the Funds | Principal Occupation(s) During the Past Five Years |
Jonathan S.
Thomas
(1963) | Director and President
since 2007 | President and Chief Executive Officer, ACC (March 2007 to present). Also serves as Chief Executive Officer, ACS; Executive Vice President, ACIM; Director, ACC, ACIM and other ACC subsidiaries |
Amy D. Shelton
(1964) | Chief Compliance Officer and Vice President since 2014 | Chief Compliance Officer, American Century funds, (March 2014 to present); Chief Compliance Officer, ACIM (February 2014 to present); Chief Compliance Officer, ACIS (October 2009 to present); Vice President, Client Interactions and Marketing, ACIS (February 2013 to January 2014); Director, Client Interactions and Marketing, ACIS (June 2007 to January 2013). Also serves as Vice President, ACIS |
Charles A. Etherington
(1957) | General Counsel since 2007 and Senior Vice President since 2006 | Attorney, ACC (February 1994 to present); Vice President, ACC (November 2005 to present); General Counsel, ACC (March 2007 to present). Also serves as General Counsel, ACIM, ACS, ACIS and other ACC subsidiaries; and Senior Vice President, ACIM and ACS |
C. Jean Wade
(1964) | Vice President,
Treasurer and
Chief Financial
Officer since 2012 | Vice President, ACS (February 2000 to present) |
Robert J. Leach
(1966) | Vice President
since 2006 and
Assistant Treasurer
since 2012 | Vice President, ACS (February 2000 to present) |
David H. Reinmiller
(1963) | Vice President since 2001 | Attorney, ACC (January 1994 to present); Associate General Counsel, ACC (January 2001 to present). Also serves as Vice President, ACIM and ACS |
Ward D. Stauffer
(1960) | Secretary since 2005 | Attorney, ACC (June 2003 to present) |
|
|
| Approval of Management Agreement |
At a meeting held on June 16, 2015, the Fund’s Board of Directors unanimously approved the renewal of the management agreement pursuant to which American Century Investment Management, Inc. (the “Advisor”) acts as the investment advisor for the Fund. Under Section 15(c) of the Investment Company Act, contracts for investment advisory services are required to be reviewed, evaluated, and approved by a majority of a fund’s directors/trustees, including a majority of the independent Directors, each year. The Board regards this annual evaluation and renewal as one of its most important responsibilities.
The independent Directors have memorialized a statement regarding the relationship between their ongoing obligations to oversee and evaluate the performance of the Advisor and their annual consideration of renewal of the management agreement. In that statement, the independent Directors noted that their assessment of the Advisor’s performance is an ongoing process that takes place over the entire year and is informed by all of the extensive information that the Board and its committees receive and consider over time. This information, together with the materials provided in connection with the review, are central to the Board’s assessment of the Advisor’s performance and its determination whether to renew the Fund’s management agreement.
Prior to its consideration of the renewal of the management agreement, the Board requested and reviewed extensive data and analysis relating to the proposed renewal. This information and analysis was compiled by the Advisor and certain independent providers of evaluation data concerning the Fund and the services provided to the Fund by the Advisor.
In connection with its consideration of the renewal of the management agreement, the Board’s review and evaluation of the services provided by the Advisor included, but was not limited to, the following:
| |
| • | the nature, extent, and quality of investment management, shareholder services, and other services provided by the Advisor to the Fund; |
| |
| • | the wide range of other programs and services the Advisor provides to the Fund and its shareholders on a routine and non-routine basis; |
| |
| • | the investment performance of the Fund, including data comparing the Fund’s performance to appropriate benchmarks and/or a peer group of other mutual funds with similar investment objectives and strategies; |
| |
| • | the cost of owning the Fund compared to the cost of owning similar funds; |
| |
| • | the Advisor’s compliance policies, procedures, and regulatory experience; |
| |
| • | financial data showing the cost of services provided to the Fund, the profitability of the Fund to the Advisor, and the overall profitability of the Advisor; |
| |
| • | possible economies of scale associated with the Advisor’s management of the Fund and other accounts under its management; |
| |
| • | data comparing services provided and charges to other investment management clients of the Advisor; |
| |
| • | acquired fund fees and expenses; |
| |
| • | payments by the Fund and the Advisor to financial intermediaries whose clients are investors in the Fund; and |
| |
| • | any collateral benefits derived by the Advisor from the management of the Fund. |
In keeping with its practice, the Board held two in-person meetings to review and discuss the information provided in response to their request. The independent Directors also had the benefit of the advice of their independent counsel throughout the process.
Factors Considered
The Directors considered all of the information provided by the Advisor, the independent data providers, and the independent Directors’ independent counsel in connection with the review, and evaluated such information for the Fund. In connection with their review, the Directors did not identify any single factor as being all-important or controlling and each Director may have attributed different levels of importance to different factors. In deciding to renew the management agreement, the Board based its decision on a number of factors, including the following:
Nature, Extent and Quality of Services - Generally. Under the management agreement, the Advisor is responsible for providing or arranging for all services necessary for the operation of the Fund. The Board noted that under the management agreement, the Advisor provides or arranges at its own expense a wide variety of services including:
| |
| • | constructing and designing the Fund |
| |
| • | portfolio research and security selection |
| |
| • | initial capitalization/funding |
| |
| • | daily valuation of the Fund’s portfolio |
| |
| • | shareholder servicing and transfer agency, including shareholder confirmations, recordkeeping, and communications |
| |
| • | legal services (except the independent Directors’ counsel) |
| |
| • | regulatory and portfolio compliance |
| |
| • | marketing and distribution (except amounts paid by the Fund under Rule 12b-1 plans) |
The Board noted that many of these services have expanded over time both in terms of quantity and complexity in response to shareholder demands, competition in the industry, changing distribution channels, and the changing regulatory environment.
Investment Management, Shareholder, and Other Services. The nature of the investment management services provided to the Fund is quite complex and allows Fund shareholders access to professional money management, instant diversification of their investments within an asset class, the opportunity to easily diversify among asset classes by investing in or exchanging among various American Century Investments funds, and liquidity. In evaluating investment performance, the Board expects the Advisor to manage the Fund in accordance with its investment objectives and approved strategies. Further, the Directors recognize that the Advisor has an obligation to seek the best execution of fund trades. In providing these services, the Advisor utilizes teams of investment professionals (portfolio managers, analysts, research assistants, and securities traders) who require extensive information technology, research, training, compliance, and other systems to conduct their business. The Board, directly and through its Portfolio Committee, regularly reviews investment performance information for the Fund, together with comparative information for appropriate benchmarks and/or peer groups of similarly-managed funds, over different time horizons. The Directors also review detailed performance information during the management agreement approval process. If performance concerns are identified, the Fund receives special reviews until performance improves, during which the Board discusses with the Advisor the reasons for such results (e.g., market conditions, security selection) and any efforts being undertaken to improve performance. The Fund’s performance was above its benchmark for the one-, three-, and five-year periods reviewed by the Board. The Board found the investment management services provided by the Advisor to the Fund to be satisfactory and consistent with the management agreement.
Under the management agreement, the Advisor provides the Fund with a comprehensive package of transfer agency, shareholder, and other services. The Board, directly and through various committees of the Board, regularly reviews reports and evaluations of such services at its regular
meetings. These reports include, but are not limited to, information regarding the operational efficiency and accuracy of the shareholder and transfer agency services provided, staffing levels, shareholder satisfaction (as measured by external as well as internal sources), technology support, new products and services offered to Fund shareholders, securities trading activities, portfolio valuation services, auditing services, and legal and operational compliance activities.
Certain aspects of shareholder and transfer agency service level efficiency and the quality of securities trading activities are measured by independent third party providers and are presented in comparison to other fund groups not managed by the Advisor. The Board found the services provided by the Advisor to the Fund under the management agreement to be competitive and of high quality.
Costs of Services and Profitability. The Advisor provides detailed information concerning its cost of providing various services to the Fund, its profitability in managing the Fund, its overall profitability, and its financial condition. The Directors have reviewed with the Advisor the methodology used to prepare this financial information. This information is considered in evaluating the Advisor’s financial condition, its ability to continue to provide services under the management agreement, and the reasonableness of the current management fee. The Board concluded that the Advisor’s profits were reasonable in light of the services provided to the Fund.
Ethics. The Board generally considers the Advisor’s commitment to providing quality services to shareholders and to conducting its business ethically. They noted that the Advisor’s practices generally meet or exceed industry best practices.
Economies of Scale. The Board also reviewed information provided by the Advisor regarding the possible existence of economies of scale in connection with the management of the Fund. The Board concluded that economies of scale are difficult to measure and predict with precision, especially on a fund-by-fund basis. The Board concluded that the Advisor is appropriately sharing economies of scale through its competitive fee structure, offering competitive fees from fund inception, and through reinvestment in its business to provide shareholders enhanced and expanded services.
Comparison to Other Funds’ Fees. The management agreement provides that the Fund pays the Advisor a single, all-inclusive (or unified) management fee for providing all services necessary for the management and operation of the Fund, other than brokerage expenses, taxes, interest, extraordinary expenses, the fees and expenses of the Fund’s independent Directors (including their independent legal counsel), and expenses incurred in connection with the provision of shareholder services and distribution services under a plan adopted pursuant to Rule 12b-1 under the 1940 Act. Under the unified fee structure, the Advisor is responsible for providing all investment advisory, custody, audit, administrative, compliance, recordkeeping, marketing, and shareholder services, or arranging and supervising third parties to provide such services. By contrast, most other funds are charged a variety of fees, including an investment advisory fee, a transfer agency fee, an administrative fee, distribution charges, and other expenses. Other than their investment advisory fees and any applicable Rule 12b-1 fees, all other components of the total fees charged by these other funds may be increased without shareholder approval. The Board believes the unified fee structure is a benefit to Fund shareholders because it clearly discloses to shareholders the cost of owning Fund shares, and, since the unified fee cannot be increased without a vote of Fund shareholders, it shifts to the Advisor the risk of increased costs of operating the Fund and provides a direct incentive to minimize administrative inefficiencies. Part of the Board’s analysis of fee levels involves reviewing certain evaluative data compiled by an independent provider and comparing the Fund’s unified fee to the total expense ratio of peer funds. The unified fee charged to shareholders of the Fund was below the median of the total expense ratios of the Fund’s peer universe. The Board concluded that the management fee paid by the Fund to the Advisor under the management agreement is reasonable in light of the services provided to the Fund.
Comparison to Fees and Services Provided to Other Clients of the Advisor. The Board also requested and received information from the Advisor concerning the nature of the services, fees, costs, and profitability of its advisory services to advisory clients other than the Fund. They observed that these varying types of client accounts require different services and involve different regulatory and entrepreneurial risks than the management of the Fund. The Board analyzed this information and concluded that the fees charged and services provided to the Fund were reasonable by comparison.
Payments to Intermediaries. The Directors also requested and received a description of payments made to intermediaries by the Fund and the Advisor. These payments include various payments made by the Fund or the Advisor to different types of intermediaries and recordkeepers for distribution and service activities provided for the Fund.
Collateral or “Fall-Out” Benefits Derived by the Advisor. The Board considered the existence of collateral benefits the Advisor may receive as a result of its relationship with the Fund. The Board noted that the Advisor’s primary business is managing mutual funds and it generally does not use fund or shareholder information to generate profits in other lines of business, and therefore does not derive any significant collateral benefits from them. The Board noted that the Advisor receives proprietary research from broker-dealers that execute fund portfolio transactions. The Board also determined that the Advisor is able to provide investment management services to certain clients other than the Fund, at least in part, due to its existing infrastructure built to serve the fund complex.
Existing Relationship. The Board also considered whether there was any reason for not continuing the existing arrangement with the Advisor. In this regard, the Board was mindful of the potential disruptions of the Fund’s operations and various risks, uncertainties, and other effects that could occur as a result of a decision not to continue such relationship. In particular, the Board recognized that most shareholders have invested in the Fund on the strength of the Advisor’s industry standing and reputation and in the expectation that the Advisor will have a continuing role in providing advisory services to the Fund.
Conclusion of the Directors. As a result of this process, the Board, including all of the independent Directors and assisted by the advice of independent legal counsel, taking into account all of the factors discussed above and the information provided by the Advisor and others in connection with its review and throughout the year, concluded that the management agreement between the Fund and the Advisor is fair and reasonable in light of the services provided and should be renewed.
Retirement Account Information
As required by law, distributions you receive from certain IRAs are subject to federal income tax withholding, unless you elect not to have withholding apply. Tax will be withheld on the total amount withdrawn even though you may be receiving amounts that are not subject to withholding, such as nondeductible contributions. In such case, excess amounts of withholding could occur. You may adjust your withholding election so that a greater or lesser amount will be withheld.
If you don’t want us to withhold on this amount, you must notify us to not withhold the federal income tax. You may notify us in writing or in certain situations by telephone or through other electronic means. For systematic withdrawals, your withholding election will remain in effect until revoked or changed by filing a new election. You have the right to revoke your election at any time.
Remember, even if you elect not to have income tax withheld, you are liable for paying income tax on the taxable portion of your withdrawal. If you elect not to have income tax withheld or you don’t have enough income tax withheld, you may be responsible for payment of estimated tax. You may incur penalties under the estimated tax rules if your withholding and estimated tax payments are not sufficient. You can reduce or defer the income tax on a distribution by directly or indirectly rolling such distribution over to another IRA or eligible plan. You should consult your tax advisor for additional information.
State tax will be withheld if, at the time of your distribution, your address is within one of the mandatory withholding states and you have federal income tax withheld (or as otherwise required by state law). State taxes will be withheld from your distribution in accordance with the respective state rules.
Distributions you receive from 403(b), 457 and qualified plans are subject to special tax and withholding rules. Your plan administrator or plan sponsor is required to provide you with a special tax notice explaining those rules at the time you request a distribution. If applicable, federal and/or state taxes may be withheld from your distribution amount.
Proxy Voting Policies
Descriptions of the principles and policies that the fund's investment advisor uses in exercising the voting rights associated with the securities purchased and/or held by the fund are available without charge, upon request, by calling 1-800-345-2021 or visiting the "About Us" page of American Century Investments’ website at americancentury.com. A description of the policies is also available on the Securities and Exchange Commission’s website at sec.gov. Information regarding how the investment advisor voted proxies relating to portfolio securities during the most recent 12-month period ended June 30 is available on the "About Us" page at americancentury.com. It is also available at sec.gov.
Quarterly Portfolio Disclosure
The fund files its complete schedule of portfolio holdings with the Securities and Exchange Commission (SEC) for the first and third quarters of each fiscal year on Form N-Q. The fund’s Forms N-Q are available on the SEC’s website at sec.gov, and may be reviewed and copied at the SEC’s Public Reference Room in Washington, DC. Information on the operation of the Public Reference Room may be obtained by calling 1-800-SEC-0330. The fund also makes its complete schedule of portfolio holdings for the most recent quarter of its fiscal year available on its website at americancentury.com and, upon request, by calling 1-800-345-2021.
Other Tax Information
The following information is provided pursuant to provisions of the Internal Revenue Code.
The fund hereby designates up to the maximum amount allowable as qualified dividend income for the fiscal year ended June 30, 2015.
For the fiscal year ended June 30, 2015, the fund intends to pass through to shareholders foreign source income of $904,549 and foreign taxes paid of $60,955, or up to the maximum amount allowable, as a foreign tax credit. Foreign source income and foreign tax expense per outstanding share on June 30, 2015 are $0.2374 and $0.0160, respectively.
|
| | |
| |
| | | |
| Contact Us | americancentury.com | |
| Automated Information Line | 1-800-345-8765 | |
| Investor Services Representative | 1-800-345-2021
or 816-531-5575 | |
| Investors Using Advisors | 1-800-378-9878 | |
Business, Not-For-Profit, Employer-Sponsored
Retirement Plans | 1-800-345-3533 | |
Banks and Trust Companies, Broker-Dealers,
Financial Professionals, Insurance Companies | 1-800-345-6488 | |
| Telecommunications Relay Service for the Deaf | 711 | |
| | | |
| American Century Quantitative Equity Funds, Inc. | |
| | | |
Investment Advisor: American Century Investment Management, Inc. Kansas City, Missouri | |
| | | |
| This report and the statements it contains are submitted for the general information of our shareholders. The report is not authorized for distribution to prospective investors unless preceded or accompanied by an effective prospectus. | |
| | | |
©2015 American Century Proprietary Holdings, Inc. All rights reserved.
CL-ANN-86499 1508 | |
|
| |
| ANNUAL REPORT | JUNE 30, 2015 |
NT Core Equity Plus Fund
|
| | |
| Performance | 2 |
|
| Portfolio Commentary | |
|
| Fund Characteristics | |
|
| Shareholder Fee Example | |
|
| Schedule of Investments | |
|
| Statement of Assets and Liabilities | |
|
| Statement of Operations | |
|
| Statement of Changes in Net Assets | |
|
| Statement of Cash Flows | |
|
| Notes to Financial Statements | |
|
| Financial Highlights | |
|
| Report of Independent Registered Public Accounting Firm | |
|
| Management | |
|
| Approval of Management Agreement | |
|
| Additional Information | |
|
Any opinions expressed in this report reflect those of the author as of the date of the report, and do not necessarily represent the opinions of American Century Investments® or any other person in the American Century Investments organization. Any such opinions are subject to change at any time based upon market or other conditions and American Century Investments disclaims any responsibility to update such opinions. These opinions may not be relied upon as investment advice and, because investment decisions made by American Century Investments funds are based on numerous factors, may not be relied upon as an indication of trading intent on behalf of any American Century Investments fund. Security examples are used for representational purposes only and are not intended as recommendations to purchase or sell securities. Performance information for comparative indices and securities is provided to American Century Investments by third party vendors. To the best of American Century Investments’ knowledge, such information is accurate at the time of printing.
|
| | | | |
| Total Returns as of June 30, 2015 |
| | | | Average Annual Returns | |
| | Ticker Symbol | 1 year | Since Inception | Inception Date |
| Institutional Class | ACNKX | 4.86% | 17.64% | 12/1/11 |
| S&P 500 Index | — | 7.42% | 17.64% | — |
|
|
| Growth of $10,000 Over Life of Class |
| $10,000 investment made December 1, 2011 |
|
| |
| Value on June 30, 2015 |
| | Institutional Class — $17,890 |
| |
| | S&P 500 Index — $17,889 |
| |
*From December 1, 2011, the Institutional Class’s inception date. Not annualized.
|
| |
| Total Annual Fund Operating Expenses |
| Institutional Class | 1.57% |
The total annual fund operating expenses shown is as stated in the fund’s prospectus current as of the date of this report. The prospectus may vary from the expense ratio shown elsewhere in this report because it is based on a different time period, includes acquired fund fees and expenses, and, if applicable, does not include fee waivers or expense reimbursements.
Data presented reflect past performance. Past performance is no guarantee of future results. Current performance may be higher or lower than the performance shown. Investment return and principal value will fluctuate, and redemption value may be more or less than original cost. Data assumes reinvestment of dividends and capital gains, and none of the charts reflect the deduction of taxes that a shareholder would pay on fund distributions or the redemption of fund shares. To obtain performance data current to the most recent month end, please call 1-800-345-2021 or visit americancentury.com. For additional information about the fund, please consult the prospectus.
Portfolio Managers: Scott Wittman, Bill Martin and Claudia Musat
Performance Summary
NT Core Equity Plus returned 4.86% for the fiscal year ended June 30, 2015, compared with the 7.42% return of its benchmark, the S&P 500 Index.
U.S. equity markets endured substantial volatility, but ended the 12-month period with advances. NT Core Equity Plus produced gains for the 12-month period, but was unable to match the return of its benchmark. The fund is managed to have a 100% net exposure to the equity market by investing approximately 130% of its net assets in long positions, while 30% of its net assets are sold short. The proceeds from the securities sold short are used to fund the purchase of the additional 30% of long positions. The fund’s stock selection process incorporates factors of valuation, quality, growth, and sentiment while striving to minimize unintended risks along industries and other risk characteristics. Within the fund, growth-based factors proved most difficult, although valuation and sentiment indicators also detracted modestly. Security selection in the information technology and consumer discretionary sectors weighed on relative performance the most, while energy sector positioning and stock selection among industrials contributed to relative gains.
Information Technology Was Leading Detractor
Security selection in the information technology sector was the principal detractor from the fund’s 12-month results. The IT services and computers and peripherals industries were leading drivers of sector underperformance, although leading individual detraction came from a short position (a trade made to benefit from a stock’s decline) in travel and expense management software provider Concur Technologies, which rallied on its acquisition by Germany-based enterprise software giant SAP. The company’s acquisition was completed during the reporting period and the fund’s short position was exited.
The consumer discretionary sector was another area of underperformance, driven by a number of declining specialty retailers including Abercrombie & Fitch. The teen apparel retailer’s stock sank on weak sales, both in the U.S. and in Europe, as young shoppers turned away from clothing sporting the retailer’s logo. The non-benchmark position was ultimately liquidated. Elsewhere in the sector, a portfolio-only position in casino operator Las Vegas Sands was detrimental. The company’s stock price fell dramatically on weaker-than-expected revenue and earnings, and management’s announced dividend increase and two-billion-dollar buyback program were not enough to stave off price declines. Our conviction in the holding is driven by strong quality and valuation insights.
Key detraction came from a short position in Puma Biotechnology, which advanced strongly after the release of positive phase three data for its breast cancer treatment. Despite generally weak fundamentals overall, the trial’s results led us to cover the fund’s short position. A number of portfolio-only positions in the financials sector weighed on the fund’s returns. Shares of real estate management company Altisource Portfolio Solutions declined steeply on disappointing quarterly earnings and again after a New York State investigation implicated a subsidiary. We ultimately eliminated the holding. A position in Nationstar Mortgage Holdings also weighed on results. The residential mortgage servicer reported subdued earnings due to declines in mortgage origination and real estate services. Despite these difficulties, the holding remains strong across sentiment and valuation and has above-average growth insights.
Energy Sector was Leading Contributor
Limited exposure to the underperforming energy sector, particularly underweight positioning, relative to the benchmark, in oil, gas, and consumable fuels holdings, bolstered the fund’s relative returns. Key contribution stemmed from holding less than the benchmark weighting in Chevron, which declined steadily throughout the period together with the price of oil.
Stock selection in the industrials sector also contributed to the fund’s relative returns. A short position in equipment manufacturer Chart Industries bolstered the sector’s return after the company’s stock fell on soft demand in the liquefied natural gas market, for which the company manufactures equipment. We covered the short position during the reporting period. Elsewhere in the sector, shipping company Matson appreciated steeply, rising on unexpectedly strong quarterly results driven by container volume increases.
Gains were also bolstered by an overweight position in Broadcom. The semiconductor designer’s stock rose following strong quarterly results, and again after a merger announcement with industry rival Avago in a deal that is expected to create the world’s leading communications semiconductor company. Our valuation and quality indicators showed modest deterioration late in the period and we liquidated the position. Insurance and managed care provider Aetna was a key contributor, advancing amid merger speculation in the recent wave of health insurance industry consolidation.
A Look Ahead
The U.S. economy seems poised to continue to experience hesitant economic growth through the second half of 2015. Economic activity appears to have somewhat diminished in breadth, though it remains slow yet steady. We believe that divergence in monetary policy between the U.S. and much of the rest of the world is likely to continue. Therefore, questions surrounding when and how much the U.S. Federal Reserve might act to tighten money supply, and the potential impact of such a move, are likely to continue driving investor sentiment in equity markets. Our disciplined, objective, and systematic investment strategy is designed to take advantage of opportunities at the individual company level in both the long and short portions of the portfolio. We believe this approach is the most powerful way to capitalize on market inefficiencies that lead to the mispricing of individual stocks. The fund’s largest overweights are in information technology, health care, and industrials while the underweights are led by the financials, energy, and utilities sectors.
|
| |
| JUNE 30, 2015 |
| Top Ten Long Holdings | % of net assets |
| Apple, Inc. | 3.97% |
| Johnson & Johnson | 2.18% |
| Microsoft Corp. | 2.16% |
| Pfizer, Inc. | 1.93% |
| Procter & Gamble Co. (The) | 1.91% |
| Bank of America Corp. | 1.71% |
| Merck & Co., Inc. | 1.63% |
| International Business Machines Corp. | 1.57% |
| Cisco Systems, Inc. | 1.56% |
| Intel Corp. | 1.53% |
| | |
| Top Five Short Holdings | % of net assets |
| WEX, Inc. | (0.89)% |
| SunEdison, Inc. | (0.84)% |
| Advisory Board Co. (The) | (0.83)% |
| Louisiana-Pacific Corp. | (0.83)% |
| WR Grace & Co. | (0.79)% |
| | |
| Types of Investments in Portfolio | % of net assets |
| Common Stocks | 127.7% |
| Common Stocks Sold Short | (29.3)% |
| Temporary Cash Investments | 0.8% |
| Other Assets and Liabilities | 0.8% |
Fund shareholders may incur two types of costs: (1) transaction costs, including sales charges (loads) on purchase payments and redemption/exchange fees; and (2) ongoing costs, including management fees; distribution and service (12b-1) fees; and other fund expenses. This example is intended to help you understand your ongoing costs (in dollars) of investing in your fund and to compare these costs with the ongoing cost of investing in other mutual funds.
The example is based on an investment of $1,000 made at the beginning of the period and held for the entire period from January 1, 2015 to June 30, 2015.
Actual Expenses
The table provides information about actual account values and actual expenses for each class. You may use the information, together with the amount you invested, to estimate the expenses that you paid over the period. First, identify the share class you own. Then simply divide your account value by $1,000 (for example, an $8,600 account value divided by $1,000 = 8.6), then multiply the result by the number under the heading “Expenses Paid During Period” to estimate the expenses you paid on your account during this period.
Hypothetical Example for Comparison Purposes
The table also provides information about hypothetical account values and hypothetical expenses based on the actual expense ratio of each class of your fund and an assumed rate of return of 5% per year before expenses, which is not the actual return of a fund’s share class. The hypothetical account values and expenses may not be used to estimate the actual ending account balance or expenses you paid for the period. You may use this information to compare the ongoing costs of investing in your fund and other funds. To do so, compare this 5% hypothetical example with the 5% hypothetical examples that appear in the shareholder reports of the other funds.
Please note that the expenses shown in the table are meant to highlight your ongoing costs only and do not reflect any transactional costs, such as sales charges (loads) or redemption/exchange fees. Therefore, the table is useful in comparing ongoing costs only, and will not help you determine the relative total costs of owning different funds. In addition, if these transactional costs were included, your costs would have been higher.
|
| | | | |
| | Beginning
Account Value
1/1/15 | Ending
Account Value
6/30/15 | Expenses Paid
During Period(1)1/1/15 - 6/30/15 | Annualized Expense Ratio(1) |
| Actual | | | | |
| Institutional Class | $1,000 | $989.00 | $7.64 | 1.55% |
| Hypothetical | | | | |
| Institutional Class | $1,000 | $1,017.11 | $7.75 | 1.55% |
| |
| (1) | Expenses are equal to the class's annualized expense ratio listed in the table above, multiplied by the average account value over the period, multiplied by 181, the number of days in the most recent fiscal half-year, divided by 365, to reflect the one-half year period. |
JUNE 30, 2015
|
| | | | | |
| | Shares | Value |
| COMMON STOCKS — 127.7% | | |
| Aerospace and Defense — 5.0% | | |
Boeing Co. (The)(1) | 25,409 |
| $ | 3,524,737 |
|
Honeywell International, Inc.(1) | 52,670 |
| 5,370,760 |
|
| Huntington Ingalls Industries, Inc. | 30,798 |
| 3,467,547 |
|
Moog, Inc., Class A(1)(2) | 14,845 |
| 1,049,245 |
|
Spirit AeroSystems Holdings, Inc., Class A(2) | 65,310 |
| 3,599,234 |
|
Teledyne Technologies, Inc.(1)(2) | 11,595 |
| 1,223,388 |
|
Textron, Inc.(1) | 89,664 |
| 4,001,704 |
|
Triumph Group, Inc.(1) | 23,617 |
| 1,558,486 |
|
| | | 23,795,101 |
|
| Air Freight and Logistics — 0.1% | | |
| United Parcel Service, Inc., Class B | 5,782 |
| 560,334 |
|
| Airlines — 1.4% | | |
Southwest Airlines Co.(1) | 99,402 |
| 3,289,212 |
|
United Continental Holdings, Inc.(1)(2) | 66,991 |
| 3,551,193 |
|
| | | 6,840,405 |
|
| Auto Components — 0.1% | | |
| Delphi Automotive plc | 5,700 |
| 485,013 |
|
| Automobiles — 0.2% | | |
| General Motors Co. | 26,017 |
| 867,147 |
|
| Banks — 3.6% | | |
Bank of America Corp.(1) | 477,697 |
| 8,130,403 |
|
Citigroup, Inc.(1) | 65,632 |
| 3,625,512 |
|
JPMorgan Chase & Co.(1) | 40,820 |
| 2,765,963 |
|
Wells Fargo & Co.(1) | 44,116 |
| 2,481,084 |
|
| | | 17,002,962 |
|
| Beverages — 2.5% | | |
Coca-Cola Co. (The)(1) | 8,077 |
| 316,861 |
|
Dr Pepper Snapple Group, Inc.(1) | 60,972 |
| 4,444,859 |
|
PepsiCo, Inc.(1) | 76,572 |
| 7,147,230 |
|
| | | 11,908,950 |
|
| Biotechnology — 4.0% | | |
Amgen, Inc.(1) | 27,411 |
| 4,208,137 |
|
Biogen, Inc.(1)(2) | 8,584 |
| 3,467,421 |
|
Celgene Corp.(1)(2) | 30,848 |
| 3,570,193 |
|
Gilead Sciences, Inc.(1) | 47,445 |
| 5,554,861 |
|
Medivation, Inc.(2) | 10,333 |
| 1,180,029 |
|
United Therapeutics Corp.(1)(2) | 6,731 |
| 1,170,857 |
|
| | | 19,151,498 |
|
| Building Products — 0.5% | | |
USG Corp.(1)(2) | 81,074 |
| 2,253,047 |
|
|
| | | | | |
| | Shares | Value |
| Capital Markets — 4.1% | | |
Ameriprise Financial, Inc.(1) | 33,166 |
| $ | 4,143,428 |
|
| Artisan Partners Asset Management, Inc., Class A | 40,463 |
| 1,879,911 |
|
Evercore Partners, Inc., Class A(1) | 75,312 |
| 4,063,836 |
|
Franklin Resources, Inc.(1) | 81,646 |
| 4,003,103 |
|
| Legg Mason, Inc. | 73,148 |
| 3,769,317 |
|
| Waddell & Reed Financial, Inc., Class A | 30,536 |
| 1,444,658 |
|
| | | 19,304,253 |
|
| Chemicals — 3.4% | | |
Cabot Corp.(1) | 91,116 |
| 3,397,716 |
|
Dow Chemical Co. (The)(1) | 103,446 |
| 5,293,332 |
|
E.I. du Pont de Nemours & Co.(1) | 69,675 |
| 4,455,716 |
|
| LyondellBasell Industries NV, Class A | 27,953 |
| 2,893,694 |
|
| | | 16,040,458 |
|
| Commercial Services and Supplies — 2.4% | | |
Deluxe Corp.(1) | 48,890 |
| 3,031,180 |
|
Herman Miller, Inc.(1) | 119,170 |
| 3,447,588 |
|
Pitney Bowes, Inc.(1) | 149,730 |
| 3,115,881 |
|
| Waste Management, Inc. | 39,622 |
| 1,836,480 |
|
| | | 11,431,129 |
|
| Communications Equipment — 3.7% | | |
Brocade Communications Systems, Inc.(1) | 340,479 |
| 4,044,890 |
|
Cisco Systems, Inc.(1) | 270,167 |
| 7,418,786 |
|
QUALCOMM, Inc.(1) | 97,352 |
| 6,097,156 |
|
| | | 17,560,832 |
|
| Consumer Finance — 0.9% | | |
Credit Acceptance Corp.(2) | 17,846 |
| 4,393,328 |
|
| Containers and Packaging — 0.2% | | |
Berry Plastics Group, Inc.(1)(2) | 35,625 |
| 1,154,250 |
|
| Diversified Consumer Services — 0.7% | | |
H&R Block, Inc.(1) | 118,702 |
| 3,519,514 |
|
| Diversified Financial Services — 0.4% | | |
Berkshire Hathaway, Inc., Class B(1)(2) | 15,142 |
| 2,060,978 |
|
| Diversified Telecommunication Services — 0.5% | | |
AT&T, Inc.(1) | 23,723 |
| 842,641 |
|
Verizon Communications, Inc.(1) | 29,380 |
| 1,369,402 |
|
| | | 2,212,043 |
|
| Electric Utilities — 0.5% | | |
Entergy Corp.(1) | 28,136 |
| 1,983,588 |
|
| NextEra Energy, Inc. | 6,011 |
| 589,258 |
|
| | | 2,572,846 |
|
| Electrical Equipment — 1.8% | | |
Emerson Electric Co.(1) | 78,429 |
| 4,347,320 |
|
Rockwell Automation, Inc.(1) | 32,600 |
| 4,063,264 |
|
| | | 8,410,584 |
|
|
| | | | | |
| | Shares | Value |
| Electronic Equipment, Instruments and Components — 1.1% | | |
Corning, Inc.(1) | 206,444 |
| $ | 4,073,140 |
|
Dolby Laboratories, Inc., Class A(1) | 28,629 |
| 1,135,999 |
|
| | | 5,209,139 |
|
| Energy Equipment and Services — 2.6% | | |
Dril-Quip, Inc.(1)(2) | 31,088 |
| 2,339,372 |
|
FMC Technologies, Inc.(2) | 17,655 |
| 732,506 |
|
Schlumberger Ltd.(1) | 75,207 |
| 6,482,091 |
|
Superior Energy Services, Inc.(1) | 136,002 |
| 2,861,482 |
|
| | | 12,415,451 |
|
| Food and Staples Retailing — 3.4% | | |
CVS Health Corp.(1) | 63,583 |
| 6,668,585 |
|
| Kroger Co. (The) | 17,497 |
| 1,268,707 |
|
SUPERVALU, Inc.(1)(2) | 229,453 |
| 1,856,275 |
|
Wal-Mart Stores, Inc.(1) | 92,198 |
| 6,539,604 |
|
| | | 16,333,171 |
|
| Food Products — 4.3% | | |
Archer-Daniels-Midland Co.(1) | 94,809 |
| 4,571,690 |
|
Bunge Ltd.(1) | 40,325 |
| 3,540,535 |
|
ConAgra Foods, Inc.(1) | 62,577 |
| 2,735,866 |
|
| Dean Foods Co. | 71,529 |
| 1,156,624 |
|
| Ingredion, Inc. | 10,305 |
| 822,442 |
|
Pilgrim's Pride Corp.(1) | 123,092 |
| 2,827,423 |
|
Sanderson Farms, Inc.(1) | 42,117 |
| 3,165,514 |
|
Seaboard Corp.(1)(2) | 453 |
| 1,630,347 |
|
| | | 20,450,441 |
|
| Health Care Equipment and Supplies — 3.3% | | |
Boston Scientific Corp.(2) | 27,474 |
| 486,290 |
|
| C.R. Bard, Inc. | 3,973 |
| 678,191 |
|
DENTSPLY International, Inc.(1) | 58,024 |
| 2,991,137 |
|
Hologic, Inc.(2) | 24,479 |
| 931,671 |
|
St. Jude Medical, Inc.(1) | 59,365 |
| 4,337,800 |
|
Stryker Corp.(1) | 46,537 |
| 4,447,541 |
|
Teleflex, Inc.(1) | 12,204 |
| 1,653,032 |
|
| | | 15,525,662 |
|
| Health Care Providers and Services — 4.3% | | |
Aetna, Inc.(1) | 39,838 |
| 5,077,752 |
|
| Cardinal Health, Inc. | 7,982 |
| 667,694 |
|
Express Scripts Holding Co.(1)(2) | 42,563 |
| 3,785,553 |
|
HCA Holdings, Inc.(1)(2) | 53,396 |
| 4,844,085 |
|
Health Net, Inc.(2) | 35,151 |
| 2,253,882 |
|
Molina Healthcare, Inc.(2) | 22,415 |
| 1,575,775 |
|
| UnitedHealth Group, Inc. | 17,325 |
| 2,113,650 |
|
| | | 20,318,391 |
|
| Health Care Technology — 1.2% | | |
Allscripts Healthcare Solutions, Inc.(1)(2) | 130,581 |
| 1,786,348 |
|
Cerner Corp.(1)(2) | 57,102 |
| 3,943,464 |
|
| | | 5,729,812 |
|
|
| | | | | |
| | Shares | Value |
| Hotels, Restaurants and Leisure — 4.7% | | |
| Brinker International, Inc. | 63,833 |
| $ | 3,679,973 |
|
| Cracker Barrel Old Country Store, Inc. | 26,368 |
| 3,933,051 |
|
| Darden Restaurants, Inc. | 26,629 |
| 1,892,789 |
|
Diamond Resorts International, Inc.(2) | 61,411 |
| 1,937,517 |
|
Las Vegas Sands Corp.(1) | 67,281 |
| 3,536,962 |
|
| Marriott Vacations Worldwide Corp. | 21,065 |
| 1,932,714 |
|
| SeaWorld Entertainment, Inc. | 30,884 |
| 569,501 |
|
| Vail Resorts, Inc. | 24,086 |
| 2,630,191 |
|
Wyndham Worldwide Corp.(1) | 24,668 |
| 2,020,556 |
|
| | | 22,133,254 |
|
| Household Durables — 0.7% | | |
| Garmin Ltd. | 16,274 |
| 714,917 |
|
| Harman International Industries, Inc. | 20,516 |
| 2,440,173 |
|
| | | 3,155,090 |
|
| Household Products — 1.9% | | |
Procter & Gamble Co. (The)(1) | 115,834 |
| 9,062,852 |
|
| Industrial Conglomerates — 2.9% | | |
3M Co.(1) | 40,398 |
| 6,233,411 |
|
Danaher Corp.(1) | 48,017 |
| 4,109,775 |
|
General Electric Co.(1) | 124,149 |
| 3,298,639 |
|
| | | 13,641,825 |
|
| Insurance — 1.3% | | |
| Allstate Corp. (The) | 49,614 |
| 3,218,460 |
|
Amtrust Financial Services, Inc.(1) | 17,008 |
| 1,114,194 |
|
Hanover Insurance Group, Inc. (The)(1) | 22,436 |
| 1,660,937 |
|
| | | 5,993,591 |
|
| Internet and Catalog Retail — 0.3% | | |
Expedia, Inc.(1) | 11,536 |
| 1,261,462 |
|
Liberty Interactive Corp. QVC Group, Class A(1)(2) | 8,348 |
| 231,657 |
|
| | | 1,493,119 |
|
| Internet Software and Services — 2.6% | | |
eBay, Inc.(1)(2) | 92,171 |
| 5,552,381 |
|
Facebook, Inc., Class A(1)(2) | 12,005 |
| 1,029,609 |
|
Google, Inc., Class A(1)(2) | 9,976 |
| 5,387,439 |
|
VeriSign, Inc.(2) | 3,490 |
| 215,403 |
|
| | | 12,184,832 |
|
| IT Services — 3.9% | | |
Accenture plc, Class A(1) | 55,413 |
| 5,362,870 |
|
Amdocs Ltd.(1) | 19,942 |
| 1,088,634 |
|
Computer Sciences Corp.(1) | 39,601 |
| 2,599,409 |
|
| Convergys Corp. | 26,082 |
| 664,830 |
|
International Business Machines Corp.(1) | 45,800 |
| 7,449,828 |
|
Teradata Corp.(2) | 13,612 |
| 503,644 |
|
| Western Union Co. (The) | 23,642 |
| 480,642 |
|
| Xerox Corp. | 31,934 |
| 339,778 |
|
| | | 18,489,635 |
|
|
| | | | | |
| | Shares | Value |
| Life Sciences Tools and Services — 1.0% | | |
Bio-Rad Laboratories, Inc., Class A(1)(2) | 28,529 |
| $ | 4,296,753 |
|
Bruker Corp.(1)(2) | 18,783 |
| 383,361 |
|
| | | 4,680,114 |
|
| Machinery — 4.3% | | |
Caterpillar, Inc.(1) | 57,609 |
| 4,886,395 |
|
| Cummins, Inc. | 30,293 |
| 3,974,139 |
|
| Illinois Tool Works, Inc. | 23,469 |
| 2,154,219 |
|
| PACCAR, Inc. | 16,546 |
| 1,055,800 |
|
Parker-Hannifin Corp.(1) | 34,775 |
| 4,045,376 |
|
Stanley Black & Decker, Inc.(1) | 41,819 |
| 4,401,032 |
|
| | | 20,516,961 |
|
| Marine — 0.5% | | |
Matson, Inc.(1) | 54,059 |
| 2,272,640 |
|
| Media — 3.3% | | |
Cablevision Systems Corp., Class A(1) | 187,696 |
| 4,493,442 |
|
Comcast Corp., Class A(1) | 57,696 |
| 3,469,838 |
|
DIRECTV(2) | 12,861 |
| 1,193,372 |
|
Omnicom Group, Inc.(1) | 30,707 |
| 2,133,830 |
|
| Scripps Networks Interactive, Inc., Class A | 36,741 |
| 2,401,759 |
|
| Viacom, Inc., Class B | 16,530 |
| 1,068,499 |
|
Walt Disney Co. (The)(1) | 8,043 |
| 918,028 |
|
| | | 15,678,768 |
|
| Metals and Mining — 1.4% | | |
Alcoa, Inc.(1) | 292,928 |
| 3,266,147 |
|
United States Steel Corp.(1) | 165,234 |
| 3,407,125 |
|
| | | 6,673,272 |
|
| Multi-Utilities — 0.4% | | |
| Public Service Enterprise Group, Inc. | 42,982 |
| 1,688,333 |
|
| Multiline Retail — 3.2% | | |
Big Lots, Inc.(1) | 87,016 |
| 3,914,850 |
|
Dillard's, Inc., Class A(1) | 23,457 |
| 2,467,441 |
|
| Kohl's Corp. | 58,954 |
| 3,691,110 |
|
Macy's, Inc.(1) | 5,172 |
| 348,955 |
|
Target Corp.(1) | 60,465 |
| 4,935,758 |
|
| | | 15,358,114 |
|
| Oil, Gas and Consumable Fuels — 5.4% | | |
Chevron Corp.(1) | 13,494 |
| 1,301,766 |
|
CVR Energy, Inc.(1) | 92,734 |
| 3,490,508 |
|
Denbury Resources, Inc.(1) | 109,659 |
| 697,431 |
|
EOG Resources, Inc.(1) | 25,579 |
| 2,239,442 |
|
Exxon Mobil Corp.(1) | 64,239 |
| 5,344,685 |
|
Murphy Oil Corp.(1) | 86,234 |
| 3,584,747 |
|
Valero Energy Corp.(1) | 86,485 |
| 5,413,961 |
|
Western Refining, Inc.(1) | 78,541 |
| 3,425,958 |
|
| | | 25,498,498 |
|
|
| | | | | |
| | Shares | Value |
| Paper and Forest Products — 0.1% | | |
| Domtar Corp. | 8,454 |
| $ | 349,995 |
|
| International Paper Co. | 6,535 |
| 311,001 |
|
| | | 660,996 |
|
| Personal Products — 0.2% | | |
Avon Products, Inc.(1) | 149,515 |
| 935,964 |
|
| Pharmaceuticals — 7.2% | | |
AbbVie, Inc.(1) | 102,814 |
| 6,908,073 |
|
Johnson & Johnson(1) | 105,973 |
| 10,328,128 |
|
Merck & Co., Inc.(1) | 135,499 |
| 7,713,958 |
|
Pfizer, Inc.(1) | 272,930 |
| 9,151,343 |
|
| | | 34,101,502 |
|
| Professional Services — 0.3% | | |
ManpowerGroup, Inc.(1) | 10,181 |
| 909,978 |
|
TriNet Group, Inc.(2) | 12,689 |
| 321,666 |
|
| | | 1,231,644 |
|
| Real Estate Investment Trusts (REITs) — 2.9% | | |
Hospitality Properties Trust(1) | 118,072 |
| 3,402,835 |
|
Lamar Advertising Co., Class A(1) | 60,699 |
| 3,488,978 |
|
| Plum Creek Timber Co., Inc. | 6,722 |
| 272,712 |
|
| RLJ Lodging Trust | 117,794 |
| 3,507,905 |
|
Ryman Hospitality Properties, Inc.(1) | 60,297 |
| 3,202,374 |
|
| | | 13,874,804 |
|
| Real Estate Management and Development — 1.5% | | |
CBRE Group, Inc.(1)(2) | 94,705 |
| 3,504,085 |
|
Jones Lang LaSalle, Inc.(1) | 21,337 |
| 3,648,627 |
|
| | | 7,152,712 |
|
| Semiconductors and Semiconductor Equipment — 2.6% | | |
Fairchild Semiconductor International, Inc.(2) | 14,533 |
| 252,583 |
|
Intel Corp.(1) | 239,062 |
| 7,271,071 |
|
Marvell Technology Group Ltd.(1) | 23,123 |
| 304,877 |
|
Micron Technology, Inc.(1)(2) | 54,256 |
| 1,022,183 |
|
Texas Instruments, Inc.(1) | 70,464 |
| 3,629,601 |
|
| | | 12,480,315 |
|
| Software — 6.2% | | |
| Activision Blizzard, Inc. | 34,359 |
| 831,831 |
|
Cadence Design Systems, Inc.(1)(2) | 189,038 |
| 3,716,487 |
|
Electronic Arts, Inc.(2) | 21,851 |
| 1,453,092 |
|
Mentor Graphics Corp.(1) | 86,024 |
| 2,273,614 |
|
Microsoft Corp.(1) | 232,334 |
| 10,257,546 |
|
Oracle Corp.(1) | 166,804 |
| 6,722,201 |
|
Symantec Corp.(1) | 17,441 |
| 405,503 |
|
Synopsys, Inc.(1)(2) | 72,433 |
| 3,668,732 |
|
| | | 29,329,006 |
|
| Specialty Retail — 3.7% | | |
Best Buy Co., Inc.(1) | 61,143 |
| 1,993,873 |
|
|
| | | | | |
| | Shares | Value |
Foot Locker, Inc.(1) | 63,423 |
| $ | 4,249,975 |
|
Gap, Inc. (The)(1) | 94,361 |
| 3,601,760 |
|
Lowe's Cos., Inc.(1) | 83,796 |
| 5,611,818 |
|
Murphy USA, Inc.(1)(2) | 40,385 |
| 2,254,291 |
|
| | | 17,711,717 |
|
| Technology Hardware, Storage and Peripherals — 7.1% | | |
Apple, Inc.(1) | 150,293 |
| 18,850,499 |
|
EMC Corp.(1) | 194,227 |
| 5,125,651 |
|
Hewlett-Packard Co.(1) | 153,553 |
| 4,608,126 |
|
NetApp, Inc.(1) | 7,571 |
| 238,941 |
|
SanDisk Corp.(1) | 22,879 |
| 1,332,015 |
|
Seagate Technology plc(1) | 12,495 |
| 593,512 |
|
Western Digital Corp.(1) | 34,807 |
| 2,729,565 |
|
| | | 33,478,309 |
|
| Textiles, Apparel and Luxury Goods — 0.7% | | |
Wolverine World Wide, Inc.(1) | 114,491 |
| 3,260,704 |
|
| Thrifts and Mortgage Finance — 1.2% | | |
Essent Group Ltd.(2) | 135,084 |
| 3,694,548 |
|
Nationstar Mortgage Holdings, Inc.(1)(2) | 130,678 |
| 2,195,390 |
|
| | | 5,889,938 |
|
TOTAL COMMON STOCKS (Cost $552,159,989) | | 606,135,248 |
|
| TEMPORARY CASH INVESTMENTS — 0.8% | | |
Repurchase Agreement, Bank of America Merrill Lynch, (collateralized by various U.S. Treasury obligations, 1.50%, 1/31/19 - 11/30/19, valued at $683,691), in a joint trading account at 0.10%, dated 6/30/15, due 7/1/15 (Delivery value $670,050) | | 670,048 |
|
| Repurchase Agreement, Fixed Income Clearing Corp., (collateralized by various U.S. Treasury obligations, 2.375%, 8/15/24, valued at $2,739,463), at 0.01%, dated 6/30/15, due 7/1/15 (Delivery value $2,681,001) | | 2,681,000 |
|
| State Street Institutional Liquid Reserves Fund, Premier Class | 665,917 |
| 665,917 |
|
TOTAL TEMPORARY CASH INVESTMENTS (Cost $4,016,965) | | 4,016,965 |
|
TOTAL INVESTMENT SECURITIES BEFORE SECURITIES SOLD SHORT — 128.5% (Cost $556,176,954) | 610,152,213 |
|
| COMMON STOCKS SOLD SHORT — (29.3)% | | |
| Aerospace and Defense — (1.2)% | | |
| DigitalGlobe, Inc. | (118,600 | ) | (3,295,894 | ) |
| Orbital ATK, Inc. | (30,999 | ) | (2,274,087 | ) |
| | | (5,569,981 | ) |
| Air Freight and Logistics — (0.2)% | | |
| UTi Worldwide, Inc. | (86,093 | ) | (860,069 | ) |
| Airlines — (0.9)% | | |
| Allegiant Travel Co. | (11,693 | ) | (2,079,951 | ) |
| Spirit Airlines, Inc. | (36,350 | ) | (2,257,335 | ) |
| | | (4,337,286 | ) |
| Auto Components — (0.9)% | | |
| BorgWarner, Inc. | (27,385 | ) | (1,556,564 | ) |
| Visteon Corp. | (23,934 | ) | (2,512,591 | ) |
| | | (4,069,155 | ) |
|
| | | | | |
| | Shares | Value |
| Chemicals — (1.1)% | | |
| Platform Specialty Products Corp. | (11,576 | ) | $ | (296,114 | ) |
| Tronox Ltd., Class A | (66,036 | ) | (966,106 | ) |
| WR Grace & Co. | (37,339 | ) | (3,745,102 | ) |
| | | (5,007,322 | ) |
| Communications Equipment — (0.9)% | | |
| Motorola Solutions, Inc. | (54,645 | ) | (3,133,344 | ) |
| ViaSat, Inc. | (21,558 | ) | (1,299,085 | ) |
| | | (4,432,429 | ) |
| Construction and Engineering — (1.4)% | | |
| AECOM | (112,639 | ) | (3,726,098 | ) |
| Granite Construction, Inc. | (83,141 | ) | (2,952,337 | ) |
| | | (6,678,435 | ) |
| Diversified Financial Services — (0.7)% | | |
| Leucadia National Corp. | (136,488 | ) | (3,313,929 | ) |
| Electric Utilities — (0.1)% | | |
| ALLETE, Inc. | (14,321 | ) | (664,351 | ) |
| Electrical Equipment — (0.4)% | | |
| Franklin Electric Co., Inc. | (51,834 | ) | (1,675,793 | ) |
| Electronic Equipment, Instruments and Components — (1.5)% | | |
| Anixter International, Inc. | (51,339 | ) | (3,344,736 | ) |
| FEI Co. | (33,497 | ) | (2,777,906 | ) |
| SYNNEX Corp. | (6,608 | ) | (483,639 | ) |
| Zebra Technologies Corp., Class A | (4,956 | ) | (550,364 | ) |
| | | (7,156,645 | ) |
| Energy Equipment and Services — (1.3)% | | |
| Bristow Group, Inc. | (44,277 | ) | (2,359,964 | ) |
| Rowan Cos. plc | (169,276 | ) | (3,573,416 | ) |
| RPC, Inc. | (23,003 | ) | (318,132 | ) |
| | | (6,251,512 | ) |
| Food and Staples Retailing — (1.2)% | | |
| PriceSmart, Inc. | (40,723 | ) | (3,715,566 | ) |
| United Natural Foods, Inc. | (30,879 | ) | (1,966,375 | ) |
| | | (5,681,941 | ) |
| Food Products — (0.5)% | | |
| Post Holdings, Inc. | (47,432 | ) | (2,558,008 | ) |
| Gas Utilities — (0.2)% | | |
| South Jersey Industries, Inc. | (39,939 | ) | (987,692 | ) |
| Health Care Equipment and Supplies — (0.1)% | | |
| Cooper Cos., Inc. (The) | (1,950 | ) | (347,042 | ) |
| Health Care Providers and Services — (3.0)% | | |
| Acadia Healthcare Co., Inc. | (46,986 | ) | (3,680,414 | ) |
| Brookdale Senior Living, Inc. | (98,650 | ) | (3,423,155 | ) |
| Henry Schein, Inc. | (13,185 | ) | (1,873,852 | ) |
| Owens & Minor, Inc. | (69,257 | ) | (2,354,738 | ) |
| Tenet Healthcare Corp. | (52,240 | ) | (3,023,651 | ) |
| | | (14,355,810 | ) |
|
| | | | | |
| | Shares | Value |
| Hotels, Restaurants and Leisure — (0.4)% | | |
| MGM Resorts International | (99,651 | ) | $ | (1,818,631 | ) |
| Household Durables — (1.0)% | | |
| Lennar Corp., Class A | (36,748 | ) | (1,875,618 | ) |
| M.D.C. Holdings, Inc. | (96,865 | ) | (2,903,044 | ) |
| | | (4,778,662 | ) |
| Insurance — (0.8)% | | |
| MBIA, Inc. | (389,330 | ) | (2,339,873 | ) |
| Old Republic International Corp. | (88,864 | ) | (1,388,945 | ) |
| | | (3,728,818 | ) |
| Internet Software and Services — (0.5)% | | |
| Yahoo!, Inc. | (63,619 | ) | (2,499,591 | ) |
| IT Services — (1.3)% | | |
| Global Payments, Inc. | (20,769 | ) | (2,148,553 | ) |
| WEX, Inc. | (36,989 | ) | (4,215,636 | ) |
| | | (6,364,189 | ) |
| Machinery — (0.7)% | | |
| Donaldson Co., Inc. | (94,368 | ) | (3,378,374 | ) |
| Media — (0.7)% | | |
| Loral Space & Communications, Inc. | (53,795 | ) | (3,395,540 | ) |
| Metals and Mining — (0.5)% | | |
| Allegheny Technologies, Inc. | (9,995 | ) | (301,849 | ) |
| Freeport-McMoRan, Inc. | (14,431 | ) | (268,705 | ) |
| Hecla Mining Co. | (768,556 | ) | (2,021,303 | ) |
| | | (2,591,857 | ) |
| Multi-Utilities — (0.1)% | | |
| Dominion Resources, Inc. | (9,694 | ) | (648,238 | ) |
| Oil, Gas and Consumable Fuels — (1.4)% | | |
| Cobalt International Energy, Inc. | (118,923 | ) | (1,154,742 | ) |
| Diamondback Energy, Inc. | (29,120 | ) | (2,195,066 | ) |
| Gulfport Energy Corp. | (59,296 | ) | (2,386,664 | ) |
| Teekay Corp. | (15,570 | ) | (666,707 | ) |
| | | (6,403,179 | ) |
| Paper and Forest Products — (0.8)% | | |
| Louisiana-Pacific Corp. | (232,527 | ) | (3,959,935 | ) |
| Pharmaceuticals — (0.2)% | | |
| Akorn, Inc. | (26,593 | ) | (1,161,050 | ) |
| Professional Services — (0.8)% | | |
| Advisory Board Co. (The) | (72,442 | ) | (3,960,404 | ) |
| Real Estate Management and Development — (0.7)% | | |
| Howard Hughes Corp. (The) | (10,089 | ) | (1,448,175 | ) |
| Kennedy-Wilson Holdings, Inc. | (69,774 | ) | (1,715,743 | ) |
| | | (3,163,918 | ) |
|
| | | | | |
| | Shares | Value |
| Road and Rail — (0.6)% | | |
| Kansas City Southern | (29,486 | ) | $ | (2,689,123 | ) |
| Semiconductors and Semiconductor Equipment — (0.8)% | | |
| SunEdison, Inc. | (133,578 | ) | (3,995,318 | ) |
| Software — (0.1)% | | |
| FireEye, Inc. | (8,289 | ) | (405,415 | ) |
| Specialty Retail — (1.3)% | | |
| Cabela's, Inc. | (56,672 | ) | (2,832,466 | ) |
| CarMax, Inc. | (46,598 | ) | (3,085,254 | ) |
| | | (5,917,720 | ) |
| Textiles, Apparel and Luxury Goods — (0.2)% | | |
| Under Armour, Inc., Class A | (10,260 | ) | (856,094 | ) |
| Trading Companies and Distributors — (0.1)% | | |
| Watsco, Inc. | (2,233 | ) | (276,311 | ) |
| Transportation Infrastructure — (0.7)% | | |
| Macquarie Infrastructure Corp. | (38,957 | ) | (3,219,017 | ) |
TOTAL COMMON STOCKS SOLD SHORT — (29.3)% (Proceeds $136,996,532) | | (139,158,784 | ) |
| OTHER ASSETS AND LIABILITIES — 0.8% | | 3,704,057 |
|
| TOTAL NET ASSETS — 100.0% | | $ | 474,697,486 |
|
|
| | |
| NOTES TO SCHEDULE OF INVESTMENTS |
| |
| (1) | Security, or a portion thereof, has been pledged at the custodian bank or with a broker for collateral requirements on securities sold short. At the period end, the aggregate value of securities pledged was $402,858,038. |
See Notes to Financial Statements.
|
|
| Statement of Assets and Liabilities |
|
| | | |
| JUNE 30, 2015 |
| Assets |
| Investment securities, at value (cost of $556,176,954) | $ | 610,152,213 |
|
| Deposits with broker for securities sold short | 2,683,347 |
|
| Receivable for investments sold | 27,089,675 |
|
| Receivable for capital shares sold | 413,433 |
|
| Dividends and interest receivable | 623,911 |
|
| | 640,962,579 |
|
| | |
| Liabilities | |
| Securities sold short, at value (proceeds of $136,996,532) | 139,158,784 |
|
| Payable for investments purchased | 26,610,197 |
|
| Accrued management fees | 430,486 |
|
| Dividend expense payable on securities sold short | 65,626 |
|
| | 166,265,093 |
|
| | |
| Net Assets | $ | 474,697,486 |
|
| | |
| Institutional Class Capital Shares, $0.01 Par Value | |
| Shares authorized | 200,000,000 |
|
| Shares outstanding | 32,939,880 |
|
| | |
| Net Asset Value Per Share | $ | 14.41 |
|
| | |
| Net Assets Consist of: | |
| Capital (par value and paid-in surplus) | $ | 393,443,015 |
|
| Undistributed net investment income | 241,436 |
|
| Undistributed net realized gain | 29,200,028 |
|
| Net unrealized appreciation | 51,813,007 |
|
| | $ | 474,697,486 |
|
See Notes to Financial Statements.
|
| | | |
| YEAR ENDED JUNE 30, 2015 |
| Investment Income (Loss) |
| Income: | |
| Dividends (net of foreign taxes withheld of $6,484) | $ | 10,875,302 |
|
| Interest | 3,761 |
|
| | 10,879,063 |
|
| | |
| Expenses: | |
| Dividend expense on securities sold short | 1,095,445 |
|
| Broker fees and charges on securities sold short | 743,940 |
|
| Management fees | 4,651,437 |
|
| Directors' fees and expenses | 20,805 |
|
| Other expenses | 137 |
|
| | 6,511,764 |
|
| | |
| Net investment income (loss) | 4,367,299 |
|
| | |
| Realized and Unrealized Gain (Loss) | |
| Net realized gain (loss) on: | |
| Investment transactions | 53,161,150 |
|
| Securities sold short transactions | (8,095,247 | ) |
| | 45,065,903 |
|
| | |
| Change in net unrealized appreciation (depreciation) on: | |
| Investments | (37,411,328 | ) |
| Securities sold short | 6,753,111 |
|
| | (30,658,217 | ) |
| | |
| Net realized and unrealized gain (loss) | 14,407,686 |
|
| | |
| Net Increase (Decrease) in Net Assets Resulting from Operations | $ | 18,774,985 |
|
See Notes to Financial Statements.
|
|
| Statement of Changes in Net Assets |
|
| | | | | | |
| YEARS ENDED JUNE 30, 2015 AND JUNE 30, 2014 |
| Increase (Decrease) in Net Assets | June 30, 2015 | June 30, 2014 |
| Operations | | |
| Net investment income (loss) | $ | 4,367,299 |
| $ | 2,905,761 |
|
| Net realized gain (loss) | 45,065,903 |
| 37,130,428 |
|
| Change in net unrealized appreciation (depreciation) | (30,658,217 | ) | 37,542,280 |
|
| Net increase (decrease) in net assets resulting from operations | 18,774,985 |
| 77,578,469 |
|
| | | |
| Distributions to Shareholders | | |
| From net investment income | (4,115,172 | ) | (2,895,863 | ) |
| From net realized gains | (43,391,423 | ) | (18,191,926 | ) |
| Decrease in net assets from distributions | (47,506,595 | ) | (21,087,789 | ) |
| | | |
| Capital Share Transactions | | |
| Proceeds from shares sold | 93,554,643 |
| 53,033,084 |
|
| Proceeds from reinvestment of distributions | 47,506,595 |
| 21,087,789 |
|
| Payments for shares redeemed | (24,508,840 | ) | (11,310,492 | ) |
| Net increase (decrease) in net assets from capital share transactions | 116,552,398 |
| 62,810,381 |
|
| | | |
| Net increase (decrease) in net assets | 87,820,788 |
| 119,301,061 |
|
| | | |
| Net Assets | | |
| Beginning of period | 386,876,698 |
| 267,575,637 |
|
| End of period | $ | 474,697,486 |
| $ | 386,876,698 |
|
| | | |
| Undistributed net investment income | $ | 241,436 |
| $ | 55,052 |
|
| | | |
| Transactions in Shares of the Fund | | |
| Sold | 6,360,257 |
| 3,687,822 |
|
| Issued in reinvestment of distributions | 3,298,154 |
| 1,466,219 |
|
| Redeemed | (1,605,334 | ) | (763,715 | ) |
| Net increase (decrease) in shares of the fund | 8,053,077 |
| 4,390,326 |
|
See Notes to Financial Statements.
|
| | | |
| YEAR ENDED JUNE 30, 2015 | |
| Cash Flows From (Used In) Operating Activities | |
| Net increase (decrease) in net assets resulting from operations | $ | 18,774,985 |
|
| Adjustments to reconcile net increase (decrease) in net assets resulting from operations to net cash from (used in) operating activities: | |
| Purchases of investment securities | (515,302,129 | ) |
| Proceeds from investments sold | 422,328,703 |
|
| Purchases to cover securities sold short | (132,276,115 | ) |
| Proceeds from securities sold short | 153,350,423 |
|
| (Increase) decrease in short-term investments | 2,854,916 |
|
| (Increase) decrease in deposits with broker for securities sold short | (1,422,343 | ) |
| (Increase) decrease in receivable for investments sold | (26,035,087 | ) |
| (Increase) decrease in dividends and interest receivable | (187,346 | ) |
| Increase (decrease) in payable for investments purchased | 23,585,592 |
|
| Increase (decrease) in accrued management fees | 84,982 |
|
| Increase (decrease) in dividend expense payable on securities sold short | 10,976 |
|
| Change in net unrealized (appreciation) depreciation on investments | 37,411,328 |
|
| Net realized (gain) loss on investment transactions | (53,161,150 | ) |
| Change in net unrealized (appreciation) depreciation on securities sold short | (6,753,111 | ) |
| Net realized (gain) loss on securities sold short transactions | 8,095,247 |
|
| Net cash from (used in) operating activities | (68,640,129 | ) |
| | |
| Cash Flows From (Used In) Financing Activities | |
| Proceeds from shares sold | 93,142,183 |
|
| Payments for shares redeemed | (24,508,840 | ) |
| Distributions paid, net of reinvestments | — |
|
| Net cash from (used in) financing activities | 68,633,343 |
|
| | |
| Net Increase (Decrease) In Cash | (6,786 | ) |
| Cash at beginning of period | 6,786 |
|
| Cash at end of period | — |
|
| | |
| Supplemental disclosure of cash flow information: | |
| Non cash financing activities not included herein consist of all reinvestment of distributions of $47,506,595. |
See Notes to Financial Statements.
|
|
| Notes to Financial Statements |
JUNE 30, 2015
1. Organization
American Century Quantitative Equity Funds, Inc. (the corporation) is registered under the Investment Company Act of 1940, as amended (the 1940 Act), as an open-end management investment company and is organized as a Maryland corporation. NT Core Equity Plus Fund (the fund) is one fund in a series issued by the corporation. The fund is diversified as defined under the 1940 Act. The fund’s investment objective is to seek long-term capital growth. The fund is not permitted to invest in securities issued by companies assigned the Global Industry Classification Standard for the tobacco industry.
2. Significant Accounting Policies
The following is a summary of significant accounting policies consistently followed by the fund in preparation of its financial statements. The fund is an investment company and follows accounting and reporting guidance in accordance with accounting principles generally accepted in the United States of America. This may require management to make certain estimates and assumptions at the date of the financial statements. Actual results could differ from these estimates. Management evaluated the impact of events or transactions occurring through the date the financial statements were issued that would merit recognition or disclosure.
Investment Valuations — The fund determines the fair value of its investments and computes its net asset value per share at the close of regular trading (usually 4 p.m. Eastern time) on the New York Stock Exchange (NYSE) on each day the NYSE is open. The Board of Directors has adopted valuation policies and procedures to guide the investment advisor in the fund’s investment valuation process and to provide methodologies for the oversight of the fund’s pricing function.
Equity securities that are listed or traded on a domestic securities exchange are valued at the last reported sales price or at the official closing price as provided by the exchange. Equity securities traded on foreign securities exchanges are generally valued at the closing price of such securities on the exchange where primarily traded or at the close of the NYSE, if that is earlier. If no last sales price is reported, or if local convention or regulation so provides, the mean of the latest bid and asked prices may be used. Securities traded over-the-counter are valued at the mean of the latest bid and asked prices, the last sales price, or the official closing price.
Fixed income securities maturing within 60 days at the time of purchase may be valued at cost, plus or minus any amortized discount or premium or at the evaluated mean as provided by an independent pricing service. Evaluated mean prices are commonly derived through utilization of market models, which may consider, among other factors: trade data, quotations from dealers and active market makers, relevant yield curve and spread data, related sector levels, creditworthiness, trade data or market information on comparable securities, and other relevant security specific information.
Open-end management investment companies are valued at the reported net asset value per share. Repurchase agreements are valued at cost, which approximates fair value.
If the fund determines that the market price for an investment is not readily available or the valuation methods mentioned above do not reflect an investment’s fair value, such investment is valued as determined in good faith by the Board of Directors or its delegate, in accordance with policies and procedures adopted by the Board of Directors. In its determination of fair value, the fund may review several factors including, but not limited to, market information regarding the specific investment or comparable investments and correlation with other investment types, futures indices or general market indicators. Circumstances that may cause the fund to use these procedures to value an investment include, but are not limited to: an investment has been declared in default or is distressed; trading in a security has been suspended during the trading day or a security is not actively trading on its principal exchange; prices received from a regular pricing source are deemed unreliable; or there is a foreign market holiday and no trading occurred.
The fund monitors for significant events occurring after the close of an investment’s primary exchange but before the fund’s net asset value per share is determined. Significant events may include, but are not limited to: corporate announcements and transactions; governmental action and political unrest that could impact a specific investment or an investment sector; or armed conflicts, natural disasters and similar events that could
affect investments in a specific country or region. The fund also monitors for significant fluctuations between domestic and foreign markets, as evidenced by the U.S. market or such other indicators that the Board of Directors, or its delegate, deems appropriate. If significant fluctuations in foreign markets are identified, the fund may apply a model-derived factor to the closing price of equity securities traded on foreign securities exchanges. The factor is based on observable market data as provided by an independent pricing service.
Security Transactions — Security transactions are accounted for as of the trade date. Net realized gains and losses are determined on the identified cost basis, which is also used for federal income tax purposes.
Investment Income — Dividend income less foreign taxes withheld, if any, is recorded as of the ex-dividend date. Distributions received on securities that represent a return of capital or long-term capital gain are recorded as a reduction of cost of investments and/or as a realized gain. The fund may estimate the components of distributions received that may be considered nontaxable distributions or long-term capital gain distributions for income tax purposes. Interest income is recorded on the accrual basis and includes accretion of discounts and amortization of premiums.
Securities Sold Short — The fund enters into short sales, which is selling securities it does not own, as part of its normal investment activities. Upon selling a security short, the fund will segregate cash, cash equivalents or other appropriate liquid securities in at least an amount equal to the current market value of the securities sold short until the fund replaces the borrowed security. Interest earned on segregated cash for securities sold short is reflected as interest income. The fund is required to pay any dividends or interest due on securities sold short. Such dividends and interest are recorded as an expense. The fund may pay fees or charges to the broker on the assets borrowed for securities sold short. These fees are calculated daily based upon the value of each security sold short and a rate that is dependent on the availability of such security. Liabilities for securities sold short are valued daily and changes in value are recorded as change in net unrealized appreciation (depreciation) on securities sold short. The fund records realized gain (loss) on a security sold short when it is terminated by the fund and includes as a component of net realized gain (loss) on securities sold short transactions.
Repurchase Agreements — The fund may enter into repurchase agreements with institutions that American Century Investment Management, Inc. (ACIM) (the investment advisor) has determined are creditworthy pursuant to criteria adopted by the Board of Directors. The fund requires that the collateral, represented by securities, received in a repurchase transaction be transferred to the custodian in a manner sufficient to enable the fund to obtain those securities in the event of a default under the repurchase agreement. ACIM monitors, on a daily basis, the securities transferred to ensure the value, including accrued interest, of the securities under each repurchase agreement is equal to or greater than amounts owed to the fund under each repurchase agreement.
Joint Trading Account — Pursuant to an Exemptive Order issued by the Securities and Exchange Commission, the fund, along with certain other funds in the American Century Investments family of funds, may transfer uninvested cash balances into a joint trading account. These balances are invested in one or more repurchase agreements that are collateralized by U.S. Treasury or Agency obligations.
Segregated Assets — In accordance with the 1940 Act, the fund segregates assets on its books and records to cover certain types of investments, including, but not limited to, futures contracts and short sales. ACIM monitors, on a daily basis, the securities segregated to ensure the fund designates a sufficient amount of liquid assets, marked-to-market daily. The fund may also receive assets or be required to pledge assets at the custodian bank or with a broker for margin requirements on futures contracts and short sales.
Income Tax Status — It is the fund’s policy to distribute substantially all net investment income and net realized gains to shareholders and to otherwise qualify as a regulated investment company under provisions of the Internal Revenue Code. Accordingly, no provision has been made for income taxes. The fund files U.S. federal, state, local and non-U.S. tax returns as applicable. The fund's tax returns are subject to examination by the relevant taxing authority until expiration of the applicable statute of limitations, which is generally three years from the date of filing but can be longer in certain jurisdictions. At this time, management believes there are no uncertain tax positions which, based on their technical merit, would not be sustained upon examination and for which it is reasonably possible that the total amounts of unrecognized tax benefits will significantly change in the next twelve months.
Distributions to Shareholders — Distributions from net investment income, if any, are generally declared and paid semiannually. Distributions from net realized gains, if any, are generally declared and paid annually.
Indemnifications — Under the corporation’s organizational documents, its officers and directors are indemnified against certain liabilities arising out of the performance of their duties to the fund. In addition, in the normal course of business, the fund enters into contracts that provide general indemnifications. The maximum exposure under these arrangements is unknown as this would involve future claims that may be made against a fund. The risk of material loss from such claims is considered by management to be remote.
Statement of Cash Flows — The Statement of Cash Flows has been prepared using the indirect method which requires net increase (decrease) in net assets resulting from operations to be adjusted to reconcile to net cash from (used in) operating activities. The beginning of period and end of period cash is the amount of domestic and foreign currency included in the fund's Statement of Assets and Liabilities and represents the cash on hand at the custodian bank and does not include any short-term investments or deposits with brokers for securities sold short.
3. Fees and Transactions with Related Parties
Certain officers and directors of the corporation are also officers and/or directors of American Century Companies, Inc. (ACC). The corporation’s investment advisor, ACIM, the corporation's distributor, American Century Investment Services, Inc., and the corporation’s transfer agent, American Century Services, LLC, are wholly owned, directly or indirectly, by ACC. Various funds issued by American Century Asset Allocation Portfolios, Inc. own, in aggregate, 100% of the shares of the fund. Related parties do not invest in the fund for the purpose of exercising management or control.
Management Fees — The corporation has entered into a management agreement with ACIM, under which ACIM provides the fund with investment advisory and management services in exchange for a single, unified management fee (the fee). The agreement provides that all expenses of managing and operating the fund, except distribution and service fees, expenses on securities sold short, brokerage expenses, taxes, interest, fees and expenses of the independent directors (including legal counsel fees), and extraordinary expenses, will be paid by ACIM. The fee is computed and accrued daily based on the daily net assets of the fund and paid monthly in arrears. The fee consists of (1) an Investment Category Fee based on the daily net assets of the fund and certain other accounts managed by the investment advisor that are in the same broad investment category as the fund and (2) a Complex Fee based on the assets of all the funds in the American Century Investments family of funds. The rates for the Investment Category Fee range from 0.9680% to 1.1500%. The rates for the Complex Fee range from 0.0500% to 0.1100%. The effective annual management fee for the year ended June 30, 2015 was 1.09%.
Directors' Fees and Expenses — The Board of Directors is responsible for overseeing the investment advisor’s management and operations of the fund. The directors receive detailed information about the fund and its investment advisor regularly throughout the year, and meet at least quarterly with management of the investment advisor to review reports about fund operations. The fund’s officers do not receive compensation from the fund.
4. Investment Transactions
Purchases and sales of investment securities and securities sold short, excluding short-term investments, for the year ended June 30, 2015 were $647,578,244 and $575,396,756, respectively.
5. Fair Value Measurements
The fund’s investments valuation process is based on several considerations and may use multiple inputs to determine the fair value of the investments held by the fund. In conformity with accounting principles generally accepted in the United States of America, the inputs used to determine a valuation are classified into three broad levels.
| |
| • | Level 1 valuation inputs consist of unadjusted quoted prices in an active market for identical investments. |
| |
| • | Level 2 valuation inputs consist of direct or indirect observable market data (including quoted prices for comparable investments, evaluations of subsequent market events, interest rates, prepayment speeds, credit risk, etc.). These inputs also consist of quoted prices for identical investments initially expressed in local currencies that are adjusted through translation into U.S. dollars. |
| |
| • | Level 3 valuation inputs consist of unobservable data (including a fund’s own assumptions). |
The level classification is based on the lowest level input that is significant to the fair valuation measurement. The valuation inputs are not necessarily an indication of the risks associated with investing in these securities or other financial instruments. There were no significant transfers between levels during the period.
The following is a summary of the level classifications as of period end. The Schedule of Investments provides additional information on the fund’s portfolio holdings.
|
| | | | | | | | |
| | Level 1 | Level 2 | Level 3 |
| Assets |
| Investment Securities | | | |
| Common Stocks | $ | 606,135,248 |
| — |
| — |
|
| Temporary Cash Investments | 665,917 |
| $ | 3,351,048 |
| — |
|
| | $ | 606,801,165 |
| $ | 3,351,048 |
| — |
|
| | | | |
| Liabilities |
| Securities Sold Short | | | |
| Common Stocks | $ | (139,158,784 | ) | — |
| — |
|
6. Risk Factors
The fund is subject to short sales risk. If the market price of a security increases after the fund borrows the security, the fund may suffer a loss when it replaces the borrowed security at the higher price. Any loss will be increased by the amount of compensation, interest or dividends, and transaction costs the fund must pay to the lender of the borrowed security.
The fund's investment strategy utilizes leverage, which can increase market exposure and subject the fund to greater risk and higher volatility.
If the fund is overweighted in a stock or sector, any negative development related to that stock or sector will have a greater impact on the fund than other funds that are not overweighted in that stock or sector.
The fund’s investment process may result in high portfolio turnover, which could mean high transaction costs, affecting both performance and capital gains tax liabilities to investors.
7. Federal Tax Information
The tax character of distributions paid during the years ended June 30, 2015 and June 30, 2014 were as follows:
|
| | | | | | |
| | 2015 | 2014 |
| Distributions Paid From | | |
| Ordinary income | $ | 8,267,044 |
| $ | 6,818,382 |
|
| Long-term capital gains | $ | 39,239,551 |
| $ | 14,269,407 |
|
The book-basis character of distributions made during the year from net investment income or net realized gains may differ from their ultimate characterization for federal income tax purposes. These differences reflect the differing character of certain income items and net realized gains and losses for financial statement and tax purposes, and may result in reclassification among certain capital accounts on the financial statements.
As of June 30, 2015, the federal tax cost of investments and the components of distributable earnings on a tax-basis were as follows:
|
| | | |
| Federal tax cost of investments | $ | 556,266,458 |
|
| Gross tax appreciation of investments | $ | 77,687,048 |
|
| Gross tax depreciation of investments | (23,801,293 | ) |
| Net tax appreciation (depreciation) of investments | 53,885,755 |
|
| Net tax appreciation (depreciation) on securities sold short | (2,513,179 | ) |
| Net tax appreciation (depreciation) | $ | 51,372,576 |
|
| Undistributed ordinary income | $ | 241,436 |
|
| Accumulated long-term gains | $ | 30,687,471 |
|
| Post-October capital loss deferral | $ | (1,047,012 | ) |
The difference between book-basis and tax-basis unrealized appreciation (depreciation) is attributable primarily to deferral of losses on unsettled short positions.
Loss deferrals represent certain qualified losses that the fund has elected to treat as having been incurred in the following fiscal year for federal income tax purposes.
|
| | | | | | | | | | | | | | | | |
| For a Share Outstanding Throughout the Years Ended June 30 (except as noted) |
| Per-Share Data | | | | | | | | Ratios and Supplemental Data | | |
| | | Income From Investment Operations: | Distributions From: | | | Ratio to Average Net Assets of: | | |
| | Net Asset Value, Beginning of Period | Net Investment Income (Loss)(1) | Net Realized and Unrealized Gain (Loss) | Total From Investment Operations | Net Investment Income | Net Realized Gains | Total Distributions | Net Asset Value, End of Period | Total Return(2) | Operating Expenses | Operating Expenses (excluding expenses on securities sold short) | Net Investment Income (Loss) | Portfolio Turnover Rate | Net Assets, End of Period (in thousands) |
| Institutional Class | | | | | | | | | | | |
| 2015 | $15.55 | 0.16 | 0.58 | 0.74 | (0.14) | (1.74) | (1.88) | $14.41 | 4.86% | 1.53% | 1.10% | 1.03% | 106% |
| $474,697 |
|
| 2014 | $13.05 | 0.13 | 3.33 | 3.46 | (0.12) | (0.84) | (0.96) | $15.55 | 27.10% | 1.57% | 1.10% | 0.88% | 104% |
| $386,877 |
|
| 2013 | $10.95 | 0.16 | 2.26 | 2.42 | (0.18) | (0.14) | (0.32) | $13.05 | 22.54% | 1.66% | 1.10% | 1.35% | 111% |
| $267,576 |
|
2012(3) | $10.00 | 0.03 | 0.92 | 0.95 | —(4) | — | —(4) | $10.95 | 9.55% | 1.86%(5) | 1.11%(5) | 0.53%(5) | 81% |
| $188,648 |
|
|
|
| Notes to Financial Highlights |
| |
| (1) | Computed using average shares outstanding throughout the period. |
| |
| (2) | Total returns are calculated based on the net asset value of the last business day. Total returns for periods less than one year are not annualized. |
| |
| (3) | December 1, 2011 (fund inception) through June 30, 2012. |
| |
| (4) | Per-share amount was less than $0.005. |
See Notes to Financial Statements.
|
|
| Report of Independent Registered Public Accounting Firm |
To the Directors of the American Century Quantitative Equity Funds, Inc. and Shareholders of the
NT Core Equity Plus Fund:
In our opinion, the accompanying statement of assets and liabilities, including the schedule of investments, and the related statements of operations, of changes in net assets and of cash flows and the financial highlights present fairly, in all material respects, the financial position of the NT Core Equity Plus Fund (one of the sixteen funds comprising the American Century Quantitative Equity Funds, Inc., hereafter referred to as the “Fund”) at June 30, 2015, the results of its operations and its cash flows for the year then ended, the changes in its net assets for each of the two years in the period then ended and the financial highlights for each of the periods presented, in conformity with accounting principles generally accepted in the United States of America. These financial statements and financial highlights (hereafter referred to as "financial statements") are the responsibility of the Fund's management. Our responsibility is to express an opinion on these financial statements based on our audits. We conducted our audits of these financial statements in accordance with the standards of the Public Company Accounting Oversight Board (United States). Those standards require that we plan and perform the audit to obtain reasonable assurance about whether the financial statements are free of material misstatement. An audit includes examining, on a test basis, evidence supporting the amounts and disclosures in the financial statements, assessing the accounting principles used and significant estimates made by management, and evaluating the overall financial statement presentation. We believe that our audits, which included confirmation of securities at June 30, 2015 by correspondence with the custodian and brokers, provide a reasonable basis for our opinion.
PricewaterhouseCoopers LLP
Kansas City, Missouri
August 21, 2015
Board of Directors
The individuals listed below serve as directors of the funds. Each director will continue to serve in this capacity until death, retirement, resignation or removal from office. The board has adopted a mandatory retirement age for directors who are not “interested persons,” as that term is defined in the Investment Company Act (independent directors). Independent directors shall retire on December 31 of the year in which they reach their 75th birthday; provided, however, that on or after January 1, 2022, independent directors shall retire on December 31 of the year in which they reach their 76th birthday.
Mr. Thomas is an “interested person” because he currently serves as President and Chief Executive Officer of American Century Companies, Inc. (ACC), the parent company of American Century Investment Management, Inc. (ACIM or the advisor). The other directors (more than three-fourths of the total number) are independent. They are not employees, directors or officers of, and have no financial interest in, ACC or any of its wholly owned, direct or indirect, subsidiaries, including ACIM, American Century Investment Services, Inc. (ACIS) and American Century Services, LLC (ACS), and they do not have any other affiliations, positions or relationships that would cause them to be considered “interested persons” under the Investment Company Act. The directors serve in this capacity for eight (in the case of Mr. Thomas, 15) registered investment companies in the American Century Investments family of funds.
The following table presents additional information about the directors. The mailing address for each director other than Mr. Thomas is 1665 Charleston Road, Mountain View, California 94043. The mailing address for Mr. Thomas is 4500 Main Street, Kansas City, Missouri 64111.
|
| | | | | |
Name (Year of Birth) | Position(s) Held with Funds | Length of Time Served | Principal Occupation(s) During Past 5 Years | Number of American Century Portfolios Overseen by Director | Other Directorships Held During Past 5 Years |
Independent Directors | | |
Tanya S. Beder
(1955) | Director | Since 2011 | Chairman and CEO, SBCC Group Inc. (independent advisory services) (2006 to present) | 46 | CYS Investments, Inc. (NYSE mortgage arbitrage REIT) |
Jeremy I. Bulow
(1954) | Director | Since 2011 | Professor of Economics, Stanford University, Graduate School of Business (1979 to present) | 46 | None |
Ronald J. Gilson
(1946) | Director and Chairman of the Board | Since 1995
(Chairman since 2005) | Charles J. Meyers Professor of Law and Business, Stanford Law School (1979 to present); Marc and Eva Stern Professor of Law and Business, Columbia University School of Law (1992 to present) | 46 | None |
Frederick L. A. Grauer
(1946) | Director | Since 2008 | Senior Advisor, BlackRock, Inc. (investment management firm) (2010 to 2011, 2013 to present) | 46 | None |
Peter F. Pervere
(1947) | Director | Since 2007 | Retired | 46 | None |
|
| | | | | |
Name (Year of Birth) | Position(s) Held with Funds | Length of Time Served | Principal Occupation(s) During Past 5 Years | Number of American Century Portfolios Overseen by Director | Other Directorships Held During Past 5 Years |
| Independent Directors | | |
John B. Shoven
(1947) | Director | Since 2002 | Professor of Economics, Stanford University (1973 to present) | 46 | Cadence Design Systems; Exponent; Financial Engines |
| Interested Director | | |
Jonathan S. Thomas
(1963) | Director and President | Since 2007 | President and Chief Executive Officer, ACC (March 2007 to present). Also serves as Chief Executive Officer, ACS; Executive Vice President, ACIM; Director, ACC, ACIM and other ACC subsidiaries | 124 | BioMed Valley Discoveries, Inc. |
The Statement of Additional Information has additional information about the fund's directors and is available without charge, upon request, by calling 1-800-345-2021.
Officers
The following table presents certain information about the executive officers of the funds. Each officer serves as an officer for each of the 15 investment companies in the American Century family of funds, unless otherwise noted. No officer is compensated for his or her service as an officer of the funds. The listed officers are interested persons of the funds and are appointed or re-appointed on an annual basis. The mailing address for each of the officers listed below is 4500 Main Street, Kansas City, Missouri 64111.
|
| | |
Name (Year of Birth) | Offices with
the Funds | Principal Occupation(s) During the Past Five Years |
Jonathan S.
Thomas
(1963) | Director and President
since 2007 | President and Chief Executive Officer, ACC (March 2007 to present). Also serves as Chief Executive Officer, ACS; Executive Vice President, ACIM; Director, ACC, ACIM and other ACC subsidiaries |
Amy D. Shelton
(1964) | Chief Compliance Officer and Vice President since 2014 | Chief Compliance Officer, American Century funds, (March 2014 to present); Chief Compliance Officer, ACIM (February 2014 to present); Chief Compliance Officer, ACIS (October 2009 to present); Vice President, Client Interactions and Marketing, ACIS (February 2013 to January 2014); Director, Client Interactions and Marketing, ACIS (June 2007 to January 2013). Also serves as Vice President, ACIS |
Charles A. Etherington
(1957) | General Counsel since 2007 and Senior Vice President since 2006 | Attorney, ACC (February 1994 to present); Vice President, ACC (November 2005 to present); General Counsel, ACC (March 2007 to present). Also serves as General Counsel, ACIM, ACS, ACIS and other ACC subsidiaries; and Senior Vice President, ACIM and ACS |
C. Jean Wade
(1964) | Vice President,
Treasurer and
Chief Financial
Officer since 2012 | Vice President, ACS (February 2000 to present) |
Robert J. Leach
(1966) | Vice President
since 2006 and
Assistant Treasurer
since 2012 | Vice President, ACS (February 2000 to present) |
David H. Reinmiller
(1963) | Vice President since 2001 | Attorney, ACC (January 1994 to present); Associate General Counsel, ACC (January 2001 to present). Also serves as Vice President, ACIM and ACS |
Ward D. Stauffer
(1960) | Secretary since 2005 | Attorney, ACC (June 2003 to present) |
|
|
| Approval of Management Agreement |
At a meeting held on June 16, 2015, the Fund’s Board of Directors unanimously approved the renewal of the management agreement pursuant to which American Century Investment Management, Inc. (the “Advisor”) acts as the investment advisor for the Fund. Under Section 15(c) of the Investment Company Act, contracts for investment advisory services are required to be reviewed, evaluated, and approved by a majority of a fund’s directors/trustees, including a majority of the independent Directors, each year. The Board regards this annual evaluation and renewal as one of its most important responsibilities.
The independent Directors have memorialized a statement regarding the relationship between their ongoing obligations to oversee and evaluate the performance of the Advisor and their annual consideration of renewal of the management agreement. In that statement, the independent Directors noted that their assessment of the Advisor’s performance is an ongoing process that takes place over the entire year and is informed by all of the extensive information that the Board and its committees receive and consider over time. This information, together with the materials provided in connection with the review, are central to the Board’s assessment of the Advisor’s performance and its determination whether to renew the Fund’s management agreement.
Prior to its consideration of the renewal of the management agreement, the Board requested and reviewed extensive data and analysis relating to the proposed renewal. This information and analysis was compiled by the Advisor and certain independent providers of evaluation data concerning the Fund and the services provided to the Fund by the Advisor.
In connection with its consideration of the renewal of the management agreement, the Board’s review and evaluation of the services provided by the Advisor included, but was not limited to, the following:
| |
| • | the nature, extent, and quality of investment management, shareholder services, and other services provided by the Advisor to the Fund; |
| |
| • | the wide range of other programs and services the Advisor provides to the Fund and its shareholders on a routine and non-routine basis; |
| |
| • | the investment performance of the Fund, including data comparing the Fund’s performance to appropriate benchmarks and/or a peer group of other mutual funds with similar investment objectives and strategies; |
| |
| • | the cost of owning the Fund compared to the cost of owning similar funds; |
| |
| • | the Advisor’s compliance policies, procedures, and regulatory experience; |
| |
| • | financial data showing the cost of services provided to the Fund, the profitability of the Fund to the Advisor, and the overall profitability of the Advisor; |
| |
| • | possible economies of scale associated with the Advisor’s management of the Fund and other accounts under its management; |
| |
| • | data comparing services provided and charges to other investment management clients of the Advisor; |
| |
| • | acquired fund fees and expenses; |
| |
| • | payments by the Fund and the Advisor to financial intermediaries whose clients are investors in the Fund; and |
| |
| • | any collateral benefits derived by the Advisor from the management of the Fund. |
In keeping with its practice, the Board held two in-person meetings to review and discuss the information provided in response to their request. The independent Directors also had the benefit of the advice of their independent counsel throughout the process.
Factors Considered
The Directors considered all of the information provided by the Advisor, the independent data providers, and the independent Directors’ independent counsel in connection with the review, and evaluated such information for the Fund. In connection with their review, the Directors did not identify any single factor as being all-important or controlling and each Director may have attributed different levels of importance to different factors. In deciding to renew the management agreement, the Board based its decision on a number of factors, including the following:
Nature, Extent and Quality of Services - Generally. Under the management agreement, the Advisor is responsible for providing or arranging for all services necessary for the operation of the Fund. The Board noted that under the management agreement, the Advisor provides or arranges at its own expense a wide variety of services including:
| |
| • | constructing and designing the Fund |
| |
| • | portfolio research and security selection |
| |
| • | initial capitalization/funding |
| |
| • | daily valuation of the Fund’s portfolio |
| |
| • | shareholder servicing and transfer agency, including shareholder confirmations, recordkeeping, and communications |
| |
| • | legal services (except the independent Directors’ counsel) |
| |
| • | regulatory and portfolio compliance |
| |
| • | marketing and distribution (except amounts paid by the Fund under Rule 12b-1 plans) |
The Board noted that many of these services have expanded over time both in terms of quantity and complexity in response to shareholder demands, competition in the industry, changing distribution channels, and the changing regulatory environment.
Investment Management, Shareholder, and Other Services. The nature of the investment management services provided to the Fund is quite complex and allows Fund shareholders access to professional money management, instant diversification of their investments within an asset class, the opportunity to easily diversify among asset classes by investing in or exchanging among various American Century Investments funds, and liquidity. In evaluating investment performance, the Board expects the Advisor to manage the Fund in accordance with its investment objectives and approved strategies. Further, the Directors recognize that the Advisor has an obligation to seek the best execution of fund trades. In providing these services, the Advisor utilizes teams of investment professionals (portfolio managers, analysts, research assistants, and securities traders) who require extensive information technology, research, training, compliance, and other systems to conduct their business. The Board, directly and through its Portfolio Committee, regularly reviews investment performance information for the Fund, together with comparative information for appropriate benchmarks and/or peer groups of similarly-managed funds, over different time horizons. The Directors also review detailed performance information during the management agreement approval process. If performance concerns are identified, the Fund receives special reviews until performance improves, during which the Board discusses with the Advisor the reasons for such results (e.g., market conditions, security selection) and any efforts being undertaken to improve performance. The Fund’s performance was above its benchmark for the one- and three-year periods reviewed by the Board. The Board found the investment management services provided by the Advisor to the Fund to be satisfactory and consistent with the management agreement.
Under the management agreement, the Advisor provides the Fund with a comprehensive package of transfer agency, shareholder, and other services. The Board, directly and through various committees of the Board, regularly reviews reports and evaluations of such services at its regular
meetings. These reports include, but are not limited to, information regarding the operational efficiency and accuracy of the shareholder and transfer agency services provided, staffing levels, shareholder satisfaction (as measured by external as well as internal sources), technology support, new products and services offered to Fund shareholders, securities trading activities, portfolio valuation services, auditing services, and legal and operational compliance activities.
Certain aspects of shareholder and transfer agency service level efficiency and the quality of securities trading activities are measured by independent third party providers and are presented in comparison to other fund groups not managed by the Advisor. The Board found the services provided by the Advisor to the Fund under the management agreement to be competitive and of high quality.
Costs of Services and Profitability. The Advisor provides detailed information concerning its cost of providing various services to the Fund, its profitability in managing the Fund, its overall profitability, and its financial condition. The Directors have reviewed with the Advisor the methodology used to prepare this financial information. This information is considered in evaluating the Advisor’s financial condition, its ability to continue to provide services under the management agreement, and the reasonableness of the current management fee. The Board concluded that the Advisor’s profits were reasonable in light of the services provided to the Fund.
Ethics. The Board generally considers the Advisor’s commitment to providing quality services to shareholders and to conducting its business ethically. They noted that the Advisor’s practices generally meet or exceed industry best practices.
Economies of Scale. The Board also reviewed information provided by the Advisor regarding the possible existence of economies of scale in connection with the management of the Fund. The Board concluded that economies of scale are difficult to measure and predict with precision, especially on a fund-by-fund basis. The Board concluded that the Advisor is appropriately sharing economies of scale through its competitive fee structure, offering competitive fees from fund inception, and through reinvestment in its business to provide shareholders enhanced and expanded services.
Comparison to Other Funds’ Fees. The management agreement provides that the Fund pays the Advisor a single, all-inclusive (or unified) management fee for providing all services necessary for the management and operation of the Fund, other than brokerage expenses, taxes, interest, extraordinary expenses, the fees and expenses of the Fund’s independent Directors (including their independent legal counsel), and expenses incurred in connection with the provision of shareholder services and distribution services under a plan adopted pursuant to Rule 12b-1 under the 1940 Act. Under the unified fee structure, the Advisor is responsible for providing all investment advisory, custody, audit, administrative, compliance, recordkeeping, marketing, and shareholder services, or arranging and supervising third parties to provide such services. By contrast, most other funds are charged a variety of fees, including an investment advisory fee, a transfer agency fee, an administrative fee, distribution charges, and other expenses. Other than their investment advisory fees and any applicable Rule 12b-1 fees, all other components of the total fees charged by these other funds may be increased without shareholder approval. The Board believes the unified fee structure is a benefit to Fund shareholders because it clearly discloses to shareholders the cost of owning Fund shares, and, since the unified fee cannot be increased without a vote of Fund shareholders, it shifts to the Advisor the risk of increased costs of operating the Fund and provides a direct incentive to minimize administrative inefficiencies. Part of the Board’s analysis of fee levels involves reviewing certain evaluative data compiled by an independent provider and comparing the Fund’s unified fee to the total expense ratio of peer funds. The unified fee charged to shareholders of the Fund was below the median of the total expense ratios of the Fund’s peer group. The Board concluded that the management fee paid by the Fund to the Advisor under the management agreement is reasonable in light of the services provided to the Fund.
Comparison to Fees and Services Provided to Other Clients of the Advisor. The Board also requested and received information from the Advisor concerning the nature of the services, fees, costs, and profitability of its advisory services to advisory clients other than the Fund. They observed that these varying types of client accounts require different services and involve different regulatory and entrepreneurial risks than the management of the Fund. The Board analyzed this information and concluded that the fees charged and services provided to the Fund were reasonable by comparison.
Payments to Intermediaries. The Directors also requested and received a description of payments made to intermediaries by the Fund and the Advisor. These payments include various payments made by the Fund or the Advisor to different types of intermediaries and recordkeepers for distribution and service activities provided for the Fund.
Collateral or “Fall-Out” Benefits Derived by the Advisor. The Board considered the existence of collateral benefits the Advisor may receive as a result of its relationship with the Fund. The Board noted that the Advisor’s primary business is managing mutual funds and it generally does not use fund or shareholder information to generate profits in other lines of business, and therefore does not derive any significant collateral benefits from them. The Board noted that the Advisor receives proprietary research from broker-dealers that execute fund portfolio transactions. The Board also determined that the Advisor is able to provide investment management services to certain clients other than the Fund, at least in part, due to its existing infrastructure built to serve the fund complex.
Existing Relationship. The Board also considered whether there was any reason for not continuing the existing arrangement with the Advisor. In this regard, the Board was mindful of the potential disruptions of the Fund’s operations and various risks, uncertainties, and other effects that could occur as a result of a decision not to continue such relationship. In particular, the Board recognized that most shareholders have invested in the Fund on the strength of the Advisor’s industry standing and reputation and in the expectation that the Advisor will have a continuing role in providing advisory services to the Fund.
Conclusion of the Directors. As a result of this process, the Board, including all of the independent Directors and assisted by the advice of independent legal counsel, taking into account all of the factors discussed above and the information provided by the Advisor and others in connection with its review and throughout the year, concluded that the management agreement between the Fund and the Advisor is fair and reasonable in light of the services provided and should be renewed.
Retirement Account Information
As required by law, distributions you receive from certain IRAs are subject to federal income tax withholding, unless you elect not to have withholding apply. Tax will be withheld on the total amount withdrawn even though you may be receiving amounts that are not subject to withholding, such as nondeductible contributions. In such case, excess amounts of withholding could occur. You may adjust your withholding election so that a greater or lesser amount will be withheld.
If you don’t want us to withhold on this amount, you must notify us to not withhold the federal income tax. You may notify us in writing or in certain situations by telephone or through other electronic means. For systematic withdrawals, your withholding election will remain in effect until revoked or changed by filing a new election. You have the right to revoke your election at any time.
Remember, even if you elect not to have income tax withheld, you are liable for paying income tax on the taxable portion of your withdrawal. If you elect not to have income tax withheld or you don’t have enough income tax withheld, you may be responsible for payment of estimated tax. You may incur penalties under the estimated tax rules if your withholding and estimated tax payments are not sufficient. You can reduce or defer the income tax on a distribution by directly or indirectly rolling such distribution over to another IRA or eligible plan. You should consult your tax advisor for additional information.
State tax will be withheld if, at the time of your distribution, your address is within one of the mandatory withholding states and you have federal income tax withheld (or as otherwise required by state law). State taxes will be withheld from your distribution in accordance with the respective state rules.
Distributions you receive from 403(b), 457 and qualified plans are subject to special tax and withholding rules. Your plan administrator or plan sponsor is required to provide you with a special tax notice explaining those rules at the time you request a distribution. If applicable, federal and/or state taxes may be withheld from your distribution amount.
Proxy Voting Policies
Descriptions of the principles and policies that the fund's investment advisor uses in exercising the voting rights associated with the securities purchased and/or held by the fund are available without charge, upon request, by calling 1-800-345-2021 or visiting the "About Us" page of American Century Investments’ website at americancentury.com. A description of the policies is also available on the Securities and Exchange Commission’s website at sec.gov. Information regarding how the investment advisor voted proxies relating to portfolio securities during the most recent 12-month period ended June 30 is available on the "About Us" page at americancentury.com. It is also available at sec.gov.
Quarterly Portfolio Disclosure
The fund files its complete schedule of portfolio holdings with the Securities and Exchange Commission (SEC) for the first and third quarters of each fiscal year on Form N-Q. The fund’s Forms N-Q are available on the SEC’s website at sec.gov, and may be reviewed and copied at the SEC’s Public Reference Room in Washington, DC. Information on the operation of the Public Reference Room may be obtained by calling 1-800-SEC-0330. The fund also makes its complete schedule of portfolio holdings for the most recent quarter of its fiscal year available on its website at americancentury.com and, upon request, by calling 1-800-345-2021.
Other Tax Information
The following information is provided pursuant to provisions of the Internal Revenue Code.
The fund hereby designates up to the maximum amount allowable as qualified dividend income for the fiscal year ended June 30, 2015.
For corporate taxpayers, the fund hereby designates $8,267,044, or up to the maximum amount allowable, of ordinary income distributions paid during the fiscal year ended June 30, 2015 as qualified for the corporate dividends received deduction.
The fund hereby designates $4,151,872 as qualified short-term capital gain distributions for purposes of Internal Revenue Code Section 871 for the fiscal year ended June 30, 2015.
The fund hereby designates $39,239,551, or up to the maximum amount allowable, as long-term capital gain distributions for the fiscal year ended June 30, 2015.
|
| | |
| |
| | | |
| Contact Us | americancentury.com | |
| Automated Information Line | 1-800-345-8765 | |
| Investor Services Representative | 1-800-345-2021
or 816-531-5575 | |
| Investors Using Advisors | 1-800-378-9878 | |
Business, Not-For-Profit, Employer-Sponsored
Retirement Plans | 1-800-345-3533 | |
Banks and Trust Companies, Broker-Dealers,
Financial Professionals, Insurance Companies | 1-800-345-6488 | |
| Telecommunications Relay Service for the Deaf | 711 | |
| | | |
| American Century Quantitative Equity Funds, Inc. | |
| | | |
Investment Advisor: American Century Investment Management, Inc. Kansas City, Missouri | |
| | | |
| This report and the statements it contains are submitted for the general information of our shareholders. The report is not authorized for distribution to prospective investors unless preceded or accompanied by an effective prospectus. | |
| | | |
©2015 American Century Proprietary Holdings, Inc. All rights reserved.
CL-ANN-86516 1508 | |
|
| |
| ANNUAL REPORT | JUNE 30, 2015 |
NT Disciplined Growth Fund
|
| | |
| Performance | 2 |
|
| Portfolio Commentary | |
|
| Fund Characteristics | |
|
| Shareholder Fee Example | |
|
| Schedule of Investments | |
|
| Statement of Assets and Liabilities | |
|
| Statement of Operations | |
|
| Statement of Changes in Net Assets | |
|
| Notes to Financial Statements | |
|
| Financial Highlights | |
|
| Report of Independent Registered Public Accounting Firm | |
|
| Management | |
|
| Approval of Management Agreement | |
|
| Additional Information | |
|
Any opinions expressed in this report reflect those of the author as of the date of the report, and do not necessarily represent the opinions of American Century Investments® or any other person in the American Century Investments organization. Any such opinions are subject to change at any time based upon market or other conditions and American Century Investments disclaims any responsibility to update such opinions. These opinions may not be relied upon as investment advice and, because investment decisions made by American Century Investments funds are based on numerous factors, may not be relied upon as an indication of trading intent on behalf of any American Century Investments fund. Security examples are used for representational purposes only and are not intended as recommendations to purchase or sell securities. Performance information for comparative indices and securities is provided to American Century Investments by third party vendors. To the best of American Century Investments’ knowledge, such information is accurate at the time of printing.
|
| | | |
| Total Returns as of June 30, 2015 |
| | Ticker Symbol | Since Inception(1) | Inception Date |
| Investor Class | ANTDX | -2.30% | 3/19/15 |
| Russell 1000 Growth Index | — | -1.01% | — |
| Institutional Class | ANDGX | -2.20% | 3/19/15 |
| |
| (1) | Total returns for periods less than one year are not annualized. |
|
| |
| Total Annual Fund Operating Expenses |
| Investor Class | Institutional Class |
| 1.03% | 0.83% |
The total annual fund operating expenses shown is as stated in the fund’s prospectus current as of the date of this report. The prospectus may vary from the expense ratio shown elsewhere in this report because it is based on a different time period, includes acquired fund fees and expenses, and, if applicable, does not include fee waivers or expense reimbursements.
Data presented reflect past performance. Past performance is no guarantee of future results. Current performance may be higher or lower than the performance shown. Investment return and principal value will fluctuate, and redemption value may be more or less than original cost. Data assumes reinvestment of dividends and capital gains, and none of the charts reflect the deduction of taxes that a shareholder would pay on fund distributions or the redemption of fund shares. To obtain performance data current to the most recent month end, please call 1-800-345-2021 or visit americancentury.com. For additional information about the fund, please consult the prospectus.
Portfolio Managers: Bill Martin and Lynette Pang
Performance Summary
NT Disciplined Growth returned -2.20%* for the partial period from March 19, 2015 through
June 30, 2015, compared with the -1.01% return of its benchmark, the Russell 1000 Growth Index and the -0.70% return of the broad S&P 500 Index.
U.S. equity markets endured substantial volatility, ending the reporting period with declines. NT Disciplined Growth declined during the period, underperforming its benchmark, the Russell 1000 Growth Index. Security selection in the consumer discretionary sector was a leading detractor from fund results, while health care sector holdings contributed to relative performance.
NT Disciplined Growth’s stock selection process incorporates factors of valuation, quality, growth, and sentiment while striving to minimize unintended risks along industries and other risk characteristics. Within the fund, growth and sentiment were generally rewarded while valuation- and quality-oriented stocks struggled.
Consumer Discretionary Leading Detractor
Overweight positions, relative to the index, in a number of underperforming brick-and-mortar retailers led the consumer discretionary sector to be a leading underperformer. Department store operator Dillard’s was a key detractor, falling on declining sales, which led to weaker-than-expected quarterly financial results. We believe the company remains very attractive on valuation and sentiment insights. Likewise, Kohl’s tumbled after the department store reported disappointing sales despite beating earnings estimates. Despite a difficult quarter, the stock remains attractive across all measures, with sentiment and valuation representing the strongest insights. For-profit education provider Strayer Education weighed on results as lower enrollment due to stricter financial aid funding guidelines imposed on for-profit colleges pressured the company’s revenues. However, the holding remains very attractive across valuation and quality metrics and is strong on sentiment-based factors.
Having no exposure to several internet retailers also detracted. Not owning streaming video provider Netflix was detrimental as the company’s stock reached record highs on accelerating subscriber gains both at home and abroad, which led to strong first-quarter results. Similarly, an underweight in Amazon.com weighed on performance as the internet retailer’s stock price continued to rise on robust earnings, due in part to strength in the company’s cloud computing business. We believe that both stocks demonstrate the market’s preference for expensive growth names, and consider both to be overvalued.
Materials holdings also diminished portfolio gains. An overweight in Southwest Airlines detracted after the company’s stock price fell on investors’ jitters that the sluggish growth rate of the U.S. economy could lead to lower passenger unit revenues. However, Southwest’s earnings and revenues remain strong, and our research continues to show favorable quality, growth, and valuation measures.
| |
| * | All fund returns referenced in this commentary are for Institutional Class shares. Total returns for periods less than one year are not annualized. Performance for other share classes will vary due to differences in fee structure; when Institutional Class performance exceeds that of the fund's benchmark, other share classes may not. See page 2 for returns for all share classes. |
Health Care Sector Leading Relative Contributor
Outperformance across a number of industries helped to position the health care sector as a leading contributor. An overweight position in Gilead Sciences made a substantial contribution. The biopharmaceutical manufacturer’s stock price rallied on better-than-expected quarterly financial results and stronger full year guidance due to robust sales of Harvoni, its hepatitis C treatments. Pharmaceutical company AbbVie’s stock price advanced following unexpectedly strong first-quarter earnings and revenues, which were driven by ongoing strength in sales of its blockbuster anti-inflammatory drug, Humira.
Information technology sector contribution came primarily from security selection in internet software and services providers and positioning among software manufacturers. An overweight position in video game maker Electronic Arts was beneficial. The company’s rising sales, particularly on mobile platforms, led to stronger-than-expected revenues and earnings.
Elsewhere, leading contribution came from cable provider Cablevision, whose stock price benefited from widespread consolidation in the industry and speculation that Cablevision may be an attractive target for acquisition. The position’s quality-based factors are especially strong. A portfolio-only position in Cal-Maine Foods was also successful. The egg producer’s stock rally was driven by the ongoing spread of avian flu, which is expected to decrease the supply of eggs and bolster producers’ prices. We subsequently sold the position, opting to lock in gains in light of industry instability.
A Look Ahead
The U.S. economy seems poised to continue to experience hesitant economic growth through the second half of 2015. Economic activity appears to have somewhat diminished in breadth, though remains slow yet steady. We believe that divergence in monetary policy between the U.S. and much of the rest of the world is likely to continue. Therefore, questions surrounding when and how much the Federal Reserve might act to tighten money supply, and the potential impact of such a move, are likely to continue driving investor sentiment in equity markets. Our disciplined, objective, and systematic investment strategy is designed to take advantage of opportunities at the individual company level. We believe this approach is the most powerful way to capitalize on market inefficiencies that lead to the mispricing of individual stocks. The funds largest overweights are in information technology and industrials, while the underweights are led by the materials and consumer discretionary sectors.
|
| |
| JUNE 30, 2015 |
| Top Ten Holdings | % of net assets |
| Apple, Inc. | 7.5% |
| Gilead Sciences, Inc. | 2.4% |
| Verizon Communications, Inc. | 2.1% |
| Google, Inc., Class A | 2.1% |
| Facebook, Inc., Class A | 2.0% |
| PepsiCo, Inc. | 1.9% |
| Amgen, Inc. | 1.8% |
| AbbVie, Inc. | 1.8% |
| Biogen, Inc. | 1.6% |
| 3M Co. | 1.6% |
| | |
| Top Five Industries | % of net assets |
| Biotechnology | 8.7% |
| Technology Hardware, Storage and Peripherals | 8.4% |
| Software | 6.8% |
| Internet Software and Services | 6.3% |
| Pharmaceuticals | 4.4% |
| | |
| Types of Investments in Portfolio | % of net assets |
| Common Stocks | 99.0% |
| Temporary Cash Investments | 2.0% |
| Other Assets and Liabilities | (1.0)% |
Fund shareholders may incur two types of costs: (1) transaction costs, including sales charges (loads) on purchase payments and redemption/exchange fees; and (2) ongoing costs, including management fees; distribution and service (12b-1) fees; and other fund expenses. This example is intended to help you understand your ongoing costs (in dollars) of investing in your fund and to compare these costs with the ongoing cost of investing in other mutual funds.
The example is based on an investment of $1,000 made at the beginning of the period and held for the entire period from January 1, 2015 to June 30, 2015 (except as noted).
Actual Expenses
The table provides information about actual account values and actual expenses for each class. You may use the information, together with the amount you invested, to estimate the expenses that you paid over the period. First, identify the share class you own. Then simply divide your account value by $1,000 (for example, an $8,600 account value divided by $1,000 = 8.6), then multiply the result by the number under the heading “Expenses Paid During Period” to estimate the expenses you paid on your account during this period.
Hypothetical Example for Comparison Purposes
The table also provides information about hypothetical account values and hypothetical expenses based on the actual expense ratio of each class of your fund and an assumed rate of return of 5% per year before expenses, which is not the actual return of a fund’s share class. The hypothetical account values and expenses may not be used to estimate the actual ending account balance or expenses you paid for the period. You may use this information to compare the ongoing costs of investing in your fund and other funds. To do so, compare this 5% hypothetical example with the 5% hypothetical examples that appear in the shareholder reports of the other funds.
Please note that the expenses shown in the table are meant to highlight your ongoing costs only and do not reflect any transactional costs, such as sales charges (loads) or redemption/exchange fees. Therefore, the table is useful in comparing ongoing costs only, and will not help you determine the relative total costs of owning different funds. In addition, if these transactional costs were included, your costs would have been higher. |
| | | | |
| | Beginning
Account Value
1/1/15 | Ending
Account Value
6/30/15 | Expenses Paid
During Period(1)1/1/15 - 6/30/15 | Annualized Expense Ratio(1) |
| Actual | | | | |
| Investor Class | $1,000 | $977.00(2) | $2.84(3) | 1.01% |
| Institutional Class | $1,000 | $978.00(2) | $2.28(3) | 0.81% |
| Hypothetical | | | | |
| Investor Class | $1,000 | $1,019.79(4) | $5.06(4) | 1.01% |
| Institutional Class | $1,000 | $1,020.78(4) | $4.06(4) | 0.81% |
| |
| (1) | Expenses are equal to the class's annualized expense ratio listed in the table above, multiplied by the average account value over the period, multiplied by 181, the number of days in the most recent fiscal half-year, divided by 365, to reflect the one-half year period. |
| |
| (2) | Ending account value based on actual return from March 19, 2015 (fund inception) through June 30, 2015. |
| |
| (3) | Expenses are equal to the class's annualized expense ratio listed in the table above, multiplied by the average account value over the period, multiplied by 104, the number of days in the period from March 19, 2015 (fund inception) through June 30, 2015, divided by 365 to reflect the period. Had the class been available for the full period, the expenses paid during the period would have been higher. |
| |
| (4) | Ending account value and expenses paid during the period assumes the class had been available throughout the entire period and are calculated using the class's annualized expense ratio listed in the table above. |
JUNE 30, 2015
|
| | | | |
| | Shares | Value |
| COMMON STOCKS — 99.0% | | |
| Aerospace and Defense — 3.1% | | |
Astronics Corp.(1) | 34,095 | $ | 2,416,995 |
|
| Boeing Co. (The) | 7,034 | 975,756 |
|
| Honeywell International, Inc. | 36,225 | 3,693,863 |
|
| Huntington Ingalls Industries, Inc. | 28,098 | 3,163,554 |
|
Spirit AeroSystems Holdings, Inc., Class A(1) | 65,696 | 3,620,507 |
|
| | | 13,870,675 |
|
| Airlines — 1.8% | | |
| Southwest Airlines Co. | 120,054 | 3,972,587 |
|
United Continental Holdings, Inc.(1) | 78,713 | 4,172,576 |
|
| | | 8,145,163 |
|
| Beverages — 3.4% | | |
| Coca-Cola Co. (The) | 76,175 | 2,988,345 |
|
| Dr Pepper Snapple Group, Inc. | 50,746 | 3,699,384 |
|
| PepsiCo, Inc. | 90,645 | 8,460,804 |
|
| | | 15,148,533 |
|
| Biotechnology — 8.7% | | |
| Amgen, Inc. | 54,177 | 8,317,253 |
|
Biogen, Inc.(1) | 18,383 | 7,425,629 |
|
Celgene Corp.(1) | 61,930 | 7,167,468 |
|
| Gilead Sciences, Inc. | 91,898 | 10,759,418 |
|
Ophthotech Corp.(1) | 32,910 | 1,713,295 |
|
Regeneron Pharmaceuticals, Inc.(1) | 7,371 | 3,760,168 |
|
| | | 39,143,231 |
|
| Building Products — 0.1% | | |
Continental Building Products, Inc.(1) | 21,588 | 457,450 |
|
| Capital Markets — 1.3% | | |
| Ameriprise Financial, Inc. | 2,209 | 275,970 |
|
| Artisan Partners Asset Management, Inc., Class A | 7,914 | 367,685 |
|
| Franklin Resources, Inc. | 48,529 | 2,379,377 |
|
| Legg Mason, Inc. | 42,668 | 2,198,682 |
|
| Moelis & Co., Class A | 25,137 | 721,683 |
|
| | | 5,943,397 |
|
| Chemicals — 0.8% | | |
| Cabot Corp. | 58,569 | 2,184,038 |
|
| International Flavors & Fragrances, Inc. | 6,252 | 683,281 |
|
| Minerals Technologies, Inc. | 9,900 | 674,487 |
|
| | | 3,541,806 |
|
| Commercial Services and Supplies — 0.7% | | |
| Herman Miller, Inc. | 23,318 | 674,590 |
|
| Pitney Bowes, Inc. | 24,288 | 505,433 |
|
| Waste Management, Inc. | 43,057 | 1,995,692 |
|
| | | 3,175,715 |
|
| Communications Equipment — 1.1% | | |
ARRIS Group, Inc.(1) | 22,976 | 703,065 |
|
|
| | | | |
| | Shares | Value |
F5 Networks, Inc.(1) | 745 | $ | 89,661 |
|
| QUALCOMM, Inc. | 65,716 | 4,115,793 |
|
| | | 4,908,519 |
|
| Containers and Packaging — 0.5% | | |
Berry Plastics Group, Inc.(1) | 71,281 | 2,309,504 |
|
| Diversified Consumer Services — 1.4% | | |
| Capella Education Co. | 4,706 | 252,571 |
|
| H&R Block, Inc. | 123,378 | 3,658,158 |
|
K12, Inc.(1) | 42,591 | 538,776 |
|
Strayer Education, Inc.(1) | 42,120 | 1,815,372 |
|
| | | 6,264,877 |
|
Diversified Financial Services† | | |
| GAIN Capital Holdings, Inc. | 3,271 | 31,271 |
|
| Diversified Telecommunication Services — 2.5% | | |
| CenturyLink, Inc. | 54,529 | 1,602,062 |
|
| Verizon Communications, Inc. | 205,433 | 9,575,232 |
|
| | | 11,177,294 |
|
| Electrical Equipment — 1.9% | | |
| Emerson Electric Co. | 63,000 | 3,492,090 |
|
Enphase Energy, Inc.(1) | 66,181 | 503,638 |
|
| Rockwell Automation, Inc. | 35,374 | 4,409,015 |
|
| | | 8,404,743 |
|
| Electronic Equipment, Instruments and Components — 0.4% | | |
| Corning, Inc. | 91,038 | 1,796,180 |
|
| Energy Equipment and Services — 0.9% | | |
FMC Technologies, Inc.(1) | 4,747 | 196,953 |
|
| Schlumberger Ltd. | 46,558 | 4,012,834 |
|
| | | 4,209,787 |
|
| Food and Staples Retailing — 2.3% | | |
| CVS Health Corp. | 30,061 | 3,152,798 |
|
| Kroger Co. (The) | 68,818 | 4,989,993 |
|
| Wal-Mart Stores, Inc. | 29,239 | 2,073,922 |
|
| | | 10,216,713 |
|
| Food Products — 2.1% | | |
| Archer-Daniels-Midland Co. | 44,433 | 2,142,559 |
|
| Hormel Foods Corp. | 66,033 | 3,722,280 |
|
| Pilgrim's Pride Corp. | 148,517 | 3,411,436 |
|
Seaboard Corp.(1) | 29 | 104,371 |
|
| | | 9,380,646 |
|
| Health Care Equipment and Supplies — 4.0% | | |
| Analogic Corp. | 3,781 | 298,321 |
|
| DENTSPLY International, Inc. | 10,194 | 525,501 |
|
Edwards Lifesciences Corp.(1) | 29,690 | 4,228,747 |
|
Hologic, Inc.(1) | 97,660 | 3,716,939 |
|
ICU Medical, Inc.(1) | 1,111 | 106,278 |
|
| St. Jude Medical, Inc. | 59,818 | 4,370,901 |
|
| Stryker Corp. | 45,059 | 4,306,289 |
|
Varian Medical Systems, Inc.(1) | 8,046 | 678,519 |
|
| | | 18,231,495 |
|
|
| | | | |
| | Shares | Value |
| Health Care Providers and Services — 2.8% | | |
| Aetna, Inc. | 17,561 | $ | 2,238,325 |
|
| Anthem, Inc. | 8,295 | 1,361,541 |
|
| Cardinal Health, Inc. | 26,018 | 2,176,406 |
|
Express Scripts Holding Co.(1) | 63,393 | 5,638,173 |
|
| UnitedHealth Group, Inc. | 10,421 | 1,271,362 |
|
| | | 12,685,807 |
|
| Health Care Technology — 0.1% | | |
Cerner Corp.(1) | 1,300 | 89,778 |
|
Merge Healthcare, Inc.(1) | 22,240 | 106,752 |
|
| Quality Systems, Inc. | 10,959 | 181,591 |
|
| | | 378,121 |
|
| Hotels, Restaurants and Leisure — 4.3% | | |
Boyd Gaming Corp.(1) | 18,141 | 271,208 |
|
| Brinker International, Inc. | 50,334 | 2,901,755 |
|
Chipotle Mexican Grill, Inc.(1) | 6,184 | 3,741,258 |
|
| Cracker Barrel Old Country Store, Inc. | 24,900 | 3,714,084 |
|
| Darden Restaurants, Inc. | 20,881 | 1,484,221 |
|
| Las Vegas Sands Corp. | 81,094 | 4,263,112 |
|
| McDonald's Corp. | 2,968 | 282,168 |
|
| Ruth's Hospitality Group, Inc. | 1,376 | 22,181 |
|
| Vail Resorts, Inc. | 24,896 | 2,718,643 |
|
| | | 19,398,630 |
|
| Household Durables — 0.7% | | |
| Harman International Industries, Inc. | 28,484 | 3,387,887 |
|
| Household Products — 1.0% | | |
Central Garden and Pet Co.(1) | 23,776 | 271,284 |
|
| Clorox Co. (The) | 8,219 | 854,940 |
|
| Colgate-Palmolive Co. | 15,748 | 1,030,077 |
|
| Procter & Gamble Co. (The) | 28,138 | 2,201,517 |
|
| | | 4,357,818 |
|
| Industrial Conglomerates — 1.6% | | |
| 3M Co. | 47,867 | 7,385,878 |
|
| Insurance — 0.1% | | |
| Federated National Holding Co. | 3,374 | 81,651 |
|
Heritage Insurance Holdings, Inc.(1) | 10,121 | 232,682 |
|
| | | 314,333 |
|
| Internet and Catalog Retail — 1.2% | | |
Amazon.com, Inc.(1) | 8,031 | 3,486,177 |
|
Liberty Interactive Corp. QVC Group, Class A(1) | 61,632 | 1,710,288 |
|
| PetMed Express, Inc. | 19,303 | 333,363 |
|
| | | 5,529,828 |
|
| Internet Software and Services — 6.3% | | |
eBay, Inc.(1) | 114,638 | 6,905,793 |
|
Endurance International Group Holdings, Inc.(1) | 33,668 | 695,581 |
|
Everyday Health, Inc.(1) | 11,145 | 142,433 |
|
Facebook, Inc., Class A(1) | 103,309 | 8,860,296 |
|
Google, Inc., Class A(1) | 17,346 | 9,367,534 |
|
LogMeIn, Inc.(1) | 6,397 | 412,543 |
|
|
| | | | |
| | Shares | Value |
VeriSign, Inc.(1) | 31,913 | $ | 1,969,670 |
|
| | | 28,353,850 |
|
| IT Services — 4.2% | | |
| Accenture plc, Class A | 60,941 | 5,897,870 |
|
| CSG Systems International, Inc. | 2,798 | 88,585 |
|
| International Business Machines Corp. | 44,013 | 7,159,154 |
|
Teradata Corp.(1) | 29,219 | 1,081,103 |
|
| Total System Services, Inc. | 59,819 | 2,498,640 |
|
| Visa, Inc., Class A | 25,955 | 1,742,878 |
|
| Western Union Co. (The) | 18,779 | 381,777 |
|
| | | 18,850,007 |
|
| Machinery — 4.0% | | |
| Caterpillar, Inc. | 39,346 | 3,337,328 |
|
| Cummins, Inc. | 32,058 | 4,205,689 |
|
| Illinois Tool Works, Inc. | 7,489 | 687,415 |
|
| PACCAR, Inc. | 35,241 | 2,248,728 |
|
| Parker-Hannifin Corp. | 31,964 | 3,718,372 |
|
| Stanley Black & Decker, Inc. | 36,141 | 3,803,479 |
|
| | | 18,001,011 |
|
| Media — 3.5% | | |
| Cablevision Systems Corp., Class A | 8,756 | 209,619 |
|
| Comcast Corp., Class A | 38,721 | 2,328,681 |
|
| Omnicom Group, Inc. | 56,802 | 3,947,171 |
|
| Scripps Networks Interactive, Inc., Class A | 55,180 | 3,607,117 |
|
| Twenty-First Century Fox, Inc. | 36,253 | 1,179,854 |
|
| Viacom, Inc., Class B | 2,708 | 175,045 |
|
| Walt Disney Co. (The) | 39,696 | 4,530,901 |
|
| | | 15,978,388 |
|
| Metals and Mining — 0.3% | | |
| Materion Corp. | 35,748 | 1,260,117 |
|
| Multiline Retail — 2.5% | | |
| Big Lots, Inc. | 51,882 | 2,334,171 |
|
| Dillard's, Inc., Class A | 27,864 | 2,931,014 |
|
| Kohl's Corp. | 38,770 | 2,427,390 |
|
| Target Corp. | 45,783 | 3,737,266 |
|
| | | 11,429,841 |
|
| Oil, Gas and Consumable Fuels — 0.5% | | |
| Valero Energy Corp. | 34,700 | 2,172,220 |
|
| Pharmaceuticals — 4.4% | | |
| AbbVie, Inc. | 123,007 | 8,264,840 |
|
| Bristol-Myers Squibb Co. | 18,268 | 1,215,553 |
|
Jazz Pharmaceuticals plc(1) | 18,706 | 3,293,565 |
|
| Johnson & Johnson | 23,254 | 2,266,335 |
|
| Merck & Co., Inc. | 77,089 | 4,388,677 |
|
Nektar Therapeutics(1) | 42,619 | 533,164 |
|
| | | 19,962,134 |
|
| Professional Services — 0.1% | | |
RPX Corp.(1) | 31,651 | 534,902 |
|
| Real Estate Investment Trusts (REITs) — 0.8% | | |
| Lamar Advertising Co., Class A | 62,169 | 3,573,474 |
|
|
| | | | |
| | Shares | Value |
| Real Estate Management and Development — 1.1% | | |
| Jones Lang LaSalle, Inc. | 21,083 | $ | 3,605,193 |
|
Marcus & Millichap, Inc.(1) | 28,005 | 1,292,151 |
|
| | | 4,897,344 |
|
| Road and Rail — 0.1% | | |
| Union Pacific Corp. | 3,661 | 349,150 |
|
| Semiconductors and Semiconductor Equipment — 2.1% | | |
| Intel Corp. | 122,970 | 3,740,132 |
|
| Texas Instruments, Inc. | 115,809 | 5,965,322 |
|
| | | 9,705,454 |
|
| Software — 6.8% | | |
| Activision Blizzard, Inc. | 54,347 | 1,315,741 |
|
Cadence Design Systems, Inc.(1) | 196,777 | 3,868,636 |
|
Electronic Arts, Inc.(1) | 77,652 | 5,163,858 |
|
| Intuit, Inc. | 48,194 | 4,856,509 |
|
| Microsoft Corp. | 140,753 | 6,214,245 |
|
| Oracle Corp. | 164,999 | 6,649,460 |
|
Synopsys, Inc.(1) | 6,862 | 347,560 |
|
Tableau Software, Inc., Class A(1) | 9,672 | 1,115,182 |
|
VMware, Inc., Class A(1) | 13,084 | 1,121,822 |
|
| | | 30,653,013 |
|
| Specialty Retail — 4.3% | | |
Bed Bath & Beyond, Inc.(1) | 46,581 | 3,213,157 |
|
Build-A-Bear Workshop, Inc.(1) | 33,790 | 540,302 |
|
| Foot Locker, Inc. | 60,997 | 4,087,409 |
|
| Gap, Inc. (The) | 96,623 | 3,688,100 |
|
| Home Depot, Inc. (The) | 21,557 | 2,395,630 |
|
| Lowe's Cos., Inc. | 73,841 | 4,945,132 |
|
Murphy USA, Inc.(1) | 13,215 | 737,661 |
|
| | | 19,607,391 |
|
| Technology Hardware, Storage and Peripherals — 8.4% | | |
| Apple, Inc. | 271,605 | 34,066,057 |
|
| EMC Corp. | 139,203 | 3,673,567 |
|
| | | 37,739,624 |
|
| Textiles, Apparel and Luxury Goods — 0.5% | | |
Michael Kors Holdings Ltd.(1) | 6,216 | 261,632 |
|
| Wolverine World Wide, Inc. | 74,269 | 2,115,181 |
|
| | | 2,376,813 |
|
| Thrifts and Mortgage Finance — 0.3% | | |
Essent Group Ltd.(1) | 56,216 | 1,537,507 |
|
Nationstar Mortgage Holdings, Inc.(1) | 146 | 2,453 |
|
| | | 1,539,960 |
|
Trading Companies and Distributors† | | |
| Kaman Corp. | 4,235 | 177,616 |
|
Wireless Telecommunication Services† | | |
| Shenandoah Telecommunications Co. | 3,680 | 125,966 |
|
TOTAL COMMON STOCKS (Cost $456,789,571) | | 447,083,576 |
|
|
| | | | |
| | Shares | Value |
| TEMPORARY CASH INVESTMENTS — 2.0% | | |
Repurchase Agreement, Bank of America Merrill Lynch, (collateralized by various U.S. Treasury obligations, 1.50%, 1/31/19 - 11/30/19, valued at $1,508,048), in a joint trading account at 0.10%, dated 6/30/15, due 7/1/15 (Delivery value $1,477,960) | | $ | 1,477,956 |
|
| Repurchase Agreement, Fixed Income Clearing Corp., (collateralized by various U.S. Treasury obligations, 2.375%, 8/15/24, valued at $6,035,934), at 0.01%, dated 6/30/15, due 7/1/15 (Delivery value $5,913,002) | | 5,913,000 |
|
| State Street Institutional Liquid Reserves Fund, Premier Class | 1,469,446 | 1,469,446 |
|
TOTAL TEMPORARY CASH INVESTMENTS (Cost $8,860,402) | | 8,860,402 |
|
TOTAL INVESTMENT SECURITIES — 101.0% (Cost $465,649,973) | | 455,943,978 |
|
| OTHER ASSETS AND LIABILITIES — (1.0)% | | (4,371,870) |
|
| TOTAL NET ASSETS — 100.0% | | $ | 451,572,108 |
|
|
| | |
| NOTES TO SCHEDULE OF INVESTMENTS |
| |
| † | Category is less than 0.05% of total net assets. |
See Notes to Financial Statements.
|
|
| Statement of Assets and Liabilities |
|
| | | |
| JUNE 30, 2015 |
| Assets |
| Investment securities, at value (cost of $465,649,973) | $ | 455,943,978 |
|
| Receivable for investments sold | 28,825,054 |
|
| Receivable for capital shares sold | 317,118 |
|
| Dividends and interest receivable | 283,435 |
|
| | 485,369,585 |
|
| | |
| Liabilities | |
| Payable for investments purchased | 33,476,087 |
|
| Accrued management fees | 321,390 |
|
| | 33,797,477 |
|
| | |
| Net Assets | $ | 451,572,108 |
|
| | |
| Net Assets Consist of: | |
| Capital (par value and paid-in surplus) | $ | 461,609,799 |
|
| Undistributed net investment income | 893,621 |
|
| Accumulated net realized loss | (1,225,317 | ) |
| Net unrealized depreciation | (9,705,995 | ) |
| | $ | 451,572,108 |
|
|
| | | | | | |
| | Net Assets | Shares Outstanding | Net Asset Value Per Share |
| Investor Class, $0.01 Par Value |
| $94,459,343 |
| 9,667,889 |
| $9.77 |
| Institutional Class, $0.01 Par Value |
| $357,112,765 |
| 36,529,833 |
| $9.78 |
See Notes to Financial Statements.
|
| | | |
FOR THE PERIOD ENDED JUNE 30, 2015(1) |
| Investment Income (Loss) |
| Income: | |
| Dividends | $ | 1,988,114 |
|
| Interest | 2,005 |
|
| | 1,990,119 |
|
| | |
| Expenses: | |
| Management fees | 1,088,447 |
|
| Directors' fees and expenses | 3,517 |
|
| | 1,091,964 |
|
| | |
| Net investment income (loss) | 898,155 |
|
| | |
| Realized and Unrealized Gain (Loss) | |
| Net realized gain (loss) on investment transactions | (1,229,851 | ) |
| Change in net unrealized appreciation (depreciation) on investments | (9,705,995 | ) |
| | |
| Net realized and unrealized gain (loss) | (10,935,846 | ) |
| | |
| Net Increase (Decrease) in Net Assets Resulting from Operations | $ | (10,037,691 | ) |
| |
| (1) | March 19, 2015 (fund inception) through June 30, 2015. |
See Notes to Financial Statements.
|
|
| Statement of Changes in Net Assets |
|
| | | |
PERIOD ENDED JUNE 30, 2015(1) |
| Increase (Decrease) in Net Assets | |
| Operations | |
| Net investment income (loss) | $ | 898,155 |
|
| Net realized gain (loss) | (1,229,851 | ) |
| Change in net unrealized appreciation (depreciation) | (9,705,995 | ) |
| Net increase (decrease) in net assets resulting from operations | (10,037,691 | ) |
| | |
| Capital Share Transactions | |
| Net increase (decrease) in net assets from capital share transactions (Note 5) | 461,609,799 |
|
| | |
| Net increase (decrease) in net assets | 451,572,108 |
|
| | |
| Net Assets | |
| End of period | $ | 451,572,108 |
|
| | |
| Undistributed net investment income | $ | 893,621 |
|
| |
| (1) | March 19, 2015 (fund inception) through June 30, 2015. |
See Notes to Financial Statements.
|
|
| Notes to Financial Statements |
JUNE 30, 2015
1. Organization
American Century Quantitative Equity Funds, Inc. (the corporation) is registered under the Investment Company Act of 1940, as amended (the 1940 Act), as an open-end management investment company and is organized as a Maryland corporation. NT Disciplined Growth Fund (the fund) is one fund in a series issued by the corporation. The fund is diversified as defined under the 1940 Act. The fund’s investment objective is to seek long-term capital growth. The fund is not permitted to invest in securities issued by companies assigned the Global Industry Classification Standard for the tobacco industry.
The fund offers the Investor Class and the Institutional Class. The share classes differ principally in their
respective distribution and shareholder servicing expenses and arrangements. The Institutional Class is made
available to institutional shareholders or through financial intermediaries whose clients do not require the
same level of shareholder and administrative services as shareholders of other classes. As a result, the
Institutional Class is charged a lower unified management fee. All classes of the fund commenced sale on March 19, 2015, the fund’s inception date.
2. Significant Accounting Policies
The following is a summary of significant accounting policies consistently followed by the fund in preparation of its financial statements. The fund is an investment company and follows accounting and reporting guidance in accordance with accounting principles generally accepted in the United States of America. This may require management to make certain estimates and assumptions at the date of the financial statements. Actual results could differ from these estimates. Management evaluated the impact of events or transactions occurring through the date the financial statements were issued that would merit recognition or disclosure.
Investment Valuations — The fund determines the fair value of its investments and computes its net asset value per share at the close of regular trading (usually 4 p.m. Eastern time) on the New York Stock Exchange (NYSE) on each day the NYSE is open. The Board of Directors has adopted valuation policies and procedures to guide the investment advisor in the fund’s investment valuation process and to provide methodologies for the oversight of the fund’s pricing function.
Equity securities that are listed or traded on a domestic securities exchange are valued at the last reported sales price or at the official closing price as provided by the exchange. Equity securities traded on foreign securities exchanges are generally valued at the closing price of such securities on the exchange where primarily traded or at the close of the NYSE, if that is earlier. If no last sales price is reported, or if local convention or regulation so provides, the mean of the latest bid and asked prices may be used. Securities traded over-the-counter are valued at the mean of the latest bid and asked prices, the last sales price, or the official closing price.
Fixed income securities maturing within 60 days at the time of purchase may be valued at cost, plus or minus any amortized discount or premium or at the evaluated mean as provided by an independent pricing service. Evaluated mean prices are commonly derived through utilization of market models, which may consider, among other factors: trade data, quotations from dealers and active market makers, relevant yield curve and spread data, related sector levels, creditworthiness, trade data or market information on comparable securities, and other relevant security specific information.
Open-end management investment companies are valued at the reported net asset value per share. Repurchase agreements are valued at cost, which approximates fair value.
If the fund determines that the market price for an investment is not readily available or the valuation methods mentioned above do not reflect an investment’s fair value, such investment is valued as determined in good faith by the Board of Directors or its delegate, in accordance with policies and procedures adopted by the Board of Directors. In its determination of fair value, the fund may review several factors including, but not
limited to, market information regarding the specific investment or comparable investments and correlation with other investment types, futures indices or general market indicators. Circumstances that may cause the fund to use these procedures to value an investment include, but are not limited to: an investment has been declared in default or is distressed; trading in a security has been suspended during the trading day or a security is not actively trading on its principal exchange; prices received from a regular pricing source are deemed unreliable; or there is a foreign market holiday and no trading occurred.
The fund monitors for significant events occurring after the close of an investment’s primary exchange but before the fund’s net asset value per share is determined. Significant events may include, but are not limited to: corporate announcements and transactions; governmental action and political unrest that could impact a specific investment or an investment sector; or armed conflicts, natural disasters and similar events that could affect investments in a specific country or region. The fund also monitors for significant fluctuations between domestic and foreign markets, as evidenced by the U.S. market or such other indicators that the Board of Directors, or its delegate, deems appropriate. If significant fluctuations in foreign markets are identified, the fund may apply a model-derived factor to the closing price of equity securities traded on foreign securities exchanges. The factor is based on observable market data as provided by an independent pricing service.
Security Transactions — Security transactions are accounted for as of the trade date. Net realized gains and losses are determined on the identified cost basis, which is also used for federal income tax purposes.
Investment Income — Dividend income less foreign taxes withheld, if any, is recorded as of the ex-dividend date. Distributions received on securities that represent a return of capital or long-term capital gain are recorded as a reduction of cost of investments and/or as a realized gain. The fund may estimate the components of distributions received that may be considered nontaxable distributions or long-term capital gain distributions for income tax purposes. Interest income is recorded on the accrual basis and includes accretion of discounts and amortization of premiums.
Repurchase Agreements — The fund may enter into repurchase agreements with institutions that American
Century Investment Management, Inc. (ACIM) (the investment advisor) has determined are creditworthy pursuant to criteria adopted by the Board of Directors. The fund requires that the collateral, represented by securities, received in a repurchase transaction be transferred to the custodian in a manner sufficient to enable the fund to obtain those securities in the event of a default under the repurchase agreement. ACIM monitors, on a daily basis, the securities transferred to ensure the value, including accrued interest, of the securities under each repurchase agreement is equal to or greater than amounts owed to the fund under each repurchase agreement.
Joint Trading Account — Pursuant to an Exemptive Order issued by the Securities and Exchange Commission, the fund, along with certain other funds in the American Century Investments family of funds, may transfer uninvested cash balances into a joint trading account. These balances are invested in one or more repurchase agreements that are collateralized by U.S. Treasury or Agency obligations.
Income Tax Status — It is the fund’s policy to distribute substantially all net investment income and net realized gains to shareholders and to otherwise qualify as a regulated investment company under provisions of the Internal Revenue Code. Accordingly, no provision has been made for income taxes. The fund files U.S. federal, state, local and non-U.S. tax returns as applicable. The fund's tax returns are subject to examination by the relevant taxing authority until expiration of the applicable statute of limitations, which is generally three years from the date of filing but can be longer in certain jurisdictions. At this time, management believes there are no uncertain tax positions which, based on their technical merit, would not be sustained upon examination and for which it is reasonably possible that the total amounts of unrecognized tax benefits will significantly change in the next twelve months.
Multiple Class — All shares of the fund represent an equal pro rata interest in the net assets of the class to which such shares belong, and have identical voting, dividend, liquidation and other rights and the same terms and conditions, except for class specific expenses and exclusive rights to vote on matters affecting only individual classes. Income, non-class specific expenses, and realized and unrealized capital gains and losses of the fund are allocated to each class of shares based on their relative net assets.
Distributions to Shareholders — Distributions from net investment income, if any, are generally declared and paid semiannually. Distributions from net realized gains, if any, are generally declared and paid annually.
Indemnifications — Under the corporation’s organizational documents, its officers and directors are indemnified against certain liabilities arising out of the performance of their duties to the fund. In addition, in the normal course of business, the fund enters into contracts that provide general indemnifications. The maximum exposure under these arrangements is unknown as this would involve future claims that may be made against a fund. The risk of material loss from such claims is considered by management to be remote.
3. Fees and Transactions with Related Parties
Certain officers and directors of the corporation are also officers and/or directors of American Century Companies, Inc. (ACC). The corporation’s investment advisor, ACIM, the corporation's distributor, American Century Investment Services, Inc., and the corporation’s transfer agent, American Century Services, LLC, are wholly owned, directly or indirectly, by ACC. Various funds issued by American Century Asset Allocation Portfolios, Inc. own, in aggregate, 100% of the shares of the fund. Related parties do not invest in the fund for the purpose of exercising management or control.
Management Fees — The corporation has entered into a management agreement with ACIM, under which ACIM provides the fund with investment advisory and management services in exchange for a single, unified management fee (the fee) per class. The agreement provides that all expenses of managing and operating the fund, except distribution and service fees, brokerage expenses, taxes, interest, fees and expenses of the independent directors (including legal counsel fees), and extraordinary expenses, will be paid by ACIM. The fee is computed and accrued daily based on each class’s daily net assets and paid monthly in arrears. The fee consists of (1) an Investment Category Fee based on the daily net assets of the fund and certain other accounts managed by the investment advisor that are in the same broad investment category as the fund and (2) a Complex Fee based on the assets of all the funds in the American Century Investments family of funds. The rates for the Investment Category Fee range from 0.6880% to 0.8700%. The rates for the Complex Fee range from 0.2500% to 0.3100% for the Investor Class and 0.0500% to 0.1100% for the Institutional Class. The effective annual management fee for each class for the period March 19, 2015 (fund inception) through June 30, 2015 was 1.01% for the Investor Class and 0.81% for the Institutional Class.
Directors' Fees and Expenses — The Board of Directors is responsible for overseeing the investment advisor’s management and operations of the fund. The directors receive detailed information about the fund and its investment advisor regularly throughout the year, and meet at least quarterly with management of the investment advisor to review reports about fund operations. The fund’s officers do not receive compensation from the fund.
4. Investment Transactions
Purchases and sales of investment securities, excluding short-term investments, for the period March 19, 2015 (fund inception) through June 30, 2015 were $585,931,630 and $127,912,208, respectively.
5. Capital Share Transactions
Transactions in shares of the fund were as follows:
|
| | | | | |
| | Period ended June 30, 2015(1) |
| | Shares | Amount |
| Investor Class/Shares Authorized | 90,000,000 |
| |
| Sold | 9,760,412 |
| $ | 97,603,873 |
|
| Redeemed | (92,523 | ) | (921,053 | ) |
| | 9,667,889 |
| 96,682,820 |
|
| Institutional Class/Shares Authorized | 240,000,000 |
| |
| Sold | 36,954,067 |
| 369,151,500 |
|
| Redeemed | (424,234 | ) | (4,224,521 | ) |
| | 36,529,833 |
| 364,926,979 |
|
| Net increase (decrease) | 46,197,722 |
| $ | 461,609,799 |
|
| |
| (1) | March 19, 2015 (fund inception) through June 30, 2015. |
6. Fair Value Measurements
The fund’s investments valuation process is based on several considerations and may use multiple inputs to determine the fair value of the investments held by the fund. In conformity with accounting principles generally accepted in the United States of America, the inputs used to determine a valuation are classified into three broad levels.
| |
| • | Level 1 valuation inputs consist of unadjusted quoted prices in an active market for identical investments. |
| |
| • | Level 2 valuation inputs consist of direct or indirect observable market data (including quoted prices for comparable investments, evaluations of subsequent market events, interest rates, prepayment speeds, credit risk, etc.). These inputs also consist of quoted prices for identical investments initially expressed in local currencies that are adjusted through translation into U.S. dollars. |
| |
| • | Level 3 valuation inputs consist of unobservable data (including a fund’s own assumptions). |
The level classification is based on the lowest level input that is significant to the fair valuation measurement. The valuation inputs are not necessarily an indication of the risks associated with investing in these securities or other financial instruments. There were no significant transfers between levels during the period.
The following is a summary of the level classifications as of period end. The Schedule of Investments provides additional information on the fund’s portfolio holdings.
|
| | | | | | | | |
| | Level 1 | Level 2 | Level 3 |
| Assets |
| Investment Securities | | | |
| Common Stocks | $ | 447,083,576 |
| — |
| — |
|
| Temporary Cash Investments | 1,469,446 |
| $ | 7,390,956 |
| — |
|
| | $ | 448,553,022 |
| $ | 7,390,956 |
| — |
|
7. Risk Factors
The fund’s investment process may result in high portfolio turnover, which could mean high transaction costs, affecting both performance and capital gains tax liabilities to investors.
8. Federal Tax Information
The book-basis character of distributions made during the year from net investment income or net realized gains may differ from their ultimate characterization for federal income tax purposes. These differences reflect the differing character of certain income items and net realized gains and losses for financial statement and tax purposes, and may result in reclassification among certain capital accounts on the financial statements. There were no distributions paid by the fund during the period March 19, 2015 (fund inception) through June 30, 2015.
As of June 30, 2015, the federal tax cost of investments and the components of distributable earnings on a tax-basis were as follows:
|
| | | |
| Federal tax cost of investments | $ | 465,772,014 |
|
| Gross tax appreciation of investments | $ | 9,113,688 |
|
| Gross tax depreciation of investments | (18,941,724 | ) |
| Net tax appreciation (depreciation) of investments | (9,828,036 | ) |
| Undistributed ordinary income | $ | 893,621 |
|
| Accumulated short-term capital losses | $ | (1,103,276 | ) |
The difference between book-basis and tax-basis unrealized appreciation (depreciation) is attributable primarily to the tax deferral of losses on wash sales.
Accumulated capital losses represent net capital loss carryovers that may be used to offset future realized capital gains for federal income tax purposes. The capital loss carryovers may be carried forward for an unlimited period. Future capital loss carryover utilization in any given year may be subject to Internal Revenue Code limitations.
|
| | | | | | | | | | | | |
| For a Share Outstanding Throughout the Period Indicated |
| Per-Share Data | | | | | Ratios and Supplemental Data | | |
| | | Income From Investment Operations: | | | Ratio to Average Net Assets of: | | |
| | Net Asset Value, Beginning of Period | Net Investment Income (Loss)(1) | Net Realized and Unrealized Gain (Loss) | Total From Investment Operations | Net Asset Value, End of Period | Total Return(2) | Operating Expenses | Net Investment Income (Loss) | Portfolio Turnover Rate | Net Assets, End of Period (in thousands) |
| Investor Class | | | | | | | |
2015(3) | $10.00 | 0.02 | (0.25) | (0.23) | $9.77 | (2.30)% | 1.01%(4) | 0.55%(4) | 29% |
| $94,459 |
|
| Institutional Class | | | | | | | |
2015(3) | $10.00 | 0.02 | (0.24) | (0.22) | $9.78 | (2.20)% | 0.81%(4) | 0.75%(4) | 29% |
| $357,113 |
|
|
|
| Notes to Financial Highlights |
| |
| (1) | Computed using average shares outstanding throughout the period. |
| |
| (2) | Total returns are calculated based on the net asset value of the last business day. Total returns for periods less than one year are not annualized. |
| |
| (3) | March 19, 2015 (fund inception) through June 30, 2015. |
See Notes to Financial Statements.
|
|
| Report of Independent Registered Public Accounting Firm |
To the Directors of the American Century Quantitative Equity Funds, Inc. and Shareholders of the
NT Disciplined Growth Fund:
In our opinion, the accompanying statement of assets and liabilities, including the schedule of investments, and the related statements of operations and of changes in net assets and the financial highlights present fairly, in all material respects, the financial position of the NT Disciplined Growth Fund (one of the sixteen funds comprising the American Century Quantitative Equity Funds, Inc., hereafter referred to as the “Fund”) at June 30, 2015, and the results of its operations, the changes in its net assets and the financial highlights for the period March 19, 2015 (commencement of operations) through June 30, 2015, in conformity with accounting principles generally accepted in the United States of America. These financial statements and financial highlights (hereafter referred to as "financial statements") are the responsibility of the Fund's management. Our responsibility is to express an opinion on these financial statements based on our audit. We conducted our audit of these financial statements in accordance with the standards of the Public Company Accounting Oversight Board (United States). Those standards require that we plan and perform the audit to obtain reasonable assurance about whether the financial statements are free of material misstatement. An audit includes examining, on a test basis, evidence supporting the amounts and disclosures in the financial statements, assessing the accounting principles used and significant estimates made by management, and evaluating the overall financial statement presentation. We believe that our audit, which included confirmation of securities at June 30, 2015 by correspondence with the custodian and brokers, provides a reasonable basis for our opinion.
PricewaterhouseCoopers LLP
Kansas City, Missouri
August 21, 2015
Board of Directors
The individuals listed below serve as directors of the funds. Each director will continue to serve in this capacity until death, retirement, resignation or removal from office. The board has adopted a mandatory retirement age for directors who are not “interested persons,” as that term is defined in the Investment Company Act (independent directors). Independent directors shall retire on December 31 of the year in which they reach their 75th birthday; provided, however, that on or after January 1, 2022, independent directors shall retire on December 31 of the year in which they reach their 76th birthday.
Mr. Thomas is an “interested person” because he currently serves as President and Chief Executive Officer of American Century Companies, Inc. (ACC), the parent company of American Century Investment Management, Inc. (ACIM or the advisor). The other directors (more than three-fourths of the total number) are independent. They are not employees, directors or officers of, and have no financial interest in, ACC or any of its wholly owned, direct or indirect, subsidiaries, including ACIM, American Century Investment Services, Inc. (ACIS) and American Century Services, LLC (ACS), and they do not have any other affiliations, positions or relationships that would cause them to be considered “interested persons” under the Investment Company Act. The directors serve in this capacity for eight (in the case of Mr. Thomas, 15) registered investment companies in the American Century Investments family of funds.
The following table presents additional information about the directors. The mailing address for each director other than Mr. Thomas is 1665 Charleston Road, Mountain View, California 94043. The mailing address for Mr. Thomas is 4500 Main Street, Kansas City, Missouri 64111.
|
| | | | | |
Name (Year of Birth) | Position(s) Held with Funds | Length of Time Served | Principal Occupation(s) During Past 5 Years | Number of American Century Portfolios Overseen by Director | Other Directorships Held During Past 5 Years |
Independent Directors | | |
Tanya S. Beder
(1955) | Director | Since 2011 | Chairman and CEO, SBCC Group Inc. (independent advisory services) (2006 to present) | 46 | CYS Investments, Inc. (NYSE mortgage arbitrage REIT) |
Jeremy I. Bulow
(1954) | Director | Since 2011 | Professor of Economics, Stanford University, Graduate School of Business (1979 to present) | 46 | None |
Ronald J. Gilson
(1946) | Director and Chairman of the Board | Since 1995
(Chairman since 2005) | Charles J. Meyers Professor of Law and Business, Stanford Law School (1979 to present); Marc and Eva Stern Professor of Law and Business, Columbia University School of Law (1992 to present) | 46 | None |
Frederick L. A. Grauer
(1946) | Director | Since 2008 | Senior Advisor, BlackRock, Inc. (investment management firm) (2010 to 2011, 2013 to present) | 46 | None |
Peter F. Pervere
(1947) | Director | Since 2007 | Retired | 46 | None |
|
| | | | | |
Name (Year of Birth) | Position(s) Held with Funds | Length of Time Served | Principal Occupation(s) During Past 5 Years | Number of American Century Portfolios Overseen by Director | Other Directorships Held During Past 5 Years |
| Independent Directors | | |
John B. Shoven
(1947) | Director | Since 2002 | Professor of Economics, Stanford University (1973 to present) | 46 | Cadence Design Systems; Exponent; Financial Engines |
| Interested Director | | |
Jonathan S. Thomas
(1963) | Director and President | Since 2007 | President and Chief Executive Officer, ACC (March 2007 to present). Also serves as Chief Executive Officer, ACS; Executive Vice President, ACIM; Director, ACC, ACIM and other ACC subsidiaries | 124 | BioMed Valley Discoveries, Inc. |
The Statement of Additional Information has additional information about the fund's directors and is available without charge, upon request, by calling 1-800-345-2021.
Officers
The following table presents certain information about the executive officers of the funds. Each officer serves as an officer for each of the 15 investment companies in the American Century family of funds, unless otherwise noted. No officer is compensated for his or her service as an officer of the funds. The listed officers are interested persons of the funds and are appointed or re-appointed on an annual basis. The mailing address for each of the officers listed below is 4500 Main Street, Kansas City, Missouri 64111.
|
| | |
Name (Year of Birth) | Offices with the Funds | Principal Occupation(s) During the Past Five Years |
Jonathan S.
Thomas
(1963) | Director and President
since 2007 | President and Chief Executive Officer, ACC (March 2007 to present). Also serves as Chief Executive Officer, ACS; Executive Vice President, ACIM; Director, ACC, ACIM and other ACC subsidiaries |
Amy D. Shelton
(1964) | Chief Compliance Officer and Vice President since 2014 | Chief Compliance Officer, American Century funds, (March 2014 to present); Chief Compliance Officer, ACIM (February 2014 to present); Chief Compliance Officer, ACIS (October 2009 to present); Vice President, Client Interactions and Marketing, ACIS (February 2013 to January 2014); Director, Client Interactions and Marketing, ACIS (June 2007 to January 2013). Also serves as Vice President, ACIS |
Charles A. Etherington
(1957) | General Counsel since 2007 and Senior Vice President since 2006 | Attorney, ACC (February 1994 to present); Vice President, ACC (November 2005 to present); General Counsel, ACC (March 2007 to present). Also serves as General Counsel, ACIM, ACS, ACIS and other ACC subsidiaries; and Senior Vice President, ACIM and ACS |
C. Jean Wade
(1964) | Vice President,Treasurer and Chief Financial Officer since 2012 | Vice President, ACS (February 2000 to present) |
Robert J. Leach
(1966) | Vice President since 2006 and Assistant Treasurer since 2012 | Vice President, ACS (February 2000 to present) |
David H. Reinmiller
(1963) | Vice President since 2001 | Attorney, ACC (January 1994 to present); Associate General Counsel, ACC (January 2001 to present). Also serves as Vice President, ACIM and ACS |
Ward D. Stauffer
(1960) | Secretary since 2005 | Attorney, ACC (June 2003 to present) |
|
|
| Approval of Management Agreement |
The Fund’s Board of Directors unanimously approved the initial management agreement pursuant to which American Century Investment Management, Inc. (the “Advisor”) acts as the investment advisor for the Fund. Under Section 15(c) of the Investment Company Act, new contracts for investment advisory services are required to be approved by a majority of a fund’s independent directors/trustees and to be evaluated on an annual basis thereafter.
In advance of the Board’s consideration, the Advisor provided information concerning the fund. The materials circulated and the discussions held detailed the investment objective and strategy proposed to be utilized by the Advisor, the Fund’s characteristics and key attributes, the rationale for launching the Fund, the experience of the staff designated to manage the Fund, the proposed pricing, and the markets in which the Fund would be sold. The information considered and the discussions held included, but were not limited to:
| |
| • | the nature, extent, and quality of investment management, shareholder services, and other services to be provided by the Advisor to the Fund; |
| |
| • | the wide range of other programs and services the Advisor would provide to the Fund and its shareholders on a routine and non-routine basis; |
| |
| • | the Fund’s proposed investment objective and strategy, including a discussion of the Fund’s anticipated investment performance and proposed benchmark; |
| |
| • | the cost of owning the Fund compared to the cost of owning similar funds; |
| |
| • | the Advisor’s compliance policies, procedures, and regulatory experience; and |
| |
| • | any collateral benefits derived by the Advisor from the management of the Fund. |
American Century Investments’ funds utilize a unified management fee structure. Under the unified fee structure, the Advisor is responsible for providing all investment advisory, custody, audit, administrative, compliance, recordkeeping, marketing, and shareholder services, or arranging and supervising third parties to provide such services. By contrast, most other funds are charged a variety of fees, including an investment advisory fee, a transfer agency fee, an administrative fee, distribution charges, and other expenses. Other than their investment advisory fees and Rule 12b-1 fees, all other components of the total fees charged by these other funds may be increased without shareholder approval. The Advisor and Board believe the unified fee structure is a benefit to fund shareholders because it clearly discloses to shareholders the cost of owning fund shares, and because the unified fee cannot be increased without a vote of Fund shareholders, it shifts to the Advisor the risk of increased costs of operating the Fund and provides a direct incentive to minimize administrative inefficiencies.
When considering the approval of the management agreement for the Fund, the independent Directors considered the entrepreneurial risk that the Advisor assumes in launching a new fund. In particular, they considered the effect of the unified management fee structure and the fact that the Advisor will assume a substantial part of the start-up costs of the Fund and the risk that the Fund will not grow to a level that will become profitable to the Advisor. The Board considered the position that the Fund would take in the lineup of the American Century Investments’ family of funds and the benefits to shareholders of existing funds of the broadened product offering. Finally, while not specifically discussed, but important in the decision to approve the management agreement, is the Directors’ familiarity with the Advisor. The Board oversees and evaluates on a continuous basis the nature and quality of all services the Advisor performs for other funds within the American Century Investments’ complex. As such, the Directors have confidence in the Advisor’s integrity and competence in providing services to the Fund.
The Directors considered all of the information provided by the Advisor and the independent Directors’ independent counsel in connection with the approval and evaluated such information for the Fund. In connection with their review, the Directors did not identify any single factor as being all-important or controlling, and each Director may have attributed different levels of importance to different factors. The independent Directors concluded that the overall arrangements between the Fund and the Advisor, as provided in the management agreement, were fair and reasonable in light of the services to be provided and should be approved.
Retirement Account Information
As required by law, distributions you receive from certain IRAs are subject to federal income tax withholding, unless you elect not to have withholding apply. Tax will be withheld on the total amount withdrawn even though you may be receiving amounts that are not subject to withholding, such as nondeductible contributions. In such case, excess amounts of withholding could occur. You may adjust your withholding election so that a greater or lesser amount will be withheld.
If you don’t want us to withhold on this amount, you must notify us to not withhold the federal income tax. You may notify us in writing or in certain situations by telephone or through other electronic means. For systematic withdrawals, your withholding election will remain in effect until revoked or changed by filing a new election. You have the right to revoke your election at any time.
Remember, even if you elect not to have income tax withheld, you are liable for paying income tax on the taxable portion of your withdrawal. If you elect not to have income tax withheld or you don’t have enough income tax withheld, you may be responsible for payment of estimated tax. You may incur penalties under the estimated tax rules if your withholding and estimated tax payments are not sufficient. You can reduce or defer the income tax on a distribution by directly or indirectly rolling such distribution over to another IRA or eligible plan. You should consult your tax advisor for additional information.
State tax will be withheld if, at the time of your distribution, your address is within one of the mandatory withholding states and you have federal income tax withheld (or as otherwise required by state law). State taxes will be withheld from your distribution in accordance with the respective state rules.
Distributions you receive from 403(b), 457 and qualified plans are subject to special tax and withholding rules. Your plan administrator or plan sponsor is required to provide you with a special tax notice explaining those rules at the time you request a distribution. If applicable, federal and/or state taxes may be withheld from your distribution amount.
Proxy Voting Policies
Descriptions of the principles and policies that the fund's investment advisor uses in exercising the voting rights associated with the securities purchased and/or held by the fund are available without charge, upon request, by calling 1-800-345-2021 or visiting the "About Us" page of American Century Investments’ website at americancentury.com. A description of the policies is also available on the Securities and Exchange Commission’s website at sec.gov. Information regarding how the investment advisor voted proxies relating to portfolio securities during the most recent 12-month period ended June 30 is available on the "About Us" page at americancentury.com. It is also available at sec.gov.
Quarterly Portfolio Disclosure
The fund files its complete schedule of portfolio holdings with the Securities and Exchange Commission (SEC) for the first and third quarters of each fiscal year on Form N-Q. The fund’s Forms N-Q are available on the SEC’s website at sec.gov, and may be reviewed and copied at the SEC’s Public Reference Room in Washington, DC. Information on the operation of the Public Reference Room may be obtained by calling 1-800-SEC-0330. The fund also makes its complete schedule of portfolio holdings for the most recent quarter of its fiscal year available on its website at americancentury.com and, upon request, by calling 1-800-345-2021.
|
| | |
| |
| | | |
| Contact Us | americancentury.com | |
| Automated Information Line | 1-800-345-8765 | |
| Investor Services Representative | 1-800-345-2021
or 816-531-5575 | |
| Investors Using Advisors | 1-800-378-9878 | |
Business, Not-For-Profit, Employer-Sponsored
Retirement Plans | 1-800-345-3533 | |
Banks and Trust Companies, Broker-Dealers,
Financial Professionals, Insurance Companies | 1-800-345-6488 | |
| Telecommunications Relay Service for the Deaf | 711 | |
| | | |
| American Century Quantitative Equity Funds, Inc. | |
| | | |
Investment Advisor: American Century Investment Management, Inc. Kansas City, Missouri | |
| | | |
| This report and the statements it contains are submitted for the general information of our shareholders. The report is not authorized for distribution to prospective investors unless preceded or accompanied by an effective prospectus. | |
| | | |
©2015 American Century Proprietary Holdings, Inc. All rights reserved.
CL-ANN-86517 1508 | |
|
| |
| ANNUAL REPORT | JUNE 30, 2015 |
NT Equity Growth Fund
|
| | |
| Performance | 2 |
|
| Portfolio Commentary | |
|
| Fund Characteristics | |
|
| Shareholder Fee Example | |
|
| Schedule of Investments | |
|
| Statement of Assets and Liabilities | |
|
| Statement of Operations | |
|
| Statement of Changes in Net Assets | |
|
| Notes to Financial Statements | |
|
| Financial Highlights | |
|
| Report of Independent Registered Public Accounting Firm | |
|
| Management | |
|
| Approval of Management Agreement | |
|
| Additional Information | |
|
Any opinions expressed in this report reflect those of the author as of the date of the report, and do not necessarily represent the opinions of American Century Investments® or any other person in the American Century Investments organization. Any such opinions are subject to change at any time based upon market or other conditions and American Century Investments disclaims any responsibility to update such opinions. These opinions may not be relied upon as investment advice and, because investment decisions made by American Century Investments funds are based on numerous factors, may not be relied upon as an indication of trading intent on behalf of any American Century Investments fund. Security examples are used for representational purposes only and are not intended as recommendations to purchase or sell securities. Performance information for comparative indices and securities is provided to American Century Investments by third party vendors. To the best of American Century Investments’ knowledge, such information is accurate at the time of printing.
|
| | | | | |
| Total Returns as of June 30, 2015 |
| | | | Average Annual Returns | |
| | Ticker Symbol | 1 year | 5 years | Since Inception | Inception Date |
| Institutional Class | ACLEX | 5.97% | 17.47% | 7.21% | 5/12/06 |
| S&P 500 Index | — | 7.42% | 17.33% | 7.52% | — |
|
|
| Growth of $10,000 Over Life of Class |
| $10,000 investment made May 12, 2006 |
|
| |
| Value on June 30, 2015 |
| | Institutional Class — $18,892 |
| |
| | S&P 500 Index — $19,407 |
| |
*From May 12, 2006, the Institutional Class’s inception date. Not annualized.
|
| |
| Total Annual Fund Operating Expenses |
| Institutional Class | 0.47% |
The total annual fund operating expenses shown is as stated in the fund’s prospectus current as of the date of this report. The prospectus may vary from the expense ratio shown elsewhere in this report because it is based on a different time period, includes acquired fund fees and expenses, and, if applicable, does not include fee waivers or expense reimbursements.
Data presented reflect past performance. Past performance is no guarantee of future results. Current performance may be higher or lower than the performance shown. Investment return and principal value will fluctuate, and redemption value may be more or less than original cost. Data assumes reinvestment of dividends and capital gains, and none of the charts reflect the deduction of taxes that a shareholder would pay on fund distributions or the redemption of fund shares. To obtain performance data current to the most recent month end, please call 1-800-345-2021 or visit americancentury.com. For additional information about the fund, please consult the prospectus.
Portfolio Managers: Bill Martin and Claudia Musat
Performance Summary
NT Equity Growth returned 5.97% for the fiscal year ended June 30, 2015, compared with the 7.42% return of its benchmark, the S&P 500 Index.
U.S. equity markets endured substantial volatility, but ended the 12-month period with advances. NT Equity Growth posted gains during the fiscal year, but was unable to match the return of its benchmark. Security selection in the information technology, financials, and consumer discretionary sectors detracted from fund results, while positioning in the energy and utilities sectors contributed to relative performance.
NT Equity Growth’s stock selection process incorporates factors of valuation, quality, growth, and sentiment while striving to minimize unintended risks along industries and other risk characteristics. Within the fund, valuation- and growth-based factors proved most difficult, while quality and sentiment indicators were mildly positive.
Security Selection Across a Number of Sectors Hampered Relative Gains
Information technology sector holdings diminished the fund’s gains, with detraction spread across a number of industries. Leading underperformance on a security level came from an overweight position, relative to the benchmark, in QUALCOMM. The semiconductor manufacturer’s stock price fell sharply after company management reduced revenue and earnings estimates for the coming year based on the supposition that a major smartphone customer would turn to a different processor supplier rather than using QUALCOMM’s high-end Snapdragon 810 processor.
The financials sector was also an area of underperformance, stemming largely from a number of capital markets holdings and stock selection in real estate investment trusts, although no individual position was a leading fund detractor. In the consumer discretionary sector, positioning among specialty and internet retailers weighed on fund results. Not holding home improvement retailer Home Depot, which continued to benefit from rising sales due to historically low interest rates that have driven new home purchases and existing home renovation plans, hurt results. Nevertheless, the company’s valuation metrics remain weak. Similarly, an underweight position in internet retailer Amazon.com, whose stock price continued to rise on strength in the company’s cloud computing business, was detrimental. We exited out of the position due to weak valuation signals as we believe that stock demonstrates the market’s preference for expensive growth names.
Although the energy sector was an overall contributor to relative gains, a number of individual holdings weighed on results. An overweight position in Baker Hughes, a provider of services to the oilfield industry, was detrimental, particularly during the first half of the period when the company’s stock declined amid concerns about falling oil prices and the effects of sanctions on its Russia-based operations. Similarly, EOG Resources, a crude oil producer, was impacted by the slump in oil prices. Both positions were sold out of the fund.
Energy was Leading Sector Contributor
Positioning in the energy sector, particularly underweight exposure to oil, gas, and consumable fuels holdings, bolstered the fund’s relative returns. Key contribution stemmed from holding less than the benchmark weighting in Chevron, which declined steadily throughout the period together with the price of oil.
A number of individual outperformers were health care sector names. An overweight position in insurance and managed care provider Aetna was a key contributor in the space, advancing amid merger speculation in the recent wave of health insurance industry consolidation. Higher demand for its therapies led biotechnology company Amgen to consistently beat earnings and revenue expectations. In addition, management’s restructuring and share buyback programs further supported the company’s stock price.
Elsewhere, gains were bolstered by an overweight position in Broadcom. The semiconductor designer’s stock rose following strong quarterly results, and again after a merger announcement with industry rival Avago in a deal that is expected to create the world’s leading communications semiconductor company. Our valuation, quality, and growth indicators showed modest deterioration late in the period and we liquidated the position.
A Look Ahead
The U.S. economy seems poised to continue to experience hesitant economic growth through the second half of 2015. Economic activity appears to have somewhat diminished in breadth, though it remains slow yet steady. We believe that divergence in monetary policy between the U.S. and much of the rest of the world is likely to continue. Therefore, questions surrounding when and how much the U.S. Federal Reserve might act to tighten money supply, and the potential impact of such a move, are likely to continue driving investor sentiment in equity markets. Our disciplined, objective, and systematic investment strategy is designed to take advantage of opportunities at the individual company level. We believe this approach is the most powerful way to capitalize on market inefficiencies that lead to the mispricing of individual stocks. Our strategy is designed to provide investors with well-diversified and risk-controlled exposure to broad U.S. equities. As such we do not see significant deviations versus the S&P 500. The fund’s largest, but modest, overweights are in the health care and information technology sectors, while the underweights are led by the utilities and financials sectors.
|
| |
| JUNE 30, 2015 |
| Top Ten Holdings | % of net assets |
| Apple, Inc. | 3.4% |
| Microsoft Corp. | 2.6% |
| Pfizer, Inc. | 1.9% |
| Procter & Gamble Co. (The) | 1.9% |
| JPMorgan Chase & Co. | 1.8% |
| Gilead Sciences, Inc. | 1.7% |
| Citigroup, Inc. | 1.6% |
| Comcast Corp., Class A | 1.6% |
| Merck & Co., Inc. | 1.6% |
| International Business Machines Corp. | 1.6% |
| | |
| Top Five Industries | % of net assets |
| Pharmaceuticals | 6.5% |
| Biotechnology | 5.6% |
| Technology Hardware, Storage and Peripherals | 5.5% |
| Software | 4.9% |
| Banks | 4.6% |
| | |
| Types of Investments in Portfolio | % of net assets |
| Common Stocks | 98.5% |
| Temporary Cash Investments | 1.3% |
| Other Assets and Liabilities | 0.2% |
Fund shareholders may incur two types of costs: (1) transaction costs, including sales charges (loads) on purchase payments and redemption/exchange fees; and (2) ongoing costs, including management fees; distribution and service (12b-1) fees; and other fund expenses. This example is intended to help you understand your ongoing costs (in dollars) of investing in your fund and to compare these costs with the ongoing cost of investing in other mutual funds.
The example is based on an investment of $1,000 made at the beginning of the period and held for the entire period from January 1, 2015 to June 30, 2015.
Actual Expenses
The table provides information about actual account values and actual expenses for each class. You may use the information, together with the amount you invested, to estimate the expenses that you paid over the period. First, identify the share class you own. Then simply divide your account value by $1,000 (for example, an $8,600 account value divided by $1,000 = 8.6), then multiply the result by the number under the heading “Expenses Paid During Period” to estimate the expenses you paid on your account during this period.
Hypothetical Example for Comparison Purposes
The table also provides information about hypothetical account values and hypothetical expenses based on the actual expense ratio of each class of your fund and an assumed rate of return of 5% per year before expenses, which is not the actual return of a fund’s share class. The hypothetical account values and expenses may not be used to estimate the actual ending account balance or expenses you paid for the period. You may use this information to compare the ongoing costs of investing in your fund and other funds. To do so, compare this 5% hypothetical example with the 5% hypothetical examples that appear in the shareholder reports of the other funds.
Please note that the expenses shown in the table are meant to highlight your ongoing costs only and do not reflect any transactional costs, such as sales charges (loads) or redemption/exchange fees. Therefore, the table is useful in comparing ongoing costs only, and will not help you determine the relative total costs of owning different funds. In addition, if these transactional costs were included, your costs would have been higher.
|
| | | | |
| | Beginning
Account Value
1/1/15 | Ending
Account Value
6/30/15 | Expenses Paid
During Period(1)1/1/15 - 6/30/15 | Annualized
Expense Ratio(1) |
| Actual | | | | |
| Institutional Class | $1,000 | $1,001.00 | $2.33 | 0.47% |
| Hypothetical | | | | |
| Institutional Class | $1,000 | $1,022.46 | $2.36 | 0.47% |
| |
| (1) | Expenses are equal to the class's annualized expense ratio listed in the table above, multiplied by the average account value over the period, multiplied by 181, the number of days in the most recent fiscal half-year, divided by 365, to reflect the one-half year period. |
JUNE 30, 2015
|
| | | | |
| | Shares | Value |
| COMMON STOCKS — 98.5% | | |
| Aerospace and Defense — 3.7% | | |
| Boeing Co. (The) | 57,174 | $ | 7,931,177 |
|
| General Dynamics Corp. | 45,892 | 6,502,438 |
|
| Honeywell International, Inc. | 156,004 | 15,907,728 |
|
| Huntington Ingalls Industries, Inc. | 22,164 | 2,495,445 |
|
Spirit Aerosystems Holdings, Inc., Class A(1) | 127,966 | 7,052,206 |
|
| Textron, Inc. | 243,748 | 10,878,473 |
|
| | | 50,767,467 |
|
| Airlines — 1.9% | | |
| Delta Air Lines, Inc. | 106,694 | 4,382,990 |
|
| Southwest Airlines Co. | 336,502 | 11,134,851 |
|
United Continental Holdings, Inc.(1) | 198,679 | 10,531,974 |
|
| | | 26,049,815 |
|
| Auto Components — 0.1% | | |
| Delphi Automotive plc | 20,312 | 1,728,348 |
|
| Banks — 4.6% | | |
| Bank of America Corp. | 520,502 | 8,858,944 |
|
| Citigroup, Inc. | 408,136 | 22,545,433 |
|
| JPMorgan Chase & Co. | 360,905 | 24,454,923 |
|
| Wells Fargo & Co. | 141,093 | 7,935,070 |
|
| | | 63,794,370 |
|
| Beverages — 2.1% | | |
| Coca-Cola Co. (The) | 24,275 | 952,308 |
|
| Dr Pepper Snapple Group, Inc. | 112,505 | 8,201,615 |
|
| PepsiCo, Inc. | 214,714 | 20,041,405 |
|
| | | 29,195,328 |
|
| Biotechnology — 5.6% | | |
| Amgen, Inc. | 132,086 | 20,277,843 |
|
Biogen, Inc.(1) | 43,799 | 17,692,168 |
|
Celgene Corp.(1) | 133,882 | 15,494,833 |
|
| Gilead Sciences, Inc. | 204,935 | 23,993,790 |
|
| | | 77,458,634 |
|
| Capital Markets — 2.8% | | |
| Ameriprise Financial, Inc. | 93,084 | 11,628,984 |
|
| Artisan Partners Asset Management, Inc., Class A | 29,214 | 1,357,283 |
|
| Franklin Resources, Inc. | 236,824 | 11,611,481 |
|
| Legg Mason, Inc. | 197,442 | 10,174,186 |
|
| Waddell & Reed Financial, Inc., Class A | 87,975 | 4,162,097 |
|
| | | 38,934,031 |
|
| Chemicals — 2.9% | | |
| Cabot Corp. | 228,219 | 8,510,287 |
|
|
| | | | |
| | Shares | Value |
| Dow Chemical Co. (The) | 298,699 | $ | 15,284,428 |
|
| E.I. du Pont de Nemours & Co. | 24,215 | 1,548,549 |
|
| LyondellBasell Industries NV, Class A | 144,304 | 14,938,350 |
|
| | | 40,281,614 |
|
| Commercial Services and Supplies — 0.1% | | |
| Pitney Bowes, Inc. | 23,485 | 488,723 |
|
| Waste Management, Inc. | 29,895 | 1,385,633 |
|
| | | 1,874,356 |
|
| Communications Equipment — 2.8% | | |
| Cisco Systems, Inc. | 781,360 | 21,456,145 |
|
| QUALCOMM, Inc. | 272,928 | 17,093,481 |
|
| | | 38,549,626 |
|
| Consumer Finance — 0.1% | | |
Credit Acceptance Corp.(1) | 2,989 | 735,832 |
|
| Diversified Consumer Services — 0.5% | | |
| H&R Block, Inc. | 238,036 | 7,057,767 |
|
| Diversified Financial Services — 0.4% | | |
Berkshire Hathaway, Inc., Class B(1) | 44,686 | 6,082,211 |
|
| Diversified Telecommunication Services — 0.5% | | |
| AT&T, Inc. | 71,095 | 2,525,295 |
|
| Verizon Communications, Inc. | 96,279 | 4,487,564 |
|
| | | 7,012,859 |
|
| Electric Utilities — 0.2% | | |
| NextEra Energy, Inc. | 31,606 | 3,098,336 |
|
| Electrical Equipment — 0.9% | | |
| Emerson Electric Co. | 219,175 | 12,148,870 |
|
| Electronic Equipment, Instruments and Components — 0.8% | | |
| Corning, Inc. | 596,618 | 11,771,273 |
|
| Energy Equipment and Services — 1.4% | | |
| Schlumberger Ltd. | 216,846 | 18,689,957 |
|
| Food and Staples Retailing — 3.5% | | |
| CVS Health Corp. | 160,675 | 16,851,594 |
|
| Kroger Co. (The) | 172,788 | 12,528,858 |
|
| Wal-Mart Stores, Inc. | 265,922 | 18,861,847 |
|
| | | 48,242,299 |
|
| Food Products — 3.5% | | |
| Archer-Daniels-Midland Co. | 282,391 | 13,616,894 |
|
| Bunge Ltd. | 115,525 | 10,143,095 |
|
| ConAgra Foods, Inc. | 142,262 | 6,219,695 |
|
| Ingredion, Inc. | 94,372 | 7,531,829 |
|
| Pilgrim's Pride Corp. | 337,415 | 7,750,423 |
|
| Sanderson Farms, Inc. | 42,139 | 3,167,167 |
|
| | | 48,429,103 |
|
| Health Care Equipment and Supplies — 1.8% | | |
| St. Jude Medical, Inc. | 172,653 | 12,615,755 |
|
| Stryker Corp. | 130,257 | 12,448,661 |
|
| | | 25,064,416 |
|
|
| | | | |
| | Shares | Value |
| Health Care Providers and Services — 2.9% | | |
| Aetna, Inc. | 115,482 | $ | 14,719,336 |
|
| Cardinal Health, Inc. | 18,477 | 1,545,601 |
|
Express Scripts Holding Co.(1) | 120,978 | 10,759,783 |
|
HCA Holdings, Inc.(1) | 142,109 | 12,892,129 |
|
| UnitedHealth Group, Inc. | 4,386 | 535,092 |
|
| | | 40,451,941 |
|
| Health Care Technology — 0.8% | | |
Cerner Corp.(1) | 160,051 | 11,053,122 |
|
| Hotels, Restaurants and Leisure — 2.4% | | |
| Brinker International, Inc. | 181,000 | 10,434,650 |
|
| Cracker Barrel Old Country Store, Inc. | 20,238 | 3,018,700 |
|
| Darden Restaurants, Inc. | 83,426 | 5,929,920 |
|
| Las Vegas Sands Corp. | 177,586 | 9,335,696 |
|
| Wyndham Worldwide Corp. | 49,686 | 4,069,780 |
|
| | | 32,788,746 |
|
| Household Products — 1.9% | | |
| Procter & Gamble Co. (The) | 335,656 | 26,261,725 |
|
| Industrial Conglomerates — 1.9% | | |
| 3M Co. | 111,971 | 17,277,125 |
|
| General Electric Co. | 322,454 | 8,567,603 |
|
| | | 25,844,728 |
|
| Insurance — 2.8% | | |
| Allstate Corp. (The) | 184,873 | 11,992,712 |
|
| Amtrust Financial Services, Inc. | 160,396 | 10,507,542 |
|
| Aspen Insurance Holdings Ltd. | 142,800 | 6,840,120 |
|
| Hanover Insurance Group, Inc. (The) | 117,882 | 8,726,804 |
|
| | | 38,067,178 |
|
| Internet Software and Services — 2.0% | | |
eBay, Inc.(1) | 268,668 | 16,184,560 |
|
Google, Inc., Class A(1) | 22,464 | 12,131,459 |
|
| | | 28,316,019 |
|
| IT Services — 3.2% | | |
| Accenture plc, Class A | 157,067 | 15,200,944 |
|
| Amdocs Ltd. | 137,221 | 7,490,894 |
|
| International Business Machines Corp. | 133,622 | 21,734,955 |
|
| | | 44,426,793 |
|
| Life Sciences Tools and Services — 0.2% | | |
Bio-Rad Laboratories, Inc., Class A(1) | 19,673 | 2,962,951 |
|
| Machinery — 3.9% | | |
| Caterpillar, Inc. | 162,705 | 13,800,638 |
|
| Cummins, Inc. | 86,371 | 11,331,011 |
|
| PACCAR, Inc. | 94,058 | 6,001,841 |
|
| Parker-Hannifin Corp. | 92,963 | 10,814,386 |
|
| Stanley Black & Decker, Inc. | 114,300 | 12,028,932 |
|
| | | 53,976,808 |
|
|
| | | | |
| | Shares | Value |
| Media — 3.2% | | |
| Comcast Corp., Class A | 368,960 | $ | 22,189,254 |
|
DIRECTV(1) | 37,779 | 3,505,514 |
|
| Omnicom Group, Inc. | 89,601 | 6,226,374 |
|
| Twenty-First Century Fox, Inc. | 140,239 | 4,564,078 |
|
| Viacom, Inc., Class B | 105,878 | 6,843,954 |
|
| Walt Disney Co. (The) | 7,016 | 800,806 |
|
| | | 44,129,980 |
|
| Metals and Mining — 0.5% | | |
| Alcoa, Inc. | 567,262 | 6,324,971 |
|
| Multi-Utilities — 0.1% | | |
| Public Service Enterprise Group, Inc. | 23,231 | 912,514 |
|
| Multiline Retail — 2.9% | | |
| Big Lots, Inc. | 146,026 | 6,569,710 |
|
| Dillard's, Inc., Class A | 70,195 | 7,383,812 |
|
| Kohl's Corp. | 179,531 | 11,240,436 |
|
| Target Corp. | 181,626 | 14,826,130 |
|
| | | 40,020,088 |
|
| Oil, Gas and Consumable Fuels — 4.0% | | |
| Chevron Corp. | 36,097 | 3,482,278 |
|
| CVR Energy, Inc. | 32,652 | 1,229,021 |
|
| Exxon Mobil Corp. | 178,346 | 14,838,387 |
|
| Marathon Petroleum Corp. | 60,804 | 3,180,657 |
|
| Murphy Oil Corp. | 256,951 | 10,681,453 |
|
| Valero Energy Corp. | 252,939 | 15,833,982 |
|
| Western Refining, Inc. | 141,765 | 6,183,789 |
|
| | | 55,429,567 |
|
| Pharmaceuticals — 6.5% | | |
| AbbVie, Inc. | 293,020 | 19,688,014 |
|
| Johnson & Johnson | 216,333 | 21,083,814 |
|
| Merck & Co., Inc. | 386,942 | 22,028,608 |
|
| Pfizer, Inc. | 787,314 | 26,398,638 |
|
| | | 89,199,074 |
|
| Real Estate Investment Trusts (REITs) — 2.0% | | |
| Hospitality Properties Trust | 198,578 | 5,723,018 |
|
| Lamar Advertising Co., Class A | 178,986 | 10,288,115 |
|
| Plum Creek Timber Co., Inc. | 40,831 | 1,656,514 |
|
| RLJ Lodging Trust | 138,380 | 4,120,956 |
|
| Ryman Hospitality Properties, Inc. | 104,804 | 5,566,141 |
|
| | | 27,354,744 |
|
| Real Estate Management and Development — 0.8% | | |
CBRE Group, Inc.(1) | 41,197 | 1,524,289 |
|
| Jones Lang LaSalle, Inc. | 56,042 | 9,583,182 |
|
| | | 11,107,471 |
|
| Semiconductors and Semiconductor Equipment — 2.5% | | |
| Intel Corp. | 696,990 | 21,198,951 |
|
|
| | | | |
| | Shares | Value |
| Texas Instruments, Inc. | 272,047 | $ | 14,013,141 |
|
| | | 35,212,092 |
|
| Software — 4.9% | | |
| Activision Blizzard, Inc. | 77,529 | 1,876,977 |
|
| Microsoft Corp. | 813,767 | 35,927,813 |
|
| Oracle Corp. | 502,912 | 20,267,354 |
|
Synopsys, Inc.(1) | 195,069 | 9,880,245 |
|
| | | 67,952,389 |
|
| Specialty Retail — 2.9% | | |
Bed Bath & Beyond, Inc.(1) | 44,438 | 3,065,333 |
|
| Foot Locker, Inc. | 190,398 | 12,758,570 |
|
| Gap, Inc. (The) | 251,190 | 9,587,922 |
|
| Lowe's Cos., Inc. | 221,421 | 14,828,565 |
|
| | | 40,240,390 |
|
| Technology Hardware, Storage and Peripherals — 5.5% | | |
| Apple, Inc. | 379,060 | 47,543,600 |
|
| EMC Corp. | 102,965 | 2,717,246 |
|
| Hewlett-Packard Co. | 438,386 | 13,155,964 |
|
| Seagate Technology plc | 72,902 | 3,462,845 |
|
| Western Digital Corp. | 112,530 | 8,824,603 |
|
| | | 75,704,258 |
|
| Textiles, Apparel and Luxury Goods — 0.1% | | |
| Wolverine World Wide, Inc. | 34,091 | 970,912 |
|
| Thrifts and Mortgage Finance — 0.4% | | |
Essent Group Ltd.(1) | 97,191 | 2,658,174 |
|
| EverBank Financial Corp. | 141,836 | 2,787,077 |
|
| | | 5,445,251 |
|
TOTAL COMMON STOCKS (Cost $1,201,956,123) | | 1,361,120,224 |
|
| TEMPORARY CASH INVESTMENTS — 1.3% | | |
Repurchase Agreement, Bank of America Merrill Lynch, (collateralized by various U.S. Treasury obligations, 1.50%, 1/31/19 - 11/30/19, valued at $2,979,569), in a joint trading account at 0.10%, dated 6/30/15, due 7/1/15 (Delivery value $2,920,120) | | 2,920,111 |
|
| Repurchase Agreement, Fixed Income Clearing Corp., (collateralized by various U.S. Treasury obligations, 2.50%, 8/15/23, valued at $11,917,271), at 0.01%, dated 6/30/15, due 7/1/15 (Delivery value $11,682,003) | | 11,682,000 |
|
| State Street Institutional Liquid Reserves Fund, Premier Class | 2,904,075 | 2,904,075 |
|
TOTAL TEMPORARY CASH INVESTMENTS (Cost $17,506,186) | | 17,506,186 |
|
TOTAL INVESTMENT SECURITIES — 99.8% (Cost $1,219,462,309) | | 1,378,626,410 |
|
| OTHER ASSETS AND LIABILITIES — 0.2% | | 2,422,750 |
|
| TOTAL NET ASSETS — 100.0% | | $ | 1,381,049,160 |
|
|
|
| NOTES TO SCHEDULE OF INVESTMENTS |
See Notes to Financial Statements.
|
|
| Statement of Assets and Liabilities |
|
| | | |
| JUNE 30, 2015 | |
| Assets | |
| Investment securities, at value (cost of $1,219,462,309) | $ | 1,378,626,410 |
|
| Receivable for investments sold | 4,097,641 |
|
| Receivable for capital shares sold | 1,453,114 |
|
| Dividends and interest receivable | 1,451,599 |
|
| | 1,385,628,764 |
|
| | |
| Liabilities | |
| Payable for investments purchased | 4,049,405 |
|
| Accrued management fees | 530,199 |
|
| | 4,579,604 |
|
| | |
| Net Assets | $ | 1,381,049,160 |
|
| | |
| Institutional Class Capital Shares, $0.01 Par Value | |
| Shares authorized | 710,000,000 |
|
| Shares outstanding | 112,282,370 |
|
| | |
| Net Asset Value Per Share | $ | 12.30 |
|
| | |
| Net Assets Consist of: | |
| Capital (par value and paid-in surplus) | $ | 1,154,303,535 |
|
| Undistributed net investment income | 1,406,402 |
|
| Undistributed net realized gain | 66,175,122 |
|
| Net unrealized appreciation | 159,164,101 |
|
| | $ | 1,381,049,160 |
|
See Notes to Financial Statements.
|
| | | |
| YEAR ENDED JUNE 30, 2015 | |
| Investment Income (Loss) | |
| Income: | |
| Dividends (net of foreign taxes withheld of $18,116) | $ | 26,266,839 |
|
| Interest | 3,993 |
|
| | 26,270,832 |
|
| | |
| Expenses: | |
| Management fees | 5,726,370 |
|
| Directors' fees and expenses | 60,455 |
|
| | 5,786,825 |
|
| | |
| Net investment income (loss) | 20,484,007 |
|
| | |
| Realized and Unrealized Gain (Loss) | |
| Net realized gain (loss) on: | |
| Investment transactions | 110,775,277 |
|
| Futures contract transactions | 94,952 |
|
| | 110,870,229 |
|
| | |
| Change in net unrealized appreciation (depreciation) on investments | (60,626,024 | ) |
| | |
| Net realized and unrealized gain (loss) | 50,244,205 |
|
| | |
| Net Increase (Decrease) in Net Assets Resulting from Operations | $ | 70,728,212 |
|
See Notes to Financial Statements.
|
|
| Statement of Changes in Net Assets |
|
| | | | | | |
| YEARS ENDED JUNE 30, 2015 AND JUNE 30, 2014 |
| Increase (Decrease) in Net Assets | June 30, 2015 | June 30, 2014 |
| Operations | | |
| Net investment income (loss) | $ | 20,484,007 |
| $ | 15,772,109 |
|
| Net realized gain (loss) | 110,870,229 |
| 98,191,715 |
|
| Change in net unrealized appreciation (depreciation) | (60,626,024 | ) | 100,152,803 |
|
| Net increase (decrease) in net assets resulting from operations | 70,728,212 |
| 214,116,627 |
|
| | | |
| Distributions to Shareholders | | |
| From net investment income | (19,553,090 | ) | (15,303,543 | ) |
| From net realized gains | (111,633,314 | ) | (83,092,332 | ) |
| Decrease in net assets from distributions | (131,186,404 | ) | (98,395,875 | ) |
| | | |
| Capital Share Transactions | | |
| Proceeds from shares sold | 288,468,292 |
| 179,185,362 |
|
| Proceeds from reinvestment of distributions | 131,186,404 |
| 98,395,875 |
|
| Payments for shares redeemed | (102,850,160 | ) | (48,276,197 | ) |
| Net increase (decrease) in net assets from capital share transactions | 316,804,536 |
| 229,305,040 |
|
| | | |
| Net increase (decrease) in net assets | 256,346,344 |
| 345,025,792 |
|
| | | |
| Net Assets | | |
| Beginning of period | 1,124,702,816 |
| 779,677,024 |
|
| End of period | $ | 1,381,049,160 |
| $ | 1,124,702,816 |
|
| | | |
| Undistributed net investment income | $ | 1,406,402 |
| $ | 917,994 |
|
| | | |
| Transactions in Shares of the Fund | | |
| Sold | 23,274,654 |
| 14,586,133 |
|
| Issued in reinvestment of distributions | 10,792,181 |
| 8,165,196 |
|
| Redeemed | (8,060,298 | ) | (3,824,575 | ) |
| Net increase (decrease) in shares of the fund | 26,006,537 |
| 18,926,754 |
|
See Notes to Financial Statements.
|
|
| Notes to Financial Statements |
JUNE 30, 2015
1. Organization
American Century Quantitative Equity Funds, Inc. (the corporation) is registered under the Investment Company Act of 1940, as amended (the 1940 Act), as an open-end management investment company and is organized as a Maryland corporation. NT Equity Growth Fund (the fund) is one fund in a series issued by the corporation. The fund is diversified as defined under the 1940 Act. The fund’s investment objective is to seek long-term capital growth. The fund is not permitted to invest in securities issued by companies assigned the Global Industry Classification Standard for the tobacco industry.
2. Significant Accounting Policies
The following is a summary of significant accounting policies consistently followed by the fund in preparation of its financial statements. The fund is an investment company and follows accounting and reporting guidance in accordance with accounting principles generally accepted in the United States of America. This may require management to make certain estimates and assumptions at the date of the financial statements. Actual results could differ from these estimates. Management evaluated the impact of events or transactions occurring through the date the financial statements were issued that would merit recognition or disclosure.
Investment Valuations — The fund determines the fair value of its investments and computes its net asset value per share at the close of regular trading (usually 4 p.m. Eastern time) on the New York Stock Exchange (NYSE) on each day the NYSE is open. The Board of Directors has adopted valuation policies and procedures to guide the investment advisor in the fund’s investment valuation process and to provide methodologies for the oversight of the fund’s pricing function.
Equity securities that are listed or traded on a domestic securities exchange are valued at the last reported sales price or at the official closing price as provided by the exchange. Equity securities traded on foreign securities exchanges are generally valued at the closing price of such securities on the exchange where primarily traded or at the close of the NYSE, if that is earlier. If no last sales price is reported, or if local convention or regulation so provides, the mean of the latest bid and asked prices may be used. Securities traded over-the-counter are valued at the mean of the latest bid and asked prices, the last sales price, or the official closing price.
Fixed income securities maturing within 60 days at the time of purchase may be valued at cost, plus or minus any amortized discount or premium or at the evaluated mean as provided by an independent pricing service. Evaluated mean prices are commonly derived through utilization of market models, which may consider, among other factors: trade data, quotations from dealers and active market makers, relevant yield curve and spread data, related sector levels, creditworthiness, trade data or market information on comparable securities, and other relevant security specific information.
Open-end management investment companies are valued at the reported net asset value per share. Repurchase agreements are valued at cost, which approximates fair value. Exchange-traded futures contracts are valued at the settlement price as provided by the appropriate clearing corporation.
If the fund determines that the market price for an investment is not readily available or the valuation methods mentioned above do not reflect an investment’s fair value, such investment is valued as determined in good faith by the Board of Directors or its delegate, in accordance with policies and procedures adopted by the Board of Directors. In its determination of fair value, the fund may review several factors including, but not limited to, market information regarding the specific investment or comparable investments and correlation with other investment types, futures indices or general market indicators. Circumstances that may cause the fund to use these procedures to value an investment include, but are not limited to: an investment has been declared in default or is distressed; trading in a security has been suspended during the trading day or a security is not actively trading on its principal exchange; prices received from a regular pricing source are deemed unreliable; or there is a foreign market holiday and no trading occurred.
The fund monitors for significant events occurring after the close of an investment’s primary exchange but before the fund’s net asset value per share is determined. Significant events may include, but are not limited to: corporate announcements and transactions; governmental action and political unrest that could impact a specific investment or an investment sector; or armed conflicts, natural disasters and similar events that could affect investments in a specific country or region. The fund also monitors for significant fluctuations between domestic and foreign markets, as evidenced by the U.S. market or such other indicators that the Board of Directors, or its delegate, deems appropriate. If significant fluctuations in foreign markets are identified, the fund may apply a model-derived factor to the closing price of equity securities traded on foreign securities exchanges. The factor is based on observable market data as provided by an independent pricing service.
Security Transactions — Security transactions are accounted for as of the trade date. Net realized gains and losses are determined on the identified cost basis, which is also used for federal income tax purposes.
Investment Income — Dividend income less foreign taxes withheld, if any, is recorded as of the ex-dividend date. Distributions received on securities that represent a return of capital or long-term capital gain are recorded as a reduction of cost of investments and/or as a realized gain. The fund may estimate the components of distributions received that may be considered nontaxable distributions or long-term capital gain distributions for income tax purposes. Interest income is recorded on the accrual basis and includes accretion of discounts and amortization of premiums.
Repurchase Agreements — The fund may enter into repurchase agreements with institutions that American Century Investment Management, Inc. (ACIM) (the investment advisor) has determined are creditworthy pursuant to criteria adopted by the Board of Directors. The fund requires that the collateral, represented by securities, received in a repurchase transaction be transferred to the custodian in a manner sufficient to enable the fund to obtain those securities in the event of a default under the repurchase agreement. ACIM monitors, on a daily basis, the securities transferred to ensure the value, including accrued interest, of the securities under each repurchase agreement is equal to or greater than amounts owed to the fund under each repurchase agreement.
Joint Trading Account — Pursuant to an Exemptive Order issued by the Securities and Exchange Commission, the fund, along with certain other funds in the American Century Investments family of funds, may transfer uninvested cash balances into a joint trading account. These balances are invested in one or more repurchase agreements that are collateralized by U.S. Treasury or Agency obligations.
Segregated Assets — In accordance with the 1940 Act, the fund segregates assets on its books and records to cover futures contracts. ACIM monitors, on a daily basis, the securities segregated to ensure the fund designates a sufficient amount of liquid assets, marked-to-market daily. The fund may also receive assets or be required to pledge assets at the custodian bank or with a broker for margin requirements on futures contracts.
Income Tax Status — It is the fund’s policy to distribute substantially all net investment income and net realized gains to shareholders and to otherwise qualify as a regulated investment company under provisions of the Internal Revenue Code. Accordingly, no provision has been made for income taxes. The fund files U.S. federal, state, local and non-U.S. tax returns as applicable. The fund's tax returns are subject to examination by the relevant taxing authority until expiration of the applicable statute of limitations, which is generally three years from the date of filing but can be longer in certain jurisdictions. At this time, management believes there are no uncertain tax positions which, based on their technical merit, would not be sustained upon examination and for which it is reasonably possible that the total amounts of unrecognized tax benefits will significantly change in the next twelve months.
Distributions to Shareholders — Distributions from net investment income, if any, are generally declared and paid quarterly. Distributions from net realized gains, if any, are generally declared and paid annually.
Indemnifications — Under the corporation’s organizational documents, its officers and directors are indemnified against certain liabilities arising out of the performance of their duties to the fund. In addition, in the normal course of business, the fund enters into contracts that provide general indemnifications. The maximum exposure under these arrangements is unknown as this would involve future claims that may be made against a fund. The risk of material loss from such claims is considered by management to be remote.
3. Fees and Transactions with Related Parties
Certain officers and directors of the corporation are also officers and/or directors of American Century Companies, Inc. (ACC). The corporation’s investment advisor, ACIM, the corporation's distributor, American
Century Investment Services, Inc., and the corporation’s transfer agent, American Century Services, LLC, are wholly owned, directly or indirectly, by ACC. Various funds issued by American Century Asset Allocation Portfolios, Inc. own, in aggregate, 100% of the shares of the fund. Related parties do not invest in the fund for the purpose of exercising management or control.
Management Fees — The corporation has entered into a management agreement with ACIM, under which ACIM provides the fund with investment advisory and management services in exchange for a single, unified management fee (the fee). The agreement provides that all expenses of managing and operating the fund, except distribution and service fees, brokerage expenses, taxes, interest, fees and expenses of the independent directors (including legal counsel fees), and extraordinary expenses, will be paid by ACIM. The fee is computed and accrued daily based on the daily net assets of the fund and paid monthly in arrears. The fee consists of (1) an Investment Category Fee based on the daily net assets of the fund and certain other accounts managed by the investment advisor that are in the same broad investment category as the fund and (2) a Complex Fee based on the assets of all the funds in the American Century Investments family of funds. The rates for the Investment Category Fee range from 0.3380% to 0.5200%. The rates for the Complex Fee range from 0.0500% to 0.1100%. The effective annual management fee for the year ended June 30, 2015 was 0.46%.
Directors' Fees and Expenses — The Board of Directors is responsible for overseeing the investment advisor’s management and operations of the fund. The directors receive detailed information about the fund and its investment advisor regularly throughout the year, and meet at least quarterly with management of the investment advisor to review reports about fund operations. The fund’s officers do not receive compensation from the fund.
4. Investment Transactions
Purchases and sales of investment securities, excluding short-term investments, for the year ended June 30, 2015 were $1,216,293,541 and $1,020,209,630, respectively.
5. Fair Value Measurements
The fund’s investments valuation process is based on several considerations and may use multiple inputs to determine the fair value of the investments held by the fund. In conformity with accounting principles generally accepted in the United States of America, the inputs used to determine a valuation are classified into three broad levels.
| |
| • | Level 1 valuation inputs consist of unadjusted quoted prices in an active market for identical investments. |
| |
| • | Level 2 valuation inputs consist of direct or indirect observable market data (including quoted prices for comparable investments, evaluations of subsequent market events, interest rates, prepayment speeds, credit risk, etc.). These inputs also consist of quoted prices for identical investments initially expressed in local currencies that are adjusted through translation into U.S. dollars. |
| |
| • | Level 3 valuation inputs consist of unobservable data (including a fund’s own assumptions). |
The level classification is based on the lowest level input that is significant to the fair valuation measurement. The valuation inputs are not necessarily an indication of the risks associated with investing in these securities or other financial instruments. There were no significant transfers between levels during the period.
The following is a summary of the level classifications as of period end. The Schedule of Investments provides additional information on the fund’s portfolio holdings.
|
| | | | | | | | |
| | Level 1 | Level 2 | Level 3 |
| Assets | | | |
| Investment Securities | | | |
| Common Stocks | $ | 1,361,120,224 |
| — |
| — |
|
| Temporary Cash Investments | 2,904,075 |
| $ | 14,602,111 |
| — |
|
| | $ | 1,364,024,299 |
| $ | 14,602,111 |
| — |
|
6. Derivative Instruments
Equity Price Risk — The fund is subject to equity price risk in the normal course of pursuing its investment objectives. A fund may enter into futures contracts based on an equity index in order to manage its exposure to changes in market conditions. A fund may purchase futures contracts to gain exposure to increases in market value or sell futures contracts to protect against a decline in market value. Upon entering into a futures contract, a fund is required to deposit either cash or securities in an amount equal to a certain percentage of the contract value (initial margin). Subsequent payments (variation margin) are made or received daily, in cash, by a fund. The variation margin is equal to the daily change in the contract value and is recorded as unrealized gains and losses. A fund recognizes a realized gain or loss when the contract is closed or expires. Net realized and unrealized gains or losses occurring during the holding period of futures contracts are a component of net realized gain (loss) on futures contract transactions and change in net unrealized appreciation (depreciation) on futures contracts, respectively. One of the risks of entering into futures contracts is the possibility that the change in value of the contract may not correlate with the changes in value of the underlying securities. During the period, the fund infrequently purchased equity price risk derivative instruments for temporary investment purposes.
At period end, the fund did not have any derivative instruments disclosed on the Statement of Assets and Liabilities. For the year ended June 30, 2015, the effect of equity price risk derivative instruments on the Statement of Operations was $94,952 in net realized gain (loss) on futures contract transactions.
7. Federal Tax Information
The tax character of distributions paid during the years ended June 30, 2015 and June 30, 2014 were as follows:
|
| | | | | | |
| | 2015 | 2014 |
| Distributions Paid From | | |
| Ordinary income | $ | 53,605,692 |
| $ | 59,700,311 |
|
| Long-term capital gains | $ | 77,580,712 |
| $ | 38,695,564 |
|
The book-basis character of distributions made during the year from net investment income or net realized gains may differ from their ultimate characterization for federal income tax purposes. These differences reflect the differing character of certain income items and net realized gains and losses for financial statement and tax purposes, and may result in reclassification among certain capital accounts on the financial statements.
As of June 30, 2015, the federal tax cost of investments and the components of distributable earnings on a tax-basis were as follows:
|
| | | |
| Federal tax cost of investments | $ | 1,222,271,192 |
|
| Gross tax appreciation of investments | $ | 187,602,446 |
|
| Gross tax depreciation of investments | (31,247,228 | ) |
| Net tax appreciation (depreciation) of investments | $ | 156,355,218 |
|
| Undistributed ordinary income | $ | 14,343,479 |
|
| Accumulated long-term gains | $ | 56,046,928 |
|
The difference between book-basis and tax-basis unrealized appreciation (depreciation) is attributable primarily to the tax deferral of losses on wash sales.
|
| | | | | | | | | | | | | | | |
| For a Share Outstanding Throughout the Years Ended June 30 (except as noted) | | | |
| Per-Share Data | | | | Ratios and Supplemental Data |
| | | Income From Investment Operations: | Distributions From: | | | Ratio to Average Net Assets of: | | |
| | Net Asset Value, Beginning of Period | Net Investment Income (Loss)(1) | Net Realized and Unrealized Gain (Loss) | Total From Investment Operations | Net Investment Income | Net Realized Gains | Total Distributions | Net Asset Value, End of Period | Total Return(2) | Operating Expenses | Net Investment Income (Loss) | Portfolio Turnover Rate | Net Assets, End of Period (in thousands) |
| Institutional Class | | | | | | | | | | |
| 2015 | $13.04 | 0.21 | 0.53 | 0.74 | (0.20) | (1.28) | (1.48) | $12.30 | 5.97% | 0.47% | 1.66% | 84% |
| $1,381,049 |
|
| 2014 | $11.58 | 0.20 | 2.59 | 2.79 | (0.19) | (1.14) | (1.33) | $13.04 | 25.29% | 0.47% | 1.64% | 77% |
| $1,124,703 |
|
| 2013 | $10.20 | 0.22 | 1.87 | 2.09 | (0.21) | (0.50) | (0.71) | $11.58 | 21.39% | 0.48% | 2.03% | 95% |
| $779,677 |
|
| 2012 | $10.27 | 0.17 | 0.35 | 0.52 | (0.18) | (0.41) | (0.59) | $10.20 | 5.65% | 0.48% | 1.75% | 104% |
| $558,993 |
|
| 2011 | $7.92 | 0.14 | 2.34 | 2.48 | (0.13) | — | (0.13) | $10.27 | 31.45% | 0.49% | 1.46% | 84% |
| $550,202 |
|
|
|
| Notes to Financial Highlights |
| |
| (1) | Computed using average shares outstanding throughout the period. |
| |
| (2) | Total returns are calculated based on the net asset value of the last business day. Total returns for periods less than one year are not annualized. |
See Notes to Financial Statements.
|
|
| Report of Independent Registered Public Accounting Firm |
To the Directors of the American Century Quantitative Equity Funds, Inc. and Shareholders of the
NT Equity Growth Fund:
In our opinion, the accompanying statement of assets and liabilities, including the schedule of investments, and the related statements of operations and of changes in net assets and the financial highlights present fairly, in all material respects, the financial position of the NT Equity Growth Fund (one of the sixteen funds comprising the American Century Quantitative Equity Funds, Inc., hereafter referred to as the “Fund”) at June 30, 2015, the results of its operations for the year then ended, the changes in its net assets for each of the two years in the period then ended and the financial highlights for each of the five years in the period then ended, in conformity with accounting principles generally accepted in the United States of America. These financial statements and financial highlights (hereafter referred to as "financial statements") are the responsibility of the Fund's management. Our responsibility is to express an opinion on these financial statements based on our audits. We conducted our audits of these financial statements in accordance with the standards of the Public Company Accounting Oversight Board (United States). Those standards require that we plan and perform the audit to obtain reasonable assurance about whether the financial statements are free of material misstatement. An audit includes examining, on a test basis, evidence supporting the amounts and disclosures in the financial statements, assessing the accounting principles used and significant estimates made by management, and evaluating the overall financial statement presentation. We believe that our audits, which included confirmation of securities at June 30, 2015 by correspondence with the custodian and brokers, provide a reasonable basis for our opinion.
PricewaterhouseCoopers LLP
Kansas City, Missouri
August 21, 2015
Board of Directors
The individuals listed below serve as directors of the funds. Each director will continue to serve in this capacity until death, retirement, resignation or removal from office. The board has adopted a mandatory retirement age for directors who are not “interested persons,” as that term is defined in the Investment Company Act (independent directors). Independent directors shall retire on December 31 of the year in which they reach their 75th birthday; provided, however, that on or after January 1, 2022, independent directors shall retire on December 31 of the year in which they reach their 76th birthday.
Mr. Thomas is an “interested person” because he currently serves as President and Chief Executive Officer of American Century Companies, Inc. (ACC), the parent company of American Century Investment Management, Inc. (ACIM or the advisor). The other directors (more than three-fourths of the total number) are independent. They are not employees, directors or officers of, and have no financial interest in, ACC or any of its wholly owned, direct or indirect, subsidiaries, including ACIM, American Century Investment Services, Inc. (ACIS) and American Century Services, LLC (ACS), and they do not have any other affiliations, positions or relationships that would cause them to be considered “interested persons” under the Investment Company Act. The directors serve in this capacity for eight (in the case of Mr. Thomas, 15) registered investment companies in the American Century Investments family of funds.
The following table presents additional information about the directors. The mailing address for each director other than Mr. Thomas is 1665 Charleston Road, Mountain View, California 94043. The mailing address for Mr. Thomas is 4500 Main Street, Kansas City, Missouri 64111.
|
| | | | | |
Name (Year of Birth) | Position(s) Held with Funds | Length of Time Served | Principal Occupation(s) During Past 5 Years | Number of American Century Portfolios Overseen by Director | Other Directorships Held During Past 5 Years |
Independent Directors | | |
Tanya S. Beder
(1955) | Director | Since 2011 | Chairman and CEO, SBCC Group Inc. (independent advisory services) (2006 to present) | 46 | CYS Investments, Inc. (NYSE mortgage arbitrage REIT) |
Jeremy I. Bulow
(1954) | Director | Since 2011 | Professor of Economics, Stanford University, Graduate School of Business (1979 to present) | 46 | None |
Ronald J. Gilson
(1946) | Director and Chairman of the Board | Since 1995
(Chairman since 2005) | Charles J. Meyers Professor of Law and Business, Stanford Law School (1979 to present); Marc and Eva Stern Professor of Law and Business, Columbia University School of Law (1992 to present) | 46 | None |
Frederick L. A. Grauer
(1946) | Director | Since 2008 | Senior Advisor, BlackRock, Inc. (investment management firm) (2010 to 2011, 2013 to present) | 46 | None |
Peter F. Pervere
(1947) | Director | Since 2007 | Retired | 46 | None |
|
| | | | | |
Name (Year of Birth) | Position(s) Held with Funds | Length of Time Served | Principal Occupation(s) During Past 5 Years | Number of American Century Portfolios Overseen by Director | Other Directorships Held During Past 5 Years |
| Independent Directors | | |
John B. Shoven
(1947) | Director | Since 2002 | Professor of Economics, Stanford University (1973 to present) | 46 | Cadence Design Systems; Exponent; Financial Engines |
| Interested Director | | |
Jonathan S. Thomas
(1963) | Director and President | Since 2007 | President and Chief Executive Officer, ACC (March 2007 to present). Also serves as Chief Executive Officer, ACS; Executive Vice President, ACIM; Director, ACC, ACIM and other ACC subsidiaries | 124 | BioMed Valley Discoveries, Inc. |
The Statement of Additional Information has additional information about the fund's directors and is available without charge, upon request, by calling 1-800-345-2021.
Officers
The following table presents certain information about the executive officers of the funds. Each officer serves as an officer for each of the 15 investment companies in the American Century family of funds, unless otherwise noted. No officer is compensated for his or her service as an officer of the funds. The listed officers are interested persons of the funds and are appointed or re-appointed on an annual basis. The mailing address for each of the officers listed below is 4500 Main Street, Kansas City, Missouri 64111.
|
| | |
Name (Year of Birth) | Offices with
the Funds | Principal Occupation(s) During the Past Five Years |
Jonathan S.
Thomas
(1963) | Director and President
since 2007 | President and Chief Executive Officer, ACC (March 2007 to present). Also serves as Chief Executive Officer, ACS; Executive Vice President, ACIM; Director, ACC, ACIM and other ACC subsidiaries |
Amy D. Shelton
(1964) | Chief Compliance Officer and Vice President since 2014 | Chief Compliance Officer, American Century funds, (March 2014 to present); Chief Compliance Officer, ACIM (February 2014 to present); Chief Compliance Officer, ACIS (October 2009 to present); Vice President, Client Interactions and Marketing, ACIS (February 2013 to January 2014); Director, Client Interactions and Marketing, ACIS (June 2007 to January 2013). Also serves as Vice President, ACIS |
Charles A. Etherington
(1957) | General Counsel since 2007 and Senior Vice President since 2006 | Attorney, ACC (February 1994 to present); Vice President, ACC (November 2005 to present); General Counsel, ACC (March 2007 to present). Also serves as General Counsel, ACIM, ACS, ACIS and other ACC subsidiaries; and Senior Vice President, ACIM and ACS |
C. Jean Wade
(1964) | Vice President,
Treasurer and
Chief Financial
Officer since 2012 | Vice President, ACS (February 2000 to present) |
Robert J. Leach
(1966) | Vice President
since 2006 and
Assistant Treasurer
since 2012 | Vice President, ACS (February 2000 to present) |
David H. Reinmiller
(1963) | Vice President since 2001 | Attorney, ACC (January 1994 to present); Associate General Counsel, ACC (January 2001 to present). Also serves as Vice President, ACIM and ACS |
Ward D. Stauffer
(1960) | Secretary since 2005 | Attorney, ACC (June 2003 to present) |
|
|
| Approval of Management Agreement |
At a meeting held on June 16, 2015, the Fund’s Board of Directors unanimously approved the renewal of the management agreement pursuant to which American Century Investment Management, Inc. (the “Advisor”) acts as the investment advisor for the Fund. Under Section 15(c) of the Investment Company Act, contracts for investment advisory services are required to be reviewed, evaluated, and approved by a majority of a fund’s directors/trustees, including a majority of the independent Directors, each year. The Board regards this annual evaluation and renewal as one of its most important responsibilities.
The independent Directors have memorialized a statement regarding the relationship between their ongoing obligations to oversee and evaluate the performance of the Advisor and their annual consideration of renewal of the management agreement. In that statement, the independent Directors noted that their assessment of the Advisor’s performance is an ongoing process that takes place over the entire year and is informed by all of the extensive information that the Board and its committees receive and consider over time. This information, together with the materials provided in connection with the review, are central to the Board’s assessment of the Advisor’s performance and its determination whether to renew the Fund’s management agreement.
Prior to its consideration of the renewal of the management agreement, the Board requested and reviewed extensive data and analysis relating to the proposed renewal. This information and analysis was compiled by the Advisor and certain independent providers of evaluation data concerning the Fund and the services provided to the Fund by the Advisor.
In connection with its consideration of the renewal of the management agreement, the Board’s review and evaluation of the services provided by the Advisor included, but was not limited to, the following:
| |
| • | the nature, extent, and quality of investment management, shareholder services, and other services provided by the Advisor to the Fund; |
| |
| • | the wide range of other programs and services the Advisor provides to the Fund and its shareholders on a routine and non-routine basis; |
| |
| • | the investment performance of the Fund, including data comparing the Fund’s performance to appropriate benchmarks and/or a peer group of other mutual funds with similar investment objectives and strategies; |
| |
| • | the cost of owning the Fund compared to the cost of owning similar funds; |
| |
| • | the Advisor’s compliance policies, procedures, and regulatory experience; |
| |
| • | financial data showing the cost of services provided to the Fund, the profitability of the Fund to the Advisor, and the overall profitability of the Advisor; |
| |
| • | possible economies of scale associated with the Advisor’s management of the Fund and other accounts under its management; |
| |
| • | data comparing services provided and charges to other investment management clients of the Advisor; |
| |
| • | acquired fund fees and expenses; |
| |
| • | payments by the Fund and the Advisor to financial intermediaries whose clients are investors in the Fund; and |
| |
| • | any collateral benefits derived by the Advisor from the management of the Fund. |
In keeping with its practice, the Board held two in-person meetings to review and discuss the information provided in response to their request. The independent Directors also had the benefit of the advice of their independent counsel throughout the process.
Factors Considered
The Directors considered all of the information provided by the Advisor, the independent data providers, and the independent Directors’ independent counsel in connection with the review, and evaluated such information for the Fund. In connection with their review, the Directors did not identify any single factor as being all-important or controlling and each Director may have attributed different levels of importance to different factors. In deciding to renew the management agreement, the Board based its decision on a number of factors, including the following:
Nature, Extent and Quality of Services - Generally. Under the management agreement, the Advisor is responsible for providing or arranging for all services necessary for the operation of the Fund. The Board noted that under the management agreement, the Advisor provides or arranges at its own expense a wide variety of services including:
| |
| • | constructing and designing the Fund |
| |
| • | portfolio research and security selection |
| |
| • | initial capitalization/funding |
| |
| • | daily valuation of the Fund’s portfolio |
| |
| • | shareholder servicing and transfer agency, including shareholder confirmations, recordkeeping, and communications |
| |
| • | legal services (except the independent Directors’ counsel) |
| |
| • | regulatory and portfolio compliance |
| |
| • | marketing and distribution (except amounts paid by the Fund under Rule 12b-1 plans) |
The Board noted that many of these services have expanded over time both in terms of quantity and complexity in response to shareholder demands, competition in the industry, changing distribution channels, and the changing regulatory environment.
Investment Management, Shareholder, and Other Services. The nature of the investment management services provided to the Fund is quite complex and allows Fund shareholders access to professional money management, instant diversification of their investments within an asset class, the opportunity to easily diversify among asset classes by investing in or exchanging among various American Century Investments funds, and liquidity. In evaluating investment performance, the Board expects the Advisor to manage the Fund in accordance with its investment objectives and approved strategies. Further, the Directors recognize that the Advisor has an obligation to seek the best execution of fund trades. In providing these services, the Advisor utilizes teams of investment professionals (portfolio managers, analysts, research assistants, and securities traders) who require extensive information technology, research, training, compliance, and other systems to conduct their business. The Board, directly and through its Portfolio Committee, regularly reviews investment performance information for the Fund, together with comparative information for appropriate benchmarks and/or peer groups of similarly-managed funds, over different time horizons. The Directors also review detailed performance information during the management agreement approval process. If performance concerns are identified, the Fund receives special reviews until performance improves, during which the Board discusses with the Advisor the reasons for such results (e.g., market conditions, security selection) and any efforts being undertaken to improve performance. The Fund’s performance was above its benchmark for the one-, three-, and five-year periods reviewed by the Board. The Board found the investment management services provided by the Advisor to the Fund to be satisfactory and consistent with the management agreement.
Under the management agreement, the Advisor provides the Fund with a comprehensive package of transfer agency, shareholder, and other services. The Board, directly and through various committees of the Board, regularly reviews reports and evaluations of such services at its regular
meetings. These reports include, but are not limited to, information regarding the operational efficiency and accuracy of the shareholder and transfer agency services provided, staffing levels, shareholder satisfaction (as measured by external as well as internal sources), technology support, new products and services offered to Fund shareholders, securities trading activities, portfolio valuation services, auditing services, and legal and operational compliance activities.
Certain aspects of shareholder and transfer agency service level efficiency and the quality of securities trading activities are measured by independent third party providers and are presented in comparison to other fund groups not managed by the Advisor. The Board found the services provided by the Advisor to the Fund under the management agreement to be competitive and of high quality.
Costs of Services and Profitability. The Advisor provides detailed information concerning its cost of providing various services to the Fund, its profitability in managing the Fund, its overall profitability, and its financial condition. The Directors have reviewed with the Advisor the methodology used to prepare this financial information. This information is considered in evaluating the Advisor’s financial condition, its ability to continue to provide services under the management agreement, and the reasonableness of the current management fee. The Board concluded that the Advisor’s profits were reasonable in light of the services provided to the Fund.
Ethics. The Board generally considers the Advisor’s commitment to providing quality services to shareholders and to conducting its business ethically. They noted that the Advisor’s practices generally meet or exceed industry best practices.
Economies of Scale. The Board also reviewed information provided by the Advisor regarding the possible existence of economies of scale in connection with the management of the Fund. The Board concluded that economies of scale are difficult to measure and predict with precision, especially on a fund-by-fund basis. The Board concluded that the Advisor is appropriately sharing economies of scale through its competitive fee structure, offering competitive fees from fund inception, and through reinvestment in its business to provide shareholders enhanced and expanded services.
Comparison to Other Funds’ Fees. The management agreement provides that the Fund pays the Advisor a single, all-inclusive (or unified) management fee for providing all services necessary for the management and operation of the Fund, other than brokerage expenses, taxes, interest, extraordinary expenses, the fees and expenses of the Fund’s independent Directors (including their independent legal counsel), and expenses incurred in connection with the provision of shareholder services and distribution services under a plan adopted pursuant to Rule 12b-1 under the 1940 Act. Under the unified fee structure, the Advisor is responsible for providing all investment advisory, custody, audit, administrative, compliance, recordkeeping, marketing, and shareholder services, or arranging and supervising third parties to provide such services. By contrast, most other funds are charged a variety of fees, including an investment advisory fee, a transfer agency fee, an administrative fee, distribution charges, and other expenses. Other than their investment advisory fees and any applicable Rule 12b-1 fees, all other components of the total fees charged by these other funds may be increased without shareholder approval. The Board believes the unified fee structure is a benefit to Fund shareholders because it clearly discloses to shareholders the cost of owning Fund shares, and, since the unified fee cannot be increased without a vote of Fund shareholders, it shifts to the Advisor the risk of increased costs of operating the Fund and provides a direct incentive to minimize administrative inefficiencies. Part of the Board’s analysis of fee levels involves reviewing certain evaluative data compiled by an independent provider and comparing the Fund’s unified fee to the total expense ratio of peer funds. The unified fee charged to shareholders of the Fund was below the median of the total expense ratios of the Fund’s peer group. The Board concluded that the management fee paid by the Fund to the Advisor under the management agreement is reasonable in light of the services provided to the Fund.
Comparison to Fees and Services Provided to Other Clients of the Advisor. The Board also requested and received information from the Advisor concerning the nature of the services, fees, costs, and profitability of its advisory services to advisory clients other than the Fund. They observed that these varying types of client accounts require different services and involve different regulatory and entrepreneurial risks than the management of the Fund. The Board analyzed this information and concluded that the fees charged and services provided to the Fund were reasonable by comparison.
Payments to Intermediaries. The Directors also requested and received a description of payments made to intermediaries by the Fund and the Advisor. These payments include various payments made by the Fund or the Advisor to different types of intermediaries and recordkeepers for distribution and service activities provided for the Fund.
Collateral or “Fall-Out” Benefits Derived by the Advisor. The Board considered the existence of collateral benefits the Advisor may receive as a result of its relationship with the Fund. The Board noted that the Advisor’s primary business is managing mutual funds and it generally does not use fund or shareholder information to generate profits in other lines of business, and therefore does not derive any significant collateral benefits from them. The Board noted that the Advisor receives proprietary research from broker-dealers that execute fund portfolio transactions. The Board also determined that the Advisor is able to provide investment management services to certain clients other than the Fund, at least in part, due to its existing infrastructure built to serve the fund complex.
Existing Relationship. The Board also considered whether there was any reason for not continuing the existing arrangement with the Advisor. In this regard, the Board was mindful of the potential disruptions of the Fund’s operations and various risks, uncertainties, and other effects that could occur as a result of a decision not to continue such relationship. In particular, the Board recognized that most shareholders have invested in the Fund on the strength of the Advisor’s industry standing and reputation and in the expectation that the Advisor will have a continuing role in providing advisory services to the Fund.
Conclusion of the Directors. As a result of this process, the Board, including all of the independent Directors and assisted by the advice of independent legal counsel, taking into account all of the factors discussed above and the information provided by the Advisor and others in connection with its review and throughout the year, concluded that the management agreement between the Fund and the Advisor is fair and reasonable in light of the services provided and should be renewed.
Retirement Account Information
As required by law, distributions you receive from certain IRAs are subject to federal income tax withholding, unless you elect not to have withholding apply. Tax will be withheld on the total amount withdrawn even though you may be receiving amounts that are not subject to withholding, such as nondeductible contributions. In such case, excess amounts of withholding could occur. You may adjust your withholding election so that a greater or lesser amount will be withheld.
If you don’t want us to withhold on this amount, you must notify us to not withhold the federal income tax. You may notify us in writing or in certain situations by telephone or through other electronic means. For systematic withdrawals, your withholding election will remain in effect until revoked or changed by filing a new election. You have the right to revoke your election at any time.
Remember, even if you elect not to have income tax withheld, you are liable for paying income tax on the taxable portion of your withdrawal. If you elect not to have income tax withheld or you don’t have enough income tax withheld, you may be responsible for payment of estimated tax. You may incur penalties under the estimated tax rules if your withholding and estimated tax payments are not sufficient. You can reduce or defer the income tax on a distribution by directly or indirectly rolling such distribution over to another IRA or eligible plan. You should consult your tax advisor for additional information.
State tax will be withheld if, at the time of your distribution, your address is within one of the mandatory withholding states and you have federal income tax withheld (or as otherwise required by state law). State taxes will be withheld from your distribution in accordance with the respective state rules.
Distributions you receive from 403(b), 457 and qualified plans are subject to special tax and withholding rules. Your plan administrator or plan sponsor is required to provide you with a special tax notice explaining those rules at the time you request a distribution. If applicable, federal and/or state taxes may be withheld from your distribution amount.
Proxy Voting Policies
Descriptions of the principles and policies that the fund's investment advisor uses in exercising the voting rights associated with the securities purchased and/or held by the fund are available without charge, upon request, by calling 1-800-345-2021 or visiting the "About Us" page of American Century Investments’ website at americancentury.com. A description of the policies is also available on the Securities and Exchange Commission’s website at sec.gov. Information regarding how the investment advisor voted proxies relating to portfolio securities during the most recent 12-month period ended June 30 is available on the "About Us" page at americancentury.com. It is also available at sec.gov.
Quarterly Portfolio Disclosure
The fund files its complete schedule of portfolio holdings with the Securities and Exchange Commission (SEC) for the first and third quarters of each fiscal year on Form N-Q. The fund’s Forms N-Q are available on the SEC’s website at sec.gov, and may be reviewed and copied at the SEC’s Public Reference Room in Washington, DC. Information on the operation of the Public Reference Room may be obtained by calling 1-800-SEC-0330. The fund also makes its complete schedule of portfolio holdings for the most recent quarter of its fiscal year available on its website at americancentury.com and, upon request, by calling 1-800-345-2021.
Other Tax Information
The following information is provided pursuant to provisions of the Internal Revenue Code.
The fund hereby designates up to the maximum amount allowable as qualified dividend income for the fiscal year ended June 30, 2015.
For corporate taxpayers, the fund hereby designates $23,749,445, or up to the maximum amount allowable, of ordinary income distributions paid during the fiscal year ended June 30, 2015 as qualified for the corporate dividends received deduction.
The fund hereby designates $34,052,602 as qualified short-term capital gain distributions for purposes of Internal Revenue Code Section 871 for the fiscal year ended June 30, 2015.
The fund hereby designates $77,580,712, or up to the maximum amount allowable, as long-term capital gain distributions for the fiscal year ended June 30, 2015.
|
| | |
| |
| | | |
| Contact Us | americancentury.com | |
| Automated Information Line | 1-800-345-8765 | |
| Investor Services Representative | 1-800-345-2021
or 816-531-5575 | |
| Investors Using Advisors | 1-800-378-9878 | |
Business, Not-For-Profit, Employer-Sponsored
Retirement Plans | 1-800-345-3533 | |
Banks and Trust Companies, Broker-Dealers,
Financial Professionals, Insurance Companies | 1-800-345-6488 | |
| Telecommunications Relay Service for the Deaf | 711 | |
| | | |
| American Century Quantitative Equity Funds, Inc. | |
| | | |
Investment Advisor: American Century Investment Management, Inc. Kansas City, Missouri | |
| | | |
| This report and the statements it contains are submitted for the general information of our shareholders. The report is not authorized for distribution to prospective investors unless preceded or accompanied by an effective prospectus. | |
| | | |
©2015 American Century Proprietary Holdings, Inc. All rights reserved.
CL-ANN-86514 1508 | |
|
| |
| ANNUAL REPORT | JUNE 30, 2015 |
NT Small Company Fund
|
| | |
| Performance | 2 |
|
| Portfolio Commentary | |
|
| Fund Characteristics | |
|
| Shareholder Fee Example | |
|
| Schedule of Investments | |
|
| Statement of Assets and Liabilities | |
|
| Statement of Operations | |
|
| Statement of Changes in Net Assets | |
|
| Notes to Financial Statements | |
|
| Financial Highlights | |
|
| Report of Independent Registered Public Accounting Firm | |
|
| Management | |
|
| Approval of Management Agreement | |
|
| Additional Information | |
|
Any opinions expressed in this report reflect those of the author as of the date of the report, and do not necessarily represent the opinions of American Century Investments® or any other person in the American Century Investments organization. Any such opinions are subject to change at any time based upon market or other conditions and American Century Investments disclaims any responsibility to update such opinions. These opinions may not be relied upon as investment advice and, because investment decisions made by American Century Investments funds are based on numerous factors, may not be relied upon as an indication of trading intent on behalf of any American Century Investments fund. Security examples are used for representational purposes only and are not intended as recommendations to purchase or sell securities. Performance information for comparative indices and securities is provided to American Century Investments by third party vendors. To the best of American Century Investments’ knowledge, such information is accurate at the time of printing.
|
| | | | | |
| Total Returns as of June 30, 2015 |
| | | | Average Annual Returns | |
| | Ticker Symbol | 1 year | 5 years | Since Inception | Inception Date |
| Institutional Class | ACLOX | 5.12% | 17.95% | 5.03% | 5/12/06 |
| Russell 2000 Index | — | 6.49% | 17.07% | 7.35% | — |
|
|
| Growth of $10,000 Over Life of Class |
| $10,000 investment made May 12, 2006 |
|
| |
| Value on June 30, 2015 |
| | Institutional Class — $15,665 |
| |
| | Russell 2000 Index — $19,124 |
| |
*From May 12, 2006, the Institutional Class's inception date. Not annualized.
|
| |
| Total Annual Fund Operating Expenses |
| Institutional Class | 0.67% |
The total annual fund operating expenses shown is as stated in the fund’s prospectus current as of the date of this report. The prospectus may vary from the expense ratio shown elsewhere in this report because it is based on a different time period, includes acquired fund fees and expenses, and, if applicable, does not include fee waivers or expense reimbursements.
Data presented reflect past performance. Past performance is no guarantee of future results. Current performance may be higher or lower than the performance shown. Investment return and principal value will fluctuate, and redemption value may be more or less than original cost. Data assumes reinvestment of dividends and capital gains, and none of the charts reflect the deduction of taxes that a shareholder would pay on fund distributions or the redemption of fund shares. To obtain performance data current to the most recent month end, please call 1-800-345-2021 or visit americancentury.com. For additional information about the fund, please consult the prospectus.
Portfolio Managers: Brian Garbe and Tal Sansani
Performance Summary
NT Small Company returned 5.12% for the fiscal year ended June 30, 2015, compared with the 6.49% return of its benchmark, the Russell 2000 Index.
U.S. equity markets endured substantial volatility, but ended the 12-month period with advances. NT Small Company produced gains during the fiscal year, but was unable to match the return of its benchmark, the Russell 2000 Index. NT Small Company’s stock selection process incorporates factors of valuation, quality, growth, and sentiment while striving to minimize unintended risks along industries and other risk characteristics. Security selection in health care holdings provided the majority of detraction, while energy sector positioning was beneficial.
Stock Selection Across Several Sectors Detracted
On a sector basis, health care holdings imparted the largest relative detraction, although no position in the sector was a leading individual fund underperformer. Significant individual detraction stemmed from overweight positions, relative to the benchmark, in a number of energy sector holdings, which were hurt by ongoing declines in the price of oil during the year. These included Pioneer Energy Services, a provider of drilling and production services to oil and gas exploration companies, and Warren Resources, an oil and gas exploration and production company. Both positions were ultimately liquidated.
Several private education providers in the consumer discretionary sector also weighed on the fund’s twelve-month results as lower enrollment due to stricter financial aid funding guidelines imposed on for-profit educators pressured revenues. An overweight position in online education provider K12 was a leading detractor in the space, however, the holding remains very attractive across quality, valuation, and growth metrics. Elsewhere in the sector, underperformers included Iconix Brand Group, an apparel brand licensing company, which declined amid questions surrounding the company's accounting methods and several executive-level resignations. We retain our position in the holding based on its attractive valuation profile. An overweight to Weight Watchers International, a weight management services provider, limited gains as the company’s stock tumbled after an earnings miss and downward revisions to management’s outlook driven by double-digit subscriber declines. The position was subsequently liquidated.
A number of positions in the financials sector weighed on the fund’s returns. Shares of real estate management company Altisource Portfolio Solutions declined steeply on disappointing quarterly earnings and again after a New York State investigation implicated a subsidiary. We ultimately eliminated the holding.
Individual Consumer Discretionary & Health Care Positions Contributed to Relative Gains
Although energy was the leading relative contributor on a sector basis, no single position made a significant contribution to relative results. Instead, leading outperformance on a security level came from several health care and consumer discretionary sector holdings. A portfolio-only position in Centene was beneficial as the Medicaid coverage provider’s stock rallied after management released above-expectations earnings forecasts. Elsewhere in the sector, contribution came from an overweight position in Ligand Pharmaceuticals whose share price advanced following news of favorable quarterly earnings and again when the company disclosed encouraging results from its experimental type II diabetes treatment.
Isle of Capri Casinos, a casino operator with properties outside of Las Vegas, was a leading fund contributor after surpassing earnings forecasts due to revenue gains and constrained spending, which contrasted from trends seen in Las Vegas- and Macau-based casino operators. An overweight position in Cracker Barrel Old Country Store was also helpful. The company’s shares reached an all-time high, following strong quarterly revenues and earnings, driven in part by lower gas prices that helped drive customers to its highway restaurant locations. Elsewhere, shipping company Matson bolstered the industrials sector’s returns after it appreciated steeply on unexpectedly strong quarterly results driven by container volume increases.
A Look Ahead
The U.S. economy seems poised to continue to experience hesitant economic growth through the second half of 2015. Economic activity appears to have somewhat diminished in breadth, though it remains slow yet steady. We believe that divergence in monetary policy between the U.S. and much of the rest of the world is likely to continue. Therefore, questions surrounding when and how much the U.S. Federal Reserve might act to tighten money supply, and the potential impact of such a move, are likely to continue driving investor sentiment in equity markets. Our disciplined, objective, and systematic investment strategy is designed to take advantage of opportunities at the individual company level. We believe this approach is the most powerful way to capitalize on market inefficiencies that lead to the mispricing of individual stocks. Currently, the fund’s most significant sector overweight positions are in health care and information technology while financials and utilities represent the greatest sector underweights.
|
| |
| JUNE 30, 2015 |
| Top Ten Holdings | % of net assets |
| RLJ Lodging Trust | 0.8% |
| Bank of the Ozarks, Inc. | 0.7% |
| Vail Resorts, Inc. | 0.7% |
| Fair Isaac Corp. | 0.7% |
| Prestige Brands Holdings, Inc. | 0.7% |
| Microsemi Corp. | 0.7% |
| Cracker Barrel Old Country Store, Inc. | 0.7% |
| Ligand Pharmaceuticals, Inc., Class B | 0.7% |
| Dana Holding Corp. | 0.7% |
| Mentor Graphics Corp. | 0.7% |
| | |
| Top Five Industries | % of net assets |
| Real Estate Investment Trusts (REITs) | 5.9% |
| Hotels, Restaurants and Leisure | 5.9% |
| Banks | 5.8% |
| Software | 5.7% |
| Health Care Equipment and Supplies | 5.7% |
| | |
| Types of Investments in Portfolio | % of net assets |
| Common Stocks | 99.3% |
| Temporary Cash Investments | 0.3% |
| Other Assets and Liabilities | 0.4% |
Fund shareholders may incur two types of costs: (1) transaction costs, including sales charges (loads) on purchase payments and redemption/exchange fees; and (2) ongoing costs, including management fees; distribution and service (12b-1) fees; and other fund expenses. This example is intended to help you understand your ongoing costs (in dollars) of investing in your fund and to compare these costs with the ongoing cost of investing in other mutual funds.
The example is based on an investment of $1,000 made at the beginning of the period and held for the entire period from January 1, 2015 to June 30, 2015.
Actual Expenses
The table provides information about actual account values and actual expenses for each class. You may use the information, together with the amount you invested, to estimate the expenses that you paid over the period. First, identify the share class you own. Then simply divide your account value by $1,000 (for example, an $8,600 account value divided by $1,000 = 8.6), then multiply the result by the number under the heading “Expenses Paid During Period” to estimate the expenses you paid on your account during this period.
Hypothetical Example for Comparison Purposes
The table also provides information about hypothetical account values and hypothetical expenses based on the actual expense ratio of each class of your fund and an assumed rate of return of 5% per year before expenses, which is not the actual return of a fund’s share class. The hypothetical account values and expenses may not be used to estimate the actual ending account balance or expenses you paid for the period. You may use this information to compare the ongoing costs of investing in your fund and other funds. To do so, compare this 5% hypothetical example with the 5% hypothetical examples that appear in the shareholder reports of the other funds.
Please note that the expenses shown in the table are meant to highlight your ongoing costs only and do not reflect any transactional costs, such as sales charges (loads) or redemption/exchange fees. Therefore, the table is useful in comparing ongoing costs only, and will not help you determine the relative total costs of owning different funds. In addition, if these transactional costs were included, your costs would have been higher.
|
| | | | |
| | Beginning
Account Value
1/1/15 | Ending
Account Value
6/30/15 | Expenses Paid
During Period(1)1/1/15 - 6/30/15 | Annualized Expense Ratio(1) |
| Actual | | | | |
| Institutional Class | $1,000 | $1,040.00 | $3.39 | 0.67% |
| Hypothetical | | | | |
| Institutional Class | $1,000 | $1,021.47 | $3.36 | 0.67% |
| |
| (1) | Expenses are equal to the class's annualized expense ratio listed in the table above, multiplied by the average account value over the period, multiplied by 181, the number of days in the most recent fiscal half-year, divided by 365, to reflect the one-half year period. |
JUNE 30, 2015
|
| | | | |
| | Shares | Value |
| COMMON STOCKS — 99.3% | | |
| Aerospace and Defense — 2.0% | | |
Astronics Corp.(1) | 26,433 | $ | 1,873,835 |
|
Ducommun, Inc.(1) | 33,317 | 855,247 |
|
Moog, Inc., Class A(1) | 29,850 | 2,109,798 |
|
Teledyne Technologies, Inc.(1) | 22,654 | 2,390,224 |
|
| | | 7,229,104 |
|
| Air Freight and Logistics — 0.6% | | |
Air Transport Services Group, Inc.(1) | 45,999 | 482,529 |
|
Atlas Air Worldwide Holdings, Inc.(1) | 28,676 | 1,576,033 |
|
| | | 2,058,562 |
|
| Airlines — 0.5% | | |
JetBlue Airways Corp.(1) | 86,886 | 1,803,753 |
|
| Auto Components — 2.0% | | |
American Axle & Manufacturing Holdings, Inc.(1) | 86,674 | 1,812,353 |
|
| Cooper Tire & Rubber Co. | 58,533 | 1,980,171 |
|
| Dana Holding Corp. | 117,063 | 2,409,157 |
|
Tower International, Inc.(1) | 29,139 | 759,071 |
|
| | | 6,960,752 |
|
| Banks — 5.8% | | |
| Bank of the Ozarks, Inc. | 56,907 | 2,603,495 |
|
| Banner Corp. | 15,254 | 731,124 |
|
| Berkshire Hills Bancorp, Inc. | 2,903 | 82,677 |
|
| Cardinal Financial Corp. | 66,762 | 1,454,744 |
|
Eagle Bancorp, Inc.(1) | 27,851 | 1,224,330 |
|
First BanCorp(1) | 293,773 | 1,415,986 |
|
| First Financial Bancorp | 4,772 | 85,610 |
|
| First Interstate Bancsystem, Inc. | 11,992 | 332,658 |
|
| First Merchants Corp. | 13,313 | 328,831 |
|
| First Midwest Bancorp, Inc. | 14,804 | 280,832 |
|
First NBC Bank Holding Co.(1) | 3,890 | 140,040 |
|
| Hancock Holding Co. | 19,089 | 609,130 |
|
| Heartland Financial USA, Inc. | 14,133 | 526,030 |
|
| Home Bancshares, Inc. | 54,204 | 1,981,698 |
|
| OFG Bancorp | 23,962 | 255,675 |
|
| Opus Bank | 1,486 | 53,764 |
|
| Park National Corp. | 2,912 | 254,421 |
|
| Prosperity Bancshares, Inc. | 37,955 | 2,191,522 |
|
| Renasant Corp. | 18,992 | 619,139 |
|
| South State Corp. | 15,433 | 1,172,754 |
|
| Sterling Bancorp | 41,822 | 614,783 |
|
| United Community Banks, Inc. | 11,987 | 250,169 |
|
Western Alliance Bancorp(1) | 68,626 | 2,316,814 |
|
| Wilshire Bancorp, Inc. | 70,646 | 892,259 |
|
| Wintrust Financial Corp. | 4,359 | 232,683 |
|
| | | 20,651,168 |
|
|
| | | | |
| | Shares | Value |
| Biotechnology — 5.3% | | |
Acorda Therapeutics, Inc.(1) | 62,422 | $ | 2,080,525 |
|
Array BioPharma, Inc.(1) | 47,273 | 340,838 |
|
BioSpecifics Technologies Corp.(1) | 9,742 | 502,687 |
|
Dyax Corp.(1) | 48,932 | 1,296,698 |
|
Emergent Biosolutions, Inc.(1) | 68,881 | 2,269,629 |
|
Enanta Pharmaceuticals, Inc.(1) | 10,244 | 460,878 |
|
Five Prime Therapeutics, Inc.(1) | 3,079 | 76,482 |
|
Geron Corp.(1) | 250,298 | 1,071,275 |
|
Infinity Pharmaceuticals, Inc.(1) | 44,568 | 488,020 |
|
Ligand Pharmaceuticals, Inc., Class B(1) | 24,001 | 2,421,701 |
|
MannKind Corp.(1) | 84,008 | 478,006 |
|
Merrimack Pharmaceuticals, Inc.(1) | 139,686 | 1,727,217 |
|
MiMedx Group, Inc.(1) | 179,107 | 2,075,850 |
|
NewLink Genetics Corp.(1) | 40,756 | 1,804,268 |
|
Ophthotech Corp.(1) | 15,745 | 819,685 |
|
Orexigen Therapeutics, Inc.(1) | 156,510 | 774,725 |
|
Rigel Pharmaceuticals, Inc.(1) | 17,642 | 56,631 |
|
| | | 18,745,115 |
|
| Building Products — 1.4% | | |
American Woodmark Corp.(1) | 38,056 | 2,087,372 |
|
Continental Building Products, Inc.(1) | 58,227 | 1,233,830 |
|
| Griffon Corp. | 39,514 | 629,063 |
|
Patrick Industries, Inc.(1) | 4,765 | 181,308 |
|
| Simpson Manufacturing Co., Inc. | 13,621 | 463,114 |
|
| Universal Forest Products, Inc. | 5,787 | 301,098 |
|
| | | 4,895,785 |
|
| Capital Markets — 2.8% | | |
| Calamos Asset Management, Inc., Class A | 45,110 | 552,598 |
|
| Diamond Hill Investment Group, Inc. | 4,099 | 818,406 |
|
| Evercore Partners, Inc., Class A | 41,348 | 2,231,138 |
|
INTL FCStone, Inc.(1) | 20,007 | 665,033 |
|
| Investment Technology Group, Inc. | 67,058 | 1,663,038 |
|
| Janus Capital Group, Inc. | 133,403 | 2,283,859 |
|
| Manning & Napier, Inc. | 56,192 | 560,234 |
|
| Moelis & Co., Class A | 36,649 | 1,052,193 |
|
| | | 9,826,499 |
|
| Chemicals — 0.4% | | |
| Innophos Holdings, Inc. | 2,659 | 139,970 |
|
| KMG Chemicals, Inc. | 3,920 | 99,725 |
|
| Minerals Technologies, Inc. | 9,396 | 640,149 |
|
Trinseo SA(1) | 23,439 | 629,103 |
|
| | | 1,508,947 |
|
| Commercial Services and Supplies — 2.0% | | |
ACCO Brands Corp.(1) | 239,676 | 1,862,282 |
|
ARC Document Solutions, Inc.(1) | 58,669 | 446,471 |
|
| Deluxe Corp. | 36,409 | 2,257,358 |
|
| Ennis, Inc. | 14,029 | 260,799 |
|
| Herman Miller, Inc. | 71,919 | 2,080,617 |
|
| | | 6,907,527 |
|
|
| | | | |
| | Shares | Value |
| Communications Equipment — 1.1% | | |
ARRIS Group, Inc.(1) | 37,705 | $ | 1,153,773 |
|
| Brocade Communications Systems, Inc. | 67,497 | 801,864 |
|
Polycom, Inc.(1) | 170,370 | 1,949,033 |
|
| | | 3,904,670 |
|
| Construction and Engineering — 0.8% | | |
| Argan, Inc. | 13,394 | 540,180 |
|
| EMCOR Group, Inc. | 48,019 | 2,293,868 |
|
| | | 2,834,048 |
|
| Consumer Finance — 1.0% | | |
Credit Acceptance Corp.(1) | 7,248 | 1,784,313 |
|
World Acceptance Corp.(1) | 27,460 | 1,689,064 |
|
| | | 3,473,377 |
|
| Containers and Packaging — 1.1% | | |
Berry Plastics Group, Inc.(1) | 68,646 | 2,224,130 |
|
| Graphic Packaging Holding Co. | 114,477 | 1,594,665 |
|
| | | 3,818,795 |
|
| Distributors — 0.1% | | |
VOXX International Corp.(1) | 34,842 | 288,492 |
|
| Diversified Consumer Services — 1.2% | | |
| Capella Education Co. | 15,688 | 841,975 |
|
K12, Inc.(1) | 137,449 | 1,738,730 |
|
Steiner Leisure, Ltd.(1) | 1,625 | 87,392 |
|
Strayer Education, Inc.(1) | 35,520 | 1,530,912 |
|
| | | 4,199,009 |
|
| Diversified Financial Services — 0.7% | | |
| GAIN Capital Holdings, Inc. | 137,632 | 1,315,762 |
|
| MarketAxess Holdings, Inc. | 12,015 | 1,114,632 |
|
| | | 2,430,394 |
|
| Diversified Telecommunication Services — 0.7% | | |
| IDT Corp., Class B | 58,383 | 1,055,565 |
|
| Inteliquent, Inc. | 46,257 | 851,129 |
|
Intelsat SA(1) | 73,307 | 727,205 |
|
| | | 2,633,899 |
|
| Electrical Equipment — 0.7% | | |
| AZZ, Inc. | 11,538 | 597,668 |
|
Enphase Energy, Inc.(1) | 117,332 | 892,897 |
|
| General Cable Corp. | 49,657 | 979,733 |
|
Thermon Group Holdings, Inc.(1) | 6,287 | 151,328 |
|
| | | 2,621,626 |
|
| Electronic Equipment, Instruments and Components — 2.1% | | |
| Checkpoint Systems, Inc. | 52,612 | 535,590 |
|
Coherent, Inc.(1) | 14,028 | 890,498 |
|
DTS, Inc.(1) | 4,490 | 136,900 |
|
| Methode Electronics, Inc. | 50,630 | 1,389,794 |
|
Newport Corp.(1) | 36,473 | 691,528 |
|
OSI Systems, Inc.(1) | 23,056 | 1,632,134 |
|
Rogers Corp.(1) | 4,246 | 280,830 |
|
Sanmina Corp.(1) | 97,942 | 1,974,511 |
|
| | | 7,531,785 |
|
|
| | | | |
| | Shares | Value |
| Energy Equipment and Services — 0.5% | | |
Forum Energy Technologies, Inc.(1) | 88,656 | $ | 1,797,944 |
|
Parker Drilling Co.(1) | 23,853 | 79,192 |
|
| | | 1,877,136 |
|
| Food and Staples Retailing — 0.8% | | |
| Ingles Markets, Inc., Class A | 17,049 | 814,431 |
|
| SpartanNash Co. | 8,686 | 282,642 |
|
SUPERVALU, Inc.(1) | 205,164 | 1,659,777 |
|
| | | 2,756,850 |
|
| Food Products — 2.2% | | |
| Cal-Maine Foods, Inc. | 38,777 | 2,024,159 |
|
| Dean Foods Co. | 117,256 | 1,896,030 |
|
| Pilgrim's Pride Corp. | 35,860 | 823,704 |
|
| Sanderson Farms, Inc. | 26,376 | 1,982,420 |
|
Seaboard Corp.(1) | 264 | 950,136 |
|
| | | 7,676,449 |
|
| Gas Utilities — 0.1% | | |
| Southwest Gas Corp. | 8,396 | 446,751 |
|
| Health Care Equipment and Supplies — 5.7% | | |
| Abaxis, Inc. | 8,937 | 460,077 |
|
Align Technology, Inc.(1) | 19,518 | 1,223,974 |
|
| Analogic Corp. | 18,926 | 1,493,261 |
|
Anika Therapeutics, Inc.(1) | 35,235 | 1,163,812 |
|
Cyberonics, Inc.(1) | 29,790 | 1,771,313 |
|
Exactech, Inc.(1) | 3,429 | 71,426 |
|
Globus Medical, Inc.(1) | 78,634 | 2,018,535 |
|
Greatbatch, Inc.(1) | 38,776 | 2,090,802 |
|
| Hill-Rom Holdings, Inc. | 29,925 | 1,625,825 |
|
Integra LifeSciences Holdings Corp.(1) | 10,434 | 702,939 |
|
Merit Medical Systems, Inc.(1) | 41,117 | 885,660 |
|
Natus Medical, Inc.(1) | 56,163 | 2,390,297 |
|
| STERIS Corp. | 37,134 | 2,392,915 |
|
| West Pharmaceutical Services, Inc. | 30,146 | 1,750,880 |
|
| | | 20,041,716 |
|
| Health Care Providers and Services — 1.9% | | |
Air Methods Corp.(1) | 29,681 | 1,227,013 |
|
Centene Corp.(1) | 22,066 | 1,774,106 |
|
| Landauer, Inc. | 26,743 | 953,120 |
|
Molina Healthcare, Inc.(1) | 32,601 | 2,291,850 |
|
RadNet, Inc.(1) | 46,604 | 311,781 |
|
Surgical Care Affiliates, Inc.(1) | 5,641 | 216,502 |
|
| | | 6,774,372 |
|
| Health Care Technology — 0.8% | | |
| Computer Programs & Systems, Inc. | 7,027 | 375,382 |
|
Merge Healthcare, Inc.(1) | 68,568 | 329,127 |
|
| Quality Systems, Inc. | 121,476 | 2,012,857 |
|
| | | 2,717,366 |
|
| Hotels, Restaurants and Leisure — 5.9% | | |
Boyd Gaming Corp.(1) | 120,428 | 1,800,399 |
|
| Cracker Barrel Old Country Store, Inc. | 16,497 | 2,460,693 |
|
|
| | | | |
| | Shares | Value |
Denny's Corp.(1) | 29,180 | $ | 338,780 |
|
Diamond Resorts International, Inc.(1) | 22,244 | 701,798 |
|
| DineEquity, Inc. | 8,045 | 797,179 |
|
| Interval Leisure Group, Inc. | 39,357 | 899,307 |
|
Isle of Capri Casinos, Inc.(1) | 118,143 | 2,144,295 |
|
| Jack in the Box, Inc. | 9,000 | 793,440 |
|
La Quinta Holdings, Inc.(1) | 83,769 | 1,914,122 |
|
| Marriott Vacations Worldwide Corp. | 25,164 | 2,308,797 |
|
Monarch Casino & Resort, Inc.(1) | 11,508 | 236,604 |
|
| Nathan's Famous, Inc. | 4,042 | 149,797 |
|
Penn National Gaming, Inc.(1) | 126,875 | 2,328,156 |
|
| Ruth's Hospitality Group, Inc. | 70,662 | 1,139,071 |
|
| Speedway Motorsports, Inc. | 10,301 | 233,318 |
|
| Vail Resorts, Inc. | 23,273 | 2,541,412 |
|
| | | 20,787,168 |
|
| Household Durables — 0.7% | | |
| CSS Industries, Inc. | 12,346 | 373,467 |
|
Helen of Troy Ltd.(1) | 6,777 | 660,690 |
|
Universal Electronics, Inc.(1) | 22,597 | 1,126,234 |
|
Zagg, Inc.(1) | 18,696 | 148,072 |
|
| | | 2,308,463 |
|
| Household Products — 0.1% | | |
Central Garden and Pet Co.(1) | 16,044 | 183,062 |
|
| Independent Power and Renewable Electricity Producers — 0.6% | |
| Ormat Technologies, Inc. | 53,630 | 2,020,778 |
|
| Insurance — 3.3% | | |
| AMERISAFE, Inc. | 36,338 | 1,710,066 |
|
| Amtrust Financial Services, Inc. | 20,455 | 1,340,007 |
|
| Employers Holdings, Inc. | 14,513 | 330,606 |
|
| Federated National Holding Co. | 62,137 | 1,503,715 |
|
| HCI Group, Inc. | 4,369 | 193,153 |
|
| Maiden Holdings Ltd. | 114,979 | 1,814,369 |
|
| Selective Insurance Group, Inc. | 76,093 | 2,134,409 |
|
| United Fire Group, Inc. | 5,514 | 180,639 |
|
| United Insurance Holdings Corp. | 38,964 | 605,501 |
|
| Universal Insurance Holdings, Inc. | 78,895 | 1,909,259 |
|
| | | 11,721,724 |
|
| Internet and Catalog Retail — 0.6% | | |
1-800-Flowers.com, Inc., Class A(1) | 72,908 | 762,618 |
|
| Nutrisystem, Inc. | 15,993 | 397,906 |
|
| PetMed Express, Inc. | 48,279 | 833,778 |
|
| | | 1,994,302 |
|
| Internet Software and Services — 3.6% | | |
Carbonite, Inc.(1) | 10,149 | 119,860 |
|
Cimpress NV(1) | 28,479 | 2,396,793 |
|
Constant Contact, Inc.(1) | 52,766 | 1,517,550 |
|
DHI Group, Inc.(1) | 63,325 | 562,959 |
|
| EarthLink Holdings Corp. | 52,685 | 394,611 |
|
Endurance International Group Holdings, Inc.(1) | 94,644 | 1,955,345 |
|
Everyday Health, Inc.(1) | 15,896 | 203,151 |
|
|
| | | | |
| | Shares | Value |
LogMeIn, Inc.(1) | 32,324 | $ | 2,084,575 |
|
| Marchex, Inc., Class B | 12,916 | 63,934 |
|
Monster Worldwide, Inc.(1) | 11,965 | 78,251 |
|
| NIC, Inc. | 8,446 | 154,393 |
|
United Online, Inc.(1) | 11,077 | 173,576 |
|
Web.com Group, Inc.(1) | 94,804 | 2,296,153 |
|
XO Group, Inc.(1) | 53,664 | 877,406 |
|
| | | 12,878,557 |
|
| IT Services — 1.0% | | |
| CSG Systems International, Inc. | 47,823 | 1,514,076 |
|
| Science Applications International Corp. | 40,687 | 2,150,308 |
|
| | | 3,664,384 |
|
| Life Sciences Tools and Services — 1.7% | | |
Affymetrix, Inc.(1) | 66,630 | 727,600 |
|
Cambrex Corp.(1) | 49,780 | 2,187,333 |
|
Luminex Corp.(1) | 48,891 | 843,859 |
|
PAREXEL International Corp.(1) | 37,279 | 2,397,412 |
|
| | | 6,156,204 |
|
| Machinery — 2.7% | | |
Blount International, Inc.(1) | 144,996 | 1,583,356 |
|
| Douglas Dynamics, Inc. | 29,923 | 642,746 |
|
| Federal Signal Corp. | 11,562 | 172,390 |
|
| Kadant, Inc. | 5,089 | 240,201 |
|
Lydall, Inc.(1) | 37,842 | 1,118,610 |
|
Meritor, Inc.(1) | 159,342 | 2,090,567 |
|
| Mueller Water Products, Inc., Class A | 210,253 | 1,913,302 |
|
Wabash National Corp.(1) | 148,176 | 1,858,127 |
|
| | | 9,619,299 |
|
| Marine — 0.6% | | |
| Matson, Inc. | 53,891 | 2,265,578 |
|
| Media — 0.3% | | |
Entercom Communications Corp., Class A(1) | 38,023 | 434,223 |
|
| Nexstar Broadcasting Group, Inc., Class A | 11,236 | 629,216 |
|
| | | 1,063,439 |
|
| Metals and Mining — 1.1% | | |
Century Aluminum Co.(1) | 148,204 | 1,545,768 |
|
| Gold Resource Corp. | 151,801 | 418,971 |
|
| Materion Corp. | 51,942 | 1,830,955 |
|
| | | 3,795,694 |
|
| Multiline Retail — 0.6% | | |
Burlington Stores, Inc.(1) | 24,374 | 1,247,949 |
|
| Dillard's, Inc., Class A | 6,665 | 701,091 |
|
| | | 1,949,040 |
|
| Oil, Gas and Consumable Fuels — 1.8% | | |
| Alon USA Energy, Inc. | 103,914 | 1,963,975 |
|
Pacific Ethanol, Inc.(1) | 144,877 | 1,495,131 |
|
Par Petroleum Corp.(1) | 7,889 | 147,682 |
|
REX American Resources Corp.(1) | 31,293 | 1,991,486 |
|
| Western Refining, Inc. | 13,415 | 585,162 |
|
| | | 6,183,436 |
|
|
| | | | |
| | Shares | Value |
| Paper and Forest Products — 0.9% | | |
Clearwater Paper Corp.(1) | 26,232 | $ | 1,503,093 |
|
| Neenah Paper, Inc. | 27,009 | 1,592,451 |
|
| | | 3,095,544 |
|
| Pharmaceuticals — 3.5% | | |
Lannett Co., Inc.(1) | 37,631 | 2,236,787 |
|
Nektar Therapeutics(1) | 100,685 | 1,259,569 |
|
Pacira Pharmaceuticals, Inc.(1) | 27,923 | 1,974,715 |
|
Pozen, Inc.(1) | 73,868 | 761,579 |
|
Prestige Brands Holdings, Inc.(1) | 53,914 | 2,492,983 |
|
Sagent Pharmaceuticals, Inc.(1) | 74,281 | 1,805,771 |
|
Sucampo Pharmaceuticals, Inc., Class A(1) | 114,748 | 1,885,310 |
|
Supernus Pharmaceuticals, Inc.(1) | 5,489 | 93,203 |
|
| | | 12,509,917 |
|
| Professional Services — 1.4% | | |
CRA International, Inc.(1) | 21,026 | 585,995 |
|
| Korn / Ferry International | 42,153 | 1,465,660 |
|
RPX Corp.(1) | 132,034 | 2,231,375 |
|
TrueBlue, Inc.(1) | 11,559 | 345,614 |
|
| VSE Corp. | 3,834 | 205,157 |
|
| | | 4,833,801 |
|
| Real Estate Investment Trusts (REITs) — 5.9% | | |
| Alexander's, Inc. | 159 | 65,190 |
|
| Armada Hoffler Properties, Inc. | 6,714 | 67,073 |
|
| Ashford Hospitality Prime, Inc. | 12,856 | 193,097 |
|
| Ashford Hospitality Trust, Inc. | 33,113 | 280,136 |
|
| Cedar Realty Trust, Inc. | 9,430 | 60,352 |
|
| Coresite Realty Corp. | 9,240 | 419,866 |
|
| DiamondRock Hospitality Co. | 176,659 | 2,263,002 |
|
| Geo Group, Inc. (The) | 13,926 | 475,712 |
|
| Hatteras Financial Corp. | 15,168 | 247,238 |
|
| LaSalle Hotel Properties | 57,213 | 2,028,773 |
|
| LTC Properties, Inc. | 40,900 | 1,701,440 |
|
| Medical Properties Trust, Inc. | 165,895 | 2,174,884 |
|
| New Residential Investment Corp. | 16,067 | 244,861 |
|
| PS Business Parks, Inc. | 25,209 | 1,818,829 |
|
| RLJ Lodging Trust | 90,743 | 2,702,327 |
|
| Rouse Properties, Inc. | 5,459 | 89,255 |
|
| Ryman Hospitality Properties, Inc. | 41,603 | 2,209,535 |
|
| Summit Hotel Properties, Inc. | 112,539 | 1,464,132 |
|
| Sunstone Hotel Investors, Inc. | 150,926 | 2,265,399 |
|
| Universal Health Realty Income Trust | 2,867 | 133,201 |
|
| | | 20,904,302 |
|
| Real Estate Management and Development — 1.0% | | |
Marcus & Millichap, Inc.(1) | 39,733 | 1,833,280 |
|
| RE/MAX Holdings, Inc., Class A | 44,374 | 1,575,721 |
|
| | | 3,409,001 |
|
| Road and Rail — 1.1% | | |
| ArcBest Corp. | 57,720 | 1,835,496 |
|
PAM Transportation Services, Inc.(1) | 1,473 | 85,508 |
|
|
| | | | |
| | Shares | Value |
Swift Transportation Co.(1) | 91,888 | $ | 2,083,101 |
|
USA Truck, Inc.(1) | 504 | 10,700 |
|
| | | 4,014,805 |
|
| Semiconductors and Semiconductor Equipment — 5.4% | | |
Advanced Energy Industries, Inc.(1) | 61,462 | 1,689,590 |
|
Amkor Technology, Inc.(1) | 48,809 | 291,878 |
|
Cabot Microelectronics Corp.(1) | 23,293 | 1,097,333 |
|
Cirrus Logic, Inc.(1) | 62,406 | 2,123,676 |
|
Diodes, Inc.(1) | 68,782 | 1,658,334 |
|
Fairchild Semiconductor International, Inc.(1) | 122,061 | 2,121,420 |
|
MaxLinear, Inc., Class A(1) | 77,217 | 934,326 |
|
Microsemi Corp.(1) | 71,155 | 2,486,867 |
|
| MKS Instruments, Inc. | 30,907 | 1,172,612 |
|
OmniVision Technologies, Inc.(1) | 55,988 | 1,466,606 |
|
| Pericom Semiconductor Corp. | 10,423 | 137,062 |
|
Rambus, Inc.(1) | 72,797 | 1,054,829 |
|
Semtech Corp.(1) | 82,968 | 1,646,915 |
|
| Tessera Technologies, Inc. | 21,718 | 824,850 |
|
Ultra Clean Holdings, Inc.(1) | 22,880 | 142,542 |
|
Xcerra Corp.(1) | 16,736 | 126,691 |
|
| | | 18,975,531 |
|
| Software — 5.7% | | |
ACI Worldwide, Inc.(1) | 96,257 | 2,365,034 |
|
Aspen Technology, Inc.(1) | 10,115 | 460,738 |
|
BroadSoft, Inc.(1) | 2,024 | 69,970 |
|
Cadence Design Systems, Inc.(1) | 25,961 | 510,393 |
|
| Fair Isaac Corp. | 27,572 | 2,502,986 |
|
Glu Mobile, Inc.(1) | 272,197 | 1,690,343 |
|
| Mentor Graphics Corp. | 91,085 | 2,407,377 |
|
MicroStrategy, Inc., Class A(1) | 11,753 | 1,998,950 |
|
NetScout Systems, Inc.(1) | 50,179 | 1,840,064 |
|
| Pegasystems, Inc. | 76,873 | 1,759,623 |
|
Progress Software Corp.(1) | 2,645 | 72,738 |
|
PTC, Inc.(1) | 33,432 | 1,371,381 |
|
| QAD, Inc., Class A | 3,668 | 96,945 |
|
TiVo, Inc.(1) | 6,602 | 66,944 |
|
VASCO Data Security International, Inc.(1) | 60,810 | 1,835,854 |
|
Verint Systems, Inc.(1) | 16,550 | 1,005,330 |
|
| | | 20,054,670 |
|
| Specialty Retail — 2.8% | | |
| Buckle, Inc. (The) | 14,094 | 645,082 |
|
Build-A-Bear Workshop, Inc.(1) | 107,479 | 1,718,589 |
|
| Caleres, Inc. | 47,531 | 1,510,535 |
|
| Cato Corp. (The), Class A | 50,446 | 1,955,287 |
|
| Chico's FAS, Inc. | 74,315 | 1,235,858 |
|
| Children's Place, Inc. (The) | 875 | 57,234 |
|
Citi Trends, Inc.(1) | 19,600 | 474,320 |
|
| Kirkland's, Inc. | 8,133 | 226,667 |
|
| Outerwall, Inc. | 27,382 | 2,084,044 |
|
Tilly's, Inc., Class A(1) | 13,574 | 131,261 |
|
| | | 10,038,877 |
|
|
| | | | |
| | Shares | Value |
| Technology Hardware, Storage and Peripherals — 0.6% | | |
Dot Hill Systems Corp.(1) | 32,283 | $ | 197,572 |
|
QLogic Corp.(1) | 135,036 | 1,916,161 |
|
| | | 2,113,733 |
|
| Textiles, Apparel and Luxury Goods — 0.8% | | |
| Culp, Inc. | 14,985 | 464,535 |
|
Iconix Brand Group, Inc.(1) | 2,192 | 54,734 |
|
Perry Ellis International, Inc.(1) | 2,497 | 59,354 |
|
Vince Holding Corp.(1) | 44,424 | 532,200 |
|
| Wolverine World Wide, Inc. | 58,755 | 1,673,342 |
|
| | | 2,784,165 |
|
| Thrifts and Mortgage Finance — 0.9% | | |
Essent Group Ltd.(1) | 81,473 | 2,228,287 |
|
| EverBank Financial Corp. | 56,091 | 1,102,188 |
|
| | | 3,330,475 |
|
| Water Utilities — 0.2% | | |
| American States Water Co. | 19,076 | 713,251 |
|
| California Water Service Group | 2,968 | 67,819 |
|
| | | 781,070 |
|
| Wireless Telecommunication Services — 0.2% | | |
| Spok Holdings, Inc. | 34,950 | 588,558 |
|
TOTAL COMMON STOCKS (Cost $309,551,055) | | 350,639,524 |
|
| TEMPORARY CASH INVESTMENTS — 0.3% | | |
Repurchase Agreement, Bank of America Merrill Lynch, (collateralized by various U.S. Treasury obligations, 1.50%, 1/31/19 - 11/30/19, valued at $200,604), in a joint trading account at 0.10%, dated 6/30/15, due 7/1/15 (Delivery value $196,601) | | 196,600 |
|
| Repurchase Agreement, Fixed Income Clearing Corp., (collateralized by various U.S. Treasury obligations, 2.375%, 8/15/24, valued at $805,129), at 0.01%, dated 6/30/15, due 7/1/15 (Delivery value $787,000) | | 787,000 |
|
| State Street Institutional Liquid Reserves Fund, Premier Class | 195,028 | 195,028 |
|
TOTAL TEMPORARY CASH INVESTMENTS (Cost $1,178,628) | | 1,178,628 |
|
TOTAL INVESTMENT SECURITIES — 99.6% (Cost $310,729,683) | | 351,818,152 |
|
| OTHER ASSETS AND LIABILITIES — 0.4% | | 1,355,924 |
|
| TOTAL NET ASSETS — 100.0% | | $ | 353,174,076 |
|
|
|
| NOTES TO SCHEDULE OF INVESTMENTS |
See Notes to Financial Statements.
|
|
| Statement of Assets and Liabilities |
|
| | | |
| JUNE 30, 2015 | |
| Assets | |
| Investment securities, at value (cost of $310,729,683) | $ | 351,818,152 |
|
| Receivable for investments sold | 10,339,259 |
|
| Receivable for capital shares sold | 368,439 |
|
| Dividends and interest receivable | 332,784 |
|
| | 362,858,634 |
|
| | |
| Liabilities | |
| Payable for investments purchased | 9,489,193 |
|
| Accrued management fees | 195,365 |
|
| | 9,684,558 |
|
| | |
| Net Assets | $ | 353,174,076 |
|
| | |
| Institutional Class Capital Shares, $0.01 Par Value | |
| Shares authorized | 250,000,000 |
|
| Shares outstanding | 34,861,220 |
|
| | |
| Net Asset Value Per Share | $ | 10.13 |
|
| | |
| Net Assets Consist of: | |
| Capital (par value and paid-in surplus) | $ | 286,532,842 |
|
| Undistributed net investment income | 1,052,907 |
|
| Undistributed net realized gain | 24,499,858 |
|
| Net unrealized appreciation | 41,088,469 |
|
| | $ | 353,174,076 |
|
See Notes to Financial Statements.
|
| | | |
| YEAR ENDED JUNE 30, 2015 | |
| Investment Income (Loss) | |
| Income: | |
| Dividends (net of foreign taxes withheld of $5,264) | $ | 4,107,499 |
|
| Interest | 1,398 |
|
| | 4,108,897 |
|
| | |
| Expenses: | |
| Management fees | 2,473,492 |
|
| Directors' fees and expenses | 18,862 |
|
| Other expenses | 99 |
|
| | 2,492,453 |
|
| | |
| Net investment income (loss) | 1,616,444 |
|
| | |
| Realized and Unrealized Gain (Loss) | |
| Net realized gain (loss) on: | |
| Investment transactions | 43,366,953 |
|
| Futures contract transactions | 1,485,712 |
|
| | 44,852,665 |
|
| | |
| Change in net unrealized appreciation (depreciation) on investments | (23,576,735 | ) |
| | |
| Net realized and unrealized gain (loss) | 21,275,930 |
|
| | |
| Net Increase (Decrease) in Net Assets Resulting from Operations | $ | 22,892,374 |
|
See Notes to Financial Statements.
|
|
| Statement of Changes in Net Assets |
|
| | | | | | |
| YEARS ENDED JUNE 30, 2015 AND JUNE 30, 2014 |
| Increase (Decrease) in Net Assets | June 30, 2015 | June 30, 2014 |
| Operations | | |
| Net investment income (loss) | $ | 1,616,444 |
| $ | 1,184,730 |
|
| Net realized gain (loss) | 44,852,665 |
| 47,598,869 |
|
| Change in net unrealized appreciation (depreciation) | (23,576,735 | ) | 24,119,734 |
|
| Net increase (decrease) in net assets resulting from operations | 22,892,374 |
| 72,903,333 |
|
| | | |
| Distributions to Shareholders | | |
| From net investment income | (1,036,862 | ) | (1,227,746 | ) |
| From net realized gains | (45,882,682 | ) | (36,394,986 | ) |
| Decrease in net assets from distributions | (46,919,544 | ) | (37,622,732 | ) |
| | | |
| Capital Share Transactions | | |
| Proceeds from shares sold | 71,435,059 |
| 70,430,340 |
|
| Proceeds from reinvestment of distributions | 46,919,544 |
| 37,622,732 |
|
| Payments for shares redeemed | (112,283,342 | ) | (28,068,774 | ) |
| Net increase (decrease) in net assets from capital share transactions | 6,071,261 |
| 79,984,298 |
|
| | | |
| Net increase (decrease) in net assets | (17,955,909 | ) | 115,264,899 |
|
| | | |
| Net Assets | | |
| Beginning of period | 371,129,985 |
| 255,865,086 |
|
| End of period | $ | 353,174,076 |
| $ | 371,129,985 |
|
| | | |
| Undistributed net investment income | $ | 1,052,907 |
| $ | 285,892 |
|
| | | |
| Transactions in Shares of the Fund | | |
| Sold | 6,976,850 |
| 6,688,254 |
|
| Issued in reinvestment of distributions | 5,013,513 |
| 3,712,263 |
|
| Redeemed | (10,862,964 | ) | (2,550,471 | ) |
| Net increase (decrease) in shares of the fund | 1,127,399 |
| 7,850,046 |
|
See Notes to Financial Statements.
|
|
| Notes to Financial Statements |
JUNE 30, 2015
1. Organization
American Century Quantitative Equity Funds, Inc. (the corporation) is registered under the Investment Company Act of 1940, as amended (the 1940 Act), as an open-end management investment company and is organized as a Maryland corporation. NT Small Company Fund (the fund) is one fund in a series issued by the corporation. The fund is diversified as defined under the 1940 Act. The fund’s investment objective is to seek long-term capital growth. The fund is not permitted to invest in securities issued by companies assigned the Global Industry Classification Standard for the tobacco industry.
2. Significant Accounting Policies
The following is a summary of significant accounting policies consistently followed by the fund in preparation of its financial statements. The fund is an investment company and follows accounting and reporting guidance in accordance with accounting principles generally accepted in the United States of America. This may require management to make certain estimates and assumptions at the date of the financial statements. Actual results could differ from these estimates. Management evaluated the impact of events or transactions occurring through the date the financial statements were issued that would merit recognition or disclosure.
Investment Valuations — The fund determines the fair value of its investments and computes its net asset value per share at the close of regular trading (usually 4 p.m. Eastern time) on the New York Stock Exchange (NYSE) on each day the NYSE is open. The Board of Directors has adopted valuation policies and procedures to guide the investment advisor in the fund’s investment valuation process and to provide methodologies for the oversight of the fund’s pricing function.
Equity securities that are listed or traded on a domestic securities exchange are valued at the last reported sales price or at the official closing price as provided by the exchange. Equity securities traded on foreign securities exchanges are generally valued at the closing price of such securities on the exchange where primarily traded or at the close of the NYSE, if that is earlier. If no last sales price is reported, or if local convention or regulation so provides, the mean of the latest bid and asked prices may be used. Securities traded over-the-counter are valued at the mean of the latest bid and asked prices, the last sales price, or the official closing price.
Fixed income securities maturing within 60 days at the time of purchase may be valued at cost, plus or minus any amortized discount or premium or at the evaluated mean as provided by an independent pricing service. Evaluated mean prices are commonly derived through utilization of market models, which may consider, among other factors: trade data, quotations from dealers and active market makers, relevant yield curve and spread data, related sector levels, creditworthiness, trade data or market information on comparable securities, and other relevant security specific information.
Open-end management investment companies are valued at the reported net asset value per share. Repurchase agreements are valued at cost, which approximates fair value. Exchange-traded futures contracts are valued at the settlement price as provided by the appropriate clearing corporation.
If the fund determines that the market price for an investment is not readily available or the valuation methods mentioned above do not reflect an investment’s fair value, such investment is valued as determined in good faith by the Board of Directors or its delegate, in accordance with policies and procedures adopted by the Board of Directors. In its determination of fair value, the fund may review several factors including, but not limited to, market information regarding the specific investment or comparable investments and correlation with other investment types, futures indices or general market indicators. Circumstances that may cause the fund to use these procedures to value an investment include, but are not limited to: an investment has been declared in default or is distressed; trading in a security has been suspended during the trading day or a security is not actively trading on its principal exchange; prices received from a regular pricing source are deemed unreliable; or there is a foreign market holiday and no trading occurred.
The fund monitors for significant events occurring after the close of an investment’s primary exchange but before the fund’s net asset value per share is determined. Significant events may include, but are not limited to: corporate announcements and transactions; governmental action and political unrest that could impact a specific investment or an investment sector; or armed conflicts, natural disasters and similar events that could affect investments in a specific country or region. The fund also monitors for significant fluctuations between domestic and foreign markets, as evidenced by the U.S. market or such other indicators that the Board of Directors, or its delegate, deems appropriate. If significant fluctuations in foreign markets are identified, the fund may apply a model-derived factor to the closing price of equity securities traded on foreign securities exchanges. The factor is based on observable market data as provided by an independent pricing service.
Security Transactions — Security transactions are accounted for as of the trade date. Net realized gains and losses are determined on the identified cost basis, which is also used for federal income tax purposes.
Investment Income — Dividend income less foreign taxes withheld, if any, is recorded as of the ex-dividend date. Distributions received on securities that represent a return of capital or long-term capital gain are recorded as a reduction of cost of investments and/or as a realized gain. The fund may estimate the components of distributions received that may be considered nontaxable distributions or long-term capital gain distributions for income tax purposes. Interest income is recorded on the accrual basis and includes accretion of discounts and amortization of premiums.
Repurchase Agreements — The fund may enter into repurchase agreements with institutions that American Century Investment Management, Inc. (ACIM) (the investment advisor) has determined are creditworthy pursuant to criteria adopted by the Board of Directors. The fund requires that the collateral, represented by securities, received in a repurchase transaction be transferred to the custodian in a manner sufficient to enable the fund to obtain those securities in the event of a default under the repurchase agreement. ACIM monitors, on a daily basis, the securities transferred to ensure the value, including accrued interest, of the securities under each repurchase agreement is equal to or greater than amounts owed to the fund under each repurchase agreement.
Joint Trading Account — Pursuant to an Exemptive Order issued by the Securities and Exchange Commission, the fund, along with certain other funds in the American Century Investments family of funds, may transfer uninvested cash balances into a joint trading account. These balances are invested in one or more repurchase agreements that are collateralized by U.S. Treasury or Agency obligations.
Segregated Assets — In accordance with the 1940 Act, the fund segregates assets on its books and records to cover futures contracts. ACIM monitors, on a daily basis, the securities segregated to ensure the fund designates a sufficient amount of liquid assets, marked-to-market daily. The fund may also receive assets or be required to pledge assets at the custodian bank or with a broker for margin requirements on futures contracts.
Income Tax Status — It is the fund’s policy to distribute substantially all net investment income and net realized gains to shareholders and to otherwise qualify as a regulated investment company under provisions of the Internal Revenue Code. Accordingly, no provision has been made for income taxes. The fund files U.S. federal, state, local and non-U.S. tax returns as applicable. The fund's tax returns are subject to examination by the relevant taxing authority until expiration of the applicable statute of limitations, which is generally three years from the date of filing but can be longer in certain jurisdictions. At this time, management believes there are no uncertain tax positions which, based on their technical merit, would not be sustained upon examination and for which it is reasonably possible that the total amounts of unrecognized tax benefits will significantly change in the next twelve months.
Distributions to Shareholders — Distributions from net investment income, if any, are generally declared and paid quarterly. Distributions from net realized gains, if any, are generally declared and paid annually. The fund may elect to treat a portion of its payment to a redeeming shareholder, which represents the pro rata share of undistributed net investment income and net realized gains, as a distribution for federal income tax purposes (tax equalization).
Indemnifications — Under the corporation’s organizational documents, its officers and directors are indemnified against certain liabilities arising out of the performance of their duties to the fund. In addition, in the normal course of business, the fund enters into contracts that provide general indemnifications. The maximum exposure under these arrangements is unknown as this would involve future claims that may be made against a fund. The risk of material loss from such claims is considered by management to be remote.
3. Fees and Transactions with Related Parties
Certain officers and directors of the corporation are also officers and/or directors of American Century Companies, Inc. (ACC). The corporation’s investment advisor, ACIM, the corporation's distributor, American Century Investment Services, Inc., and the corporation’s transfer agent, American Century Services, LLC, are wholly owned, directly or indirectly, by ACC. Various funds issued by American Century Asset Allocation Portfolios, Inc. own, in aggregate, 100% of the shares of the fund. Related parties do not invest in the fund for the purpose of exercising management or control.
Management Fees — The corporation has entered into a management agreement with ACIM, under which ACIM provides the fund with investment advisory and management services in exchange for a single, unified management fee (the fee). The agreement provides that all expenses of managing and operating the fund, except distribution and service fees, brokerage expenses, taxes, interest, fees and expenses of the independent directors (including legal counsel fees), and extraordinary expenses, will be paid by ACIM. The fee is computed and accrued daily based on the daily net assets of the fund and paid monthly in arrears. The fee consists of (1) an Investment Category Fee based on the daily net assets of the fund and certain other accounts managed by the investment advisor that are in the same broad investment category as the fund and (2) a Complex Fee based on the assets of all the funds in the American Century Investments family of funds. The rates for the Investment Category Fee range from 0.5380% to 0.7200%. The rates for the Complex Fee range from 0.0500% to 0.1100%. The effective annual management fee for the year ended June 30, 2015 was 0.66%.
Directors' Fees and Expenses — The Board of Directors is responsible for overseeing the investment advisor’s management and operations of the fund. The directors receive detailed information about the fund and its investment advisor regularly throughout the year, and meet at least quarterly with management of the investment advisor to review reports about fund operations. The fund’s officers do not receive compensation from the fund.
4. Investment Transactions
Purchases and sales of investment securities, excluding short-term investments, for the year ended June 30, 2015 were $436,607,962 and $476,222,587, respectively.
5. Fair Value Measurements
The fund’s investments valuation process is based on several considerations and may use multiple inputs to determine the fair value of the investments held by the fund. In conformity with accounting principles generally accepted in the United States of America, the inputs used to determine a valuation are classified into three broad levels.
| |
| • | Level 1 valuation inputs consist of unadjusted quoted prices in an active market for identical investments. |
| |
| • | Level 2 valuation inputs consist of direct or indirect observable market data (including quoted prices for comparable investments, evaluations of subsequent market events, interest rates, prepayment speeds, credit risk, etc.). These inputs also consist of quoted prices for identical investments initially expressed in local currencies that are adjusted through translation into U.S. dollars. |
| |
| • | Level 3 valuation inputs consist of unobservable data (including a fund’s own assumptions). |
The level classification is based on the lowest level input that is significant to the fair valuation measurement. The valuation inputs are not necessarily an indication of the risks associated with investing in these securities or other financial instruments. There were no significant transfers between levels during the period.
The following is a summary of the level classifications as of period end. The Schedule of Investments provides additional information on the fund’s portfolio holdings.
|
| | | | | | | | |
| | Level 1 | Level 2 | Level 3 |
| Assets | | | |
| Investment Securities | | | |
| Common Stocks | $ | 350,639,524 |
| — |
| — |
|
| Temporary Cash Investments | 195,028 |
| $ | 983,600 |
| — |
|
| | $ | 350,834,552 |
| $ | 983,600 |
| — |
|
6. Derivative Instruments
Equity Price Risk — The fund is subject to equity price risk in the normal course of pursuing its investment objectives. A fund may enter into futures contracts based on an equity index in order to manage its exposure to changes in market conditions. A fund may purchase futures contracts to gain exposure to increases in market value or sell futures contracts to protect against a decline in market value. Upon entering into a futures contract, a fund is required to deposit either cash or securities in an amount equal to a certain percentage of the contract value (initial margin). Subsequent payments (variation margin) are made or received daily, in cash, by a fund. The variation margin is equal to the daily change in the contract value and is recorded as unrealized gains and losses. A fund recognizes a realized gain or loss when the contract is closed or expires. Net realized and unrealized gains or losses occurring during the holding period of futures contracts are a component of net realized gain (loss) on futures contract transactions and change in net unrealized appreciation (depreciation) on futures contracts, respectively. One of the risks of entering into futures contracts is the possibility that the change in value of the contract may not correlate with the changes in value of the underlying securities. During the period, the fund infrequently purchased equity price risk derivative instruments for temporary investment purposes.
At period end, the fund did not have any derivative instruments disclosed on the Statement of Assets and Liabilities. For the year ended June 30, 2015, the effect of equity price risk derivative instruments on the Statement of Operations was $1,485,712 in net realized gain (loss) on futures contract transactions.
7. Risk Factors
The fund’s investment process may result in high portfolio turnover, which could mean high transaction costs, affecting both performance and capital gains tax liabilities to investors.
The fund invests in common stocks of small companies. Because of this, the fund may be subject to greater risk and market fluctuations than a fund investing in larger, more established companies.
8. Federal Tax Information
The tax character of distributions paid during the years ended June 30, 2015 and June 30, 2014 were as follows:
|
| | | | | | |
| | 2015 | 2014 |
| Distributions Paid From | | |
| Ordinary income | $ | 11,136,377 |
| $ | 15,807,585 |
|
| Long-term capital gains | $ | 35,783,167 |
| $ | 21,815,147 |
|
The book-basis character of distributions made during the year from net investment income or net realized gains may differ from their ultimate characterization for federal income tax purposes. These differences reflect the differing character of certain income items and net realized gains and losses for financial statement and tax purposes, and may result in reclassification among certain capital accounts on the financial statements.
The reclassifications, which are primarily due to tax equalization, were made to capital $3,698,398, undistributed net investment income $187,433, and undistributed net realized gain $(3,885,831).
As of June 30, 2015, the federal tax cost of investments and the components of distributable earnings on a tax-basis were as follows:
|
| | | |
| Federal tax cost of investments | $ | 312,360,620 |
|
| Gross tax appreciation of investments | $ | 52,115,749 |
|
| Gross tax depreciation of investments | (12,658,217 | ) |
| Net tax appreciation (depreciation) of investments | $ | 39,457,532 |
|
| Undistributed ordinary income | $ | 3,637,895 |
|
| Accumulated long-term gains | $ | 23,545,807 |
|
The difference between book-basis and tax-basis unrealized appreciation (depreciation) is attributable primarily to the tax deferral of losses on wash sales.
|
| | | | | | | | | | | | | | | |
| For a Share Outstanding Throughout the Years Ended June 30 (except as noted) | | | |
| Per-Share Data | | | | | | | Ratios and Supplemental Data | |
| | | Income From Investment Operations: | Distributions From: | | | Ratio to Average Net Assets of: | | |
| | Net Asset Value, Beginning of Period | Net Investment Income (Loss)(1) | Net Realized and Unrealized Gain (Loss) | Total From Investment Operations | Net Investment Income | Net Realized Gains | Total Distributions | Net Asset Value, End of Period | Total Return(2) | Operating Expenses | Net Investment Income (Loss) | Portfolio Turnover Rate | Net Assets, End of Period (in thousands) |
| Institutional Class | | | | | | | | | | |
| 2015 | $11.00 | 0.04 | 0.41 | 0.45 | (0.03) | (1.29) | (1.32) | $10.13 | 5.12% | 0.67% | 0.43% | 119% |
| $353,174 |
|
| 2014 | $9.89 | 0.04 | 2.48 | 2.52 | (0.04) | (1.37) | (1.41) | $11.00 | 26.77% | 0.67% | 0.38% | 96% |
| $371,130 |
|
| 2013 | $8.27 | 0.10 | 2.03 | 2.13 | (0.10) | (0.41) | (0.51) | $9.89 | 26.98% | 0.68% | 1.12% | 106% |
| $255,865 |
|
| 2012 | $9.17 | 0.06 | (0.23) | (0.17) | (0.03) | (0.70) | (0.73) | $8.27 | (0.98)% | 0.68% | 0.67% | 86% |
| $177,436 |
|
| 2011 | $6.76 | 0.03 | 2.42 | 2.45 | (0.04) | — | (0.04) | $9.17 | 36.29% | 0.69% | 0.38% | 93% |
| $131,572 |
|
|
|
| Notes to Financial Highlights |
| |
| (1) | Computed using average shares outstanding throughout the period. |
| |
| (2) | Total returns are calculated based on the net asset value of the last business day. Total returns for periods less than one year are not annualized. |
See Notes to Financial Statements.
|
|
| Report of Independent Registered Public Accounting Firm |
To the Directors of the American Century Quantitative Equity Funds, Inc. and Shareholders of the NT Small Company Fund:
In our opinion, the accompanying statement of assets and liabilities, including the schedule of investments, and the related statements of operations and of changes in net assets and the financial highlights present fairly, in all material respects, the financial position of the NT Small Company Fund (one of the sixteen funds comprising the American Century Quantitative Equity Funds, Inc., hereafter referred to as the “Fund”) at June 30, 2015, the results of its operations for the year then ended, the changes in its net assets for each of the two years in the period then ended and the financial highlights for each of the five years in the period then ended, in conformity with accounting principles generally accepted in the United States of America. These financial statements and financial highlights (hereafter referred to as "financial statements") are the responsibility of the Fund's management. Our responsibility is to express an opinion on these financial statements based on our audits. We conducted our audits of these financial statements in accordance with the standards of the Public Company Accounting Oversight Board (United States). Those standards require that we plan and perform the audit to obtain reasonable assurance about whether the financial statements are free of material misstatement. An audit includes examining, on a test basis, evidence supporting the amounts and disclosures in the financial statements, assessing the accounting principles used and significant estimates made by management, and evaluating the overall financial statement presentation. We believe that our audits, which included confirmation of securities at June 30, 2015 by correspondence with the custodian and brokers, provide a reasonable basis for our opinion.
PricewaterhouseCoopers LLP
Kansas City, Missouri
August 21, 2015
Board of Directors
The individuals listed below serve as directors of the funds. Each director will continue to serve in this capacity until death, retirement, resignation or removal from office. The board has adopted a mandatory retirement age for directors who are not “interested persons,” as that term is defined in the Investment Company Act (independent directors). Independent directors shall retire on December 31 of the year in which they reach their 75th birthday; provided, however, that on or after January 1, 2022, independent directors shall retire on December 31 of the year in which they reach their 76th birthday.
Mr. Thomas is an “interested person” because he currently serves as President and Chief Executive Officer of American Century Companies, Inc. (ACC), the parent company of American Century Investment Management, Inc. (ACIM or the advisor). The other directors (more than three-fourths of the total number) are independent. They are not employees, directors or officers of, and have no financial interest in, ACC or any of its wholly owned, direct or indirect, subsidiaries, including ACIM, American Century Investment Services, Inc. (ACIS) and American Century Services, LLC (ACS), and they do not have any other affiliations, positions or relationships that would cause them to be considered “interested persons” under the Investment Company Act. The directors serve in this capacity for eight (in the case of Mr. Thomas, 15) registered investment companies in the American Century Investments family of funds.
The following table presents additional information about the directors. The mailing address for each director other than Mr. Thomas is 1665 Charleston Road, Mountain View, California 94043. The mailing address for Mr. Thomas is 4500 Main Street, Kansas City, Missouri 64111.
|
| | | | | |
Name (Year of Birth) | Position(s) Held with Funds | Length of Time Served | Principal Occupation(s) During Past 5 Years | Number of American Century Portfolios Overseen by Director | Other Directorships Held During Past 5 Years |
Independent Directors | | |
Tanya S. Beder
(1955) | Director | Since 2011 | Chairman and CEO, SBCC Group Inc. (independent advisory services) (2006 to present) | 46 | CYS Investments, Inc. (NYSE mortgage arbitrage REIT) |
Jeremy I. Bulow
(1954) | Director | Since 2011 | Professor of Economics, Stanford University, Graduate School of Business (1979 to present) | 46 | None |
Ronald J. Gilson
(1946) | Director and Chairman of the Board | Since 1995
(Chairman since 2005) | Charles J. Meyers Professor of Law and Business, Stanford Law School (1979 to present); Marc and Eva Stern Professor of Law and Business, Columbia University School of Law (1992 to present) | 46 | None |
Frederick L. A. Grauer
(1946) | Director | Since 2008 | Senior Advisor, BlackRock, Inc. (investment management firm) (2010 to 2011, 2013 to present) | 46 | None |
Peter F. Pervere
(1947) | Director | Since 2007 | Retired | 46 | None |
|
| | | | | |
Name (Year of Birth) | Position(s) Held with Funds | Length of Time Served | Principal Occupation(s) During Past 5 Years | Number of American Century Portfolios Overseen by Director | Other Directorships Held During Past 5 Years |
| Independent Directors | | |
John B. Shoven
(1947) | Director | Since 2002 | Professor of Economics, Stanford University (1973 to present) | 46 | Cadence Design Systems; Exponent; Financial Engines |
| Interested Director | | |
Jonathan S. Thomas
(1963) | Director and President | Since 2007 | President and Chief Executive Officer, ACC (March 2007 to present). Also serves as Chief Executive Officer, ACS; Executive Vice President, ACIM; Director, ACC, ACIM and other ACC subsidiaries | 124 | BioMed Valley Discoveries, Inc. |
The Statement of Additional Information has additional information about the fund's directors and is available without charge, upon request, by calling 1-800-345-2021.
Officers
The following table presents certain information about the executive officers of the funds. Each officer serves as an officer for each of the 15 investment companies in the American Century family of funds, unless otherwise noted. No officer is compensated for his or her service as an officer of the funds. The listed officers are interested persons of the funds and are appointed or re-appointed on an annual basis. The mailing address for each of the officers listed below is 4500 Main Street, Kansas City, Missouri 64111.
|
| | |
Name (Year of Birth) | Offices with
the Funds | Principal Occupation(s) During the Past Five Years |
Jonathan S.
Thomas
(1963) | Director and President
since 2007 | President and Chief Executive Officer, ACC (March 2007 to present). Also serves as Chief Executive Officer, ACS; Executive Vice President, ACIM; Director, ACC, ACIM and other ACC subsidiaries |
Amy D. Shelton
(1964) | Chief Compliance Officer and Vice President since 2014 | Chief Compliance Officer, American Century funds, (March 2014 to present); Chief Compliance Officer, ACIM (February 2014 to present); Chief Compliance Officer, ACIS (October 2009 to present); Vice President, Client Interactions and Marketing, ACIS (February 2013 to January 2014); Director, Client Interactions and Marketing, ACIS (June 2007 to January 2013). Also serves as Vice President, ACIS |
Charles A. Etherington
(1957) | General Counsel since 2007 and Senior Vice President since 2006 | Attorney, ACC (February 1994 to present); Vice President, ACC (November 2005 to present); General Counsel, ACC (March 2007 to present). Also serves as General Counsel, ACIM, ACS, ACIS and other ACC subsidiaries; and Senior Vice President, ACIM and ACS |
C. Jean Wade
(1964) | Vice President, Treasurer and
Chief Financial Officer since 2012 | Vice President, ACS (February 2000 to present) |
Robert J. Leach
(1966) | Vice President since 2006 and
Assistant Treasurer since 2012 | Vice President, ACS (February 2000 to present) |
David H. Reinmiller
(1963) | Vice President since 2001 | Attorney, ACC (January 1994 to present); Associate General Counsel, ACC (January 2001 to present). Also serves as Vice President, ACIM and ACS |
Ward D. Stauffer
(1960) | Secretary since 2005 | Attorney, ACC (June 2003 to present) |
|
|
| Approval of Management Agreement |
At a meeting held on June 16, 2015, the Fund’s Board of Directors unanimously approved the renewal of the management agreement pursuant to which American Century Investment Management, Inc. (the “Advisor”) acts as the investment advisor for the Fund. Under Section 15(c) of the Investment Company Act, contracts for investment advisory services are required to be reviewed, evaluated, and approved by a majority of a fund’s directors/trustees, including a majority of the independent Directors, each year. The Board regards this annual evaluation and renewal as one of its most important responsibilities.
The independent Directors have memorialized a statement regarding the relationship between their ongoing obligations to oversee and evaluate the performance of the Advisor and their annual consideration of renewal of the management agreement. In that statement, the independent Directors noted that their assessment of the Advisor’s performance is an ongoing process that takes place over the entire year and is informed by all of the extensive information that the Board and its committees receive and consider over time. This information, together with the materials provided in connection with the review, are central to the Board’s assessment of the Advisor’s performance and its determination whether to renew the Fund’s management agreement.
Prior to its consideration of the renewal of the management agreement, the Board requested and reviewed extensive data and analysis relating to the proposed renewal. This information and analysis was compiled by the Advisor and certain independent providers of evaluation data concerning the Fund and the services provided to the Fund by the Advisor.
In connection with its consideration of the renewal of the management agreement, the Board’s review and evaluation of the services provided by the Advisor included, but was not limited to, the following:
| |
| • | the nature, extent, and quality of investment management, shareholder services, and other services provided by the Advisor to the Fund; |
| |
| • | the wide range of other programs and services the Advisor provides to the Fund and its shareholders on a routine and non-routine basis; |
| |
| • | the investment performance of the Fund, including data comparing the Fund’s performance to appropriate benchmarks and/or a peer group of other mutual funds with similar investment objectives and strategies; |
| |
| • | the cost of owning the Fund compared to the cost of owning similar funds; |
| |
| • | the Advisor’s compliance policies, procedures, and regulatory experience; |
| |
| • | financial data showing the cost of services provided to the Fund, the profitability of the Fund to the Advisor, and the overall profitability of the Advisor; |
| |
| • | possible economies of scale associated with the Advisor’s management of the Fund and other accounts under its management; |
| |
| • | data comparing services provided and charges to other investment management clients of the Advisor; |
| |
| • | acquired fund fees and expenses; |
| |
| • | payments by the Fund and the Advisor to financial intermediaries whose clients are investors in the Fund; and |
| |
| • | any collateral benefits derived by the Advisor from the management of the Fund. |
In keeping with its practice, the Board held two in-person meetings to review and discuss the information provided in response to their request. The independent Directors also had the benefit of the advice of their independent counsel throughout the process.
Factors Considered
The Directors considered all of the information provided by the Advisor, the independent data providers, and the independent Directors’ independent counsel in connection with the review, and evaluated such information for the Fund. In connection with their review, the Directors did not identify any single factor as being all-important or controlling and each Director may have attributed different levels of importance to different factors. In deciding to renew the management agreement, the Board based its decision on a number of factors, including the following:
Nature, Extent and Quality of Services - Generally. Under the management agreement, the Advisor is responsible for providing or arranging for all services necessary for the operation of the Fund. The Board noted that under the management agreement, the Advisor provides or arranges at its own expense a wide variety of services including:
| |
| • | constructing and designing the Fund |
| |
| • | portfolio research and security selection |
| |
| • | initial capitalization/funding |
| |
| • | daily valuation of the Fund’s portfolio |
| |
| • | shareholder servicing and transfer agency, including shareholder confirmations, recordkeeping, and communications |
| |
| • | legal services (except the independent Directors’ counsel) |
| |
| • | regulatory and portfolio compliance |
| |
| • | marketing and distribution (except amounts paid by the Fund under Rule 12b-1 plans) |
The Board noted that many of these services have expanded over time both in terms of quantity and complexity in response to shareholder demands, competition in the industry, changing distribution channels, and the changing regulatory environment.
Investment Management, Shareholder, and Other Services. The nature of the investment management services provided to the Fund is quite complex and allows Fund shareholders access to professional money management, instant diversification of their investments within an asset class, the opportunity to easily diversify among asset classes by investing in or exchanging among various American Century Investments funds, and liquidity. In evaluating investment performance, the Board expects the Advisor to manage the Fund in accordance with its investment objectives and approved strategies. Further, the Directors recognize that the Advisor has an obligation to seek the best execution of fund trades. In providing these services, the Advisor utilizes teams of investment professionals (portfolio managers, analysts, research assistants, and securities traders) who require extensive information technology, research, training, compliance, and other systems to conduct their business. The Board, directly and through its Portfolio Committee, regularly reviews investment performance information for the Fund, together with comparative information for appropriate benchmarks and/or peer groups of similarly-managed funds, over different time horizons. The Directors also review detailed performance information during the management agreement approval process. If performance concerns are identified, the Fund receives special reviews until performance improves, during which the Board discusses with the Advisor the reasons for such results (e.g., market conditions, security selection) and any efforts being undertaken to improve performance. The Fund’s performance was above its benchmark for the one-, three-, and five-year periods reviewed by the Board. The Board found the investment management services provided by the Advisor to the Fund to be satisfactory and consistent with the management agreement.
Under the management agreement, the Advisor provides the Fund with a comprehensive package of transfer agency, shareholder, and other services. The Board, directly and through various committees of the Board, regularly reviews reports and evaluations of such services at its regular
meetings. These reports include, but are not limited to, information regarding the operational efficiency and accuracy of the shareholder and transfer agency services provided, staffing levels, shareholder satisfaction (as measured by external as well as internal sources), technology support, new products and services offered to Fund shareholders, securities trading activities, portfolio valuation services, auditing services, and legal and operational compliance activities.
Certain aspects of shareholder and transfer agency service level efficiency and the quality of securities trading activities are measured by independent third party providers and are presented in comparison to other fund groups not managed by the Advisor. The Board found the services provided by the Advisor to the Fund under the management agreement to be competitive and of high quality.
Costs of Services and Profitability. The Advisor provides detailed information concerning its cost of providing various services to the Fund, its profitability in managing the Fund, its overall profitability, and its financial condition. The Directors have reviewed with the Advisor the methodology used to prepare this financial information. This information is considered in evaluating the Advisor’s financial condition, its ability to continue to provide services under the management agreement, and the reasonableness of the current management fee. The Board concluded that the Advisor’s profits were reasonable in light of the services provided to the Fund.
Ethics. The Board generally considers the Advisor’s commitment to providing quality services to shareholders and to conducting its business ethically. They noted that the Advisor’s practices generally meet or exceed industry best practices.
Economies of Scale. The Board also reviewed information provided by the Advisor regarding the possible existence of economies of scale in connection with the management of the Fund. The Board concluded that economies of scale are difficult to measure and predict with precision, especially on a fund-by-fund basis. The Board concluded that the Advisor is appropriately sharing economies of scale through its competitive fee structure, offering competitive fees from fund inception, and through reinvestment in its business to provide shareholders enhanced and expanded services.
Comparison to Other Funds’ Fees. The management agreement provides that the Fund pays the Advisor a single, all-inclusive (or unified) management fee for providing all services necessary for the management and operation of the Fund, other than brokerage expenses, taxes, interest, extraordinary expenses, the fees and expenses of the Fund’s independent Directors (including their independent legal counsel), and expenses incurred in connection with the provision of shareholder services and distribution services under a plan adopted pursuant to Rule 12b-1 under the 1940 Act. Under the unified fee structure, the Advisor is responsible for providing all investment advisory, custody, audit, administrative, compliance, recordkeeping, marketing, and shareholder services, or arranging and supervising third parties to provide such services. By contrast, most other funds are charged a variety of fees, including an investment advisory fee, a transfer agency fee, an administrative fee, distribution charges, and other expenses. Other than their investment advisory fees and any applicable Rule 12b-1 fees, all other components of the total fees charged by these other funds may be increased without shareholder approval. The Board believes the unified fee structure is a benefit to Fund shareholders because it clearly discloses to shareholders the cost of owning Fund shares, and, since the unified fee cannot be increased without a vote of Fund shareholders, it shifts to the Advisor the risk of increased costs of operating the Fund and provides a direct incentive to minimize administrative inefficiencies. Part of the Board’s analysis of fee levels involves reviewing certain evaluative data compiled by an independent provider and comparing the Fund’s unified fee to the total expense ratio of peer funds. The unified fee charged to shareholders of the Fund was below the median of the total expense ratios of the Fund’s peer group. The Board concluded that the management fee paid by the Fund to the Advisor under the management agreement is reasonable in light of the services provided to the Fund.
Comparison to Fees and Services Provided to Other Clients of the Advisor. The Board also requested and received information from the Advisor concerning the nature of the services, fees,
costs, and profitability of its advisory services to advisory clients other than the Fund. They observed that these varying types of client accounts require different services and involve different regulatory and entrepreneurial risks than the management of the Fund. The Board analyzed this information and concluded that the fees charged and services provided to the Fund were reasonable by comparison.
Payments to Intermediaries. The Directors also requested and received a description of payments made to intermediaries by the Fund and the Advisor. These payments include various payments made by the Fund or the Advisor to different types of intermediaries and recordkeepers for distribution and service activities provided for the Fund.
Collateral or “Fall-Out” Benefits Derived by the Advisor. The Board considered the existence of collateral benefits the Advisor may receive as a result of its relationship with the Fund. The Board noted that the Advisor’s primary business is managing mutual funds and it generally does not use fund or shareholder information to generate profits in other lines of business, and therefore does not derive any significant collateral benefits from them. The Board noted that the Advisor receives proprietary research from broker-dealers that execute fund portfolio transactions. The Board also determined that the Advisor is able to provide investment management services to certain clients other than the Fund, at least in part, due to its existing infrastructure built to serve the fund complex.
Existing Relationship. The Board also considered whether there was any reason for not continuing the existing arrangement with the Advisor. In this regard, the Board was mindful of the potential disruptions of the Fund’s operations and various risks, uncertainties, and other effects that could occur as a result of a decision not to continue such relationship. In particular, the Board recognized that most shareholders have invested in the Fund on the strength of the Advisor’s industry standing and reputation and in the expectation that the Advisor will have a continuing role in providing advisory services to the Fund.
Conclusion of the Directors. As a result of this process, the Board, including all of the independent Directors and assisted by the advice of independent legal counsel, taking into account all of the factors discussed above and the information provided by the Advisor and others in connection with its review and throughout the year, concluded that the management agreement between the Fund and the Advisor is fair and reasonable in light of the services provided and should be renewed.
Retirement Account Information
As required by law, distributions you receive from certain IRAs are subject to federal income tax withholding, unless you elect not to have withholding apply. Tax will be withheld on the total amount withdrawn even though you may be receiving amounts that are not subject to withholding, such as nondeductible contributions. In such case, excess amounts of withholding could occur. You may adjust your withholding election so that a greater or lesser amount will be withheld.
If you don’t want us to withhold on this amount, you must notify us to not withhold the federal income tax. You may notify us in writing or in certain situations by telephone or through other electronic means. For systematic withdrawals, your withholding election will remain in effect until revoked or changed by filing a new election. You have the right to revoke your election at any time.
Remember, even if you elect not to have income tax withheld, you are liable for paying income tax on the taxable portion of your withdrawal. If you elect not to have income tax withheld or you don’t have enough income tax withheld, you may be responsible for payment of estimated tax. You may incur penalties under the estimated tax rules if your withholding and estimated tax payments are not sufficient. You can reduce or defer the income tax on a distribution by directly or indirectly rolling such distribution over to another IRA or eligible plan. You should consult your tax advisor for additional information.
State tax will be withheld if, at the time of your distribution, your address is within one of the mandatory withholding states and you have federal income tax withheld (or as otherwise required by state law). State taxes will be withheld from your distribution in accordance with the respective state rules.
Distributions you receive from 403(b), 457 and qualified plans are subject to special tax and withholding rules. Your plan administrator or plan sponsor is required to provide you with a special tax notice explaining those rules at the time you request a distribution. If applicable, federal and/or state taxes may be withheld from your distribution amount.
Proxy Voting Policies
Descriptions of the principles and policies that the fund's investment advisor uses in exercising the voting rights associated with the securities purchased and/or held by the fund are available without charge, upon request, by calling 1-800-345-2021 or visiting the "About Us" page of American Century Investments’ website at americancentury.com. A description of the policies is also available on the Securities and Exchange Commission’s website at sec.gov. Information regarding how the investment advisor voted proxies relating to portfolio securities during the most recent 12-month period ended June 30 is available on the "About Us" page at americancentury.com. It is also available at sec.gov.
Quarterly Portfolio Disclosure
The fund files its complete schedule of portfolio holdings with the Securities and Exchange Commission (SEC) for the first and third quarters of each fiscal year on Form N-Q. The fund’s Forms N-Q are available on the SEC’s website at sec.gov, and may be reviewed and copied at the SEC’s Public Reference Room in Washington, DC. Information on the operation of the Public Reference Room may be obtained by calling 1-800-SEC-0330. The fund also makes its complete schedule of portfolio holdings for the most recent quarter of its fiscal year available on its website at americancentury.com and, upon request, by calling 1-800-345-2021.
Other Tax Information
The following information is provided pursuant to provisions of the Internal Revenue Code.
The fund hereby designates up to the maximum amount allowable as qualified dividend income for the fiscal year ended June 30, 2015.
For corporate taxpayers, the fund hereby designates $1,711,221, or up to the maximum amount allowable, of ordinary income distributions paid during the fiscal year ended June 30, 2015 as qualified for the corporate dividends received deduction.
The fund hereby designates $10,099,515 as qualified short-term capital gain distributions for purposes of Internal Revenue Code Section 871 for the fiscal year ended June 30, 2015.
The fund hereby designates $39,022,092, or up to the maximum amount allowable, as long-term capital gain distributions for the fiscal year ended June 30, 2015.
The fund utilized earnings and profits of $3,698,398 distributed to shareholders on redemption of shares as part of the dividends paid deduction (tax equalization).
|
| | |
| |
| | | |
| Contact Us | americancentury.com | |
| Automated Information Line | 1-800-345-8765 | |
| Investor Services Representative | 1-800-345-2021
or 816-531-5575 | |
| Investors Using Advisors | 1-800-378-9878 | |
Business, Not-For-Profit, Employer-Sponsored
Retirement Plans | 1-800-345-3533 | |
Banks and Trust Companies, Broker-Dealers,
Financial Professionals, Insurance Companies | 1-800-345-6488 | |
| Telecommunications Relay Service for the Deaf | 711 | |
| | | |
| American Century Quantitative Equity Funds, Inc. | |
| | | |
Investment Advisor: American Century Investment Management, Inc. Kansas City, Missouri | |
| | | |
| This report and the statements it contains are submitted for the general information of our shareholders. The report is not authorized for distribution to prospective investors unless preceded or accompanied by an effective prospectus. | |
| | | |
©2015 American Century Proprietary Holdings, Inc. All rights reserved.
CL-ANN-86515 1508 | |
|
| |
| ANNUAL REPORT | JUNE 30, 2015 |
Small Company Fund
|
| | |
| President's Letter | 2 |
|
| Performance | 3 |
|
| Portfolio Commentary | |
|
| Fund Characteristics | |
|
| Shareholder Fee Example | |
|
| Schedule of Investments | |
|
| Statement of Assets and Liabilities | |
|
| Statement of Operations | |
|
| Statement of Changes in Net Assets | |
|
| Notes to Financial Statements | |
|
| Financial Highlights | |
|
| Report of Independent Registered Public Accounting Firm | |
|
| Management | |
|
| Approval of Management Agreement | |
|
| Additional Information | |
|
Any opinions expressed in this report reflect those of the author as of the date of the report, and do not necessarily represent the opinions of American Century Investments® or any other person in the American Century Investments organization. Any such opinions are subject to change at any time based upon market or other conditions and American Century Investments disclaims any responsibility to update such opinions. These opinions may not be relied upon as investment advice and, because investment decisions made by American Century Investments funds are based on numerous factors, may not be relied upon as an indication of trading intent on behalf of any American Century Investments fund. Security examples are used for representational purposes only and are not intended as recommendations to purchase or sell securities. Performance information for comparative indices and securities is provided to American Century Investments by third party vendors. To the best of American Century Investments’ knowledge, such information is accurate at the time of printing.
|
| |
| Dear Investor:
Thank you for reviewing this annual report for the 12 months ended June 30, 2015. It provides investment performance and portfolio information for the reporting period, plus longer-term historical performance data.
Annual reports remain important vehicles for conveying information about fund returns, including market and economic factors that affected performance during the reporting period. For additional, updated investment and market insights, we encourage you to visit our website, americancentury.com. |
| Jonathan Thomas |
Global Divergence Favored U.S. Assets
“Global divergence” between the U.S. and the rest of the world emerged as a prevalent theme during the reporting period. This theme embraced not only the relatively stronger economic growth enjoyed by the U.S. compared with most of the world, but also the related contrast between the U.S. Federal Reserve’s unwinding of monetary stimulus compared with the continuation and expansion of stimulus by other major central banks. Low inflation also prevailed, after crude oil prices plunged over 40% amid muted demand for commodities in general. In this environment, the U.S. dollar, U.S. growth stocks, and longer-maturity U.S. Treasuries generally benefited from “flight to quality” capital flows, reinforced by geopolitical and financial turmoil, particularly in Greece, Russia/Ukraine, China, and the Middle East.
Strong global capital flows into U.S. assets generated a global divergence between investment returns for U.S. and non-U.S. markets, especially for U.S. investors who realized their returns in dollar terms. For the reporting period, the U.S. Dollar Index, the S&P 500 Index, and the Barclays U.S. Aggregate Bond Index returned 19.74%, 7.42%, and 1.86%, respectively. By contrast, the MSCI EAFE Index, the MSCI Emerging Markets Index, and the Barclays Global Aggregate Bond ex-USD (Unhedged) Index returned -4.22%, -5.12%, and -13.19%, respectively, for U.S. investors unhedged for the strong dollar’s impact on non-dollar-denominated returns.
We expect more monetary policy divergence between the U.S. and other major developed economies in the coming months, accompanied by continued market volatility. This could present both challenges and opportunities for active investment managers. Upward pressures on inflation and interest rates could develop as the massive amount of global monetary stimulus in progress takes hold and economies improve. In this environment, we continue to believe in a disciplined, diversified, long-term investment approach, using professionally managed stock and bond portfolios to meet financial goals. We appreciate your continued trust in us.
Sincerely,
Jonathan Thomas
President and Chief Executive Officer
American Century Investments
|
| | | | | | |
| Total Returns as of June 30, 2015 |
| | | | Average Annual Returns | |
| | Ticker Symbol | 1 year | 5 years | 10 years | Since Inception | Inception Date |
| Investor Class | ASQIX | 4.51% | 17.73% | 5.87% | 8.94% | 7/31/98 |
| Russell 2000 Index | — | 6.49% | 17.07% | 8.40% | 7.95% | — |
| Institutional Class | ASCQX | 4.77% | 17.94% | 6.09% | 10.16% | 10/1/99 |
A Class(1) | ASQAX | | | | | 9/7/00 |
| No sales charge* | | 4.30% | 17.41% | 5.61% | 8.25% | |
| With sales charge* | | -1.68% | 16.03% | 4.98% | 7.82% | |
| C Class | ASQCX | 3.54% | 16.56% | — | 14.53% | 3/1/10 |
| R Class | ASCRX | 4.02% | 17.15% | 5.35% | 8.38% | 8/29/03 |
| |
| * | Sales charges include initial sales charges and contingent deferred sales charges (CDSCs), as applicable. A Class shares have a 5.75% maximum initial sales charge and may be subject to a maximum CDSC of 1.00%. C Class shares redeemed within 12 months of purchase are subject to a maximum CDSC of 1.00%. The SEC requires that mutual funds provide performance information net of maximum sales charges in all cases where charges could be applied. |
| |
| (1) | Prior to March 1, 2010, the A Class was referred to as the Advisor Class and did not have a front-end sales charge. Performance prior to that date has been adjusted to reflect this charge. |
Data presented reflect past performance. Past performance is no guarantee of future results. Current performance may be higher or lower than the performance shown. Investment return and principal value will fluctuate, and redemption value may be more or less than original cost. Data assumes reinvestment of dividends and capital gains, and none of the charts reflect the deduction of taxes that a shareholder would pay on fund distributions or the redemption of fund shares. To obtain performance data current to the most recent month end, please call 1-800-345-2021 or visit americancentury.com. For additional information about the fund, please consult the prospectus.
|
|
| Growth of $10,000 Over 10 Years |
| $10,000 investment made June 30, 2005 |
| Performance for other share classes will vary due to differences in fee structure. |
|
| |
| Value on June 30, 2015 |
| | Investor Class — $17,698 |
| |
| | Russell 2000 Index — $22,407 |
| |
|
| | | | |
| Total Annual Fund Operating Expenses |
| Investor Class | Institutional Class | A Class | C Class | R Class |
| 0.87% | 0.67% | 1.12% | 1.87% | 1.37% |
The total annual fund operating expenses shown is as stated in the fund’s prospectus current as of the date of this report. The prospectus may vary from the expense ratio shown elsewhere in this report because it is based on a different time period, includes acquired fund fees and expenses, and, if applicable, does not include fee waivers or expense reimbursements.
Data presented reflect past performance. Past performance is no guarantee of future results. Current performance may be higher or lower than the performance shown. Investment return and principal value will fluctuate, and redemption value may be more or less than original cost. Data assumes reinvestment of dividends and capital gains, and none of the charts reflect the deduction of taxes that a shareholder would pay on fund distributions or the redemption of fund shares. To obtain performance data current to the most recent month end, please call 1-800-345-2021 or visit americancentury.com. For additional information about the fund, please consult the prospectus.
Portfolio Managers: Brian Garbe and Tal Sansani
Performance Summary
Small Company returned 4.51%* for the fiscal year ended June 30, 2015, compared with the 6.49% return of its benchmark, the Russell 2000 Index.
U.S. equity markets endured substantial volatility, but ended the 12-month period with advances. Small Company produced gains during the fiscal year, but was unable to match the return of its benchmark, the Russell 2000 Index. Small Company’s stock selection process incorporates factors of valuation, quality, growth, and sentiment while striving to minimize unintended risks along industries and other risk characteristics. Security selection in health care holdings provided the majority of detraction, while energy sector positioning was beneficial.
Stock Selection Across Several Sectors Detracted
On a sector basis, health care holdings imparted the largest relative detraction, although no position in the sector was a leading individual fund underperformer. Significant individual detraction stemmed from overweight positions, relative to the benchmark, in a number of energy sector holdings, which were hurt by ongoing declines in the price of oil during the year. These included Pioneer Energy Services, a provider of drilling and production services to oil and gas exploration companies, and Warren Resources, an oil and gas exploration and production company. Both positions were ultimately liquidated.
Several private education providers in the consumer discretionary sector also weighed on the fund’s twelve-month results as lower enrollment due to stricter financial aid funding guidelines imposed on for-profit educators pressured revenues. An overweight position in online education provider K12 was a leading detractor in the space, however, the holding remains very attractive across quality, valuation, and growth metrics. Elsewhere in the sector, underperformers included Iconix Brand Group, an apparel brand licensing company, which declined amid questions surrounding the company's accounting methods and several executive-level resignations. We retain our position in the holding based on its attractive valuation profile. An overweight to Weight Watchers International, a weight management services provider, limited gains as the company’s stock tumbled after an earnings miss and downward revisions to management’s outlook driven by double-digit subscriber declines. The position was subsequently liquidated.
A number of positions in the financials sector weighed on the fund’s returns. Shares of real estate management company Altisource Portfolio Solutions declined steeply on disappointing quarterly earnings and again after a New York State investigation implicated a subsidiary. We ultimately eliminated the holding.
| |
| * | All fund returns referenced in this commentary are for Investor Class shares. Performance for other share classes will vary due to differences in fee structure; when Investor Class performance exceeds that of the fund's benchmark, other share classes may not. See page 3 for returns for all share classes. |
Individual Consumer Discretionary & Health Care Positions Contributed to Relative Gains
Although energy was the leading relative contributor on a sector basis, no single position made a significant contribution to relative results. Instead, leading outperformance on a security level came from several health care and consumer discretionary sector holdings. A portfolio-only position in Centene was beneficial as the Medicaid coverage provider’s stock rallied after management released above-expectations earnings forecasts. Elsewhere in the sector, contribution came from an overweight position in Ligand Pharmaceuticals whose share price advanced following news of favorable quarterly earnings and again when the company disclosed encouraging results from its experimental type II diabetes treatment.
Isle of Capri Casinos, a casino operator with properties outside of Las Vegas, was a leading fund contributor after surpassing earnings forecasts due to revenue gains and constrained spending, which contrasted from trends seen in Las Vegas- and Macau-based casino operators. An overweight position in Cracker Barrel Old Country Store was also helpful. The company’s shares reached an all-time high, following strong quarterly revenues and earnings, driven in part by lower gas prices that helped drive customers to its highway restaurant locations. Elsewhere, shipping company Matson bolstered the industrials sector’s returns after it appreciated steeply on unexpectedly strong quarterly results driven by container volume increases.
A Look Ahead
The U.S. economy seems poised to continue to experience hesitant economic growth through the second half of 2015. Economic activity appears to have somewhat diminished in breadth, though it remains slow yet steady. We believe that divergence in monetary policy between the U.S. and much of the rest of the world is likely to continue. Therefore, questions surrounding when and how much the U.S. Federal Reserve might act to tighten money supply, and the potential impact of such a move, are likely to continue driving investor sentiment in equity markets. Our disciplined, objective, and systematic investment strategy is designed to take advantage of opportunities at the individual company level. We believe this approach is the most powerful way to capitalize on market inefficiencies that lead to the mispricing of individual stocks. Currently, the fund’s most significant sector overweight positions are in health care and information technology while financials and utilities represent the greatest sector underweights.
|
| |
| JUNE 30, 2015 |
| Top Ten Holdings | % of net assets |
| Fair Isaac Corp. | 0.7% |
| RLJ Lodging Trust | 0.7% |
| Prestige Brands Holdings, Inc. | 0.7% |
| Microsemi Corp. | 0.7% |
| Vail Resorts, Inc. | 0.7% |
| Teledyne Technologies, Inc. | 0.7% |
| Ligand Pharmaceuticals, Inc., Class B | 0.7% |
| Cracker Barrel Old Country Store, Inc. | 0.7% |
| Dana Holding Corp. | 0.7% |
| Bank of the Ozarks, Inc. | 0.7% |
| | |
| Top Five Industries | % of net assets |
| Banks | 5.9% |
| Real Estate Investment Trusts (REITs) | 5.9% |
| Hotels, Restaurants and Leisure | 5.8% |
| Software | 5.7% |
| Health Care Equipment and Supplies | 5.6% |
| | |
| Types of Investments in Portfolio | % of net assets |
| Common Stocks | 99.0% |
| Temporary Cash Investments | 1.0% |
| Other Assets and Liabilities | —* |
*Category is less than 0.05% of total net assets.
Fund shareholders may incur two types of costs: (1) transaction costs, including sales charges (loads) on purchase payments and redemption/exchange fees; and (2) ongoing costs, including management fees; distribution and service (12b-1) fees; and other fund expenses. This example is intended to help you understand your ongoing costs (in dollars) of investing in your fund and to compare these costs with the ongoing cost of investing in other mutual funds.
The example is based on an investment of $1,000 made at the beginning of the period and held for the entire period from January 1, 2015 to June 30, 2015.
Actual Expenses
The table provides information about actual account values and actual expenses for each class. You may use the information, together with the amount you invested, to estimate the expenses that you paid over the period. First, identify the share class you own. Then simply divide your account value by $1,000 (for example, an $8,600 account value divided by $1,000 = 8.6), then multiply the result by the number under the heading “Expenses Paid During Period” to estimate the expenses you paid on your account during this period.
If you hold Investor Class shares of any American Century Investments fund, or Institutional Class shares of the American Century Diversified Bond Fund, in an American Century Investments account (i.e., not a financial intermediary or retirement plan account), American Century Investments may charge you a $12.50 semiannual account maintenance fee if the value of those shares is less than $10,000. We will redeem shares automatically in one of your accounts to pay the $12.50 fee. In determining your total eligible investment amount, we will include your investments in all personal accounts (including American Century Investments Brokerage accounts) registered under your Social Security number. Personal accounts include individual accounts, joint accounts, UGMA/UTMA accounts, personal trusts, Coverdell Education Savings Accounts and IRAs (including traditional, Roth, Rollover, SEP-, SARSEP- and SIMPLE-IRAs), and certain other retirement accounts. If you have only business, business retirement, employer-sponsored or American Century Investments Brokerage accounts, you are currently not subject to this fee. If you are subject to the Account Maintenance Fee, your account value could be reduced by the fee amount.
Hypothetical Example for Comparison Purposes
The table also provides information about hypothetical account values and hypothetical expenses based on the actual expense ratio of each class of your fund and an assumed rate of return of 5% per year before expenses, which is not the actual return of a fund’s share class. The hypothetical account values and expenses may not be used to estimate the actual ending account balance or expenses you paid for the period. You may use this information to compare the ongoing costs of investing in your fund and other funds. To do so, compare this 5% hypothetical example with the 5% hypothetical examples that appear in the shareholder reports of the other funds.
Please note that the expenses shown in the table are meant to highlight your ongoing costs only and do not reflect any transactional costs, such as sales charges (loads) or redemption/exchange fees. Therefore, the table is useful in comparing ongoing costs only, and will not help you determine the relative total costs of owning different funds. In addition, if these transactional costs were included, your costs would have been higher.
|
| | | | |
| | Beginning
Account Value
1/1/15 | Ending
Account Value
6/30/15 | Expenses Paid
During Period(1) 1/1/15 - 6/30/15 | Annualized Expense Ratio(1) |
| Actual | | | | |
| Investor Class | $1,000 | $1,034.80 | $4.39 | 0.87% |
| Institutional Class | $1,000 | $1,036.10 | $3.38 | 0.67% |
| A Class | $1,000 | $1,034.00 | $5.65 | 1.12% |
| C Class | $1,000 | $1,030.60 | $9.42 | 1.87% |
| R Class | $1,000 | $1,032.90 | $6.91 | 1.37% |
| Hypothetical | | | | |
| Investor Class | $1,000 | $1,020.48 | $4.36 | 0.87% |
| Institutional Class | $1,000 | $1,021.47 | $3.36 | 0.67% |
| A Class | $1,000 | $1,019.24 | $5.61 | 1.12% |
| C Class | $1,000 | $1,015.52 | $9.35 | 1.87% |
| R Class | $1,000 | $1,018.00 | $6.85 | 1.37% |
| |
| (1) | Expenses are equal to the class's annualized expense ratio listed in the table above, multiplied by the average account value over the period, multiplied by 181, the number of days in the most recent fiscal half-year, divided by 365, to reflect the one-half year period. |
JUNE 30, 2015
|
| | | | |
| | Shares | Value |
| COMMON STOCKS — 99.0% | | |
| Aerospace and Defense — 2.1% | | |
Astronics Corp.(1) | 42,314 | $ | 2,999,640 |
|
Ducommun, Inc.(1) | 53,150 | 1,364,361 |
|
Moog, Inc., Class A(1) | 47,152 | 3,332,703 |
|
Teledyne Technologies, Inc.(1) | 36,779 | 3,880,552 |
|
| | | 11,577,256 |
|
| Air Freight and Logistics — 0.6% | | |
Air Transport Services Group, Inc.(1) | 73,214 | 768,015 |
|
Atlas Air Worldwide Holdings, Inc.(1) | 45,110 | 2,479,245 |
|
| | | 3,247,260 |
|
| Airlines — 0.5% | | |
JetBlue Airways Corp.(1) | 136,371 | 2,831,062 |
|
| Auto Components — 2.0% | | |
American Axle & Manufacturing Holdings, Inc.(1) | 136,767 | 2,859,798 |
|
| Cooper Tire & Rubber Co. | 92,711 | 3,136,413 |
|
| Dana Holding Corp. | 185,595 | 3,819,545 |
|
Tower International, Inc.(1) | 42,372 | 1,103,791 |
|
| | | 10,919,547 |
|
| Banks — 5.9% | | |
| Bank of the Ozarks, Inc. | 82,852 | 3,790,479 |
|
| Banner Corp. | 24,844 | 1,190,773 |
|
| Berkshire Hills Bancorp, Inc. | 7,381 | 210,211 |
|
| Cardinal Financial Corp. | 102,803 | 2,240,077 |
|
Eagle Bancorp, Inc.(1) | 44,273 | 1,946,241 |
|
First BanCorp(1) | 467,283 | 2,252,304 |
|
| First Financial Bancorp | 15,155 | 271,881 |
|
| First Interstate Bancsystem, Inc. | 17,098 | 474,299 |
|
| First Merchants Corp. | 24,404 | 602,779 |
|
| First Midwest Bancorp, Inc. | 25,339 | 480,681 |
|
First NBC Bank Holding Co.(1) | 6,530 | 235,080 |
|
| Fulton Financial Corp. | 30,190 | 394,281 |
|
| Hancock Holding Co. | 27,733 | 884,960 |
|
| Heartland Financial USA, Inc. | 22,616 | 841,768 |
|
| Home Bancshares, Inc. | 91,971 | 3,362,460 |
|
| OFG Bancorp | 31,477 | 335,860 |
|
| Opus Bank | 3,808 | 137,773 |
|
| Park National Corp. | 4,066 | 355,246 |
|
| Prosperity Bancshares, Inc. | 56,237 | 3,247,124 |
|
| Renasant Corp. | 17,943 | 584,942 |
|
| South State Corp. | 28,122 | 2,136,991 |
|
| Sterling Bancorp | 65,312 | 960,086 |
|
| United Community Banks, Inc. | 26,366 | 550,258 |
|
Western Alliance Bancorp(1) | 110,523 | 3,731,256 |
|
| Wilshire Bancorp, Inc. | 114,973 | 1,452,109 |
|
|
| | | | |
| | Shares | Value |
| Wintrust Financial Corp. | 6,584 | $ | 351,454 |
|
| | | 33,021,373 |
|
| Biotechnology — 5.3% | | |
Acorda Therapeutics, Inc.(1) | 97,249 | 3,241,309 |
|
Array BioPharma, Inc.(1) | 76,752 | 553,382 |
|
BioSpecifics Technologies Corp.(1) | 15,553 | 802,535 |
|
Dyax Corp.(1) | 77,563 | 2,055,420 |
|
Emergent Biosolutions, Inc.(1) | 107,396 | 3,538,698 |
|
Enanta Pharmaceuticals, Inc.(1) | 17,132 | 770,769 |
|
Five Prime Therapeutics, Inc.(1) | 4,018 | 99,807 |
|
Geron Corp.(1) | 383,322 | 1,640,618 |
|
Infinity Pharmaceuticals, Inc.(1) | 72,221 | 790,820 |
|
Ligand Pharmaceuticals, Inc., Class B(1) | 38,232 | 3,857,609 |
|
MannKind Corp.(1) | 135,187 | 769,214 |
|
Merrimack Pharmaceuticals, Inc.(1) | 219,193 | 2,710,321 |
|
MiMedx Group, Inc.(1) | 281,533 | 3,262,968 |
|
NewLink Genetics Corp.(1) | 64,533 | 2,856,876 |
|
Ophthotech Corp.(1) | 23,322 | 1,214,143 |
|
Orexigen Therapeutics, Inc.(1) | 235,860 | 1,167,507 |
|
Rigel Pharmaceuticals, Inc.(1) | 27,883 | 89,504 |
|
| | | 29,421,500 |
|
| Building Products — 1.4% | | |
American Woodmark Corp.(1) | 59,465 | 3,261,655 |
|
Continental Building Products, Inc.(1) | 90,071 | 1,908,604 |
|
| Griffon Corp. | 64,893 | 1,033,097 |
|
Patrick Industries, Inc.(1) | 8,068 | 306,987 |
|
| Simpson Manufacturing Co., Inc. | 19,653 | 668,202 |
|
| Universal Forest Products, Inc. | 10,020 | 521,341 |
|
| | | 7,699,886 |
|
| Capital Markets — 2.8% | | |
| Calamos Asset Management, Inc., Class A | 75,073 | 919,644 |
|
| Diamond Hill Investment Group, Inc. | 6,609 | 1,319,553 |
|
| Evercore Partners, Inc., Class A | 64,853 | 3,499,468 |
|
INTL FCStone, Inc.(1) | 32,620 | 1,084,289 |
|
| Investment Technology Group, Inc. | 105,657 | 2,620,293 |
|
| Janus Capital Group, Inc. | 209,399 | 3,584,911 |
|
| Manning & Napier, Inc. | 90,378 | 901,069 |
|
| Moelis & Co., Class A | 58,140 | 1,669,199 |
|
| | | 15,598,426 |
|
| Chemicals — 0.4% | | |
| Innophos Holdings, Inc. | 3,649 | 192,084 |
|
| KMG Chemicals, Inc. | 5,521 | 140,454 |
|
| Minerals Technologies, Inc. | 15,775 | 1,074,751 |
|
Trinseo SA(1) | 37,511 | 1,006,795 |
|
| | | 2,414,084 |
|
| Commercial Services and Supplies — 2.0% | | |
ACCO Brands Corp.(1) | 375,871 | 2,920,518 |
|
ARC Document Solutions, Inc.(1) | 97,363 | 740,932 |
|
| Deluxe Corp. | 57,608 | 3,571,696 |
|
| Ennis, Inc. | 22,147 | 411,713 |
|
|
| | | | |
| | Shares | Value |
| Herman Miller, Inc. | 112,011 | $ | 3,240,478 |
|
| | | 10,885,337 |
|
| Communications Equipment — 1.1% | | |
ARRIS Group, Inc.(1) | 57,207 | 1,750,534 |
|
| Brocade Communications Systems, Inc. | 108,382 | 1,287,578 |
|
Polycom, Inc.(1) | 279,104 | 3,192,950 |
|
| | | 6,231,062 |
|
| Construction and Engineering — 0.8% | | |
| Argan, Inc. | 22,039 | 888,833 |
|
| EMCOR Group, Inc. | 75,944 | 3,627,845 |
|
| | | 4,516,678 |
|
| Consumer Finance — 1.0% | | |
Credit Acceptance Corp.(1) | 11,311 | 2,784,542 |
|
World Acceptance Corp.(1) | 43,669 | 2,686,080 |
|
| | | 5,470,622 |
|
| Containers and Packaging — 1.1% | | |
Berry Plastics Group, Inc.(1) | 108,539 | 3,516,663 |
|
| Graphic Packaging Holding Co. | 184,320 | 2,567,578 |
|
| | | 6,084,241 |
|
| Distributors — 0.1% | | |
VOXX International Corp.(1) | 47,339 | 391,967 |
|
| Diversified Consumer Services — 1.2% | | |
| Capella Education Co. | 25,168 | 1,350,767 |
|
K12, Inc.(1) | 217,548 | 2,751,982 |
|
Steiner Leisure, Ltd.(1) | 2,325 | 125,038 |
|
Strayer Education, Inc.(1) | 55,970 | 2,412,307 |
|
| | | 6,640,094 |
|
| Diversified Financial Services — 0.7% | | |
| GAIN Capital Holdings, Inc. | 216,571 | 2,070,419 |
|
| MarketAxess Holdings, Inc. | 21,259 | 1,972,197 |
|
| | | 4,042,616 |
|
| Diversified Telecommunication Services — 0.7% | | |
| IDT Corp., Class B | 88,696 | 1,603,624 |
|
| Inteliquent, Inc. | 70,566 | 1,298,414 |
|
Intelsat SA(1) | 119,094 | 1,181,413 |
|
| | | 4,083,451 |
|
| Electrical Equipment — 0.7% | | |
| AZZ, Inc. | 18,977 | 983,009 |
|
Enphase Energy, Inc.(1) | 178,668 | 1,359,663 |
|
| General Cable Corp. | 79,360 | 1,565,773 |
|
Thermon Group Holdings, Inc.(1) | 5,572 | 134,118 |
|
| | | 4,042,563 |
|
| Electronic Equipment, Instruments and Components — 2.1% | | |
| Checkpoint Systems, Inc. | 77,424 | 788,176 |
|
Coherent, Inc.(1) | 21,199 | 1,345,712 |
|
DTS, Inc.(1) | 7,009 | 213,704 |
|
| Methode Electronics, Inc. | 79,797 | 2,190,428 |
|
Newport Corp.(1) | 59,004 | 1,118,716 |
|
OSI Systems, Inc.(1) | 37,016 | 2,620,363 |
|
Rogers Corp.(1) | 6,978 | 461,525 |
|
|
| | | | |
| | Shares | Value |
Sanmina Corp.(1) | 154,911 | $ | 3,123,006 |
|
| | | 11,861,630 |
|
| Energy Equipment and Services — 0.5% | | |
Forum Energy Technologies, Inc.(1) | 139,139 | 2,821,739 |
|
Parker Drilling Co.(1) | 38,271 | 127,060 |
|
| | | 2,948,799 |
|
| Food and Staples Retailing — 0.8% | | |
| Ingles Markets, Inc., Class A | 26,720 | 1,276,415 |
|
| SpartanNash Co. | 12,408 | 403,756 |
|
SUPERVALU, Inc.(1) | 321,910 | 2,604,252 |
|
| | | 4,284,423 |
|
| Food Products — 2.2% | | |
| Cal-Maine Foods, Inc. | 61,708 | 3,221,157 |
|
| Dean Foods Co. | 188,496 | 3,047,980 |
|
| Pilgrim's Pride Corp. | 57,535 | 1,321,579 |
|
| Sanderson Farms, Inc. | 41,685 | 3,133,045 |
|
Seaboard Corp.(1) | 416 | 1,497,184 |
|
| | | 12,220,945 |
|
| Gas Utilities — 0.1% | | |
| Southwest Gas Corp. | 14,637 | 778,835 |
|
| Health Care Equipment and Supplies — 5.6% | | |
| Abaxis, Inc. | 14,482 | 745,533 |
|
Align Technology, Inc.(1) | 29,141 | 1,827,432 |
|
| Analogic Corp. | 29,695 | 2,342,936 |
|
Anika Therapeutics, Inc.(1) | 52,793 | 1,743,753 |
|
Cyberonics, Inc.(1) | 46,724 | 2,778,209 |
|
Exactech, Inc.(1) | 4,263 | 88,798 |
|
Globus Medical, Inc.(1) | 124,782 | 3,203,154 |
|
Greatbatch, Inc.(1) | 60,903 | 3,283,890 |
|
| Hill-Rom Holdings, Inc. | 46,506 | 2,526,671 |
|
Integra LifeSciences Holdings Corp.(1) | 16,109 | 1,085,263 |
|
Merit Medical Systems, Inc.(1) | 65,141 | 1,403,137 |
|
Natus Medical, Inc.(1) | 86,314 | 3,673,524 |
|
| STERIS Corp. | 58,092 | 3,743,449 |
|
| West Pharmaceutical Services, Inc. | 47,930 | 2,783,774 |
|
| | | 31,229,523 |
|
| Health Care Providers and Services — 1.9% | | |
Air Methods Corp.(1) | 46,826 | 1,935,787 |
|
Centene Corp.(1) | 34,063 | 2,738,665 |
|
| Landauer, Inc. | 40,309 | 1,436,613 |
|
Molina Healthcare, Inc.(1) | 50,066 | 3,519,640 |
|
RadNet, Inc.(1) | 74,730 | 499,944 |
|
Surgical Care Affiliates, Inc.(1) | 9,419 | 361,501 |
|
| | | 10,492,150 |
|
| Health Care Technology — 0.8% | | |
| Computer Programs & Systems, Inc. | 11,649 | 622,289 |
|
Merge Healthcare, Inc.(1) | 98,631 | 473,429 |
|
| Quality Systems, Inc. | 191,582 | 3,174,514 |
|
| | | 4,270,232 |
|
|
| | | | |
| | Shares | Value |
| Hotels, Restaurants and Leisure — 5.8% | | |
Boyd Gaming Corp.(1) | 186,526 | $ | 2,788,564 |
|
| Cracker Barrel Old Country Store, Inc. | 25,764 | 3,842,958 |
|
Denny's Corp.(1) | 50,297 | 583,948 |
|
Diamond Resorts International, Inc.(1) | 34,418 | 1,085,888 |
|
| DineEquity, Inc. | 11,027 | 1,092,666 |
|
| Interval Leisure Group, Inc. | 56,491 | 1,290,819 |
|
Isle of Capri Casinos, Inc.(1) | 183,497 | 3,330,471 |
|
| Jack in the Box, Inc. | 14,564 | 1,283,962 |
|
La Quinta Holdings, Inc.(1) | 137,124 | 3,133,283 |
|
| Marriott Vacations Worldwide Corp. | 37,845 | 3,472,279 |
|
Monarch Casino & Resort, Inc.(1) | 18,584 | 382,087 |
|
| Nathan's Famous, Inc. | 6,612 | 245,041 |
|
Penn National Gaming, Inc.(1) | 198,084 | 3,634,841 |
|
| Ruth's Hospitality Group, Inc. | 113,693 | 1,832,731 |
|
| Speedway Motorsports, Inc. | 16,192 | 366,749 |
|
| Vail Resorts, Inc. | 35,612 | 3,888,830 |
|
| | | 32,255,117 |
|
| Household Durables — 0.6% | | |
| CSS Industries, Inc. | 19,112 | 578,138 |
|
Helen of Troy Ltd.(1) | 10,658 | 1,039,048 |
|
Universal Electronics, Inc.(1) | 33,800 | 1,684,592 |
|
Zagg, Inc.(1) | 31,927 | 252,862 |
|
| | | 3,554,640 |
|
| Household Products — 0.1% | | |
Central Garden and Pet Co.(1) | 29,232 | 333,537 |
|
| Independent Power and Renewable Electricity Producers — 0.6% | |
| Ormat Technologies, Inc. | 83,431 | 3,143,680 |
|
| Insurance — 3.3% | | |
| AMERISAFE, Inc. | 57,633 | 2,712,209 |
|
| Amtrust Financial Services, Inc. | 30,168 | 1,976,306 |
|
| Employers Holdings, Inc. | 25,178 | 573,555 |
|
| Federated National Holding Co. | 96,462 | 2,334,380 |
|
| HCI Group, Inc. | 5,388 | 238,204 |
|
| Maiden Holdings Ltd. | 181,208 | 2,859,462 |
|
| Selective Insurance Group, Inc. | 118,768 | 3,331,442 |
|
| United Fire Group, Inc. | 10,620 | 347,911 |
|
| United Insurance Holdings Corp. | 63,442 | 985,889 |
|
| Universal Insurance Holdings, Inc. | 124,304 | 3,008,157 |
|
| | | 18,367,515 |
|
| Internet and Catalog Retail — 0.6% | | |
1-800-Flowers.com, Inc., Class A(1) | 108,481 | 1,134,711 |
|
| Nutrisystem, Inc. | 26,821 | 667,307 |
|
| PetMed Express, Inc. | 75,120 | 1,297,322 |
|
| | | 3,099,340 |
|
| Internet Software and Services — 3.6% | | |
Carbonite, Inc.(1) | 17,461 | 206,214 |
|
Cimpress NV(1) | 44,915 | 3,780,046 |
|
Constant Contact, Inc.(1) | 83,757 | 2,408,851 |
|
DHI Group, Inc.(1) | 103,112 | 916,666 |
|
|
| | | | |
| | Shares | Value |
| EarthLink Holdings Corp. | 85,825 | $ | 642,829 |
|
Endurance International Group Holdings, Inc.(1) | 149,029 | 3,078,939 |
|
Everyday Health, Inc.(1) | 26,497 | 338,632 |
|
LogMeIn, Inc.(1) | 50,044 | 3,227,338 |
|
| Marchex, Inc., Class B | 26,560 | 131,472 |
|
Monster Worldwide, Inc.(1) | 18,513 | 121,075 |
|
| NIC, Inc. | 14,223 | 259,997 |
|
United Online, Inc.(1) | 17,576 | 275,416 |
|
Web.com Group, Inc.(1) | 149,314 | 3,616,385 |
|
XO Group, Inc.(1) | 81,735 | 1,336,367 |
|
| | | 20,340,227 |
|
| IT Services — 1.0% | | |
| CSG Systems International, Inc. | 75,240 | 2,382,098 |
|
| Science Applications International Corp. | 63,788 | 3,371,196 |
|
| | | 5,753,294 |
|
| Life Sciences Tools and Services — 1.7% | | |
Affymetrix, Inc.(1) | 100,897 | 1,101,795 |
|
Cambrex Corp.(1) | 78,855 | 3,464,889 |
|
Luminex Corp.(1) | 78,698 | 1,358,328 |
|
PAREXEL International Corp.(1) | 58,736 | 3,777,312 |
|
| | | 9,702,324 |
|
| Machinery — 2.7% | | |
Blount International, Inc.(1) | 227,888 | 2,488,537 |
|
| Douglas Dynamics, Inc. | 42,554 | 914,060 |
|
| Federal Signal Corp. | 15,259 | 227,512 |
|
| Kadant, Inc. | 8,123 | 383,406 |
|
Lydall, Inc.(1) | 57,289 | 1,693,463 |
|
Meritor, Inc.(1) | 252,721 | 3,315,699 |
|
| Mueller Water Products, Inc., Class A | 333,449 | 3,034,386 |
|
Wabash National Corp.(1) | 235,434 | 2,952,342 |
|
| | | 15,009,405 |
|
| Marine — 0.6% | | |
| Matson, Inc. | 84,324 | 3,544,981 |
|
| Media — 0.3% | | |
Entercom Communications Corp., Class A(1) | 62,018 | 708,246 |
|
| Nexstar Broadcasting Group, Inc., Class A | 18,699 | 1,047,144 |
|
| | | 1,755,390 |
|
| Metals and Mining — 1.1% | | |
Century Aluminum Co.(1) | 235,785 | 2,459,238 |
|
| Gold Resource Corp. | 232,353 | 641,294 |
|
| Materion Corp. | 81,304 | 2,865,966 |
|
| | | 5,966,498 |
|
| Multiline Retail — 0.5% | | |
Burlington Stores, Inc.(1) | 37,330 | 1,911,296 |
|
| Dillard's, Inc., Class A | 10,768 | 1,132,686 |
|
| | | 3,043,982 |
|
| Oil, Gas and Consumable Fuels — 1.7% | | |
| Alon USA Energy, Inc. | 161,963 | 3,061,101 |
|
Pacific Ethanol, Inc.(1) | 227,310 | 2,345,839 |
|
Par Petroleum Corp.(1) | 13,604 | 254,667 |
|
|
| | | | |
| | Shares | Value |
REX American Resources Corp.(1) | 49,137 | $ | 3,127,078 |
|
| Western Refining, Inc. | 22,019 | 960,469 |
|
| | | 9,749,154 |
|
| Paper and Forest Products — 0.9% | | |
Clearwater Paper Corp.(1) | 40,554 | 2,323,744 |
|
| Neenah Paper, Inc. | 42,185 | 2,487,228 |
|
| | | 4,810,972 |
|
| Pharmaceuticals — 3.5% | | |
Lannett Co., Inc.(1) | 59,438 | 3,532,995 |
|
Nektar Therapeutics(1) | 158,237 | 1,979,545 |
|
Pacira Pharmaceuticals, Inc.(1) | 44,310 | 3,133,603 |
|
Pozen, Inc.(1) | 119,046 | 1,227,364 |
|
Prestige Brands Holdings, Inc.(1) | 85,515 | 3,954,214 |
|
Sagent Pharmaceuticals, Inc.(1) | 117,116 | 2,847,090 |
|
Sucampo Pharmaceuticals, Inc., Class A(1) | 181,501 | 2,982,061 |
|
Supernus Pharmaceuticals, Inc.(1) | 8,588 | 145,824 |
|
| | | 19,802,696 |
|
| Professional Services — 1.4% | | |
CRA International, Inc.(1) | 34,103 | 950,451 |
|
| Korn / Ferry International | 68,798 | 2,392,106 |
|
RPX Corp.(1) | 207,404 | 3,505,127 |
|
TrueBlue, Inc.(1) | 18,161 | 543,014 |
|
| VSE Corp. | 6,092 | 325,983 |
|
| | | 7,716,681 |
|
| Real Estate Investment Trusts (REITs) — 5.9% | | |
| Alexander's, Inc. | 214 | 87,740 |
|
| Armada Hoffler Properties, Inc. | 10,623 | 106,124 |
|
| Ashford Hospitality Prime, Inc. | 18,514 | 278,080 |
|
| Ashford Hospitality Trust, Inc. | 57,403 | 485,629 |
|
| Cedar Realty Trust, Inc. | 12,814 | 82,010 |
|
| Coresite Realty Corp. | 14,593 | 663,106 |
|
| DiamondRock Hospitality Co. | 277,252 | 3,551,598 |
|
| Geo Group, Inc. (The) | 20,540 | 701,646 |
|
| Hatteras Financial Corp. | 28,630 | 466,669 |
|
| LaSalle Hotel Properties | 95,985 | 3,403,628 |
|
| LTC Properties, Inc. | 59,727 | 2,484,643 |
|
| Medical Properties Trust, Inc. | 262,473 | 3,441,021 |
|
| New Residential Investment Corp. | 24,845 | 378,638 |
|
| PS Business Parks, Inc. | 41,685 | 3,007,573 |
|
| RLJ Lodging Trust | 132,968 | 3,959,787 |
|
| Rouse Properties, Inc. | 11,908 | 194,696 |
|
| Ryman Hospitality Properties, Inc. | 64,753 | 3,439,032 |
|
| Summit Hotel Properties, Inc. | 183,478 | 2,387,049 |
|
| Sunstone Hotel Investors, Inc. | 236,315 | 3,547,088 |
|
| Universal Health Realty Income Trust | 4,686 | 217,712 |
|
| | | 32,883,469 |
|
| Real Estate Management and Development — 1.0% | | |
Marcus & Millichap, Inc.(1) | 61,607 | 2,842,547 |
|
| RE/MAX Holdings, Inc., Class A | 70,511 | 2,503,846 |
|
| | | 5,346,393 |
|
|
| | | | |
| | Shares | Value |
| Road and Rail — 1.2% | | |
| ArcBest Corp. | 91,890 | $ | 2,922,102 |
|
PAM Transportation Services, Inc.(1) | 2,501 | 145,183 |
|
Swift Transportation Co.(1) | 147,736 | 3,349,175 |
|
USA Truck, Inc.(1) | 3,168 | 67,257 |
|
| | | 6,483,717 |
|
| Semiconductors and Semiconductor Equipment — 5.3% | | |
Advanced Energy Industries, Inc.(1) | 95,499 | 2,625,268 |
|
Amkor Technology, Inc.(1) | 73,876 | 441,779 |
|
Cabot Microelectronics Corp.(1) | 36,101 | 1,700,718 |
|
Cirrus Logic, Inc.(1) | 98,638 | 3,356,651 |
|
Diodes, Inc.(1) | 107,331 | 2,587,750 |
|
Fairchild Semiconductor International, Inc.(1) | 192,250 | 3,341,305 |
|
MaxLinear, Inc., Class A(1) | 119,614 | 1,447,329 |
|
Microsemi Corp.(1) | 111,532 | 3,898,043 |
|
| MKS Instruments, Inc. | 49,857 | 1,891,575 |
|
OmniVision Technologies, Inc.(1) | 86,905 | 2,276,477 |
|
| Pericom Semiconductor Corp. | 17,821 | 234,346 |
|
Rambus, Inc.(1) | 111,584 | 1,616,852 |
|
Semtech Corp.(1) | 131,171 | 2,603,744 |
|
| Tessera Technologies, Inc. | 35,427 | 1,345,517 |
|
Ultra Clean Holdings, Inc.(1) | 37,275 | 232,223 |
|
Xcerra Corp.(1) | 27,836 | 210,719 |
|
| | | 29,810,296 |
|
| Software — 5.7% | | |
ACI Worldwide, Inc.(1) | 152,183 | 3,739,136 |
|
Aspen Technology, Inc.(1) | 16,625 | 757,269 |
|
BroadSoft, Inc.(1) | 3,203 | 110,728 |
|
Cadence Design Systems, Inc.(1) | 40,420 | 794,657 |
|
| Fair Isaac Corp. | 43,931 | 3,988,056 |
|
Glu Mobile, Inc.(1) | 427,518 | 2,654,887 |
|
| Mentor Graphics Corp. | 142,723 | 3,772,169 |
|
MicroStrategy, Inc., Class A(1) | 18,575 | 3,159,236 |
|
NetScout Systems, Inc.(1) | 78,382 | 2,874,268 |
|
| Pegasystems, Inc. | 121,293 | 2,776,397 |
|
Progress Software Corp.(1) | 3,276 | 90,090 |
|
PTC, Inc.(1) | 54,124 | 2,220,166 |
|
| QAD, Inc., Class A | 6,386 | 168,782 |
|
TiVo, Inc.(1) | 10,447 | 105,933 |
|
VASCO Data Security International, Inc.(1) | 94,715 | 2,859,446 |
|
Verint Systems, Inc.(1) | 27,019 | 1,641,269 |
|
| | | 31,712,489 |
|
| Specialty Retail — 2.8% | | |
| Buckle, Inc. (The) | 21,412 | 980,027 |
|
Build-A-Bear Workshop, Inc.(1) | 169,790 | 2,714,942 |
|
| Caleres, Inc. | 75,045 | 2,384,930 |
|
| Cato Corp. (The), Class A | 79,324 | 3,074,598 |
|
| Chico's FAS, Inc. | 123,206 | 2,048,916 |
|
| Children's Place, Inc. (The) | 1,820 | 119,046 |
|
Citi Trends, Inc.(1) | 28,916 | 699,767 |
|
| Kirkland's, Inc. | 13,146 | 366,379 |
|
|
| | | | |
| | Shares | Value |
| Outerwall, Inc. | 43,043 | $ | 3,276,003 |
|
Tilly's, Inc., Class A(1) | 22,329 | 215,922 |
|
| | | 15,880,530 |
|
| Technology Hardware, Storage and Peripherals — 0.6% | | |
Dot Hill Systems Corp.(1) | 56,311 | 344,623 |
|
QLogic Corp.(1) | 213,510 | 3,029,707 |
|
| | | 3,374,330 |
|
| Textiles, Apparel and Luxury Goods — 0.8% | | |
| Culp, Inc. | 24,807 | 769,017 |
|
Iconix Brand Group, Inc.(1) | 3,196 | 79,804 |
|
Perry Ellis International, Inc.(1) | 4,312 | 102,496 |
|
Vince Holding Corp.(1) | 69,462 | 832,155 |
|
| Wolverine World Wide, Inc. | 93,134 | 2,652,456 |
|
| | | 4,435,928 |
|
| Thrifts and Mortgage Finance — 0.9% | | |
Essent Group Ltd.(1) | 127,366 | 3,483,460 |
|
| EverBank Financial Corp. | 81,718 | 1,605,759 |
|
| | | 5,089,219 |
|
| Water Utilities — 0.2% | | |
| American States Water Co. | 28,149 | 1,052,491 |
|
| California Water Service Group | 4,696 | 107,304 |
|
| | | 1,159,795 |
|
| Wireless Telecommunication Services — 0.2% | | |
| Spok Holdings, Inc. | 56,316 | 948,361 |
|
TOTAL COMMON STOCKS (Cost $498,560,889) | | 552,279,522 |
|
| TEMPORARY CASH INVESTMENTS — 1.0% | | |
Repurchase Agreement, Bank of America Merrill Lynch, (collateralized by various U.S. Treasury obligations, 1.50%, 1/31/19 - 11/30/19, valued at $925,350), in a joint trading account at 0.10%, dated 6/30/15, due 7/1/15 (Delivery value $906,887) | | 906,884 |
|
| Repurchase Agreement, Fixed Income Clearing Corp., (collateralized by various U.S. Treasury obligations, 2.375%, 8/15/24, valued at $3,701,567), at 0.01%, dated 6/30/15, due 7/1/15 (Delivery value $3,628,001) | | 3,628,000 |
|
| State Street Institutional Liquid Reserves Fund, Premier Class | 901,926 | 901,926 |
|
TOTAL TEMPORARY CASH INVESTMENTS (Cost $5,436,810) | | 5,436,810 |
|
TOTAL INVESTMENT SECURITIES — 100.0% (Cost $503,997,699) | | 557,716,332 |
|
OTHER ASSETS AND LIABILITIES† | | 225,386 |
|
| TOTAL NET ASSETS — 100.0% | | $ | 557,941,718 |
|
|
|
| NOTES TO SCHEDULE OF INVESTMENTS |
| |
| † | Category is less than 0.05% of total net assets. |
See Notes to Financial Statements.
|
|
| Statement of Assets and Liabilities |
|
| | | |
| JUNE 30, 2015 |
| Assets |
| Investment securities, at value (cost of $503,997,699) | $ | 557,716,332 |
|
| Receivable for investments sold | 17,722,061 |
|
| Receivable for capital shares sold | 442,873 |
|
| Dividends and interest receivable | 522,550 |
|
| | 576,403,816 |
|
| | |
| Liabilities | |
| Payable for investments purchased | 17,823,659 |
|
| Payable for capital shares redeemed | 231,417 |
|
| Accrued management fees | 394,241 |
|
| Distribution and service fees payable | 12,781 |
|
| | 18,462,098 |
|
| | |
| Net Assets | $ | 557,941,718 |
|
| | |
| Net Assets Consist of: | |
| Capital (par value and paid-in surplus) | $ | 534,443,770 |
|
| Undistributed net investment income | 1,080,762 |
|
| Accumulated net realized loss | (31,301,447 | ) |
| Net unrealized appreciation | 53,718,633 |
|
| | $ | 557,941,718 |
|
|
| | | | | | |
| | Net Assets | Shares Outstanding | Net Asset Value Per Share |
| Investor Class, $0.01 Par Value |
| $464,591,585 |
| 33,955,874 |
| $13.68 |
| Institutional Class, $0.01 Par Value |
| $39,482,712 |
| 2,870,231 |
| $13.76 |
| A Class, $0.01 Par Value |
| $47,470,556 |
| 3,545,767 |
| $13.39* |
| C Class, $0.01 Par Value |
| $1,211,587 |
| 92,160 |
| $13.15 |
| R Class, $0.01 Par Value |
| $5,185,278 |
| 393,152 |
| $13.19 |
*Maximum offering price $14.21 (net asset value divided by 0.9425).
See Notes to Financial Statements.
|
| | | |
| YEAR ENDED JUNE 30, 2015 |
| Investment Income (Loss) |
| Income: | |
| Dividends (net of foreign taxes withheld of $6,601) | $ | 5,257,447 |
|
| Interest | 1,619 |
|
| | 5,259,066 |
|
| | |
| Expenses: | |
| Management fees | 3,969,635 |
|
| Distribution and service fees: | |
| A Class | 98,612 |
|
| C Class | 9,170 |
|
| R Class | 19,016 |
|
| Directors' fees and expenses | 22,638 |
|
| Other expenses | 2,514 |
|
| | 4,121,585 |
|
| | |
| Net investment income (loss) | 1,137,481 |
|
| | |
| Realized and Unrealized Gain (Loss) | |
| Net realized gain (loss) on: | |
| Investment transactions | 48,078,031 |
|
| Futures contract transactions | (2,190,097 | ) |
| | 45,887,934 |
|
| | |
| Change in net unrealized appreciation (depreciation) on investments | (23,392,818 | ) |
| | |
| Net realized and unrealized gain (loss) | 22,495,116 |
|
| | |
| Net Increase (Decrease) in Net Assets Resulting from Operations | $ | 23,632,597 |
|
See Notes to Financial Statements.
|
|
| Statement of Changes in Net Assets |
|
| | | | | | |
| YEARS ENDED JUNE 30, 2015 AND JUNE 30, 2014 |
| Increase (Decrease) in Net Assets | June 30, 2015 | June 30, 2014 |
| Operations | | |
| Net investment income (loss) | $ | 1,137,481 |
| $ | 700,341 |
|
| Net realized gain (loss) | 45,887,934 |
| 59,766,506 |
|
| Change in net unrealized appreciation (depreciation) | (23,392,818 | ) | 28,715,909 |
|
| Net increase (decrease) in net assets resulting from operations | 23,632,597 |
| 89,182,756 |
|
| | | |
| Distributions to Shareholders | | |
| From net investment income: | | |
| Investor Class | (250,135 | ) | (819,277 | ) |
| Institutional Class | (48,049 | ) | (223,632 | ) |
| A Class | (4,861 | ) | (9,668 | ) |
| Decrease in net assets from distributions | (303,045 | ) | (1,052,577 | ) |
| | | |
| Capital Share Transactions | | |
Net increase (decrease) in net assets from capital share transactions (Note 5) | 110,853,317 |
| 33,941,478 |
|
| | | |
| Net increase (decrease) in net assets | 134,182,869 |
| 122,071,657 |
|
| | | |
| Net Assets | | |
| Beginning of period | 423,758,849 |
| 301,687,192 |
|
| End of period | $ | 557,941,718 |
| $ | 423,758,849 |
|
| | | |
| Undistributed net investment income | $ | 1,080,762 |
| $ | 82,345 |
|
See Notes to Financial Statements.
|
|
| Notes to Financial Statements |
JUNE 30, 2015
1. Organization
American Century Quantitative Equity Funds, Inc. (the corporation) is registered under the Investment Company Act of 1940, as amended (the 1940 Act), as an open-end management investment company and is organized as a Maryland corporation. Small Company Fund (the fund) is one fund in a series issued by the corporation. The fund is diversified as defined under the 1940 Act. The fund’s investment objective is to seek long-term capital growth by investing primarily in common stocks of small companies.
The fund offers the Investor Class, the Institutional Class, the A Class, the C Class and the R Class. The A Class may incur an initial sales charge. The A Class and C Class may be subject to a contingent deferred sales charge. The share classes differ principally in their respective sales charges and distribution and shareholder servicing expenses and arrangements. The Institutional Class is made available to institutional shareholders or through financial intermediaries whose clients do not require the same level of shareholder and administrative services as shareholders of other classes. As a result, the Institutional Class is charged a lower unified management fee.
2. Significant Accounting Policies
The following is a summary of significant accounting policies consistently followed by the fund in preparation of its financial statements. The fund is an investment company and follows accounting and reporting guidance in accordance with accounting principles generally accepted in the United States of America. This may require management to make certain estimates and assumptions at the date of the financial statements. Actual results could differ from these estimates. Management evaluated the impact of events or transactions occurring through the date the financial statements were issued that would merit recognition or disclosure.
Investment Valuations — The fund determines the fair value of its investments and computes its net asset value per share at the close of regular trading (usually 4 p.m. Eastern time) on the New York Stock Exchange (NYSE) on each day the NYSE is open. The Board of Directors has adopted valuation policies and procedures to guide the investment advisor in the fund’s investment valuation process and to provide methodologies for the oversight of the fund’s pricing function.
Equity securities that are listed or traded on a domestic securities exchange are valued at the last reported sales price or at the official closing price as provided by the exchange. Equity securities traded on foreign securities exchanges are generally valued at the closing price of such securities on the exchange where primarily traded or at the close of the NYSE, if that is earlier. If no last sales price is reported, or if local convention or regulation so provides, the mean of the latest bid and asked prices may be used. Securities traded over-the-counter are valued at the mean of the latest bid and asked prices, the last sales price, or the official closing price.
Fixed income securities maturing within 60 days at the time of purchase may be valued at cost, plus or minus any amortized discount or premium or at the evaluated mean as provided by an independent pricing service. Evaluated mean prices are commonly derived through utilization of market models, which may consider, among other factors: trade data, quotations from dealers and active market makers, relevant yield curve and spread data, related sector levels, creditworthiness, trade data or market information on comparable securities, and other relevant security specific information.
Open-end management investment companies are valued at the reported net asset value per share. Repurchase agreements are valued at cost, which approximates fair value. Exchange-traded futures contracts are valued at the settlement price as provided by the appropriate clearing corporation.
If the fund determines that the market price for an investment is not readily available or the valuation methods mentioned above do not reflect an investment’s fair value, such investment is valued as determined in good faith by the Board of Directors or its delegate, in accordance with policies and procedures adopted by the Board of Directors. In its determination of fair value, the fund may review several factors including, but not limited to, market information regarding the specific investment or comparable investments and correlation with other investment types, futures indices or general market indicators. Circumstances that may cause the fund to use these procedures to value an investment include, but are not limited to: an investment has been
declared in default or is distressed; trading in a security has been suspended during the trading day or a security is not actively trading on its principal exchange; prices received from a regular pricing source are deemed unreliable; or there is a foreign market holiday and no trading occurred.
The fund monitors for significant events occurring after the close of an investment’s primary exchange but before the fund’s net asset value per share is determined. Significant events may include, but are not limited to: corporate announcements and transactions; governmental action and political unrest that could impact a specific investment or an investment sector; or armed conflicts, natural disasters and similar events that could affect investments in a specific country or region. The fund also monitors for significant fluctuations between domestic and foreign markets, as evidenced by the U.S. market or such other indicators that the Board of Directors, or its delegate, deems appropriate. If significant fluctuations in foreign markets are identified, the fund may apply a model-derived factor to the closing price of equity securities traded on foreign securities exchanges. The factor is based on observable market data as provided by an independent pricing service.
Security Transactions — Security transactions are accounted for as of the trade date. Net realized gains and losses are determined on the identified cost basis, which is also used for federal income tax purposes.
Investment Income — Dividend income less foreign taxes withheld, if any, is recorded as of the ex-dividend date. Distributions received on securities that represent a return of capital or long-term capital gain are recorded as a reduction of cost of investments and/or as a realized gain. The fund may estimate the components of distributions received that may be considered nontaxable distributions or long-term capital gain distributions for income tax purposes. Interest income is recorded on the accrual basis and includes accretion of discounts and amortization of premiums.
Repurchase Agreements — The fund may enter into repurchase agreements with institutions that American Century Investment Management, Inc. (ACIM) (the investment advisor) has determined are creditworthy pursuant to criteria adopted by the Board of Directors. The fund requires that the collateral, represented by securities, received in a repurchase transaction be transferred to the custodian in a manner sufficient to enable the fund to obtain those securities in the event of a default under the repurchase agreement. ACIM monitors, on a daily basis, the securities transferred to ensure the value, including accrued interest, of the securities under each repurchase agreement is equal to or greater than amounts owed to the fund under each repurchase agreement.
Joint Trading Account — Pursuant to an Exemptive Order issued by the Securities and Exchange Commission, the fund, along with certain other funds in the American Century Investments family of funds, may transfer uninvested cash balances into a joint trading account. These balances are invested in one or more repurchase agreements that are collateralized by U.S. Treasury or Agency obligations.
Segregated Assets — In accordance with the 1940 Act, the fund segregates assets on its books and records to cover futures contracts. ACIM monitors, on a daily basis, the securities segregated to ensure the fund designates a sufficient amount of liquid assets, marked-to-market daily. The fund may also receive assets or be required to pledge assets at the custodian bank or with a broker for margin requirements on futures contracts.
Income Tax Status — It is the fund’s policy to distribute substantially all net investment income and net realized gains to shareholders and to otherwise qualify as a regulated investment company under provisions of the Internal Revenue Code. Accordingly, no provision has been made for income taxes. The fund files U.S. federal, state, local and non-U.S. tax returns as applicable. The fund's tax returns are subject to examination by the relevant taxing authority until expiration of the applicable statute of limitations, which is generally three years from the date of filing but can be longer in certain jurisdictions. At this time, management believes there are no uncertain tax positions which, based on their technical merit, would not be sustained upon examination and for which it is reasonably possible that the total amounts of unrecognized tax benefits will significantly change in the next twelve months.
Multiple Class — All shares of the fund represent an equal pro rata interest in the net assets of the class to which such shares belong, and have identical voting, dividend, liquidation and other rights and the same terms and conditions, except for class specific expenses and exclusive rights to vote on matters affecting only individual classes. Income, non-class specific expenses, and realized and unrealized capital gains and losses of the fund are allocated to each class of shares based on their relative net assets.
Distributions to Shareholders — Distributions from net investment income, if any, are generally declared and paid quarterly. Distributions from net realized gains, if any, are generally declared and paid annually.
Indemnifications — Under the corporation’s organizational documents, its officers and directors are indemnified against certain liabilities arising out of the performance of their duties to the fund. In addition, in the normal course of business, the fund enters into contracts that provide general indemnifications. The maximum exposure under these arrangements is unknown as this would involve future claims that may be made against a fund. The risk of material loss from such claims is considered by management to be remote.
3. Fees and Transactions with Related Parties
Certain officers and directors of the corporation are also officers and/or directors of American Century Companies, Inc. (ACC). The corporation’s investment advisor, ACIM, the corporation's distributor, American Century Investment Services, Inc. (ACIS), and the corporation’s transfer agent, American Century Services, LLC, are wholly owned, directly or indirectly, by ACC. Various funds issued by American Century Asset Allocation Portfolios, Inc. and American Century Strategic Asset Allocations, Inc. own, in aggregate, 17% of the shares of the fund.
Management Fees — The corporation has entered into a management agreement with ACIM, under which ACIM provides the fund with investment advisory and management services in exchange for a single, unified management fee (the fee) per class. The agreement provides that all expenses of managing and operating the fund, except distribution and service fees, brokerage expenses, taxes, interest, fees and expenses of the independent directors (including legal counsel fees), and extraordinary expenses, will be paid by ACIM. The fee is computed and accrued daily based on each class's daily net assets and paid monthly in arrears. The fee consists of (1) an Investment Category Fee based on the daily net assets of the fund and certain other accounts managed by the investment advisor that are in the same broad investment category as the fund and (2) a Complex Fee based on the assets of all the funds in the American Century Investments family of funds. The rates for the Investment Category Fee range from 0.5380% to 0.7200%. The rates for the Complex Fee range from 0.2500% to 0.3100% for the Investor Class, A Class, C Class and R Class. The rates for the Complex Fee range from 0.0500% to 0.1100% for the Institutional Class. The effective annual management fee for each class for the year ended June 30, 2015 was 0.86% for the Investor Class, A Class, C Class and R Class and 0.66% for the Institutional Class.
Distribution and Service Fees — The Board of Directors has adopted a separate Master Distribution and Individual Shareholder Services Plan for each of the A Class, C Class and R Class (collectively the plans), pursuant to Rule 12b-1 of the 1940 Act. The plans provide that the A Class will pay ACIS an annual distribution and service fee of 0.25%. The plans provide that the C Class will pay ACIS an annual distribution and service fee of 1.00%, of which 0.25% is paid for individual shareholder services and 0.75% is paid for distribution services. The plans provide that the R Class will pay ACIS an annual distribution and service fee of 0.50%. The fees are computed and accrued daily based on each class’s daily net assets and paid monthly in arrears. The fees are used to pay financial intermediaries for distribution and individual shareholder services. Fees incurred under the plans during the year ended June 30, 2015 are detailed in the Statement of Operations.
Directors' Fees and Expenses — The Board of Directors is responsible for overseeing the investment advisor’s management and operations of the fund. The directors receive detailed information about the fund and its investment advisor regularly throughout the year, and meet at least quarterly with management of the investment advisor to review reports about fund operations. The fund’s officers do not receive compensation from the fund.
4. Investment Transactions
Purchases and sales of investment securities, excluding short-term investments, for the year ended June 30, 2015 were $569,915,324 and $462,533,258, respectively.
5. Capital Share Transactions
Transactions in shares of the fund were as follows:
|
| | | | | | | | | | |
| | Year ended
June 30, 2015 | Year ended June 30, 2014 |
| | Shares | Amount | Shares | Amount |
| Investor Class/Shares Authorized | 325,000,000 |
| | 175,000,000 |
| |
| Sold | 15,678,727 |
| $ | 205,580,851 |
| 9,832,062 |
| $ | 113,605,442 |
|
| Issued in reinvestment of distributions | 19,099 |
| 245,991 |
| 69,246 |
| 804,576 |
|
| Redeemed | (7,864,330 | ) | (102,910,372 | ) | (6,591,527 | ) | (79,024,918 | ) |
| | 7,833,496 |
| 102,916,470 |
| 3,309,781 |
| 35,385,100 |
|
| Institutional Class/Shares Authorized | 40,000,000 |
| | 50,000,000 |
| |
| Sold | 576,454 |
| 7,583,049 |
| 676,351 |
| 8,103,817 |
|
| Issued in reinvestment of distributions | 3,715 |
| 48,033 |
| 18,841 |
| 223,479 |
|
| Redeemed | (737,692 | ) | (9,752,126 | ) | (1,212,044 | ) | (14,876,569 | ) |
| | (157,523 | ) | (2,121,044 | ) | (516,852 | ) | (6,549,273 | ) |
| A Class/Shares Authorized | 40,000,000 |
| | 50,000,000 |
| |
| Sold | 1,574,696 |
| 20,445,446 |
| 1,179,236 |
| 13,737,241 |
|
| Issued in reinvestment of distributions | 377 |
| 4,766 |
| 876 |
| 9,624 |
|
| Redeemed | (1,023,276 | ) | (13,129,731 | ) | (831,330 | ) | (9,883,023 | ) |
| | 551,797 |
| 7,320,481 |
| 348,782 |
| 3,863,842 |
|
| C Class/Shares Authorized | 15,000,000 |
| | 10,000,000 |
| |
| Sold | 47,456 |
| 610,322 |
| 32,612 |
| 384,884 |
|
| Redeemed | (9,197 | ) | (116,366 | ) | (8,699 | ) | (101,795 | ) |
| | 38,259 |
| 493,956 |
| 23,913 |
| 283,089 |
|
| R Class/Shares Authorized | 20,000,000 |
| | 10,000,000 |
| |
| Sold | 289,212 |
| 3,666,922 |
| 151,181 |
| 1,777,695 |
|
| Redeemed | (112,449 | ) | (1,423,468 | ) | (69,691 | ) | (818,975 | ) |
| | 176,763 |
| 2,243,454 |
| 81,490 |
| 958,720 |
|
| Net increase (decrease) | 8,442,792 |
| $ | 110,853,317 |
| 3,247,114 |
| $ | 33,941,478 |
|
6. Fair Value Measurements
The fund’s investments valuation process is based on several considerations and may use multiple inputs to determine the fair value of the investments held by the fund. In conformity with accounting principles generally accepted in the United States of America, the inputs used to determine a valuation are classified into three broad levels.
| |
| • | Level 1 valuation inputs consist of unadjusted quoted prices in an active market for identical investments. |
| |
| • | Level 2 valuation inputs consist of direct or indirect observable market data (including quoted prices for comparable investments, evaluations of subsequent market events, interest rates, prepayment speeds, credit risk, etc.). These inputs also consist of quoted prices for identical investments initially expressed in local currencies that are adjusted through translation into U.S. dollars. |
| |
| • | Level 3 valuation inputs consist of unobservable data (including a fund’s own assumptions). |
The level classification is based on the lowest level input that is significant to the fair valuation measurement. The valuation inputs are not necessarily an indication of the risks associated with investing in these securities or other financial instruments. There were no significant transfers between levels during the period.
The following is a summary of the level classifications as of period end. The Schedule of Investments provides additional information on the fund’s portfolio holdings.
|
| | | | | | | | |
| | Level 1 | Level 2 | Level 3 |
| Assets | | | |
| Investment Securities | | | |
| Common Stocks | $ | 552,279,522 |
| — |
| — |
|
| Temporary Cash Investments | 901,926 |
| $ | 4,534,884 |
| — |
|
| | $ | 553,181,448 |
| $ | 4,534,884 |
| — |
|
7. Derivative Instruments
Equity Price Risk — The fund is subject to equity price risk in the normal course of pursuing its investment objectives. A fund may enter into futures contracts based on an equity index in order to manage its exposure to changes in market conditions. A fund may purchase futures contracts to gain exposure to increases in market value or sell futures contracts to protect against a decline in market value. Upon entering into a futures contract, a fund is required to deposit either cash or securities in an amount equal to a certain percentage of the contract value (initial margin). Subsequent payments (variation margin) are made or received daily, in cash, by a fund. The variation margin is equal to the daily change in the contract value and is recorded as unrealized gains and losses. A fund recognizes a realized gain or loss when the contract is closed or expires. Net realized and unrealized gains or losses occurring during the holding period of futures contracts are a component of net realized gain (loss) on futures contract transactions and change in net unrealized appreciation (depreciation) on futures contracts, respectively. One of the risks of entering into futures contracts is the possibility that the change in value of the contract may not correlate with the changes in value of the underlying securities. During the period, the fund infrequently purchased equity price risk derivative instruments for temporary investment purposes.
At period end, the fund did not have any derivative instruments disclosed on the Statement of Assets and Liabilities. For the year ended June 30, 2015, the effect of equity price risk derivative instruments on the Statement of Operations was $(2,190,097) in net realized gain (loss) on futures contract transactions.
8. Risk Factors
The fund’s investment process may result in high portfolio turnover, which could mean high transaction costs, affecting both performance and capital gains tax liabilities to investors.
The fund invests in common stocks of small companies. Because of this, the fund may be subject to greater risk and market fluctuations than a fund investing in larger, more established companies.
9. Federal Tax Information
The tax character of distributions paid during the years ended June 30, 2015 and June 30, 2014 were as follows:
|
| | | | | | |
| | 2015 | 2014 |
| Distributions Paid From | | |
| Ordinary income | $ | 303,045 |
| $ | 1,052,577 |
|
| Long-term capital gains | — |
| — |
|
The book-basis character of distributions made during the year from net investment income or net realized gains may differ from their ultimate characterization for federal income tax purposes. These differences reflect the differing character of certain income items and net realized gains and losses for financial statement and tax purposes, and may result in reclassification among certain capital accounts on the financial statements.
As of June 30, 2015, the federal tax cost of investments and the components of distributable earnings on a tax-basis were as follows:
|
| | | |
| Federal tax cost of investments | $ | 504,004,727 |
|
| Gross tax appreciation of investments | $ | 76,251,494 |
|
| Gross tax depreciation of investments | (22,539,889 | ) |
| Net tax appreciation (depreciation) of investments | $ | 53,711,605 |
|
| Undistributed ordinary income | $ | 1,183,551 |
|
| Accumulated short-term capital losses | $ | (31,397,208 | ) |
The difference between book-basis and tax-basis unrealized appreciation (depreciation) is attributable primarily to the tax deferral of losses on wash sales, the return of capital dividends received and the realization to ordinary income for tax purposes of unrealized gains on investments in passive foreign investment companies.
Accumulated capital losses represent net capital loss carryovers that may be used to offset future realized capital gains for federal income tax purposes. Future capital loss carryover utilization in any given year may be subject to Internal Revenue Code limitations. Capital loss carryovers expire in 2018.
|
| | | | | | | | | | | | | |
| For a Share Outstanding Throughout the Years Ended June 30 (except as noted) | | | |
| Per-Share Data | | | | | Ratios and Supplemental Data | |
| | | Income From Investment Operations: | | | | Ratio to Average Net Assets of: | | |
| | Net Asset Value, Beginning of Period | Net Investment Income (Loss)(1) | Net Realized and Unrealized Gain (Loss) | Total From Investment Operations | Distributions From Net Investment Income | Net Asset Value, End of Period | Total Return(2) | Operating Expenses | Net Investment Income (Loss) | Portfolio Turnover Rate | Net Assets, End of Period (in thousands) |
| Investor Class | | | | | | | | |
| 2015 | $13.10 | 0.03 | 0.56 | 0.59 | (0.01) | $13.68 | 4.51% | 0.87% | 0.25% | 100% |
| $464,592 |
|
| 2014 | $10.36 | 0.02 | 2.75 | 2.77 | (0.03) | $13.10 | 26.79% | 0.87% | 0.18% | 83% |
| $342,090 |
|
| 2013 | $8.24 | 0.08 | 2.12 | 2.20 | (0.08) | $10.36 | 26.92% | 0.88% | 0.92% | 93% |
| $236,280 |
|
| 2012 | $8.38 | 0.04 | (0.16) | (0.12) | (0.02) | $8.24 | (1.37)% | 0.89% | 0.45% | 72% |
| $188,519 |
|
| 2011 | $6.15 | 0.01 | 2.23 | 2.24 | (0.01) | $8.38 | 36.39% | 0.89% | 0.17% | 61% |
| $218,642 |
|
| Institutional Class | | | | | | | | |
| 2015 | $13.15 | 0.06 | 0.57 | 0.63 | (0.02) | $13.76 | 4.77% | 0.67% | 0.45% | 100% |
| $39,483 |
|
| 2014 | $10.41 | 0.05 | 2.76 | 2.81 | (0.07) | $13.15 | 27.02% | 0.67% | 0.38% | 83% |
| $39,805 |
|
| 2013 | $8.27 | 0.10 | 2.14 | 2.24 | (0.10) | $10.41 | 27.27% | 0.68% | 1.12% | 93% |
| $36,886 |
|
| 2012 | $8.42 | 0.05 | (0.15) | (0.10) | (0.05) | $8.27 | (1.20)% | 0.69% | 0.65% | 72% |
| $29,506 |
|
| 2011 | $6.19 | 0.03 | 2.22 | 2.25 | (0.02) | $8.42 | 36.43% | 0.69% | 0.37% | 61% |
| $42,541 |
|
| A Class | | | | | | | | | | |
| 2015 | $12.84 | —(3) | 0.55 | 0.55 | —(3) | $13.39 | 4.30% | 1.12% | 0.00%(4) | 100% |
| $47,471 |
|
| 2014 | $10.15 | (0.01) | 2.70 | 2.69 | —(3) | $12.84 | 26.54% | 1.12% | (0.07)% | 83% |
| $38,437 |
|
| 2013 | $8.08 | 0.06 | 2.07 | 2.13 | (0.06) | $10.15 | 26.58% | 1.13% | 0.67% | 93% |
| $26,862 |
|
| 2012 | $8.22 | 0.02 | (0.15) | (0.13) | (0.01) | $8.08 | (1.64)% | 1.14% | 0.20% | 72% |
| $25,944 |
|
| 2011 | $6.05 | (0.01) | 2.18 | 2.17 | — | $8.22 | 35.87% | 1.14% | (0.08)% | 61% |
| $33,452 |
|
|
| | | | | | | | | | | | | |
| For a Share Outstanding Throughout the Years Ended June 30 (except as noted) | | | |
| Per-Share Data | | | | | Ratios and Supplemental Data | |
| | | Income From Investment Operations: | | | | Ratio to Average Net Assets of: | | |
| | Net Asset Value, Beginning of Period | Net Investment Income (Loss)(1) | Net Realized and Unrealized Gain (Loss) | Total From Investment Operations | Distributions From Net Investment Income | Net Asset Value, End of Period | Total Return(2) | Operating Expenses | Net Investment Income (Loss) | Portfolio Turnover Rate | Net Assets, End of Period (in thousands) |
| C Class | | | | | | | | |
| 2015 | $12.70 | (0.09) | 0.54 | 0.45 | — | $13.15 | 3.54% | 1.87% | (0.75)% | 100% |
| $1,212 |
|
| 2014 | $10.12 | (0.10) | 2.68 | 2.58 | — | $12.70 | 25.49% | 1.87% | (0.82)% | 83% |
| $685 |
|
| 2013 | $8.08 | (0.03) | 2.10 | 2.07 | (0.03) | $10.12 | 25.68% | 1.88% | (0.08)% | 93% |
| $303 |
|
| 2012 | $8.27 | (0.04) | (0.15) | (0.19) | — | $8.08 | (2.30)% | 1.89% | (0.55)% | 72% |
| $77 |
|
| 2011 | $6.13 | (0.06) | 2.20 | 2.14 | — | $8.27 | 34.91% | 1.89% | (0.83)% | 61% |
| $74 |
|
| R Class | | | | | | | | | | | |
| 2015 | $12.68 | (0.03) | 0.54 | 0.51 | — | $13.19 | 4.02% | 1.37% | (0.25)% | 100% |
| $5,185 |
|
| 2014 | $10.05 | (0.04) | 2.67 | 2.63 | — | $12.68 | 26.17% | 1.37% | (0.32)% | 83% |
| $2,743 |
|
| 2013 | $8.00 | 0.04 | 2.06 | 2.10 | (0.05) | $10.05 | 26.33% | 1.38% | 0.42% | 93% |
| $1,356 |
|
| 2012 | $8.15 | —(3) | (0.15) | (0.15) | — | $8.00 | (1.84)% | 1.39% | (0.05)% | 72% |
| $930 |
|
| 2011 | $6.01 | (0.02) | 2.16 | 2.14 | — | $8.15 | 35.61% | 1.39% | (0.33)% | 61% |
| $945 |
|
|
|
| Notes to Financial Highlights |
| |
| (1) | Computed using average shares outstanding throughout the period. |
| |
| (2) | Total returns are calculated based on the net asset value of the last business day and do not reflect applicable sales charges, if any. Total returns for periods less than one year are not annualized. |
| |
| (3) | Per-share amount was less than $0.005. |
| |
| (4) | Ratio was less than 0.005%. |
See Notes to Financial Statements.
|
|
| Report of Independent Registered Public Accounting Firm |
To the Directors of the American Century Quantitative Equity Funds, Inc. and Shareholders of the Small Company Fund:
In our opinion, the accompanying statement of assets and liabilities, including the schedule of investments, and the related statements of operations and of changes in net assets and the financial highlights present fairly, in all material respects, the financial position of the Small Company Fund (one of the sixteen funds comprising the American Century Quantitative Equity Funds, Inc., hereafter referred to as the “Fund”) at June 30, 2015, the results of its operations for the year then ended, the changes in its net assets for each of the two years in the period then ended and the financial highlights for each of the five years in the period then ended, in conformity with accounting principles generally accepted in the United States of America. These financial statements and financial highlights (hereafter referred to as "financial statements") are the responsibility of the Fund's management. Our responsibility is to express an opinion on these financial statements based on our audits. We conducted our audits of these financial statements in accordance with the standards of the Public Company Accounting Oversight Board (United States). Those standards require that we plan and perform the audit to obtain reasonable assurance about whether the financial statements are free of material misstatement. An audit includes examining, on a test basis, evidence supporting the amounts and disclosures in the financial statements, assessing the accounting principles used and significant estimates made by management, and evaluating the overall financial statement presentation. We believe that our audits, which included confirmation of securities at June 30, 2015 by correspondence with the custodian and brokers, provide a reasonable basis for our opinion.
PricewaterhouseCoopers LLP
Kansas City, Missouri
August 21, 2015
Board of Directors
The individuals listed below serve as directors of the funds. Each director will continue to serve in this capacity until death, retirement, resignation or removal from office. The board has adopted a mandatory retirement age for directors who are not “interested persons,” as that term is defined in the Investment Company Act (independent directors). Independent directors shall retire on December 31 of the year in which they reach their 75th birthday; provided, however, that on or after January 1, 2022, independent directors shall retire on December 31 of the year in which they reach their 76th birthday.
Mr. Thomas is an “interested person” because he currently serves as President and Chief Executive Officer of American Century Companies, Inc. (ACC), the parent company of American Century Investment Management, Inc. (ACIM or the advisor). The other directors (more than three-fourths of the total number) are independent. They are not employees, directors or officers of, and have no financial interest in, ACC or any of its wholly owned, direct or indirect, subsidiaries, including ACIM, American Century Investment Services, Inc. (ACIS) and American Century Services, LLC (ACS), and they do not have any other affiliations, positions or relationships that would cause them to be considered “interested persons” under the Investment Company Act. The directors serve in this capacity for eight (in the case of Mr. Thomas, 15) registered investment companies in the American Century Investments family of funds.
The following table presents additional information about the directors. The mailing address for each director other than Mr. Thomas is 1665 Charleston Road, Mountain View, California 94043. The mailing address for Mr. Thomas is 4500 Main Street, Kansas City, Missouri 64111.
|
| | | | | |
Name (Year of Birth) | Position(s) Held with Funds | Length of Time Served | Principal Occupation(s) During Past 5 Years | Number of American Century Portfolios Overseen by Director | Other Directorships Held During Past 5 Years |
Independent Directors | | |
Tanya S. Beder
(1955) | Director | Since 2011 | Chairman and CEO, SBCC Group Inc. (independent advisory services) (2006 to present) | 46 | CYS Investments, Inc. (NYSE mortgage arbitrage REIT) |
Jeremy I. Bulow
(1954) | Director | Since 2011 | Professor of Economics, Stanford University, Graduate School of Business (1979 to present) | 46 | None |
Ronald J. Gilson
(1946) | Director and Chairman of the Board | Since 1995
(Chairman since 2005) | Charles J. Meyers Professor of Law and Business, Stanford Law School (1979 to present); Marc and Eva Stern Professor of Law and Business, Columbia University School of Law (1992 to present) | 46 | None |
Frederick L. A. Grauer
(1946) | Director | Since 2008 | Senior Advisor, BlackRock, Inc. (investment management firm) (2010 to 2011, 2013 to present) | 46 | None |
Peter F. Pervere
(1947) | Director | Since 2007 | Retired | 46 | None |
|
| | | | | |
Name (Year of Birth) | Position(s) Held with Funds | Length of Time Served | Principal Occupation(s) During Past 5 Years | Number of American Century Portfolios Overseen by Director | Other Directorships Held During Past 5 Years |
| Independent Directors | | |
John B. Shoven
(1947) | Director | Since 2002 | Professor of Economics, Stanford University (1973 to present) | 46 | Cadence Design Systems; Exponent; Financial Engines |
| Interested Director | | |
Jonathan S. Thomas
(1963) | Director and President | Since 2007 | President and Chief Executive Officer, ACC (March 2007 to present). Also serves as Chief Executive Officer, ACS; Executive Vice President, ACIM; Director, ACC, ACIM and other ACC subsidiaries | 124 | BioMed Valley Discoveries, Inc. |
The Statement of Additional Information has additional information about the fund's directors and is available without charge, upon request, by calling 1-800-345-2021.
Officers
The following table presents certain information about the executive officers of the funds. Each officer serves as an officer for each of the 15 investment companies in the American Century family of funds, unless otherwise noted. No officer is compensated for his or her service as an officer of the funds. The listed officers are interested persons of the funds and are appointed or re-appointed on an annual basis. The mailing address for each of the officers listed below is 4500 Main Street, Kansas City, Missouri 64111.
|
| | |
Name (Year of Birth) | Offices with
the Funds | Principal Occupation(s) During the Past Five Years |
Jonathan S.
Thomas
(1963) | Director and President
since 2007 | President and Chief Executive Officer, ACC (March 2007 to present). Also serves as Chief Executive Officer, ACS; Executive Vice President, ACIM; Director, ACC, ACIM and other ACC subsidiaries |
Amy D. Shelton
(1964) | Chief Compliance Officer and Vice President since 2014 | Chief Compliance Officer, American Century funds, (March 2014 to present); Chief Compliance Officer, ACIM (February 2014 to present); Chief Compliance Officer, ACIS (October 2009 to present); Vice President, Client Interactions and Marketing, ACIS (February 2013 to January 2014); Director, Client Interactions and Marketing, ACIS (June 2007 to January 2013). Also serves as Vice President, ACIS |
Charles A. Etherington
(1957) | General Counsel since 2007 and Senior Vice President since 2006 | Attorney, ACC (February 1994 to present); Vice President, ACC (November 2005 to present); General Counsel, ACC (March 2007 to present). Also serves as General Counsel, ACIM, ACS, ACIS and other ACC subsidiaries; and Senior Vice President, ACIM and ACS |
C. Jean Wade
(1964) | Vice President, Treasurer and
Chief Financial Officer since 2012 | Vice President, ACS (February 2000 to present) |
Robert J. Leach
(1966) | Vice President since 2006 and
Assistant Treasurer since 2012 | Vice President, ACS (February 2000 to present) |
David H. Reinmiller
(1963) | Vice President since 2001 | Attorney, ACC (January 1994 to present); Associate General Counsel, ACC (January 2001 to present). Also serves as Vice President, ACIM and ACS |
Ward D. Stauffer
(1960) | Secretary since 2005 | Attorney, ACC (June 2003 to present) |
|
|
| Approval of Management Agreement |
At a meeting held on June 16, 2015, the Fund’s Board of Directors unanimously approved the renewal of the management agreement pursuant to which American Century Investment Management, Inc. (the “Advisor”) acts as the investment advisor for the Fund. Under Section 15(c) of the Investment Company Act, contracts for investment advisory services are required to be reviewed, evaluated, and approved by a majority of a fund’s directors/trustees, including a majority of the independent Directors, each year. The Board regards this annual evaluation and renewal as one of its most important responsibilities.
The independent Directors have memorialized a statement regarding the relationship between their ongoing obligations to oversee and evaluate the performance of the Advisor and their annual consideration of renewal of the management agreement. In that statement, the independent Directors noted that their assessment of the Advisor’s performance is an ongoing process that takes place over the entire year and is informed by all of the extensive information that the Board and its committees receive and consider over time. This information, together with the materials provided in connection with the review, are central to the Board’s assessment of the Advisor’s performance and its determination whether to renew the Fund’s management agreement.
Prior to its consideration of the renewal of the management agreement, the Board requested and reviewed extensive data and analysis relating to the proposed renewal. This information and analysis was compiled by the Advisor and certain independent providers of evaluation data concerning the Fund and the services provided to the Fund by the Advisor.
In connection with its consideration of the renewal of the management agreement, the Board’s review and evaluation of the services provided by the Advisor included, but was not limited to, the following:
| |
| • | the nature, extent, and quality of investment management, shareholder services, and other services provided by the Advisor to the Fund; |
| |
| • | the wide range of other programs and services the Advisor provides to the Fund and its shareholders on a routine and non-routine basis; |
| |
| • | the investment performance of the Fund, including data comparing the Fund’s performance to appropriate benchmarks and/or a peer group of other mutual funds with similar investment objectives and strategies; |
| |
| • | the cost of owning the Fund compared to the cost of owning similar funds; |
| |
| • | the Advisor’s compliance policies, procedures, and regulatory experience; |
| |
| • | financial data showing the cost of services provided to the Fund, the profitability of the Fund to the Advisor, and the overall profitability of the Advisor; |
| |
| • | possible economies of scale associated with the Advisor’s management of the Fund and other accounts under its management; |
| |
| • | data comparing services provided and charges to other investment management clients of the Advisor; |
| |
| • | acquired fund fees and expenses; |
| |
| • | payments by the Fund and the Advisor to financial intermediaries whose clients are investors in the Fund; and |
| |
| • | any collateral benefits derived by the Advisor from the management of the Fund. |
In keeping with its practice, the Board held two in-person meetings to review and discuss the information provided in response to their request. The independent Directors also had the benefit of the advice of their independent counsel throughout the process.
Factors Considered
The Directors considered all of the information provided by the Advisor, the independent data providers, and the independent Directors’ independent counsel in connection with the review, and evaluated such information for the Fund. In connection with their review, the Directors did not identify any single factor as being all-important or controlling and each Director may have attributed different levels of importance to different factors. In deciding to renew the management agreement, the Board based its decision on a number of factors, including the following:
Nature, Extent and Quality of Services - Generally. Under the management agreement, the Advisor is responsible for providing or arranging for all services necessary for the operation of the Fund. The Board noted that under the management agreement, the Advisor provides or arranges at its own expense a wide variety of services including:
| |
| • | constructing and designing the Fund |
| |
| • | portfolio research and security selection |
| |
| • | initial capitalization/funding |
| |
| • | daily valuation of the Fund’s portfolio |
| |
| • | shareholder servicing and transfer agency, including shareholder confirmations, recordkeeping, and communications |
| |
| • | legal services (except the independent Directors’ counsel) |
| |
| • | regulatory and portfolio compliance |
| |
| • | marketing and distribution (except amounts paid by the Fund under Rule 12b-1 plans) |
The Board noted that many of these services have expanded over time both in terms of quantity and complexity in response to shareholder demands, competition in the industry, changing distribution channels, and the changing regulatory environment.
Investment Management, Shareholder, and Other Services. The nature of the investment management services provided to the Fund is quite complex and allows Fund shareholders access to professional money management, instant diversification of their investments within an asset class, the opportunity to easily diversify among asset classes by investing in or exchanging among various American Century Investments funds, and liquidity. In evaluating investment performance, the Board expects the Advisor to manage the Fund in accordance with its investment objectives and approved strategies. Further, the Directors recognize that the Advisor has an obligation to seek the best execution of fund trades. In providing these services, the Advisor utilizes teams of investment professionals (portfolio managers, analysts, research assistants, and securities traders) who require extensive information technology, research, training, compliance, and other systems to conduct their business. The Board, directly and through its Portfolio Committee, regularly reviews investment performance information for the Fund, together with comparative information for appropriate benchmarks and/or peer groups of similarly-managed funds, over different time horizons. The Directors also review detailed performance information during the management agreement approval process. If performance concerns are identified, the Fund receives special reviews until performance improves, during which the Board discusses with the Advisor the reasons for such results (e.g., market conditions, security selection) and any efforts being undertaken to improve performance. The Fund’s performance was above its benchmark for the one-, three-, and five-year periods and below its benchmark for the ten-year period reviewed by the Board. The Board found the investment management services provided by the Advisor to the Fund to be satisfactory and consistent with the management agreement.
Under the management agreement, the Advisor provides the Fund with a comprehensive package of transfer agency, shareholder, and other services. The Board, directly and through various committees of the Board, regularly reviews reports and evaluations of such services at its regular
meetings. These reports include, but are not limited to, information regarding the operational efficiency and accuracy of the shareholder and transfer agency services provided, staffing levels, shareholder satisfaction (as measured by external as well as internal sources), technology support, new products and services offered to Fund shareholders, securities trading activities, portfolio valuation services, auditing services, and legal and operational compliance activities.
Certain aspects of shareholder and transfer agency service level efficiency and the quality of securities trading activities are measured by independent third party providers and are presented in comparison to other fund groups not managed by the Advisor. The Board found the services provided by the Advisor to the Fund under the management agreement to be competitive and of high quality.
Costs of Services and Profitability. The Advisor provides detailed information concerning its cost of providing various services to the Fund, its profitability in managing the Fund, its overall profitability, and its financial condition. The Directors have reviewed with the Advisor the methodology used to prepare this financial information. This information is considered in evaluating the Advisor’s financial condition, its ability to continue to provide services under the management agreement, and the reasonableness of the current management fee. The Board concluded that the Advisor’s profits were reasonable in light of the services provided to the Fund.
Ethics. The Board generally considers the Advisor’s commitment to providing quality services to shareholders and to conducting its business ethically. They noted that the Advisor’s practices generally meet or exceed industry best practices.
Economies of Scale. The Board also reviewed information provided by the Advisor regarding the possible existence of economies of scale in connection with the management of the Fund. The Board concluded that economies of scale are difficult to measure and predict with precision, especially on a fund-by-fund basis. The Board concluded that the Advisor is appropriately sharing economies of scale through its competitive fee structure, offering competitive fees from fund inception, and through reinvestment in its business to provide shareholders enhanced and expanded services.
Comparison to Other Funds’ Fees. The management agreement provides that the Fund pays the Advisor a single, all-inclusive (or unified) management fee for providing all services necessary for the management and operation of the Fund, other than brokerage expenses, taxes, interest, extraordinary expenses, the fees and expenses of the Fund’s independent Directors (including their independent legal counsel), and expenses incurred in connection with the provision of shareholder services and distribution services under a plan adopted pursuant to Rule 12b-1 under the 1940 Act. Under the unified fee structure, the Advisor is responsible for providing all investment advisory, custody, audit, administrative, compliance, recordkeeping, marketing, and shareholder services, or arranging and supervising third parties to provide such services. By contrast, most other funds are charged a variety of fees, including an investment advisory fee, a transfer agency fee, an administrative fee, distribution charges, and other expenses. Other than their investment advisory fees and any applicable Rule 12b-1 fees, all other components of the total fees charged by these other funds may be increased without shareholder approval. The Board believes the unified fee structure is a benefit to Fund shareholders because it clearly discloses to shareholders the cost of owning Fund shares, and, since the unified fee cannot be increased without a vote of Fund shareholders, it shifts to the Advisor the risk of increased costs of operating the Fund and provides a direct incentive to minimize administrative inefficiencies. Part of the Board’s analysis of fee levels involves reviewing certain evaluative data compiled by an independent provider and comparing the Fund’s unified fee to the total expense ratio of peer funds. The unified fee charged to shareholders of the Fund was below the median of the total expense ratios of the Fund’s peer group. The Board concluded that the management fee paid by the Fund to the Advisor under the management agreement is reasonable in light of the services provided to the Fund.
Comparison to Fees and Services Provided to Other Clients of the Advisor. The Board also requested and received information from the Advisor concerning the nature of the services, fees, costs, and profitability of its advisory services to advisory clients other than the Fund. They observed that these varying types of client accounts require different services and involve different regulatory and entrepreneurial risks than the management of the Fund. The Board analyzed this information and concluded that the fees charged and services provided to the Fund were reasonable by comparison.
Payments to Intermediaries. The Directors also requested and received a description of payments made to intermediaries by the Fund and the Advisor. These payments include various payments made by the Fund or the Advisor to different types of intermediaries and recordkeepers for distribution and service activities provided for the Fund.
Collateral or “Fall-Out” Benefits Derived by the Advisor. The Board considered the existence of collateral benefits the Advisor may receive as a result of its relationship with the Fund. The Board noted that the Advisor’s primary business is managing mutual funds and it generally does not use fund or shareholder information to generate profits in other lines of business, and therefore does not derive any significant collateral benefits from them. The Board noted that the Advisor receives proprietary research from broker-dealers that execute fund portfolio transactions. The Board also determined that the Advisor is able to provide investment management services to certain clients other than the Fund, at least in part, due to its existing infrastructure built to serve the fund complex.
Existing Relationship. The Board also considered whether there was any reason for not continuing the existing arrangement with the Advisor. In this regard, the Board was mindful of the potential disruptions of the Fund’s operations and various risks, uncertainties, and other effects that could occur as a result of a decision not to continue such relationship. In particular, the Board recognized that most shareholders have invested in the Fund on the strength of the Advisor’s industry standing and reputation and in the expectation that the Advisor will have a continuing role in providing advisory services to the Fund.
Conclusion of the Directors. As a result of this process, the Board, including all of the independent Directors and assisted by the advice of independent legal counsel, taking into account all of the factors discussed above and the information provided by the Advisor and others in connection with its review and throughout the year, concluded that the management agreement between the Fund and the Advisor is fair and reasonable in light of the services provided and should be renewed.
Retirement Account Information
As required by law, distributions you receive from certain IRAs are subject to federal income tax withholding, unless you elect not to have withholding apply. Tax will be withheld on the total amount withdrawn even though you may be receiving amounts that are not subject to withholding, such as nondeductible contributions. In such case, excess amounts of withholding could occur. You may adjust your withholding election so that a greater or lesser amount will be withheld.
If you don’t want us to withhold on this amount, you must notify us to not withhold the federal income tax. You may notify us in writing or in certain situations by telephone or through other electronic means. For systematic withdrawals, your withholding election will remain in effect until revoked or changed by filing a new election. You have the right to revoke your election at any time.
Remember, even if you elect not to have income tax withheld, you are liable for paying income tax on the taxable portion of your withdrawal. If you elect not to have income tax withheld or you don’t have enough income tax withheld, you may be responsible for payment of estimated tax. You may incur penalties under the estimated tax rules if your withholding and estimated tax payments are not sufficient. You can reduce or defer the income tax on a distribution by directly or indirectly rolling such distribution over to another IRA or eligible plan. You should consult your tax advisor for additional information.
State tax will be withheld if, at the time of your distribution, your address is within one of the mandatory withholding states and you have federal income tax withheld (or as otherwise required by state law). State taxes will be withheld from your distribution in accordance with the respective state rules.
Distributions you receive from 403(b), 457 and qualified plans are subject to special tax and withholding rules. Your plan administrator or plan sponsor is required to provide you with a special tax notice explaining those rules at the time you request a distribution. If applicable, federal and/or state taxes may be withheld from your distribution amount.
Proxy Voting Policies
Descriptions of the principles and policies that the fund's investment advisor uses in exercising the voting rights associated with the securities purchased and/or held by the fund are available without charge, upon request, by calling 1-800-345-2021 or visiting the "About Us" page of American Century Investments’ website at americancentury.com. A description of the policies is also available on the Securities and Exchange Commission’s website at sec.gov. Information regarding how the investment advisor voted proxies relating to portfolio securities during the most recent 12-month period ended June 30 is available on the "About Us" page at americancentury.com. It is also available at sec.gov.
Quarterly Portfolio Disclosure
The fund files its complete schedule of portfolio holdings with the Securities and Exchange Commission (SEC) for the first and third quarters of each fiscal year on Form N-Q. The fund’s Forms N-Q are available on the SEC’s website at sec.gov, and may be reviewed and copied at the SEC’s Public Reference Room in Washington, DC. Information on the operation of the Public Reference Room may be obtained by calling 1-800-SEC-0330. The fund also makes its complete schedule of portfolio holdings for the most recent quarter of its fiscal year available on its website at americancentury.com and, upon request, by calling 1-800-345-2021.
Other Tax Information
The following information is provided pursuant to provisions of the Internal Revenue Code.
The fund hereby designates up to the maximum amount allowable as qualified dividend income for the fiscal year ended June 30, 2015.
For corporate taxpayers, the fund hereby designates $303,045, or up to the maximum amount allowable, of ordinary income distributions paid during the fiscal year ended June 30, 2015 as qualified for the corporate dividends received deduction.
|
| | |
| |
| | | |
| Contact Us | americancentury.com | |
| Automated Information Line | 1-800-345-8765 | |
| Investor Services Representative | 1-800-345-2021
or 816-531-5575 | |
| Investors Using Advisors | 1-800-378-9878 | |
Business, Not-For-Profit, Employer-Sponsored
Retirement Plans | 1-800-345-3533 | |
Banks and Trust Companies, Broker-Dealers,
Financial Professionals, Insurance Companies | 1-800-345-6488 | |
| Telecommunications Relay Service for the Deaf | 711 | |
| | | |
| American Century Quantitative Equity Funds, Inc. | |
| | | |
Investment Advisor: American Century Investment Management, Inc. Kansas City, Missouri | |
| | | |
| This report and the statements it contains are submitted for the general information of our shareholders. The report is not authorized for distribution to prospective investors unless preceded or accompanied by an effective prospectus. | |
| | | |
©2015 American Century Proprietary Holdings, Inc. All rights reserved.
CL-ANN-86507 1508 | |
|
| |
| ANNUAL REPORT | JUNE 30, 2015 |
Strategic Inflation Opportunities Fund
|
| | |
| President's Letter | 2 |
|
| Performance | 3 |
|
| Portfolio Commentary | |
|
| Fund Characteristics | |
|
| Shareholder Fee Example | |
|
| Schedule of Investments | |
|
| Statement of Assets and Liabilities | |
|
| Statement of Operations | |
|
| Statement of Changes in Net Assets | |
|
| Notes to Financial Statements | |
|
| Financial Highlights | |
|
| Report of Independent Registered Public Accounting Firm | |
|
| Management | |
|
| Approval of Management Agreement | |
|
| Additional Information | |
|
Any opinions expressed in this report reflect those of the author as of the date of the report, and do not necessarily represent the opinions of American Century Investments® or any other person in the American Century Investments organization. Any such opinions are subject to change at any time based upon market or other conditions and American Century Investments disclaims any responsibility to update such opinions. These opinions may not be relied upon as investment advice and, because investment decisions made by American Century Investments funds are based on numerous factors, may not be relied upon as an indication of trading intent on behalf of any American Century Investments fund. Security examples are used for representational purposes only and are not intended as recommendations to purchase or sell securities. Performance information for comparative indices and securities is provided to American Century Investments by third party vendors. To the best of American Century Investments’ knowledge, such information is accurate at the time of printing.
|
| |
| Dear Investor:
Thank you for reviewing this annual report for the 12 months ended June 30, 2015. It provides investment performance and portfolio information for the reporting period, plus longer-term historical performance data.
Annual reports remain important vehicles for conveying information about fund returns, including market and economic factors that affected performance during the reporting period. For additional, updated investment and market insights, we encourage you to visit our website, americancentury.com. |
| Jonathan Thomas |
Global Divergence Favored U.S. Assets
“Global divergence” between the U.S. and the rest of the world emerged as a prevalent theme during the reporting period. This theme embraced not only the relatively stronger economic growth enjoyed by the U.S. compared with most of the world, but also the related contrast between the U.S. Federal Reserve’s unwinding of monetary stimulus compared with the continuation and expansion of stimulus by other major central banks. Low inflation also prevailed, after crude oil prices plunged over 40% amid muted demand for commodities in general. In this environment, the U.S. dollar, U.S. growth stocks, and longer-maturity U.S. Treasuries generally benefited from “flight to quality” capital flows, reinforced by geopolitical and financial turmoil, particularly in Greece, Russia/Ukraine, China, and the Middle East.
Strong global capital flows into U.S. assets generated a global divergence between investment returns for U.S. and non-U.S. markets, especially for U.S. investors who realized their returns in dollar terms. For the reporting period, the U.S. Dollar Index, the S&P 500 Index, and the Barclays U.S. Aggregate Bond Index returned 19.74%, 7.42%, and 1.86%, respectively. By contrast, the MSCI EAFE Index, the MSCI Emerging Markets Index, and the Barclays Global Aggregate Bond ex-USD (Unhedged) Index returned -4.22%, -5.12%, and -13.19%, respectively, for U.S. investors unhedged for the strong dollar’s impact on non-dollar-denominated returns.
We expect more monetary policy divergence between the U.S. and other major developed economies in the coming months, accompanied by continued market volatility. This could present both challenges and opportunities for active investment managers. Upward pressures on inflation and interest rates could develop as the massive amount of global monetary stimulus in progress takes hold and economies improve. In this environment, we continue to believe in a disciplined, diversified, long-term investment approach, using professionally managed stock and bond portfolios to meet financial goals. We appreciate your continued trust in us.
Sincerely,
Jonathan Thomas
President and Chief Executive Officer
American Century Investments
|
| | | | | |
| Total Returns as of June 30, 2015 |
| | | | Average Annual Returns | |
| | Ticker Symbol | 1 year | 5 years | Since Inception | Inception Date |
| Investor Class | ASIOX | -8.35%(1) | 0.61%(1) | -0.22%(1) | 4/30/10 |
| Barclays U.S. 1-3 Month Treasury Bill Index | — | 0.01% | 0.06% | 0.06% | — |
| Institutional Class | ASINX | -8.15%(1) | 0.82%(1) | -0.02%(1) | 4/30/10 |
| A Class | ASIDX | | | | 4/30/10 |
| No sales charge* | | -8.59%(1) | 0.37%(1) | -0.47%(1) | |
| With sales charge* | | -13.86%(1) | -0.80%(1) | -1.61%(1) | |
| C Class | ASIZX | -9.29%(1) | -0.40%(1) | -1.23%(1) | 4/30/10 |
| R Class | ASIUX | -8.88%(1) | 0.10%(1) | -0.73%(1) | 4/30/10 |
| |
| * | Sales charges include initial sales charges and contingent deferred sales charges (CDSCs), as applicable. A Class shares have a 5.75% maximum initial sales charge and may be subject to a maximum CDSC of 1.00%. C Class shares redeemed within 12 months of purchase are subject to a maximum CDSC of 1.00%. The SEC requires that mutual funds provide performance information net of maximum sales charges in all cases where charges could be applied. |
| |
| (1) | Returns would have been lower if a portion of the management fee had not been waived. |
Data presented reflect past performance. Past performance is no guarantee of future results. Current performance may be higher or lower than the performance shown. Investment return and principal value will fluctuate, and redemption value may be more or less than original cost. Data assumes reinvestment of dividends and capital gains, and none of the charts reflect the deduction of taxes that a shareholder would pay on fund distributions or the redemption of fund shares. To obtain performance data current to the most recent month end, please call 1-800-345-2021 or visit americancentury.com. For additional information about the fund, please consult the prospectus.
|
|
| Growth of $10,000 Over Life of Class |
| $10,000 investment made April 30, 2010 |
| Performance for other share classes will vary due to differences in fee structure. |
|
| |
| Value on June 30, 2015 |
| | Investor Class — $9,887** |
| |
| | Barclays U.S. 1-3 Month Treasury Bill Index — $10,033 |
| |
* From April 30, 2010, the Investor Class’s inception date. Not annualized.
**Ending value would have been lower if a portion of the management fee had not been waived.
|
| | | | |
| Total Annual Fund Operating Expenses |
| Investor Class | Institutional Class | A Class | C Class | R Class |
| 1.15% | 0.95% | 1.40% | 2.15% | 1.65% |
The total annual fund operating expenses shown is as stated in the fund’s prospectus current as of the date of this report. The prospectus may vary from the expense ratio shown elsewhere in this report because it is based on a different time period, includes acquired fund fees and expenses, and, if applicable, does not include fee waivers or expense reimbursements.
Data presented reflect past performance. Past performance is no guarantee of future results. Current performance may be higher or lower than the performance shown. Investment return and principal value will fluctuate, and redemption value may be more or less than original cost. Data assumes reinvestment of dividends and capital gains, and none of the charts reflect the deduction of taxes that a shareholder would pay on fund distributions or the redemption of fund shares. To obtain performance data current to the most recent month end, please call 1-800-345-2021 or visit americancentury.com. For additional information about the fund, please consult the prospectus.
Portfolio Managers: Bob Gahagan, Bill Martin, Brian Howell, John Lovito, and Steven Brown
Performance Summary
For the 12 months ended June 30, 2015, Strategic Inflation Opportunities declined -8.35%.* The fund’s benchmark, the Barclays U.S. 1-3 Month Treasury Bill Index, advanced 0.01%. Fund returns reflect operating expenses, while index returns do not.
Global economic growth and inflation generally remained lackluster despite ongoing central bank stimulus programs. Against this backdrop, most investments that typically provide investor protection against the primary sources of inflation, including Treasury inflation-protected securities (TIPS), commodity-related investments, and foreign currencies, declined during the 12-month period and accounted for the fund’s underperformance relative to its Treasury bill benchmark. Real estate investment trusts (REITs) advanced slightly during the 12-month period, as declining interest rates supported the rate-sensitive securities. A variety of factors—including global divergence of central bank policy and economic growth, a sharp sell-off in global oil markets, and a rallying U.S. dollar—influenced performance in each asset class.
Inflation Benign on Weak Growth, Falling Commodity Prices
Subdued global growth and weakness in the commodities markets helped stifle inflation throughout the 12-month period, even as leading central banks pursued aggressive and unprecedented stimulus programs. In the U.S., the annual headline inflation rate was 0.1% at the end of June 2015. Similarly, inflation rates for other leading economies were at or slightly higher than 0% at the end of the 12-month period and well below central bank target levels.
Growth in the world’s major developed economies generally remained unsynchronized, with the U.S. and U.K. maintaining modest growth rates, and Europe and Japan barely expanding. Uneven economic growth led to divergence in central bank policy, with the Federal Reserve (the Fed) and the Bank of England the only major central banks contemplating rate increases, while the European Central Bank (ECB) and the Bank of Japan engaged in aggressive quantitative easing (QE) and other stimulus programs. The growing disparity in economic growth rates and central bank policies drove the U.S. dollar’s value higher. The greenback rallied sharply versus other leading currencies, which put further downward pressure on commodity and gold prices.
Commodity prices, a key inflation trigger, declined -36.81% during the period, according to the S&P Goldman Sachs Commodities Index, a measure of global commodities prices. Energy prices were a main driver of the decline, as Brent oil and West Texas Intermediate crude prices plunged -46.10% and -43.58%, respectively, on mounting supply/demand imbalances. Industrial and precious metals also declined during the period. The conclusion of the Fed’s QE program in October 2014, subdued inflation, and a stronger U.S. dollar pressured gold prices (gold is priced in dollars, so a stronger dollar makes it less attractive for foreign buyers).
* All fund returns referenced in this commentary are for Investor Class shares. Returns would have been lower if a portion of the management fee had not been waived. Performance for other share classes will vary due to differences in fee structures; when Investor Class performance exceeds that of the fund’s benchmark, other share classes may not. See page 3 for returns for all share classes.
Portfolio Positioning & Strategy
The portfolio’s neutral asset mix as of June 30, 2015, was 45% inflation-linked bonds and other fixed-income securities, 25% non-dollar currency investments, 15% commodity-related investments, 10% global REITs, and 5% gold securities that track the price of gold bullion, including gold exchange-traded funds (ETFs). The portfolio’s actual asset weightings varied based on short-term tactical adjustments and fluctuating securities prices. We make modest tactical adjustments to the portfolio’s asset mix in an effort to add value and improve the fund’s ability to meet its investment objective.
Within the portfolio’s inflation-linked securities allocation, where we had a neutral 45% allocation as of June 30, 2015, TIPS declined on weak current inflation readings and declining longer-term inflation expectations. In addition, we favored shorter-duration (less price sensitivity to interest rate changes) TIPS, which underperformed longer-duration TIPS as interest rates declined and the U.S. Treasury yield curve flattened during the period. This allocation also included mortgage-backed securities (MBS) and investment-grade and high-yield corporate bonds in conjunction with inflation “swaps” (effectively creating an “inflation overlay” for the corporate and mortgage securities), which generally outperformed TIPS.
Within the commodities component, also neutral at a 15% weighting on June 30, 2015, the portfolio was invested in common stocks, commodity ETFs, and gold-related securities (such as holdings in mining companies). This exposure weighed on overall performance, primarily due to our preference for securities in the energy sector, which tumbled on plunging oil prices. Exposure to industrial and precious metals, including gold securities, also detracted from performance as these prices declined.
We maintained an underweight allocation of 20%, compared with the portfolio’s target weighting of 25%, in non-dollar currencies. We underweighted the euro and yen, given our expectations for continued strength in the U.S. dollar stemming from ongoing QE in Europe and Japan and a likely rate hike from the Fed. This positioning improved the performance of the currency allocation, as the dollar advanced sharply against the euro, yen, and most major currencies. Among emerging markets, the team favored currencies from Asian countries exhibiting stronger growth over countries with weaker economies and volatile political climates.
Within the REIT allocation, we maintained an overweight position of 15% versus our target allocation of 10%, which, along with security selection, contributed favorably to portfolio performance. REITs generally benefited from the declining interest rate environment. But, performance plunged late in the period on fears of rising interest rates, erasing some but not all of the earlier gains. In the U.S., many of the leading contributors were office and apartment owners based on the West Coast that benefited from the strong economic environment in the region. In Europe, U.K. property stocks benefited from continued rental growth in the improving economic environment. Elsewhere on the European continent, the ECB’s QE program helped support property values, but we remained selective in this region.
Outlook
We believe weak oil prices and subpar global growth will keep global inflation relatively low and contained in the near term. In the U.S., we believe headline inflation likely has bottomed and should remain relatively low and contained in the near term. But U.S. economic growth appears to be improving, and at some point, we expect the cumulative impact of years of massive monetary and fiscal stimulus in the U.S. and elsewhere will kick in, triggering higher long-term inflation. We believe this scenario underscores the importance of securing potential inflation hedges and protecting purchasing power through investments in inflation-fighting portfolios, such as Strategic Inflation Opportunities.
|
| |
| JUNE 30, 2015 |
| Types of Investments in Portfolio | % of net assets |
| U.S. Treasury Securities | 37.0% |
| Domestic Common Stocks | 13.9% |
| Foreign Common Stocks | 9.0% |
| Commercial Paper | 18.6% |
| Exchange-Traded Funds | 11.5% |
| Collateralized Mortgage Obligations | 3.4% |
| Corporate Bonds | 3.3% |
| Asset-Backed Securities | 0.7% |
| Commercial Mortgage-Backed Securities | 0.5% |
| Cash and Equivalents* | 2.1% |
*Includes temporary cash investments and other assets and liabilities.
Fund shareholders may incur two types of costs: (1) transaction costs, including sales charges (loads) on purchase payments and redemption/exchange fees; and (2) ongoing costs, including management fees; distribution and service (12b-1) fees; and other fund expenses. This example is intended to help you understand your ongoing costs (in dollars) of investing in your fund and to compare these costs with the ongoing cost of investing in other mutual funds.
The example is based on an investment of $1,000 made at the beginning of the period and held for the entire period from January 1, 2015 to June 30, 2015.
Actual Expenses
The table provides information about actual account values and actual expenses for each class. You may use the information, together with the amount you invested, to estimate the expenses that you paid over the period. First, identify the share class you own. Then simply divide your account value by $1,000 (for example, an $8,600 account value divided by $1,000 = 8.6), then multiply the result by the number under the heading “Expenses Paid During Period” to estimate the expenses you paid on your account during this period.
If you hold Investor Class shares of any American Century Investments fund, or Institutional Class shares of the American Century Diversified Bond Fund, in an American Century Investments account (i.e., not a financial intermediary or retirement plan account), American Century Investments may charge you a $12.50 semiannual account maintenance fee if the value of those shares is less than $10,000. We will redeem shares automatically in one of your accounts to pay the $12.50 fee. In determining your total eligible investment amount, we will include your investments in all personal accounts (including American Century Investments Brokerage accounts) registered under your Social Security number. Personal accounts include individual accounts, joint accounts, UGMA/UTMA accounts, personal trusts, Coverdell Education Savings Accounts and IRAs (including traditional, Roth, Rollover, SEP-, SARSEP- and SIMPLE-IRAs), and certain other retirement accounts. If you have only business, business retirement, employer-sponsored or American Century Investments Brokerage accounts, you are currently not subject to this fee. If you are subject to the Account Maintenance Fee, your account value could be reduced by the fee amount.
Hypothetical Example for Comparison Purposes
The table also provides information about hypothetical account values and hypothetical expenses based on the actual expense ratio of each class of your fund and an assumed rate of return of 5% per year before expenses, which is not the actual return of a fund’s share class. The hypothetical account values and expenses may not be used to estimate the actual ending account balance or expenses you paid for the period. You may use this information to compare the ongoing costs of investing in your fund and other funds. To do so, compare this 5% hypothetical example with the 5% hypothetical examples that appear in the shareholder reports of the other funds.
Please note that the expenses shown in the table are meant to highlight your ongoing costs only and do not reflect any transactional costs, such as sales charges (loads) or redemption/exchange fees. Therefore, the table is useful in comparing ongoing costs only, and will not help you determine the relative total costs of owning different funds. In addition, if these transactional costs were included, your costs would have been higher.
|
| | | | |
| | Beginning
Account Value
1/1/15 | Ending
Account Value
6/30/15 | Expenses Paid
During Period(1)1/1/15 - 6/30/15 | Annualized Expense Ratio(1) |
| Actual |
| Investor Class (after waiver) | $1,000 | $985.50 | $4.43 | 0.90% |
| Investor Class (before waiver) | $1,000 | $985.50(2) | $5.42 | 1.10% |
| Institutional Class (after waiver) | $1,000 | $986.60 | $3.45 | 0.70% |
| Institutional Class (before waiver) | $1,000 | $986.60(2) | $4.43 | 0.90% |
| A Class (after waiver) | $1,000 | $984.50 | $5.66 | 1.15% |
| A Class (before waiver) | $1,000 | $984.50(2) | $6.64 | 1.35% |
| C Class (after waiver) | $1,000 | $979.90 | $9.33 | 1.90% |
| C Class (before waiver) | $1,000 | $979.90(2) | $10.31 | 2.10% |
| R Class (after waiver) | $1,000 | $982.30 | $6.88 | 1.40% |
| R Class (before waiver) | $1,000 | $982.30(2) | $7.86 | 1.60% |
| Hypothetical |
| Investor Class (after waiver) | $1,000 | $1,020.33 | $4.51 | 0.90% |
| Investor Class (before waiver) | $1,000 | $1,019.34 | $5.51 | 1.10% |
| Institutional Class (after waiver) | $1,000 | $1,021.32 | $3.51 | 0.70% |
| Institutional Class (before waiver) | $1,000 | $1,020.33 | $4.51 | 0.90% |
| A Class (after waiver) | $1,000 | $1,019.09 | $5.76 | 1.15% |
| A Class (before waiver) | $1,000 | $1,018.10 | $6.76 | 1.35% |
| C Class (after waiver) | $1,000 | $1,015.37 | $9.49 | 1.90% |
| C Class (before waiver) | $1,000 | $1,014.38 | $10.49 | 2.10% |
| R Class (after waiver) | $1,000 | $1,017.85 | $7.00 | 1.40% |
| R Class (before waiver) | $1,000 | $1,016.86 | $8.00 | 1.60% |
| |
| (1) | Expenses are equal to the class's annualized expense ratio listed in the table above, multiplied by the average account value over the period, multiplied by 181, the number of days in the most recent fiscal half-year, divided by 365, to reflect the one-half year period. |
| |
| (2) | Ending account value assumes the return earned after waiver and would have been lower if a portion of the management fee had not been waived. |
JUNE 30, 2015
|
| | | | | | |
| | Principal Amount/Shares | Value |
| U.S. TREASURY SECURITIES — 37.0% | | |
| U.S. Treasury Inflation Indexed Notes, 2.50%, 7/15/16 | $ | 140,587 |
| $ | 145,793 |
|
| U.S. Treasury Inflation Indexed Notes, 2.375%, 1/15/17 | 1,525,199 |
| 1,599,553 |
|
| U.S. Treasury Inflation Indexed Notes, 0.125%, 4/15/17 | 1,250,028 |
| 1,266,727 |
|
| U.S. Treasury Inflation Indexed Notes, 2.625%, 7/15/17 | 856,185 |
| 918,325 |
|
| U.S. Treasury Inflation Indexed Notes, 1.625%, 1/15/18 | 225,874 |
| 238,562 |
|
| U.S. Treasury Inflation Indexed Notes, 0.125%, 4/15/18 | 3,121,767 |
| 3,169,080 |
|
| U.S. Treasury Inflation Indexed Notes, 1.375%, 7/15/18 | 1,097,190 |
| 1,162,850 |
|
| U.S. Treasury Inflation Indexed Notes, 2.125%, 1/15/19 | 1,487,700 |
| 1,618,338 |
|
| U.S. Treasury Inflation Indexed Notes, 0.125%, 4/15/19 | 2,271,893 |
| 2,299,403 |
|
| U.S. Treasury Inflation Indexed Notes, 1.875%, 7/15/19 | 609,455 |
| 664,258 |
|
| U.S. Treasury Inflation Indexed Notes, 1.375%, 1/15/20 | 273,530 |
| 292,314 |
|
| U.S. Treasury Inflation Indexed Notes, 0.125%, 4/15/20 | 1,111,363 |
| 1,119,872 |
|
TOTAL U.S. TREASURY SECURITIES (Cost $14,525,208) | | 14,495,075 |
|
| COMMON STOCKS — 22.9% | | |
| Capital Markets — 0.1% | | |
| Blackstone Group LP (The) | 1,411 |
| 57,668 |
|
| Chemicals — 0.1% | | |
| CF Industries Holdings, Inc. | 505 |
| 32,461 |
|
| Construction Materials — 0.2% | | |
| Martin Marietta Materials, Inc. | 171 |
| 24,198 |
|
| Vulcan Materials Co. | 560 |
| 47,001 |
|
| | | 71,199 |
|
| Containers and Packaging — 0.4% | | |
| Ball Corp. | 207 |
| 14,521 |
|
Crown Holdings, Inc.(1) | 402 |
| 21,270 |
|
| MeadWestvaco Corp. | 998 |
| 47,096 |
|
| Packaging Corp. of America | 257 |
| 16,060 |
|
| Rock Tenn Co., Class A | 338 |
| 20,348 |
|
| Sealed Air Corp. | 641 |
| 32,934 |
|
| | | 152,229 |
|
| Energy Equipment and Services — 1.5% | | |
| Baker Hughes, Inc. | 1,079 |
| 66,574 |
|
| Canadian Energy Services & Technology Corp. | 12,974 |
| 74,790 |
|
| Halliburton Co. | 1,896 |
| 81,661 |
|
| Nabors Industries Ltd. | 2,280 |
| 32,900 |
|
| National Oilwell Varco, Inc. | 969 |
| 46,783 |
|
| Patterson-UTI Energy, Inc. | 967 |
| 18,194 |
|
| Schlumberger Ltd. | 2,703 |
| 232,972 |
|
Weatherford International plc(1) | 1,481 |
| 18,172 |
|
| | | 572,046 |
|
|
| | | | | | |
| | Principal Amount/Shares | Value |
| Hotels, Restaurants and Leisure — 0.9% | | |
| Accor SA | 1,538 |
| $ | 77,622 |
|
Hilton Worldwide Holdings, Inc.(1) | 3,203 |
| 88,243 |
|
Hyatt Hotels Corp., Class A(1) | 2,053 |
| 116,384 |
|
| Marriott Vacations Worldwide Corp. | 949 |
| 87,071 |
|
| | | 369,320 |
|
| Metals and Mining — 0.6% | | |
| Agnico-Eagle Mines Ltd. | 833 |
| 23,650 |
|
| Franco-Nevada Corp. | 1,042 |
| 49,697 |
|
| Freeport-McMoRan, Inc. | 1,642 |
| 30,574 |
|
| Goldcorp, Inc. New York Shares | 1,572 |
| 25,466 |
|
| Randgold Resources Ltd. ADR | 506 |
| 33,877 |
|
| Rio Tinto plc ADR | 327 |
| 13,476 |
|
| Royal Gold, Inc. | 514 |
| 31,657 |
|
| Silver Wheaton Corp. | 854 |
| 14,808 |
|
| | | 223,205 |
|
| Oil, Gas and Consumable Fuels — 5.5% | | |
| Anadarko Petroleum Corp. | 1,158 |
| 90,394 |
|
| Apache Corp. | 1,183 |
| 68,176 |
|
| Canadian Natural Resources Ltd. | 1,088 |
| 29,550 |
|
Cheniere Energy, Inc.(1) | 1,143 |
| 79,164 |
|
| Chesapeake Energy Corp. | 1,090 |
| 12,175 |
|
| Chevron Corp. | 2,420 |
| 233,457 |
|
| ConocoPhillips | 2,357 |
| 144,743 |
|
Crew Energy, Inc.(1) | 4,901 |
| 22,406 |
|
| Devon Energy Corp. | 552 |
| 32,838 |
|
| Encana Corp. | 3,552 |
| 39,143 |
|
| EOG Resources, Inc. | 1,916 |
| 167,746 |
|
| Exxon Mobil Corp. | 3,166 |
| 263,411 |
|
| Hess Corp. | 689 |
| 46,080 |
|
| Kinder Morgan, Inc. | 3,595 |
| 138,012 |
|
Leucrotta Exploration, Inc.(1) | 29,975 |
| 27,599 |
|
| Marathon Oil Corp. | 1,888 |
| 50,108 |
|
| Marathon Petroleum Corp. | 942 |
| 49,276 |
|
| Noble Energy, Inc. | 875 |
| 37,345 |
|
| Occidental Petroleum Corp. | 1,775 |
| 138,042 |
|
Paramount Resources Ltd., A Shares(1) | 2,240 |
| 51,472 |
|
| Peyto Exploration & Development Corp. | 1,752 |
| 42,825 |
|
| Phillips 66 | 891 |
| 71,779 |
|
| Pioneer Natural Resources Co. | 282 |
| 39,111 |
|
| Spectra Energy Corp. | 1,168 |
| 38,077 |
|
| Suncor Energy, Inc. | 2,594 |
| 71,387 |
|
Tourmaline Oil Corp.(1) | 774 |
| 23,251 |
|
| Valero Energy Corp. | 1,179 |
| 73,805 |
|
| Williams Cos., Inc. (The) | 1,194 |
| 68,524 |
|
| | | 2,149,896 |
|
|
| | | | | | |
| | Principal Amount/Shares | Value |
| Paper and Forest Products — 0.1% | | |
| International Paper Co. | 817 |
| $ | 38,881 |
|
| Real Estate Investment Trusts (REITs) — 9.3% | | |
| Alexandria Real Estate Equities, Inc. | 1,517 |
| 132,677 |
|
| Allied Properties Real Estate Investment Trust | 2,894 |
| 82,116 |
|
| Alstria Office REIT AG | 4,181 |
| 53,860 |
|
| AvalonBay Communities, Inc. | 1,192 |
| 190,565 |
|
| Big Yellow Group plc | 6,356 |
| 63,666 |
|
| Boston Properties, Inc. | 1,232 |
| 149,121 |
|
| British Land Co. plc | 1,495 |
| 18,639 |
|
| Calloway Real Estate Investment Trust | 2,594 |
| 60,063 |
|
| Champion REIT | 101,000 |
| 55,506 |
|
| Charter Hall Group | 6,752 |
| 23,547 |
|
| Derwent London plc | 1,859 |
| 99,371 |
|
| Duke Realty Corp. | 6,141 |
| 114,038 |
|
| Equity Residential | 2,805 |
| 196,827 |
|
| Essex Property Trust, Inc. | 710 |
| 150,875 |
|
| Extra Space Storage, Inc. | 2,306 |
| 150,397 |
|
| Federation Centres | 24,328 |
| 54,809 |
|
| Goodman Group | 18,344 |
| 88,741 |
|
| Great Portland Estates plc | 8,253 |
| 100,628 |
|
| Hudson Pacific Properties, Inc. | 3,623 |
| 102,785 |
|
| Hulic Reit, Inc. | 31 |
| 44,175 |
|
| Invincible Investment Corp. | 32 |
| 17,074 |
|
| Japan Rental Housing Investments, Inc. | 44 |
| 30,919 |
|
Kenedix Retail REIT Corp.(1) | 13 |
| 30,858 |
|
| Kilroy Realty Corp. | 1,607 |
| 107,910 |
|
| Kite Realty Group Trust | 4,080 |
| 99,838 |
|
| Klepierre | 1,757 |
| 77,284 |
|
| Land Securities Group plc | 5,136 |
| 97,162 |
|
| Link REIT (The) | 9,000 |
| 52,712 |
|
| Macerich Co. (The) | 1,799 |
| 134,205 |
|
| Mapletree Greater China Commercial Trust | 36,000 |
| 27,264 |
|
Merlin Properties Socimi SA(1) | 3,268 |
| 39,931 |
|
| New Residential Investment Corp. | 4,681 |
| 71,338 |
|
| NIPPON REIT Investment Corp. | 18 |
| 42,491 |
|
| NorthStar Realty Finance Corp. | 2,535 |
| 40,307 |
|
| ProLogis, Inc. | 4,504 |
| 167,098 |
|
| Safestore Holdings plc | 8,990 |
| 39,940 |
|
| Scentre Group | 39,821 |
| 115,215 |
|
| Simon Property Group, Inc. | 1,897 |
| 328,219 |
|
| STORE Capital Corp. | 2,169 |
| 43,597 |
|
| Unibail-Rodamco SE | 532 |
| 134,456 |
|
| Westfield Corp. | 3,259 |
| 22,932 |
|
| | | 3,653,156 |
|
|
| | | | | | |
| | Principal Amount/Shares | Value |
| Real Estate Management and Development — 4.2% | | |
| Ayala Land, Inc. | 59,600 |
| $ | 49,303 |
|
| Capital & Counties Properties plc | 5,990 |
| 40,960 |
|
| CapitaLand Ltd. | 23,800 |
| 61,848 |
|
| China Overseas Land & Investment Ltd. | 14,000 |
| 49,397 |
|
| China Resources Land Ltd. | 29,555 |
| 95,892 |
|
| Corp. Inmobiliaria Vesta SAB de CV | 7,032 |
| 11,453 |
|
| Daiwa House Industry Co. Ltd. | 3,700 |
| 86,253 |
|
| Emaar Properties PJSC | 20,446 |
| 43,866 |
|
| Fabege AB | 7,510 |
| 102,460 |
|
Forest City Enterprises, Inc., Class A(1) | 5,498 |
| 121,506 |
|
| Global Logistic Properties Ltd. | 28,500 |
| 53,536 |
|
| Henderson Land Development Co. Ltd. | 4,600 |
| 31,482 |
|
| Hongkong Land Holdings Ltd. | 13,100 |
| 107,420 |
|
| Hulic Co. Ltd. | 8,200 |
| 72,764 |
|
| Jones Lang LaSalle, Inc. | 597 |
| 102,087 |
|
| Kerry Properties Ltd. | 3,500 |
| 13,726 |
|
| KWG Property Holding Ltd. | 52,500 |
| 44,294 |
|
| Longfor Properties Co. Ltd. | 42,500 |
| 67,658 |
|
| Mitsubishi Estate Co. Ltd. | 2,000 |
| 43,085 |
|
| Mitsui Fudosan Co. Ltd. | 6,000 |
| 168,011 |
|
| SM Prime Holdings, Inc. | 68,700 |
| 30,442 |
|
| Sun Hung Kai Properties Ltd. | 8,750 |
| 141,778 |
|
| Unite Group plc (The) | 11,165 |
| 100,258 |
|
| | | 1,639,479 |
|
TOTAL COMMON STOCKS (Cost $8,295,156) | | 8,959,540 |
|
COMMERCIAL PAPER(2) — 18.6% | | |
Bennington Stark Cap Co., 0.21%, 7/24/15(3) | $ | 2,500,000 |
| 2,499,705 |
|
Charta LLC, 0.21%, 9/1/15(3) | 2,500,000 |
| 2,499,204 |
|
Jupiter Securitization Co. LLC, 0.31%, 11/5/15(3) | 2,300,000 |
| 2,297,293 |
|
TOTAL COMMERCIAL PAPER (Cost $7,296,326) | | 7,296,202 |
|
| EXCHANGE-TRADED FUNDS — 11.5% | | |
iShares S&P GSCI Commodity Indexed Trust(1) | 102,464 |
| 2,163,015 |
|
PowerShares DB Commodity Index Tracking Fund(1) | 20,596 |
| 370,728 |
|
SPDR Gold Shares(1) | 10,160 |
| 1,141,679 |
|
Sprott Physical Gold Trust(1) | 83,882 |
| 810,300 |
|
TOTAL EXCHANGE-TRADED FUNDS (Cost $5,708,234) | | 4,485,722 |
|
COLLATERALIZED MORTGAGE OBLIGATIONS(4) — 3.4% | | |
| Private Sponsor Collateralized Mortgage Obligations — 3.3% | | |
| ABN Amro Mortgage Corp., Series 2003-6, Class 1A4, 5.50%, 5/25/33 | $ | 7,819 |
| 8,217 |
|
| Banc of America Mortgage Securities, Inc., Series 2004-7, Class 7A1, 5.00%, 8/25/19 | 5,891 |
| 5,895 |
|
| Banc of America Mortgage Securities, Inc., Series 2005-1, Class 1A15, 5.50%, 2/25/35 | 42,083 |
| 44,080 |
|
|
| | | | | | |
| | Principal Amount/Shares | Value |
| Banc of America Mortgage Securities, Inc., Series 2007-1, Class 1A16, 5.625%, 3/25/37 | $ | 37,839 |
| $ | 34,261 |
|
| Bear Stearns Adjustable Rate Mortgage Trust, Series 2004-12, Class 2A1, VRN, 2.70%, 7/1/15 | 29,681 |
| 29,718 |
|
| Bear Stearns Adjustable Rate Mortgage Trust, Series 2006-1, Class A1, VRN, 2.36%, 7/1/15 | 79,035 |
| 78,611 |
|
| Citigroup Mortgage Loan Trust, Inc., Series 2004-UST1, Class A4, VRN, 2.24%, 7/1/15 | 50,644 |
| 50,318 |
|
| Citigroup Mortgage Loan Trust, Inc., Series 2005-4, Class A, VRN, 5.11%, 7/1/15 | 65,338 |
| 64,600 |
|
| Countrywide Home Loan Mortgage Pass-Through Trust, Series 2004-4, Class A19, 5.25%, 5/25/34 | 64,171 |
| 67,962 |
|
| Countrywide Home Loan Mortgage Pass-Through Trust, Series 2004-5, Class 2A4, 5.50%, 5/25/34 | 9,435 |
| 9,907 |
|
| First Horizon Mortgage Pass-Through Trust, Series 2005-AR3, Class 4A1, VRN, 3.94%, 7/1/15 | 39,919 |
| 38,212 |
|
| GSR Mortgage Loan Trust, Series 2005-AR6, Class 2A1, VRN, 2.68%, 7/1/15 | 57,023 |
| 57,287 |
|
| JPMorgan Mortgage Trust, Series 2005-A6, Class 7A1, VRN, 2.53%, 7/1/15 | 66,418 |
| 63,172 |
|
| JPMorgan Mortgage Trust, Series 2006-A3, Class 7A1, VRN, 2.61%, 7/1/15 | 18,345 |
| 18,512 |
|
| MASTR Asset Securitization Trust, Series 2003-10, Class 3A1, 5.50%, 11/25/33 | 19,764 |
| 20,742 |
|
| PHHMC Mortgage Pass-Through Certificates, Series 2007-6, Class A1, VRN, 5.36%, 7/1/15 | 10,465 |
| 10,428 |
|
Sequoia Mortgage Trust, Series 2014-3, Class A14, VRN, 3.00%, 7/1/15(3) | 60,375 |
| 61,291 |
|
| Thornburg Mortgage Securities Trust, Series 2004-3, Class A, VRN, 0.93%, 7/27/15 | 18,755 |
| 18,095 |
|
| WaMu Mortgage Pass-Through Certificates, Series 2003-S11, Class 3A5, 5.95%, 11/25/33 | 13,888 |
| 14,344 |
|
| Wells Fargo Mortgage-Backed Securities Trust, Series 2005-AR14, Class A1, VRN, 4.89%, 7/1/15 | 18,786 |
| 18,643 |
|
| Wells Fargo Mortgage-Backed Securities Trust, Series 2005-AR16, Class 1A1, VRN, 2.67%, 7/1/15 | 71,613 |
| 73,168 |
|
| Wells Fargo Mortgage-Backed Securities Trust, Series 2005-AR16, Class 3A2, VRN, 2.64%, 7/1/15 | 51,200 |
| 51,721 |
|
| Wells Fargo Mortgage-Backed Securities Trust, Series 2005-AR7, Class 1A1, VRN, 2.74%, 7/1/15 | 32,597 |
| 32,700 |
|
| Wells Fargo Mortgage-Backed Securities Trust, Series 2006-10, Class A4 SEQ, 6.00%, 8/25/36 | 63,020 |
| 64,847 |
|
| Wells Fargo Mortgage-Backed Securities Trust, Series 2006-11, Class A9 SEQ, 6.50%, 9/25/36 | 67,059 |
| 65,454 |
|
| Wells Fargo Mortgage-Backed Securities Trust, Series 2006-9, Class 1A9 SEQ, 6.00%, 8/25/36 | 29,880 |
| 31,081 |
|
| Wells Fargo Mortgage-Backed Securities Trust, Series 2006-AR15, Class A1, VRN, 2.62%, 7/1/15 | 40,961 |
| 37,999 |
|
| Wells Fargo Mortgage-Backed Securities Trust, Series 2007-10, Class 1A5, 6.00%, 7/25/37 | 51,669 |
| 51,725 |
|
| Wells Fargo Mortgage-Backed Securities Trust, Series 2007-11, Class A3 SEQ, 6.00%, 8/25/37 | 39,153 |
| 38,740 |
|
| Wells Fargo Mortgage-Backed Securities Trust, Series 2007-13, Class A1, 6.00%, 9/25/37 | 48,815 |
| 50,751 |
|
| Wells Fargo Mortgage-Backed Securities Trust, Series 2007-14, Class 2A2, 5.50%, 10/25/22 | 13,904 |
| 14,388 |
|
|
| | | | | | |
| | Principal Amount/Shares | Value |
| Wells Fargo Mortgage-Backed Securities Trust, Series 2007-16, Class 1A1, 6.00%, 12/28/37 | $ | 15,682 |
| $ | 16,241 |
|
| Wells Fargo Mortgage-Backed Securities Trust, Series 2007-3, Class 3A1, 5.50%, 4/25/22 | 5,694 |
| 5,888 |
|
| Wells Fargo Mortgage-Backed Securities Trust, Series 2007-AR10, Class 1A1, VRN, 6.21%, 7/1/15 | 7,566 |
| 7,546 |
|
WinWater Mortgage Loan Trust, Series 2014-1, Class A4 SEQ, VRN, 3.50%, 7/1/15(3) | 44,347 |
| 45,427 |
|
| | | 1,301,971 |
|
| U.S. Government Agency Collateralized Mortgage Obligations — 0.1% | |
| FHLMC, Series 2824, Class LB SEQ, 4.50%, 7/15/24 | 46,394 |
| 49,704 |
|
TOTAL COLLATERALIZED MORTGAGE OBLIGATIONS (Cost $1,329,601) | | 1,351,675 |
|
| CORPORATE BONDS — 3.3% | | |
| Aerospace and Defense — 0.2% | | |
Bombardier, Inc., 5.75%, 3/15/22(3) | 70,000 |
| 62,650 |
|
Automobiles† | | |
Nissan Motor Acceptance Corp., 2.65%, 9/26/18(3) | 10,000 |
| 10,259 |
|
| Banks — 0.1% | | |
| Bank of America Corp., 2.00%, 1/11/18 | 40,000 |
| 40,137 |
|
| Chemicals — 0.2% | | |
| Ashland, Inc., 4.75%, 8/15/22 | 75,000 |
| 73,875 |
|
| Communications Equipment — 0.4% | | |
| Crown Castle International Corp., 5.25%, 1/15/23 | 75,000 |
| 75,825 |
|
| SBA Communications Corp., 5.625%, 10/1/19 | 75,000 |
| 78,281 |
|
| | | 154,106 |
|
| Diversified Financial Services — 0.1% | | |
| Morgan Stanley, MTN, 5.625%, 9/23/19 | 20,000 |
| 22,408 |
|
| MUFG Union Bank N.A., 2.625%, 9/26/18 | 10,000 |
| 10,160 |
|
| | | 32,568 |
|
| Diversified Telecommunication Services — 0.1% | | |
| Verizon Communications, Inc., 3.65%, 9/14/18 | 20,000 |
| 21,024 |
|
| Windstream Services LLC, 7.875%, 11/1/17 | 30,000 |
| 31,987 |
|
| | | 53,011 |
|
| Food Products — 0.1% | | |
| Tyson Foods, Inc., 6.60%, 4/1/16 | 20,000 |
| 20,767 |
|
| Health Care Providers and Services — 0.3% | | |
| CHS / Community Health Systems, Inc., 5.125%, 8/15/18 | 55,000 |
| 56,540 |
|
Fresenius Medical Care US Finance II, Inc., 5.625%, 7/31/19(3) | 70,000 |
| 76,038 |
|
| | | 132,578 |
|
| Insurance — 0.1% | | |
| American International Group, Inc., 4.125%, 2/15/24 | 30,000 |
| 31,144 |
|
| XLIT Ltd., 2.30%, 12/15/18 | 20,000 |
| 20,139 |
|
| | | 51,283 |
|
| Life Sciences Tools and Services — 0.1% | | |
| Thermo Fisher Scientific, Inc., 3.20%, 3/1/16 | 20,000 |
| 20,310 |
|
|
| | | | | | |
| | Principal Amount/Shares | Value |
| Metals and Mining — 0.1% | | |
| Barrick Gold Corp., 2.90%, 5/30/16 | $ | 30,000 |
| $ | 30,298 |
|
| Rio Tinto Finance USA plc, 1.375%, 6/17/16 | 20,000 |
| 20,070 |
|
| | | 50,368 |
|
| Multi-Utilities — 0.3% | | |
| CMS Energy Corp., 8.75%, 6/15/19 | 25,000 |
| 30,816 |
|
| Dominion Gas Holdings LLC, 1.05%, 11/1/16 | 20,000 |
| 19,970 |
|
| GenOn Energy, Inc., 7.875%, 6/15/17 | 55,000 |
| 55,688 |
|
| | | 106,474 |
|
| Oil, Gas and Consumable Fuels — 0.4% | | |
| Bill Barrett Corp., 7.00%, 10/15/22 | 75,000 |
| 68,250 |
|
| Marathon Petroleum Corp., 3.50%, 3/1/16 | 20,000 |
| 20,340 |
|
| Peabody Energy Corp., 6.50%, 9/15/20 | 30,000 |
| 10,350 |
|
| QEP Resources, Inc., 5.25%, 5/1/23 | 75,000 |
| 72,188 |
|
| | | 171,128 |
|
Pharmaceuticals† | | |
| Mylan, Inc., 1.35%, 11/29/16 | 10,000 |
| 9,972 |
|
| Real Estate Investment Trusts (REITs) — 0.2% | | |
| HCP, Inc., 6.00%, 1/30/17 | 25,000 |
| 26,676 |
|
| Reckson Operating Partnership LP, 6.00%, 3/31/16 | 50,000 |
| 51,649 |
|
| | | 78,325 |
|
| Specialty Retail — 0.2% | | |
| Hertz Corp. (The), 6.75%, 4/15/19 | 55,000 |
| 56,892 |
|
| Textiles, Apparel and Luxury Goods — 0.2% | | |
| Hanesbrands, Inc., 6.375%, 12/15/20 | 75,000 |
| 78,750 |
|
| Wireless Telecommunication Services — 0.2% | | |
| Sprint Communications, 6.00%, 12/1/16 | 70,000 |
| 72,669 |
|
TOTAL CORPORATE BONDS (Cost $1,300,477) | | 1,276,122 |
|
ASSET-BACKED SECURITIES(4) — 0.7% | | |
Hilton Grand Vacations Trust, Series 2014-AA, Class A SEQ, 1.77%, 11/25/26(3) | 57,941 |
| 57,505 |
|
MVW Owner Trust, Series 2014-1A, Class B, 2.70%, 9/22/31(3) | 168,454 |
| 167,345 |
|
Sierra Timeshare Receivables Funding LLC, Series 2015-1A, Class A, 2.40%, 3/22/32(3) | 43,739 |
| 43,783 |
|
TOTAL ASSET-BACKED SECURITIES (Cost $270,092) | | 268,633 |
|
COMMERCIAL MORTGAGE-BACKED SECURITIES(4) — 0.5% | | |
| Banc of America Commercial Mortgage, Inc., Series 2005-5, Class AM, VRN, 5.18%, 7/1/15 | 75,000 |
| 75,807 |
|
Core Industrial Trust, Series 2015-CALW, Class B, 3.25%, 2/10/34(3) | 50,000 |
| 49,962 |
|
Core Industrial Trust, Series 2015-TEXW, Class B, 3.33%, 2/10/34(3) | 50,000 |
| 49,905 |
|
| LB-UBS Commercial Mortgage Trust, Series 2004-C1, Class A4 SEQ, 4.57%, 1/15/31 | 7,817 |
| 7,907 |
|
TOTAL COMMERCIAL MORTGAGE-BACKED SECURITIES (Cost $188,566) | | 183,581 |
|
|
| | | | | | |
| | Principal Amount/Shares | Value |
| TEMPORARY CASH INVESTMENTS — 2.1% | | |
| SSgA U.S. Government Money Market Fund, Class N | 663,058 |
| $ | 663,058 |
|
| State Street Institutional Liquid Reserves Fund, Premier Class | 144,349 |
| 144,349 |
|
TOTAL TEMPORARY CASH INVESTMENTS (Cost $807,407) | | 807,407 |
|
TOTAL INVESTMENT SECURITIES — 100.0% (Cost $39,721,067) | | 39,123,957 |
|
OTHER ASSETS AND LIABILITIES† | | 1,700 |
|
| TOTAL NET ASSETS — 100.0% | | $ | 39,125,657 |
|
FORWARD FOREIGN CURRENCY EXCHANGE CONTRACTS
|
| | | | | | | | |
| Currency Purchased | Currency Sold | Counterparty | Settlement Date | Unrealized Appreciation
(Depreciation) |
| AUD | 127,492 | USD | 97,334 | Barclays Bank plc | 9/16/15 | $ | 628 |
|
| BRL | 525,158 | USD | 164,009 | UBS AG | 9/16/15 | 363 |
|
| CAD | 1,114,144 | USD | 902,157 | Barclays Bank plc | 9/16/15 | (11,030) |
|
| CAD | 595,166 | USD | 480,000 | Barclays Bank plc | 9/16/15 | (3,967) |
|
| CAD | 121,697 | USD | 98,497 | JPMorgan Chase Bank N.A. | 9/16/15 | (1,160) |
|
| CHF | 131,039 | USD | 141,289 | UBS AG | 9/16/15 | (719) |
|
| USD | 5,454 | CHF | 5,052 | Barclays Bank plc | 9/16/15 | 35 |
|
| CLP | 572,946,976 | USD | 899,093 | UBS AG | 9/16/15 | (9,153) |
|
| USD | 480,000 | CLP | 308,400,000 | UBS AG | 9/16/15 | 972 |
|
| CNY | 13,049,663 | USD | 2,121,724 | UBS AG | 9/16/15 | 4,036 |
|
| CZK | 5,817,693 | USD | 240,000 | Barclays Bank plc | 9/16/15 | (1,910) |
|
| USD | 228,751 | CZK | 5,545,190 | Deutsche Bank | 9/16/15 | 1,814 |
|
| USD | 371,449 | EUR | 327,807 | Barclays Bank plc | 9/16/15 | 5,606 |
|
| GBP | 723,584 | USD | 1,112,487 | Deutsche Bank | 9/16/15 | 23,824 |
|
| HKD | 804,291 | USD | 103,728 | Deutsche Bank | 9/16/15 | 22 |
|
| USD | 2,364 | HKD | 18,329 | Barclays Bank plc | 9/16/15 | — |
|
| USD | 888 | HUF | 247,361 | UBS AG | 9/16/15 | 15 |
|
| ILS | 332,677 | USD | 87,080 | Barclays Bank plc | 9/16/15 | 1,100 |
|
| USD | 6,304 | ILS | 24,187 | Barclays Bank plc | 9/16/15 | (107) |
|
| INR | 9,977,170 | USD | 152,867 | Westpac Group | 9/16/15 | 2,251 |
|
| USD | 1,133,252 | JPY | 140,792,251 | Deutsche Bank | 9/16/15 | (18,279) |
|
| KRW | 853,206,400 | USD | 760,000 | Westpac Group | 9/16/15 | 619 |
|
| MXN | 8,009,072 | USD | 520,000 | Barclays Bank plc | 9/17/15 | (13,176) |
|
| MXN | 6,035,903 | USD | 385,278 | UBS AG | 9/17/15 | (3,319) |
|
| MYR | 425,974 | USD | 113,050 | Westpac Group | 9/17/15 | (295) |
|
| USD | 513,648 | NZD | 725,978 | Barclays Bank plc | 9/16/15 | 24,852 |
|
| USD | 83,148 | NZD | 120,000 | Barclays Bank plc | 9/16/15 | 2,353 |
|
| USD | 81,936 | NZD | 120,000 | Barclays Bank plc | 9/16/15 | 1,141 |
|
| USD | 506,103 | NZD | 740,000 | Barclays Bank plc | 9/16/15 | 7,866 |
|
| PHP | 1,936,241 | USD | 42,551 | Westpac Group | 9/16/15 | 240 |
|
| PLN | 57,795 | USD | 15,579 | Deutsche Bank | 9/16/15 | (239) |
|
| RUB | 5,768,134 | USD | 102,636 | UBS AG | 9/16/15 | (848) |
|
| SEK | 3,598,232 | USD | 440,000 | Barclays Bank plc | 9/16/15 | (5,261) |
|
| SEK | 477,685 | USD | 58,281 | JPMorgan Chase Bank N.A. | 9/16/15 | (567) |
|
| SGD | 206,734 | USD | 152,623 | Barclays Bank plc | 9/16/15 | 705 |
|
|
| | | | | | | | |
| Currency Purchased | Currency Sold | Counterparty | Settlement Date | Unrealized Appreciation
(Depreciation) |
| THB | 16,950,500 | USD | 500,000 | Westpac Group | 9/16/15 | $ | 624 |
|
| USD | 393,549 | THB | 13,344,446 | Westpac Group | 9/16/15 | (573) |
|
| TRY | 749,262 | USD | 266,056 | Deutsche Bank | 9/16/15 | 7,487 |
|
| USD | 260,000 | TRY | 722,410 | Barclays Bank plc | 9/16/15 | (3,740) |
|
| TWD | 13,945,446 | USD | 451,674 | UBS AG | 9/16/15 | 299 |
|
| TWD | 3,080,000 | USD | 100,000 | Westpac Group | 9/16/15 | (177) |
|
| TWD | 15,302,500 | USD | 500,000 | Westpac Group | 9/16/15 | (4,045) |
|
| USD | 256,253 | TWD | 7,911,800 | UBS AG | 9/16/15 | (170) |
|
| USD | 578,215 | TWD | 17,852,400 | UBS AG | 9/16/15 | (382) |
|
| ZAR | 6,100,278 | USD | 486,556 | Barclays Bank plc | 9/16/15 | 8,281 |
|
| USD | 486,308 | ZAR | 6,150,997 | Deutsche Bank | 9/16/15 | (12,644) |
|
| | | | | | | $ | 3,372 |
|
|
| | | | | | | | | | |
| TOTAL RETURN SWAP AGREEMENTS |
| Counterparty | Notional
Amount | Floating Rate
Referenced Index | Pay/Receive
Total Return of
Referenced Index | Fixed Rate | Termination
Date | Value |
| Bank of America N.A. | $ | 925,000 |
| U.S. CPI Urban Consumers NSA Index | Receive | 2.28% | 1/21/16 | $ | (30,653 | ) |
| Bank of America N.A. | 1,000,000 |
| U.S. CPI Urban Consumers NSA Index | Receive | 2.21% | 3/13/19 | (38,399 | ) |
| Barclays Bank plc | 900,000 |
| U.S. CPI Urban Consumers NSA Index | Receive | 2.30% | 1/11/16 | (30,468 | ) |
| Barclays Bank plc | 1,000,000 |
| U.S. CPI Urban Consumers NSA Index | Receive | 1.64% | 2/3/20 | 229 |
|
| Morgan Stanley Capital Services LLC | 500,000 |
| U.S. CPI Urban Consumers NSA Index | Receive | 2.24% | 8/19/19 | (21,427 | ) |
| | | | | | | $ | (120,718 | ) |
|
| | |
| NOTES TO SCHEDULE OF INVESTMENTS |
| ADR | - | American Depositary Receipt |
| AUD | - | Australian Dollar |
| BRL | - | Brazilian Real |
| CAD | - | Canadian Dollar |
| CHF | - | Swiss Franc |
| CLP | - | Chilean Peso |
| CNY | - | Chinese Yuan |
| CPI | - | Consumer Price Index |
| CZK | - | Czech Koruna |
| EUR | - | Euro |
| FHLMC | - | Federal Home Loan Mortgage Corporation |
| GBP | - | British Pound |
| HKD | - | Hong Kong Dollar |
| HUF | - | Hungarian Forint |
| ILS | - | Israeli Shekel |
| INR | - | Indian Rupee |
| JPY | - | Japanese Yen |
| KRW | - | South Korea Won |
| MTN | - | Medium Term Note |
| MXN | - | Mexican Peso |
| MYR | - | Malaysian Ringgit |
| NSA | - | Not Seasonally Adjusted |
| NZD | - | New Zealand Dollar |
| PHP | - | Philippine Peso |
| PJSC | - | Public Joint Stock Company |
| PLN | - | Polish Zloty |
| RUB | - | Russian Ruble |
| SEK | - | Swedish Krona |
| SEQ | - | Sequential Payer |
| SGD | - | Singapore Dollar |
| THB | - | Thai Baht |
| TRY | - | Turkish Lira |
| TWD | - | Taiwanese Dollar |
| USD | - | United States Dollar |
| VRN | - | Variable Rate Note. Interest reset date is indicated. Rate shown is effective at the period end. |
| ZAR | - | South African Rand |
| |
| † | Category is less than 0.05% of total net assets. |
| |
| (2) | The rate indicated is the yield to maturity at purchase for non-interest bearing securities. For interest bearing securities, the stated coupon rate is shown. |
| |
| (3) | Restricted security exempt from registration pursuant to Rule 144A or Section 4(2) under the Securities Act of 1933. These securities may be sold without restriction to qualified institutional investors and have been deemed liquid under policies approved by the Board of Directors. The aggregate value of these securities at the period end was $7,920,367, which represented 20.2% of total net assets. |
| |
| (4) | Final maturity date indicated, unless otherwise noted. |
See Notes to Financial Statements.
|
|
| Statement of Assets and Liabilities |
|
| | | |
| JUNE 30, 2015 |
| Assets |
| Investment securities, at value (cost of $39,721,067) | $ | 39,123,957 |
|
| Foreign currency holdings, at value (cost of $2,903) | 2,892 |
|
| Receivable for investments sold | 147,764 |
|
| Receivable for capital shares sold | 150,988 |
|
| Unrealized appreciation on forward foreign currency exchange contracts | 95,133 |
|
| Swap agreements, at value | 229 |
|
| Dividends and interest receivable | 109,854 |
|
| Other assets | 197 |
|
| | 39,631,014 |
|
| | |
| Liabilities | |
| Payable for investments purchased | 169,229 |
|
| Payable for capital shares redeemed | 88,495 |
|
| Unrealized depreciation on forward foreign currency exchange contracts | 91,761 |
|
| Swap agreements, at value | 120,947 |
|
| Accrued management fees | 28,465 |
|
| Distribution and service fees payable | 6,460 |
|
| | 505,357 |
|
| | |
| Net Assets | $ | 39,125,657 |
|
| | |
| Net Assets Consist of: | |
| Capital (par value and paid-in surplus) | $ | 45,031,312 |
|
| Distributions in excess of net investment income | (832,688 | ) |
| Accumulated net realized loss | (4,358,436 | ) |
| Net unrealized depreciation | (714,531 | ) |
| | $ | 39,125,657 |
|
|
| | | | | | |
| | Net Assets | Shares Outstanding | Net Asset Value Per Share |
| Investor Class, $0.01 Par Value |
| $24,054,162 |
| 2,521,635 |
| $9.54 |
| Institutional Class, $0.01 Par Value |
| $1,101,807 |
| 115,414 |
| $9.55 |
| A Class, $0.01 Par Value |
| $8,384,938 |
| 881,705 |
| $9.51* |
| C Class, $0.01 Par Value |
| $5,479,135 |
| 590,233 |
| $9.28 |
| R Class, $0.01 Par Value |
| $105,615 |
| 11,185 |
| $9.44 |
*Maximum offering price $10.09 (net asset value divided by 0.9425).
See Notes to Financial Statements.
|
| | | |
| YEAR ENDED JUNE 30, 2015 |
| Investment Income (Loss) |
| Income: | |
| Dividends (net of foreign taxes withheld of $6,631) | $ | 353,396 |
|
| Interest (net of foreign taxes withheld of $16) | 200,390 |
|
| | 553,786 |
|
| | |
| Expenses: | |
| Management fees | 525,288 |
|
| Distribution and service fees: | |
| A Class | 27,151 |
|
| C Class | 73,625 |
|
| R Class | 549 |
|
| Directors' fees and expenses | 2,524 |
|
| Other expenses | 4,962 |
|
| | 634,099 |
|
| Fees waived | (97,939 | ) |
| | 536,160 |
|
| | |
| Net investment income (loss) | 17,626 |
|
| | |
| Realized and Unrealized Gain (Loss) |
| Net realized gain (loss) on: | |
| Investment transactions | (714,130 | ) |
| Futures contract transactions | (102,100 | ) |
| Foreign currency transactions | (758,380 | ) |
| | (1,574,610 | ) |
| | |
| Change in net unrealized appreciation (depreciation) on: | |
| Investments (includes (increase) decrease in accrued foreign taxes of $245) | (2,935,220 | ) |
| Futures contracts | (16,308 | ) |
| Swap agreements | (120,359 | ) |
| Translation of assets and liabilities in foreign currencies | (48,775 | ) |
| | (3,120,662 | ) |
| | |
| Net realized and unrealized gain (loss) | (4,695,272 | ) |
| | |
| Net Increase (Decrease) in Net Assets Resulting from Operations | $ | (4,677,646 | ) |
See Notes to Financial Statements.
|
|
| Statement of Changes in Net Assets |
|
| | | | | | |
| YEARS ENDED JUNE 30, 2015 AND JUNE 30, 2014 |
| Increase (Decrease) in Net Assets | June 30, 2015 | June 30, 2014 |
| Operations | | |
| Net investment income (loss) | $ | 17,626 |
| $ | 28,038 |
|
| Net realized gain (loss) | (1,574,610 | ) | (112,307 | ) |
| Change in net unrealized appreciation (depreciation) | (3,120,662 | ) | 3,597,867 |
|
| Net increase (decrease) in net assets resulting from operations | (4,677,646 | ) | 3,513,598 |
|
| | | |
| Distributions to Shareholders | | |
| From net investment income: | | |
| Investor Class | (295,073 | ) | (100,537 | ) |
| Institutional Class | (17,817 | ) | (10,017 | ) |
| A Class | (55,820 | ) | — |
|
| R Class | (221 | ) | — |
|
| Decrease in net assets from distributions | (368,931 | ) | (110,554 | ) |
| | | |
| Capital Share Transactions | | |
Net increase (decrease) in net assets from capital share transactions (Note 5) | (8,638,049 | ) | (33,584,196 | ) |
| | | |
| Net increase (decrease) in net assets | (13,684,626 | ) | (30,181,152 | ) |
| | | |
| Net Assets | | |
| Beginning of period | 52,810,283 |
| 82,991,435 |
|
| End of period | $ | 39,125,657 |
| $ | 52,810,283 |
|
| | | |
| Undistributed (distributions in excess of) net investment income | $ | (832,688 | ) | $ | 82,568 |
|
See Notes to Financial Statements.
|
|
| Notes to Financial Statements |
JUNE 30, 2015
1. Organization
American Century Quantitative Equity Funds, Inc. (the corporation) is registered under the Investment Company Act of 1940, as amended (the 1940 Act), as an open-end management investment company and is organized as a Maryland corporation. Strategic Inflation Opportunities Fund (the fund) is one fund in a series issued by the corporation. The fund is nondiversified as defined under the 1940 Act. The fund’s investment objective is to seek total real return.
The fund offers the Investor Class, the Institutional Class, the A Class, the C Class and the R Class. The A Class may incur an initial sales charge. The A Class and C Class may be subject to a contingent deferred sales charge. The share classes differ principally in their respective sales charges and distribution and shareholder servicing expenses and arrangements. The Institutional Class is made available to institutional shareholders or through financial intermediaries whose clients do not require the same level of shareholder and administrative services as shareholders of other classes. As a result, the Institutional Class is charged a lower unified management fee.
2. Significant Accounting Policies
The following is a summary of significant accounting policies consistently followed by the fund in preparation of its financial statements. The fund is an investment company and follows accounting and reporting guidance in accordance with accounting principles generally accepted in the United States of America. This may require management to make certain estimates and assumptions at the date of the financial statements. Actual results could differ from these estimates. Management evaluated the impact of events or transactions occurring through the date the financial statements were issued that would merit recognition or disclosure.
Investment Valuations — The fund determines the fair value of its investments and computes its net asset value per share at the close of regular trading (usually 4 p.m. Eastern time) on the New York Stock Exchange (NYSE) on each day the NYSE is open. The Board of Directors has adopted valuation policies and procedures to guide the investment advisor in the fund’s investment valuation process and to provide methodologies for the oversight of the fund’s pricing function.
Fixed income securities maturing in greater than 60 days at the time of purchase are valued at the evaluated mean as provided by independent pricing services or at the mean of the most recent bid and asked prices as provided by investment dealers. Fixed income securities maturing within 60 days at the time of purchase may be valued at cost, plus or minus any amortized discount or premium or at the evaluated mean as provided by an independent pricing service. Evaluated mean prices are commonly derived through utilization of market models, which may consider, among other factors: trade data, quotations from dealers and active market makers, relevant yield curve and spread data, related sector levels, creditworthiness, trade data or market information on comparable securities, and other relevant security specific information.
Equity securities that are listed or traded on a domestic securities exchange are valued at the last reported sales price or at the official closing price as provided by the exchange. Equity securities traded on foreign securities exchanges are generally valued at the closing price of such securities on the exchange where primarily traded or at the close of the NYSE, if that is earlier. If no last sales price is reported, or if local convention or regulation so provides, the mean of the latest bid and asked prices may be used. Securities traded over-the-counter are valued at the mean of the latest bid and asked prices, the last sales price, or the official closing price. Equity securities initially expressed in local currencies are translated into U.S. dollars at the mean of the appropriate currency exchange rate at the close of the NYSE as provided by an independent pricing service.
Open-end management investment companies are valued at the reported net asset value per share. Exchange-traded futures contracts are valued at the settlement price as provided by the appropriate clearing corporation. Swap agreements are valued at an evaluated price as provided by independent pricing services or independent brokers. Forward foreign currency exchange contracts are valued at the mean of the appropriate forward exchange rate at the close of the NYSE as provided by an independent pricing service.
If the fund determines that the market price for an investment is not readily available or the valuation methods mentioned above do not reflect an investment’s fair value, such investment is valued as determined in good faith by the Board of Directors or its delegate, in accordance with policies and procedures adopted by the Board of Directors. In its determination of fair value, the fund may review several factors including, but not limited to, market information regarding the specific investment or comparable investments and correlation with other investment types, futures indices or general market indicators. Circumstances that may cause the fund to use these procedures to value an investment include, but are not limited to: an investment has been declared in default or is distressed; trading in a security has been suspended during the trading day or a security is not actively trading on its principal exchange; prices received from a regular pricing source are deemed unreliable; or there is a foreign market holiday and no trading occurred.
The fund monitors for significant events occurring after the close of an investment’s primary exchange but before the fund’s net asset value per share is determined. Significant events may include, but are not limited to: corporate announcements and transactions; governmental action and political unrest that could impact a specific investment or an investment sector; or armed conflicts, natural disasters and similar events that could affect investments in a specific country or region. The fund also monitors for significant fluctuations between domestic and foreign markets, as evidenced by the U.S. market or such other indicators that the Board of Directors, or its delegate, deems appropriate. If significant fluctuations in foreign markets are identified, the fund may apply a model-derived factor to the closing price of equity securities traded on foreign securities exchanges. The factor is based on observable market data as provided by an independent pricing service.
Security Transactions — Security transactions are accounted for as of the trade date. Net realized gains and losses are determined on the identified cost basis, which is also used for federal income tax purposes. Certain countries impose taxes on realized gains on the sale of securities registered in their country. The fund records the foreign tax expense, if any, on an accrual basis. The foreign tax expense on realized gains and unrealized appreciation reduces the net realized gain (loss) on investment transactions and net unrealized appreciation (depreciation) on investments, respectively.
Investment Income — Dividend income less foreign taxes withheld, if any, is recorded as of the ex-dividend date. Distributions received on securities that represent a return of capital or long-term capital gain are recorded as a reduction of cost of investments and/or as a realized gain. The fund may estimate the components of distributions received that may be considered nontaxable distributions or long-term capital gain distributions for income tax purposes. Interest income less foreign taxes withheld, if any, is recorded on the accrual basis and includes paydown gain (loss) and accretion of discounts and amortization of premiums. Inflation adjustments related to inflation-linked debt securities are reflected as interest income.
Foreign Currency Translations — All assets and liabilities initially expressed in foreign currencies are translated into U.S. dollars at prevailing exchange rates at period end. The fund may enter into spot foreign currency exchange contracts to facilitate transactions denominated in a foreign currency. Purchases and sales of investment securities, dividend and interest income, spot foreign currency exchange contracts, and expenses are translated at the rates of exchange prevailing on the respective dates of such transactions. Net realized and unrealized foreign currency exchange gains or losses related to investment securities are a component of net realized gain (loss) on investment transactions and change in net unrealized appreciation (depreciation) on investments, respectively.
Income Tax Status — It is the fund’s policy to distribute substantially all net investment income and net realized gains to shareholders and to otherwise qualify as a regulated investment company under provisions of the Internal Revenue Code. Accordingly, no provision has been made for income taxes. The fund files U.S. federal, state, local and non-U.S. tax returns as applicable. The fund's tax returns are subject to examination by the relevant taxing authority until expiration of the applicable statute of limitations, which is generally three years from the date of filing but can be longer in certain jurisdictions. At this time, management believes there are no uncertain tax positions which, based on their technical merit, would not be sustained upon examination and for which it is reasonably possible that the total amounts of unrecognized tax benefits will significantly change in the next twelve months.
Segregated Assets — In accordance with the 1940 Act, the fund segregates assets on its books and records to cover certain types of investments, including, but not limited to, futures contracts, forward commitments, when-issued securities, swap agreements and certain forward foreign currency exchange contracts. American Century Investment Management, Inc. (ACIM) (the investment advisor) monitors, on a daily basis, the securities segregated to ensure the fund designates a sufficient amount of liquid assets, marked-to-market daily. The fund may also receive assets or be required to pledge assets at the custodian bank or with a broker for margin requirements on futures contracts, forward commitments and swap agreements.
Multiple Class — All shares of the fund represent an equal pro rata interest in the net assets of the class to which such shares belong, and have identical voting, dividend, liquidation and other rights and the same terms and conditions, except for class specific expenses and exclusive rights to vote on matters affecting only individual classes. Income, non-class specific expenses, and realized and unrealized capital gains and losses of the fund are allocated to each class of shares based on their relative net assets.
Distributions to Shareholders — Distributions from net investment income, if any, are generally declared and paid quarterly. Distributions from net realized gains, if any, are generally declared and paid annually.
Indemnifications — Under the corporation’s organizational documents, its officers and directors are indemnified against certain liabilities arising out of the performance of their duties to the fund. In addition, in the normal course of business, the fund enters into contracts that provide general indemnifications. The maximum exposure under these arrangements is unknown as this would involve future claims that may be made against a fund. The risk of material loss from such claims is considered by management to be remote.
3. Fees and Transactions with Related Parties
Certain officers and directors of the corporation are also officers and/or directors of American Century Companies, Inc. (ACC). The corporation’s investment advisor, ACIM, the corporation's distributor, American Century Investment Services, Inc. (ACIS), and the corporation’s transfer agent, American Century Services, LLC, are wholly owned, directly or indirectly, by ACC.
Management Fees — The corporation has entered into a management agreement with ACIM, under which ACIM provides the fund with investment advisory and management services in exchange for a single, unified management fee (the fee) per class. The agreement provides that all expenses of managing and operating the fund, except distribution and service fees, brokerage expenses, taxes, interest, fees and expenses of the independent directors (including legal counsel fees), and extraordinary expenses, will be paid by ACIM. The fee is computed and accrued daily based on each class’s daily net assets and paid monthly in arrears. The fee consists of (1) an Investment Category Fee based on the daily net assets of the fund and certain other accounts managed by the investment advisor that are in the same broad investment category as the fund and (2) a Complex Fee based on the assets of all the funds in the American Century Investments family of funds. The rates for the Investment Category Fee range from 0.7754% to 0.8929%. The rates for the Complex Fee range from 0.2500% to 0.3100% for the Investor Class, A Class, C Class and R Class. The rates for the Complex Fee range from 0.0500% to 0.1100% for the Institutional Class. During the year ended June 30, 2015, the investment advisor voluntarily agreed to waive 0.2000% of the fund's management fee. The investment advisor expects this waiver to continue until October 31, 2015, and cannot terminate it prior to such date without the approval of the Board of Directors. The total amount of the waiver for each class for the year ended June 30, 2015 was $58,692, $2,581, $21,721, $14,725 and $220 for the Investor Class, Institutional Class, A Class, C Class and R Class, respectively. The effective annual management fee before waiver for each class for the year ended June 30, 2015 was 1.08% for the Investor Class, A Class, C Class and R Class and 0.88% for the Institutional Class. The effective annual management fee after waiver for each class for the year ended June 30, 2015 was 0.88% for the Investor Class, A Class, C Class and R Class and 0.68% for the Institutional Class.
Distribution and Service Fees — The Board of Directors has adopted a separate Master Distribution and Individual Shareholder Services Plan for each of the A Class, C Class and R Class (collectively the plans), pursuant to Rule 12b-1 of the 1940 Act. The plans provide that the A Class will pay ACIS an annual distribution and service fee of 0.25%. The plans provide that the C Class will pay ACIS an annual distribution and service fee of 1.00%, of which 0.25% is paid for individual shareholder services and 0.75% is paid for distribution services. The plans provide that the R Class will pay ACIS an annual distribution and service fee of 0.50%. The fees are computed and accrued daily based on each class’s daily net assets and paid monthly in arrears. The fees are used to pay financial intermediaries for distribution and individual shareholder services. Fees incurred under the plans during the year ended June 30, 2015 are detailed in the Statement of Operations.
Directors' Fees and Expenses — The Board of Directors is responsible for overseeing the investment advisor’s management and operations of the fund. The directors receive detailed information about the fund and its investment advisor regularly throughout the year, and meet at least quarterly with management of the investment advisor to review reports about fund operations. The fund’s officers do not receive compensation from the fund.
Acquired Fund Fees and Expenses — The fund may invest in mutual funds, exchange-traded funds, and business development companies (the acquired funds). The fund will indirectly realize its pro rata share of the fees and expenses of the acquired funds in which it invests. These indirect fees and expenses are not paid out of the fund's assets but are reflected in the return realized by the fund on its investment in the acquired funds.
4. Investment Transactions
Purchases of investment securities, excluding short-term investments, for the year ended June 30, 2015 totaled $35,595,985, of which $8,820,279 represented U.S. Treasury and Government Agency obligations.
Sales of investment securities, excluding short-term investments, for the year ended June 30, 2015 totaled $42,460,266, of which $12,604,604 represented U.S. Treasury and Government Agency obligations.
5. Capital Share Transactions
Transactions in shares of the fund were as follows:
|
| | | | | | | | | | |
| | Year ended
June 30, 2015 | Year ended June 30, 2014 |
| | Shares | Amount | Shares | Amount |
| Investor Class/Shares Authorized | 50,000,000 |
| | 50,000,000 |
| |
| Sold | 1,296,364 |
| $ | 13,315,015 |
| 544,078 |
| $ | 5,523,649 |
|
| Issued in reinvestment of distributions | 20,753 |
| 210,942 |
| 4,799 |
| 48,089 |
|
| Redeemed | (1,487,088 | ) | (14,658,510 | ) | (2,467,593 | ) | (24,881,633 | ) |
| | (169,971 | ) | (1,132,553 | ) | (1,918,716 | ) | (19,309,895 | ) |
| Institutional Class/Shares Authorized | 30,000,000 |
| | 50,000,000 |
| |
| Sold | 29,488 |
| 295,312 |
| 35,822 |
| 363,229 |
|
| Issued in reinvestment of distributions | 1,764 |
| 17,817 |
| 967 |
| 9,703 |
|
| Redeemed | (44,989 | ) | (437,567 | ) | (208,798 | ) | (2,106,791 | ) |
| | (13,737 | ) | (124,438 | ) | (172,009 | ) | (1,733,859 | ) |
| A Class/Shares Authorized | 40,000,000 |
| | 50,000,000 |
| |
| Sold | 33,869 |
| 338,497 |
| 159,775 |
| 1,622,519 |
|
| Issued in reinvestment of distributions | 5,446 |
| 55,711 |
| — |
| — |
|
| Redeemed | (501,558 | ) | (4,982,560 | ) | (1,156,419 | ) | (11,659,981 | ) |
| | (462,243 | ) | (4,588,352 | ) | (996,644 | ) | (10,037,462 | ) |
| C Class/Shares Authorized | 20,000,000 |
| | 50,000,000 |
| |
| Sold | 32,327 |
| 316,647 |
| 171,152 |
| 1,695,940 |
|
| Redeemed | (324,564 | ) | (3,109,811 | ) | (420,690 | ) | (4,171,635 | ) |
| | (292,237 | ) | (2,793,164 | ) | (249,538 | ) | (2,475,695 | ) |
| R Class/Shares Authorized | 15,000,000 |
| | 10,000,000 |
| |
| Sold | 24 |
| 237 |
| 800 |
| 8,015 |
|
| Issued in reinvestment of distributions | 22 |
| 221 |
| — |
| — |
|
| Redeemed | — |
| — |
| (3,519 | ) | (35,300 | ) |
| | 46 |
| 458 |
| (2,719 | ) | (27,285 | ) |
| Net increase (decrease) | (938,142 | ) | $ | (8,638,049 | ) | (3,339,626 | ) | $ | (33,584,196 | ) |
6. Fair Value Measurements
The fund’s investments valuation process is based on several considerations and may use multiple inputs to determine the fair value of the investments held by the fund. In conformity with accounting principles generally accepted in the United States of America, the inputs used to determine a valuation are classified into three broad levels.
| |
| • | Level 1 valuation inputs consist of unadjusted quoted prices in an active market for identical investments. |
| |
| • | Level 2 valuation inputs consist of direct or indirect observable market data (including quoted prices for comparable investments, evaluations of subsequent market events, interest rates, prepayment speeds, credit risk, etc.). These inputs also consist of quoted prices for identical investments initially expressed in local currencies that are adjusted through translation into U.S. dollars. |
| |
| • | Level 3 valuation inputs consist of unobservable data (including a fund’s own assumptions). |
The level classification is based on the lowest level input that is significant to the fair valuation measurement. The valuation inputs are not necessarily an indication of the risks associated with investing in these securities or other financial instruments. There were no significant transfers between levels during the period.
The following is a summary of the level classifications as of period end. The Schedule of Investments provides additional information on the fund’s portfolio holdings.
|
| | | | | | | | |
| | Level 1 | Level 2 | Level 3 |
| Assets | | | |
| Investment Securities | | | |
| U.S. Treasury Securities | — |
| $ | 14,495,075 |
| — |
|
| Common Stocks | | | |
| Energy Equipment and Services | $ | 497,256 |
| 74,790 |
| — |
|
| Hotels, Restaurants and Leisure | 291,698 |
| 77,622 |
| — |
|
| Metals and Mining | 149,858 |
| 73,347 |
| — |
|
| Oil, Gas and Consumable Fuels | 1,982,343 |
| 167,553 |
| — |
|
| Real Estate Investment Trusts (REITs) | 2,179,797 |
| 1,473,359 |
| — |
|
| Real Estate Management and Development | 223,593 |
| 1,415,886 |
| — |
|
| Other Industries | 352,438 |
| — |
| — |
|
| Commercial Paper | — |
| 7,296,202 |
| — |
|
| Exchange-Traded Funds | 4,485,722 |
| — |
| — |
|
| Collateralized Mortgage Obligations | — |
| 1,351,675 |
| — |
|
| Corporate Bonds | — |
| 1,276,122 |
| — |
|
| Asset-Backed Securities | — |
| 268,633 |
| — |
|
| Commercial Mortgage-Backed Securities | — |
| 183,581 |
| — |
|
| Temporary Cash Investments | 807,407 |
| — |
| — |
|
| | $ | 10,970,112 |
| $ | 28,153,845 |
| — |
|
| Other Financial Instruments | | | |
| Swap Agreements | — |
| $ | 229 |
| — |
|
| Forward Foreign Currency Exchange Contracts | — |
| 95,133 |
| — |
|
| | — |
| $ | 95,362 |
| — |
|
| | | | |
| Liabilities | | | |
| Other Financial Instruments | | | |
| Swap Agreements | — |
| $ | (120,947 | ) | — |
|
| Forward Foreign Currency Exchange Contracts | — |
| (91,761 | ) | — |
|
| | — |
| $ | (212,708 | ) | — |
|
7. Derivative Instruments
Foreign Currency Risk — The fund is subject to foreign currency exchange rate risk in the normal course of pursuing its investment objectives. The value of foreign investments held by a fund may be significantly affected by changes in foreign currency exchange rates. The dollar value of a foreign security generally decreases when the value of the dollar rises against the foreign currency in which the security is denominated and tends to increase when the value of the dollar declines against such foreign currency. A fund may enter into forward foreign currency exchange contracts to reduce a fund's exposure to foreign currency exchange rate fluctuations or to gain exposure to the fluctuations in the value of foreign currencies. The net U.S. dollar value of foreign currency underlying all contractual commitments held by a fund and the resulting unrealized appreciation or depreciation are determined daily. Realized gain or loss is recorded upon the termination of the contract. Net realized and unrealized gains or losses occurring during the holding period of forward foreign currency exchange contracts are a component of net realized gain (loss) on foreign currency transactions and change in net unrealized appreciation (depreciation) on translation of assets and liabilities in foreign currencies, respectively. A fund bears the risk of an unfavorable change in the foreign currency exchange rate underlying the forward contract. Additionally, losses, up to the fair value, may arise if the counterparties do not perform under the contract terms. The fund's average U.S. dollar exposure to foreign currency risk derivative instruments held during the period was $52,374,004.
Interest Rate Risk — The fund is subject to interest rate risk in the normal course of pursuing its investment objectives. The value of bonds generally declines as interest rates rise. A fund may enter into futures contracts based on a bond index or a specific underlying security. A fund may purchase futures contracts to gain exposure to increases in market value or sell futures contracts to protect against a decline in market value. Upon entering into a futures contract, a fund will segregate cash, cash equivalents or other appropriate liquid securities on its records in amounts sufficient to meet requirements. Subsequent payments (variation margin) are made or received daily, in cash, by a fund. The variation margin is equal to the daily change in the contract value and is recorded as unrealized gains and losses. A fund recognizes a realized gain or loss when the futures contract is closed or expires. Net realized and unrealized gains or losses occurring during the holding period of futures contracts are a component of net realized gain (loss) on futures contract transactions and change in net unrealized appreciation (depreciation) on futures contracts, respectively. One of the risks of entering into futures contracts is the possibility that the change in value of the contract may not correlate with the changes in value of the underlying securities. The fund's average exposure to interest rate risk derivative instruments held during the period was 19 contracts.
Other Contracts — A fund may enter into total return swap agreements in order to attempt to obtain or preserve a particular return or spread at a lower cost than obtaining a return or spread through purchases and/or sales of instruments in other markets or gain exposure to certain markets in the most economical way possible. A fund will segregate cash, cash equivalents or other appropriate liquid securities on its records in amounts sufficient to meet requirements. Changes in value, including the periodic amounts of interest to be paid or received on swap agreements, are recorded as unrealized appreciation (depreciation) on swap agreements. Realized gain or loss is recorded upon receipt or payment of a periodic settlement or termination of swap agreements. Net realized and unrealized gains or losses occurring during the holding period of swap agreements are a component of net realized gain (loss) on swap agreement transactions and change in net unrealized appreciation (depreciation) on swap agreements, respectively. The risks of entering into swap agreements include the possible lack of liquidity, failure of the counterparty to meet its obligations, and that there may be unfavorable changes in the underlying investments or instruments, including inflationary risk. The fund's average notional amount held during the period was $3,783,333.
Value of Derivative Instruments as of June 30, 2015
|
| | | | | | | | |
| | Asset Derivatives | | Liability Derivatives | |
| Type of Risk Exposure | Location on Statement of Assets and Liabilities | Value | Location on Statement of Assets and Liabilities | Value |
| Foreign Currency Risk | Unrealized appreciation on forward foreign currency exchange contracts | $ | 95,133 |
| Unrealized depreciation on forward foreign currency exchange contracts | $ | 91,761 |
|
| Other Contracts | Swap agreements | 229 |
| Swap agreements | 120,947 |
|
| | | $ | 95,362 |
| | $ | 212,708 |
|
Effect of Derivative Instruments on the Statement of Operations for the Year Ended June 30, 2015
|
| | | | | | | | |
| | Net Realized Gain (Loss) | | Change in Net Unrealized Appreciation (Depreciation) | |
| Type of Risk Exposure | Location on Statement of Operations | Value | Location on Statement of Operations | Value |
| Foreign Currency Risk | Net realized gain (loss) on foreign currency transactions | $ | (751,870 | ) | Change in net unrealized appreciation (depreciation) on translation of assets and liabilities in foreign currencies | $ | (48,271 | ) |
| Interest Rate Risk | Net realized gain (loss) on futures contract transactions | (102,100 | ) | Change in net unrealized appreciation (depreciation) on futures contracts | (16,308 | ) |
| Other Contracts | Net realized gain (loss) on swap agreement transactions | — |
| Change in net unrealized appreciation (depreciation) on swap agreements | (120,359 | ) |
| | | $ | (853,970 | ) | | $ | (184,938 | ) |
8. Risk Factors
There are certain risks involved in investing in foreign securities. These risks include those resulting from future adverse political, social and economic developments, fluctuations in currency exchange rates, the possible imposition of exchange controls, and other foreign laws or restrictions. Investing in emerging markets may accentuate these risks.
There are certain risks involved with investing in forward foreign currency exchange contracts. Changes in the value of foreign currencies against the U.S. dollar could result in gains or losses to the fund. The value of a share of the fund is determined in U.S. dollars. As a result, the fund could recognize a gain or loss based solely upon a change in the exchange rate between the foreign currency and the U.S. dollar. Changes in exchange rates may increase losses and lower gains from the fund’s investments. The overall impact on the fund may be significant depending on the currencies represented in the portfolio and how each one appreciates or depreciates in relation to the U.S. dollar. Currency trends are unpredictable and exchange rates in foreign currencies may fluctuate significantly over short periods of time for a number of reasons, including changes in interest rates, intervention (or the failure to intervene) by U.S. or foreign governments, central banks or Supranational entities, or by the imposition of currency controls or other political developments in the United States or abroad.
The fund’s commodity- and gold-related investments may be subject to greater volatility than investments in traditional securities. The value of the fund’s commodity- and gold-related investments may be affected by changes in overall market movements, interest rate changes, and volatility in commodity- and gold-related indices. The value of these investments may also be affected by factors affecting a particular commodity, such as weather, disease, embargoes, tariffs, taxes and economic, political and regulatory developments.
The fund may be subject to certain risks similar to those associated with direct investment in real estate including but not limited to: local or regional economic conditions, changes in zoning laws, changes in property values, property tax increases, overbuilding, increased competition, environmental contamination, natural disasters, and interest rate risk.
9. Federal Tax Information
The tax character of distributions paid during the years ended June 30, 2015 and June 30, 2014 were as follows:
|
| | | | | | |
| | 2015 | 2014 |
| Distributions Paid From | | |
| Ordinary income | $ | 368,931 |
| $ | 110,554 |
|
| Long-term capital gains | — |
| — |
|
The book-basis character of distributions made during the year from net investment income or net realized gains may differ from their ultimate characterization for federal income tax purposes. These differences reflect the differing character of certain income items and net realized gains and losses for financial statement and tax purposes, and may result in reclassification among certain capital accounts on the financial statements.
The reclassifications, which are primarily due to foreign currency gains and losses, were made to capital $(3,649), distributions in excess of net investment income $(563,951), and accumulated net realized loss $567,600.
As of June 30, 2015, the federal tax cost of investments and the components of distributable earnings on a tax-basis were as follows:
|
| | | |
| Federal tax cost of investments | $ | 39,018,330 |
|
| Gross tax appreciation of investments | $ | 1,293,189 |
|
| Gross tax depreciation of investments | (1,187,562 | ) |
| Net tax appreciation (depreciation) of investments | 105,627 |
|
Net tax appreciation (depreciation) on derivatives and translation of assets and liabilities in foreign currencies | (125,044 | ) |
| Net tax appreciation (depreciation) | $ | (19,417 | ) |
| Other book-to-tax adjustments | $ | (3,625 | ) |
| Undistributed ordinary income | — |
|
| Accumulated short-term capital losses | $ | (3,158,992 | ) |
| Accumulated long-term capital losses | $ | (1,963,798 | ) |
| Late-year ordinary loss deferral | $ | (759,823 | ) |
The difference between book-basis and tax-basis unrealized appreciation (depreciation) is attributable primarily to the timing and recognition of partnership income. Other book-to-tax adjustments are attributable primarily to the tax deferral of losses on straddle positions.
Accumulated capital losses represent net capital loss carryovers that may be used to offset future realized capital gains for federal income tax purposes. The capital loss carryovers may be carried forward for an unlimited period. Future capital loss carryover utilization in any given year may be subject to Internal Revenue Code limitations.
Loss deferrals represent certain qualified losses that the fund has elected to treat as having been incurred in the following fiscal year for federal income tax purposes.
|
| | | | | | | | | | | | | | | | | |
| For a Share Outstanding Throughout the Years Ended June 30 (except as noted) |
| Per-Share Data | Ratios and Supplemental Data |
| | | Income From Investment Operations: | Distributions From: | | | Ratio to Average Net Assets of: | | |
| | Net Asset Value, Beginning of Period | Net Investment Income (Loss)(1) | Net Realized and Unrealized Gain (Loss) | Total From Investment Operations | Net Investment Income | Net Realized Gains | Total Distributions | Net Asset Value, End of Period | Total Return(2) | Operating Expenses(3) | Operating Expenses (before expense waiver)(3) | Net Investment Income (Loss) | Net Investment Income (Loss) (before expense waiver) | Portfolio Turnover Rate | Net Assets, End of Period (in thousands) |
| Investor Class |
| 2015 | $10.50 | 0.02 | (0.89) | (0.87) | (0.09) | — | (0.09) | $9.54 | (8.35)% | 0.89% | 1.09% | 0.24% | 0.04% | 93% |
| $24,054 |
|
| 2014 | $9.92 | 0.03 | 0.57 | 0.60 | (0.02) | — | (0.02) | $10.50 | 6.09% | 0.91% | 1.09% | 0.27% | 0.09% | 87% |
| $28,261 |
|
| 2013 | $9.99 | (0.03) | (0.04) | (0.07) | — | — | — | $9.92 | (0.70)% | 1.09% | 1.09% | (0.31)% | (0.31)% | 85% |
| $45,728 |
|
| 2012 | $10.71 | 0.01 | (0.57) | (0.56) | (0.13) | (0.03) | (0.16) | $9.99 | (5.32)% | 1.08% | 1.09% | 0.12% | 0.11% | 80% |
| $65,968 |
|
| 2011 | $9.59 | 0.12 | 1.10 | 1.22 | (0.10) | —(4) | (0.10) | $10.71 | 12.78% | 0.95% | 1.09% | 1.27% | 1.13% | 52% |
| $53,696 |
|
| Institutional Class |
| 2015 | $10.53 | 0.04 | (0.89) | (0.85) | (0.13) | — | (0.13) | $9.55 | (8.15)% | 0.69% | 0.89% | 0.44% | 0.24% | 93% |
| $1,102 |
|
| 2014 | $9.94 | 0.05 | 0.58 | 0.63 | (0.04) | — | (0.04) | $10.53 | 6.28% | 0.71% | 0.89% | 0.47% | 0.29% | 87% |
| $1,360 |
|
| 2013 | $9.99 | (0.02) | (0.03) | (0.05) | — | — | — | $9.94 | (0.40)% | 0.89% | 0.89% | (0.11)% | (0.11)% | 85% |
| $2,995 |
|
| 2012 | $10.71 | 0.04 | (0.58) | (0.54) | (0.15) | (0.03) | (0.18) | $9.99 | (5.13)% | 0.88% | 0.89% | 0.32% | 0.31% | 80% |
| $7,078 |
|
| 2011 | $9.59 | 0.15 | 1.09 | 1.24 | (0.12) | —(4) | (0.12) | $10.71 | 12.93% | 0.75% | 0.89% | 1.47% | 1.33% | 52% |
| $5,428 |
|
|
| | | | | | | | | | | | | | | | | |
| For a Share Outstanding Throughout the Years Ended June 30 (except as noted) |
| Per-Share Data | Ratios and Supplemental Data |
| | | Income From Investment Operations: | Distributions From: | | | Ratio to Average Net Assets of: | | |
| | Net Asset Value, Beginning of Period | Net Investment Income (Loss)(1) | Net Realized and Unrealized Gain (Loss) | Total From Investment Operations | Net Investment Income | Net Realized Gains | Total Distributions | Net Asset Value, End of Period | Total Return(2) | Operating Expenses(3) | Operating Expenses (before expense waiver)(3) | Net Investment Income (Loss) | Net Investment Income (Loss) (before expense waiver) | Portfolio Turnover Rate | Net Assets, End of Period (in thousands) |
| A Class |
| 2015 | $10.45 | —(4) | (0.89) | (0.89) | (0.05) | — | (0.05) | $9.51 | (8.59)% | 1.14% | 1.34% | (0.01)% | (0.21)% | 93% |
| $8,385 |
|
| 2014 | $9.87 | —(4) | 0.58 | 0.58 | — | — | — | $10.45 | 5.88% | 1.16% | 1.34% | 0.02% | (0.16)% | 87% |
| $14,044 |
|
| 2013 | $9.97 | (0.05) | (0.05) | (0.10) | — | — | — | $9.87 | (1.00)% | 1.34% | 1.34% | (0.56)% | (0.56)% | 85% |
| $23,108 |
|
| 2012 | $10.69 | (0.02) | (0.56) | (0.58) | (0.11) | (0.03) | (0.14) | $9.97 | (5.51)% | 1.33% | 1.34% | (0.13)% | (0.14)% | 80% |
| $31,305 |
|
| 2011 | $9.58 | 0.13 | 1.06 | 1.19 | (0.08) | —(4) | (0.08) | $10.69 | 12.50% | 1.20% | 1.34% | 1.02% | 0.88% | 52% |
| $30,416 |
|
| C Class |
| 2015 | $10.23 | (0.08) | (0.87) | (0.95) | — | — | — | $9.28 | (9.29)% | 1.89% | 2.09% | (0.76)% | (0.96)% | 93% |
| $5,479 |
|
| 2014 | $9.74 | (0.07) | 0.56 | 0.49 | — | — | — | $10.23 | 5.03% | 1.91% | 2.09% | (0.73)% | (0.91)% | 87% |
| $9,029 |
|
| 2013 | $9.90 | (0.12) | (0.04) | (0.16) | — | — | — | $9.74 | (1.62)% | 2.09% | 2.09% | (1.31)% | (1.31)% | 85% |
| $11,025 |
|
| 2012 | $10.65 | (0.08) | (0.59) | (0.67) | (0.05) | (0.03) | (0.08) | $9.90 | (6.33)% | 2.08% | 2.09% | (0.88)% | (0.89)% | 80% |
| $8,667 |
|
| 2011 | $9.57 | 0.08 | 1.03 | 1.11 | (0.03) | —(4) | (0.03) | $10.65 | 11.64% | 1.95% | 2.09% | 0.27% | 0.13% | 52% |
| $6,167 |
|
| R Class |
| 2015 | $10.38 | (0.03) | (0.89) | (0.92) | (0.02) | — | (0.02) | $9.44 | (8.88)% | 1.39% | 1.59% | (0.26)% | (0.46)% | 93% |
| $106 |
|
| 2014 | $9.83 | (0.02) | 0.57 | 0.55 | — | — | — | $10.38 | 5.60% | 1.41% | 1.59% | (0.23)% | (0.41)% | 87% |
| $116 |
|
| 2013 | $9.94 | (0.08) | (0.03) | (0.11) | — | — | — | $9.83 | (1.11)% | 1.59% | 1.59% | (0.81)% | (0.81)% | 85% |
| $136 |
|
| 2012 | $10.67 | (0.04) | (0.57) | (0.61) | (0.09) | (0.03) | (0.12) | $9.94 | (5.78)% | 1.58% | 1.59% | (0.38)% | (0.39)% | 80% |
| $137 |
|
| 2011 | $9.58 | 0.01 | 1.15 | 1.16 | (0.07) | —(4) | (0.07) | $10.67 | 12.10% | 1.45% | 1.59% | 0.77% | 0.63% | 52% |
| $124 |
|
|
|
| Notes to Financial Highlights |
| |
| (1) | Computed using average shares outstanding throughout the period. |
| |
| (2) | Total returns are calculated based on the net asset value of the last business day and do not reflect applicable sales charges, if any. Total returns for periods less than one year are not annualized. |
| |
| (3) | Ratio of operating expenses to average net assets does not include any fees and expenses of the acquired funds. |
| |
| (4) | Per-share amount was less than $0.005. |
See Notes to Financial Statements.
|
|
| Report of Independent Registered Public Accounting Firm |
To the Directors of the American Century Quantitative Equity Funds, Inc. and Shareholders of the Strategic Inflation Opportunities Fund:
In our opinion, the accompanying statement of assets and liabilities, including the schedule of investments, and the related statements of operations and of changes in net assets and the financial highlights present fairly, in all material respects, the financial position of the Strategic Inflation Opportunities Fund (one of the sixteen funds comprising the American Century Quantitative Equity Funds, Inc., hereafter referred to as the “Fund”) at June 30, 2015, the results of its operations for the year then ended, the changes in its net assets for each of the two years in the period then ended and the financial highlights for each of the five years in the period then ended, in conformity with accounting principles generally accepted in the United States of America. These financial statements and financial highlights (hereafter referred to as "financial statements") are the responsibility of the Fund's management. Our responsibility is to express an opinion on these financial statements based on our audits. We conducted our audits of these financial statements in accordance with the standards of the Public Company Accounting Oversight Board (United States). Those standards require that we plan and perform the audit to obtain reasonable assurance about whether the financial statements are free of material misstatement. An audit includes examining, on a test basis, evidence supporting the amounts and disclosures in the financial statements, assessing the accounting principles used and significant estimates made by management, and evaluating the overall financial statement presentation. We believe that our audits, which included confirmation of securities at June 30, 2015 by correspondence with the custodian and brokers, provide a reasonable basis for our opinion.
PricewaterhouseCoopers LLP
Kansas City, Missouri
August 21, 2015
Board of Directors
The individuals listed below serve as directors of the funds. Each director will continue to serve in this capacity until death, retirement, resignation or removal from office. The board has adopted a mandatory retirement age for directors who are not “interested persons,” as that term is defined in the Investment Company Act (independent directors). Independent directors shall retire on December 31 of the year in which they reach their 75th birthday; provided, however, that on or after January 1, 2022, independent directors shall retire on December 31 of the year in which they reach their 76th birthday.
Mr. Thomas is an “interested person” because he currently serves as President and Chief Executive Officer of American Century Companies, Inc. (ACC), the parent company of American Century Investment Management, Inc. (ACIM or the advisor). The other directors (more than three-fourths of the total number) are independent. They are not employees, directors or officers of, and have no financial interest in, ACC or any of its wholly owned, direct or indirect, subsidiaries, including ACIM, American Century Investment Services, Inc. (ACIS) and American Century Services, LLC (ACS), and they do not have any other affiliations, positions or relationships that would cause them to be considered “interested persons” under the Investment Company Act. The directors serve in this capacity for eight (in the case of Mr. Thomas, 15) registered investment companies in the American Century Investments family of funds.
The following table presents additional information about the directors. The mailing address for each director other than Mr. Thomas is 1665 Charleston Road, Mountain View, California 94043. The mailing address for Mr. Thomas is 4500 Main Street, Kansas City, Missouri 64111.
|
| | | | | |
Name (Year of Birth) | Position(s) Held with Funds | Length of Time Served | Principal Occupation(s) During Past 5 Years | Number of American Century Portfolios Overseen by Director | Other Directorships Held During Past 5 Years |
Independent Directors | | |
Tanya S. Beder
(1955) | Director | Since 2011 | Chairman and CEO, SBCC Group Inc. (independent advisory services) (2006 to present) | 46 | CYS Investments, Inc. (NYSE mortgage arbitrage REIT) |
Jeremy I. Bulow
(1954) | Director | Since 2011 | Professor of Economics, Stanford University, Graduate School of Business (1979 to present) | 46 | None |
Ronald J. Gilson
(1946) | Director and Chairman of the Board | Since 1995
(Chairman since 2005) | Charles J. Meyers Professor of Law and Business, Stanford Law School (1979 to present); Marc and Eva Stern Professor of Law and Business, Columbia University School of Law (1992 to present) | 46 | None |
Frederick L. A. Grauer
(1946) | Director | Since 2008 | Senior Advisor, BlackRock, Inc. (investment management firm) (2010 to 2011, 2013 to present) | 46 | None |
Peter F. Pervere
(1947) | Director | Since 2007 | Retired | 46 | None |
|
| | | | | |
Name (Year of Birth) | Position(s) Held with Funds | Length of Time Served | Principal Occupation(s) During Past 5 Years | Number of American Century Portfolios Overseen by Director | Other Directorships Held During Past 5 Years |
| Independent Directors | | |
John B. Shoven
(1947) | Director | Since 2002 | Professor of Economics, Stanford University (1973 to present) | 46 | Cadence Design Systems; Exponent; Financial Engines |
| Interested Director | | |
Jonathan S. Thomas
(1963) | Director and President | Since 2007 | President and Chief Executive Officer, ACC (March 2007 to present). Also serves as Chief Executive Officer, ACS; Executive Vice President, ACIM; Director, ACC, ACIM and other ACC subsidiaries | 124 | BioMed Valley Discoveries, Inc. |
The Statement of Additional Information has additional information about the fund's directors and is available without charge, upon request, by calling 1-800-345-2021.
Officers
The following table presents certain information about the executive officers of the funds. Each officer serves as an officer for each of the 15 investment companies in the American Century family of funds, unless otherwise noted. No officer is compensated for his or her service as an officer of the funds. The listed officers are interested persons of the funds and are appointed or re-appointed on an annual basis. The mailing address for each of the officers listed below is 4500 Main Street, Kansas City, Missouri 64111.
|
| | |
Name (Year of Birth) | Offices with
the Funds | Principal Occupation(s) During the Past Five Years |
Jonathan S.
Thomas
(1963) | Director and President
since 2007 | President and Chief Executive Officer, ACC (March 2007 to present). Also serves as Chief Executive Officer, ACS; Executive Vice President, ACIM; Director, ACC, ACIM and other ACC subsidiaries |
Amy D. Shelton
(1964) | Chief Compliance Officer and Vice President since 2014 | Chief Compliance Officer, American Century funds, (March 2014 to present); Chief Compliance Officer, ACIM (February 2014 to present); Chief Compliance Officer, ACIS (October 2009 to present); Vice President, Client Interactions and Marketing, ACIS (February 2013 to January 2014); Director, Client Interactions and Marketing, ACIS (June 2007 to January 2013). Also serves as Vice President, ACIS |
Charles A. Etherington
(1957) | General Counsel since 2007 and Senior Vice President since 2006 | Attorney, ACC (February 1994 to present); Vice President, ACC (November 2005 to present); General Counsel, ACC (March 2007 to present). Also serves as General Counsel, ACIM, ACS, ACIS and other ACC subsidiaries; and Senior Vice President, ACIM and ACS |
C. Jean Wade
(1964) | Vice President,
Treasurer and
Chief Financial
Officer since 2012 | Vice President, ACS (February 2000 to present) |
Robert J. Leach
(1966) | Vice President
since 2006 and
Assistant Treasurer
since 2012 | Vice President, ACS (February 2000 to present) |
David H. Reinmiller
(1963) | Vice President since 2001 | Attorney, ACC (January 1994 to present); Associate General Counsel, ACC (January 2001 to present). Also serves as Vice President, ACIM and ACS |
Ward D. Stauffer
(1960) | Secretary since 2005 | Attorney, ACC (June 2003 to present) |
|
|
| Approval of Management Agreement |
At a meeting held on June 16, 2015, the Fund’s Board of Directors unanimously approved the renewal of the management agreement pursuant to which American Century Investment Management, Inc. (the “Advisor”) acts as the investment advisor for the Fund. Under Section 15(c) of the Investment Company Act, contracts for investment advisory services are required to be reviewed, evaluated, and approved by a majority of a fund’s directors/trustees, including a majority of the independent Directors, each year. The Board regards this annual evaluation and renewal as one of its most important responsibilities.
The independent Directors have memorialized a statement regarding the relationship between their ongoing obligations to oversee and evaluate the performance of the Advisor and their annual consideration of renewal of the management agreement. In that statement, the independent Directors noted that their assessment of the Advisor’s performance is an ongoing process that takes place over the entire year and is informed by all of the extensive information that the Board and its committees receive and consider over time. This information, together with the materials provided in connection with the review, are central to the Board’s assessment of the Advisor’s performance and its determination whether to renew the Fund’s management agreement.
Prior to its consideration of the renewal of the management agreement, the Board requested and reviewed extensive data and analysis relating to the proposed renewal. This information and analysis was compiled by the Advisor and certain independent providers of evaluation data concerning the Fund and the services provided to the Fund by the Advisor.
In connection with its consideration of the renewal of the management agreement, the Board’s review and evaluation of the services provided by the Advisor included, but was not limited to, the following:
| |
| • | the nature, extent, and quality of investment management, shareholder services, and other services provided by the Advisor to the Fund; |
| |
| • | the wide range of other programs and services the Advisor provides to the Fund and its shareholders on a routine and non-routine basis; |
| |
| • | the investment performance of the Fund, including data comparing the Fund’s performance to appropriate benchmarks and/or a peer group of other mutual funds with similar investment objectives and strategies; |
| |
| • | the cost of owning the Fund compared to the cost of owning similar funds; |
| |
| • | the Advisor’s compliance policies, procedures, and regulatory experience; |
| |
| • | financial data showing the cost of services provided to the Fund, the profitability of the Fund to the Advisor, and the overall profitability of the Advisor; |
| |
| • | possible economies of scale associated with the Advisor’s management of the Fund and other accounts under its management; |
| |
| • | data comparing services provided and charges to other investment management clients of the Advisor; |
| |
| • | acquired fund fees and expenses; |
| |
| • | payments by the Fund and the Advisor to financial intermediaries whose clients are investors in the Fund; and |
| |
| • | any collateral benefits derived by the Advisor from the management of the Fund. |
In keeping with its practice, the Board held two in-person meetings to review and discuss the information provided in response to their request. The independent Directors also had the benefit of the advice of their independent counsel throughout the process.
Factors Considered
The Directors considered all of the information provided by the Advisor, the independent data providers, and the independent Directors’ independent counsel in connection with the review, and evaluated such information for the Fund. In connection with their review, the Directors did not identify any single factor as being all-important or controlling and each Director may have attributed different levels of importance to different factors. In deciding to renew the management agreement, the Board based its decision on a number of factors, including the following:
Nature, Extent and Quality of Services - Generally. Under the management agreement, the Advisor is responsible for providing or arranging for all services necessary for the operation of the Fund. The Board noted that under the management agreement, the Advisor provides or arranges at its own expense a wide variety of services including:
| |
| • | constructing and designing the Fund |
| |
| • | portfolio research and security selection |
| |
| • | initial capitalization/funding |
| |
| • | daily valuation of the Fund’s portfolio |
| |
| • | shareholder servicing and transfer agency, including shareholder confirmations, recordkeeping, and communications |
| |
| • | legal services (except the independent Directors’ counsel) |
| |
| • | regulatory and portfolio compliance |
| |
| • | marketing and distribution (except amounts paid by the Fund under Rule 12b-1 plans) |
The Board noted that many of these services have expanded over time both in terms of quantity and complexity in response to shareholder demands, competition in the industry, changing distribution channels, and the changing regulatory environment.
Investment Management, Shareholder, and Other Services. The nature of the investment management services provided to the Fund is quite complex and allows Fund shareholders access to professional money management, instant diversification of their investments within an asset class, the opportunity to easily diversify among asset classes by investing in or exchanging among various American Century Investments funds, and liquidity. In evaluating investment performance, the Board expects the Advisor to manage the Fund in accordance with its investment objectives and approved strategies. Further, the Directors recognize that the Advisor has an obligation to seek the best execution of fund trades. In providing these services, the Advisor utilizes teams of investment professionals (portfolio managers, analysts, research assistants, and securities traders) who require extensive information technology, research, training, compliance, and other systems to conduct their business. The Board, directly and through its Portfolio Committee, regularly reviews investment performance information for the Fund, together with comparative information for appropriate benchmarks and/or peer groups of similarly-managed funds, over different time horizons. The Directors also review detailed performance information during the management agreement approval process. If performance concerns are identified, the Fund receives special reviews until performance improves, during which the Board discusses with the Advisor the reasons for such results (e.g., market conditions, security selection) and any efforts being undertaken to improve performance. The Fund’s performance was above its benchmark for the one- and three-year periods reviewed by the Board. The Board found the investment management services provided by the Advisor to the Fund to be satisfactory and consistent with the management agreement.
Under the management agreement, the Advisor provides the Fund with a comprehensive package of transfer agency, shareholder, and other services. The Board, directly and through various committees of the Board, regularly reviews reports and evaluations of such services at its regular
meetings. These reports include, but are not limited to, information regarding the operational efficiency and accuracy of the shareholder and transfer agency services provided, staffing levels, shareholder satisfaction (as measured by external as well as internal sources), technology support, new products and services offered to Fund shareholders, securities trading activities, portfolio valuation services, auditing services, and legal and operational compliance activities.
Certain aspects of shareholder and transfer agency service level efficiency and the quality of securities trading activities are measured by independent third party providers and are presented in comparison to other fund groups not managed by the Advisor. The Board found the services provided by the Advisor to the Fund under the management agreement to be competitive and of high quality.
Costs of Services and Profitability. The Advisor provides detailed information concerning its cost of providing various services to the Fund, its profitability in managing the Fund, its overall profitability, and its financial condition. The Directors have reviewed with the Advisor the methodology used to prepare this financial information. This information is considered in evaluating the Advisor’s financial condition, its ability to continue to provide services under the management agreement, and the reasonableness of the current management fee. The Board concluded that the Advisor’s profits were reasonable in light of the services provided to the Fund.
Ethics. The Board generally considers the Advisor’s commitment to providing quality services to shareholders and to conducting its business ethically. They noted that the Advisor’s practices generally meet or exceed industry best practices.
Economies of Scale. The Board also reviewed information provided by the Advisor regarding the possible existence of economies of scale in connection with the management of the Fund. The Board concluded that economies of scale are difficult to measure and predict with precision, especially on a fund-by-fund basis. The Board concluded that the Advisor is appropriately sharing economies of scale through its competitive fee structure, offering competitive fees from fund inception, and through reinvestment in its business to provide shareholders enhanced and expanded services.
Comparison to Other Funds’ Fees. The management agreement provides that the Fund pays the Advisor a single, all-inclusive (or unified) management fee for providing all services necessary for the management and operation of the Fund, other than brokerage expenses, taxes, interest, extraordinary expenses, the fees and expenses of the Fund’s independent Directors (including their independent legal counsel), and expenses incurred in connection with the provision of shareholder services and distribution services under a plan adopted pursuant to Rule 12b-1 under the 1940 Act. Under the unified fee structure, the Advisor is responsible for providing all investment advisory, custody, audit, administrative, compliance, recordkeeping, marketing, and shareholder services, or arranging and supervising third parties to provide such services. By contrast, most other funds are charged a variety of fees, including an investment advisory fee, a transfer agency fee, an administrative fee, distribution charges, and other expenses. Other than their investment advisory fees and any applicable Rule 12b-1 fees, all other components of the total fees charged by these other funds may be increased without shareholder approval. The Board believes the unified fee structure is a benefit to Fund shareholders because it clearly discloses to shareholders the cost of owning Fund shares, and, since the unified fee cannot be increased without a vote of Fund shareholders, it shifts to the Advisor the risk of increased costs of operating the Fund and provides a direct incentive to minimize administrative inefficiencies. Part of the Board’s analysis of fee levels involves reviewing certain evaluative data compiled by an independent provider and comparing the Fund’s unified fee to the total expense ratio of peer funds. The unified fee charged to shareholders of the Fund was below the median of the total expense ratios of the Fund’s peer universe. The Board concluded that the management fee paid by the Fund to the Advisor under the management agreement is reasonable in light of the services provided to the Fund.
Comparison to Fees and Services Provided to Other Clients of the Advisor. The Board also requested and received information from the Advisor concerning the nature of the services, fees, costs, and profitability of its advisory services to advisory clients other than the Fund. They observed that these varying types of client accounts require different services and involve different regulatory and entrepreneurial risks than the management of the Fund. The Board analyzed this information and concluded that the fees charged and services provided to the Fund were reasonable by comparison.
Payments to Intermediaries. The Directors also requested and received a description of payments made to intermediaries by the Fund and the Advisor. These payments include various payments made by the Fund or the Advisor to different types of intermediaries and recordkeepers for distribution and service activities provided for the Fund.
Collateral or “Fall-Out” Benefits Derived by the Advisor. The Board considered the existence of collateral benefits the Advisor may receive as a result of its relationship with the Fund. The Board noted that the Advisor’s primary business is managing mutual funds and it generally does not use fund or shareholder information to generate profits in other lines of business, and therefore does not derive any significant collateral benefits from them. The Board noted that the Advisor receives proprietary research from broker-dealers that execute fund portfolio transactions. The Board also determined that the Advisor is able to provide investment management services to certain clients other than the Fund, at least in part, due to its existing infrastructure built to serve the fund complex.
Existing Relationship. The Board also considered whether there was any reason for not continuing the existing arrangement with the Advisor. In this regard, the Board was mindful of the potential disruptions of the Fund’s operations and various risks, uncertainties, and other effects that could occur as a result of a decision not to continue such relationship. In particular, the Board recognized that most shareholders have invested in the Fund on the strength of the Advisor’s industry standing and reputation and in the expectation that the Advisor will have a continuing role in providing advisory services to the Fund.
Conclusion of the Directors. As a result of this process, the Board, including all of the independent Directors and assisted by the advice of independent legal counsel, taking into account all of the factors discussed above and the information provided by the Advisor and others in connection with its review and throughout the year, concluded that the management agreement between the Fund and the Advisor is fair and reasonable in light of the services provided and should be renewed.
Retirement Account Information
As required by law, distributions you receive from certain IRAs are subject to federal income tax withholding, unless you elect not to have withholding apply. Tax will be withheld on the total amount withdrawn even though you may be receiving amounts that are not subject to withholding, such as nondeductible contributions. In such case, excess amounts of withholding could occur. You may adjust your withholding election so that a greater or lesser amount will be withheld.
If you don’t want us to withhold on this amount, you must notify us to not withhold the federal income tax. You may notify us in writing or in certain situations by telephone or through other electronic means. For systematic withdrawals, your withholding election will remain in effect until revoked or changed by filing a new election. You have the right to revoke your election at any time.
Remember, even if you elect not to have income tax withheld, you are liable for paying income tax on the taxable portion of your withdrawal. If you elect not to have income tax withheld or you don’t have enough income tax withheld, you may be responsible for payment of estimated tax. You may incur penalties under the estimated tax rules if your withholding and estimated tax payments are not sufficient. You can reduce or defer the income tax on a distribution by directly or indirectly rolling such distribution over to another IRA or eligible plan. You should consult your tax advisor for additional information.
State tax will be withheld if, at the time of your distribution, your address is within one of the mandatory withholding states and you have federal income tax withheld (or as otherwise required by state law). State taxes will be withheld from your distribution in accordance with the respective state rules.
Distributions you receive from 403(b), 457 and qualified plans are subject to special tax and withholding rules. Your plan administrator or plan sponsor is required to provide you with a special tax notice explaining those rules at the time you request a distribution. If applicable, federal and/or state taxes may be withheld from your distribution amount.
Proxy Voting Policies
Descriptions of the principles and policies that the fund's investment advisor uses in exercising the voting rights associated with the securities purchased and/or held by the fund are available without charge, upon request, by calling 1-800-345-2021 or visiting the "About Us" page of American Century Investments’ website at americancentury.com. A description of the policies is also available on the Securities and Exchange Commission’s website at sec.gov. Information regarding how the investment advisor voted proxies relating to portfolio securities during the most recent 12-month period ended June 30 is available on the "About Us" page at americancentury.com. It is also available at sec.gov.
Quarterly Portfolio Disclosure
The fund files its complete schedule of portfolio holdings with the Securities and Exchange Commission (SEC) for the first and third quarters of each fiscal year on Form N-Q. The fund’s Forms N-Q are available on the SEC’s website at sec.gov, and may be reviewed and copied at the SEC’s Public Reference Room in Washington, DC. Information on the operation of the Public Reference Room may be obtained by calling 1-800-SEC-0330. The fund also makes its complete schedule of portfolio holdings for the most recent quarter of its fiscal year available on its website at americancentury.com and, upon request, by calling 1-800-345-2021.
Other Tax Information
The following information is provided pursuant to provisions of the Internal Revenue Code.
The fund hereby designates up to the maximum amount allowable as qualified dividend income for the fiscal year ended June 30, 2015.
For corporate taxpayers, the fund hereby designates $77,505, or up to the maximum amount allowable, of ordinary income distributions paid during the fiscal year ended June 30, 2015 as qualified for the corporate dividends received deduction.
|
| | |
| |
| | | |
| Contact Us | americancentury.com | |
| Automated Information Line | 1-800-345-8765 | |
| Investor Services Representative | 1-800-345-2021
or 816-531-5575 | |
| Investors Using Advisors | 1-800-378-9878 | |
Business, Not-For-Profit, Employer-Sponsored
Retirement Plans | 1-800-345-3533 | |
Banks and Trust Companies, Broker-Dealers,
Financial Professionals, Insurance Companies | 1-800-345-6488 | |
| Telecommunications Relay Service for the Deaf | 711 | |
| | | |
| American Century Quantitative Equity Funds, Inc. | |
| | | |
Investment Advisor: American Century Investment Management, Inc. Kansas City, Missouri | |
| | | |
| This report and the statements it contains are submitted for the general information of our shareholders. The report is not authorized for distribution to prospective investors unless preceded or accompanied by an effective prospectus. | |
| | | |
©2015 American Century Proprietary Holdings, Inc. All rights reserved.
CL-ANN-86508 1508 | |
|
| |
| ANNUAL REPORT | JUNE 30, 2015 |
Utilities Fund
|
| | |
| President's Letter | 2 |
|
| Performance | 3 |
|
| Portfolio Commentary | |
|
| Fund Characteristics | |
|
| Shareholder Fee Example | |
|
| Schedule of Investments | |
|
| Statement of Assets and Liabilities | |
|
| Statement of Operations | |
|
| Statement of Changes in Net Assets | |
|
| Notes to Financial Statements | |
|
| Financial Highlights | |
|
| Report of Independent Registered Public Accounting Firm | |
|
| Management | |
|
| Approval of Management Agreement | |
|
| Additional Information | |
|
Any opinions expressed in this report reflect those of the author as of the date of the report, and do not necessarily represent the opinions of American Century Investments® or any other person in the American Century Investments organization. Any such opinions are subject to change at any time based upon market or other conditions and American Century Investments disclaims any responsibility to update such opinions. These opinions may not be relied upon as investment advice and, because investment decisions made by American Century Investments funds are based on numerous factors, may not be relied upon as an indication of trading intent on behalf of any American Century Investments fund. Security examples are used for representational purposes only and are not intended as recommendations to purchase or sell securities. Performance information for comparative indices and securities is provided to American Century Investments by third party vendors. To the best of American Century Investments’ knowledge, such information is accurate at the time of printing.
|
| |
| Dear Investor:
Thank you for reviewing this annual report for the 12 months ended June 30, 2015. It provides investment performance and portfolio information for the reporting period, plus longer-term historical performance data.
Annual reports remain important vehicles for conveying information about fund returns, including market and economic factors that affected performance during the reporting period. For additional, updated investment and market insights, we encourage you to visit our website, americancentury.com. |
| Jonathan Thomas |
Global Divergence Favored U.S. Assets
“Global divergence” between the U.S. and the rest of the world emerged as a prevalent theme during the reporting period. This theme embraced not only the relatively stronger economic growth enjoyed by the U.S. compared with most of the world, but also the related contrast between the U.S. Federal Reserve’s unwinding of monetary stimulus compared with the continuation and expansion of stimulus by other major central banks. Low inflation also prevailed, after crude oil prices plunged over 40% amid muted demand for commodities in general. In this environment, the U.S. dollar, U.S. growth stocks, and longer-maturity U.S. Treasuries generally benefited from “flight to quality” capital flows, reinforced by geopolitical and financial turmoil, particularly in Greece, Russia/Ukraine, China, and the Middle East.
Strong global capital flows into U.S. assets generated a global divergence between investment returns for U.S. and non-U.S. markets, especially for U.S. investors who realized their returns in dollar terms. For the reporting period, the U.S. Dollar Index, the S&P 500 Index, and the Barclays U.S. Aggregate Bond Index returned 19.74%, 7.42%, and 1.86%, respectively. By contrast, the MSCI EAFE Index, the MSCI Emerging Markets Index, and the Barclays Global Aggregate Bond ex-USD (Unhedged) Index returned -4.22%, -5.12%, and -13.19%, respectively, for U.S. investors unhedged for the strong dollar’s impact on non-dollar-denominated returns.
We expect more monetary policy divergence between the U.S. and other major developed economies in the coming months, accompanied by continued market volatility. This could present both challenges and opportunities for active investment managers. Upward pressures on inflation and interest rates could develop as the massive amount of global monetary stimulus in progress takes hold and economies improve. In this environment, we continue to believe in a disciplined, diversified, long-term investment approach, using professionally managed stock and bond portfolios to meet financial goals. We appreciate your continued trust in us.
Sincerely,
Jonathan Thomas
President and Chief Executive Officer
American Century Investments
|
| | | | | | |
| Total Returns as of June 30, 2015 |
| | | | Average Annual Returns | |
| | Ticker Symbol | 1 year | 5 years | 10 years | Since Inception | Inception Date |
| Investor Class | BULIX | -2.73% | 12.54% | 7.15% | 7.79% | 3/1/93 |
| Russell 3000 Utilities Index | — | -1.92% | 13.15% | 6.81% | N/A(1) | — |
| S&P 500 Index | — | 7.42% | 17.33% | 7.89% | 9.26% | — |
| |
| (1) | Benchmark data first available August 1996. |
|
|
| Growth of $10,000 Over 10 Years |
| $10,000 investment made June 30, 2005 |
|
| |
| Value on June 30, 2015 |
| | Investor Class — $19,954 |
| |
| | Russell 3000 Utilities Index — $19,323 |
| |
| | S&P 500 Index — $21,377 |
| |
|
| |
| Total Annual Fund Operating Expenses |
| Investor Class | 0.67% |
The total annual fund operating expenses shown is as stated in the fund’s prospectus current as of the date of this report. The prospectus may vary from the expense ratio shown elsewhere in this report because it is based on a different time period, includes acquired fund fees and expenses, and, if applicable, does not include fee waivers or expense reimbursements.
Data presented reflect past performance. Past performance is no guarantee of future results. Current performance may be higher or lower than the performance shown. Investment return and principal value will fluctuate, and redemption value may be more or less than original cost. Data assumes reinvestment of dividends and capital gains, and none of the charts reflect the deduction of taxes that a shareholder would pay on fund distributions or the redemption of fund shares. To obtain performance data current to the most recent month end, please call 1-800-345-2021 or visit americancentury.com. For additional information about the fund, please consult the prospectus.
Portfolio Managers: Bill Martin and Lynette Pang
Performance Summary
Utilities returned -2.73% for the 12 months ended June 30, 2015, underperforming the -1.92% return of its benchmark, the Russell 3000 Utilities Index. The S&P 500 Index, a broad market measure, returned 7.42%.
The U.S. stock market posted solid returns for the 12-month period, despite weakness at the end of the period due to global concerns. After a strong 2014, utility stocks declined during the year and lagged the overall market as the economy and employment data improved and investors increasingly anticipated that the Federal Reserve would begin to raise interest rates sometime in 2015. Dividend-paying utility stocks are often seen as a good alternative to bonds in a low interest rate environment, while higher bond yields typically reduce utilities’ appeal.
The Russell 3000 Utilities Index is primarily made up of utilities and telecommunication services stocks but includes smaller allocations to other sectors. Information technology stocks, a tiny segment of the index, performed well, as did industrial stocks, another very small category that includes certain construction and services companies related to the utilities industry. Telecommunication services stocks, which make up nearly 40% of the benchmark, returned just under 1.5%, while traditional utilities, which compose roughly 60% of the index, declined just almost 4.0%.
Stock selection in telecommunication services as well as an underweight to the subsector, was a significant source of fund underperformance relative to the benchmark. Positioning in information technology also hampered results. Stock selection among utilities stocks benefited results.
Telecommunication Services Stocks Were Key Detractors
Like the Russell benchmark, traditional utilities and telecommunication services stocks represent the vast majority of the fund’s holdings. Stock selection and an underweight to telecommunication services was a major detractor from results versus the benchmark. Overweight positions in voice over internet company magicJack VocalTec, communications satellite firm Intelsat, and bundled media provider CenturyLink, along with underweighting the better-performing AT&T, were the primary sources of underperformance. magicJack was eliminated from the portfolio.
Stock selection among information technology companies hampered relative results. The fund’s holding of communications equipment firm QUALCOMM, which is not in the benchmark, was a significant detractor in the subsector. The company lowered revenue guidance for the current fiscal year, but an activist investor is pressuring the company to cut costs and introduce shareholder-friendly practices such as stock repurchases.
Utilities and Industrials Benefited Results
Traditional utilities companies—the largest segment of the benchmark and fund—added to relative results through stock selection. The independent power and renewable electricity producers industry has been especially weak over the past year as natural gas prices have declined, hurting profitability. Not owning a number of benchmark stocks in the industry aided fund results. Multi-utilities, a category that includes firms with diversified utility businesses, held up fairly well during the period, and overweights to PG&E, Public Service Enterprise Group, and Consolidated Edison were helpful.
The tiny industrials segment was a key contributor, driven by an industry overweight. Pike Corp., a construction and engineering company whose services are directed to the electric energy industry, was a major positive contributor, as was services firm West Corp. Pike was eliminated.
Elsewhere, an overweight in Inteliquent was a major contributor. The company is a voice telecommunications wholesaler that sells to larger firms such as AT&T. The stock performed well after reporting better-than-expected results for the first quarter of 2015.
Outlook
Utilities employs a structured, disciplined investment approach. The management team incorporates both growth and value measures into its stock selection process and attempts to balance the portfolio’s risk and expected return.
The team continues to overweight utilities. Telecommunication services is significantly underweight as a result of only modest exposure to diversified telecommunication services firms.
|
| |
| JUNE 30, 2015 |
| Top Ten Holdings | % of net assets |
| AT&T, Inc. | 11.6% |
| Verizon Communications, Inc. | 10.7% |
| American Electric Power Co., Inc. | 4.6% |
| PPL Corp. | 4.6% |
| PG&E Corp. | 4.6% |
| Consolidated Edison, Inc. | 4.6% |
| Public Service Enterprise Group, Inc. | 4.5% |
| Exelon Corp. | 4.4% |
| Edison International | 4.3% |
| CenturyLink, Inc. | 4.3% |
| | |
| Sub-Industry Allocation | % of net assets |
| Electric Utilities | 32.5% |
| Integrated Telecommunication Services | 29.7% |
| Multi-Utilities | 20.5% |
| Gas Utilities | 4.1% |
| Independent Power Producers and Energy Traders | 3.8% |
| Wireless Telecommunication Services | 3.5% |
| Alternative Carriers | 3.0% |
| Communications Equipment | 1.6% |
| Water Utilities | 0.7% |
| Cash and Equivalents* | 0.6% |
| *Includes temporary cash investments and other assets and liabilities. | |
| | |
| Types of Investments in Portfolio | % of net assets |
| Common Stocks | 99.4% |
| Temporary Cash Investments | 0.4% |
| Other Assets and Liabilities | 0.2% |
Fund shareholders may incur two types of costs: (1) transaction costs, including sales charges (loads) on purchase payments and redemption/exchange fees; and (2) ongoing costs, including management fees; distribution and service (12b-1) fees; and other fund expenses. This example is intended to help you understand your ongoing costs (in dollars) of investing in your fund and to compare these costs with the ongoing cost of investing in other mutual funds.
The example is based on an investment of $1,000 made at the beginning of the period and held for the entire period from January 1, 2015 to June 30, 2015.
Actual Expenses
The table provides information about actual account values and actual expenses for each class. You may use the information, together with the amount you invested, to estimate the expenses that you paid over the period. First, identify the share class you own. Then simply divide your account value by $1,000 (for example, an $8,600 account value divided by $1,000 = 8.6), then multiply the result by the number under the heading “Expenses Paid During Period” to estimate the expenses you paid on your account during this period.
If you hold Investor Class shares of any American Century Investments fund, or Institutional Class shares of the American Century Diversified Bond Fund, in an American Century Investments account (i.e., not a financial intermediary or retirement plan account), American Century Investments may charge you a $12.50 semiannual account maintenance fee if the value of those shares is less than $10,000. We will redeem shares automatically in one of your accounts to pay the $12.50 fee. In determining your total eligible investment amount, we will include your investments in all personal accounts (including American Century Investments Brokerage accounts) registered under your Social Security number. Personal accounts include individual accounts, joint accounts, UGMA/UTMA accounts, personal trusts, Coverdell Education Savings Accounts and IRAs (including traditional, Roth, Rollover, SEP-, SARSEP- and SIMPLE-IRAs), and certain other retirement accounts. If you have only business, business retirement, employer-sponsored or American Century Investments Brokerage accounts, you are currently not subject to this fee. If you are subject to the Account Maintenance Fee, your account value could be reduced by the fee amount.
Hypothetical Example for Comparison Purposes
The table also provides information about hypothetical account values and hypothetical expenses based on the actual expense ratio of each class of your fund and an assumed rate of return of 5% per year before expenses, which is not the actual return of a fund’s share class. The hypothetical account values and expenses may not be used to estimate the actual ending account balance or expenses you paid for the period. You may use this information to compare the ongoing costs of investing in your fund and other funds. To do so, compare this 5% hypothetical example with the 5% hypothetical examples that appear in the shareholder reports of the other funds.
Please note that the expenses shown in the table are meant to highlight your ongoing costs only and do not reflect any transactional costs, such as sales charges (loads) or redemption/exchange fees. Therefore, the table is useful in comparing ongoing costs only, and will not help you determine the relative total costs of owning different funds. In addition, if these transactional costs were included, your costs would have been higher.
|
| | | | |
| | Beginning
Account Value
1/1/15 | Ending
Account Value
6/30/15 | Expenses Paid
During Period(1)1/1/15 - 6/30/15 | Annualized Expense Ratio(1) |
| Actual | | | | |
| Investor Class | $1,000 | $915.40 | $3.18 | 0.67% |
| Hypothetical | | | | |
| Investor Class | $1,000 | $1,021.47 | $3.36 | 0.67% |
| |
| (1) | Expenses are equal to the class's annualized expense ratio listed in the table above, multiplied by the average account value over the period, multiplied by 181, the number of days in the most recent fiscal half-year, divided by 365, to reflect the one-half year period. |
JUNE 30, 2015
|
| | | | |
| | Shares | Value |
| COMMON STOCKS — 99.4% | | |
| Alternative Carriers — 3.0% | | |
| Inteliquent, Inc. | 540,081 | $ | 9,937,491 |
|
Intelsat SA(1) | 14,261 | 141,469 |
|
| Lumos Networks Corp. | 6,132 | 90,692 |
|
Premiere Global Services, Inc.(1) | 23,096 | 237,658 |
|
| | | 10,407,310 |
|
| Communications Equipment — 1.6% | | |
| QUALCOMM, Inc. | 90,420 | 5,663,005 |
|
| Electric Utilities — 32.5% | | |
| American Electric Power Co., Inc. | 303,580 | 16,080,633 |
|
| Duke Energy Corp. | 102,909 | 7,267,433 |
|
| Edison International | 272,450 | 15,142,771 |
|
| Entergy Corp. | 211,352 | 14,900,316 |
|
| Exelon Corp. | 493,008 | 15,490,311 |
|
| NextEra Energy, Inc. | 52,835 | 5,179,415 |
|
| Pinnacle West Capital Corp. | 196,512 | 11,179,568 |
|
| PPL Corp. | 541,632 | 15,961,895 |
|
| Southern Co. (The) | 124,835 | 5,230,586 |
|
| Westar Energy, Inc. | 143,249 | 4,901,981 |
|
| Xcel Energy, Inc. | 55,070 | 1,772,153 |
|
| | | 113,107,062 |
|
| Gas Utilities — 4.1% | | |
| AGL Resources, Inc. | 215,768 | 10,046,158 |
|
| New Jersey Resources Corp. | 11,175 | 307,871 |
|
| WGL Holdings, Inc. | 73,123 | 3,969,848 |
|
| | | 14,323,877 |
|
| Independent Power Producers and Energy Traders — 3.8% | | |
| AES Corp. (The) | 965,955 | 12,808,563 |
|
Talen Energy Corp.(1) | 32,965 | 565,680 |
|
| | | 13,374,243 |
|
| Integrated Telecommunication Services — 29.7% | | |
| AT&T, Inc. | 1,142,185 | 40,570,411 |
|
| Atlantic Tele-Network, Inc. | 803 | 55,471 |
|
| CenturyLink, Inc. | 509,428 | 14,966,995 |
|
General Communication, Inc., Class A(1) | 62,801 | 1,068,245 |
|
| IDT Corp., Class B | 503,118 | 9,096,373 |
|
| Verizon Communications, Inc. | 800,664 | 37,318,949 |
|
| Windstream Holdings, Inc. | 56,044 | 357,561 |
|
| | | 103,434,005 |
|
| Multi-Utilities — 20.5% | | |
| Ameren Corp. | 91,872 | 3,461,737 |
|
| Consolidated Edison, Inc. | 274,261 | 15,874,227 |
|
|
| | | | |
| | Shares | Value |
| Dominion Resources, Inc. | 76,997 | $ | 5,148,789 |
|
| DTE Energy Co. | 86,208 | 6,434,565 |
|
| PG&E Corp. | 323,728 | 15,895,045 |
|
| Public Service Enterprise Group, Inc. | 403,416 | 15,846,181 |
|
| SCANA Corp. | 171,251 | 8,673,863 |
|
| | | 71,334,407 |
|
| Water Utilities — 0.7% | | |
| SJW Corp. | 78,073 | 2,396,060 |
|
| Wireless Telecommunication Services — 3.5% | | |
| Spok Holdings, Inc. | 176,330 | 2,969,397 |
|
T-Mobile US, Inc.(1) | 45,405 | 1,760,352 |
|
| West Corp. | 246,042 | 7,405,864 |
|
| | | 12,135,613 |
|
TOTAL COMMON STOCKS (Cost $296,471,313) | | 346,175,582 |
|
| TEMPORARY CASH INVESTMENTS — 0.4% | | |
Repurchase Agreement, Bank of America Merrill Lynch, (collateralized by various U.S. Treasury obligations, 1.50%, 1/31/19 - 11/30/19, valued at $244,489), in a joint trading account at 0.10%, dated 6/30/15, due 7/1/15 (Delivery value $239,611) | | 239,610 |
|
| Repurchase Agreement, Fixed Income Clearing Corp., (collateralized by various U.S. Treasury obligations, 2.375%, 8/15/24, valued at $982,358), at 0.01%, dated 6/30/15, due 7/1/15 (Delivery value $959,000) | | 959,000 |
|
| State Street Institutional Liquid Reserves Fund, Premier Class | 237,861 | 237,861 |
|
TOTAL TEMPORARY CASH INVESTMENTS (Cost $1,436,471) | | 1,436,471 |
|
TOTAL INVESTMENT SECURITIES — 99.8% (Cost $297,907,784) | | 347,612,053 |
|
| OTHER ASSETS AND LIABILITIES — 0.2% | | 769,452 |
|
| TOTAL NET ASSETS — 100.0% | | $ | 348,381,505 |
|
|
| |
| NOTES TO SCHEDULE OF INVESTMENTS |
| (1) | Non-income producing. |
See Notes to Financial Statements.
|
|
| Statement of Assets and Liabilities |
|
| | | |
| JUNE 30, 2015 |
| Assets |
| Investment securities, at value (cost of $297,907,784) | $ | 347,612,053 |
|
| Receivable for investments sold | 720,354 |
|
| Receivable for capital shares sold | 104,301 |
|
| Dividends and interest receivable | 742,930 |
|
| | 349,179,638 |
|
| | |
| Liabilities | |
| Payable for capital shares redeemed | 602,460 |
|
| Accrued management fees | 195,673 |
|
| | 798,133 |
|
| | |
| Net Assets | $ | 348,381,505 |
|
| | |
| Investor Class Capital Shares, $0.01 Par Value | |
| Shares authorized | 180,000,000 |
|
| Shares outstanding | 21,402,925 |
|
| | |
| Net Asset Value Per Share | $ | 16.28 |
|
| | |
| Net Assets Consist of: | |
| Capital (par value and paid-in surplus) | $ | 295,618,824 |
|
| Undistributed net realized gain | 3,059,523 |
|
| Net unrealized appreciation | 49,703,158 |
|
| | $ | 348,381,505 |
|
See Notes to Financial Statements.
|
| | | |
| YEAR ENDED JUNE 30, 2015 |
| Investment Income (Loss) |
| Income: | |
| Dividends | $ | 15,206,039 |
|
| Interest | 1,162 |
|
| | 15,207,201 |
|
| | |
| Expenses: | |
| Management fees | 2,649,416 |
|
| Directors' fees and expenses | 20,481 |
|
| Other expenses | 5,270 |
|
| | 2,675,167 |
|
| | |
| Net investment income (loss) | 12,532,034 |
|
| | |
| Realized and Unrealized Gain (Loss) | |
| Net realized gain (loss) on investment transactions | 10,573,063 |
|
| | |
| Change in net unrealized appreciation (depreciation) on: | |
| Investments | (33,415,672 | ) |
| Translation of assets and liabilities in foreign currencies | (1,136 | ) |
| | (33,416,808 | ) |
| | |
| Net realized and unrealized gain (loss) | (22,843,745 | ) |
| | |
| Net Increase (Decrease) in Net Assets Resulting from Operations | $ | (10,311,711 | ) |
See Notes to Financial Statements.
|
|
| Statement of Changes in Net Assets |
|
| | | | | | |
| YEARS ENDED JUNE 30, 2015 AND JUNE 30, 2014 |
| Increase (Decrease) in Net Assets | June 30, 2015 | June 30, 2014 |
| Operations | | |
| Net investment income (loss) | $ | 12,532,034 |
| $ | 12,571,946 |
|
| Net realized gain (loss) | 10,573,063 |
| 20,048,897 |
|
| Change in net unrealized appreciation (depreciation) | (33,416,808 | ) | 27,253,329 |
|
| Net increase (decrease) in net assets resulting from operations | (10,311,711 | ) | 59,874,172 |
|
| | | |
| Distributions to Shareholders | | |
| From net investment income | (12,941,268 | ) | (12,695,491 | ) |
| From net realized gains | (16,748,797 | ) | (20,977,352 | ) |
| Decrease in net assets from distributions | (29,690,065 | ) | (33,672,843 | ) |
| | | |
| Capital Share Transactions | | |
| Proceeds from shares sold | 85,318,543 |
| 92,806,569 |
|
| Proceeds from reinvestment of distributions | 28,340,735 |
| 32,206,183 |
|
| Payments for shares redeemed | (140,116,192 | ) | (84,646,037 | ) |
| Net increase (decrease) in net assets from capital share transactions | (26,456,914 | ) | 40,366,715 |
|
| | | |
| Net increase (decrease) in net assets | (66,458,690 | ) | 66,568,044 |
|
| | | |
| Net Assets | | |
| Beginning of period | 414,840,195 |
| 348,272,151 |
|
| End of period | $ | 348,381,505 |
| $ | 414,840,195 |
|
| | | |
| Undistributed net investment income | — |
| $ | 1,359,386 |
|
| | | |
| Transactions in Shares of the Fund | | |
| Sold | 4,765,153 |
| 5,430,035 |
|
| Issued in reinvestment of distributions | 1,630,559 |
| 1,981,828 |
|
| Redeemed | (7,996,686 | ) | (5,014,400 | ) |
| Net increase (decrease) in shares of the fund | (1,600,974 | ) | 2,397,463 |
|
See Notes to Financial Statements.
|
|
| Notes to Financial Statements |
JUNE 30, 2015
1. Organization
American Century Quantitative Equity Funds, Inc. (the corporation) is registered under the Investment Company Act of 1940, as amended (the 1940 Act), as an open-end management investment company and is organized as a Maryland corporation. Utilities Fund (the fund) is one fund in a series issued by the corporation. The fund is diversified as defined under the 1940 Act. The fund’s investment objectives are to seek current income and long-term growth of capital and income. The fund invests at least 80% of its assets in equity securities of companies engaged in the utilities industry.
2. Significant Accounting Policies
The following is a summary of significant accounting policies consistently followed by the fund in preparation of its financial statements. The fund is an investment company and follows accounting and reporting guidance in accordance with accounting principles generally accepted in the United States of America. This may require management to make certain estimates and assumptions at the date of the financial statements. Actual results could differ from these estimates. Management evaluated the impact of events or transactions occurring through the date the financial statements were issued that would merit recognition or disclosure.
Investment Valuations — The fund determines the fair value of its investments and computes its net asset value per share at the close of regular trading (usually 4 p.m. Eastern time) on the New York Stock Exchange (NYSE) on each day the NYSE is open. The Board of Directors has adopted valuation policies and procedures to guide the investment advisor in the fund’s investment valuation process and to provide methodologies for the oversight of the fund’s pricing function.
Equity securities that are listed or traded on a domestic securities exchange are valued at the last reported sales price or at the official closing price as provided by the exchange. Equity securities traded on foreign securities exchanges are generally valued at the closing price of such securities on the exchange where primarily traded or at the close of the NYSE, if that is earlier. If no last sales price is reported, or if local convention or regulation so provides, the mean of the latest bid and asked prices may be used. Securities traded over-the-counter are valued at the mean of the latest bid and asked prices, the last sales price, or the official closing price. Equity securities initially expressed in local currencies are translated into U.S. dollars at the mean of the appropriate currency exchange rate at the close of the NYSE as provided by an independent pricing service.
Fixed income securities maturing within 60 days at the time of purchase may be valued at cost, plus or minus any amortized discount or premium or at the evaluated mean as provided by an independent pricing service. Evaluated mean prices are commonly derived through utilization of market models, which may consider, among other factors: trade data, quotations from dealers and active market makers, relevant yield curve and spread data, related sector levels, creditworthiness, trade data or market information on comparable securities, and other relevant security specific information.
Open-end management investment companies are valued at the reported net asset value per share. Repurchase agreements are valued at cost, which approximates fair value.
If the fund determines that the market price for an investment is not readily available or the valuation methods mentioned above do not reflect an investment’s fair value, such investment is valued as determined in good faith by the Board of Directors or its delegate, in accordance with policies and procedures adopted by the Board of Directors. In its determination of fair value, the fund may review several factors including, but not limited to, market information regarding the specific investment or comparable investments and correlation with other investment types, futures indices or general market indicators. Circumstances that may cause the fund to use these procedures to value an investment include, but are not limited to: an investment has been declared in default or is distressed; trading in a security has been suspended during the trading day or a security is not actively trading on its principal exchange; prices received from a regular pricing source are deemed unreliable; or there is a foreign market holiday and no trading occurred.
The fund monitors for significant events occurring after the close of an investment’s primary exchange but before the fund’s net asset value per share is determined. Significant events may include, but are not limited
to: corporate announcements and transactions; governmental action and political unrest that could impact a specific investment or an investment sector; or armed conflicts, natural disasters and similar events that could affect investments in a specific country or region. The fund also monitors for significant fluctuations between domestic and foreign markets, as evidenced by the U.S. market or such other indicators that the Board of Directors, or its delegate, deems appropriate. If significant fluctuations in foreign markets are identified, the fund may apply a model-derived factor to the closing price of equity securities traded on foreign securities exchanges. The factor is based on observable market data as provided by an independent pricing service.
Security Transactions — Security transactions are accounted for as of the trade date. Net realized gains and losses are determined on the identified cost basis, which is also used for federal income tax purposes.
Investment Income — Dividend income less foreign taxes withheld, if any, is recorded as of the ex-dividend date. Distributions received on securities that represent a return of capital or long-term capital gain are recorded as a reduction of cost of investments and/or as a realized gain. The fund may estimate the components of distributions received that may be considered nontaxable distributions or long-term capital gain distributions for income tax purposes. Interest income is recorded on the accrual basis and includes accretion of discounts and amortization of premiums.
Foreign Currency Translations — All assets and liabilities initially expressed in foreign currencies are translated into U.S. dollars at prevailing exchange rates at period end. The fund may enter into spot foreign currency exchange contracts to facilitate transactions denominated in a foreign currency. Purchases and sales of investment securities, dividend and interest income, spot foreign currency exchange contracts, and expenses are translated at the rates of exchange prevailing on the respective dates of such transactions. Net realized and unrealized foreign currency exchange gains or losses related to investment securities are a component of net realized gain (loss) on investment transactions and change in net unrealized appreciation (depreciation) on investments, respectively.
Repurchase Agreements — The fund may enter into repurchase agreements with institutions that American Century Investment Management, Inc. (ACIM) (the investment advisor) has determined are creditworthy pursuant to criteria adopted by the Board of Directors. The fund requires that the collateral, represented by securities, received in a repurchase transaction be transferred to the custodian in a manner sufficient to enable the fund to obtain those securities in the event of a default under the repurchase agreement. ACIM monitors, on a daily basis, the securities transferred to ensure the value, including accrued interest, of the securities under each repurchase agreement is equal to or greater than amounts owed to the fund under each repurchase agreement.
Joint Trading Account — Pursuant to an Exemptive Order issued by the Securities and Exchange Commission, the fund, along with certain other funds in the American Century Investments family of funds, may transfer uninvested cash balances into a joint trading account. These balances are invested in one or more repurchase agreements that are collateralized by U.S. Treasury or Agency obligations.
Income Tax Status — It is the fund’s policy to distribute substantially all net investment income and net realized gains to shareholders and to otherwise qualify as a regulated investment company under provisions of the Internal Revenue Code. Accordingly, no provision has been made for income taxes. The fund files U.S. federal, state, local and non-U.S. tax returns as applicable. The fund's tax returns are subject to examination by the relevant taxing authority until expiration of the applicable statute of limitations, which is generally three years from the date of filing but can be longer in certain jurisdictions. At this time, management believes there are no uncertain tax positions which, based on their technical merit, would not be sustained upon examination and for which it is reasonably possible that the total amounts of unrecognized tax benefits will significantly change in the next twelve months.
Distributions to Shareholders — Distributions from net investment income, if any, are generally declared and paid quarterly. Distributions from net realized gains, if any, are generally declared and paid annually. The fund may elect to treat a portion of its payment to a redeeming shareholder, which represents the pro rata share of undistributed net investment income and net realized gains, as a distribution for federal income tax purposes (tax equalization).
Indemnifications — Under the corporation’s organizational documents, its officers and directors are indemnified against certain liabilities arising out of the performance of their duties to the fund. In addition, in the normal course of business, the fund enters into contracts that provide general indemnifications. The maximum exposure under these arrangements is unknown as this would involve future claims that may be made against a fund. The risk of material loss from such claims is considered by management to be remote.
3. Fees and Transactions with Related Parties
Certain officers and directors of the corporation are also officers and/or directors of American Century Companies, Inc. (ACC). The corporation’s investment advisor, ACIM, the corporation's distributor, American Century Investment Services, Inc., and the corporation’s transfer agent, American Century Services, LLC, are wholly owned, directly or indirectly, by ACC.
Management Fees — The corporation has entered into a management agreement with ACIM, under which ACIM provides the fund with investment advisory and management services in exchange for a single, unified management fee (the fee). The agreement provides that all expenses of managing and operating the fund, except distribution and service fees, brokerage expenses, taxes, interest, fees and expenses of the independent directors (including legal counsel fees), and extraordinary expenses, will be paid by ACIM. The fee is computed and accrued daily based on the daily net assets of the fund and paid monthly in arrears. The fee consists of (1) an Investment Category Fee based on the daily net assets of the fund and certain other accounts managed by the investment advisor that are in the same broad investment category as the fund and (2) a Complex Fee based on the assets of all the funds in the American Century Investments family of funds. The rates for the Investment Category Fee range from 0.3380% to 0.5200%. The rates for the Complex Fee range from 0.2500% to 0.3100%. The effective annual management fee for the year ended June 30, 2015 was 0.66%.
Directors' Fees and Expenses — The Board of Directors is responsible for overseeing the investment advisor’s management and operations of the fund. The directors receive detailed information about the fund and its investment advisor regularly throughout the year, and meet at least quarterly with management of the investment advisor to review reports about fund operations. The fund’s officers do not receive compensation from the fund.
4. Investment Transactions
Purchases and sales of investment securities, excluding short-term investments, for the year ended June 30, 2015 were $158,362,595 and $200,728,300, respectively.
5. Fair Value Measurements
The fund’s investments valuation process is based on several considerations and may use multiple inputs to determine the fair value of the investments held by the fund. In conformity with accounting principles generally accepted in the United States of America, the inputs used to determine a valuation are classified into three broad levels.
| |
| • | Level 1 valuation inputs consist of unadjusted quoted prices in an active market for identical investments. |
| |
| • | Level 2 valuation inputs consist of direct or indirect observable market data (including quoted prices for comparable investments, evaluations of subsequent market events, interest rates, prepayment speeds, credit risk, etc.). These inputs also consist of quoted prices for identical investments initially expressed in local currencies that are adjusted through translation into U.S. dollars. |
| |
| • | Level 3 valuation inputs consist of unobservable data (including a fund’s own assumptions). |
The level classification is based on the lowest level input that is significant to the fair valuation measurement. The valuation inputs are not necessarily an indication of the risks associated with investing in these securities or other financial instruments. There were no significant transfers between levels during the period.
The following is a summary of the level classifications as of period end. The Schedule of Investments provides additional information on the fund’s portfolio holdings.
|
| | | | | | | | |
| | Level 1 | Level 2 | Level 3 |
| Assets | | | |
| Investment Securities | | | |
| Common Stocks | $ | 346,175,582 |
| — |
| — |
|
| Temporary Cash Investments | 237,861 |
| $ | 1,198,610 |
| — |
|
| | $ | 346,413,443 |
| $ | 1,198,610 |
| — |
|
6. Risk Factors
The fund concentrates its investments in a narrow segment of the total market. Because of this, the fund may be subject to greater risk and market fluctuations than a portfolio representing a broader range of industries.
7. Federal Tax Information
The tax character of distributions paid during the years ended June 30, 2015 and June 30, 2014 were as follows:
|
| | | | | | |
| | 2015 | 2014 |
| Distributions Paid From | | |
| Ordinary income | $ | 14,012,151 |
| $ | 18,863,815 |
|
| Long-term capital gains | $ | 15,677,914 |
| $ | 14,809,028 |
|
The book-basis character of distributions made during the year from net investment income or net realized gains may differ from their ultimate characterization for federal income tax purposes. These differences reflect the differing character of certain income items and net realized gains and losses for financial statement and tax purposes, and may result in reclassification among certain capital accounts on the financial statements.
As of June 30, 2015, the federal tax cost of investments and the components of distributable earnings on a tax-basis were as follows:
|
| | | |
| Federal tax cost of investments | $ | 299,668,558 |
|
| Gross tax appreciation of investments | $ | 53,375,776 |
|
| Gross tax depreciation of investments | (5,432,281 | ) |
| Net tax appreciation (depreciation) of investments | 47,943,495 |
|
Net tax appreciation (depreciation) on translation of assets and liabilities in foreign currencies | (1,111 | ) |
| Net tax appreciation (depreciation) | $ | 47,942,384 |
|
| Undistributed ordinary income | — |
|
| Accumulated long-term gains | $ | 4,820,297 |
|
The difference between book-basis and tax-basis unrealized appreciation (depreciation) is attributable primarily to the tax deferral of losses on wash sales.
|
| | | | | | | | | | | | | | | |
| For a Share Outstanding Throughout the Years Ended June 30 (except as noted) | | | |
| Per-Share Data | | | | | | | Ratios and Supplemental Data | |
| | | Income From Investment Operations: | Distributions From: | | | Ratio to Average Net Assets of: | | |
| | Net Asset Value, Beginning of Period | Net Investment Income (Loss)(1) | Net Realized and Unrealized Gain (Loss) | Total From Investment Operations | Net Investment Income | Net Realized Gains | Total Distributions | Net Asset Value, End of Period | Total Return(2) | Operating Expenses | Net Investment Income (Loss) | Portfolio Turnover Rate | Net Assets, End of Period (in thousands) |
| Investor Class | | | | | | | | | | |
| 2015 | $18.03 | 0.55 | (0.98) | (0.43) | (0.58) | (0.74) | (1.32) | $16.28 | (2.73)% | 0.67% | 3.14% | 40% |
| $348,382 |
|
| 2014 | $16.90 | 0.58 | 2.13 | 2.71 | (0.58) | (1.00) | (1.58) | $18.03 | 17.35% | 0.67% | 3.41% | 45% |
| $414,840 |
|
| 2013 | $16.54 | 0.63 | 1.20 | 1.83 | (0.60) | (0.87) | (1.47) | $16.90 | 12.06% | 0.68% | 3.79% | 41% |
| $348,272 |
|
| 2012 | $15.93 | 0.60 | 0.66 | 1.26 | (0.55) | (0.10) | (0.65) | $16.54 | 8.20% | 0.68% | 3.83% | 55% |
| $316,325 |
|
| 2011 | $12.62 | 0.51 | 3.30 | 3.81 | (0.50) | — | (0.50) | $15.93 | 30.50% | 0.69% | 3.47% | 17% |
| $284,177 |
|
|
|
| Notes to Financial Highlights |
| |
| (1) | Computed using average shares outstanding throughout the period. |
| |
| (2) | Total returns are calculated based on the net asset value of the last business day. Total returns for periods less than one year are not annualized. |
See Notes to Financial Statements.
|
|
| Report of Independent Registered Public Accounting Firm |
To the Directors of the American Century Quantitative Equity Funds, Inc. and Shareholders of the Utilities Fund:
In our opinion, the accompanying statement of assets and liabilities, including the schedule of investments, and the related statements of operations and of changes in net assets and the financial highlights present fairly, in all material respects, the financial position of the Utilities Fund (one of the sixteen funds comprising the American Century Quantitative Equity Funds, Inc., hereafter referred to as the “Fund”) at June 30, 2015, the results of its operations for the year then ended, the changes in its net assets for each of the two years in the period then ended and the financial highlights for each of the five years in the period then ended, in conformity with accounting principles generally accepted in the United States of America. These financial statements and financial highlights (hereafter referred to as "financial statements") are the responsibility of the Fund's management. Our responsibility is to express an opinion on these financial statements based on our audits. We conducted our audits of these financial statements in accordance with the standards of the Public Company Accounting Oversight Board (United States). Those standards require that we plan and perform the audit to obtain reasonable assurance about whether the financial statements are free of material misstatement. An audit includes examining, on a test basis, evidence supporting the amounts and disclosures in the financial statements, assessing the accounting principles used and significant estimates made by management, and evaluating the overall financial statement presentation. We believe that our audits, which included confirmation of securities at June 30, 2015 by correspondence with the custodian and brokers, provide a reasonable basis for our opinion.
PricewaterhouseCoopers LLP
Kansas City, Missouri
August 21, 2015
Board of Directors
The individuals listed below serve as directors of the funds. Each director will continue to serve in this capacity until death, retirement, resignation or removal from office. The board has adopted a mandatory retirement age for directors who are not “interested persons,” as that term is defined in the Investment Company Act (independent directors). Independent directors shall retire on December 31 of the year in which they reach their 75th birthday; provided, however, that on or after January 1, 2022, independent directors shall retire on December 31 of the year in which they reach their 76th birthday.
Mr. Thomas is an “interested person” because he currently serves as President and Chief Executive Officer of American Century Companies, Inc. (ACC), the parent company of American Century Investment Management, Inc. (ACIM or the advisor). The other directors (more than three-fourths of the total number) are independent. They are not employees, directors or officers of, and have no financial interest in, ACC or any of its wholly owned, direct or indirect, subsidiaries, including ACIM, American Century Investment Services, Inc. (ACIS) and American Century Services, LLC (ACS), and they do not have any other affiliations, positions or relationships that would cause them to be considered “interested persons” under the Investment Company Act. The directors serve in this capacity for eight (in the case of Mr. Thomas, 15) registered investment companies in the American Century Investments family of funds.
The following table presents additional information about the directors. The mailing address for each director other than Mr. Thomas is 1665 Charleston Road, Mountain View, California 94043. The mailing address for Mr. Thomas is 4500 Main Street, Kansas City, Missouri 64111.
|
| | | | | |
Name (Year of Birth) | Position(s) Held with Funds | Length of Time Served | Principal Occupation(s) During Past 5 Years | Number of American Century Portfolios Overseen by Director | Other Directorships Held During Past 5 Years |
Independent Directors | | |
Tanya S. Beder
(1955) | Director | Since 2011 | Chairman and CEO, SBCC Group Inc. (independent advisory services) (2006 to present) | 46 | CYS Investments, Inc. (NYSE mortgage arbitrage REIT) |
Jeremy I. Bulow
(1954) | Director | Since 2011 | Professor of Economics, Stanford University, Graduate School of Business (1979 to present) | 46 | None |
Ronald J. Gilson
(1946) | Director and Chairman of the Board | Since 1995
(Chairman since 2005) | Charles J. Meyers Professor of Law and Business, Stanford Law School (1979 to present); Marc and Eva Stern Professor of Law and Business, Columbia University School of Law (1992 to present) | 46 | None |
Frederick L. A. Grauer
(1946) | Director | Since 2008 | Senior Advisor, BlackRock, Inc. (investment management firm) (2010 to 2011, 2013 to present) | 46 | None |
Peter F. Pervere
(1947) | Director | Since 2007 | Retired | 46 | None |
|
| | | | | |
Name (Year of Birth) | Position(s) Held with Funds | Length of Time Served | Principal Occupation(s) During Past 5 Years | Number of American Century Portfolios Overseen by Director | Other Directorships Held During Past 5 Years |
| Independent Directors | | |
John B. Shoven
(1947) | Director | Since 2002 | Professor of Economics, Stanford University (1973 to present) | 46 | Cadence Design Systems; Exponent; Financial Engines |
| Interested Director | | |
Jonathan S. Thomas
(1963) | Director and President | Since 2007 | President and Chief Executive Officer, ACC (March 2007 to present). Also serves as Chief Executive Officer, ACS; Executive Vice President, ACIM; Director, ACC, ACIM and other ACC subsidiaries | 124 | BioMed Valley Discoveries, Inc. |
The Statement of Additional Information has additional information about the fund's directors and is available without charge, upon request, by calling 1-800-345-2021.
Officers
The following table presents certain information about the executive officers of the funds. Each officer serves as an officer for each of the 15 investment companies in the American Century family of funds, unless otherwise noted. No officer is compensated for his or her service as an officer of the funds. The listed officers are interested persons of the funds and are appointed or re-appointed on an annual basis. The mailing address for each of the officers listed below is 4500 Main Street, Kansas City, Missouri 64111.
|
| | |
Name (Year of Birth) | Offices with
the Funds | Principal Occupation(s) During the Past Five Years |
Jonathan S.
Thomas
(1963) | Director and President
since 2007 | President and Chief Executive Officer, ACC (March 2007 to present). Also serves as Chief Executive Officer, ACS; Executive Vice President, ACIM; Director, ACC, ACIM and other ACC subsidiaries |
Amy D. Shelton
(1964) | Chief Compliance Officer and Vice President since 2014 | Chief Compliance Officer, American Century funds, (March 2014 to present); Chief Compliance Officer, ACIM (February 2014 to present); Chief Compliance Officer, ACIS (October 2009 to present); Vice President, Client Interactions and Marketing, ACIS (February 2013 to January 2014); Director, Client Interactions and Marketing, ACIS (June 2007 to January 2013). Also serves as Vice President, ACIS |
Charles A. Etherington
(1957) | General Counsel since 2007 and Senior Vice President since 2006 | Attorney, ACC (February 1994 to present); Vice President, ACC (November 2005 to present); General Counsel, ACC (March 2007 to present). Also serves as General Counsel, ACIM, ACS, ACIS and other ACC subsidiaries; and Senior Vice President, ACIM and ACS |
C. Jean Wade
(1964) | Vice President,
Treasurer and
Chief Financial
Officer since 2012 | Vice President, ACS (February 2000 to present) |
Robert J. Leach
(1966) | Vice President
since 2006 and
Assistant Treasurer
since 2012 | Vice President, ACS (February 2000 to present) |
David H. Reinmiller
(1963) | Vice President since 2001 | Attorney, ACC (January 1994 to present); Associate General Counsel, ACC (January 2001 to present). Also serves as Vice President, ACIM and ACS |
Ward D. Stauffer
(1960) | Secretary since 2005 | Attorney, ACC (June 2003 to present) |
|
|
| Approval of Management Agreement |
At a meeting held on June 16, 2015, the Fund’s Board of Directors unanimously approved the renewal of the management agreement pursuant to which American Century Investment Management, Inc. (the “Advisor”) acts as the investment advisor for the Fund. Under Section 15(c) of the Investment Company Act, contracts for investment advisory services are required to be reviewed, evaluated, and approved by a majority of a fund’s directors/trustees, including a majority of the independent Directors, each year. The Board regards this annual evaluation and renewal as one of its most important responsibilities.
The independent Directors have memorialized a statement regarding the relationship between their ongoing obligations to oversee and evaluate the performance of the Advisor and their annual consideration of renewal of the management agreement. In that statement, the independent Directors noted that their assessment of the Advisor’s performance is an ongoing process that takes place over the entire year and is informed by all of the extensive information that the Board and its committees receive and consider over time. This information, together with the materials provided in connection with the review, are central to the Board’s assessment of the Advisor’s performance and its determination whether to renew the Fund’s management agreement.
Prior to its consideration of the renewal of the management agreement, the Board requested and reviewed extensive data and analysis relating to the proposed renewal. This information and analysis was compiled by the Advisor and certain independent providers of evaluation data concerning the Fund and the services provided to the Fund by the Advisor.
In connection with its consideration of the renewal of the management agreement, the Board’s review and evaluation of the services provided by the Advisor included, but was not limited to, the following:
| |
| • | the nature, extent, and quality of investment management, shareholder services, and other services provided by the Advisor to the Fund; |
| |
| • | the wide range of other programs and services the Advisor provides to the Fund and its shareholders on a routine and non-routine basis; |
| |
| • | the investment performance of the Fund, including data comparing the Fund’s performance to appropriate benchmarks and/or a peer group of other mutual funds with similar investment objectives and strategies; |
| |
| • | the cost of owning the Fund compared to the cost of owning similar funds; |
| |
| • | the Advisor’s compliance policies, procedures, and regulatory experience; |
| |
| • | financial data showing the cost of services provided to the Fund, the profitability of the Fund to the Advisor, and the overall profitability of the Advisor; |
| |
| • | possible economies of scale associated with the Advisor’s management of the Fund and other accounts under its management; |
| |
| • | data comparing services provided and charges to other investment management clients of the Advisor; |
| |
| • | acquired fund fees and expenses; |
| |
| • | payments by the Fund and the Advisor to financial intermediaries whose clients are investors in the Fund; and |
| |
| • | any collateral benefits derived by the Advisor from the management of the Fund. |
In keeping with its practice, the Board held two in-person meetings to review and discuss the information provided in response to their request. The independent Directors also had the benefit of the advice of their independent counsel throughout the process.
Factors Considered
The Directors considered all of the information provided by the Advisor, the independent data providers, and the independent Directors’ independent counsel in connection with the review, and evaluated such information for the Fund. In connection with their review, the Directors did not identify any single factor as being all-important or controlling and each Director may have attributed different levels of importance to different factors. In deciding to renew the management agreement, the Board based its decision on a number of factors, including the following:
Nature, Extent and Quality of Services - Generally. Under the management agreement, the Advisor is responsible for providing or arranging for all services necessary for the operation of the Fund. The Board noted that under the management agreement, the Advisor provides or arranges at its own expense a wide variety of services including:
| |
| • | constructing and designing the Fund |
| |
| • | portfolio research and security selection |
| |
| • | initial capitalization/funding |
| |
| • | daily valuation of the Fund’s portfolio |
| |
| • | shareholder servicing and transfer agency, including shareholder confirmations, recordkeeping, and communications |
| |
| • | legal services (except the independent Directors’ counsel) |
| |
| • | regulatory and portfolio compliance |
| |
| • | marketing and distribution (except amounts paid by the Fund under Rule 12b-1 plans) |
The Board noted that many of these services have expanded over time both in terms of quantity and complexity in response to shareholder demands, competition in the industry, changing distribution channels, and the changing regulatory environment.
Investment Management, Shareholder, and Other Services. The nature of the investment management services provided to the Fund is quite complex and allows Fund shareholders access to professional money management, instant diversification of their investments within an asset class, the opportunity to easily diversify among asset classes by investing in or exchanging among various American Century Investments funds, and liquidity. In evaluating investment performance, the Board expects the Advisor to manage the Fund in accordance with its investment objectives and approved strategies. Further, the Directors recognize that the Advisor has an obligation to seek the best execution of fund trades. In providing these services, the Advisor utilizes teams of investment professionals (portfolio managers, analysts, research assistants, and securities traders) who require extensive information technology, research, training, compliance, and other systems to conduct their business. The Board, directly and through its Portfolio Committee, regularly reviews investment performance information for the Fund, together with comparative information for appropriate benchmarks and/or peer groups of similarly-managed funds, over different time horizons. The Directors also review detailed performance information during the management agreement approval process. If performance concerns are identified, the Fund receives special reviews until performance improves, during which the Board discusses with the Advisor the reasons for such results (e.g., market conditions, security selection) and any efforts being undertaken to improve performance. The Fund’s performance was above its benchmark for the one-, three-, five-, and ten-year periods reviewed by the Board. The Board found the investment management services provided by the Advisor to the Fund to be satisfactory and consistent with the management agreement.
Under the management agreement, the Advisor provides the Fund with a comprehensive package of transfer agency, shareholder, and other services. The Board, directly and through various committees of the Board, regularly reviews reports and evaluations of such services at its regular
meetings. These reports include, but are not limited to, information regarding the operational efficiency and accuracy of the shareholder and transfer agency services provided, staffing levels, shareholder satisfaction (as measured by external as well as internal sources), technology support, new products and services offered to Fund shareholders, securities trading activities, portfolio valuation services, auditing services, and legal and operational compliance activities.
Certain aspects of shareholder and transfer agency service level efficiency and the quality of securities trading activities are measured by independent third party providers and are presented in comparison to other fund groups not managed by the Advisor. The Board found the services provided by the Advisor to the Fund under the management agreement to be competitive and of high quality.
Costs of Services and Profitability. The Advisor provides detailed information concerning its cost of providing various services to the Fund, its profitability in managing the Fund, its overall profitability, and its financial condition. The Directors have reviewed with the Advisor the methodology used to prepare this financial information. This information is considered in evaluating the Advisor’s financial condition, its ability to continue to provide services under the management agreement, and the reasonableness of the current management fee. The Board concluded that the Advisor’s profits were reasonable in light of the services provided to the Fund.
Ethics. The Board generally considers the Advisor’s commitment to providing quality services to shareholders and to conducting its business ethically. They noted that the Advisor’s practices generally meet or exceed industry best practices.
Economies of Scale. The Board also reviewed information provided by the Advisor regarding the possible existence of economies of scale in connection with the management of the Fund. The Board concluded that economies of scale are difficult to measure and predict with precision, especially on a fund-by-fund basis. The Board concluded that the Advisor is appropriately sharing economies of scale through its competitive fee structure, offering competitive fees from fund inception, and through reinvestment in its business to provide shareholders enhanced and expanded services.
Comparison to Other Funds’ Fees. The management agreement provides that the Fund pays the Advisor a single, all-inclusive (or unified) management fee for providing all services necessary for the management and operation of the Fund, other than brokerage expenses, taxes, interest, extraordinary expenses, the fees and expenses of the Fund’s independent Directors (including their independent legal counsel), and expenses incurred in connection with the provision of shareholder services and distribution services under a plan adopted pursuant to Rule 12b-1 under the 1940 Act. Under the unified fee structure, the Advisor is responsible for providing all investment advisory, custody, audit, administrative, compliance, recordkeeping, marketing, and shareholder services, or arranging and supervising third parties to provide such services. By contrast, most other funds are charged a variety of fees, including an investment advisory fee, a transfer agency fee, an administrative fee, distribution charges, and other expenses. Other than their investment advisory fees and any applicable Rule 12b-1 fees, all other components of the total fees charged by these other funds may be increased without shareholder approval. The Board believes the unified fee structure is a benefit to Fund shareholders because it clearly discloses to shareholders the cost of owning Fund shares, and, since the unified fee cannot be increased without a vote of Fund shareholders, it shifts to the Advisor the risk of increased costs of operating the Fund and provides a direct incentive to minimize administrative inefficiencies. Part of the Board’s analysis of fee levels involves reviewing certain evaluative data compiled by an independent provider and comparing the Fund’s unified fee to the total expense ratio of peer funds. The unified fee charged to shareholders of the Fund was below the median of the total expense ratios of the Fund’s peer universe. The Board concluded that the management fee paid by the Fund to the Advisor under the management agreement is reasonable in light of the services provided to the Fund.
Comparison to Fees and Services Provided to Other Clients of the Advisor. The Board also requested and received information from the Advisor concerning the nature of the services, fees, costs, and profitability of its advisory services to advisory clients other than the Fund. They observed that these varying types of client accounts require different services and involve different regulatory and entrepreneurial risks than the management of the Fund. The Board analyzed this information and concluded that the fees charged and services provided to the Fund were reasonable by comparison.
Payments to Intermediaries. The Directors also requested and received a description of payments made to intermediaries by the Fund and the Advisor. These payments include various payments made by the Fund or the Advisor to different types of intermediaries and recordkeepers for distribution and service activities provided for the Fund.
Collateral or “Fall-Out” Benefits Derived by the Advisor. The Board considered the existence of collateral benefits the Advisor may receive as a result of its relationship with the Fund. The Board noted that the Advisor’s primary business is managing mutual funds and it generally does not use fund or shareholder information to generate profits in other lines of business, and therefore does not derive any significant collateral benefits from them. The Board noted that the Advisor receives proprietary research from broker-dealers that execute fund portfolio transactions. The Board also determined that the Advisor is able to provide investment management services to certain clients other than the Fund, at least in part, due to its existing infrastructure built to serve the fund complex.
Existing Relationship. The Board also considered whether there was any reason for not continuing the existing arrangement with the Advisor. In this regard, the Board was mindful of the potential disruptions of the Fund’s operations and various risks, uncertainties, and other effects that could occur as a result of a decision not to continue such relationship. In particular, the Board recognized that most shareholders have invested in the Fund on the strength of the Advisor’s industry standing and reputation and in the expectation that the Advisor will have a continuing role in providing advisory services to the Fund.
Conclusion of the Directors. As a result of this process, the Board, including all of the independent Directors and assisted by the advice of independent legal counsel, taking into account all of the factors discussed above and the information provided by the Advisor and others in connection with its review and throughout the year, concluded that the management agreement between the Fund and the Advisor is fair and reasonable in light of the services provided and should be renewed.
Retirement Account Information
As required by law, distributions you receive from certain IRAs are subject to federal income tax withholding, unless you elect not to have withholding apply. Tax will be withheld on the total amount withdrawn even though you may be receiving amounts that are not subject to withholding, such as nondeductible contributions. In such case, excess amounts of withholding could occur. You may adjust your withholding election so that a greater or lesser amount will be withheld.
If you don’t want us to withhold on this amount, you must notify us to not withhold the federal income tax. You may notify us in writing or in certain situations by telephone or through other electronic means. For systematic withdrawals, your withholding election will remain in effect until revoked or changed by filing a new election. You have the right to revoke your election at any time.
Remember, even if you elect not to have income tax withheld, you are liable for paying income tax on the taxable portion of your withdrawal. If you elect not to have income tax withheld or you don’t have enough income tax withheld, you may be responsible for payment of estimated tax. You may incur penalties under the estimated tax rules if your withholding and estimated tax payments are not sufficient. You can reduce or defer the income tax on a distribution by directly or indirectly rolling such distribution over to another IRA or eligible plan. You should consult your tax advisor for additional information.
State tax will be withheld if, at the time of your distribution, your address is within one of the mandatory withholding states and you have federal income tax withheld (or as otherwise required by state law). State taxes will be withheld from your distribution in accordance with the respective state rules.
Distributions you receive from 403(b), 457 and qualified plans are subject to special tax and withholding rules. Your plan administrator or plan sponsor is required to provide you with a special tax notice explaining those rules at the time you request a distribution. If applicable, federal and/or state taxes may be withheld from your distribution amount.
Proxy Voting Policies
Descriptions of the principles and policies that the fund's investment advisor uses in exercising the voting rights associated with the securities purchased and/or held by the fund are available without charge, upon request, by calling 1-800-345-2021 or visiting the "About Us" page of American Century Investments’ website at americancentury.com. A description of the policies is also available on the Securities and Exchange Commission’s website at sec.gov. Information regarding how the investment advisor voted proxies relating to portfolio securities during the most recent 12-month period ended June 30 is available on the "About Us" page at americancentury.com. It is also available at sec.gov.
Quarterly Portfolio Disclosure
The fund files its complete schedule of portfolio holdings with the Securities and Exchange Commission (SEC) for the first and third quarters of each fiscal year on Form N-Q. The fund’s Forms N-Q are available on the SEC’s website at sec.gov, and may be reviewed and copied at the SEC’s Public Reference Room in Washington, DC. Information on the operation of the Public Reference Room may be obtained by calling 1-800-SEC-0330. The fund also makes its complete schedule of portfolio holdings for the most recent quarter of its fiscal year available on its website at americancentury.com and, upon request, by calling 1-800-345-2021.
Other Tax Information
The following information is provided pursuant to provisions of the Internal Revenue Code.
The fund hereby designates up to the maximum amount allowable as qualified dividend income for the fiscal year ended June 30, 2015.
For corporate taxpayers, the fund hereby designates $12,871,369, or up to the maximum amount allowable, of ordinary income distributions paid during the fiscal year ended June 30, 2015 as qualified for the corporate dividends received deduction.
The fund hereby designates $913,375 as qualified short-term capital gain distributions for purposes of Internal Revenue Code Section 871 for the fiscal year ended June 30, 2015.
The fund hereby designates $16,719,723, or up to the maximum amount allowable, as long-term capital gain distributions for the fiscal year ended June 30, 2015.
The fund utilized earnings and profits of $1,593,447 distributed to shareholders on redemption of shares as part of the dividends paid deduction (tax equalization).
|
| | |
| |
| | | |
| Contact Us | americancentury.com | |
| Automated Information Line | 1-800-345-8765 | |
| Investor Services Representative | 1-800-345-2021
or 816-531-5575 | |
| Investors Using Advisors | 1-800-378-9878 | |
Business, Not-For-Profit, Employer-Sponsored
Retirement Plans | 1-800-345-3533 | |
Banks and Trust Companies, Broker-Dealers,
Financial Professionals, Insurance Companies | 1-800-345-6488 | |
| Telecommunications Relay Service for the Deaf | 711 | |
| | | |
| American Century Quantitative Equity Funds, Inc. | |
| | | |
Investment Advisor: American Century Investment Management, Inc. Kansas City, Missouri | |
| | | |
| This report and the statements it contains are submitted for the general information of our shareholders. The report is not authorized for distribution to prospective investors unless preceded or accompanied by an effective prospectus. | |
| | | |
©2015 American Century Proprietary Holdings, Inc. All rights reserved.
CL-ANN-86500 1508 | |
ITEM 2. CODE OF ETHICS.
| |
| (a) | The registrant has adopted a Code of Ethics for Senior Financial Officers that applies to the registrant’s principal executive officer, principal financial officer, principal accounting officer, and persons performing similar functions. |
| |
| (f) | The registrant’s Code of Ethics for Senior Financial Officers was filed as Exhibit 12 (a)(1) to American Century Asset Allocation Portfolios, Inc.’s Annual Certified Shareholder Report on Form N-CSR, File No. 811-21591, on September 29, 2005, and is incorporated herein by reference. |
ITEM 3. AUDIT COMMITTEE FINANCIAL EXPERT.
| |
| (a)(1) | The registrant's board has determined that the registrant has at least one audit committee financial expert serving on its audit committee. |
| |
| (a)(2) | Tanya S. Beder, Peter F. Pervere and Ronald J. Gilson are the registrant's designated audit committee financial experts. They are "independent" as defined in Item 3 of Form N-CSR. |
ITEM 4. PRINCIPAL ACCOUNTANT FEES AND SERVICES.
The aggregate fees billed for each of the last two fiscal years for professional services rendered by the principal accountant for the audit of the registrant’s annual financial statements or services that are normally provided by the accountant in connection with statutory and regulatory filings or engagements for those fiscal years were as follows:
FY 2014: $409,403
FY 2015: $446,973
The aggregate fees billed in each of the last two fiscal years for assurance and related services by the principal accountant that are reasonably related to the performance of the audit of the registrant’s financial statements and are not reported under paragraph (a) of this Item were as follows:
For services rendered to the registrant:
FY 2014: $0
FY 2015: $0
Fees required to be approved pursuant to paragraph (c)(7)(ii) of Rule 2-01 of Regulation S-X (relating to certain engagements for non-audit services with the registrant’s investment adviser and its affiliates):
FY 2014: $0
FY 2015: $0
The aggregate fees billed in each of the last two fiscal years for professional services rendered by the principal accountant for tax compliance, tax advice, and tax planning were as follows:
For services rendered to the registrant:
FY 2014: $0
FY 2015: $0
Fees required to be approved pursuant to paragraph (c)(7)(ii) of Rule 2-01 of Regulation S-X (relating to certain engagements for non-audit services with the registrant’s investment adviser and its affiliates):
FY 2014: $0
FY 2015: $0
The aggregate fees billed in each of the last two fiscal years for products and services provided by the principal accountant, other than the services reported in paragraphs (a) through (c) of this Item were as follows:
For services rendered to the registrant:
FY 2014: $0
FY 2015: $0
Fees required to be approved pursuant to paragraph (c)(7)(ii) of Rule 2-01 of Regulation S-X (relating to certain engagements for non-audit services with the registrant’s investment adviser and its affiliates):
FY 2014: $0
FY 2015: $0
| |
| (e)(1) | In accordance with paragraph (c)(7)(i)(A) of Rule 2-01 of Regulation S-X, before the accountant is engaged by the registrant to render audit or non-audit services, the engagement is approved by the registrant’s audit committee. Pursuant to paragraph (c)(7)(ii) of Rule 2-01 of Regulation S-X, the registrant’s audit committee also pre-approves its accountant’s engagements for non-audit services with the registrant’s investment adviser, its parent company, and any entity controlled by, or under common control with the investment adviser that provides ongoing services to the registrant, if the engagement relates directly to the operations and financial reporting of the registrant. |
| |
| (e)(2) | All services described in each of paragraphs (b) through (d) of this Item were pre-approved before the engagement by the registrant’s audit committee pursuant to paragraph (c)(7)(i)(A) of Rule 2-01 of Regulation S-X. Consequently, none of such services were required to be approved by the audit committee pursuant to paragraph (c)(7)(i)(C). |
| |
| (f) | The percentage of hours expended on the principal accountant’s engagement to audit the registrant’s financial statements for the most recent fiscal year that were attributed to work performed by persons other than the principal accountant’s full-time, permanent employees was less than 50%. |
| |
| (g) | The aggregate non-audit fees billed by the registrant’s accountant for services rendered to the registrant, and rendered to the registrant’s investment adviser (not including any sub-adviser whose role is primarily portfolio management and is subcontracted with or overseen by another investment adviser), and any entity controlling, controlled by, or under common control with the adviser that provides ongoing services to the registrant for each of the last two fiscal years of the registrant were as follows: |
FY 2014: $ 71,500
FY 2015: $310,094
| |
| (h) | The registrant’s investment adviser and accountant have notified the registrant’s audit committee of all non-audit services that were rendered by the registrant’s accountant to the registrant’s investment adviser, its parent company, and any entity controlled by, or under common control with the investment adviser that provides services to the registrant, which services were not required to be pre-approved pursuant to paragraph (c)(7)(ii) of Rule 2-01 of Regulation S-X. The notification provided to the registrant’s audit committee included sufficient details regarding such services to allow the registrant’s audit committee to consider the continuing independence of its principal accountant. |
ITEM 5. AUDIT COMMITTEE OF LISTED REGISTRANTS.
Not applicable.
ITEM 6. INVESTMENTS.
| |
| (a) | The schedule of investments is included as part of the report to stockholders filed under Item 1 of this Form. |
ITEM 7. DISCLOSURE OF PROXY VOTING POLICIES AND PROCEDURES FOR CLOSED-END MANAGEMENT INVESTMENT COMPANIES.
Not applicable.
ITEM 8. PORTFOLIO MANAGERS OF CLOSED-END MANAGEMENT INVESTMENT COMPANIES.
Not applicable.
ITEM 9. PURCHASES OF EQUITY SECURITIES BY CLOSED-END MANAGEMENT INVESTMENT COMPANY AND AFFILIATED PURCHASERS.
Not applicable.
ITEM 10. SUBMISSION OF MATTERS TO A VOTE OF SECURITY HOLDERS.
During the reporting period, there were no material changes to the procedures by which shareholders may recommend nominees to the registrant’s board.
ITEM 11. CONTROLS AND PROCEDURES.
| |
| (a) | The registrant's principal executive officer and principal financial officer have concluded that the registrant's disclosure controls and procedures (as defined in Rule 30a-3(c) under the Investment Company Act of 1940) are effective based on their evaluation of these controls and procedures as of a date within 90 days of the filing date of this report. |
| |
| (b) | There were no changes in the registrant's internal control over financial reporting (as defined in Rule 30a-3(d) under the Investment Company Act of 1940) that occurred during the registrant's second fiscal quarter of the period covered by this report that have materially affected, or are reasonably likely to materially affect, the registrant's internal control over financial reporting. |
ITEM 12. EXHIBITS.
| |
| (a)(1) | Registrant’s Code of Ethics for Senior Financial Officers, which is the subject of the disclosure required by Item 2 of Form N-CSR, was filed as Exhibit 12(a)(1) to American Century Asset Allocation Portfolios, Inc.’s Certified Shareholder Report on Form N-CSR, File No. 811-21591, on September 29, 2005. |
| |
| (a)(2) | Separate certifications by the registrant’s principal executive officer and principal financial officer, pursuant to Section 302 of the Sarbanes-Oxley Act of 2002 and Rule 30a-2(a) under the Investment Company Act of 1940, are filed and attached hereto as EX-99.CERT. |
| |
| (b) | A certification by the registrant’s chief executive officer and chief financial officer, pursuant to Section 906 of the Sarbanes-Oxley Act of 2002, is furnished and attached hereto as EX-99.906CERT. |
SIGNATURES
Pursuant to the requirements of the Securities Exchange Act of 1934 and the Investment Company Act of 1940, the registrant has duly caused this report to be signed on its behalf by the undersigned, thereunto duly authorized.
|
| | | | |
| Registrant: | American Century Quantitative Equity Funds, Inc. | |
| | | | |
| By: | /s/ Jonathan S. Thomas | |
| | Name: | Jonathan S. Thomas | |
| | Title: | President | |
| | | | |
| Date: | August 27, 2015 | |
Pursuant to the requirements of the Securities Exchange Act of 1934 and the Investment Company Act of 1940, this report has been signed below by the following persons on behalf of the registrant and in the capacities and on the dates indicated.
|
| | | |
| By: | /s/ Jonathan S. Thomas | |
| | Name: | Jonathan S. Thomas | |
| | Title: | President | |
| | | (principal executive officer) | |
| | | | |
| Date: | August 27, 2015 | |
|
| | | |
| By: | /s/ C. Jean Wade | |
| | Name: | C. Jean Wade | |
| | Title: | Vice President, Treasurer, and | |
| | | Chief Financial Officer | |
| | | (principal financial officer) | |
| | | | |
| Date: | August 27, 2015 | |