Washington, D.C. 20549
ITEM 1. REPORTS TO STOCKHOLDERS.
ANNUAL REPORT JUNE 30, 2012
| | Strategic Inflation Opportunities Fund |
| President’s Letter | 2 |
| Market Perspective | 3 |
| Performance | 4 |
| Portfolio Commentary | 6 |
| Fund Characteristics | 8 |
| Shareholder Fee Example | 9 |
| Schedule of Investments | 11 |
| Statement of Assets and Liabilities | 21 |
| Statement of Operations | 22 |
| Statement of Changes in Net Assets | 23 |
| Notes to Financial Statements | 24 |
| Financial Highlights | 33 |
| Report of Independent Registered Public Accounting Firm | 35 |
| Management | 36 |
| Approval of Management Agreement | 39 |
| Additional Information | 44 |
Any opinions expressed in this report reflect those of the author as of the date of the report, and do not necessarily represent the opinions of American Century Investments® or any other person in the American Century Investments organization. Any such opinions are subject to change at any time based upon market or other conditions and American Century Investments disclaims any responsibility to update such opinions. These opinions may not be relied upon as investment advice and, because investment decisions made by American Century Investments funds are based on numerous factors, may not be relied upon as an indication of trading intent on behalf of any American Century Investments fund. Security examples are used for representational purposes only and are not intended as recommendations to purchase or sell securities. Performance information for comparative indices and securities is provided to American Century Investments by third party vendors. To the best of American Century Investments’ knowledge, such information is accurate at the time of printing.
Dear Investor:
Thank you for reviewing this annual report for the period ended June 30, 2012. Our report offers investment performance and portfolio information, presented with the expert perspective of our portfolio management team.
This report remains one of our most important vehicles for conveying information about fund returns, as well as market factors and strategies that affected fund performance. For additional, updated information, we encourage you to visit our website, americancentury.com. Click on the “Fund Performance” and “Insights & News” headings at the top of our Individual Investors site.
Flight to Quality as Economic and Financial Uncertainties Resurfaced
During the second half of 2011 and the first half of 2012, the global economy and financial markets struggled to move beyond the lingering aftereffects of the 2008 Financial Crisis and Great Recession. Global economic fundamentals have improved since 2008, but weakened since 2010, with increased uncertainty surrounding near-term economic growth levels in major developed economies such as the U.S., Japan, and Europe. There were also questions about near-term growth levels in influential emerging economies such as China.
These near-term uncertainties manifested themselves in asset returns for the 12 months ended June 30, 2012. Assets perceived to be “safe-haven” investments rallied—the 30-year U.S. Treasury bond posted a 39% total return. At the other end of the spectrum, international stock returns for U.S. investors were undermined by a combination of risk-averse investing attitudes, weakening global economic growth, and a stronger U.S. dollar versus the euro and currencies of other struggling economies. Commodity prices also plunged during the period.
Unfortunately, the instability that triggered much of this flight-to-quality trading remains largely in place, and the coming months may bring additional uncertainties about the U.S. presidential election and what might happen when various U.S. tax cuts and other stimulative measures expire in 2013 (the so-called “Fiscal Cliff”). In this uncertain, unstable environment, we continue to believe in a disciplined, diversified, long-term investment approach, using both stocks and bonds, as appropriate. We appreciate your continued trust in us during these unsettled times.
Sincerely,
Jonathan Thomas
President and Chief Executive Officer
American Century Investments
By Scott Wittman, Chief Investment Officer, Quantitative Equity
and Asset Allocation
Risk Aversion Took Center Stage
Market sentiment wavered between “risk on” and “risk off” during the 12-month period ended June 30, 2012. Nevertheless, persistent concerns about weakening global economies and Europe’s ongoing sovereign debt and banking crises overshadowed the periodic bouts of optimism that emerged. Overall, riskier assets, including global stocks and commodities, experienced sharp losses during the period, while higher-quality assets—including U.S. Treasury bonds, Treasury inflation-protected securities (TIPS), and the U.S. dollar—posted strong gains.
The period began with weak labor market and housing data, a first-ever U.S. credit-rating downgrade, and Europe’s expanding sovereign-debt crisis triggering recession fears and “risk-off” trading. Those fears subsided beginning in late 2011 as select economic data improved, and action by the European Central Bank calmed investors’ eurozone fears. But, beginning in April, slowing global growth, combined with ongoing problems in Europe, triggered another round of risk aversion.
Concerned about the economy, the Federal Reserve (the Fed) committed to keeping the federal funds rate target near zero until late 2014. In addition, the Fed extended “Operation Twist,” a stimulus strategy designed to reduce longer-term interest rates, through the end of 2012.
Inflation Tumbled on Weaker Commodity Prices
Commodity prices generally increased into early 2012, before tumbling on slowing demand and sluggish growth. Overall, Brent oil prices fell more than 13% for the period, while WTI crude futures declined 11%. Prices for other commodities also plunged; the S&P Goldman Sachs Commodities Index declined -10.74%.
In this environment of falling commodity prices and weakening economic outlooks, inflationary pressures eased. The 12-month change in the U.S. Consumer Price Index as of June 30, 2012, was 1.7%, compared with 3.6% a year earlier.
At the same time, ongoing concerns related to Europe’s debt and banking-sector solvency fueled demand for perceived “safe-haven” currencies. This helped the U.S. dollar increase in value versus the euro and other major currencies. The dollar’s strength also magnified the decline in commodity prices and stifled demand for gold.
| 12-Month Total Returns | |
| As of June 30, 2012 | |
| S&P Goldman Sachs Commodities Index (total returns) | | | -10.74 | % |
| London Gold PM Fix, in U.S. dollars | | | 6.18 | % |
| Barclays Global Treasury ex-U.S. Bond Index | | | 0.73 | % |
| Barclays U.S. Treasury Inflation Protected Securities (TIPS) Index | | | 11.66 | % |
| Barclays U.S. 1-3 Month Treasury Bill Index | | | 0.04 | % |
| U.S. Dollar (Dollar Spot Index) | | | 9.86 | % |
| Total Returns as of June 30, 2012 |
| | | | Average Annual Returns | |
| | Ticker Symbol | 1 year | Since Inception | Inception Date |
| Investor Class | ASIOX | -5.32% | 1.10%(1) | 4/30/10 |
| Barclays U.S. 1-3 Month Treasury Bill Index | — | 0.04% | 0.10% | — |
| Institutional Class | ASINX | -5.13% | 1.26%(1) | 4/30/10 |
A Class No sales charge* With sales charge* | ASIDX | -5.51% -10.92% | 0.85%(1) -1.87%(1) | 4/30/10 |
| C Class | ASIZX | -6.33% | 0.03%(1) | 4/30/10 |
| R Class | ASIUX | -5.78% | 0.54%(1) | 4/30/10 |
| * | Sales charges include initial sales charges and contingent deferred sales charges (CDSCs), as applicable. A Class shares have a 5.75% maximum initial sales charge and may be subject to a maximum CDSC of 1.00%. C Class shares redeemed within 12 months of purchase are subject to a maximum CDSC of 1.00%. The SEC requires that mutual funds provide performance information net of maximum sales charges in all cases where charges could be applied. |
| (1) | Returns would have been lower if a portion of the management fee had not been waived. |
Data presented reflect past performance. Past performance is no guarantee of future results. Current performance may be higher or lower than the performance shown. Investment return and principal value will fluctuate, and redemption value may be more or less than original cost. To obtain performance data current to the most recent month end, please call 1-800-345-2021 or visit americancentury.com. As interest rates rise, bond values will decline. International investing involves special risks, such as political instability and currency fluctuations. Investing in emerging markets may accentuate these risks. There are certain risks involved in investing in forward foreign currency exchange contracts; changes in the value of foreign currencies against the U.S. dollar could result in losses to the fund. Commodity investing involves special risks, such as weather, disease, embargoes, tariffs, taxes and economic, political and regulatory developments.
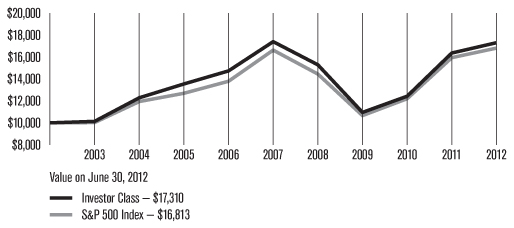
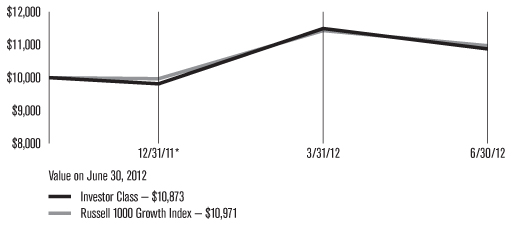
Unless otherwise indicated, performance reflects Investor Class shares; performance for other share classes will vary due to differences in fee structure. For information about other share classes available, please consult the prospectus. Data assumes reinvestment of dividends and capital gains, and none of the charts reflect the deduction of taxes that a shareholder would pay on fund distributions or the redemption of fund shares. Returns for the index are provided for comparison. The fund’s total returns include operating expenses (such as transaction costs and management fees) that reduce returns, while the total returns of the index do not.
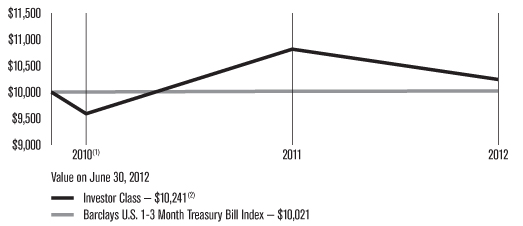
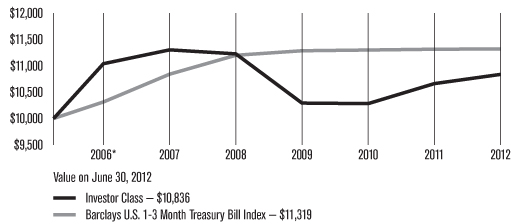
| Growth of $10,000 Over Life of Class |
| $10,000 investment made April 30, 2010 |
| (1) | From 4/30/10, the Investor Class’s inception date. Not annualized. |
| (2) | Ending value would have been lower if a portion of the management fee had not been waived. |
| Total Annual Fund Operating Expenses |
| Investor Class | Institutional Class | A Class | C Class | R Class |
| 1.19% | 0.99% | 1.44% | 2.19% | 1.69% |
The total annual fund operating expenses shown is as stated in the fund’s prospectus current as of the date of this report. The prospectus may vary from the expense ratio shown elsewhere in this report because it is based on a different time period, includes acquired fund fees and expenses, and, if applicable, does not include fee waivers or expense reimbursements.
Data presented reflect past performance. Past performance is no guarantee of future results. Current performance may be higher or lower than the performance shown. Investment return and principal value will fluctuate, and redemption value may be more or less than original cost. To obtain performance data current to the most recent month end, please call 1-800-345-2021 or visit americancentury.com. As interest rates rise, bond values will decline. International investing involves special risks, such as political instability and currency fluctuations. Investing in emerging markets may accentuate these risks. There are certain risks involved in investing in forward foreign currency exchange contracts; changes in the value of foreign currencies against the U.S. dollar could result in losses to the fund. Commodity investing involves special risks, such as weather, disease, embargoes, tariffs, taxes and economic, political and regulatory developments.
Unless otherwise indicated, performance reflects Investor Class shares; performance for other share classes will vary due to differences in fee structure. For information about other share classes available, please consult the prospectus. Data assumes reinvestment of dividends and capital gains, and none of the charts reflect the deduction of taxes that a shareholder would pay on fund distributions or the redemption of fund shares. Returns for the index are provided for comparison. The fund’s total returns include operating expenses (such as transaction costs and management fees) that reduce returns, while the total returns of the index do not.
Portfolio Managers: Bob Gahagan, Bill Martin, Brian Howell, John Lovito, and Federico Garcia Zamora
Performance Summary
For the 12 months ended June 30, 2012, Strategic Inflation Opportunities declined -5.32%.* The portfolio’s benchmark, the Barclays U.S. 1-3 Month Treasury Bill Index, advanced 0.04% during the same period.
In general, concerns about the stalling global economic recovery, combined with worries about the stability of Europe’s sovereign debt and the solvency of its banking sector, helped trigger sharp losses among global stocks and other “riskier” assets during the 12-month period. In this environment, investors favored perceived “safe-haven” investments, including U.S. Treasury securities, particularly longer-term Treasuries, and the U.S. dollar. Despite waning inflation expectations during the period, the Treasury inflation-protected securities (TIPS) benchmark outpaced the nominal Treasury index and was among the leading performers in the taxable fixed-income universe.
The portfolio’s underperformance relative to its Treasury bill benchmark was primarily due to weak results from positions in commodities, foreign stocks, and foreign currencies, which lagged as risk aversion generally dominated during the period.
Current Inflation Slowed
Current inflation, as measured by the yearly change in the Consumer Price Index (CPI), increased 1.7% as of June 30, 2012, representing a decline of nearly 2 percentage points from the inflation rate a year earlier. Much of the slowdown in inflation was due to falling commodity prices, including oil. After generally rising through March 2012, oil prices fell 20% (Brent crude) during the final three months of the period, which led to an overall decline for the one-year period.
Bucking the general trend among commodities, gold bullion advanced during the 12-month period, but the gain was much more modest than in previous fiscal years. After rallying to a record high in August 2011, gold prices generally tumbled through the end of the fiscal year. The decline stemmed from waning demand triggered by a stronger U.S. dollar (gold is priced in dollars, so a stronger dollar makes it more expensive for foreign buyers) and declining inflation (rising inflation often triggers demand for gold from investors looking to hedge against the threat).
Inflation Outlook Eased
Longer-term inflation expectations also eased during the period, according to one market indicator. The yield difference (or breakeven rate) between 10-year TIPS and nominal 10-year Treasuries declined from 2.38 percentage points at the end of June 2011 to 2.10 percentage points at the end of June 2012. Theoretically, the 10-year breakeven rate reflects the market’s expectations for inflation for the next 10 years and also reflects the inflation rate required for TIPS to outperform nominal Treasuries during that period.
* All fund returns referenced in this commentary are for Investor Class shares.
Portfolio Positioning & Strategy
As of June 30, 2012, approximately 37% of Strategic Inflation Opportunities was invested in TIPS. The portfolio also had an additional small percentage of inflation-linked fixed income exposure in the form of inflation “swaps” (synthetic inflation-linked overlays for corporate and mortgage securities). Commodity-linked investments (including commodity exchange-traded funds—ETFs), domestic and foreign stocks, and foreign currency instruments generally comprised the remainder of the portfolio.
Within the portfolio’s inflation-linked allocation, TIPS outperformed the benchmark and contributed favorably to the portfolio’s relative performance. In addition, the investment team’s use of inflation swaps also contributed favorably to performance, as these securities outperformed short-maturity TIPS and the portfolio’s benchmark.
Within the commodities component, the portfolio was evenly weighted between futures and commodity-related stocks and ETFs, which generally detracted from performance. In terms of specific commodities exposure, the portfolio ended the period with overweight positions in gold and fertilizer companies and an underweight in oil. This positioning reflects the investment team’s outlook for weak economic growth, particularly among developed countries, and continued re-inflationary policies of lower interest rates and quantitative easing from the world’s central banks. A small weighting to global REITs (real estate investment trusts) contributed positively to performance, benefiting from the declining interest rate environment.
After specific currency positions performed well in late 2011 and early 2012, the investment team sold some of that currency exposure to lock in profits and reduce risk. However, remaining exposure to commodity-driven currencies in Canada, Sweden, Australia, New Zealand, and Norway dragged down overall performance. In addition, underweight positions in the outperforming Japanese yen and U.S. dollar detracted from results, while an underweight in the lagging euro helped.
Outlook
The portfolio’s investment team expects inflation to remain relatively contained in the near term, due to slowing economic growth, a weak labor market, and lower commodity prices. Longer term, though, the team believes record federal debt and historically low and highly stimulative interest rate levels eventually may result in higher inflation than what is currently priced into the U.S. Treasury market. The team believes this scenario underscores the importance of products designed to hedge against inflation and protect purchasing power, such as Strategic Inflation Opportunities.
| JUNE 30, 2012 | |
| Types of Investments in Portfolio | % of net assets |
| U.S. Treasury Securities | 46.2% |
| Domestic Common Stocks | 11.3% |
| Foreign Common Stocks | 5.8% |
| Commodity ETFs | 14.6% |
| Commercial Paper | 12.4% |
| Corporate Bonds | 2.6% |
| Commercial Mortgage-Backed Securities | 1.8% |
| Collateralized Mortgage Obligations | 1.4% |
| Temporary Cash Investments | 4.2% |
| Other Assets and Liabilities | (0.3)% |
| | |
| Top Ten Stock Holdings | % of net assets |
| Chevron Corp. | 1.0% |
| Exxon Mobil Corp. | 1.0% |
| Schlumberger Ltd. | 0.7% |
| Occidental Petroleum Corp. | 0.5% |
| ConocoPhillips | 0.5% |
| Apache Corp. | 0.3% |
| Goldcorp, Inc. New York Shares | 0.3% |
| Freeport-McMoRan Copper & Gold, Inc. | 0.3% |
| Halliburton Co. | 0.3% |
| Barrick Gold Corp. | 0.3% |
| | |
| Geographic Composition of Stock Holdings | % of net assets |
| United States | 11.3% |
| Canada | 3.0% |
| Hong Kong | 0.7% |
| Japan | 0.5% |
| Other Countries | 1.6% |
Fund shareholders may incur two types of costs: (1) transaction costs, including sales charges (loads) on purchase payments and redemption/exchange fees; and (2) ongoing costs, including management fees; distribution and service (12b-1) fees; and other fund expenses. This example is intended to help you understand your ongoing costs (in dollars) of investing in your fund and to compare these costs with the ongoing cost of investing in other mutual funds.
The example is based on an investment of $1,000 made at the beginning of the period and held for the entire period from January 1, 2012 to June 30, 2012.
Actual Expenses
The table provides information about actual account values and actual expenses for each class. You may use the information, together with the amount you invested, to estimate the expenses that you paid over the period. First, identify the share class you own. Then simply divide your account value by $1,000 (for example, an $8,600 account value divided by $1,000 = 8.6), then multiply the result by the number under the heading “Expenses Paid During Period” to estimate the expenses you paid on your account during this period.
If you hold Investor Class shares of any American Century Investments fund, or Institutional Class shares of the American Century Diversified Bond Fund, in an American Century Investments account (i.e., not a financial intermediary or retirement plan account), American Century Investments may charge you a $12.50 semiannual account maintenance fee if the value of those shares is less than $10,000. We will redeem shares automatically in one of your accounts to pay the $12.50 fee. In determining your total eligible investment amount, we will include your investments in all personal accounts (including American Century Investments Brokerage accounts) registered under your Social Security number. Personal accounts include individual accounts, joint accounts, UGMA/UTMA accounts, personal trusts, Coverdell Education Savings Accounts and IRAs (including traditional, Roth, Rollover, SEP-, SARSEP- and SIMPLE-IRAs), and certain other retirement accounts. If you have only business, business retirement, employer-sponsored or American Century Investments Brokerage accounts, you are currently not subject to this fee. If you are subject to the Account Maintenance Fee, your account value could be reduced by the fee amount.
Hypothetical Example for Comparison Purposes
The table also provides information about hypothetical account values and hypothetical expenses based on the actual expense ratio of each class of your fund and an assumed rate of return of 5% per year before expenses, which is not the actual return of a fund’s share class. The hypothetical account values and expenses may not be used to estimate the actual ending account balance or expenses you paid for the period. You may use this information to compare the ongoing costs of investing in your fund and other funds. To do so, compare this 5% hypothetical example with the 5% hypothetical examples that appear in the shareholder reports of the other funds.
Please note that the expenses shown in the table are meant to highlight your ongoing costs only and do not reflect any transactional costs, such as sales charges (loads) or redemption/exchange fees. Therefore, the table is useful in comparing ongoing costs only, and will not help you determine the relative total costs of owning different funds. In addition, if these transactional costs were included, your costs would have been higher.
| | | | | |
| | Beginning Account Value 1/1/12 | Ending Account Value 6/30/12 | Expenses Paid During Period(1) 1/1/12 – 6/30/12 | Annualized Expense Ratio(1) |
| Actual | | | | |
| Investor Class | $1,000 | $997.00 | $5.41 | 1.09% |
| Institutional Class | $1,000 | $997.60 | $4.42 | 0.89% |
| A Class | $1,000 | $996.00 | $6.65 | 1.34% |
| C Class | $1,000 | $991.00 | $10.35 | 2.09% |
| R Class | $1,000 | $994.00 | $7.88 | 1.59% |
| Hypothetical | | | | |
| Investor Class | $1,000 | $1,019.44 | $5.47 | 1.09% |
| Institutional Class | $1,000 | $1,020.44 | $4.47 | 0.89% |
| A Class | $1,000 | $1,018.20 | $6.72 | 1.34% |
| C Class | $1,000 | $1,014.47 | $10.47 | 2.09% |
| R Class | $1,000 | $1,016.96 | $7.97 | 1.59% |
| (1) | Expenses are equal to the class’s annualized expense ratio listed in the table above, multiplied by the average account value over the period, multiplied by 182, the number of days in the most recent fiscal half-year, divided by 366, to reflect the one-half year period. |
| | | Principal Amount/ Shares | | | Value | |
| U.S. Treasury Securities — 46.2% | |
| U.S. Treasury Inflation Indexed Notes, 1.875%, 7/15/13 | | | $2,874,947 | | | | $2,946,596 | |
| U.S. Treasury Inflation Indexed Notes, 2.00%, 1/15/14 | | | 4,856,202 | | | | 5,045,900 | |
| U.S. Treasury Inflation Indexed Notes, 1.25%, 4/15/14 | | | 3,702,833 | | | | 3,825,778 | |
| U.S. Treasury Inflation Indexed Notes, 2.00%, 7/15/14 | | | 2,203,147 | | | | 2,336,369 | |
| U.S. Treasury Inflation Indexed Notes, 1.625%, 1/15/15 | | | 3,415,977 | | | | 3,633,212 | |
U.S. Treasury Inflation Indexed Notes, 0.50%, 4/15/15(1) | | | 6,322,245 | | | | 6,570,690 | |
| U.S. Treasury Inflation Indexed Notes, 1.875%, 7/15/15 | | | 4,096,210 | | | | 4,459,429 | |
| U.S. Treasury Inflation Indexed Notes, 2.00%, 1/15/16 | | | 3,333,888 | | | | 3,692,541 | |
| U.S. Treasury Inflation Indexed Notes, 0.125%, 4/15/16 | | | 2,579,792 | | | | 2,688,223 | |
| U.S. Treasury Inflation Indexed Notes, 2.50%, 7/15/16 | | | 478,489 | | | | 548,356 | |
| U.S. Treasury Inflation Indexed Notes, 2.375%, 1/15/17 | | | 3,650,848 | | | | 4,217,872 | |
| U.S. Treasury Inflation Indexed Notes, 0.125%, 4/15/17 | | | 2,025,940 | | | | 2,141,165 | |
| U.S. Treasury Inflation Indexed Notes, 1.625%, 1/15/18 | | | 164,735 | | | | 188,287 | |
| U.S. Treasury Notes, 0.375%, 8/31/12 | | | 10,000,000 | | | | 10,005,860 | |
TOTAL U.S. TREASURY SECURITIES (Cost $52,077,088) | | | | 52,300,278 | |
| Common Stocks — 17.1% | |
| CHEMICALS — 0.5% | |
| Agrium, Inc. | | | 1,967 | | | | 174,020 | |
| Monsanto Co. | | | 1,765 | | | | 146,107 | |
| Mosaic Co. (The) | | | 1,547 | | | | 84,714 | |
| Potash Corp. of Saskatchewan, Inc. | | | 4,419 | | | | $193,066 | |
| | | | | | | | 597,907 | |
| ENERGY EQUIPMENT AND SERVICES — 2.0% | |
| Baker Hughes, Inc. | | | 4,867 | | | | 200,034 | |
| Diamond Offshore Drilling, Inc. | | | 1,751 | | | | 103,537 | |
| Ensco plc Class A | | | 3,416 | | | | 160,450 | |
| Halliburton Co. | | | 11,371 | | | | 322,823 | |
Nabors Industries Ltd.(2) | | | 3,922 | | | | 56,477 | |
| National Oilwell Varco, Inc. | | | 3,542 | | | | 228,246 | |
Noble Corp.(2) | | | 2,853 | | | | 92,808 | |
| Oceaneering International, Inc. | | | 2,102 | | | | 100,602 | |
| Patterson-UTI Energy, Inc. | | | 4,622 | | | | 67,296 | |
Rowan Cos. plc(2) | | | 2,380 | | | | 76,945 | |
| Schlumberger Ltd. | | | 11,374 | | | | 738,286 | |
| Tidewater, Inc. | | | 1,616 | | | | 74,918 | |
Weatherford International Ltd.(2) | | | 7,094 | | | | 89,597 | |
| | | | | | | | 2,312,019 | |
| HOTELS, RESTAURANTS AND LEISURE — 0.1% | |
| Wyndham Worldwide Corp. | | | 2,239 | | | | 118,085 | |
| HOUSEHOLD DURABLES — 0.2% | |
| Lennar Corp., Class A | | | 4,145 | | | | 128,122 | |
PulteGroup, Inc.(2) | | | 11,680 | | | | 124,976 | |
| | | | | | | | 253,098 | |
| METALS AND MINING — 2.3% | |
Allied Nevada Gold Corp.(2) | | | 3,150 | | | | 89,355 | |
B2Gold Corp.(2) | | | 35,517 | | | | 106,750 | |
| Barrick Gold Corp. | | | 8,146 | | | | 306,045 | |
| BHP Billiton Ltd. ADR | | | 833 | | | | 54,395 | |
Detour Gold Corp.(2) | | | 2,169 | | | | 43,695 | |
| Eldorado Gold Corp. | | | 1,982 | | | | 24,412 | |
First Majestic Silver Corp.(2) | | | 1,994 | | | | 28,813 | |
| Franco-Nevada Corp. | | | 3,170 | | | | 143,352 | |
| Freeport-McMoRan Copper & Gold, Inc. | | | 10,049 | | | | 342,369 | |
| Goldcorp, Inc. New York Shares | | | 9,336 | | | | 350,847 | |
| Kinross Gold Corp. New York Shares | | | 8,063 | | | | 65,713 | |
New Gold, Inc.(2) | | | 8,120 | | | | 77,444 | |
| Newmont Mining Corp. | | | 4,317 | | | | 209,418 | |
Osisko Mining Corp.(2) | | | 9,846 | | | | 67,697 | |
| Royal Gold, Inc. | | | 739 | | | | 57,938 | |
| | | | | | | | | |
| | | Principal Amount/ Shares | | | | Value | |
Sandstorm Gold Ltd.(2) | | | 8,636 | | | | $70,405 | |
| Silver Wheaton Corp. | | | 4,795 | | | | 128,698 | |
SunCoke Energy, Inc.(2) | | | 2,353 | | | | 34,471 | |
Tahoe Resources, Inc.(2) | | | 6,116 | | | | 84,522 | |
| Teck Resources Ltd. | | | 4,267 | | | | 132,021 | |
Torex Gold Resources, Inc.(2) | | | 13,663 | | | | 22,143 | |
| Yamana Gold, Inc. New York Shares | | | 9,279 | | | | 142,897 | |
| | | | | | | | 2,583,400 | |
| OIL, GAS AND CONSUMABLE FUELS — 7.0% | |
Alpha Natural Resources, Inc.(2) | | | 3,765 | | | | 32,793 | |
| Anadarko Petroleum Corp. | | | 3,957 | | | | 261,953 | |
| Apache Corp. | | | 4,312 | | | | 378,982 | |
| Cabot Oil & Gas Corp. | | | 1,546 | | | | 60,912 | |
| Canadian Natural Resources Ltd. | | | 5,562 | | | | 149,340 | |
| Canadian Oil Sands Ltd. | | | 3,618 | | | | 70,079 | |
| Chesapeake Energy Corp. | | | 5,968 | | | | 111,005 | |
| Chevron Corp. | | | 10,464 | | | | 1,103,952 | |
| Cimarex Energy Co. | | | 1,012 | | | | 55,781 | |
Cobalt International Energy, Inc.(2) | | | 2,652 | | | | 62,322 | |
| ConocoPhillips | | | 10,153 | | | | 567,350 | |
Continental Resources, Inc.(2) | | | 911 | | | | 60,691 | |
Denbury Resources, Inc.(2) | | | 4,275 | | | | 64,595 | |
| Devon Energy Corp. | | | 4,044 | | | | 234,512 | |
| Encana Corp. | | | 8,354 | | | | 174,014 | |
| Energy Transfer Equity LP | | | 1,452 | | | | 59,561 | |
| EOG Resources, Inc. | | | 2,901 | | | | 261,409 | |
| Exxon Mobil Corp. | | | 12,897 | | | | 1,103,596 | |
Forest Oil Corp.(2) | | | 3,215 | | | | 23,566 | |
| Hess Corp. | | | 3,881 | | | | 168,629 | |
| Marathon Oil Corp. | | | 7,771 | | | | 198,704 | |
| Marathon Petroleum Corp. | | | 3,347 | | | | 150,347 | |
Newfield Exploration Co.(2) | | | 1,179 | | | | 34,556 | |
| Noble Energy, Inc. | | | 1,600 | | | | 135,712 | |
| Occidental Petroleum Corp. | | | 6,874 | | | | 589,583 | |
| Peabody Energy Corp. | | | 2,232 | | | | 54,729 | |
Phillips 66(2) | | | 6,017 | | | | 200,005 | |
Pinecrest Energy, Inc.(2) | | | 24,948 | | | | 43,373 | |
| Pioneer Natural Resources Co. | | | 742 | | | | 65,452 | |
Plains Exploration & Production Co.(2) | | | 1,702 | | | | 59,876 | |
| Range Resources Corp. | | | 1,669 | | | | 103,261 | |
Renegade Petroleum Ltd.(2) | | | 19,080 | | | | 48,726 | |
Southwestern Energy Co.(2) | | | 2,776 | | | | $88,638 | |
| Spectra Energy Corp. | | | 4,923 | | | | 143,062 | |
| Suncor Energy, Inc. | | | 10,086 | | | | 291,990 | |
| Sunoco, Inc. | | | 2,074 | | | | 98,515 | |
| Talisman Energy, Inc. | | | 1,430 | | | | 16,391 | |
| Talisman Energy, Inc., New York shares | | | 7,515 | | | | 86,122 | |
| TransCanada Corp. | | | 1,078 | | | | 45,181 | |
| Valero Energy Corp. | | | 7,251 | | | | 175,112 | |
Whiting Petroleum Corp.(2) | | | 1,442 | | | | 59,295 | |
| Williams Cos., Inc. (The) | | | 4,659 | | | | 134,272 | |
WPX Energy, Inc.(2) | | | 3,731 | | | | 60,368 | |
| | | | | | | | 7,888,312 | |
PAPER AND FOREST PRODUCTS† | |
| Domtar Corp. | | | 505 | | | | 38,739 | |
| REAL ESTATE INVESTMENT TRUSTS (REITs) — 3.4% | |
| Advance Residence Investment Corp. | | | 17 | | | | 33,028 | |
| American Tower Corp. | | | 3,726 | | | | 260,485 | |
| Apartment Investment & Management Co., Class A | | | 4,929 | | | | 133,231 | |
| Camden Property Trust | | | 2,048 | | | | 138,588 | |
| Capital Property Fund | | | 21,965 | | | | 26,885 | |
| CDL Hospitality Trusts | | | 29,000 | | | | 44,859 | |
| CFS Retail Property Trust | | | 40,739 | | | | 81,022 | |
| Derwent London plc | | | 2,859 | | | | 83,068 | |
| Extra Space Storage, Inc. | | | 4,272 | | | | 130,723 | |
| Frasers Centrepoint Trust | | | 34,000 | | | | 44,883 | |
| Goodman Group | | | 21,812 | | | | 82,677 | |
| Great Portland Estates plc | | | 13,149 | | | | 81,387 | |
| Hammerson plc | | | 13,661 | | | | 95,228 | |
| Health Care REIT, Inc. | | | 3,108 | | | | 181,196 | |
| Highwoods Properties, Inc. | | | 3,677 | | | | 123,731 | |
| Host Hotels & Resorts, Inc. | | | 4,546 | | | | 71,918 | |
| Japan Real Estate Investment Corp. | | | 5 | | | | 45,968 | |
| Japan Retail Fund Investment Corp. | | | 24 | | | | 38,056 | |
| Kilroy Realty Corp. | | | 2,544 | | | | 123,155 | |
| Klepierre | | | 3,468 | | | | 114,279 | |
| Link Real Estate Investment Trust (The) | | | 36,500 | | | | 149,228 | |
| Newcastle Investment Corp. | | | 10,162 | | | | 68,085 | |
| Nippon Building Fund, Inc. | | | 5 | | | | 48,415 | |
| Public Storage | | | 1,584 | | | | 228,745 | |
| Rayonier, Inc. | | | 3,247 | | | | 145,790 | |
| RioCan Real Estate Investment Trust | | | 1,935 | | | | 52,647 | |
| Simon Property Group, Inc. | | | 1,520 | | | | 236,603 | |
| | | | | | | | | |
| | | Principal Amount/ Shares | | | | Value | |
| Taubman Centers, Inc. | | | 1,829 | | | | $141,126 | |
| UDR, Inc. | | | 5,562 | | | | 143,722 | |
| United Urban Investment Corp. | | | 32 | | | | 34,522 | |
| Ventas, Inc. | | | 3,442 | | | | 217,259 | |
| Westfield Group | | | 18,173 | | | | 177,054 | |
| Westfield Retail Trust | | | 23,243 | | | | 68,136 | |
| Weyerhaeuser Co. | | | 9,025 | | | | 201,799 | |
| | | | | | | | 3,847,498 | |
| REAL ESTATE MANAGEMENT AND DEVELOPMENT — 1.5% | |
| Ayala Land, Inc. | | | 69,300 | | | | 35,652 | |
| BR Malls Participacoes SA | | | 5,600 | | | | 63,430 | |
| Brookfield Asset Management, Inc. Class A | | | 5,268 | | | | 174,371 | |
| Cheung Kong Holdings Ltd. | | | 3,000 | | | | 37,033 | |
| China Overseas Grand Oceans Group Ltd. | | | 45,500 | | | | 41,001 | |
| China Overseas Land & Investment Ltd. | | | 42,000 | | | | 98,527 | |
| Daito Trust Construction Co. Ltd. | | | 500 | | | | 47,431 | |
| Daiwa House Industry Co. Ltd. | | | 3,000 | | | | 42,590 | |
Global Logistic Properties Ltd.(2) | | | 49,000 | | | | 81,630 | |
| Growthpoint Properties Ltd. | | | 17,462 | | | | 49,195 | |
| GSW Immobilien AG | | | 1,833 | | | | 62,624 | |
| Hang Lung Properties Ltd. | | | 10,000 | | | | 34,040 | |
| Keppel Land Ltd. | | | 18,000 | | | | 46,264 | |
| Mitsubishi Estate Co. Ltd. | | | 7,000 | | | | 125,574 | |
| Mitsui Fudosan Co. Ltd. | | | 5,000 | | | | 96,994 | |
| New World Development Co. Ltd. | | | 60,000 | | | | 70,835 | |
| PT Ciputra Development Tbk | | | 393,500 | | | | 27,363 | |
| PT Lippo Karawaci Tbk | | | 223,500 | | | | 19,092 | |
| Shimao Property Holdings Ltd. | | | 44,500 | | | | 68,911 | |
| SM Prime Holdings, Inc. | | | 107,000 | | | | 33,295 | |
| Sobha Developers Ltd. | | | 1,701 | | | | 10,381 | |
| Sumitomo Realty & Development Co. Ltd. | | | 3,000 | | | | 73,815 | |
| Sun Hung Kai Properties Ltd. | | | 8,000 | | | | 94,931 | |
| Swire Properties Ltd. | | | 19,961 | | | | 60,120 | |
| TAG Immobilien AG | | | 8,494 | | | | 79,817 | |
| Wheelock & Co. Ltd. | | | 20,000 | | | | 75,995 | |
| | | | | | | | 1,650,911 | |
| TRADING COMPANIES AND DISTRIBUTORS — 0.1% | |
| Noble Group Ltd. | | | 80,290 | | | | $71,685 | |
TOTAL COMMON STOCKS (Cost $20,282,127) | | | | 19,361,654 | |
| Commodity ETFs — 14.6% | |
iShares S&P GSCI Commodity Indexed Trust(2) | | | 262,373 | | | | 7,986,634 | |
PowerShares DB Commodity Index Tracking Fund(2) | | | 200,812 | | | | 5,170,909 | |
SPDR Gold Shares(2) | | | 10,882 | | | | 1,688,778 | |
Sprott Physical Gold Trust(2) | | | 124,062 | | | | 1,710,815 | |
TOTAL COMMODITY ETFs (Cost $17,688,501) | | | | 16,557,136 | |
Commercial Paper(3) — 12.4% | |
BASF SE, 0.16%, 7/24/12(4) | | | $2,000,000 | | | | 1,999,833 | |
BP Capital Markets plc, 0.17%, 8/22/12(4) | | | 750,000 | | | | 749,820 | |
| City of Austin, 0.20%, 8/15/12 | | | 2,011,000 | | | | 2,010,598 | |
CRC Funding LLC, 0.46%, 7/9/12(4) | | | 1,300,000 | | | | 1,299,937 | |
Govco LLC, 0.47%, 7/5/12(4) | | | 2,000,000 | | | | 1,999,926 | |
| Nestle Finance International Ltd., 0.18%, 8/30/12 | | | 2,000,000 | | | | 1,999,549 | |
Sanofi, 0.16%, 9/14/12(4) | | | 2,000,000 | | | | 1,999,229 | |
Thunder Bay Funding LLC, 0.18%, 8/14/12(4) | | | 2,000,000 | | | | 1,999,385 | |
TOTAL COMMERCIAL PAPER (Cost $14,058,170) | | | | 14,058,277 | |
| Corporate Bonds — 2.6% | |
| AUTO COMPONENTS — 0.1% | |
| Visteon Corp., 6.75%, 4/15/19 | | | 70,000 | | | | 68,425 | |
| AUTOMOBILES — 0.1% | |
| Ford Motor Credit Co. LLC, 5.625%, 9/15/15 | | | 70,000 | | | | 76,266 | |
| Ford Motor Credit Co. LLC, 5.00%, 5/15/18 | | | 100,000 | | | | 106,492 | |
| | | | | | | | 182,758 | |
BEVERAGES† | |
| Anheuser-Busch InBev Worldwide, Inc., 5.375%, 1/15/20 | | | 30,000 | | | | 35,828 | |
| CHEMICALS — 0.2% | |
| Ashland, Inc., 9.125%, 6/1/17 | | | 170,000 | | | | 187,850 | |
| CF Industries, Inc., 6.875%, 5/1/18 | | | 25,000 | | | | 29,719 | |
| | | | | | | | 217,569 | |
| | | | | | | | | |
| | | Principal Amount/ Shares | | | | Value | |
COMMERCIAL BANKS† | |
| Capital One Financial Corp., 2.125%, 7/15/14 | | | $50,000 | | | | $50,456 | |
| CONSUMER FINANCE — 0.1% | |
CIT Group, Inc., 4.75%, 2/15/15(4) | | | 75,000 | | | | 77,063 | |
| Credit Suisse (New York), 5.50%, 5/1/14 | | | 20,000 | | | | 21,214 | |
| | | | | | | | 98,277 | |
| CONTAINERS AND PACKAGING — 0.1% | |
Ardagh Packaging Finance plc, 7.375%, 10/15/17(4) | | | 70,000 | | | | 74,725 | |
| Ball Corp., 7.125%, 9/1/16 | | | 70,000 | | | | 76,562 | |
| | | | | | | | 151,287 | |
| DIVERSIFIED FINANCIAL SERVICES — 0.2% | |
| Ally Financial, Inc., 8.30%, 2/12/15 | | | 70,000 | | | | 76,475 | |
| Citigroup, Inc., 6.00%, 12/13/13 | | | 60,000 | | | | 63,083 | |
| Goldman Sachs Group, Inc. (The), 3.625%, 2/7/16 | | | 45,000 | | | | 45,057 | |
| Morgan Stanley, 5.625%, 9/23/19 | | | 20,000 | | | | 19,835 | |
| UBS AG (Stamford Branch), 2.25%, 8/12/13 | | | 40,000 | | | | 40,136 | |
| | | | | | | | 244,586 | |
| DIVERSIFIED TELECOMMUNICATION SERVICES — 0.2% | |
| CenturyLink, Inc., Series L, 7.875%, 8/15/12 | | | 30,000 | | | | 30,213 | |
| Cincinnati Bell, Inc., 8.25%, 10/15/17 | | | 70,000 | | | | 73,150 | |
| Frontier Communications Corp., 6.25%, 1/15/13 | | | 50,000 | | | | 51,281 | |
| Windstream Corp., 7.875%, 11/1/17 | | | 30,000 | | | | 32,850 | |
| | | | | | | | 187,494 | |
| ELECTRIC UTILITIES — 0.1% | |
| AES Corp. (The), 9.75%, 4/15/16 | | | 70,000 | | | | 83,300 | |
FOOD PRODUCTS† | |
| Tyson Foods, Inc., 6.85%, 4/1/16 | | | 20,000 | | | | 22,975 | |
| HEALTH CARE PROVIDERS AND SERVICES — 0.1% | |
| DaVita, Inc., 6.375%, 11/1/18 | | | 25,000 | | | | 25,875 | |
Fresenius Medical Care US Finance II, Inc., 5.625%, 7/31/19(4) | | | 70,000 | | | | 73,150 | |
| Universal Health Services, Inc., 7.125%, 6/30/16 | | | 40,000 | | | | 44,800 | |
| | | | | | | | 143,825 | |
HOTELS, RESTAURANTS AND LEISURE† | |
| Wynn Las Vegas LLC / Wynn Las Vegas Capital Corp., 7.875%, 11/1/17 | | | $50,000 | | | | $55,250 | |
| INDUSTRIAL CONGLOMERATES — 0.1% | |
Bombardier, Inc., 5.75%, 3/15/22(4) | | | 70,000 | | | | 70,088 | |
| INSURANCE — 0.1% | |
| International Lease Finance Corp., 4.875%, 4/1/15 | | | 70,000 | | | | 70,400 | |
| IT SERVICES — 0.1% | |
Fidelity National Information Services, Inc., 5.00%, 3/15/22(4) | | | 70,000 | | | | 71,575 | |
| International Business Machines Corp., 1.95%, 7/22/16 | | | 50,000 | | | | 51,505 | |
| | | | | | | | 123,080 | |
| MEDIA — 0.2% | |
| CCO Holdings LLC/CCO Holdings Capital Corp., 7.25%, 10/30/17 | | | 70,000 | | | | 76,650 | |
| DISH DBS Corp., 7.00%, 10/1/13 | | | 50,000 | | | | 52,750 | |
Sirius XM Radio, Inc., 8.75%, 4/1/15(4) | | | 70,000 | | | | 79,100 | |
| | | | | | | | 208,500 | |
METALS AND MINING† | |
| Barrick Gold Corp., 2.90%, 5/30/16 | | | 30,000 | | | | 31,509 | |
| MULTI-UTILITIES — 0.2% | |
Calpine Construction Finance Co. LP/CCFC Finance Corp., 8.00%, 6/1/16(4) | | | 45,000 | | | | 48,825 | |
Calpine Corp., 7.25%, 10/15/17(4) | | | 70,000 | | | | 75,600 | |
| CMS Energy Corp., 4.25%, 9/30/15 | | | 30,000 | | | | 31,345 | |
| CMS Energy Corp., 8.75%, 6/15/19 | | | 25,000 | | | | 30,980 | |
| DTE Energy Co., 1.17%, 6/3/13 | | | 40,000 | | | | 40,076 | |
| | | | | | | | 226,826 | |
| OIL, GAS AND CONSUMABLE FUELS — 0.2% | |
| Alpha Natural Resources, Inc., 6.00%, 6/1/19 | | | 70,000 | | | | 60,025 | |
| Anadarko Petroleum Corp., 5.95%, 9/15/16 | | | 20,000 | | | | 22,725 | |
| Newfield Exploration Co., 6.875%, 2/1/20 | | | 50,000 | | | | 53,500 | |
| | | | | | | | | |
| | | Principal Amount/ Shares | | | | Value | |
| Peabody Energy Corp., 7.375%, 11/1/16 | | | $30,000 | | | | $33,150 | |
| Peabody Energy Corp., 6.50%, 9/15/20 | | | 30,000 | | | | 30,525 | |
| | | | | | | | 199,925 | |
| PAPER AND FOREST PRODUCTS — 0.1% | |
Georgia-Pacific LLC, 8.25%, 5/1/16(4) | | | 80,000 | | | | 88,326 | |
PERSONAL PRODUCTS† | |
| Procter & Gamble Co. (The), 0.70%, 8/15/14 | | | 50,000 | | | | 50,161 | |
| PHARMACEUTICALS — 0.1% | |
Valeant Pharmaceuticals International, 6.50%, 7/15/16(4) | | | 70,000 | | | | 73,500 | |
| REAL ESTATE INVESTMENT TRUSTS (REITs) — 0.1% | |
| Developers Diversified Realty Corp., 5.375%, 10/15/12 | | | 40,000 | | | | 40,048 | |
| ERP Operating LP, 5.20%, 4/1/13 | | | 25,000 | | | | 25,750 | |
| Reckson Operating Partnership LP, 6.00%, 3/31/16 | | | 50,000 | | | | 53,198 | |
| | | | | | | | 118,996 | |
| SEMICONDUCTORS AND SEMICONDUCTOR EQUIPMENT — 0.1% | |
| Advanced Micro Devices, Inc., 8.125%, 12/15/17 | | | 70,000 | | | | 76,300 | |
TEXTILES, APPAREL AND LUXURY GOODS† | |
| Gap, Inc. (The), 5.95%, 4/12/21 | | | 10,000 | | | | 10,390 | |
| WIRELESS TELECOMMUNICATION SERVICES — 0.1% | |
| Sprint Nextel Corp., 6.00%, 12/1/16 | | | 70,000 | | | | 67,375 | |
TOTAL CORPORATE BONDS(Cost $2,882,165) | | | | 2,957,406 | |
Commercial Mortgage-Backed Securities(5) — 1.8% | |
| Banc of America Commercial Mortgage, Inc., Series 2004-1, Class A4 SEQ, 4.76%, 11/10/39 | | | 150,000 | | | | 156,760 | |
| Banc of America Commercial Mortgage, Inc., Series 2004-6, Class A3 SEQ, 4.51%, 12/10/42 | | | 29,781 | | | | 30,064 | |
| Banc of America Commercial Mortgage, Inc., Series 2005-5, Class A4, VRN, 5.12%, 7/1/12 | | | 100,000 | | | | 111,802 | |
| Banc of America Commercial Mortgage, Inc., Series 2005-5, Class AM, VRN, 5.18%, 7/1/12 | | | $75,000 | | | | $80,469 | |
| Greenwich Capital Commercial Funding Corp., Series 2004-GG1, Class B, VRN, 5.43%, 7/1/12 | | | 25,000 | | | | 25,641 | |
| Greenwich Capital Commercial Funding Corp., Series 2005-GG3, Class A3 SEQ, 4.57%, 8/10/42 | | | 95,685 | | | | 96,926 | |
| Greenwich Capital Commercial Funding Corp., Series 2005-GG3, Class A4, VRN, 4.80%, 7/10/12 | | | 200,000 | | | | 215,974 | |
| GS Mortgage Securities Corp. II, Series 2004-GG2, Class A6 SEQ, VRN, 5.40%, 7/1/12 | | | 200,000 | | | | 214,530 | |
| GS Mortgage Securities Corp. II, Series 2005-GG4, Class A4A SEQ, 4.75%, 7/10/39 | | | 200,000 | | | | 216,460 | |
| LB-UBS Commercial Mortgage Trust, Series 2004-C1, Class A4 SEQ, 4.57%, 1/15/31 | | | 75,000 | | | | 78,722 | |
| LB-UBS Commercial Mortgage Trust, Series 2004-C2, Class A4 SEQ, 4.37%, 3/15/36 | | | 155,000 | | | | 162,256 | |
| LB-UBS Commercial Mortgage Trust, Series 2004-C4, Class A4, VRN, 5.45%, 7/11/12 | | | 150,000 | | | | 159,830 | |
| LB-UBS Commercial Mortgage Trust, Series 2004-C8, Class AJ, VRN, 4.86%, 7/11/12 | | | 25,000 | | | | 26,687 | |
| LB-UBS Commercial Mortgage Trust, Series 2005-C3, Class AJ SEQ, 4.84%, 7/15/40 | | | 85,000 | | | | 84,426 | |
| LB-UBS Commercial Mortgage Trust, Series 2005-C5, Class AM, VRN, 5.02%, 7/11/12 | | | 125,000 | | | | 134,482 | |
| LB-UBS Commercial Mortgage Trust, Series 2005-C7, Class AM SEQ, VRN, 5.26%, 7/11/12 | | | 75,000 | | | | 81,656 | |
| | | | | | | | | |
| | | Principal Amount/ Shares | | | | Value | |
| Wachovia Bank Commercial Mortgage Trust, Series 2004-C15, Class A3 SEQ, 4.50%, 10/15/41 | | | $21,489 | | | | $21,721 | |
| Wachovia Bank Commercial Mortgage Trust, Series 2005-C20, Class AMFX, VRN, 5.18%, 7/1/12 | | | 100,000 | | | | 108,730 | |
TOTAL COMMERCIAL MORTGAGE-BACKED SECURITIES (Cost $1,966,800) | | | | 2,007,136 | |
Collateralized Mortgage Obligations(5) — 1.4% | |
| PRIVATE SPONSOR COLLATERALIZED MORTGAGE OBLIGATIONS — 1.3% | |
| ABN Amro Mortgage Corp., Series 2003-6, Class 1A4, 5.50%, 5/25/33 | | | 20,965 | | | | 21,818 | |
| Banc of America Mortgage Securities, Inc., Series 2004-7, Class 7A1, 5.00%, 8/25/19 | | | 22,530 | | | | 23,132 | |
| Bear Stearns Adjustable Rate Mortgage Trust, Series 2006-1, Class A1, VRN, 2.52%, 7/1/12 | | | 122,874 | | | | 106,087 | |
| Citigroup Mortgage Loan Trust, Inc., Series 2005-4, Class A, VRN, 5.33%, 7/1/12 | | | 102,546 | | | | 98,492 | |
| Countrywide Home Loan Mortgage Pass-Through Trust, Series 2003-35, Class 1A3 SEQ, 5.00%, 9/25/18 | | | 18,104 | | | | 18,929 | |
| Countrywide Home Loan Mortgage Pass-Through Trust, Series 2004-5, Class 2A4, 5.50%, 5/25/34 | | | 20,907 | | | | 21,698 | |
| JP Morgan Mortgage Trust, Series 2005-A6, Class 7A1, VRN, 2.72%, 7/1/12 | | | 35,283 | | | | 27,142 | |
| MASTR Asset Securitization Trust, Series 2003-10, Class 3A1, 5.50%, 11/25/33 | | | 53,916 | | | | 56,691 | |
| PHHMC Mortgage Pass-Through Certificates, Series 2007-6, Class A1, VRN, 6.00%, 7/1/12 | | | 47,458 | | | | 49,535 | |
| Wamu Mortgage Pass-Through Certificates, Series 2003-S11, Class 3A5, 5.95%, 11/25/33 | | | 33,298 | | | | 35,127 | |
| Wells Fargo Mortgage-Backed Securities Trust, Series 2004-1, Class A10, 5.50%, 2/25/34 | | | $28,828 | | | | $30,365 | |
| Wells Fargo Mortgage-Backed Securities Trust, Series 2005-17, Class 1A1, 5.50%, 1/25/36 | | | 127,282 | | | | 126,117 | |
| Wells Fargo Mortgage-Backed Securities Trust, Series 2005-2, Class 1A1 SEQ, 5.50%, 4/25/35 | | | 18,974 | | | | 18,973 | |
| Wells Fargo Mortgage-Backed Securities Trust, Series 2005-5, Class 1A1, 5.00%, 5/25/20 | | | 41,770 | | | | 42,392 | |
| Wells Fargo Mortgage-Backed Securities Trust, Series 2005-6, Class A1 SEQ, 5.25%, 8/25/35 | | | 36,645 | | | | 36,743 | |
| Wells Fargo Mortgage-Backed Securities Trust, Series 2005-AR14, Class A1, VRN, 5.35%, 7/1/12 | | | 46,509 | | | | 46,167 | |
| Wells Fargo Mortgage-Backed Securities Trust, Series 2005-AR16, Class 1A1, VRN, 2.75%, 7/1/12 | | | 117,390 | | | | 118,610 | |
| Wells Fargo Mortgage-Backed Securities Trust, Series 2006-10, Class A4 SEQ, 6.00%, 8/25/36 | | | 90,350 | | | | 89,666 | |
| Wells Fargo Mortgage-Backed Securities Trust, Series 2006-13, Class A5, 6.00%, 10/25/36 | | | 118,128 | | | | 115,960 | |
| Wells Fargo Mortgage-Backed Securities Trust, Series 2006-3, Class A9 SEQ, 5.50%, 3/25/36 | | | 71,153 | | | | 71,549 | |
| Wells Fargo Mortgage-Backed Securities Trust, Series 2006-9, Class 1A15 SEQ, 6.00%, 8/25/36 | | | 38,913 | | | | 39,310 | |
| Wells Fargo Mortgage-Backed Securities Trust, Series 2006-9, Class 1A9 SEQ, 6.00%, 8/25/36 | | | 45,891 | | | | 44,842 | |
| Wells Fargo Mortgage-Backed Securities Trust, Series 2006-AR19, Class A1, VRN, 5.41%, 7/1/12 | | | 35,941 | | | | 33,821 | |
| Wells Fargo Mortgage-Backed Securities Trust, Series 2007-13, Class A1, 6.00%, 9/25/37 | | | 106,431 | | | | 106,359 | |
| | | | | | | | | |
| | | Principal Amount/ Shares | | | | Value | |
| Wells Fargo Mortgage-Backed Securities Trust, Series 2007-3, Class 3A1, 5.50%, 4/25/22 | | | $37,081 | | | | $38,515 | |
| Wells Fargo Mortgage-Backed Securities Trust, Series 2007-AR10, Class 1A1, VRN, 6.07%, 7/1/12 | | | 14,752 | | | | 14,901 | |
| | | | | | | | 1,432,941 | |
| U.S. GOVERNMENT AGENCY COLLATERALIZED MORTGAGE OBLIGATIONS — 0.1% | |
| FHLMC, Series 2824, Class LB SEQ, 4.50%, 7/15/24 | | | 136,693 | | | | 148,732 | |
TOTAL COLLATERALIZED MORTGAGE OBLIGATIONS (Cost $1,558,789) | | | | 1,581,673 | |
| | | Shares | | | Value | |
| Temporary Cash Investments — 4.2% | |
| SSgA U.S. Government Money Market Fund (Cost $4,723,508) | | | 4,723,508 | | | | $4,723,508 | |
TOTAL INVESTMENT SECURITIES — 100.3% (Cost $115,237,148) | | | | 113,547,068 | |
| OTHER ASSETS AND LIABILITIES — (0.3)% | | | | (391,775 | ) |
| TOTAL NET ASSETS — 100.0% | | | | $113,155,293 | |
| | |
| Forward Foreign Currency Exchange Contracts | |
| Contracts to Buy | Counterparty | Settlement Date | | Value | | | Unrealized Gain (Loss) | |
| | 1,223,200 | | CHF for EUR | UBS AG | 7/27/12 | | | $1,289,437 | | | | $(17,820 | ) |
| | 320,538 | | EUR for CHF | Deutsche Bank | 7/27/12 | | | 405,718 | | | | 2,593 | |
| | 538,139 | | EUR for SEK | Deutsche Bank | 7/27/12 | | | 681,143 | | | | 11,322 | |
| | 536,677 | | EUR for SEK | UBS AG | 7/27/12 | | | 679,294 | | | | 4,905 | |
| | 4,842,300 | | SEK for EUR | UBS AG | 7/27/12 | | | 699,392 | | | | 27,736 | |
| | 34,900 | | AUD for USD | Barclays Bank plc | 7/27/12 | | | 35,639 | | | | 1,845 | |
| | 17,400 | | AUD for USD | Barclays Bank plc | 7/27/12 | | | 17,768 | | | | (235 | ) |
| | 1,000 | | AUD for USD | HSBC Holdings plc | 7/27/12 | | | 1,021 | | | | (4 | ) |
| | 455,500 | | AUD for USD | Westpac Group | 7/27/12 | | | 465,145 | | | | (2,243 | ) |
| | 1,054,500 | | BRL for USD | Barclays Bank plc | 7/27/12 | | | 522,321 | | | | (38,375 | ) |
| | 46,100 | | CAD for USD | Barclays Bank plc | 7/27/12 | | | 45,257 | | | | (1,631 | ) |
| | 200,600 | | CAD for USD | Barclays Bank plc | 7/27/12 | | | 196,930 | | | | 1,047 | |
| | 78,600 | | CAD for USD | Barclays Bank plc | 7/27/12 | | | 77,162 | | | | 1,691 | |
| | 4,807,200 | | CAD for USD | Barclays Bank plc | 7/27/12 | | | 4,719,260 | | | | (140,375 | ) |
| | 114,500 | | CAD for USD | HSBC Holdings plc | 7/27/12 | | | 112,405 | | | | (2,970 | ) |
| | 45,200 | | CHF for USD | Barclays Bank plc | 7/27/12 | | | 47,648 | | | | 562 | |
| | 2,600 | | CHF for USD | HSBC Holdings plc | 7/27/12 | | | 2,741 | | | | (126 | ) |
| | 115,821,000 | | CLP for USD | Barclays Bank plc | 7/27/12 | | | 230,567 | | | | (5,441 | ) |
| | 819,000 | | CNY for USD | HSBC Holdings plc | 7/27/12 | | | 129,210 | | | | 9 | |
| | 33,823,000 | | CNY for USD | HSBC Holdings plc | 7/27/12 | | | 5,336,088 | | | | (22,860 | ) |
| | 204,847,992 | | COP for USD | Barclays Bank plc | 7/27/12 | | | 114,362 | | | | (270 | ) |
| | 95,700 | | EUR for USD | Barclays Bank plc | 7/27/12 | | | 121,131 | | | | 1,513 | |
| | 2,694,278 | | EUR for USD | Barclays Bank plc | 7/27/12 | | | 3,410,253 | | | | (127,738 | ) |
| | 31,500 | | EUR for USD | Barclays Bank plc | 7/27/12 | | | 39,871 | | | | (1,889 | ) |
| | 29,800 | | EUR for USD | HSBC Holdings plc | 7/27/12 | | | 37,719 | | | | (1,741 | ) |
| | 73,900 | | EUR for USD | HSBC Holdings plc | 7/27/12 | | | 93,538 | | | | (923 | ) |
| | 64,000 | | EUR for USD | HSBC Holdings plc | 7/27/12 | | | 81,007 | | | | (3,090 | ) |
| | 5,600 | | EUR for USD | Westpac Group | 7/27/12 | | | 7,088 | | | | 22 | |
| | 17,000 | | GBP for USD | Barclays Bank plc | 7/27/12 | | | 26,623 | | | | 457 | |
| | 400 | | GBP for USD | Barclays Bank plc | 7/27/12 | | | 626 | | | | 4 | |
| | | | | | | | | |
| Contracts to Buy | Counterparty | Settlement Date | | Value | | | Unrealized Gain (Loss) | |
| | 7,800 | | GBP for USD | Barclays Bank plc | 7/27/12 | | | $12,215 | | | | $(448 | ) |
| | 274,300 | | GBP for USD | Deutsche Bank | 7/27/12 | | | 429,570 | | | | (7,206 | ) |
| | 8,100 | | GBP for USD | HSBC Holdings plc | 7/27/12 | | | 12,685 | | | | (214 | ) |
| | 2,731,000 | | HKD for USD | Westpac Group | 7/27/12 | | | 352,051 | | | | (39 | ) |
| | 3,413,969,974 | | IDR for USD | UBS AG | 7/27/12 | | | 362,880 | | | | (6,670 | ) |
| | 1,105,600 | | ILS for USD | UBS AG | 7/27/12 | | | 282,453 | | | | (10,437 | ) |
| | 32,459,000 | | INR for USD | UBS AG | 7/27/12 | | | 582,388 | | | | (35,887 | ) |
| | 302,000 | | JPY for USD | Barclays Bank plc | 7/27/12 | | | 3,779 | | | | 23 | |
| | 6,873,000 | | JPY for USD | Barclays Bank plc | 7/27/12 | | | 86,012 | | | | (538 | ) |
| | 29,613,342 | | JPY for USD | Barclays Bank plc | 7/27/12 | | | 370,595 | | | | 3,347 | |
| | 3,281,000 | | JPY for USD | HSBC Holdings plc | 7/27/12 | | | 41,060 | | | | 471 | |
| | 57,580,006 | | KRW for USD | HSBC Holdings plc | 7/27/12 | | | 50,217 | | | | 1,098 | |
| | 1,199,460,000 | | KRW for USD | HSBC Holdings plc | 7/27/12 | | | 1,046,077 | | | | (3,458 | ) |
| | 2,000,000 | | MXN for USD | Barclays Bank plc | 7/27/12 | | | 149,577 | | | | 5,637 | |
| | 1,500,000 | | MXN for USD | Barclays Bank plc | 7/27/12 | | | 112,183 | | | | 5,236 | |
| | 1,700,000 | | MXN for USD | Barclays Bank plc | 7/27/12 | | | 127,140 | | | | 7,917 | |
| | 1,000,000 | | MXN for USD | Barclays Bank plc | 7/27/12 | | | 74,788 | | | | 3,164 | |
| | 38,262,000 | | MXN for USD | Barclays Bank plc | 7/27/12 | | | 2,861,554 | | | | (39,434 | ) |
| | 1,819,900 | | MYR for USD | Westpac Group | 7/27/12 | | | 575,421 | | | | (16,147 | ) |
| | 329,300 | | NOK for USD | Barclays Bank plc | 7/27/12 | | | 55,310 | | | | 1,300 | |
| | 146,900 | | NOK for USD | Barclays Bank plc | 7/27/12 | | | 24,674 | | | | (877 | ) |
| | 4,279,300 | | NOK for USD | Deutsche Bank | 7/27/12 | | | 718,756 | | | | (24,436 | ) |
| | 18,200 | | NZD for USD | Barclays Bank plc | 7/27/12 | | | 14,545 | | | | 800 | |
| | 8,100 | | NZD for USD | Barclays Bank plc | 7/27/12 | | | 6,473 | | | | (121 | ) |
| | 1,700 | | NZD for USD | HSBC Holdings plc | 7/27/12 | | | 1,359 | | | | (20 | ) |
| | 214,300 | | NZD for USD | Westpac Group | 7/27/12 | | | 171,266 | | | | (3,848 | ) |
| | 10,434,000 | | PHP for USD | Westpac Group | 7/27/12 | | | 248,409 | | | | 4,567 | |
| | 29,999 | | PLN for USD | Deutsche Bank | 7/27/12 | | | 8,978 | | | | (376 | ) |
| | 9,463,000 | | RUB for USD | UBS AG | 7/27/12 | | | 291,205 | | | | (24,319 | ) |
| | 620,200 | | SEK for USD | Barclays Bank plc | 7/27/12 | | | 89,578 | | | | 3,348 | |
| | 7,236,500 | | SEK for USD | Barclays Bank plc | 7/27/12 | | | 1,045,195 | | | | (21,962 | ) |
| | 300,500 | | SEK for USD | Barclays Bank plc | 7/27/12 | | | 43,402 | | | | (1,150 | ) |
| | 27,300 | | SEK for USD | HSBC Holdings plc | 7/27/12 | | | 3,943 | | | | (104 | ) |
| | 588,100 | | SGD for USD | HSBC Holdings plc | 7/27/12 | | | 464,256 | | | | (6,224 | ) |
| | 14,556,000 | | THB for USD | Westpac Group | 7/27/12 | | | 459,854 | | | | (10,833 | ) |
| | 67,000 | | TRY for USD | Deutsche Bank | 7/27/12 | | | 36,840 | | | | 199 | |
| | 21,571,000 | | TWD for USD | HSBC Holdings plc | 7/27/12 | | | 723,393 | | | | (10,065 | ) |
| | | | | | | | | $31,566,445 | | | | $(501,731 | ) |
(Value on Settlement Date $32,068,176)
| | | | | | | | | |
| Contracts to Sell | Counterparty | Settlement Date | | Value | | | Unrealized Gain (Loss) | |
| | 1,019,045 | | EUR for CHF | UBS AG | 7/27/12 | | | $1,289,845 | | | | $17,412 | |
| | 384,800 | | CHF for EUR | Deutsche Bank | 7/27/12 | | | 405,637 | | | | (2,512 | ) |
| | 4,718,400 | | SEK for EUR | Deutsche Bank | 7/27/12 | | | 681,496 | | | | (11,675 | ) |
| | 4,803,800 | | SEK for EUR | UBS AG | 7/27/12 | | | 693,831 | | | | (19,442 | ) |
| | 536,127 | | EUR for SEK | UBS AG | 7/27/12 | | | 678,597 | | | | (6,942 | ) |
| | 6,300 | | AUD for USD | Barclays Bank plc | 7/27/12 | | | 6,433 | | | | (103 | ) |
| | 26,200 | | CAD for USD | Barclays Bank plc | 7/27/12 | | | 25,721 | | | | (188 | ) |
| | 16,700 | | CAD for USD | HSBC Holdings plc | 7/27/12 | | | 16,394 | | | | 522 | |
| | 3,700 | | CHF for USD | Barclays Bank plc | 7/27/12 | | | 3,900 | | | | 187 | |
| | 800 | | CHF for USD | Barclays Bank plc | 7/27/12 | | | 843 | | | | (12 | ) |
| | 257,833 | | CHF for USD | UBS AG | 7/27/12 | | | 271,795 | | | | 9,798 | |
| | 1,004,009 | | CZK for USD | Deutsche Bank | 7/27/12 | | | 49,782 | | | | 3,498 | |
| | 19,900 | | EUR for USD | Barclays Bank plc | 7/27/12 | | | 25,188 | | | | (363 | ) |
| | 8,700 | | GBP for USD | HSBC Holdings plc | 7/27/12 | | | 13,625 | | | | 482 | |
| | 6,833,467 | | HUF for USD | Deutsche Bank | 7/27/12 | | | 30,162 | | | | (268 | ) |
| | 7,145,000 | | JPY for USD | Barclays Bank plc | 7/27/12 | | | 89,416 | | | | 1,986 | |
| | 1,632,000 | | JPY for USD | Barclays Bank plc | 7/27/12 | | | 20,424 | | | | 48 | |
| | 3,670,000 | | JPY for USD | HSBC Holdings plc | 7/27/12 | | | 45,928 | | | | (129 | ) |
| | 33,824,000 | | JPY for USD | Westpac Group | 7/27/12 | | | 423,289 | | | | 6,495 | |
| | 23,700 | | NOK for USD | Barclays Bank plc | 7/27/12 | | | 3,981 | | | | (63 | ) |
| | 5,100 | | NOK for USD | HSBC Holdings plc | 7/27/12 | | | 857 | | | | 33 | |
| | 9,200 | | NZD for USD | Barclays Bank plc | 7/27/12 | | | 7,352 | | | | (84 | ) |
| | 194,000 | | PEN for USD | Barclays Bank plc | 7/27/12 | | | 72,639 | | | | 142 | |
| | 144,800 | | SEK for USD | Barclays Bank plc | 7/27/12 | | | 20,914 | | | | (390 | ) |
| | 176,000 | | ZAR for USD | Deutsche Bank | 7/27/12 | | | 21,452 | | | | 799 | |
| | | | | | | | | $4,899,501 | | | | $(769 | ) |
(Value on Settlement Date $4,898,732)
| Futures Contracts | |
| Contracts Purchased | Expiration Date | | Underlying Face Amount at Value | | | Unrealized Gain (Loss) | |
| | 10 | | U.S. Treasury 5-Year Notes | September 2012 | | | $1,239,688 | | | | $(491 | ) |
| Total Return Swap Agreements | |
| Counterparty | | Notional Amount | | Floating Rate Referenced Index | Pay/Receive Total Return of Referenced Index | | Fixed Rate | | Termination Date | | Value | |
| Bank of America N.A. | | | $925,000 | | U.S. CPI Urban Consumers NSA Index | Receive | | | 2.28 | % | 1/21/16 | | | $(5,715 | ) |
| Bank of America N.A. | | | 1,000,000 | | U.S. CPI Urban Consumers NSA Index | Receive | | | 1.97 | % | 12/21/16 | | | 473 | |
| Barclays Bank plc | | | 700,000 | | U.S. CPI Urban Consumers NSA Index | Receive | | | 1.84 | % | 8/4/13 | | | (6,349 | ) |
| Barclays Bank plc | | | 800,000 | | U.S. CPI Urban Consumers NSA Index | Receive | | | 1.29 | % | 8/31/13 | | | 3,359 | |
| Barclays Bank plc | | | 500,000 | | U.S. CPI Urban Consumers NSA Index | Receive | | | 1.58 | % | 9/6/13 | | | (846 | ) |
| Barclays Bank plc | | | 900,000 | | U.S. CPI Urban Consumers NSA Index | Receive | | | 2.30 | % | 1/11/16 | | | (6,343 | ) |
| Barclays Bank plc | | | 2,100,000 | | U.S. CPI Urban Consumers NSA Index | Receive | | | 2.52 | % | 5/13/16 | | | (55,648 | ) |
| | | | | | | | | | | | | | | $(71,069 | ) |
Notes to Schedule of Investments
ADR = American Depositary Receipt
AUD = Australian Dollar
BRL = Brazilian Real
CAD = Canadian Dollar
CHF = Swiss Franc
CLP = Chilean Peso
CNY = Chinese Yuan
COP = Colombian Peso
CPI = Consumer Price Index
CZK = Czech Koruna
DB = Deutsche Bank
ETF = Exchange-Traded Fund
EUR = Euro
FHLMC = Federal Home Loan Mortgage Corporation
GBP = British Pound
GSCI = Goldman Sachs Commodities Index
HKD = Hong Kong Dollar
HUF = Hungarian Forint
IDR = Indonesian Rupiah
ILS = Israeli Shekel
INR = Indian Rupee
JPY = Japanese Yen
KRW = Korea Won
LB-UBS = Lehman Brothers, Inc. — UBS AG
MASTR = Mortgage Asset Securitization Transactions, Inc.
MXN = Mexican Peso
MYR = Malaysian Ringgit
NOK = Norwegian Krone
NSA = Not Seasonally Adjusted
NZD = New Zealand Dollar
PEN = Peruvian Nuevo Sol
PHHMC = PHH Mortgage Corporation
PHP = Philippine Peso
PLN = Polish Zloty
REIT = Real Estate Investment Trust
RUB = Russian Rouble
SEK = Swedish Krona
SEQ = Sequential Payer
SGD = Singapore Dollar
SPDR = Standard & Poor’s Depositary Receipts
THB = Thai Baht
TRY = Turkish Lira
TWD = Taiwanese Dollar
USD = United States Dollar
VRN = Variable Rate Note. Interest reset date is indicated. Rate shown is effective at the period end.
ZAR = South African Rand
† Category is less than 0.05% of total net assets.
| (1) | Security, or a portion thereof, has been pledged at the custodian bank or with a broker for margin requirements on futures contracts. At the period end, the aggregate value of securities pledged was $20,786 |
| (3) | The rate indicated is the yield to maturity at purchase for non-interest bearing securities. For interest bearing securities, the stated coupon rate is shown. |
| (4) | Security was purchased under Rule 144A or Section 4(2) of the Securities Act of 1933 or is a private placement and, unless registered under the Act or exempted from registration, may only be sold to qualified institutional investors. The aggregate value of these securities at the period end was $10,780,082, which represented 9.5% of total net assets. |
| (5) | Final maturity date indicated, unless otherwise noted. |
See Notes to Financial Statements.
Statement of Assets and Liabilities |
| JUNE 30, 2012 | |
| Assets | |
| Investment securities, at value (cost of $115,237,148) | | | $113,547,068 | |
| Foreign currency holdings, at value (cost of $8,764) | | | 8,770 | |
| Receivable for investments sold | | | 105,661 | |
| Receivable for capital shares sold | | | 286,572 | |
| Unrealized gain on forward foreign currency exchange contracts | | | 132,215 | |
| Swap agreements, at value | | | 3,832 | |
| Dividends and interest receivable | | | 342,007 | |
| | | | 114,426,125 | |
| | | | | |
| Liabilities | | | | |
| Payable for investments purchased | | | 196,834 | |
| Payable for capital shares redeemed | | | 250,826 | |
| Payable for variation margin on futures contracts | | | 2,109 | |
| Unrealized loss on forward foreign currency exchange contracts | | | 634,715 | |
| Swap agreements, at value | | | 74,901 | |
| Accrued management fees | | | 97,794 | |
| Distribution and service fees payable | | | 13,521 | |
| Accrued foreign taxes | | | 132 | |
| | | | 1,270,832 | |
| | | | | |
| Net Assets | | | $113,155,293 | |
| | | | | |
| Net Assets Consist of: | | | | |
| Capital (par value and paid-in surplus) | | | $117,350,264 | |
| Undistributed net investment income | | | 294,710 | |
| Accumulated net realized loss | | | (2,225,563 | ) |
| Net unrealized depreciation | | | (2,264,118 | ) |
| | | | $113,155,293 | |
| | | | | | | | | | |
| | | Net assets | | Shares outstanding | | Net asset value per share |
| Investor Class, $0.01 Par Value | | | $65,968,178 | | | | 6,605,013 | | | | $9.99 | |
| Institutional Class, $0.01 Par Value | | | $7,078,141 | | | | 708,306 | | | | $9.99 | |
| A Class, $0.01 Par Value | | | $31,305,373 | | | | 3,141,116 | | | | $9.97 | * |
| C Class, $0.01 Par Value | | | $8,667,086 | | | | 875,027 | | | | $9.90 | |
| R Class, $0.01 Par Value | | | $136,515 | | | | 13,727 | | | | $9.94 | |
*Maximum offering price $10.58 (net asset value divided by 0.9425)
See Notes to Financial Statements.
| YEAR ENDED JUNE 30, 2012 | |
| Investment Income (Loss) | |
| Income: | | | |
| Dividends (net of foreign taxes withheld of $12,650) | | | $370,311 | |
| Interest | | | 880,077 | |
| | | | 1,250,388 | |
| | | | | |
| Expenses: | | | | |
| Management fees | | | 1,117,460 | |
| Distribution and service fees: | | | | |
| A Class | | | 83,592 | |
| C Class | | | 76,395 | |
| R Class | | | 661 | |
| Directors’ fees and expenses | | | 7,765 | |
| Other expenses | | | 703 | |
| | | | 1,286,576 | |
| Fees waived | | | (11,929 | ) |
| | | | 1,274,647 | |
| | | | | |
| Net investment income (loss) | | | (24,259 | ) |
| | | | | |
| Realized and Unrealized Gain (Loss) | | | | |
| Net realized gain (loss) on: | | | | |
| Investment transactions (net of foreign tax expenses paid (refunded) of $916) | | | (2,015,561 | ) |
| Futures contract transactions | | | 84,077 | |
| Swap agreement transactions | | | 6,500 | |
| Foreign currency transactions (net of foreign tax expenses paid (refunded) of $2,719) | | | (856,248 | ) |
| | | | (2,781,232 | ) |
| | | | | |
| Change in net unrealized appreciation (depreciation) on: | | | | |
| Investments (includes (increase) decrease in accrued foreign taxes of $(132)) | | | (2,844,286 | ) |
| Futures contracts | | | 23,132 | |
| Swap agreements | | | (94,506 | ) |
| Translation of assets and liabilities in foreign currencies | | | (325,961 | ) |
| | | | (3,241,621 | ) |
| | | | | |
| Net realized and unrealized gain (loss) | | | (6,022,853 | ) |
| | | | | |
| Net Increase (Decrease) in Net Assets Resulting from Operations | | | $(6,047,112 | ) |
See Notes to Financial Statements.
Statement of Changes in Net Assets |
| YEARS ENDED JUNE 30, 2012 AND JUNE 30, 2011 | |
| Increase (Decrease) in Net Assets | June 30, 2012 | | | June 30, 2011 | |
| Operations | |
| Net investment income (loss) | | $(24,259 | ) | | | $502,933 | |
| Net realized gain (loss) | | (2,781,232 | ) | | | 1,141,612 | |
| Change in net unrealized appreciation (depreciation) | | (3,241,621 | ) | | | 1,174,865 | |
| Net increase (decrease) in net assets resulting from operations | | (6,047,112 | ) | | | 2,819,410 | |
| | | | | | | | |
| Distributions to Shareholders | | | | | | | |
| From net investment income: | | | | | | | |
| Investor Class | | (674,472 | ) | | | (262,159 | ) |
| Institutional Class | | (75,987 | ) | | | (27,223 | ) |
| A Class | | (369,850 | ) | | | (40,461 | ) |
| C Class | | (34,670 | ) | | | (2,042 | ) |
| R Class | | (1,046 | ) | | | (682 | ) |
| From net realized gains: | | | | | | | |
| Investor Class | | (145,643 | ) | | | (1,772 | ) |
| Institutional Class | | (13,696 | ) | | | (176 | ) |
| A Class | | (85,639 | ) | | | (301 | ) |
| C Class | | (18,728 | ) | | | (65 | ) |
| R Class | | (338 | ) | | | (11 | ) |
| Decrease in net assets from distributions | | (1,420,069 | ) | | | (334,892 | ) |
| | | | | | | | |
| Capital Share Transactions | | | | | | | |
| Net increase (decrease) in net assets from capital share transactions | | 24,791,565 | | | | 85,289,192 | |
| | | | | | | | |
| Net increase (decrease) in net assets | | 17,324,384 | | | | 87,773,710 | |
| | | | | | | | |
| Net Assets | | | | | | | |
| Beginning of period | | 95,830,909 | | | | 8,057,199 | |
| End of period | | $113,155,293 | | | | $95,830,909 | |
| | | | | | | | |
| Undistributed net investment income | | $294,710 | | | | $1,149,729 | |
See Notes to Financial Statements.
Notes to Financial Statements |
JUNE 30, 2012
1. Organization
American Century Quantitative Equity Funds, Inc. (the corporation) is registered under the Investment Company Act of 1940, as amended (the 1940 Act), as an open-end management investment company and is organized as a Maryland corporation. Strategic Inflation Opportunities Fund (the fund) is one fund in a series issued by the corporation. The fund is nondiversified as defined under the 1940 Act. The fund’s investment objective is to seek total real return (total return reduced by the expected impact of inflation). The fund pursues its objective by diversifying investments among U.S. Treasury inflation-indexed and other U.S. fixed-income securities, commodity-related investments, and non-U.S. dollar investments.
The fund offers the Investor Class, the Institutional Class, the A Class, the C Class and the R Class. The A Class may incur an initial sales charge. The A Class and C Class may be subject to a contingent deferred sales charge. The share classes differ principally in their respective sales charges and distribution and shareholder servicing expenses and arrangements. The Institutional Class is made available to institutional shareholders or through financial intermediaries whose clients do not require the same level of shareholder and administrative services as shareholders of other classes. As a result, the Institutional Class is charged a lower unified management fee.
2. Significant Accounting Policies
The following is a summary of significant accounting policies consistently followed by the fund in preparation of its financial statements. The financial statements are prepared in conformity with accounting principles generally accepted in the United States of America, which may require management to make certain estimates and assumptions at the date of the financial statements. Actual results could differ from these estimates.
Investment Valuations — The fund determines the fair value of its investments and computes its net asset value per share as of the close of regular trading (usually 4 p.m. Eastern time) on the New York Stock Exchange (NYSE) on each day the NYSE is open.
Debt securities maturing in greater than 60 days at the time of purchase are valued at the evaluated mean as provided by independent pricing services or at the mean of the most recent bid and asked prices as provided by investment dealers. Debt securities maturing within 60 days at the time of purchase may be valued at cost, plus or minus any amortized discount or premium or at the evaluated mean as provided by an independent pricing service. Evaluated mean prices are commonly derived through utilization of market models, which may consider, among other factors, trade data, quotations from dealers and active market makers, relevant yield curve and spread data, related sector levels, creditworthiness, and other relevant market information on the same or comparable securities.
Equity securities that are listed or traded on a domestic securities exchange are valued at the last reported sales price or at the official closing price as provided by the exchange. Equity securities traded on foreign securities exchanges are typically valued at the closing price on the exchange where primarily traded or as of the close of the NYSE, if that is earlier. If no last sales price is reported, or if local convention or regulation so provides, the mean of the latest bid and asked prices is used. Depending on local convention or regulation, securities traded over-the-counter are valued at the mean of the latest bid and asked prices, the last sales price, or the official closing price. In its determination of fair value, the fund may review several factors including: market information specific to a security; news developments in U.S. and foreign markets; the performance of particular U.S. and foreign securities, indices, comparable securities, American Depositary Receipts, Exchange-Traded Funds, and other relevant market indicators.
Investments in open-end management investment companies are valued at the reported net asset value per share. Exchange-traded futures contracts are valued at the settlement price as provided by the appropriate clearing corporation. Swap agreements are valued at an evaluated price as provided by independent pricing services or investment dealers. Forward foreign currency exchange contracts are valued at the mean of the latest bid and asked prices of the forward currency rates as provided by an independent pricing service.
The value of investments initially expressed in foreign currencies is translated into U.S. dollars at prevailing exchange rates.
If the fund determines that the market price for a portfolio security is not readily available or the valuation methods mentioned above do not reflect a security’s fair value, such security is valued as determined in good faith by the Board of Directors or its designee, in accordance with procedures adopted by the Board of Directors. Circumstances that may cause the fund to use these procedures to value a security include, but are not limited to: a security has been declared in default; trading in a security has been halted during the trading day; there is a foreign market holiday and no trading occurred; or an event occurred between the close of a foreign exchange and the NYSE that may affect the value of a security.
Security Transactions — Security transactions are accounted for as of the trade date. Net realized gains and losses are determined on the identified cost basis, which is also used for federal income tax purposes. Certain countries impose taxes on realized gains on the sale of securities registered in their country. The fund records the foreign tax expense, if any, on an accrual basis. The foreign tax expense on realized gains and unrealized appreciation reduces the net realized gain (loss) on investment transactions and net unrealized appreciation (depreciation) on investments, respectively.
Investment Income — Dividend income less foreign taxes withheld, if any, is recorded as of the ex-dividend date. Distributions received on securities that represent a return of capital or capital gain are recorded as a reduction of cost of investments and/or as a realized gain. The fund estimates the components of distributions received that may be considered nontaxable distributions or capital gain distributions for income tax purposes. Interest income is recorded on the accrual basis and includes paydown gain (loss) and accretion of discounts and amortization of premiums. Inflation adjustments related to inflation-linked debt securities are reflected as interest income.
Foreign Currency Translations — All assets and liabilities initially expressed in foreign currencies are translated into U.S. dollars at prevailing exchange rates at period end. The fund may enter into spot foreign currency exchange contracts to facilitate transactions denominated in a foreign currency. Purchases and sales of investment securities, dividend and interest income, spot foreign currency exchange contracts, and expenses are translated at the rates of exchange prevailing on the respective dates of such transactions. Net realized and unrealized foreign currency exchange gains or losses related to investment securities are a component of net realized gain (loss) on investment transactions and change in net unrealized appreciation (depreciation) on investments, respectively. Certain countries impose taxes on the contract amount of purchases and sales of foreign currency contracts in their currency. The fund records the foreign tax expense, if any, as a reduction to the net realized gain (loss) on foreign currency transactions.
Commodity Exchange-Traded Funds — The fund may invest in exchange-traded funds of underlying commodities (Commodity ETFs). Commodity ETFs are a type of index fund bought and sold on a securities exchange. A Commodity ETF trades like common stock and represents a portfolio designed to track the performance of a particular index of a physical commodity or group of physical commodities. The fund may purchase a Commodity ETF to gain exposure to the underlying physical commodities. The risks of owning a Commodity ETF generally reflect the risks of owning the underlying commodities they are designed to track, although a lack of liquidity on a Commodity ETF could result in it being more volatile. Commodities markets have historically been extremely volatile. Additionally, Commodity ETFs have fees and expenses that reduce their value.
Income Tax Status — It is the fund’s policy to distribute substantially all net investment income and net realized gains to shareholders and to otherwise qualify as a regulated investment company under provisions of the Internal Revenue Code. All tax years for the fund remain subject to examination by tax authorities. Additionally, non-U.S. tax returns filed by the fund due to investments in certain foreign securities remain subject to examination by the relevant taxing authority for seven years from the date of filing. At this time, management believes there are no uncertain tax positions which, based on their technical merit, would not be sustained upon examination and for which it is reasonably possible that the total amounts of unrecognized tax benefits will significantly change in the next twelve months. Accordingly, no provision has been made for federal or state income taxes.
Segregated Assets — In accordance with the 1940 Act, the fund segregates assets on its books and records to cover certain types of investments, including, but not limited to, futures contracts, forward commitments, when-issued securities, swap agreements and certain forward foreign currency exchange contracts. American Century Investment Management, Inc. (ACIM) (the investment advisor) monitors, on a daily basis, the securities segregated to ensure the fund designates a sufficient amount of liquid assets, marked-to-market daily. The fund may also receive assets or be required to pledge assets at the custodian bank or with a broker for margin requirements on futures contracts and swap agreements.
Multiple Class — All shares of the fund represent an equal pro rata interest in the net assets of the class to which such shares belong, and have identical voting, dividend, liquidation and other rights and the same terms and conditions, except for class specific expenses and exclusive rights to vote on matters affecting only individual classes. Income, non-class specific expenses, and realized and unrealized capital gains and losses of the fund are allocated to each class of shares based on their relative net assets.
Distributions to Shareholders — Distributions from net investment income, if any, are generally declared and paid quarterly. Distributions from net realized gains, if any, are generally declared and paid annually.
Indemnifications — Under the corporation’s organizational documents, its officers and directors are indemnified against certain liabilities arising out of the performance of their duties to the fund. In addition, in the normal course of business, the fund enters into contracts that provide general indemnifications. The maximum exposure under these arrangements is unknown as this would involve future claims that may be made against a fund. The risk of material loss from such claims is considered by management to be remote.
3. Fees and Transactions with Related Parties
Management Fees — The corporation has entered into a management agreement with ACIM, under which ACIM provides the fund with investment advisory and management services in exchange for a single, unified management fee (the fee) per class. The agreement provides that all expenses of managing and operating the fund, except distribution and service fees, brokerage expenses, taxes, interest, fees and expenses of the independent directors (including legal counsel fees), and extraordinary expenses, will be paid by ACIM. The fee is computed and accrued daily based on each class’s daily net assets and paid monthly in arrears. The fee consists of (1) an Investment Category Fee based on the daily net assets of the fund and certain other accounts managed by the investment advisor that are in the same broad investment category as the fund and (2) a Complex Fee based on the assets of all the funds in the American Century Investments family of funds. The rates for the Investment Category Fee range from 0.7754% to 0.8929%. The rates for the Complex Fee range from 0.2500% to 0.3100% for the Investor Class, A Class, C Class and R Class. The Institutional Class is 0.2000% less at each point within the Complex Fee range. From July 1, 2011 through July 31, 2011, the investment advisor voluntarily agreed to waive 0.14% of its management fee. The total amount of the waiver for each class for the year ended June 30, 2012 was $6,607, $649, $3,888, $770 and $15 for the Investor Class, Institutional Class, A Class, C Class and R Class, respectively. The effective annual management fee before waiver for each class for the year ended June 30, 2012 was 1.08% for the Investor Class, A Class, C Class and R Class and 0.88% for the Institutional Class. The effective annual management fee after waiver for each class for the year ended June 30, 2012 was 1.07% for the Investor Class, A Class, C Class and R Class and 0.87% for the Institutional Class.
Distribution and Service Fees — The Board of Directors has adopted a separate Master Distribution and Individual Shareholder Services Plan for each of the A Class, C Class and R Class (collectively the plans), pursuant to Rule 12b-1 of the 1940 Act. The plans provide that the A Class will pay American Century Investment Services, Inc. (ACIS) an annual distribution and service fee of 0.25%. The plans provide that the C Class will pay ACIS an annual distribution and service fee of 1.00%, of which 0.25% is paid for individual shareholder services and 0.75% is paid for distribution services. The plans provide that the R Class will pay ACIS an annual distribution and service fee of 0.50%. The fees are computed and accrued daily based on each class’s daily net assets and paid monthly in arrears. The fees are used to pay financial intermediaries for distribution and individual shareholder services. Fees incurred under the plans during the year ended June 30, 2012 are detailed in the Statement of Operations.
Acquired Fund Fees and Expenses — The fund may invest in mutual funds, exchange-traded funds, and business development companies (the acquired funds). The fund will indirectly realize its pro rata share of the fees and expenses of the acquired funds in which it invests. These indirect fees and expenses are not paid out of the fund’s assets but are reflected in the return realized by the fund on its investment in the acquired funds.
Related Parties — Certain officers and directors of the corporation are also officers and/or directors of American Century Companies, Inc., the parent of the corporation’s investment advisor, ACIM, the distributor of the corporation, ACIS, and the corporation’s transfer agent, American Century Services, LLC.
4. Investment Transactions
Purchases of investment securities, excluding short-term investments, for the year ended June 30, 2012 totaled $84,484,613, of which $29,715,298 represented U.S. Treasury and Government Agency obligations.
Sales of investment securities, excluding short-term investments, for the year ended June 30, 2012 totaled $63,181,404, of which $19,476,997 represented U.S. Treasury and Government Agency obligations.
5. Capital Share Transactions
Transactions in shares of the fund were as follows:
| | Year ended June 30, 2012 | | Year ended June 30, 2011 | |
| | Shares | | Amount | | Shares | | Amount | |
| Investor Class/Shares Authorized | | 50,000,000 | | | | | 100,000,000 | | | |
| Sold | | 3,937,761 | | | $40,224,169 | | | 5,132,386 | | | $53,442,644 | |
| Issued in reinvestment of distributions | | 66,304 | | | 673,816 | | | 20,247 | | | 208,747 | |
| Redeemed | | (2,414,685 | ) | | (24,702,735 | ) | | (558,637 | ) | | (5,883,794 | ) |
| | | 1,589,380 | | | 16,195,250 | | | 4,593,996 | | | 47,767,597 | |
| Institutional Class/Shares Authorized | | 50,000,000 | | | | | | 50,000,000 | | | | |
| Sold | | 278,083 | | | 2,856,280 | | | 507,900 | | | 5,293,580 | |
| Issued in reinvestment of distributions | | 8,781 | | | 89,442 | | | 2,657 | | | 27,389 | |
| Redeemed | | (85,296 | ) | | (866,892 | ) | | (18,819 | ) | | (194,968 | ) |
| | | 201,568 | | | 2,078,830 | | | 491,738 | | | 5,126,001 | |
| A Class/Shares Authorized | | 50,000,000 | | | | | | 50,000,000 | | | | |
| Sold | | 1,815,215 | | | 18,816,025 | | | 2,808,724 | | | 29,927,433 | |
| Issued in reinvestment of distributions | | 41,547 | | | 422,365 | | | 3,820 | | | 39,392 | |
| Redeemed | | (1,560,940 | ) | | (15,827,678 | ) | | (318,950 | ) | | (3,325,657 | ) |
| | | 295,822 | | | 3,410,712 | | | 2,493,594 | | | 26,641,168 | |
| C Class/Shares Authorized | | 50,000,000 | | | | | | 50,000,000 | | | | |
| Sold | | 460,021 | | | 4,733,335 | | | 581,308 | | | 6,194,946 | |
| Issued in reinvestment of distributions | | 4,733 | | | 47,890 | | | 191 | | | 1,964 | |
| Redeemed | | (169,032 | ) | | (1,695,509 | ) | | (39,398 | ) | | (408,295 | ) |
| | | 295,722 | | | 3,085,716 | | | 542,101 | | | 5,788,615 | |
| R Class/Shares Authorized | | 50,000,000 | | | | | | 50,000,000 | | | | |
| Sold | | 1,996 | | | 20,087 | | | 1,569 | | | 16,618 | |
| Issued in reinvestment of distributions | | 136 | | | 1,384 | | | 67 | | | 693 | |
| Redeemed | | (41 | ) | | (414 | ) | | (5,000 | ) | | (51,500 | ) |
| | | 2,091 | | | 21,057 | | | (3,364 | ) | | (34,189 | ) |
| Net increase (decrease) | | 2,384,583 | | | $24,791,565 | | | 8,118,065 | | | $85,289,192 | |
6. Fair Value Measurements
The fund’s securities valuation process is based on several considerations and may use multiple inputs to determine the fair value of the positions held by the fund. In conformity with accounting principles generally accepted in the United States of America, the inputs used to determine a valuation are classified into three broad levels as follows:
| • | Level 1 valuation inputs consist of unadjusted quoted prices in an active market for identical securities; |
| • | Level 2 valuation inputs consist of direct or indirect observable market data (including quoted prices for similar securities, evaluations of subsequent market events, interest rates, prepayment speeds, credit risk, etc.); or |
| • | Level 3 valuation inputs consist of unobservable data (including a fund’s own assumptions). |
The level classification is based on the lowest level input that is significant to the fair valuation measurement. The valuation inputs are not necessarily an indication of the risks associated with investing in these securities or other financial instruments.
The following is a summary of the level classifications as of period end. The Schedule of Investments provides additional information on the fund’s portfolio holdings.
| | | | | | | | | |
| | Level 1 | | | Level 2 | | | Level 3 | |
| Investment Securities | | | | | | | | |
| U.S. Treasury Securities | | — | | | | $52,300,278 | | | | — | |
| Domestic Common Stocks | | $12,668,139 | | | | 89,355 | | | | — | |
| Foreign Common Stocks | | 2,890,423 | | | | 3,713,737 | | | | — | |
| Commodity ETFs | | 16,557,136 | | | | — | | | | — | |
| Commercial Paper | | — | | | | 14,058,277 | | | | — | |
| Corporate Bonds | | — | | | | 2,957,406 | | | | — | |
| Commercial Mortgage-Backed Securities | | — | | | | 2,007,136 | | | | — | |
| Collateralized Mortgage Obligations | | — | | | | 1,581,673 | | | | — | |
| Temporary Cash Investments | | 4,723,508 | | | | — | | | | — | |
| Total Value of Investment Securities | | $36,839,206 | | | | $76,707,862 | | | | — | |
| | | | | | | | | | | | |
| Other Financial Instruments | | | | | | | | | | | |
| Futures Contracts | | $(491 | ) | | | — | | | | — | |
| Swap Agreements | | — | | | | $(71,069 | ) | | | — | |
| Forward Foreign Currency Exchange Contracts | | — | | | | (502,500 | ) | | | | |
| Total Unrealized Gain (Loss) on Other Financial Instruments | | $(491 | ) | | | $(573,569 | ) | | | — | |
7. Derivative Instruments
Foreign Currency Risk — The fund is subject to foreign currency exchange rate risk in the normal course of pursuing its investment objectives. The value of foreign investments held by a fund may be significantly affected by changes in foreign currency exchange rates. The dollar value of a foreign security generally decreases when the value of the dollar rises against the foreign currency in which the security is denominated and tends to increase when the value of the dollar declines against such foreign currency. A fund may enter into forward foreign currency exchange contracts to reduce a fund’s exposure to foreign currency exchange rate fluctuations, or to shift exposure to the fluctuations in the value of foreign currencies from one foreign currency to another foreign currency. The net U.S. dollar value of foreign currency underlying all contractual commitments held by a fund and the resulting unrealized appreciation or depreciation are determined daily. Realized gain or loss is recorded upon the termination of the contract. Net realized and unrealized gains or losses occurring during the holding period of forward foreign currency exchange contracts are a component of net realized gain (loss) on foreign currency transactions and change in net unrealized appreciation (depreciation) on translation of assets and liabilities in foreign currencies, respectively. A fund bears the risk of an unfavorable change in the foreign currency exchange rate underlying the forward contract. Additionally, losses, up to the fair value, may arise if the counterparties do not perform under the contract terms. The foreign currency risk derivative instruments held at period end as disclosed on the Schedule of Investments are indicative of the fund’s typical volume during the period.
Interest Rate Risk — The fund is subject to interest rate risk in the normal course of pursuing its investment objectives. The value of bonds generally declines as interest rates rise. A fund may enter into futures contracts based on a bond index or a specific underlying security. A fund may purchase futures contracts to gain exposure to increases in market value or sell futures contracts to protect against a decline in market value. Upon entering into a futures contract, a fund will segregate cash, cash equivalents or other appropriate liquid securities on its records in amounts sufficient to meet requirements. Subsequent payments (variation margin) are made or received daily, in cash, by a fund. The variation margin is equal to the daily change in the contract value and is recorded as unrealized gains and losses. A fund recognizes a realized gain or loss when the futures contract is closed or expires. Net realized and unrealized gains or losses occurring during the holding period of futures contracts are a component of net realized gain (loss) on futures contract transactions and change in net unrealized appreciation (depreciation) on futures contracts, respectively. One of the risks of entering into futures contracts is the possibility that the change in value of the contract may not correlate with the changes in value of the underlying securities. The fund regularly purchased and sold interest rate risk derivative instruments during the first two months of the reporting period and regularly purchased interest rate risk derivative instruments during the last six months of the reporting period. The amounts held at period end as disclosed on the Schedule of Investments are indicative of the fund’s typical volume during the last six months of the period, though the amount is lower than the typical volume during the first two months of the period.
Other Contracts — A fund may enter into total return swap agreements in order to attempt to obtain or preserve a particular return or spread at a lower cost than obtaining a return or spread through purchases and/or sales of instruments in other markets or gain exposure to certain markets in the most economical way possible. A fund will segregate cash, cash equivalents or other appropriate liquid securities on its records in amounts sufficient to meet requirements. Changes in value, including the periodic amounts of interest to be paid or received on swap agreements, are recorded as unrealized appreciation (depreciation) on swap agreements. Realized gain or loss is recorded upon receipt or payment of a periodic settlement or termination of swap agreements. Net realized and unrealized gains or losses occurring during the holding period of swap agreements are a component of net realized gain (loss) on swap agreement transactions and change in net unrealized appreciation (depreciation) on swap agreements, respectively. The risks of entering into swap agreements include the possible lack of liquidity, failure of the counterparty to meet its obligations, and that there may be unfavorable changes in the underlying investments or instruments. The other contracts derivative instruments held at period end as disclosed on the Schedule of Investments are indicative of the fund’s typical volume during the period.
| Value of Derivative Instruments as of June 30, 2012 | |
| | Asset Derivatives | | | Liability Derivatives | |
Type of Risk Exposure | Location on Statement of Assets and Liabilities | | Value | | | Location on Statement of Assets and Liabilities | | Value | |
| Foreign Currency Risk | Unrealized gain on forward foreign currency exchange contracts | | | $132,215 | | | Unrealized loss on forward foreign currency exchange contracts | | | $634,715 | |
| Interest Rate Risk | Receivable for variation margin on futures contracts* | | | — | | | Payable for variation margin on futures contracts* | | | 2,109 | |
| Other Contracts | Swap agreements | | | 3,832 | | | Swap agreements | | | 74,901 | |
| | | | | $136,047 | | | | | | $711,725 | |
*Included in the unrealized gain (loss) on futures contracts as reported in the Schedule of Investments.
Effect of Derivative Instruments on the Statement of Operations for the Year Ended June 30, 2012
| | | | | | |
| | Net Realized Gain (Loss) | | | Change in Net Unrealized Appreciation (Depreciation) | |
Type of Risk Exposure | Location on Statement of Operations | | Value | | | Location on Statement of Operations | | Value | |
| Foreign Currency Risk | Net realized gain (loss) on foreign currency transactions | | | $(853,228 | ) | | Change in net unrealized appreciation (depreciation) on translation of assets and liabilities in foreign currencies | | | $(326,074 | ) |
| Interest Rate Risk | Net realized gain (loss) on futures contract transactions | | | 84,077 | | | Change in net unrealized appreciation (depreciation) on futures contracts | | | 23,132 | |
| Other Contracts | Net realized gain (loss) on swap agreement transactions | | | 6,500 | | | Change in net unrealized appreciation (depreciation) on swap agreements | | | (94,506 | ) |
| | | | | $(762,651 | ) | | | | | $(397,448 | ) |
8. Risk Factors
The fund may concentrate its investments in a narrow segment of the total market. Because of this, the fund may be subject to greater risk and market fluctuations than a portfolio representing a broader range of industries.
There are certain risks involved in investing in foreign securities. These risks include those resulting from future adverse political, social and economic developments, fluctuations in currency exchange rates, the possible imposition of exchange controls, and other foreign laws or restrictions. Investing in emerging markets may accentuate these risks.
There are certain risks involved with investing in forward foreign currency exchange contracts. Changes in the value of foreign currencies against the U.S. dollar could result in gains or losses to the fund. The value of a share of the fund is determined in U.S. dollars. As a result, the fund could recognize a gain or loss based solely upon a change in the exchange rate between the foreign currency and the U.S. dollar. Changes in exchange rates may increase losses and lower gains from the fund’s investments. The overall impact on the fund may be significant depending on the currencies represented in the portfolio and how each one appreciates or depreciates in relation to the U.S. dollar. Currency trends are unpredictable and exchange rates in foreign currencies may fluctuate significantly over short periods of time for a number of reasons, including changes in interest rates, intervention (or the failure to intervene) by U.S. or foreign governments, central banks or supranational entities, or by the imposition of currency controls or other political developments in the United States or abroad.
The fund’s commodity-related investments may be subject to greater volatility than investments in traditional securities. The value of the fund’s commodity-related investments may be affected by changes in overall market movements, interest rate changes, and volatility in commodity-related indices. The value of these investments may also be affected by factors affecting a particular commodity, such as weather, disease, embargoes, tariffs, taxes and economic, political and regulatory developments.
9. Federal Tax Information
The tax character of distributions paid during the years ended June 30, 2012 and June 30, 2011 were as follows:
| | | | | | | |
| | | 2012 | | | 2011 | |
| Distributions Paid From | | | | | | |
| Ordinary income | | $1,340,221 | | | $332,567 | |
| Long-term capital gains | | $79,848 | | | $2,325 | |
The book-basis character of distributions made during the year from net investment income or net realized gains may differ from their ultimate characterization for federal income tax purposes. These differences reflect the differing character of certain income items and net realized gains and losses for financial statement and tax purposes, and may result in reclassification among certain capital accounts on the financial statements.
As of June 30, 2012, the federal tax cost of investments and the components of distributable earnings on a tax-basis were as follows:
| | | | | |
| Federal tax cost of investments | | | $115,779,774 | |
| Gross tax appreciation of investments | | | $1,489,486 | |
| Gross tax depreciation of investments | | | (3,722,192 | ) |
| Net tax appreciation (depreciation) of investments | | | $(2,232,706 | ) |
Net tax appreciation (depreciation) on derivatives and translation of assets and liabilities in foreign currencies | | | $(157,601 | ) |
| Other book-to-tax adjustments | | | (27,537 | ) |
| Net tax appreciation (depreciation) | | | $(2,417,844 | ) |
| Undistributed ordinary income | | | — | |
| Accumulated short-term capital losses | | | $(1,123,129 | ) |
| Post-October capital loss deferral | | | $(653,998 | ) |
The difference between book-basis and tax-basis cost and unrealized appreciation (depreciation) is attributable primarily to the tax deferral of losses on wash sales and the realization for tax purposes of unrealized gains (losses) on certain foreign currency exchange contracts, futures contracts and investments in passive foreign investment companies. Other book-to-tax adjustments are attributable primarily to the tax deferral of losses on straddle positions.
The accumulated capital losses represent net capital loss carryovers that may be used to offset future realized capital gains for federal income tax purposes. The capital loss carryovers may be carried forward for an unlimited period. Future capital loss carryover utilization in any given year may be subject to Internal Revenue Code limitations.
The loss deferral represents certain qualified losses that the fund has elected to treat as having been incurred in the following fiscal year for federal income tax purposes.
| |
| For a Share Outstanding Throughout the Years Ended June 30 (except as noted) |
| Per-Share Data | Ratios and Supplemental Data |
| | | Income From Investment Operations: | Distributions From: | | | Ratio to Average Net Assets of: | | |
| | Net Asset Value, Beginning of Period | Net Investment Income (Loss)(1) | Net Realized and Unrealized Gain (Loss) | Total From Investment Operations | Net Investment Income | Net Realized Gains | Total Distributions | Net Asset Value, End of Period | Total Return(2) | Operating Expenses(3) | Operating Expenses (before expense waiver)(3) | Net Investment Income (Loss) | Net Investment Income (Loss) (before expense waiver) | Portfolio Turnover Rate | Net Assets, End of Period (in thousands) |
| Investor Class |
| 2012 | $10.71 | 0.01 | (0.57) | (0.56) | (0.13) | (0.03) | (0.16) | $9.99 | (5.32)% | 1.08% | 1.09% | 0.12% | 0.11% | 80% | $65,968 |
| 2011 | $9.59 | 0.12 | 1.10 | 1.22 | (0.10) | —(4) | (0.10) | $10.71 | 12.78% | 0.95% | 1.09% | 1.27% | 1.13% | 52% | $53,696 |
2010(5) | $10.00 | 0.01 | (0.42) | (0.41) | — | — | — | $9.59 | (4.10)% | 0.95%(6) | 1.09%(6) | 0.79%(6) | 0.65%(6) | 0% | $4,044 |
| Institutional Class |
| 2012 | $10.71 | 0.04 | (0.58) | (0.54) | (0.15) | (0.03) | (0.18) | $9.99 | (5.13)% | 0.88% | 0.89% | 0.32% | 0.31% | 80% | $7,078 |
| 2011 | $9.59 | 0.15 | 1.09 | 1.24 | (0.12) | —(4) | (0.12) | $10.71 | 12.93% | 0.75% | 0.89% | 1.47% | 1.33% | 52% | $5,428 |
2010(5) | $10.00 | 0.02 | (0.43) | (0.41) | — | — | — | $9.59 | (4.10)% | 0.75%(6) | 0.89%(6) | 0.99%(6) | 0.85%(6) | 0% | $144 |
| A Class |
| 2012 | $10.69 | (0.02) | (0.56) | (0.58) | (0.11) | (0.03) | (0.14) | $9.97 | (5.51)% | 1.33% | 1.34% | (0.13)% | (0.14)% | 80% | $31,305 |
| 2011 | $9.58 | 0.13 | 1.06 | 1.19 | (0.08) | —(4) | (0.08) | $10.69 | 12.50% | 1.20% | 1.34% | 1.02% | 0.88% | 52% | $30,416 |
2010(5) | $10.00 | 0.01 | (0.43) | (0.42) | — | — | — | $9.58 | (4.20)% | 1.20%(6) | 1.34%(6) | 0.54%(6) | 0.40%(6) | 0% | $3,370 |
| C Class |
| 2012 | $10.65 | (0.08) | (0.59) | (0.67) | (0.05) | (0.03) | (0.08) | $9.90 | (6.33)% | 2.08% | 2.09% | (0.88)% | (0.89)% | 80% | $8,667 |
| 2011 | $9.57 | 0.08 | 1.03 | 1.11 | (0.03) | —(4) | (0.03) | $10.65 | 11.64% | 1.95% | 2.09% | 0.27% | 0.13% | 52% | $6,167 |
2010(5) | $10.00 | —(4) | (0.43) | (0.43) | — | — | — | $9.57 | (4.30)% | 1.95%(6) | 2.09%(6) | (0.21)%(6) | (0.35)%(6) | 0% | $356 |
| |
| For a Share Outstanding Throughout the Years Ended June 30 (except as noted) |
| Per-Share Data | Ratios and Supplemental Data |
| | | Income From Investment Operations: | Distributions From: | | | Ratio to Average Net Assets of: | | |
| | Net Asset Value, Beginning of Period | Net Investment Income (Loss)(1) | Net Realized and Unrealized Gain (Loss) | Total From Investment Operations | Net Investment Income | Net Realized Gains | Total Distributions | Net Asset Value, End of Period | Total Return(2) | Operating Expenses(3) | Operating Expenses (before expense waiver)(3) | Net Investment Income (Loss) | Net Investment Income (Loss) (before expense waiver) | Portfolio Turnover Rate | Net Assets, End of Period (in thousands) |
| R Class |
| 2012 | $10.67 | (0.04) | (0.57) | (0.61) | (0.09) | (0.03) | (0.12) | $9.94 | (5.78)% | 1.58% | 1.59% | (0.38)% | (0.39)% | 80% | $137 |
| 2011 | $9.58 | 0.01 | 1.15 | 1.16 | (0.07) | —(4) | (0.07) | $10.67 | 12.10% | 1.45% | 1.59% | 0.77% | 0.63% | 52% | $124 |
2010(5) | $10.00 | 0.01 | (0.43) | (0.42) | — | — | — | $9.58 | (4.20)% | 1.45%(6) | 1.59%(6) | 0.29%(6) | 0.15%(6) | 0% | $144 |
Notes to Financial Highlights
| (1) | Computed using average shares outstanding throughout the period. |
| (2) | Total returns are calculated based on the net asset value of the last business day and do not reflect applicable sales charges, if any. Total returns for periods less than one year are not annualized. |
| (3) | Ratio of operating expenses to average net assets does not include any fees and expenses of the acquired funds. |
| (4) | Per-share amount was less than $0.005. |
| (5) | April 30, 2010 (fund inception) through June 30, 2010. |
See Notes to Financial Statements.
Report of Independent Registered Public Accounting Firm |
To the Directors of the American Century Quantitative Equity Funds, Inc.
and Shareholders of the Strategic Inflation Opportunities Fund:
In our opinion, the accompanying statement of assets and liabilities, including the schedule of investments, and the related statements of operations and of changes in net assets and the financial highlights present fairly, in all material respects, the financial position of the Strategic Inflation Opportunities Fund (one of the fourteen funds comprising the American Century Quantitative Equity Funds, Inc., hereafter referred to as the “Fund”) at June 30, 2012, the results of its operations for the year then ended, the changes in its net assets for each of the two years in the period then ended and the financial highlights for each of the periods presented, in conformity with accounting principles generally accepted in the United States of America. These financial statements and financial highlights (hereafter referred to as “financial statements”) are the responsibility of the Fund’s management; our responsibility is to express an opinion on these financial statements based on our audits. We conducted our audits of these financial statements in accordance with the standards of the Public Company Accounting Oversight Board (United States). Those standards require that we plan and perform the audit to obtain reasonable assurance about whether the financial statements are free of material misstatement. An audit includes examining, on a test basis, evidence supporting the amounts and disclosures in the financial statements, assessing the accounting principles used and significant estimates made by management, and evaluating the overall financial statement presentation. We believe that our audits, which included confirmation of securities at June 30, 2012 by correspondence with the custodian and brokers, provide a reasonable basis for our opinion.
PricewaterhouseCoopers LLP
Kansas City, Missouri
August 21, 2012
Board of Directors
The individuals listed below serve as directors of the funds. Each director will continue to serve in this capacity until death, retirement, resignation or removal from office. The mandatory retirement age for directors who are not “interested persons,” as that term is defined in the Investment Company Act (independent directors), is 73. However, the mandatory retirement age may be extended for a period not to exceed two years with the approval of the remaining independent directors.
Mr. Thomas is the only director who is an “interested person” because he currently serves as President and Chief Executive Officer of American Century Companies, Inc. (ACC), the parent company of American Century Investment Management, Inc. (ACIM or the advisor).
The other directors (more than three-fourths of the total number) are independent; that is, they have never been employees, directors or officers of, and have no financial interest in, ACC or any of its wholly owned, direct or indirect, subsidiaries, including ACIM, American Century Investment Services, Inc. (ACIS) and American Century Services, LLC (ACS). The directors serve in this capacity for eight (in the case of Mr. Thomas, 15) registered investment companies in the American Century Investments family of funds.
The following table presents additional information about the directors. The mailing address for each director other than Mr. Thomas is 1665 Charleston Road, Mountain View, California 94043. The mailing address for Mr. Thomas is 4500 Main Street, Kansas City, Missouri 64111.
| | | | | | | |
Name (Year of Birth) | Position(s) Held with Funds | Length of Time Served | Principal Occupation(s) During Past 5 Years | | Number of American Century Portfolios Overseen by Director | Other Directorships Held During Past 5 Years |
| Independent Directors |
Tanya S. Beder (1955) | Director | Since 2011 | Chairman, SBCC Group Inc. (investment advisory services)(2006 to present); Fellow in Practice, International Center for Finance, Yale University School of Management (1985 to present) | | 42 | CYS Investments, Inc. (specialty finance company) |
Jeremy I. Bulow (1954) | Director | Since 2011 | Professor of Economics, Stanford University, Graduate School of Business (1979 to present) | | 42 | None |
Ronald J. Gilson (1946) | Director and Chairman of the Board | Since 1995 | Charles J. Meyers Professor of Law and Business, Stanford Law School (1979 to present); Marc and Eva Stern Professor of Law and Business, Columbia University School of Law (1992 to present) | | 42 | None |
| | | | | | | |
Name (Year of Birth) | Position(s) Held with Funds | Length of Time Served | Principal Occupation(s) During Past 5 Years | | Number of American Century Portfolios Overseen by Director | Other Directorships Held During Past 5 Years |
Frederick L. A. Grauer (1946) | Director | Since 2008 | Senior Advisor, BlackRock, Inc. (investment management firm) (2010 to 2011); Senior Advisor, Barclays Global Investors (investment management firm) (2003 to 2009) | | 42 | None |
Peter F. Pervere (1947) | Director | Since 2007 | Retired | | 42 | Intraware, Inc. (2003 to 2009) |
Myron S. Scholes (1941) | Director | Since 1980 | Chairman, Platinum Grove Asset Management, L.P. (asset manager) (1999 to 2009); Frank E. Buck Professor of Finance-Emeritus, Stanford Graduate School of Business (1996 to present) | | 42 | Dimensional Fund Advisors (investment advisor); CME Group, Inc. (futures and options exchange) |
John B. Shoven (1947) | Director | Since 2002 | Professor of Economics, Stanford University (1973 to present) | | 42 | Cadence Design Systems; Exponent; Financial Engines |
| |
| Interested Director |
Jonathan S. Thomas (1963) | Director and President | Since 2007 | President and Chief Executive Officer, ACC (March 2007 to present); Chief Administrative Officer, ACC (February 2006 to February 2007); Executive Vice President, ACC (November 2005 to February 2007). Also serves as Chief Executive Officer and Manager, ACS; Executive Vice President, ACIM; Director, ACC, ACIM and other ACC subsidiaries | | 108 | None |
Officers
The following table presents certain information about the executive officers of the funds. Each officer serves as an officer for each of the 15 investment companies in the American Century family of funds, unless otherwise noted. No officer is compensated for his or her service as an officer of the funds. The listed officers are interested persons of the funds and are appointed or re-appointed on an annual basis. The mailing address for each of the officers listed below is 4500 Main Street, Kansas City, Missouri 64111.
| | | | | |
Name (Year of Birth) | | Offices with the Funds | | Principal Occupation(s) During the Past Five Years |
Jonathan S. Thomas (1963) | | Director and President since 2007 | | President and Chief Executive Officer, ACC (March 2007 to present); Chief Administrative Officer, ACC (February 2006 to February 2007); Executive Vice President, ACC (November 2005 to February 2007). Also serves as Chief Executive Officer and Manager, ACS; Executive Vice President, ACIM; Director, ACC, ACIM and other ACC subsidiaries |
Barry Fink (1955) | | Executive Vice President since 2007 | | Chief Operating Officer and Executive Vice President, ACC (September 2007 to present); President, ACS (October 2007 to present); Managing Director, Morgan Stanley (2000 to 2007). Also serves as Manager, ACS and Director, ACC and certain ACC subsidiaries |
Maryanne L. Roepke (1956) | | Chief Compliance Officer since 2006 and Senior Vice President since 2000 | | Chief Compliance Officer, American Century funds, ACIM and ACS (August 2006 to present). Also serves as Senior Vice President, ACS |
Charles A. Etherington (1957) | | General Counsel since 2007 and Senior Vice President since 2006 | | Attorney, ACC (February 1994 to present); Vice President, ACC (November 2005 to present), General Counsel, ACC (March 2007 to present); Also serves as General Counsel, ACIM, ACS, ACIS and other ACC subsidiaries; and Senior Vice President, ACIM and ACS |
C. Jean Wade (1964) | | Vice President, Treasurer and Chief Financial Officer since 2012 | | Vice President, ACS (February 2000 to present) |
Robert J. Leach (1966) | | Vice President since 2006 and Assistant Treasurer since 2012 | | Vice President, ACS (February 2000 to present) |
David H. Reinmiller (1963) | | Vice President since 2001 | | Attorney, ACC (January 1994 to present); Associate General Counsel, ACC (January 2001 to present); Also serves as Vice President, ACIM and ACS |
Ward D. Stauffer (1960) | | Secretary since 2005 | | Attorney, ACC (June 2003 to present) |
The Statement of Additional Information has additional information about the fund’s directors and is available without charge, upon request, by calling 1-800-345-2021.
Approval of Management Agreement |
At a meeting held on June 14, 2012, the Fund’s Board of Directors/Trustees unanimously approved the renewal of the management agreement pursuant to which American Century Investment Management, Inc. (the “Advisor”) acts as the investment advisor for the Fund. Under Section 15(c) of the Investment Company Act, contracts for investment advisory services are required to be reviewed, evaluated, and approved by a majority of a fund’s independent directors/trustees (the “Directors”) each year.
As a part of the approval process, the Board requested and reviewed extensive data and information compiled by the Advisor and certain independent providers of evaluation data concerning the Fund and the services provided to the Fund by the Advisor. This review was in addition to the oversight and evaluation undertaken by the Board and its committees on a continuous basis throughout the year and included, but was not limited to the following:
| • | the nature, extent, and quality of investment management, shareholder services, and other services provided by the Advisor to the Fund; |
| • | the wide range of other programs and services the Advisor provides to the Fund and its shareholders on a routine and non-routine basis; |
| • | the investment performance of the fund, including data comparing the Fund’s performance to appropriate benchmarks and/or a peer group of other mutual funds with similar investment objectives and strategies; |
| • | data comparing the cost of owning the Fund to the cost of owning similar funds; |
| • | the Advisor’s compliance policies, procedures, and regulatory experience; |
| • | financial data showing the cost of services provided to the Fund, the profitability of the Fund to the Advisor, and the overall profitability of the Advisor; |
| • | data comparing services provided and charges to other investment management clients of the Advisor; and |
| • | consideration of collateral benefits derived by the Advisor from the management of the Fund and any potential economies of scale relating thereto. |
In keeping with its practice, the Board held two in-person meetings to review and discuss the information provided. The Board also had the benefit of the advice of its independent counsel throughout the period.
Factors Considered
The Directors considered all of the information provided by the Advisor, the independent data providers, and the Board’s independent counsel, and evaluated such information for the Fund. In connection with their review, the Directors did not identify any single factor as being all-important or controlling, and each Director may have attributed different levels of importance to different factors. In deciding to renew the management agreement, the Board based its decision on a number of factors, including the following:
Nature, Extent and Quality of Services — Generally. Under the management agreement, the Advisor is responsible for providing or arranging for all services necessary for the operation of the Fund. The Board noted that under the management agreement, the Advisor provides or arranges at its own expense a wide variety of services including:
| constructing and designing the Fund |
| portfolio research and security selection |
| initial capitalization/funding |
| daily valuation of the Fund’s portfolio |
| shareholder servicing and transfer agency, including shareholder confirmations, recordkeeping, and communications |
| regulatory and portfolio compliance |
| marketing and distribution |
The Board noted that many of these services have expanded over time both in terms of quantity and complexity in response to shareholder demands, competition in the industry, changing distribution channels, and the changing regulatory environment.
Investment Management Services. The nature of the investment management services provided to the Fund is quite complex and allows Fund shareholders access to professional money management, instant diversification of their investments within an asset class, the opportunity to easily diversify among asset classes by investing in or exchanging among various American Century Investments funds, and liquidity. In evaluating investment performance, the Board expects the Advisor to manage the Fund in accordance with its investment objectives and approved strategies. Further, the Directors recognize that the Advisor has an obligation to seek the best execution of fund trades. In providing these services, the Advisor utilizes teams of investment professionals (portfolio managers, analysts, research assistants, and securities traders) who require extensive information technology, research, training, compliance and other systems to conduct their business. The Board, directly and through its Portfolio Committee, regularly reviews investment performance information for the Fund, together with comparative information for appropriate benchmarks and/or peer groups of similarly-managed funds, over different time horizons. The Directors also review detailed performance information during the management agreement approval
process. If performance concerns are identified, the Fund receives special reviews until performance improves, during which the Board discusses with the Advisor the reasons for such results (e.g., market conditions, security selection) and any efforts being undertaken to improve performance. The Board found the investment management services provided by the Advisor to the Fund to meet or exceed industry standards. More detailed information about the Fund’s performance can be found in the Performance and Portfolio Commentary sections of this report.
Shareholder and Other Services. Under the management agreement, the Advisor provides the Fund with a comprehensive package of transfer agency, shareholder, and other services. The Board, directly and through various committees of the Board, regularly reviews reports and evaluations of such services at its regular meetings. These reports include, but are not limited to, information regarding the operational efficiency and accuracy of the shareholder and transfer agency services provided, staffing levels, shareholder satisfaction (as measured by external as well as internal sources), technology support, new products and services offered to Fund shareholders, securities trading activities, portfolio valuation services, auditing services, and legal and operational compliance activities. Certain aspects of shareholder and transfer agency service level efficiency and the quality of securities trading activities are measured by independent third party providers and are presented in comparison to other fund groups not managed by the Advisor. The Board found the services provided by the Advisor to the Fund under the management agreement to be competitive and of high quality.
Costs of Services and Profitability. The Advisor provides detailed information concerning its cost of providing various services to the Fund, its profitability in managing the Fund, its overall profitability, and its financial condition. The Directors have reviewed with the Advisor the methodology used to prepare this financial information. The financial information regarding the Advisor is considered in evaluating the Advisor’s financial condition, ability to continue to provide services under the management agreement, and the reasonableness of the current management fee. The Board concluded that the Advisor’s profits were reasonable in light of the services provided to the Fund.
Ethics. The Board generally considers the Advisor’s commitment to providing quality services to shareholders and to conducting its business ethically. They noted that the Advisor’s practices generally meet or exceed industry best practices.
Economies of Scale. The Board also reviewed information provided by the Advisor regarding the possible existence of economies of scale in connection with the management of the Fund. The Board concluded that economies of scale are difficult to measure and predict with precision, especially on a fund-by-fund basis. The Board concluded that the Advisor is appropriately sharing economies of scale through its competitive fee structure, offering competitive fees from fund inception, and through reinvestment in its business to provide shareholders additional content and services.
Comparison to Other Funds’ Fees. The management agreement provides that the Fund pay the Advisor a single, all-inclusive (or unified) management fee for providing all services necessary for the management and operation of the Fund, other than brokerage expenses, taxes, interest, extraordinary expenses, and the fees and expenses of the Fund’s independent directors (including their independent legal counsel) and expenses incurred in connection with the provision of shareholder services and distribution services under a plan adopted pursuant to Rule 12b-1 under the 1940 Act. Under the unified fee structure, the Advisor is responsible for providing all investment advisory, custody, audit, administrative, compliance, recordkeeping, marketing and shareholder services, or arranging and supervising third parties to provide such services. By contrast, most other funds are charged a variety of fees, including an investment advisory fee, a transfer agency fee, an administrative fee, distribution charges and other expenses. Other than their investment advisory fees and any applicable Rule 12b-1 distribution fees, all other components of the total fees charged by these other funds may be increased without shareholder approval. The Board believes the unified fee structure is a benefit to Fund shareholders because it clearly discloses to shareholders the cost of owning Fund shares, and, since the unified fee cannot be increased without a vote of Fund shareholders, it shifts to the Advisor the risk of increased costs of operating the Fund and provides a direct incentive to minimize administrative inefficiencies. Part of the Board’s analysis of fee levels involves reviewing certain evaluative data compiled by an independent provider and comparing the Fund’s unified fee to the total expense ratio of other funds in the Fund’s peer group. The Board concluded that the management fee paid by the Fund to the Advisor under the management agreement is reasonable in light of the services provided to the Fund.
Comparison to Fees and Services Provided to Other Clients of the Advisor. The Board also requested and received information from the Advisor concerning the nature of the services, fees, costs and profitability of its advisory services to advisory clients other than the Fund. They observed that these varying types of client accounts require different services and involve different regulatory and entrepreneurial risks than the management of the Fund. The Board analyzed this information and concluded that the fees charged and services provided to the Fund were reasonable by comparison.
Collateral or “Fall-Out” Benefits Derived by the Advisor. The Board considered the existence of collateral benefits the Advisor may receive as a result of its relationship with the Fund. They concluded that the Advisor’s primary business is managing mutual funds and it generally does not use fund or shareholder information to generate profits in other lines of business, and therefore does not derive any significant collateral benefits from them. The Board noted that the Advisor receives proprietary research from broker-dealers that execute fund portfolio transactions and concluded that this research is likely to benefit Fund shareholders. The Board also determined that the Advisor is able to provide investment management services to certain clients other than the Fund, at least in part, due to its existing infrastructure built to serve the fund complex. The Board concluded, however, that the assets of those other clients are not material to the analysis and, where applicable, may be included with the assets of the Fund to determine breakpoints in the management fee schedule.
Existing Relationship. The Board also considered whether there was any reason for not continuing the existing arrangement with the Advisor. In this regard, the Board was mindful of the potential disruptions of the Fund’s operations and various risks, uncertainties, and other effects that could occur as a result of a decision not to continue such relationship. In particular, the Board recognized that most shareholders have invested in the Fund on the strength of the Advisor’s industry standing and reputation and in the expectation that the Advisor will have a continuing role in providing advisory services to the Fund.
Conclusion of the Directors. As a result of this process, the Board, including all of the independent directors and assisted by the advice of independent legal counsel, taking into account all of the factors discussed above and the information provided by the Advisor and others, concluded that the management agreement between the Fund and the Advisor is fair and reasonable in light of the services provided and should be renewed.
Retirement Account Information
As required by law, distributions you receive from certain IRAs, or 403(b), 457 and qualified plans are subject to federal income tax withholding, unless you elect not to have withholding apply. Tax will be withheld on the total amount withdrawn even though you may be receiving amounts that are not subject to withholding, such as nondeductible contributions. In such case, excess amounts of withholding could occur. You may adjust your withholding election so that a greater or lesser amount will be withheld.
If you don’t want us to withhold on this amount, you must notify us to not withhold the federal income tax. You may notify us in writing or in certain situations by telephone or through other electronic means. You have the right to revoke your withholding election at any time and any election you make may remain in effect until revoked by filing a new election.
Remember, even if you elect not to have income tax withheld, you are liable for paying income tax on the taxable portion of your withdrawal. If you elect not to have income tax withheld or you don’t have enough income tax withheld, you may be responsible for payment of estimated tax. You may incur penalties under the estimated tax rules if your withholding and estimated tax payments are not sufficient. You can reduce or defer the income tax on a distribution by directly or indirectly rolling such distribution over to another IRA or eligible plan. You should consult your tax advisor for additional information.
State tax will be withheld if, at the time of your distribution, your address is within one of the mandatory withholding states and you have federal income tax withheld. State taxes will be withheld from your distribution in accordance with the respective state rules.
Proxy Voting Guidelines
American Century Investment Management, Inc., the fund’s investment advisor, is responsible for exercising the voting rights associated with the securities purchased and/or held by the fund. A description of the policies and procedures the advisor uses in fulfilling this responsibility is available without charge, upon request, by calling 1-800-345-2021. It is also available on American Century Investments’ website at americancentury.com and on the Securities and Exchange Commission’s website at sec.gov. Information regarding how the investment advisor voted proxies relating to portfolio securities during the most recent 12-month period ended June 30 is available on the “About Us” page at americancentury.com. It is also available at sec.gov.
Quarterly Portfolio Disclosure
The fund files its complete schedule of portfolio holdings with the Securities and Exchange Commission (SEC) for the first and third quarters of each fiscal year on Form N-Q. The fund’s Forms N-Q are available on the SEC’s website at sec.gov, and may be reviewed and copied at the SEC’s Public Reference Room in Washington, DC. Information on the operation of the Public Reference Room may be obtained by calling 1-800-SEC-0330. The fund also makes its complete schedule of portfolio holdings for the most recent quarter of its fiscal year available on its website at americancentury.com and, upon request, by calling 1-800-345-2021.
Other Tax Information
The following information is provided pursuant to provisions of the Internal Revenue Code.
The fund hereby designates up to the maximum amount allowable as qualified dividend income for the fiscal year ended June 30, 2012.
For corporate taxpayers, the fund hereby designates $164,138, or up to the maximum amount allowable, of ordinary income distributions paid during the fiscal year ended June 30, 2012 as qualified for the corporate dividends received deduction.
The fund hereby designates $79,848, or up to the maximum amount allowable, as long-term capital gain distributions for the fiscal year ended June 30, 2012.
The fund hereby designates $281,899 as qualified short-term capital gain distributions for purposes of Internal Revenue Code Section 871.
| Contact Us | americancentury.com |
| Automated Information Line | 1-800-345-8765 |
| Investor Services Representative | 1-800-345-2021 or 816-531-5575 |
| Investors Using Advisors | 1-800-378-9878 |
| Business, Not-For-Profit, Employer-Sponsored Retirement Plans | 1-800-345-3533 |
| Banks and Trust Companies, Broker-Dealers, Financial Professionals, Insurance Companies | 1-800-345-6488 |
| Telecommunications Device for the Deaf | 1-800-634-4113 |
American Century Quantitative Equity Funds, Inc.
Investment Advisor:
American Century Investment Management, Inc.
Kansas City, Missouri
This report and the statements it contains are submitted for the general information of our shareholders. The report is not authorized for distribution to prospective investors unless preceded or accompanied by an effective prospectus.
©2012 American Century Proprietary Holdings, Inc. All rights reserved.
CL-ANN-75843 1208
ANNUAL REPORT JUNE 30, 2012


| President’s Letter | 2 |
| Market Perspective | 3 |
| Performance | 4 |
| Portfolio Commentary | 5 |
| Fund Characteristics | 7 |
| Shareholder Fee Example | 8 |
| Schedule of Investments | 10 |
| Statement of Assets and Liabilities | 12 |
| Statement of Operations | 13 |
| Statement of Changes in Net Assets | 14 |
| Notes to Financial Statements | 15 |
| Financial Highlights | 19 |
| Report of Independent Registered Public Accounting Firm | 20 |
| Management | 21 |
| Approval of Management Agreement | 24 |
| Additional Information | 29 |
Any opinions expressed in this report reflect those of the author as of the date of the report, and do not necessarily represent the opinions of American Century Investments® or any other person in the American Century Investments organization. Any such opinions are subject to change at any time based upon market or other conditions and American Century Investments disclaims any responsibility to update such opinions. These opinions may not be relied upon as investment advice and, because investment decisions made by American Century Investments funds are based on numerous factors, may not be relied upon as an indication of trading intent on behalf of any American Century Investments fund. Security examples are used for representational purposes only and are not intended as recommendations to purchase or sell securities. Performance information for comparative indices and securities is provided to American Century Investments by third party vendors. To the best of American Century Investments’ knowledge, such information is accurate at the time of printing.
Dear Investor:
Thank you for reviewing this annual report for the period ended June 30, 2012. Our report offers investment performance and portfolio information, presented with the expert perspective of our portfolio management team.
This report remains one of our most important vehicles for conveying information about fund returns, as well as market factors and strategies that affected fund performance. For additional, updated information, we encourage you to visit our website, americancentury.com. Click on the “Fund Performance” and “Insights & News” headings at the top of our Individual Investors site.
Flight to Quality as Economic and Financial Uncertainties Resurfaced
During the second half of 2011 and the first half of 2012, the global economy and financial markets struggled to move beyond the lingering aftereffects of the 2008 Financial Crisis and Great Recession. Global economic fundamentals have improved since 2008, but weakened since 2010, with increased uncertainty surrounding near-term economic growth levels in major developed economies such as the U.S., Japan, and Europe. There were also questions about near-term growth levels in influential emerging economies such as China.
These near-term uncertainties manifested themselves in asset returns for the 12 months ended June 30, 2012. Assets perceived to be “safe-haven” investments rallied—the 30-year U.S. Treasury bond posted a 39% total return. At the other end of the spectrum, international stock returns for U.S. investors were undermined by a combination of risk-averse investing attitudes, weakening global economic growth, and a stronger U.S. dollar versus the euro and currencies of other struggling economies. Commodity prices also plunged during the period.
Unfortunately, the instability that triggered much of this flight-to-quality trading remains largely in place, and the coming months may bring additional uncertainties about the U.S. presidential election and what might happen when various U.S. tax cuts and other stimulative measures expire in 2013 (the so-called “Fiscal Cliff”). In this uncertain, unstable environment, we continue to believe in a disciplined, diversified, long-term investment approach, using both stocks and bonds, as appropriate. We appreciate your continued trust in us during these unsettled times.
Sincerely,
Jonathan Thomas
President and Chief Executive Officer
American Century Investments
By Scott Wittman, Chief Investment Officer, Quantitative Equity
and Asset Allocation
U.S. Stocks Mixed but Generally Higher
The U.S. stock market faced significant volatility during the 12 months ended June 30, 2012, but ultimately posted positive overall returns. As the reporting period began, stocks were in the midst of an accelerating market decline as evidence of a slowdown in U.S. economic activity and a worsening sovereign debt crisis in Europe put downward pressure on the equity market.
In early October, however, the equity market bottomed and reversed course, enjoying a substantial rebound through the fourth quarter of 2011 and first quarter of 2012. Investors grew more optimistic as signs of improving economic activity quashed recession fears; in particular, job growth consistently exceeded expectations, driving the unemployment rate down to its lowest level in more than three years. Another positive factor was better news out of Europe as the European Central Bank provided long-term financing to the debt markets and support for the Continent’s banking sector.
The final three months of the period brought another reversal as the headwinds facing the equity market at the start of the period returned to the forefront. Evidence of slowing economic activity in the U.S. and adverse developments in Europe—including political turmoil in Greece and troubled banks in Spain—weighed on investor confidence, sending stocks down sharply.
Large-Cap Stocks Outperformed
For the 12-month period, the broad equity indices (as represented by the S&P 500 Index and Russell 3000 Index) rose by 4–5%. As the table below illustrates, however, there was a divergence in returns as large-cap stocks advanced while mid- and small-cap issues declined modestly. Growth and value stocks were mixed—growth issues outperformed among large-cap stocks, while value shares held up better in the mid- and small-cap segments of the market.
From a sector perspective, the defensive sectors of the market fared best. Utilities, consumer staples, and telecommunication services stocks all generated double-digit gains for the reporting period. On the downside, the commodity-driven energy and materials sectors fell the most during the period, reflecting a broad decline in commodity prices.
| U.S. Stock Index Returns |
| For the 12 months ended June 30, 2012 |
| Russell 1000 Index (Large-Cap) | 4.37% | | Russell 2000 Index (Small-Cap) | -2.08% |
| Russell 1000 Growth Index | 5.76% | | Russell 2000 Growth Index | -2.71% |
| Russell 1000 Value Index | 3.01% | | Russell 2000 Value Index | -1.44% |
| Russell Midcap Index | -1.65% | | | |
| Russell Midcap Growth Index | -2.99% | | | |
| Russell Midcap Value Index | -0.37% | | | |
| Total Returns as of June 30, 2012 |
| | | | Average Annual Returns | |
| | Ticker Symbol | 1 year | 5 years | 10 years | Since Inception | Inception Date |
| Investor Class | BULIX | 8.20% | 1.70% | 9.41% | 7.68% | 3/1/93 |
Russell 3000 Utilities Index | — | 12.00% | 1.42% | 7.73% | N/A(1) | — |
| S&P 500 Index | — | 5.45% | 0.22% | 5.33% | 8.07%(2) | — |
| (1) | Index data first available 7/1/96. |
| (2) | Since 2/28/93, the date nearest the Investor Class’s inception for which data are available. |
| Growth of $10,000 Over 10 Years |
| $10,000 investment made June 30, 2002 |
| Total Annual Fund Operating Expenses |
Investor Class 0.69% |
The total annual fund operating expenses shown is as stated in the fund’s prospectus current as of the date of this report. The prospectus may vary from the expense ratio shown elsewhere in this report because it is based on a different time period, includes acquired fund fees and expenses, and, if applicable, does not include fee waivers or expense reimbursements.
Data presented reflect past performance. Past performance is no guarantee of future results. Current performance may be higher or lower than the performance shown. Investment return and principal value will fluctuate, and redemption value may be more or less than original cost. To obtain performance data current to the most recent month end, please call 1-800-345-2021 or visit americancentury.com. The fund concentrates its investments in a narrow segment of the total market and is therefore subject to greater risks and market fluctuations than a portfolio representing a broader range of industries. International investing involves special risks, such as political instability and currency fluctuations.
Data assumes reinvestment of dividends and capital gains, and none of the charts reflect the deduction of taxes that a shareholder would pay on fund distributions or the redemption of fund shares. Returns for the indices are provided for comparison. The fund’s total returns include operating expenses (such as transaction costs and management fees) that reduce returns, while the total returns of the indices do not.
Portfolio Managers: Bill Martin and Lynette Pang
Performance Summary
Utilities returned 8.20% for the 12 months ended June 30, 2012, lagging the 12.00% return of its benchmark, the Russell 3000 Utilities Index. The S&P 500 Index, a broad market measure, returned 5.45%.
As described on page 3, the U.S. stock market delivered gains for the 12-month period, although global macroeconomic concerns drove up volatility throughout the period. Against this backdrop, Utilities delivered gains on an absolute basis, but underperformed its benchmark.
From a broad sector perspective, stock selection in the traditional utilities sector, as well as an overweight allocation to the information technology sector, accounted for the bulk of underperformance relative to the benchmark. The energy sector was also a source of relative underperformance. On the positive side, an underweight allocation and stock decisions in the telecommunications sector contributed to relative results.
Within the utilities sector, an underweight allocation and stock choices in the electric utilities industry detracted significantly from relative returns. Underrepresentation in the water utilities industry also hurt relative performance. The portfolio’s underweight allocation to the independent power producer group and stock decisions in the group added meaningfully to returns versus the benchmark. Overweights in gas utilities and multi-utilities also contributed to relative results.
Utilities Detracted
The traditional utilities sector, which represented almost 60% of the portfolio, was a source of negative relative returns for the reporting period. Within the sector, the electric utilities group accounted for the bulk of underperformance by far, led by an overweight position in Exelon. The company reported lower-than-expected revenues, as an unusually warm winter resulted in decreased demand for heating for two Exelon subsidiaries, PECO Energy and ComEd.
An underweight allocation to water utilities hurt relative returns, as the portfolio missed two benchmark companies that outperformed during the reporting period.
Information Technology, Energy Detracted
Within the information technology sector, the portfolio held an overweight position in J2 Global. The provider of cloud communications and storage messaging services declined modestly during the 12-month period, reporting weaker-than-expected fourth quarter 2011 earnings amid increased competition. For the time the portfolio held the position, the share price decline was greater than its decline in the benchmark for the entire period.
The energy sector was also a source of underperformance. Here, detrimental stock choices included an overweight position in Energen. The natural gas and oil producer’s share price declined in the face of falling oil and natural gas prices.
Telecommunications Contributed, but some Positions Lagged
An underweight allocation to the telecommunications sector largely reflected positions within the diversified telecom group. The portfolio was underweight two positions—Level 3 Communications and Frontier Communications—that underperformed in the benchmark. Level 3 Communications, in particular, declined sharply in the benchmark amid continued net losses.
In the wireless telecommunications group, the portfolio’s overweight stake in Chicago-based Telephone and Data Systems contributed meaningfully. The company performed well as its subsidiary, U.S. Cellular, increased customer additions and revenues, while managing costs.
Elsewhere in the sector, however, holding an underweight position in cellular network provider AT&T hurt results versus the benchmark, as the company continued to benefit from increased demand. A position in France Telecom also hurt relative returns. With one of the highest dividend yields among European telecom companies, the company’s ability to maintain its yield as the European debt crisis dampened consumer demand came into question.
Outlook
Utilities employs a structured, disciplined investment approach. The management team incorporates both growth and value measures into its stock selection process and attempts to balance the portfolio’s risk and expected return.
The team has continued to avoid water utilities and is underweight independent power producers in the portfolio. The portfolio has maintained overweight positions in gas utilities and multi-utilities, as our quantitative process has identified opportunities in these areas.
| Utilities Market Returns |
| For the 12 months ended June 30, 2012 |
| Broad U.S. Stock Market | | Primary Utilities Industries in Fund Benchmark |
| S&P 500 Index | 5.45% | | Diversified Telecommunications Services | 16.89% |
| Nasdaq Composite Index* | 5.82% | | Electric Utilities | 15.19% |
| Broad Utilities Market | | Multi-Utilities | 17.45% |
| Lipper Utility Funds Index | 7.72% | | Gas Utilities | 2.67% |
| Russell 3000 Utilities Index | 12.00% | | Independent Power Producers & Energy Traders | -13.01% |
| * | Return does not reflect the reinvestment of dividends on securities in the index. Had such reinvestments been included, returns would have been higher. |
| JUNE 30, 2012 |
| Top Ten Holdings | % of net assets |
| AT&T, Inc. | 12.8% |
| Verizon Communications, Inc. | 9.7% |
| PG&E Corp. | 4.8% |
| Public Service Enterprise Group, Inc. | 4.6% |
| Exelon Corp. | 4.6% |
| American Electric Power Co., Inc. | 4.6% |
| PPL Corp. | 4.5% |
| Entergy Corp. | 4.1% |
| DTE Energy Co. | 3.8% |
| Ameren Corp. | 3.6% |
| |
| Sub-Industry Allocation | % of net assets |
| Electric Utilities | 34.8% |
| Integrated Telecommunication Services | 26.8% |
| Multi-Utilities | 22.8% |
| Wireless Telecommunication Services | 5.4% |
| Gas Utilities | 3.8% |
| Internet Software and Services | 1.7% |
| Independent Power Producers and Energy Traders | 1.5% |
| Alternative Carriers | 1.3% |
| Oil and Gas Exploration and Production | 0.6% |
| Communications Equipment | 0.1% |
| Cash and Equivalents* | 1.2% |
| *Includes temporary cash investments and other assets and liabilities. |
| |
| Types of Investments in Portfolio | % of net assets |
| Common Stocks | 98.8% |
| Temporary Cash Investments | 1.0% |
| Other Assets and Liabilities | 0.2% |
Fund shareholders may incur two types of costs: (1) transaction costs, including sales charges (loads) on purchase payments and redemption/exchange fees; and (2) ongoing costs, including management fees; distribution and service (12b-1) fees; and other fund expenses. This example is intended to help you understand your ongoing costs (in dollars) of investing in your fund and to compare these costs with the ongoing cost of investing in other mutual funds.
The example is based on an investment of $1,000 made at the beginning of the period and held for the entire period from January 1, 2012 to June 30, 2012.
Actual Expenses
The table provides information about actual account values and actual expenses for each class. You may use the information, together with the amount you invested, to estimate the expenses that you paid over the period. First, identify the share class you own. Then simply divide your account value by $1,000 (for example, an $8,600 account value divided by $1,000 = 8.6), then multiply the result by the number under the heading “Expenses Paid During Period” to estimate the expenses you paid on your account during this period.
If you hold Investor Class shares of any American Century Investments fund, or Institutional Class shares of the American Century Diversified Bond Fund, in an American Century Investments account (i.e., not a financial intermediary or retirement plan account), American Century Investments may charge you a $12.50 semiannual account maintenance fee if the value of those shares is less than $10,000. We will redeem shares automatically in one of your accounts to pay the $12.50 fee. In determining your total eligible investment amount, we will include your investments in all personal accounts (including American Century Investments Brokerage accounts) registered under your Social Security number. Personal accounts include individual accounts, joint accounts, UGMA/UTMA accounts, personal trusts, Coverdell Education Savings Accounts and IRAs (including traditional, Roth, Rollover, SEP-, SARSEP- and SIMPLE-IRAs), and certain other retirement accounts. If you have only business, business retirement, employer-sponsored or American Century Investments Brokerage accounts, you are currently not subject to this fee. If you are subject to the Account Maintenance Fee, your account value could be reduced by the fee amount.
Hypothetical Example for Comparison Purposes
The table also provides information about hypothetical account values and hypothetical expenses based on the actual expense ratio of each class of your fund and an assumed rate of return of 5% per year before expenses, which is not the actual return of a fund’s share class. The hypothetical account values and expenses may not be used to estimate the actual ending account balance or expenses you paid for the period. You may use this information to compare the ongoing costs of investing in your fund and other funds. To do so, compare this 5% hypothetical example with the 5% hypothetical examples that appear in the shareholder reports of the other funds.
Please note that the expenses shown in the table are meant to highlight your ongoing costs only and do not reflect any transactional costs, such as sales charges (loads) or redemption/exchange fees. Therefore, the table is useful in comparing ongoing costs only, and will not help you determine the relative total costs of owning different funds. In addition, if these transactional costs were included, your costs would have been higher.
| | Beginning Account Value 1/1/12 | Ending Account Value 6/30/12 | Expenses Paid During Period(1) 1/1/12 – 6/30/12 | Annualized Expense Ratio(1) |
| Actual |
| Investor Class | $1,000 | $1,059.40 | $3.48 | 0.68% |
| Hypothetical |
| Investor Class | $1,000 | $1,021.48 | $3.42 | 0.68% |
| (1) | Expenses are equal to the class’s annualized expense ratio listed in the table above, multiplied by the average account value over the period, multiplied by 182, the number of days in the most recent fiscal half-year, divided by 366, to reflect the one-half year period. |
| | | | | | | |
| | | Shares | | | Value | |
| Common Stocks — 98.8% | |
| ALTERNATIVE CARRIERS — 1.3% | |
Neutral Tandem, Inc.(1) | | | 228,105 | | | | $3,006,424 | |
tw telecom, inc.(1) | | | 48,236 | | | | 1,237,736 | |
| | | | | | | | 4,244,160 | |
| COMMUNICATIONS EQUIPMENT — 0.1% | |
| QUALCOMM, Inc. | | | 5,412 | | | | 301,340 | |
| ELECTRIC UTILITIES — 34.8% | |
| American Electric Power Co., Inc. | | | 360,898 | | | | 14,399,830 | |
| Cleco Corp. | | | 123,315 | | | | 5,158,267 | |
| Duke Energy Corp. | | | 209,604 | | | | 4,833,468 | |
| Edison International | | | 68,678 | | | | 3,172,924 | |
| Entergy Corp. | | | 189,925 | | | | 12,894,008 | |
| Exelon Corp. | | | 386,663 | | | | 14,546,262 | |
| FirstEnergy Corp. | | | 128,224 | | | | 6,307,339 | |
| NextEra Energy, Inc. | | | 146,643 | | | | 10,090,505 | |
| Pinnacle West Capital Corp. | | | 122,151 | | | | 6,320,093 | |
| Portland General Electric Co. | | | 324,296 | | | | 8,645,731 | |
| PPL Corp. | | | 510,147 | | | | 14,187,188 | |
| Southern Co. | | | 93,843 | | | | 4,344,931 | |
| UNS Energy Corp. | | | 5,169 | | | | 198,541 | |
| Xcel Energy, Inc. | | | 180,400 | | | | 5,125,164 | |
| | | | | | | | 110,224,251 | |
| GAS UTILITIES — 3.8% | |
| Laclede Group, Inc. (The) | | | 52,743 | | | | 2,099,699 | |
| Questar Corp. | | | 82,000 | | | | 1,710,520 | |
| UGI Corp. | | | 273,435 | | | | 8,047,192 | |
| | | | | | | | 11,857,411 | |
| INDEPENDENT POWER PRODUCERS AND ENERGY TRADERS — 1.5% | |
AES Corp. (The)(1) | | | 371,197 | | | | 4,762,457 | |
| INTEGRATED TELECOMMUNICATION SERVICES — 26.8% | |
| AT&T, Inc. | | | 1,133,960 | | | | 40,437,013 | |
| Atlantic Tele-Network, Inc. | | | 6,953 | | | | 234,525 | |
| BCE, Inc. | | | 88,064 | | | | 3,628,237 | |
| CenturyLink, Inc. | | | 225,218 | | | | 8,893,859 | |
| HickoryTech Corp. | | | 25,608 | | | | 284,505 | |
| Verizon Communications, Inc. | | | 689,750 | | | | 30,652,490 | |
| Windstream Corp. | | | 80,309 | | | | 775,785 | |
| | | | | | | | 84,906,414 | |
| INTERNET SOFTWARE AND SERVICES — 1.7% | |
| j2 Global, Inc. | | | 207,960 | | | | 5,494,303 | |
| MULTI-UTILITIES — 22.8% | |
| Ameren Corp. | | | 342,732 | | | | 11,495,231 | |
| CenterPoint Energy, Inc. | | | 414,373 | | | | 8,565,090 | |
| CMS Energy Corp. | | | 179,100 | | | | 4,208,850 | |
| Consolidated Edison, Inc. | | | 61,301 | | | | 3,812,309 | |
| Dominion Resources, Inc. | | | 17,122 | | | | 924,588 | |
| DTE Energy Co. | | | 203,231 | | | | 12,057,695 | |
| NorthWestern Corp. | | | 31,149 | | | | 1,143,169 | |
| PG&E Corp. | | | 335,633 | | | | 15,194,106 | |
| Public Service Enterprise Group, Inc. | | | 450,504 | | | | 14,641,380 | |
| | | | | | | | 72,042,418 | |
| OIL AND GAS EXPLORATION AND PRODUCTION — 0.6% | |
| Energen Corp. | | | 39,326 | | | | 1,774,782 | |
| WIRELESS TELECOMMUNICATION SERVICES — 5.4% | |
| America Movil SAB de CV Series L ADR | | | 121,128 | | | | 3,156,596 | |
MetroPCS Communications, Inc.(1) | | | 39,691 | | | | 240,130 | |
NII Holdings, Inc.(1) | | | 49,595 | | | | 507,357 | |
Sprint Nextel Corp.(1) | | | 903,042 | | | | 2,943,917 | |
| Telephone & Data Systems, Inc. | | | 145,010 | | | | 3,087,263 | |
United States Cellular Corp.(1) | | | 34,158 | | | | 1,319,182 | |
| USA Mobility, Inc. | | | 245,679 | | | | 3,159,432 | |
| Vodafone Group plc ADR | | | 92,230 | | | | 2,599,041 | |
| | | | | | | | 17,012,918 | |
TOTAL COMMON STOCKS (Cost $267,686,202) | | | | 312,620,454 | |
| Temporary Cash Investments — 1.0% | |
Repurchase Agreement, Bank of America Merrill Lynch, (collateralized by various U.S. Treasury obligations, 1.50% – 4.00%, 2/15/15 – 6/30/16, valued at $956,277), in a joint trading account at 0.10%, dated 6/29/12, due 7/2/12 (Delivery value $938,065) | | | | $938,057 | |
Repurchase Agreement, Credit Suisse First Boston, Inc., (collateralized by various U.S. Treasury obligations, 3.75%, 8/15/41, valued at $959,250), in a joint trading account at 0.10%, dated 6/29/12, due 7/2/12 (Delivery value $938,065) | | | | 938,057 | |
Repurchase Agreement, Goldman Sachs & Co., (collateralized by various U.S. Treasury obligations, 4.375%, 5/15/40, valued at $238,885), in a joint trading account at 0.06%, dated 6/29/12, due 7/2/12 (Delivery value $234,515) | | | | 234,514 | |
| SSgA U.S. Government Money Market Fund | | | 838,385 | | | | 838,385 | |
TOTAL TEMPORARY CASH INVESTMENTS (Cost $2,949,013) | | | | 2,949,013 | |
TOTAL INVESTMENT SECURITIES — 99.8% (Cost $270,635,215) | | | | 315,569,467 | |
| OTHER ASSETS AND LIABILITIES — 0.2% | | | | 755,107 | |
| TOTAL NET ASSETS — 100.0% | | | | $316,324,574 | |
Notes to Schedule of Investments
ADR = American Depositary Receipt
See Notes to Financial Statements.
Statement of Assets and Liabilities |
| JUNE 30, 2012 | |
| Assets | |
| Investment securities, at value (cost of $270,635,215) | | | $315,569,467 | |
| Receivable for capital shares sold | | | 366,034 | |
| Dividends and interest receivable | | | 897,711 | |
| | | | 316,833,212 | |
| | | | | |
| Liabilities | | | | |
| Payable for capital shares redeemed | | | 339,032 | |
| Accrued management fees | | | 169,606 | |
| | | | 508,638 | |
| | | | | |
| Net Assets | | | $316,324,574 | |
| | | | | |
| Investor Class Capital Shares, $0.01 Par Value | |
| Shares authorized | | | 80,000,000 | |
| Shares outstanding | | | 19,129,113 | |
| | | | | |
| Net Asset Value Per Share | | | $16.54 | |
| | | | | |
| Net Assets Consist of: | |
| Capital (par value and paid-in surplus) | | | $255,568,589 | |
| Undistributed net investment income | | | 1,159,833 | |
| Undistributed net realized gain | | | 14,662,048 | |
| Net unrealized appreciation | | | 44,934,104 | |
| | | | $316,324,574 | |
See Notes to Financial Statements.
| YEAR ENDED JUNE 30, 2012 | |
| Investment Income (Loss) | |
| Income: | | | |
| Dividends (net of foreign taxes withheld of $102,650) | | | $12,984,419 | |
| Interest | | | 1,473 | |
| | | | 12,985,892 | |
| | | | | |
| Expenses: | | | | |
| Management fees | | | 1,952,542 | |
| Directors’ fees and expenses | | | 14,678 | |
| Other expenses | | | 862 | |
| | | | 1,968,082 | |
| | | | | |
| Net investment income (loss) | | | 11,017,810 | |
| | | | | |
| Realized and Unrealized Gain (Loss) | |
| Net realized gain (loss) on: | | | | |
| Investment transactions | | | 25,431,397 | |
| Foreign currency transactions | | | (508 | ) |
| | | | 25,430,889 | |
| | | | | |
| Change in net unrealized appreciation (depreciation) on: | | | | |
| Investments | | | (12,858,676 | ) |
| Translation of assets and liabilities in foreign currencies | | | (1,329 | ) |
| | | | (12,860,005 | ) |
| | | | | |
| Net realized and unrealized gain (loss) | | | 12,570,884 | |
| | | | | |
| Net Increase (Decrease) in Net Assets Resulting from Operations | | | $23,588,694 | |
See Notes to Financial Statements.
Statement of Changes in Net Assets |
| YEARS ENDED JUNE 30, 2012 AND JUNE 30, 2011 | |
| Increase (Decrease) in Net Assets | June 30, 2012 | | | June 30, 2011 | |
| Operations | |
| Net investment income (loss) | | $11,017,810 | | | | $9,008,793 | |
| Net realized gain (loss) | | 25,430,889 | | | | 8,674,327 | |
| Change in net unrealized appreciation (depreciation) | | (12,860,005 | ) | | | 49,540,081 | |
| Net increase (decrease) in net assets resulting from operations | | 23,588,694 | | | | 67,223,201 | |
| | | | | | | | |
| Distributions to Shareholders | |
| From net investment income | | (10,207,695 | ) | | | (8,638,698 | ) |
| From net realized gains | | (1,904,502 | ) | | | — | |
| Decrease in net assets from distributions | | (12,112,197 | ) | | | (8,638,698 | ) |
| | | | | | | | |
| Capital Share Transactions | |
| Proceeds from shares sold | | 78,049,539 | | | | 34,807,857 | |
| Proceeds from reinvestment of distributions | | 11,419,325 | | | | 8,094,997 | |
| Payments for shares redeemed | | (68,797,889 | ) | | | (45,411,469 | ) |
| Net increase (decrease) in net assets from capital share transactions | | 20,670,975 | | | | (2,508,615 | ) |
| | | | | | | | |
| Net increase (decrease) in net assets | | 32,147,472 | | | | 56,075,888 | |
| | | | | | | | |
| Net Assets | |
| Beginning of period | | 284,177,102 | | | | 228,101,214 | |
| End of period | | $316,324,574 | | | | $284,177,102 | |
| | | | | | | | |
| Undistributed net investment income | | $1,159,833 | | | | $469,486 | |
| | | | | | | | |
| Transactions in Shares of the Fund | |
| Sold | | 4,984,057 | | | | 2,310,663 | |
| Issued in reinvestment of distributions | | 726,185 | | | | 545,910 | |
| Redeemed | | (4,417,268 | ) | | | (3,099,743 | ) |
| Net increase (decrease) in shares of the fund | | 1,292,974 | | | | (243,170 | ) |
See Notes to Financial Statements.
Notes to Financial Statements |
JUNE 30, 2012
1. Organization
American Century Quantitative Equity Funds, Inc. (the corporation) is registered under the Investment Company Act of 1940, as amended (the 1940 Act), as an open-end management investment company and is organized as a Maryland corporation. Utilities Fund (the fund) is one fund in a series issued by the corporation. The fund is diversified as defined under the 1940 Act. The fund’s investment objective is to seek current income and long-term growth of capital and income. The fund pursues its objectives by investing at least 80% of its assets in equity securities of companies engaged in the utilities industry.
2. Significant Accounting Policies
The following is a summary of significant accounting policies consistently followed by the fund in preparation of its financial statements. The financial statements are prepared in conformity with accounting principles generally accepted in the United States of America, which may require management to make certain estimates and assumptions at the date of the financial statements. Actual results could differ from these estimates.
Investment Valuations — The fund determines the fair value of its investments and computes its net asset value per share as of the close of regular trading (usually 4 p.m. Eastern time) on the New York Stock Exchange (NYSE) on each day the NYSE is open.
Equity securities that are listed or traded on a domestic securities exchange are valued at the last reported sales price or at the official closing price as provided by the exchange. Equity securities traded on foreign securities exchanges are typically valued at the closing price on the exchange where primarily traded or as of the close of the NYSE, if that is earlier. If no last sales price is reported, or if local convention or regulation so provides, the mean of the latest bid and asked prices is used. Depending on local convention or regulation, securities traded over-the-counter are valued at the mean of the latest bid and asked prices, the last sales price, or the official closing price. In its determination of fair value, the fund may review several factors including: market information specific to a security; news developments in U.S. and foreign markets; the performance of particular U.S. and foreign securities, indices, comparable securities, American Depositary Receipts, Exchange-Traded Funds, and other relevant market indicators.
Debt securities maturing within 60 days at the time of purchase may be valued at cost, plus or minus any amortized discount or premium or at the evaluated mean as provided by an independent pricing service. Evaluated mean prices are commonly derived through utilization of market models, which may consider, among other factors, trade data, quotations from dealers and active market makers, relevant yield curve and spread data, related sector levels, creditworthiness, and other relevant market information on the same or comparable securities.
Investments in open-end management investment companies are valued at the reported net asset value per share. Repurchase agreements are valued at cost.
The value of investments initially expressed in foreign currencies is translated into U.S. dollars at prevailing exchange rates.
If the fund determines that the market price for a portfolio security is not readily available or the valuation methods mentioned above do not reflect a security’s fair value, such security is valued as determined in good faith by the Board of Directors or its designee, in accordance with procedures adopted by the Board of Directors. Circumstances that may cause the fund to use these procedures to value a security include, but are not limited to: a security has been declared in default; trading in a security has been halted during the trading day; there is a foreign market holiday and no trading occurred; or an event occurred between the close of a foreign exchange and the NYSE that may affect the value of a security.
Security Transactions — Security transactions are accounted for as of the trade date. Net realized gains and losses are determined on the identified cost basis, which is also used for federal income tax purposes.
Investment Income — Dividend income less foreign taxes withheld, if any, is recorded as of the ex-dividend date. Interest income is recorded on the accrual basis and includes accretion of discounts and amortization of premiums.
Foreign Currency Translations — All assets and liabilities initially expressed in foreign currencies are translated into U.S. dollars at prevailing exchange rates at period end. The fund may enter into spot foreign currency exchange contracts to facilitate transactions denominated in a foreign currency. Purchases and sales of investment securities, dividend and interest income, spot foreign currency exchange contracts, and expenses are translated at the rates of exchange prevailing on the respective dates of such transactions. Net realized and unrealized foreign currency exchange gains or losses related to investment securities are a component of net realized gain (loss) on investment transactions and change in net unrealized appreciation (depreciation) on investments, respectively.
Repurchase Agreements — The fund may enter into repurchase agreements with institutions that American Century Investment Management, Inc. (ACIM) (the investment advisor) has determined are creditworthy pursuant to criteria adopted by the Board of Directors. The fund requires that the collateral, represented by securities, received in a repurchase transaction be transferred to the custodian in a manner sufficient to enable the fund to obtain those securities in the event of a default under the repurchase agreement. ACIM monitors, on a daily basis, the securities transferred to ensure the value, including accrued interest, of the securities under each repurchase agreement is equal to or greater than amounts owed to the fund under each repurchase agreement.
Joint Trading Account — Pursuant to an Exemptive Order issued by the Securities and Exchange Commission, the fund, along with certain other funds in the American Century Investments family of funds, may transfer uninvested cash balances into a joint trading account. These balances are invested in one or more repurchase agreements that are collateralized by U.S. Treasury or Agency obligations.
Income Tax Status — It is the fund’s policy to distribute substantially all net investment income and net realized gains to shareholders and to otherwise qualify as a regulated investment company under provisions of the Internal Revenue Code. The fund is no longer subject to examination by tax authorities for years prior to 2009. At this time, management believes there are no uncertain tax positions which, based on their technical merit, would not be sustained upon examination and for which it is reasonably possible that the total amounts of unrecognized tax benefits will significantly change in the next twelve months. Accordingly, no provision has been made for federal or state income taxes.
Distributions to Shareholders — Distributions from net investment income, if any, are generally declared and paid quarterly. Distributions from net realized gains, if any, are generally declared and paid annually.
Indemnifications — Under the corporation’s organizational documents, its officers and directors are indemnified against certain liabilities arising out of the performance of their duties to the fund. In addition, in the normal course of business, the fund enters into contracts that provide general indemnifications. The maximum exposure under these arrangements is unknown as this would involve future claims that may be made against a fund. The risk of material loss from such claims is considered by management to be remote.
3. Fees and Transactions with Related Parties
Management Fees — The corporation has entered into a management agreement with ACIM, under which ACIM provides the fund with investment advisory and management services in exchange for a single, unified management fee (the fee). The agreement provides that all expenses of managing and operating the fund, except distribution and service fees, brokerage expenses, taxes, interest, fees and expenses of the independent directors (including legal counsel fees), and extraordinary expenses, will be paid by ACIM. The fee is computed and accrued daily based on the daily net assets of the fund and paid monthly in arrears. The fee consists of (1) an Investment Category Fee based on the daily net assets of the fund and certain other accounts managed by the investment advisor that are in the same broad investment category as the fund and (2) a Complex Fee based on the assets of all the funds in the American Century Investments family of funds. The rates for the Investment Category Fee range from 0.3380% to 0.5200%. The rates for the Complex Fee range from 0.2500% to 0.3100%. The effective annual management fee for the year ended June 30, 2012 was 0.68%.
Related Parties — Certain officers and directors of the corporation are also officers and/or directors of American Century Companies, Inc., the parent of the corporation’s investment advisor, ACIM, the distributor of the corporation, American Century Investment Services, Inc., and the corporation’s transfer agent, American Century Services, LLC.
4. Investment Transactions
Purchases and sales of investment securities, excluding short-term investments, for the year ended June 30, 2012 were $178,017,380 and $157,215,656, respectively.
5. Fair Value Measurements
The fund’s securities valuation process is based on several considerations and may use multiple inputs to determine the fair value of the positions held by the fund. In conformity with accounting principles generally accepted in the United States of America, the inputs used to determine a valuation are classified into three broad levels as follows:
| • | Level 1 valuation inputs consist of unadjusted quoted prices in an active market for identical securities; |
| • | Level 2 valuation inputs consist of direct or indirect observable market data (including quoted prices for similar securities, evaluations of subsequent market events, interest rates, prepayment speeds, credit risk, etc.); or |
| • | Level 3 valuation inputs consist of unobservable data (including a fund’s own assumptions). |
The level classification is based on the lowest level input that is significant to the fair valuation measurement. The valuation inputs are not necessarily an indication of the risks associated with investing in these securities or other financial instruments.
The following is a summary of the level classifications as of period end. The Schedule of Investments provides additional information on the fund’s portfolio holdings.
| | Level 1 | Level 2 | Level 3 |
| Investment Securities |
| Common Stocks | $312,620,454 | — | — |
| Temporary Cash Investments | 838,385 | $2,110,628 | — |
| Total Value of Investment Securities | $313,458,839 | $2,110,628 | — |
6. Risk Factors
The fund concentrates its investments in a narrow segment of the total market. Because of this, the fund may be subject to greater risk and market fluctuations than a portfolio representing a broader range of industries.
There are certain risks involved in investing in foreign securities. These risks include those resulting from future adverse political, social and economic developments, fluctuations in currency exchange rates, the possible imposition of exchange controls, and other foreign laws or restrictions.
7. Federal Tax Information
The tax character of distributions paid during the years ended June 30, 2012 and June 30, 2011 were as follows:
| | | |
| | 2012 | 2011 |
| Distributions Paid From |
| Ordinary income | $10,207,695 | $8,638,698 |
| Long-term capital gains | $1,904,502 | — |
The book-basis character of distributions made during the year from net investment income or net realized gains may differ from their ultimate characterization for federal income tax purposes. These differences reflect the differing character of certain income items and net realized gains and losses for financial statement and tax purposes, and may result in reclassification among certain capital accounts on the financial statements.
As of June 30, 2012, the federal tax cost of investments and the components of distributable earnings on a tax-basis were as follows:
| Federal tax cost of investments | | $271,384,678 | |
| Gross tax appreciation of investments | | $49,012,879 | |
| Gross tax depreciation of investments | | (4,828,090 | ) |
| Net tax appreciation (depreciation) of investments | | $44,184,789 | |
Net tax appreciation (depreciation) on translation of assets and liabilities in foreign currencies | | $(146 | ) |
| Net tax appreciation (depreciation) | | $44,184,643 | |
| Undistributed ordinary income | | $1,159,833 | |
| Accumulated long-term gains | | $15,411,509 | |
The difference between book-basis and tax-basis cost and unrealized appreciation (depreciation) is attributable primarily to the tax deferral of losses on wash sales.
| For a Share Outstanding Throughout the Years Ended June 30 (except as noted) |
| Per-Share Data | Ratios and Supplemental Data |
| | Net Asset Value, Beginning of Period | Income From Investment Operations: | Distributions From: | | Total Return(2) | Ratio to Average Net Assets of: | | |
| | Net Investment Income (Loss)(1) | Net Realized and Unrealized Gain (Loss) | Total From Investment Operations | Net Investment Income | Net Realized Gains | Total Distributions | Net Asset Value, End of Period | Operating Expenses | Net Investment Income (Loss) | Portfolio Turnover Rate | Net Assets, End of Period (in thousands) |
| Investor Class |
| 2012 | $15.93 | 0.60 | 0.66 | 1.26 | (0.55) | (0.10) | (0.65) | $16.54 | 8.20% | 0.68% | 3.83% | 55% | $316,325 |
| 2011 | $12.62 | 0.51 | 3.30 | 3.81 | (0.50) | — | (0.50) | $15.93 | 30.50% | 0.69% | 3.47% | 17% | $284,177 |
| 2010 | $12.42 | 0.49 | 0.19 | 0.68 | (0.48) | — | (0.48) | $12.62 | 5.30% | 0.70% | 3.75% | 11% | $228,101 |
| 2009 | $17.46 | 0.46 | (4.98) | (4.52) | (0.52) | — | (0.52) | $12.42 | (25.89)% | 0.70% | 3.54% | 14% | $236,734 |
| 2008 | $18.04 | 0.39 | (0.61) | (0.22) | (0.36) | — | (0.36) | $17.46 | (1.26)% | 0.68% | 2.16% | 19% | $387,070 |
Notes to Financial Highlights
| (1) | Computed using average shares outstanding throughout the period. |
| (2) | Total returns are calculated based on the net asset value of the last business day. Total returns for periods less than one year are not annualized. |
See Notes to Financial Statements.
Report of Independent Registered Public Accounting Firm |
To the Directors of the American Century Quantitative Equity Funds, Inc. and Shareholders of the Utilities Fund:
In our opinion, the accompanying statement of assets and liabilities, including the schedule of investments, and the related statements of operations and of changes in net assets and the financial highlights present fairly, in all material respects, the financial position of the Utilities Fund (one of the fourteen funds comprising the American Century Quantitative Equity Funds, Inc., hereafter referred to as the “Fund”) at June 30, 2012, the results of its operations for the year then ended, the changes in its net assets for each of the two years in the period then ended and the financial highlights for each of the five years in the period then ended, in conformity with accounting principles generally accepted in the United States of America. These financial statements and financial highlights (hereafter referred to as “financial statements”) are the responsibility of the Fund’s management; our responsibility is to express an opinion on these financial statements based on our audits. We conducted our audits of these financial statements in accordance with the standards of the Public Company Accounting Oversight Board (United States). Those standards require that we plan and perform the audit to obtain reasonable assurance about whether the financial statements are free of material misstatement. An audit includes examining, on a test basis, evidence supporting the amounts and disclosures in the financial statements, assessing the accounting principles used and significant estimates made by management, and evaluating the overall financial statement presentation. We believe that our audits, which included confirmation of securities at June 30, 2012 by correspondence with the custodian and brokers, provide a reasonable basis for our opinion.
PricewaterhouseCoopers LLP
Kansas City, Missouri
August 21, 2012
Board of Directors
The individuals listed below serve as directors of the funds. Each director will continue to serve in this capacity until death, retirement, resignation or removal from office. The mandatory retirement age for directors who are not “interested persons,” as that term is defined in the Investment Company Act (independent directors), is 73. However, the mandatory retirement age may be extended for a period not to exceed two years with the approval of the remaining independent directors.
Mr. Thomas is the only director who is an “interested person” because he currently serves as President and Chief Executive Officer of American Century Companies, Inc. (ACC), the parent company of American Century Investment Management, Inc. (ACIM or the advisor).
The other directors (more than three-fourths of the total number) are independent; that is, they have never been employees, directors or officers of, and have no financial interest in, ACC or any of its wholly owned, direct or indirect, subsidiaries, including ACIM, American Century Investment Services, Inc. (ACIS) and American Century Services, LLC (ACS). The directors serve in this capacity for eight (in the case of Mr. Thomas, 15) registered investment companies in the American Century Investments family of funds.
The following table presents additional information about the directors. The mailing address for each director other than Mr. Thomas is 1665 Charleston Road, Mountain View, California 94043. The mailing address for Mr. Thomas is 4500 Main Street, Kansas City, Missouri 64111.
Name (Year of Birth) | Position(s) Held with Funds | Length of Time Served | | Principal Occupation(s) During Past 5 Years | | Number of American Century Portfolios Overseen by Director | Other Directorships Held During Past 5 Years |
| Independent Directors |
Tanya S. Beder (1955) | Director | Since 2011 | | Chairman, SBCC Group Inc. (investment advisory services)(2006 to present); Fellow in Practice, International Center for Finance, Yale University School of Management (1985 to present) | | 42 | CYS Investments, Inc. (specialty finance company) |
Jeremy I. Bulow (1954) | Director | Since 2011 | | Professor of Economics, Stanford University, Graduate School of Business (1979 to present) | | 42 | None |
Ronald J. Gilson (1946) | Director and Chairman of the Board | Since 1995 | | Charles J. Meyers Professor of Law and Business, Stanford Law School (1979 to present); Marc and Eva Stern Professor of Law and Business, Columbia University School of Law (1992 to present) | | 42 | None |
Name (Year of Birth) | Position(s) Held with Funds | Length of Time Served | | Principal Occupation(s) During Past 5 Years | | Number of American Century Portfolios Overseen by Director | Other Directorships Held During Past 5 Years |
| Independent Directors |
Frederick L. A. Grauer (1946) | Director | Since 2008 | | Senior Advisor, BlackRock, Inc. (investment management firm) (2010 to 2011); Senior Advisor, Barclays Global Investors (investment management firm) (2003 to 2009) | | 42 | None |
Peter F. Pervere (1947) | Director | Since 2007 | | Retired | | 42 | Intraware, Inc. (2003 to 2009) |
Myron S. Scholes (1941) | Director | Since 1980 | | Chairman, Platinum Grove Asset Management, L.P. (asset manager) (1999 to 2009); Frank E. Buck Professor of Finance-Emeritus, Stanford Graduate School of Business (1996 to present) | | 42 | Dimensional Fund Advisors (investment advisor); CME Group, Inc. (futures and options exchange) |
John B. Shoven (1947) | Director | Since 2002 | | Professor of Economics, Stanford University (1973 to present) | | 42 | Cadence Design Systems; Exponent; Financial Engines |
| |
| Interested Director |
Jonathan S. Thomas (1963) | Director and President | Since 2007 | | President and Chief Executive Officer, ACC (March 2007 to present); Chief Administrative Officer, ACC (February 2006 to February 2007); Executive Vice President, ACC (November 2005 to February 2007). Also serves as Chief Executive Officer and Manager, ACS; Executive Vice President, ACIM; Director, ACC, ACIM and other ACC subsidiaries | | 108 | None |
Officers
The following table presents certain information about the executive officers of the funds. Each officer serves as an officer for each of the 15 investment companies in the American Century family of funds, unless otherwise noted. No officer is compensated for his or her service as an officer of the funds. The listed officers are interested persons of the funds and are appointed or re-appointed on an annual basis. The mailing address for each of the officers listed below is 4500 Main Street, Kansas City, Missouri 64111.
Name (Year of Birth) | Offices with the Funds | | Principal Occupation(s) During the Past Five Years |
Jonathan S. Thomas (1963) | Director and President since 2007 | | President and Chief Executive Officer, ACC (March 2007 to present); Chief Administrative Officer, ACC (February 2006 to February 2007); Executive Vice President, ACC (November 2005 to February 2007). Also serves as Chief Executive Officer and Manager, ACS; Executive Vice President, ACIM; Director, ACC, ACIM and other ACC subsidiaries |
Barry Fink (1955) | Executive Vice President since 2007 | | Chief Operating Officer and Executive Vice President, ACC (September 2007 to present); President, ACS (October 2007 to present); Managing Director, Morgan Stanley (2000 to 2007). Also serves as Manager, ACS and Director, ACC and certain ACC subsidiaries |
Maryanne L. Roepke (1956) | Chief Compliance Officer since 2006 and Senior Vice President since 2000 | | Chief Compliance Officer, American Century funds, ACIM and ACS (August 2006 to present). Also serves as Senior Vice President, ACS |
Charles A. Etherington (1957) | General Counsel since 2007 and Senior Vice President since 2006 | | Attorney, ACC (February 1994 to present); Vice President, ACC (November 2005 to present), General Counsel, ACC (March 2007 to present); Also serves as General Counsel, ACIM, ACS, ACIS and other ACC subsidiaries; and Senior Vice President, ACIM and ACS |
C. Jean Wade (1964) | Vice President, Treasurer and Chief Financial Officer since 2012 | | Vice President, ACS (February 2000 to present) |
Robert J. Leach (1966) | Vice President since 2006 and Assistant Treasurer since 2012 | | Vice President, ACS (February 2000 to present) |
David H. Reinmiller (1963) | Vice President since 2001 | | Attorney, ACC (January 1994 to present); Associate General Counsel, ACC (January 2001 to present); Also serves as Vice President, ACIM and ACS |
Ward D. Stauffer (1960) | Secretary since 2005 | | Attorney, ACC (June 2003 to present) |
The Statement of Additional Information has additional information about the fund’s directors and is available without charge, upon request, by calling 1-800-345-2021.
Approval of Management Agreement |
At a meeting held on June 14, 2012, the Fund’s Board of Directors/Trustees unanimously approved the renewal of the management agreement pursuant to which American Century Investment Management, Inc. (the “Advisor”) acts as the investment advisor for the Fund. Under Section 15(c) of the Investment Company Act, contracts for investment advisory services are required to be reviewed, evaluated, and approved by a majority of a fund’s independent directors/trustees (the “Directors”) each year.
As a part of the approval process, the Board requested and reviewed extensive data and information compiled by the Advisor and certain independent providers of evaluation data concerning the Fund and the services provided to the Fund by the Advisor. This review was in addition to the oversight and evaluation undertaken by the Board and its committees on a continuous basis throughout the year and included, but was not limited to the following:
| • | the nature, extent, and quality of investment management, shareholder services, and other services provided by the Advisor to the Fund; |
| • | the wide range of other programs and services the Advisor provides to the Fund and its shareholders on a routine and non-routine basis; |
| • | the investment performance of the fund, including data comparing the Fund’s performance to appropriate benchmarks and/or a peer group of other mutual funds with similar investment objectives and strategies; |
| • | data comparing the cost of owning the Fund to the cost of owning similar funds; |
| • | the Advisor’s compliance policies, procedures, and regulatory experience; |
| • | financial data showing the cost of services provided to the Fund, the profitability of the Fund to the Advisor, and the overall profitability of the Advisor; |
| • | data comparing services provided and charges to other investment management clients of the Advisor; and |
| • | consideration of collateral benefits derived by the Advisor from the management of the Fund and any potential economies of scale relating thereto. |
In keeping with its practice, the Board held two in-person meetings to review and discuss the information provided. The Board also had the benefit of the advice of its independent counsel throughout the period.
Factors Considered
The Directors considered all of the information provided by the Advisor, the independent data providers, and the Board’s independent counsel, and evaluated such information for the Fund. In connection with their review, the Directors did not identify any single factor as being all-important or controlling, and each Director may have attributed different levels of importance to different factors. In deciding to renew the management agreement, the Board based its decision on a number of factors, including the following:
Nature, Extent and Quality of Services — Generally. Under the management agreement, the Advisor is responsible for providing or arranging for all services necessary for the operation of the Fund. The Board noted that under the management agreement, the Advisor provides or arranges at its own expense a wide variety of services including:
| • | constructing and designing the Fund |
| • | portfolio research and security selection |
| • | initial capitalization/funding |
| • | daily valuation of the Fund’s portfolio |
| • | shareholder servicing and transfer agency, including shareholder confirmations, recordkeeping, and communications |
| • | regulatory and portfolio compliance |
| • | marketing and distribution |
The Board noted that many of these services have expanded over time both in terms of quantity and complexity in response to shareholder demands, competition in the industry, changing distribution channels, and the changing regulatory environment.
Investment Management Services. The nature of the investment management services provided to the Fund is quite complex and allows Fund shareholders access to professional money management, instant diversification of their investments within an asset class, the opportunity to easily diversify among asset classes by investing in or exchanging among various American Century Investments funds, and liquidity. In evaluating investment performance, the Board expects the Advisor to manage the Fund in accordance with its investment objectives and approved strategies. Further, the Directors recognize that the Advisor has an obligation to seek the best execution of fund trades. In providing these services, the Advisor utilizes teams of investment professionals (portfolio managers, analysts, research assistants, and securities traders) who require extensive information technology, research, training, compliance and other systems to conduct their business. The Board, directly and through its Portfolio Committee, regularly reviews investment performance information for the Fund, together with comparative information for appropriate benchmarks and/or peer groups of similarly-managed funds, over different time horizons. The Directors also review detailed performance information during the management agreement
approval process. If performance concerns are identified, the Fund receives special reviews until performance improves, during which the Board discusses with the Advisor the reasons for such results (e.g., market conditions, security selection) and any efforts being undertaken to improve performance. The Board found the investment management services provided by the Advisor to the Fund to meet or exceed industry standards. More detailed information about the Fund’s performance can be found in the Performance and Portfolio Commentary sections of this report.
Shareholder and Other Services. Under the management agreement, the Advisor provides the Fund with a comprehensive package of transfer agency, shareholder, and other services. The Board, directly and through various committees of the Board, regularly reviews reports and evaluations of such services at its regular meetings. These reports include, but are not limited to, information regarding the operational efficiency and accuracy of the shareholder and transfer agency services provided, staffing levels, shareholder satisfaction (as measured by external as well as internal sources), technology support, new products and services offered to Fund shareholders, securities trading activities, portfolio valuation services, auditing services, and legal and operational compliance activities. Certain aspects of shareholder and transfer agency service level efficiency and the quality of securities trading activities are measured by independent third party providers and are presented in comparison to other fund groups not managed by the Advisor. The Board found the services provided by the Advisor to the Fund under the management agreement to be competitive and of high quality.
Costs of Services and Profitability. The Advisor provides detailed information concerning its cost of providing various services to the Fund, its profitability in managing the Fund, its overall profitability, and its financial condition. The Directors have reviewed with the Advisor the methodology used to prepare this financial information. The financial information regarding the Advisor is considered in evaluating the Advisor’s financial condition, ability to continue to provide services under the management agreement, and the reasonableness of the current management fee. The Board concluded that the Advisor’s profits were reasonable in light of the services provided to the Fund.
Ethics. The Board generally considers the Advisor’s commitment to providing quality services to shareholders and to conducting its business ethically. They noted that the Advisor’s practices generally meet or exceed industry best practices.
Economies of Scale. The Board also reviewed information provided by the Advisor regarding the possible existence of economies of scale in connection with the management of the Fund. The Board concluded that economies of scale are difficult to measure and predict with precision, especially on a fund-by-fund basis. The Board concluded that the Advisor is appropriately sharing economies of scale through its competitive fee structure, offering competitive fees from fund inception, and through reinvestment in its business to provide shareholders additional content and services.
Comparison to Other Funds’ Fees. The management agreement provides that the Fund pay the Advisor a single, all-inclusive (or unified) management fee for providing all services necessary for the management and operation of the Fund, other than brokerage expenses, taxes, interest, extraordinary expenses, and the fees and expenses of the Fund’s independent directors (including their independent legal counsel) and expenses incurred in connection with the provision of shareholder services and distribution services under a plan adopted pursuant to Rule 12b-1 under the 1940 Act. Under the unified fee structure, the Advisor is responsible for providing all investment advisory, custody, audit, administrative, compliance, recordkeeping, marketing and shareholder services, or arranging and supervising third parties to provide such services. By contrast, most other funds are charged a variety of fees, including an investment advisory fee, a transfer agency fee, an administrative fee, distribution charges and other expenses. Other than their investment advisory fees and any applicable Rule 12b-1 distribution fees, all other components of the total fees charged by these other funds may be increased without shareholder approval. The Board believes the unified fee structure is a benefit to Fund shareholders because it clearly discloses to shareholders the cost of owning Fund shares, and, since the unified fee cannot be increased without a vote of Fund shareholders, it shifts to the Advisor the risk of increased costs of operating the Fund and provides a direct incentive to minimize administrative inefficiencies. Part of the Board’s analysis of fee levels involves reviewing certain evaluative data compiled by an independent provider and comparing the Fund’s unified fee to the total expense ratio of other funds in the Fund’s peer group. The Board concluded that the management fee paid by the Fund to the Advisor under the management agreement is reasonable in light of the services provided to the Fund.
Comparison to Fees and Services Provided to Other Clients of the Advisor. The Board also requested and received information from the Advisor concerning the nature of the services, fees, costs and profitability of its advisory services to advisory clients other than the Fund. They observed that these varying types of client accounts require different services and involve different regulatory and entrepreneurial risks than the management of the Fund. The Board analyzed this information and concluded that the fees charged and services provided to the Fund were reasonable by comparison.
Collateral or “Fall-Out” Benefits Derived by the Advisor. The Board considered the existence of collateral benefits the Advisor may receive as a result of its relationship with the Fund. They concluded that the Advisor’s primary business is managing mutual funds and it generally does not use fund or shareholder information to generate profits in other lines of business, and therefore does not derive any significant collateral benefits from them. The Board noted that the Advisor receives proprietary research from broker-dealers that execute fund portfolio transactions and concluded that this research is likely to benefit Fund shareholders. The Board also determined that the Advisor is able to provide investment management services to certain clients other than the Fund, at least in part, due to its existing infrastructure built to serve the fund complex. The Board concluded, however, that the assets of those other clients are not material to the analysis and, where applicable, may be included with the assets of the Fund to determine breakpoints in the management fee schedule.
Existing Relationship. The Board also considered whether there was any reason for not continuing the existing arrangement with the Advisor. In this regard, the Board was mindful of the potential disruptions of the Fund’s operations and various risks, uncertainties, and other effects that could occur as a result of a decision not to continue such relationship. In particular, the Board recognized that most shareholders have invested in the Fund on the strength of the Advisor’s industry standing and reputation and in the expectation that the Advisor will have a continuing role in providing advisory services to the Fund.
Conclusion of the Directors. As a result of this process, the Board, including all of the independent directors and assisted by the advice of independent legal counsel, taking into account all of the factors discussed above and the information provided by the Advisor and others, concluded that the management agreement between the Fund and the Advisor is fair and reasonable in light of the services provided and should be renewed.
Retirement Account Information
As required by law, distributions you receive from certain IRAs, or 403(b), 457 and qualified plans are subject to federal income tax withholding, unless you elect not to have withholding apply. Tax will be withheld on the total amount withdrawn even though you may be receiving amounts that are not subject to withholding, such as nondeductible contributions. In such case, excess amounts of withholding could occur. You may adjust your withholding election so that a greater or lesser amount will be withheld.
If you don’t want us to withhold on this amount, you must notify us to not withhold the federal income tax. You may notify us in writing or in certain situations by telephone or through other electronic means. You have the right to revoke your withholding election at any time and any election you make may remain in effect until revoked by filing a new election.
Remember, even if you elect not to have income tax withheld, you are liable for paying income tax on the taxable portion of your withdrawal. If you elect not to have income tax withheld or you don’t have enough income tax withheld, you may be responsible for payment of estimated tax. You may incur penalties under the estimated tax rules if your withholding and estimated tax payments are not sufficient. You can reduce or defer the income tax on a distribution by directly or indirectly rolling such distribution over to another IRA or eligible plan. You should consult your tax advisor for additional information.
State tax will be withheld if, at the time of your distribution, your address is within one of the mandatory withholding states and you have federal income tax withheld. State taxes will be withheld from your distribution in accordance with the respective state rules.
Proxy Voting Guidelines
American Century Investment Management, Inc., the fund’s investment advisor, is responsible for exercising the voting rights associated with the securities purchased and/or held by the fund. A description of the policies and procedures the advisor uses in fulfilling this responsibility is available without charge, upon request, by calling 1-800-345-2021. It is also available on American Century Investments’ website at americancentury.com and on the Securities and Exchange Commission’s website at sec.gov. Information regarding how the investment advisor voted proxies relating to portfolio securities during the most recent 12-month period ended June 30 is available on the “About Us” page at americancentury.com. It is also available at sec.gov.
Quarterly Portfolio Disclosure
The fund files its complete schedule of portfolio holdings with the Securities and Exchange Commission (SEC) for the first and third quarters of each fiscal year on Form N-Q. The fund’s Forms N-Q are available on the SEC’s website at sec.gov, and may be reviewed and copied at the SEC’s Public Reference Room in Washington, DC. Information on the operation of the Public Reference Room may be obtained by calling 1-800-SEC-0330. The fund also makes its complete schedule of portfolio holdings for the most recent quarter of its fiscal year available on its website at americancentury.com and, upon request, by calling 1-800-345-2021.
Other Tax Information
The following information is provided pursuant to provisions of the Internal Revenue Code.
The fund hereby designates up to the maximum amount allowable as qualified dividend income for the fiscal year ended June 30, 2012.
For corporate taxpayers, the fund hereby designates $10,207,695, or up to the maximum amount allowable, of ordinary income distributions paid during the fiscal year ended June 30, 2012 as qualified for the corporate dividends received deduction.
The fund hereby designates $1,904,502, or up to the maximum amount allowable, as long-term capital gain distributions for the fiscal year ended June 30, 2012.
| Contact Us | americancentury.com |
| Automated Information Line | 1-800-345-8765 |
| Investor Services Representative | 1-800-345-2021 or 816-531-5575 |
| Investors Using Advisors | 1-800-378-9878 |
| Business, Not-For-Profit, Employer-Sponsored Retirement Plans | 1-800-345-3533 |
| Banks and Trust Companies, Broker-Dealers, Financial Professionals, Insurance Companies | 1-800-345-6488 |
| Telecommunications Device for the Deaf | 1-800-634-4113 |
American Century Quantitative Equity Funds, Inc.
Investment Advisor:
American Century Investment Management, Inc.
Kansas City, Missouri
This report and the statements it contains are submitted for the general information of our shareholders. The report is not authorized for distribution to prospective investors unless preceded or accompanied by an effective prospectus.
©2012 American Century Proprietary Holdings, Inc. All rights reserved.
CL-ANN-75835 1208
ANNUAL REPORT JUNE 30, 2012
| President’s Letter | 2 |
| Market Perspective | 3 |
| Performance | 4 |
| Portfolio Commentary | 5 |
| Fund Characteristics | 7 |
| Shareholder Fee Example | 8 |
| Schedule of Investments | 10 |
| Statement of Assets and Liabilities | 13 |
| Statement of Operations | 14 |
| Statement of Changes in Net Assets | 15 |
| Notes to Financial Statements | 16 |
| Financial Highlights | 20 |
| Report of Independent Registered Public Accounting Firm | 21 |
| Management | 22 |
| Approval of Management Agreement | 25 |
| Additional Information | 30 |
Any opinions expressed in this report reflect those of the author as of the date of the report, and do not necessarily represent the opinions of American Century Investments® or any other person in the American Century Investments organization. Any such opinions are subject to change at any time based upon market or other conditions and American Century Investments disclaims any responsibility to update such opinions. These opinions may not be relied upon as investment advice and, because investment decisions made by American Century Investments funds are based on numerous factors, may not be relied upon as an indication of trading intent on behalf of any American Century Investments fund. Security examples are used for representational purposes only and are not intended as recommendations to purchase or sell securities. Performance information for comparative indices and securities is provided to American Century Investments by third party vendors. To the best of American Century Investments’ knowledge, such information is accurate at the time of printing.
Dear Investor:
Thank you for reviewing this annual report for the period ended June 30, 2012. Our report offers investment performance and portfolio information, presented with the expert perspective of our portfolio management team.
This report remains one of our most important vehicles for conveying information about fund returns, as well as market factors and strategies that affected fund performance. For additional, updated information, we encourage you to visit our website, americancentury.com. Click on the “Fund Performance” and “Insights & News” headings at the top of our Individual Investors site.
Flight to Quality as Economic and Financial Uncertainties Resurfaced
During the second half of 2011 and the first half of 2012, the global economy and financial markets struggled to move beyond the lingering aftereffects of the 2008 Financial Crisis and Great Recession. Global economic fundamentals have improved since 2008, but weakened since 2010, with increased uncertainty surrounding near-term economic growth levels in major developed economies such as the U.S., Japan, and Europe. There were also questions about near-term growth levels in influential emerging economies such as China.
These near-term uncertainties manifested themselves in asset returns for the 12 months ended June 30, 2012. Assets perceived to be “safe-haven” investments rallied—the 30-year U.S. Treasury bond posted a 39% total return. At the other end of the spectrum, international stock returns for U.S. investors were undermined by a combination of risk-averse investing attitudes, weakening global economic growth, and a stronger U.S. dollar versus the euro and currencies of other struggling economies. Commodity prices also plunged during the period.
Unfortunately, the instability that triggered much of this flight-to-quality trading remains largely in place, and the coming months may bring additional uncertainties about the U.S. presidential election and what might happen when various U.S. tax cuts and other stimulative measures expire in 2013 (the so-called “Fiscal Cliff”). In this uncertain, unstable environment, we continue to believe in a disciplined, diversified, long-term investment approach, using both stocks and bonds, as appropriate. We appreciate your continued trust in us during these unsettled times.
Sincerely,
Jonathan Thomas
President and Chief Executive Officer
American Century Investments
By Scott Wittman, Chief Investment Officer,
Quantitative Equity and Asset Allocation
U.S. Stocks Mixed but Generally Higher
The U.S. stock market faced significant volatility during the 12 months ended June 30, 2012, but ultimately posted positive overall returns. As the reporting period began, stocks were in the midst of an accelerating market decline as evidence of a slowdown in U.S. economic activity and a worsening sovereign debt crisis in Europe put downward pressure on the equity market.
In early October, however, the equity market bottomed and reversed course, enjoying a substantial rebound through the fourth quarter of 2011 and first quarter of 2012. Investors grew more optimistic as signs of improving economic activity quashed recession fears; in particular, job growth consistently exceeded expectations, driving the unemployment rate down to its lowest level in more than three years. Another positive factor was better news out of Europe as the European Central Bank provided long-term financing to the debt markets and support for the Continent’s banking sector.
The final three months of the period brought another reversal as the headwinds facing the equity market at the start of the period returned to the forefront. Evidence of slowing economic activity in the U.S. and adverse developments in Europe—including political turmoil in Greece and troubled banks in Spain—weighed on investor confidence, sending stocks down sharply.
Large-Cap Stocks Outperformed
For the 12-month period, the broad equity indices (as represented by the S&P 500 Index and Russell 3000 Index) rose by 4–5%. As the table below illustrates, however, there was a divergence in returns as large-cap stocks advanced while mid- and small-cap issues declined modestly. Growth and value stocks were mixed—growth issues outperformed among large-cap stocks, while value shares held up better in the mid- and small-cap segments of the market.
From a sector perspective, the defensive sectors of the market fared best. Utilities, consumer staples, and telecommunication services stocks all generated double-digit gains for the reporting period. On the downside, the commodity-driven energy and materials sectors fell the most during the period, reflecting a broad decline in commodity prices.
| U.S. Stock Index Returns |
| For the 12 months ended June 30, 2012 |
| Russell 1000 Index (Large-Cap) | 4.37% | | Russell 2000 Index (Small-Cap) | -2.08% |
| Russell 1000 Growth Index | 5.76% | | Russell 2000 Growth Index | -2.71% |
| Russell 1000 Value Index | 3.01% | | Russell 2000 Value Index | -1.44% |
| Russell Midcap Index | -1.65% | | |
| Russell Midcap Growth Index | -2.99% | | | |
| Russell Midcap Value Index | -0.37% | | | |
| Total Returns as of June 30, 2012 |
| | | | Average Annual Returns | |
| | Ticker Symbol | 1 year | 5 years | Since Inception | Inception Date |
| Institutional Class | ACLEX | 5.65% | 0.09% | 2.62% | 5/12/06 |
| S&P 500 Index | — | 5.45% | 0.22% | 2.80%(1) | — |
| (1) | Since 4/30/06, the date nearest the Institutional Class’s inception for which data are available. |
| Growth of $10,000 Over Life of Class |
| $10,000 investment made May 12, 2006 |
| * | From 5/12/06, the Institutional Class’s inception date. Index data from 4/30/06, the date nearest the Institutional Class’s inception for which data are available. Not annualized. |
| Total Annual Fund Operating Expenses |
Institutional Class 0.49% |
The total annual fund operating expenses shown is as stated in the fund’s prospectus current as of the date of this report. The prospectus may vary from the expense ratio shown elsewhere in this report because it is based on a different time period, includes acquired fund fees and expenses, and, if applicable, does not include fee waivers or expense reimbursements.
Data presented reflect past performance. Past performance is no guarantee of future results. Current performance may be higher or lower than the performance shown. Investment return and principal value will fluctuate, and redemption value may be more or less than original cost. To obtain performance data current to the most recent month end, please call 1-800-345-2021 or visit americancentury.com. International investing involves special risks, such as political instability and currency fluctuations. The fund’s investment process may result in high portfolio turnover, which could mean high transaction costs, affecting both performance and capital gains tax liabilities to investors.
Data assumes reinvestment of dividends and capital gains, and none of the charts reflect the deduction of taxes that a shareholder would pay on fund distributions or the redemption of fund shares. Returns for the index are provided for comparison. The fund’s total returns include operating expenses (such as transaction costs and management fees) that reduce returns, while the total returns of the index do not.
Portfolio Managers: Bill Martin and Claudia Musat
Performance Summary
NT Equity Growth returned 5.65% for the fiscal year ended June 30, 2012, compared with the 5.45% return of its benchmark, the S&P 500 Index.
In an up-and-down period for the U.S. stock market (see page 3 for details), NT Equity Growth posted a solid gain for the 12 months and outperformed the S&P 500. Individual stock selection, a critical element of our investment process, was the key behind the outperformance.
Absolute Performance Driven by Technology and Health Care
NT Equity Growth’s absolute return for the 12 months was driven primarily by strong returns in the information technology and health care sectors, both of which generated double-digit gains. Five of the fund’s top 10 contributors to absolute performance came from the technology sector—consumer electronics maker Apple, credit card processor Visa, semiconductor manufacturer Intel, IT services provider International Business Machines, and disk drive maker Seagate Technology. In the health care sector, the best contributors were drug makers Pfizer and Abbott Laboratories.
The fund’s holdings in the telecommunication services sector also fared well. Although telecom services is the smallest sector weighting in the portfolio, it gained more than 20% for the reporting period. Top contributors included diversified telecom providers Verizon Communications and AT&T.
The only three sectors in the portfolio to decline for the 12-month period were the industrials, energy, and materials sectors. Notable detractors included oil refiner Occidental Petroleum and offshore drilling company W&T Offshore in the energy sector, mining companies Freeport-McMoRan Copper & Gold and Coeur d’Alene Mines in the materials sector, and construction and engineering firms KBR and Fluor in the industrials sector.
Financials Outperformed
Looking at performance versus the S&P 500, the fund’s holdings in the financials sector contributed the most to its outperformance of the index for the 12 months. When comparing fund performance with that of the benchmark index, it is just as important to limit exposure to weaker-performing stocks as it is to have heavier weightings in stocks that perform well. In the financials sector, the fund benefited from underweight positions versus the index in financial services providers and capital markets firms.
The best individual contributors in the financials sector were also underweight positions—financial services firm Citigroup and investment bank Goldman Sachs, the latter of which was not held by the fund. Both companies continued to struggle with declining net interest margins and problematic loans.
Health Care and Energy Also Added Value
Stock selection in the health care and energy sectors also contributed favorably to relative results. Stock selection among health care providers and pharmaceutical companies, along with an overweight position in biotechnology stocks, produced
the bulk of the outperformance in the health care sector. The leading relative performance contributor in the health care sector was health care provider WellCare Health Plans, which delivered better-than-expected profits thanks to a strong increase in enrollment and cost reductions resulting from a core systems upgrade. Drug maker Eli Lilly and biotechnology firm Amgen also added value during the period.
In the energy sector, an underweight position in energy equipment and services stocks contributed to the overall outperformance. As in the financials sector, the best individual contributor was an underweight position—energy equipment and services provider Schlumberger. Schlumberger experienced reduced demand as oil prices fell by 11% for the period.
The most important individual investment decision versus the S&P 500 for the reporting period was avoiding diversified technology firm Hewlett-Packard, which fell by more than 40%. The bulk of H-P’s decline occurred early in the period, when narrowing profit margins, a costly acquisition, and a plan to spin-off its PC business into a separate company led to the firing of its CEO.
Consumer Staples and Industrials Detracted
Stock selection in the consumer staples and industrials sectors detracted the most from performance versus the S&P 500 for the 12-month period. Stock choices among food and staples retailers and food products makers, along with avoiding the tobacco industry, produced virtually all of the underperformance in the consumer staples sector. The most notable detractor in this sector was avoiding tobacco company Philip Morris International, which surpassed earnings expectations and attracted investor demand for its relatively high dividend yield.
In the industrials sector, an overweight position in construction and engineering firms and an underweight position in industrial conglomerates detracted from relative results. The most significant detractors included aerospace and defense contractor United Technologies and construction and engineering company Fluor. A weaker economy and reduced government spending on defense put downward pressure on United Technologies, while Fluor’s exposure to the oil and gas industry weighed on earnings.
Other noteworthy detractors in the portfolio included auto parts maker TRW Automotive, private education firm ITT Educational Services, and mining company Coeur d’Alene Mines.
A Look Ahead
As we move into the second half of 2012, the U.S. equity market is likely to remain volatile given the uncertainty regarding the economic outlook, the European debt situation, and the upcoming U.S. presidential election. Heightened levels of volatility often provide investment opportunities, and our disciplined, objective, and systematic investment strategy is designed to take advantage of these opportunities at the individual company level. We believe this approach is the most powerful way to capitalize on market inefficiencies that lead to the mispricing of individual stocks.
| JUNE 30, 2012 |
| Top Ten Holdings | % of net assets |
| Apple, Inc. | 3.7% |
| Exxon Mobil Corp. | 2.6% |
| International Business Machines Corp. | 2.5% |
| Chevron Corp. | 2.4% |
| Microsoft Corp. | 2.0% |
| Verizon Communications, Inc. | 1.8% |
| Google, Inc., Class A | 1.7% |
| JPMorgan Chase & Co. | 1.7% |
| Johnson & Johnson | 1.6% |
| Oracle Corp. | 1.6% |
| | |
| Top Five Industries | % of net assets |
| Oil, Gas and Consumable Fuels | 10.7% |
| Pharmaceuticals | 7.0% |
| Insurance | 6.3% |
| Computers and Peripherals | 4.9% |
| IT Services | 4.6% |
| | |
| Types of Investments in Portfolio | % of net assets |
| Domestic Common Stocks | 89.9% |
| Foreign Common Stocks* | 8.8% |
| Total Common Stocks | 98.7% |
| Temporary Cash Investments | 1.2% |
| Other Assets and Liabilities | 0.1% |
| Includes depositary shares, dual listed securities and foreign ordinary shares. |
Fund shareholders may incur two types of costs: (1) transaction costs, including sales charges (loads) on purchase payments and redemption/exchange fees; and (2) ongoing costs, including management fees; distribution and service (12b-1) fees; and other fund expenses. This example is intended to help you understand your ongoing costs (in dollars) of investing in your fund and to compare these costs with the ongoing cost of investing in other mutual funds.
The example is based on an investment of $1,000 made at the beginning of the period and held for the entire period from January 1, 2012 to June 30, 2012.
Actual Expenses
The table provides information about actual account values and actual expenses for each class. You may use the information, together with the amount you invested, to estimate the expenses that you paid over the period. First, identify the share class you own. Then simply divide your account value by $1,000 (for example, an $8,600 account value divided by $1,000 = 8.6), then multiply the result by the number under the heading “Expenses Paid During Period” to estimate the expenses you paid on your account during this period.
If you hold Investor Class shares of any American Century Investments fund, or Institutional Class shares of the American Century Diversified Bond Fund, in an American Century Investments account (i.e., not a financial intermediary or retirement plan account), American Century Investments may charge you a $12.50 semiannual account maintenance fee if the value of those shares is less than $10,000. We will redeem shares automatically in one of your accounts to pay the $12.50 fee. In determining your total eligible investment amount, we will include your investments in all personal accounts (including American Century Investments Brokerage accounts) registered under your Social Security number. Personal accounts include individual accounts, joint accounts, UGMA/UTMA accounts, personal trusts, Coverdell Education Savings Accounts and IRAs (including traditional, Roth, Rollover, SEP-, SARSEP- and SIMPLE-IRAs), and certain other retirement accounts. If you have only business, business retirement, employer-sponsored or American Century Investments Brokerage accounts, you are currently not subject to this fee. If you are subject to the Account Maintenance Fee, your account value could be reduced by the fee amount.
Hypothetical Example for Comparison Purposes
The table also provides information about hypothetical account values and hypothetical expenses based on the actual expense ratio of each class of your fund and an assumed rate of return of 5% per year before expenses, which is not the actual return of a fund’s share class. The hypothetical account values and expenses may not be used to estimate the actual ending account balance or expenses you paid for the period. You may use this information to compare the ongoing costs of investing in your fund and other funds. To do so, compare this 5% hypothetical example with the 5% hypothetical examples that appear in the shareholder reports of the other funds.
Please note that the expenses shown in the table are meant to highlight your ongoing costs only and do not reflect any transactional costs, such as sales charges (loads) or redemption/exchange fees. Therefore, the table is useful in comparing ongoing costs only, and will not help you determine the relative total costs of owning different funds. In addition, if these transactional costs were included, your costs would have been higher.
| | Beginning Account Value 1/1/12 | Ending Account Value 6/30/12 | Expenses Paid During Period(1) 1/1/12 - 6/30/12 | Annualized Expense Ratio(1) |
| Actual |
| Institutional Class | $1,000 | $1,093.00 | $2.50 | 0.48% |
| Hypothetical |
| Institutional Class | $1,000 | $1,022.48 | $2.41 | 0.48% |
| (1) | Expenses are equal to the class’s annualized expense ratio listed in the table above, multiplied by the average account value over the period, multiplied by 182, the number of days in the most recent fiscal half-year, divided by 366, to reflect the one-half year period. |
| | | | | | | |
| | | Shares | | | Value | |
| Common Stocks — 98.7% | |
| AEROSPACE AND DEFENSE — 2.5% | |
| Boeing Co. (The) | | | 11,737 | | | | $872,059 | |
| Northrop Grumman Corp. | | | 67,845 | | | | 4,327,833 | |
| Raytheon Co. | | | 53,114 | | | | 3,005,721 | |
| United Technologies Corp. | | | 79,071 | | | | 5,972,233 | |
| | | | | | | | 14,177,846 | |
| AIR FREIGHT AND LOGISTICS — 2.1% | |
| FedEx Corp. | | | 50,285 | | | | 4,606,609 | |
| United Parcel Service, Inc., Class B | | | 87,733 | | | | 6,909,851 | |
| | | | | | | | 11,516,460 | |
| BEVERAGES — 2.3% | |
| Coca-Cola Co. (The) | | | 52,606 | | | | 4,113,263 | |
Constellation Brands, Inc., Class A(1) | | | 178,429 | | | | 4,828,289 | |
Monster Beverage Corp.(1) | | | 40,160 | | | | 2,859,392 | |
| PepsiCo, Inc. | | | 18,562 | | | | 1,311,591 | |
| | | | | | | | 13,112,535 | |
| BIOTECHNOLOGY — 1.8% | |
| Amgen, Inc. | | | 91,184 | | | | 6,660,080 | |
Biogen Idec, Inc.(1) | | | 2,821 | | | | 407,296 | |
United Therapeutics Corp.(1) | | | 59,264 | | | | 2,926,456 | |
| | | | | | | | 9,993,832 | |
| CHEMICALS — 3.6% | |
| CF Industries Holdings, Inc. | | | 26,517 | | | | 5,137,404 | |
| Huntsman Corp. | | | 114,637 | | | | 1,483,403 | |
| LyondellBasell Industries NV, Class A | | | 90,956 | | | | 3,662,798 | |
| Monsanto Co. | | | 73,102 | | | | 6,051,383 | |
| NewMarket Corp. | | | 3,348 | | | | 725,177 | |
| PPG Industries, Inc. | | | 26,238 | | | | 2,784,376 | |
| | | | | | | | 19,844,541 | |
| COMMERCIAL BANKS — 3.3% | |
| Bank of Montreal | | | 67,125 | | | | 3,709,328 | |
| BB&T Corp. | | | 109,451 | | | | 3,376,563 | |
| U.S. Bancorp | | | 207,027 | | | | 6,657,988 | |
| Wells Fargo & Co. | | | 131,984 | | | | 4,413,545 | |
| | | | | | | | 18,157,424 | |
| COMMUNICATIONS EQUIPMENT — 0.5% | |
Brocade Communications Systems, Inc.(1) | | | 166,755 | | | | 822,102 | |
| Cisco Systems, Inc. | | | 42,399 | | | | 727,991 | |
| QUALCOMM, Inc. | | | 15,997 | | | | 890,713 | |
Research In Motion Ltd.(1) | | | 15,302 | | | | 113,082 | |
| | | | | | | | 2,553,888 | |
| COMPUTERS AND PERIPHERALS — 4.9% | |
Apple, Inc.(1) | | | 35,174 | | | | $20,541,616 | |
| Seagate Technology plc | | | 146,229 | | | | 3,616,243 | |
Western Digital Corp.(1) | | | 107,043 | | | | 3,262,671 | |
| | | | | | | | 27,420,530 | |
| CONSTRUCTION AND ENGINEERING — 1.3% | |
| Chicago Bridge & Iron Co. NV New York Shares | | | 96,427 | | | | 3,660,369 | |
| URS Corp. | | | 99,040 | | | | 3,454,515 | |
| | | | | | | | 7,114,884 | |
| CONSUMER FINANCE — 1.6% | |
| American Express Co. | | | 112,290 | | | | 6,536,401 | |
| Cash America International, Inc. | | | 50,525 | | | | 2,225,121 | |
| Discover Financial Services | | | 7,561 | | | | 261,459 | |
| | | | | | | | 9,022,981 | |
| DIVERSIFIED CONSUMER SERVICES — 0.7% | |
Apollo Group, Inc., Class A(1) | | | 1,596 | | | | 57,759 | |
Coinstar, Inc.(1) | | | 31,049 | | | | 2,131,824 | |
ITT Educational Services, Inc.(1) | | | 32,794 | | | | 1,992,236 | |
| | | | | | | | 4,181,819 | |
| DIVERSIFIED FINANCIAL SERVICES — 2.0% | |
| Bank of America Corp. | | | 190,224 | | | | 1,556,032 | |
| Citigroup, Inc. | | | 14,375 | | | | 394,019 | |
| JPMorgan Chase & Co. | | | 258,461 | | | | 9,234,812 | |
| | | | | | | | 11,184,863 | |
| DIVERSIFIED TELECOMMUNICATION SERVICES — 2.7% | |
| AT&T, Inc. | | | 146,691 | | | | 5,231,001 | |
| Verizon Communications, Inc. | | | 225,814 | | | | 10,035,174 | |
| | | | | | | | 15,266,175 | |
| ELECTRIC UTILITIES — 0.9% | |
| American Electric Power Co., Inc. | | | 82,874 | | | | 3,306,672 | |
| Cleco Corp. | | | 34,684 | | | | 1,450,832 | |
| | | | | | | | 4,757,504 | |
| ELECTRONIC EQUIPMENT, INSTRUMENTS AND COMPONENTS — 0.4% | |
Tech Data Corp.(1) | | | 42,306 | | | | 2,037,880 | |
| ENERGY EQUIPMENT AND SERVICES — 0.7% | |
Helix Energy Solutions Group, Inc.(1) | | | 204,459 | | | | 3,355,172 | |
| Schlumberger Ltd. | | | 8,394 | | | | 544,855 | |
| | | | | | | | 3,900,027 | |
| FOOD AND STAPLES RETAILING — 0.8% | |
| CVS Caremark Corp. | | | 37,193 | | | | $1,738,029 | |
| Kroger Co. (The) | | | 46,131 | | | | 1,069,778 | |
| SUPERVALU, Inc. | | | 32,568 | | | | 168,702 | |
| Wal-Mart Stores, Inc. | | | 24,167 | | | | 1,684,923 | |
| | | | | | | | 4,661,432 | |
| FOOD PRODUCTS — 3.4% | |
| Archer-Daniels-Midland Co. | | | 155,836 | | | | 4,600,279 | |
| Bunge Ltd. | | | 43,933 | | | | 2,756,356 | |
| Campbell Soup Co. | | | 112,508 | | | | 3,755,517 | |
| ConAgra Foods, Inc. | | | 162,985 | | | | 4,226,201 | |
| Tyson Foods, Inc., Class A | | | 201,350 | | | | 3,791,421 | |
| | | | | | | | 19,129,774 | |
| HEALTH CARE EQUIPMENT AND SUPPLIES — 0.7% | |
| Covidien plc | | | 24,745 | | | | 1,323,858 | |
| Medtronic, Inc. | | | 69,058 | | | | 2,674,616 | |
| | | | | | | | 3,998,474 | |
| HEALTH CARE PROVIDERS AND SERVICES — 3.0% | |
| Humana, Inc. | | | 52,599 | | | | 4,073,267 | |
| McKesson Corp. | | | 51,776 | | | | 4,854,000 | |
| UnitedHealth Group, Inc. | | | 114,039 | | | | 6,671,281 | |
| WellPoint, Inc. | | | 20,399 | | | | 1,301,252 | |
| | | | | | | | 16,899,800 | |
| HOTELS, RESTAURANTS AND LEISURE — 1.3% | |
| Brinker International, Inc. | | | 59,186 | | | | 1,886,258 | |
| McDonald’s Corp. | | | 10,025 | | | | 887,513 | |
| Yum! Brands, Inc. | | | 68,517 | | | | 4,413,865 | |
| | | | | | | | 7,187,636 | |
| HOUSEHOLD DURABLES — 0.4% | |
| Garmin Ltd. | | | 64,302 | | | | 2,462,124 | |
| HOUSEHOLD PRODUCTS — 1.0% | |
| Kimberly-Clark Corp. | | | 12,185 | | | | 1,020,737 | |
| Procter & Gamble Co. (The) | | | 70,691 | | | | 4,329,824 | |
| | | | | | | | 5,350,561 | |
| INDUSTRIAL CONGLOMERATES — 1.4% | |
| General Electric Co. | | | 253,918 | | | | 5,291,651 | |
| Tyco International Ltd. | | | 46,686 | | | | 2,467,355 | |
| | | | | | | | 7,759,006 | |
| INSURANCE — 6.3% | |
| ACE Ltd. | | | 39,834 | | | | 2,952,894 | |
| Allied World Assurance Co. Holdings AG | | | 55,385 | | | | 4,401,446 | |
| American Financial Group, Inc. | | | 14,675 | | | | 575,700 | |
| Assurant, Inc. | | | 40,571 | | | | 1,413,494 | |
Berkshire Hathaway, Inc., Class B(1) | | | 30,228 | | | | 2,518,899 | |
| Everest Re Group Ltd. | | | 36,473 | | | | 3,774,591 | |
| Loews Corp. | | | 116,057 | | | | 4,747,892 | |
| Marsh & McLennan Cos., Inc. | | | 141,677 | | | | 4,566,250 | |
| Principal Financial Group, Inc. | | | 153,614 | | | | 4,029,295 | |
| Protective Life Corp. | | | 17,477 | | | | 513,998 | |
| Prudential Financial, Inc. | | | 92,548 | | | | 4,482,100 | |
| Validus Holdings Ltd. | | | 39,167 | | | | 1,254,519 | |
| | | | | | | | 35,231,078 | |
INTERNET AND CATALOG RETAIL† | |
| Expedia, Inc. | | | 3,177 | | | | 152,718 | |
| INTERNET SOFTWARE AND SERVICES — 1.7% | |
Google, Inc., Class A(1) | | | 16,322 | | | | 9,467,903 | |
| IT SERVICES — 4.6% | |
| Accenture plc, Class A | | | 84,665 | | | | 5,087,520 | |
| International Business Machines Corp. | | | 72,067 | | | | 14,094,864 | |
| Visa, Inc., Class A | | | 54,900 | | | | 6,787,287 | |
| | | | | | | | 25,969,671 | |
| LIFE SCIENCES TOOLS AND SERVICES — 1.0% | |
| Agilent Technologies, Inc. | | | 101,041 | | | | 3,964,849 | |
Life Technologies Corp.(1) | | | 36,270 | | | | 1,631,787 | |
| | | | | | | | 5,596,636 | |
| MACHINERY — 1.9% | |
| Actuant Corp., Class A | | | 15,571 | | | | 422,908 | |
| Cummins, Inc. | | | 42,373 | | | | 4,106,368 | |
| Parker-Hannifin Corp. | | | 44,443 | | | | 3,416,778 | |
| Sauer-Danfoss, Inc. | | | 81,225 | | | | 2,837,189 | |
| | | | | | | | 10,783,243 | |
| MEDIA — 3.4% | |
| CBS Corp., Class B | | | 159,977 | | | | 5,244,046 | |
| Comcast Corp., Class A | | | 165,509 | | | | 5,291,323 | |
| DISH Network Corp., Class A | | | 130,505 | | | | 3,725,918 | |
| Regal Entertainment Group Class A | | | 282,772 | | | | 3,890,942 | |
| Viacom, Inc., Class B | | | 12,653 | | | | 594,944 | |
| | | | | | | | 18,747,173 | |
| METALS AND MINING — 1.2% | |
Coeur d’Alene Mines Corp.(1) | | | 166,652 | | | | 2,926,409 | |
| Southern Copper Corp. | | | 9,936 | | | | 313,084 | |
| Teck Resources Ltd. | | | 113,448 | | | | 3,510,081 | |
| | | | | | | | 6,749,574 | |
| MULTI-UTILITIES — 2.4% | |
| Ameren Corp. | | | 119,106 | | | | 3,994,815 | |
| Consolidated Edison, Inc. | | | 77,792 | | | | 4,837,885 | |
| Public Service Enterprise Group, Inc. | | | 148,628 | | | | 4,830,410 | |
| | | | | | | | 13,663,110 | |
| MULTILINE RETAIL — 1.4% | |
| Dillard’s, Inc., Class A | | | 53,804 | | | | $3,426,239 | |
| Macy’s, Inc. | | | 124,840 | | | | 4,288,254 | |
| | | | | | | | 7,714,493 | |
| OIL, GAS AND CONSUMABLE FUELS — 10.7% | |
| Apache Corp. | | | 31,117 | | | | 2,734,873 | |
| Chevron Corp. | | | 125,214 | | | | 13,210,077 | |
| ConocoPhillips | | | 113,140 | | | | 6,322,263 | |
| Energy XXI Bermuda Ltd. | | | 114,817 | | | | 3,592,624 | |
| Exxon Mobil Corp. | | | 172,316 | | | | 14,745,080 | |
| Marathon Petroleum Corp. | | | 116,131 | | | | 5,216,605 | |
| Occidental Petroleum Corp. | | | 77,686 | | | | 6,663,128 | |
Phillips 66(1) | | | 39,080 | | | | 1,299,019 | |
| Suncor Energy, Inc. | | | 124,227 | | | | 3,596,372 | |
| Western Refining, Inc. | | | 104,846 | | | | 2,334,920 | |
| | | | | | | | 59,714,961 | |
| PERSONAL PRODUCTS — 0.5% | |
| Nu Skin Enterprises, Inc., Class A | | | 62,951 | | | | 2,952,402 | |
| PHARMACEUTICALS — 7.0% | |
| Abbott Laboratories | | | 136,414 | | | | 8,794,611 | |
| Eli Lilly & Co. | | | 140,202 | | | | 6,016,068 | |
| Johnson & Johnson | | | 134,077 | | | | 9,058,242 | |
| Merck & Co., Inc. | | | 150,339 | | | | 6,276,653 | |
| Pfizer, Inc. | | | 384,974 | | | | 8,854,402 | |
| | | | | | | | 38,999,976 | |
| REAL ESTATE INVESTMENT TRUSTS (REITs) — 1.1% | |
| American Tower Corp. | | | 3,157 | | | | 220,706 | |
| Post Properties, Inc. | | | 4,047 | | | | 198,101 | |
| Simon Property Group, Inc. | | | 36,908 | | | | 5,745,099 | |
| | | | | | | | 6,163,906 | |
| ROAD AND RAIL — 1.1% | |
| Union Pacific Corp. | | | 49,485 | | | | 5,904,055 | |
| SEMICONDUCTORS AND SEMICONDUCTOR EQUIPMENT — 2.7% | |
Advanced Micro Devices, Inc.(1) | | | 633,220 | | | | 3,628,351 | |
| Applied Materials, Inc. | | | 142,245 | | | | 1,630,128 | |
| Intel Corp. | | | 220,493 | | | | 5,876,138 | |
| KLA-Tencor Corp. | | | 81,141 | | | | 3,996,194 | |
| | | | | | | | 15,130,811 | |
| SOFTWARE — 4.6% | |
| CA, Inc. | | | 55,709 | | | | 1,509,157 | |
Cadence Design Systems, Inc.(1) | | | 11,675 | | | | 128,308 | |
| Intuit, Inc. | | | 7,188 | | | | 426,608 | |
| Microsoft Corp. | | | 361,068 | | | | 11,045,070 | |
| Oracle Corp. | | | 304,630 | | | | 9,047,511 | |
Symantec Corp.(1) | | | 259,302 | | | | 3,788,402 | |
| | | | | | | | 25,945,056 | |
| SPECIALTY RETAIL — 3.8% | |
| Best Buy Co., Inc. | | | 197,851 | | | | 4,146,957 | |
| Foot Locker, Inc. | | | 122,950 | | | | 3,759,811 | |
| GameStop Corp., Class A | | | 18,723 | | | | 343,754 | |
| Home Depot, Inc. (The) | | | 150,727 | | | | 7,987,024 | |
O’Reilly Automotive, Inc.(1) | | | 8,866 | | | | 742,705 | |
| PetSmart, Inc. | | | 64,831 | | | | 4,420,177 | |
| | | | | | | | 21,400,428 | |
TOTAL COMMON STOCKS (Cost $475,150,993) | | | | 551,979,190 | |
| Temporary Cash Investments — 1.2% | |
Repurchase Agreement, Bank of America Merrill Lynch, (collateralized by various U.S. Treasury obligations, 1.50% - 4.00%, 2/15/15 - 6/30/16, valued at $2,156,672), in a joint trading account at 0.10%, dated 6/29/12, due 7/2/12 (Delivery value $2,115,598) | | | | 2,115,580 | |
Repurchase Agreement, Credit Suisse First Boston, Inc., (collateralized by various U.S. Treasury obligations, 3.75%, 8/15/41, valued at $2,163,376), in a joint trading account at 0.10%, dated 6/29/12, due 7/2/12 (Delivery value $2,115,598) | | | | 2,115,580 | |
Repurchase Agreement, Goldman Sachs & Co., (collateralized by various U.S. Treasury obligations, 4.375%, 5/15/40, valued at $538,751), in a joint trading account at 0.06%, dated 6/29/12, due 7/2/12 (Delivery value $528,898) | | | | 528,895 | |
| SSgA U.S. Government Money Market Fund | | | 1,861,855 | | | | 1,861,855 | |
TOTAL TEMPORARY CASH INVESTMENTS (Cost $6,621,910) | | | | 6,621,910 | |
TOTAL INVESTMENT SECURITIES — 99.9% (Cost $481,772,903) | | | | 558,601,100 | |
| OTHER ASSETS AND LIABILITIES — 0.1% | | | | 391,597 | |
| TOTAL NET ASSETS — 100.0% | | | | $558,992,697 | |
Notes to Schedule of Investments
| † | Category is less than 0.05% of total net assets. |
See Notes to Financial Statements.
Statement of Assets and Liabilities |
| JUNE 30, 2012 | |
| Assets | |
| Investment securities, at value (cost of $481,772,903) | | | $558,601,100 | |
| Cash | | | 28,936 | |
| Receivable for capital shares sold | | | 85,304 | |
| Dividends and interest receivable | | | 487,283 | |
| | | | 559,202,623 | |
| | | | | |
| Liabilities | |
| Accrued management fees | | | 209,926 | |
| | | | | |
| Net Assets | | | $558,992,697 | |
| | | | | |
| Institutional Class Capital Shares, $0.01 Par Value | |
| Shares authorized | | | 200,000,000 | |
| Shares outstanding | | | 54,789,253 | |
| | | | | |
| Net Asset Value Per Share | | | $10.20 | |
| | | | | |
| Net Assets Consist of: | |
| Capital (par value and paid-in surplus) | | | $473,934,683 | |
| Undistributed net investment income | | | 452,866 | |
| Undistributed net realized gain | | | 7,776,701 | |
| Net unrealized appreciation | | | 76,828,447 | |
| | | | $558,992,697 | |
See Notes to Financial Statements.
| YEAR ENDED JUNE 30, 2012 | |
| Investment Income (Loss) | |
| Income: | | | |
| Dividends (net of foreign taxes withheld of $24,416) | | | $11,549,811 | |
| Interest | | | 4,357 | |
| | | | 11,554,168 | |
| | | | | |
| Expenses: | | | | |
| Management fees | | | 2,473,840 | |
| Directors’ fees and expenses | | | 26,757 | |
| | | | 2,500,597 | |
| | | | | |
| Net investment income (loss) | | | 9,053,571 | |
| | | | | |
| Realized and Unrealized Gain (Loss) | |
| Net realized gain (loss) on: | | | | |
| Investment transactions | | | 15,071,289 | |
| Foreign currency transactions | | | (1,721 | ) |
| | | | 15,069,568 | |
| | | | | |
| Change in net unrealized appreciation (depreciation) on: | | | | |
| Investments | | | 426,296 | |
| Translation of assets and liabilities in foreign currencies | | | 250 | |
| | | | 426,546 | |
| | | | | |
| Net realized and unrealized gain (loss) | | | 15,496,114 | |
| | | | | |
| Net Increase (Decrease) in Net Assets Resulting from Operations | | | $24,549,685 | |
See Notes to Financial Statements.
Statement of Changes in Net Assets |
| YEARS ENDED JUNE 30, 2012 AND JUNE 30, 2011 | |
| Increase (Decrease) in Net Assets | June 30, 2012 | | | June 30, 2011 | |
| Operations | |
| Net investment income (loss) | | $9,053,571 | | | | $6,569,744 | |
| Net realized gain (loss) | | 15,069,568 | | | | 31,599,955 | |
| Change in net unrealized appreciation (depreciation) | | 426,546 | | | | 76,809,765 | |
| Net increase (decrease) in net assets resulting from operations | | 24,549,685 | | | | 114,979,464 | |
| | | | | | | | |
| Distributions to Shareholders | |
| From net investment income | | (8,917,757 | ) | | | (6,254,173 | ) |
| From net realized gains | | (17,931,780 | ) | | | — | |
| Decrease in net assets from distributions | | (26,849,537 | ) | | | (6,254,173 | ) |
| | | | | | | | |
| Capital Share Transactions | |
| Proceeds from shares sold | | 148,664,112 | | | | 130,602,354 | |
| Proceeds from reinvestment of distributions | | 26,849,537 | | | | 6,254,173 | |
| Payments for shares redeemed | | (164,422,725 | ) | | | (16,338,638 | ) |
| Net increase (decrease) in net assets from capital share transactions | | 11,090,924 | | | | 120,517,889 | |
| | | | | | | | |
| Net increase (decrease) in net assets | | 8,791,072 | | | | 229,243,180 | |
| | | | | | | | |
| Net Assets | |
| Beginning of period | | 550,201,625 | | | | 320,958,445 | |
| End of period | | $558,992,697 | | | | $550,201,625 | |
| | | | | | | | |
| Undistributed net investment income | | $452,866 | | | | $357,034 | |
| | | | | | | | |
| Transactions in Shares of the Fund | |
| Sold | | 15,241,901 | | | | 14,195,659 | |
| Issued in reinvestment of distributions | | 2,865,072 | | | | 656,770 | |
| Redeemed | | (16,916,462 | ) | | | (1,802,459 | ) |
| Net increase (decrease) in shares of the fund | | 1,190,511 | | | | 13,049,970 | |
See Notes to Financial Statements.
Notes to Financial Statements |
JUNE 30, 2012
1. Organization
American Century Quantitative Equity Funds, Inc. (the corporation) is registered under the Investment Company Act of 1940, as amended (the 1940 Act), as an open-end management investment company and is organized as a Maryland corporation. NT Equity Growth Fund (the fund) is one fund in a series issued by the corporation. The fund is diversified as defined under the 1940 Act. The fund’s investment objective is to seek long-term capital growth. The fund pursues its objective by investing primarily in large capitalization common stocks. The fund is not permitted to invest in any securities issued by companies assigned the Global Industry Classification Standard for the tobacco industry.
2. Significant Accounting Policies
The following is a summary of significant accounting policies consistently followed by the fund in preparation of its financial statements. The financial statements are prepared in conformity with accounting principles generally accepted in the United States of America, which may require management to make certain estimates and assumptions at the date of the financial statements. Actual results could differ from these estimates.
Investment Valuations — The fund determines the fair value of its investments and computes its net asset value per share as of the close of regular trading (usually 4 p.m. Eastern time) on the New York Stock Exchange (NYSE) on each day the NYSE is open.
Equity securities that are listed or traded on a domestic securities exchange are valued at the last reported sales price or at the official closing price as provided by the exchange. Equity securities traded on foreign securities exchanges are typically valued at the closing price on the exchange where primarily traded or as of the close of the NYSE, if that is earlier. If no last sales price is reported, or if local convention or regulation so provides, the mean of the latest bid and asked prices is used. Depending on local convention or regulation, securities traded over-the-counter are valued at the mean of the latest bid and asked prices, the last sales price, or the official closing price. In its determination of fair value, the fund may review several factors including: market information specific to a security; news developments in U.S. and foreign markets; the performance of particular U.S. and foreign securities, indices, comparable securities, American Depositary Receipts, Exchange-Traded Funds, and other relevant market indicators.
Debt securities maturing within 60 days at the time of purchase may be valued at cost, plus or minus any amortized discount or premium or at the evaluated mean as provided by an independent pricing service. Evaluated mean prices are commonly derived through utilization of market models, which may consider, among other factors, trade data, quotations from dealers and active market makers, relevant yield curve and spread data, related sector levels, creditworthiness, and other relevant market information on the same or comparable securities.
Investments in open-end management investment companies are valued at the reported net asset value per share. Repurchase agreements are valued at cost.
The value of investments initially expressed in foreign currencies is translated into U.S. dollars at prevailing exchange rates.
If the fund determines that the market price for a portfolio security is not readily available or the valuation methods mentioned above do not reflect a security’s fair value, such security is valued as determined in good faith by the Board of Directors or its designee, in accordance with procedures adopted by the Board of Directors. Circumstances that may cause the fund to use these procedures to value a security include, but are not limited to: a security has been declared in default; trading in a security has been halted during the trading day; there is a foreign market holiday and no trading occurred; or an event occurred between the close of a foreign exchange and the NYSE that may affect the value of a security.
Security Transactions — Security transactions are accounted for as of the trade date. Net realized gains and losses are determined on the identified cost basis, which is also used for federal income tax purposes.
Investment Income — Dividend income less foreign taxes withheld, if any, is recorded as of the ex-dividend date. Interest income is recorded on the accrual basis and includes accretion of discounts and amortization of premiums.
Foreign Currency Translations — All assets and liabilities initially expressed in foreign currencies are translated into U.S. dollars at prevailing exchange rates at period end. The fund may enter into spot foreign currency exchange contracts to facilitate transactions denominated in a foreign currency. Purchases and sales of investment securities, dividend and interest income, spot foreign currency exchange contracts, and expenses are translated at the rates of exchange prevailing on the respective dates of such transactions. Net realized and unrealized foreign currency exchange gains or losses related to investment securities are a component of net realized gain (loss) on investment transactions and change in net unrealized appreciation (depreciation) on investments, respectively.
Repurchase Agreements — The fund may enter into repurchase agreements with institutions that American Century Investment Management, Inc. (ACIM) (the investment advisor) has determined are creditworthy pursuant to criteria adopted by the Board of Directors. The fund requires that the collateral, represented by securities, received in a repurchase transaction be transferred to the custodian in a manner sufficient to enable the fund to obtain those securities in the event of a default under the repurchase agreement. ACIM monitors, on a daily basis, the securities transferred to ensure the value, including accrued interest, of the securities under each repurchase agreement is equal to or greater than amounts owed to the fund under each repurchase agreement.
Joint Trading Account — Pursuant to an Exemptive Order issued by the Securities and Exchange Commission, the fund, along with certain other funds in the American Century Investments family of funds, may transfer uninvested cash balances into a joint trading account. These balances are invested in one or more repurchase agreements that are collateralized by U.S. Treasury or Agency obligations.
Income Tax Status — It is the fund’s policy to distribute substantially all net investment income and net realized gains to shareholders and to otherwise qualify as a regulated investment company under provisions of the Internal Revenue Code. The fund is no longer subject to examination by tax authorities for years prior to 2009. At this time, management believes there are no uncertain tax positions which, based on their technical merit, would not be sustained upon examination and for which it is reasonably possible that the total amounts of unrecognized tax benefits will significantly change in the next twelve months. Accordingly, no provision has been made for federal or state income taxes.
Distributions to Shareholders — Distributions from net investment income, if any, are generally declared and paid quarterly. Distributions from net realized gains, if any, are generally declared and paid annually.
Indemnifications — Under the corporation’s organizational documents, its officers and directors are indemnified against certain liabilities arising out of the performance of their duties to the fund. In addition, in the normal course of business, the fund enters into contracts that provide general indemnifications. The maximum exposure under these arrangements is unknown as this would involve future claims that may be made against a fund. The risk of material loss from such claims is considered by management to be remote.
3. Fees and Transactions with Related Parties
Management Fees — The corporation has entered into a management agreement with ACIM, under which ACIM provides the fund with investment advisory and management services in exchange for a single, unified management fee (the fee). The agreement provides that all expenses of managing and operating the fund, except distribution and service fees, brokerage expenses, taxes, interest, fees and expenses of the independent directors (including legal counsel fees), and extraordinary expenses, will be paid by ACIM. The fee is computed and accrued daily based on the daily net assets of the fund and paid monthly in arrears. The fee consists of (1) an Investment Category Fee based on
the daily net assets of the fund and certain other accounts managed by the investment advisor that are in the same broad investment category as the fund and (2) a Complex Fee based on the assets of all the funds in the American Century Investments family of funds. The rates for the Investment Category Fee range from 0.3380% to 0.5200%. The rates for the Complex Fee range from 0.0500% to 0.1100%. The effective annual management fee for the year ended June 30, 2012 was 0.48%.
Related Parties — Certain officers and directors of the corporation are also officers and/or directors of American Century Companies, Inc., the parent of the corporation’s investment advisor, ACIM, the distributor of the corporation, American Century Investment Services, Inc., and the corporation’s transfer agent, American Century Services, LLC. The fund is wholly owned, in aggregate, by various funds in a series issued by American Century Asset Allocation Portfolios, Inc. (ACAAP). ACAAP does not invest in the fund for the purpose of exercising management or control.
4. Investment Transactions
Purchases and sales of investment securities, excluding short-term investments, for the year ended June 30, 2012 were $536,678,074 and $547,588,932, respectively.
5. Fair Value Measurements
The fund’s securities valuation process is based on several considerations and may use multiple inputs to determine the fair value of the positions held by the fund. In conformity with accounting principles generally accepted in the United States of America, the inputs used to determine a valuation are classified into three broad levels as follows:
| • | Level 1 valuation inputs consist of unadjusted quoted prices in an active market for identical securities; |
| • | Level 2 valuation inputs consist of direct or indirect observable market data (including quoted prices for similar securities, evaluations of subsequent market events, interest rates, prepayment speeds, credit risk, etc.); or |
| • | Level 3 valuation inputs consist of unobservable data (including a fund’s own assumptions). |
The level classification is based on the lowest level input that is significant to the fair valuation measurement. The valuation inputs are not necessarily an indication of the risks associated with investing in these securities or other financial instruments.
The following is a summary of the level classifications as of period end. The Schedule of Investments provides additional information on the fund’s portfolio holdings.
| | | | |
| | Level 1 | Level 2 | Level 3 |
| Investment Securities |
| Domestic Common Stocks | $502,793,986 | — | — |
| Foreign Common Stocks | 49,185,204 | — | — |
| Temporary Cash Investments | 1,861,855 | $4,760,055 | — |
| Total Value of Investment Securities | $553,841,045 | $4,760,055 | — |
6. Risk Factors
There are certain risks involved in investing in foreign securities. These risks include those resulting from future adverse political, social and economic developments, fluctuations in currency exchange rates, the possible imposition of exchange controls, and other foreign laws or restrictions.
The fund’s investment process may result in high portfolio turnover, which could mean high transaction costs, affecting both performance and capital gains tax liabilities to investors.
7. Federal Tax Information
The tax character of distributions paid during the years ended June 30, 2012 and June 30, 2011 were as follows:
| | 2012 | 2011 |
| Distributions Paid From | | |
| Ordinary income | $9,564,690 | $6,254,173 |
| Long-term capital gains | $17,284,847 | — |
The book-basis character of distributions made during the year from net investment income or net realized gains may differ from their ultimate characterization for federal income tax purposes. These differences reflect the differing character of certain income items and net realized gains and losses for financial statement and tax purposes, and may result in reclassification among certain capital accounts on the financial statements.
As of June 30, 2012, the federal tax cost of investments and the components of distributable earnings on a tax-basis were as follows:
| | | | |
| Federal tax cost of investments | | | $488,081,958 | |
| Gross tax appreciation of investments | | | $81,749,526 | |
| Gross tax depreciation of investments | | | (11,230,384 | ) |
| Net tax appreciation (depreciation) of investments | | | $70,519,142 | |
| Net tax appreciation (depreciation) on translation of assets and liabilities in foreign currencies | | | $249 | |
| Net tax appreciation (depreciation) | | | $70,519,391 | |
| Undistributed ordinary income | | | $452,866 | |
| Accumulated long-term gains | | | $14,085,757 | |
The difference between book-basis and tax-basis cost and unrealized appreciation (depreciation) is attributable primarily to the tax deferral of losses on wash sales.
| For a Share Outstanding Throughout the Years Ended June 30 (except as noted) |
| Per-Share Data | Ratios and Supplemental Data |
| | | Income From Investment Operations: | Distributions From: | | | Ratio to Average Net Assets of: | | |
| | Net Asset Value, Beginning of Period | Net Investment Income (Loss) | Net Realized and Unrealized Gain (Loss) | Total From Investment Operations | Net Investment Income | Net Realized Gains | Total Distributions | Net Asset Value, End of Period | Total Return(1) | Operating Expenses | Net Investment Income (Loss) | Portfolio Turnover Rate | Net Assets, End of Period (in thousands) |
| Institutional Class |
| 2012 | $10.27 | 0.17(2) | 0.35 | 0.52 | (0.18) | (0.41) | (0.59) | $10.20 | 5.65% | 0.48% | 1.75% | 104% | $558,993 |
| 2011 | $7.92 | 0.14(2) | 2.34 | 2.48 | (0.13) | — | (0.13) | $10.27 | 31.45% | 0.49% | 1.46% | 84% | $550,202 |
| 2010 | $7.06 | 0.11(2) | 0.85 | 0.96 | (0.10) | — | (0.10) | $7.92 | 13.53% | 0.49% | 1.31% | 69% | $320,958 |
| 2009 | $9.98 | 0.13(2) | (2.89) | (2.76) | (0.16) | — | (0.16) | $7.06 | (27.73)% | 0.50% | 1.82% | 109% | $191,046 |
| 2008 | $11.53 | 0.12 | (1.47) | (1.35) | (0.09) | (0.11) | (0.20) | $9.98 | (11.84)% | 0.47% | 1.20% | 99% | $112,417 |
Notes to Financial Highlights
| (1) | Total returns are calculated based on the net asset value of the last business day. Total returns for periods less than one year are not annualized. |
| (2) | Computed using average shares outstanding throughout the period. |
See Notes to Financial Statements.
Report of Independent Registered Public Accounting Firm |
To the Directors of the American Century Quantitative Equity Funds, Inc. and Shareholders of the NT Equity Growth Fund:
In our opinion, the accompanying statement of assets and liabilities, including the schedule of investments, and the related statements of operations and of changes in net assets and the financial highlights present fairly, in all material respects, the financial position of the NT Equity Growth Fund (one of the fourteen funds comprising the American Century Quantitative Equity Funds, Inc., hereafter referred to as the “Fund”) at June 30, 2012, the results of its operations for the year then ended, the changes in its net assets for each of the two years in the period then ended and the financial highlights for each of the five years in the period then ended, in conformity with accounting principles generally accepted in the United States of America. These financial statements and financial highlights (hereafter referred to as “financial statements”) are the responsibility of the Fund’s management; our responsibility is to express an opinion on these financial statements based on our audits. We conducted our audits of these financial statements in accordance with the standards of the Public Company Accounting Oversight Board (United States). Those standards require that we plan and perform the audit to obtain reasonable assurance about whether the financial statements are free of material misstatement. An audit includes examining, on a test basis, evidence supporting the amounts and disclosures in the financial statements, assessing the accounting principles used and significant estimates made by management, and evaluating the overall financial statement presentation. We believe that our audits, which included confirmation of securities at June 30, 2012 by correspondence with the custodian and brokers, provide a reasonable basis for our opinion.
PricewaterhouseCoopers LLP
Kansas City, Missouri
August 21, 2012
Board of Directors
The individuals listed below serve as directors of the funds. Each director will continue to serve in this capacity until death, retirement, resignation or removal from office. The mandatory retirement age for directors who are not “interested persons,” as that term is defined in the Investment Company Act (independent directors), is 73. However, the mandatory retirement age may be extended for a period not to exceed two years with the approval of the remaining independent directors.
Mr. Thomas is the only director who is an “interested person” because he currently serves as President and Chief Executive Officer of American Century Companies, Inc. (ACC), the parent company of American Century Investment Management, Inc. (ACIM or the advisor).
The other directors (more than three-fourths of the total number) are independent; that is, they have never been employees, directors or officers of, and have no financial interest in, ACC or any of its wholly owned, direct or indirect, subsidiaries, including ACIM, American Century Investment Services, Inc. (ACIS) and American Century Services, LLC (ACS). The directors serve in this capacity for eight (in the case of Mr. Thomas, 15) registered investment companies in the American Century Investments family of funds.
The following table presents additional information about the directors. The mailing address for each director other than Mr. Thomas is 1665 Charleston Road, Mountain View, California 94043. The mailing address for Mr. Thomas is 4500 Main Street, Kansas City, Missouri 64111.
| | | | | | | | |
Name (Year of Birth) | Position(s) Held with Funds | Length of Time Served | | Principal Occupation(s) During Past 5 Years | | Number of American Century Portfolios Overseen by Director | Other Directorships Held During Past 5 Years |
| Independent Directors |
Tanya S. Beder (1955) | Director | Since 2011 | | Chairman, SBCC Group Inc. (investment advisory services)(2006 to present); Fellow in Practice, International Center for Finance, Yale University School of Management (1985 to present) | | 42 | CYS Investments, Inc. (specialty finance company) |
Jeremy I. Bulow (1954) | Director | Since 2011 | | Professor of Economics, Stanford University, Graduate School of Business (1979 to present) | | 42 | None |
Ronald J. Gilson (1946) | Director and Chairman of the Board | Since 1995 | | Charles J. Meyers Professor of Law and Business, Stanford Law School (1979 to present); Marc and Eva Stern Professor of Law and Business, Columbia University School of Law (1992 to present) | | 42 | None |
| | | | | | | | |
Name (Year of Birth) | Position(s) Held with Funds | Length of Time Served | | Principal Occupation(s) During Past 5 Years | | Number of American Century Portfolios Overseen by Director | Other Directorships Held During Past 5 Years |
| Independent Directors |
Frederick L. A. Grauer (1946) | Director | Since 2008 | | Senior Advisor, BlackRock, Inc. (investment management firm) (2010 to 2011); Senior Advisor, Barclays Global Investors (investment management firm) (2003 to 2009) | | 42 | None |
Peter F. Pervere (1947) | Director | Since 2007 | | Retired | | 42 | Intraware, Inc. (2003 to 2009) |
Myron S. Scholes (1941) | Director | Since 1980 | | Chairman, Platinum Grove Asset Management, L.P. (asset manager) (1999 to 2009); Frank E. Buck Professor of Finance-Emeritus, Stanford Graduate School of Business (1996 to present) | | 42 | Dimensional Fund Advisors (investment advisor); CME Group, Inc. (futures and options exchange) |
John B. Shoven (1947) | Director | Since 2002 | | Professor of Economics, Stanford University (1973 to present) | | 42 | Cadence Design Systems; Exponent; Financial Engines |
| |
| Interested Director |
Jonathan S. Thomas (1963) | Director and President | Since 2007 | | President and Chief Executive Officer, ACC (March 2007 to present); Chief Administrative Officer, ACC (February 2006 to February 2007); Executive Vice President, ACC (November 2005 to February 2007). Also serves as Chief Executive Officer and Manager, ACS; Executive Vice President, ACIM; Director, ACC, ACIM and other ACC subsidiaries | | 108 | None |
Officers
The following table presents certain information about the executive officers of the funds. Each officer serves as an officer for each of the 15 investment companies in the American Century family of funds, unless otherwise noted. No officer is compensated for his or her service as an officer of the funds. The listed officers are interested persons of the funds and are appointed or re-appointed on an annual basis. The mailing address for each of the officers listed below is 4500 Main Street, Kansas City, Missouri 64111.
| | | | |
Name (Year of Birth) | Offices with the Funds | | Principal Occupation(s) During the Past Five Years |
Jonathan S. Thomas (1963) | Director and President since 2007 | | President and Chief Executive Officer, ACC (March 2007 to present); Chief Administrative Officer, ACC (February 2006 to February 2007); Executive Vice President, ACC (November 2005 to February 2007). Also serves as Chief Executive Officer and Manager, ACS; Executive Vice President, ACIM; Director, ACC, ACIM and other ACC subsidiaries |
Barry Fink (1955) | Executive Vice President since 2007 | | Chief Operating Officer and Executive Vice President, ACC (September 2007 to present); President, ACS (October 2007 to present); Managing Director, Morgan Stanley (2000 to 2007). Also serves as Manager, ACS and Director, ACC and certain ACC subsidiaries |
Maryanne L. Roepke (1956) | Chief Compliance Officer since 2006 and Senior Vice President since 2000 | | Chief Compliance Officer, American Century funds, ACIM and ACS (August 2006 to present). Also serves as Senior Vice President, ACS |
Charles A. Etherington (1957) | General Counsel since 2007 and Senior Vice President since 2006 | | Attorney, ACC (February 1994 to present); Vice President, ACC (November 2005 to present), General Counsel, ACC (March 2007 to present); Also serves as General Counsel, ACIM, ACS, ACIS and other ACC subsidiaries; and Senior Vice President, ACIM and ACS |
C. Jean Wade (1964) | Vice President, Treasurer and Chief Financial Officer since 2012 | | Vice President, ACS (February 2000 to present) |
Robert J. Leach (1966) | Vice President since 2006 and Assistant Treasurer since 2012 | | Vice President, ACS (February 2000 to present) |
David H. Reinmiller (1963) | Vice President since 2001 | | Attorney, ACC (January 1994 to present); Associate General Counsel, ACC (January 2001 to present); Also serves as Vice President, ACIM and ACS |
Ward D. Stauffer (1960) | Secretary since 2005 | | Attorney, ACC (June 2003 to present) |
The Statement of Additional Information has additional information about the fund’s directors and is available without charge, upon request, by calling 1-800-345-2021.
Approval of Management Agreement |
At a meeting held on June 14, 2012, the Fund’s Board of Directors/Trustees unanimously approved the renewal of the management agreement pursuant to which American Century Investment Management, Inc. (the “Advisor”) acts as the investment advisor for the Fund. Under Section 15(c) of the Investment Company Act, contracts for investment advisory services are required to be reviewed, evaluated, and approved by a majority of a fund’s independent directors/trustees (the “Directors”) each year.
As a part of the approval process, the Board requested and reviewed extensive data and information compiled by the Advisor and certain independent providers of evaluation data concerning the Fund and the services provided to the Fund by the Advisor. This review was in addition to the oversight and evaluation undertaken by the Board and its committees on a continuous basis throughout the year and included, but was not limited to the following:
| • | the nature, extent, and quality of investment management, shareholder services, and other services provided by the Advisor to the Fund; |
| • | the wide range of other programs and services the Advisor provides to the Fund and its shareholders on a routine and non-routine basis; |
| • | the investment performance of the fund, including data comparing the Fund’s performance to appropriate benchmarks and/or a peer group of other mutual funds with similar investment objectives and strategies; |
| • | data comparing the cost of owning the Fund to the cost of owning similar funds; |
| • | the Advisor’s compliance policies, procedures, and regulatory experience; |
| • | financial data showing the cost of services provided to the Fund, the profitability of the Fund to the Advisor, and the overall profitability of the Advisor; |
| • | data comparing services provided and charges to other investment management clients of the Advisor; and |
| • | consideration of collateral benefits derived by the Advisor from the management of the Fund and any potential economies of scale relating thereto. |
In keeping with its practice, the Board held two in-person meetings to review and discuss the information provided. The Board also had the benefit of the advice of its independent counsel throughout the period.
Factors Considered
The Directors considered all of the information provided by the Advisor, the independent data providers, and the Board’s independent counsel, and evaluated such information for the Fund. In connection with their review, the Directors did not identify any single factor as being all-important or controlling, and each Director may have attributed different levels of importance to different factors. In deciding to renew the management agreement, the Board based its decision on a number of factors, including the following:
Nature, Extent and Quality of Services - Generally. Under the management agreement, the Advisor is responsible for providing or arranging for all services necessary for the operation of the Fund. The Board noted that under the management agreement, the Advisor provides or arranges at its own expense a wide variety of services including:
| • | constructing and designing the Fund |
| • | portfolio research and security selection |
| • | initial capitalization/funding |
| • | daily valuation of the Fund’s portfolio |
| • | shareholder servicing and transfer agency, including shareholder confirmations, recordkeeping, and communications |
| • | regulatory and portfolio compliance |
| • | marketing and distribution |
The Board noted that many of these services have expanded over time both in terms of quantity and complexity in response to shareholder demands, competition in the industry, changing distribution channels, and the changing regulatory environment.
Investment Management Services. The nature of the investment management services provided to the Fund is quite complex and allows Fund shareholders access to professional money management, instant diversification of their investments within an asset class, the opportunity to easily diversify among asset classes by investing in or exchanging among various American Century Investments funds, and liquidity. In evaluating investment performance, the Board expects the Advisor to manage the Fund in accordance with its investment objectives and approved strategies. Further, the Directors recognize that the Advisor has an obligation to seek the best execution of fund trades. In providing these services, the Advisor utilizes teams of investment professionals (portfolio managers, analysts, research assistants, and securities traders) who require extensive information technology, research, training, compliance and other systems to conduct their business. The Board, directly and through its Portfolio Committee, regularly reviews investment performance information for the Fund, together with comparative information for appropriate benchmarks and/or peer groups of similarly-managed funds, over different time horizons. The Directors also review
detailed performance information during the management agreement approval process. If performance concerns are identified, the Fund receives special reviews until performance improves, during which the Board discusses with the Advisor the reasons for such results (e.g., market conditions, security selection) and any efforts being undertaken to improve performance. The Board found the investment management services provided by the Advisor to the Fund to meet or exceed industry standards. More detailed information about the Fund’s performance can be found in the Performance and Portfolio Commentary sections of this report.
Shareholder and Other Services. Under the management agreement, the Advisor provides the Fund with a comprehensive package of transfer agency, shareholder, and other services. The Board, directly and through various committees of the Board, regularly reviews reports and evaluations of such services at its regular meetings. These reports include, but are not limited to, information regarding the operational efficiency and accuracy of the shareholder and transfer agency services provided, staffing levels, shareholder satisfaction (as measured by external as well as internal sources), technology support, new products and services offered to Fund shareholders, securities trading activities, portfolio valuation services, auditing services, and legal and operational compliance activities. Certain aspects of shareholder and transfer agency service level efficiency and the quality of securities trading activities are measured by independent third party providers and are presented in comparison to other fund groups not managed by the Advisor. The Board found the services provided by the Advisor to the Fund under the management agreement to be competitive and of high quality.
Costs of Services and Profitability. The Advisor provides detailed information concerning its cost of providing various services to the Fund, its profitability in managing the Fund, its overall profitability, and its financial condition. The Directors have reviewed with the Advisor the methodology used to prepare this financial information. The financial information regarding the Advisor is considered in evaluating the Advisor’s financial condition, ability to continue to provide services under the management agreement, and the reasonableness of the current management fee. The Board concluded that the Advisor’s profits were reasonable in light of the services provided to the Fund.
Ethics. The Board generally considers the Advisor’s commitment to providing quality services to shareholders and to conducting its business ethically. They noted that the Advisor’s practices generally meet or exceed industry best practices.
Economies of Scale. The Board also reviewed information provided by the Advisor regarding the possible existence of economies of scale in connection with the management of the Fund. The Board concluded that economies of scale are difficult to measure and predict with precision, especially on a fund-by-fund basis. The Board concluded that the Advisor is appropriately sharing economies of scale through its competitive fee structure, offering competitive fees from fund inception, and through reinvestment in its business to provide shareholders additional content and services.
Comparison to Other Funds’ Fees. The management agreement provides that the Fund pay the Advisor a single, all-inclusive (or unified) management fee for providing all services necessary for the management and operation of the Fund, other than brokerage expenses, taxes, interest, extraordinary expenses, and the fees and expenses of the Fund’s independent directors (including their independent legal counsel) and expenses incurred in connection with the provision of shareholder services and distribution services under a plan adopted pursuant to Rule 12b-1 under the 1940 Act. Under the unified fee structure, the Advisor is responsible for providing all investment advisory, custody, audit, administrative, compliance, recordkeeping, marketing and shareholder services, or arranging and supervising third parties to provide such services. By contrast, most other funds are charged a variety of fees, including an investment advisory fee, a transfer agency fee, an administrative fee, distribution charges and other expenses. Other than their investment advisory fees and any applicable Rule 12b-1 distribution fees, all other components of the total fees charged by these other funds may be increased without shareholder approval. The Board believes the unified fee structure is a benefit to Fund shareholders because it clearly discloses to shareholders the cost of owning Fund shares, and, since the unified fee cannot be increased without a vote of Fund shareholders, it shifts to the Advisor the risk of increased costs of operating the Fund and provides a direct incentive to minimize administrative inefficiencies. Part of the Board’s analysis of fee levels involves reviewing certain evaluative data compiled by an independent provider and comparing the Fund’s unified fee to the total expense ratio of other funds in the Fund’s peer group. The Board concluded that the management fee paid by the Fund to the Advisor under the management agreement is reasonable in light of the services provided to the Fund.
Comparison to Fees and Services Provided to Other Clients of the Advisor. The Board also requested and received information from the Advisor concerning the nature of the services, fees, costs and profitability of its advisory services to advisory clients other than the Fund. They observed that these varying types of client accounts require different services and involve different regulatory and entrepreneurial risks than the management of the Fund. The Board analyzed this information and concluded that the fees charged and services provided to the Fund were reasonable by comparison.
Collateral or “Fall-Out” Benefits Derived by the Advisor. The Board considered the existence of collateral benefits the Advisor may receive as a result of its relationship with the Fund. They concluded that the Advisor’s primary business is managing mutual funds and it generally does not use fund or shareholder information to generate profits in other lines of business, and therefore does not derive any significant collateral benefits from them. The Board noted that the Advisor receives proprietary research from broker-dealers that execute fund portfolio transactions and concluded that this research is likely to benefit Fund shareholders. The Board also determined that the Advisor is able to provide investment management services to certain clients other than the Fund, at least in part, due to its existing infrastructure built to serve the fund complex. The Board concluded, however, that the assets of those other clients are not material to the analysis and, where applicable, may be included with the assets of the Fund to determine breakpoints in the management fee schedule.
Existing Relationship. The Board also considered whether there was any reason for not continuing the existing arrangement with the Advisor. In this regard, the Board was mindful of the potential disruptions of the Fund’s operations and various risks, uncertainties, and other effects that could occur as a result of a decision not to continue such relationship. In particular, the Board recognized that most shareholders have invested in the Fund on the strength of the Advisor’s industry standing and reputation and in the expectation that the Advisor will have a continuing role in providing advisory services to the Fund.
Conclusion of the Directors. As a result of this process, the Board, including all of the independent directors and assisted by the advice of independent legal counsel, taking into account all of the factors discussed above and the information provided by the Advisor and others, concluded that the management agreement between the Fund and the Advisor is fair and reasonable in light of the services provided and should be renewed.
Retirement Account Information
As required by law, distributions you receive from certain IRAs, or 403(b), 457 and qualified plans are subject to federal income tax withholding, unless you elect not to have withholding apply. Tax will be withheld on the total amount withdrawn even though you may be receiving amounts that are not subject to withholding, such as nondeductible contributions. In such case, excess amounts of withholding could occur. You may adjust your withholding election so that a greater or lesser amount will be withheld.
If you don’t want us to withhold on this amount, you must notify us to not withhold the federal income tax. You may notify us in writing or in certain situations by telephone or through other electronic means. You have the right to revoke your withholding election at any time and any election you make may remain in effect until revoked by filing a new election.
Remember, even if you elect not to have income tax withheld, you are liable for paying income tax on the taxable portion of your withdrawal. If you elect not to have income tax withheld or you don’t have enough income tax withheld, you may be responsible for payment of estimated tax. You may incur penalties under the estimated tax rules if your withholding and estimated tax payments are not sufficient. You can reduce or defer the income tax on a distribution by directly or indirectly rolling such distribution over to another IRA or eligible plan. You should consult your tax advisor for additional information.
State tax will be withheld if, at the time of your distribution, your address is within one of the mandatory withholding states and you have federal income tax withheld. State taxes will be withheld from your distribution in accordance with the respective state rules.
Proxy Voting Guidelines
American Century Investment Management, Inc., the fund’s investment advisor, is responsible for exercising the voting rights associated with the securities purchased and/or held by the fund. A description of the policies and procedures the advisor uses in fulfilling this responsibility is available without charge, upon request, by calling 1-800-345-2021. It is also available on American Century Investments’ website at americancentury.com and on the Securities and Exchange Commission’s website at sec.gov. Information regarding how the investment advisor voted proxies relating to portfolio securities during the most recent 12-month period ended June 30 is available on the “About Us” page at americancentury.com. It is also available at sec.gov.
Quarterly Portfolio Disclosure
The fund files its complete schedule of portfolio holdings with the Securities and Exchange Commission (SEC) for the first and third quarters of each fiscal year on Form N-Q. The fund’s Forms N-Q are available on the SEC’s website at sec.gov, and may be reviewed and copied at the SEC’s Public Reference Room in Washington, DC. Information on the operation of the Public Reference Room may be obtained by calling 1-800-SEC-0330. The fund also makes its complete schedule of portfolio holdings for the most recent quarter of its fiscal year available on its website at americancentury.com and, upon request, by calling 1-800-345-2021.
Other Tax Information
The following information is provided pursuant to provisions of the Internal Revenue Code.
The fund hereby designates up to the maximum amount allowable as qualified dividend income for the fiscal year ended June 30, 2012.
For corporate taxpayers, the fund hereby designates $9,564,690, or up to the maximum amount allowable, of ordinary income distributions paid during the fiscal year ended June 30, 2012 as qualified for the corporate dividends received deduction.
The fund hereby designates $17,284,847, or up to the maximum amount allowable, as long-term capital gain distributions for the fiscal year ended June 30, 2012.
The fund hereby designates $645,286 as qualified short-term capital gain distributions for purposes of Internal Revenue Code Section 871.
| Contact Us | americancentury.com |
| Automated Information Line | 1-800-345-8765 |
| Investor Services Representative | 1-800-345-2021 or 816-531-5575 |
| Investors Using Advisors | 1-800-378-9878 |
| Business, Not-For-Profit, Employer-Sponsored Retirement Plans | 1-800-345-3533 |
| Banks and Trust Companies, Broker-Dealers, Financial Professionals, Insurance Companies | 1-800-345-6488 |
| Telecommunications Device for the Deaf | 1-800-634-4113 |
American Century Quantitative Equity Funds, Inc.
Investment Advisor:
American Century Investment Management, Inc.
Kansas City, Missouri
This report and the statements it contains are submitted for the general information of our shareholders. The report is not authorized for distribution to prospective investors unless preceded or accompanied by an effective prospectus.
©2012 American Century Proprietary Holdings, Inc. All rights reserved.
CL-ANN-75846 1208
ANNUAL REPORT JUNE 30, 2012
| President’s Letter | 2 |
| Market Perspective | 3 |
| Performance | 4 |
| Portfolio Commentary | 6 |
| Fund Characteristics | 8 |
| Shareholder Fee Example | 9 |
| Schedule of Investments | 11 |
| Statement of Assets and Liabilities | 18 |
| Statement of Operations | 19 |
| Statement of Changes in Net Assets | 20 |
| Notes to Financial Statements | 21 |
| Financial Highlights | 27 |
| Report of Independent Registered Public Accounting Firm | 29 |
| Management | 30 |
| Approval of Management Agreement | 33 |
| Additional Information | 38 |
Any opinions expressed in this report reflect those of the author as of the date of the report, and do not necessarily represent the opinions of American Century Investments® or any other person in the American Century Investments organization. Any such opinions are subject to change at any time based upon market or other conditions and American Century Investments disclaims any responsibility to update such opinions. These opinions may not be relied upon as investment advice and, because investment decisions made by American Century Investments funds are based on numerous factors, may not be relied upon as an indication of trading intent on behalf of any American Century Investments fund. Security examples are used for representational purposes only and are not intended as recommendations to purchase or sell securities. Performance information for comparative indices and securities is provided to American Century Investments by third party vendors. To the best of American Century Investments’ knowledge, such information is accurate at the time of printing.
Dear Investor:
Thank you for reviewing this annual report for the period ended June 30, 2012. Our report offers investment performance and portfolio information, presented with the expert perspective of our portfolio management team.
This report remains one of our most important vehicles for conveying information about fund returns, as well as market factors and strategies that affected fund performance. For additional, updated information, we encourage you to visit our website, americancentury.com. Click on the “Fund Performance” and “Insights & News” headings at the top of our Individual Investors site.
Flight to Quality as Economic and Financial Uncertainties Resurfaced
During the second half of 2011 and the first half of 2012, the global economy and financial markets struggled to move beyond the lingering aftereffects of the 2008 Financial Crisis and Great Recession. Global economic fundamentals have improved since 2008, but weakened since 2010, with increased uncertainty surrounding near-term economic growth levels in major developed economies such as the U.S., Japan, and Europe. There were also questions about near-term growth levels in influential emerging economies such as China.
These near-term uncertainties manifested themselves in asset returns for the 12 months ended June 30, 2012. Assets perceived to be “safe-haven” investments rallied—the 30-year U.S. Treasury bond posted a 39% total return. At the other end of the spectrum, international stock returns for U.S. investors were undermined by a combination of risk-averse investing attitudes, weakening global economic growth, and a stronger U.S. dollar versus the euro and currencies of other struggling economies. Commodity prices also plunged during the period.
Unfortunately, the instability that triggered much of this flight-to-quality trading remains largely in place, and the coming months may bring additional uncertainties about the U.S. presidential election and what might happen when various U.S. tax cuts and other stimulative measures expire in 2013 (the so-called “Fiscal Cliff”). In this uncertain, unstable environment, we continue to believe in a disciplined, diversified, long-term investment approach, using both stocks and bonds, as appropriate. We appreciate your continued trust in us during these unsettled times.
Sincerely,
Jonathan Thomas
President and Chief Executive Officer
American Century Investments
By Scott Wittman, Chief Investment Officer,
Quantitative Equity and Asset Allocation
U.S. Stocks Mixed but Generally Higher
The U.S. stock market faced significant volatility during the 12 months ended June 30, 2012, but ultimately posted positive overall returns. As the reporting period began, stocks were in the midst of an accelerating market decline as evidence of a slowdown in U.S. economic activity and a worsening sovereign debt crisis in Europe put downward pressure on the equity market.
In early October, however, the equity market bottomed and reversed course, enjoying a substantial rebound through the fourth quarter of 2011 and first quarter of 2012. Investors grew more optimistic as signs of improving economic activity quashed recession fears; in particular, job growth consistently exceeded expectations, driving the unemployment rate down to its lowest level in more than three years. Another positive factor was better news out of Europe as the European Central Bank provided long-term financing to the debt markets and support for the Continent’s banking sector.
The final three months of the period brought another reversal as the headwinds facing the equity market at the start of the period returned to the forefront. Evidence of slowing economic activity in the U.S. and adverse developments in Europe—including political turmoil in Greece and troubled banks in Spain—weighed on investor confidence, sending stocks down sharply.
Large-Cap Stocks Outperformed
For the 12-month period, the broad equity indices (as represented by the S&P 500 Index and Russell 3000 Index) rose by 4–5%. As the table below illustrates, however, there was a divergence in returns as large-cap stocks advanced while mid- and small-cap issues declined modestly. Growth and value stocks were mixed—growth issues outperformed among large-cap stocks, while value shares held up better in the mid- and small-cap segments of the market.
From a sector perspective, the defensive sectors of the market fared best. Utilities, consumer staples, and telecommunication services stocks all generated double-digit gains for the reporting period. On the downside, the commodity-driven energy and materials sectors fell the most during the period, reflecting a broad decline in commodity prices.
| U.S. Stock Index Returns |
| For the 12 months ended June 30, 2012 |
| Russell 1000 Index (Large-Cap) | 4.37% | | Russell 2000 Index (Small-Cap) | -2.08% |
| Russell 1000 Growth Index | 5.76% | | Russell 2000 Growth Index | -2.71% |
| Russell 1000 Value Index | 3.01% | | Russell 2000 Value Index | -1.44% |
| Russell Midcap Index | -1.65% | | |
| Russell Midcap Growth Index | -2.99% | | | |
| Russell Midcap Value Index | -0.37% | | | |
| Total Returns as of June 30, 2012 |
| | | | Average Annual Returns | |
| | Ticker Symbol | 1 year | 5 years | 10 years | Since Inception | Inception Date |
| Investor Class | ASQIX | -1.37% | -2.84% | 6.35% | 6.90% | 7/31/98 |
| S&P SmallCap 600 Index | — | 1.43% | 1.83% | 7.91% | 7.92% | — |
Russell 2000 Index(1) | — | -2.08% | 0.54% | 7.00% | 6.11% | — |
| Institutional Class | ASCQX | -1.20% | -2.65% | 6.55% | 8.14% | 10/1/99 |
A Class(2) No sales charge* With sales charge* | ASQAX | -1.64% -7.28% | -3.10% -4.24% | 6.09% 5.47% | 5.76% 5.23% | 9/7/00 |
| C Class | ASQCX | -2.30% | — | — | 10.50% | 3/1/10 |
| R Class | ASCRX | -1.84% | -3.33% | — | 5.19% | 8/29/03 |
| * | Sales charges include initial sales charges and contingent deferred sales charges (CDSCs), as applicable. A Class shares have a 5.75% maximum initial sales charge and may be subject to a maximum CDSC of 1.00%. C Class shares redeemed within 12 months of purchase are subject to a maximum CDSC of 1.00%. The SEC requires that mutual funds provide performance information net of maximum sales charges in all cases where charges could be applied. |
| (1) | Effective July 1, 2012, the fund’s benchmark will change from the S&P SmallCap 600 Index to the Russell 2000 Index. The fund’s investment advisor believes this index better represents the fund’s portfolio holdings. |
| (2) | Prior to March 1, 2010, the A Class was referred to as the Advisor Class and did not have a front-end sales charge. Performance prior to that date has been adjusted to reflect this charge. |
Data presented reflect past performance. Past performance is no guarantee of future results. Current performance may be higher or lower than the performance shown. Investment return and principal value will fluctuate, and redemption value may be more or less than original cost. To obtain performance data current to the most recent month end, please call 1-800-345-2021 or visit americancentury.com. Historically, small company stocks have been more volatile than the stocks of larger, more established companies.
Unless otherwise indicated, performance reflects Investor Class shares; performance for other share classes will vary due to differences in fee structure. For information about other share classes available, please consult the prospectus. Data assumes reinvestment of dividends and capital gains, and none of the charts reflect the deduction of taxes that a shareholder would pay on fund distributions or the redemption of fund shares. Returns for the indices are provided for comparison. The fund’s total returns include operating expenses (such as transaction costs and management fees) that reduce returns, while the total returns of the indices do not.
| Growth of $10,000 Over 10 Years |
| $10,000 investment made June 30, 2002 |
| Total Annual Fund Operating Expenses |
| Investor Class | Institutional Class | A Class | C Class | R Class |
| 0.90% | 0.70% | 1.15% | 1.90% | 1.40% |
The total annual fund operating expenses shown is as stated in the fund’s prospectus current as of the date of this report. The prospectus may vary from the expense ratio shown elsewhere in this report because it is based on a different time period, includes acquired fund fees and expenses, and, if applicable, does not include fee waivers or expense reimbursements.
Data presented reflect past performance. Past performance is no guarantee of future results. Current performance may be higher or lower than the performance shown. Investment return and principal value will fluctuate, and redemption value may be more or less than original cost. To obtain performance data current to the most recent month end, please call 1-800-345-2021 or visit americancentury.com. Historically, small company stocks have been more volatile than the stocks of larger, more established companies.
Unless otherwise indicated, performance reflects Investor Class shares; performance for other share classes will vary due to differences in fee structure. For information about other share classes available, please consult the prospectus. Data assumes reinvestment of dividends and capital gains, and none of the charts reflect the deduction of taxes that a shareholder would pay on fund distributions or the redemption of fund shares. Returns for the indices are provided for comparison. The fund’s total returns include operating expenses (such as transaction costs and management fees) that reduce returns, while the total returns of the indices do not.
Portfolio Managers: Brian Garbe and Tal Sansani
Performance Summary
Small Company returned –1.37%* for the fiscal year ended June 30, 2012, compared with the 1.43% return of its benchmark, the S&P SmallCap 600 Index. The small-cap Russell 2000 Index returned ���2.08%. (Effective July 1, 2012, the fund’s benchmark will change from the S&P SmallCap 600 Index to the Russell 2000 Index.)
In an up-and-down period for the U.S. stock market (see page 3 for details), Small Company declined modestly for the 12 months, trailing the small positive return of the S&P SmallCap 600 Index. Individual stock selection, a critical element of our investment process, was the primary factor behind the underperformance versus the index, particularly in the information technology and financials sectors.
Absolute Performance Driven by Technology and Energy
Small Company’s negative absolute return for the 12-month period was driven primarily by double-digit declines in the information technology and energy sectors of the portfolio. The most significant detractors in the information technology sector were two semiconductor manufacturers, Veeco Instruments and OmniVision Technologies. In the energy sector, the biggest detractor was energy services and equipment provider ION Geophysical.
The fund’s holdings in the materials sector also had a negative impact on absolute results as falling commodity prices weighed on this sector. Notable detractors included chemicals producers OM Group, Ferro, and TPC Group.
On the positive side, the fund’s holdings in the consumer discretionary and health care sectors boosted fund performance for the 12 months. The top two contributors to absolute performance in the portfolio were consumer discretionary stocks—gaming machine company Multimedia Games and recreational vehicle maker Arctic Cat. In the health care sector, the leading contributors included biotechnology firms Pharmacyclics and ViroPharma, as well as orthodontic products maker Align Technology (a top 10 holding at the end of the period).
Technology and Financials Detracted
Looking at performance versus the S&P SmallCap 600 Index, the fund’s holdings in the information technology and financials sectors contributed the most to its underperformance of the index for the 12 months. Stock selection among IT services providers and semiconductor manufacturers detracted the most in the information technology sector. As was the case for absolute performance, the biggest detractors from relative performance in this sector were OmniVision Technologies and Veeco Instruments. Increased competition in its core image sensors business weighed on OmniVision’s stock, while Veeco faced slumping demand, especially in its solar products unit.
| * | All fund returns referenced in this commentary are for Investor Class shares. |
In the financials sector, stock choices among commercial banks and capital markets firms produced the bulk of the underperformance. The most significant individual decision that detracted from results versus the benchmark in this sector was avoiding insurance firm Delphi Financial Group, which rallied sharply after agreeing to be acquired by Japanese insurer Tokio Marine Holdings.
Other noteworthy detractors in the portfolio included navigation software maker TeleNav, medical equipment and supplies company Invacare, and Internet-based telecom services provider Vonage Holdings. TeleNav struggled with increased competition in its mobile voice-guided navigation systems business; Invacare faced a regulatory injunction that threatened to suspend operations at one of its plants; and Vonage fell as higher marketing costs weighed on profit margins.
Consumer Discretionary and Energy Outperformed
Stock selection was most successful in consumer discretionary and energy sectors of the portfolio compared with the S&P SmallCap 600 Index. Stock choices among leisure equipment makers generated the bulk of the outperformance in the consumer discretionary sector. The top relative performance contributors were also the top absolute contributors—Multimedia Games and Arctic Cat. Multimedia Games, which produces networked gaming systems for casinos and state lotteries, consistently exceeded earnings expectations as the company expanded its footprint in the U.S. gaming market. Arctic Cat benefited from strong sales of its snowmobiles and all-terrain vehicles, as well as from the introduction of innovative new products.
In the energy sector, stock selection and an underweight position in energy equipment and services providers added the most value. The most effective investment decisions in this sector included avoiding oilfield equipment and services company Lufkin Industries and holding an overweight position in construction and engineering firm Willbros Group. Lufkin experienced declining demand in the first half of 2012, which led to an earnings shortfall. In contrast, Willbros, which was added to the portfolio in late 2011, rallied substantially in the first half of 2012 as the company reported stronger-than-expected revenues and secured a contract for a new pipeline construction project.
Although the fund’s health care stocks had little overall impact on relative results, two holdings were among the top individual contributors—biotech firm Pharmacyclics and medical device maker Kensey Nash. Pharmacyclics, which focuses on small-molecule medications used to treat cancer and auto-immune diseases, rallied sharply as the company announced promising clinical trial data for an experimental lymphoma drug. Kensey Nash was acquired by Dutch life sciences company Royal DSM at a sizable premium.
A Look Ahead
As we move into the second half of 2012, the U.S. equity market is likely to remain volatile given the uncertainty regarding the economic outlook, the European debt situation, and the upcoming U.S. presidential election. Heightened levels of volatility often provide investment opportunities, and our disciplined, objective, and systematic investment strategy is designed to take advantage of these opportunities at the individual company level. We believe this approach is the most powerful way to capitalize on market inefficiencies that lead to the mispricing of individual stocks.
| JUNE 30, 2012 |
| Top Ten Holdings | % of net assets |
| Energy XXI Bermuda Ltd. | 0.7% |
| Coinstar, Inc. | 0.7% |
| Align Technology, Inc. | 0.7% |
| EMCOR Group, Inc. | 0.7% |
| CommVault Systems, Inc. | 0.7% |
| Helix Energy Solutions Group, Inc. | 0.7% |
| Moog, Inc., Class A | 0.7% |
| FEI Co. | 0.7% |
| Tetra Tech, Inc. | 0.6% |
| Ciena Corp. | 0.6% |
| | |
| Top Five Industries | % of net assets |
| Real Estate Investment Trusts (REITs) | 7.3% |
| Commercial Banks | 4.8% |
| Software | 4.0% |
| Oil, Gas and Consumable Fuels | 3.8% |
| Insurance | 3.8% |
| | |
| Types of Investments in Portfolio | % of net assets |
| Common Stocks | 99.1% |
| Temporary Cash Investments | 0.7% |
| Other Assets and Liabilities | 0.2% |
Fund shareholders may incur two types of costs: (1) transaction costs, including sales charges (loads) on purchase payments and redemption/exchange fees; and (2) ongoing costs, including management fees; distribution and service (12b-1) fees; and other fund expenses. This example is intended to help you understand your ongoing costs (in dollars) of investing in your fund and to compare these costs with the ongoing cost of investing in other mutual funds.
The example is based on an investment of $1,000 made at the beginning of the period and held for the entire period from January 1, 2012 to June 30, 2012.
Actual Expenses
The table provides information about actual account values and actual expenses for each class. You may use the information, together with the amount you invested, to estimate the expenses that you paid over the period. First, identify the share class you own. Then simply divide your account value by $1,000 (for example, an $8,600 account value divided by $1,000 = 8.6), then multiply the result by the number under the heading “Expenses Paid During Period” to estimate the expenses you paid on your account during this period.
If you hold Investor Class shares of any American Century Investments fund, or Institutional Class shares of the American Century Diversified Bond Fund, in an American Century Investments account (i.e., not a financial intermediary or retirement plan account), American Century Investments may charge you a $12.50 semiannual account maintenance fee if the value of those shares is less than $10,000. We will redeem shares automatically in one of your accounts to pay the $12.50 fee. In determining your total eligible investment amount, we will include your investments in all personal accounts (including American Century Investments Brokerage accounts) registered under your Social Security number. Personal accounts include individual accounts, joint accounts, UGMA/UTMA accounts, personal trusts, Coverdell Education Savings Accounts and IRAs (including traditional, Roth, Rollover, SEP-, SARSEP- and SIMPLE-IRAs), and certain other retirement accounts. If you have only business, business retirement, employer-sponsored or American Century Investments Brokerage accounts, you are currently not subject to this fee. If you are subject to the Account Maintenance Fee, your account value could be reduced by the fee amount.
Hypothetical Example for Comparison Purposes
The table also provides information about hypothetical account values and hypothetical expenses based on the actual expense ratio of each class of your fund and an assumed rate of return of 5% per year before expenses, which is not the actual return of a fund’s share class. The hypothetical account values and expenses may not be used to estimate the actual ending account balance or expenses you paid for the period. You may use this information to compare the ongoing costs of investing in your fund and other funds. To do so, compare this 5% hypothetical example with the 5% hypothetical examples that appear in the shareholder reports of the other funds.
Please note that the expenses shown in the table are meant to highlight your ongoing costs only and do not reflect any transactional costs, such as sales charges (loads) or redemption/exchange fees. Therefore, the table is useful in comparing ongoing costs only, and will not help you determine the relative total costs of owning different funds. In addition, if these transactional costs were included, your costs would have been higher.
| | Beginning Account Value 1/1/12 | Ending Account Value 6/30/12 | Expenses Paid During Period(1) 1/1/12 – 6/30/12 | Annualized Expense Ratio(1) |
| Actual |
| Investor Class | $1,000 | $1,065.10 | $4.52 | 0.88% |
| Institutional Class | $1,000 | $1,064.50 | $3.49 | 0.68% |
| A Class | $1,000 | $1,062.40 | $5.79 | 1.13% |
| C Class | $1,000 | $1,060.40 | $9.63 | 1.88% |
| R Class | $1,000 | $1,061.00 | $7.07 | 1.38% |
| Hypothetical | | | | |
| Investor Class | $1,000 | $1,020.49 | $4.42 | 0.88% |
| Institutional Class | $1,000 | $1,021.48 | $3.42 | 0.68% |
| A Class | $1,000 | $1,019.24 | $5.67 | 1.13% |
| C Class | $1,000 | $1,015.52 | $9.42 | 1.88% |
| R Class | $1,000 | $1,018.00 | $6.92 | 1.38% |
| (1) | Expenses are equal to the class’s annualized expense ratio listed in the table above, multiplied by the average account value over the period, multiplied by 182, the number of days in the most recent fiscal half-year, divided by 366, to reflect the one-half year period. |
JUNE 30, 2012
| | | Shares | | | Value | |
| Common Stocks — 99.1% | |
| AEROSPACE AND DEFENSE — 1.4% | |
| Alliant Techsystems, Inc. | | | 5,175 | | | | $261,700 | |
Astronics Corp.(1) | | | 3,824 | | | | 107,990 | |
| Curtiss-Wright Corp. | | | 3,593 | | | | 111,563 | |
Moog, Inc., Class A(1) | | | 39,261 | | | | 1,623,442 | |
| Sypris Solutions, Inc. | | | 5,547 | | | | 38,662 | |
Taser International, Inc.(1) | | | 79,736 | | | | 417,817 | |
Teledyne Technologies, Inc.(1) | | | 13,269 | | | | 818,034 | |
| | | | | | | | 3,379,208 | |
| AIR FREIGHT AND LOGISTICS — 0.8% | |
| Forward Air Corp. | | | 36,623 | | | | 1,181,824 | |
Park-Ohio Holdings Corp.(1) | | | 39,208 | | | | 746,128 | |
| | | | | | | | 1,927,952 | |
| AIRLINES — 0.5% | |
Alaska Air Group, Inc.(1) | | | 20,150 | | | | 723,385 | |
Spirit Airlines, Inc.(1) | | | 20,533 | | | | 399,572 | |
| | | | | | | | 1,122,957 | |
| AUTO COMPONENTS — 0.4% | |
| Spartan Motors, Inc. | | | 77,095 | | | | 403,978 | |
WABCO Holdings, Inc.(1) | | | 13,139 | | | | 695,447 | |
| | | | | | | | 1,099,425 | |
| BEVERAGES — 0.2% | |
| Coca-Cola Bottling Co. Consolidated | | | 7,552 | | | | 485,443 | |
| BIOTECHNOLOGY — 2.4% | |
Agenus, Inc.(1) | | | 27,868 | | | | 146,028 | |
BioCryst Pharmaceuticals, Inc.(1) | | | 28,952 | | | | 115,229 | |
Cubist Pharmaceuticals, Inc.(1) | | | 29,837 | | | | 1,131,121 | |
Genomic Health, Inc.(1) | | | 7,934 | | | | 264,996 | |
Momenta Pharmaceuticals, Inc.(1) | | | 27,011 | | | | 365,189 | |
| PDL BioPharma, Inc. | | | 107,031 | | | | 709,615 | |
Pharmacyclics, Inc.(1) | | | 14,698 | | | | 802,658 | |
Progenics Pharmaceuticals, Inc.(1) | | | 54,772 | | | | 535,670 | |
Spectrum Pharmaceuticals, Inc.(1) | | | 75,183 | | | | 1,169,847 | |
United Therapeutics Corp.(1) | | | 15,229 | | | | 752,008 | |
| | | | | | | | 5,992,361 | |
| BUILDING PRODUCTS — 0.6% | |
Gibraltar Industries, Inc.(1) | | | 59,868 | | | | 621,430 | |
Patrick Industries, Inc.(1) | | | 16,867 | | | | 215,054 | |
Trex Co., Inc.(1) | | | 22,103 | | | | 665,079 | |
| | | | | | | | 1,501,563 | |
| CAPITAL MARKETS — 1.7% | |
| Apollo Investment Corp. | | | 2,040 | | | | 15,667 | |
| Calamos Asset Management, Inc., Class A | | | 64,727 | | | | 741,124 | |
| Diamond Hill Investment Group, Inc. | | | 7,071 | | | | 553,589 | |
| Epoch Holding Corp. | | | 4,003 | | | | 91,188 | |
FBR & Co.(1) | | | 13,182 | | | | 36,514 | |
| FXCM, Inc., Class A | | | 53,729 | | | | 631,853 | |
| Greenhill & Co., Inc. | | | 17,407 | | | | 620,560 | |
INTL FCStone, Inc.(1) | | | 17,084 | | | | 330,575 | |
Investment Technology Group, Inc.(1) | | | 37,847 | | | | 348,192 | |
| Janus Capital Group, Inc. | | | 14,594 | | | | 114,125 | |
| Manning & Napier, Inc. | | | 21,338 | | | | 303,640 | |
| NGP Capital Resources Co. | | | 6,706 | | | | 47,479 | |
| Pzena Investment Management, Inc., Class A | | | 50,023 | | | | 221,602 | |
SWS Group, Inc.(1) | | | 4,604 | | | | 24,539 | |
| | | | | | | | 4,080,647 | |
| CHEMICALS — 1.8% | |
Flotek Industries, Inc.(1) | | | 59,321 | | | | 554,058 | |
| Georgia Gulf Corp. | | | 53,959 | | | | 1,385,128 | |
| H.B. Fuller Co. | | | 44,730 | | | | 1,373,211 | |
| Minerals Technologies, Inc. | | | 6,341 | | | | 404,429 | |
| Rockwood Holdings, Inc. | | | 4,680 | | | | 207,558 | |
TPC Group, Inc.(1) | | | 12,673 | | | | 468,267 | |
| | | | | | | | 4,392,651 | |
| COMMERCIAL BANKS — 4.8% | |
| CapitalSource, Inc. | | | 104,222 | | | | 700,372 | |
Central Pacific Financial Corp.(1) | | | 45,902 | | | | 648,136 | |
Citizens Republic Bancorp, Inc.(1) | | | 8,497 | | | | 145,554 | |
| City Holding Co. | | | 13,344 | | | | 449,559 | |
| City National Corp. | | | 9,766 | | | | 474,432 | |
| Columbia Banking System, Inc. | | | 52,772 | | | | 993,169 | |
| Community Bank System, Inc. | | | 16,941 | | | | 459,440 | |
| CVB Financial Corp. | | | 78,582 | | | | 915,480 | |
| Enterprise Financial Services Corp. | | | 5,610 | | | | 61,486 | |
| F.N.B. Corp. | | | 10,236 | | | | 111,265 | |
| First Financial Bancorp | | | 70,089 | | | | 1,120,022 | |
| Home Bancshares, Inc. | | | 11,462 | | | | 350,508 | |
| International Bancshares Corp. | | | 11,940 | | | | 233,069 | |
| Old National Bancorp. | | | 48,552 | | | | 583,110 | |
| PacWest Bancorp. | | | 48,524 | | | | 1,148,563 | |
Pinnacle Financial Partners, Inc.(1) | | | 14,382 | | | | 280,593 | |
| Tompkins Financial Corp. | | | 2,043 | | | | $76,980 | |
| Trustmark Corp. | | | 20,412 | | | | 499,686 | |
| UMB Financial Corp. | | | 28,665 | | | | 1,468,508 | |
| Westamerica Bancorp. | | | 8,502 | | | | 401,209 | |
Wilshire Bancorp, Inc.(1) | | | 107,019 | | | | 586,464 | |
| | | | | | | | 11,707,605 | |
| COMMERCIAL SERVICES AND SUPPLIES — 1.5% | |
| Deluxe Corp. | | | 26,575 | | | | 662,781 | |
| Herman Miller, Inc. | | | 16,725 | | | | 309,747 | |
| HNI Corp. | | | 2,498 | | | | 64,324 | |
| Intersections, Inc. | | | 20,898 | | | | 331,233 | |
Standard Parking Corp.(1) | | | 9,072 | | | | 195,229 | |
Tetra Tech, Inc.(1) | | | 60,430 | | | | 1,576,014 | |
TRC Cos., Inc.(1) | | | 29,162 | | | | 177,305 | |
| US Ecology, Inc. | | | 22,125 | | | | 392,498 | |
| | | | | | | | 3,709,131 | |
| COMMUNICATIONS EQUIPMENT — 2.7% | |
Arris Group, Inc.(1) | | | 106,662 | | | | 1,483,669 | |
Aviat Networks, Inc.(1) | | | 14,551 | | | | 40,743 | |
Brocade Communications Systems, Inc.(1) | | | 108,382 | | | | 534,323 | |
Calix, Inc.(1) | | | 90,919 | | | | 747,354 | |
Ciena Corp.(1) | | | 96,146 | | | | 1,573,910 | |
| Comtech Telecommunications Corp. | | | 34,899 | | | | 997,413 | |
Globecomm Systems, Inc.(1) | | | 11,633 | | | | 117,959 | |
| Loral Space & Communications, Inc. | | | 5,266 | | | | 354,665 | |
| Plantronics, Inc. | | | 18,497 | | | | 617,800 | |
| Tessco Technologies, Inc. | | | 7,122 | | | | 157,040 | |
| | | | | | | | 6,624,876 | |
| COMPUTERS AND PERIPHERALS — 1.0% | |
Electronics for Imaging, Inc.(1) | | | 16,341 | | | | 265,541 | |
QLogic Corp.(1) | | | 44,261 | | | | 605,933 | |
Synaptics, Inc.(1) | | | 41,922 | | | | 1,200,227 | |
| Xyratex Ltd. | | | 43,275 | | | | 489,440 | |
| | | | | | | | 2,561,141 | |
| CONSTRUCTION AND ENGINEERING — 1.5% | |
| Argan, Inc. | | | 10,787 | | | | 150,802 | |
| EMCOR Group, Inc. | | | 60,802 | | | | 1,691,512 | |
| Granite Construction, Inc. | | | 23,413 | | | | 611,313 | |
Michael Baker Corp.(1) | | | 19,237 | | | | 501,893 | |
| URS Corp. | | | 18,295 | | | | 638,130 | |
| | | | | | | | 3,593,650 | |
| CONSTRUCTION MATERIALS — 0.4% | |
Headwaters, Inc.(1) | | | 175,297 | | | | 902,779 | |
United States Lime & Minerals, Inc.(1) | | | 1,780 | | | | 83,073 | |
| | | | | | | | 985,852 | |
| CONSUMER FINANCE — 1.0% | |
| Cash America International, Inc. | | | 29,772 | | | | 1,311,159 | |
World Acceptance Corp.(1) | | | 17,033 | | | | 1,120,771 | |
| | | | | | | | 2,431,930 | |
| CONTAINERS AND PACKAGING — 0.5% | |
| Boise, Inc. | | | 61,858 | | | | 407,026 | |
| Myers Industries, Inc. | | | 51,058 | | | | 876,155 | |
| | | | | | | | 1,283,181 | |
| DISTRIBUTORS — 0.1% | |
| Core-Mark Holding Co., Inc. | | | 3,918 | | | | 188,613 | |
| DIVERSIFIED CONSUMER SERVICES — 1.3% | |
American Public Education, Inc.(1) | | | 7,075 | | | | 226,400 | |
Bridgepoint Education, Inc.(1) | | | 31,352 | | | | 683,474 | |
Coinstar, Inc.(1) | | | 26,021 | | | | 1,786,602 | |
ITT Educational Services, Inc.(1) | | | 9,971 | | | | 605,738 | |
| | | | | | | | 3,302,214 | |
| DIVERSIFIED FINANCIAL SERVICES — 0.6% | |
| Interactive Brokers Group, Inc., Class A | | | 68,916 | | | | 1,014,444 | |
| MarketAxess Holdings, Inc. | | | 19,780 | | | | 526,939 | |
| | | | | | | | 1,541,383 | |
| DIVERSIFIED TELECOMMUNICATION SERVICES — 0.6% | |
| IDT Corp., Class B | | | 26,153 | | | | 256,561 | |
Premiere Global Services, Inc.(1) | | | 73,709 | | | | 618,418 | |
Vonage Holdings Corp.(1) | | | 285,251 | | | | 573,355 | |
| | | | | | | | 1,448,334 | |
| ELECTRIC UTILITIES — 1.0% | |
| Empire District Electric Co. (The) | | | 1,263 | | | | 26,649 | |
| Hawaiian Electric Industries, Inc. | | | 24,466 | | | | 697,770 | |
| MGE Energy, Inc. | | | 11,965 | | | | 565,945 | |
| Otter Tail Corp. | | | 20,620 | | | | 471,579 | |
| Portland General Electric Co. | | | 27,169 | | | | 724,326 | |
| | | | | | | | 2,486,269 | |
| ELECTRICAL EQUIPMENT — 1.5% | |
| Acuity Brands, Inc. | | | 10,983 | | | | 559,144 | |
| Belden, Inc. | | | 45,619 | | | | 1,521,394 | |
EnerSys(1) | | | 22,731 | | | | 797,176 | |
Generac Holdings, Inc.(1) | | | 27,948 | | | | 672,429 | |
Ultralife Corp.(1) | | | 38,546 | | | | 148,788 | |
| | | | | | | | 3,698,931 | |
| ELECTRONIC EQUIPMENT, INSTRUMENTS AND COMPONENTS — 3.3% | |
Agilysys, Inc.(1) | | | 8,032 | | | | $69,637 | |
| Electro Scientific Industries, Inc. | | | 34,701 | | | | 410,166 | |
FEI Co.(1) | | | 33,344 | | | | 1,595,177 | |
Itron, Inc.(1) | | | 16,480 | | | | 679,635 | |
| Littelfuse, Inc. | | | 19,214 | | | | 1,093,085 | |
LoJack Corp.(1) | | | 67,516 | | | | 203,898 | |
| MTS Systems Corp. | | | 12,394 | | | | 477,789 | |
Newport Corp.(1) | | | 38,076 | | | | 457,674 | |
Plexus Corp.(1) | | | 20,021 | | | | 564,592 | |
SYNNEX Corp.(1) | | | 32,419 | | | | 1,118,131 | |
Tech Data Corp.(1) | | | 12,695 | | | | 611,518 | |
Vishay Intertechnology, Inc.(1) | | | 47,775 | | | | 450,518 | |
Zygo Corp.(1) | | | 18,237 | | | | 325,713 | |
| | | | | | | | 8,057,533 | |
| ENERGY EQUIPMENT AND SERVICES — 2.6% | |
Basic Energy Services, Inc.(1) | | | 140,097 | | | | 1,445,801 | |
C&J Energy Services, Inc.(1) | | | 36,834 | | | | 681,429 | |
Helix Energy Solutions Group, Inc.(1) | | | 99,516 | | | | 1,633,058 | |
Hornbeck Offshore Services, Inc.(1) | | | 6,909 | | | | 267,931 | |
ION Geophysical Corp.(1) | | | 25,051 | | | | 165,086 | |
Mitcham Industries, Inc.(1) | | | 15,377 | | | | 260,948 | |
Natural Gas Services Group, Inc.(1) | | | 9,374 | | | | 138,923 | |
Parker Drilling Co.(1) | | | 116,526 | | | | 525,532 | |
TGC Industries, Inc.(1) | | | 62,919 | | | | 610,943 | |
Willbros Group, Inc.(1) | | | 117,425 | | | | 758,565 | |
| | | | | | | | 6,488,216 | |
| FOOD AND STAPLES RETAILING — 0.9% | |
| Andersons, Inc. (The) | | | 25,019 | | | | 1,067,311 | |
| Spartan Stores, Inc. | | | 49,956 | | | | 905,702 | |
| SUPERVALU, Inc. | | | 48,317 | | | | 250,282 | |
| | | | | | | | 2,223,295 | |
| FOOD PRODUCTS — 1.8% | |
| Cal-Maine Foods, Inc. | | | 25,070 | | | | 980,237 | |
Darling International, Inc.(1) | | | 60,280 | | | | 994,017 | |
Dean Foods Co.(1) | | | 40,490 | | | | 689,545 | |
Farmer Bros. Co.(1) | | | 21,591 | | | | 171,864 | |
| J&J Snack Foods Corp. | | | 16,876 | | | | 997,372 | |
Omega Protein Corp.(1) | | | 69,564 | | | | 511,991 | |
Smart Balance, Inc.(1) | | | 13,641 | | | | 128,089 | |
| | | | | | | | 4,473,115 | |
| GAS UTILITIES — 0.6% | |
| Northwest Natural Gas Co. | | | 29,365 | | | | 1,397,774 | |
| HEALTH CARE EQUIPMENT AND SUPPLIES — 3.7% | |
Align Technology, Inc.(1) | | | 51,094 | | | | 1,709,605 | |
| Analogic Corp. | | | 12,756 | | | | 790,872 | |
| CONMED Corp. | | | 35,572 | | | | 984,277 | |
CryoLife, Inc.(1) | | | 5,094 | | | | 26,642 | |
Cyberonics, Inc.(1) | | | 14,063 | | | | 631,991 | |
Cynosure, Inc., Class A(1) | | | 13,520 | | | | 285,948 | |
Greatbatch, Inc.(1) | | | 43,453 | | | | 986,818 | |
| Hill-Rom Holdings, Inc. | | | 19,165 | | | | 591,240 | |
ICU Medical, Inc.(1) | | | 6,637 | | | | 354,283 | |
| Invacare Corp. | | | 49,342 | | | | 761,347 | |
Orthofix International NV(1) | | | 14,905 | | | | 614,831 | |
RTI Biologics, Inc.(1) | | | 174,108 | | | | 654,646 | |
Thoratec Corp.(1) | | | 18,585 | | | | 624,085 | |
| | | | | | | | 9,016,585 | |
| HEALTH CARE PROVIDERS AND SERVICES — 2.2% | |
Amsurg Corp.(1) | | | 13,757 | | | | 412,435 | |
| Chemed Corp. | | | 19,537 | | | | 1,180,816 | |
Molina Healthcare, Inc.(1) | | | 40,479 | | | | 949,637 | |
PDI, Inc.(1) | | | 5,420 | | | | 44,661 | |
Providence Service Corp. (The)(1) | | | 47,405 | | | | 649,923 | |
Select Medical Holdings Corp.(1) | | | 50,720 | | | | 512,779 | |
Team Health Holdings, Inc.(1) | | | 28,934 | | | | 697,020 | |
Triple-S Management Corp. Class B(1) | | | 30,594 | | | | 559,258 | |
WellCare Health Plans, Inc.(1) | | | 5,476 | | | | 290,228 | |
| | | | | | | | 5,296,757 | |
| HEALTH CARE TECHNOLOGY — 0.4% | |
HealthStream, Inc.(1) | | | 25,048 | | | | 651,248 | |
MedAssets, Inc.(1) | | | 13,721 | | | | 184,548 | |
Omnicell, Inc.(1) | | | 7,477 | | | | 109,463 | |
| | | | | | | | 945,259 | |
| HOTELS, RESTAURANTS AND LEISURE — 2.4% | |
| Churchill Downs, Inc. | | | 10,682 | | | | 627,995 | |
| Cracker Barrel Old Country Store, Inc. | | | 21,366 | | | | 1,341,785 | |
| Interval Leisure Group, Inc. | | | 9,380 | | | | 178,314 | |
Multimedia Games Holding Co., Inc.(1) | | | 58,563 | | | | 819,882 | |
Papa John’s International, Inc.(1) | | | 21,877 | | | | 1,040,689 | |
Red Robin Gourmet Burgers, Inc.(1) | | | 22,817 | | | | 696,147 | |
Ruth’s Hospitality Group, Inc.(1) | | | 30,593 | | | | 201,914 | |
Shuffle Master, Inc.(1) | | | 52,337 | | | | 722,250 | |
Town Sports International Holdings, Inc.(1) | | | 24,485 | | | | 325,405 | |
| | | | | | | | 5,954,381 | |
| HOUSEHOLD DURABLES — 0.4% | |
| Blyth, Inc. | | | 19,698 | | | | $680,763 | |
| CSS Industries, Inc. | | | 9,425 | | | | 193,684 | |
iRobot Corp.(1) | | | 1,506 | | | | 33,358 | |
| | | | | | | | 907,805 | |
| INDUSTRIAL CONGLOMERATES — 0.4% | |
| Standex International Corp. | | | 22,695 | | | | 966,126 | |
| INSURANCE — 3.8% | |
| Allied World Assurance Co. Holdings AG | | | 7,658 | | | | 608,581 | |
American Safety Insurance Holdings Ltd.(1) | | | 31,336 | | | | 587,550 | |
AMERISAFE, Inc.(1) | | | 33,685 | | | | 874,126 | |
| Amtrust Financial Services, Inc. | | | 26,494 | | | | 787,137 | |
| Aspen Insurance Holdings Ltd. | | | 21,103 | | | | 609,877 | |
| Hanover Insurance Group, Inc. (The) | | | 16,491 | | | | 645,293 | |
| Maiden Holdings Ltd. | | | 74,965 | | | | 650,696 | |
| Meadowbrook Insurance Group, Inc. | | | 105,506 | | | | 927,398 | |
| Montpelier Re Holdings Ltd. | | | 30,176 | | | | 642,447 | |
National Financial Partners Corp.(1) | | | 97,029 | | | | 1,300,189 | |
| Protective Life Corp. | | | 25,996 | | | | 764,542 | |
| Symetra Financial Corp. | | | 32,222 | | | | 406,642 | |
| Universal Insurance Holdings, Inc. | | | 125,199 | | | | 426,928 | |
| | | | | | | | 9,231,406 | |
| INTERNET AND CATALOG RETAIL — 0.3% | |
1-800-Flowers.com, Inc. Class A(1) | | | 9,399 | | | | 32,803 | |
Orbitz Worldwide, Inc.(1) | | | 88,433 | | | | 322,780 | |
| PetMed Express, Inc. | | | 28,220 | | | | 343,155 | |
| | | | | | | | 698,738 | |
| INTERNET SOFTWARE AND SERVICES — 2.6% | |
Ancestry.com, Inc.(1) | | | 27,828 | | | | 766,105 | |
Blucora, Inc.(1) | | | 78,403 | | | | 965,925 | |
Constant Contact, Inc.(1) | | | 22,921 | | | | 409,827 | |
Demand Media, Inc.(1) | | | 87,603 | | | | 981,154 | |
Dice Holdings, Inc.(1) | | | 33,443 | | | | 314,030 | |
Digital River, Inc.(1) | | | 57,676 | | | | 958,575 | |
| IAC/InterActiveCorp | | | 15,928 | | | | 726,317 | |
| j2 Global, Inc. | | | 18,023 | | | | 476,168 | |
| United Online, Inc. | | | 167,039 | | | | 704,904 | |
| | | | | | | | 6,303,005 | |
| IT SERVICES — 1.7% | |
Acxiom Corp.(1) | | | 51,707 | | | | 781,293 | |
CACI International, Inc., Class A(1) | | | 25,535 | | | | 1,404,936 | |
CSG Systems International, Inc.(1) | | | 11,444 | | | | 197,752 | |
Dynamics Research Corp.(1) | | | 21,030 | | | | 122,184 | |
Global Cash Access Holdings, Inc.(1) | | | 82,760 | | | | 596,700 | |
TNS, Inc.(1) | | | 14,121 | | | | 253,331 | |
Unisys Corp.(1) | | | 36,161 | | | | 706,947 | |
| | | | | | | | 4,063,143 | |
| LEISURE EQUIPMENT AND PRODUCTS — 1.8% | |
Arctic Cat, Inc.(1) | | | 21,595 | | | | 789,513 | |
LeapFrog Enterprises, Inc.(1) | | | 123,937 | | | | 1,271,594 | |
| Polaris Industries, Inc. | | | 7,982 | | | | 570,553 | |
Smith & Wesson Holding Corp.(1) | | | 93,670 | | | | 778,398 | |
| Sturm Ruger & Co., Inc. | | | 23,707 | | | | 951,836 | |
| | | | | | | | 4,361,894 | |
| LIFE SCIENCES TOOLS AND SERVICES — 1.3% | |
Affymetrix, Inc.(1) | | | 86,618 | | | | 406,238 | |
Cambrex Corp.(1) | | | 97,892 | | | | 921,164 | |
Charles River Laboratories International, Inc.(1) | | | 9,148 | | | | 299,689 | |
PAREXEL International Corp.(1) | | | 53,887 | | | | 1,521,230 | |
| | | | | | | | 3,148,321 | |
| MACHINERY — 3.4% | |
| Actuant Corp., Class A | | | 48,878 | | | | 1,327,526 | |
| Albany International Corp., Class A | | | 5,148 | | | | 96,319 | |
| Ampco-Pittsburgh Corp. | | | 5,294 | | | | 97,039 | |
| Briggs & Stratton Corp. | | | 69,193 | | | | 1,210,186 | |
| FreightCar America, Inc. | | | 38,847 | | | | 892,316 | |
Hurco Cos., Inc.(1) | | | 4,723 | | | | 96,774 | |
Kadant, Inc.(1) | | | 28,641 | | | | 671,631 | |
| L.B. Foster Co., Class A | | | 20,114 | | | | 575,462 | |
| Miller Industries, Inc. | | | 31,472 | | | | 501,349 | |
| NACCO Industries, Inc., Class A | | | 7,636 | | | | 887,685 | |
| Robbins & Myers, Inc. | | | 6,222 | | | | 260,204 | |
| Sauer-Danfoss, Inc. | | | 14,409 | | | | 503,306 | |
| Sun Hydraulics Corp. | | | 8,376 | | | | 203,453 | |
Trimas Corp.(1) | | | 14,047 | | | | 282,345 | |
| Wabtec Corp. | | | 9,830 | | | | 766,838 | |
| | | | | | | | 8,372,433 | |
| MEDIA — 1.2% | |
| Arbitron, Inc. | | | 32,373 | | | | 1,133,055 | |
Carmike Cinemas, Inc.(1) | | | 68,833 | | | | 1,008,403 | |
LodgeNet Interactive Corp.(1) | | | 58,263 | | | | 76,325 | |
| Scholastic Corp. | | | 22,755 | | | | 640,781 | |
SuperMedia, Inc.(1) | | | 48,670 | | | | 121,675 | |
| | | | | | | | 2,980,239 | |
| METALS AND MINING — 1.1% | |
Aurizon Mines Ltd.(1) | | | 136,273 | | | | $614,591 | |
Coeur d’Alene Mines Corp.(1) | | | 34,680 | | | | 608,981 | |
Endeavour Silver Corp.(1) | | | 56,308 | | | | 457,221 | |
| Gold Resource Corp. | | | 13,857 | | | | 360,143 | |
Handy & Harman Ltd.(1) | | | 4,306 | | | | 58,045 | |
| Nevsun Resources Ltd. | | | 174,203 | | | | 564,418 | |
| | | | | | | | 2,663,399 | |
| MULTI-UTILITIES — 0.4% | |
| NorthWestern Corp. | | | 26,667 | | | | 978,679 | |
| MULTILINE RETAIL — 0.4% | |
| Dillard’s, Inc., Class A | | | 10,768 | | | | 685,706 | |
Dollar Tree, Inc.(1) | | | 5,076 | | | | 273,089 | |
| | | | | | | | 958,795 | |
| OIL, GAS AND CONSUMABLE FUELS — 3.8% | |
| Adams Resources & Energy, Inc. | | | 6,524 | | | | 273,486 | |
Callon Petroleum Co.(1) | | | 49,765 | | | | 211,999 | |
Cloud Peak Energy, Inc.(1) | | | 75,292 | | | | 1,273,188 | |
Contango Oil & Gas Co.(1) | | | 18,311 | | | | 1,084,011 | |
| Delek US Holdings, Inc. | | | 36,620 | | | | 644,146 | |
Energy Partners Ltd.(1) | | | 24,596 | | | | 415,672 | |
| Energy XXI Bermuda Ltd. | | | 58,673 | | | | 1,835,878 | |
Green Plains Renewable Energy, Inc.(1) | | | 23,023 | | | | 143,664 | |
| Knightsbridge Tankers Ltd. | | | 55,754 | | | | 453,838 | |
REX American Resources Corp.(1) | | | 28,435 | | | | 555,051 | |
| Targa Resources Corp. | | | 1,520 | | | | 64,904 | |
Tesoro Corp.(1) | | | 27,273 | | | | 680,734 | |
Vaalco Energy, Inc.(1) | | | 70,448 | | | | 607,966 | |
| W&T Offshore, Inc. | | | 21,039 | | | | 321,897 | |
| Western Refining, Inc. | | | 33,286 | | | | 741,279 | |
Westmoreland Coal Co.(1) | | | 3,580 | | | | 28,819 | |
| | | | | | | | 9,336,532 | |
| PAPER AND FOREST PRODUCTS — 1.2% | |
| Buckeye Technologies, Inc. | | | 38,734 | | | | 1,103,532 | |
| Neenah Paper, Inc. | | | 35,226 | | | | 940,182 | |
| P.H. Glatfelter Co. | | | 48,053 | | | | 786,627 | |
| | | | | | | | 2,830,341 | |
| PERSONAL PRODUCTS — 0.7% | |
Medifast, Inc.(1) | | | 48,584 | | | | 956,133 | |
USANA Health Sciences, Inc.(1) | | | 19,899 | | | | 818,247 | |
| | | | | | | | 1,774,380 | |
| PHARMACEUTICALS — 2.7% | |
Acura Pharmaceuticals, Inc.(1) | | | 24,710 | | | | 77,589 | |
Endo Health Solutions Inc.(1) | | | 9,601 | | | | 297,439 | |
Hi-Tech Pharmacal Co., Inc.(1) | | | 15,693 | | | | 508,453 | |
Medicines Co. (The)(1) | | | 62,731 | | | | 1,439,049 | |
| Medicis Pharmaceutical Corp., Class A | | | 20,505 | | | | 700,246 | |
Obagi Medical Products, Inc.(1) | | | 27,060 | | | | 413,206 | |
Par Pharmaceutical Cos., Inc.(1) | | | 23,563 | | | | 851,567 | |
Pozen, Inc.(1) | | | 24,631 | | | | 153,698 | |
Questcor Pharmaceuticals, Inc.(1) | | | 13,628 | | | | 725,555 | |
ViroPharma, Inc.(1) | | | 61,980 | | | | 1,468,926 | |
| | | | | | | | 6,635,728 | |
| PROFESSIONAL SERVICES — 1.7% | |
| Barrett Business Services, Inc. | | | 11,909 | | | | 251,756 | |
| Corporate Executive Board Co. (The) | | | 17,650 | | | | 721,532 | |
Exponent, Inc.(1) | | | 16,126 | | | | 851,937 | |
| Insperity, Inc. | | | 33,556 | | | | 907,690 | |
Navigant Consulting, Inc.(1) | | | 61,652 | | | | 779,281 | |
RPX Corp.(1) | | | 38,171 | | | | 547,754 | |
| | | | | | | | 4,059,950 | |
| REAL ESTATE INVESTMENT TRUSTS (REITs) — 7.3% | |
| BioMed Realty Trust, Inc. | | | 10,303 | | | | 192,460 | |
| CBL & Associates Properties, Inc. | | | 19,230 | | | | 375,754 | |
| Colonial Properties Trust | | | 52,745 | | | | 1,167,774 | |
| Coresite Realty Corp. | | | 32,062 | | | | 827,841 | |
| CubeSmart | | | 11,026 | | | | 128,673 | |
| Entertainment Properties Trust | | | 35,132 | | | | 1,444,277 | |
| Extra Space Storage, Inc. | | | 46,847 | | | | 1,433,518 | |
First Industrial Realty Trust, Inc.(1) | | | 61,263 | | | | 773,139 | |
| Home Properties, Inc. | | | 12,639 | | | | 775,529 | |
| Hospitality Properties Trust | | | 4,759 | | | | 117,880 | |
| Kilroy Realty Corp. | | | 6,680 | | | | 323,379 | |
| LaSalle Hotel Properties | | | 42,063 | | | | 1,225,716 | |
| LTC Properties, Inc. | | | 36,402 | | | | 1,320,665 | |
| Mack-Cali Realty Corp. | | | 24,279 | | | | 705,791 | |
| Mid-America Apartment Communities, Inc. | | | 17,669 | | | | 1,205,733 | |
| Mission West Properties, Inc. | | | 72,447 | | | | 624,493 | |
| National Retail Properties, Inc. | | | 22,480 | | | | 635,959 | |
| Post Properties, Inc. | | | 24,479 | | | | 1,198,247 | |
| PS Business Parks, Inc. | | | 18,191 | | | | 1,231,895 | |
| Sovran Self Storage, Inc. | | | 20,415 | | | | 1,022,587 | |
| Sun Communities, Inc. | | | 705 | | | | 31,189 | |
| Tanger Factory Outlet Centers | | | 37,267 | | | | 1,194,407 | |
| | | | | | | | 17,956,906 | |
REAL ESTATE MANAGEMENT AND DEVELOPMENT† | |
FirstService Corp.(1) | | | 2,664 | | | | 74,512 | |
| ROAD AND RAIL — 1.3% | | | | | | | | |
| Arkansas Best Corp. | | | 46,494 | | | | $585,824 | |
| Knight Transportation, Inc. | | | 60,864 | | | | 973,215 | |
| Marten Transport Ltd. | | | 4,854 | | | | 103,196 | |
Old Dominion Freight Line, Inc.(1) | | | 20,998 | | | | 909,004 | |
Swift Transportation Co.(1) | | | 57,664 | | | | 544,925 | |
| | | | | | | | 3,116,164 | |
| SEMICONDUCTORS AND SEMICONDUCTOR EQUIPMENT — 3.7% | |
| Cabot Microelectronics Corp. | | | 10,266 | | | | 299,870 | |
Cypress Semiconductor Corp.(1) | | | 3,119 | | | | 41,233 | |
Entegris, Inc.(1) | | | 69,487 | | | | 593,419 | |
Exar Corp.(1) | | | 25,014 | | | | 204,114 | |
GT Advanced Technologies, Inc.(1) | | | 190,059 | | | | 1,003,512 | |
Kulicke & Soffa Industries, Inc.(1) | | | 86,004 | | | | 767,156 | |
LSI Corp.(1) | | | 104,807 | | | | 667,621 | |
Mattson Technology, Inc.(1) | | | 50,959 | | | | 89,178 | |
| Micrel, Inc. | | | 80,539 | | | | 767,537 | |
| MKS Instruments, Inc. | | | 48,306 | | | | 1,397,493 | |
Monolithic Power Systems, Inc.(1) | | | 25,013 | | | | 497,008 | |
Photronics, Inc.(1) | | | 50,137 | | | | 305,836 | |
PMC - Sierra, Inc.(1) | | | 73,178 | | | | 449,313 | |
| Power Integrations, Inc. | | | 23,838 | | | | 889,157 | |
Rudolph Technologies, Inc.(1) | | | 3,538 | | | | 30,851 | |
STR Holdings, Inc.(1) | | | 45,849 | | | | 209,071 | |
| Tessera Technologies, Inc. | | | 59,741 | | | | 918,219 | |
| | | | | | | | 9,130,588 | |
| SOFTWARE — 4.0% | |
Aspen Technology, Inc.(1) | | | 33,342 | | | | 771,867 | |
| Blackbaud, Inc. | | | 8,493 | | | | 218,015 | |
Cadence Design Systems, Inc.(1) | | | 57,871 | | | | 636,002 | |
CommVault Systems, Inc.(1) | | | 33,620 | | | | 1,666,543 | |
| Fair Isaac Corp. | | | 17,319 | | | | 732,247 | |
Guidance Software, Inc.(1) | | | 14,576 | | | | 138,618 | |
JDA Software Group, Inc.(1) | | | 42,196 | | | | 1,252,799 | |
Manhattan Associates, Inc.(1) | | | 26,446 | | | | 1,208,847 | |
Mentor Graphics Corp.(1) | | | 39,904 | | | | 598,560 | |
Monotype Imaging Holdings, Inc.(1) | | | 16,799 | | | | 281,719 | |
NetScout Systems, Inc.(1) | | | 7,206 | | | | 155,578 | |
QAD, Inc., Class A(1) | | | 6,027 | | | | 85,704 | |
TeleNav, Inc.(1) | | | 83,634 | | | | 512,676 | |
TiVo, Inc.(1) | | | 65,509 | | | | 541,760 | |
Websense, Inc.(1) | | | 48,891 | | | | 915,729 | |
| | | | | | | | 9,716,664 | |
| SPECIALTY RETAIL — 3.7% | |
ANN, Inc.(1) | | | 22,740 | | | | 579,643 | |
Body Central Corp.(1) | | | 2,982 | | | | 26,838 | |
| Buckle, Inc. (The) | | | 27,046 | | | | 1,070,210 | |
| Destination Maternity Corp. | | | 5,750 | | | | 124,200 | |
Express, Inc.(1) | | | 32,755 | | | | 595,158 | |
| Finish Line, Inc. (The), Class A | | | 53,688 | | | | 1,122,616 | |
Francesca’s Holdings Corp.(1) | | | 26,556 | | | | 717,278 | |
| GameStop Corp., Class A | | | 30,079 | | | | 552,250 | |
Genesco, Inc.(1) | | | 22,235 | | | | 1,337,435 | |
Hibbett Sports, Inc.(1) | | | 26,436 | | | | 1,525,622 | |
| Hot Topic, Inc. | | | 25,420 | | | | 246,320 | |
Select Comfort Corp.(1) | | | 48,096 | | | | 1,006,168 | |
Vitamin Shoppe, Inc.(1) | | | 5,370 | | | | 294,974 | |
| | | | | | | | 9,198,712 | |
| TEXTILES, APPAREL AND LUXURY GOODS — 2.6% | |
Crocs, Inc.(1) | | | 48,072 | | | | 776,363 | |
Fifth & Pacific Cos., Inc.(1) | | | 79,887 | | | | 857,188 | |
Iconix Brand Group, Inc.(1) | | | 71,978 | | | | 1,257,456 | |
| Jones Group, Inc. (The) | | | 66,563 | | | | 636,342 | |
| Movado Group, Inc. | | | 35,968 | | | | 899,919 | |
| Oxford Industries, Inc. | | | 22,506 | | | | 1,006,018 | |
| RG Barry Corp. | | | 1,928 | | | | 26,202 | |
| True Religion Apparel, Inc. | | | 33,675 | | | | 975,901 | |
| | | | | | | | 6,435,389 | |
| THRIFTS AND MORTGAGE FINANCE — 0.1% | |
HomeStreet, Inc.(1) | | | 1,382 | | | | 44,210 | |
| Provident Financial Services, Inc. | | | 5,351 | | | | 82,138 | |
Walker & Dunlop, Inc.(1) | | | 15,459 | | | | 198,648 | |
| | | | | | | | 324,996 | |
| TRADING COMPANIES AND DISTRIBUTORS — 0.7% | |
| Applied Industrial Technologies, Inc. | | | 5,366 | | | | 197,737 | |
Beacon Roofing Supply, Inc.(1) | | | 25,140 | | | | 634,031 | |
DXP Enterprises, Inc.(1) | | | 12,775 | | | | 530,035 | |
| MFC Industrial Ltd. | | | 58,980 | | | | 397,525 | |
| | | | | | | | 1,759,328 | |
| WATER UTILITIES — 0.5% | |
| American States Water Co. | | | 28,666 | | | | 1,134,600 | |
| Artesian Resources Corp., Class A | | | 1,113 | | | | 23,974 | |
| | | | | | | | 1,158,574 | |
| WIRELESS TELECOMMUNICATION SERVICES — 0.1% | |
Boingo Wireless, Inc.(1) | | | 8,760 | | | | $101,791 | |
| USA Mobility, Inc. | | | 16,914 | | | | 217,514 | |
| | | | | | | | 319,305 | |
TOTAL COMMON STOCKS (Cost $221,749,315) | | | | 242,860,284 | |
| Temporary Cash Investments — 0.7% | |
Repurchase Agreement, Bank of America Merrill Lynch, (collateralized by various U.S. Treasury obligations, 1.50% - 4.00%, 2/15/15 - 6/30/16, valued at $608,241), in a joint trading account at 0.10%, dated 6/29/12, due 7/2/12 (Delivery value $596,657) | | | | 596,652 | |
Repurchase Agreement, Credit Suisse First Boston, Inc., (collateralized by various U.S. Treasury obligations, 3.75%, 8/15/41, valued at $610,132), in a joint trading account at 0.10%, dated 6/29/12, due 7/2/12 (Delivery value $596,657) | | | | 596,652 | |
Repurchase Agreement, Goldman Sachs & Co., (collateralized by various U.S. Treasury obligations, 4.375%, 5/15/40, valued at $151,943), in a joint trading account at 0.06%, dated 6/29/12, due 7/2/12 (Delivery value $149,164) | | | | 149,163 | |
| SSgA U.S. Government Money Market Fund | | | 365,568 | | | | 365,568 | |
TOTAL TEMPORARY CASH INVESTMENTS (Cost $1,708,035) | | | | 1,708,035 | |
TOTAL INVESTMENT SECURITIES — 99.8% (Cost $223,457,350) | | | | 244,568,319 | |
| OTHER ASSETS AND LIABILITIES — 0.2% | | | | 406,773 | |
| TOTAL NET ASSETS — 100.0% | | | | $244,975,092 | |
Notes to Schedule of Investments
| † | Category is less than 0.05% of total net assets. |
See Notes to Financial Statements.
| Statement of Assets and Liabilities |
| JUNE 30, 2012 | |
| Assets | |
| Investment securities, at value (cost of $223,457,350) | | | $244,568,319 | |
| Cash | | | 1,042 | |
| Receivable for investments sold | | | 8,697,777 | |
| Receivable for capital shares sold | | | 83,864 | |
| Dividends and interest receivable | | | 218,623 | |
| | | | 253,569,625 | |
| | | | | |
| Liabilities | | | | |
| Payable for investments purchased | | | 8,335,478 | |
| Payable for capital shares redeemed | | | 88,421 | |
| Accrued management fees | | | 165,057 | |
| Distribution and service fees payable | | | 5,577 | |
| | | | 8,594,533 | |
| | | | | |
| Net Assets | | | $244,975,092 | |
| | | | | |
| Net Assets Consist of: | | | | |
| Capital (par value and paid-in surplus) | | | $394,164,617 | |
| Undistributed net investment income | | | 559,352 | |
| Accumulated net realized loss | | | (170,859,846 | ) |
| Net unrealized appreciation | | | 21,110,969 | |
| | | | $244,975,092 | |
| | Net assets | Shares outstanding | Net asset value per share |
| Investor Class, $0.01 Par Value | $188,518,569 | 22,887,364 | $8.24 |
| Institutional Class, $0.01 Par Value | $29,506,168 | 3,566,901 | $8.27 |
| A Class, $0.01 Par Value | $25,943,774 | 3,210,462 | $8.08* |
| C Class, $0.01 Par Value | $76,748 | 9,504 | $8.08 |
| R Class, $0.01 Par Value | $929,833 | 116,220 | $8.00 |
* Maximum offering price $8.57 (net asset value divided by 0.9425)
See Notes to Financial Statements.
| YEAR ENDED JUNE 30, 2012 | |
| Investment Income (Loss) | |
| Income: | | | |
| Dividends (net of foreign taxes withheld of $5,211) | | | $3,394,876 | |
| Interest | | | 1,936 | |
| | | | 3,396,812 | |
| | | | | |
| Expenses: | | | | |
| Management fees | | | 2,171,985 | |
| Distribution and service fees: | | | | |
| A Class | | | 68,564 | |
| C Class | | | 680 | |
| R Class | | | 4,535 | |
| Directors’ fees and expenses | | | 14,682 | |
| Other expenses | | | 1,629 | |
| | | | 2,262,075 | |
| | | | | |
| Net investment income (loss) | | | 1,134,737 | |
| | | | | |
| Realized and Unrealized Gain (Loss) | | | | |
| Net realized gain (loss) on: | | | | |
| Investment transactions | | | 22,038,222 | |
| Futures contract transactions | | | 81,415 | |
| | | | 22,119,637 | |
| | | | | |
| Change in net unrealized appreciation (depreciation) on investments | | | (30,243,656 | ) |
| | | | | |
| Net realized and unrealized gain (loss) | | | (8,124,019 | ) |
| | | | | |
| Net Increase (Decrease) in Net Assets Resulting from Operations | | | $(6,989,282 | ) |
See Notes to Financial Statements.
Statement of Changes in Net Assets |
| YEARS ENDED JUNE 30, 2012 AND JUNE 30, 2011 | |
| Increase (Decrease) in Net Assets | June 30, 2012 | | | June 30, 2011 | |
| Operations | |
| Net investment income (loss) | | $1,134,737 | | | | $495,328 | |
| Net realized gain (loss) | | 22,119,637 | | | | 49,798,369 | |
| Change in net unrealized appreciation (depreciation) | | (30,243,656 | ) | | | 38,016,101 | |
| Net increase (decrease) in net assets resulting from operations | | (6,989,282 | ) | | | 88,309,798 | |
| | | | | | | | |
| Distributions to Shareholders | | | | | | | |
| From net investment income: | | | | | | | |
| Investor Class | | (606,377 | ) | | | (193,801 | ) |
| Institutional Class | | (181,344 | ) | | | (108,353 | ) |
| A Class | | (17,887 | ) | | | — | |
| Decrease in net assets from distributions | | (805,608 | ) | | | (302,154 | ) |
| | | | | | | | |
| Capital Share Transactions | | | | | | | |
| Net increase (decrease) in net assets from capital share transactions | | (42,884,361 | ) | | | (105,655,179 | ) |
| | | | | | | | |
| Net increase (decrease) in net assets | | (50,679,251 | ) | | | (17,647,535 | ) |
| | | | | | | | |
| Net Assets | | | | | | | |
| Beginning of period | | 295,654,343 | | | | 313,301,878 | |
| End of period | | $244,975,092 | | | | $295,654,343 | |
| | | | | | | | |
| Undistributed net investment income | | $559,352 | | | | $282,320 | |
See Notes to Financial Statements.
Notes to Financial Statements |
JUNE 30, 2012
1. Organization
American Century Quantitative Equity Funds, Inc. (the corporation) is registered under the Investment Company Act of 1940, as amended (the 1940 Act), as an open-end management investment company and is organized as a Maryland corporation. Small Company Fund (the fund) is one fund in a series issued by the corporation. The fund is diversified as defined under the 1940 Act. The fund’s investment objective is to seek long-term capital growth. The fund pursues its objective by investing primarily in stocks of smaller-capitalization U.S. companies.
The fund offers the Investor Class, the Institutional Class, the A Class, the C Class and the R Class. The A Class may incur an initial sales charge. The A Class and C Class may be subject to a contingent deferred sales charge. The share classes differ principally in their respective sales charges and distribution and shareholder servicing expenses and arrangements. The Institutional Class is made available to institutional shareholders or through financial intermediaries whose clients do not require the same level of shareholder and administrative services as shareholders of other classes. As a result, the Institutional Class is charged a lower unified management fee.
2. Significant Accounting Policies
The following is a summary of significant accounting policies consistently followed by the fund in preparation of its financial statements. The financial statements are prepared in conformity with accounting principles generally accepted in the United States of America, which may require management to make certain estimates and assumptions at the date of the financial statements. Actual results could differ from these estimates.
Investment Valuations — The fund determines the fair value of its investments and computes its net asset value per share as of the close of regular trading (usually 4 p.m. Eastern time) on the New York Stock Exchange (NYSE) on each day the NYSE is open.
Equity securities that are listed or traded on a domestic securities exchange are valued at the last reported sales price or at the official closing price as provided by the exchange. Equity securities traded on foreign securities exchanges are typically valued at the closing price on the exchange where primarily traded or as of the close of the NYSE, if that is earlier. If no last sales price is reported, or if local convention or regulation so provides, the mean of the latest bid and asked prices is used. Depending on local convention or regulation, securities traded over-the-counter are valued at the mean of the latest bid and asked prices, the last sales price, or the official closing price. In its determination of fair value, the fund may review several factors including: market information specific to a security; news developments in U.S. and foreign markets; the performance of particular U.S. and foreign securities, indices, comparable securities, American Depositary Receipts, Exchange-Traded Funds, and other relevant market indicators.
Debt securities maturing within 60 days at the time of purchase may be valued at cost, plus or minus any amortized discount or premium or at the evaluated mean as provided by an independent pricing service. Evaluated mean prices are commonly derived through utilization of market models, which may consider, among other factors, trade data, quotations from dealers and active market makers, relevant yield curve and spread data, related sector levels, creditworthiness, and other relevant market information on the same or comparable securities.
Investments in open-end management investment companies are valued at the reported net asset value per share. Repurchase agreements are valued at cost. Exchange-traded futures contracts are valued at the settlement price as provided by the appropriate clearing corporation.
If the fund determines that the market price for a portfolio security is not readily available or the valuation methods mentioned above do not reflect a security’s fair value, such security is valued as determined in good faith by the Board of Directors or its designee, in accordance with procedures adopted by the Board of Directors. Circumstances that may cause the fund to use these procedures to value a security include, but are not limited
to: a security has been declared in default; trading in a security has been halted during the trading day; there is a foreign market holiday and no trading occurred; or an event occurred between the close of a foreign exchange and the NYSE that may affect the value of a security.
Security Transactions — Security transactions are accounted for as of the trade date. Net realized gains and losses are determined on the identified cost basis, which is also used for federal income tax purposes.
Investment Income — Dividend income less foreign taxes withheld, if any, is recorded as of the ex-dividend date. Distributions received on securities that represent a return of capital or capital gain are recorded as a reduction of cost of investments and/or as a realized gain. The fund estimates the components of distributions received that may be considered nontaxable distributions or capital gain distributions for income tax purposes. Interest income is recorded on the accrual basis and includes accretion of discounts and amortization of premiums.
Business Development Companies — The fund may invest in securities of closed-end investment companies that have elected to be treated as a business development company under the 1940 Act. A business development company operates similar to an exchange-traded fund and represents a portfolio of securities. The fund may purchase a business development company to gain exposure to the securities in the underlying portfolio. The risks of owning a business development company generally reflect the risks of owning the underlying securities. Business development companies have expenses that reduce their value.
Repurchase Agreements — The fund may enter into repurchase agreements with institutions that American Century Investment Management, Inc. (ACIM) (the investment advisor) has determined are creditworthy pursuant to criteria adopted by the Board of Directors. The fund requires that the collateral, represented by securities, received in a repurchase transaction be transferred to the custodian in a manner sufficient to enable the fund to obtain those securities in the event of a default under the repurchase agreement. ACIM monitors, on a daily basis, the securities transferred to ensure the value, including accrued interest, of the securities under each repurchase agreement is equal to or greater than amounts owed to the fund under each repurchase agreement.
Joint Trading Account — Pursuant to an Exemptive Order issued by the Securities and Exchange Commission, the fund, along with certain other funds in the American Century Investments family of funds, may transfer uninvested cash balances into a joint trading account. These balances are invested in one or more repurchase agreements that are collateralized by U.S. Treasury or Agency obligations.
Segregated Assets — In accordance with the 1940 Act, the fund segregates assets on its books and records to cover futures contracts. ACIM monitors, on a daily basis, the securities segregated to ensure the fund designates a sufficient amount of liquid assets, marked-to-market daily. The fund may also receive assets or be required to pledge assets at the custodian bank or with a broker for margin requirements on futures contracts.
Income Tax Status — It is the fund’s policy to distribute substantially all net investment income and net realized gains to shareholders and to otherwise qualify as a regulated investment company under provisions of the Internal Revenue Code. The fund is no longer subject to examination by tax authorities for years prior to 2009. At this time, management believes there are no uncertain tax positions which, based on their technical merit, would not be sustained upon examination and for which it is reasonably possible that the total amounts of unrecognized tax benefits will significantly change in the next twelve months. Accordingly, no provision has been made for federal or state income taxes.
Multiple Class — All shares of the fund represent an equal pro rata interest in the net assets of the class to which such shares belong, and have identical voting, dividend, liquidation and other rights and the same terms and conditions, except for class specific expenses and exclusive rights to vote on matters affecting only individual classes. Income, non-class specific expenses, and realized and unrealized capital gains and losses of the fund are allocated to each class of shares based on their relative net assets.
Distributions to Shareholders — Distributions from net investment income, if any, are generally declared and paid quarterly. Distributions from net realized gains, if any, are generally declared and paid annually.
Indemnifications — Under the corporation’s organizational documents, its officers and directors are indemnified against certain liabilities arising out of the performance of their duties to the fund. In addition, in the normal course of business, the fund enters into contracts that provide general indemnifications. The maximum exposure under these arrangements is unknown as this would involve future claims that may be made against a fund. The risk of material loss from such claims is considered by management to be remote.
3. Fees and Transactions with Related Parties
Management Fees — The corporation has entered into a management agreement with ACIM, under which ACIM provides the fund with investment advisory and management services in exchange for a single, unified management fee (the fee) per class. The agreement provides that all expenses of managing and operating the fund, except distribution and service fees, brokerage expenses, taxes, interest, fees and expenses of the independent directors (including legal counsel fees), and extraordinary expenses, will be paid by ACIM. The fee is computed and accrued daily based on each class’s daily net assets and paid monthly in arrears. The fee consists of (1) an Investment Category Fee based on the daily net assets of the fund and certain other accounts managed by the investment advisor that are in the same broad investment category as the fund and (2) a Complex Fee based on the assets of all the funds in the American Century Investments family of funds. The rates for the Investment Category Fee range from 0.5380% to 0.7200%. The rates for the Complex Fee range from 0.2500% to 0.3100% for the Investor Class, A Class, C Class and R Class. The Institutional Class is 0.2000% less at each point within the Complex Fee range. The effective annual management fee for each class for the year ended June 30, 2012 was 0.88% for the Investor Class, A Class, C Class and R Class and 0.68% for the Institutional Class.
Distribution and Service Fees — The Board of Directors has adopted a separate Master Distribution and Individual Shareholder Services Plan for each of the A Class, C Class and R Class (collectively the plans), pursuant to Rule 12b-1 of the 1940 Act. The plans provide that the A Class will pay American Century Investment Services, Inc. (ACIS) an annual distribution and service fee of 0.25%. The plans provide that the C Class will pay ACIS an annual distribution and service fee of 1.00%, of which 0.25% is paid for individual shareholder services and 0.75% is paid for distribution services. The plans provide that the R Class will pay ACIS an annual distribution and service fee of 0.50%. The fees are computed and accrued daily based on each class’s daily net assets and paid monthly in arrears. The fees are used to pay financial intermediaries for distribution and individual shareholder services. Fees incurred under the plans during the year ended June 30, 2012 are detailed in the Statement of Operations.
Acquired Fund Fees and Expenses — The fund may invest in mutual funds, exchange-traded funds, and business development companies (the acquired funds). The fund will indirectly realize its pro rata share of the fees and expenses of the acquired funds in which it invests. These indirect fees and expenses are not paid out of the fund’s assets but are reflected in the return realized by the fund on its investment in the acquired funds.
Related Parties — Certain officers and directors of the corporation are also officers and/or directors of American Century Companies, Inc., the parent of the corporation’s investment advisor, ACIM, the distributor of the corporation, ACIS, and the corporation’s transfer agent, American Century Services, LLC. Various funds in a series issued by American Century Asset Allocation Portfolios, Inc. (ACAAP) own, in aggregate, 19% of the shares of the fund. ACAAP does not invest in the fund for the purpose of exercising management or control.
4. Investment Transactions
Purchases and sales of investment securities, excluding short-term investments, for the year ended June 30, 2012 were $182,075,758 and $224,208,380, respectively.
For the year ended June 30, 2012, the fund incurred net realized losses of $(557,651) from redemptions in kind. A redemption in kind occurs when a fund delivers securities from its portfolio in lieu of cash as payment to a redeeming shareholder.
5. Capital Share Transactions
Transactions in shares of the fund were as follows:
| | | Year ended June 30, 2012 | | Year ended June 30, 2011 | |
| | | Shares | | Amount | | Shares | | Amount | |
| Investor Class/Shares Authorized | | | 200,000,000 | | | | | 200,000,000 | | | |
| Sold | | | 4,492,903 | | | $35,130,570 | | | 3,748,866 | | | $28,194,868 | |
| Issued in reinvestment of distributions | | | 74,240 | | | 594,091 | | | 28,390 | | | 189,365 | |
| Redeemed | | | (7,786,139 | ) | | (62,419,731 | ) | | (15,819,818 | ) | | (109,003,394 | ) |
| | | | (3,218,996 | ) | | (26,695,070 | ) | | (12,042,562 | ) | | (80,619,161 | ) |
| Institutional Class/Shares Authorized | | | 100,000,000 | | | | | | 100,000,000 | | | | |
| Sold | | | 1,173,172 | | | 9,379,013 | | | 1,362,748 | | | 10,489,197 | |
| Issued in reinvestment of distributions | | | 23,354 | | | 180,999 | | | 16,095 | | | 107,839 | |
| Redeemed | | | (2,682,434 | ) | | (19,252,370 | ) | | (3,211,344 | ) | | (22,848,871 | ) |
| | | | (1,485,908 | ) | | (9,692,358 | ) | | (1,832,501 | ) | | (12,251,835 | ) |
| A Class/Shares Authorized | | | 140,000,000 | | | | | | 140,000,000 | | | | |
| Sold | | | 561,169 | | | 4,459,495 | | | 662,917 | | | 4,941,713 | |
| Issued in reinvestment of distributions | | | 2,105 | | | 17,854 | | | — | | | — | |
| Redeemed | | | (1,423,609 | ) | | (10,976,701 | ) | | (2,474,255 | ) | | (18,176,255 | ) |
| | | | (860,335 | ) | | (6,499,352 | ) | | (1,811,338 | ) | | (13,234,542 | ) |
| C Class/Shares Authorized | | | 10,000,000 | | | | | | 10,000,000 | | | | |
| Sold | | | 2,211 | | | 17,729 | | | 5,072 | | | 38,642 | |
| Redeemed | | | (1,685 | ) | | (11,539 | ) | | — | | | — | |
| | | | 526 | | | 6,190 | | | 5,072 | | | 38,642 | |
| R Class/Shares Authorized | | | 10,000,000 | | | | | | 10,000,000 | | | | |
| Sold | | | 30,952 | | | 237,954 | | | 102,397 | | | 803,580 | |
| Redeemed | | | (30,595 | ) | | (241,725 | ) | | (50,466 | ) | | (391,863 | ) |
| | | | 357 | | | (3,771 | ) | | 51,931 | | | 411,717 | |
| Net increase (decrease) | | | (5,564,356 | ) | | $(42,884,361 | ) | | (15,629,398 | ) | | $(105,655,179 | ) |
6. Fair Value Measurements
The fund’s securities valuation process is based on several considerations and may use multiple inputs to determine the fair value of the positions held by the fund. In conformity with accounting principles generally accepted in the United States of America, the inputs used to determine a valuation are classified into three broad levels as follows:
| • | Level 1 valuation inputs consist of unadjusted quoted prices in an active market for identical securities; |
| • | Level 2 valuation inputs consist of direct or indirect observable market data (including quoted prices for similar securities, evaluations of subsequent market events, interest rates, prepayment speeds, credit risk, etc.); or |
| • | Level 3 valuation inputs consist of unobservable data (including a fund’s own assumptions). |
The level classification is based on the lowest level input that is significant to the fair valuation measurement. The valuation inputs are not necessarily an indication of the risks associated with investing in these securities or other financial instruments.
The following is a summary of the level classifications as of period end. The Schedule of Investments provides additional information on the fund’s portfolio holdings.
| | | | | | | | | |
| | Level 1 | | | Level 2 | | | Level 3 | |
| Investment Securities | |
| Common Stocks | | $242,860,284 | | | | — | | | | — | |
| Temporary Cash Investments | | 365,568 | | | | $1,342,467 | | | | — | |
| Total Value of Investment Securities | | $243,225,852 | | | | $1,342,467 | | | | — | |
7. Derivative Instruments
Equity Price Risk — The fund is subject to equity price risk in the normal course of pursuing its investment objectives. A fund may enter into futures contracts based on an equity index in order to manage its exposure to changes in market conditions. A fund may purchase futures contracts to gain exposure to increases in market value or sell futures contracts to protect against a decline in market value. Upon entering into a futures contract, a fund is required to deposit either cash or securities in an amount equal to a certain percentage of the contract value (initial margin). Subsequent payments (variation margin) are made or received daily, in cash, by a fund. The variation margin is equal to the daily change in the contract value and is recorded as unrealized gains and losses. A fund recognizes a realized gain or loss when the contract is closed or expires. Net realized and unrealized gains or losses occurring during the holding period of futures contracts are a component of net realized gain (loss) on futures contract transactions and change in net unrealized appreciation (depreciation) on futures contracts, respectively. One of the risks of entering into futures contracts is the possibility that the change in value of the contract may not correlate with the changes in value of the underlying securities. During the period, the fund infrequently purchased equity price risk derivative instruments for temporary investment purposes.
At period end, the fund did not have any equity price risk derivative instruments disclosed on the Statement of Assets and Liabilities. For the year ended June 30, 2012, the effect of equity price risk derivative instruments on the Statement of Operations was $81,415 in net realized gain (loss) on futures contract transactions.
8. Risk Factors
The fund concentrates its investments in common stocks of small companies. Because of this, the fund may be subject to greater risk and market fluctuations than a fund investing in larger, more established companies.
9. Federal Tax Information
The tax character of distributions paid during the years ended June 30, 2012 and June 30, 2011 were as follows:
| | | 2012 | | 2011 |
| Distributions Paid From | |
| Ordinary income | | $805,608 | | | $302,154 | |
| Long-term capital gains | | — | | | — | |
The book-basis character of distributions made during the year from net investment income or net realized gains may differ from their ultimate characterization for federal income tax purposes. These differences reflect the differing character of certain income items and net realized gains and losses for financial statement and tax purposes, and may result in reclassification among certain capital accounts on the financial statements.
As of June 30, 2012, the federal tax cost of investments and the components of distributable earnings on a tax-basis were as follows:
| | | | | |
| Federal tax cost of investments | | | $223,298,819 | |
| Gross tax appreciation of investments | | | $35,595,753 | |
| Gross tax depreciation of investments | | | (14,326,253 | ) |
| Net tax appreciation (depreciation) of investments | | | $21,269,500 | |
| Undistributed ordinary income | | | $559,352 | |
| Accumulated short-term capital losses | | | $(169,310,624 | ) |
| Post-October capital loss deferral | | | $(1,707,753 | ) |
The difference between book-basis and tax-basis cost and unrealized appreciation (depreciation) is attributable primarily to the tax deferral of losses on wash sales and return of capital dividends received.
The accumulated capital losses represent net capital loss carryovers that may be used to offset future realized capital gains for federal income tax purposes. Future capital loss carryover utilization in any given year may be subject to Internal Revenue Code limitations. Capital loss carryovers of $(10,179,789) and $(159,130,835) expire in 2017 and 2018, respectively.
The loss deferral represents certain qualified losses that the fund has elected to treat as having been incurred in the following fiscal year for federal income tax purposes.
| For a Share Outstanding Throughout the Years Ended June 30 (except as noted) |
| Per-Share Data | Ratios and Supplemental Data |
| | | Income From Investment Operations: | Distributions From: | | | Ratio to Average Net Assets of: | | |
| | Net Asset Value, Beginning of Period | Net Investment Income (Loss)(1) | Net Realized and Unrealized Gain (Loss) | Total From Investment Operations | Net Investment Income | Net Realized Gains | Total Distributions | Net Asset Value, End of Period | Total Return(2) | Operating Expenses | Net Investment Income (Loss) | Portfolio Turnover Rate | Net Assets, End of Period (in thousands) |
| Investor Class |
| 2012 | $8.38 | 0.04 | (0.16) | (0.12) | (0.02) | — | (0.02) | $8.24 | (1.37)% | 0.89% | 0.45% | 72% | $188,519 |
| 2011 | $6.15 | 0.01 | 2.23 | 2.24 | (0.01) | — | (0.01) | $8.38 | 36.39% | 0.89% | 0.17% | 61% | $218,642 |
| 2010 | $5.00 | 0.01 | 1.16 | 1.17 | (0.02) | — | (0.02) | $6.15 | 23.39% | 0.90% | 0.12% | 44% | $234,727 |
| 2009 | $7.76 | 0.02 | (2.78) | (2.76) | —(3) | — | —(3) | $5.00 | (35.51)% | 0.90% | 0.33% | 92% | $229,568 |
| 2008 | $10.77 | —(3) | (2.01) | (2.01) | (0.02) | (0.98) | (1.00) | $7.76 | (19.13)% | 0.87% | 0.06% | 105% | $454,464 |
| Institutional Class |
| 2012 | $8.42 | 0.05 | (0.15) | (0.10) | (0.05) | — | (0.05) | $8.27 | (1.20)% | 0.69% | 0.65% | 72% | $29,506 |
| 2011 | $6.19 | 0.03 | 2.22 | 2.25 | (0.02) | — | (0.02) | $8.42 | 36.43% | 0.69% | 0.37% | 61% | $42,541 |
| 2010 | $5.02 | 0.02 | 1.18 | 1.20 | (0.03) | — | (0.03) | $6.19 | 23.87% | 0.70% | 0.32% | 44% | $42,599 |
| 2009 | $7.79 | 0.03 | (2.79) | (2.76) | (0.01) | — | (0.01) | $5.02 | (35.38)% | 0.70% | 0.53% | 92% | $143,028 |
| 2008 | $10.80 | 0.02 | (2.02) | (2.00) | (0.03) | (0.98) | (1.01) | $7.79 | (18.99)% | 0.67% | 0.26% | 105% | $218,820 |
A Class(4) |
| 2012 | $8.22 | 0.02 | (0.15) | (0.13) | (0.01) | — | (0.01) | $8.08 | (1.64)% | 1.14% | 0.20% | 72% | $25,944 |
| 2011 | $6.05 | (0.01) | 2.18 | 2.17 | — | — | — | $8.22 | 35.87% | 1.14% | (0.08)% | 61% | $33,452 |
| 2010 | $4.91 | (0.01) | 1.16 | 1.15 | (0.01) | — | (0.01) | $6.05 | 23.40% | 1.15% | (0.13)% | 44% | $35,567 |
| 2009 | $7.65 | —(3) | (2.74) | (2.74) | — | — | — | $4.91 | (35.82)% | 1.15% | 0.08% | 92% | $49,253 |
| 2008 | $10.64 | (0.02) | (1.98) | (2.00) | (0.01) | (0.98) | (0.99) | $7.65 | (19.30)% | 1.12% | (0.19)% | 105% | $236,906 |
| For a Share Outstanding Throughout the Years Ended June 30 (except as noted) |
| Per-Share Data | Ratios and Supplemental Data |
| | | Income From Investment Operations: | Distributions From: | | | Ratio to Average Net Assets of: | | |
| | Net Asset Value, Beginning of Period | Net Investment Income (Loss)(1) | Net Realized and Unrealized Gain (Loss) | Total From Investment Operations | Net Investment Income | Net Realized Gains | Total Distributions | Net Asset Value, End of Period | Total Return(2) | Operating Expenses | Net Investment Income (Loss) | Portfolio Turnover Rate | Net Assets, End of Period (in thousands) |
| C Class |
| 2012 | $8.27 | (0.04) | (0.15) | (0.19) | — | — | — | $8.08 | (2.30)% | 1.89% | (0.55)% | 72% | $77 |
| 2011 | $6.13 | (0.06) | 2.20 | 2.14 | — | — | — | $8.27 | 34.91% | 1.89% | (0.83)% | 61% | $74 |
2010(5) | $6.40 | (0.02) | (0.25) | (0.27) | — | — | — | $6.13 | (4.22)% | 1.90%(6) | (0.79)%(6) | 44%(7) | $24 |
| R Class |
| 2012 | $8.15 | —(3) | (0.15) | (0.15) | — | — | — | $8.00 | (1.84)% | 1.39% | (0.05)% | 72% | $930 |
| 2011 | $6.01 | (0.02) | 2.16 | 2.14 | — | — | — | $8.15 | 35.61% | 1.39% | (0.33)% | 61% | $945 |
| 2010 | $4.89 | (0.02) | 1.14 | 1.12 | — | — | — | $6.01 | 22.90% | 1.40% | (0.38)% | 44% | $384 |
| 2009 | $7.63 | (0.01) | (2.73) | (2.74) | — | — | — | $4.89 | (35.91)% | 1.40% | (0.17)% | 92% | $321 |
| 2008 | $10.63 | (0.04) | (1.98) | (2.02) | — | (0.98) | (0.98) | $7.63 | (19.51)% | 1.37% | (0.44)% | 105% | $254 |
Notes to Financial Highlights
| (1) | Computed using average shares outstanding throughout the period. |
| (2) | Total returns are calculated based on the net asset value of the last business day and do not reflect applicable sales charges, if any. Total returns for periods less than one year are not annualized. |
| (3) | Per-share amount was less than $0.005. |
| (4) | Prior to March 1, 2010, the A Class was referred to as the Advisor Class. |
| (5) | March 1, 2010 (commencement of sale) through June 30, 2010. |
| (7) | Portfolio turnover is calculated at the fund level. Percentage indicated was calculated for the year ended June 30, 2010. |
See Notes to Financial Statements.
Report of Independent Registered Public Accounting Firm |
To the Directors of the American Century Quantitative Equity Funds, Inc.
and Shareholders of the Small Company Fund:
In our opinion, the accompanying statement of assets and liabilities, including the schedule of investments, and the related statements of operations and of changes in net assets and the financial highlights present fairly, in all material respects, the financial position of the Small Company Fund (one of the fourteen funds comprising the American Century Quantitative Equity Funds, Inc., hereafter referred to as the “Fund”) at June 30, 2012, the results of its operations for the year then ended, the changes in its net assets for each of the two years in the period then ended and the financial highlights for each of the periods presented, in conformity with accounting principles generally accepted in the United States of America. These financial statements and financial highlights (hereafter referred to as “financial statements”) are the responsibility of the Fund’s management; our responsibility is to express an opinion on these financial statements based on our audits. We conducted our audits of these financial statements in accordance with the standards of the Public Company Accounting Oversight Board (United States). Those standards require that we plan and perform the audit to obtain reasonable assurance about whether the financial statements are free of material misstatement. An audit includes examining, on a test basis, evidence supporting the amounts and disclosures in the financial statements, assessing the accounting principles used and significant estimates made by management, and evaluating the overall financial statement presentation. We believe that our audits, which included confirmation of securities at June 30, 2012 by correspondence with the custodian and brokers, provide a reasonable basis for our opinion.
PricewaterhouseCoopers LLP
Kansas City, Missouri
August 21, 2012
Board of Directors
The individuals listed below serve as directors of the funds. Each director will continue to serve in this capacity until death, retirement, resignation or removal from office. The mandatory retirement age for directors who are not “interested persons,” as that term is defined in the Investment Company Act (independent directors), is 73. However, the mandatory retirement age may be extended for a period not to exceed two years with the approval of the remaining independent directors.
Mr. Thomas is the only director who is an “interested person” because he currently serves as President and Chief Executive Officer of American Century Companies, Inc. (ACC), the parent company of American Century Investment Management, Inc. (ACIM or the advisor).
The other directors (more than three-fourths of the total number) are independent; that is, they have never been employees, directors or officers of, and have no financial interest in, ACC or any of its wholly owned, direct or indirect, subsidiaries, including ACIM, American Century Investment Services, Inc. (ACIS) and American Century Services, LLC (ACS). The directors serve in this capacity for eight (in the case of Mr. Thomas, 15) registered investment companies in the American Century Investments family of funds.
The following table presents additional information about the directors. The mailing address for each director other than Mr. Thomas is 1665 Charleston Road, Mountain View, California 94043. The mailing address for Mr. Thomas is 4500 Main Street, Kansas City, Missouri 64111.
Name (Year of Birth) | Position(s) Held with Funds | Length of Time Served | | Principal Occupation(s) During Past 5 Years | | Number of American Century Portfolios Overseen by Director | Other Directorships Held During Past 5 Years |
| Independent Directors |
Tanya S. Beder (1955) | Director | Since 2011 | | Chairman, SBCC Group Inc. (investment advisory services)(2006 to present); Fellow in Practice, International Center for Finance, Yale University School of Management (1985 to present) | | 42 | CYS Investments, Inc. (specialty finance company) |
Jeremy I. Bulow (1954) | Director | Since 2011 | | Professor of Economics, Stanford University, Graduate School of Business (1979 to present) | | 42 | None |
Ronald J. Gilson (1946) | Director and Chairman of the Board | Since 1995 | | Charles J. Meyers Professor of Law and Business, Stanford Law School (1979 to present); Marc and Eva Stern Professor of Law and Business, Columbia University School of Law (1992 to present) | | 42 | None |
Name (Year of Birth) | Position(s) Held with Funds | Length of Time Served | | Principal Occupation(s) During Past 5 Years | | Number of American Century Portfolios Overseen by Director | Other Directorships Held During Past 5 Years |
| Independent Directors |
Frederick L. A. Grauer (1946) | Director | Since 2008 | | Senior Advisor, BlackRock, Inc. (investment management firm) (2010 to 2011); Senior Advisor, Barclays Global Investors (investment management firm) (2003 to 2009) | | 42 | None |
Peter F. Pervere (1947) | Director | Since 2007 | | Retired | | 42 | Intraware, Inc. (2003 to 2009) |
Myron S. Scholes (1941) | Director | Since 1980 | | Chairman, Platinum Grove Asset Management, L.P. (asset manager) (1999 to 2009); Frank E. Buck Professor of Finance-Emeritus, Stanford Graduate School of Business (1996 to present) | | 42 | Dimensional Fund Advisors (investment advisor); CME Group, Inc. (futures and options exchange) |
John B. Shoven (1947) | Director | Since 2002 | | Professor of Economics, Stanford University (1973 to present) | | 42 | Cadence Design Systems; Exponent; Financial Engines |
| |
| Interested Director |
Jonathan S. Thomas (1963) | Director and President | Since 2007 | | President and Chief Executive Officer, ACC (March 2007 to present); Chief Administrative Officer, ACC (February 2006 to February 2007); Executive Vice President, ACC (November 2005 to February 2007). Also serves as Chief Executive Officer and Manager, ACS; Executive Vice President, ACIM; Director, ACC, ACIM and other ACC subsidiaries | | 108 | None |
Officers
The following table presents certain information about the executive officers of the funds. Each officer serves as an officer for each of the 15 investment companies in the American Century family of funds, unless otherwise noted. No officer is compensated for his or her service as an officer of the funds. The listed officers are interested persons of the funds and are appointed or re-appointed on an annual basis. The mailing address for each of the officers listed below is 4500 Main Street, Kansas City, Missouri 64111.
Name (Year of Birth) | Offices with the Funds | | Principal Occupation(s) During the Past Five Years |
Jonathan S. Thomas (1963) | Director and President since 2007 | | President and Chief Executive Officer, ACC (March 2007 to present); Chief Administrative Officer, ACC (February 2006 to February 2007); Executive Vice President, ACC (November 2005 to February 2007). Also serves as Chief Executive Officer and Manager, ACS; Executive Vice President, ACIM; Director, ACC, ACIM and other ACC subsidiaries |
Barry Fink (1955) | Executive Vice President since 2007 | | Chief Operating Officer and Executive Vice President, ACC (September 2007 to present); President, ACS (October 2007 to present); Managing Director, Morgan Stanley (2000 to 2007). Also serves as Manager, ACS and Director, ACC and certain ACC subsidiaries |
Maryanne L. Roepke (1956) | Chief Compliance Officer since 2006 and Senior Vice President since 2000 | | Chief Compliance Officer, American Century funds, ACIM and ACS (August 2006 to present). Also serves as Senior Vice President, ACS |
Charles A. Etherington (1957) | General Counsel since 2007 and Senior Vice President since 2006 | | Attorney, ACC (February 1994 to present); Vice President, ACC (November 2005 to present), General Counsel, ACC (March 2007 to present); Also serves as General Counsel, ACIM, ACS, ACIS and other ACC subsidiaries; and Senior Vice President, ACIM and ACS |
C. Jean Wade (1964) | Vice President, Treasurer and Chief Financial Officer since 2012 | | Vice President, ACS (February 2000 to present) |
Robert J. Leach (1966) | Vice President since 2006 and Assistant Treasurer since 2012 | | Vice President, ACS (February 2000 to present) |
David H. Reinmiller (1963) | Vice President since 2001 | | Attorney, ACC (January 1994 to present); Associate General Counsel, ACC (January 2001 to present); Also serves as Vice President, ACIM and ACS |
Ward D. Stauffer (1960) | Secretary since 2005 | | Attorney, ACC (June 2003 to present) |
The Statement of Additional Information has additional information about the fund’s directors and is available without charge, upon request, by calling 1-800-345-2021.
Approval of Management Agreement |
At a meeting held on June 14, 2012, the Fund’s Board of Directors/Trustees unanimously approved the renewal of the management agreement pursuant to which American Century Investment Management, Inc. (the “Advisor”) acts as the investment advisor for the Fund. Under Section 15(c) of the Investment Company Act, contracts for investment advisory services are required to be reviewed, evaluated, and approved by a majority of a fund’s independent directors/trustees (the “Directors”) each year.
As a part of the approval process, the Board requested and reviewed extensive data and information compiled by the Advisor and certain independent providers of evaluation data concerning the Fund and the services provided to the Fund by the Advisor. This review was in addition to the oversight and evaluation undertaken by the Board and its committees on a continuous basis throughout the year and included, but was not limited to the following:
| • | the nature, extent, and quality of investment management, shareholder services, and other services provided by the Advisor to the Fund; |
| • | the wide range of other programs and services the Advisor provides to the Fund and its shareholders on a routine and non-routine basis; |
| • | the investment performance of the fund, including data comparing the Fund’s performance to appropriate benchmarks and/or a peer group of other mutual funds with similar investment objectives and strategies; |
| • | data comparing the cost of owning the Fund to the cost of owning similar funds; |
| • | the Advisor’s compliance policies, procedures, and regulatory experience; |
| • | financial data showing the cost of services provided to the Fund, the profitability of the Fund to the Advisor, and the overall profitability of the Advisor; |
| • | data comparing services provided and charges to other investment management clients of the Advisor; and |
| • | consideration of collateral benefits derived by the Advisor from the management of the Fund and any potential economies of scale relating thereto. |
In keeping with its practice, the Board held two in-person meetings to review and discuss the information provided. The Board also had the benefit of the advice of its independent counsel throughout the period.
Factors Considered
The Directors considered all of the information provided by the Advisor, the independent data providers, and the Board’s independent counsel, and evaluated such information for the Fund. In connection with their review, the Directors did not identify any single factor as being all-important or controlling, and each Director may have attributed different levels of importance to different factors. In deciding to renew the management agreement, the Board based its decision on a number of factors, including the following:
Nature, Extent and Quality of Services — Generally. Under the management agreement, the Advisor is responsible for providing or arranging for all services necessary for the operation of the Fund. The Board noted that under the management agreement, the Advisor provides or arranges at its own expense a wide variety of services including:
| • | constructing and designing the Fund |
| • | portfolio research and security selection |
| • | initial capitalization/funding |
| • | daily valuation of the Fund’s portfolio |
| • | shareholder servicing and transfer agency, including shareholder confirmations, recordkeeping, and communications |
| • | regulatory and portfolio compliance |
| • | marketing and distribution |
The Board noted that many of these services have expanded over time both in terms of quantity and complexity in response to shareholder demands, competition in the industry, changing distribution channels, and the changing regulatory environment.
Investment Management Services. The nature of the investment management services provided to the Fund is quite complex and allows Fund shareholders access to professional money management, instant diversification of their investments within an asset class, the opportunity to easily diversify among asset classes by investing in or exchanging among various American Century Investments funds, and liquidity. In evaluating investment performance, the Board expects the Advisor to manage the Fund in accordance with its investment objectives and approved strategies. Further, the Directors recognize that the Advisor has an obligation to seek the best execution of fund trades. In providing these services, the Advisor utilizes teams of investment professionals (portfolio managers, analysts, research assistants, and securities traders) who require extensive information technology, research, training, compliance and other systems to conduct their business. The Board, directly and through its Portfolio Committee, regularly reviews investment performance information for the Fund, together with comparative information for appropriate benchmarks and/or peer groups of similarly-managed funds, over different time horizons. The Directors also review detailed performance information during the management agreement approval
process. If performance concerns are identified, the Fund receives special reviews until performance improves, during which the Board discusses with the Advisor the reasons for such results (e.g., market conditions, security selection) and
any efforts being undertaken to improve performance. The Board found the investment management services provided by the Advisor to the Fund to meet or exceed industry standards. More detailed information about the Fund’s performance can be found in the Performance and Portfolio Commentary sections of this report.
Shareholder and Other Services. Under the management agreement, the Advisor provides the Fund with a comprehensive package of transfer agency, shareholder, and other services. The Board, directly and through various committees of the Board, regularly reviews reports and evaluations of such services at its regular meetings. These reports include, but are not limited to, information regarding the operational efficiency and accuracy of the shareholder and transfer agency services provided, staffing levels, shareholder satisfaction (as measured by external as well as internal sources), technology support, new products and services offered to Fund shareholders, securities trading activities, portfolio valuation services, auditing services, and legal and operational compliance activities. Certain aspects of shareholder and transfer agency service level efficiency and the quality of securities trading activities are measured by independent third party providers and are presented in comparison to other fund groups not managed by the Advisor. The Board found the services provided by the Advisor to the Fund under the management agreement to be competitive and of high quality.
Costs of Services and Profitability. The Advisor provides detailed information concerning its cost of providing various services to the Fund, its profitability in managing the Fund, its overall profitability, and its financial condition. The Directors have reviewed with the Advisor the methodology used to prepare this financial information. The financial information regarding the Advisor is considered in evaluating the Advisor’s financial condition, ability to continue to provide services under the management agreement, and the reasonableness of the current management fee. The Board concluded that the Advisor’s profits were reasonable in light of the services provided to the Fund.
Ethics. The Board generally considers the Advisor’s commitment to providing quality services to shareholders and to conducting its business ethically. They noted that the Advisor’s practices generally meet or exceed industry best practices.
Economies of Scale. The Board also reviewed information provided by the Advisor regarding the possible existence of economies of scale in connection with the management of the Fund. The Board concluded that economies of scale are difficult to measure and predict with precision, especially on a fund-by-fund basis. The Board concluded that the Advisor is appropriately sharing economies of scale through its competitive fee structure, offering competitive fees from fund inception, and through reinvestment in its business to provide shareholders additional content and services.
Comparison to Other Funds’ Fees. The management agreement provides that the Fund pay the Advisor a single, all-inclusive (or unified) management fee for providing all services necessary for the management and operation of the Fund, other than brokerage expenses, taxes, interest, extraordinary expenses, and the fees and expenses of the Fund’s independent directors (including their independent legal counsel) and expenses incurred in connection with the provision of shareholder services and distribution services under a plan adopted pursuant to Rule 12b-1 under the 1940 Act. Under the unified fee structure, the Advisor is responsible for providing all investment advisory, custody, audit, administrative, compliance, recordkeeping, marketing and shareholder services, or arranging and supervising third parties to provide such services. By contrast, most other funds are charged a variety of fees, including an investment advisory fee, a transfer agency fee, an administrative fee, distribution charges and other expenses. Other than their investment advisory fees and any applicable Rule 12b-1 distribution fees, all other components of the total fees charged by these other funds may be increased without shareholder approval. The Board believes the unified fee structure is a benefit to Fund shareholders because it clearly discloses to shareholders the cost of owning Fund shares, and, since the unified fee cannot be increased without a vote of Fund shareholders, it shifts to the Advisor the risk of increased costs of operating the Fund and provides a direct incentive to minimize administrative inefficiencies. Part of the Board’s analysis of fee levels involves reviewing certain evaluative data compiled by an independent provider and comparing the Fund’s unified fee to the total expense ratio of other funds in the Fund’s peer group. The Board concluded that the management fee paid by the Fund to the Advisor under the management agreement is reasonable in light of the services provided to the Fund.
Comparison to Fees and Services Provided to Other Clients of the Advisor. The Board also requested and received information from the Advisor concerning the nature of the services, fees, costs and profitability of its advisory services to advisory clients other than the Fund. They observed that these varying types of client accounts require different services and involve different regulatory and entrepreneurial risks than the management of the Fund. The Board analyzed this information and concluded that the fees charged and services provided to the Fund were reasonable by comparison.
Collateral or “Fall-Out” Benefits Derived by the Advisor. The Board considered the existence of collateral benefits the Advisor may receive as a result of its relationship with the Fund. They concluded that the Advisor’s primary business is managing mutual funds and it generally does not use fund or shareholder information to generate profits in other lines of business, and therefore does not derive any significant collateral benefits from them. The Board noted that the Advisor receives proprietary research from broker-dealers that execute fund portfolio transactions and concluded that this research is likely to benefit Fund shareholders. The Board also determined that the Advisor is able to provide investment management services to certain clients other than the Fund, at least in part, due to its existing infrastructure built to serve the fund complex. The Board concluded, however, that the assets of those other clients are not material to the analysis and, where applicable, may be included with the assets of the Fund to determine breakpoints in the management fee schedule.
Existing Relationship. The Board also considered whether there was any reason for not continuing the existing arrangement with the Advisor. In this regard, the Board was mindful of the potential disruptions of the Fund’s operations and various risks, uncertainties, and other effects that could occur as a result of a decision not to continue such relationship. In particular, the Board recognized that most shareholders have invested in the Fund on the strength of the Advisor’s industry standing and reputation and in the expectation that the Advisor will have a continuing role in providing advisory services to the Fund.
Conclusion of the Directors. As a result of this process, the Board, including all of the independent directors and assisted by the advice of independent legal counsel, taking into account all of the factors discussed above and the information provided by the Advisor and others, concluded that the management agreement between the Fund and the Advisor is fair and reasonable in light of the services provided and should be renewed.
Retirement Account Information
As required by law, distributions you receive from certain IRAs, or 403(b), 457 and qualified plans are subject to federal income tax withholding, unless you elect not to have withholding apply. Tax will be withheld on the total amount withdrawn even though you may be receiving amounts that are not subject to withholding, such as nondeductible contributions. In such case, excess amounts of withholding could occur. You may adjust your withholding election so that a greater or lesser amount will be withheld.
If you don’t want us to withhold on this amount, you must notify us to not withhold the federal income tax. You may notify us in writing or in certain situations by telephone or through other electronic means. You have the right to revoke your withholding election at any time and any election you make may remain in effect until revoked by filing a new election.
Remember, even if you elect not to have income tax withheld, you are liable for paying income tax on the taxable portion of your withdrawal. If you elect not to have income tax withheld or you don’t have enough income tax withheld, you may be responsible for payment of estimated tax. You may incur penalties under the estimated tax rules if your withholding and estimated tax payments are not sufficient. You can reduce or defer the income tax on a distribution by directly or indirectly rolling such distribution over to another IRA or eligible plan. You should consult your tax advisor for additional information.
State tax will be withheld if, at the time of your distribution, your address is within one of the mandatory withholding states and you have federal income tax withheld. State taxes will be withheld from your distribution in accordance with the respective state rules.
Proxy Voting Guidelines
American Century Investment Management, Inc., the fund’s investment advisor, is responsible for exercising the voting rights associated with the securities purchased and/or held by the fund. A description of the policies and procedures the advisor uses in fulfilling this responsibility is available without charge, upon request, by calling 1-800-345-2021. It is also available on American Century Investments’ website at americancentury.com and on the Securities and Exchange Commission’s website at sec.gov. Information regarding how the investment advisor voted proxies relating to portfolio securities during the most recent 12-month period ended June 30 is available on the “About Us” page at americancentury.com. It is also available at sec.gov.
Quarterly Portfolio Disclosure
The fund files its complete schedule of portfolio holdings with the Securities and Exchange Commission (SEC) for the first and third quarters of each fiscal year on Form N-Q. The fund’s Forms N-Q are available on the SEC’s website at sec.gov, and may be reviewed and copied at the SEC’s Public Reference Room in Washington, DC. Information on the operation of the Public Reference Room may be obtained by calling 1-800-SEC-0330. The fund also makes its complete schedule of portfolio holdings for the most recent quarter of its fiscal year available on its website at americancentury.com and, upon request, by calling 1-800-345-2021.
Other Tax Information
The following information is provided pursuant to provisions of the Internal Revenue Code.
The fund hereby designates up to the maximum amount allowable as qualified dividend income for the fiscal year ended June 30, 2012.
For corporate taxpayers, the fund hereby designates $805,608, or up to the maximum amount allowable, of ordinary income distributions paid during the fiscal year ended June 30, 2012 as qualified for the corporate dividends received deduction.
| Contact Us | americancentury.com |
| Automated Information Line | 1-800-345-8765 |
| Investor Services Representative | 1-800-345-2021 or 816-531-5575 |
| Investors Using Advisors | 1-800-378-9878 |
| Business, Not-For-Profit, Employer-Sponsored Retirement Plans | 1-800-345-3533 |
| Banks and Trust Companies, Broker-Dealers, Financial Professionals, Insurance Companies | 1-800-345-6488 |
| Telecommunications Device for the Deaf | 1-800-634-4113 |
American Century Quantitative Equity Funds, Inc.
Investment Advisor:
American Century Investment Management, Inc.
Kansas City, Missouri
This report and the statements it contains are submitted for the general information of our shareholders. The report is not authorized for distribution to prospective investors unless preceded or accompanied by an effective prospectus.
©2012 American Century Proprietary Holdings, Inc. All rights reserved.
CL-ANN-75842 1208
ANNUAL REPORT JUNE 30, 2012
| President’s Letter | 2 |
| Market Perspective | 3 |
| Performance | 4 |
| Portfolio Commentary | 5 |
| Fund Characteristics | 7 |
| Shareholder Fee Example | 8 |
| Schedule of Investments | 10 |
| Statement of Assets and Liabilities | 17 |
| Statement of Operations | 18 |
| Statement of Changes in Net Assets | 19 |
| Notes to Financial Statements | 20 |
| Financial Highlights | 25 |
| Report of Independent Registered Public Accounting Firm | 26 |
| Management | 27 |
| Approval of Management Agreement | 30 |
| Additional Information | 35 |
Any opinions expressed in this report reflect those of the author as of the date of the report, and do not necessarily represent the opinions of American Century Investments® or any other person in the American Century Investments organization. Any such opinions are subject to change at any time based upon market or other conditions and American Century Investments disclaims any responsibility to update such opinions. These opinions may not be relied upon as investment advice and, because investment decisions made by American Century Investments funds are based on numerous factors, may not be relied upon as an indication of trading intent on behalf of any American Century Investments fund. Security examples are used for representational purposes only and are not intended as recommendations to purchase or sell securities. Performance information for comparative indices and securities is provided to American Century Investments by third party vendors. To the best of American Century Investments’ knowledge, such information is accurate at the time of printing.
Dear Investor:
Thank you for reviewing this annual report for the period ended June 30, 2012. Our report offers investment performance and portfolio information, presented with the expert perspective of our portfolio management team.
This report remains one of our most important vehicles for conveying information about fund returns, as well as market factors and strategies that affected fund performance. For additional, updated information, we encourage you to visit our website, americancentury.com. Click on the “Fund Performance” and “Insights & News” headings at the top of our Individual Investors site.
Flight to Quality as Economic and Financial Uncertainties Resurfaced
During the second half of 2011 and the first half of 2012, the global economy and financial markets struggled to move beyond the lingering aftereffects of the 2008 Financial Crisis and Great Recession. Global economic fundamentals have improved since 2008, but weakened since 2010, with increased uncertainty surrounding near-term economic growth levels in major developed economies such as the U.S., Japan, and Europe. There were also questions about near-term growth levels in influential emerging economies such as China.
These near-term uncertainties manifested themselves in asset returns for the 12 months ended June 30, 2012. Assets perceived to be “safe-haven” investments rallied—the 30-year U.S. Treasury bond posted a 39% total return. At the other end of the spectrum, international stock returns for U.S. investors were undermined by a combination of risk-averse investing attitudes, weakening global economic growth, and a stronger U.S. dollar versus the euro and currencies of other struggling economies. Commodity prices also plunged during the period.
Unfortunately, the instability that triggered much of this flight-to-quality trading remains largely in place, and the coming months may bring additional uncertainties about the U.S. presidential election and what might happen when various U.S. tax cuts and other stimulative measures expire in 2013 (the so-called “Fiscal Cliff”). In this uncertain, unstable environment, we continue to believe in a disciplined, diversified, long-term investment approach, using both stocks and bonds, as appropriate. We appreciate your continued trust in us during these unsettled times.
Sincerely,
Jonathan Thomas
President and Chief Executive Officer
American Century Investments
By Scott Wittman, Chief Investment Officer, Quantitative Equity
and Asset Allocation
U.S. Stocks Mixed but Generally Higher
The U.S. stock market faced significant volatility during the 12 months ended June 30, 2012, but ultimately posted positive overall returns. As the reporting period began, stocks were in the midst of an accelerating market decline as evidence of a slowdown in U.S. economic activity and a worsening sovereign debt crisis in Europe put downward pressure on the equity market.
In early October, however, the equity market bottomed and reversed course, enjoying a substantial rebound through the fourth quarter of 2011 and first quarter of 2012. Investors grew more optimistic as signs of improving economic activity quashed recession fears; in particular, job growth consistently exceeded expectations, driving the unemployment rate down to its lowest level in more than three years. Another positive factor was better news out of Europe as the European Central Bank provided long-term financing to the debt markets and support for the Continent’s banking sector.
The final three months of the period brought another reversal as the headwinds facing the equity market at the start of the period returned to the forefront. Evidence of slowing economic activity in the U.S. and adverse developments in Europe—including political turmoil in Greece and troubled banks in Spain—weighed on investor confidence, sending stocks down sharply.
Large-Cap Stocks Outperformed
��
For the 12-month period, the broad equity indices (as represented by the S&P 500 Index and Russell 3000 Index) rose by 4–5%. As the table below illustrates, however, there was a divergence in returns as large-cap stocks advanced while mid- and small-cap issues declined modestly. Growth and value stocks were mixed—growth issues outperformed among large-cap stocks, while value shares held up better in the mid- and small-cap segments of the market.
From a sector perspective, the defensive sectors of the market fared best. Utilities, consumer staples, and telecommunication services stocks all generated double-digit gains for the reporting period. On the downside, the commodity-driven energy and materials sectors fell the most during the period, reflecting a broad decline in commodity prices.
| U.S. Stock Index Returns |
| For the 12 months ended June 30, 2012 |
| Russell 1000 Index (Large-Cap) | 4.37% | | Russell 2000 Index (Small-Cap) | -2.08% |
| Russell 1000 Growth Index | 5.76% | | Russell 2000 Growth Index | -2.71% |
| Russell 1000 Value Index | 3.01% | | Russell 2000 Value Index | -1.44% |
| Russell Midcap Index | -1.65% | | |
| Russell Midcap Growth Index | -2.99% | | | |
| Russell Midcap Value Index | -0.37% | | | |
| Total Returns as of June 30, 2012 |
| | | | Average Annual Returns | |
| | Ticker Symbol | 1 year | 5 years | Since Inception | Inception Date |
| Institutional Class | ACLOX | -0.98% | -2.82% | -1.25% | 5/12/06 |
| S&P SmallCap 600 Index | — | 1.43% | 1.83% | 3.18%(1) | — |
Russell 2000 Index(2) | — | -2.08% | 0.54% | 2.09%(1) | — |
| (1) | Since 4/30/06, the date nearest the Institutional Class’s inception for which data are available. |
| (2) | Effective July 1, 2012, the fund’s benchmark will change from the S&P SmallCap 600 Index to the Russell 2000 Index. The fund’s investment advisor believes this index better represents the fund’s portfolio holdings. |
| Growth of $10,000 Over Life of Class |
| $10,000 investment made May 12, 2006 |
* From 5/12/06, the Institutional Class’s inception date. Index data from 4/30/06, the date nearest the Institutional Class’s inception for which data are available. Not annualized.
| Total Annual Fund Operating Expenses |
Institutional Class 0.70% |
The total annual fund operating expenses shown is as stated in the fund’s prospectus current as of the date of this report. The prospectus may vary from the expense ratio shown elsewhere in this report because it is based on a different time period, includes acquired fund fees and expenses, and, if applicable, does not include fee waivers or expense reimbursements.
Data presented reflect past performance. Past performance is no guarantee of future results. Current performance may be higher or lower than the performance shown. Investment return and principal value will fluctuate, and redemption value may be more or less than original cost. To obtain performance data current to the most recent month end, please call 1-800-345-2021 or visit americancentury.com. Historically, small company stocks have been more volatile than the stocks of larger, more established companies.
Data assumes reinvestment of dividends and capital gains, and none of the charts reflect the deduction of taxes that a shareholder would pay on fund distributions or the redemption of fund shares. Returns for the indices are provided for comparison. The fund’s total returns include operating expenses (such as transaction costs and management fees) that reduce returns, while the total returns of the indices do not.
Portfolio Managers: Brian Garbe and Tal Sansani
Performance Summary
NT Small Company returned –0.98% for the fiscal year ended June 30, 2012, compared with the 1.43% return of its benchmark, the S&P SmallCap 600 Index. The small-cap Russell 2000 Index returned –2.08%. (Effective July 1, 2012, the fund’s benchmark will change from the S&P SmallCap 600 Index to the Russell 2000 Index.)
In an up-and-down period for the U.S. stock market (see page 3 for details), NT Small Company declined modestly for the 12 months, trailing the small positive return of the S&P SmallCap 600 Index. Individual stock selection, a critical element of our investment process, was the primary factor behind the underperformance versus the index, particularly in the information technology and financials sectors.
Absolute Performance Driven by Technology and Energy
NT Small Company’s negative absolute return for the 12-month period was driven primarily by double-digit declines in the information technology and energy sectors of the portfolio. The most significant detractors in the information technology sector were two semiconductor manufacturers, Veeco Instruments and OmniVision Technologies. In the energy sector, the biggest detractor was energy services and equipment provider ION Geophysical.
The fund’s holdings in the materials sector also had a negative impact on absolute results as falling commodity prices weighed on this sector. Notable detractors included chemicals producers OM Group, Ferro, and TPC Group.
On the positive side, the fund’s holdings in the consumer discretionary and health care sectors boosted fund performance for the 12 months. The top two contributors to absolute performance in the portfolio were consumer discretionary stocks—gaming machine company Multimedia Games and recreational vehicle maker Arctic Cat. In the health care sector, the leading contributors included biotechnology firms Pharmacyclics and ViroPharma, as well as orthodontic products maker Align Technology (a top 10 holding at the end of the period).
Technology and Financials Detracted
Looking at performance versus the S&P SmallCap 600 Index, the fund’s holdings in the information technology and financials sectors contributed the most to its underperformance of the index for the 12 months. Stock selection among IT services providers and semiconductor manufacturers detracted the most in the information technology sector. As was the case for absolute performance, the biggest detractors from relative performance in this sector were OmniVision Technologies and Veeco Instruments. Increased competition in its core image sensors business weighed on OmniVision’s stock, while Veeco faced slumping demand, especially in its solar products unit.
In the financials sector, stock choices among commercial banks and capital markets firms produced the bulk of the underperformance. The most significant individual decision that detracted from results versus the benchmark in this sector was avoiding insurance firm Delphi Financial Group, which rallied sharply after agreeing to be acquired by Japanese insurer Tokio Marine Holdings.
Other noteworthy detractors in the portfolio included navigation software maker TeleNav, medical equipment and supplies company Invacare, and Internet-based telecom services provider Vonage Holdings. TeleNav struggled with increased competition in its mobile voice-guided navigation systems business; Invacare faced a regulatory injunction that threatened to suspend operations at one of its plants; and Vonage fell as higher marketing costs weighed on profit margins.
Consumer Discretionary and Energy Outperformed
Stock selection was most successful in consumer discretionary and energy sectors of the portfolio compared with the S&P SmallCap 600 Index. Stock choices among leisure equipment makers generated the bulk of the outperformance in the consumer discretionary sector. The top relative performance contributors were also the top absolute contributors—Multimedia Games and Arctic Cat. Multimedia Games, which produces networked gaming systems for casinos and state lotteries, consistently exceeded earnings expectations as the company expanded its footprint in the U.S. gaming market. Arctic Cat benefited from strong sales of its snowmobiles and all-terrain vehicles, as well as from the introduction of innovative new products.
In the energy sector, stock selection and an underweight position in energy equipment and services providers added the most value. The most effective investment decisions in this sector included avoiding oilfield equipment and services company Lufkin Industries and holding an overweight position in construction and engineering firm Willbros Group. Lufkin experienced declining demand in the first half of 2012, which led to an earnings shortfall. In contrast, Willbros, which was added to the portfolio in late 2011, rallied substantially in the first half of 2012 as the company reported stronger-than-expected revenues and secured a contract for a new pipeline construction project.
Although the fund’s health care stocks had little overall impact on relative results, two holdings were among the top individual contributors—biotech firm Pharmacyclics and medical device maker Kensey Nash. Pharmacyclics, which focuses on small-molecule medications used to treat cancer and auto-immune diseases, rallied sharply as the company announced promising clinical trial data for an experimental lymphoma drug. Kensey Nash was acquired by Dutch life sciences company Royal DSM at a sizable premium.
A Look Ahead
As we move into the second half of 2012, the U.S. equity market is likely to remain volatile given the uncertainty regarding the economic outlook, the European debt situation, and the upcoming U.S. presidential election. Heightened levels of volatility often provide investment opportunities, and our disciplined, objective, and systematic investment strategy is designed to take advantage of these opportunities at the individual company level. We believe this approach is the most powerful way to capitalize on market inefficiencies that lead to the mispricing of individual stocks.
| JUNE 30, 2012 |
| Top Ten Holdings | % of net assets |
| Energy XXI Bermuda Ltd. | 0.8% |
| Coinstar, Inc. | 0.7% |
| EMCOR Group, Inc. | 0.7% |
| Align Technology, Inc. | 0.7% |
| CommVault Systems, Inc. | 0.7% |
| Helix Energy Solutions Group, Inc. | 0.7% |
| Moog, Inc., Class A | 0.7% |
| Tetra Tech, Inc. | 0.6% |
| Ciena Corp. | 0.6% |
| FEI Co. | 0.6% |
| |
| Top Five Industries | % of net assets |
| Real Estate Investment Trusts (REITs) | 7.3% |
| Commercial Banks | 4.8% |
| Software | 3.9% |
| Oil, Gas and Consumable Fuels | 3.8% |
| Insurance | 3.8% |
| |
| Types of Investments in Portfolio | % of net assets |
| Common Stocks | 99.2% |
| Temporary Cash Investments | 1.3% |
| Other Assets and Liabilities | (0.5)% |
Fund shareholders may incur two types of costs: (1) transaction costs, including sales charges (loads) on purchase payments and redemption/exchange fees; and (2) ongoing costs, including management fees; distribution and service (12b-1) fees; and other fund expenses. This example is intended to help you understand your ongoing costs (in dollars) of investing in your fund and to compare these costs with the ongoing cost of investing in other mutual funds.
The example is based on an investment of $1,000 made at the beginning of the period and held for the entire period from January 1, 2012 to June 30, 2012.
Actual Expenses
The table provides information about actual account values and actual expenses for each class. You may use the information, together with the amount you invested, to estimate the expenses that you paid over the period. First, identify the share class you own. Then simply divide your account value by $1,000 (for example, an $8,600 account value divided by $1,000 = 8.6), then multiply the result by the number under the heading “Expenses Paid During Period” to estimate the expenses you paid on your account during this period.
If you hold Investor Class shares of any American Century Investments fund, or Institutional Class shares of the American Century Diversified Bond Fund, in an American Century Investments account (i.e., not a financial intermediary or retirement plan account), American Century Investments may charge you a $12.50 semiannual account maintenance fee if the value of those shares is less than $10,000. We will redeem shares automatically in one of your accounts to pay the $12.50 fee. In determining your total eligible investment amount, we will include your investments in all personal accounts (including American Century Investments Brokerage accounts) registered under your Social Security number. Personal accounts include individual accounts, joint accounts, UGMA/UTMA accounts, personal trusts, Coverdell Education Savings Accounts and IRAs (including traditional, Roth, Rollover, SEP-, SARSEP- and SIMPLE-IRAs), and certain other retirement accounts. If you have only business, business retirement, employer-sponsored or American Century Investments Brokerage accounts, you are currently not subject to this fee. If you are subject to the Account Maintenance Fee, your account value could be reduced by the fee amount.
Hypothetical Example for Comparison Purposes
The table also provides information about hypothetical account values and hypothetical expenses based on the actual expense ratio of each class of your fund and an assumed rate of return of 5% per year before expenses, which is not the actual return of a fund’s share class. The hypothetical account values and expenses may not be used to estimate the actual ending account balance or expenses you paid for the period. You may use this information to compare the ongoing costs of investing in your fund and other funds. To do so, compare this 5% hypothetical example with the 5% hypothetical examples that appear in the shareholder reports of the other funds.
Please note that the expenses shown in the table are meant to highlight your ongoing costs only and do not reflect any transactional costs, such as sales charges (loads) or redemption/exchange fees. Therefore, the table is useful in comparing ongoing costs only, and will not help you determine the relative total costs of owning different funds. In addition, if these transactional costs were included, your costs would have been higher.
| | Beginning Account Value 1/1/12 | Ending Account Value 6/30/12 | Expenses Paid During Period(1) 1/1/12 – 6/30/12 | Annualized Expense Ratio(1) |
| Actual | | | | |
| Institutional Class | $1,000 | $1,065.70 | $3.49 | 0.68% |
| Hypothetical | | | | |
| Institutional Class | $1,000 | $1,021.48 | $3.42 | 0.68% |
| (1) | Expenses are equal to the class’s annualized expense ratio listed in the table above, multiplied by the average account value over the period, multiplied by 182, the number of days in the most recent fiscal half-year, divided by 366, to reflect the one-half year period. |
| | | Shares | | | Value | |
| Common Stocks — 99.2% | |
| AEROSPACE AND DEFENSE — 1.4% | |
| Alliant Techsystems, Inc. | | | 3,960 | | | | $200,257 | |
Astronics Corp.(1) | | | 3,217 | | | | 90,848 | |
| Curtiss-Wright Corp. | | | 2,229 | | | | 69,210 | |
Moog, Inc., Class A(1) | | | 28,313 | | | | 1,170,743 | |
| Sypris Solutions, Inc. | | | 4,776 | | | | 33,289 | |
Taser International, Inc.(1) | | | 59,221 | | | | 310,318 | |
Teledyne Technologies, Inc.(1) | | | 9,651 | | | | 594,984 | |
| | | | | | | | 2,469,649 | |
| AIR FREIGHT AND LOGISTICS — 0.8% | |
| Forward Air Corp. | | | 27,361 | | | | 882,940 | |
Park-Ohio Holdings Corp.(1) | | | 28,336 | | | | 539,234 | |
| | | | | | | | 1,422,174 | |
| AIRLINES — 0.5% | |
Alaska Air Group, Inc.(1) | | | 14,521 | | | | 521,304 | |
Spirit Airlines, Inc.(1) | | | 14,987 | | | | 291,647 | |
| | | | | | | | 812,951 | |
| AUTO COMPONENTS — 0.4% | |
| Spartan Motors, Inc. | | | 55,937 | | | | 293,110 | |
WABCO Holdings, Inc.(1) | | | 9,583 | | | | 507,228 | |
| | | | | | | | 800,338 | |
| BEVERAGES — 0.2% | |
| Coca-Cola Bottling Co. Consolidated | | | 5,312 | | | | 341,455 | |
| BIOTECHNOLOGY — 2.5% | |
Agenus, Inc.(1) | | | 19,426 | | | | 101,792 | |
BioCryst Pharmaceuticals, Inc.(1) | | | 20,355 | | | | 81,013 | |
Cubist Pharmaceuticals, Inc.(1) | | | 21,906 | | | | 830,457 | |
Genomic Health, Inc.(1) | | | 5,533 | | | | 184,802 | |
Momenta Pharmaceuticals, Inc.(1) | | | 19,876 | | | | 268,724 | |
| PDL BioPharma, Inc. | | | 79,926 | | | | 529,909 | |
Pharmacyclics, Inc.(1) | | | 10,589 | | | | 578,265 | |
Progenics Pharmaceuticals, Inc.(1) | | | 38,748 | | | | 378,955 | |
Spectrum Pharmaceuticals, Inc.(1) | | | 55,263 | | | | 859,892 | |
United Therapeutics Corp.(1) | | | 11,217 | | | | 553,896 | |
| | | | | | | | 4,367,705 | |
| BUILDING PRODUCTS — 0.6% | |
Gibraltar Industries, Inc.(1) | | | 43,683 | | | | 453,430 | |
Patrick Industries, Inc.(1) | | | 12,160 | | | | 155,040 | |
Trex Co., Inc.(1) | | | 15,468 | | | | 465,432 | |
| | | | | | | | 1,073,902 | |
| CAPITAL MARKETS — 1.7% | |
| Apollo Investment Corp. | | | 2,256 | | | | 17,326 | |
| Calamos Asset Management, Inc., Class A | | | 47,237 | | | | 540,864 | |
| Diamond Hill Investment Group, Inc. | | | 5,148 | | | | 403,037 | |
| Epoch Holding Corp. | | | 2,780 | | | | 63,328 | |
FBR & Co.(1) | | | 12,118 | | | | 33,567 | |
| FXCM, Inc., Class A | | | 39,898 | | | | 469,200 | |
| Greenhill & Co., Inc. | | | 12,703 | | | | 452,862 | |
INTL FCStone, Inc.(1) | | | 11,023 | | | | 213,295 | |
Investment Technology Group, Inc.(1) | | | 26,574 | | | | 244,481 | |
| Janus Capital Group, Inc. | | | 10,757 | | | | 84,120 | |
| Manning & Napier, Inc. | | | 16,454 | | | | 234,140 | |
| NGP Capital Resources Co. | | | 6,464 | | | | 45,765 | |
| Pzena Investment Management, Inc., Class A | | | 35,628 | | | | 157,832 | |
SWS Group, Inc.(1) | | | 3,714 | | | | 19,796 | |
| | | | | | | | 2,979,613 | |
| CHEMICALS — 1.8% | |
Flotek Industries, Inc.(1) | | | 42,062 | | | | 392,859 | |
| Georgia Gulf Corp. | | | 39,323 | | | | 1,009,421 | |
| H.B. Fuller Co. | | | 32,284 | | | | 991,119 | |
| Minerals Technologies, Inc. | | | 4,529 | | | | 288,860 | |
| Rockwood Holdings, Inc. | | | 2,969 | | | | 131,675 | |
TPC Group, Inc.(1) | | | 9,468 | | | | 349,843 | |
| | | | | | | | 3,163,777 | |
| COMMERCIAL BANKS — 4.8% | |
| CapitalSource, Inc. | | | 76,116 | | | | 511,500 | |
Central Pacific Financial Corp.(1) | | | 33,242 | | | | 469,377 | |
Citizens Republic Bancorp, Inc.(1) | | | 5,888 | | | | 100,862 | |
| City Holding Co. | | | 9,544 | | | | 321,537 | |
| City National Corp. | | | 6,777 | | | | 329,227 | |
| Columbia Banking System, Inc. | | | 37,719 | | | | 709,872 | |
| Community Bank System, Inc. | | | 11,478 | | | | 311,283 | |
| CVB Financial Corp. | | | 56,973 | | | | 663,736 | |
| Enterprise Financial Services Corp. | | | 3,164 | | | | 34,677 | |
| F.N.B. Corp. | | | 8,085 | | | | 87,884 | |
| First Financial Bancorp | | | 49,943 | | | | 798,089 | |
| Home Bancshares, Inc. | | | 8,909 | | | | 272,437 | |
| International Bancshares Corp. | | | 8,593 | | | | 167,735 | |
| Old National Bancorp | | | 33,835 | | | | 406,358 | |
| | | | | | | | | |
| | | | Shares | | | | Value | |
| PacWest Bancorp | | | 35,589 | | | | $842,392 | |
Pinnacle Financial Partners, Inc.(1) | | | 10,599 | | | | 206,787 | |
| Tompkins Financial Corp. | | | 983 | | | | 37,039 | |
| Trustmark Corp. | | | 14,713 | | | | 360,174 | |
| UMB Financial Corp. | | | 21,073 | | | | 1,079,570 | |
| Westamerica Bancorp. | | | 6,169 | | | | 291,115 | |
Wilshire Bancorp, Inc.(1) | | | 81,254 | | | | 445,272 | |
| | | | | | | | 8,446,923 | |
| COMMERCIAL SERVICES AND SUPPLIES — 1.5% | |
| Deluxe Corp. | | | 19,232 | | | | 479,646 | |
| Herman Miller, Inc. | | | 12,677 | | | | 234,778 | |
| HNI Corp. | | | 1,618 | | | | 41,664 | |
| Intersections, Inc. | | | 15,271 | | | | 242,045 | |
Standard Parking Corp.(1) | | | 6,373 | | | | 137,147 | |
Tetra Tech, Inc.(1) | | | 44,016 | | | | 1,147,937 | |
TRC Cos., Inc.(1) | | | 20,036 | | | | 121,819 | |
| US Ecology, Inc. | | | 16,134 | | | | 286,217 | |
| | | | | | | | 2,691,253 | |
| COMMUNICATIONS EQUIPMENT — 2.7% | |
Arris Group, Inc.(1) | | | 78,209 | | | | 1,087,887 | |
Aviat Networks, Inc.(1) | | | 11,772 | | | | 32,962 | |
Brocade Communications Systems, Inc.(1) | | | 78,748 | | | | 388,228 | |
Calix, Inc.(1) | | | 66,270 | | | | 544,739 | |
Ciena Corp.(1) | | | 70,015 | | | | 1,146,145 | |
| Comtech Telecommunications Corp. | | | 25,159 | | | | 719,044 | |
Globecomm Systems, Inc.(1) | | | 10,505 | | | | 106,521 | |
| Loral Space & Communications, Inc. | | | 3,685 | | | | 248,185 | |
| Plantronics, Inc. | | | 13,099 | | | | 437,507 | |
| Tessco Technologies, Inc. | | | 5,122 | | | | 112,940 | |
| | | | | | | | 4,824,158 | |
| COMPUTERS AND PERIPHERALS — 1.0% | |
Electronics for Imaging, Inc.(1) | | | 12,017 | | | | 195,276 | |
QLogic Corp.(1) | | | 31,663 | | | | 433,466 | |
Synaptics, Inc.(1) | | | 30,304 | | | | 867,604 | |
| Xyratex Ltd. | | | 31,938 | | | | 361,219 | |
| | | | | | | | 1,857,565 | |
| CONSTRUCTION AND ENGINEERING — 1.5% | |
| Argan, Inc. | | | 9,938 | | | | 138,933 | |
| EMCOR Group, Inc. | | | 44,209 | | | | 1,229,895 | |
| Granite Construction, Inc. | | | 17,072 | | | | 445,750 | |
Michael Baker Corp.(1) | | | 13,730 | | | | 358,216 | |
| URS Corp. | | | 13,706 | | | | 478,065 | |
| | | | | | | | 2,650,859 | |
| CONSTRUCTION MATERIALS — 0.4% | |
Headwaters, Inc.(1) | | | 127,629 | | | | 657,289 | |
United States Lime & Minerals, Inc.(1) | | | 1,407 | | | | 65,665 | |
| | | | | | | | 722,954 | |
| CONSUMER FINANCE — 1.0% | |
| Cash America International, Inc. | | | 22,163 | | | | 976,058 | |
World Acceptance Corp.(1) | | | 12,517 | | | | 823,619 | |
| | | | | | | | 1,799,677 | |
| CONTAINERS AND PACKAGING — 0.5% | |
| Boise, Inc. | | | 44,491 | | | | 292,751 | |
| Myers Industries, Inc. | | | 36,596 | | | | 627,987 | |
| | | | | | | | 920,738 | |
| DISTRIBUTORS — 0.1% | |
| Core-Mark Holding Co., Inc. | | | 3,153 | | | | 151,785 | |
| DIVERSIFIED CONSUMER SERVICES — 1.3% | |
American Public Education, Inc.(1) | | | 4,696 | | | | 150,272 | |
Bridgepoint Education, Inc.(1) | | | 22,976 | | | | 500,877 | |
Coinstar, Inc.(1) | | | 18,929 | | | | 1,299,665 | |
ITT Educational Services, Inc.(1) | | | 7,267 | | | | 441,470 | |
| | | | | | | | 2,392,284 | |
| DIVERSIFIED FINANCIAL SERVICES — 0.6% | |
| Interactive Brokers Group, Inc., Class A | | | 49,920 | | | | 734,822 | |
| MarketAxess Holdings, Inc. | | | 14,784 | | | | 393,846 | |
| | | | | | | | 1,128,668 | |
| DIVERSIFIED TELECOMMUNICATION SERVICES — 0.6% | |
| IDT Corp., Class B | | | 19,184 | | | | 188,195 | |
Premiere Global Services, Inc.(1) | | | 52,726 | | | | 442,371 | |
Vonage Holdings Corp.(1) | | | 202,375 | | | | 406,774 | |
| | | | | | | | 1,037,340 | |
| ELECTRIC UTILITIES — 1.0% | |
| Hawaiian Electric Industries, Inc. | | | 17,917 | | | | 510,993 | |
| MGE Energy, Inc. | | | 8,460 | | | | 400,158 | |
| Otter Tail Corp. | | | 15,170 | | | | 346,938 | |
| Portland General Electric Co. | | | 19,352 | | | | 515,924 | |
| | | | | | | | 1,774,013 | |
| ELECTRICAL EQUIPMENT — 1.5% | |
| Acuity Brands, Inc. | | | 7,834 | | | | 398,829 | |
| Belden, Inc. | | | 33,218 | | | | 1,107,821 | |
EnerSys(1) | | | 16,717 | | | | 586,265 | |
Generac Holdings, Inc.(1) | | | 20,836 | | | | 501,314 | |
Ultralife Corp.(1) | | | 27,336 | | | | 105,517 | |
| | | | | | | | 2,699,746 | |
| ELECTRONIC EQUIPMENT, INSTRUMENTS AND COMPONENTS — 3.3% | |
Agilysys, Inc.(1) | | | 6,581 | | | | $57,057 | |
| Electro Scientific Industries, Inc. | | | 24,685 | | | | 291,777 | |
FEI Co.(1) | | | 23,819 | | | | 1,139,501 | |
Itron, Inc.(1) | | | 12,358 | | | | 509,644 | |
| Littelfuse, Inc. | | | 13,881 | | | | 789,690 | |
LoJack Corp.(1) | | | 44,076 | | | | 133,109 | |
| MTS Systems Corp. | | | 8,473 | | | | 326,634 | |
Newport Corp.(1) | | | 26,719 | | | | 321,162 | |
Plexus Corp.(1) | | | 14,379 | | | | 405,488 | |
SYNNEX Corp.(1) | | | 23,778 | | | | 820,103 | |
Tech Data Corp.(1) | | | 9,609 | | | | 462,866 | |
Vishay Intertechnology, Inc.(1) | | | 33,839 | | | | 319,102 | |
Zygo Corp.(1) | | | 13,022 | | | | 232,573 | |
| | | | | | | | 5,808,706 | |
| ENERGY EQUIPMENT AND SERVICES — 2.7% | |
Basic Energy Services, Inc.(1) | | | 101,502 | | | | 1,047,501 | |
C&J Energy Services, Inc.(1) | | | 27,011 | | | | 499,703 | |
Helix Energy Solutions Group, Inc.(1) | | | 72,787 | | | | 1,194,435 | |
Hornbeck Offshore Services, Inc.(1) | | | 4,717 | | | | 182,925 | |
ION Geophysical Corp.(1) | | | 16,469 | | | | 108,531 | |
Mitcham Industries, Inc.(1) | | | 10,403 | | | | 176,539 | |
Natural Gas Services Group, Inc.(1) | | | 7,950 | | | | 117,819 | |
Parker Drilling Co.(1) | | | 85,544 | | | | 385,803 | |
TGC Industries, Inc.(1) | | | 46,060 | | | | 447,243 | |
Willbros Group, Inc.(1) | | | 87,150 | | | | 562,989 | |
| | | | | | | | 4,723,488 | |
| FOOD AND STAPLES RETAILING — 0.9% | |
| Andersons, Inc. (The) | | | 18,277 | | | | 779,697 | |
| Spartan Stores, Inc. | | | 37,527 | | | | 680,364 | |
| SUPERVALU, Inc. | | | 35,273 | | | | 182,714 | |
| | | | | | | | 1,642,775 | |
| FOOD PRODUCTS — 1.8% | |
| Cal-Maine Foods, Inc. | | | 17,907 | | | | 700,164 | |
Darling International, Inc.(1) | | | 42,727 | | | | 704,568 | |
Dean Foods Co.(1) | | | 30,155 | | | | 513,540 | |
Farmer Bros. Co.(1) | | | 15,398 | | | | 122,568 | |
| J&J Snack Foods Corp. | | | 12,098 | | | | 714,992 | |
Omega Protein Corp.(1) | | | 48,353 | | | | 355,878 | |
Smart Balance, Inc.(1) | | | 8,162 | | | | 76,641 | |
| | | | | | | | 3,188,351 | |
| GAS UTILITIES — 0.6% | |
| Northwest Natural Gas Co. | | | 22,073 | | | | 1,050,675 | |
| HEALTH CARE EQUIPMENT AND SUPPLIES — 3.7% | |
Align Technology, Inc.(1) | | | 36,698 | | | | 1,227,915 | |
| Analogic Corp. | | | 9,243 | | | | 573,066 | |
| CONMED Corp. | | | 25,382 | | | | 702,320 | |
CryoLife, Inc.(1) | | | 1,974 | | | | 10,324 | |
Cyberonics, Inc.(1) | | | 10,096 | | | | 453,714 | |
Cynosure, Inc., Class A(1) | | | 9,995 | | | | 211,394 | |
Greatbatch, Inc.(1) | | | 30,443 | | | | 691,361 | |
| Hill-Rom Holdings, Inc. | | | 14,479 | | | | 446,677 | |
ICU Medical, Inc.(1) | | | 4,869 | | | | 259,907 | |
| Invacare Corp. | | | 35,837 | | | | 552,965 | |
Orthofix International NV(1) | | | 11,111 | | | | 458,329 | |
RTI Biologics, Inc.(1) | | | 129,921 | | | | 488,503 | |
Thoratec Corp.(1) | | | 13,861 | | | | 465,452 | |
| | | | | | | | 6,541,927 | |
| HEALTH CARE PROVIDERS AND SERVICES — 2.2% | |
Amsurg Corp.(1) | | | 10,505 | | | | 314,940 | |
| Chemed Corp. | | | 13,947 | | | | 842,957 | |
Molina Healthcare, Inc.(1) | | | 29,868 | | | | 700,703 | |
PDI, Inc.(1) | | | 2,317 | | | | 19,092 | |
Providence Service Corp. (The)(1) | | | 33,464 | | | | 458,791 | |
Select Medical Holdings Corp.(1) | | | 36,679 | | | | 370,825 | |
Team Health Holdings, Inc.(1) | | | 21,238 | | | | 511,623 | |
Triple-S Management Corp. Class B(1) | | | 22,381 | | | | 409,125 | |
WellCare Health Plans, Inc.(1) | | | 3,958 | | | | 209,774 | |
| | | | | | | | 3,837,830 | |
| HEALTH CARE TECHNOLOGY — 0.4% | |
HealthStream, Inc.(1) | | | 18,141 | | | | 471,666 | |
MedAssets, Inc.(1) | | | 9,536 | | | | 128,259 | |
Omnicell, Inc.(1) | | | 5,216 | | | | 76,362 | |
| | | | | | | | 676,287 | |
| HOTELS, RESTAURANTS AND LEISURE — 2.4% | |
| Churchill Downs, Inc. | | | 7,822 | | | | 459,855 | |
| Cracker Barrel Old Country Store, Inc. | | | 15,573 | | | | 977,985 | |
| Interval Leisure Group, Inc. | | | 6,382 | | | | 121,322 | |
Multimedia Games Holding Co., Inc.(1) | | | 43,386 | | | | 607,404 | |
Papa John’s International, Inc.(1) | | | 16,103 | | | | 766,020 | |
Red Robin Gourmet Burgers, Inc.(1) | | | 16,296 | | | | 497,191 | |
Ruth’s Hospitality Group, Inc.(1) | | | 20,062 | | | | $132,409 | |
Shuffle Master, Inc.(1) | | | 37,719 | | | | 520,522 | |
Town Sports International Holdings, Inc.(1) | | | 17,724 | | | | 235,552 | |
| | | | | | | | 4,318,260 | |
| HOUSEHOLD DURABLES — 0.4% | |
| Blyth, Inc. | | | 14,130 | | | | 488,333 | |
| CSS Industries, Inc. | | | 6,203 | | | | 127,471 | |
iRobot Corp.(1) | | | 658 | | | | 14,575 | |
| | | | | | | | 630,379 | |
| INDUSTRIAL CONGLOMERATES — 0.4% | |
| Standex International Corp. | | | 16,782 | | | | 714,410 | |
| INSURANCE — 3.8% | |
| Allied World Assurance Co. Holdings AG | | | 5,843 | | | | 464,343 | |
American Safety Insurance Holdings Ltd.(1) | | | 22,289 | | | | 417,919 | |
AMERISAFE, Inc.(1) | | | 24,819 | | | | 644,053 | |
| Amtrust Financial Services, Inc. | | | 18,805 | | | | 558,697 | |
| Aspen Insurance Holdings Ltd. | | | 15,757 | | | | 455,377 | |
| Hanover Insurance Group, Inc. (The) | | | 11,643 | | | | 455,591 | |
| Maiden Holdings Ltd. | | | 55,041 | | | | 477,756 | |
| Meadowbrook Insurance Group, Inc. | | | 76,388 | | | | 671,451 | |
| Montpelier Re Holdings Ltd. | | | 21,489 | | | | 457,501 | |
National Financial Partners Corp.(1) | | | 71,191 | | | | 953,959 | |
| Protective Life Corp. | | | 18,874 | | | | 555,084 | |
| Symetra Financial Corp. | | | 23,768 | | | | 299,952 | |
| Universal Insurance Holdings, Inc. | | | 91,637 | | | | 312,482 | |
| | | | | | | | 6,724,165 | |
| INTERNET AND CATALOG RETAIL — 0.3% | |
1-800-Flowers.com, Inc. Class A(1) | | | 9,517 | | | | 33,215 | |
Orbitz Worldwide, Inc.(1) | | | 63,660 | | | | 232,359 | |
| PetMed Express, Inc. | | | 20,126 | | | | 244,732 | |
| | | | | | | | 510,306 | |
| INTERNET SOFTWARE AND SERVICES — 2.6% | |
Ancestry.com, Inc.(1) | | | 20,668 | | | | 568,990 | |
Blucora, Inc.(1) | | | 57,358 | | | | 706,651 | |
Constant Contact, Inc.(1) | | | 16,325 | | | | 291,891 | |
Demand Media, Inc.(1) | | | 64,599 | | | | 723,509 | |
Dice Holdings, Inc.(1) | | | 24,875 | | | | 233,576 | |
Digital River, Inc.(1) | | | 42,040 | | | | 698,705 | |
| IAC/InterActiveCorp | | | 11,740 | | | | 535,344 | |
| j2 Global, Inc. | | | 12,827 | | | | 338,889 | |
| United Online, Inc. | | | 121,175 | | | | 511,358 | |
| | | | | | | | 4,608,913 | |
| IT SERVICES — 1.7% | |
Acxiom Corp.(1) | | | 38,654 | | | | 584,062 | |
CACI International, Inc., Class A(1) | | | 18,509 | | | | 1,018,365 | |
CSG Systems International, Inc.(1) | | | 9,284 | | | | 160,427 | |
Dynamics Research Corp.(1) | | | 15,111 | | | | 87,795 | |
Global Cash Access Holdings, Inc.(1) | | | 60,123 | | | | 433,487 | |
TNS, Inc.(1) | | | 9,877 | | | | 177,193 | |
Unisys Corp.(1) | | | 26,552 | | | | 519,092 | |
| | | | | | | | 2,980,421 | |
| LEISURE EQUIPMENT AND PRODUCTS — 1.8% | |
Arctic Cat, Inc.(1) | | | 15,845 | | | | 579,293 | |
LeapFrog Enterprises, Inc.(1) | | | 90,191 | | | | 925,360 | |
| Polaris Industries, Inc. | | | 5,817 | | | | 415,799 | |
Smith & Wesson Holding Corp.(1) | | | 68,956 | | | | 573,025 | |
| Sturm Ruger & Co., Inc. | | | 17,275 | | | | 693,591 | |
| | | | | | | | 3,187,068 | |
| LIFE SCIENCES TOOLS AND SERVICES — 1.3% | |
Affymetrix, Inc.(1) | | | 63,559 | | | | 298,092 | |
Cambrex Corp.(1) | | | 72,774 | | | | 684,803 | |
Charles River Laboratories International, Inc.(1) | | | 6,799 | | | | 222,735 | |
PAREXEL International Corp.(1) | | | 39,399 | | | | 1,112,234 | |
| | | | | | | | 2,317,864 | |
| MACHINERY — 3.4% | |
| Actuant Corp., Class A | | | 35,826 | | | | 973,034 | |
| Albany International Corp., Class A | | | 3,243 | | | | 60,677 | |
| Ampco-Pittsburgh Corp. | | | 2,918 | | | | 53,487 | |
| Briggs & Stratton Corp. | | | 49,547 | | | | 866,577 | |
| FreightCar America, Inc. | | | 28,947 | | | | 664,913 | |
Hurco Cos., Inc.(1) | | | 2,167 | | | | 44,402 | |
Kadant, Inc.(1) | | | 21,172 | | | | 496,483 | |
| L.B. Foster Co., Class A | | | 14,557 | | | | 416,476 | |
| Miller Industries, Inc. | | | 22,031 | | | | 350,954 | |
| NACCO Industries, Inc., Class A | | | 5,625 | | | | 653,906 | |
| Robbins & Myers, Inc. | | | 4,417 | | | | 184,719 | |
| Sauer-Danfoss, Inc. | | | 10,514 | | | | 367,254 | |
| Sun Hydraulics Corp. | | | 6,605 | | | | 160,435 | |
Trimas Corp.(1) | | | 9,731 | | | | 195,593 | |
| Wabtec Corp. | | | 6,951 | | | | 542,247 | |
| | | | | | | | 6,031,157 | |
| MEDIA — 1.2% | |
| Arbitron, Inc. | | | 23,789 | | | | $832,615 | |
Carmike Cinemas, Inc.(1) | | | 50,127 | | | | 734,361 | |
LodgeNet Interactive Corp.(1) | | | 37,543 | | | | 49,181 | |
| Scholastic Corp. | | | 16,627 | | | | 468,216 | |
SuperMedia, Inc.(1) | | | 34,115 | | | | 85,288 | |
| | | | | | | | 2,169,661 | |
| METALS AND MINING — 1.1% | |
Aurizon Mines Ltd.(1) | | | 100,575 | | | | 453,593 | |
Coeur d’Alene Mines Corp.(1) | | | 25,488 | | | | 447,569 | |
Endeavour Silver Corp.(1) | | | 40,563 | | | | 329,372 | |
| Gold Resource Corp. | | | 9,480 | | | | 246,385 | |
Handy & Harman Ltd.(1) | | | 3,815 | | | | 51,426 | |
| Nevsun Resources Ltd. | | | 128,941 | | | | 417,769 | |
| | | | | | | | 1,946,114 | |
| MULTI-UTILITIES — 0.4% | |
| NorthWestern Corp. | | | 18,662 | | | | 684,895 | |
| MULTILINE RETAIL — 0.4% | |
| Dillard’s, Inc., Class A | | | 7,900 | | | | 503,072 | |
Dollar Tree, Inc.(1) | | | 3,228 | | | | 173,666 | |
| | | | | | | | 676,738 | |
| OIL, GAS AND CONSUMABLE FUELS — 3.8% | |
| Adams Resources & Energy, Inc. | | | 4,545 | | | | 190,526 | |
Callon Petroleum Co.(1) | | | 31,647 | | | | 134,816 | |
Cloud Peak Energy, Inc.(1) | | | 54,845 | | | | 927,429 | |
Contango Oil & Gas Co.(1) | | | 13,227 | | | | 783,039 | |
| Delek US Holdings, Inc. | | | 26,291 | | | | 462,459 | |
Energy Partners Ltd.(1) | | | 17,787 | | | | 300,600 | |
| Energy XXI Bermuda Ltd. | | | 42,808 | | | | 1,339,462 | |
Green Plains Renewable Energy, Inc.(1) | | | 17,237 | | | | 107,559 | |
| Knightsbridge Tankers Ltd. | | | 42,092 | | | | 342,629 | |
REX American Resources Corp.(1) | | | 20,665 | | | | 403,381 | |
| Targa Resources Corp. | | | 589 | | | | 25,150 | |
Tesoro Corp.(1) | | | 19,072 | | | | 476,037 | |
Vaalco Energy, Inc.(1) | | | 52,513 | | | | 453,187 | |
| W&T Offshore, Inc. | | | 13,809 | | | | 211,278 | |
| Western Refining, Inc. | | | 24,786 | | | | 551,984 | |
Westmoreland Coal Co.(1) | | | 2,499 | | | | 20,117 | |
| | | | | | | | 6,729,653 | |
| PAPER AND FOREST PRODUCTS — 1.1% | |
| Buckeye Technologies, Inc. | | | 27,669 | | | | 788,290 | |
| Neenah Paper, Inc. | | | 25,228 | | | | 673,335 | |
| P.H. Glatfelter Co. | | | 35,090 | | | | 574,423 | |
| | | | | | | | 2,036,048 | |
| PERSONAL PRODUCTS — 0.7% | |
Medifast, Inc.(1) | | | 35,120 | | | | 691,162 | |
USANA Health Sciences, Inc.(1) | | | 14,503 | | | | 596,363 | |
| | | | | | | | 1,287,525 | |
| PHARMACEUTICALS — 2.7% | |
Acura Pharmaceuticals, Inc.(1) | | | 20,644 | | | | 64,822 | |
Endo Health Solutions Inc.(1) | | | 6,985 | | | | 216,395 | |
Hi-Tech Pharmacal Co., Inc.(1) | | | 11,161 | | | | 361,616 | |
Medicines Co. (The)(1) | | | 45,336 | | | | 1,040,008 | |
| Medicis Pharmaceutical Corp., Class A | | | 15,057 | | | | 514,197 | |
Obagi Medical Products, Inc.(1) | | | 19,588 | | | | 299,109 | |
Par Pharmaceutical Cos., Inc.(1) | | | 16,450 | | | | 594,503 | |
Pozen, Inc.(1) | | | 17,759 | | | | 110,816 | |
Questcor Pharmaceuticals, Inc.(1) | | | 9,894 | | | | 526,757 | |
ViroPharma, Inc.(1) | | | 44,749 | | | | 1,060,551 | |
| | | | | | | | 4,788,774 | |
| PROFESSIONAL SERVICES — 1.7% | |
| Barrett Business Services, Inc. | | | 9,646 | | | | 203,916 | |
| Corporate Executive Board Co. (The) | | | 13,135 | | | | 536,959 | |
Exponent, Inc.(1) | | | 11,347 | | | | 599,462 | |
| Insperity, Inc. | | | 23,496 | | | | 635,567 | |
Navigant Consulting, Inc.(1) | | | 44,125 | | | | 557,740 | |
RPX Corp.(1) | | | 28,122 | | | | 403,551 | |
| | | | | | | | 2,937,195 | |
| REAL ESTATE INVESTMENT TRUSTS (REITs) — 7.3% | |
| BioMed Realty Trust, Inc. | | | 6,779 | | | | 126,632 | |
| CBL & Associates Properties, Inc. | | | 14,661 | | | | 286,476 | |
| Colonial Properties Trust | | | 37,058 | | | | 820,464 | |
| Coresite Realty Corp. | | | 23,592 | | | | 609,145 | |
| CubeSmart | | | 7,621 | | | | 88,937 | |
| Entertainment Properties Trust | | | 25,206 | | | | 1,036,219 | |
| Extra Space Storage, Inc. | | | 34,206 | | | | 1,046,704 | |
First Industrial Realty Trust, Inc.(1) | | | 44,399 | | | | 560,315 | |
| Home Properties, Inc. | | | 9,499 | | | | 582,859 | |
| Hospitality Properties Trust | | | 3,396 | | | | 84,119 | |
| Kilroy Realty Corp. | | | 4,046 | | | | 195,867 | |
| LaSalle Hotel Properties | | | 30,802 | | | | 897,570 | |
| LTC Properties, Inc. | | | 26,846 | | | | 973,973 | |
| Mack-Cali Realty Corp. | | | 17,807 | | | | 517,649 | |
| Mid-America Apartment Communities, Inc. | | | 12,921 | | | | $881,729 | |
| Mission West Properties, Inc. | | | 52,535 | | | | 452,852 | |
| National Retail Properties, Inc. | | | 15,192 | | | | 429,782 | |
| Post Properties, Inc. | | | 18,097 | | | | 885,848 | |
| PS Business Parks, Inc. | | | 12,852 | | | | 870,337 | |
| Sovran Self Storage, Inc. | | | 15,106 | | | | 756,659 | |
| Sun Communities, Inc. | | | 588 | | | | 26,013 | |
| Tanger Factory Outlet Centers | | | 26,291 | | | | 842,627 | |
| | | | | | | | 12,972,776 | |
REAL ESTATE MANAGEMENT AND DEVELOPMENT† | |
FirstService Corp.(1) | | | 847 | | | | 23,691 | |
| ROAD AND RAIL — 1.3% | |
| Arkansas Best Corp. | | | 34,155 | | | | 430,353 | |
| Knight Transportation, Inc. | | | 43,038 | | | | 688,178 | |
| Marten Transport Ltd. | | | 2,934 | | | | 62,377 | |
Old Dominion Freight Line, Inc.(1) | | | 14,877 | | | | 644,025 | |
Swift Transportation Co.(1) | | | 43,564 | | | | 411,680 | |
| | | | | | | | 2,236,613 | |
| SEMICONDUCTORS AND SEMICONDUCTOR EQUIPMENT — 3.7% | |
| Cabot Microelectronics Corp. | | | 6,931 | | | | 202,455 | |
Cypress Semiconductor Corp.(1) | | | 2,216 | | | | 29,296 | |
Entegris, Inc.(1) | | | 49,879 | | | | 425,967 | |
Exar Corp.(1) | | | 17,196 | | | | 140,319 | |
GT Advanced Technologies, Inc.(1) | | | 138,961 | | | | 733,714 | |
Kulicke & Soffa Industries, Inc.(1) | | | 62,525 | | | | 557,723 | |
LSI Corp.(1) | | | 78,175 | | | | 497,975 | |
Mattson Technology, Inc.(1) | | | 38,791 | | | | 67,884 | |
| Micrel, Inc. | | | 58,304 | | | | 555,637 | |
| MKS Instruments, Inc. | | | 35,025 | | | | 1,013,273 | |
Monolithic Power Systems, Inc.(1) | | | 18,455 | | | | 366,701 | |
Photronics, Inc.(1) | | | 36,632 | | | | 223,455 | |
PMC – Sierra, Inc.(1) | | | 52,179 | | | | 320,379 | |
| Power Integrations, Inc. | | | 17,578 | | | | 655,659 | |
Rudolph Technologies, Inc.(1) | | | 2,277 | | | | 19,855 | |
STR Holdings, Inc.(1) | | | 33,316 | | | | 151,921 | |
| Tessera Technologies, Inc. | | | 42,361 | | | | 651,089 | |
| | | | | | | | 6,613,302 | |
| SOFTWARE — 3.9% | |
Aspen Technology, Inc.(1) | | | 23,980 | | | | 555,137 | |
| Blackbaud, Inc. | | | 5,523 | | | | 141,775 | |
Cadence Design Systems, Inc.(1) | | | 42,231 | | | | 464,119 | |
CommVault Systems, Inc.(1) | | | 24,499 | | | | 1,214,415 | |
| Fair Isaac Corp. | | | 12,357 | | | | 522,454 | |
Guidance Software, Inc.(1) | | | 10,450 | | | | 99,380 | |
JDA Software Group, Inc.(1) | | | 30,308 | | | | 899,845 | |
Manhattan Associates, Inc.(1) | | | 19,486 | | | | 890,705 | |
Mentor Graphics Corp.(1) | | | 28,717 | | | | 430,755 | |
Monotype Imaging Holdings, Inc.(1) | | | 11,295 | | | | 189,417 | |
NetScout Systems, Inc.(1) | | | 4,934 | | | | 106,525 | |
QAD, Inc., Class A(1) | | | 4,406 | | | | 62,653 | |
TeleNav, Inc.(1) | | | 58,651 | | | | 359,531 | |
TiVo, Inc.(1) | | | 48,478 | | | | 400,913 | |
Websense, Inc.(1) | | | 35,669 | | | | 668,080 | |
| | | | | | | | 7,005,704 | |
| SPECIALTY RETAIL — 3.8% | |
ANN, Inc.(1) | | | 16,495 | | | | 420,458 | |
Body Central Corp.(1) | | | 1,725 | | | | 15,525 | |
| Buckle, Inc. (The) | | | 19,681 | | | | 778,777 | |
| Destination Maternity Corp. | | | 4,447 | | | | 96,055 | |
Express, Inc.(1) | | | 23,829 | | | | 432,973 | |
| Finish Line, Inc. (The), Class A | | | 39,070 | | | | 816,954 | |
Francesca’s Holdings Corp.(1) | | | 19,414 | | | | 524,372 | |
| GameStop Corp., Class A | | | 21,802 | | | | 400,285 | |
Genesco, Inc.(1) | | | 16,161 | | | | 972,084 | |
Hibbett Sports, Inc.(1) | | | 19,077 | | | | 1,100,934 | |
| Hot Topic, Inc. | | | 18,144 | | | | 175,815 | |
Select Comfort Corp.(1) | | | 34,611 | | | | 724,062 | |
Vitamin Shoppe, Inc.(1) | | | 3,795 | | | | 208,459 | |
| | | | | | | | 6,666,753 | |
| TEXTILES, APPAREL AND LUXURY GOODS — 2.6% | |
Crocs, Inc.(1) | | | 34,394 | | | | 555,463 | |
Fifth & Pacific Cos., Inc.(1) | | | 58,141 | | | | 623,853 | |
Iconix Brand Group, Inc.(1) | | | 51,406 | | | | 898,063 | |
| Jones Group, Inc. (The) | | | 47,506 | | | | 454,157 | |
| Movado Group, Inc. | | | 26,274 | | | | 657,376 | |
| Oxford Industries, Inc. | | | 16,286 | | | | 727,984 | |
| RG Barry Corp. | | | 2,472 | | | | 33,594 | |
| True Religion Apparel, Inc. | | | 24,875 | | | | 720,878 | |
| | | | | | | | 4,671,368 | |
| THRIFTS AND MORTGAGE FINANCE — 0.1% | |
HomeStreet, Inc.(1) | | | 1,092 | | | | 34,933 | |
| Provident Financial Services, Inc. | | | 3,882 | | | | 59,589 | |
Walker & Dunlop, Inc.(1) | | | 7,049 | | | | 90,579 | |
| | | | | | | | 185,101 | |
| TRADING COMPANIES AND DISTRIBUTORS — 0.7% | |
| Applied Industrial Technologies, Inc. | | | 3,203 | | | | $118,031 | |
Beacon Roofing Supply, Inc.(1) | | | 18,942 | | | | 477,717 | |
DXP Enterprises, Inc.(1) | | | 9,277 | | | | 384,903 | |
| MFC Industrial Ltd. | | | 42,814 | | | | 288,566 | |
| | | | | | | | 1,269,217 | |
| WATER UTILITIES — 0.5% | |
| American States Water Co. | | | 21,499 | | | | 850,930 | |
| Artesian Resources Corp., Class A | | | 2,162 | | | | 46,570 | |
| | | | | | | | 897,500 | |
| WIRELESS TELECOMMUNICATION SERVICES — 0.1% | |
Boingo Wireless, Inc.(1) | | | 5,918 | | | | 68,767 | |
| USA Mobility, Inc. | | | 12,482 | | | | 160,519 | |
| | | | | | | | 229,286 | |
TOTAL COMMON STOCKS (Cost $162,179,913) | | | | 176,050,423 | |
| Temporary Cash Investments — 1.3% | |
Repurchase Agreement, Bank of America Merrill Lynch, (collateralized by various U.S. Treasury obligations, 1.50% – 4.00%, 2/15/15 – 6/30/16, valued at $800,225), in a joint trading account at 0.10%, dated 6/29/12, due 7/2/12 (Delivery value $784,985) | | | | $784,978 | |
Repurchase Agreement, Credit Suisse First Boston, Inc., (collateralized by various U.S. Treasury obligations, 3.75%, 8/15/41, valued at $802,712), in a joint trading account at 0.10%, dated 6/29/12, due 7/2/12 (Delivery value $784,985) | | | | 784,978 | |
Repurchase Agreement, Goldman Sachs & Co., (collateralized by various U.S. Treasury obligations, 4.375%, 5/15/40, valued at $199,902), in a joint trading account at 0.06%, dated 6/29/12, due 7/2/12 (Delivery value $196,246) | | | | 196,245 | |
| SSgA U.S. Government Money Market Fund | | | 580,791 | | | | 580,791 | |
TOTAL TEMPORARY CASH INVESTMENTS (Cost $2,346,992) | | | | 2,346,992 | |
TOTAL INVESTMENT SECURITIES — 100.5% (Cost $164,526,905) | | | | 178,397,415 | |
| OTHER ASSETS AND LIABILITIES — (0.5)% | | | | (961,779 | ) |
| TOTAL NET ASSETS — 100.0% | | | | $177,435,636 | |
Notes to Schedule of Investments
† Category is less than 0.05% of total net assets.
See Notes to Financial Statements.
Statement of Assets and Liabilities |
| JUNE 30, 2012 | |
| Assets | |
| Investment securities, at value (cost of $164,526,905) | | | $178,397,415 | |
| Cash | | | 736 | |
| Receivable for investments sold | | | 6,164,462 | |
| Receivable for capital shares sold | | | 28,195 | |
| Dividends and interest receivable | | | 153,701 | |
| | | | 184,744,509 | |
| | | | | |
| Liabilities | | | | |
| Payable for investments purchased | | | 7,215,583 | |
| Accrued management fees | | | 93,290 | |
| | | | 7,308,873 | |
| | | | | |
| Net Assets | | | $177,435,636 | |
| | | | | |
| Institutional Class Capital Shares, $0.01 Par Value | | | | |
| Shares authorized | | | 100,000,000 | |
| Shares outstanding | | | 21,460,655 | |
| | | | | |
| Net Asset Value Per Share | | | $8.27 | |
| | | | | |
| Net Assets Consist of: | | | | |
| Capital (par value and paid-in surplus) | | | $159,311,915 | |
| Undistributed net investment income | | | 363,202 | |
| Undistributed net realized gain | | | 3,890,009 | |
| Net unrealized appreciation | | | 13,870,510 | |
| | | | $177,435,636 | |
See Notes to Financial Statements.
| YEAR ENDED JUNE 30, 2012 | |
| Investment Income (Loss) | |
| Income: | | | |
| Dividends (net of foreign taxes withheld of $3,224) | | | $1,990,366 | |
| Interest | | | 1,459 | |
| | | | 1,991,825 | |
| | | | | |
| Expenses: | | | | |
| Management fees | | | 995,277 | |
| Directors’ fees and expenses | | | 7,391 | |
| | | | 1,002,668 | |
| | | | | |
| Net investment income (loss) | | | 989,157 | |
| | | | | |
| Realized and Unrealized Gain (Loss) | | | | |
| Net realized gain (loss) on: | | | | |
| Investment transactions | | | 6,308,513 | |
| Futures contract transactions | | | (51,251 | ) |
| | | | 6,257,262 | |
| | | | | |
| Change in net unrealized appreciation (depreciation) on investments | | | (6,549,616 | ) |
| | | | | |
| Net realized and unrealized gain (loss) | | | (292,354 | ) |
| | | | | |
| Net Increase (Decrease) in Net Assets Resulting from Operations | | | $696,803 | |
See Notes to Financial Statements.
Statement of Changes in Net Assets |
| YEARS ENDED JUNE 30, 2012 AND JUNE 30, 2011 | |
| Increase (Decrease) in Net Assets | June 30, 2012 | | | June 30, 2011 | |
| Operations | |
| Net investment income (loss) | | $989,157 | | | | $411,374 | |
| Net realized gain (loss) | | 6,257,262 | | | | 17,637,656 | |
| Change in net unrealized appreciation (depreciation) | | (6,549,616 | ) | | | 13,820,900 | |
| Net increase (decrease) in net assets resulting from operations | | 696,803 | | | | 31,869,930 | |
| | | | | | | | |
| Distributions to Shareholders | | | | | | | |
| From net investment income | | (604,943 | ) | | | (494,062 | ) |
| From net realized gains | | (11,273,310 | ) | | | — | |
| Decrease in net assets from distributions | | (11,878,253 | ) | | | (494,062 | ) |
| | | | | | | | |
| Capital Share Transactions | | | | | | | |
| Proceeds from shares sold | | 50,747,672 | | | | 31,205,113 | |
| Proceeds from reinvestment of distributions | | 11,878,253 | | | | 494,062 | |
| Payments for shares redeemed | | (5,581,048 | ) | | | (7,935,726 | ) |
| Net increase (decrease) in net assets from capital share transactions | | 57,044,877 | | | | 23,763,449 | |
| | | | | | | | |
| Net increase (decrease) in net assets | | 45,863,427 | | | | 55,139,317 | |
| | | | | | | | |
| Net Assets | | | | | | | |
| Beginning of period | | 131,572,209 | | | | 76,432,892 | |
| End of period | | $177,435,636 | | | | $131,572,209 | |
| | | | | | | | |
| Undistributed net investment income | | $363,202 | | | | — | |
| | | | | | | | |
| Transactions in Shares of the Fund | | | | | | | |
| Sold | | 6,219,375 | | | | 3,982,369 | |
| Issued in reinvestment of distributions | | 1,570,029 | | | | 59,864 | |
| Redeemed | | (677,031 | ) | | | (995,671 | ) |
| Net increase (decrease) in shares of the fund | | 7,112,373 | | | | 3,046,562 | |
See Notes to Financial Statements.
Notes to Financial Statements |
JUNE 30, 2012
1. Organization
American Century Quantitative Equity Funds, Inc. (the corporation) is registered under the Investment Company Act of 1940, as amended (the 1940 Act), as an open-end management investment company and is organized as a Maryland corporation. NT Small Company Fund (the fund) is one fund in a series issued by the corporation. The fund is diversified as defined under the 1940 Act. The fund’s investment objective is to seek long-term capital growth. The fund pursues its objective by investing primarily in stocks of smaller-capitalization U.S. companies. The fund is not permitted to invest in any securities issued by companies assigned the Global Industry Classification Standard for the tobacco industry.
2. Significant Accounting Policies
The following is a summary of significant accounting policies consistently followed by the fund in preparation of its financial statements. The financial statements are prepared in conformity with accounting principles generally accepted in the United States of America, which may require management to make certain estimates and assumptions at the date of the financial statements. Actual results could differ from these estimates.
Investment Valuations — The fund determines the fair value of its investments and computes its net asset value per share as of the close of regular trading (usually 4 p.m. Eastern time) on the New York Stock Exchange (NYSE) on each day the NYSE is open.
Equity securities that are listed or traded on a domestic securities exchange are valued at the last reported sales price or at the official closing price as provided by the exchange. Equity securities traded on foreign securities exchanges are typically valued at the closing price on the exchange where primarily traded or as of the close of the NYSE, if that is earlier. If no last sales price is reported, or if local convention or regulation so provides, the mean of the latest bid and asked prices is used. Depending on local convention or regulation, securities traded over-the-counter are valued at the mean of the latest bid and asked prices, the last sales price, or the official closing price. In its determination of fair value, the fund may review several factors including: market information specific to a security; news developments in U.S. and foreign markets; the performance of particular U.S. and foreign securities, indices, comparable securities, American Depositary Receipts, Exchange-Traded Funds, and other relevant market indicators.
Debt securities maturing within 60 days at the time of purchase may be valued at cost, plus or minus any amortized discount or premium or at the evaluated mean as provided by an independent pricing service. Evaluated mean prices are commonly derived through utilization of market models, which may consider, among other factors, trade data, quotations from dealers and active market makers, relevant yield curve and spread data, related sector levels, creditworthiness, and other relevant market information on the same or comparable securities.
Investments in open-end management investment companies are valued at the reported net asset value per share. Repurchase agreements are valued at cost. Exchange-traded futures contracts are valued at the settlement price as provided by the appropriate clearing corporation.
If the fund determines that the market price for a portfolio security is not readily available or the valuation methods mentioned above do not reflect a security’s fair value, such security is valued as determined in good faith by the Board of Directors or its designee, in accordance with procedures adopted by the Board of Directors. Circumstances that may cause the fund to use these procedures to value a security include, but are not limited to: a security has been declared in default; trading in a security has been halted during the trading day; there is a foreign market holiday and no trading occurred; or an event occurred between the close of a foreign exchange and the NYSE that may affect the value of a security.
Security Transactions — Security transactions are accounted for as of the trade date. Net realized gains and losses are determined on the identified cost basis, which is also used for federal income tax purposes.
Investment Income — Dividend income less foreign taxes withheld, if any, is recorded as of the ex-dividend date. Distributions received on securities that represent a return of capital or capital gain are recorded as a reduction of cost of investments and/or as a realized gain. The fund estimates the components of distributions received that may be considered nontaxable distributions or capital gain distributions for income tax purposes. Interest income is recorded on the accrual basis and includes accretion of discounts and amortization of premiums.
Business Development Companies — The fund may invest in securities of closed-end investment companies that have elected to be treated as a business development company under the 1940 Act. A business development company operates similar to an exchange-traded fund and represents a portfolio of securities. The fund may purchase a business development company to gain exposure to the securities in the underlying portfolio. The risks of owning a business development company generally reflect the risks of owning the underlying securities. Business development companies have expenses that reduce their value.
Repurchase Agreements — The fund may enter into repurchase agreements with institutions that American Century Investment Management, Inc. (ACIM) (the investment advisor) has determined are creditworthy pursuant to criteria adopted by the Board of Directors. The fund requires that the collateral, represented by securities, received in a repurchase transaction be transferred to the custodian in a manner sufficient to enable the fund to obtain those securities in the event of a default under the repurchase agreement. ACIM monitors, on a daily basis, the securities transferred to ensure the value, including accrued interest, of the securities under each repurchase agreement is equal to or greater than amounts owed to the fund under each repurchase agreement.
Joint Trading Account — Pursuant to an Exemptive Order issued by the Securities and Exchange Commission, the fund, along with certain other funds in the American Century Investments family of funds, may transfer uninvested cash balances into a joint trading account. These balances are invested in one or more repurchase agreements that are collateralized by U.S. Treasury or Agency obligations.
Segregated Assets — In accordance with the 1940 Act, the fund segregates assets on its books and records to cover futures contracts. ACIM monitors, on a daily basis, the securities segregated to ensure the fund designates a sufficient amount of liquid assets, marked-to-market daily. The fund may also receive assets or be required to pledge assets at the custodian bank or with a broker for margin requirements on futures contracts.
Income Tax Status — It is the fund’s policy to distribute substantially all net investment income and net realized gains to shareholders and to otherwise qualify as a regulated investment company under provisions of the Internal Revenue Code. The fund is no longer subject to examination by tax authorities for years prior to 2009. At this time, management believes there are no uncertain tax positions which, based on their technical merit, would not be sustained upon examination and for which it is reasonably possible that the total amounts of unrecognized tax benefits will significantly change in the next twelve months. Accordingly, no provision has been made for federal or state income taxes.
Distributions to Shareholders — Distributions from net investment income, if any, are generally declared and paid quarterly. Distributions from net realized gains, if any, are generally declared and paid annually.
Indemnifications — Under the corporation’s organizational documents, its officers and directors are indemnified against certain liabilities arising out of the performance of their duties to the fund. In addition, in the normal course of business, the fund enters into contracts that provide general indemnifications. The maximum exposure under these arrangements is unknown as this would involve future claims that may be made against a fund. The risk of material loss from such claims is considered by management to be remote.
3. Fees and Transactions with Related Parties
Management Fees — The corporation has entered into a management agreement with ACIM, under which ACIM provides the fund with investment advisory and management services in exchange for a single, unified management fee (the fee). The agreement provides that all expenses of managing and operating the fund, except distribution and service fees, brokerage expenses, taxes, interest, fees and expenses of the independent directors (including legal counsel fees), and extraordinary expenses, will be paid by ACIM. The fee is computed and accrued daily based on the daily net assets of the fund and paid monthly in arrears. The fee consists of (1) an Investment Category Fee based on the daily net assets of the fund and certain other accounts managed by the investment advisor that are in the same broad investment category as the fund and (2) a Complex Fee based on the assets of all the funds in the American Century Investments family of funds. The rates for the Investment Category Fee range from 0.5380% to 0.7200%. The rates for the Complex Fee range from 0.0500% to 0.1100%. The effective annual management fee for each class for the year ended June 30, 2012 was 0.68%.
Acquired Fund Fees and Expenses — The fund may invest in mutual funds, exchange-traded funds, and business development companies (the acquired funds). The fund will indirectly realize its pro rata share of the fees and expenses of the acquired funds in which it invests. These indirect fees and expenses are not paid out of the fund’s assets but are reflected in the return realized by the fund on its investment in the acquired funds.
Related Parties — Certain officers and directors of the corporation are also officers and/or directors of American Century Companies, Inc., the parent of the corporation’s investment advisor, ACIM, the distributor of the corporation, American Century Investment Services, Inc., and the corporation’s transfer agent, American Century Services, LLC. The fund is wholly owned, in aggregate, by various funds in a series issued by American Century Asset Allocation Portfolios, Inc. (ACAAP). ACAAP does not invest in the fund for the purpose of exercising management or control.
4. Investment Transactions
Purchases and sales of investment securities, excluding short-term investments, for the year ended June 30, 2012 were $172,213,420 and $125,263,099, respectively.
5. Fair Value Measurements
The fund’s securities valuation process is based on several considerations and may use multiple inputs to determine the fair value of the positions held by the fund. In conformity with accounting principles generally accepted in the United States of America, the inputs used to determine a valuation are classified into three broad levels as follows:
| • | Level 1 valuation inputs consist of unadjusted quoted prices in an active market for identical securities; |
| • | Level 2 valuation inputs consist of direct or indirect observable market data (including quoted prices for similar securities, evaluations of subsequent market events, interest rates, prepayment speeds, credit risk, etc.); or |
| • | Level 3 valuation inputs consist of unobservable data (including a fund’s own assumptions). |
The level classification is based on the lowest level input that is significant to the fair valuation measurement. The valuation inputs are not necessarily an indication of the risks associated with investing in these securities or other financial instruments.
The following is a summary of the level classifications as of period end. The Schedule of Investments provides additional information on the fund’s portfolio holdings.
| | Level 1 | | | Level 2 | | | Level 3 | |
| Investment Securities | | | | | | | | |
| Common Stocks | | $176,050,423 | | | | — | | | | — | |
| Temporary Cash Investments | | 580,791 | | | | $1,766,201 | | | | — | |
| Total Value of Investment Securities | | $176,631,214 | | | | $1,766,201 | | | | — | |
6. Derivative Instruments
Equity Price Risk — The fund is subject to equity price risk in the normal course of pursuing its investment objectives. A fund may enter into futures contracts based on an equity index in order to manage its exposure to changes in market conditions. A fund may purchase futures contracts to gain exposure to increases in market value or sell futures contracts to protect against a decline in market value. Upon entering into a futures contract, a fund is required to deposit either cash or securities in an amount equal to a certain percentage of the contract value (initial margin). Subsequent payments (variation margin) are made or received daily, in cash, by a fund. The variation margin is equal to the daily change in the contract value and is recorded as unrealized gains and losses. A fund recognizes a realized gain or loss when the contract is closed or expires. Net realized and unrealized gains or losses occurring during the holding period of futures contracts are a component of net realized gain (loss) on futures contract transactions and change in net unrealized appreciation (depreciation) on futures contracts, respectively. One of the risks of entering into futures contracts is the possibility that the change in value of the contract may not correlate with the changes in value of the underlying securities. During the period, the fund infrequently purchased equity price risk derivative instruments for temporary investment purposes.
At period end, the fund did not have any equity price risk derivative instruments disclosed on the Statement of Assets and Liabilities. For the year ended June 30, 2012, the effect of equity price risk derivative instruments on the Statement of Operations was $(51,251) in net realized gain (loss) on futures contract transactions.
7. Risk Factors
The fund concentrates its investments in common stocks of small companies. Because of this, the fund may be subject to greater risk and market fluctuations than a fund investing in larger, more established companies.
8. Federal Tax Information
The tax character of distributions paid during the years ended June 30, 2012 and June 30, 2011 were as follows:
| | | 2012 | | | 2011 | |
| Distributions Paid From | | | | | | |
| Ordinary income | | $604,943 | | | $442,084 | |
| Long-term capital gains | | $11,273,310 | | | $51,978 | |
The book-basis character of distributions made during the year from net investment income or net realized gains may differ from their ultimate characterization for federal income tax purposes. These differences reflect the differing character of certain income items and net realized gains and losses for financial statement and tax purposes, and may result in reclassification among certain capital accounts on the financial statements.
As of June 30, 2012, the federal tax cost of investments and the components of distributable earnings on a tax-basis were as follows:
| Federal tax cost of investments | | | $165,745,912 | |
| Gross tax appreciation of investments | | | $20,184,993 | |
| Gross tax depreciation of investments | | | (7,533,490 | ) |
| Net tax appreciation (depreciation) of investments | | | $12,651,503 | |
| Undistributed ordinary income | | | $363,202 | |
| Accumulated long-term gains | | | $5,109,016 | |
The difference between book-basis and tax-basis cost and unrealized appreciation (depreciation) is attributable primarily to the tax deferral of losses on wash sales.
| For a Share Outstanding Throughout the Years Ended June 30 (except as noted) |
| Per-Share Data | Ratios and Supplemental Data |
| | | Income From Investment Operations: | Distributions From: | | | Ratio to Average Net Assets of: | | |
| | Net Asset Value, Beginning of Period | Net Investment Income (Loss) | Net Realized and Unrealized Gain (Loss) | Total From Investment Operations | Net Investment Income | Net Realized Gains | Total Distributions | Net Asset Value, End of Period | Total Return(1) | Operating Expenses | Net Investment Income (Loss) | Portfolio Turnover Rate | Net Assets, End of Period (in thousands) |
| Institutional Class |
| 2012 | $9.17 | 0.06(2) | (0.23) | (0.17) | (0.03) | (0.70) | (0.73) | $8.27 | (0.98)% | 0.68% | 0.67% | 86% | $177,436 |
| 2011 | $6.76 | 0.03(2) | 2.42 | 2.45 | (0.04) | — | (0.04) | $9.17 | 36.29% | 0.69% | 0.38% | 93% | $131,572 |
| 2010 | $5.50 | 0.02(2) | 1.27 | 1.29 | (0.03) | — | (0.03) | $6.76 | 23.50% | 0.69% | 0.34% | 78% | $76,433 |
| 2009 | $8.60 | 0.03(2) | (3.11) | (3.08) | (0.02) | — | (0.02) | $5.50 | (35.83)% | 0.70% | 0.56% | 110% | $47,041 |
| 2008 | $10.65 | 0.03 | (2.05) | (2.02) | (0.03) | — | (0.03) | $8.60 | (18.98)% | 0.67% | 0.29% | 143% | $28,178 |
Notes to Financial Highlights
| (1) | Total returns are calculated based on the net asset value of the last business day. Total returns for periods less than one year are not annualized. |
| (2) | Computed using average shares outstanding throughout the period. |
See Notes to Financial Statements.
Report of Independent Registered Public Accounting Firm |
To the Directors of the American Century Quantitative Equity Funds, Inc.
and Shareholders of the NT Small Company Fund:
In our opinion, the accompanying statement of assets and liabilities, including the schedule of investments, and the related statements of operations and of changes in net assets and the financial highlights present fairly, in all material respects, the financial position of the NT Small Company Fund (one of the fourteen funds comprising the American Century Quantitative Equity Funds, Inc., hereafter referred to as the “Fund”) at June 30, 2012, the results of its operations for the year then ended, the changes in its net assets for each of the two years in the period then ended and the financial highlights for each of the five years in the period then ended, in conformity with accounting principles generally accepted in the United States of America. These financial statements and financial highlights (hereafter referred to as “financial statements”) are the responsibility of the Fund’s management; our responsibility is to express an opinion on these financial statements based on our audits. We conducted our audits of these financial statements in accordance with the standards of the Public Company Accounting Oversight Board (United States). Those standards require that we plan and perform the audit to obtain reasonable assurance about whether the financial statements are free of material misstatement. An audit includes examining, on a test basis, evidence supporting the amounts and disclosures in the financial statements, assessing the accounting principles used and significant estimates made by management, and evaluating the overall financial statement presentation. We believe that our audits, which included confirmation of securities at June 30, 2012 by correspondence with the custodian and brokers, provide a reasonable basis for our opinion.
PricewaterhouseCoopers LLP
Kansas City, Missouri
August 21, 2012
Board of Directors
The individuals listed below serve as directors of the funds. Each director will continue to serve in this capacity until death, retirement, resignation or removal from office. The mandatory retirement age for directors who are not “interested persons,” as that term is defined in the Investment Company Act (independent directors), is 73. However, the mandatory retirement age may be extended for a period not to exceed two years with the approval of the remaining independent directors.
Mr. Thomas is the only director who is an “interested person” because he currently serves as President and Chief Executive Officer of American Century Companies, Inc. (ACC), the parent company of American Century Investment Management, Inc. (ACIM or the advisor).
The other directors (more than three-fourths of the total number) are independent; that is, they have never been employees, directors or officers of, and have no financial interest in, ACC or any of its wholly owned, direct or indirect, subsidiaries, including ACIM, American Century Investment Services, Inc. (ACIS) and American Century Services, LLC (ACS). The directors serve in this capacity for eight (in the case of Mr. Thomas, 15) registered investment companies in the American Century Investments family of funds.
The following table presents additional information about the directors. The mailing address for each director other than Mr. Thomas is 1665 Charleston Road, Mountain View, California 94043. The mailing address for Mr. Thomas is 4500 Main Street, Kansas City, Missouri 64111.
Name (Year of Birth) | Position(s) Held with Funds | Length of Time Served | | Principal Occupation(s) During Past 5 Years | | Number of American Century Portfolios Overseen by Director | Other Directorships Held During Past 5 Years |
| Independent Directors |
Tanya S. Beder (1955) | Director | Since 2011 | | Chairman, SBCC Group Inc. (investment advisory services)(2006 to present); Fellow in Practice, International Center for Finance, Yale University School of Management (1985 to present) | | 42 | CYS Investments, Inc. (specialty finance company) |
Jeremy I. Bulow (1954) | Director | Since 2011 | | Professor of Economics, Stanford University, Graduate School of Business (1979 to present) | | 42 | None |
Ronald J. Gilson (1946) | Director and Chairman of the Board | Since 1995 | | Charles J. Meyers Professor of Law and Business, Stanford Law School (1979 to present); Marc and Eva Stern Professor of Law and Business, Columbia University School of Law (1992 to present) | | 42 | None |
Name (Year of Birth) | Position(s) Held with Funds | Length of Time Served | | Principal Occupation(s) During Past 5 Years | | Number of American Century Portfolios Overseen by Director | Other Directorships Held During Past 5 Years |
Frederick L. A. Grauer (1946) | Director | Since 2008 | | Senior Advisor, BlackRock, Inc. (investment management firm) (2010 to 2011); Senior Advisor, Barclays Global Investors (investment management firm) (2003 to 2009) | | 42 | None |
Peter F. Pervere (1947) | Director | Since 2007 | | Retired | | 42 | Intraware, Inc. (2003 to 2009) |
Myron S. Scholes (1941) | Director | Since 1980 | | Chairman, Platinum Grove Asset Management, L.P. (asset manager) (1999 to 2009); Frank E. Buck Professor of Finance-Emeritus, Stanford Graduate School of Business (1996 to present) | | 42 | Dimensional Fund Advisors (investment advisor); CME Group, Inc. (futures and options exchange) |
John B. Shoven (1947) | Director | Since 2002 | | Professor of Economics, Stanford University (1973 to present) | | 42 | Cadence Design Systems; Exponent; Financial Engines |
| |
| Interested Director |
Jonathan S. Thomas (1963) | Director and President | Since 2007 | | President and Chief Executive Officer, ACC (March 2007 to present); Chief Administrative Officer, ACC (February 2006 to February 2007); Executive Vice President, ACC (November 2005 to February 2007). Also serves as Chief Executive Officer and Manager, ACS; Executive Vice President, ACIM; Director, ACC, ACIM and other ACC subsidiaries | | 108 | None |
Officers
The following table presents certain information about the executive officers of the funds. Each officer serves as an officer for each of the 15 investment companies in the American Century family of funds, unless otherwise noted. No officer is compensated for his or her service as an officer of the funds. The listed officers are interested persons of the funds and are appointed or re-appointed on an annual basis. The mailing address for each of the officers listed below is 4500 Main Street, Kansas City, Missouri 64111.
Name (Year of Birth) | | Offices with the Funds | | Principal Occupation(s) During the Past Five Years |
Jonathan S. Thomas (1963) | | Director and President since 2007 | | President and Chief Executive Officer, ACC (March 2007 to present); Chief Administrative Officer, ACC (February 2006 to February 2007); Executive Vice President, ACC (November 2005 to February 2007). Also serves as Chief Executive Officer and Manager, ACS; Executive Vice President, ACIM; Director, ACC, ACIM and other ACC subsidiaries |
Barry Fink (1955) | | Executive Vice President since 2007 | | Chief Operating Officer and Executive Vice President, ACC (September 2007 to present); President, ACS (October 2007 to present); Managing Director, Morgan Stanley (2000 to 2007). Also serves as Manager, ACS and Director, ACC and certain ACC subsidiaries |
Maryanne L. Roepke (1956) | | Chief Compliance Officer since 2006 and Senior Vice President since 2000 | | Chief Compliance Officer, American Century funds, ACIM and ACS (August 2006 to present). Also serves as Senior Vice President, ACS |
Charles A. Etherington (1957) | | General Counsel since 2007 and Senior Vice President since 2006 | | Attorney, ACC (February 1994 to present); Vice President, ACC (November 2005 to present), General Counsel, ACC (March 2007 to present); Also serves as General Counsel, ACIM, ACS, ACIS and other ACC subsidiaries; and Senior Vice President, ACIM and ACS |
C. Jean Wade (1964) | | Vice President, Treasurer and Chief Financial Officer since 2012 | | Vice President, ACS (February 2000 to present) |
Robert J. Leach (1966) | | Vice President since 2006 and Assistant Treasurer since 2012 | | Vice President, ACS (February 2000 to present) |
David H. Reinmiller (1963) | | Vice President since 2001 | | Attorney, ACC (January 1994 to present); Associate General Counsel, ACC (January 2001 to present); Also serves as Vice President, ACIM and ACS |
Ward D. Stauffer (1960) | | Secretary since 2005 | | Attorney, ACC (June 2003 to present) |
The Statement of Additional Information has additional information about the fund’s directors and is available without charge, upon request, by calling 1-800-345-2021.
Approval of Management Agreement |
At a meeting held on June 14, 2012, the Fund’s Board of Directors/Trustees unanimously approved the renewal of the management agreement pursuant to which American Century Investment Management, Inc. (the “Advisor”) acts as the investment advisor for the Fund. Under Section 15(c) of the Investment Company Act, contracts for investment advisory services are required to be reviewed, evaluated, and approved by a majority of a fund’s independent directors/trustees (the “Directors”) each year.
As a part of the approval process, the Board requested and reviewed extensive data and information compiled by the Advisor and certain independent providers of evaluation data concerning the Fund and the services provided to the Fund by the Advisor. This review was in addition to the oversight and evaluation undertaken by the Board and its committees on a continuous basis throughout the year and included, but was not limited to the following:
| • | the nature, extent, and quality of investment management, shareholder services, and other services provided by the Advisor to the Fund; |
| • | the wide range of other programs and services the Advisor provides to the Fund and its shareholders on a routine and non-routine basis; |
| • | the investment performance of the fund, including data comparing the Fund’s performance to appropriate benchmarks and/or a peer group of other mutual funds with similar investment objectives and strategies; |
| • | data comparing the cost of owning the Fund to the cost of owning similar funds; |
| • | the Advisor’s compliance policies, procedures, and regulatory experience; |
| • | financial data showing the cost of services provided to the Fund, the profitability of the Fund to the Advisor, and the overall profitability of the Advisor; |
| • | data comparing services provided and charges to other investment management clients of the Advisor; and management clients of the Advisor; and |
| • | consideration of collateral benefits derived by the Advisor from the management of the Fund and any potential economies of scale relating thereto. |
In keeping with its practice, the Board held two in-person meetings to review and discuss the information provided. The Board also had the benefit of the advice of its independent counsel throughout the period.
Factors Considered
The Directors considered all of the information provided by the Advisor, the independent data providers, and the Board’s independent counsel, and evaluated such information for the Fund. In connection with their review, the Directors did not identify any single factor as being all-important or controlling, and each Director may have attributed different levels of importance to different factors. In deciding to renew the management agreement, the Board based its decision on a number of factors, including the following:
Nature, Extent and Quality of Services — Generally. Under the management agreement, the Advisor is responsible for providing or arranging for all services necessary for the operation of the Fund. The Board noted that under the management agreement, the Advisor provides or arranges at its own expense a wide variety of services including:
| • | constructing and designing the Fund |
| • | portfolio research and security selection |
| • | initial capitalization/funding |
| • | daily valuation of the Fund’s portfolio |
| • | shareholder servicing and transfer agency, including shareholder confirmations, recordkeeping, and communications |
| • | regulatory and portfolio compliance |
| • | marketing and distribution |
The Board noted that many of these services have expanded over time both in terms of quantity and complexity in response to shareholder demands, competition in the industry, changing distribution channels, and the changing regulatory environment.
Investment Management Services. The nature of the investment management services provided to the Fund is quite complex and allows Fund shareholders access to professional money management, instant diversification of their investments within an asset class, the opportunity to easily diversify among asset classes by investing in or exchanging among various American Century Investments funds, and liquidity. In evaluating investment performance, the Board expects the Advisor to manage the Fund in accordance with its investment objectives and approved strategies. Further, the Directors recognize that the Advisor has an obligation to seek the best execution of fund trades. In providing these services, the Advisor utilizes teams of investment professionals (portfolio managers, analysts, research assistants, and securities traders) who require extensive information technology, research, training, compliance and other systems to conduct their business. The Board, directly and through its Portfolio Committee, regularly reviews investment performance information for the Fund, together with comparative information for appropriate benchmarks and/or peer groups of similarly-managed funds, over different time horizons. The Directors also review detailed performance information during the management agreement approval
process. If performance concerns are identified, the Fund receives special reviews until performance improves, during which the Board discusses with the Advisor the reasons for such results (e.g., market conditions, security selection) and any efforts being undertaken to improve performance. The Board found the investment management services provided by the Advisor to the Fund to meet or exceed industry standards. More detailed information about the Fund’s performance can be found in the Performance and Portfolio Commentary sections of this report.
Shareholder and Other Services. Under the management agreement, the Advisor provides the Fund with a comprehensive package of transfer agency, shareholder, and other services. The Board, directly and through various committees of the Board, regularly reviews reports and evaluations of such services at its regular meetings. These reports include, but are not limited to, information regarding the operational efficiency and accuracy of the shareholder and transfer agency services provided, staffing levels, shareholder satisfaction (as measured by external as well as internal sources), technology support, new products and services offered to Fund shareholders, securities trading activities, portfolio valuation services, auditing services, and legal and operational compliance activities. Certain aspects of shareholder and transfer agency service level efficiency and the quality of securities trading activities are measured by independent third party providers and are presented in comparison to other fund groups not managed by the Advisor. The Board found the services provided by the Advisor to the Fund under the management agreement to be competitive and of high quality.
Costs of Services and Profitability. The Advisor provides detailed information concerning its cost of providing various services to the Fund, its profitability in managing the Fund, its overall profitability, and its financial condition. The Directors have reviewed with the Advisor the methodology used to prepare this financial information. The financial information regarding the Advisor is considered in evaluating the Advisor’s financial condition, ability to continue to provide services under the management agreement, and the reasonableness of the current management fee. The Board concluded that the Advisor’s profits were reasonable in light of the services provided to the Fund.
Ethics. The Board generally considers the Advisor’s commitment to providing quality services to shareholders and to conducting its business ethically. They noted that the Advisor’s practices generally meet or exceed industry best practices.
Economies of Scale. The Board also reviewed information provided by the Advisor regarding the possible existence of economies of scale in connection with the management of the Fund. The Board concluded that economies of scale are difficult to measure and predict with precision, especially on a fund-by-fund basis. The Board concluded that the Advisor is appropriately sharing economies of scale through its competitive fee structure, offering competitive fees from fund inception, and through reinvestment in its business to provide shareholders additional content and services.
Comparison to Other Funds’ Fees. The management agreement provides that the Fund pay the Advisor a single, all-inclusive (or unified) management fee for providing all services necessary for the management and operation of the Fund, other than brokerage expenses, taxes, interest, extraordinary expenses, and the fees and expenses of the Fund’s independent directors (including their independent legal counsel) and expenses incurred in connection with the provision of shareholder services and distribution services under a plan adopted pursuant to Rule 12b-1 under the 1940 Act. Under the unified fee structure, the Advisor is responsible for providing all investment advisory, custody, audit, administrative, compliance, recordkeeping, marketing and shareholder services, or arranging and supervising third parties to provide such services. By contrast, most other funds are charged a variety of fees, including an investment advisory fee, a transfer agency fee, an administrative fee, distribution charges and other expenses. Other than their investment advisory fees and any applicable Rule 12b-1 distribution fees, all other components of the total fees charged by these other funds may be increased without shareholder approval. The Board believes the unified fee structure is a benefit to Fund shareholders because it clearly discloses to shareholders the cost of owning Fund shares, and, since the unified fee cannot be increased without a vote of Fund shareholders, it shifts to the Advisor the risk of increased costs of operating the Fund and provides a direct incentive to minimize administrative inefficiencies. Part of the Board’s analysis of fee levels involves reviewing certain evaluative data compiled by an independent provider and comparing the Fund’s unified fee to the total expense ratio of other funds in the Fund’s peer group. The Board concluded that the management fee paid by the Fund to the Advisor under the management agreement is reasonable in light of the services provided to the Fund.
Comparison to Fees and Services Provided to Other Clients of the Advisor. The Board also requested and received information from the Advisor concerning the nature of the services, fees, costs and profitability of its advisory services to advisory clients other than the Fund. They observed that these varying types of client accounts require different services and involve different regulatory and entrepreneurial risks than the management of the Fund. The Board analyzed this information and concluded that the fees charged and services provided to the Fund were reasonable by comparison.
Collateral or “Fall-Out” Benefits Derived by the Advisor. The Board considered the existence of collateral benefits the Advisor may receive as a result of its relationship with the Fund. They concluded that the Advisor’s primary business is managing mutual funds and it generally does not use fund or shareholder information to generate profits in other lines of business, and therefore does not derive any significant collateral benefits from them. The Board noted that the Advisor receives proprietary research from broker-dealers that execute fund portfolio transactions and concluded that this research is likely to benefit Fund shareholders. The Board also determined that the Advisor is able to provide investment management services to certain clients other than the Fund, at least in part, due to its existing infrastructure built to serve the fund complex. The Board concluded, however, that the assets of those other clients are not material to the analysis and, where applicable, may be included with the assets of the Fund to determine breakpoints in the management fee schedule.
Existing Relationship. The Board also considered whether there was any reason for not continuing the existing arrangement with the Advisor. In this regard, the Board was mindful of the potential disruptions of the Fund’s operations and various risks, uncertainties, and other effects that could occur as a result of a decision not to continue such relationship. In particular, the Board recognized that most shareholders have invested in the Fund on the strength of the Advisor’s industry standing and reputation and in the expectation that the Advisor will have a continuing role in providing advisory services to the Fund.
Conclusion of the Directors. As a result of this process, the Board, including all of the independent directors and assisted by the advice of independent legal counsel, taking into account all of the factors discussed above and the information provided by the Advisor and others, concluded that the management agreement between the Fund and the Advisor is fair and reasonable in light of the services provided and should be renewed.
Retirement Account Information
As required by law, distributions you receive from certain IRAs, or 403(b), 457 and qualified plans are subject to federal income tax withholding, unless you elect not to have withholding apply. Tax will be withheld on the total amount withdrawn even though you may be receiving amounts that are not subject to withholding, such as nondeductible contributions. In such case, excess amounts of withholding could occur. You may adjust your withholding election so that a greater or lesser amount will be withheld.
If you don’t want us to withhold on this amount, you must notify us to not withhold the federal income tax. You may notify us in writing or in certain situations by telephone or through other electronic means. You have the right to revoke your withholding election at any time and any election you make may remain in effect until revoked by filing a new election.
Remember, even if you elect not to have income tax withheld, you are liable for paying income tax on the taxable portion of your withdrawal. If you elect not to have income tax withheld or you don’t have enough income tax withheld, you may be responsible for payment of estimated tax. You may incur penalties under the estimated tax rules if your withholding and estimated tax payments are not sufficient. You can reduce or defer the income tax on a distribution by directly or indirectly rolling such distribution over to another IRA or eligible plan. You should consult your tax advisor for additional information.
State tax will be withheld if, at the time of your distribution, your address is within one of the mandatory withholding states and you have federal income tax withheld. State taxes will be withheld from your distribution in accordance with the respective state rules.
Proxy Voting Guidelines
American Century Investment Management, Inc., the fund’s investment advisor, is responsible for exercising the voting rights associated with the securities purchased and/or held by the fund. A description of the policies and procedures the advisor uses in fulfilling this responsibility is available without charge, upon request, by calling 1-800-345-2021. It is also available on American Century Investments’ website at americancentury.com and on the Securities and Exchange Commission’s website at sec.gov. Information regarding how the investment advisor voted proxies relating to portfolio securities during the most recent 12-month period ended June 30 is available on the “About Us” page at americancentury.com. It is also available at sec.gov.
Quarterly Portfolio Disclosure
The fund files its complete schedule of portfolio holdings with the Securities and Exchange Commission (SEC) for the first and third quarters of each fiscal year on Form N-Q. The fund’s Forms N-Q are available on the SEC’s website at sec.gov, and may be reviewed and copied at the SEC’s Public Reference Room in Washington, DC. Information on the operation of the Public Reference Room may be obtained by calling 1-800-SEC-0330. The fund also makes its complete schedule of portfolio holdings for the most recent quarter of its fiscal year available on its website at americancentury.com and, upon request, by calling 1-800-345-2021.
Other Tax Information
The following information is provided pursuant to provisions of the Internal Revenue Code.
The fund hereby designates up to the maximum amount allowable as qualified dividend income for the fiscal year ended June 30, 2012.
For corporate taxpayers, the fund hereby designates $604,943, or up to the maximum amount allowable, of ordinary income distributions paid during the fiscal year ended June 30, 2012 as qualified for the corporate dividends received deduction.
The fund hereby designates $11,273,310, or up to the maximum amount allowable, as long-term capital gain distributions for the fiscal year ended June 30, 2012.
| Contact Us | americancentury.com |
| Automated Information Line | 1-800-345-8765 |
| Investor Services Representative | 1-800-345-2021 or 816-531-5575 |
| Investors Using Advisors | 1-800-378-9878 |
| Business, Not-For-Profit, Employer-Sponsored Retirement Plans | 1-800-345-3533 |
| Banks and Trust Companies, Broker-Dealers, Financial Professionals, Insurance Companies | 1-800-345-6488 |
| Telecommunications Device for the Deaf | 1-800-634-4113 |
American Century Quantitative Equity Funds, Inc.
Investment Advisor:
American Century Investment Management, Inc.
Kansas City, Missouri
This report and the statements it contains are submitted for the general information of our shareholders. The report is not authorized for distribution to prospective investors unless preceded or accompanied by an effective prospectus.
©2012 American Century Proprietary Holdings, Inc. All rights reserved.
CL-ANN-75847 1208
ANNUAL REPORT JUNE 30, 2012
| President’s Letter | 2 |
| Market Perspective | 3 |
| Performance | 4 |
| Portfolio Commentary | 6 |
| Fund Characteristics | 8 |
| Shareholder Fee Example | 9 |
| Schedule of Investments | 11 |
| Statement of Assets and Liabilities | 14 |
| Statement of Operations | 15 |
| Statement of Changes in Net Assets | 16 |
| Notes to Financial Statements | 17 |
| Financial Highlights | 23 |
| Report of Independent Registered Public Accounting Firm | 25 |
| Management | 26 |
| Approval of Management Agreement | 29 |
| Additional Information | 34 |
Any opinions expressed in this report reflect those of the author as of the date of the report, and do not necessarily represent the opinions of American Century Investments® or any other person in the American Century Investments organization. Any such opinions are subject to change at any time based upon market or other conditions and American Century Investments disclaims any responsibility to update such opinions. These opinions may not be relied upon as investment advice and, because investment decisions made by American Century Investments funds are based on numerous factors, may not be relied upon as an indication of trading intent on behalf of any American Century Investments fund. Security examples are used for representational purposes only and are not intended as recommendations to purchase or sell securities. Performance information for comparative indices and securities is provided to American Century Investments by third party vendors. To the best of American Century Investments’ knowledge, such information is accurate at the time of printing.
Dear Investor:
Thank you for reviewing this annual report for the period ended June 30, 2012. Our report offers investment performance and portfolio information, presented with the expert perspective of our portfolio management team.
This report remains one of our most important vehicles for conveying information about fund returns, as well as market factors and strategies that affected fund performance. For additional, updated information, we encourage you to visit our website, americancentury.com. Click on the “Fund Performance” and “Insights & News” headings at the top of our Individual Investors site.
Flight to Quality as Economic and Financial Uncertainties Resurfaced
During the second half of 2011 and the first half of 2012, the global economy and financial markets struggled to move beyond the lingering aftereffects of the 2008 Financial Crisis and Great Recession. Global economic fundamentals have improved since 2008, but weakened since 2010, with increased uncertainty surrounding near-term economic growth levels in major developed economies such as the U.S., Japan, and Europe. There were also questions about near-term growth levels in influential emerging economies such as China.
These near-term uncertainties manifested themselves in asset returns for the 12 months ended June 30, 2012. Assets perceived to be “safe-haven” investments rallied—the 30-year U.S. Treasury bond posted a 39% total return. At the other end of the spectrum, international stock returns for U.S. investors were undermined by a combination of risk-averse investing attitudes, weakening global economic growth, and a stronger U.S. dollar versus the euro and currencies of other struggling economies. Commodity prices also plunged during the period.
Unfortunately, the instability that triggered much of this flight-to-quality trading remains largely in place, and the coming months may bring additional uncertainties about the U.S. presidential election and what might happen when various U.S. tax cuts and other stimulative measures expire in 2013 (the so-called “Fiscal Cliff”). In this uncertain, unstable environment, we continue to believe in a disciplined, diversified, long-term investment approach, using both stocks and bonds, as appropriate. We appreciate your continued trust in us during these unsettled times.
Sincerely,
Jonathan Thomas
President and Chief Executive Officer
American Century Investments
By Scott Wittman, Chief Investment Officer, Quantitative Equity
and Asset Allocation
U.S. Stocks Mixed but Generally Higher
The U.S. stock market faced significant volatility during the 12 months ended June 30, 2012, but ultimately posted positive overall returns. As the reporting period began, stocks were in the midst of an accelerating market decline as evidence of a slowdown in U.S. economic activity and a worsening sovereign debt crisis in Europe put downward pressure on the equity market.
In early October, however, the equity market bottomed and reversed course, enjoying a substantial rebound through the fourth quarter of 2011 and first quarter of 2012. Investors grew more optimistic as signs of improving economic activity quashed recession fears; in particular, job growth consistently exceeded expectations, driving the unemployment rate down to its lowest level in more than three years. Another positive factor was better news out of Europe as the European Central Bank provided long-term financing to the debt markets and support for the Continent’s banking sector.
The final three months of the period brought another reversal as the headwinds facing the equity market at the start of the period returned to the forefront. Evidence of slowing economic activity in the U.S. and adverse developments in Europe—including political turmoil in Greece and troubled banks in Spain—weighed on investor confidence, sending stocks down sharply.
Large-Cap Stocks Outperformed
For the 12-month period, the broad equity indices (as represented by the S&P 500 Index and Russell 3000 Index) rose by 4–5%. As the table below illustrates, however, there was a divergence in returns as large-cap stocks advanced while mid- and small-cap issues declined modestly. Growth and value stocks were mixed—growth issues outperformed among large-cap stocks, while value shares held up better in the mid- and small-cap segments of the market.
From a sector perspective, the defensive sectors of the market fared best. Utilities, consumer staples, and telecommunication services stocks all generated double-digit gains for the reporting period. On the downside, the commodity-driven energy and materials sectors fell the most during the period, reflecting a broad decline in commodity prices.
| U.S. Stock Index Returns |
| For the 12 months ended June 30, 2012 |
| Russell 1000 Index (Large-Cap) | 4.37% | | Russell 2000 Index (Small-Cap) | -2.08% |
| Russell 1000 Growth Index | 5.76% | | Russell 2000 Growth Index | -2.71% |
| Russell 1000 Value Index | 3.01% | | Russell 2000 Value Index | -1.44% |
| Russell Midcap Index | -1.65% | | | |
| Russell Midcap Growth Index | -2.99% | | | |
| Russell Midcap Value Index | -0.37% | | | |
| Total Returns as of June 30, 2012 |
| | | | Average Annual Returns | |
| | Ticker Symbol | 1 year | 5 years | 10 years | Since Inception | Inception Date |
| Investor Class | BIGRX | 4.75% | -1.81% | 4.73% | 9.27% | 12/17/90 |
| S&P 500 Index | — | 5.45% | 0.22% | 5.33% | 9.04%(1) | — |
| Institutional Class | AMGIX | 4.96% | -1.62% | 4.94% | 4.20% | 1/28/98 |
A Class(2) No sales charge* With sales charge* | AMADX | 4.46% -1.56% | -2.06% -3.21% | 4.47% 3.85% | 3.79% 3.36% | 12/15/97 |
| C Class | ACGCX | 3.73% | -2.78% | 3.70% | 1.83% | 6/28/01 |
| R Class | AICRX | 4.19% | -2.30% | — | 4.46% | 8/29/03 |
| * | Sales charges include initial sales charges and contingent deferred sales charges (CDSCs), as applicable. A Class shares have a 5.75% maximum initial sales charge and may be subject to a maximum CDSC of 1.00%. C Class shares redeemed within 12 months of purchase are subject to a maximum CDSC of 1.00%. The SEC requires that mutual funds provide performance information net of maximum sales charges in all cases where charges could be applied. |
| (1) | Since 12/31/90, the date nearest the Investor Class’s inception for which data are available. |
| (2) | Prior to September 4, 2007, the A Class was referred to as the Advisor Class and did not have a front-end sales charge. Performance prior to that date has been adjusted to reflect this charge. |
Data presented reflect past performance. Past performance is no guarantee of future results. Current performance may be higher or lower than the performance shown. Investment return and principal value will fluctuate, and redemption value may be more or less than original cost. To obtain performance data current to the most recent month end, please call 1-800-345-2021 or visit americancentury.com. International investing involves special risks, such as political instability and currency fluctuations.
Unless otherwise indicated, performance reflects Investor Class shares; performance for other share classes will vary due to differences in fee structure. For information about other share classes available, please consult the prospectus. Data assumes reinvestment of dividends and capital gains, and none of the charts reflect the deduction of taxes that a shareholder would pay on fund distributions or the redemption of fund shares. Returns for the index are provided for comparison. The fund’s total returns include operating expenses (such as transaction costs and management fees) that reduce returns, while the total returns of the index do not.
| Growth of $10,000 Over 10 Years |
| $10,000 investment made June 30, 2002 |
| Total Annual Fund Operating Expenses |
| Investor Class | Institutional Class | A Class | C Class | R Class |
| 0.69% | 0.49% | 0.94% | 1.69% | 1.19% |
The total annual fund operating expenses shown is as stated in the fund’s prospectus current as of the date of this report. The prospectus may vary from the expense ratio shown elsewhere in this report because it is based on a different time period, includes acquired fund fees and expenses, and, if applicable, does not include fee waivers or expense reimbursements.
Data presented reflect past performance. Past performance is no guarantee of future results. Current performance may be higher or lower than the performance shown. Investment return and principal value will fluctuate, and redemption value may be more or less than original cost. To obtain performance data current to the most recent month end, please call 1-800-345-2021 or visit americancentury.com. International investing involves special risks, such as political instability and currency fluctuations.
Unless otherwise indicated, performance reflects Investor Class shares; performance for other share classes will vary due to differences in fee structure. For information about other share classes available, please consult the prospectus. Data assumes reinvestment of dividends and capital gains, and none of the charts reflect the deduction of taxes that a shareholder would pay on fund distributions or the redemption of fund shares. Returns for the index are provided for comparison. The fund’s total returns include operating expenses (such as transaction costs and management fees) that reduce returns, while the total returns of the index do not.
Portfolio Managers: Brian Garbe and Claudia Musat
Performance Summary
Income & Growth returned 4.75%* for the fiscal year ended June 30, 2012, compared with the 5.45% return of its benchmark, the S&P 500 Index.
In an up-and-down period for the U.S. stock market (see page 3 for details), Income & Growth posted a solid gain for the 12 months but trailed the S&P 500. The fund’s tilt toward value was a detractor from performance versus the index as value stocks lagged growth issues by a notable margin in the large-cap segment of the equity market.
Absolute Performance Driven by Consumer Staples and Health Care
Income & Growth’s absolute return for the 12 months was driven primarily by strong returns in the more-defensive consumer staples and health care sectors, both of which generated double-digit gains. The leading contributors in the consumer staples sector included tobacco company Philip Morris International and beverage maker Constellation Brands. In the health care sector, drug makers Pfizer and Abbott Laboratories were the best contributors.
The fund’s holdings in the telecommunication services sector also fared well. Although telecom services is one of the smallest sector weightings in the portfolio, it gained more than 20% for the reporting period. Top contributors included diversified telecom providers Verizon Communications and AT&T, both of which were among the fund’s top 10 individual contributors to absolute performance.
The only two sectors in the portfolio to decline for the 12-month period were the industrials and energy sectors. Notable detractors included oil and gas producer Murphy Oil and drilling services provider Transocean in the energy sector, and defense contractor United Technologies and machinery manufacturer Eaton in the industrials sector. The fund’s holdings in the materials sector were fractionally positive for the reporting period, held back by mining company Freeport-McMoRan Copper & Gold, which was the fund’s largest detractor from absolute performance.
Technology and Industrials Underperformed
Looking at performance versus the S&P 500, the fund’s holdings in the information technology and industrials sectors contributed the most to its underperformance of the index for the 12 months. Stock selection among IT services providers and communications equipment makers had the biggest negative impact in the information technology sector.
The most significant decision adversely affecting performance versus the index during the period was an underweight position in consumer electronics maker Apple. On average, Apple was the fund’s second-largest holding for the 12 months, but it comprised an even larger percentage of the S&P 500. Apple rallied sharply during the period thanks to strong sales of its iPhone and iPad products.
*All fund returns referenced in this commentary are for Investor Class shares.
Other notable detractors in the technology sector included IT services provider Computer Sciences, which faced write-offs after losing a significant client, and electronic components maker Vishay Intertechnology, which reported disappointing earnings as sales volumes fell and profit margins narrowed.
In the industrials sector, stock selection among aerospace and defense contractors, as well as an overweight position in construction and engineering companies, detracted the most. The most significant individual detractors in this sector included engine maker Cummins, which fell as overseas demand declined, and defense contractor United Technologies, which struggled with reduced government spending on defense.
Energy and Health Care Outperformed
On the positive side, the fund’s holdings in the energy and health care sectors outperformed their counterparts in the S&P 500 for the 12-month period. Stock selection and an underweight position in energy equipment and services was the key behind the outperformance in the energy sector. In particular, underweight positions in energy equipment and services stocks Schlumberger and Halliburton added the most value as declining oil prices led to lower demand for their services.
In the health care sector, the fund’s holdings among drug makers and health care providers produced the bulk of the outperformance. Top contributors included pharmaceutical company Eli Lilly, which benefited from promising developments on a new Alzheimer’s medication, and biotechnology firm Amgen, which made a number of favorable acquisitions during the period.
Overall, five of the six top relative performance contributors in the portfolio were underweight positions in weaker-performing stocks. Along with Schlumberger, these included diversified technology company Hewlett-Packard, gold producer Newmont Mining, and financial services firms Bank of America and Citigroup.
The best-performing overweight positions in the portfolio included apparel maker VF Corp. and home improvement retailer Home Depot. VF reported better-than-expected earnings and completed the acquisition of footwear maker Timberland, while Home Depot benefited from growing do-it-yourself home improvement activity.
A Look Ahead
As we move into the second half of 2012, the U.S. equity market is likely to remain volatile given the uncertainty regarding the economic outlook, the European debt situation, and the upcoming U.S. presidential election. Heightened levels of volatility often provide investment opportunities, and our disciplined, objective, and systematic investment strategy is designed to take advantage of these opportunities at the individual company level. We believe this approach is the most powerful way to capitalize on market inefficiencies that lead to the mispricing of individual stocks.
| JUNE 30, 2012 |
| Top Ten Holdings | % of net assets |
| Apple, Inc. | 3.6% |
| Exxon Mobil Corp. | 3.4% |
| Microsoft Corp. | 2.6% |
| Chevron Corp. | 2.5% |
| International Business Machines Corp. | 2.4% |
| AT&T, Inc. | 2.2% |
| Philip Morris International, Inc. | 2.1% |
| Wells Fargo & Co. | 2.0% |
| Pfizer, Inc. | 2.0% |
| JPMorgan Chase & Co. | 1.9% |
| |
| Top Five Industries | % of net assets |
| Oil, Gas and Consumable Fuels | 10.7% |
| Pharmaceuticals | 7.7% |
| Insurance | 5.1% |
| Computers and Peripherals | 4.9% |
| Software | 4.6% |
| |
| Types of Investments in Portfolio | % of net assets |
| Domestic Common Stocks | 91.8% |
Foreign Common Stocks(1) | 7.3% |
| Total Common Stocks | 99.1% |
| Temporary Cash Investments | 0.9% |
| Other Assets and Liabilities | —(2) |
(1)Includes depositary shares, dual listed securities and foreign ordinary shares. (2)Category is less than 0.05% of total net assets. |
Fund shareholders may incur two types of costs: (1) transaction costs, including sales charges (loads) on purchase payments and redemption/exchange fees; and (2) ongoing costs, including management fees; distribution and service (12b-1) fees; and other fund expenses. This example is intended to help you understand your ongoing costs (in dollars) of investing in your fund and to compare these costs with the ongoing cost of investing in other mutual funds.
The example is based on an investment of $1,000 made at the beginning of the period and held for the entire period from January 1, 2012 to June 30, 2012.
Actual Expenses
The table provides information about actual account values and actual expenses for each class. You may use the information, together with the amount you invested, to estimate the expenses that you paid over the period. First, identify the share class you own. Then simply divide your account value by $1,000 (for example, an $8,600 account value divided by $1,000 = 8.6), then multiply the result by the number under the heading “Expenses Paid During Period” to estimate the expenses you paid on your account during this period.
If you hold Investor Class shares of any American Century Investments fund, or Institutional Class shares of the American Century Diversified Bond Fund, in an American Century Investments account (i.e., not a financial intermediary or retirement plan account), American Century Investments may charge you a $12.50 semiannual account maintenance fee if the value of those shares is less than $10,000. We will redeem shares automatically in one of your accounts to pay the $12.50 fee. In determining your total eligible investment amount, we will include your investments in all personal accounts (including American Century Investments Brokerage accounts) registered under your Social Security number. Personal accounts include individual accounts, joint accounts, UGMA/UTMA accounts, personal trusts, Coverdell Education Savings Accounts and IRAs (including traditional, Roth, Rollover, SEP-, SARSEP- and SIMPLE-IRAs), and certain other retirement accounts. If you have only business, business retirement, employer-sponsored or American Century Investments Brokerage accounts, you are currently not subject to this fee. If you are subject to the Account Maintenance Fee, your account value could be reduced by the fee amount.
Hypothetical Example for Comparison Purposes
The table also provides information about hypothetical account values and hypothetical expenses based on the actual expense ratio of each class of your fund and an assumed rate of return of 5% per year before expenses, which is not the actual return of a fund’s share class. The hypothetical account values and expenses may not be used to estimate the actual ending account balance or expenses you paid for the period. You may use this information to compare the ongoing costs of investing in your fund and other funds. To do so, compare this 5% hypothetical example with the 5% hypothetical examples that appear in the shareholder reports of the other funds.
Please note that the expenses shown in the table are meant to highlight your ongoing costs only and do not reflect any transactional costs, such as sales charges (loads) or redemption/exchange fees. Therefore, the table is useful in comparing ongoing costs only, and will not help you determine the relative total costs of owning different funds. In addition, if these transactional costs were included, your costs would have been higher.
| | Beginning Account Value 1/1/12 | Ending Account Value 6/30/12 | Expenses Paid During Period(1) 1/1/12 – 6/30/12 | Annualized Expense Ratio(1) |
| Actual |
| Investor Class | $1,000 | $1,088.50 | $3.53 | 0.68% |
| Institutional Class | $1,000 | $1,089.80 | $2.49 | 0.48% |
| A Class | $1,000 | $1,087.40 | $4.83 | 0.93% |
| C Class | $1,000 | $1,083.40 | $8.70 | 1.68% |
| R Class | $1,000 | $1,085.60 | $6.12 | 1.18% |
| Hypothetical |
| Investor Class | $1,000 | $1,021.48 | $3.42 | 0.68% |
| Institutional Class | $1,000 | $1,022.48 | $2.41 | 0.48% |
| A Class | $1,000 | $1,020.24 | $4.67 | 0.93% |
| C Class | $1,000 | $1,016.51 | $8.42 | 1.68% |
| R Class | $1,000 | $1,019.00 | $5.92 | 1.18% |
| (1) | Expenses are equal to the class’s annualized expense ratio listed in the table above, multiplied by the average account value over the period, multiplied by 182, the number of days in the most recent fiscal half-year, divided by 366, to reflect the one-half year period. |
| | | Shares | | | Value | |
| Common Stocks — 99.1% | |
| AEROSPACE AND DEFENSE — 3.6% | |
| General Dynamics Corp. | | | 199,468 | | | | $13,156,909 | |
| L-3 Communications Holdings, Inc. | | | 67,559 | | | | 5,000,042 | |
| Northrop Grumman Corp. | | | 249,867 | | | | 15,939,016 | |
| Raytheon Co. | | | 22,019 | | | | 1,246,055 | |
| United Technologies Corp. | | | 264,821 | | | | 20,001,930 | |
| | | | | | | | 55,343,952 | |
| AIR FREIGHT AND LOGISTICS — 1.9% | |
| FedEx Corp. | | | 168,695 | | | | 15,454,149 | |
| United Parcel Service, Inc., Class B | | | 177,273 | | | | 13,962,021 | |
| | | | | | | | 29,416,170 | |
| AUTOMOBILES — 0.7% | |
General Motors Co.(1) | | | 504,734 | | | | 9,953,354 | |
| BEVERAGES — 1.9% | |
| Coca-Cola Co. (The) | | | 106,376 | | | | 8,317,539 | |
Constellation Brands, Inc., Class A(1) | | | 621,485 | | | | 16,817,384 | |
| Dr Pepper Snapple Group, Inc. | | | 71,503 | | | | 3,128,256 | |
| PepsiCo, Inc. | | | 15,631 | | | | 1,104,487 | |
| | | | | | | | 29,367,666 | |
| BIOTECHNOLOGY — 1.5% | |
| Amgen, Inc. | | | 273,987 | | | | 20,012,011 | |
Biogen Idec, Inc.(1) | | | 6,211 | | | | 896,744 | |
Celgene Corp.(1) | | | 27,015 | | | | 1,733,282 | |
| | | | | | | | 22,642,037 | |
| CAPITAL MARKETS — 0.2% | |
| Bank of New York Mellon Corp. (The) | | | 166,308 | | | | 3,650,461 | |
| CHEMICALS — 2.8% | |
| CF Industries Holdings, Inc. | | | 78,963 | | | | 15,298,291 | |
| Monsanto Co. | | | 198,847 | | | | 16,460,555 | |
| PPG Industries, Inc. | | | 97,381 | | | | 10,334,072 | |
| | | | | | | | 42,092,918 | |
| COMMERCIAL BANKS — 3.9% | |
| Bank of Montreal | | | 120,511 | | | | 6,659,438 | |
| BB&T Corp. | | | 169,354 | | | | 5,224,571 | |
| U.S. Bancorp | | | 549,101 | | | | 17,659,088 | |
| Wells Fargo & Co. | | | 891,271 | | | | 29,804,102 | |
| | | | | | | | 59,347,199 | |
| COMMUNICATIONS EQUIPMENT — 0.5% | |
| Cisco Systems, Inc. | | | 127,549 | | | | 2,190,016 | |
Research In Motion Ltd.(1) | | | 724,274 | | | | 5,352,385 | |
| | | | | | | | 7,542,401 | |
| COMPUTERS AND PERIPHERALS — 4.9% | |
Apple, Inc.(1) | | | 93,880 | | | | 54,825,920 | |
Dell, Inc.(1) | | | 56,014 | | | | 701,295 | |
| Seagate Technology plc | | | 340,365 | | | | 8,417,227 | |
Western Digital Corp.(1) | | | 321,702 | | | | 9,805,477 | |
| | | | | | | | 73,749,919 | |
| CONSTRUCTION AND ENGINEERING — 0.9% | |
| Chicago Bridge & Iron Co. NV New York Shares | | | 174,441 | | | | 6,621,780 | |
| URS Corp. | | | 209,321 | | | | 7,301,117 | |
| | | | | | | | 13,922,897 | |
| CONSUMER FINANCE — 1.4% | |
| American Express Co. | | | 144,417 | | | | 8,406,514 | |
| Cash America International, Inc. | | | 274,281 | | | | 12,079,335 | |
| | | | | | | | 20,485,849 | |
| DIVERSIFIED CONSUMER SERVICES — 0.3% | |
| H&R Block, Inc. | | | 163,722 | | | | 2,616,278 | |
ITT Educational Services, Inc.(1) | | | 26,535 | | | | 1,612,001 | |
| | | | | | | | 4,228,279 | |
| DIVERSIFIED FINANCIAL SERVICES — 2.1% | |
| Bank of America Corp. | | | 219,258 | | | | 1,793,530 | |
| JPMorgan Chase & Co. | | | 799,373 | | | | 28,561,597 | |
| NASDAQ OMX Group, Inc. (The) | | | 45,692 | | | | 1,035,838 | |
| | | | | | | | 31,390,965 | |
| DIVERSIFIED TELECOMMUNICATION SERVICES — 4.0% | |
| AT&T, Inc. | | | 928,989 | | | | 33,127,748 | |
| Verizon Communications, Inc. | | | 629,403 | | | | 27,970,669 | |
| | | | | | | | 61,098,417 | |
| ELECTRIC UTILITIES — 1.3% | |
| American Electric Power Co., Inc. | | | 194,873 | | | | 7,775,433 | |
| FirstEnergy Corp. | | | 250,361 | | | | 12,315,257 | |
| | | | | | | | 20,090,690 | |
| ELECTRONIC EQUIPMENT, INSTRUMENTS AND COMPONENTS — 0.5% | |
| Molex, Inc. | | | 120,444 | | | | 2,883,429 | |
| TE Connectivity Ltd. | | | 93,556 | | | | 2,985,372 | |
Tech Data Corp.(1) | | | 33,603 | | | | 1,618,657 | |
| | | | | | | | 7,487,458 | |
| ENERGY EQUIPMENT AND SERVICES — 1.0% | |
Helix Energy Solutions Group, Inc.(1) | | | 677,563 | | | | 11,118,809 | |
| National Oilwell Varco, Inc. | | | 71,253 | | | | 4,591,543 | |
| | | | | | | | 15,710,352 | |
| FOOD AND STAPLES RETAILING — 1.2% | |
| CVS Caremark Corp. | | | 140,131 | | | | $6,548,322 | |
| SUPERVALU, Inc. | | | 1,880,662 | | | | 9,741,829 | |
| Wal-Mart Stores, Inc. | | | 33,983 | | | | 2,369,295 | |
| | | | | | | | 18,659,446 | |
| FOOD PRODUCTS — 3.3% | |
| Archer-Daniels-Midland Co. | | | 483,351 | | | | 14,268,521 | |
| Bunge Ltd. | | | 119,493 | | | | 7,496,991 | |
| Campbell Soup Co. | | | 114,774 | | | | 3,831,156 | |
| ConAgra Foods, Inc. | | | 467,101 | | | | 12,111,929 | |
Smithfield Foods, Inc.(1) | | | 20,404 | | | | 441,339 | |
| Tyson Foods, Inc., Class A | | | 666,379 | | | | 12,547,917 | |
| | | | | | | | 50,697,853 | |
| HEALTH CARE EQUIPMENT AND SUPPLIES — 0.8% | |
| Becton, Dickinson and Co. | | | 82,061 | | | | 6,134,060 | |
| Covidien plc | | | 26,789 | | | | 1,433,211 | |
| Medtronic, Inc. | | | 33,312 | | | | 1,290,174 | |
| St. Jude Medical, Inc. | | | 5,816 | | | | 232,117 | |
| Zimmer Holdings, Inc. | | | 53,337 | | | | 3,432,769 | |
| | | | | | | | 12,522,331 | |
| HEALTH CARE PROVIDERS AND SERVICES — 2.8% | |
| Humana, Inc. | | | 171,301 | | | | 13,265,550 | |
| McKesson Corp. | | | 50,153 | | | | 4,701,844 | |
| UnitedHealth Group, Inc. | | | 341,546 | | | | 19,980,441 | |
| WellPoint, Inc. | | | 76,717 | | | | 4,893,777 | |
| | | | | | | | 42,841,612 | |
| HOTELS, RESTAURANTS AND LEISURE — 0.5% | |
| Brinker International, Inc. | | | 98,043 | | | | 3,124,630 | |
| McDonald’s Corp. | | | 35,379 | | | | 3,132,103 | |
| Yum! Brands, Inc. | | | 25,921 | | | | 1,669,831 | |
| | | | | | | | 7,926,564 | |
| HOUSEHOLD DURABLES — 0.4% | |
| Garmin Ltd. | | | 169,795 | | | | 6,501,451 | |
| HOUSEHOLD PRODUCTS — 1.4% | |
| Kimberly-Clark Corp. | | | 139,034 | | | | 11,646,878 | |
| Procter & Gamble Co. (The) | | | 146,879 | | | | 8,996,339 | |
| | | | | | | | 20,643,217 | |
| INDUSTRIAL CONGLOMERATES — 1.1% | |
| General Electric Co. | | | 700,529 | | | | 14,599,024 | |
| Tyco International Ltd. | | | 40,082 | | | | 2,118,334 | |
| | | | | | | | 16,717,358 | |
| INSURANCE — 5.1% | |
| ACE Ltd. | | | 193,722 | | | | 14,360,612 | |
| Allied World Assurance Co. Holdings AG | | | 149,707 | | | | 11,897,215 | |
| American Financial Group, Inc. | | | 237,769 | | | | 9,327,678 | |
| Assured Guaranty Ltd. | | | 54,342 | | | | 766,222 | |
Berkshire Hathaway, Inc., Class B(1) | | | 61,019 | | | | 5,084,713 | |
| CNA Financial Corp. | | | 10,840 | | | | 300,485 | |
| Everest Re Group Ltd. | | | 54,904 | | | | 5,682,015 | |
| Loews Corp. | | | 37,004 | | | | 1,513,834 | |
| Marsh & McLennan Cos., Inc. | | | 29,051 | | | | 936,314 | |
| Principal Financial Group, Inc. | | | 536,888 | | | | 14,082,572 | |
| Prudential Financial, Inc. | | | 295,917 | | | | 14,331,260 | |
| | | | | | | | 78,282,920 | |
| INTERNET SOFTWARE AND SERVICES — 1.8% | |
AOL, Inc.(1) | | | 152,251 | | | | 4,275,208 | |
Google, Inc., Class A(1) | | | 39,026 | | | | 22,637,812 | |
| | | | | | | | 26,913,020 | |
| IT SERVICES — 4.5% | |
| Accenture plc, Class A | | | 205,794 | | | | 12,366,162 | |
| Computer Sciences Corp. | | | 340,609 | | | | 8,453,915 | |
| International Business Machines Corp. | | | 186,343 | | | | 36,444,964 | |
| SAIC, Inc. | | | 481,846 | | | | 5,839,974 | |
| Visa, Inc., Class A | | | 37,786 | | | | 4,671,483 | |
| | | | | | | | 67,776,498 | |
| MACHINERY — 1.9% | |
| Cummins, Inc. | | | 145,370 | | | | 14,087,806 | |
| Parker-Hannifin Corp. | | | 168,276 | | | | 12,937,059 | |
| Sauer-Danfoss, Inc. | | | 46,618 | | | | 1,628,367 | |
| | | | | | | | 28,653,232 | |
| MEDIA — 3.8% | |
| CBS Corp., Class B | | | 457,186 | | | | 14,986,557 | |
| Comcast Corp., Class A | | | 745,475 | | | | 23,832,836 | |
| Regal Entertainment Group, Class A | | | 705,040 | | | | 9,701,350 | |
| Time Warner, Inc. | | | 247,184 | | | | 9,516,584 | |
| | | | | | | | 58,037,327 | |
| METALS AND MINING — 1.7% | |
Coeur d’Alene Mines Corp.(1) | | | 312,613 | | | | 5,489,484 | |
| Freeport-McMoRan Copper & Gold, Inc. | | | 267,070 | | | | 9,099,075 | |
| Teck Resources Ltd. | | | 375,954 | | | | 11,632,017 | |
| | | | | | | | 26,220,576 | |
| MULTI-UTILITIES — 1.4% | |
| Ameren Corp. | | | 101,054 | | | | 3,389,351 | |
| Consolidated Edison, Inc. | | | 68,659 | | | | 4,269,903 | |
| Public Service Enterprise Group, Inc. | | | 415,346 | | | | 13,498,745 | |
| | | | | | | | 21,157,999 | |
| MULTILINE RETAIL — 1.4% | |
| Dillard’s, Inc., Class A | | | 146,042 | | | | 9,299,955 | |
| Macy’s, Inc. | | | 358,541 | | | | 12,315,883 | |
| | | | | | | | 21,615,838 | |
| OIL, GAS AND CONSUMABLE FUELS — 10.7% | |
| Apache Corp. | | | 23,009 | | | | $2,022,261 | |
| Chevron Corp. | | | 364,990 | | | | 38,506,445 | |
| ConocoPhillips | | | 380,263 | | | | 21,249,097 | |
| Energy XXI Bermuda Ltd. | | | 329,122 | | | | 10,298,227 | |
| Exxon Mobil Corp. | | | 600,697 | | | | 51,401,642 | |
| Marathon Oil Corp. | | | 162,636 | | | | 4,158,603 | |
| Marathon Petroleum Corp. | | | 231,745 | | | | 10,409,986 | |
| Occidental Petroleum Corp. | | | 128,694 | | | | 11,038,084 | |
Phillips 66(1) | | | 76,408 | | | | 2,539,802 | |
| Suncor Energy, Inc. | | | 31,057 | | | | 899,100 | |
| Valero Energy Corp. | | | 436,988 | | | | 10,553,260 | |
| | | | | | | | 163,076,507 | |
| PAPER AND FOREST PRODUCTS — 0.2% | |
| Domtar Corp. | | | 40,878 | | | | 3,135,751 | |
PERSONAL PRODUCTS† | |
| Nu Skin Enterprises, Inc., Class A | | | 8,246 | | | | 386,737 | |
| PHARMACEUTICALS — 7.7% | |
| Abbott Laboratories | | | 412,613 | | | | 26,601,160 | |
| Eli Lilly & Co. | | | 445,968 | | | | 19,136,487 | |
| Johnson & Johnson | | | 421,840 | | | | 28,499,510 | |
| Merck & Co., Inc. | | | 324,366 | | | | 13,542,281 | |
| Pfizer, Inc. | | | 1,295,114 | | | | 29,787,622 | |
| | | | | | | | 117,567,060 | |
| REAL ESTATE INVESTMENT TRUSTS (REITs) — 1.1% | |
| American Tower Corp. | | | 31,510 | | | | 2,202,864 | |
| Entertainment Properties Trust | | | 32,982 | | | | 1,355,890 | |
| Post Properties, Inc. | | | 48,006 | | | | 2,349,894 | |
| Public Storage | | | 23,637 | | | | 3,413,419 | |
| Simon Property Group, Inc. | | | 49,282 | | | | 7,671,236 | |
| | | | | | | | 16,993,303 | |
| ROAD AND RAIL — 0.1% | |
| Norfolk Southern Corp. | | | 6,423 | | | | 460,979 | |
| Union Pacific Corp. | | | 3,477 | | | | 414,841 | |
| | | | | | | | 875,820 | |
| SEMICONDUCTORS AND SEMICONDUCTOR EQUIPMENT — 2.6% | |
| Applied Materials, Inc. | | | 448,588 | | | | 5,140,818 | |
| Intel Corp. | | | 1,067,626 | | | | 28,452,233 | |
| KLA-Tencor Corp. | | | 51,588 | | | | 2,540,709 | |
Lam Research Corp.(1) | | | 98,474 | | | | 3,716,409 | |
| | | | | | | | 39,850,169 | |
| SOFTWARE — 4.6% | |
| Activision Blizzard, Inc. | | | 863,902 | | | | 10,358,185 | |
| Microsoft Corp. | | | 1,313,899 | | | | 40,192,170 | |
| Oracle Corp. | | | 282,971 | | | | 8,404,239 | |
Symantec Corp.(1) | | | 649,193 | | | | 9,484,710 | |
Synopsys, Inc.(1) | | | 26,687 | | | | 785,398 | |
| | | | | | | | 69,224,702 | |
| SPECIALTY RETAIL — 3.5% | |
| Best Buy Co., Inc. | | | 602,303 | | | | 12,624,271 | |
| Foot Locker, Inc. | | | 304,087 | | | | 9,298,980 | |
| GameStop Corp., Class A | | | 436,891 | | | | 8,021,319 | |
| Home Depot, Inc. (The) | | | 429,387 | | | | 22,753,217 | |
| PetSmart, Inc. | | | 16,526 | | | | 1,126,743 | |
| | | | | | | | 53,824,530 | |
| TOBACCO — 2.1% | |
| Philip Morris International, Inc. | | | 360,912 | | | | 31,493,181 | |
TOTAL COMMON STOCKS (Cost $1,160,919,797) | | | | 1,509,115,986 | |
| Temporary Cash Investments — 0.9% | |
Repurchase Agreement, Bank of America Merrill Lynch., (collateralized by various U.S. Treasury obligations, 1.50% – 4.00%, 2/15/15 – 6/30/16, valued at $4,389,654), in a joint trading account at 0.10%, dated 6/29/12, due 7/2/12 (Delivery value $4,306,054) | | | | 4,306,018 | |
Repurchase Agreement, Credit Suisse First Boston, Inc., (collateralized by various U.S. Treasury obligations, 3.75%, 8/15/41, valued at $4,403,300), in a joint trading account at 0.10%, dated 6/29/12, due 7/2/12 (Delivery value $4,306,054) | | | | 4,306,018 | |
Repurchase Agreement, Goldman Sachs & Co., (collateralized by various U.S. Treasury obligations, 4.375%, 5/15/40, valued at $1,096,565), in a joint trading account at 0.06%, dated 6/29/12, due 7/2/12 (Delivery value $1,076,509) | | | | 1,076,504 | |
| SSgA U.S. Government Money Market Fund | | | 3,772,077 | | | | 3,772,077 | |
TOTAL TEMPORARY CASH INVESTMENTS (Cost $13,460,617) | | | | 13,460,617 | |
TOTAL INVESTMENT SECURITIES — 100.0% (Cost $1,174,380,414) | | | | 1,522,576,603 | |
OTHER ASSETS AND LIABILITIES† | | | | 396,246 | |
| TOTAL NET ASSETS — 100.0% | | | | $1,522,972,849 | |
Notes to Schedule of Investments
| † | Category is less than 0.05% of total net assets. |
See Notes to Financial Statements.
Statement of Assets and Liabilities |
| JUNE 30, 2012 | |
| Assets | |
| Investment securities, at value (cost of $1,174,380,414) | | | $1,522,576,603 | |
| Cash | | | 76,408 | |
| Receivable for capital shares sold | | | 545,305 | |
| Dividends and interest receivable | | | 1,604,113 | |
| | | | 1,524,802,429 | |
| | | | | |
| Liabilities | |
| Payable for capital shares redeemed | | | 1,000,818 | |
| Accrued management fees | | | 804,266 | |
| Distribution and service fees payable | | | 24,496 | |
| | | | 1,829,580 | |
| | | | | |
| Net Assets | | | $1,522,972,849 | |
| | | | | |
| Net Assets Consist of: | |
| Capital (par value and paid-in surplus) | | | $1,599,019,074 | |
| Undistributed net investment income | | | 1,276,101 | |
| Accumulated net realized loss | | | (425,519,354 | ) |
| Net unrealized appreciation | | | 348,197,028 | |
| | | | $1,522,972,849 | |
| | | Net assets | | Shares outstanding | | Net asset value per share |
| Investor Class, $0.01 Par Value | | | $1,306,254,237 | | | | 49,687,139 | | | | $26.29 | |
| Institutional Class, $0.01 Par Value | | | $97,809,214 | | | | 3,717,417 | | | | $26.31 | |
| A Class, $0.01 Par Value | | | $116,762,308 | | | | 4,445,695 | | | | $26.26 | * |
| C Class, $0.01 Par Value | | | $1,150,547 | | | | 43,867 | | | | $26.23 | |
| R Class, $0.01 Par Value | | | $996,543 | | | | 37,913 | | | | $26.28 | |
| *Maximum offering price $27.86 (net asset value divided by 0.9425). | |
See Notes to Financial Statements.
| YEAR ENDED JUNE 30, 2012 | |
| Investment Income (Loss) | |
| Income: | | | |
| Dividends (net of foreign taxes withheld of $52,089) | | | $36,342,680 | |
| Interest | | | 7,931 | |
| | | | 36,350,611 | |
| | | | | |
| Expenses: | | | | |
| Management fees | | | 9,960,558 | |
| Distribution and service fees: | | | | |
| A Class | | | 286,612 | |
| B Class | | | 259 | |
| C Class | | | 9,720 | |
| R Class | | | 3,237 | |
| Directors’ fees and expenses | | | 83,346 | |
| | | | 10,343,732 | |
| | | | | |
| Net investment income (loss) | | | 26,006,879 | |
| | | | | |
| Realized and Unrealized Gain (Loss) | |
| Net realized gain (loss) on: | | | | |
| Investment transactions | | | 61,124,293 | |
| Futures contract transactions | | | 113,445 | |
| Foreign currency transactions | | | (3,685 | ) |
| | | | 61,234,053 | |
| | | | | |
| Change in net unrealized appreciation (depreciation) on: | | | | |
| Investments | | | (22,981,327 | ) |
| Translation of assets and liabilities in foreign currencies | | | 839 | |
| | | | (22,980,488 | ) |
| | | | | |
| Net realized and unrealized gain (loss) | | | 38,253,565 | |
| | | | | |
| Net Increase (Decrease) in Net Assets Resulting from Operations | | | $64,260,444 | |
See Notes to Financial Statements.
Statement of Changes in Net Assets |
| YEARS ENDED JUNE 30, 2012 AND JUNE 30, 2011 | |
| Increase (Decrease) in Net Assets | June 30, 2012 | | | June 30, 2011 | |
| Operations | |
| Net investment income (loss) | | $26,006,879 | | | | $24,796,556 | |
| Net realized gain (loss) | | 61,234,053 | | | | 120,379,628 | |
| Change in net unrealized appreciation (depreciation) | | (22,980,488 | ) | | | 287,256,696 | |
| Net increase (decrease) in net assets resulting from operations | | 64,260,444 | | | | 432,432,880 | |
| | | | | | | | |
| Distributions to Shareholders | |
| From net investment income: | | | | | | | |
| Investor Class | | (22,166,360 | ) | | | (18,759,820 | ) |
| Institutional Class | | (2,131,405 | ) | | | (2,729,719 | ) |
| A Class | | (1,703,017 | ) | | | (1,546,359 | ) |
| B Class | | (171 | ) | | | (416 | ) |
| C Class | | (7,366 | ) | | | (4,216 | ) |
| R Class | | (8,302 | ) | | | (3,766 | ) |
| Decrease in net assets from distributions | | (26,016,621 | ) | | | (23,044,296 | ) |
| | | | | | | | |
| Capital Share Transactions | |
| Net increase (decrease) in net assets from capital share transactions | | (126,126,611 | ) | | | (350,165,245 | ) |
| | | | | | | | |
| Net increase (decrease) in net assets | | (87,882,788 | ) | | | 59,223,339 | |
| | | | | | | | |
| Net Assets | |
| Beginning of period | | 1,610,855,637 | | | | 1,551,632,298 | |
| End of period | | $1,522,972,849 | | | | $1,610,855,637 | |
| | | | | | | | |
| Undistributed net investment income | | $1,276,101 | | | | $1,379,089 | |
See Notes to Financial Statements.
Notes to Financial Statements |
JUNE 30, 2012
1. Organization
American Century Quantitative Equity Funds, Inc. (the corporation) is registered under the Investment Company Act of 1940, as amended (the 1940 Act), as an open-end management investment company and is organized as a Maryland corporation. Income & Growth Fund (the fund) is one fund in a series issued by the corporation. The fund is diversified as defined under the 1940 Act. The fund’s investment objective is to seek long-term capital growth. Income is a secondary objective. The fund pursues its objectives by investing primarily in common stocks of large capitalization, publicly-traded U.S. companies.
The fund offers the Investor Class, the Institutional Class, the A Class, the C Class and the R Class. The A Class may incur an initial sales charge. The A Class and C Class may be subject to a contingent deferred sales charge. The share classes differ principally in their respective sales charges and distribution and shareholder servicing expenses and arrangements. The Institutional Class is made available to institutional shareholders or through financial intermediaries whose clients do not require the same level of shareholder and administrative services as shareholders of other classes. As a result, the Institutional Class is charged a lower unified management fee. On October 21, 2011, all outstanding B Class shares were converted to A Class shares and the fund discontinued offering the B Class.
2. Significant Accounting Policies
The following is a summary of significant accounting policies consistently followed by the fund in preparation of its financial statements. The financial statements are prepared in conformity with accounting principles generally accepted in the United States of America, which may require management to make certain estimates and assumptions at the date of the financial statements. Actual results could differ from these estimates.
Investment Valuations — The fund determines the fair value of its investments and computes its net asset value per share as of the close of regular trading (usually 4 p.m. Eastern time) on the New York Stock Exchange (NYSE) on each day the NYSE is open.
Equity securities that are listed or traded on a domestic securities exchange are valued at the last reported sales price or at the official closing price as provided by the exchange. Equity securities traded on foreign securities exchanges are typically valued at the closing price on the exchange where primarily traded or as of the close of the NYSE, if that is earlier. If no last sales price is reported, or if local convention or regulation so provides, the mean of the latest bid and asked prices is used. Depending on local convention or regulation, securities traded over-the-counter are valued at the mean of the latest bid and asked prices, the last sales price, or the official closing price. In its determination of fair value, the fund may review several factors including: market information specific to a security; news developments in U.S. and foreign markets; the performance of particular U.S. and foreign securities, indices, comparable securities, American Depositary Receipts, Exchange-Traded Funds, and other relevant market indicators.
Debt securities maturing within 60 days at the time of purchase may be valued at cost, plus or minus any amortized discount or premium or at the evaluated mean as provided by an independent pricing service. Evaluated mean prices are commonly derived through utilization of market models, which may consider, among other factors, trade data, quotations from dealers and active market makers, relevant yield curve and spread data, related sector levels, creditworthiness, and other relevant market information on the same or comparable securities.
Investments in open-end management investment companies are valued at the reported net asset value per share. Repurchase agreements are valued at cost. Exchange-traded futures contracts are valued at the settlement price as provided by the appropriate clearing corporation.
The value of investments initially expressed in foreign currencies is translated into U.S. dollars at prevailing exchange rates.
If the fund determines that the market price for a portfolio security is not readily available or the valuation methods mentioned above do not reflect a security’s fair value, such security is valued as determined in good faith by the Board of Directors or its designee, in accordance with procedures adopted by the Board of Directors. Circumstances that may cause the fund to use these procedures to value a security include, but are not limited to: a security has been declared in default; trading in a security has been halted during the trading day; there is a foreign market holiday and no trading occurred; or an event occurred between the close of a foreign exchange and the NYSE that may affect the value of a security.
Security Transactions — Security transactions are accounted for as of the trade date. Net realized gains and losses are determined on the identified cost basis, which is also used for federal income tax purposes.
Investment Income — Dividend income less foreign taxes withheld, if any, is recorded as of the ex-dividend date. Interest income is recorded on the accrual basis and includes accretion of discounts and amortization of premiums.
Foreign Currency Translations — All assets and liabilities initially expressed in foreign currencies are translated into U.S. dollars at prevailing exchange rates at period end. The fund may enter into spot foreign currency exchange contracts to facilitate transactions denominated in a foreign currency. Purchases and sales of investment securities, dividend and interest income, spot foreign currency exchange contracts, and expenses are translated at the rates of exchange prevailing on the respective dates of such transactions. Net realized and unrealized foreign currency exchange gains or losses related to investment securities are a component of net realized gain (loss) on investment transactions and change in net unrealized appreciation (depreciation) on investments, respectively.
Repurchase Agreements — The fund may enter into repurchase agreements with institutions that American Century Investment Management, Inc. (ACIM) (the investment advisor) has determined are creditworthy pursuant to criteria adopted by the Board of Directors. The fund requires that the collateral, represented by securities, received in a repurchase transaction be transferred to the custodian in a manner sufficient to enable the fund to obtain those securities in the event of a default under the repurchase agreement. ACIM monitors, on a daily basis, the securities transferred to ensure the value, including accrued interest, of the securities under each repurchase agreement is equal to or greater than amounts owed to the fund under each repurchase agreement.
Joint Trading Account — Pursuant to an Exemptive Order issued by the Securities and Exchange Commission, the fund, along with certain other funds in the American Century Investments family of funds, may transfer uninvested cash balances into a joint trading account. These balances are invested in one or more repurchase agreements that are collateralized by U.S. Treasury or Agency obligations.
Segregated Assets — In accordance with the 1940 Act, the fund segregates assets on its books and records to cover futures contracts. ACIM monitors, on a daily basis, the securities segregated to ensure the fund designates a sufficient amount of liquid assets, marked-to-market daily. The fund may also receive assets or be required to pledge assets at the custodian bank or with a broker for margin requirements on futures contracts.
Income Tax Status — It is the fund’s policy to distribute substantially all net investment income and net realized gains to shareholders and to otherwise qualify as a regulated investment company under provisions of the Internal Revenue Code. The fund is no longer subject to examination by tax authorities for years prior to 2009. At this time, management believes there are no uncertain tax positions which, based on their technical merit, would not be sustained upon examination and for which it is reasonably possible that the total amounts of unrecognized tax benefits will significantly change in the next twelve months. Accordingly, no provision has been made for federal or state income taxes.
Multiple Class — All shares of the fund represent an equal pro rata interest in the net assets of the class to which such shares belong, and have identical voting, dividend, liquidation and other rights and the same terms and conditions, except for class specific expenses and exclusive rights to vote on matters affecting only individual classes. Income, non-class specific expenses, and realized and unrealized capital gains and losses of the fund are allocated to each class of shares based on their relative net assets.
Distributions to Shareholders — Distributions from net investment income, if any, are generally declared and paid quarterly. Distributions from net realized gains, if any, are generally declared and paid annually.
Indemnifications — Under the corporation’s organizational documents, its officers and directors are indemnified against certain liabilities arising out of the performance of their duties to the fund. In addition, in the normal course of business, the fund enters into contracts that provide general indemnifications. The maximum exposure under these arrangements is unknown as this would involve future claims that may be made against a fund. The risk of material loss from such claims is considered by management to be remote.
3. Fees and Transactions with Related Parties
Management Fees — The corporation has entered into a management agreement with ACIM, under which ACIM provides the fund with investment advisory and management services in exchange for a single, unified management fee (the fee) per class. The agreement provides that all expenses of managing and operating the fund, except distribution and service fees, brokerage expenses, taxes, interest, fees and expenses of the independent trustees (including legal counsel fees), and extraordinary expenses, will be paid by ACIM. The fee is computed and accrued daily based on each class’s daily net assets and paid monthly in arrears. The fee consists of (1) an Investment Category Fee based on the daily net assets of the fund and certain other accounts managed by the investment advisor that are in the same broad investment category as the fund and (2) a Complex Fee based on the assets of all the funds in the American Century Investments family of funds. The rates for the Investment Category Fee range from 0.3380% to 0.5200%. The rates for the Complex Fee range from 0.2500% to 0.3100% for the Investor Class, A Class, B Class, C Class and R Class. The Institutional Class is 0.2000% less at each point within the Complex Fee range. The effective annual management fee for each class for the year ended June 30, 2012 was 0.68% for the Investor Class, A Class, C Class and R Class and 0.48% for the Institutional Class.
Distribution and Service Fees — The Board of Directors has adopted a separate Master Distribution and Individual Shareholder Services Plan for each of the A Class, B Class, C Class and R Class (collectively the plans), pursuant to Rule 12b-1 of the 1940 Act. The plans provide that the A Class will pay American Century Investment Services, Inc. (ACIS) an annual distribution and service fee of 0.25%. The plans provide that the B Class and C Class will each pay ACIS an annual distribution and service fee of 1.00%, of which 0.25% is paid for individual shareholder services and 0.75% is paid for distribution services. The plans provide that the R Class will pay ACIS an annual distribution and service fee of 0.50%. The fees are computed and accrued daily based on each class’s daily net assets and paid monthly in arrears. The fees are used to pay financial intermediaries for distribution and individual shareholder services. Fees incurred under the plans during the year ended June 30, 2012 are detailed in the Statement of Operations.
Related Parties — Certain officers and directors of the corporation are also officers and/or directors of American Century Companies, Inc., the parent of the corporation’s investment advisor, ACIM, the distributor of the corporation, ACIS, and the corporation’s transfer agent, American Century Services, LLC.
4. Investment Transactions
Purchases and sales of investment securities, excluding short-term investments, for the year ended June 30, 2012 were $785,606,360 and $888,133,304, respectively.
5. Capital Share Transactions
Transactions in shares of the fund were as follows:
| | Year ended June 30, 2012 | | Year ended June 30, 2011 | |
| | Shares | | Amount | | Shares | | Amount | |
| Investor Class/Shares Authorized | | 230,000,000 | | | | | 330,000,000 | | | |
| Sold | | 3,224,252 | | | $81,186,437 | | | 4,055,282 | | | $97,373,445 | |
| Issued in reinvestment of distributions | | 857,331 | | | 21,323,146 | | | 744,626 | | | 17,595,330 | |
| Redeemed | | (7,326,884 | ) | | (182,293,645 | ) | | (13,602,049 | ) | | (318,927,646 | ) |
| | | (3,245,301 | ) | | (79,784,062 | ) | | (8,802,141 | ) | | (203,958,871 | ) |
| Institutional Class/Shares Authorized | | 75,000,000 | | | | | | 100,000,000 | | | | |
| Sold | | 722,826 | | | 18,132,028 | | | 1,035,106 | | | 23,919,025 | |
| Issued in reinvestment of distributions | | 74,524 | | | 1,845,822 | | | 106,317 | | | 2,484,050 | |
| Redeemed | | (2,106,105 | ) | | (52,366,864 | ) | | (6,027,443 | ) | | (142,584,805 | ) |
| | | (1,308,755 | ) | | (32,389,014 | ) | | (4,886,020 | ) | | (116,181,730 | ) |
| A Class/Shares Authorized | | 75,000,000 | | | | | | 100,000,000 | | | | |
| Sold | | 735,867 | | | 18,374,764 | | | 651,825 | | | 15,543,996 | |
| Issued in reinvestment of distributions | | 67,472 | | | 1,676,653 | | | 64,037 | | | 1,510,238 | |
| Redeemed | | (1,410,073 | ) | | (34,585,102 | ) | | (2,006,731 | ) | | (47,042,494 | ) |
| | | (606,734 | ) | | (14,533,685 | ) | | (1,290,869 | ) | | (29,988,260 | ) |
| B Class/Shares Authorized | | N/A | | | | | | 10,000,000 | | | | |
| Sold | | — | | | — | | | 590 | | | 13,970 | |
| Issued in reinvestment of distributions | | 7 | | | 171 | | | 17 | | | 399 | |
| Redeemed | | (3,650 | ) | | (87,522 | ) | | (953 | ) | | (23,596 | ) |
| | | (3,643 | ) | | (87,351 | ) | | (346 | ) | | (9,227 | ) |
| C Class/Shares Authorized | | 10,000,000 | | | | | | 10,000,000 | | | | |
| Sold | | 14,803 | | | 378,581 | | | 13,080 | | | 312,515 | |
| Issued in reinvestment of distributions | | 204 | | | 5,057 | | | 137 | | | 3,243 | |
| Redeemed | | (7,752 | ) | | (191,694 | ) | | (20,124 | ) | | (482,602 | ) |
| | | 7,255 | | | 191,944 | | | (6,907 | ) | | (166,844 | ) |
| R Class/Shares Authorized | | 10,000,000 | | | | | | 10,000,000 | | | | |
| Sold | | 27,268 | | | 700,916 | | | 14,111 | | | 338,455 | |
| Issued in reinvestment of distributions | | 221 | | | 5,575 | | | 91 | | | 2,158 | |
| Redeemed | | (9,405 | ) | | (230,934 | ) | | (8,403 | ) | | (200,926 | ) |
| | | 18,084 | | | 475,557 | | | 5,799 | | | 139,687 | |
| Net increase (decrease) | | (5,139,094 | ) | | $(126,126,611 | ) | | (14,980,484 | ) | | $(350,165,245 | ) |
6. Fair Value Measurements
The fund’s securities valuation process is based on several considerations and may use multiple inputs to determine the fair value of the positions held by the fund. In conformity with accounting principles generally accepted in the United States of America, the inputs used to determine a valuation are classified into three broad levels as follows:
| • | Level 1 valuation inputs consist of unadjusted quoted prices in an active market for identical securities; |
| • | Level 2 valuation inputs consist of direct or indirect observable market data (including quoted prices for similar securities, evaluations of subsequent market events, interest rates, prepayment speeds, credit risk, etc.); or |
| • | Level 3 valuation inputs consist of unobservable data (including a fund’s own assumptions). |
The level classification is based on the lowest level input that is significant to the fair valuation measurement. The valuation inputs are not necessarily an indication of the risks associated with investing in these securities or other financial instruments.
The following is a summary of the level classifications as of period end. The Schedule of Investments provides additional information on the fund’s portfolio holdings.
| | Level 1 | | Level 2 | | Level 3 |
| Investment Securities | |
| Domestic Common Stocks | | $1,397,989,467 | | | | — | | | | — | |
| Foreign Common Stocks | | 111,126,519 | | | | — | | | | — | |
| Temporary Cash Investments | | 3,772,077 | | | | $9,688,540 | | | | — | |
| Total Value of Investment Securities | | $1,512,888,063 | | | | $9,688,540 | | | | — | |
7. Derivative Instruments
Equity Price Risk — The fund is subject to equity price risk in the normal course of pursuing its investment objectives. A fund may enter into futures contracts based on an equity index in order to manage its exposure to changes in market conditions. A fund may purchase futures contracts to gain exposure to increases in market value or sell futures contracts to protect against a decline in market value. Upon entering into a futures contract, a fund is required to deposit either cash or securities in an amount equal to a certain percentage of the contract value (initial margin). Subsequent payments (variation margin) are made or received daily, in cash, by a fund. The variation margin is equal to the daily change in the contract value and is recorded as unrealized gains and losses. A fund recognizes a realized gain or loss when the contract is closed or expires. Net realized and unrealized gains or losses occurring during the holding period of futures contracts are a component of net realized gain (loss) on futures contract transactions and change in net unrealized appreciation (depreciation) on futures contracts, respectively. One of the risks of entering into futures contracts is the possibility that the change in value of the contract may not correlate with the changes in value of the underlying securities. During the period, the fund infrequently purchased equity price risk derivative instruments for temporary investment purposes.
At period end, the fund did not have any equity price risk derivative instruments disclosed on the Statement of Assets and Liabilities. For the year ended June 30, 2012, the effect of equity price risk derivative instruments on the Statement of Operations was $113,445 in net realized gain (loss) on futures contract transactions.
8. Risk Factors
There are certain risks involved in investing in foreign securities. These risks include those resulting from future adverse political, social and economic developments, fluctuations in currency exchange rates, the possible imposition of exchange controls, and other foreign laws or restrictions.
9. Federal Tax Information
The tax character of distributions paid during the years ended June 30, 2012 and June 30, 2011 were as follows:
| | 2012 | 2011 |
| Distributions Paid From |
| Ordinary income | $26,016,621 | $23,044,296 |
| Long-term capital gains | — | — |
The book-basis character of distributions made during the year from net investment income or net realized gains may differ from their ultimate characterization for federal income tax purposes. These differences reflect the differing character of certain income items and net realized gains and losses for financial statement and tax purposes, and may result in reclassification among certain capital accounts on the financial statements.
As of June 30, 2012, the federal tax cost of investments and the components of distributable earnings on a tax-basis were as follows:
| Federal tax cost of investments | | | $1,178,355,510 | |
| Gross tax appreciation of investments | | | $383,244,012 | |
| Gross tax depreciation of investments | | | (39,022,919 | ) |
| Net tax appreciation (depreciation) of investments | | | $344,221,093 | |
| Net tax appreciation (depreciation) on translation of assets and liabilities in foreign currencies | | | $839 | |
| Net tax appreciation (depreciation) | | | $344,221,932 | |
| Undistributed ordinary income | | | $1,276,101 | |
| Accumulated short-term capital losses | | | $(421,544,258 | ) |
The difference between book-basis and tax-basis cost and unrealized appreciation (depreciation) is attributable primarily to the tax deferral of losses on wash sales.
The accumulated capital losses represent net capital loss carryovers that may be used to offset future realized capital gains for federal income tax purposes. Future capital loss carryover utilization in any given year may be subject to Internal Revenue Code limitations. Capital loss carryovers of $(65,970,006) and $(355,574,252) expire in 2017 and 2018, respectively.
| For a Share Outstanding Throughout the Years Ended June 30 (except as noted) |
| Per-Share Data | Ratios and Supplemental Data |
| | Net Asset Value, Beginning of Period | Income From Investment Operations: | Distributions From: | | | Ratio to Average Net Assets of: | | |
| | Net Investment Income (Loss)(1) | Net Realized and Unrealized Gain (Loss) | Total Fro Investment Operations | Net Investment Income | Net Realized Gains | Total Distributions | Net Asset Value, End of Period | Total Return(2) | Operating Expenses | Net Investment Income (Loss) | Portfolio Turnover Rate | Net Assets, End of Period (in thousands) |
| Investor Class |
| 2012 | $25.54 | 0.43 | 0.76 | 1.19 | (0.44) | — | (0.44) | $26.29 | 4.75% | 0.68% | 1.73% | 53% | $1,306,254 |
| 2011 | $19.88 | 0.36 | 5.64 | 6.00 | (0.34) | — | (0.34) | $25.54 | 30.31% | 0.69% | 1.52% | 42% | $1,351,936 |
| 2010 | $18.03 | 0.33 | 1.85 | 2.18 | (0.33) | — | (0.33) | $19.88 | 11.99% | 0.70% | 1.58% | 45% | $1,227,234 |
| 2009 | $25.32 | 0.44 | (7.20) | (6.76) | (0.53) | — | (0.53) | $18.03 | (26.76)% | 0.70% | 2.27% | 49% | $1,281,418 |
| 2008 | $35.04 | 0.47 | (6.54) | (6.07) | (0.36) | (3.29) | (3.65) | $25.32 | (18.48)% | 0.68% | 1.53% | 57% | $2,078,333 |
| Institutional Class |
| 2012 | $25.56 | 0.48 | 0.76 | 1.24 | (0.49) | — | (0.49) | $26.31 | 4.96% | 0.48% | 1.93% | 53% | $97,809 |
| 2011 | $19.89 | 0.40 | 5.66 | 6.06 | (0.39) | — | (0.39) | $25.56 | 30.61% | 0.49% | 1.72% | 42% | $128,468 |
| 2010 | $18.04 | 0.38 | 1.85 | 2.23 | (0.38) | — | (0.38) | $19.89 | 12.20% | 0.50% | 1.78% | 45% | $197,196 |
| 2009 | $25.35 | 0.48 | (7.21) | (6.73) | (0.58) | — | (0.58) | $18.04 | (26.63)% | 0.50% | 2.47% | 49% | $268,346 |
| 2008 | $35.06 | 0.52 | (6.53) | (6.01) | (0.41) | (3.29) | (3.70) | $25.35 | (18.32)% | 0.48% | 1.73% | 57% | $538,656 |
A Class(3) |
| 2012 | $25.52 | 0.37 | 0.74 | 1.11 | (0.37) | — | (0.37) | $26.26 | 4.46% | 0.93% | 1.48% | 53% | $116,762 |
| 2011 | $19.86 | 0.30 | 5.64 | 5.94 | (0.28) | — | (0.28) | $25.52 | 30.02% | 0.94% | 1.27% | 42% | $128,920 |
| 2010 | $18.01 | 0.28 | 1.85 | 2.13 | (0.28) | — | (0.28) | $19.86 | 11.72% | 0.95% | 1.33% | 45% | $125,981 |
| 2009 | $25.28 | 0.40 | (7.20) | (6.80) | (0.47) | — | (0.47) | $18.01 | (26.95)% | 0.95% | 2.02% | 49% | $182,331 |
| 2008 | $35.01 | 0.39 | (6.53) | (6.14) | (0.30) | (3.29) | (3.59) | $25.28 | (18.68)% | 0.93% | 1.28% | 57% | $361,500 |
| For a Share Outstanding Throughout the Years Ended June 30 (except as noted) |
| Per-Share Data | Ratios and Supplemental Data |
| | Net Asset Value, Beginning of Period | Income From Investment Operations: | Distributions From: | | | Ratio to Average Net Assets of: | | |
| | Net Investment Income (Loss)(1) | Net Realized and Unrealized Gain (Loss) | Total Fro Investment Operations | Net Investment Income | Net Realized Gains | Total Distributions | Net Asset Value, End of Period | Total Return(2) | Operating Expenses | Net Investment Income (Loss) | Portfolio Turnover Rate | Net Assets, End of Period (in thousands) |
| C Class |
| 2012 | $25.48 | 0.18 | 0.76 | 0.94 | (0.19) | — | (0.19) | $26.23 | 3.73% | 1.68% | 0.73% | 53% | $1,151 |
| 2011 | $19.83 | 0.12 | 5.63 | 5.75 | (0.10) | — | (0.10) | $25.48 | 29.04% | 1.69% | 0.52% | 42% | $933 |
| 2010 | $17.99 | 0.12 | 1.84 | 1.96 | (0.12) | — | (0.12) | $19.83 | 10.85% | 1.70% | 0.58% | 45% | $863 |
| 2009 | $25.20 | 0.24 | (7.17) | (6.93) | (0.28) | — | (0.28) | $17.99 | (27.48)% | 1.70% | 1.27% | 49% | $815 |
| 2008 | $34.98 | 0.16 | (6.51) | (6.35) | (0.14) | (3.29) | (3.43) | $25.20 | (19.31)% | 1.68% | 0.53% | 57% | $1,176 |
| R Class |
| 2012 | $25.54 | 0.31 | 0.74 | 1.05 | (0.31) | — | (0.31) | $26.28 | 4.19% | 1.18% | 1.23% | 53% | $997 |
| 2011 | $19.87 | 0.24 | 5.65 | 5.89 | (0.22) | — | (0.22) | $25.54 | 29.73% | 1.19% | 1.02% | 42% | $506 |
| 2010 | $18.03 | 0.23 | 1.84 | 2.07 | (0.23) | — | (0.23) | $19.87 | 11.38% | 1.20% | 1.08% | 45% | $279 |
| 2009 | $25.29 | 0.36 | (7.21) | (6.85) | (0.41) | — | (0.41) | $18.03 | (27.13)% | 1.20% | 1.77% | 49% | $176 |
| 2008 | $35.04 | 0.32 | (6.53) | (6.21) | (0.25) | (3.29) | (3.54) | $25.29 | (18.88)% | 1.18% | 1.03% | 57% | $546 |
Notes to Financial Highlights
| (1) | Computed using average shares outstanding throughout the period. |
| (2) | Total returns are calculated based on the net asset value of the last business day and do not reflect applicable sales charges, if any. Total returns for periods less than one year are not annualized. |
| (3) | Prior to September 4, 2007, the A Class was referred to as the Advisor Class. |
See Notes to Financial Statements.
Report of Independent Registered Public Accounting Firm |
To the Directors of the American Century Quantitative Equity Funds, Inc. and Shareholders of the Income & Growth Fund:
In our opinion, the accompanying statement of assets and liabilities, including the schedule of investments, and the related statements of operations and of changes in net assets and the financial highlights present fairly, in all material respects, the financial position of the Income & Growth Fund (one of the fourteen funds comprising the American Century Quantitative Equity Funds, Inc., hereafter referred to as the “Fund”) at June 30, 2012, the results of its operations for the year then ended, the changes in its net assets for each of the two years in the period then ended and the financial highlights for each of the periods presented, in conformity with accounting principles generally accepted in the United States of America. These financial statements and financial highlights (hereafter referred to as “financial statements”) are the responsibility of the Fund’s management; our responsibility is to express an opinion on these financial statements based on our audits. We conducted our audits of these financial statements in accordance with the standards of the Public Company Accounting Oversight Board (United States). Those standards require that we plan and perform the audit to obtain reasonable assurance about whether the financial statements are free of material misstatement. An audit includes examining, on a test basis, evidence supporting the amounts and disclosures in the financial statements, assessing the accounting principles used and significant estimates made by management, and evaluating the overall financial statement presentation. We believe that our audits, which included confirmation of securities at June 30, 2012 by correspondence with the custodian and brokers, provide a reasonable basis for our opinion.
PricewaterhouseCoopers LLP
Kansas City, Missouri
August 21, 2012
Board of Directors
The individuals listed below serve as directors of the funds. Each director will continue to serve in this capacity until death, retirement, resignation or removal from office. The mandatory retirement age for directors who are not “interested persons,” as that term is defined in the Investment Company Act (independent directors), is 73. However, the mandatory retirement age may be extended for a period not to exceed two years with the approval of the remaining independent directors.
Mr. Thomas is the only director who is an “interested person” because he currently serves as President and Chief Executive Officer of American Century Companies, Inc. (ACC), the parent company of American Century Investment Management, Inc. (ACIM or the advisor).
The other directors (more than three-fourths of the total number) are independent; that is, they have never been employees, directors or officers of, and have no financial interest in, ACC or any of its wholly owned, direct or indirect, subsidiaries, including ACIM, American Century Investment Services, Inc. (ACIS) and American Century Services, LLC (ACS). The directors serve in this capacity for eight (in the case of Mr. Thomas, 15) registered investment companies in the American Century Investments family of funds.
The following table presents additional information about the directors. The mailing address for each director other than Mr. Thomas is 1665 Charleston Road, Mountain View, California 94043. The mailing address for Mr. Thomas is 4500 Main Street, Kansas City, Missouri 64111.
Name (Year of Birth) | Position(s) Held with Funds | Length of Time Served | | Principal Occupation(s) During Past 5 Years | | Number of American Century Portfolios Overseen by Director | Other Directorships Held During Past 5 Years |
| Independent Directors |
Tanya S. Beder (1955) | Director | Since 2011 | | Chairman, SBCC Group Inc. (investment advisory services)(2006 to present); Fellow in Practice, International Center for Finance, Yale University School of Management (1985 to present) | | 42 | CYS Investments, Inc. (specialty finance company) |
Jeremy I. Bulow (1954) | Director | Since 2011 | | Professor of Economics, Stanford University, Graduate School of Business (1979 to present) | | 42 | None |
Ronald J. Gilson (1946) | Director and Chairman of the Board | Since 1995 | | Charles J. Meyers Professor of Law and Business, Stanford Law School (1979 to present); Marc and Eva Stern Professor of Law and Business, Columbia University School of Law (1992 to present) | | 42 | None |
Name (Year of Birth) | Position(s) Held with Funds | Length of Time Served | | Principal Occupation(s) During Past 5 Years | | Number of American Century Portfolios Overseen by Director | Other Directorships Held During Past 5 Years |
| Independent Directors |
Frederick L. A. Grauer (1946) | Director | Since 2008 | | Senior Advisor, BlackRock, Inc. (investment management firm) (2010 to 2011); Senior Advisor, Barclays Global Investors (investment management firm) (2003 to 2009) | | 42 | None |
Peter F. Pervere (1947) | Director | Since 2007 | | Retired | | 42 | Intraware, Inc. (2003 to 2009) |
Myron S. Scholes (1941) | Director | Since 1980 | | Chairman, Platinum Grove Asset Management, L.P. (asset manager) (1999 to 2009); Frank E. Buck Professor of Finance-Emeritus, Stanford Graduate School of Business (1996 to present) | | 42 | Dimensional Fund Advisors (investment advisor); CME Group, Inc. (futures and options exchange) |
John B. Shoven (1947) | Director | Since 2002 | | Professor of Economics, Stanford University (1973 to present) | | 42 | Cadence Design Systems; Exponent; Financial Engines |
| |
| Interested Director |
Jonathan S. Thomas (1963) | Director and President | Since 2007 | | President and Chief Executive Officer, ACC (March 2007 to present); Chief Administrative Officer, ACC (February 2006 to February 2007); Executive Vice President, ACC (November 2005 to February 2007). Also serves as Chief Executive Officer and Manager, ACS; Executive Vice President, ACIM; Director, ACC, ACIM and other ACC subsidiaries | | 108 | None |
Officers
The following table presents certain information about the executive officers of the funds. Each officer serves as an officer for each of the 15 investment companies in the American Century family of funds, unless otherwise noted. No officer is compensated for his or her service as an officer of the funds. The listed officers are interested persons of the funds and are appointed or re-appointed on an annual basis. The mailing address for each of the officers listed below is 4500 Main Street, Kansas City, Missouri 64111.
Name (Year of Birth) | | Offices with the Funds | | Principal Occupation(s) During the Past Five Years |
Jonathan S. Thomas (1963) | | Director and President since 2007 | | President and Chief Executive Officer, ACC (March 2007 to present); Chief Administrative Officer, ACC (February 2006 to February 2007); Executive Vice President, ACC (November 2005 to February 2007). Also serves as Chief Executive Officer and Manager, ACS; Executive Vice President, ACIM; Director, ACC, ACIM and other ACC subsidiaries |
Barry Fink (1955) | | Executive Vice President since 2007 | | Chief Operating Officer and Executive Vice President, ACC (September 2007 to present); President, ACS (October 2007 to present); Managing Director, Morgan Stanley (2000 to 2007). Also serves as Manager, ACS and Director, ACC and certain ACC subsidiaries |
Maryanne L. Roepke (1956) | | Chief Compliance Officer since 2006 and Senior Vice President since 2000 | | Chief Compliance Officer, American Century funds, ACIM and ACS (August 2006 to present). Also serves as Senior Vice President, ACS |
Charles A. Etherington (1957) | | General Counsel since 2007 and Senior Vice President since 2006 | | Attorney, ACC (February 1994 to present); Vice President, ACC (November 2005 to present), General Counsel, ACC (March 2007 to present); Also serves as General Counsel, ACIM, ACS, ACIS and other ACC subsidiaries; and Senior Vice President, ACIM and ACS |
C. Jean Wade (1964) | | Vice President, Treasurer and Chief Financial Officer since 2012 | | Vice President, ACS (February 2000 to present) |
Robert J. Leach (1966) | | Vice President since 2006 and Assistant Treasurer since 2012 | | Vice President, ACS (February 2000 to present) |
David H. Reinmiller (1963) | | Vice President since 2001 | | Attorney, ACC (January 1994 to present); Associate General Counsel, ACC (January 2001 to present); Also serves as Vice President, ACIM and ACS |
Ward D. Stauffer (1960) | | Secretary since 2005 | | Attorney, ACC (June 2003 to present) |
The Statement of Additional Information has additional information about the fund’s directors and is available without charge, upon request, by calling 1-800-345-2021.
Approval of Management Agreement |
At a meeting held on June 14, 2012, the Fund’s Board of Directors/Trustees unanimously approved the renewal of the management agreement pursuant to which American Century Investment Management, Inc. (the “Advisor”) acts as the investment advisor for the Fund. Under Section 15(c) of the Investment Company Act, contracts for investment advisory services are required to be reviewed, evaluated, and approved by a majority of a fund’s independent directors/trustees (the “Directors”) each year.
As a part of the approval process, the Board requested and reviewed extensive data and information compiled by the Advisor and certain independent providers of evaluation data concerning the Fund and the services provided to the Fund by the Advisor. This review was in addition to the oversight and evaluation undertaken by the Board and its committees on a continuous basis throughout the year and included, but was not limited to the following:
| • | the nature, extent, and quality of investment management, shareholder services, and other services provided by the Advisor to the Fund; |
| • | the wide range of other programs and services the Advisor provides to the Fund and its shareholders on a routine and non-routine basis; |
| • | the investment performance of the fund, including data comparing the Fund’s performance to appropriate benchmarks and/or a peer group of other mutual funds with similar investment objectives and strategies; |
| • | data comparing the cost of owning the Fund to the cost of owning similar funds; |
| • | the Advisor’s compliance policies, procedures, and regulatory experience; |
• | financial data showing the cost of services provided to the Fund, the profitability of the Fund to the Advisor, and the overall profitability of the Advisor; |
| • | data comparing services provided and charges to other investment management clients of the Advisor; and |
| • | consideration of collateral benefits derived by the Advisor from the management of the Fund and any potential economies of scale relating thereto. |
In keeping with its practice, the Board held two in-person meetings to review and discuss the information provided. The Board also had the benefit of the advice of its independent counsel throughout the period.
Factors Considered
The Directors considered all of the information provided by the Advisor, the independent data providers, and the Board’s independent counsel, and evaluated such information for the Fund. In connection with their review, the Directors did not identify any single factor as being all-important or controlling, and each Director may have attributed different levels of importance to different factors. In deciding to renew the management agreement, the Board based its decision on a number of factors, including the following:
Nature, Extent and Quality of Services — Generally. Under the management agreement, the Advisor is responsible for providing or arranging for all services necessary for the operation of the Fund. The Board noted that under the management agreement, the Advisor provides or arranges at its own expense a wide variety of services including:
| • | constructing and designing the Fund |
| • | portfolio research and security selection |
| • | initial capitalization/funding |
| • | daily valuation of the Fund’s portfolio |
| • | shareholder servicing and transfer agency, including shareholder confirmations, recordkeeping, and communications |
| • | regulatory and portfolio compliance |
| • | marketing and distribution |
The Board noted that many of these services have expanded over time both in terms of quantity and complexity in response to shareholder demands, competition in the industry, changing distribution channels, and the changing regulatory environment.
Investment Management Services. The nature of the investment management services provided to the Fund is quite complex and allows Fund shareholders access to professional money management, instant diversification of their investments within an asset class, the opportunity to easily diversify among asset classes by investing in or exchanging among various American Century Investments funds, and liquidity. In evaluating investment performance, the Board expects the Advisor to manage the Fund in accordance with its investment objectives and approved strategies. Further, the Directors recognize that the Advisor has an obligation to seek the best execution of fund trades. In providing these services, the Advisor utilizes teams of investment professionals (portfolio managers, analysts, research assistants, and securities traders) who require extensive information technology, research, training, compliance and other systems to conduct their business. The Board, directly and through its Portfolio Committee, regularly reviews investment performance information for the Fund, together with comparative information for appropriate benchmarks and/or peer groups of similarly-managed funds, over different time horizons. The Directors also review detailed performance information during the management agreement
approval process. If performance concerns are identified, the Fund receives special reviews until performance improves, during which the Board discusses with the Advisor the reasons for such results (e.g., market conditions, security selection) and any efforts being undertaken to improve performance. The Board found the investment management services provided by the Advisor to the Fund to meet or exceed industry standards. More detailed information about the Fund’s performance can be found in the Performance and Portfolio Commentary sections of this report.
Shareholder and Other Services. Under the management agreement, the Advisor provides the Fund with a comprehensive package of transfer agency, shareholder, and other services. The Board, directly and through various committees of the Board, regularly reviews reports and evaluations of such services at its regular meetings. These reports include, but are not limited to, information regarding the operational efficiency and accuracy of the shareholder and transfer agency services provided, staffing levels, shareholder satisfaction (as measured by external as well as internal sources), technology support, new products and services offered to Fund shareholders, securities trading activities, portfolio valuation services, auditing services, and legal and operational compliance activities. Certain aspects of shareholder and transfer agency service level efficiency and the quality of securities trading activities are measured by independent third party providers and are presented in comparison to other fund groups not managed by the Advisor. The Board found the services provided by the Advisor to the Fund under the management agreement to be competitive and of high quality.
Costs of Services and Profitability. The Advisor provides detailed information concerning its cost of providing various services to the Fund, its profitability in managing the Fund, its overall profitability, and its financial condition. The Directors have reviewed with the Advisor the methodology used to prepare this financial information. The financial information regarding the Advisor is considered in evaluating the Advisor’s financial condition, ability to continue to provide services under the management agreement, and the reasonableness of the current management fee. The Board concluded that the Advisor’s profits were reasonable in light of the services provided to the Fund.
Ethics. The Board generally considers the Advisor’s commitment to providing quality services to shareholders and to conducting its business ethically. They noted that the Advisor’s practices generally meet or exceed industry best practices.
Economies of Scale. The Board also reviewed information provided by the Advisor regarding the possible existence of economies of scale in connection with the management of the Fund. The Board concluded that economies of scale are difficult to measure and predict with precision, especially on a fund-by-fund basis. The Board concluded that the Advisor is appropriately sharing economies of scale through its competitive fee structure, offering competitive fees from fund inception, and through reinvestment in its business to provide shareholders additional content and services.
Comparison to Other Funds’ Fees. The management agreement provides that the Fund pay the Advisor a single, all-inclusive (or unified) management fee for providing all services necessary for the management and operation of the Fund, other than brokerage expenses, taxes, interest, extraordinary expenses, and the fees and expenses of the Fund’s independent directors (including their independent legal counsel) and expenses incurred in connection with the provision of shareholder services and distribution services under a plan adopted pursuant to Rule 12b-1 under the 1940 Act. Under the unified fee structure, the Advisor is responsible for providing all investment advisory, custody, audit, administrative, compliance, recordkeeping, marketing and shareholder services, or arranging and supervising third parties to provide such services. By contrast, most other funds are charged a variety of fees, including an investment advisory fee, a transfer agency fee, an administrative fee, distribution charges and other expenses. Other than their investment advisory fees and any applicable Rule 12b-1 distribution fees, all other components of the total fees charged by these other funds may be increased without shareholder approval. The Board believes the unified fee structure is a benefit to Fund shareholders because it clearly discloses to shareholders the cost of owning Fund shares, and, since the unified fee cannot be increased without a vote of Fund shareholders, it shifts to the Advisor the risk of increased costs of operating the Fund and provides a direct incentive to minimize administrative inefficiencies. Part of the Board’s analysis of fee levels involves reviewing certain evaluative data compiled by an independent provider and comparing the Fund’s unified fee to the total expense ratio of other funds in the Fund’s peer group. The Board concluded that the management fee paid by the Fund to the Advisor under the management agreement is reasonable in light of the services provided to the Fund.
Comparison to Fees and Services Provided to Other Clients of the Advisor. The Board also requested and received information from the Advisor concerning the nature of the services, fees, costs and profitability of its advisory services to advisory clients other than the Fund. They observed that these varying types of client accounts require different services and involve different regulatory and entrepreneurial risks than the management of the Fund. The Board analyzed this information and concluded that the fees charged and services provided to the Fund were reasonable by comparison.
Collateral or “Fall-Out” Benefits Derived by the Advisor. The Board considered the existence of collateral benefits the Advisor may receive as a result of its relationship with the Fund. They concluded that the Advisor’s primary business is managing mutual funds and it generally does not use fund or shareholder information to generate profits in other lines of business, and therefore does not derive any significant collateral benefits from them. The Board noted that the Advisor receives proprietary research from broker-dealers that execute fund portfolio transactions and concluded that this research is likely to benefit Fund shareholders. The Board also determined that the Advisor is able to provide investment management services to certain clients other than the Fund, at least in part, due to its existing infrastructure built to serve the fund complex. The Board concluded, however, that the assets of those other clients are not material to the analysis and, where applicable, may be included with the assets of the Fund to determine breakpoints in the management fee schedule.
Existing Relationship. The Board also considered whether there was any reason for not continuing the existing arrangement with the Advisor. In this regard, the Board was mindful of the potential disruptions of the Fund’s operations and various risks, uncertainties, and other effects that could occur as a result of a decision not to continue such relationship. In particular, the Board recognized that most shareholders have invested in the Fund on the strength of the Advisor’s industry standing and reputation and in the expectation that the Advisor will have a continuing role in providing advisory services to the Fund.
Conclusion of the Directors. As a result of this process, the Board, including all of the independent directors and assisted by the advice of independent legal counsel, taking into account all of the factors discussed above and the information provided by the Advisor and others, concluded that the management agreement between the Fund and the Advisor is fair and reasonable in light of the services provided and should be renewed.
Retirement Account Information
As required by law, distributions you receive from certain IRAs, or 403(b), 457 and qualified plans are subject to federal income tax withholding, unless you elect not to have withholding apply. Tax will be withheld on the total amount withdrawn even though you may be receiving amounts that are not subject to withholding, such as nondeductible contributions. In such case, excess amounts of withholding could occur. You may adjust your withholding election so that a greater or lesser amount will be withheld.
If you don’t want us to withhold on this amount, you must notify us to not withhold the federal income tax. You may notify us in writing or in certain situations by telephone or through other electronic means. You have the right to revoke your withholding election at any time and any election you make may remain in effect until revoked by filing a new election.
Remember, even if you elect not to have income tax withheld, you are liable for paying income tax on the taxable portion of your withdrawal. If you elect not to have income tax withheld or you don’t have enough income tax withheld, you may be responsible for payment of estimated tax. You may incur penalties under the estimated tax rules if your withholding and estimated tax payments are not sufficient. You can reduce or defer the income tax on a distribution by directly or indirectly rolling such distribution over to another IRA or eligible plan. You should consult your tax advisor for additional information.
State tax will be withheld if, at the time of your distribution, your address is within one of the mandatory withholding states and you have federal income tax withheld. State taxes will be withheld from your distribution in accordance with the respective state rules.
Proxy Voting Guidelines
American Century Investment Management, Inc., the fund’s investment advisor, is responsible for exercising the voting rights associated with the securities purchased and/or held by the fund. A description of the policies and procedures the advisor uses in fulfilling this responsibility is available without charge, upon request, by calling 1-800-345-2021. It is also available on American Century Investments’ website at americancentury.com and on the Securities and Exchange Commission’s website at sec.gov. Information regarding how the investment advisor voted proxies relating to portfolio securities during the most recent 12-month period ended June 30 is available on the “About Us” page at americancentury.com. It is also available at sec.gov.
Quarterly Portfolio Disclosure
The fund files its complete schedule of portfolio holdings with the Securities and Exchange Commission (SEC) for the first and third quarters of each fiscal year on Form N-Q. The fund’s Forms N-Q are available on the SEC’s website at sec.gov, and may be reviewed and copied at the SEC’s Public Reference Room in Washington, DC. Information on the operation of the Public Reference Room may be obtained by calling 1-800-SEC-0330. The fund also makes its complete schedule of portfolio holdings for the most recent quarter of its fiscal year available on its website at americancentury.com and, upon request, by calling 1-800-345-2021.
Other Tax Information
The following information is provided pursuant to provisions of the Internal Revenue Code.
The fund hereby designates up to the maximum amount allowable as qualified dividend income for the fiscal year ended June 30, 2012.
For corporate taxpayers, the fund hereby designates $26,016,621, or up to the maximum amount allowable, of ordinary income distributions paid during the fiscal year ended June 30, 2012 as qualified for the corporate dividends received deduction.
| Contact Us | americancentury.com |
| Automated Information Line | 1-800-345-8765 |
| Investor Services Representative | 1-800-345-2021 or 816-531-5575 |
| Investors Using Advisors | 1-800-378-9878 |
| Business, Not-For-Profit, Employer-Sponsored Retirement Plans | 1-800-345-3533 |
| Banks and Trust Companies, Broker-Dealers, Financial Professionals, Insurance Companies | 1-800-345-6488 |
| Telecommunications Device for the Deaf | 1-800-634-4113 |
American Century Quantitative Equity Funds, Inc.
Investment Advisor:
American Century Investment Management, Inc.
Kansas City, Missouri
This report and the statements it contains are submitted for the general information of our shareholders. The report is not authorized for distribution to prospective investors unless preceded or accompanied by an effective prospectus.
©2012 American Century Proprietary Holdings, Inc. All rights reserved.
CL-ANN-75840 1208
ANNUAL REPORT JUNE 30, 2012
| President’s Letter | 2 |
| Market Perspective | 3 |
| Performance | 4 |
| Portfolio Commentary | 5 |
| Fund Characteristics | 7 |
| Shareholder Fee Example | 8 |
| Schedule of Investments | 10 |
| Statement of Assets and Liabilities | 16 |
| Statement of Operations | 17 |
| Statement of Changes in Net Assets | 18 |
| Statement of Cash Flows | 19 |
| Notes to Financial Statements | 20 |
| Financial Highlights | 25 |
| Report of Independent Registered Public Accounting Firm | 26 |
| Management | 27 |
| Approval of Management Agreement | 30 |
| Additional Information | 34 |
Any opinions expressed in this report reflect those of the author as of the date of the report, and do not necessarily represent the opinions of American Century Investments® or any other person in the American Century Investments organization. Any such opinions are subject to change at any time based upon market or other conditions and American Century Investments disclaims any responsibility to update such opinions. These opinions may not be relied upon as investment advice and, because investment decisions made by American Century Investments funds are based on numerous factors, may not be relied upon as an indication of trading intent on behalf of any American Century Investments fund. Security examples are used for representational purposes only and are not intended as recommendations to purchase or sell securities. Performance information for comparative indices and securities is provided to American Century Investments by third party vendors. To the best of American Century Investments’ knowledge, such information is accurate at the time of printing.
Dear Investor:
Thank you for reviewing this annual report for the shortened reporting period from the fund’s inception on December 1, 2011, to June 30, 2012. Our report offers investment performance and portfolio information, presented with the expert perspective of our portfolio management team.
This report remains one of our most important vehicles for conveying information about fund returns, as well as market factors and strategies that affected fund performance. For additional, updated information, we encourage you to visit our website, americancentury.com. Click on the “Fund Performance” and “Insights & News” headings at the top of our Individual Investors site.
First Four Months Outweighed Final Three
If you wanted to “cherry-pick” a time period during the past 12 months that would show positive returns across most asset classes, you couldn’t have done much better than the seven months ended June 30, 2012. Even international stocks, which struggled during much of the last half of 2011 and the first half of 2012, managed small positive benchmark returns for the seven-month period.
Most of the positive equity performance for this abbreviated reporting period occurred during December 2011 and the first quarter of 2012, when investors were still optimistic about global economic growth prospects in 2012. European policymakers also raised hopes about a solution to the European sovereign debt crisis by committing more liquidity to the financial system. But that optimism faded in the second quarter of 2012, as economic data rolled over and financial problems in Europe persisted. Assets perceived to be “safe-haven” investments rallied during the second quarter, while riskier assets, including most stocks, lagged or declined.
Unfortunately, the instability that helped trigger flight-to-quality trading in the second quarter of 2012 remains largely in place, and the coming months may bring additional uncertainties about the U.S. presidential election and what might happen when various U.S. tax cuts and other stimulative measures expire in 2013 (the so-called “Fiscal Cliff”). In this uncertain, unstable environment, we continue to believe in a disciplined, diversified, long-term investment approach, using both stocks and bonds, as appropriate. We appreciate your continued trust in us during these unsettled times.
Sincerely,
Jonathan Thomas
President and Chief Executive Officer
American Century Investments
By Scott Wittman, Chief Investment Officer, Quantitative Equity
and Asset Allocation
U.S. Stocks Advanced
The U.S. stock market rallied broadly during the period from December 1, 2011, to June 30, 2012, though stocks faced some volatility along the way. Stocks generally rose from the beginning of the period through the end of March 2012 as signs of improving economic activity emerged. In particular, job growth consistently exceeded expectations, driving the unemployment rate down to its lowest level in more than three years.
Another positive factor was better news regarding Europe’s ongoing sovereign debt problems, which had taken a turn for the worse during the summer and fall of 2011. As the contagion spread to larger, fiscally troubled European countries such as Italy and Spain, the European Central Bank took steps to ease the crisis by providing long-term financing to the debt markets and support for the Continent’s banking sector.
Stocks gave back some gains during the last three months of the period as evidence of slowing economic activity in the U.S. and adverse developments in Europe—including political turmoil in Greece and faltering banks in Spain—weighed on investor confidence. Although the broad equity indices rebounded in the period’s final month amid some positive news out of Europe, it was not enough to offset the declines from April and May.
Large-Cap Stocks Outperformed
For the reporting period, the broad equity indices (as represented by the S&P 500 Index and Russell 3000 Index) rose by 10–11%. As the table below illustrates, large- and small-cap stocks outpaced mid-cap issues, while value shares outperformed growth-oriented stocks across all market capitalizations.
From a sector perspective, six of the ten market sectors posted double-digit gains for the reporting period, led by telecommunication services (which gained more than 20% as a group), consumer discretionary, and financials. On the downside, the only sector to decline for the reporting period was energy, which reflected a broad decline in commodity prices, including a 15% drop in the price of oil.
| U.S. Stock Index Returns |
| From December 1, 2011 through June 30, 2012* |
| Russell 1000 Index (Large-Cap) | 10.51% | | Russell 2000 Index (Small-Cap) | 10.24% |
| Russell 1000 Growth Index | 9.68% | | Russell 2000 Growth Index | 9.37% |
| Russell 1000 Value Index | 11.35% | | Russell 2000 Value Index | 11.12% |
| Russell Midcap Index | 8.08% | | |
| Russell Midcap Growth Index | 6.55% | | | |
| Russell Midcap Value Index | 9.54% | | | |
*Total returns for periods less than one year are not annualized.
| Total Returns as of June 30, 2012 |
| | Ticker Symbol | Since Inception(1) | Inception Date |
| Institutional Class | ACNKX | 9.55% | 12/1/11 |
| S&P 500 Index | — | 10.61%(2) | — |
| (1) | Total returns for periods less than one year are not annualized. |
| (2) | Since 11/30/11, the date nearest Institutional Class’s inception for which data are available. |
| Growth of $10,000 Over Life of Class |
| $10,000 investment made December 1, 2011 |
| From 12/1/11, the Institutional Class’s inception date. Index data from 11/30/11, the date nearest Institutional Class’s inception for which data are available. Not annualized. |
| Total Annual Fund Operating Expenses |
Institutional Class 1.87% |
The total annual fund operating expenses shown is as stated in the fund’s prospectus current as of the date of this report. The prospectus may vary from the expense ratio shown elsewhere in this report because it is based on a different time period, includes acquired fund fees and expenses, and, if applicable, does not include fee waivers or expense reimbursements.
Data presented reflect past performance. Past performance is no guarantee of future results. Current performance may be higher or lower than the performance shown. Investment return and principal value will fluctuate, and redemption value may be more or less than original cost. To obtain performance data current to the most recent month end, please call 1-800-345-2021 or visit americancentury.com. The fund’s investment process may result in high portfolio turnover, which could mean high transaction costs, affecting both performance and capital gains tax liabilities to investors. In addition, its investment approach may involve higher volatility, short sales risk, leverage risk and overweighting risk. International investing involves special risks, such as political instability and currency fluctuations.
Data assumes reinvestment of dividends and capital gains, and none of the charts reflect the deduction of taxes that a shareholder would pay on fund distributions or the redemption of fund shares. Returns for the index are provided for comparison. The fund’s total returns include operating expenses (such as transaction costs and management fees) that reduce returns, while the total returns of the index do not.
Portfolio Managers: Scott Wittman, Bill Martin and Claudia Musat
Performance Summary
NT Core Equity Plus returned 9.55%* from the fund’s inception date on December 1, 2011, through June 30, 2012, compared with the 10.61% return of its benchmark, the S&P 500 Index, from November 30, 2011 through June 30, 2012.
The fund is managed to have a 100% net exposure to the equity market by investing approximately 130% of its net assets in long positions, while 30% of its net assets are sold short. The proceeds from the securities sold short are used to fund the purchase of the additional 30% of long positions. For the reporting period, NT Core Equity Plus posted a solid gain but underperformed the S&P 500. Stock selection was the primary factor behind the underperformance of the index.
Absolute Performance Driven by Technology and Consumer Discretionary
The fund’s absolute return of more than 9% for the reporting period was driven primarily by strong returns in the information technology and consumer discretionary sectors. Four of the fund’s top 11 contributors to absolute performance came from the information technology sector, while three of the top 11 contributors to absolute performance came from the consumer discretionary sector. The fund’s holdings in the energy and financials sectors also fared well during the period.
The weaker-performing sectors in the portfolio for the reporting period were the industrials and utilities sectors. Short positions had the most significant negative impact on absolute performance; eight of the fund’s ten biggest detractors from absolute performance were short positions.
Financials and Health Care Detracted from Relative Results
Looking at performance versus the S&P 500, the fund’s holdings in the financials and health care sectors contributed the most to its underperformance of the index for the 7 months. The most significant detractor in the financials sector was a short position in insurer MBIA. The company rallied during the period as its investment-grade credit rating was affirmed and it settled litigation related to its 2009 reorganization. Other notable detractors among the portfolio’s financial stocks included overweight positions in brokerage firm Investment Technology Group, which reported disappointing earnings resulting from weak institutional trading, and pawn shop operator Cash America International, which faced a slowdown in consumer demand.
In the health care sector, noteworthy detractors included short positions in pharmacy benefits manager Catalyst Health Solutions and biotechnology firm Human Genome Sciences. Both companies received takeover offers during the reporting period, boosting their respective stock prices.
* Total returns for periods less than one year are not annualized.
Other significant detractors in the portfolio included overweight positions in specialty mattress maker Tempur-Pedic International and mining company Coeur d’Alene Mines, as well as a short position in data center services provider Equinix. Tempur-Pedic declined sharply as increased price competition led the company to reduce its 2012 profit forecast; Coeur d’Alene Mines struggled with declining prices for silver and other commodities; and Equinix was a beneficiary of the trend toward cloud computing.
Technology and Energy Added Value
On the positive side, the fund’s holdings in the information technology and energy sectors contributed favorably to results versus the index for the reporting period. Short positions in solar products maker First Solar and semiconductor manufacturer MEMC Electronic Materials contributed the most to the outperformance in the information technology sector. Both companies were adversely affected by a sharp decline in demand for solar power installations. Overweight positions in online services provider AOL and disk drive maker Seagate Technology also added value.
In the energy sector, the best investment decisions were a short position in coal producer Alpha Natural Resources and an overweight position in oil refiner Western Refining. Declining energy prices had a divergent impact on the two companies—Western Refining benefited from increased production and higher profit margins, while declining domestic demand and falling coal prices weighed on profitability for Alpha Natural Resources.
Other top contributors to performance versus the S&P 500 included an overweight position in restaurant chain P.F. Chang’s China Bistro and short positions in mining company Thompson Creek Metals and electrical equipment manufacturer GrafTech International. P.F. Chang’s rallied after being acquired by a private equity firm. Thompson Creek Metals struggled with higher-than-expected costs, while GrafTech suffered from its meaningful exposure to the steel industry, which experienced declining demand and prices.
A Look Ahead
As we move into the second half of 2012, the U.S. equity market is likely to remain volatile given the uncertainty regarding the economic outlook, the European debt situation, and the upcoming U.S. presidential election. Heightened levels of volatility often provide investment opportunities in both the long and short portions of the portfolio. Our disciplined, objective, and systematic investment strategy is designed to take advantage of these opportunities at the individual company level. We believe this approach is the most powerful way to capitalize on market inefficiencies that lead to the mispricing of individual stocks.
| JUNE 30, 2012 | |
| Top Ten Long Holdings | % of net assets |
| Apple, Inc. | 3.49% |
| Exxon Mobil Corp. | 3.44% |
| Chevron Corp. | 2.29% |
| Pfizer, Inc. | 2.04% |
| International Business Machines Corp. | 1.74% |
| JPMorgan Chase & Co. | 1.71% |
| Merck & Co., Inc. | 1.71% |
| Verizon Communications, Inc. | 1.66% |
| Oracle Corp. | 1.62% |
| Abbott Laboratories | 1.57% |
| | |
| Top Five Short Holdings | % of net assets |
| Textainer Group Holdings Ltd. | (0.77)% |
| First Solar, Inc. | (0.73)% |
| Neogen Corp. | (0.73)% |
| MBIA, Inc. | (0.73)% |
| EXCO Resources, Inc. | (0.72)% |
| | |
| Types of Investments in Portfolio | % of net assets |
| Common Stocks | 127.2% |
| Common Stocks Sold Short | (29.7)% |
| Temporary Cash Investments | 0.7% |
| Other Assets and Liabilities | 1.8% |
Fund shareholders may incur two types of costs: (1) transaction costs, including sales charges (loads) on purchase payments and redemption/exchange fees; and (2) ongoing costs, including management fees; distribution and service (12b-1) fees; and other fund expenses. This example is intended to help you understand your ongoing costs (in dollars) of investing in your fund and to compare these costs with the ongoing cost of investing in other mutual funds.
The example is based on an investment of $1,000 made at the beginning of the period and held for the entire period from January 1, 2012 to June 30, 2012.
Actual Expenses
The table provides information about actual account values and actual expenses for each class. You may use the information, together with the amount you invested, to estimate the expenses that you paid over the period. First, identify the share class you own. Then simply divide your account value by $1,000 (for example, an $8,600 account value divided by $1,000 = 8.6), then multiply the result by the number under the heading “Expenses Paid During Period” to estimate the expenses you paid on your account during this period.
If you hold Investor Class shares of any American Century Investments fund, or Institutional Class shares of the American Century Diversified Bond Fund, in an American Century Investments account (i.e., not a financial intermediary or retirement plan account), American Century Investments may charge you a $12.50 semiannual account maintenance fee if the value of those shares is less than $10,000. We will redeem shares automatically in one of your accounts to pay the $12.50 fee. In determining your total eligible investment amount, we will include your investments in all personal accounts (including American Century Investments Brokerage accounts) registered under your Social Security number. Personal accounts include individual accounts, joint accounts, UGMA/UTMA accounts, personal trusts, Coverdell Education Savings Accounts and IRAs (including traditional, Roth, Rollover, SEP-, SARSEP- and SIMPLE-IRAs), and certain other retirement accounts. If you have only business, business retirement, employer-sponsored or American Century Investments Brokerage accounts, you are currently not subject to this fee. If you are subject to the Account Maintenance Fee, your account value could be reduced by the fee amount.
Hypothetical Example for Comparison Purposes
The table also provides information about hypothetical account values and hypothetical expenses based on the actual expense ratio of each class of your fund and an assumed rate of return of 5% per year before expenses, which is not the actual return of a fund’s share class. The hypothetical account values and expenses may not be used to estimate the actual ending account balance or expenses you paid for the period. You may use this information to compare the ongoing costs of investing in your fund and other funds. To do so, compare this 5% hypothetical example with the 5% hypothetical examples that appear in the shareholder reports of the other funds.
Please note that the expenses shown in the table are meant to highlight your ongoing costs only and do not reflect any transactional costs, such as sales charges (loads) or redemption/exchange fees. Therefore, the table is useful in comparing ongoing costs only, and will not help you determine the relative total costs of owning different funds. In addition, if these transactional costs were included, your costs would have been higher.
| | Beginning Account Value 1/1/12 | Ending Account Value 6/30/12 | Expenses Paid During Period(1) 1/1/12 – 6/30/12 | Annualized Expense Ratio(1) |
| Actual |
| Institutional Class | $1,000 | $1,089.60 | $9.87 | 1.90% |
| Hypothetical |
| Institutional Class | $1,000 | $1,015.42 | $9.52 | 1.90% |
| (1) | Expenses are equal to the class’s annualized expense ratio listed in the table above, multiplied by the average account value over the period, multiplied by 182, the number of days in the most recent fiscal half-year, divided by 366, to reflect the one-half year period. |
| | | Shares | | | Value | |
| Common Stocks — 127.2% | |
| AEROSPACE AND DEFENSE — 2.5% | |
| Boeing Co. (The) | | | 1,003 | | | | $74,523 | |
Huntington Ingalls Industries, Inc.(1) | | | 3,726 | | | | 149,934 | |
Northrop Grumman Corp.(2) | | | 22,374 | | | | 1,427,238 | |
Teledyne Technologies, Inc.(1) | | | 2,922 | | | | 180,141 | |
Textron, Inc.(2) | | | 33,012 | | | | 821,008 | |
United Technologies Corp.(2) | | | 26,333 | | | | 1,988,932 | |
| | | | | | | | 4,641,776 | |
| AIR FREIGHT AND LOGISTICS — 2.1% | |
| FedEx Corp. | | | 17,799 | | | | 1,630,566 | |
United Parcel Service, Inc., Class B(2) | | | 30,150 | | | | 2,374,614 | |
| | | | | | | | 4,005,180 | |
| AUTO COMPONENTS — 0.1% | |
Lear Corp.(2) | | | 3,006 | | | | 113,416 | |
| BEVERAGES — 2.5% | | | | | | | | |
Boston Beer Co., Inc., Class A(1)(2) | | | 8,051 | | | | 974,171 | |
Coca-Cola Co. (The)(2) | | | 18,717 | | | | 1,463,482 | |
Constellation Brands, Inc., Class A(1)(2) | | | 55,943 | | | | 1,513,818 | |
Monster Beverage Corp.(1) | | | 5,909 | | | | 420,721 | |
PepsiCo, Inc.(2) | | | 4,453 | | | | 314,649 | |
| | | | | | | | 4,686,841 | |
| BIOTECHNOLOGY — 3.1% | | | | | | | | |
Amgen, Inc.(2) | | | 19,503 | | | | 1,424,499 | |
Biogen Idec, Inc.(1)(2) | | | 7,419 | | | | 1,071,155 | |
Celgene Corp.(1)(2) | | | 13,865 | | | | 889,578 | |
Gilead Sciences, Inc.(1)(2) | | | 20,854 | | | | 1,069,393 | |
Momenta Pharmaceuticals, Inc.(1)(2) | | | 25,776 | | | | 348,492 | |
Pharmacyclics, Inc.(1) | | | 11,485 | | | | 627,196 | |
United Therapeutics Corp.(1)(2) | | | 9,413 | | | | 464,814 | |
| | | | | | | | 5,895,127 | |
| CAPITAL MARKETS — 0.9% | |
Affiliated Managers Group, Inc.(1) | | | 4,350 | | | | 476,108 | |
| BlackRock, Inc. | | | 493 | | | | 83,721 | |
Investment Technology Group, Inc.(1)(2) | | | 82,949 | | | | 763,131 | |
T. Rowe Price Group, Inc.(2) | | | 5,614 | | | | 353,457 | |
| | | | | | | | 1,676,417 | |
| CHEMICALS — 3.7% | | | | | | | | |
CF Industries Holdings, Inc.(2) | | | 8,959 | | | | 1,735,717 | |
| LyondellBasell Industries NV, Class A | | | 7,010 | | | | $282,293 | |
Monsanto Co.(2) | | | 25,039 | | | | 2,072,728 | |
| NewMarket Corp. | | | 6,042 | | | | 1,308,697 | |
PPG Industries, Inc.(2) | | | 15,730 | | | | 1,669,268 | |
| | | | | | | | 7,068,703 | |
| COMMERCIAL BANKS — 3.3% | |
Bank of Montreal(2) | | | 22,543 | | | | 1,245,726 | |
| BB&T Corp. | | | 12,955 | | | | 399,662 | |
| CapitalSource, Inc. | | | 105,259 | | | | 707,340 | |
U.S. Bancorp(2) | | | 69,106 | | | | 2,222,449 | |
Wells Fargo & Co.(2) | | | 48,074 | | | | 1,607,595 | |
| | | | | | | | 6,182,772 | |
| COMMUNICATIONS EQUIPMENT — 2.3% | |
Arris Group, Inc.(1)(2) | | | 73,986 | | | | 1,029,145 | |
Brocade Communications Systems, Inc.(1)(2) | | | 266,281 | | | | 1,312,765 | |
Cisco Systems, Inc.(2) | | | 71,466 | | | | 1,227,071 | |
Motorola Solutions, Inc.(2) | | | 2,969 | | | | 142,839 | |
QUALCOMM, Inc.(2) | | | 12,932 | | | | 720,054 | |
| | | | | | | | 4,431,874 | |
| COMPUTERS AND PERIPHERALS — 4.6% | |
Apple, Inc.(1)(2) | | | 11,266 | | | | 6,579,344 | |
EMC Corp.(1)(2) | | | 45,906 | | | | 1,176,571 | |
Seagate Technology plc(2) | | | 38,353 | | | | 948,469 | |
| | | | | | | | 8,704,384 | |
| CONSTRUCTION AND ENGINEERING — 1.3% | |
Chicago Bridge & Iron Co. NV New York Shares(2) | | | 31,608 | | | | 1,199,840 | |
| Granite Construction, Inc. | | | 8,218 | | | | 214,572 | |
URS Corp.(2) | | | 28,479 | | | | 993,347 | |
| | | | | | | | 2,407,759 | |
| CONSUMER FINANCE — 1.8% | |
American Express Co.(2) | | | 37,291 | | | | 2,170,709 | |
Cash America International, Inc.(2) | | | 28,321 | | | | 1,247,257 | |
| | | | | | | | 3,417,966 | |
| DIVERSIFIED CONSUMER SERVICES — 1.7% | |
Bridgepoint Education, Inc.(1)(2) | | | 45,850 | | | | 999,530 | |
Coinstar, Inc.(1)(2) | | | 25,664 | | | | 1,762,090 | |
ITT Educational Services, Inc.(1)(2) | | | 6,132 | | | | 372,519 | |
| | | | | | | | 3,134,139 | |
| DIVERSIFIED FINANCIAL SERVICES — 4.1% | |
Bank of America Corp.(2) | | | 294,232 | | | | 2,406,818 | |
Citigroup, Inc.(2) | | | 36,292 | | | | 994,764 | |
Interactive Brokers Group, Inc., Class A(2) | | | 70,081 | | | | $1,031,592 | |
JPMorgan Chase & Co.(2) | | | 90,417 | | | | 3,230,599 | |
| | | | | | | | 7,663,773 | |
| DIVERSIFIED TELECOMMUNICATION SERVICES — 3.0% | |
AT&T, Inc.(2) | | | 47,030 | | | | 1,677,090 | |
Verizon Communications, Inc.(2) | | | 70,411 | | | | 3,129,065 | |
Vonage Holdings Corp.(1)(2) | | | 397,295 | | | | 798,563 | |
| | | | | | | | 5,604,718 | |
| ELECTRIC UTILITIES — 0.9% | |
American Electric Power Co., Inc.(2) | | | 27,245 | | | | 1,087,076 | |
PNM Resources, Inc.(2) | | | 27,419 | | | | 535,767 | |
| | | | | | | | 1,622,843 | |
| ELECTRICAL EQUIPMENT — 1.0% | |
Acuity Brands, Inc.(2) | | | 14,932 | | | | 760,188 | |
Belden, Inc.(2) | | | 24,810 | | | | 827,414 | |
EnerSys(1) | | | 9,248 | | | | 324,327 | |
| | | | | | | | 1,911,929 | |
| ELECTRONIC EQUIPMENT, INSTRUMENTS AND COMPONENTS — 2.5% | |
Celestica, Inc.(1)(2) | | | 152,402 | | | | 1,106,439 | |
Itron, Inc.(1)(2) | | | 32,717 | | | | 1,349,249 | |
Molex, Inc.(2) | | | 49,433 | | | | 1,183,426 | |
Tech Data Corp.(1)(2) | | | 23,313 | | | | 1,122,987 | |
| | | | | | | | 4,762,101 | |
| ENERGY EQUIPMENT AND SERVICES — 1.8% | |
Diamond Offshore Drilling, Inc.(2) | | | 16,013 | | | | 946,849 | |
Helix Energy Solutions Group, Inc.(1)(2) | | | 72,389 | | | | 1,187,903 | |
National Oilwell Varco, Inc.(2) | | | 18,793 | | | | 1,211,021 | |
| Schlumberger Ltd. | | | 1,404 | | | | 91,134 | |
| | | | | | | | 3,436,907 | |
| FOOD AND STAPLES RETAILING — 1.4% | |
CVS Caremark Corp.(2) | | | 19,107 | | | | 892,870 | |
SUPERVALU, Inc.(2) | | | 225,989 | | | | 1,170,623 | |
Wal-Mart Stores, Inc.(2) | | | 7,751 | | | | 540,400 | |
| | | | | | | | 2,603,893 | |
| FOOD PRODUCTS — 2.8% | |
Archer-Daniels-Midland Co.(2) | | | 48,901 | | | | 1,443,557 | |
B&G Foods, Inc.(2) | | | 17,508 | | | | 465,713 | |
Bunge Ltd.(2) | | | 2,901 | | | | 182,009 | |
Campbell Soup Co.(2) | | | 30,941 | | | | 1,032,811 | |
ConAgra Foods, Inc.(2) | | | 53,912 | | | | 1,397,938 | |
Dean Foods Co.(1) | | | 22,137 | | | | 376,993 | |
Smithfield Foods, Inc.(1)(2) | | | 15,224 | | | | 329,295 | |
| | | | | | | | 5,228,316 | |
| GAS UTILITIES — 0.6% | | | | | | | | |
| Northwest Natural Gas Co. | | | 23,941 | | | | 1,139,592 | |
| HEALTH CARE EQUIPMENT AND SUPPLIES — 2.7% | |
Covidien plc(2) | | | 30,914 | | | | 1,653,899 | |
Hologic, Inc.(1)(2) | | | 38,043 | | | | 686,296 | |
Medtronic, Inc.(2) | | | 41,156 | | | | 1,593,972 | |
St. Jude Medical, Inc.(2) | | | 27,973 | | | | 1,116,402 | |
| | | | | | | | 5,050,569 | |
| HEALTH CARE PROVIDERS AND SERVICES — 3.6% | |
Humana, Inc.(2) | | | 18,197 | | | | 1,409,175 | |
McKesson Corp.(2) | | | 17,395 | | | | 1,630,781 | |
Molina Healthcare, Inc.(1)(2) | | | 44,593 | | | | 1,046,152 | |
| Omnicare, Inc. | | | 13,499 | | | | 421,574 | |
UnitedHealth Group, Inc.(2) | | | 36,284 | | | | 2,122,614 | |
| WellPoint, Inc. | | | 1,939 | | | | 123,689 | |
| | | | | | | | 6,753,985 | |
| HOTELS, RESTAURANTS AND LEISURE — 2.0% | |
Ameristar Casinos, Inc.(2) | | | 59,890 | | | | 1,064,245 | |
Bob Evans Farms, Inc.(2) | | | 34,175 | | | | 1,373,835 | |
| International Game Technology | | | 9,430 | | | | 148,523 | |
McDonald’s Corp.(2) | | | 1,649 | | | | 145,986 | |
| Wynn Resorts Ltd. | | | 292 | | | | 30,286 | |
Yum! Brands, Inc.(2) | | | 15,219 | | | | 980,408 | |
| | | | | | | | 3,743,283 | |
| HOUSEHOLD DURABLES — 0.7% | |
Garmin Ltd.(2) | | | 26,125 | | | | 1,000,326 | |
Tempur-Pedic International, Inc.(1)(2) | | | 16,859 | | | | 394,332 | |
| | | | | | | | 1,394,658 | |
| HOUSEHOLD PRODUCTS — 1.1% | |
Procter & Gamble Co. (The)(2) | | | 24,152 | | | | 1,479,310 | |
Spectrum Brands Holdings, Inc.(1) | | | 19,905 | | | | 648,306 | |
| | | | | | | | 2,127,616 | |
| INDEPENDENT POWER PRODUCERS AND ENERGY TRADERS — 0.1% | |
| TransAlta Corp. | | | 13,471 | | | | 228,603 | |
| INDUSTRIAL CONGLOMERATES — 1.6% | |
3M Co.(2) | | | 9,893 | | | | 886,413 | |
General Electric Co.(2) | | | 83,733 | | | | 1,744,996 | |
Tyco International Ltd.(2) | | | 7,492 | | | | 395,952 | |
| | | | | | | | 3,027,361 | |
| INSURANCE — 6.5% | | | | | | | | |
Allied World Assurance Co. Holdings Ltd.(2) | | | 18,401 | | | | $1,462,327 | |
Arch Capital Group Ltd.(1)(2) | | | 14,717 | | | | 584,118 | |
| Aspen Insurance Holdings Ltd. | | | 6,455 | | | | 186,549 | |
Berkshire Hathaway, Inc., Class B(1)(2) | | | 11,365 | | | | 947,045 | |
CNA Financial Corp.(2) | | | 42,492 | | | | 1,177,878 | |
| Everest Re Group Ltd. | | | 11,685 | | | | 1,209,281 | |
Loews Corp.(2) | | | 36,545 | | | | 1,495,056 | |
Marsh & McLennan Cos., Inc.(2) | | | 15,637 | | | | 503,981 | |
Principal Financial Group, Inc.(2) | | | 50,551 | | | | 1,325,953 | |
| ProAssurance Corp. | | | 4,755 | | | | 423,623 | |
| Protective Life Corp. | | | 18,754 | | | | 551,555 | |
Prudential Financial, Inc.(2) | | | 29,161 | | | | 1,412,267 | |
| Validus Holdings Ltd. | | | 32,995 | | | | 1,056,830 | |
| | | | | | | | 12,336,463 | |
| INTERNET SOFTWARE AND SERVICES — 2.7% | |
Ancestry.com, Inc.(1)(2) | | | 48,756 | | | | 1,342,253 | |
AOL, Inc.(1)(2) | | | 42,835 | | | | 1,202,807 | |
Dice Holdings, Inc.(1)(2) | | | 119,850 | | | | 1,125,391 | |
Google, Inc. Class A(1)(2) | | | 1,814 | | | | 1,052,247 | |
United Online, Inc.(2) | | | 93,590 | | | | 394,950 | |
| | | | | | | | 5,117,648 | |
| IT SERVICES — 4.2% | | | | | | | | |
Accenture plc, Class A(2) | | | 18,104 | | | | 1,087,870 | |
Alliance Data Systems Corp.(1)(2) | | | 1,419 | | | | 191,565 | |
CACI International, Inc., Class A(1)(2) | | | 20,556 | | | | 1,130,991 | |
International Business Machines Corp.(2) | | | 16,826 | | | | 3,290,829 | |
| SAIC, Inc. | | | 34,178 | | | | 414,237 | |
Unisys Corp.(1)(2) | | | 24,911 | | | | 487,010 | |
Visa, Inc., Class A(2) | | | 11,459 | | | | 1,416,676 | |
| | | | | | | | 8,019,178 | |
| LIFE SCIENCES TOOLS AND SERVICES — 0.8% | |
| Agilent Technologies, Inc. | | | 20,568 | | | | 807,089 | |
Life Technologies Corp.(1) | | | 14,275 | | | | 642,232 | |
| | | | | | | | 1,449,321 | |
| MACHINERY — 2.3% | | | | | | | | |
Actuant Corp., Class A(2) | | | 43,617 | | | | 1,184,638 | |
Cummins, Inc.(2) | | | 14,651 | | | | 1,419,828 | |
Parker-Hannifin Corp.(2) | | | 3,626 | | | | 278,767 | |
| Robbins & Myers, Inc. | | | 9,492 | | | | 396,955 | |
Sauer-Danfoss, Inc.(2) | | | 30,228 | | | | 1,055,864 | |
| | | | | | | | 4,336,052 | |
| MEDIA — 3.1% | | | | | | | | |
CBS Corp., Class B(2) | | | 49,411 | | | | 1,619,693 | |
Comcast Corp., Class A(2) | | | 11,993 | | | | 383,416 | |
DISH Network Corp., Class A(2) | | | 3,760 | | | | 107,348 | |
Live Nation Entertainment, Inc.(1) | | | 86,548 | | | | 794,511 | |
Regal Entertainment Group Class A(2) | | | 94,323 | | | | 1,297,884 | |
Scholastic Corp.(2) | | | 37,794 | | | | 1,064,279 | |
Time Warner, Inc.(2) | | | 7,089 | | | | 272,927 | |
| Viacom, Inc., Class B | | | 7,403 | | | | 348,089 | |
| | | | | | | | 5,888,147 | |
| METALS AND MINING — 2.1% | |
Coeur d’Alene Mines Corp.(1)(2) | | | 67,401 | | | | 1,183,562 | |
Freeport-McMoRan Copper & Gold, Inc.(2) | | | 24,537 | | | | 835,976 | |
Nevsun Resources Ltd.(2) | | | 113,203 | | | | 366,778 | |
| Silver Wheaton Corp. | | | 12,673 | | | | 340,143 | |
Teck Resources Ltd.(2) | | | 37,276 | | | | 1,153,319 | |
| | | | | | | | 3,879,778 | |
| MULTI-UTILITIES — 2.3% | | | | | | | | |
Ameren Corp.(2) | | | 41,217 | | | | 1,382,418 | |
Consolidated Edison, Inc.(2) | | | 24,034 | | | | 1,494,674 | |
| Public Service Enterprise Group, Inc. | | | 47,557 | | | | 1,545,603 | |
| | | | | | | | 4,422,695 | |
| MULTILINE RETAIL — 1.5% | |
Dillard’s, Inc., Class A(2) | | | 17,196 | | | | 1,095,041 | |
Macy’s, Inc.(2) | | | 25,810 | | | | 886,574 | |
Saks, Inc.(1)(2) | | | 73,634 | | | | 784,202 | |
| | | | | | | | 2,765,817 | |
| OIL, GAS AND CONSUMABLE FUELS — 12.8% | |
| Apache Corp. | | | 17,409 | | | | 1,530,077 | |
Chevron Corp.(2) | | | 40,981 | | | | 4,323,495 | |
Cloud Peak Energy, Inc.(1)(2) | | | 28,162 | | | | 476,219 | |
ConocoPhillips(2) | | | 40,069 | | | | 2,239,056 | |
Energy XXI Bermuda Ltd.(2) | | | 41,588 | | | | 1,301,288 | |
Exxon Mobil Corp.(2) | | | 75,773 | | | | 6,483,896 | |
Marathon Oil Corp.(2) | | | 45,667 | | | | 1,167,705 | |
Marathon Petroleum Corp.(2) | | | 39,568 | | | | 1,777,395 | |
| Occidental Petroleum Corp. | | | 16,284 | | | | 1,396,679 | |
Phillips 66(1) | | | 12,421 | | | | 412,874 | |
Suncor Energy, Inc.(2) | | | 42,421 | | | | 1,228,088 | |
Valero Energy Corp.(2) | | | 11,585 | | | | 279,778 | |
Western Refining, Inc.(2) | | | 68,684 | | | | 1,529,593 | |
| | | | | | | | 24,146,143 | |
| PAPER AND FOREST PRODUCTS — 0.9% | |
Domtar Corp.(2) | | | 13,021 | | | | $998,841 | |
International Paper Co.(2) | | | 25,359 | | | | 733,129 | |
| | | | | | | | 1,731,970 | |
| PERSONAL PRODUCTS — 0.6% | |
Nu Skin Enterprises, Inc., Class A(2) | | | 23,660 | | | | 1,109,654 | |
| PHARMACEUTICALS — 7.7% | |
Abbott Laboratories(2) | | | 45,903 | | | | 2,959,366 | |
Bristol-Myers Squibb Co.(2) | | | 12,025 | | | | 432,299 | |
Eli Lilly & Co.(2) | | | 45,705 | | | | 1,961,202 | |
Johnson & Johnson(2) | | | 24,472 | | | | 1,653,328 | |
Merck & Co., Inc.(2) | | | 77,158 | | | | 3,221,346 | |
Pfizer, Inc.(2) | | | 166,998 | | | | 3,840,954 | |
ViroPharma, Inc.(1)(2) | | | 13,651 | | | | 323,529 | |
Warner Chilcott plc Class A(1) | | | 7,834 | | | | 140,385 | |
| | | | | | | | 14,532,409 | |
| PROFESSIONAL SERVICES — 1.0% | |
| Corporate Executive Board Co. (The) | | | 20,068 | | | | 820,380 | |
| Robert Half International, Inc. | | | 39,087 | | | | 1,116,715 | |
| | | | | | | | 1,937,095 | |
| REAL ESTATE INVESTMENT TRUSTS (REITs) — 2.4% | |
| American Tower Corp. | | | 1,411 | | | | 98,643 | |
First Industrial Realty Trust, Inc.(1)(2) | | | 74,774 | | | | 943,648 | |
LaSalle Hotel Properties(2) | | | 26,483 | | | | 771,715 | |
Simon Property Group, Inc.(2) | | | 8,909 | | | | 1,386,775 | |
Taubman Centers, Inc.(2) | | | 17,976 | | | | 1,387,028 | |
| | | | | | | | 4,587,809 | |
| ROAD AND RAIL — 0.8% | | | | | | | | |
Dollar Thrifty Automotive Group, Inc.(1)(2) | | | 6,656 | | | | 538,870 | |
| Norfolk Southern Corp. | | | 1,725 | | | | 123,803 | |
Union Pacific Corp.(2) | | | 7,168 | | | | 855,214 | |
| | | | | | | | 1,517,887 | |
| SEMICONDUCTORS AND SEMICONDUCTOR EQUIPMENT — 4.1% | |
Advanced Micro Devices, Inc.(1)(2) | | | 210,464 | | | | 1,205,959 | |
Applied Materials, Inc.(2) | | | 110,479 | | | | 1,266,089 | |
Intel Corp.(2) | | | 101,233 | | | | 2,697,859 | |
KLA-Tencor Corp.(2) | | | 21,564 | | | | 1,062,027 | |
Lam Research Corp.(1)(2) | | | 6,497 | | | | 245,197 | |
LSI Corp.(1)(2) | | | 147,852 | | | | 941,817 | |
| MKS Instruments, Inc. | | | 8,487 | | | | 245,529 | |
| | | | | | | | 7,664,477 | |
| SOFTWARE — 5.5% | | | | | | | | |
Activision Blizzard, Inc.(2) | | | 34,469 | | | | 413,283 | |
Cadence Design Systems, Inc.(1)(2) | | | 117,013 | | | | 1,285,973 | |
JDA Software Group, Inc.(1)(2) | | | 33,459 | | | | 993,398 | |
Mentor Graphics Corp.(1)(2) | | | 85,177 | | | | 1,277,655 | |
Microsoft Corp.(2) | | | 67,229 | | | | 2,056,535 | |
Oracle Corp.(2) | | | 102,672 | | | | 3,049,358 | |
Symantec Corp.(1)(2) | | | 91,414 | | | | 1,335,559 | |
| | | | | | | | 10,411,761 | |
| SPECIALTY RETAIL — 4.9% | |
Bed Bath & Beyond, Inc.(1) | | | 4,955 | | | | 306,219 | |
Best Buy Co., Inc.(2) | | | 60,715 | | | | 1,272,586 | |
Foot Locker, Inc.(2) | | | 42,073 | | | | 1,286,592 | |
GameStop Corp., Class A(2) | | | 45,534 | | | | 836,004 | |
Home Depot, Inc. (The)(2) | | | 49,294 | | | | 2,612,089 | |
O’Reilly Automotive, Inc.(1) | | | 13,646 | | | | 1,143,126 | |
PetSmart, Inc.(2) | | | 23,304 | | | | 1,588,867 | |
Select Comfort Corp.(1)(2) | | | 11,101 | | | | 232,233 | |
| | | | | | | | 9,277,716 | |
| TEXTILES, APPAREL AND LUXURY GOODS — 0.9% | |
Crocs, Inc.(1) | | | 4,249 | | | | 68,621 | |
Fifth & Pacific Cos., Inc.(1)(2) | | | 6,987 | | | | 74,971 | |
Iconix Brand Group, Inc.(1)(2) | | | 24,218 | | | | 423,088 | |
Jones Group, Inc. (The)(2) | | | 109,176 | | | | 1,043,723 | |
| | | | | | | | 1,610,403 | |
| TRADING COMPANIES AND DISTRIBUTORS — 0.2% | |
Beacon Roofing Supply, Inc.(1)(2) | | | 11,901 | | | | 300,143 | |
| WIRELESS TELECOMMUNICATION SERVICES — 0.1% | |
United States Cellular Corp.(1)(2) | | | 7,263 | | | | 280,497 | |
TOTAL COMMON STOCKS (Cost $228,799,331) | | | | 239,989,564 | |
| Temporary Cash Investments — 0.7% | |
Repurchase Agreement, Bank of America Merrill Lynch, (collateralized by various U.S. Treasury obligations, 1.50% - 4.00%, 2/15/15 - 6/30/16, valued at $414,690), in a joint trading account at 0.10%, dated 6/29/12, due 7/2/12 (Delivery value $406,792) | | | | 406,789 | |
Repurchase Agreement, Credit Suisse First Boston, Inc., (collateralized by various U.S. Treasury obligations, 3.75%, 8/15/41, valued at $415,979), in a joint trading account at 0.10%, dated 6/29/12, due 7/2/12 (Delivery value $406,792) | | | | 406,789 | |
Repurchase Agreement, Goldman Sachs & Co., (collateralized by various U.S. Treasury obligations, 4.375%, 5/15/40, valued at $103,592), in a joint trading account at 0.06%, dated 6/29/12, due 7/2/12 (Delivery value $101,698) | | | | $101,697 | |
| SSgA U.S. Government Money Market Fund | | | 351,810 | | | | 351,810 | |
TOTAL TEMPORARY CASH INVESTMENTS (Cost $1,267,085) | | | | 1,267,085 | |
TOTAL INVESTMENT SECURITIES BEFORE SECURITIES SOLD SHORT — 127.9% (Cost $230,066,416) | | | | 241,256,649 | |
| Common Stocks Sold Short — (29.7)% | |
| AEROSPACE AND DEFENSE — (0.3)% | |
| AAR Corp. | | | (42,345 | ) | | | (570,811 | ) |
| AIR FREIGHT AND LOGISTICS — (0.6)% | |
| Atlas Air Worldwide Holdings, Inc. | | | (27,031 | ) | | | (1,176,119 | ) |
| BIOTECHNOLOGY — (1.7)% | |
| Ariad Pharmaceuticals, Inc. | | | (28,692 | ) | | | (493,789 | ) |
| Halozyme Therapeutics, Inc. | | | (24,390 | ) | | | (216,095 | ) |
| Idenix Pharmaceuticals, Inc. | | | (47,172 | ) | | | (485,872 | ) |
| Incyte Corp. Ltd. | | | (20,461 | ) | | | (464,465 | ) |
| Ironwood Pharmaceuticals, Inc. | | | (32,741 | ) | | | (451,171 | ) |
| Seattle Genetics, Inc. | | | (20,596 | ) | | | (522,932 | ) |
| Theravance, Inc. | | | (21,763 | ) | | | (483,574 | ) |
| | | | | | | | (3,117,898 | ) |
| CAPITAL MARKETS — (0.6)% | |
| Ares Capital Corp. | | | (75,949 | ) | | | (1,212,146 | ) |
| CHEMICALS — (0.1)% | |
| Ashland, Inc. | | | (3,314 | ) | | | (229,693 | ) |
| COMMERCIAL SERVICES AND SUPPLIES — (0.2)% | |
| Geo Group, Inc. (The) | | | (7,512 | ) | | | (170,673 | ) |
| Interface, Inc. | | | (16,612 | ) | | | (226,421 | ) |
| | | | | | | | (397,094 | ) |
| COMMUNICATIONS EQUIPMENT — (1.3)% | |
| InterDigital, Inc. | | | (45,376 | ) | | | (1,339,046 | ) |
| Viasat, Inc. | | | (31,327 | ) | | | (1,183,221 | ) |
| | | | | | | | (2,522,267 | ) |
| COMPUTERS AND PERIPHERALS — (0.7)% | |
| Fusion-io, Inc. | | | (61,966 | ) | | | (1,294,470 | ) |
| CONSTRUCTION AND ENGINEERING — (0.3)% | |
| MasTec, Inc. | | | (35,772 | ) | | | (538,011 | ) |
| CONTAINERS AND PACKAGING — (0.1)% | |
| Rock-Tenn Co., Class A | | | (2,394 | ) | | | (130,593 | ) |
| ELECTRICAL EQUIPMENT — (0.7)% | |
| GrafTech International Ltd. | | | (128,632 | ) | | | (1,241,299 | ) |
| ELECTRONIC EQUIPMENT, INSTRUMENTS AND COMPONENTS — (0.5)% | |
| Scansource, Inc. | | | (28,884 | ) | | | (885,006 | ) |
| ENERGY EQUIPMENT AND SERVICES — (0.8)% | |
| Lufkin Industries, Inc. | | | (20,328 | ) | | | (1,104,217 | ) |
| Noble Corp. | | | (13,148 | ) | | | (427,704 | ) |
| | | | | | | | (1,531,921 | ) |
| GAS UTILITIES — (0.2)% | | | | | | | | |
| ONEOK, Inc. | | | (6,999 | ) | | | (296,128 | ) |
| HEALTH CARE EQUIPMENT AND SUPPLIES — (1.2)% | |
| DexCom, Inc. | | | (64,168 | ) | | | (831,617 | ) |
| Neogen Corp. | | | (29,635 | ) | | | (1,369,137 | ) |
| | | | | | | | (2,200,754 | ) |
| HEALTH CARE PROVIDERS AND SERVICES — (1.7)% | |
| Catalyst Health Solutions, Inc. | | | (14,187 | ) | | | (1,325,633 | ) |
| HMS Holdings Corp. | | | (28,765 | ) | | | (958,162 | ) |
| Kindred Healthcare, Inc. | | | (94,736 | ) | | | (931,255 | ) |
| | | | | | | | (3,215,050 | ) |
| INSURANCE — (3.7)% | | | | | | | | |
| Enstar Group Ltd. | | | (9,093 | ) | | | (899,662 | ) |
| Fairfax Financial Holdings Ltd. | | | (1,847 | ) | | | (723,470 | ) |
| Kemper Corp. | | | (5,698 | ) | | | (175,214 | ) |
| MBIA, Inc. | | | (126,617 | ) | | | (1,368,730 | ) |
| Old Republic International Corp. | | | (119,273 | ) | | | (988,773 | ) |
| OneBeacon Insurance Group Ltd. Class A | | | (18,864 | ) | | | (245,609 | ) |
| Platinum Underwriters Holdings Ltd. | | | (31,434 | ) | | | (1,197,635 | ) |
| Primerica, Inc. | | | (49,473 | ) | | | (1,322,413 | ) |
| | | | | | | | (6,921,506 | ) |
| IT SERVICES — (0.7)% | | | | | | | | |
| Global Payments, Inc. | | | (25,446 | ) | | | (1,100,030 | ) |
| VeriFone Systems, Inc. | | | (6,097 | ) | | | (201,750 | ) |
| | | | | | | | (1,301,780 | ) |
| MACHINERY — (1.2)% | | | | | | | | |
| Colfax Corp. | | | (42,547 | ) | | | (1,173,021 | ) |
| SPX Corp. | | | (1,518 | ) | | | (99,156 | ) |
| Westport Innovations, Inc. | | | (28,072 | ) | | | (1,031,646 | ) |
| | | | | | | | (2,303,823 | ) |
| MEDIA — (1.2)% | | | | | | | | |
| Imax Corp. | | | (55,554 | ) | | | (1,334,963 | ) |
| Lions Gate Entertainment Corp. | | | (62,764 | ) | | | (925,141 | ) |
| | | | | | | | (2,260,104 | ) |
| METALS AND MINING — (1.9)% | |
| AK Steel Holding Corp. | | | (66,244 | ) | | | $(388,852 | ) |
| AuRico Gold, Inc. | | | (109,832 | ) | | | (879,754 | ) |
| New Gold, Inc. | | | (48,349 | ) | | | (459,316 | ) |
| North American Palladium Ltd. | | | (160,316 | ) | | | (325,442 | ) |
| Rubicon Minerals Corp. | | | (99,504 | ) | | | (302,492 | ) |
| Silver Standard Resources, Inc. | | | (60,263 | ) | | | (677,356 | ) |
| Thompson Creek Metals Co., Inc. | | | (185,892 | ) | | | (592,995 | ) |
| | | | | | | | (3,626,207 | ) |
| MULTILINE RETAIL — (0.2)% | |
| J.C. Penney Co., Inc. | | | (16,957 | ) | | | (395,268 | ) |
| OIL, GAS AND CONSUMABLE FUELS — (2.5)% | |
| Approach Resources, Inc. | | | (9,045 | ) | | | (231,009 | ) |
| Bill Barrett Corp. | | | (40,085 | ) | | | (858,621 | ) |
| Clean Energy Fuels Corp. | | | (5,015 | ) | | | (77,733 | ) |
| EXCO Resources, Inc. | | | (177,914 | ) | | | (1,350,367 | ) |
| Kodiak Oil & Gas Corp. | | | (139,677 | ) | | | (1,146,748 | ) |
| Northern Oil and Gas, Inc. | | | (37,192 | ) | | | (592,840 | ) |
| World Fuel Services Corp. | | | (11,093 | ) | | | (421,867 | ) |
| | | | | | | | (4,679,185 | ) |
| PAPER AND FOREST PRODUCTS — (0.1)% | |
| Louisiana-Pacific Corp. | | | (15,240 | ) | | | (165,811 | ) |
| PHARMACEUTICALS — (0.8)% | |
| Akorn, Inc. | | | (21,958 | ) | | | (346,278 | ) |
| Impax Laboratories, Inc. | | | (40,715 | ) | | | (825,293 | ) |
| VIVUS, Inc. | | | (14,540 | ) | | | (414,971 | ) |
| | | | | | | | (1,586,542 | ) |
| REAL ESTATE MANAGEMENT AND DEVELOPMENT — (0.3)% | |
| Brookfield Office Properties, Inc. | | | (5,827 | ) | | | (101,506 | ) |
| Forest City Enterprises, Inc. Class A | | | (8,407 | ) | | | (122,742 | ) |
| St Joe Co. (The) | | | (22,237 | ) | | | (351,567 | ) |
| | | | | | | | (575,815 | ) |
| SEMICONDUCTORS AND SEMICONDUCTOR EQUIPMENT — (1.7)% | |
| First Solar, Inc. | | | (91,890 | ) | | | (1,383,863 | ) |
| International Rectifier Corp. | | | (60,023 | ) | | | (1,199,860 | ) |
| MEMC Electronic Materials, Inc. | | | (286,399 | ) | | | (621,486 | ) |
| | | | | | | | (3,205,209 | ) |
| SOFTWARE — (0.9)% | | | | | | | | |
| Concur Technologies, Inc. | | | (19,194 | ) | | | (1,307,111 | ) |
| Take-Two Interactive Software, Inc. | | | (43,697 | ) | | | (413,374 | ) |
| | | | | | | | (1,720,485 | ) |
| SPECIALTY RETAIL — (1.1)% | |
| CarMax, Inc. | | | (40,067 | ) | | | (1,039,338 | ) |
| Tiffany & Co. | | | (20,123 | ) | | | (1,065,513 | ) |
| | | | | | | | (2,104,851 | ) |
| TEXTILES, APPAREL AND LUXURY GOODS — (1.0)% | |
| Deckers Outdoor Corp. | | | (9,336 | ) | | | (410,878 | ) |
| Gildan Activewear, Inc. | | | (45,393 | ) | | | (1,249,215 | ) |
| Under Armour, Inc., Class A | | | (3,008 | ) | | | (284,196 | ) |
| | | | | | | | (1,944,289 | ) |
| TRADING COMPANIES AND DISTRIBUTORS — (1.4)% | |
| Air Lease Corp. | | | (59,788 | ) | | | (1,159,289 | ) |
| Textainer Group Holdings Ltd. | | | (39,451 | ) | | | (1,455,742 | ) |
| | | | | | | | (2,615,031 | ) |
TOTAL COMMON STOCKS SOLD SHORT — (29.7)% (Proceeds $58,902,922) | | | | (55,965,166 | ) |
| OTHER ASSETS AND LIABILITIES — 1.8% | | | | 3,356,654 | |
| TOTAL NET ASSETS — 100.0% | | | | $188,648,137 | |
Notes to Schedule of Investments
| (2) | Security, or a portion thereof, has been pledged at the custodian bank or with a broker for collateral requirements on securities sold short. At the period end, the aggregate value of securities pledged was $172,656,824. |
See Notes to Financial Statements.
Statement of Assets and Liabilities |
| JUNE 30, 2012 | |
| Assets | |
| Investment securities, at value (cost of $230,066,416) | | | $241,256,649 | |
| Cash | | | 12,809 | |
| Deposits with broker for securities sold short | | | 2,277,373 | |
| Receivable for investments sold | | | 1,017,795 | |
| Receivable for capital shares sold | | | 36,998 | |
| Dividends and interest receivable | | | 199,705 | |
| | | | 244,801,329 | |
| | | | | |
| Liabilities | | | | |
| Securities sold short, at value (proceeds of $58,902,922) | | | 55,965,166 | |
| Accrued management fees | | | 163,745 | |
| Dividend expense payable on securities sold short | | | 20,329 | |
| Broker fees and charges payable on securities sold short | | | 3,952 | |
| | | | 56,153,192 | |
| | | | | |
| Net Assets | | | $188,648,137 | |
| | | | | |
| Institutional Class Capital Shares, $0.01 Par Value | | | | |
| Shares authorized | | | 100,000,000 | |
| Shares outstanding | | | 17,229,865 | |
| | | | | |
| Net Asset Value Per Share | | | $10.95 | |
| | | | | |
| Net Assets Consist of: | | | | |
| Capital (par value and paid-in surplus) | | | $174,719,501 | |
| Undistributed net investment income | | | 465,551 | |
| Accumulated net realized loss | | | (665,024 | ) |
| Net unrealized appreciation | | | 14,128,109 | |
| | | | $188,648,137 | |
See Notes to Financial Statements.
FOR THE PERIOD ENDED JUNE 30, 2012(1) | |
| Investment Income (Loss) | |
| Income: | | | |
| Dividends (net of foreign taxes withheld of $10,845) | | | $2,327,653 | |
| Interest | | | 1,942 | |
| | | | 2,329,595 | |
| Expenses: | | | | |
| Dividend expense on securities sold short | | | 343,880 | |
| Broker fees and charges on securities sold short | | | 385,235 | |
| Management fees | | | 1,078,126 | |
| Directors’ fees and expenses | | | 4,114 | |
| | | | 1,811,355 | |
| | | | | |
| Net investment income (loss) | | | 518,240 | |
| | | | | |
| Realized and Unrealized Gain (Loss) | | | | |
| Net realized gain (loss) on: | | | | |
| Investment transactions | | | 3,696,758 | |
| Securities sold short transactions | | | (4,351,799 | ) |
| Foreign currency transactions | | | (518 | ) |
| | | | (655,559 | ) |
| | | | | |
| Change in net unrealized appreciation (depreciation) on: | | | | |
| Investments | | | 11,190,233 | |
| Securities sold short | | | 2,937,756 | |
| Translation of assets and liabilities in foreign currencies | | | 120 | |
| | | | 14,128,109 | |
| | | | | |
| Net realized and unrealized gain (loss) | | | 13,472,550 | |
| | | | | |
| Net Increase (Decrease) in Net Assets Resulting from Operations | | | $13,990,790 | |
| (1) | December 1, 2011 (fund inception) through June 30, 2012. |
See Notes to Financial Statements.
Statement of Changes in Net Assets |
PERIOD ENDED JUNE 30, 2012(1) | |
| Increase (Decrease) in Net Assets | |
| Operations | |
| Net investment income (loss) | | | $518,240 | |
| Net realized gain (loss) | | | (655,559 | ) |
| Change in net unrealized appreciation (depreciation) | | | 14,128,109 | |
| Net increase (decrease) in net assets resulting from operations | | | 13,990,790 | |
| | | | | |
| Distributions to Shareholders | | | | |
| From net investment income | | | (62,154 | ) |
| | | | | |
| Capital Share Transactions | | | | |
| Proceeds from shares sold | | | 174,768,199 | |
| Proceeds from reinvestment of distributions | | | 62,154 | |
| Payments for shares redeemed | | | (110,852 | ) |
| Net increase (decrease) in net assets from capital share transactions | | | 174,719,501 | |
| | | | | |
| Net increase (decrease) in net assets | | | 188,648,137 | |
| | | | | |
| Net Assets | | | | |
| End of period | | | $188,648,137 | |
| | | | | |
| Undistributed net investment income | | | $465,551 | |
| | | | | |
| Transactions in Shares of the Fund | | | | |
| Sold | | | 17,234,318 | |
| Issued in reinvestment of distributions | | | 6,130 | |
| Redeemed | | | (10,583 | ) |
| Net increase (decrease) in shares of the fund | | | 17,229,865 | |
| (1) | December 1, 2011 (fund inception) through June 30, 2012. |
See Notes to Financial Statements.
FOR THE PERIOD ENDED JUNE 30, 2012(1) | |
| Cash Flows From (Used In) Operating Activities | |
| Net increase (decrease) in net assets resulting from operations | | | $13,990,790 | |
Adjustments to reconcile net increase (decrease) in net assets resulting from operations to net cash from (used in) operating activities: | | | | |
| Purchases of investment securities | | | (304,510,584 | ) |
| Proceeds from investments sold | | | 79,393,184 | |
| Purchases to cover securities sold short | | | (38,385,994 | ) |
| Proceeds from securities sold short | | | 92,951,944 | |
| (Increase) decrease in short-term investments | | | (1,267,085 | ) |
| (Increase) decrease in deposits with broker for securities sold short | | | (2,277,373 | ) |
| (Increase) decrease in receivable for investments sold | | | (1,017,795 | ) |
| (Increase) decrease in dividends and interest receivable | | | (199,705 | ) |
| Increase (decrease) in accrued management fees | | | 163,745 | |
| Increase (decrease) in dividend expense payable on securities sold short | | | 20,329 | |
| Increase (decrease) in broker fees and charges payable on securities sold short | | | 3,952 | |
| Change in net unrealized (appreciation) depreciation on investments | | | (11,190,233 | ) |
| Net realized (gain) loss on investment transactions | | | (3,696,758 | ) |
| Change in net unrealized (appreciation) depreciation on securities sold short | | | (2,937,756 | ) |
| Net realized (gain) loss on securities sold short transactions | | | 4,351,799 | |
| Net cash from (used in) operating activities | | | (174,607,540 | ) |
| | | | | |
| Cash Flows From (Used In) Financing Activities | | | | |
| Proceeds from shares sold | | | 174,731,201 | |
| Payments for shares redeemed | | | (110,852 | ) |
| Distributions paid, net of reinvestments | | | — | |
| Net cash from (used in) financing activities | | | 174,620,349 | |
| | | | | |
| Net Increase (Decrease) In Cash | | | 12,809 | |
| Cash at beginning of period | | | — | |
| Cash at end of period | | | $12,809 | |
| | | | | |
Supplemental disclosure of cash flow information: Non cash financing activities not included herein consist of all reinvestment of distributions of $62,154. | |
| (1) | December 1, 2011 (fund inception) through June 30, 2012. |
See Notes to Financial Statements.
Notes to Financial Statements |
JUNE 30, 2012
1. Organization
American Century Quantitative Equity Funds, Inc. (the corporation) is registered under the Investment Company Act of 1940, as amended (the 1940 Act), as an open-end management investment company and is organized as a Maryland corporation. NT Core Equity Plus Fund (the fund) is one fund in a series issued by the corporation. The fund is diversified as defined under the 1940 Act. The fund’s investment objective is to seek long-term capital growth. The fund pursues its objective by investing primarily in large capitalization publicly-traded U.S. companies. The fund takes long positions in equity securities that have been identified as most attractive. The fund takes short positions in equity securities that have been identified as least attractive. The fund invests approximately 130% in long positions and 30% in short positions though it may range from 110% to 150% long and 10% to 50% short. The fund is not permitted to invest in any securities issued by companies assigned by the Global Industry Classification Standard to the tobacco industry. The fund incepted on December 1, 2011.
2. Significant Accounting Policies
The following is a summary of significant accounting policies consistently followed by the fund in preparation of its financial statements. The financial statements are prepared in conformity with accounting principles generally accepted in the United States of America, which may require management to make certain estimates and assumptions at the date of the financial statements. Actual results could differ from these estimates.
Investment Valuations — The fund determines the fair value of its investments and computes its net asset value per share as of the close of regular trading (usually 4 p.m. Eastern time) on the New York Stock Exchange (NYSE) on each day the NYSE is open.
Equity securities that are listed or traded on a domestic securities exchange are valued at the last reported sales price or at the official closing price as provided by the exchange. Equity securities traded on foreign securities exchanges are typically valued at the closing price on the exchange where primarily traded or as of the close of the NYSE, if that is earlier. If no last sales price is reported, or if local convention or regulation so provides, the mean of the latest bid and asked prices is used. Depending on local convention or regulation, securities traded over-the-counter are valued at the mean of the latest bid and asked prices, the last sales price, or the official closing price. In its determination of fair value, the fund may review several factors including: market information specific to a security; news developments in U.S. and foreign markets; the performance of particular U.S. and foreign securities, indices, comparable securities, American Depositary Receipts, Exchange-Traded Funds, and other relevant market indicators.
Debt securities maturing within 60 days at the time of purchase may be valued at cost, plus or minus any amortized discount or premium or at the evaluated mean as provided by an independent pricing service. Evaluated mean prices are commonly derived through utilization of market models, which may consider, among other factors, trade data, quotations from dealers and active market makers, relevant yield curve and spread data, related sector levels, creditworthiness, and other relevant market information on the same or comparable securities.
Investments in open-end management investment companies are valued at the reported net asset value per share. Repurchase agreements are valued at cost.
The value of investments initially expressed in foreign currencies is translated into U.S. dollars at prevailing exchange rates.
If the fund determines that the market price for a portfolio security is not readily available or the valuation methods mentioned above do not reflect a security’s fair value, such security is valued as determined in good faith by the Board of Directors or its designee, in accordance with procedures adopted by the Board of Directors. Circumstances that may cause the fund to use these procedures to value a security include, but are not limited to: a security has been declared in default; trading in a security has been halted during
the trading day; there is a foreign market holiday and no trading occurred; or an event occurred between the close of a foreign exchange and the NYSE that may affect the value of a security.
Security Transactions — Security transactions are accounted for as of the trade date. Net realized gains and losses are determined on the identified cost basis, which is also used for federal income tax purposes.
Investment Income — Dividend income less foreign taxes withheld, if any, is recorded as of the ex-dividend date. Distributions received on securities that represent a return of capital or capital gain are recorded as a reduction of cost of investments and/or as a realized gain. The fund estimates the components of distributions received that may be considered nontaxable distributions or capital gain distributions for income tax purposes. Interest income is recorded on the accrual basis and includes accretion of discounts and amortization of premiums.
Securities Sold Short —The fund enters into short sales, which is selling securities it does not own, as part of its normal investment activities. Upon selling a security short, the fund will segregate cash, cash equivalents or other appropriate liquid securities in at least an amount equal to the current market value of the securities sold short until the fund replaces the borrowed security. Interest earned on segregated cash for securities sold short is reflected as interest income. The fund is required to pay any dividends or interest due on securities sold short. Such dividends and interest are recorded as an expense. The fund may pay fees or charges on the assets borrowed for securities sold short. Liabilities for securities sold short are valued daily and changes in value are recorded as change in net unrealized appreciation (depreciation) on securities sold short. The fund records realized gain (loss) on a security sold short when it is terminated by the fund and includes as a component of net realized gain (loss) on securities sold short transactions.
Foreign Currency Translations — All assets and liabilities initially expressed in foreign currencies are translated into U.S. dollars at prevailing exchange rates at period end. The fund may enter into spot foreign currency exchange contracts to facilitate transactions denominated in a foreign currency. Purchases and sales of investment securities, dividend and interest income, spot foreign currency exchange contracts, and expenses are translated at the rates of exchange prevailing on the respective dates of such transactions. Net realized and unrealized foreign currency exchange gains or losses related to investment securities are a component of net realized gain (loss) on investment transactions and change in net unrealized appreciation (depreciation) on investments, respectively. Net realized and unrealized foreign currency exchange gains or losses related to securities sold short are a component of net realized gain (loss) on securities sold short transactions and change in net unrealized appreciation (depreciation) on securities sold short, respectively.
Repurchase Agreements — The fund may enter into repurchase agreements with institutions that American Century Investment Management, Inc. (ACIM) (the investment advisor) has determined are creditworthy pursuant to criteria adopted by the Board of Directors. The fund requires that the collateral, represented by securities, received in a repurchase transaction be transferred to the custodian in a manner sufficient to enable the fund to obtain those securities in the event of a default under the repurchase agreement. ACIM monitors, on a daily basis, the securities transferred to ensure the value, including accrued interest, of the securities under each repurchase agreement is equal to or greater than amounts owed to the fund under each repurchase agreement.
Joint Trading Account — Pursuant to an Exemptive Order issued by the Securities and Exchange Commission, the fund, along with certain other funds in the American Century Investments family of funds, may transfer uninvested cash balances into a joint trading account. These balances are invested in one or more repurchase agreements that are collateralized by U.S. Treasury or Agency obligations.
Segregated Assets — In accordance with the 1940 Act, the fund segregates assets on its books and records to cover certain types of investments, including, but not limited to, futures contracts and short sales. ACIM monitors, on a daily basis, the securities segregated to ensure the fund designates a sufficient amount of liquid assets, marked-to-market daily.The fund may also receive assets or be required to pledge assets at the custodian bank or with a broker for margin requirements on futures contracts and short sales.
Income Tax Status — It is the fund’s policy to distribute substantially all net investment income and net realized gains to shareholders and to otherwise qualify as a regulated investment company under provisions of the Internal Revenue Code. All tax years for the fund remain subject to examination by tax authorities. At this time, management believes there are no uncertain tax positions which, based on their technical merit, would not be sustained upon examination and for which it is reasonably possible that the total amounts of unrecognized tax benefits will significantly change in the next twelve months. Accordingly, no provision has been made for federal or state income taxes.
Distributions to Shareholders — Distributions from net investment income, if any, are generally declared and paid semiannually. Distributions from net realized gains, if any, are generally declared and paid annually.
Indemnifications — Under the corporation’s organizational documents, its officers and directors are indemnified against certain liabilities arising out of the performance of their duties to the fund. In addition, in the normal course of business, the fund enters into contracts that provide general indemnifications. The maximum exposure under these arrangements is unknown as this would involve future claims that may be made against a fund. The risk of material loss from such claims is considered by management to be remote.
Statement of Cash Flows — The beginning of period and end of period cash in the Statement of Cash Flows is the amount of domestic and foreign currency included in the fund’s Statement of Assets and Liabilities and represents the cash on hand at the custodian bank and does not include any short-term investments or deposits with brokers for securities sold short.
3. Fees and Transactions with Related Parties
Management Fees — The corporation has entered into a management agreement with ACIM, under which ACIM provides the fund with investment advisory and management services in exchange for a single, unified management fee (the fee). The agreement provides that all expenses of managing and operating the fund, except distribution and service fees, brokerage expenses, taxes, interest, fees and expenses of the independent directors (including legal counsel fees), and extraordinary expenses, will be paid by ACIM. The fee is computed and accrued daily based on the daily net assets of the fund and paid monthly in arrears. The fee consists of (1) an Investment Category Fee based on the daily net assets of the fund and certain other accounts managed by the investment advisor that are in the same broad investment category as the fund and (2) a Complex Fee based on the assets of all the funds in the American Century Investments family of funds. The rates for the Investment Category Fee range from 0.9680% to 1.1500%. The rates for the Complex Fee range from 0.0500% to 0.1100%. The effective annual management fee for the period December 1, 2011 (fund inception) through June 30, 2012 was 1.11%.
Related Parties — Certain officers and directors of the corporation are also officers and/or directors of American Century Companies, Inc., the parent of the corporation’s investment advisor, ACIM, the distributor of the corporation, American Century Investment Services, Inc., and the corporation’s transfer agent, American Century Services, LLC. The fund is wholly owned, in aggregate, by various funds in a series issued by American Century Asset Allocation Portfolios, Inc. (ACAAP). ACAAP does not invest in the fund for the purpose of exercising management or control.
4. Investment Transactions
Purchases and sales of investment securities and securities sold short, excluding short-term investments, for the period December 1, 2011 (fund inception) through June 30, 2012 were $342,896,578 and $172,330,301, respectively.
5. Fair Value Measurements
The fund’s securities valuation process is based on several considerations and may use multiple inputs to determine the fair value of the positions held by the fund. In conformity with accounting principles generally accepted in the United States of America, the inputs used to determine a valuation are classified into three broad levels as follows:
| • | Level 1 valuation inputs consist of unadjusted quoted prices in an active market for identical securities; |
| • | Level 2 valuation inputs consist of direct or indirect observable market data (including quoted prices for similar securities, evaluations of subsequent market events, interest rates, prepayment speeds, credit risk, etc.); or |
| • | Level 3 valuation inputs consist of unobservable data (including a fund’s own assumptions). |
The level classification is based on the lowest level input that is significant to the fair valuation measurement. The valuation inputs are not necessarily an indication of the risks associated with investing in these securities or other financial instruments.
The following is a summary of the level classifications as of period end. The Schedule of Investments provides additional information on the fund’s portfolio holdings.
| | Level 1 | | Level 2 | | Level 3 |
| Investment Securities | | | | | | | | |
| Domestic Common Stocks | | $220,812,200 | | | | — | | | | — | |
| Foreign Common Stocks | | 19,177,364 | | | | — | | | | — | |
| Temporary Cash Investments | | 351,810 | | | | $915,275 | | | | — | |
| Total Value of Investment Securities | | $240,341,374 | | | | $915,275 | | | | — | |
| | | | | | | | | | | | |
| Securities Sold Short | | | | | | | | | | | |
| Domestic Common Stocks | | $(45,863,516 | ) | | | — | | | | — | |
| Foreign Common Stocks | | (10,101,650 | ) | | | — | | | | — | |
| Total Value of Securities Sold Short | | $(55,965,166 | ) | | | — | | | | — | |
6. Risk Factors
The fund’s investment strategy utilizes leverage, which can increase market exposure and subject the fund to greater risk and higher volatility.
The fund’s investment process may result in high portfolio turnover, which could mean high transaction costs, affecting both performance and capital gains tax liabilities to investors.
The fund is subject to short sales risk. If the market price of a security increases after the fund borrows the security, the fund may suffer a loss when it replaces the borrowed security at the higher price. Any loss will be increased by the amount of compensation, interest or dividends, and transaction costs the fund must pay to the lender of the borrowed security.
If the fund is overweighted in a stock or sector, any negative development related to that stock or sector will have a greater impact on the fund than other funds that are not overweighted in that stock or sector.
There are certain risks involved in investing in foreign securities. These risks include those resulting from future adverse political, social and economic developments, fluctuations in currency exchange rates, the possible imposition of exchange controls, and other foreign laws or restrictions.
7. Federal Tax Information
The tax character of distributions paid during the period December 1, 2011 (fund inception) through June 30, 2012 was as follows:
| | | | |
| | | 2012 | |
| Distributions Paid From | | | |
| Ordinary income | | $62,154 | |
| Long-term capital gains | | — | |
The book-basis character of distributions made during the year from net investment income or net realized gains may differ from their ultimate characterization for federal income tax purposes. These differences reflect the differing character of certain income items and net realized gains and losses for financial statement and tax purposes, and may result in reclassification among certain capital accounts on the financial statements.
As of June 30, 2012, the federal tax cost of investments and the components of distributable earnings on a tax-basis were as follows:
| Federal tax cost of investments | | $230,214,347 | |
| Gross tax appreciation of investments | | $19,266,304 | |
| Gross tax depreciation of investments | | (8,224,002 | ) |
| Net tax appreciation (depreciation) of investments | | $11,042,302 | |
| Net tax appreciation (depreciation) on securities sold short | | $2,898,897 | |
Net tax appreciation (depreciation) on translation of assets and liabilities in foreign currencies | | $120 | |
| Net tax appreciation (depreciation) | | $13,941,319 | |
| Undistributed ordinary income | | $465,551 | |
| Accumulated short-term capital losses | | $(478,234 | ) |
The difference between book-basis and tax-basis cost and unrealized appreciation (depreciation) is attributable primarily to the tax deferral of losses on wash sales.
The accumulated capital losses represent net capital loss carryovers that may be used to offset future realized capital gains for federal income tax purposes. The capital loss carryovers may be carried forward for an unlimited period. Future capital loss carryover utilization in any given year may be subject to Internal Revenue Code limitations.
| For a Share Outstanding Throughout the Period Indicated |
| Per-Share Data | Ratios and Supplemental Data |
| | | Income From Investment Operations: | | | | Ratio to Average Net Assets of: | | |
| | Net Asset Value, Beginning of Period | Net Investment Income (Loss)(1) | Net Realized and Unrealized Gain (Loss) | Total From Investment Operations | Distributions From Net Investment Income | Net Asset Value, End of Period | Total Return(2) | Operating Expenses | Operating Expenses (excluding expenses on securities sold short) | Net Investment Income (Loss) | Portfolio Turnover Rate | Net Assets, End of Period (in thousands) |
| Institutional Class |
2012(3) | $10.00 | 0.03 | 0.92 | 0.95 | —(4) | $10.95 | 9.55% | 1.86%(5) | 1.11%(5) | 0.53%(5) | 81% | $188,648 |
Notes to Financial Highlights
| (1) | Computed using average shares outstanding throughout the period. |
| (2) | Total returns are calculated based on the net asset value of the last business day. Total returns for periods less than one year are not annualized. |
| (3) | December 1, 2011 (fund inception) through June 30, 2012. |
| (4) | Per-share amount was less than $0.005. |
See Notes to Financial Statements.
Report of Independent Registered Public Accounting Firm |
To the Directors of the American Century Quantitative Equity Funds, Inc. and Shareholders of the NT Core Equity Plus Fund:
In our opinion, the accompanying statement of assets and liabilities, including the schedule of investments, and the related statements of operations, of changes in net assets and of cash flows and the financial highlights present fairly, in all material respects, the financial position of the NT Core Equity Plus Fund (one of the fourteen funds comprising the American Century Quantitative Equity Funds, Inc., hereafter referred to as the “Fund”) at June 30, 2012, the results of its operations, the changes in its net assets, its cash flows, and the financial highlights for the period December 1, 2011 (commencement of operations) through June 30, 2012, in conformity with accounting principles generally accepted in the United States of America. These financial statements and financial highlights (hereafter referred to as “financial statements”) are the responsibility of the Fund’s management; our responsibility is to express an opinion on these financial statements based on our audit. We conducted our audit of these financial statements in accordance with the standards of the Public Company Accounting Oversight Board (United States). Those standards require that we plan and perform the audit to obtain reasonable assurance about whether the financial statements are free of material misstatement. An audit includes examining, on a test basis, evidence supporting the amounts and disclosures in the financial statements, assessing the accounting principles used and significant estimates made by management, and evaluating the overall financial statement presentation. We believe that our audit, which included confirmation of securities at June 30, 2012 by correspondence with the custodian and brokers, provides a reasonable basis for our opinion.
PricewaterhouseCoopers LLP
Kansas City, Missouri
August 21, 2012
Board of Directors
The individuals listed below serve as directors of the funds. Each director will continue to serve in this capacity until death, retirement, resignation or removal from office. The mandatory retirement age for directors who are not “interested persons,” as that term is defined in the Investment Company Act (independent directors), is 73. However, the mandatory retirement age may be extended for a period not to exceed two years with the approval of the remaining independent directors.
Mr. Thomas is the only director who is an “interested person” because he currently serves as President and Chief Executive Officer of American Century Companies, Inc. (ACC), the parent company of American Century Investment Management, Inc. (ACIM or the advisor).
The other directors (more than three-fourths of the total number) are independent; that is, they have never been employees, directors or officers of, and have no financial interest in, ACC or any of its wholly owned, direct or indirect, subsidiaries, including ACIM, American Century Investment Services, Inc. (ACIS) and American Century Services, LLC (ACS). The directors serve in this capacity for eight (in the case of Mr. Thomas, 15) registered investment companies in the American Century Investments family of funds.
The following table presents additional information about the directors. The mailing address for each director other than Mr. Thomas is 1665 Charleston Road, Mountain View, California 94043. The mailing address for Mr. Thomas is 4500 Main Street, Kansas City, Missouri 64111.
Name (Year of Birth) | Position(s) Held with Funds | Length of Time Served | | Principal Occupation(s) During Past 5 Years | | Number of American Century Portfolios Overseen by Director | Other Directorships Held During Past 5 Years |
| Independent Directors |
Tanya S. Beder (1955) | Director | Since 2011 | | Chairman, SBCC Group Inc. (investment advisory services)(2006 to present); Fellow in Practice, International Center for Finance, Yale University School of Management (1985 to present) | | 42 | CYS Investments, Inc. (specialty finance company) |
Jeremy I. Bulow (1954) | Director | Since 2011 | | Professor of Economics, Stanford University, Graduate School of Business (1979 to present) | | 42 | None |
Ronald J. Gilson (1946) | Director and Chairman of the Board | Since 1995 | | Charles J. Meyers Professor of Law and Business, Stanford Law School (1979 to present); Marc and Eva Stern Professor of Law and Business, Columbia University School of Law (1992 to present) | | 42 | None |
Name (Year of Birth) | Position(s) Held with Funds | Length of Time Served | | Principal Occupation(s) During Past 5 Years | | Number of American Century Portfolios Overseen by Director | Other Directorships Held During Past 5 Years |
| Independent Directors |
Frederick L. A. Grauer (1946) | Director | Since 2008 | | Senior Advisor, BlackRock, Inc. (investment management firm) (2010 to 2011); Senior Advisor, Barclays Global Investors (investment management firm) (2003 to 2009) | | 42 | None |
Peter F. Pervere (1947) | Director | Since 2007 | | Retired | | 42 | Intraware, Inc. (2003 to 2009) |
Myron S. Scholes (1941) | Director | Since 1980 | | Chairman, Platinum Grove Asset Management, L.P. (asset manager) (1999 to 2009); Frank E. Buck Professor of Finance-Emeritus, Stanford Graduate School of Business (1996 to present) | | 42 | Dimensional Fund Advisors (investment advisor); CME Group, Inc. (futures and options exchange) |
John B. Shoven (1947) | Director | Since 2002 | | Professor of Economics, Stanford University (1973 to present) | | 42 | Cadence Design Systems; Exponent; Financial Engines |
| |
| Interested Director |
Jonathan S. Thomas (1963) | Director and President | Since 2007 | | President and Chief Executive Officer, ACC (March 2007 to present); Chief Administrative Officer, ACC (February 2006 to February 2007); Executive Vice President, ACC (November 2005 to February 2007). Also serves as Chief Executive Officer and Manager, ACS; Executive Vice President, ACIM; Director, ACC, ACIM and other ACC subsidiaries | | 108 | None |
Officers
The following table presents certain information about the executive officers of the funds. Each officer serves as an officer for each of the 15 investment companies in the American Century family of funds, unless otherwise noted. No officer is compensated for his or her service as an officer of the funds. The listed officers are interested persons of the funds and are appointed or re-appointed on an annual basis. The mailing address for each of the officers listed below is 4500 Main Street, Kansas City, Missouri 64111.
| | | | |
Name (Year of Birth) | Offices with the Funds | | Principal Occupation(s) During the Past Five Years |
Jonathan S. Thomas (1963) | Director and President since 2007 | | President and Chief Executive Officer, ACC (March 2007 to present); Chief Administrative Officer, ACC (February 2006 to February 2007); Executive Vice President, ACC (November 2005 to February 2007). Also serves as Chief Executive Officer and Manager, ACS; Executive Vice President, ACIM; Director, ACC, ACIM and other ACC subsidiaries |
Barry Fink (1955) | Executive Vice President since 2007 | | Chief Operating Officer and Executive Vice President, ACC (September 2007 to present); President, ACS (October 2007 to present); Managing Director, Morgan Stanley (2000 to 2007). Also serves as Manager, ACS and Director, ACC and certain ACC subsidiaries |
Maryanne L. Roepke (1956) | Chief Compliance Officer since 2006 and Senior Vice President since 2000 | | Chief Compliance Officer, American Century funds, ACIM and ACS (August 2006 to present). Also serves as Senior Vice President, ACS |
Charles A. Etherington (1957) | General Counsel since 2007 and Senior Vice President since 2006 | | Attorney, ACC (February 1994 to present); Vice President, ACC (November 2005 to present), General Counsel, ACC (March 2007 to present); Also serves as General Counsel, ACIM, ACS, ACIS and other ACC subsidiaries; and Senior Vice President, ACIM and ACS |
C. Jean Wade (1964) | Vice President, Treasurer and Chief Financial Officer since 2012 | | Vice President, ACS (February 2000 to present) |
Robert J. Leach (1966) | Vice President since 2006 and Assistant Treasurer since 2012 | | Vice President, ACS (February 2000 to present) |
David H. Reinmiller (1963) | Vice President since 2001 | | Attorney, ACC (January 1994 to present); Associate General Counsel, ACC (January 2001 to present); Also serves as Vice President, ACIM and ACS |
Ward D. Stauffer (1960) | Secretary since 2005 | | Attorney, ACC (June 2003 to present) |
The Statement of Additional Information has additional information about the fund’s directors and is available without charge, upon request, by calling 1-800-345-2021.
Approval of Management Agreement |
At a meeting held on June 14, 2012, the Fund’s Board of Directors/Trustees unanimously approved the renewal of the management agreement pursuant to which American Century Investment Management, Inc. (the “Advisor”) acts as the investment advisor for the Fund. Under Section 15(c) of the Investment Company Act, contracts for investment advisory services are required to be reviewed, evaluated, and approved by a majority of a fund’s independent directors/trustees (the “Directors”) each year.
As a part of the approval process, the Board requested and reviewed extensive data and information compiled by the Advisor and certain independent providers of evaluation data concerning the Fund and the services provided to the Fund by the Advisor. This review was in addition to the oversight and evaluation undertaken by the Board and its committees on a continuous basis throughout the year and included, but was not limited to the following:
| • | the nature, extent, and quality of investment management, shareholder services, and other services provided by the Advisor to the Fund; |
| • | the wide range of other programs and services the Advisor provides to the Fund and its shareholders on a routine and non-routine basis; |
| • | the investment performance of the fund, including data comparing the Fund’s performance to appropriate benchmarks and/or a peer group of other mutual funds with similar investment objectives and strategies; |
| • | data comparing the cost of owning the Fund to the cost of owning |
| • | the Advisor’s compliance policies, procedures, and regulatory experience; |
| • | financial data showing the cost of services provided to the Fund, the profitability of the Fund to the Advisor, and the overall profitability of the Advisor; |
| • | data comparing services provided and charges to other investment management clients of the Advisor; and |
| • | consideration of collateral benefits derived by the Advisor from the management of the Fund and any potential economies of scale relating thereto. |
In keeping with its practice, the Board held two in-person meetings to review and discuss the information provided. The Board also had the benefit of the advice of its independent counsel throughout the period.
Factors Considered
The Directors considered all of the information provided by the Advisor, the independent data providers, and the Board’s independent counsel, and evaluated such information for the Fund. In connection with their review, the Directors did not identify any single factor as being all-important or controlling, and each Director may have attributed different levels of importance to different factors. In deciding to renew the management agreement, the Board based its decision on a number of factors, including the following:
Nature, Extent and Quality of Services - Generally. Under the management agreement, the Advisor is responsible for providing or arranging for all services necessary for the operation of the Fund. The Board noted that under the management agreement, the Advisor provides or arranges at its own expense a wide variety of services including:
| • | constructing and designing the Fund |
| • | portfolio research and security selection |
| • | initial capitalization/funding |
| • | daily valuation of the Fund’s portfolio |
| • | shareholder servicing and transfer agency, including shareholder |
| • | confirmations, recordkeeping, and communications |
| • | regulatory and portfolio compliance |
| • | marketing and distribution |
The Board noted that many of these services have expanded over time both in terms of quantity and complexity in response to shareholder demands, competition in the industry, changing distribution channels, and the changing regulatory environment.
Investment Management Services. The nature of the investment management services provided to the Fund is quite complex and allows Fund shareholders access to professional money management, instant diversification of their investments within an asset class, the opportunity to easily diversify among asset classes by investing in or exchanging among various American Century Investments funds, and liquidity. In evaluating investment performance, the Board expects the Advisor to manage the Fund in accordance with its investment objectives and approved strategies. Further, the Directors recognize that the Advisor has an obligation to seek the best execution of fund trades. In providing these services, the Advisor utilizes teams of investment professionals (portfolio managers, analysts, research assistants, and securities traders) who require extensive information technology, research, training, compliance and other systems to conduct their business. The Board, directly and through its Portfolio Committee, regularly reviews investment performance information for the Fund, together with comparative information for appropriate benchmarks and/or peer groups of similarly-managed funds, over different time horizons. The Directors also review detailed performance information during the management agreement approval process. If performance concerns are identified, the Fund receives special reviews until performance improves, during which the Board discusses with the Advisor the reasons for such results (e.g., market conditions, security selection) and any efforts being undertaken to improve performance. The Board found the investment management services provided by the Advisor to the Fund to meet or exceed industry standards. More detailed information about the Fund’s performance can be found in the Performance and Portfolio Commentary sections of this report.
Shareholder and Other Services. Under the management agreement, the Advisor provides the Fund with a comprehensive package of transfer agency, shareholder, and other services. The Board, directly and through various committees of the Board, regularly reviews reports and evaluations of such services at its regular meetings. These reports include, but are not limited to, information regarding the operational efficiency and accuracy of the shareholder and transfer agency services provided, staffing levels, shareholder satisfaction (as measured by external as well as internal sources), technology support, new products and
services offered to Fund shareholders, securities trading activities, portfolio valuation services, auditing services, and legal and operational compliance activities. Certain aspects of shareholder and transfer agency service level efficiency and the quality of securities trading activities are measured by independent third party providers and are presented in comparison to other fund groups not managed by the Advisor. The Board found the services provided by the Advisor to the Fund under the management agreement to be competitive and of high quality.
Costs of Services and Profitability. The Advisor provides detailed information concerning its cost of providing various services to the Fund, its profitability in managing the Fund, its overall profitability, and its financial condition. The Directors have reviewed with the Advisor the methodology used to prepare this financial information. The financial information regarding the Advisor is considered in evaluating the Advisor’s financial condition, ability to continue to provide services under the management agreement, and the reasonableness of the current management fee. The Board concluded that the Advisor’s profits were reasonable in light of the services provided to the Fund.
Ethics. The Board generally considers the Advisor’s commitment to providing quality services to shareholders and to conducting its business ethically. They noted that the Advisor’s practices generally meet or exceed industry best practices.
Economies of Scale. The Board also reviewed information provided by the Advisor regarding the possible existence of economies of scale in connection with the management of the Fund. The Board concluded that economies of scale are difficult to measure and predict with precision, especially on a fund-by-fund basis. The Board concluded that the Advisor is appropriately sharing economies of scale through its competitive fee structure, offering competitive fees from fund inception, and through reinvestment in its business to provide shareholders additional content and services.
Comparison to Other Funds’ Fees. The management agreement provides that the Fund pay the Advisor a single, all-inclusive (or unified) management fee for providing all services necessary for the management and operation of the Fund, other than brokerage expenses, taxes, interest, extraordinary expenses, and the fees and expenses of the Fund’s independent directors (including their independent legal counsel) and expenses incurred in connection with the provision of shareholder services and distribution services under a plan adopted pursuant to Rule 12b-1 under the 1940 Act. Under the unified fee structure, the Advisor is responsible for providing all investment advisory, custody, audit, administrative, compliance, recordkeeping, marketing and shareholder services, or arranging and supervising third parties to provide such services. By contrast, most other funds are charged a variety of fees, including an investment advisory fee, a transfer agency fee, an administrative fee, distribution charges and other expenses. Other than their investment advisory fees and any applicable Rule 12b-1 distribution fees, all other components of the total fees charged by these other funds may be increased without shareholder approval. The Board believes the unified fee structure is a benefit to Fund shareholders because it clearly discloses to shareholders the cost of owning Fund shares, and, since the unified fee cannot be increased without a vote of Fund shareholders, it shifts to the Advisor the risk of increased costs of operating the Fund and provides a direct incentive to minimize administrative
inefficiencies. Part of the Board’s analysis of fee levels involves reviewing certain evaluative data compiled by an independent provider and comparing the Fund’s unified fee to the total expense ratio of other funds in the Fund’s peer group. The Board concluded that the management fee paid by the Fund to the Advisor under the management agreement is reasonable in light of the services provided to the Fund.
Comparison to Fees and Services Provided to Other Clients of the Advisor. The Board also requested and received information from the Advisor concerning the nature of the services, fees, costs and profitability of its advisory services to advisory clients other than the Fund. They observed that these varying types of client accounts require different services and involve different regulatory and entrepreneurial risks than the management of the Fund. The Board analyzed this information and concluded that the fees charged and services provided to the Fund were reasonable by comparison.
Collateral or “Fall-Out” Benefits Derived by the Advisor. The Board considered the existence of collateral benefits the Advisor may receive as a result of its relationship with the Fund. They concluded that the Advisor’s primary business is managing mutual funds and it generally does not use fund or shareholder information to generate profits in other lines of business, and therefore does not derive any significant collateral benefits from them. The Board noted that the Advisor receives proprietary research from broker-dealers that execute fund portfolio transactions and concluded that this research is likely to benefit Fund shareholders. The Board also determined that the Advisor is able to provide investment management services to certain clients other than the Fund, at least in part, due to its existing infrastructure built to serve the fund complex. The Board concluded, however, that the assets of those other clients are not material to the analysis and, where applicable, may be included with the assets of the Fund to determine breakpoints in the management fee schedule.
Existing Relationship. The Board also considered whether there was any reason for not continuing the existing arrangement with the Advisor. In this regard, the Board was mindful of the potential disruptions of the Fund’s operations and various risks, uncertainties, and other effects that could occur as a result of a decision not to continue such relationship. In particular, the Board recognized that most shareholders have invested in the Fund on the strength of the Advisor’s industry standing and reputation and in the expectation that the Advisor will have a continuing role in providing advisory services to the Fund.
Conclusion of the Directors. As a result of this process, the Board, including all of the independent directors and assisted by the advice of independent legal counsel, taking into account all of the factors discussed above and the information provided by the Advisor and others, concluded that the management agreement between the Fund and the Advisor is fair and reasonable in light of the services provided and should be renewed.
Retirement Account Information
As required by law, distributions you receive from certain IRAs, or 403(b), 457 and qualified plans are subject to federal income tax withholding, unless you elect not to have withholding apply. Tax will be withheld on the total amount withdrawn even though you may be receiving amounts that are not subject to withholding, such as nondeductible contributions. In such case, excess amounts of withholding could occur. You may adjust your withholding election so that a greater or lesser amount will be withheld.
If you don’t want us to withhold on this amount, you must notify us to not withhold the federal income tax. You may notify us in writing or in certain situations by telephone or through other electronic means. You have the right to revoke your withholding election at any time and any election you make may remain in effect until revoked by filing a new election.
Remember, even if you elect not to have income tax withheld, you are liable for paying income tax on the taxable portion of your withdrawal. If you elect not to have income tax withheld or you don’t have enough income tax withheld, you may be responsible for payment of estimated tax. You may incur penalties under the estimated tax rules if your withholding and estimated tax payments are not sufficient. You can reduce or defer the income tax on a distribution by directly or indirectly rolling such distribution over to another IRA or eligible plan. You should consult your tax advisor for additional information.
State tax will be withheld if, at the time of your distribution, your address is within one of the mandatory withholding states and you have federal income tax withheld. State taxes will be withheld from your distribution in accordance with the respective state rules.
Proxy Voting Guidelines
American Century Investment Management, Inc., the fund’s investment advisor, is responsible for exercising the voting rights associated with the securities purchased and/or held by the fund. A description of the policies and procedures the advisor uses in fulfilling this responsibility is available without charge, upon request, by calling 1-800-345-2021. It is also available on American Century Investments’ website at americancentury.com and on the Securities and Exchange Commission’s website at sec.gov. Information regarding how the investment advisor voted proxies relating to portfolio securities during the most recent 12-month period ended June 30 is available on the “About Us” page at americancentury.com. It is also available at sec.gov.
Quarterly Portfolio Disclosure
The fund files its complete schedule of portfolio holdings with the Securities and Exchange Commission (SEC) for the first and third quarters of each fiscal year on Form N-Q. The fund’s Forms N-Q are available on the SEC’s website at sec.gov, and may be reviewed and copied at the SEC’s Public Reference Room in Washington, DC. Information on the operation of the Public Reference Room may be obtained by calling 1-800-SEC-0330. The fund also makes its complete schedule of portfolio holdings for the most recent quarter of its fiscal year available on its website at americancentury.com and, upon request, by calling 1-800-345-2021.
Other Tax Information
The following information is provided pursuant to provisions of the Internal Revenue Code.
The fund hereby designates up to the maximum amount allowable as qualified dividend income for the fiscal year ended June 30, 2012.
For corporate taxpayers, the fund hereby designates $62,154, or up to the maximum amount allowable, of ordinary income distributions paid during the fiscal year ended June 30, 2012 as qualified for the corporate dividends received deduction.
| Contact Us | americancentury.com |
| Automated Information Line | 1-800-345-8765 |
| Investor Services Representative | 1-800-345-2021 or 816-531-5575 |
| Investors Using Advisors | 1-800-378-9878 |
| Business, Not-For-Profit, Employer-Sponsored Retirement Plans | 1-800-345-3533 |
| Banks and Trust Companies, Broker-Dealers, Financial Professionals, Insurance Companies | 1-800-345-6488 |
| Telecommunications Device for the Deaf | 1-800-634-4113 |
American Century Quantitative Equity Funds, Inc.
Investment Advisor:
American Century Investment Management, Inc.
Kansas City, Missouri
This report and the statements it contains are submitted for the general information of our shareholders. The report is not authorized for distribution to prospective investors unless preceded or accompanied by an effective prospectus.
©2012 American Century Proprietary Holdings, Inc. All rights reserved.
CL-ANN-75848 1208
ANNUAL REPORT JUNE 30, 2012
| | International Core Equity Fund |
| President’s Letter | 2 |
| Market Perspective | 3 |
| Performance | 4 |
| Portfolio Commentary | 6 |
| Fund Characteristics | 8 |
| Shareholder Fee Example | 9 |
| Schedule of Investments | 11 |
| Statement of Assets and Liabilities | 14 |
| Statement of Operations | 15 |
| Statement of Changes in Net Assets | 16 |
| Notes to Financial Statements | 17 |
| Financial Highlights | 23 |
| Report of Independent Registered Public Accounting Firm | 25 |
| Management | 26 |
| Approval of Management Agreement | 29 |
| Additional Information | 34 |
Any opinions expressed in this report reflect those of the author as of the date of the report, and do not necessarily represent the opinions of American Century Investments® or any other person in the American Century Investments organization. Any such opinions are subject to change at any time based upon market or other conditions and American Century Investments disclaims any responsibility to update such opinions. These opinions may not be relied upon as investment advice and, because investment decisions made by American Century Investments funds are based on numerous factors, may not be relied upon as an indication of trading intent on behalf of any American Century Investments fund. Security examples are used for representational purposes only and are not intended as recommendations to purchase or sell securities. Performance information for comparative indices and securities is provided to American Century Investments by third party vendors. To the best of American Century Investments’ knowledge, such information is accurate at the time of printing.
Dear Investor:
Thank you for reviewing this annual report for the period ended June 30, 2012. Our report offers investment performance and portfolio information, presented with the expert perspective of our portfolio management team.
This report remains one of our most important vehicles for conveying information about fund returns, as well as market factors and strategies that affected fund performance. For additional, updated information, we encourage you to visit our website, americancentury.com. Click on the “Fund Performance” and “Insights & News” headings at the top of our Individual Investors site.
Flight to Quality as Economic and Financial Uncertainties Resurfaced
During the second half of 2011 and the first half of 2012, the global economy and financial markets struggled to move beyond the lingering aftereffects of the 2008 Financial Crisis and Great Recession. Global economic fundamentals have improved since 2008, but weakened since 2010, with increased uncertainty surrounding near-term economic growth levels in major developed economies such as the U.S., Japan, and Europe. There were also questions about near-term growth levels in influential emerging economies such as China.
These near-term uncertainties manifested themselves in asset returns for the 12 months ended June 30, 2012. Assets perceived to be “safe-haven” investments rallied—the 30-year U.S. Treasury bond posted a 39% total return. At the other end of the spectrum, international stock returns for U.S. investors were undermined by a combination of risk-averse investing attitudes, weakening global economic growth, and a stronger U.S. dollar versus the euro and currencies of other struggling economies. Commodity prices also plunged during the period.
Unfortunately, the instability that triggered much of this flight-to-quality trading remains largely in place, and the coming months may bring additional uncertainties about the U.S. presidential election and what might happen when various U.S. tax cuts and other stimulative measures expire in 2013 (the so-called “Fiscal Cliff”). In this uncertain, unstable environment, we continue to believe in a disciplined, diversified, long-term investment approach, using both stocks and bonds, as appropriate. We appreciate your continued trust in us during these unsettled times.
Sincerely,
Jonathan Thomas
President and Chief Executive Officer
American Century Investments
By Scott Wittman, Chief Investment Officer,
Quantitative Equity and Asset Allocation
International Stocks Posted Double-Digit Declines
International stocks declined sharply for the 12 months ended June 30, 2012. As the table below illustrates, the broad international stock indices declined by approximately 14% for the reporting period, and emerging markets fell even more.
One of the key factors weighing on international equity markets was a worsening sovereign debt crisis in Europe. As the reporting period began, investors expressed concerns about a possible sovereign debt default in Greece and the spread of the contagion to larger, fiscally troubled European countries such as Italy and Spain. The European authorities eased investor concerns somewhat by providing liquidity to the debt markets and support to the Continent’s banking sector. However, political turmoil in Greece and faltering banks in Spain toward the end of the period rekindled fears of a financial crisis in Europe.
Signs of a global economic slowdown also put downward pressure on international stocks. A number of European countries faced recessions, brought on in part by austerity measures intended to bring fiscal deficits under control. The economic weakness in Europe also impacted fast-growing emerging markets such as China, where exports to Europe and other developed countries are a meaningful component of the economy. Even the U.S. economy, which appeared to pick up steam in late 2011 and early 2012, slowed appreciably by the end of the reporting period.
Stronger U.S. Dollar Also Hurt Returns
With this backdrop, the U.S. dollar strengthened against most major currencies, further weakening international stock returns for U.S. investors. The dollar appreciated by more than 14% versus the euro, 5% against the Australian dollar, and 2% against the British pound. The main exception was the Japanese yen; the dollar declined by about 1% versus the yen for the 12 months.
Pacific Rim Outperformed, While Europe Lagged
Stocks in developed markets modestly outperformed those in emerging markets for the 12-month period. On a geographical basis, Europe suffered the most significant declines—markets in Greece, Portugal, and Spain fell the most, while Ireland and the U.K. held up best. In the Asia/Pacific region, New Zealand and Japan were the best-performing markets, while the Australian market posted the largest decline.
| International Equity Total Returns |
| For the 12 months ended June 30, 2012 (in U.S. dollars) |
| MSCI EAFE Index | -13.83% | | MSCI Europe Index | -16.48% |
| MSCI EAFE Growth Index | -12.56% | | MSCI World Index | -4.98% |
| MSCI EAFE Value Index | -15.16% | | MSCI Japan Index | -7.23% |
| MSCI Emerging Markets Index | -15.95% | | |
| Total Returns as of June 30, 2012 |
| | | | Average Annual Returns | |
| | Ticker Symbol | 1 year | 5 years | Since Inception | Inception Date |
| Investor Class | ACIMX | -15.68% | -7.84% | -4.14% | 11/30/06 |
| MSCI EAFE Index | — | -13.83% | -6.10% | -3.20% | — |
| Institutional Class | ACIUX | -15.59% | -7.66% | -3.94% | 11/30/06 |
A Class No sales charge* With sales charge* | ACIQX | -15.92% -20.73% | -8.08% -9.15% | -4.38% -5.39% | 11/30/06 |
| C Class | ACIKX | -16.62% | -8.76% | -5.09% | 11/30/06 |
| R Class | ACIRX | -16.15% | -8.30% | -4.61% | 11/30/06 |
| • | Sales charges include initial sales charges and contingent deferred sales charges (CDSCs), as applicable. A Class shares have a 5.75% maximum initial sales charge and may be subject to a maximum CDSC of 1.00%. C Class shares redeemed within 12 months of purchase are subject to a maximum CDSC of 1.00%. The SEC requires that mutual funds provide performance information net of maximum sales charges in all cases where charges could be applied. |
Data presented reflect past performance. Past performance is no guarantee of future results. Current performance may be higher or lower than the performance shown. Investment return and principal value will fluctuate, and redemption value may be more or less than original cost. To obtain performance data current to the most recent month end, please call 1-800-345-2021 or visit americancentury.com. International investing involves special risks, such as political instability and currency fluctuations. Investing in emerging markets may accentuate these risks. The fund’s investment process may result in high portfolio turnover, which could mean high transaction costs, affecting both performance and capital gains tax liabilities to investors.
Unless otherwise indicated, performance reflects Investor Class shares; performance for other share classes will vary due to differences in fee structure. For information about other share classes available, please consult the prospectus. Data assumes reinvestment of dividends and capital gains, and none of the charts reflect the deduction of taxes that a shareholder would pay on fund distributions or the redemption of fund shares. Returns for the index are provided for comparison. The fund’s total returns include operating expenses (such as transaction costs and management fees) that reduce returns, while the total returns of the index do not.
| Growth of $10,000 Over Life of Class |
| $10,000 investment made November 30, 2006 |
| * | From 11/30/06, the Investor Class’s inception date. Not annualized. |
| Total Annual Fund Operating Expenses |
| Investor Class | Institutional Class | A Class | C Class | R Class |
| 1.18% | 0.98% | 1.43% | 2.18% | 1.68% |
The total annual fund operating expenses shown is as stated in the fund’s prospectus current as of the date of this report. The prospectus may vary from the expense ratio shown elsewhere in this report because it is based on a different time period, includes acquired fund fees and expenses, and, if applicable, does not include fee waivers or expense reimbursements.
Data presented reflect past performance. Past performance is no guarantee of future results. Current performance may be higher or lower than the performance shown. Investment return and principal value will fluctuate, and redemption value may be more or less than original cost. To obtain performance data current to the most recent month end, please call 1-800-345-2021 or visit americancentury.com. International investing involves special risks, such as political instability and currency fluctuations. Investing in emerging markets may accentuate these risks. The fund’s investment process may result in high portfolio turnover, which could mean high transaction costs, affecting both performance and capital gains tax liabilities to investors.
Unless otherwise indicated, performance reflects Investor Class shares; performance for other share classes will vary due to differences in fee structure. For information about other share classes available, please consult the prospectus. Data assumes reinvestment of dividends and capital gains, and none of the charts reflect the deduction of taxes that a shareholder would pay on fund distributions or the redemption of fund shares. Returns for the index are provided for comparison. The fund’s total returns include operating expenses (such as transaction costs and management fees) that reduce returns, while the total returns of the index do not.
Portfolio Managers: Armando Lacayo and Elizabeth Xie
Performance Summary
International Core Equity returned –15.68%* for the fiscal year ended June 30, 2012, compared with the –13.83% return of the fund’s benchmark, the MSCI EAFE Index.
In a volatile market environment (see page 3 for details), International Core Equity declined for the 12 months and trailed the performance of the MSCI EAFE Index. Individual stock selection was the primary factor behind the underperformance versus the index, particularly in the industrials and consumer discretionary sectors. From a geographical perspective, holdings in Japan, Singapore, and Belgium detracted the most, while stock selection in Germany, France, the U.K., and Australia added the most value.
Absolute Performance Driven by Economically Sensitive Sectors
International Core Equity’s negative absolute return was driven primarily by sharp declines in two of the most economically sensitive sectors of the portfolio—materials and industrials. Notable decliners from these two sectors included Swiss machinery manufacturer Meyer Burger Technology, Australian mining company BHP Billiton Ltd., and German chemicals producer Wacker Chemie.
The fund’s holdings in the utilities and financials sectors also declined meaningfully during the period. Six of the portfolio’s ten largest detractors from absolute performance came from these two sectors. The most significant of these included two banks, Societe Generale of France and ING Groep of the Netherlands, and two electric utilities, Enel of Italy and Endesa of Spain.
On the positive side, the only sector in the portfolio to post a positive return for the 12-month period was consumer staples. The top contributors from this sector included U.K. tobacco producer British American Tobacco and Spanish discount store operator Distribuidora Internacional de Alimentacion. The fund’s health care and telecommunication services stocks also held up well, led by Australian telecom provider Telstra and German pharmaceutical company Bayer.
Industrials Underperformed
Looking at performance versus the MSCI EAFE Index, the fund’s holdings in the industrials sector contributed the most to its underperformance of the index for the 12 months. Stock selection among road and rail companies and machinery manufacturers detracted the most in the industrials sector.
The most significant individual detractor in this sector was Meyer Burger Technology, which produces systems and production lines for the solar, semiconductor, and photovoltaic industries. A sharp decline in demand for solar products led to disappointing earnings results for the company. Other notable decliners in the industrials sector included British rail operator FirstGroup and German airline company Deutsche Lufthansa.
*All fund returns referenced in this commentary are for Investor Class shares.
Consumer Discretionary Also Lagged
International Core Equity’s consumer discretionary stocks underperformed their counterparts in the MSCI EAFE Index for the 12-month period. Stock choices among auto components makers, hotels, and restaurants produced virtually all of the underperformance in the consumer discretionary sector.
The biggest individual detractors in this sector were French auto parts maker Faurecia and the Greek Organization of Football Prognostics (also known as OPAP), which is a lottery system operator in Greece. Faurecia faced slowing car sales and declining automotive production in Europe, while the weak economy in Greece weighed on OPAP’s sales and profits.
Other notable detractors for the 12-month period included Japanese social media and internet company DeNA and Finnish wireless products maker Nokia. DeNA declined after reporting lower-than-expected profits and facing pressure from Japanese regulators to remove gambling elements from its mobile phone games. Nokia reported four consecutive quarters of losses and several rounds of job cuts as the company lost market share in the mobile phone market, particularly among smart phones.
Telecom and Consumer Staples Outperformed
The fund’s holdings in the telecommunication services and consumer staples sectors provided the biggest positive contribution to performance versus the MSCI EAFE Index. Stock selection among diversified telecom providers was responsible for the outperformance in the telecom services sector. The top relative performance contributors in this sector were Australian telecom company Telstra and U.K. telecom provider BT Group. Both Telstra and BT Group benefited from strong subscriber growth in non-traditional telecom services—Telstra in wireless, BT in broadband.
In the consumer staples sector, stock selection among food and staples retailers and an overweight position in tobacco producers generated the bulk of the outperformance. As was the case for absolute performance, the best contributors to relative performance in this sector were British American Tobacco, which benefited from raising prices, and Distribuidora Internacional de Alimentacion, which was spun off by parent company Carrefour and benefited from increased traffic at its discount stores.
Elsewhere in the portfolio, top contributors included Swiss industrial conglomerate OC Oerlikon, Dutch semiconductor manufacturer ASML Holding, and Japanese gaming machine maker Sega Sammy Holdings.
A Look Ahead
As we move into the second half of 2012, we expect international equity markets to remain volatile given the uncertainty regarding the global economic outlook, the European debt situation, and the upcoming U.S. presidential election. Heightened levels of volatility often provide investment opportunities, and our disciplined, objective, and systematic investment strategy is designed to take advantage of these opportunities at the individual company level. We believe this approach is the most powerful way to capitalize on market inefficiencies that lead to the mispricing of individual stocks.
| JUNE 30, 2012 |
| Top Ten Holdings | % of net assets |
BHP Billiton(1) | 3.5% |
| HSBC Holdings plc | 2.7% |
| Roche Holding AG | 2.4% |
| GlaxoSmithKline plc | 2.3% |
| British American Tobacco plc | 2.2% |
| Commonwealth Bank of Australia | 2.1% |
| Total S.A. | 2.0% |
| Sanofi | 2.0% |
| Westpac Banking Corp. | 1.9% |
| Australia & New Zealand Banking Group Ltd. | 1.7% |
(1)Includes shares traded on all exchanges. | |
| | |
| Investments by Country | % of net assets |
| United Kingdom | 21.1% |
| Japan | 20.7% |
| Australia | 9.8% |
| France | 9.0% |
| Switzerland | 7.6% |
| Germany | 7.2% |
| Netherlands | 3.7% |
| Spain | 3.7% |
| Hong Kong | 3.6% |
| Italy | 3.2% |
| Norway | 2.7% |
| Sweden | 2.0% |
| Other Countries | 4.7% |
Cash and Equivalents(2) | 1.0% |
(2)Includes temporary cash investments and other assets and liabilities. | |
| | |
| Types of Investments in Portfolio | % of net assets |
| Foreign Common Stocks | 99.0% |
| Warrants | —(3) |
| Total Equity Exposure | 99.0% |
| Temporary Cash Investments | 0.4% |
| Other Assets and Liabilities | 0.6% |
(3)Category is less than 0.05% of total net assets. | |
Fund shareholders may incur two types of costs: (1) transaction costs, including sales charges (loads) on purchase payments and redemption/exchange fees; and (2) ongoing costs, including management fees; distribution and service (12b-1) fees; and other fund expenses. This example is intended to help you understand your ongoing costs (in dollars) of investing in your fund and to compare these costs with the ongoing cost of investing in other mutual funds.
The example is based on an investment of $1,000 made at the beginning of the period and held for the entire period from January 1, 2012 to June 30, 2012.
Actual Expenses
The table provides information about actual account values and actual expenses for each class. You may use the information, together with the amount you invested, to estimate the expenses that you paid over the period. First, identify the share class you own. Then simply divide your account value by $1,000 (for example, an $8,600 account value divided by $1,000 = 8.6), then multiply the result by the number under the heading “Expenses Paid During Period” to estimate the expenses you paid on your account during this period.
If you hold Investor Class shares of any American Century Investments fund, or Institutional Class shares of the American Century Diversified Bond Fund, in an American Century Investments account (i.e., not a financial intermediary or retirement plan account), American Century Investments may charge you a $12.50 semiannual account maintenance fee if the value of those shares is less than $10,000. We will redeem shares automatically in one of your accounts to pay the $12.50 fee. In determining your total eligible investment amount, we will include your investments in all personal accounts (including American Century Investments Brokerage accounts) registered under your Social Security number. Personal accounts include individual accounts, joint accounts, UGMA/UTMA accounts, personal trusts, Coverdell Education Savings Accounts and IRAs (including traditional, Roth, Rollover, SEP-, SARSEP- and SIMPLE-IRAs), and certain other retirement accounts. If you have only business, business retirement, employer-sponsored or American Century Investments Brokerage accounts, you are currently not subject to this fee. If you are subject to the Account Maintenance Fee, your account value could be reduced by the fee amount.
Hypothetical Example for Comparison Purposes
The table also provides information about hypothetical account values and hypothetical expenses based on the actual expense ratio of each class of your fund and an assumed rate of return of 5% per year before expenses, which is not the actual return of a fund’s share class. The hypothetical account values and expenses may not be used to estimate the actual ending account balance or expenses you paid for the period. You may use this information to compare the ongoing costs of investing in your fund and other funds. To do so, compare this 5% hypothetical example with the 5% hypothetical examples that appear in the shareholder reports of the other funds.
Please note that the expenses shown in the table are meant to highlight your ongoing costs only and do not reflect any transactional costs, such as sales charges (loads) or redemption/exchange fees. Therefore, the table is useful in comparing ongoing costs only, and will not help you determine the relative total costs of owning different funds. In addition, if these transactional costs were included, your costs would have been higher.
| | | | | |
| | Beginning Account Value 1/1/12 | Ending Account Value 6/30/12 | Expenses Paid During Period(1) 1/1/12 - 6/30/12 | Annualized Expense Ratio(1) |
| Actual |
| Investor Class | $1,000 | $1,034.20 | $5.97 | 1.18% |
| Institutional Class | $1,000 | $1,035.70 | $4.96 | 0.98% |
| A Class | $1,000 | $1,032.60 | $7.23 | 1.43% |
| C Class | $1,000 | $1,029.50 | $11.00 | 2.18% |
| R Class | $1,000 | $1,032.70 | $8.49 | 1.68% |
| Hypothetical |
| Investor Class | $1,000 | $1,019.00 | $5.92 | 1.18% |
| Institutional Class | $1,000 | $1,019.99 | $4.92 | 0.98% |
| A Class | $1,000 | $1,017.75 | $7.17 | 1.43% |
| C Class | $1,000 | $1,014.02 | $10.92 | 2.18% |
| R Class | $1,000 | $1,016.51 | $8.42 | 1.68% |
| (1) | Expenses are equal to the class’s annualized expense ratio listed in the table above, multiplied by the average account value over the period, multiplied by 182, the number of days in the most recent fiscal half-year, divided by 366, to reflect the one-half year period. |
| | | Shares | | | Value | |
| Common Stocks — 99.0% | |
| AUSTRALIA — 9.8% | |
| Australia & New Zealand Banking Group Ltd. | | | 4,341 | | | | $98,545 | |
| BHP Billiton Ltd. | | | 3,071 | | | | 100,104 | |
| Commonwealth Bank of Australia | | | 2,212 | | | | 121,055 | |
| Flight Centre Ltd. | | | 1,400 | | | | 27,402 | |
| Iluka Resources Ltd. | | | 450 | | | | 5,273 | |
| National Australia Bank Ltd. | | | 369 | | | | 8,961 | |
| Telstra Corp. Ltd. | | | 19,908 | | | | 75,439 | |
| Western Areas NL | | | 2,645 | | | | 11,092 | |
| Westpac Banking Corp. | | | 4,919 | | | | 107,011 | |
| | | | | | | | 554,882 | |
| AUSTRIA — 1.0% | |
| Oesterreichische Post AG | | | 1,679 | | | | 56,417 | |
| BELGIUM — 0.3% | |
| Anheuser-Busch InBev NV | | | 227 | | | | 17,648 | |
| DENMARK — 0.5% | |
| Novo Nordisk A/S B Shares | | | 202 | | | | 29,224 | |
| FINLAND — 1.5% | |
| Metso Oyj | | | 1,319 | | | | 45,667 | |
| Nokia Oyj | | | 9,105 | | | | 18,756 | |
| Outotec Oyj | | | 239 | | | | 10,961 | |
| UPM-Kymmene Oyj | | | 752 | | | | 8,523 | |
| | | | | | | | 83,907 | |
| FRANCE — 9.0% | |
| AXA SA | | | 1,850 | | | | 24,761 | |
CNP Assurances(1) | | | 2,261 | | | | 27,625 | |
| Euler Hermes SA | | | 988 | | | | 64,045 | |
| France Telecom SA | | | 3,783 | | | | 49,783 | |
| Plastic Omnium SA | | | 1,419 | | | | 35,513 | |
| Sanofi | | | 1,493 | | | | 113,216 | |
| Total S.A. | | | 2,570 | | | | 115,982 | |
| Valeo SA | | | 1,422 | | | | 58,920 | |
| Vinci SA | | | 495 | | | | 23,167 | |
| | | | | | | | 513,012 | |
| GERMANY — 7.2% | |
| Allianz SE | | | 403 | | | | 40,524 | |
| Aurubis AG | | | 1,301 | | | | 62,721 | |
| BASF SE | | | 1,360 | | | | 94,505 | |
| Bayer AG | | | 987 | | | | 71,171 | |
| Bayerische Motoren Werke AG | | | 358 | | | | 25,940 | |
| Duerr AG | | | 211 | | | | 13,006 | |
| Gildemeister AG | | | 346 | | | | 5,449 | |
| Hannover Rueckversicherung AG | | | 247 | | | | 14,666 | |
| Leoni AG | | | 370 | | | | 14,114 | |
| ProSiebenSat.1 Media AG Preference Shares | | | 2,940 | | | | 65,629 | |
| | | | | | | | 407,725 | |
| HONG KONG — 3.6% | |
| BOC Hong Kong Holdings Ltd. | | | 14,000 | | | | 42,995 | |
| Hopewell Holdings Ltd. | | | 20,500 | | | | 58,644 | |
| Link Real Estate Investment Trust (The) | | | 1,500 | | | | 6,133 | |
| MGM China Holdings Ltd. | | | 36,400 | | | | 55,984 | |
| SJM Holdings Ltd. | | | 22,000 | | | | 41,048 | |
| | | | | | | | 204,804 | |
| ISRAEL — 0.7% | |
| Delek Group Ltd. | | | 258 | | | | 38,103 | |
| ITALY — 3.2% | |
| Enel SpA | | | 19,453 | | | | 62,776 | |
| ENI SpA | | | 4,533 | | | | 96,740 | |
| Mediaset SpA | | | 12,334 | | | | 21,579 | |
| | | | | | | | 181,095 | |
| JAPAN — 20.7% | |
| Ajinomoto Co., Inc. | | | 4,000 | | | | 55,608 | |
| Aoyama Trading Co. Ltd. | | | 500 | | | | 10,228 | |
| Central Japan Railway Co. | | | 6 | | | | 47,418 | |
| Daihatsu Motor Co. Ltd. | | | 3,000 | | | | 52,555 | |
| Daito Trust Construction Co. Ltd. | | | 100 | | | | 9,486 | |
| East Japan Railway Co. | | | 400 | | | | 25,114 | |
| Fast Retailing Co. Ltd. | | | 100 | | | | 20,075 | |
| Fujitsu Ltd. | | | 10,000 | | | | 47,917 | |
| INPEX Corp. | | | 12 | | | | 67,276 | |
| Japan Tobacco, Inc. | | | 1,200 | | | | 35,560 | |
| JGC Corp. | | | 2,000 | | | | 57,887 | |
| Kao Corp. | | | 2,800 | | | | 77,224 | |
| KDDI Corp. | | | 5 | | | | 32,252 | |
| Kirin Holdings Co. Ltd. | | | 1,000 | | | | 11,786 | |
| Konica Minolta Holdings, Inc. | | | 8,000 | | | | 63,046 | |
| Lawson, Inc. | | | 900 | | | | 62,966 | |
| Namco Bandai Holdings, Inc. | | | 3,400 | | | | 46,734 | |
| NET One Systems Co. Ltd. | | | 1,800 | | | | 23,958 | |
| Nippon Telegraph & Telephone Corp. | | | 1,600 | | | | 74,339 | |
| NTT Data Corp. | | | 21 | | | | 64,482 | |
| NTT DoCoMo, Inc. | | | 11 | | | | 18,306 | |
| Resona Holdings, Inc. | | | 16,800 | | | | 69,340 | |
| Seven & I Holdings Co. Ltd. | | | 2,400 | | | | $72,315 | |
| Suzuki Motor Corp. | | | 1,600 | | | | 32,797 | |
| Tokyo Ohka Kogyo Co. Ltd. | | | 2,000 | | | | 44,469 | |
| TS Tech Co. Ltd. | | | 2,000 | | | | 36,557 | |
| Unipres Corp. | | | 500 | | | | 13,021 | |
| | | | | | | | 1,172,716 | |
| MACAU — 0.3% | |
| Wynn Macau Ltd. | | | 8,000 | | | | 18,811 | |
| NETHERLANDS — 3.7% | |
| ASML Holding NV | | | 383 | | | | 19,517 | |
| European Aeronautic Defence and Space Co. NV | | | 1,831 | | | | 64,932 | |
| Koninklijke Ahold NV | | | 4,324 | | | | 53,580 | |
| Royal Dutch Shell plc B Shares | | | 1,954 | | | | 68,195 | |
| Unilever NV CVA | | | 129 | | | | 4,318 | |
| | | | | | | | 210,542 | |
| NEW ZEALAND — 0.4% | |
| Telecom Corp. of New Zealand Ltd. | | | 11,333 | | | | 21,763 | |
| NORWAY — 2.7% | |
| Statoil ASA | | | 1,951 | | | | 46,652 | |
| STX OSV Holdings Ltd. | | | 39,000 | | | | 46,548 | |
| TGS Nopec Geophysical Co. ASA | | | 2,288 | | | | 61,669 | |
| | | | | | | | 154,869 | |
| SPAIN — 3.7% | |
| Banco Santander SA | | | 14,223 | | | | 94,992 | |
| Endesa SA | | | 2,196 | | | | 38,514 | |
| Fomento de Construcciones y Contratas SA | | | 1,327 | | | | 16,965 | |
| Mapfre SA | | | 27,997 | | | | 57,068 | |
| | | | | | | | 207,539 | |
| SWEDEN — 2.0% | |
| Billerud AB | | | 6,446 | | | | 59,612 | |
| Hoganas AB B Shares | | | 293 | | | | 9,317 | |
| Intrum Justitia AB | | | 3,275 | | | | 47,699 | |
| | | | | | | | 116,628 | |
| SWITZERLAND — 7.6% | |
| Helvetia Holding AG | | | 203 | | | | 61,352 | |
| Nestle SA | | | 956 | | | | 57,027 | |
| Novartis AG | | | 649 | | | | 36,201 | |
OC Oerlikon Corp. AG(1) | | | 7,015 | | | | 58,270 | |
| Roche Holding AG | | | 803 | | | | 138,620 | |
Swiss Life Holding AG(1) | | | 102 | | | | 9,625 | |
Zurich Financial Services AG(1) | | | 309 | | | | 69,717 | |
| | | | | | | | 430,812 | |
| UNITED KINGDOM — 21.1% | |
| AstraZeneca plc | | | 1,775 | | | | 79,341 | |
| Berendsen plc | | | 3,098 | | | | 24,309 | |
| BHP Billiton plc | | | 3,459 | | | | 98,777 | |
| BP plc | | | 3,065 | | | | 20,536 | |
| British American Tobacco plc | | | 2,490 | | | | 126,737 | |
| BT Group plc | | | 24,677 | | | | 81,802 | |
| Centrica plc | | | 15,842 | | | | 78,975 | |
| Drax Group plc | | | 1,476 | | | | 12,972 | |
| Evraz plc | | | 4,958 | | | | 20,291 | |
| GlaxoSmithKline plc | | | 5,724 | | | | 129,797 | |
| HSBC Holdings plc | | | 17,666 | | | | 155,769 | |
| Imperial Tobacco Group plc | | | 1,415 | | | | 54,445 | |
| London Stock Exchange Group plc | | | 3,119 | | | | 49,135 | |
| Marks & Spencer Group plc | | | 2,502 | | | | 12,791 | |
| Micro Focus International plc | | | 2,990 | | | | 24,913 | |
| Mondi plc | | | 5,959 | | | | 51,092 | |
| Next plc | | | 727 | | | | 36,454 | |
| Petrofac Ltd. | | | 1,480 | | | | 32,355 | |
| Standard Chartered plc | | | 3,667 | | | | 79,944 | |
| Vodafone Group plc | | | 8,721 | | | | 24,503 | |
| | | | | | | | 1,194,938 | |
TOTAL COMMON STOCKS (Cost $5,490,780) | | | | 5,615,435 | |
Warrants† | |
SINGAPORE† | |
Golden Agri-Resources Ltd.(1) (Cost $—) | | | 1,224 | | | | 121 | |
| Temporary Cash Investments — 0.4% | |
Repurchase Agreement, Bank of America Merrill Lynch, (collateralized by various U.S. Treasury obligations, 1.50% - 4.00%, 2/15/15 - 6/30/16, valued at $8,439), in a joint trading account at 0.10%, dated 6/29/12, due 7/2/12 (Delivery value $8,278) | | | | 8,278 | |
Repurchase Agreement, Credit Suisse First Boston, Inc., (collateralized by various U.S. Treasury obligations, 3.75%, 8/15/41, valued at $8,465), in a joint trading account at 0.10%, dated 6/29/12, due 7/2/12 (Delivery value $8,278) | | | | 8,278 | |
Repurchase Agreement, Goldman Sachs & Co., (collateralized by various U.S. Treasury obligations, 4.375%, 5/15/40, valued at $2,108), in a joint trading account at 0.06%, dated 6/29/12, due 7/2/12 (Delivery value $2,070) | | | | $2,070 | |
| SSgA U.S. Government Money Market Fund | | | 7,398 | | | | 7,398 | |
TOTAL TEMPORARY CASH INVESTMENTS (Cost $26,024) | | | | 26,024 | |
TOTAL INVESTMENT SECURITIES — 99.4% (Cost $5,516,804) | | | | 5,641,580 | |
| OTHER ASSETS AND LIABILITIES — 0.6% | | | | 32,230 | |
| TOTAL NET ASSETS — 100.0% | | | | $5,673,810 | |
| Market Sector Diversification | |
| (as a % of net assets) | |
| Financials | | | 21.5 | % |
| Industrials | | | 11.1 | % |
| Consumer Staples | | | 11.1 | % |
| Consumer Discretionary | | | 11.1 | % |
| Health Care | | | 10.5 | % |
| Materials | | | 10.1 | % |
| Energy | | | 9.1 | % |
| Telecommunication Services | | | 6.6 | % |
| Information Technology | | | 4.5 | % |
| Utilities | | | 3.4 | % |
| Cash and Equivalents* | | | 1.0 | % |
| * | Includes temporary cash investments and other assets and liabilities. |
Notes to Schedule of Investments
| CVA = Certificaten Van Aandelen |
| †Category is less than 0.05% of total net assets. |
| (1) Non-income producing. |
See Notes to Financial Statements.
Statement of Assets and Liabilities |
| JUNE 30, 2012 | |
| Assets | |
| Investment securities, at value (cost of $5,516,804) | | | $5,641,580 | |
| Foreign currency holdings, at value (cost of $7,308) | | | 7,318 | |
| Receivable for investments sold | | | 5,785 | |
| Receivable for capital shares sold | | | 888 | |
| Dividends and interest receivable | | | 24,558 | |
| | | | 5,680,129 | |
| | | | | |
| Liabilities | |
| Accrued management fees | | | 5,099 | |
| Distribution and service fees payable | | | 1,220 | |
| | | | 6,319 | |
| | | | | |
| Net Assets | | | $5,673,810 | |
| | | | | |
| Net Assets Consist of: | |
| Capital (par value and paid-in surplus) | | | $9,137,856 | |
| Undistributed net investment income | | | 134,462 | |
| Accumulated net realized loss | | | (3,723,101 | ) |
| Net unrealized appreciation | | | 124,593 | |
| | | | $5,673,810 | |
| | Net assets | Shares outstanding | Net asset value per share |
| Investor Class, $0.01 Par Value | $1,916,653 | 287,880 | $6.66 |
| Institutional Class, $0.01 Par Value | $418,546 | 62,785 | $6.67 |
| A Class, $0.01 Par Value | $1,844,979 | 277,474 | $6.65* |
| C Class, $0.01 Par Value | $698,343 | 105,531 | $6.62 |
| R Class, $0.01 Par Value | $795,289 | 119,825 | $6.64 |
*Maximum offering price $7.06 (net asset value divided by 0.9425).
See Notes to Financial Statements.
| YEAR ENDED JUNE 30, 2012 | |
| Investment Income (Loss) | |
| Income: | | | |
| Dividends (net of foreign taxes withheld of $21,151) | | | $276,604 | |
| Interest | | | 45 | |
| | | | 276,649 | |
| | | | | |
| Expenses: | | | | |
| Management fees | | | 88,188 | |
| Distribution and service fees: | | | | |
| A Class | | | 3,996 | |
| B Class | | | 2,593 | |
| C Class | | | 8,000 | |
| R Class | | | 4,118 | |
| Directors’ fees and expenses | | | 637 | |
| Other expenses | | | 707 | |
| | | | 108,239 | |
| | | | | |
| Net investment income (loss) | | | 168,410 | |
| | | | | |
| Realized and Unrealized Gain (Loss) | |
| Net realized gain (loss) on: | | | | |
| Investment transactions | | | (873,823 | ) |
| Foreign currency transactions | | | (2,613 | ) |
| | | | (876,436 | ) |
| | | | | |
| Change in net unrealized appreciation (depreciation) on: | | | | |
| Investments | | | (641,296 | ) |
| Translation of assets and liabilities in foreign currencies | | | (1,035 | ) |
| | | | (642,331 | ) |
| | | | | |
| Net realized and unrealized gain (loss) | | | (1,518,767 | ) |
| | | | | |
| Net Increase (Decrease) in Net Assets Resulting from Operations | | | $(1,350,357 | ) |
See Notes to Financial Statements.
Statement of Changes in Net Assets |
| YEARS ENDED JUNE 30, 2012 AND JUNE 30, 2011 | |
| Increase (Decrease) in Net Assets | June 30, 2012 | | | June 30, 2011 | |
| Operations | |
| Net investment income (loss) | | $168,410 | | | | $143,810 | |
| Net realized gain (loss) | | (876,436 | ) | | | 509,424 | |
| Change in net unrealized appreciation (depreciation) | | (642,331 | ) | | | 1,236,148 | |
| Net increase (decrease) in net assets resulting from operations | | (1,350,357 | ) | | | 1,889,382 | |
| | | | | | | | |
| Distributions to Shareholders | |
| From net investment income: | | | | | | | |
| Investor Class | | (95,745 | ) | | | (33,781 | ) |
| Institutional Class | | (9,630 | ) | | | (17,082 | ) |
| A Class | | (35,410 | ) | | | (13,012 | ) |
| B Class | | — | | | | (5,748 | ) |
| C Class | | (9,514 | ) | | | (5,426 | ) |
| R Class | | (13,100 | ) | | | (10,040 | ) |
| Decrease in net assets from distributions | | (163,399 | ) | | | (85,089 | ) |
| | | | | | | | |
| Capital Share Transactions | |
| Net increase (decrease) in net assets from capital share transactions | | (584,115 | ) | | | 1,100,849 | |
| | | | | | | | |
| Redemption Fees | |
| Increase in net assets from redemption fees | | 3,364 | | | | 368 | |
| | | | | | | | |
| Net increase (decrease) in net assets | | (2,094,507 | ) | | | 2,905,510 | |
| | | | | | | | |
| Net Assets | |
| Beginning of period | | 7,768,317 | | | | 4,862,807 | |
| End of period | | $5,673,810 | | | | $7,768,317 | |
| | | | | | | | |
| Undistributed net investment income | | $134,462 | | | | $125,170 | |
See Notes to Financial Statements.
Notes to Financial Statements |
JUNE 30, 2012
1. Organization
American Century Quantitative Equity Funds, Inc. (the corporation) is registered under the Investment Company Act of 1940, as amended (the 1940 Act), as an open-end management investment company and is organized as a Maryland corporation. International Core Equity Fund (the fund) is one fund in a series issued by the corporation. The fund is diversified as defined under the 1940 Act. The fund’s investment objective is to seek long-term capital growth. The fund pursues its objective by investing primarily in equity securities of companies located in developed countries, excluding the United States and Canada.
The fund offers the Investor Class, the Institutional Class, the A Class, the C Class and the R Class. The A Class may incur an initial sales charge. The A Class and C Class may be subject to a contingent deferred sales charge. The share classes differ principally in their respective sales charges and distribution and shareholder servicing expenses and arrangements. The Institutional Class is made available to institutional shareholders or through financial intermediaries whose clients do not require the same level of shareholder and administrative services as shareholders of other classes. As a result, the Institutional Class is charged a lower unified management fee. On October 21, 2011, all outstanding B Class shares were converted to A Class shares and the fund discontinued offering the B Class.
2. Significant Accounting Policies
The following is a summary of significant accounting policies consistently followed by the fund in preparation of its financial statements. The financial statements are prepared in conformity with accounting principles generally accepted in the United States of America, which may require management to make certain estimates and assumptions at the date of the financial statements. Actual results could differ from these estimates.
Investment Valuations — The fund determines the fair value of its investments and computes its net asset value per share as of the close of regular trading (usually 4 p.m. Eastern time) on the New York Stock Exchange (NYSE) on each day the NYSE is open.
Equity securities that are listed or traded on a domestic securities exchange are valued at the last reported sales price or at the official closing price as provided by the exchange. Equity securities traded on foreign securities exchanges are typically valued at the closing price on the exchange where primarily traded or as of the close of the NYSE, if that is earlier. If no last sales price is reported, or if local convention or regulation so provides, the mean of the latest bid and asked prices is used. Depending on local convention or regulation, securities traded over-the-counter are valued at the mean of the latest bid and asked prices, the last sales price, or the official closing price. In its determination of fair value, the fund may review several factors including: market information specific to a security; news developments in U.S. and foreign markets; the performance of particular U.S. and foreign securities, indices, comparable securities, American Depositary Receipts, Exchange-Traded Funds, and other relevant market indicators.
Debt securities maturing within 60 days at the time of purchase may be valued at cost, plus or minus any amortized discount or premium or at the evaluated mean as provided by an independent pricing service. Evaluated mean prices are commonly derived through utilization of market models, which may consider, among other factors, trade data, quotations from dealers and active market makers, relevant yield curve and spread data, related sector levels, creditworthiness, and other relevant market information on the same or comparable securities.
Investments in open-end management investment companies are valued at the reported net asset value per share. Repurchase agreements are valued at cost.
The value of investments initially expressed in foreign currencies is translated into U.S. dollars at prevailing exchange rates.
If the fund determines that the market price for a portfolio security is not readily available or the valuation methods mentioned above do not reflect a security’s fair value, such security is valued as determined in good faith by the Board of Directors or its designee, in accordance with procedures adopted by the Board of Directors. Circumstances that may cause the fund to use these procedures to value a security include, but are not limited to: a security has been declared in default; trading in a security has been halted during the trading day; there is a foreign market holiday and no trading occurred; or an event occurred between the close of a foreign exchange and the NYSE that may affect the value of a security.
Security Transactions — Security transactions are accounted for as of the trade date. Net realized gains and losses are determined on the identified cost basis, which is also used for federal income tax purposes.
Investment Income — Dividend income less foreign taxes withheld, if any, is recorded as of the ex-dividend date. Interest income is recorded on the accrual basis and includes accretion of discounts and amortization of premiums.
Foreign Currency Translations — All assets and liabilities initially expressed in foreign currencies are translated into U.S. dollars at prevailing exchange rates at period end. The fund may enter into spot foreign currency exchange contracts to facilitate transactions denominated in a foreign currency. Purchases and sales of investment securities, dividend and interest income, spot foreign currency exchange contracts, and expenses are translated at the rates of exchange prevailing on the respective dates of such transactions. Net realized and unrealized foreign currency exchange gains or losses related to investment securities are a component of net realized gain (loss) on investment transactions and change in net unrealized appreciation (depreciation) on investments, respectively.
Repurchase Agreements — The fund may enter into repurchase agreements with institutions that American Century Investment Management, Inc. (ACIM) (the investment advisor) has determined are creditworthy pursuant to criteria adopted by the Board of Directors. The fund requires that the collateral, represented by securities, received in a repurchase transaction be transferred to the custodian in a manner sufficient to enable the fund to obtain those securities in the event of a default under the repurchase agreement. ACIM monitors, on a daily basis, the securities transferred to ensure the value, including accrued interest, of the securities under each repurchase agreement is equal to or greater than amounts owed to the fund under each repurchase agreement.
Joint Trading Account — Pursuant to an Exemptive Order issued by the Securities and Exchange Commission, the fund, along with certain other funds in the American Century Investments family of funds, may transfer uninvested cash balances into a joint trading account. These balances are invested in one or more repurchase agreements that are collateralized by U.S. Treasury or Agency obligations.
Income Tax Status — It is the fund’s policy to distribute substantially all net investment income and net realized gains to shareholders and to otherwise qualify as a regulated investment company under provisions of the Internal Revenue Code. The fund is no longer subject to examination by tax authorities for years prior to 2009. At this time, management believes there are no uncertain tax positions which, based on their technical merit, would not be sustained upon examination and for which it is reasonably possible that the total amounts of unrecognized tax benefits will significantly change in the next twelve months. Accordingly, no provision has been made for federal or state income taxes.
Multiple Class — All shares of the fund represent an equal pro rata interest in the net assets of the class to which such shares belong, and have identical voting, dividend, liquidation and other rights and the same terms and conditions, except for class specific expenses and exclusive rights to vote on matters affecting only individual classes. Income, non-class specific expenses, and realized and unrealized capital gains and losses of the fund are allocated to each class of shares based on their relative net assets.
Distributions to Shareholders — Distributions from net investment income and net realized gains, if any, are generally declared and paid annually.
Redemption — The fund may impose a 2.00% redemption fee on shares held less than 60 days. The fee may not be applicable to all classes. The redemption fee is retained by the fund and helps cover transaction costs that long-term investors may bear when the fund sells securities to meet investor redemptions.
Indemnifications — Under the corporation’s organizational documents, its officers and directors are indemnified against certain liabilities arising out of the performance of their duties to the fund. In addition, in the normal course of business, the fund enters into contracts that provide general indemnifications. The maximum exposure under these arrangements is unknown as this would involve future claims that may be made against a fund. The risk of material loss from such claims is considered by management to be remote.
3. Fees and Transactions with Related Parties
Management Fees — The corporation has entered into a management agreement with ACIM, under which ACIM provides the fund with investment advisory and management services in exchange for a single, unified management fee (the fee) per class. The agreement provides that all expenses of managing and operating the fund, except distribution and service fees, brokerage expenses, taxes, interest, fees and expenses of the independent directors (including legal counsel fees), and extraordinary expenses, will be paid by ACIM. The fee is computed and accrued daily based on each class’s daily net assets and paid monthly in arrears. The fee consists of (1) an Investment Category Fee based on the daily net assets of the fund and certain other accounts managed by the investment advisor that are in the same broad investment category as the fund and (2) a Complex Fee based on the assets of all the funds in the American Century Investments family of funds. The rates for the Investment Category Fee range from 0.8180% to 1.0000%. The rates for the Complex Fee range from 0.2500% to 0.3100% for the Investor Class, A Class, B Class, C Class and R Class. The Institutional Class is 0.2000% less at each point within the Complex Fee range. The effective annual management fee for each class for the year ended June 30, 2012 was 1.16% for the Investor Class, A Class, C Class and R Class and 0.96% for the Institutional Class.
Distribution and Service Fees — The Board of Directors has adopted a separate Master Distribution and Individual Shareholder Services Plan for each of the A Class, B Class, C Class and R Class (collectively the plans), pursuant to Rule 12b-1 of the 1940 Act. The plans provide that the A Class will pay American Century Investment Services, Inc. (ACIS) an annual distribution and service fee of 0.25%. The plans provide that the B Class and C Class will each pay ACIS an annual distribution and service fee of 1.00%, of which 0.25% is paid for individual shareholder services and 0.75% is paid for distribution services. The plans provide that the R Class will pay ACIS an annual distribution and service fee of 0.50%. The fees are computed and accrued daily based on each class’s daily net assets and paid monthly in arrears. The fees are used to pay financial intermediaries for distribution and individual shareholder services. Fees incurred under the plans during the year ended June 30, 2012 are detailed in the Statement of Operations.
Related Parties — Certain officers and directors of the corporation are also officers and/or directors of American Century Companies, Inc., the parent of the corporation’s investment advisor, ACIM, the distributor of the corporation, ACIS, and the corporation’s transfer agent, American Century Services, LLC. ACIM owns 51% of the outstanding shares of the fund. ACIM does not invest in the fund for the purpose of exercising management or control.
Other Expenses — The fund’s total other expenses include the fees and expenses of the fund’s independent directors and their legal counsel, interest, and other miscellaneous expenses. The impact of total other expenses to the ratio of operating expenses to average net assets was 0.02% for the year ended June 30, 2012.
4. Investment Transactions
Purchases and sales of investment securities, excluding short-term investments, for the year ended June 30, 2012 were $8,601,000 and $9,200,082, respectively.
5. Capital Share Transactions
Transactions in shares of the fund were as follows:
| | Year ended June 30, 2012 | | Year ended June 30, 2011 | |
| | Shares | | Amount | | Shares | | Amount | |
| Investor Class/Shares Authorized | | 50,000,000 | | | | | 50,000,000 | | | |
| Sold | | 466,379 | | | $3,322,640 | | | 188,693 | | | $1,437,705 | |
| Issued in reinvestment of distributions | | 15,272 | | | 95,603 | | | 4,553 | | | 33,738 | |
| Redeemed | | (534,563 | ) | | (3,643,820 | ) | | (102,834 | ) | | (772,539 | ) |
| | | (52,912 | ) | | (225,577 | ) | | 90,412 | | | 698,904 | |
| Institutional Class/Shares Authorized | | 50,000,000 | | | | | | 50,000,000 | | | | |
| Sold | | 2,141 | | | 16,749 | | | 51,117 | | | 384,243 | |
| Issued in reinvestment of distributions | | 1,538 | | | 9,630 | | | 2,305 | | | 17,082 | |
| Redeemed | | (78,660 | ) | | (535,315 | ) | | (25,245 | ) | | (192,070 | ) |
| | | (74,981 | ) | | (508,936 | ) | | 28,177 | | | 209,255 | |
| A Class/Shares Authorized | | 10,000,000 | | | | | | 10,000,000 | | | | |
| Sold | | 189,346 | | | 1,307,866 | | | 25,487 | | | 190,990 | |
| Issued in reinvestment of distributions | | 5,171 | | | 32,369 | | | 1,651 | | | 12,233 | |
| Redeemed | | (43,221 | ) | | (294,767 | ) | | (23,823 | ) | | (174,529 | ) |
| | | 151,296 | | | 1,045,468 | | | 3,315 | | | 28,694 | |
| B Class/Shares Authorized | | N/A | | | | | | 10,000,000 | | | | |
| Sold | | — | | | — | | | 1,180 | | | 8,641 | |
| Issued in reinvestment of distributions | | — | | | — | | | 777 | | | 5,748 | |
| Redeemed | | (116,418 | ) | | (792,308 | ) | | (8 | ) | | (58 | ) |
| | | (116,418 | ) | | (792,308 | ) | | 1,949 | | | 14,331 | |
| C Class/Shares Authorized | | 10,000,000 | | | | | | 10,000,000 | | | | |
| Sold | | 6,487 | | | 45,414 | | | 19,079 | | | 147,616 | |
| Issued in reinvestment of distributions | | 1,491 | | | 9,316 | | | 708 | | | 5,236 | |
| Redeemed | | (21,405 | ) | | (142,155 | ) | | (7,446 | ) | | (59,124 | ) |
| | | (13,427 | ) | | (87,425 | ) | | 12,341 | | | 93,728 | |
| R Class/Shares Authorized | | 10,000,000 | | | | | | 10,000,000 | | | | |
| Sold | | 2,496 | | | 19,245 | | | 10,541 | | | 76,313 | |
| Issued in reinvestment of distributions | | 2,096 | | | 13,100 | | | 1,357 | | | 10,040 | |
| Redeemed | | (7,306 | ) | | (47,682 | ) | | (4,243 | ) | | (30,416 | ) |
| | | (2,714 | ) | | (15,337 | ) | | 7,655 | | | 55,937 | |
| Net increase (decrease) | | (109,156 | ) | | $(584,115 | ) | | 143,849 | | | $1,100,849 | |
6. Fair Value Measurements
The fund’s securities valuation process is based on several considerations and may use multiple inputs to determine the fair value of the positions held by the fund. In conformity with accounting principles generally accepted in the United States of America, the inputs used to determine a valuation are classified into three broad levels as follows:
| • | Level 1 valuation inputs consist of unadjusted quoted prices in an active market for identical securities; |
| • | Level 2 valuation inputs consist of direct or indirect observable market data (including quoted prices for similar securities, evaluations of subsequent market events, interest rates, prepayment speeds, credit risk, etc.); or |
| • | Level 3 valuation inputs consist of unobservable data (including a fund’s own assumptions). |
The level classification is based on the lowest level input that is significant to the fair valuation measurement. The valuation inputs are not necessarily an indication of the risks associated with investing in these securities or other financial instruments.
The following is a summary of the level classifications as of period end. The Schedule of Investments provides additional information on the fund’s portfolio holdings.
| | Level 1 | | Level 2 | | Level 3 |
| Investment Securities | |
| Foreign Common Stocks | | — | | | | $5,615,435 | | | | — | |
| Warrants | | — | | | | 121 | | | | — | |
| Temporary Cash Investments | | $7,398 | | | | 18,626 | | | | — | |
| Total Value of Investment Securities | | $7,398 | | | | $5,634,182 | | | | — | |
7. Risk Factors
There are certain risks involved in investing in foreign securities. These risks include those resulting from future adverse political, social and economic developments, fluctuations in currency exchange rates, the possible imposition of exchange controls, and other foreign laws or restrictions. Investing in emerging markets may accentuate these risks.
The fund’s investment process may result in high portfolio turnover, which could mean high transaction costs, affecting both performance and capital gains tax liabilities to investors.
8. Federal Tax Information
The tax character of distributions paid during the years ended June 30, 2012 and June 30, 2011 were as follows:
| | | 2012 | | 2011 |
| Distributions Paid From | |
| Ordinary income | | | $163,399 | | | | $85,089 | |
| Long-term capital gains | | | — | | | | — | |
The book-basis character of distributions made during the year from net investment income or net realized gains may differ from their ultimate characterization for federal income tax purposes. These differences reflect the differing character of certain income items and net realized gains and losses for financial statement and tax purposes, and may result in reclassification among certain capital accounts on the financial statements.
As of June 30, 2012, the federal tax cost of investments and the components of distributable earnings on a tax-basis were as follows:
| Federal tax cost of investments | | | $5,570,093 | |
| Gross tax appreciation of investments | | | $412,105 | |
| Gross tax depreciation of investments | | | (340,618 | ) |
| Net tax appreciation (depreciation) of investments | | | $71,487 | |
Net tax appreciation (depreciation) on translation of assets and liabilities in foreign currencies | | | $(186 | ) |
| Net tax appreciation (depreciation) | | | $71,301 | |
| Undistributed ordinary income | | | $135,863 | |
| Accumulated short-term capital losses | | | $(3,125,872 | ) |
| Post-October capital loss deferral | | | $(545,338 | ) |
The difference between book-basis and tax-basis cost and unrealized appreciation (depreciation) is attributable primarily to the tax deferral of losses on wash sales and the realization for tax purposes of unrealized gains (losses) on certain foreign currency exchange contracts and investments in passive foreign investment companies.
The accumulated capital losses represent net capital loss carryovers that may be used to offset future realized capital gains for federal income tax purposes. Any unlimited losses will be required to be utilized prior to the losses which carry an expiration date. Future capital loss carryover utilization in any given year may be subject to Internal Revenue Code limitations. Capital loss carryovers expire as follows:
| 2017 | 2018 | Unlimited |
| $(816,093) | $(1,979,923) | $(329,856) |
The loss deferral represents certain qualified losses that the fund has elected to treat as having been incurred in the following fiscal year for federal income tax purposes.
| For a Share Outstanding Throughout the Years Ended June 30 (except as noted) |
| Per-Share Data | Ratios and Supplemental Data |
| | | Income From Investment Operations: | Distributions From: | | | Ratio to Average Net Assets of: | | |
| | Net Asset Value, Beginning of Period | Net Investment Income (Loss)(1) | Net Realized and Unrealized Gain (Loss) | Total From Investment Operations | Net Investment Income | Net Realized Gains | Total Distributions | Net Asset Value, End of Period | Total Return(2) | Operating Expenses | Net Investment Income (Loss) | Portfolio Turnover Rate | Net Assets, End of Period (in thousands) |
| Investor Class |
| 2012 | $8.08 | 0.15 | (1.43) | (1.28) | (0.14) | — | (0.14) | $6.66 | (15.68)% | 1.18% | 2.42% | 113% | $1,917 |
| 2011 | $5.95 | 0.20 | 2.05 | 2.25 | (0.12) | — | (0.12) | $8.08 | 38.09% | 1.18% | 2.53% | 77% | $2,755 |
| 2010 | $5.80 | 0.10 | 0.19 | 0.29 | (0.14) | — | (0.14) | $5.95 | 4.68% | 1.18% | 1.55% | 83% | $1,490 |
| 2009 | $9.72 | 0.20 | (3.87) | (3.67) | (0.25) | — | (0.25) | $5.80 | (37.81)% | 1.17% | 3.09% | 131% | $1,704 |
| 2008 | $11.88 | 0.28 | (1.69) | (1.41) | (0.21) | (0.54) | (0.75) | $9.72 | (12.30)% | 1.16% | 2.50% | 108% | $2,583 |
| Institutional Class |
| 2012 | $8.10 | 0.18 | (1.45) | (1.27) | (0.16) | — | (0.16) | $6.67 | (15.59)% | 0.98% | 2.62% | 113% | $419 |
| 2011 | $5.96 | 0.21 | 2.07 | 2.28 | (0.14) | — | (0.14) | $8.10 | 38.47% | 0.98% | 2.73% | 77% | $1,116 |
| 2010 | $5.81 | 0.11 | 0.19 | 0.30 | (0.15) | — | (0.15) | $5.96 | 4.88% | 0.98% | 1.75% | 83% | $653 |
| 2009 | $9.73 | 0.20 | (3.86) | (3.66) | (0.26) | — | (0.26) | $5.81 | (37.65)% | 0.97% | 3.29% | 131% | $862 |
| 2008 | $11.90 | 0.29 | (1.69) | (1.40) | (0.23) | (0.54) | (0.77) | $9.73 | (12.19)% | 0.96% | 2.70% | 108% | $1,374 |
| A Class |
| 2012 | $8.07 | 0.18 | (1.47) | (1.29) | (0.13) | — | (0.13) | $6.65 | (15.92)% | 1.43% | 2.17% | 113% | $1,845 |
| 2011 | $5.94 | 0.16 | 2.08 | 2.24 | (0.11) | — | (0.11) | $8.07 | 37.80% | 1.43% | 2.28% | 77% | $1,019 |
| 2010 | $5.79 | 0.09 | 0.18 | 0.27 | (0.12) | — | (0.12) | $5.94 | 4.42% | 1.43% | 1.30% | 83% | $730 |
| 2009 | $9.71 | 0.17 | (3.86) | (3.69) | (0.23) | — | (0.23) | $5.79 | (38.00)% | 1.42% | 2.84% | 131% | $903 |
| 2008 | $11.87 | 0.24 | (1.68) | (1.44) | (0.18) | (0.54) | (0.72) | $9.71 | (12.53)% | 1.41% | 2.25% | 108% | $1,485 |
| For a Share Outstanding Throughout the Years Ended June 30 (except as noted) |
| Per-Share Data | Ratios and Supplemental Data |
| | | Income From Investment Operations: | Distributions From: | | | Ratio to Average Net Assets of: | | |
| | Net Asset Value, Beginning of Period | Net Investment Income (Loss)(1) | Net Realized and Unrealized Gain (Loss) | Total From Investment Operations | Net Investment Income | Net Realized Gains | Total Distributions | Net Asset Value, End of Period | Total Return(2) | Operating Expenses | Net Investment Income (Loss) | Portfolio Turnover Rate | Net Assets, End of Period (in thousands) |
| C Class |
| 2012 | $8.04 | 0.11 | (1.45) | (1.34) | (0.08) | — | (0.08) | $6.62 | (16.62)% | 2.18% | 1.42% | 113% | $698 |
| 2011 | $5.92 | 0.11 | 2.06 | 2.17 | (0.05) | — | (0.05) | $8.04 | 36.72% | 2.18% | 1.53% | 77% | $956 |
| 2010 | $5.77 | 0.04 | 0.18 | 0.22 | (0.07) | — | (0.07) | $5.92 | 3.64% | 2.18% | 0.55% | 83% | $631 |
| 2009 | $9.66 | 0.13 | (3.83) | (3.70) | (0.19) | — | (0.19) | $5.77 | (38.34)% | 2.17% | 2.09% | 131% | $742 |
| 2008 | $11.82 | 0.15 | (1.67) | (1.52) | (0.10) | (0.54) | (0.64) | $9.66 | (13.26)% | 2.16% | 1.50% | 108% | $1,156 |
| R Class |
| 2012 | $8.06 | 0.14 | (1.45) | (1.31) | (0.11) | — | (0.11) | $6.64 | (16.15)% | 1.68% | 1.92% | 113% | $795 |
| 2011 | $5.93 | 0.15 | 2.07 | 2.22 | (0.09) | — | (0.09) | $8.06 | 37.52% | 1.68% | 2.03% | 77% | $988 |
| 2010 | $5.78 | 0.08 | 0.17 | 0.25 | (0.10) | — | (0.10) | $5.93 | 4.16% | 1.68% | 1.05% | 83% | $682 |
| 2009 | $9.69 | 0.16 | (3.85) | (3.69) | (0.22) | — | (0.22) | $5.78 | (38.13)% | 1.67% | 2.59% | 131% | $652 |
| 2008 | $11.85 | 0.20 | (1.67) | (1.47) | (0.15) | (0.54) | (0.69) | $9.69 | (12.78)% | 1.66% | 2.00% | 108% | $1,051 |
Notes to Financial Highlights
| (1) | Computed using average shares outstanding throughout the period. |
| (2) | Total returns are calculated based on the net asset value of the last business day and do not reflect applicable sales charges, if any. Total returns for periods less than one year are not annualized. |
See Notes to Financial Statements.
Report of Independent Registered Public Accounting Firm |
To the Directors of the American Century Quantitative Equity Funds, Inc. and Shareholders of the International Core Equity Fund:
In our opinion, the accompanying statement of assets and liabilities, including the schedule of investments, and the related statements of operations and of changes in net assets and the financial highlights present fairly, in all material respects, the financial position of the International Core Equity Fund (one of the fourteen funds comprising the American Century Quantitative Equity Funds, Inc., hereafter referred to as the “Fund”) at June 30, 2012, the results of its operations for the year then ended, the changes in its net assets for each of the two years in the period then ended and the financial highlights for each of the five years in the period then ended, in conformity with accounting principles generally accepted in the United States of America. These financial statements and financial highlights (hereafter referred to as “financial statements”) are the responsibility of the Fund’s management; our responsibility is to express an opinion on these financial statements based on our audits. We conducted our audits of these financial statements in accordance with the standards of the Public Company Accounting Oversight Board (United States). Those standards require that we plan and perform the audit to obtain reasonable assurance about whether the financial statements are free of material misstatement. An audit includes examining, on a test basis, evidence supporting the amounts and disclosures in the financial statements, assessing the accounting principles used and significant estimates made by management, and evaluating the overall financial statement presentation. We believe that our audits, which included confirmation of securities at June 30, 2012 by correspondence with the custodian, provide a reasonable basis for our opinion.
PricewaterhouseCoopers LLP
Kansas City, Missouri
August 21, 2012
Board of Directors
The individuals listed below serve as directors of the funds. Each director will continue to serve in this capacity until death, retirement, resignation or removal from office. The mandatory retirement age for directors who are not “interested persons,” as that term is defined in the Investment Company Act (independent directors), is 73. However, the mandatory retirement age may be extended for a period not to exceed two years with the approval of the remaining independent directors.
Mr. Thomas is the only director who is an “interested person” because he currently serves as President and Chief Executive Officer of American Century Companies, Inc. (ACC), the parent company of American Century Investment Management, Inc. (ACIM or the advisor).
The other directors (more than three-fourths of the total number) are independent; that is, they have never been employees, directors or officers of, and have no financial interest in, ACC or any of its wholly owned, direct or indirect, subsidiaries, including ACIM, American Century Investment Services, Inc. (ACIS) and American Century Services, LLC (ACS). The directors serve in this capacity for eight (in the case of Mr. Thomas, 15) registered investment companies in the American Century Investments family of funds.
The following table presents additional information about the directors. The mailing address for each director other than Mr. Thomas is 1665 Charleston Road, Mountain View, California 94043. The mailing address for Mr. Thomas is 4500 Main Street, Kansas City, Missouri 64111.
Name (Year of Birth) | Position(s) Held with Funds | Length of Time Served | | Principal Occupation(s) During Past 5 Years | | Number of American Century Portfolios Overseen by Director | Other Directorships Held During Past 5 Years |
| Independent Directors |
Tanya S. Beder (1955) | Director | Since 2011 | | Chairman, SBCC Group Inc. (investment advisory services)(2006 to present); Fellow in Practice, International Center for Finance, Yale University School of Management (1985 to present) | | 42 | CYS Investments, Inc. (specialty finance company) |
Jeremy I. Bulow (1954) | Director | Since 2011 | | Professor of Economics, Stanford University, Graduate School of Business (1979 to present) | | 42 | None |
Ronald J. Gilson (1946) | Director and Chairman of the Board | Since 1995 | | Charles J. Meyers Professor of Law and Business, Stanford Law School (1979 to present); Marc and Eva Stern Professor of Law and Business, Columbia University School of Law (1992 to present) | | 42 | None |
Name (Year of Birth) | Position(s) Held with Funds | Length of Time Served | | Principal Occupation(s) During Past 5 Years | | Number of American Century Portfolios Overseen by Director | Other Directorships Held During Past 5 Years |
| Independent Directors |
Frederick L. A. Grauer (1946) | Director | Since 2008 | | Senior Advisor, BlackRock, Inc. (investment management firm) (2010 to 2011); Senior Advisor, Barclays Global Investors (investment management firm) (2003 to 2009) | | 42 | None |
Peter F. Pervere (1947) | Director | Since 2007 | | Retired | | 42 | Intraware, Inc. (2003 to 2009) |
Myron S. Scholes (1941) | Director | Since 1980 | | Chairman, Platinum Grove Asset Management, L.P. (asset manager) (1999 to 2009); Frank E. Buck Professor of Finance-Emeritus, Stanford Graduate School of Business (1996 to present) | | 42 | Dimensional Fund Advisors (investment advisor); CME Group, Inc. (futures and options exchange) |
John B. Shoven (1947) | Director | Since 2002 | | Professor of Economics, Stanford University (1973 to present) | | 42 | Cadence Design Systems; Exponent; Financial Engines |
| |
| Interested Director |
Jonathan S. Thomas (1963) | Director and President | Since 2007 | | President and Chief Executive Officer, ACC (March 2007 to present); Chief Administrative Officer, ACC (February 2006 to February 2007); Executive Vice President, ACC (November 2005 to February 2007). Also serves as Chief Executive Officer and Manager, ACS; Executive Vice President, ACIM; Director, ACC, ACIM and other ACC subsidiaries | | 108 | None |
Officers
The following table presents certain information about the executive officers of the funds. Each officer serves as an officer for each of the 15 investment companies in the American Century family of funds, unless otherwise noted. No officer is compensated for his or her service as an officer of the funds. The listed officers are interested persons of the funds and are appointed or re-appointed on an annual basis. The mailing address for each of the officers listed below is 4500 Main Street, Kansas City, Missouri 64111.
Name (Year of Birth) | | Offices with the Funds | | Principal Occupation(s) During the Past Five Years |
Jonathan S. Thomas (1963) | | Director and President since 2007 | | President and Chief Executive Officer, ACC (March 2007 to present); Chief Administrative Officer, ACC (February 2006 to February 2007); Executive Vice President, ACC (November 2005 to February 2007). Also serves as Chief Executive Officer and Manager, ACS; Executive Vice President, ACIM; Director, ACC, ACIM and other ACC subsidiaries |
Barry Fink (1955) | | Executive Vice President since 2007 | | Chief Operating Officer and Executive Vice President, ACC (September 2007 to present); President, ACS (October 2007 to present); Managing Director, Morgan Stanley (2000 to 2007). Also serves as Manager, ACS and Director, ACC and certain ACC subsidiaries |
Maryanne L. Roepke (1956) | | Chief Compliance Officer since 2006 and Senior Vice President since 2000 | | Chief Compliance Officer, American Century funds, ACIM and ACS (August 2006 to present). Also serves as Senior Vice President, ACS |
Charles A. Etherington (1957) | | General Counsel since 2007 and Senior Vice President since 2006 | | Attorney, ACC (February 1994 to present); Vice President, ACC (November 2005 to present), General Counsel, ACC (March 2007 to present); Also serves as General Counsel, ACIM, ACS, ACIS and other ACC subsidiaries; and Senior Vice President, ACIM and ACS |
C. Jean Wade (1964) | | Vice President, Treasurer and Chief Financial Officer since 2012 | | Vice President, ACS (February 2000 to present) |
Robert J. Leach (1966) | | Vice President since 2006 and Assistant Treasurer since 2012 | | Vice President, ACS (February 2000 to present) |
David H. Reinmiller (1963) | | Vice President since 2001 | | Attorney, ACC (January 1994 to present); Associate General Counsel, ACC (January 2001 to present); Also serves as Vice President, ACIM and ACS |
Ward D. Stauffer (1960) | | Secretary since 2005 | | Attorney, ACC (June 2003 to present) |
The Statement of Additional Information has additional information about the fund’s directors and is available without charge, upon request, by calling 1-800-345-2021.
Approval of Management Agreement |
At a meeting held on June 14, 2012, the Fund’s Board of Directors/Trustees unanimously approved the renewal of the management agreement pursuant to which American Century Investment Management, Inc. (the “Advisor”) acts as the investment advisor for the Fund. Under Section 15(c) of the Investment Company Act, contracts for investment advisory services are required to be reviewed, evaluated, and approved by a majority of a fund’s independent directors/trustees (the “Directors”) each year.
As a part of the approval process, the Board requested and reviewed extensive data and information compiled by the Advisor and certain independent providers of evaluation data concerning the Fund and the services provided to the Fund by the Advisor. This review was in addition to the oversight and evaluation undertaken by the Board and its committees on a continuous basis throughout the year and included, but was not limited to the following:
| • | the nature, extent, and quality of investment management, shareholder services, and other services provided by the Advisor to the Fund; |
| • | the wide range of other programs and services the Advisor provides to the Fund and its shareholders on a routine and non-routine basis; |
| • | the investment performance of the fund, including data comparing the Fund’s performance to appropriate benchmarks and/or a peer group of other mutual funds with similar investment objectives and strategies; |
| • | data comparing the cost of owning the Fund to the cost of owning similar funds; |
| • | the Advisor’s compliance policies, procedures, and regulatory experience; |
| • | financial data showing the cost of services provided to the Fund, the profitability of the Fund to the Advisor, and the overall profitability of the Advisor; |
| • | data comparing services provided and charges to other investment management clients of the Advisor; and |
| • | consideration of collateral benefits derived by the Advisor from the management of the Fund and any potential economies of scale relating thereto. |
In keeping with its practice, the Board held two in-person meetings to review and discuss the information provided. The Board also had the benefit of the advice of its independent counsel throughout the period.
Factors Considered
The Directors considered all of the information provided by the Advisor, the independent data providers, and the Board’s independent counsel, and evaluated such information for the Fund. In connection with their review, the Directors did not identify any single factor as being all-important or controlling, and each Director may have attributed different levels of importance to different factors. In deciding to renew the management agreement, the Board based its decision on a number of factors, including the following:
Nature, Extent and Quality of Services - Generally. Under the management agreement, the Advisor is responsible for providing or arranging for all services necessary for the operation of the Fund. The Board noted that under the management agreement, the Advisor provides or arranges at its own expense a wide variety of services including:
| • | constructing and designing the Fund |
| • | portfolio research and security selection |
| • | initial capitalization/funding |
| • | daily valuation of the Fund’s portfolio |
| • | shareholder servicing and transfer agency, including shareholder confirmations, recordkeeping, and communications |
| • | regulatory and portfolio compliance |
| • | marketing and distribution |
The Board noted that many of these services have expanded over time both in terms of quantity and complexity in response to shareholder demands, competition in the industry, changing distribution channels, and the changing regulatory environment.
Investment Management Services. The nature of the investment management services provided to the Fund is quite complex and allows Fund shareholders access to professional money management, instant diversification of their investments within an asset class, the opportunity to easily diversify among asset classes by investing in or exchanging among various American Century Investments funds, and liquidity. In evaluating investment performance, the Board expects the Advisor to manage the Fund in accordance with its investment objectives and approved strategies. Further, the Directors recognize that the Advisor has an obligation to seek the best execution of fund trades. In providing these services, the Advisor utilizes teams of investment professionals (portfolio managers, analysts, research assistants, and securities traders) who require extensive information technology, research, training, compliance and other systems to conduct their business. The Board, directly and through its Portfolio Committee, regularly reviews investment performance information for the Fund, together with comparative information for appropriate benchmarks and/or peer groups of similarly-managed funds, over different time horizons. The Directors also review
detailed performance information during the management agreement approval process. If performance concerns are identified, the Fund receives special reviews until performance improves, during which the Board discusses with the Advisor the reasons for such results (e.g., market conditions, security selection) and any efforts being undertaken to improve performance. The Board found the investment management services provided by the Advisor to the Fund to meet or exceed industry standards. More detailed information about the Fund’s performance can be found in the Performance and Portfolio Commentary sections of this report.
Shareholder and Other Services. Under the management agreement, the Advisor provides the Fund with a comprehensive package of transfer agency, shareholder, and other services. The Board, directly and through various committees of the Board, regularly reviews reports and evaluations of such services at its regular meetings. These reports include, but are not limited to, information regarding the operational efficiency and accuracy of the shareholder and transfer agency services provided, staffing levels, shareholder satisfaction (as measured by external as well as internal sources), technology support, new products and services offered to Fund shareholders, securities trading activities, portfolio valuation services, auditing services, and legal and operational compliance activities. Certain aspects of shareholder and transfer agency service level efficiency and the quality of securities trading activities are measured by independent third party providers and are presented in comparison to other fund groups not managed by the Advisor. The Board found the services provided by the Advisor to the Fund under the management agreement to be competitive and of high quality.
Costs of Services and Profitability. The Advisor provides detailed information concerning its cost of providing various services to the Fund, its profitability in managing the Fund, its overall profitability, and its financial condition. The Directors have reviewed with the Advisor the methodology used to prepare this financial information. The financial information regarding the Advisor is considered in evaluating the Advisor’s financial condition, ability to continue to provide services under the management agreement, and the reasonableness of the current management fee. The Board concluded that the Advisor’s profits were reasonable in light of the services provided to the Fund.
Ethics. The Board generally considers the Advisor’s commitment to providing quality services to shareholders and to conducting its business ethically. They noted that the Advisor’s practices generally meet or exceed industry best practices.
Economies of Scale. The Board also reviewed information provided by the Advisor regarding the possible existence of economies of scale in connection with the management of the Fund. The Board concluded that economies of scale are difficult to measure and predict with precision, especially on a fund-by-fund basis. The Board concluded that the Advisor is appropriately sharing economies of scale through its competitive fee structure, offering competitive fees from fund inception, and through reinvestment in its business to provide shareholders additional content and services.
Comparison to Other Funds’ Fees. The management agreement provides that the Fund pay the Advisor a single, all-inclusive (or unified) management fee for providing all services necessary for the management and operation of the Fund, other than brokerage expenses, taxes, interest, extraordinary expenses, and the fees and expenses of the Fund’s independent directors (including their independent legal counsel) and expenses incurred in connection with the provision of shareholder services and distribution services under a plan adopted pursuant to Rule 12b-1 under the 1940 Act. Under the unified fee structure, the Advisor is responsible for providing all investment advisory, custody, audit, administrative, compliance, recordkeeping, marketing and shareholder services, or arranging and supervising third parties to provide such services. By contrast, most other funds are charged a variety of fees, including an investment advisory fee, a transfer agency fee, an administrative fee, distribution charges and other expenses. Other than their investment advisory fees and any applicable Rule 12b-1 distribution fees, all other components of the total fees charged by these other funds may be increased without shareholder approval. The Board believes the unified fee structure is a benefit to Fund shareholders because it clearly discloses to shareholders the cost of owning Fund shares, and, since the unified fee cannot be increased without a vote of Fund shareholders, it shifts to the Advisor the risk of increased costs of operating the Fund and provides a direct incentive to minimize administrative inefficiencies. Part of the Board’s analysis of fee levels involves reviewing certain evaluative data compiled by an independent provider and comparing the Fund’s unified fee to the total expense ratio of other funds in the Fund’s peer group. The Board concluded that the management fee paid by the Fund to the Advisor under the management agreement is reasonable in light of the services provided to the Fund.
Comparison to Fees and Services Provided to Other Clients of the Advisor. The Board also requested and received information from the Advisor concerning the nature of the services, fees, costs and profitability of its advisory services to advisory clients other than the Fund. They observed that these varying types of client accounts require different services and involve different regulatory and entrepreneurial risks than the management of the Fund. The Board analyzed this information and concluded that the fees charged and services provided to the Fund were reasonable by comparison.
Collateral or “Fall-Out” Benefits Derived by the Advisor. The Board considered the existence of collateral benefits the Advisor may receive as a result of its relationship with the Fund. They concluded that the Advisor’s primary business is managing mutual funds and it generally does not use fund or shareholder information to generate profits in other lines of business, and therefore does not derive any significant collateral benefits from them. The Board noted that the Advisor receives proprietary research from broker-dealers that execute fund portfolio transactions and concluded that this research is likely to benefit Fund shareholders. The Board also determined that the Advisor is able to provide investment management services to certain clients other than the Fund, at least in part, due to its existing infrastructure built to serve the fund complex. The Board concluded, however, that the assets of those other clients are not material to the analysis and, where applicable, may be included with the assets of the Fund to determine breakpoints in the management fee schedule.
Existing Relationship. The Board also considered whether there was any reason for not continuing the existing arrangement with the Advisor. In this regard, the Board was mindful of the potential disruptions of the Fund’s operations and various risks, uncertainties, and other effects that could occur as a result of a decision not to continue such relationship. In particular, the Board recognized that most shareholders have invested in the Fund on the strength of the Advisor’s industry standing and reputation and in the expectation that the Advisor will have a continuing role in providing advisory services to the Fund.
Conclusion of the Directors. As a result of this process, the Board, including all of the independent directors and assisted by the advice of independent legal counsel, taking into account all of the factors discussed above and the information provided by the Advisor and others, concluded that the management agreement between the Fund and the Advisor is fair and reasonable in light of the services provided and should be renewed.
Retirement Account Information
As required by law, distributions you receive from certain IRAs, or 403(b), 457 and qualified plans are subject to federal income tax withholding, unless you elect not to have withholding apply. Tax will be withheld on the total amount withdrawn even though you may be receiving amounts that are not subject to withholding, such as nondeductible contributions. In such case, excess amounts of withholding could occur. You may adjust your withholding election so that a greater or lesser amount will be withheld.
If you don’t want us to withhold on this amount, you must notify us to not withhold the federal income tax. You may notify us in writing or in certain situations by telephone or through other electronic means. You have the right to revoke your withholding election at any time and any election you make may remain in effect until revoked by filing a new election.
Remember, even if you elect not to have income tax withheld, you are liable for paying income tax on the taxable portion of your withdrawal. If you elect not to have income tax withheld or you don’t have enough income tax withheld, you may be responsible for payment of estimated tax. You may incur penalties under the estimated tax rules if your withholding and estimated tax payments are not sufficient. You can reduce or defer the income tax on a distribution by directly or indirectly rolling such distribution over to another IRA or eligible plan. You should consult your tax advisor for additional information.
State tax will be withheld if, at the time of your distribution, your address is within one of the mandatory withholding states and you have federal income tax withheld. State taxes will be withheld from your distribution in accordance with the respective state rules.
Proxy Voting Guidelines
American Century Investment Management, Inc., the fund’s investment advisor, is responsible for exercising the voting rights associated with the securities purchased and/or held by the fund. A description of the policies and procedures the advisor uses in fulfilling this responsibility is available without charge, upon request, by calling 1-800-345-2021. It is also available on American Century Investments’ website at americancentury.com and on the Securities and Exchange Commission’s website at sec.gov. Information regarding how the investment advisor voted proxies relating to portfolio securities during the most recent 12-month period ended June 30 is available on the “About Us” page at americancentury.com. It is also available at sec.gov.
Quarterly Portfolio Disclosure
The fund files its complete schedule of portfolio holdings with the Securities and Exchange Commission (SEC) for the first and third quarters of each fiscal year on Form N-Q. The fund’s Forms N-Q are available on the SEC’s website at sec.gov, and may be reviewed and copied at the SEC’s Public Reference Room in Washington, DC. Information on the operation of the Public Reference Room may be obtained by calling 1-800-SEC-0330. The fund also makes its complete schedule of portfolio holdings for the most recent quarter of its fiscal year available on its website at americancentury.com and, upon request, by calling 1-800-345-2021.
Other Tax Information
The following information is provided pursuant to provisions of the Internal Revenue Code.
The fund hereby designates up to the maximum amount allowable as qualified dividend income for the fiscal year ended June 30, 2012.
For the fiscal year ended June 30, 2012, the fund intends to pass through to shareholders $21,007, or up to the maximum amount allowable, as a foreign tax credit which represents taxes paid on income derived from sources within foreign countries or possessions of the United States. During the fiscal year ended June 30, 2012, the fund earned $295,492 from income derived from foreign sources. Foreign source income and foreign tax expense per outstanding share on June 30, 2012 are $0.3462 and $0.0246, respectively.
| Contact Us | americancentury.com |
| Automated Information Line | 1-800-345-8765 |
| Investor Services Representative | 1-800-345-2021 or 816-531-5575 |
| Investors Using Advisors | 1-800-378-9878 |
| Business, Not-For-Profit, Employer-Sponsored Retirement Plans | 1-800-345-3533 |
| Banks and Trust Companies, Broker-Dealers, Financial Professionals, Insurance Companies | 1-800-345-6488 |
| Telecommunications Device for the Deaf | 1-800-634-4113 |
American Century Quantitative Equity Funds, Inc.
Investment Advisor:
American Century Investment Management, Inc.
Kansas City, Missouri
This report and the statements it contains are submitted for the general information of our shareholders. The report is not authorized for distribution to prospective investors unless preceded or accompanied by an effective prospectus.
©2012 American Century Proprietary Holdings, Inc. All rights reserved.
CL-ANN-75834 1208
ANNUAL REPORT JUNE 30, 2012
| President’s Letter | 2 |
| Market Perspective | 3 |
| Performance | 4 |
| Portfolio Commentary | 6 |
| Fund Characteristics | 8 |
| Shareholder Fee Example | 9 |
| Schedule of Investments | 11 |
| Statement of Assets and Liabilities | 14 |
| Statement of Operations | 15 |
| Statement of Changes in Net Assets | 16 |
| Notes to Financial Statements | 17 |
| Financial Highlights | 22 |
| Report of Independent Registered Public Accounting Firm | 24 |
| Management | 25 |
| Approval of Management Agreement | 28 |
| Additional Information | 33 |
Any opinions expressed in this report reflect those of the author as of the date of the report, and do not necessarily represent the opinions of American Century Investments® or any other person in the American Century Investments organization. Any such opinions are subject to change at any time based upon market or other conditions and American Century Investments disclaims any responsibility to update such opinions. These opinions may not be relied upon as investment advice and, because investment decisions made by American Century Investments funds are based on numerous factors, may not be relied upon as an indication of trading intent on behalf of any American Century Investments fund. Security examples are used for representational purposes only and are not intended as recommendations to purchase or sell securities. Performance information for comparative indices and securities is provided to American Century Investments by third party vendors. To the best of American Century Investments’ knowledge, such information is accurate at the time of printing.
Dear Investor:
Thank you for reviewing this annual report for the period ended June 30, 2012. Our report offers investment performance and portfolio information, presented with the expert perspective of our portfolio management team.
This report remains one of our most important vehicles for conveying information about fund returns, as well as market factors and strategies that affected fund performance. For additional, updated information, we encourage you to visit our website, americancentury.com. Click on the “Fund Performance” and “Insights & News” headings at the top of our Individual Investors site.
Flight to Quality as Economic and Financial Uncertainties Resurfaced
During the second half of 2011 and the first half of 2012, the global economy and financial markets struggled to move beyond the lingering aftereffects of the 2008 Financial Crisis and Great Recession. Global economic fundamentals have improved since 2008, but weakened since 2010, with increased uncertainty surrounding near-term economic growth levels in major developed economies such as the U.S., Japan, and Europe. There were also questions about near-term growth levels in influential emerging economies such as China.
These near-term uncertainties manifested themselves in asset returns for the 12 months ended June 30, 2012. Assets perceived to be “safe-haven” investments rallied—the 30-year U.S. Treasury bond posted a 39% total return. At the other end of the spectrum, international stock returns for U.S. investors were undermined by a combination of risk-averse investing attitudes, weakening global economic growth, and a stronger U.S. dollar versus the euro and currencies of other struggling economies. Commodity prices also plunged during the period.
Unfortunately, the instability that triggered much of this flight-to-quality trading remains largely in place, and the coming months may bring additional uncertainties about the U.S. presidential election and what might happen when various U.S. tax cuts and other stimulative measures expire in 2013 (the so-called “Fiscal Cliff”). In this uncertain, unstable environment, we continue to believe in a disciplined, diversified, long-term investment approach, using both stocks and bonds, as appropriate. We appreciate your continued trust in us during these unsettled times.
Sincerely,
Jonathan Thomas
President and Chief Executive Officer
American Century Investments
By Scott Wittman, Chief Investment Officer,
Quantitative Equity and Asset Allocation
U.S. Stocks Mixed but Generally Higher
The U.S. stock market faced significant volatility during the 12 months ended June 30, 2012, but ultimately posted positive overall returns. As the reporting period began, stocks were in the midst of an accelerating market decline as evidence of a slowdown in U.S. economic activity and a worsening sovereign debt crisis in Europe put downward pressure on the equity market.
In early October, however, the equity market bottomed and reversed course, enjoying a substantial rebound through the fourth quarter of 2011 and first quarter of 2012. Investors grew more optimistic as signs of improving economic activity quashed recession fears; in particular, job growth consistently exceeded expectations, driving the unemployment rate down to its lowest level in more than three years. Another positive factor was better news out of Europe as the European Central Bank provided long-term financing to the debt markets and support for the Continent’s banking sector.
The final three months of the period brought another reversal as the headwinds facing the equity market at the start of the period returned to the forefront. Evidence of slowing economic activity in the U.S. and adverse developments in Europe—including political turmoil in Greece and troubled banks in Spain—weighed on investor confidence, sending stocks down sharply.
Large-Cap Stocks Outperformed
For the 12-month period, the broad equity indices (as represented by the S&P 500 Index and Russell 3000 Index) rose by 4–5%. As the table below illustrates, however, there was a divergence in returns as large-cap stocks advanced while mid- and small-cap issues declined modestly. Growth and value stocks were mixed—growth issues outperformed among large-cap stocks, while value shares held up better in the mid- and small-cap segments of the market.
From a sector perspective, the defensive sectors of the market fared best. Utilities, consumer staples, and telecommunication services stocks all generated double-digit gains for the reporting period. On the downside, the commodity-driven energy and materials sectors fell the most during the period, reflecting a broad decline in commodity prices.
| U.S. Stock Index Returns |
| For the 12 months ended June 30, 2012 |
| Russell 1000 Index (Large-Cap) | 4.37% | | Russell 2000 Index (Small-Cap) | -2.08% |
| Russell 1000 Growth Index | 5.76% | | Russell 2000 Growth Index | -2.71% |
| Russell 1000 Value Index | 3.01% | | Russell 2000 Value Index | -1.44% |
| Russell Midcap Index | -1.65% | | |
| Russell Midcap Growth Index | -2.99% | | | |
| Russell Midcap Value Index | -0.37% | | | |
| Total Returns as of June 30, 2012 |
| | | | Average Annual Returns | |
| | Ticker Symbol | 1 year | 5 years | 10 years | Since Inception | Inception Date |
| Investor Class | BEQGX | 5.76% | -0.11% | 5.64% | 8.60% | 5/9/91 |
| S&P 500 Index | — | 5.45% | 0.22% | 5.33% | 8.48%(1) | — |
| Institutional Class | AMEIX | 5.97% | 0.09% | 5.85% | 4.37% | 1/2/98 |
A Class(2) No sales charge* With sales charge* | BEQAX | 5.51% -0.55% | -0.35% -1.53% | 5.37% 4.75% | 3.81% 3.40% | 10/9/97 |
| C Class | AEYCX | 4.71% | -1.10% | 4.59% | 2.51% | 7/18/01 |
| R Class | AEYRX | 5.24% | -0.61% | — | 2.47% | 7/29/05 |
| * | Sales charges include initial sales charges and contingent deferred sales charges (CDSCs), as applicable. A Class shares have a 5.75% maximum initial sales charge and may be subject to a maximum CDSC of 1.00%. C Class shares redeemed within 12 months of purchase are subject to a maximum CDSC of 1.00%. The SEC requires that mutual funds provide performance information net of maximum sales charges in all cases where charges could be applied. |
| (1) | Since 4/30/91, the date nearest the Investor Class’s inception for which data are available. |
| (2) | Prior to September 4, 2007, the A Class was referred to as the Advisor Class and did not have a front-end sales charge. Performance prior to that date has been adjusted to reflect this charge. |
Data presented reflect past performance. Past performance is no guarantee of future results. Current performance may be higher or lower than the performance shown. Investment return and principal value will fluctuate, and redemption value may be more or less than original cost. To obtain performance data current to the most recent month end, please call 1-800-345-2021 or visit americancentury.com. International investing involves special risks, such as political instability and currency fluctuations.
Unless otherwise indicated, performance reflects Investor Class shares; performance for other share classes will vary due to differences in fee structure. For information about other share classes available, please consult the prospectus. Data assumes reinvestment of dividends and capital gains, and none of the charts reflect the deduction of taxes that a shareholder would pay on fund distributions or the redemption of fund shares. Returns for the index are provided for comparison. The fund’s total returns include operating expenses (such as transaction costs and management fees) that reduce returns, while the total returns of the index do not.
| Growth of $10,000 Over 10 Years |
| $10,000 investment made June 30, 2002 |
| Total Annual Fund Operating Expenses |
| Investor Class | Institutional Class | A Class | C Class | R Class |
| 0.69% | 0.49% | 0.94% | 1.69% | 1.19% |
The total annual fund operating expenses shown is as stated in the fund’s prospectus current as of the date of this report. The prospectus may vary from the expense ratio shown elsewhere in this report because it is based on a different time period, includes acquired fund fees and expenses, and, if applicable, does not include fee waivers or expense reimbursements.
Data presented reflect past performance. Past performance is no guarantee of future results. Current performance may be higher or lower than the performance shown. Investment return and principal value will fluctuate, and redemption value may be more or less than original cost. To obtain performance data current to the most recent month end, please call 1-800-345-2021 or visit americancentury.com. International investing involves special risks, such as political instability and currency fluctuations.
Unless otherwise indicated, performance reflects Investor Class shares; performance for other share classes will vary due to differences in fee structure. For information about other share classes available, please consult the prospectus. Data assumes reinvestment of dividends and capital gains, and none of the charts reflect the deduction of taxes that a shareholder would pay on fund distributions or the redemption of fund shares. Returns for the index are provided for comparison. The fund’s total returns include operating expenses (such as transaction costs and management fees) that reduce returns, while the total returns of the index do not.
Portfolio Managers: Bill Martin and Claudia Musat
Performance Summary
Equity Growth returned 5.76%* for the fiscal year ended June 30, 2012, compared with the 5.45% return of its benchmark, the S&P 500 Index.
In an up-and-down period for the U.S. stock market (see page 3 for details), Equity Growth posted a solid gain for the 12 months and outperformed the S&P 500. Individual stock selection, a critical element of our investment process, was the key behind the outperformance.
Absolute Performance Driven by Technology and Health Care
Equity Growth’s absolute return for the 12 months was driven primarily by strong returns in the information technology and health care sectors, both of which generated double-digit gains. Four of the fund’s top 10 contributors to absolute performance came from the technology sector—consumer electronics maker Apple, credit card processor Visa, semiconductor manufacturer Intel, and IT services provider International Business Machines. In the health care sector, the best contributors were drug makers Pfizer and Abbott Laboratories.
The fund’s holdings in the telecommunication services sector also fared well. Although telecom services is the smallest sector weighting in the portfolio, it gained more than 20% for the reporting period. Top contributors included diversified telecom providers Verizon Communications and AT&T.
The only three sectors in the portfolio to decline for the 12-month period were the industrials, energy, and materials sectors. Notable detractors included oil refiner Occidental Petroleum and offshore drilling company W&T Offshore in the energy sector, mining companies Freeport-McMoRan Copper & Gold and Coeur d’Alene Mines in the materials sector, and construction and engineering firms KBR and Fluor in the industrials sector.
Health Care Outperformed
Looking at performance versus the S&P 500, the fund’s holdings in the health care sector contributed the most to its outperformance of the index for the 12 months. Stock selection among health care providers and pharmaceutical companies, along with an overweight position in biotechnology stocks, produced the bulk of the outperformance in the health care sector.
The leading relative performance contributor in the health care sector was health care provider WellCare Health Plans, which delivered better-than-expected profits thanks to a strong increase in enrollment and cost reductions resulting from a core systems upgrade. Drug maker Eli Lilly and biotechnology firm Amgen also added value during the period.
Financials and Energy Also Added Value
Stock selection in the financials and energy sectors also contributed favorably to relative results. When comparing fund performance with that of the benchmark index, it is just as important to limit exposure to weaker-performing stocks as it
*All fund returns referenced in this commentary are for Investor Class shares.
is to have heavier weightings in stocks that perform well. In the financials sector, the fund benefited from underweight positions versus the index in financial services providers and capital markets firms, while an underweight position in energy equipment and services stocks contributed to the outperformance in the energy sector.
The best individual contributors in these two sectors were also underweight positions—financial services firm Citigroup, investment bank Goldman Sachs, and energy equipment and services provider Schlumberger. Citigroup and Goldman Sachs continued to struggle with declining net interest margins and problematic loans, while Schlumberger experienced reduced demand as oil prices fell by 11% for the period.
The most important individual investment decision versus the S&P 500 for the reporting period was avoiding diversified technology firm Hewlett-Packard, which fell by more than 40%. The bulk of H-P’s decline occurred early in the period, when narrowing profit margins, a costly acquisition, and a plan to spin-off its PC business into a separate company led to the firing of its CEO.
Consumer Staples and Industrials Detracted
Stock selection in the consumer staples and industrials sectors detracted the most from performance versus the S&P 500 for the 12-month period. Stock choices among food and staples retailers and food products makers produced virtually all of the underperformance in the consumer staples sector. The most notable detractor in this sector was an underweight position in discount retailer Wal-Mart, which exceeded earnings expectations and announced that its new small-store format, Wal-Mart Express, had become profitable in less than a year.
In the industrials sector, an overweight position in construction and engineering firms and stock selection among aerospace and defense companies detracted from relative results. The most significant detractors included aerospace and defense contractor United Technologies and construction and engineering company Fluor. A weaker economy and reduced government spending on defense put downward pressure on United Technologies, while Fluor’s exposure to the oil and gas industry weighed on earnings.
Other noteworthy detractors in the portfolio included auto parts maker TRW Automotive, private education firm ITT Educational Services, and mining company Coeur d’Alene Mines.
A Look Ahead
As we move into the second half of 2012, the U.S. equity market is likely to remain volatile given the uncertainty regarding the economic outlook, the European debt situation, and the upcoming U.S. presidential election. Heightened levels of volatility often provide investment opportunities, and our disciplined, objective, and systematic investment strategy is designed to take advantage of these opportunities at the individual company level. We believe this approach is the most powerful way to capitalize on market inefficiencies that lead to the mispricing of individual stocks.
| JUNE 30, 2012 |
| Top Ten Holdings | % of net assets |
| Apple, Inc. | 3.7% |
| Exxon Mobil Corp. | 2.6% |
| International Business Machines Corp. | 2.5% |
| Chevron Corp. | 2.4% |
| Microsoft Corp. | 2.0% |
| Philip Morris International, Inc. | 1.9% |
| Verizon Communications, Inc. | 1.8% |
| Google, Inc., Class A | 1.7% |
| JPMorgan Chase & Co. | 1.7% |
| Oracle Corp. | 1.6% |
| | |
| Top Five Industries | % of net assets |
| Oil, Gas and Consumable Fuels | 10.5% |
| Pharmaceuticals | 6.7% |
| Insurance | 6.1% |
| Computers and Peripherals | 4.9% |
| IT Services | 4.6% |
| | |
| Types of Investments in Portfolio | % of net assets |
| Domestic Common Stocks | 90.5% |
| Foreign Common Stocks* | 8.7% |
| Total Common Stocks | 99.2% |
| Temporary Cash Investments | 0.9% |
| Other Assets and Liabilities | (0.1)% |
*Includes depositary shares, dual listed securities and foreign ordinary shares.
Fund shareholders may incur two types of costs: (1) transaction costs, including sales charges (loads) on purchase payments and redemption/exchange fees; and (2) ongoing costs, including management fees; distribution and service (12b-1) fees; and other fund expenses. This example is intended to help you understand your ongoing costs (in dollars) of investing in your fund and to compare these costs with the ongoing cost of investing in other mutual funds.
The example is based on an investment of $1,000 made at the beginning of the period and held for the entire period from January 1, 2012 to June 30, 2012.
Actual Expenses
The table provides information about actual account values and actual expenses for each class. You may use the information, together with the amount you invested, to estimate the expenses that you paid over the period. First, identify the share class you own. Then simply divide your account value by $1,000 (for example, an $8,600 account value divided by $1,000 = 8.6), then multiply the result by the number under the heading “Expenses Paid During Period” to estimate the expenses you paid on your account during this period.
If you hold Investor Class shares of any American Century Investments fund, or Institutional Class shares of the American Century Diversified Bond Fund, in an American Century Investments account (i.e., not a financial intermediary or retirement plan account), American Century Investments may charge you a $12.50 semiannual account maintenance fee if the value of those shares is less than $10,000. We will redeem shares automatically in one of your accounts to pay the $12.50 fee. In determining your total eligible investment amount, we will include your investments in all personal accounts (including American Century Investments Brokerage accounts) registered under your Social Security number. Personal accounts include individual accounts, joint accounts, UGMA/UTMA accounts, personal trusts, Coverdell Education Savings Accounts and IRAs (including traditional, Roth, Rollover, SEP-, SARSEP- and SIMPLE-IRAs), and certain other retirement accounts. If you have only business, business retirement, employer-sponsored or American Century Investments Brokerage accounts, you are currently not subject to this fee. If you are subject to the Account Maintenance Fee, your account value could be reduced by the fee amount.
Hypothetical Example for Comparison Purposes
The table also provides information about hypothetical account values and hypothetical expenses based on the actual expense ratio of each class of your fund and an assumed rate of return of 5% per year before expenses, which is not the actual return of a fund’s share class. The hypothetical account values and expenses may not be used to estimate the actual ending account balance or expenses you paid for the period. You may use this information to compare the ongoing costs of investing in your fund and other funds. To do so, compare this 5% hypothetical example with the 5% hypothetical examples that appear in the shareholder reports of the other funds.
Please note that the expenses shown in the table are meant to highlight your ongoing costs only and do not reflect any transactional costs, such as sales charges (loads) or redemption/exchange fees. Therefore, the table is useful in comparing ongoing costs only, and will not help you determine the relative total costs of owning different funds. In addition, if these transactional costs were included, your costs would have been higher.
| | Beginning Account Value 1/1/12 | Ending Account Value 6/30/12 | Expenses Paid During Period(1) 1/1/12 – 6/30/12 | Annualized Expense Ratio(1) |
| Actual |
| Investor Class | $1,000 | $1,093.90 | $3.54 | 0.68% |
| Institutional Class | $1,000 | $1,094.80 | $2.50 | 0.48% |
| A Class | $1,000 | $1,092.30 | $4.84 | 0.93% |
| C Class | $1,000 | $1,088.30 | $8.72 | 1.68% |
| R Class | $1,000 | $1,091.00 | $6.13 | 1.18% |
| Hypothetical | | | | |
| Investor Class | $1,000 | $1,021.48 | $3.42 | 0.68% |
| Institutional Class | $1,000 | $1,022.48 | $2.41 | 0.48% |
| A Class | $1,000 | $1,020.24 | $4.67 | 0.93% |
| C Class | $1,000 | $1,016.51 | $8.42 | 1.68% |
| R Class | $1,000 | $1,019.00 | $5.92 | 1.18% |
| (1) | Expenses are equal to the class’s annualized expense ratio listed in the table above, multiplied by the average account value over the period, multiplied by 182, the number of days in the most recent fiscal half-year, divided by 366, to reflect the one-half year period. |
JUNE 30, 2012
| | | Shares | | | Value | |
| Common Stocks — 99.2% | |
| AEROSPACE AND DEFENSE — 2.7% | |
| Boeing Co. (The) | | | 49,073 | | | | $3,646,124 | |
| Northrop Grumman Corp. | | | 266,384 | | | | 16,992,635 | |
| Raytheon Co. | | | 206,351 | | | | 11,677,403 | |
| United Technologies Corp. | | | 307,058 | | | | 23,192,091 | |
| | | | | | | | 55,508,253 | |
| AIR FREIGHT AND LOGISTICS — 2.1% | |
| FedEx Corp. | | | 191,632 | | | | 17,555,408 | |
| United Parcel Service, Inc., Class B | | | 324,095 | | | | 25,525,722 | |
| | | | | | | | 43,081,130 | |
| BEVERAGES — 2.2% | |
| Coca-Cola Co. (The) | | | 177,308 | | | | 13,863,712 | |
Constellation Brands, Inc., Class A(1) | | | 693,087 | | | | 18,754,934 | |
Monster Beverage Corp.(1) | | | 144,165 | | | | 10,264,548 | |
| PepsiCo, Inc. | | | 49,766 | | | | 3,516,466 | |
| | | | | | | | 46,399,660 | |
| BIOTECHNOLOGY — 1.7% | |
| Amgen, Inc. | | | 329,958 | | | | 24,100,132 | |
Biogen Idec, Inc.(1) | | | 5,780 | | | | 834,517 | |
United Therapeutics Corp.(1) | | | 219,448 | | | | 10,836,342 | |
| | | | | | | | 35,770,991 | |
| CHEMICALS — 3.5% | |
| CF Industries Holdings, Inc. | | | 98,091 | | | | 19,004,150 | |
| Huntsman Corp. | | | 425,782 | | | | 5,509,619 | |
| LyondellBasell Industries NV, Class A | | | 333,533 | | | | 13,431,374 | |
| Monsanto Co. | | | 266,582 | | | | 22,067,658 | |
| NewMarket Corp. | | | 10,971 | | | | 2,376,319 | |
| PPG Industries, Inc. | | | 90,369 | | | | 9,589,958 | |
| | | | | | | | 71,979,078 | |
| COMMERCIAL BANKS — 3.2% | |
| Bank of Montreal | | | 236,914 | | | | 13,091,868 | |
| BB&T Corp. | | | 395,893 | | | | 12,213,299 | |
| U.S. Bancorp | | | 759,371 | | | | 24,421,371 | |
| Wells Fargo & Co. | | | 470,442 | | | | 15,731,581 | |
| | | | | | | | 65,458,119 | |
| COMMUNICATIONS EQUIPMENT — 0.4% | |
Brocade Communications Systems, Inc.(1) | | | 624,622 | | | | 3,079,387 | |
| Cisco Systems, Inc. | | | 123,370 | | | | 2,118,263 | |
| QUALCOMM, Inc. | | | 56,149 | | | | 3,126,376 | |
Research In Motion Ltd.(1) | | | 85,375 | | | | 630,921 | |
| | | | | | | | 8,954,947 | |
| COMPUTERS AND PERIPHERALS — 4.9% | |
Apple, Inc.(1) | | | 130,395 | | | | 76,150,680 | |
| Seagate Technology plc | | | 541,202 | | | | 13,383,925 | |
Western Digital Corp.(1) | | | 406,983 | | | | 12,404,842 | |
| | | | | | | | 101,939,447 | |
| CONSTRUCTION AND ENGINEERING — 1.3% | |
| Chicago Bridge & Iron Co. NV New York Shares | | | 366,554 | | | | 13,914,390 | |
| URS Corp. | | | 377,766 | | | | 13,176,478 | |
| | | | | | | | 27,090,868 | |
| CONSUMER FINANCE — 1.6% | |
| American Express Co. | | | 413,451 | | | | 24,066,983 | |
| Cash America International, Inc. | | | 191,666 | | | | 8,440,971 | |
| Discover Financial Services | | | 30,866 | | | | 1,067,346 | |
| | | | | | | | 33,575,300 | |
| DIVERSIFIED CONSUMER SERVICES — 0.8% | |
Apollo Group, Inc., Class A(1) | | | 18,098 | | | | 654,967 | |
Coinstar, Inc.(1) | | | 110,284 | | | | 7,572,099 | |
ITT Educational Services, Inc.(1) | | | 130,550 | | | | 7,930,913 | |
| | | | | | | | 16,157,979 | |
| DIVERSIFIED FINANCIAL SERVICES — 2.0% | |
| Bank of America Corp. | | | 703,316 | | | | 5,753,125 | |
| Citigroup, Inc. | | | 56,607 | | | | 1,551,598 | |
| JPMorgan Chase & Co. | | | 961,231 | | | | 34,344,783 | |
| | | | | | | | 41,649,506 | |
| DIVERSIFIED TELECOMMUNICATION SERVICES — 2.7% | |
| AT&T, Inc. | | | 550,002 | | | | 19,613,071 | |
| Verizon Communications, Inc. | | | 822,654 | | | | 36,558,744 | |
| | | | | | | | 56,171,815 | |
| ELECTRIC UTILITIES — 0.7% | |
| American Electric Power Co., Inc. | | | 270,811 | | | | 10,805,359 | |
| Cleco Corp. | | | 94,624 | | | | 3,958,122 | |
| | | | | | | | 14,763,481 | |
| ELECTRONIC EQUIPMENT, INSTRUMENTS AND COMPONENTS — 0.4% | |
Tech Data Corp.(1) | | | 151,649 | | | | 7,304,932 | |
| ENERGY EQUIPMENT AND SERVICES — 0.7% | |
Helix Energy Solutions Group, Inc.(1) | | | 752,636 | | | | 12,350,757 | |
| Schlumberger Ltd. | | | 25,034 | | | | 1,624,957 | |
| | | | | | | | 13,975,714 | |
| | | Shares | | | Value | |
FOOD AND STAPLES RETAILING — 0.7% | | | | | | | | |
| CVS Caremark Corp. | | | 122,696 | | | | $5,733,584 | |
| Kroger Co. (The) | | | 95,954 | | | | 2,225,173 | |
| SUPERVALU, Inc. | | | 44,911 | | | | 232,639 | |
| Wal-Mart Stores, Inc. | | | 79,771 | | | | 5,561,634 | |
| | | | | | | | 13,753,030 | |
| FOOD PRODUCTS — 3.3% | |
| Archer-Daniels-Midland Co. | | | 554,566 | | | | 16,370,788 | |
| Bunge Ltd. | | | 153,694 | | | | 9,642,762 | |
| Campbell Soup Co. | | | 377,889 | | | | 12,613,935 | |
| ConAgra Foods, Inc. | | | 568,150 | | | | 14,732,130 | |
| Tyson Foods, Inc., Class A | | | 739,098 | | | | 13,917,215 | |
| | | | | | | | 67,276,830 | |
| HEALTH CARE EQUIPMENT AND SUPPLIES — 0.7% | |
| Covidien plc | | | 86,159 | | | | 4,609,506 | |
| Medtronic, Inc. | | | 234,493 | | | | 9,081,914 | |
| | | | | | | | 13,691,420 | |
| HEALTH CARE PROVIDERS AND SERVICES — 3.0% | |
| Humana, Inc. | | | 195,408 | | | | 15,132,396 | |
| McKesson Corp. | | | 189,817 | | | | 17,795,344 | |
| UnitedHealth Group, Inc. | | | 424,071 | | | | 24,808,153 | |
| WellPoint, Inc. | | | 77,844 | | | | 4,965,669 | |
| | | | | | | | 62,701,562 | |
| HOTELS, RESTAURANTS AND LEISURE — 1.2% | |
| Brinker International, Inc. | | | 217,923 | | | | 6,945,206 | |
| McDonald’s Corp. | | | 21,008 | | | | 1,859,838 | |
| Yum! Brands, Inc. | | | 237,648 | | | | 15,309,284 | |
| | | | | | | | 24,114,328 | |
| HOUSEHOLD DURABLES — 0.5% | |
| Garmin Ltd. | | | 240,919 | | | | 9,224,788 | |
| HOUSEHOLD PRODUCTS — 0.8% | |
| Kimberly-Clark Corp. | | | 21,612 | | | | 1,810,437 | |
| Procter & Gamble Co. (The) | | | 242,818 | | | | 14,872,603 | |
| | | | | | | | 16,683,040 | |
| INDUSTRIAL CONGLOMERATES — 1.5% | |
| General Electric Co. | | | 977,604 | | | | 20,373,267 | |
| Tyco International Ltd. | | | 182,550 | | | | 9,647,768 | |
| | | | | | | | 30,021,035 | |
| INSURANCE — 6.1% | |
| ACE Ltd. | | | 136,184 | | | | 10,095,320 | |
| Allied World Assurance Co. Holdings AG | | | 196,736 | | | | 15,634,610 | |
| American Financial Group, Inc. | | | 43,927 | | | | 1,723,256 | |
| Assurant, Inc. | | | 157,808 | | | | 5,498,031 | |
Berkshire Hathaway, Inc., Class B(1) | | | 111,480 | | | | 9,289,628 | |
| Everest Re Group Ltd. | | | 126,805 | | | | 13,123,049 | |
| Loews Corp. | | | 388,419 | | | | 15,890,221 | |
| Marsh & McLennan Cos., Inc. | | | 513,944 | | | | 16,564,415 | |
| Principal Financial Group, Inc. | | | 579,451 | | | | 15,199,000 | |
| Protective Life Corp. | | | 87,905 | | | | 2,585,286 | |
| Prudential Financial, Inc. | | | 351,260 | | | | 17,011,522 | |
| Validus Holdings Ltd. | | | 132,923 | | | | 4,257,524 | |
| | | | | | | | 126,871,862 | |
INTERNET AND CATALOG RETAIL† | |
| Expedia, Inc. | | | 15,414 | | | | 740,951 | |
| INTERNET SOFTWARE AND SERVICES — 1.7% | |
Google, Inc., Class A(1) | | | 61,241 | | | | 35,524,067 | |
| IT SERVICES — 4.6% | |
| Accenture plc, Class A | | | 314,509 | | | | 18,898,846 | |
| International Business Machines Corp. | | | 261,846 | | | | 51,211,841 | |
| Visa, Inc., Class A | | | 204,124 | | | | 25,235,850 | |
| | | | | | | | 95,346,537 | |
| LIFE SCIENCES TOOLS AND SERVICES — 1.0% | |
| Agilent Technologies, Inc. | | | 379,704 | | | | 14,899,585 | |
Life Technologies Corp.(1) | | | 134,499 | | | | 6,051,110 | |
| | | | | | | | 20,950,695 | |
| MACHINERY — 2.1% | |
| Actuant Corp., Class A | | | 79,588 | | | | 2,161,610 | |
| Cummins, Inc. | | | 167,310 | | | | 16,214,012 | |
| Parker-Hannifin Corp. | | | 179,293 | | | | 13,784,046 | |
| Sauer-Danfoss, Inc. | | | 313,310 | | | | 10,943,918 | |
| | | | | | | | 43,103,586 | |
| MEDIA — 3.3% | |
| CBS Corp., Class B | | | 602,031 | | | | 19,734,576 | |
| Comcast Corp., Class A | | | 604,633 | | | | 19,330,117 | |
| DISH Network Corp., Class A | | | 491,087 | | | | 14,020,534 | |
| Regal Entertainment Group Class A | | | 982,946 | | | | 13,525,337 | |
| Viacom, Inc., Class B | | | 38,520 | | | | 1,811,210 | |
| | | | | | | | 68,421,774 | |
| METALS AND MINING — 1.3% | |
Coeur d’Alene Mines Corp.(1) | | | 636,755 | | | | 11,181,418 | |
| Southern Copper Corp. | | | 58,409 | | | | 1,840,467 | |
| Teck Resources Ltd. | | | 432,618 | | | | 13,385,201 | |
| | | | | | | | 26,407,086 | |
| MULTI-UTILITIES — 2.2% | |
| Ameren Corp. | | | 383,619 | | | | 12,866,581 | |
| Consolidated Edison, Inc. | | | 260,712 | | | | 16,213,680 | |
| Public Service Enterprise Group, Inc. | | | 501,534 | | | | 16,299,855 | |
| | | | | | | | 45,380,116 | |
| | | Shares | | | Value | |
| MULTILINE RETAIL — 1.4% | | | | | | | | |
| Dillard’s, Inc., Class A | | | 201,515 | | | | $12,832,475 | |
| Macy’s, Inc. | | | 476,121 | | | | 16,354,757 | |
| | | | | | | | 29,187,232 | |
| OIL, GAS AND CONSUMABLE FUELS — 10.5% | |
| Apache Corp. | | | 119,549 | | | | 10,507,162 | |
| Chevron Corp. | | | 461,507 | | | | 48,688,988 | |
| ConocoPhillips | | | 419,127 | | | | 23,420,817 | |
| Energy XXI Bermuda Ltd. | | | 433,766 | | | | 13,572,538 | |
| Exxon Mobil Corp. | | | 622,880 | | | | 53,299,842 | |
| Marathon Petroleum Corp. | | | 413,063 | | | | 18,554,790 | |
| Occidental Petroleum Corp. | | | 292,480 | | | | 25,086,010 | |
Phillips 66(1) | | | 105,701 | | | | 3,513,501 | |
| Suncor Energy, Inc. | | | 456,634 | | | | 13,219,554 | |
| Western Refining, Inc. | | | 365,464 | | | | 8,138,883 | |
| | | | | | | | 218,002,085 | |
| PERSONAL PRODUCTS — 0.5% | |
| Nu Skin Enterprises, Inc., Class A | | | 228,764 | | | | 10,729,032 | |
| PHARMACEUTICALS — 6.7% | |
| Abbott Laboratories | | | 489,144 | | | | 31,535,113 | |
| Eli Lilly & Co. | | | 503,524 | | | | 21,606,215 | |
| Johnson & Johnson | | | 470,725 | | | | 31,802,181 | |
| Merck & Co., Inc. | | | 540,928 | | | | 22,583,744 | |
| Pfizer, Inc. | | | 1,380,957 | | | | 31,762,011 | |
| | | | | | | | 139,289,264 | |
| REAL ESTATE INVESTMENT TRUSTS (REITs) — 1.1% | |
| American Tower Corp. | | | 6,101 | | | | 426,521 | |
| Post Properties, Inc. | | | 25,625 | | | | 1,254,344 | |
| Simon Property Group, Inc. | | | 139,059 | | | | 21,645,924 | |
| | | | | | | | 23,326,789 | |
| ROAD AND RAIL — 1.1% | |
| Union Pacific Corp. | | | 189,690 | | | | 22,631,914 | |
| SEMICONDUCTORS AND SEMICONDUCTOR EQUIPMENT — 2.7% | |
Advanced Micro Devices, Inc.(1) | | | 2,378,211 | | | | 13,627,149 | |
| Applied Materials, Inc. | | | 589,262 | | | | 6,752,943 | |
| Intel Corp. | | | 803,479 | | | | 21,412,715 | |
| KLA-Tencor Corp. | | | 303,102 | | | | 14,927,773 | |
| | | | | | | | 56,720,580 | |
| SOFTWARE — 4.6% | |
| CA, Inc. | | | 199,111 | | | | 5,393,917 | |
Cadence Design Systems, Inc.(1) | | | 5,859 | | | | 64,390 | |
| Intuit, Inc. | | | 9,448 | | | | 560,739 | |
| Microsoft Corp. | | | 1,342,191 | | | | 41,057,623 | |
| Oracle Corp. | | | 1,132,082 | | | | 33,622,835 | |
Symantec Corp.(1) | | | 967,570 | | | | 14,136,198 | |
| | | | | | | | 94,835,702 | |
| SPECIALTY RETAIL — 3.8% | |
| Best Buy Co., Inc. | | | 749,969 | | | | 15,719,350 | |
| Foot Locker, Inc. | | | 445,482 | | | | 13,622,839 | |
| GameStop Corp., Class A | | | 82,829 | | | | 1,520,740 | |
| Home Depot, Inc. (The) | | | 557,739 | | | | 29,554,590 | |
O’Reilly Automotive, Inc.(1) | | | 29,393 | | | | 2,462,252 | |
| PetSmart, Inc. | | | 236,298 | | | | 16,110,798 | |
| | | | | | | | 78,990,569 | |
| TOBACCO — 1.9% | |
| Philip Morris International, Inc. | | | 441,110 | | | | 38,491,259 | |
TOTAL COMMON STOCKS (Cost $1,708,032,255) | | | | 2,052,198,353 | |
| Temporary Cash Investments — 0.9% | |
Repurchase Agreement, Bank of America Merrill Lynch, (collateralized by various U.S. Treasury obligations, 1.50% - 4.00%, 2/15/15 - 6/30/16, valued at $5,702,935), in a joint trading account at 0.10%, dated 6/29/12, due 7/2/12 (Delivery value $5,594,323) | | | | 5,594,276 | |
Repurchase Agreement, Credit Suisse First Boston, Inc., (collateralized by various U.S. Treasury obligations, 3.75%, 8/15/41 valued at $5,720,662), in a joint trading account at 0.10%, dated 6/29/12, due 7/2/12 (Delivery value $5,594,323) | | | | 5,594,276 | |
Repurchase Agreement, Goldman Sachs & Co., (collateralized by various U.S. Treasury obligations, 4.375%, 5/15/40, valued at $1,424,632), in a joint trading account at 0.06%, dated 6/29/12, due 7/2/12 (Delivery value $1,398,576) | | | | 1,398,569 | |
| SSgA U.S. Government Money Market Fund | | | 4,891,193 | | | | 4,891,193 | |
TOTAL TEMPORARY CASH INVESTMENTS (Cost $17,478,314) | | | | 17,478,314 | |
TOTAL INVESTMENT SECURITIES — 100.1% (Cost $1,725,510,569) | | | | 2,069,676,667 | |
| OTHER ASSETS AND LIABILITIES — (0.1)% | | | | (1,385,328 | ) |
| TOTAL NET ASSETS — 100.0% | | | | $2,068,291,339 | |
Notes to Schedule of Investments
| † | Category is less than 0.05% of total net assets. |
See Notes to Financial Statements.
Statement of Assets and Liabilities |
| JUNE 30, 2012 | |
| Assets | |
| Investment securities, at value (cost of $1,725,510,569) | | | $2,069,676,667 | |
| Cash | | | 108,414 | |
| Receivable for capital shares sold | | | 1,343,337 | |
| Dividends and interest receivable | | | 2,160,445 | |
| | | | 2,073,288,863 | |
| | | | | |
| Liabilities | | | | |
| Payable for capital shares redeemed | | | 3,875,723 | |
| Accrued management fees | | | 1,077,251 | |
| Distribution and service fees payable | | | 44,550 | |
| | | | 4,997,524 | |
| | | | | |
| Net Assets | | | $2,068,291,339 | |
| | | | | |
| Net Assets Consist of: | | | | |
| Capital (par value and paid-in surplus) | | | $2,004,738,596 | |
| Undistributed net investment income | | | 1,641,878 | |
| Accumulated net realized loss | | | (282,256,198 | ) |
| Net unrealized appreciation | | | 344,167,063 | |
| | | | $2,068,291,339 | |
| | Net assets | Shares outstanding | Net asset value per share |
| Investor Class, $0.01 Par Value | $1,654,130,033 | 71,000,956 | $23.30 |
| Institutional Class, $0.01 Par Value | $216,801,726 | 9,300,662 | $23.31 |
| A Class, $0.01 Par Value | $183,498,052 | 7,882,439 | $23.28* |
| C Class, $0.01 Par Value | $7,013,180 | 303,150 | $23.13 |
| R Class, $0.01 Par Value | $6,848,348 | 294,007 | $23.29 |
*Maximum offering price $24.70 (net asset value divided by 0.9425)
See Notes to Financial Statements.
| YEAR ENDED JUNE 30, 2012 | |
| Investment Income (Loss) | |
| Income: | | | |
| Dividends (net of foreign taxes withheld of $93,436) | | | $43,317,746 | |
| Interest | | | 12,448 | |
| | | | 43,330,194 | |
| | | | | |
| Expenses: | | | | |
| Management fees | | | 12,775,344 | |
| Distribution and service fees: | | | | |
| A Class | | | 432,113 | |
| B Class | | | 227 | |
| C Class | | | 64,281 | |
| R Class | | | 29,824 | |
| Directors’ fees and expenses | | | 109,390 | |
| Other expenses | | | 42 | |
| | | | 13,411,221 | |
| | | | | |
| Net investment income (loss) | | | 29,918,973 | |
| | | | | |
| Realized and Unrealized Gain (Loss) | | | | |
| Net realized gain (loss) on: | | | | |
| Investment transactions | | | 75,662,339 | |
| Foreign currency transactions | | | (6,253 | ) |
| | | | 75,656,086 | |
| | | | | |
| Change in net unrealized appreciation (depreciation) on: | | | | |
| Investments | | | 414,046 | |
| Translation of assets and liabilities in foreign currencies | | | 965 | |
| | | | 415,011 | |
| | | | | |
| Net realized and unrealized gain (loss) | | | 76,071,097 | |
| | | | | |
| Net Increase (Decrease) in Net Assets Resulting from Operations | | | $105,990,070 | |
See Notes to Financial Statements.
Statement of Changes in Net Assets |
| YEARS ENDED JUNE 30, 2012 AND JUNE 30, 2011 | |
| Increase (Decrease) in Net Assets | June 30, 2012 | | | June 30, 2011 | |
| Operations | |
| Net investment income (loss) | | $29,918,973 | | | | $25,425,492 | |
| Net realized gain (loss) | | 75,656,086 | | | | 177,707,264 | |
| Change in net unrealized appreciation (depreciation) | | 415,011 | | | | 343,999,660 | |
| Net increase (decrease) in net assets resulting from operations | | 105,990,070 | | | | 547,132,416 | |
| | | | | | | | |
| Distributions to Shareholders | | | | | | | |
| From net investment income: | | | | | | | |
| Investor Class | | (23,667,137 | ) | | | (19,018,126 | ) |
| Institutional Class | | (3,489,986 | ) | | | (3,152,156 | ) |
| A Class | | (2,212,441 | ) | | | (2,209,907 | ) |
| B Class | | (72 | ) | | | (199 | ) |
| C Class | | (35,349 | ) | | | (14,581 | ) |
| R Class | | (62,251 | ) | | | (33,422 | ) |
| Decrease in net assets from distributions | | (29,467,236 | ) | | | (24,428,391 | ) |
| | | | | | | | |
| Capital Share Transactions | | | | | | | |
| Net increase (decrease) in net assets from capital share transactions | | (18,326,490 | ) | | | (334,916,277 | ) |
| | | | | | | | |
| Net increase (decrease) in net assets | | 58,196,344 | | | | 187,787,748 | |
| | | | | | | | |
| Net Assets | | | | | | | |
| Beginning of period | | 2,010,094,995 | | | | 1,822,307,247 | |
| End of period | | $2,068,291,339 | | | | $2,010,094,995 | |
| | | | | | | | |
| Undistributed net investment income | | $1,641,878 | | | | $1,339,385 | |
See Notes to Financial Statements.
Notes to Financial Statements |
JUNE 30, 2012
1. Organization
American Century Quantitative Equity Funds, Inc. (the corporation) is registered under the Investment Company Act of 1940, as amended (the 1940 Act), as an open-end management investment company and is organized as a Maryland corporation. Equity Growth Fund (the fund) is one fund in a series issued by the corporation. The fund is diversified as defined under the 1940 Act. The fund’s investment objective is to seek long-term capital growth. The fund pursues its objective by investing primarily in large capitalization common stocks.
The fund offers the Investor Class, the Institutional Class, the A Class, the C Class and the R Class. The A Class may incur an initial sales charge. The A Class and C Class may be subject to a contingent deferred sales charge. The share classes differ principally in their respective sales charges and distribution and shareholder servicing expenses and arrangements. The Institutional Class is made available to institutional shareholders or through financial intermediaries whose clients do not require the same level of shareholder and administrative services as shareholders of other classes. As a result, the Institutional Class is charged a lower unified management fee. On October 21, 2011, all outstanding B Class shares were converted to A Class shares and the fund discontinued offering the B Class.
2. Significant Accounting Policies
The following is a summary of significant accounting policies consistently followed by the fund in preparation of its financial statements. The financial statements are prepared in conformity with accounting principles generally accepted in the United States of America, which may require management to make certain estimates and assumptions at the date of the financial statements. Actual results could differ from these estimates.
Investment Valuations — The fund determines the fair value of its investments and computes its net asset value per share as of the close of regular trading (usually 4 p.m. Eastern time) on the New York Stock Exchange (NYSE) on each day the NYSE is open.
Equity securities that are listed or traded on a domestic securities exchange are valued at the last reported sales price or at the official closing price as provided by the exchange. Equity securities traded on foreign securities exchanges are typically valued at the closing price on the exchange where primarily traded or as of the close of the NYSE, if that is earlier. If no last sales price is reported, or if local convention or regulation so provides, the mean of the latest bid and asked prices is used. Depending on local convention or regulation, securities traded over-the-counter are valued at the mean of the latest bid and asked prices, the last sales price, or the official closing price. In its determination of fair value, the fund may review several factors including: market information specific to a security; news developments in U.S. and foreign markets; the performance of particular U.S. and foreign securities, indices, comparable securities, American Depositary Receipts, Exchange-Traded Funds, and other relevant market indicators.
Debt securities maturing within 60 days at the time of purchase may be valued at cost, plus or minus any amortized discount or premium or at the evaluated mean as provided by an independent pricing service. Evaluated mean prices are commonly derived through utilization of market models, which may consider, among other factors, trade data, quotations from dealers and active market makers, relevant yield curve and spread data, related sector levels, creditworthiness, and other relevant market information on the same or comparable securities.
Investments in open-end management investment companies are valued at the reported net asset value per share. Repurchase agreements are valued at cost.
The value of investments initially expressed in foreign currencies is translated into U.S. dollars at prevailing exchange rates.
If the fund determines that the market price for a portfolio security is not readily available or the valuation methods mentioned above do not reflect a security’s fair value, such security is valued as determined in good faith by the Board of Directors or its designee, in accordance with procedures adopted by the Board of Directors. Circumstances that may cause the fund to use these procedures to value a security include, but are not limited to: a security has been declared in default; trading in a security has been halted during the trading day; there is a foreign market holiday and no trading occurred; or an event occurred between the close of a foreign exchange and the NYSE that may affect the value of a security.
Security Transactions — Security transactions are accounted for as of the trade date. Net realized gains and losses are determined on the identified cost basis, which is also used for federal income tax purposes.
Investment Income — Dividend income less foreign taxes withheld, if any, is recorded as of the ex-dividend date. Interest income is recorded on the accrual basis and includes accretion of discounts and amortization of premiums.
Foreign Currency Translations — All assets and liabilities initially expressed in foreign currencies are translated into U.S. dollars at prevailing exchange rates at period end. The fund may enter into spot foreign currency exchange contracts to facilitate transactions denominated in a foreign currency. Purchases and sales of investment securities, dividend and interest income, spot foreign currency exchange contracts, and expenses are translated at the rates of exchange prevailing on the respective dates of such transactions. Net realized and unrealized foreign currency exchange gains or losses related to investment securities are a component of net realized gain (loss) on investment transactions and change in net unrealized appreciation (depreciation) on investments, respectively.
Repurchase Agreements — The fund may enter into repurchase agreements with institutions that American Century Investment Management, Inc. (ACIM) (the investment advisor) has determined are creditworthy pursuant to criteria adopted by the Board of Directors. The fund requires that the collateral, represented by securities, received in a repurchase transaction be transferred to the custodian in a manner sufficient to enable the fund to obtain those securities in the event of a default under the repurchase agreement. ACIM monitors, on a daily basis, the securities transferred to ensure the value, including accrued interest, of the securities under each repurchase agreement is equal to or greater than amounts owed to the fund under each repurchase agreement.
Joint Trading Account — Pursuant to an Exemptive Order issued by the Securities and Exchange Commission, the fund, along with certain other funds in the American Century Investments family of funds, may transfer uninvested cash balances into a joint trading account. These balances are invested in one or more repurchase agreements that are collateralized by U.S. Treasury or Agency obligations.
Income Tax Status — It is the fund’s policy to distribute substantially all net investment income and net realized gains to shareholders and to otherwise qualify as a regulated investment company under provisions of the Internal Revenue Code. The fund is no longer subject to examination by tax authorities for years prior to 2009. At this time, management believes there are no uncertain tax positions which, based on their technical merit, would not be sustained upon examination and for which it is reasonably possible that the total amounts of unrecognized tax benefits will significantly change in the next twelve months. Accordingly, no provision has been made for federal or state income taxes.
Multiple Class — All shares of the fund represent an equal pro rata interest in the net assets of the class to which such shares belong, and have identical voting, dividend, liquidation and other rights and the same terms and conditions, except for class specific expenses and exclusive rights to vote on matters affecting only individual classes. Income, non-class specific expenses, and realized and unrealized capital gains and losses of the fund are allocated to each class of shares based on their relative net assets.
Distributions to Shareholders — Distributions from net investment income, if any, are generally declared and paid quarterly. Distributions from net realized gains, if any, are generally declared and paid annually.
Indemnifications — Under the corporation’s organizational documents, its officers and directors are indemnified against certain liabilities arising out of the performance of their duties to the fund. In addition, in the normal course of business, the fund enters into contracts that provide general indemnifications. The maximum exposure under these arrangements is unknown as this would involve future claims that may be made against a fund. The risk of material loss from such claims is considered by management to be remote.
3. Fees and Transactions with Related Parties
Management Fees — The corporation has entered into a management agreement with ACIM, under which ACIM provides the fund with investment advisory and management services in exchange for a single, unified management fee (the fee) per class. The agreement provides that all expenses of managing and operating the fund, except distribution and service fees, brokerage expenses, taxes, interest, fees and expenses of the independent directors (including legal counsel fees), and extraordinary expenses, will be paid by ACIM. The fee is computed and accrued daily based on each class’s daily net assets and paid monthly in arrears. The fee consists of (1) an Investment Category Fee based on the daily net assets of the fund and certain other accounts managed by the investment advisor that are in the same broad investment category as the fund and (2) a Complex Fee based on the assets of all the funds in the American Century Investments family of funds. The rates for the Investment Category Fee range from 0.3380% to 0.5200%. The rates for the Complex Fee range from 0.2500% to 0.3100% for the Investor Class, A Class, B Class, C Class and R Class. The Institutional Class is 0.2000% less at each point within the Complex Fee range. The effective annual management fee for each class for the year ended June 30, 2012 was 0.68% for the Investor Class, A Class, C Class and R Class and 0.48% for the Institutional Class.
Distribution and Service Fees — The Board of Directors has adopted a separate Master Distribution and Individual Shareholder Services Plan for each of the A Class, B Class, C Class and R Class (collectively the plans), pursuant to Rule 12b-1 of the 1940 Act. The plans provide that the A Class will pay American Century Investment Services, Inc. (ACIS) an annual distribution and service fee of 0.25%. The plans provide that the B Class and C Class will each pay ACIS an annual distribution and service fee of 1.00%, of which 0.25% is paid for individual shareholder services and 0.75% is paid for distribution services. The plans provide that the R Class will pay ACIS an annual distribution and service fee of 0.50%. The fees are computed and accrued daily based on each class’s daily net assets and paid monthly in arrears. The fees are used to pay financial intermediaries for distribution and individual shareholder services. Fees incurred under the plans during the year ended June 30, 2012 are detailed in the Statement of Operations.
Related Parties — Certain officers and directors of the corporation are also officers and/or directors of American Century Companies, Inc., the parent of the corporation’s investment advisor, ACIM, the distributor of the corporation, ACIS, and the corporation’s transfer agent, American Century Services, LLC. Various funds in a series issued by American Century Asset Allocation Portfolios, Inc. (ACAAP) own, in aggregate, 11% of the shares of the fund. ACAAP does not invest in the fund for the purpose of exercising management or control.
4. Investment Transactions
Purchases and sales of investment securities, excluding short-term investments, for the year ended June 30, 2012 were $1,678,228,603 and $1,687,471,223, respectively.
5. Capital Share Transactions
Transactions in shares of the fund were as follows:
| | Year ended June 30, 2012 | | Year ended June 30, 2011 | |
| | Shares | | | Amount | | Shares | | Amount | |
| Investor Class/Shares Authorized | | 400,000,000 | | | | | | 400,000,000 | | | |
| Sold | | 13,662,697 | | | | $304,186,412 | | | 6,844,727 | | | $139,458,692 | |
| Issued in reinvestment of distributions | | 1,057,839 | | | | 23,297,369 | | | 850,097 | | | 17,568,851 | |
| Redeemed | | (15,962,625 | ) | | | (348,644,466 | ) | | (15,216,665 | ) | | (309,262,629 | ) |
| | | (1,242,089 | ) | | | (21,160,685 | ) | | (7,521,841 | ) | | (152,235,086 | ) |
| Institutional Class/Shares Authorized | | 90,000,000 | | | | | | | 90,000,000 | | | | |
| Sold | | 1,700,903 | | | | 36,390,642 | | | 2,221,773 | | | 45,534,910 | |
| Issued in reinvestment of distributions | | 157,706 | | | | 3,475,998 | | | 151,591 | | | 3,127,220 | |
| Redeemed | | (1,503,528 | ) | | | (32,878,378 | ) | | (5,273,463 | ) | | (110,002,173 | ) |
| | | 355,081 | | | | 6,988,262 | | | (2,900,099 | ) | | (61,340,043 | ) |
| A Class/Shares Authorized | | 80,000,000 | | | | | | | 80,000,000 | | | | |
| Sold | | 1,277,027 | | | | 28,345,179 | | | 2,844,005 | | | 56,682,136 | |
| Issued in reinvestment of distributions | | 99,262 | | | | 2,185,121 | | | 80,286 | | | 1,642,871 | |
| Redeemed | | (1,645,596 | ) | | | (36,065,728 | ) | | (8,566,094 | ) | | (179,415,619 | ) |
| | | (269,307 | ) | | | (5,535,428 | ) | | (5,641,803 | ) | | (121,090,612 | ) |
| B Class/Shares Authorized | | N/A | | | | | | | 10,000,000 | | | | |
| Issued in reinvestment of distributions | | 4 | | | | 72 | | | 9 | | | 199 | |
| Redeemed | | (3,605 | ) | | | (74,955 | ) | | (674 | ) | | (14,693 | ) |
| | | (3,601 | ) | | | (74,883 | ) | | (665 | ) | | (14,494 | ) |
| C Class/Shares Authorized | | 10,000,000 | | | | | | | 10,000,000 | | | | |
| Sold | | 86,960 | | | | 1,911,255 | | | 48,149 | | | 999,740 | |
| Issued in reinvestment of distributions | | 1,474 | | | | 32,392 | | | 671 | | | 13,817 | |
| Redeemed | | (82,883 | ) | | | (1,800,660 | ) | | (75,312 | ) | | (1,534,551 | ) |
| | | 5,551 | | | | 142,987 | | | (26,492 | ) | | (520,994 | ) |
| R Class/Shares Authorized | | 10,000,000 | | | | | | | 10,000,000 | | | | |
| Sold | | 156,367 | | | | 3,437,729 | | | 59,588 | | | 1,213,479 | |
| Issued in reinvestment of distributions | | 2,821 | | | | 62,251 | | | 1,613 | | | 33,422 | |
| Redeemed | | (97,208 | ) | | | (2,186,723 | ) | | (48,362 | ) | | (961,949 | ) |
| | | 61,980 | | | | 1,313,257 | | | 12,839 | | | 284,952 | |
| Net increase (decrease) | | (1,092,385 | ) | | | $(18,326,490 | ) | | (16,078,061 | ) | | $(334,916,277 | ) |
6. Fair Value Measurements
The fund’s securities valuation process is based on several considerations and may use multiple inputs to determine the fair value of the positions held by the fund. In conformity with accounting principles generally accepted in the United States of America, the inputs used to determine a valuation are classified into three broad levels as follows:
| • | Level 1 valuation inputs consist of unadjusted quoted prices in an active market for identical securities; |
| • | Level 2 valuation inputs consist of direct or indirect observable market data (including quoted prices for similar securities, evaluations of subsequent market events, interest rates, prepayment speeds, credit risk, etc.); or |
| • | Level 3 valuation inputs consist of unobservable data (including a fund’s own assumptions). |
The level classification is based on the lowest level input that is significant to the fair valuation measurement. The valuation inputs are not necessarily an indication of the risks associated with investing in these securities or other financial instruments.
The following is a summary of the level classifications as of period end. The Schedule of Investments provides additional information on the fund’s portfolio holdings.
| | | | |
| | Level 1 | Level 2 | Level 3 |
| Investment Securities |
| Domestic Common Stocks | $1,872,077,171 | — | — |
| Foreign Common Stocks | 180,121,182 | — | — |
| Temporary Cash Investments | 4,891,193 | $12,587,121 | — |
| Total Value of Investment Securities | $2,057,089,546 | $12,587,121 | — |
7. Risk Factors
There are certain risks involved in investing in foreign securities. These risks include those resulting from future adverse political, social and economic developments, fluctuations in currency exchange rates, the possible imposition of exchange controls, and other foreign laws or restrictions.
8. Federal Tax Information
The tax character of distributions paid during the years ended June 30, 2012 and June 30, 2011 were as follows:
| | 2012 | 2011 |
| Distributions Paid From |
| Ordinary income | $29,467,236 | $24,428,391 |
| Long-term capital gains | — | — |
The book-basis character of distributions made during the year from net investment income or net realized gains may differ from their ultimate characterization for federal income tax purposes. These differences reflect the differing character of certain income items and net realized gains and losses for financial statement and tax purposes, and may result in reclassification among certain capital accounts on the financial statements.
As of June 30, 2012, the federal tax cost of investments and the components of distributable earnings on a tax-basis were as follows:
| Federal tax cost of investments | | $1,737,259,238 | |
| Gross tax appreciation of investments | | $378,196,569 | |
| Gross tax depreciation of investments | | (45,779,140 | ) |
| Net tax appreciation (depreciation) of investments | | $332,417,429 | |
| Net tax appreciation (depreciation) on translation of assets and liabilities in foreign currencies | | $966 | |
| Net tax appreciation (depreciation) | | $332,418,395 | |
| Undistributed ordinary income | | $1,641,878 | |
| Accumulated short-term capital losses | | $(270,507,530 | ) |
The difference between book-basis and tax-basis cost and unrealized appreciation (depreciation) is attributable primarily to the tax deferral of losses on wash sales.
The accumulated capital losses represent net capital loss carryovers that may be used to offset future realized capital gains for federal income tax purposes. Future capital loss carryover utilization in any given year may be subject to Internal Revenue Code limitations. Capital loss carryovers of $(270,507,530) expire in 2018.
| |
| For a Share Outstanding Throughout the Years Ended June 30 (except as noted) |
| Per-Share Data | Ratios and Supplemental Data |
| | | Income From Investment Operations: | Distributions From: | | | Ratio to Average Net Assets of: | | |
| | Net Asset Value, Beginning of Period | Net Investment Income (Loss)(1) | Net Realized and Unrealized Gain (Loss) | Total From Investment Operations | Net Investment Income | Net Realized Gains | Total Distributions | Net Asset Value, End of Period | Total Return(2) | Operating Expenses | Net Investment Income (Loss) | Portfolio Turnover Rate | Net Assets, End of Period (in thousands) |
| Investor Class |
| 2012 | $22.37 | 0.34 | 0.93 | 1.27 | (0.34) | — | (0.34) | $23.30 | 5.76% | 0.68% | 1.55% | 86% | $1,654,130 |
| 2011 | $17.20 | 0.26 | 5.16 | 5.42 | (0.25) | — | (0.25) | $22.37 | 31.66% | 0.69% | 1.28% | 74% | $1,615,829 |
| 2010 | $15.32 | 0.21 | 1.87 | 2.08 | (0.20) | — | (0.20) | $17.20 | 13.47% | 0.70% | 1.14% | 64% | $1,371,992 |
| 2009 | $21.84 | 0.27 | (6.45) | (6.18) | (0.34) | — | (0.34) | $15.32 | (28.37)% | 0.70% | 1.66% | 107% | $1,339,582 |
| 2008 | $26.91 | 0.25 | (3.36) | (3.11) | (0.18) | (1.78) | (1.96) | $21.84 | (12.12)% | 0.67% | 1.01% | 105% | $2,046,107 |
| Institutional Class |
| 2012 | $22.38 | 0.38 | 0.93 | 1.31 | (0.38) | — | (0.38) | $23.31 | 5.97% | 0.48% | 1.75% | 86% | $216,802 |
| 2011 | $17.21 | 0.30 | 5.17 | 5.47 | (0.30) | — | (0.30) | $22.38 | 31.91% | 0.49% | 1.48% | 74% | $200,191 |
| 2010 | $15.33 | 0.24 | 1.87 | 2.11 | (0.23) | — | (0.23) | $17.21 | 13.69% | 0.50% | 1.34% | 64% | $203,860 |
| 2009 | $21.86 | 0.31 | (6.46) | (6.15) | (0.38) | — | (0.38) | $15.33 | (28.21)% | 0.50% | 1.86% | 107% | $168,092 |
| 2008 | $26.92 | 0.29 | (3.35) | (3.06) | (0.22) | (1.78) | (2.00) | $21.86 | (11.95)% | 0.47% | 1.21% | 105% | $443,647 |
A Class(3) |
| 2012 | $22.35 | 0.28 | 0.93 | 1.21 | (0.28) | — | (0.28) | $23.28 | 5.51% | 0.93% | 1.30% | 86% | $183,498 |
| 2011 | $17.19 | 0.20 | 5.16 | 5.36 | (0.20) | — | (0.20) | $22.35 | 31.30% | 0.94% | 1.03% | 74% | $182,195 |
| 2010 | $15.31 | 0.16 | 1.87 | 2.03 | (0.15) | — | (0.15) | $17.19 | 13.20% | 0.95% | 0.89% | 64% | $237,076 |
| 2009 | $21.81 | 0.23 | (6.44) | (6.21) | (0.29) | — | (0.29) | $15.31 | (28.54)% | 0.95% | 1.41% | 107% | $226,830 |
| 2008 | $26.89 | 0.18 | (3.34) | (3.16) | (0.14) | (1.78) | (1.92) | $21.81 | (12.33)% | 0.92% | 0.76% | 105% | $336,939 |
| |
| For a Share Outstanding Throughout the Years Ended June 30 (except as noted) |
| Per-Share Data | Ratios and Supplemental Data |
| | | Income From Investment Operations: | Distributions From: | | | Ratio to Average Net Assets of: | | |
| | Net Asset Value, Beginning of Period | Net Investment Income (Loss)(1) | Net Realized and Unrealized Gain (Loss) | Total From Investment Operations | Net Investment Income | Net Realized Gains | Total Distributions | Net Asset Value, End of Period | Total Return(2) | Operating Expenses | Net Investment Income (Loss) | Portfolio Turnover Rate | Net Assets, End of Period (in thousands) |
| C Class |
| 2012 | $22.21 | 0.12 | 0.92 | 1.04 | (0.12) | — | (0.12) | $23.13 | 4.71% | 1.68% | 0.55% | 86% | $7,013 |
| 2011 | $17.08 | 0.06 | 5.12 | 5.18 | (0.05) | — | (0.05) | $22.21 | 30.34% | 1.69% | 0.28% | 74% | $6,611 |
| 2010 | $15.22 | 0.03 | 1.85 | 1.88 | (0.02) | — | (0.02) | $17.08 | 12.33% | 1.70% | 0.14% | 64% | $5,536 |
| 2009 | $21.64 | 0.11 | (6.40) | (6.29) | (0.13) | — | (0.13) | $15.22 | (29.06)% | 1.70% | 0.66% | 107% | $5,108 |
| 2008 | $26.76 | —(4) | (3.33) | (3.33) | (0.01) | (1.78) | (1.79) | $21.64 | (13.01)% | 1.67% | 0.01% | 105% | $7,634 |
| R Class |
| 2012 | $22.36 | 0.23 | 0.93 | 1.16 | (0.23) | — | (0.23) | $23.29 | 5.24% | 1.18% | 1.05% | 86% | $6,848 |
| 2011 | $17.20 | 0.16 | 5.15 | 5.31 | (0.15) | — | (0.15) | $22.36 | 30.95% | 1.19% | 0.78% | 74% | $5,189 |
| 2010 | $15.32 | 0.12 | 1.87 | 1.99 | (0.11) | — | (0.11) | $17.20 | 12.91% | 1.20% | 0.64% | 64% | $3,770 |
| 2009 | $21.81 | 0.18 | (6.43) | (6.25) | (0.24) | — | (0.24) | $15.32 | (28.71)% | 1.20% | 1.16% | 107% | $1,764 |
| 2008 | $26.91 | 0.13 | (3.36) | (3.23) | (0.09) | (1.78) | (1.87) | $21.81 | (12.56)% | 1.17% | 0.51% | 105% | $752 |
Notes to Financial Highlights
| (1) | Computed using average shares outstanding throughout the period. |
| (2) | Total returns are calculated based on the net asset value of the last business day and do not reflect applicable sales charges, if any. Total returns for periods less than one year are not annualized. |
| (3) | Prior to September 4, 2007, the A Class was referred to as the Advisor Class. |
| (4) | Per-share amount was less than $0.005. |
See Notes to Financial Statements.
Report of Independent Registered Public Accounting Firm |
To the Directors of the American Century Quantitative Equity Funds, Inc. and Shareholders of the Equity Growth Fund:
In our opinion, the accompanying statement of assets and liabilities, including the schedule of investments, and the related statements of operations and of changes in net assets and the financial highlights present fairly, in all material respects, the financial position of the Equity Growth Fund (one of the fourteen funds comprising the American Century Quantitative Equity Funds, Inc., hereafter referred to as the “Fund”) at June 30, 2012 the results of its operations for the year then ended, the changes in its net assets for each of the two years in the period then ended and the financial highlights for each of the periods presented, in conformity with accounting principles generally accepted in the United States of America. These financial statements and financial highlights (hereafter referred to as “financial statements”) are the responsibility of the Fund’s management; our responsibility is to express an opinion on these financial statements based on our audits. We conducted our audits of these financial statements in accordance with the standards of the Public Company Accounting Oversight Board (United States). Those standards require that we plan and perform the audit to obtain reasonable assurance about whether the financial statements are free of material misstatement. An audit includes examining, on a test basis, evidence supporting the amounts and disclosures in the financial statements, assessing the accounting principles used and significant estimates made by management, and evaluating the overall financial statement presentation. We believe that our audits, which included confirmation of securities at June 30, 2012 by correspondence with the custodian and brokers, provide a reasonable basis for our opinion.
PricewaterhouseCoopers LLP
Kansas City, Missouri
August 21, 2012
Board of Directors
The individuals listed below serve as directors of the funds. Each director will continue to serve in this capacity until death, retirement, resignation or removal from office. The mandatory retirement age for directors who are not “interested persons,” as that term is defined in the Investment Company Act (independent directors), is 73. However, the mandatory retirement age may be extended for a period not to exceed two years with the approval of the remaining independent directors.
Mr. Thomas is the only director who is an “interested person” because he currently serves as President and Chief Executive Officer of American Century Companies, Inc. (ACC), the parent company of American Century Investment Management, Inc. (ACIM or the advisor).
The other directors (more than three-fourths of the total number) are independent; that is, they have never been employees, directors or officers of, and have no financial interest in, ACC or any of its wholly owned, direct or indirect, subsidiaries, including ACIM, American Century Investment Services, Inc. (ACIS) and American Century Services, LLC (ACS). The directors serve in this capacity for eight (in the case of Mr. Thomas, 15) registered investment companies in the American Century Investments family of funds.
The following table presents additional information about the directors. The mailing address for each director other than Mr. Thomas is 1665 Charleston Road, Mountain View, California 94043. The mailing address for Mr. Thomas is 4500 Main Street, Kansas City, Missouri 64111.
Name (Year of Birth) | Position(s) Held with Funds | Length of Time Served | | Principal Occupation(s) During Past 5 Years | | Number of American Century Portfolios Overseen by Director | Other Directorships Held During Past 5 Years |
| Independent Directors |
Tanya S. Beder (1955) | Director | Since 2011 | | Chairman, SBCC Group Inc. (investment advisory services)(2006 to present); Fellow in Practice, International Center for Finance, Yale University School of Management (1985 to present) | | 42 | CYS Investments, Inc. (specialty finance company) |
Jeremy I. Bulow (1954) | Director | Since 2011 | | Professor of Economics, Stanford University, Graduate School of Business (1979 to present) | | 42 | None |
Ronald J. Gilson (1946) | Director and Chairman of the Board | Since 1995 | | Charles J. Meyers Professor of Law and Business, Stanford Law School (1979 to present); Marc and Eva Stern Professor of Law and Business, Columbia University School of Law (1992 to present) | | 42 | None |
Name (Year of Birth) | Position(s) Held with Funds | Length of Time Served | | Principal Occupation(s) During Past 5 Years | | Number of American Century Portfolios Overseen by Director | Other Directorships Held During Past 5 Years |
| Independent Directors |
Frederick L. A. Grauer (1946) | Director | Since 2008 | | Senior Advisor, BlackRock, Inc. (investment management firm) (2010 to 2011); Senior Advisor, Barclays Global Investors (investment management firm) (2003 to 2009) | | 42 | None |
Peter F. Pervere (1947) | Director | Since 2007 | | Retired | | 42 | Intraware, Inc. (2003 to 2009) |
Myron S. Scholes (1941) | Director | Since 1980 | | Chairman, Platinum Grove Asset Management, L.P. (asset manager) (1999 to 2009); Frank E. Buck Professor of Finance-Emeritus, Stanford Graduate School of Business (1996 to present) | | 42 | Dimensional Fund Advisors (investment advisor); CME Group, Inc. (futures and options exchange) |
John B. Shoven (1947) | Director | Since 2002 | | Professor of Economics, Stanford University (1973 to present) | | 42 | Cadence Design Systems; Exponent; Financial Engines |
| |
| Interested Director |
Jonathan S. Thomas (1963) | Director and President | Since 2007 | | President and Chief Executive Officer, ACC (March 2007 to present); Chief Administrative Officer, ACC (February 2006 to February 2007); Executive Vice President, ACC (November 2005 to February 2007). Also serves as Chief Executive Officer and Manager, ACS; Executive Vice President, ACIM; Director, ACC, ACIM and other ACC subsidiaries | | 108 | None |
Officers
The following table presents certain information about the executive officers of the funds. Each officer serves as an officer for each of the 15 investment companies in the American Century family of funds, unless otherwise noted. No officer is compensated for his or her service as an officer of the funds. The listed officers are interested persons of the funds and are appointed or re-appointed on an annual basis. The mailing address for each of the officers listed below is 4500 Main Street, Kansas City, Missouri 64111.
Name (Year of Birth) | Offices with the Funds | Principal Occupation(s) During the Past Five Years |
Jonathan S. Thomas (1963) | Director and President since 2007 | President and Chief Executive Officer, ACC (March 2007 to present); Chief Administrative Officer, ACC (February 2006 to February 2007); Executive Vice President, ACC (November 2005 to February 2007). Also serves as Chief Executive Officer and Manager, ACS; Executive Vice President, ACIM; Director, ACC, ACIM and other ACC subsidiaries |
Barry Fink (1955) | Executive Vice President since 2007 | Chief Operating Officer and Executive Vice President, ACC (September 2007 to present); President, ACS (October 2007 to present); Managing Director, Morgan Stanley (2000 to 2007). Also serves as Manager, ACS and Director, ACC and certain ACC subsidiaries |
Maryanne L. Roepke (1956) | Chief Compliance Officer since 2006 and Senior Vice President since 2000 | Chief Compliance Officer, American Century funds, ACIM and ACS (August 2006 to present). Also serves as Senior Vice President, ACS |
Charles A. Etherington (1957) | General Counsel since 2007 and Senior Vice President since 2006 | Attorney, ACC (February 1994 to present); Vice President, ACC (November 2005 to present), General Counsel, ACC (March 2007 to present); Also serves as General Counsel, ACIM, ACS, ACIS and other ACC subsidiaries; and Senior Vice President, ACIM and ACS |
C. Jean Wade (1964) | Vice President, Treasurer and Chief Financial Officer since 2012 | Vice President, ACS (February 2000 to present) |
Robert J. Leach (1966) | Vice President since 2006 and Assistant Treasurer since 2012 | Vice President, ACS (February 2000 to present) |
David H. Reinmiller (1963) | Vice President since 2001 | Attorney, ACC (January 1994 to present); Associate General Counsel, ACC (January 2001 to present); Also serves as Vice President, ACIM and ACS |
Ward D. Stauffer (1960) | Secretary since 2005 | Attorney, ACC (June 2003 to present) |
The Statement of Additional Information has additional information about the fund’s directors and is available without charge, upon request, by calling 1-800-345-2021.
Approval of Management Agreement |
At a meeting held on June 14, 2012, the Fund’s Board of Directors/Trustees unanimously approved the renewal of the management agreement pursuant to which American Century Investment Management, Inc. (the “Advisor”) acts as the investment advisor for the Fund. Under Section 15(c) of the Investment Company Act, contracts for investment advisory services are required to be reviewed, evaluated, and approved by a majority of a fund’s independent directors/trustees (the “Directors”) each year.
As a part of the approval process, the Board requested and reviewed extensive data and information compiled by the Advisor and certain independent providers of evaluation data concerning the Fund and the services provided to the Fund by the Advisor. This review was in addition to the oversight and evaluation undertaken by the Board and its committees on a continuous basis throughout the year and included, but was not limited to the following:
| • | the nature, extent, and quality of investment management, shareholder services, and other services provided by the Advisor to the Fund; |
| • | the wide range of other programs and services the Advisor provides to the Fund and its shareholders on a routine and non-routine basis; |
| • | the investment performance of the fund, including data comparing the Fund’s performance to appropriate benchmarks and/or a peer group of other mutual funds with similar investment objectives and strategies; |
| • | data comparing the cost of owning the Fund to the cost of owning similar funds; |
| • | the Advisor’s compliance policies, procedures, and regulatory experience; |
| • | financial data showing the cost of services provided to the Fund, the profitability of the Fund to the Advisor, and the overall profitability of the Advisor; |
| • | data comparing services provided and charges to other investment management clients of the Advisor; and |
| • | consideration of collateral benefits derived by the Advisor from the management of the Fund and any potential economies of scale relating thereto. |
In keeping with its practice, the Board held two in-person meetings to review and discuss the information provided. The Board also had the benefit of the advice of its independent counsel throughout the period.
Factors Considered
The Directors considered all of the information provided by the Advisor, the independent data providers, and the Board’s independent counsel, and evaluated such information for the Fund. In connection with their review, the Directors did not identify any single factor as being all-important or controlling, and each Director may have attributed different levels of importance to different factors. In deciding to renew the management agreement, the Board based its decision on a number of factors, including the following:
Nature, Extent and Quality of Services — Generally. Under the management agreement, the Advisor is responsible for providing or arranging for all services necessary for the operation of the Fund. The Board noted that under the management agreement, the Advisor provides or arranges at its own expense a wide variety of services including:
| • | constructing and designing the Fund |
| • | portfolio research and security selection |
| • | initial capitalization/funding |
| • | daily valuation of the Fund’s portfolio |
| • | shareholder servicing and transfer agency, including shareholder confirmations, recordkeeping, and communications |
| • | regulatory and portfolio compliance |
| • | marketing and distribution |
The Board noted that many of these services have expanded over time both in terms of quantity and complexity in response to shareholder demands, competition in the industry, changing distribution channels, and the changing regulatory environment.
Investment Management Services. The nature of the investment management services provided to the Fund is quite complex and allows Fund shareholders access to professional money management, instant diversification of their investments within an asset class, the opportunity to easily diversify among asset classes by investing in or exchanging among various American Century Investments funds, and liquidity. In evaluating investment performance, the Board expects the Advisor to manage the Fund in accordance with its investment objectives and approved strategies. Further, the Directors recognize that the Advisor has an obligation to seek the best execution of fund trades. In providing these services, the Advisor utilizes teams of investment professionals (portfolio managers, analysts, research assistants, and securities traders) who require extensive information technology, research, training, compliance and other systems to conduct their business. The Board, directly and through its Portfolio Committee, regularly reviews investment performance information for the Fund, together with comparative information for appropriate benchmarks and/or peer groups of similarly-managed funds, over different time horizons. The Directors also review detailed performance information during the management agreement approval
process. If performance concerns are identified, the Fund receives special reviews until performance improves, during which the Board discusses with the Advisor the reasons for such results (e.g., market conditions, security selection) and any efforts being undertaken to improve performance. The Board found the investment management services provided by the Advisor to the Fund to meet or exceed industry standards. More detailed information about the Fund’s performance can be found in the Performance and Portfolio Commentary sections of this report.
Shareholder and Other Services. Under the management agreement, the Advisor provides the Fund with a comprehensive package of transfer agency, shareholder, and other services. The Board, directly and through various committees of the Board, regularly reviews reports and evaluations of such services at its regular meetings. These reports include, but are not limited to, information regarding the operational efficiency and accuracy of the shareholder and transfer agency services provided, staffing levels, shareholder satisfaction (as measured by external as well as internal sources), technology support, new products and services offered to Fund shareholders, securities trading activities, portfolio valuation services, auditing services, and legal and operational compliance activities. Certain aspects of shareholder and transfer agency service level efficiency and the quality of securities trading activities are measured by independent third party providers and are presented in comparison to other fund groups not managed by the Advisor. The Board found the services provided by the Advisor to the Fund under the management agreement to be competitive and of high quality.
Costs of Services and Profitability. The Advisor provides detailed information concerning its cost of providing various services to the Fund, its profitability in managing the Fund, its overall profitability, and its financial condition. The Directors have reviewed with the Advisor the methodology used to prepare this financial information. The financial information regarding the Advisor is considered in evaluating the Advisor’s financial condition, ability to continue to provide services under the management agreement, and the reasonableness of the current management fee. The Board concluded that the Advisor’s profits were reasonable in light of the services provided to the Fund.
Ethics. The Board generally considers the Advisor’s commitment to providing quality services to shareholders and to conducting its business ethically. They noted that the Advisor’s practices generally meet or exceed industry best practices.
Economies of Scale. The Board also reviewed information provided by the Advisor regarding the possible existence of economies of scale in connection with the management of the Fund. The Board concluded that economies of scale are difficult to measure and predict with precision, especially on a fund-by-fund basis. The Board concluded that the Advisor is appropriately sharing economies of scale through its competitive fee structure, offering competitive fees from fund inception, and through reinvestment in its business to provide shareholders additional content and services.
Comparison to Other Funds’ Fees. The management agreement provides that the Fund pay the Advisor a single, all-inclusive (or unified) management fee for providing all services necessary for the management and operation of the Fund, other than brokerage expenses, taxes, interest, extraordinary expenses, and the fees and expenses of the Fund’s independent directors (including their independent legal counsel) and expenses incurred in connection with the provision of shareholder services and distribution services under a plan adopted pursuant to Rule 12b-1 under the 1940 Act. Under the unified fee structure, the Advisor is responsible for providing all investment advisory, custody, audit, administrative, compliance, recordkeeping, marketing and shareholder services, or arranging and supervising third parties to provide such services. By contrast, most other funds are charged a variety of fees, including an investment advisory fee, a transfer agency fee, an administrative fee, distribution charges and other expenses. Other than their investment advisory fees and any applicable Rule 12b-1 distribution fees, all other components of the total fees charged by these other funds may be increased without shareholder approval. The Board believes the unified fee structure is a benefit to Fund shareholders because it clearly discloses to shareholders the cost of owning Fund shares, and, since the unified fee cannot be increased without a vote of Fund shareholders, it shifts to the Advisor the risk of increased costs of operating the Fund and provides a direct incentive to minimize administrative inefficiencies. Part of the Board’s analysis of fee levels involves reviewing certain evaluative data compiled by an independent provider and comparing the Fund’s unified fee to the total expense ratio of other funds in the Fund’s peer group. The Board concluded that the management fee paid by the Fund to the Advisor under the management agreement is reasonable in light of the services provided to the Fund.
Comparison to Fees and Services Provided to Other Clients of the Advisor. The Board also requested and received information from the Advisor concerning the nature of the services, fees, costs and profitability of its advisory services to advisory clients other than the Fund. They observed that these varying types of client accounts require different services and involve different regulatory and entrepreneurial risks than the management of the Fund. The Board analyzed this information and concluded that the fees charged and services provided to the Fund were reasonable by comparison.
Collateral or “Fall-Out” Benefits Derived by the Advisor. The Board considered the existence of collateral benefits the Advisor may receive as a result of its relationship with the Fund. They concluded that the Advisor’s primary business is managing mutual funds and it generally does not use fund or shareholder information to generate profits in other lines of business, and therefore does not derive any significant collateral benefits from them. The Board noted that the Advisor receives proprietary research from broker-dealers that execute fund portfolio transactions and concluded that this research is likely to benefit Fund shareholders. The Board also determined that the Advisor is able to provide investment management services to certain clients other than the Fund, at least in part, due to its existing infrastructure built to serve the fund complex. The Board concluded, however, that the assets of those other clients are not material to the analysis and, where applicable, may be included with the assets of the Fund to determine breakpoints in the management fee schedule.
Existing Relationship. The Board also considered whether there was any reason for not continuing the existing arrangement with the Advisor. In this regard, the Board was mindful of the potential disruptions of the Fund’s operations and various risks, uncertainties, and other effects that could occur as a result of a decision not to continue such relationship. In particular, the Board recognized that most shareholders have invested in the Fund on the strength of the Advisor’s industry standing and reputation and in the expectation that the Advisor will have a continuing role in providing advisory services to the Fund.
Conclusion of the Directors. As a result of this process, the Board, including all of the independent directors and assisted by the advice of independent legal counsel, taking into account all of the factors discussed above and the information provided by the Advisor and others, concluded that the management agreement between the Fund and the Advisor is fair and reasonable in light of the services provided and should be renewed.
Retirement Account Information
As required by law, distributions you receive from certain IRAs, or 403(b), 457 and qualified plans are subject to federal income tax withholding, unless you elect not to have withholding apply. Tax will be withheld on the total amount withdrawn even though you may be receiving amounts that are not subject to withholding, such as nondeductible contributions. In such case, excess amounts of withholding could occur. You may adjust your withholding election so that a greater or lesser amount will be withheld.
If you don’t want us to withhold on this amount, you must notify us to not withhold the federal income tax. You may notify us in writing or in certain situations by telephone or through other electronic means. You have the right to revoke your withholding election at any time and any election you make may remain in effect until revoked by filing a new election.
Remember, even if you elect not to have income tax withheld, you are liable for paying income tax on the taxable portion of your withdrawal. If you elect not to have income tax withheld or you don’t have enough income tax withheld, you may be responsible for payment of estimated tax. You may incur penalties under the estimated tax rules if your withholding and estimated tax payments are not sufficient. You can reduce or defer the income tax on a distribution by directly or indirectly rolling such distribution over to another IRA or eligible plan. You should consult your tax advisor for additional information.
State tax will be withheld if, at the time of your distribution, your address is within one of the mandatory withholding states and you have federal income tax withheld. State taxes will be withheld from your distribution in accordance with the respective state rules.
Proxy Voting Guidelines
American Century Investment Management, Inc., the fund’s investment advisor, is responsible for exercising the voting rights associated with the securities purchased and/or held by the fund. A description of the policies and procedures the advisor uses in fulfilling this responsibility is available without charge, upon request, by calling 1-800-345-2021. It is also available on American Century Investments’ website at americancentury.com and on the Securities and Exchange Commission’s website at sec.gov. Information regarding how the investment advisor voted proxies relating to portfolio securities during the most recent 12-month period ended June 30 is available on the “About Us” page at americancentury.com. It is also available at sec.gov.
Quarterly Portfolio Disclosure
The fund files its complete schedule of portfolio holdings with the Securities and Exchange Commission (SEC) for the first and third quarters of each fiscal year on Form N-Q. The fund’s Forms N-Q are available on the SEC’s website at sec.gov, and may be reviewed and copied at the SEC’s Public Reference Room in Washington, DC. Information on the operation of the Public Reference Room may be obtained by calling 1-800-SEC-0330. The fund also makes its complete schedule of portfolio holdings for the most recent quarter of its fiscal year available on its website at americancentury.com and, upon request, by calling 1-800-345-2021.
Other Tax Information
The following information is provided pursuant to provisions of the Internal Revenue Code.
The fund hereby designates up to the maximum amount allowable as qualified dividend income for the fiscal year ended June 30, 2012.
For corporate taxpayers, the fund hereby designates $29,467,236, or up to the maximum amount allowable, of ordinary income distributions paid during
the fiscal year ended June 30, 2012 as qualified for the corporate dividends received deduction.
| Contact Us | americancentury.com |
| Automated Information Line | 1-800-345-8765 |
| Investor Services Representative | 1-800-345-2021 or 816-531-5575 |
| Investors Using Advisors | 1-800-378-9878 |
| Business, Not-For-Profit, Employer-Sponsored Retirement Plans | 1-800-345-3533 |
| Banks and Trust Companies, Broker-Dealers, Financial Professionals, Insurance Companies | 1-800-345-6488 |
| Telecommunications Device for the Deaf | 1-800-634-4113 |
American Century Quantitative Equity Funds, Inc.
Investment Advisor:
American Century Investment Management, Inc.
Kansas City, Missouri
This report and the statements it contains are submitted for the general information of our shareholders. The report is not authorized for distribution to prospective investors unless preceded or accompanied by an effective prospectus.
©2012 American Century Proprietary Holdings, Inc. All rights reserved.
CL-ANN-75839 1208
ANNUAL REPORT JUNE 30, 2012
| President’s Letter | 2 |
| Market Perspective | 3 |
| Performance | 4 |
| Portfolio Commentary | 6 |
| Fund Characteristics | 8 |
| Shareholder Fee Example | 9 |
| Schedule of Investments | 11 |
| Statement of Assets and Liabilities | 13 |
| Statement of Operations | 14 |
| Statement of Changes in Net Assets | 15 |
| Notes to Financial Statements | 16 |
| Financial Highlights | 22 |
| Report of Independent Registered Public Accounting Firm | 25 |
| Management | 26 |
| Approval of Management Agreement | 29 |
| Additional Information | 34 |
Any opinions expressed in this report reflect those of the author as of the date of the report, and do not necessarily represent the opinions of American Century Investments® or any other person in the American Century Investments organization. Any such opinions are subject to change at any time based upon market or other conditions and American Century Investments disclaims any responsibility to update such opinions. These opinions may not be relied upon as investment advice and, because investment decisions made by American Century Investments funds are based on numerous factors, may not be relied upon as an indication of trading intent on behalf of any American Century Investments fund. Security examples are used for representational purposes only and are not intended as recommendations to purchase or sell securities. Performance information for comparative indices and securities is provided to American Century Investments by third party vendors. To the best of American Century Investments’ knowledge, such information is accurate at the time of printing.
Dear Investor:
Thank you for reviewing this annual report for the period ended June 30, 2012. Our report offers investment performance and portfolio information, presented with the expert perspective of our portfolio management team.
This report remains one of our most important vehicles for conveying information about fund returns, as well as market factors and strategies that affected fund performance. For additional, updated information, we encourage you to visit our website, americancentury.com. Click on the “Fund Performance” and “Insights & News” headings at the top of our Individual Investors site.
Flight to Quality as Economic and Financial Uncertainties Resurfaced
During the second half of 2011 and the first half of 2012, the global economy and financial markets struggled to move beyond the lingering aftereffects of the 2008 Financial Crisis and Great Recession. Global economic fundamentals have improved since 2008, but weakened since 2010, with increased uncertainty surrounding near-term economic growth levels in major developed economies such as the U.S., Japan, and Europe. There were also questions about near-term growth levels in influential emerging economies such as China.
These near-term uncertainties manifested themselves in asset returns for the 12 months ended June 30, 2012. Assets perceived to be “safe-haven” investments rallied—the 30-year U.S. Treasury bond posted a 39% total return. At the other end of the spectrum, international stock returns for U.S. investors were undermined by a combination of risk-averse investing attitudes, weakening global economic growth, and a stronger U.S. dollar versus the euro and currencies of other struggling economies. Commodity prices also plunged during the period.
Unfortunately, the instability that triggered much of this flight-to-quality trading remains largely in place, and the coming months may bring additional uncertainties about the U.S. presidential election and what might happen when various U.S. tax cuts and other stimulative measures expire in 2013 (the so-called “Fiscal Cliff”). In this uncertain, unstable environment, we continue to believe in a disciplined, diversified, long-term investment approach, using both stocks and bonds, as appropriate. We appreciate your continued trust in us during these unsettled times.
Sincerely,
Jonathan Thomas
President and Chief Executive Officer
American Century Investments
By Scott Wittman, Chief Investment Officer, Quantitative Equity
and Asset Allocation
Risk Aversion Took Center Stage
Market sentiment wavered between “risk on” and “risk off” during the 12-month period ended June 30, 2012. Nevertheless, persistent concerns about weakening global economies and Europe’s ongoing sovereign debt and banking crises overshadowed the periodic bouts of optimism that emerged. Broad global stock benchmarks tumbled during the period, with riskier assets, including precious metals stocks, experiencing double-digit percentage losses.
The period began with weak labor market and housing data and a first-ever U.S. credit-rating downgrade leaving many investors worried about the health of the U.S. economy. At the same time, Europe’s expanding sovereign-debt crisis threatened the entire global financial sector. Recession fears mounted, and the “risk-off” trade was in fashion. Those fears subsided in late 2011 and early 2012, though, as select economic data improved, and action by the European Central Bank calmed investors’ eurozone fears. But, beginning in April, slowing global growth, combined with ongoing problems in Europe, triggered another round of widespread risk aversion.
Concerned about the struggling economy, the Federal Reserve (the Fed) committed to keeping the federal funds rate target near zero until late-2014. In addition, the Fed extended “Operation Twist,” a stimulus strategy designed to reduce longer-term interest rates while keeping shorter-term rates low, through the end of 2012.
Gold Prices Were Volatile
Gold prices edged slightly higher during the period, but the small gain masked a volatile market. For example, the price of an ounce of gold bullion started the period at $1,505.50 and climbed to a record high $1,895.00 in September 2011, before falling back to $1,598.50 by the end of June 2012.
Much of the decline since September 2011 was due to waning demand for gold. The U.S. dollar strengthened during the period, which meant gold, which is priced in dollars, was more expensive for foreign buyers. Nevertheless, we believe there is long-term support for gold prices due to strong central bank demand, inflationary monetary and fiscal policies, and rising consumer demand in emerging economies.
| 12-Month Total Returns |
| As of June 30, 2012 |
| London Gold PM Fix, in U.S. dollars | 6.18% |
| S&P Goldman Sachs Commodities Index (total returns) | -10.74% |
| Lipper Precious Metals Funds Index | -24.94% |
| U.S. Dollar vs. South African Rand* | 20.90% |
| U.S. Dollar vs. Euro* | 14.60% |
| U.S. Dollar vs. Australian Dollar* | 4.80% |
*All percentage changes in foreign exchange rates are calculated on the basis of that currency per one U.S. dollar.
| Total Returns as of June 30, 2012 |
| | | | Average Annual Returns | |
| | Ticker Symbol | 1 year | 5 years | 10 years | Since Inception | Inception Date |
| Investor Class | BGEIX | -20.43% | 5.33% | 11.46% | 4.54% | 8/17/88 |
NYSE Arca Gold Miners Index | — | -17.26% | 4.51% | N/A(1) | N/A(1) | — |
| MSCI World Index | — | -4.98% | -2.96% | 5.18% | 6.37%(2) | — |
| Institutional Class | AGGNX | -20.28% | — | — | 2.08% | 9/28/07 |
A Class(3) No sales charge* With sales charge* | ACGGX | -20.60% -25.18% | 5.07% 3.83% | 11.21% 10.55% | 8.98% 8.52% | 5/6/98 |
| C Class | AGYCX | -21.21% | — | — | 0.88% | 9/28/07 |
| R Class | AGGWX | -20.82% | — | — | 1.38% | 9/28/07 |
| Sales charges include initial sales charges and contingent deferred sales charges (CDSCs), as applicable. A Class shares have a 5.75% maximum initial sales charge and may be subject to a maximum CDSC of 1.00%. C Class shares redeemed within 12 months of purchase are subject to a maximum CDSC of 1.00%. The SEC requires that mutual funds provide performance information net of maximum sales charges in all cases where charges could be applied. |
| (1) | Benchmark total return data first available 10/1/04. |
| (2) | Since 8/31/88, the date nearest the Investor Class’s inception for which data are available. |
| (3) | Prior to September 4, 2007, the A Class was referred to as the Advisor Class and did not have a front-end sales charge. Performance prior to that date has been adjusted to reflect this charge. |
Data presented reflect past performance. Past performance is no guarantee of future results. Current performance may be higher or lower than the performance shown. Investment return and principal value will fluctuate, and redemption value may be more or less than original cost. To obtain performance data current to the most recent month end, please call 1-800-345-2021 or visit americancentury.com. The fund concentrates its investments in a narrow segment of the total market and is therefore subject to greater risks and market fluctuations than a portfolio representing a broader range of industries. International investing involves special risks, such as political instability and currency fluctuations. Investing in emerging markets may accentuate these risks. Gold stocks are generally considered speculative because of high share price volatility. The price of gold will likely impact the value of the companies in which the fund invests.
Unless otherwise indicated, performance reflects Investor Class shares; performance for other share classes will vary due to differences in fee structure. For information about other share classes available, please consult the prospectus. Data assumes reinvestment of dividends and capital gains, and none of the charts reflect the deduction of taxes that a shareholder would pay on fund distributions or the redemption of fund shares. Returns for the indices are provided for comparison. The fund’s total returns include operating expenses (such as transaction costs and management fees) that reduce returns, while the total returns of the indices do not.
| Growth of $10,000 Over 10 Years* |
| $10,000 investment made June 30, 2002 |
*Since NYSE Arca Gold Miners Index total return data is only available from 10/1/04, it is not included in the line chart.
| Total Annual Fund Operating Expenses |
| Investor Class | Institutional Class | A Class | C Class | R Class |
| 0.69% | 0.49% | 0.94% | 1.69% | 1.19% |
The total annual fund operating expenses shown is as stated in the fund’s prospectus current as of the date of this report. The prospectus may vary from the expense ratio shown elsewhere in this report because it is based on a different time period, includes acquired fund fees and expenses, and, if applicable, does not include fee waivers or expense reimbursements.
Data presented reflect past performance. Past performance is no guarantee of future results. Current performance may be higher or lower than the performance shown. Investment return and principal value will fluctuate, and redemption value may be more or less than original cost. To obtain performance data current to the most recent month end, please call 1-800-345-2021 or visit americancentury.com. The fund concentrates its investments in a narrow segment of the total market and is therefore subject to greater risks and market fluctuations than a portfolio representing a broader range of industries. International investing involves special risks, such as political instability and currency fluctuations. Investing in emerging markets may accentuate these risks. Gold stocks are generally considered speculative because of high share price volatility. The price of gold will likely impact the value of the companies in which the fund invests.
Unless otherwise indicated, performance reflects Investor Class shares; performance for other share classes will vary due to differences in fee structure. For information about other share classes available, please consult the prospectus. Data assumes reinvestment of dividends and capital gains, and none of the charts reflect the deduction of taxes that a shareholder would pay on fund distributions or the redemption of fund shares. Returns for the indices are provided for comparison. The fund’s total returns include operating expenses (such as transaction costs and management fees) that reduce returns, while the total returns of the indices do not.
Portfolio Managers: Bill Martin and Lynette Pang
Performance Summary
Global Gold declined -20.43%* for the 12 months ended June 30, 2012. The portfolio’s benchmark, the NYSE Arca Gold Miners Index, declined -17.26% for the same period. The portfolio’s return reflects operating expenses, while the benchmark’s return does not.
Gold Prices Advanced Modestly
Gold bullion advanced during the 12-month period, but the gain was much more modest than in previous fiscal years. After rallying to a record high early in the period, gold prices generally tumbled through the end of the fiscal year on waning demand. The U.S. dollar advanced on a flight to quality triggered by the debt and banking sector turmoil in Europe. (In general, when the dollar rises, gold prices fall, and vice versa.) Furthermore, global economic growth notably weakened during the period, which diminished inflation concerns. (Rising inflation often triggers demand for gold from investors looking to hedge against the threat.)
Gold, Mining Stocks Continued to Decouple
Against a backdrop of slowing economic growth in the U.S., Europe and China and concerns about the stability of Europe’s sovereign debt and banking sector, global stock benchmarks declined during the 12-month period. Gold-related stocks sharply underperformed these benchmarks, despite the overall modest rise in gold prices. For more than a year, rising production costs and geopolitical risks, including the threat of rising taxes from governments where mining operations are based, have led to a decoupling of gold prices and gold stocks. Because Global Gold invests in gold mining stocks, as opposed to gold bullion, this performance disparity has detracted from performance.
The portfolio’s underperformance relative to the benchmark primarily was due to our exposure to junior mining and exploration firms, which are more closely tied to the performance of the metal than the larger gold producers. This positioning detracted as gold prices fell sharply between August 2011 and the end of June 2012. We favor these companies because we believe they provide most of the growth opportunity in the sector. Senior gold miners have significantly pulled back their exploration activities in an attempt to contain costs and de-risk their companies.
Canada Led Detractors
Overall, an overweight allocation to Canada, the largest country weighting in the portfolio, and a portfolio-only (represented in the portfolio but not in the benchmark) allocation to Australia detracted from the portfolio’s relative performance. In terms of individual holdings, a portfolio-only position in Canada’s Osisko Mining, a development stage gold mining company, was among the largest detractors to the portfolio’s relative performance. Shares tumbled in May 2012, after a fire damaged a processing plant at the company’s mine in northwestern Quebec.
*All fund returns referenced in this commentary are for Investor Class shares.
In addition, a position in U.S.-based Newmont Mining, a gold and copper producer and one of the portfolio’s largest positions, detracted from performance primarily due to political pressures. In particular, sharp politically motivated opposition to mining projects in Peru has forced the company to delay the opening of its $4.5 billion Minas Conga gold and copper mine, which Peruvians claim threatens the region’s water quality. In late-June 2012, the company said it will build water reservoirs that will benefit the local community, but opposition persisted.
Gold Mining Trust Led Contributors
Stock selection in the United States and an overweight allocation to the United Kingdom contributed favorably to the portfolio’s relative results. In terms of individual holdings, an overweight position in Royal Gold, a U.S.-based gold mining trust and one of the portfolio’s largest holdings, was among the top performers. Rather than actively drilling for new gold, mining trusts provide capital and/or land to miners for a fixed share of future mineral production. Royal Gold’s shares rallied after the company announced in May 2012 its acquisition of a royalty on Nevada’s Ruby Hill gold mine.
In addition, a portfolio-only position in Canada’s Franco-Nevada Corp., a gold-focused royalty and stream company, was a leading performer. The company reported a first-quarter 2012 profit that was more than double its profit in the first quarter of 2011. In addition, Franco-Nevada boosted its monthly dividend for the fifth-consecutive year, raising it 25% to 5 cents a share.
Gold Stocks Offer Value
We believe gold stocks are attractively valued relative to the price of gold bullion. We would expect stocks to rally on any one of several potential catalysts, including mergers-and-acquisitions activity in the sector, rising expectations for more quantitative easing from leading central banks, and/or effective cost controls at mining companies. In the current climate, we will continue to seek quality among the portfolio’s exploration companies, looking for projects we believe are higher-grade and avoiding companies we believe will need financing in the next two years. In addition, we prefer companies with operations in geopolitical jurisdictions we believe are “safer”.
| JUNE 30, 2012 | |
| Top Ten Holdings | % of net assets |
| Barrick Gold Corp. | 13.7% |
Goldcorp, Inc.(1) | 12.0% |
| Newmont Mining Corp. | 8.3% |
Yamana Gold, Inc.(1) | 6.2% |
| Silver Wheaton Corp. | 4.4% |
| Randgold Resources Ltd. ADR | 4.4% |
| Royal Gold, Inc. | 4.2% |
| Eldorado Gold Corp. | 4.0% |
AngloGold Ashanti Ltd.(1) | 4.0% |
| Cia de Minas Buenaventura SA ADR | 4.0% |
(1)Includes shares traded on all exchanges. |
| | |
| Geographic Composition | % of net assets |
| Canada | 66.3% |
| United States | 15.3% |
| South Africa | 7.4% |
| Jersey | 4.4% |
| Peru | 4.0% |
| Australia | 1.1% |
| United Kingdom | 0.3% |
Cash and Equivalents(2) | 1.2% |
(2)Includes temporary cash investments and other assets and liabilities. |
| | |
| Types of Investments in Portfolio | % of net assets |
| Foreign Common Stocks | 83.5% |
| Domestic Common Stocks | 15.3% |
| Total Common Stocks | 98.8% |
| Temporary Cash Investments | 1.2% |
| Other Assets and Liabilities | —(3) |
(3)Category is less than 0.05% of total net assets. |
Fund shareholders may incur two types of costs: (1) transaction costs, including sales charges (loads) on purchase payments and redemption/exchange fees; and (2) ongoing costs, including management fees; distribution and service (12b-1) fees; and other fund expenses. This example is intended to help you understand your ongoing costs (in dollars) of investing in your fund and to compare these costs with the ongoing cost of investing in other mutual funds.
The example is based on an investment of $1,000 made at the beginning of the period and held for the entire period from January 1, 2012 to June 30, 2012.
Actual Expenses
The table provides information about actual account values and actual expenses for each class. You may use the information, together with the amount you invested, to estimate the expenses that you paid over the period. First, identify the share class you own. Then simply divide your account value by $1,000 (for example, an $8,600 account value divided by $1,000 = 8.6), then multiply the result by the number under the heading “Expenses Paid During Period” to estimate the expenses you paid on your account during this period.
If you hold Investor Class shares of any American Century Investments fund, or Institutional Class shares of the American Century Diversified Bond Fund, in an American Century Investments account (i.e., not a financial intermediary or retirement plan account), American Century Investments may charge you a $12.50 semiannual account maintenance fee if the value of those shares is less than $10,000. We will redeem shares automatically in one of your accounts to pay the $12.50 fee. In determining your total eligible investment amount, we will include your investments in all personal accounts (including American Century Investments Brokerage accounts) registered under your Social Security number. Personal accounts include individual accounts, joint accounts, UGMA/UTMA accounts, personal trusts, Coverdell Education Savings Accounts and IRAs (including traditional, Roth, Rollover, SEP-, SARSEP- and SIMPLE-IRAs), and certain other retirement accounts. If you have only business, business retirement, employer-sponsored or American Century Investments Brokerage accounts, you are currently not subject to this fee. If you are subject to the Account Maintenance Fee, your account value could be reduced by the fee amount.
Hypothetical Example for Comparison Purposes
The table also provides information about hypothetical account values and hypothetical expenses based on the actual expense ratio of each class of your fund and an assumed rate of return of 5% per year before expenses, which is not the actual return of a fund’s share class. The hypothetical account values and expenses may not be used to estimate the actual ending account balance or expenses you paid for the period. You may use this information to compare the ongoing costs of investing in your fund and other funds. To do so, compare this 5% hypothetical example with the 5% hypothetical examples that appear in the shareholder reports of the other funds.
Please note that the expenses shown in the table are meant to highlight your ongoing costs only and do not reflect any transactional costs, such as sales charges (loads) or redemption/exchange fees. Therefore, the table is useful in comparing ongoing costs only, and will not help you determine the relative total costs of owning different funds. In addition, if these transactional costs were included, your costs would have been higher.
| | | | | |
| | Beginning Account Value 1/1/12 | Ending Account Value 6/30/12 | Expenses Paid During Period(1) 1/1/12 – 6/30/12 | Annualized Expense Ratio(1) |
| Actual | | | | |
| Investor Class | $1,000 | $865.70 | $3.15 | 0.68% |
| Institutional Class | $1,000 | $866.50 | $2.23 | 0.48% |
| A Class | $1,000 | $864.90 | $4.31 | 0.93% |
| C Class | $1,000 | $861.60 | $7.78 | 1.68% |
| R Class | $1,000 | $863.70 | $5.47 | 1.18% |
| Hypothetical | | | | |
| Investor Class | $1,000 | $1,021.48 | $3.42 | 0.68% |
| Institutional Class | $1,000 | $1,022.48 | $2.41 | 0.48% |
| A Class | $1,000 | $1,020.24 | $4.67 | 0.93% |
| C Class | $1,000 | $1,016.51 | $8.42 | 1.68% |
| R Class | $1,000 | $1,019.00 | $5.92 | 1.18% |
| (1) | Expenses are equal to the class’s annualized expense ratio listed in the table above, multiplied by the average account value over the period, multiplied by 182, the number of days in the most recent fiscal half-year, divided by 366, to reflect the one-half year period. |
| | | Shares | | | Value | |
| Common Stocks — 98.8% | |
| AUSTRALIA — 1.1% | |
CGA Mining Ltd.(1) | | | 1,780,641 | | | | $3,235,621 | |
| Newcrest Mining Ltd. | | | 236,655 | | | | 5,508,449 | |
| | | | | | | | 8,744,070 | |
| CANADA — 66.3% | |
| Agnico-Eagle Mines Ltd. | | | 227,035 | | | | 9,196,467 | |
| Agnico-Eagle Mines Ltd. New York Shares | | | 242,200 | | | | 9,799,412 | |
| Alamos Gold, Inc. | | | 162,300 | | | | 2,534,692 | |
ATAC Resources Ltd.(1) | | | 1,124,700 | | | | 2,629,198 | |
AuRico Gold, Inc.(1) | | | 1,374,871 | | | | 11,046,503 | |
Aurizon Mines Ltd.(1) | | | 621,300 | | | | 2,819,375 | |
B2Gold Corp.(1) | | | 2,663,000 | | | | 8,003,909 | |
| Barrick Gold Corp. | | | 3,001,712 | | | | 112,774,320 | |
Belo Sun Mining Corp.(1) | | | 4,915,100 | | | | 5,503,599 | |
| Centerra Gold, Inc. | | | 230,400 | | | | 1,611,284 | |
Continental Gold Ltd.(1) | | | 481,400 | | | | 3,116,026 | |
Detour Gold Corp.(1) | | | 254,601 | | | | 5,129,031 | |
Dundee Precious Metals, Inc.(1) | | | 764,300 | | | | 4,601,865 | |
| Eldorado Gold Corp. | | | 2,692,800 | | | | 33,167,382 | |
First Majestic Silver Corp.(1) | | | 531,700 | | | | 7,677,036 | |
| Franco-Nevada Corp. | | | 335,200 | | | | 15,158,244 | |
GBS Gold International, Inc.(1) | | | 347,300 | | | | 1,706 | |
Gold Standard Ventures Corp.(1) | | | 861,500 | | | | 1,658,521 | |
| Goldcorp, Inc. | | | 2,566,576 | | | | 96,627,893 | |
| Goldcorp, Inc. New York Shares | | | 64,300 | | | | 2,416,394 | |
Golden Star Resources Ltd.(1) | | | 785,700 | | | | 910,643 | |
| IAMGOLD Corp. | | | 1,494,119 | | | | 17,669,377 | |
| Kinross Gold Corp. | | | 2,382,552 | | | | 19,447,016 | |
| Kinross Gold Corp. New York Shares | | | 1,004,757 | | | | 8,188,770 | |
Kirkland Lake Gold, Inc.(1) | | | 170,900 | | | | 1,839,764 | |
Midas Gold Corp.(1) | | | 1,567,250 | | | | 3,694,529 | |
| Nevsun Resources Ltd. | | | 767,300 | | | | 2,494,611 | |
New Gold, Inc.(1) | | | 2,325,900 | | | | 22,182,977 | |
Osisko Mining Corp.(1) | | | 1,222,400 | | | | 8,404,675 | |
| Pan American Silver Corp. | | | 148,170 | | | | 2,507,582 | |
| Pan American Silver Corp. NASDAQ Shares | | | 341,800 | | | | 5,773,002 | |
Premier Gold Mines Ltd.(1) | | | 832,400 | | | | 3,597,446 | |
Rubicon Minerals Corp.(1) | | | 151,300 | | | | 462,178 | |
Sabina Gold & Silver Corp.(1) | | | 642,400 | | | | 1,255,649 | |
Sandstorm Gold Ltd.(1) | | | 594,907 | | | | 4,849,944 | |
Seabridge Gold, Inc.(1) | | | 107,400 | | | | 1,556,226 | |
| SEMAFO, Inc. | | | 638,700 | | | | 2,929,701 | |
Silver Standard Resources, Inc.(1) | | | 215,400 | | | | 2,421,096 | |
| Silver Wheaton Corp. | | | 1,355,600 | | | | 36,384,304 | |
Tahoe Resources, Inc.(1) | | | 467,700 | | | | 6,463,549 | |
Torex Gold Resources, Inc.(1) | | | 4,887,790 | | | | 7,921,475 | |
| Yamana Gold, Inc. | | | 2,399,342 | | | | 37,023,537 | |
| Yamana Gold, Inc. New York Shares | | | 926,381 | | | | 14,266,267 | |
| | | | | | | | 547,717,175 | |
| JERSEY — 4.4% | |
| Randgold Resources Ltd. ADR | | | 400,400 | | | | 36,040,004 | |
| PERU — 4.0% | |
| Cia de Minas Buenaventura SA ADR | | | 867,600 | | | | 32,951,448 | |
| SOUTH AFRICA — 7.4% | |
| AngloGold Ashanti Ltd. | | | 465,502 | | | | 15,955,364 | |
| AngloGold Ashanti Ltd. ADR | | | 499,676 | | | | 17,158,874 | |
| Gold Fields Ltd. | | | 1,462,510 | | | | 18,676,821 | |
Great Basin Gold Ltd.(1) | | | 2,127,600 | | | | 1,441,945 | |
| Harmony Gold Mining Co. Ltd. | | | 867,150 | | | | 8,139,000 | |
| | | | | | | | 61,372,004 | |
| UNITED KINGDOM — 0.3% | |
| Fresnillo plc | | | 112,003 | | | | 2,570,475 | |
| UNITED STATES — 15.3% | |
Allied Nevada Gold Corp.(1) | | | 479,600 | | | | 13,604,605 | |
Coeur d’Alene Mines Corp.(1) | | | 355,259 | | | | 6,238,348 | |
| Gold Resource Corp. | | | 31,700 | | | | 823,883 | |
| Hecla Mining Co. | | | 502,900 | | | | 2,388,775 | |
| Newmont Mining Corp. | | | 1,421,514 | | | | 68,957,644 | |
| Royal Gold, Inc. | | | 442,421 | | | | 34,685,806 | |
| | | | | | | | 126,699,061 | |
TOTAL COMMON STOCKS (Cost $438,355,053) | | | | 816,094,237 | |
| Temporary Cash Investments — 1.2% | | | | | |
Repurchase Agreement, Bank of America Merrill Lynch, (collateralized by various U.S. Treasury obligations, 1.50% – 4.00%, 2/15/15 – 6/30/16), valued at $3,299,454, in a joint trading account at 0.10%, dated 6/29/12, due 7/2//12 (Delivery value $3,236,617) | | | | $3,236,590 | |
Repurchase Agreement, Credit Suisse First Boston, Inc., (collateralized by various U.S. Treasury obligations, 3.75%, 8/15/41, valued at $3,309,711), in a joint trading account at 0.10%, dated 6/29/12, due 7/2/12 (Delivery value $3,236,616) | | | | 3,236,589 | |
Repurchase Agreement, Goldman Sachs & Co., (collateralized by various U.S. Treasury obligations, 4.375%, 5/15/40, valued at $824,226), in a joint trading account at 0.06%, dated 6/29/12, due 7/2/12 (Delivery value $809,151) | | | | 809,147 | |
| SSgA U.S. Government Money Market Fund | | | 2,892,688 | | | | 2,892,688 | |
TOTAL TEMPORARY CASH INVESTMENTS(Cost $10,175,014) | | | | 10,175,014 | |
TOTAL INVESTMENT SECURITIES — 100.0%(Cost $448,530,067) | | | | 826,269,251 | |
OTHER ASSETS AND LIABILITIES† | | | | (163,876 | ) |
| TOTAL NET ASSETS — 100.0% | | | | $826,105,375 | |
Notes to Schedule of Investments
ADR = American Depositary Receipt
† Category is less than 0.05% of total net assets.
(1) Non-income producing.
See Notes to Financial Statements.
Statement of Assets and Liabilities |
| JUNE 30, 2012 | |
| Assets | |
| Investment securities, at value (cost of $448,530,067) | | | $826,269,251 | |
| Foreign currency holdings, at value (cost of $177,250) | | | 178,615 | |
| Receivable for capital shares sold | | | 134,523 | |
| Dividends and interest receivable | | | 357,542 | |
| | | | 826,939,931 | |
| | | | | |
| Liabilities | | | | |
| Payable for capital shares redeemed | | | 358,968 | |
| Accrued management fees | | | 468,779 | |
| Distribution and service fees payable | | | 6,809 | |
| | | | 834,556 | |
| | | | | |
| Net Assets | | | $826,105,375 | |
| | | | | |
| Net Assets Consist of: | | | | |
| Capital (par value and paid-in surplus) | | | $490,837,479 | |
| Accumulated net investment loss | | | (28,157,410 | ) |
| Accumulated net realized loss | | | (14,315,326 | ) |
| Net unrealized appreciation | | | 377,740,632 | |
| | | | $826,105,375 | |
| | Net assets | Shares outstanding | Net asset value per share |
| Investor Class, $0.01 Par Value | $789,135,339 | 46,207,757 | $17.08 |
| Institutional Class, $0.01 Par Value | $15,971,130 | 932,215 | $17.13 |
| A Class, $0.01 Par Value | $15,549,530 | 920,222 | $16.90* |
| C Class, $0.01 Par Value | $2,825,889 | 170,663 | $16.56 |
| R Class, $0.01 Par Value | $2,623,487 | 155,623 | $16.86 |
*Maximum offering price $17.93 (net asset value divided by 0.9425)
See Notes to Financial Statements.
| YEAR ENDED JUNE 30, 2012 | |
| Investment Income (Loss) | |
| Income: | | | |
| Dividends (net of foreign taxes withheld of $971,920) | | | $9,708,044 | |
| Interest | | | 3,610 | |
| | | | 9,711,654 | |
| | | | | |
| Expenses: | | | | |
| Management fees | | | 7,097,372 | |
| Distribution and service fees: | | | | |
| A Class | | | 52,284 | |
| B Class | | | 4,959 | |
| C Class | | | 34,905 | |
| R Class | | | 14,320 | |
| Directors’ fees and expenses | | | 55,899 | |
| Other expenses | | | 24,109 | |
| | | | 7,283,848 | |
| | | | | |
| Net investment income (loss) | | | 2,427,806 | |
| | | | | |
| Realized and Unrealized Gain (Loss) | | | | |
| Net realized gain (loss) on: | | | | |
| Investment transactions | | | 10,670,538 | |
| Foreign currency transactions | | | 5,050 | |
| | | | 10,675,588 | |
| | | | | |
| Change in net unrealized appreciation (depreciation) on: | | | | |
| Investments | | | (228,358,802 | ) |
| Translation of assets and liabilities in foreign currencies | | | (526 | ) |
| | | | (228,359,328 | ) |
| | | | | |
| Net realized and unrealized gain (loss) | | | (217,683,740 | ) |
| | | | | |
| Net Increase (Decrease) in Net Assets Resulting from Operations | | | $(215,255,934 | ) |
See Notes to Financial Statements.
Statement of Changes in Net Assets |
| YEARS ENDED JUNE 30, 2012 AND JUNE 30, 2011 | |
| Increase (Decrease) in Net Assets | June 30, 2012 | | | June 30, 2011 | |
| Operations | |
| Net investment income (loss) | | $2,427,806 | | | | $(2,154,649 | ) |
| Net realized gain (loss) | | 10,675,588 | | | | 171,285,153 | |
| Change in net unrealized appreciation (depreciation) | | (228,359,328 | ) | | | (44,108,072 | ) |
| Net increase (decrease) in net assets resulting from operations | | (215,255,934 | ) | | | 125,022,432 | |
| | | | | | | | |
| Distributions to Shareholders | | | | | | | |
| From net investment income: | | | | | | | |
| Investor Class | | — | | | | (74,345,381 | ) |
| Institutional Class | | — | | | | (1,350,244 | ) |
| A Class | | — | | | | (1,509,611 | ) |
| B Class | | — | | | | (87,903 | ) |
| C Class | | — | | | | (198,002 | ) |
| R Class | | — | | | | (135,833 | ) |
| From net realized gains: | | | | | | | |
| Investor Class | | (62,330,676 | ) | | | (72,322,529 | ) |
| Institutional Class | | (1,210,470 | ) | | | (1,263,890 | ) |
| A Class | | (1,344,005 | ) | | | (1,535,236 | ) |
| B Class | | — | | | | (102,609 | ) |
| C Class | | (231,742 | ) | | | (222,320 | ) |
| R Class | | (176,128 | ) | | | (142,583 | ) |
| Decrease in net assets from distributions | | (65,293,021 | ) | | | (153,216,141 | ) |
| | | | | | | | |
| Capital Share Transactions | | | | | | | |
| Net increase (decrease) in net assets from capital share transactions | | (23,527,458 | ) | | | 84,068,886 | |
| | | | | | | | |
| Redemption Fees | | | | | | | |
| Increase in net assets from redemption fees | | 103,257 | | | | 174,977 | |
| | | | | | | | |
| Net increase (decrease) in net assets | | (303,973,156 | ) | | | 56,050,154 | |
| | | | | | | | |
| Net Assets | | | | | | | |
| Beginning of period | | 1,130,078,531 | | | | 1,074,028,377 | |
| End of period | | $826,105,375 | | | | $1,130,078,531 | |
| | | | | | | | |
| Accumulated net investment loss | | $(28,157,410 | ) | | | $(48,407,336 | ) |
See Notes to Financial Statements.
Notes to Financial Statements |
JUNE 30, 2012
1. Organization
American Century Quantitative Equity Funds, Inc. (the corporation) is registered under the Investment Company Act of 1940, as amended (the 1940 Act), as an open-end management investment company and is organized as a Maryland corporation. Global Gold Fund (the fund) is one fund in a series issued by the corporation. The fund is nondiversified as defined under the 1940 Act. The fund’s investment objective is to seek to realize a total return (capital growth and dividends) consistent with investment in securities of companies that are engaged in mining, processing, fabricating or distributing gold or other metals throughout the world.
The fund offers the Investor Class, the Institutional Class, the A Class, the C Class and the R Class. The A Class may incur an initial sales charge. The A Class and C Class may be subject to a contingent deferred sales charge. The share classes differ principally in their respective sales charges and distribution and shareholder servicing expenses and arrangements. The Institutional Class is made available to institutional shareholders or through financial intermediaries whose clients do not require the same level of shareholder and administrative services as shareholders of other classes. As a result, the Institutional Class is charged a lower unified management fee. On October 21, 2011, all outstanding B Class shares were converted to A Class shares and the fund discontinued offering the B Class.
2. Significant Accounting Policies
The following is a summary of significant accounting policies consistently followed by the fund in preparation of its financial statements. The financial statements are prepared in conformity with accounting principles generally accepted in the United States of America, which may require management to make certain estimates and assumptions at the date of the financial statements. Actual results could differ from these estimates.
Investment Valuations — The fund determines the fair value of its investments and computes its net asset value per share as of the close of regular trading (usually 4 p.m. Eastern time) on the New York Stock Exchange (NYSE) on each day the NYSE is open.
Equity securities that are listed or traded on a domestic securities exchange are valued at the last reported sales price or at the official closing price as provided by the exchange. Equity securities traded on foreign securities exchanges are typically valued at the closing price on the exchange where primarily traded or as of the close of the NYSE, if that is earlier. If no last sales price is reported, or if local convention or regulation so provides, the mean of the latest bid and asked prices is used. Depending on local convention or regulation, securities traded over-the-counter are valued at the mean of the latest bid and asked prices, the last sales price, or the official closing price. In its determination of fair value, the fund may review several factors including: market information specific to a security; news developments in U.S. and foreign markets; the performance of particular U.S. and foreign securities, indices, comparable securities, American Depositary Receipts, Exchange-Traded Funds, and other relevant market indicators.
Debt securities maturing within 60 days at the time of purchase may be valued at cost, plus or minus any amortized discount or premium or at the evaluated mean as provided by an independent pricing service. Evaluated mean prices are commonly derived through utilization of market models, which may consider, among other factors, trade data, quotations from dealers and active market makers, relevant yield curve and spread data, related sector levels, creditworthiness, and other relevant market information on the same or comparable securities.
Investments in open-end management investment companies are valued at the reported net asset value per share. Repurchase agreements are valued at cost.
The value of investments initially expressed in foreign currencies is translated into U.S. dollars at prevailing exchange rates.
If the fund determines that the market price for a portfolio security is not readily available or the valuation methods mentioned above do not reflect a security’s fair value, such security is valued as determined in good faith by the Board of Directors or its designee, in accordance with procedures adopted by the Board of Directors. Circumstances that may cause the fund to use these procedures to value a security include, but are not limited to: a security has been declared in default; trading in a security has been halted during the trading day; there is a foreign market holiday and no trading occurred; or an event occurred between the close of a foreign exchange and the NYSE that may affect the value of a security.
Security Transactions — Security transactions are accounted for as of the trade date. Net realized gains and losses are determined on the identified cost basis, which is also used for federal income tax purposes.
Investment Income — Dividend income less foreign taxes withheld, if any, is recorded as of the ex-dividend date. Interest income is recorded on the accrual basis and includes accretion of discounts and amortization of premiums.
Foreign Currency Translations — All assets and liabilities initially expressed in foreign currencies are translated into U.S. dollars at prevailing exchange rates at period end. The fund may enter into spot foreign currency exchange contracts to facilitate transactions denominated in a foreign currency. Purchases and sales of investment securities, dividend and interest income, spot foreign currency exchange contracts, and expenses are translated at the rates of exchange prevailing on the respective dates of such transactions. Net realized and unrealized foreign currency exchange gains or losses related to investment securities are a component of net realized gain (loss) on investment transactions and change in net unrealized appreciation (depreciation) on investments, respectively.
Repurchase Agreements — The fund may enter into repurchase agreements with institutions that American Century Investment Management, Inc. (ACIM) (the investment advisor) has determined are creditworthy pursuant to criteria adopted by the Board of Directors. The fund requires that the collateral, represented by securities, received in a repurchase transaction be transferred to the custodian in a manner sufficient to enable the fund to obtain those securities in the event of a default under the repurchase agreement. ACIM monitors, on a daily basis, the securities transferred to ensure the value, including accrued interest, of the securities under each repurchase agreement is equal to or greater than amounts owed to the fund under each repurchase agreement.
Joint Trading Account — Pursuant to an Exemptive Order issued by the Securities and Exchange Commission, the fund, along with certain other funds in the American Century Investments family of funds, may transfer uninvested cash balances into a joint trading account. These balances are invested in one or more repurchase agreements that are collateralized by U.S. Treasury or Agency obligations.
Income Tax Status — It is the fund’s policy to distribute substantially all net investment income and net realized gains to shareholders and to otherwise qualify as a regulated investment company under provisions of the Internal Revenue Code. The fund is no longer subject to examination by tax authorities for years prior to 2009. At this time, management believes there are no uncertain tax positions which, based on their technical merit, would not be sustained upon examination and for which it is reasonably possible that the total amounts of unrecognized tax benefits will significantly change in the next twelve months. Accordingly, no provision has been made for federal or state income taxes.
Multiple Class — All shares of the fund represent an equal pro rata interest in the net assets of the class to which such shares belong, and have identical voting, dividend, liquidation and other rights and the same terms and conditions, except for class specific expenses and exclusive rights to vote on matters affecting only individual classes. Income, non-class specific expenses, and realized and unrealized capital gains and losses of the fund are allocated to each class of shares based on their relative net assets.
Distributions to Shareholders — Distributions from net investment income, if any, are generally declared and paid semiannually. Distributions from net realized gains, if any, are generally declared and paid annually.
Redemption —The fund may impose a 1.00% redemption fee on shares held less than 60 days. The fee may not be applicable to all classes. The redemption fee is retained by the fund and helps cover transaction costs that long-term investors may bear when the fund sells securities to meet investor redemptions.
Indemnifications — Under the corporation’s organizational documents, its officers and directors are indemnified against certain liabilities arising out of the performance of their duties to the fund. In addition, in the normal course of business, the fund enters into contracts that provide general indemnifications. The maximum exposure under these arrangements is unknown as this would involve future claims that may be made against a fund. The risk of material loss from such claims is considered by management to be remote.
3. Fees and Transactions with Related Parties
Management Fees — The corporation has entered into a management agreement with ACIM, under which ACIM provides the fund with investment advisory and management services in exchange for a single, unified management fee (the fee) per class. The agreement provides that all expenses of managing and operating the fund, except distribution and service fees, brokerage expenses, taxes, interest, fees and expenses of the independent directors (including legal counsel fees), and extraordinary expenses, will be paid by ACIM. The fee is computed and accrued daily based on each class’s daily net assets and paid monthly in arrears. The fee consists of (1) an Investment Category Fee based on the daily net assets of the fund and certain other accounts managed by the investment advisor that are in the same broad investment category as the fund and (2) a Complex Fee based on the assets of all the funds in the American Century Investments family of funds. The rates for the Investment Category Fee range from 0.3380% to 0.5200%. The rates for the Complex Fee range from 0.2500% to 0.3100% for the Investor Class, A Class, B Class, C Class and R Class. The Institutional Class is 0.2000% less at each point within the Complex Fee range. The effective annual management fee for each class for the year ended June 30, 2012 was 0.68% for the Investor Class, A Class, C Class and R Class and 0.48% for the Institutional Class.
Distribution and Service Fees — The Board of Directors has adopted a separate Master Distribution and Individual Shareholder Services Plan for each of the A Class, B Class, C Class and R Class (collectively the plans), pursuant to Rule 12b-1 of the 1940 Act. The plans provide that the A Class will pay American Century Investment Services, Inc. (ACIS) an annual distribution and service fee of 0.25%. The plans provide that the B Class and C Class will each pay ACIS an annual distribution and service fee of 1.00%, of which 0.25% is paid for individual shareholder services and 0.75% is paid for distribution services. The plans provide that the R Class will pay ACIS an annual distribution and service fee of 0.50%. The fees are computed and accrued daily based on each class’s daily net assets and paid monthly in arrears. The fees are used to pay financial intermediaries for distribution and individual shareholder services. Fees incurred under the plans during the year ended June 30, 2012 are detailed in the Statement of Operations.
Related Parties — Certain officers and directors of the corporation are also officers and/or directors of American Century Companies, Inc., the parent of the corporation’s investment advisor, ACIM, the distributor of the corporation, ACIS, and the corporation’s transfer agent, American Century Services, LLC.
4. Investment Transactions
Purchases and sales of investment securities, excluding short-term investments, for the year ended June 30, 2012 were $79,864,966 and $163,535,638, respectively.
5. Capital Share Transactions
Transactions in shares of the fund were as follows:
| | Year ended June 30, 2012 | | Year ended June 30, 2011 | |
| | Shares | | Amount | | Shares | | Amount | |
| Investor Class/Shares Authorized | | 200,000,000 | | | | | 200,000,000 | | | |
| Sold | | 5,806,654 | | | $124,924,527 | | | 8,972,049 | | | $225,635,610 | |
| Issued in reinvestment of distributions | | 2,827,619 | | | 57,853,227 | | | 5,119,136 | | | 136,524,838 | |
| Redeemed | | (9,646,763 | ) | | (207,328,985 | ) | | (11,539,226 | ) | | (286,921,826 | ) |
| | | (1,012,490 | ) | | (24,551,231 | ) | | 2,551,959 | | | 75,238,622 | |
| Institutional Class/Shares Authorized | | 10,000,000 | | | | | | 10,000,000 | | | | |
| Sold | | 354,270 | | | 7,690,633 | | | 363,533 | | | 9,132,218 | |
| Issued in reinvestment of distributions | | 59,019 | | | 1,210,470 | | | 98,002 | | | 2,614,134 | |
| Redeemed | | (347,270 | ) | | (7,530,923 | ) | | (276,395 | ) | | (6,803,179 | ) |
| | | 66,019 | | | 1,370,180 | | | 185,140 | | | 4,943,173 | |
| A Class/Shares Authorized | | 20,000,000 | | | | | | 20,000,000 | | | | |
| Sold | | 613,953 | | | 12,775,556 | | | 601,435 | | | 14,958,572 | |
| Issued in reinvestment of distributions | | 59,626 | | | 1,209,218 | | | 97,614 | | | 2,586,084 | |
| Redeemed | | (690,337 | ) | | (14,041,150 | ) | | (671,729 | ) | | (16,648,701 | ) |
| | | (16,758 | ) | | (56,376 | ) | | 27,320 | | | 895,955 | |
| B Class/Shares Authorized | | N/A | | | | | | 10,000,000 | | | | |
| Sold | | 1,998 | | | 48,275 | | | 4,430 | | | 110,080 | |
| Issued in reinvestment of distributions | | — | | | — | | | 6,752 | | | 177,233 | |
| Redeemed | | (69,501 | ) | | (1,505,515 | ) | | (16,528 | ) | | (399,359 | ) |
| | | (67,503 | ) | | (1,457,240 | ) | | (5,346 | ) | | (112,046 | ) |
| C Class/Shares Authorized | | 10,000,000 | | | | | | 10,000,000 | | | | |
| Sold | | 44,299 | | | 998,056 | | | 74,941 | | | 1,859,020 | |
| Issued in reinvestment of distributions | | 8,033 | | | 160,254 | | | 10,909 | | | 286,073 | |
| Redeemed | | (41,633 | ) | | (893,049 | ) | | (27,908 | ) | | (668,753 | ) |
| | | 10,699 | | | 265,261 | | | 57,942 | | | 1,476,340 | |
| R Class/Shares Authorized | | 10,000,000 | | | | | | 10,000,000 | | | | |
| Sold | | 89,907 | | | 1,917,174 | | | 93,224 | | | 2,283,666 | |
| Issued in reinvestment of distributions | | 8,693 | | | 176,128 | | | 10,498 | | | 278,416 | |
| Redeemed | | (55,906 | ) | | (1,191,354 | ) | | (39,432 | ) | | (935,240 | ) |
| | | 42,694 | | | 901,948 | | | 64,290 | | | 1,626,842 | |
| Net increase (decrease) | | (977,339 | ) | | $(23,527,458 | ) | | 2,881,305 | | | $84,068,886 | |
6. Fair Value Measurements
The fund’s securities valuation process is based on several considerations and may use multiple inputs to determine the fair value of the positions held by the fund. In conformity with accounting principles generally accepted in the United States of America, the inputs used to determine a valuation are classified into three broad levels as follows:
| • | Level 1 valuation inputs consist of unadjusted quoted prices in an active market for identical securities; |
| • | Level 2 valuation inputs consist of direct or indirect observable market data (including quoted prices for similar securities, evaluations of subsequent market events, interest rates, prepayment speeds, credit risk, etc.); or |
| • | Level 3 valuation inputs consist of unobservable data (including a fund’s own assumptions). |
The level classification is based on the lowest level input that is significant to the fair valuation measurement. The valuation inputs are not necessarily an indication of the risks associated with investing in these securities or other financial instruments.
The following is a summary of the level classifications as of period end. The Schedule of Investments provides additional information on the fund’s portfolio holdings.
| | Level 1 | | Level 2 | | Level 3 |
| Investment Securities | | | | | | | | |
| Foreign Common Stocks | | $279,730,117 | | | | $409,665,059 | | | | — | |
| Domestic Common Stocks | | 113,094,456 | | | | 13,604,605 | | | | — | |
| Temporary Cash Investments | | 2,892,688 | | | | 7,282,326 | | | | — | |
| Total Value of Investment Securities | | $395,717,261 | | | | $430,551,990 | | | | — | |
7. Risk Factors
There are certain risks involved in investing in foreign securities. These risks include those resulting from future adverse political, social and economic developments, fluctuations in currency exchange rates, the possible imposition of exchange controls, and other foreign laws or restrictions. Investing in emerging markets may accentuate these risks.
The fund concentrates its investments in a narrow segment of the total market. Because of this, the fund may be subject to greater risk and market fluctuations than a portfolio representing a broader range of industries.
Gold stocks are generally considered speculative because of high share price volatility. The price of gold will likely impact the value of the companies in which the fund invests. The price of gold will fluctuate, sometimes considerably. Though many investors believe that gold investments hedge against inflation, currency devaluations and stock market declines, there is no guarantee that these historical inverse relationships will continue.
8. Federal Tax Information
The tax character of distributions paid during the years ended June 30, 2012 and June 30, 2011 were as follows:
| | | 2012 | | 2011 |
| Distributions Paid From | | | | | | |
| Ordinary income | | | — | | | | $80,549,110 | |
| Long-term capital gains | | | $65,293,021 | | | | $72,667,031 | |
The book-basis character of distributions made during the year from net investment income or net realized gains may differ from their ultimate characterization for federal income tax purposes. These differences reflect the differing character of certain income items and net realized gains and losses for financial statement and tax purposes, and may result in reclassification among certain capital accounts on the financial statements.
The reclassifications, which are primarily due to net operating losses and passive foreign investment company transactions, were made to capital $(8,138,409), accumulated net investment loss $17,822,120, and accumulated net realized loss $(9,683,711).
As of June 30, 2012, the federal tax cost of investments and the components of distributable earnings on a tax-basis were as follows:
| | | | | |
| Federal tax cost of investments | | | $486,062,950 | |
| Gross tax appreciation of investments | | | $381,097,441 | |
| Gross tax depreciation of investments | | | (40,891,140 | ) |
| Net tax appreciation (depreciation) of investments | | | $340,206,301 | |
Net tax appreciation (depreciation) on translation of assets and liabilities in foreign currencies | | | $1,448 | |
| Net tax appreciation (depreciation) | | | $340,207,749 | |
| Undistributed ordinary income | | | — | |
| Post-October capital loss deferral | | | $(4,939,853 | ) |
The difference between book-basis and tax-basis cost and unrealized appreciation (depreciation) is attributable primarily to the tax deferral of losses on wash sales and the realization to ordinary income for tax purposes of unrealized gains on investments in passive foreign investment companies.
The loss deferral represents certain qualified losses that the fund has elected to treat as having been incurred in the following fiscal year for federal income tax purposes.
| For a Share Outstanding Throughout the Years Ended June 30 (except as noted) |
| Per-Share Data | Ratios and Supplemental Data |
| | | Income From Investment Operations: | Distributions From: | | | | Ratio to Average Net Assets of: | | |
| | Net Asset Value, Beginning of Period | Net Investment Income (Loss)(1) | Net Realized and Unrealized Gain (Loss) | Total From Investment Operations | Net Investment Income | Net Realized Gains | Total Distributions | Redemption Fees(1) | Net Asset Value, End of Period | Total Return(2) | Operating Expenses | Net Investment Income (Loss) | Portfolio Turnover Rate | Net Assets, End of Period (in thousands) |
| Investor Class |
| 2012 | $22.90 | 0.05 | (4.50) | (4.45) | — | (1.37) | (1.37) | —(3) | $17.08 | (20.43)% | 0.69% | 0.23% | 8% | $789,135 |
| 2011 | $23.11 | (0.04) | 3.06 | 3.02 | (1.60) | (1.63) | (3.23) | —(3) | $22.90 | 11.44% | 0.69% | (0.18)% | 32% | $1,081,258 |
| 2010 | $16.24 | (0.03) | 7.03 | 7.00 | (0.13) | — | (0.13) | —(3) | $23.11 | 43.18% | 0.69% | (0.16)% | 24% | $1,032,309 |
| 2009 | $23.54 | (0.01) | (5.35) | (5.36) | —(3) | (1.94) | (1.94) | —(3) | $16.24 | (21.19)% | 0.70% | (0.09)% | 20% | $792,814 |
| 2008 | $18.26 | (0.04) | 5.42 | 5.38 | (0.11) | — | (0.11) | 0.01 | $23.54 | 29.61% | 0.68% | (0.17)% | 17% | $1,136,741 |
| Institutional Class |
| 2012 | $22.92 | 0.10 | (4.52) | (4.42) | — | (1.37) | (1.37) | —(3) | $17.13 | (20.28)% | 0.49% | 0.43% | 8% | $15,971 |
| 2011 | $23.13 | 0.01 | 3.06 | 3.07 | (1.65) | (1.63) | (3.28) | —(3) | $22.92 | 11.64% | 0.49% | 0.02% | 32% | $19,854 |
| 2010 | $16.25 | 0.01 | 7.04 | 7.05 | (0.17) | — | (0.17) | —(3) | $23.13 | 43.51% | 0.49% | 0.04% | 24% | $15,751 |
| 2009 | $23.55 | 0.01 | (5.34) | (5.33) | (0.03) | (1.94) | (1.97) | —(3) | $16.25 | (21.04)% | 0.50% | 0.11% | 20% | $9,076 |
2008(4) | $21.67 | 0.01 | 1.99 | 2.00 | (0.13) | — | (0.13) | 0.01 | $23.55 | 9.37% | 0.48%(5) | 0.05%(5) | 17%(6) | $10,353 |
A Class(7) |
| 2012 | $22.72 | —(3) | (4.45) | (4.45) | — | (1.37) | (1.37) | —(3) | $16.90 | (20.60)% | 0.94% | (0.02)% | 8% | $15,550 |
| 2011 | $22.95 | (0.10) | 3.03 | 2.93 | (1.53) | (1.63) | (3.16) | —(3) | $22.72 | 11.15% | 0.94% | (0.43)% | 32% | $21,292 |
| 2010 | $16.13 | (0.08) | 6.97 | 6.89 | (0.07) | — | (0.07) | —(3) | $22.95 | 42.80% | 0.94% | (0.41)% | 24% | $20,879 |
| 2009 | $23.46 | (0.06) | (5.33) | (5.39) | — | (1.94) | (1.94) | —(3) | $16.13 | (21.40)% | 0.95% | (0.34)% | 20% | $16,866 |
| 2008 | $18.22 | (0.09) | 5.40 | 5.31 | (0.08) | — | (0.08) | 0.01 | $23.46 | 29.28% | 0.93% | (0.42)% | 17% | $8,506 |
| For a Share Outstanding Throughout the Years Ended June 30 (except as noted) |
| Per-Share Data | Ratios and Supplemental Data |
| | | Income From Investment Operations: | Distributions From: | | | | Ratio to Average Net Assets of: | | |
| | Net Asset Value, Beginning of Period | Net Investment Income (Loss)(1) | Net Realized and Unrealized Gain (Loss) | Total From Investment Operations | Net Investment Income | Net Realized Gains | Total Distributions | Redemption Fees(1) | Net Asset Value, End of Period | Total Return(2) | Operating Expenses | Net Investment Income (Loss) | Portfolio Turnover Rate | Net Assets, End of Period (in thousands) |
| C Class |
| 2012 | $22.46 | (0.16) | (4.37) | (4.53) | — | (1.37) | (1.37) | —(3) | $16.56 | (21.21)% | 1.69% | (0.77)% | 8% | $2,826 |
| 2011 | $22.72 | (0.29) | 2.99 | 2.70 | (1.33) | (1.63) | (2.96) | —(3) | $22.46 | 10.31% | 1.69% | (1.18)% | 32% | $3,593 |
| 2010 | $16.02 | (0.23) | 6.93 | 6.70 | — | — | — | —(3) | $22.72 | 41.82% | 1.69% | (1.16)% | 24% | $2,318 |
| 2009 | $23.48 | (0.18) | (5.34) | (5.52) | — | (1.94) | (1.94) | —(3) | $16.02 | (21.98)% | 1.70% | (1.09)% | 20% | $1,006 |
2008(4) | $21.67 | (0.20) | 2.00 | 1.80 | — | — | — | 0.01 | $23.48 | 8.40% | 1.68%(5) | (1.17)%(5) | 17%(6) | $151 |
| R Class |
| 2012 | $22.73 | (0.05) | (4.45) | (4.50) | — | (1.37) | (1.37) | —(3) | $16.86 | (20.82)% | 1.19% | (0.27)% | 8% | $2,623 |
| 2011 | $22.96 | (0.16) | 3.02 | 2.86 | (1.46) | (1.63) | (3.09) | —(3) | $22.73 | 10.87% | 1.19% | (0.68)% | 32% | $2,567 |
| 2010 | $16.13 | (0.13) | 6.98 | 6.85 | (0.02) | — | (0.02) | —(3) | $22.96 | 42.50% | 1.19% | (0.66)% | 24% | $1,117 |
| 2009 | $23.52 | (0.11) | (5.34) | (5.45) | — | (1.94) | (1.94) | —(3) | $16.13 | (21.62)% | 1.20% | (0.59)% | 20% | $313 |
2008(4) | $21.67 | (0.12) | 2.01 | 1.89 | (0.05) | — | (0.05) | 0.01 | $23.52 | 8.83% | 1.18%(5) | (0.71)%(5) | 17%(6) | $27 |
Notes to Financial Highlights
| (1) | Computed using average shares outstanding throughout the period. |
| (2) | Total returns are calculated based on the net asset value of the last business day and do not reflect applicable sales charges, if any. Total returns for periods less than one year are not annualized. |
| (3) | Per-share amount was less than $0.005. |
| (4) | September 28, 2007 (commencement of sale) through June 30, 2008. |
| (6) | Portfolio turnover is calculated at the fund level. Percentage indicated was calculated for the year ended June 30, 2008. |
| (7) | Prior to September 4, 2007, the A Class was referred to as the Advisor Class. |
See Notes to Financial Statements.
Report of Independent Registered Public Accounting Firm |
To the Directors of the American Century Quantitative Equity Funds, Inc.
and Shareholders of the Global Gold Fund:
In our opinion, the accompanying statement of assets and liabilities, including the schedule of investments, and the related statements of operations and of changes in net assets and the financial highlights present fairly, in all material respects, the financial position of the Global Gold Fund (one of the fourteen funds comprising the American Century Quantitative Equity Funds, Inc., hereafter referred to as the “Fund”) at June 30, 2012, the results of its operations for the year then ended, the changes in its net assets for each of the two years in the period then ended and the financial highlights for each of the periods presented, in conformity with accounting principles generally accepted in the United States of America. These financial statements and financial highlights (hereafter referred to as “financial statements”) are the responsibility of the Fund’s management; our responsibility is to express an opinion on these financial statements based on our audits. We conducted our audits of these financial statements in accordance with the standards of the Public Company Accounting Oversight Board (United States). Those standards require that we plan and perform the audit to obtain reasonable assurance about whether the financial statements are free of material misstatement. An audit includes examining, on a test basis, evidence supporting the amounts and disclosures in the financial statements, assessing the accounting principles used and significant estimates made by management, and evaluating the overall financial statement presentation. We believe that our audits, which included confirmation of securities at June 30, 2012 by correspondence with the custodian and brokers, provide a reasonable basis for our opinion.
PricewaterhouseCoopers LLP
Kansas City, Missouri
August 21, 2012
Board of Directors
The individuals listed below serve as directors of the funds. Each director will continue to serve in this capacity until death, retirement, resignation or removal from office. The mandatory retirement age for directors who are not “interested persons,” as that term is defined in the Investment Company Act (independent directors), is 73. However, the mandatory retirement age may be extended for a period not to exceed two years with the approval of the remaining independent directors.
Mr. Thomas is the only director who is an “interested person” because he currently serves as President and Chief Executive Officer of American Century Companies, Inc. (ACC), the parent company of American Century Investment Management, Inc. (ACIM or the advisor).
The other directors (more than three-fourths of the total number) are independent; that is, they have never been employees, directors or officers of, and have no financial interest in, ACC or any of its wholly owned, direct or indirect, subsidiaries, including ACIM, American Century Investment Services, Inc. (ACIS) and American Century Services, LLC (ACS). The directors serve in this capacity for eight (in the case of Mr. Thomas, 15) registered investment companies in the American Century Investments family of funds.
The following table presents additional information about the directors. The mailing address for each director other than Mr. Thomas is 1665 Charleston Road, Mountain View, California 94043. The mailing address for Mr. Thomas is 4500 Main Street, Kansas City, Missouri 64111.
Name (Year of Birth) | Position(s) Held with Funds | Length of Time Served | | Principal Occupation(s) During Past 5 Years | | Number of American Century Portfolios Overseen by Director | Other Directorships Held During Past 5 Years |
| Independent Directors |
Tanya S. Beder (1955) | Director | Since 2011 | | Chairman, SBCC Group Inc. (investment advisory services)(2006 to present); Fellow in Practice, International Center for Finance, Yale University School of Management (1985 to present) | | 42 | CYS Investments, Inc. (specialty finance company) |
Jeremy I. Bulow (1954) | Director | Since 2011 | | Professor of Economics, Stanford University, Graduate School of Business (1979 to present) | | 42 | None |
Ronald J. Gilson (1946) | Director and Chairman of the Board | Since 1995 | | Charles J. Meyers Professor of Law and Business, Stanford Law School (1979 to present); Marc and Eva Stern Professor of Law and Business, Columbia University School of Law (1992 to present) | | 42 | None |
Name (Year of Birth) | Position(s) Held with Funds | Length of Time Served | | Principal Occupation(s) During Past 5 Years | | Number of American Century Portfolios Overseen by Director | Other Directorships Held During Past 5 Years |
| Independent Directors |
Frederick L. A. Grauer (1946) | Director | Since 2008 | | Senior Advisor, BlackRock, Inc. (investment management firm) (2010 to 2011); Senior Advisor, Barclays Global Investors (investment management firm) (2003 to 2009) | | 42 | None |
Peter F. Pervere (1947) | Director | Since 2007 | | Retired | | 42 | Intraware, Inc. (2003 to 2009) |
Myron S. Scholes (1941) | Director | Since 1980 | | Chairman, Platinum Grove Asset Management, L.P. (asset manager) (1999 to 2009); Frank E. Buck Professor of Finance-Emeritus, Stanford Graduate School of Business (1996 to present) | | 42 | Dimensional Fund Advisors (investment advisor); CME Group, Inc. (futures and options exchange) |
John B. Shoven (1947) | Director | Since 2002 | | Professor of Economics, Stanford University (1973 to present) | | 42 | Cadence Design Systems; Exponent; Financial Engines |
| |
| Interested Director |
Jonathan S. Thomas (1963) | Director and President | Since 2007 | | President and Chief Executive Officer, ACC (March 2007 to present); Chief Administrative Officer, ACC (February 2006 to February 2007); Executive Vice President, ACC (November 2005 to February 2007). Also serves as Chief Executive Officer and Manager, ACS; Executive Vice President, ACIM; Director, ACC, ACIM and other ACC subsidiaries | | 108 | None |
Officers
The following table presents certain information about the executive officers of the funds. Each officer serves as an officer for each of the 15 investment companies in the American Century family of funds, unless otherwise noted. No officer is compensated for his or her service as an officer of the funds. The listed officers are interested persons of the funds and are appointed or re-appointed on an annual basis. The mailing address for each of the officers listed below is 4500 Main Street, Kansas City, Missouri 64111.
Name (Year of Birth) | Offices with the Funds | Principal Occupation(s) During the Past Five Years |
Jonathan S. Thomas (1963) | Director and President since 2007 | President and Chief Executive Officer, ACC (March 2007 to present); Chief Administrative Officer, ACC (February 2006 to February 2007); Executive Vice President, ACC (November 2005 to February 2007). Also serves as Chief Executive Officer and Manager, ACS; Executive Vice President, ACIM; Director, ACC, ACIM and other ACC subsidiaries |
Barry Fink (1955) | Executive Vice President since 2007 | Chief Operating Officer and Executive Vice President, ACC (September 2007 to present); President, ACS (October 2007 to present); Managing Director, Morgan Stanley (2000 to 2007). Also serves as Manager, ACS and Director, ACC and certain ACC subsidiaries |
Maryanne L. Roepke (1956) | Chief Compliance Officer since 2006 and Senior Vice President since 2000 | Chief Compliance Officer, American Century funds, ACIM and ACS (August 2006 to present). Also serves as Senior Vice President, ACS |
Charles A. Etherington (1957) | General Counsel since 2007 and Senior Vice President since 2006 | Attorney, ACC (February 1994 to present); Vice President, ACC (November 2005 to present), General Counsel, ACC (March 2007 to present); Also serves as General Counsel, ACIM, ACS, ACIS and other ACC subsidiaries; and Senior Vice President, ACIM and ACS |
C. Jean Wade (1964) | Vice President, Treasurer and Chief Financial Officer since 2012 | Vice President, ACS (February 2000 to present) |
Robert J. Leach (1966) | Vice President since 2006 and Assistant Treasurer since 2012 | Vice President, ACS (February 2000 to present) |
David H. Reinmiller (1963) | Vice President since 2001 | Attorney, ACC (January 1994 to present); Associate General Counsel, ACC (January 2001 to present); Also serves as Vice President, ACIM and ACS |
Ward D. Stauffer (1960) | Secretary since 2005 | Attorney, ACC (June 2003 to present) |
The Statement of Additional Information has additional information about the fund’s directors and is available without charge, upon request, by calling 1-800-345-2021.
Approval of Management Agreement |
At a meeting held on June 14, 2012, the Fund’s Board of Directors/Trustees unanimously approved the renewal of the management agreement pursuant to which American Century Investment Management, Inc. (the “Advisor”) acts as the investment advisor for the Fund. Under Section 15(c) of the Investment Company Act, contracts for investment advisory services are required to be reviewed, evaluated, and approved by a majority of a fund’s independent
directors/trustees (the “Directors”) each year.
As a part of the approval process, the Board requested and reviewed extensive data and information compiled by the Advisor and certain independent providers of evaluation data concerning the Fund and the services provided to the Fund by the Advisor. This review was in addition to the oversight and evaluation undertaken by the Board and its committees on a continuous basis throughout the year and included, but was not limited to the following:
| • | the nature, extent, and quality of investment management, shareholder services, and other services provided by the Advisor to the Fund; |
| • | the wide range of other programs and services the Advisor provides to the Fund and its shareholders on a routine and non-routine basis; |
| • | the investment performance of the fund, including data comparing the Fund’s performance to appropriate benchmarks and/or a peer group of other mutual funds with similar investment objectives and strategies; |
| • | data comparing the cost of owning the Fund to the cost of owning similar funds; |
| • | the Advisor’s compliance policies, procedures, and regulatory experience; |
| • | financial data showing the cost of services provided to the Fund, the profitability of the Fund to the Advisor, and the overall profitability of the Advisor; |
| • | data comparing services provided and charges to other investment management clients of the Advisor; and |
| • | •consideration of collateral benefits derived by the Advisor from the management of the Fund and any potential economies of scale relating thereto. |
In keeping with its practice, the Board held two in-person meetings to review and discuss the information provided. The Board also had the benefit of the advice of its independent counsel throughout the period.
Factors Considered
The Directors considered all of the information provided by the Advisor, the independent data providers, and the Board’s independent counsel, and evaluated such information for the Fund. In connection with their review, the Directors did not identify any single factor as being all-important or controlling, and each Director may have attributed different levels of importance to different factors. In deciding to renew the management agreement, the Board based its decision on a number of factors, including the following:
Nature, Extent and Quality of Services — Generally. Under the management agreement, the Advisor is responsible for providing or arranging for all services necessary for the operation of the Fund. The Board noted that under the management agreement, the Advisor provides or arranges at its own expense a wide variety of services including:
| • | constructing and designing the Fund |
| • | portfolio research and security selection |
| • | initial capitalization/funding |
| • | daily valuation of the Fund’s portfolio |
| • | shareholder servicing and transfer agency, including shareholder confirmations, recordkeeping, and communications |
| • | regulatory and portfolio compliance |
| • | marketing and distribution |
The Board noted that many of these services have expanded over time both in terms of quantity and complexity in response to shareholder demands, competition in the industry, changing distribution channels, and the changing regulatory environment.
Investment Management Services. The nature of the investment management services provided to the Fund is quite complex and allows Fund shareholders access to professional money management, instant diversification of their investments within an asset class, the opportunity to easily diversify among asset classes by investing in or exchanging among various American Century Investments funds, and liquidity. In evaluating investment performance, the Board expects the Advisor to manage the Fund in accordance with its investment objectives and approved strategies. Further, the Directors recognize that the Advisor has an obligation to seek the best execution of fund trades. In providing these services, the Advisor utilizes teams of investment professionals (portfolio managers, analysts, research assistants, and securities traders) who require extensive information technology, research, training, compliance and other systems to conduct their business. The Board, directly and through its Portfolio Committee, regularly reviews investment performance information for the Fund, together with comparative information for appropriate benchmarks and/or peer groups of similarly-managed funds, over different time horizons. The Directors also review detailed performance information during the management agreement approval
process. If performance concerns are identified, the Fund receives special reviews until performance improves, during which the Board discusses with the Advisor the reasons for such results (e.g., market conditions, security selection) and any efforts being undertaken to improve performance. The Board found the investment management services provided by the Advisor to the Fund to meet or exceed industry standards. More detailed information about the Fund’s performance can be found in the Performance and Portfolio Commentary sections of this report.
Shareholder and Other Services. Under the management agreement, the Advisor provides the Fund with a comprehensive package of transfer agency, shareholder, and other services. The Board, directly and through various committees of the Board, regularly reviews reports and evaluations of such services at its regular meetings. These reports include, but are not limited to, information regarding the operational efficiency and accuracy of the shareholder and transfer agency services provided, staffing levels, shareholder satisfaction (as measured by external as well as internal sources), technology support, new products and services offered to Fund shareholders, securities trading activities, portfolio valuation services, auditing services, and legal and operational compliance activities. Certain aspects of shareholder and transfer agency service level efficiency and the quality of securities trading activities are measured by independent third party providers and are presented in comparison to other fund groups not managed by the Advisor. The Board found the services provided by the Advisor to the Fund under the management agreement to be competitive and of high quality.
Costs of Services and Profitability. The Advisor provides detailed information concerning its cost of providing various services to the Fund, its profitability in managing the Fund, its overall profitability, and its financial condition. The Directors have reviewed with the Advisor the methodology used to prepare this financial information. The financial information regarding the Advisor is considered in evaluating the Advisor’s financial condition, ability to continue to provide services under the management agreement, and the reasonableness of the current management fee. The Board concluded that the Advisor’s profits were reasonable in light of the services provided to the Fund.
Ethics. The Board generally considers the Advisor’s commitment to providing quality services to shareholders and to conducting its business ethically. They noted that the Advisor’s practices generally meet or exceed industry best practices.
Economies of Scale. The Board also reviewed information provided by the Advisor regarding the possible existence of economies of scale in connection with the management of the Fund. The Board concluded that economies of scale are difficult to measure and predict with precision, especially on a fund-by-fund basis. The Board concluded that the Advisor is appropriately sharing economies of scale through its competitive fee structure, offering competitive fees from fund inception, and through reinvestment in its business to provide shareholders additional content and services.
Comparison to Other Funds’ Fees. The management agreement provides that the Fund pay the Advisor a single, all-inclusive (or unified) management fee for providing all services necessary for the management and operation of the Fund, other than brokerage expenses, taxes, interest, extraordinary expenses, and the fees and expenses of the Fund’s independent directors (including their independent legal counsel) and expenses incurred in connection with the provision of shareholder services and distribution services under a plan adopted pursuant to Rule 12b-1 under the 1940 Act. Under the unified fee structure, the Advisor is responsible for providing all investment advisory, custody, audit, administrative, compliance, recordkeeping, marketing and shareholder services, or arranging and supervising third parties to provide such services. By contrast, most other funds are charged a variety of fees, including an investment advisory fee, a transfer agency fee, an administrative fee, distribution charges and other expenses. Other than their investment advisory fees and any applicable Rule 12b-1 distribution fees, all other components of the total fees charged by these other funds may be increased without shareholder approval. The Board believes the unified fee structure is a benefit to Fund shareholders because it clearly discloses to shareholders the cost of owning Fund shares, and, since the unified fee cannot be increased without a vote of Fund shareholders, it shifts to the Advisor the risk of increased costs of operating the Fund and provides a direct incentive to minimize administrative inefficiencies. Part of the Board’s analysis of fee levels involves reviewing certain evaluative data compiled by an independent provider and comparing the Fund’s unified fee to the total expense ratio of other funds in the Fund’s peer group. The Board concluded that the management fee paid by the Fund to the Advisor under the management agreement is reasonable in light of the services provided to the Fund.
Comparison to Fees and Services Provided to Other Clients of the Advisor. The Board also requested and received information from the Advisor concerning the nature of the services, fees, costs and profitability of its advisory services to advisory clients other than the Fund. They observed that these varying types of client accounts require different services and involve different regulatory and entrepreneurial risks than the management of the Fund. The Board analyzed this information and concluded that the fees charged and services provided to the Fund were reasonable by comparison.
Collateral or “Fall-Out” Benefits Derived by the Advisor. The Board considered the existence of collateral benefits the Advisor may receive as a result of its relationship with the Fund. They concluded that the Advisor’s primary business is managing mutual funds and it generally does not use fund or shareholder information to generate profits in other lines of business, and therefore does not derive any significant collateral benefits from them. The Board noted that the Advisor receives proprietary research from broker-dealers that execute fund portfolio transactions and concluded that this research is likely to benefit Fund shareholders. The Board also determined that the Advisor is able to provide investment management services to certain clients other than the Fund, at least in part, due to its existing infrastructure built to serve the fund complex. The Board concluded, however, that the assets of those other clients are not material to the analysis and, where applicable, may be included with the assets of the Fund to determine breakpoints in the management fee schedule.
Existing Relationship. The Board also considered whether there was any reason for not continuing the existing arrangement with the Advisor. In this regard, the Board was mindful of the potential disruptions of the Fund’s operations and various risks, uncertainties, and other effects that could occur as a result of a decision not to continue such relationship. In particular, the Board recognized that most shareholders have invested in the Fund on the strength of the Advisor’s industry standing and reputation and in the expectation that the Advisor will have a continuing role in providing advisory services to the Fund.
Conclusion of the Directors. As a result of this process, the Board, including all of the independent directors and assisted by the advice of independent legal counsel, taking into account all of the factors discussed above and the information provided by the Advisor and others, concluded that the management agreement between the Fund and the Advisor is fair and reasonable in light of the services provided and should be renewed.
Retirement Account Information
As required by law, distributions you receive from certain IRAs, or 403(b), 457 and qualified plans are subject to federal income tax withholding, unless you elect not to have withholding apply. Tax will be withheld on the total amount withdrawn even though you may be receiving amounts that are not subject to withholding, such as nondeductible contributions. In such case, excess amounts of withholding could occur. You may adjust your withholding election so that a greater or lesser amount will be withheld.
If you don’t want us to withhold on this amount, you must notify us to not withhold the federal income tax. You may notify us in writing or in certain situations by telephone or through other electronic means. You have the right to revoke your withholding election at any time and any election you make may remain in effect until revoked by filing a new election.
Remember, even if you elect not to have income tax withheld, you are liable for paying income tax on the taxable portion of your withdrawal. If you elect not to have income tax withheld or you don’t have enough income tax withheld, you may be responsible for payment of estimated tax. You may incur penalties under the estimated tax rules if your withholding and estimated tax payments are not sufficient. You can reduce or defer the income tax on a distribution by directly or indirectly rolling such distribution over to another IRA or eligible plan. You should consult your tax advisor for additional information.
State tax will be withheld if, at the time of your distribution, your address is within one of the mandatory withholding states and you have federal income tax withheld. State taxes will be withheld from your distribution in accordance with the respective state rules.
Proxy Voting Guidelines
American Century Investment Management, Inc., the fund’s investment advisor, is responsible for exercising the voting rights associated with the securities purchased and/or held by the fund. A description of the policies and procedures the advisor uses in fulfilling this responsibility is available without charge, upon request, by calling 1-800-345-2021. It is also available on American Century Investments’ website at americancentury.com and on the Securities and Exchange Commission’s website at sec.gov. Information regarding how the investment advisor voted proxies relating to portfolio securities during the most recent 12-month period ended June 30 is available on the “About Us” page at americancentury.com. It is also available at sec.gov.
Quarterly Portfolio Disclosure
The fund files its complete schedule of portfolio holdings with the Securities and Exchange Commission (SEC) for the first and third quarters of each fiscal year on Form N-Q. The fund’s Forms N-Q are available on the SEC’s website at sec.gov, and may be reviewed and copied at the SEC’s Public Reference Room in Washington, DC. Information on the operation of the Public Reference Room may be obtained by calling 1-800-SEC-0330. The fund also makes its complete schedule of portfolio holdings for the most recent quarter of its fiscal year available on its website at americancentury.com and, upon request, by calling 1-800-345-2021.
Other Tax Information
The following information is provided pursuant to provisions of the Internal Revenue Code.
The fund hereby designates $65,293,021, or up to the maximum amount allowable, as long-term capital gain distributions for the fiscal year ended June 30, 2012.
For the fiscal year ended June 30, 2012, the fund intends to pass through to shareholders $971,920, or up to the maximum amount allowable, as a foreign tax credit which represents taxes paid on income derived from sources within foreign countries or possessions of the United States. During the fiscal year ended June 30, 2012, the fund earned $8,530,361 from income derived from foreign sources. Foreign source income and foreign tax expense per outstanding share on June 30, 2012 are $0.1763 and $0.0201, respectively.
| Contact Us | americancentury.com |
| Automated Information Line | 1-800-345-8765 |
| Investor Services Representative | 1-800-345-2021 or 816-531-5575 |
| Investors Using Advisors | 1-800-378-9878 |
| Business, Not-For-Profit, Employer-Sponsored Retirement Plans | 1-800-345-3533 |
| Banks and Trust Companies, Broker-Dealers, Financial Professionals, Insurance Companies | 1-800-345-6488 |
| Telecommunications Device for the Deaf | 1-800-634-4113 |
American Century Quantitative Equity Funds, Inc.
Investment Advisor:
American Century Investment Management, Inc.
Kansas City, Missouri
This report and the statements it contains are submitted for the general information of our shareholders. The report is not authorized for distribution to prospective investors unless preceded or accompanied by an effective prospectus.
©2012 American Century Proprietary Holdings, Inc. All rights reserved.
CL-ANN-75837 1208
ANNUAL REPORT JUNE 30, 2012
| | Equity Market Neutral Fund |
| President’s Letter | 2 |
| Market Perspective | 3 |
| Performance | 4 |
| Portfolio Commentary | 6 |
| Fund Characteristics | 8 |
| Shareholder Fee Example | 9 |
| Schedule of Investments | 11 |
| Statement of Assets and Liabilities | 20 |
| Statement of Operations | 21 |
| Statement of Changes in Net Assets | 22 |
| Notes to Financial Statements | 23 |
| Financial Highlights | 29 |
| Report of Independent Registered Public Accounting Firm | 31 |
| Management | 32 |
| Approval of Management Agreement | 35 |
| Additional Information | 40 |
Any opinions expressed in this report reflect those of the author as of the date of the report, and do not necessarily represent the opinions of American Century Investments® or any other person in the American Century Investments organization. Any such opinions are subject to change at any time based upon market or other conditions and American Century Investments disclaims any responsibility to update such opinions. These opinions may not be relied upon as investment advice and, because investment decisions made by American Century Investments funds are based on numerous factors, may not be relied upon as an indication of trading intent on behalf of any American Century Investments fund. Security examples are used for representational purposes only and are not intended as recommendations to purchase or sell securities. Performance information for comparative indices and securities is provided to American Century Investments by third party vendors. To the best of American Century Investments’ knowledge, such information is accurate at the time of printing.
Dear Investor:
Thank you for reviewing this annual report for the period ended June 30, 2012. Our report offers investment performance and portfolio information, presented with the expert perspective of our portfolio management team.
This report remains one of our most important vehicles for conveying information about fund returns, as well as market factors and strategies that affected fund performance. For additional, updated information, we encourage you to visit our website, americancentury.com. Click on the “Fund Performance” and “Insights & News” headings at the top of our Individual Investors site.
Flight to Quality as Economic and Financial Uncertainties Resurfaced
During the second half of 2011 and the first half of 2012, the global economy and financial markets struggled to move beyond the lingering aftereffects of the 2008 Financial Crisis and Great Recession. Global economic fundamentals have improved since 2008, but weakened since 2010, with increased uncertainty surrounding near-term economic growth levels in major developed economies such as the U.S., Japan, and Europe. There were also questions about near-term growth levels in influential emerging economies such as China.
These near-term uncertainties manifested themselves in asset returns for the 12 months ended June 30, 2012. Assets perceived to be “safe-haven” investments rallied—the 30-year U.S. Treasury bond posted a 39% total return. At the other end of the spectrum, international stock returns for U.S. investors were undermined by a combination of risk-averse investing attitudes, weakening global economic growth, and a stronger U.S. dollar versus the euro and currencies of other struggling economies. Commodity prices also plunged during the period.
Unfortunately, the instability that triggered much of this flight-to-quality trading remains largely in place, and the coming months may bring additional uncertainties about the U.S. presidential election and what might happen when various U.S. tax cuts and other stimulative measures expire in 2013 (the so-called “Fiscal Cliff”). In this uncertain, unstable environment, we continue to believe in a disciplined, diversified, long-term investment approach, using both stocks and bonds, as appropriate. We appreciate your continued trust in us during these unsettled times.
Sincerely,
Jonathan Thomas
President and Chief Executive Officer
American Century Investments
By Scott Wittman, Chief Investment Officer, Quantitative Equity
and Asset Allocation
U.S. Stocks Mixed but Generally Higher
The U.S. stock market faced significant volatility during the 12 months ended June 30, 2012, but ultimately posted positive overall returns. As the reporting period began, stocks were in the midst of an accelerating market decline as evidence of a slowdown in U.S. economic activity and a worsening sovereign debt crisis in Europe put downward pressure on the equity market.
In early October, however, the equity market bottomed and reversed course, enjoying a substantial rebound through the fourth quarter of 2011 and first quarter of 2012. Investors grew more optimistic as signs of improving economic activity quashed recession fears; in particular, job growth consistently exceeded expectations, driving the unemployment rate down to its lowest level in more than three years. Another positive factor was better news out of Europe as the European Central Bank provided long-term financing to the debt markets and support for the Continent’s banking sector.
The final three months of the period brought another reversal as the headwinds facing the equity market at the start of the period returned to the forefront. Evidence of slowing economic activity in the U.S. and adverse developments in Europe—including political turmoil in Greece and troubled banks in Spain—weighed on investor confidence, sending stocks down sharply.
Large-Cap Stocks Outperformed
For the 12-month period, the broad equity indices (as represented by the S&P 500 Index and Russell 3000 Index) rose by 4–5%. As the table below illustrates, however, there was a divergence in returns as large-cap stocks advanced while mid- and small-cap issues declined modestly. Growth and value stocks were mixed—growth issues outperformed among large-cap stocks, while value shares held up better in the mid- and small-cap segments of the market.
From a sector perspective, the defensive sectors of the market fared best. Utilities, consumer staples, and telecommunication services stocks all generated double-digit gains for the reporting period. On the downside, the commodity-driven energy and materials sectors fell the most during the period, reflecting a broad decline in commodity prices.
| U.S. Stock Index Returns |
| For the 12 months ended June 30, 2012 |
| Russell 1000 Index (Large-Cap) | 4.37% | | Russell 2000 Index (Small-Cap) | -2.08% |
| Russell 1000 Growth Index | 5.76% | | Russell 2000 Growth Index | -2.71% |
| Russell 1000 Value Index | 3.01% | | Russell 2000 Value Index | -1.44% |
| Russell Midcap Index | -1.65% | | |
| Russell Midcap Growth Index | -2.99% | | | |
| Russell Midcap Value Index | -0.37% | | | |
| Total Returns as of June 30, 2012 |
| | | | Average Annual Returns | |
| | Ticker Symbol | 1 year | 5 years | Since Inception | Inception Date |
| Investor Class | ALHIX | 1.64% | -0.84% | 1.20% | 9/30/05 |
| Barclays U.S. 1-3 Month Treasury Bill Index | — | 0.04% | 0.87% | 1.85% | — |
| Institutional Class | ALISX | 1.82% | -0.65% | 1.40% | 9/30/05 |
A Class No sales charge* With sales charge* | ALIAX | 1.36% -4.50% | -1.09% -2.25% | 0.96% 0.07% | 9/30/05 |
| C Class | ALICX | 0.61% | -1.83% | 0.19% | 9/30/05 |
| R Class | ALIRX | 1.08% | -1.35% | 0.68% | 9/30/05 |
| Sales charges include initial sales charges and contingent deferred sales charges (CDSCs), as applicable. A Class shares have a 5.75% maximum initial sales charge and may be subject to a maximum CDSC of 1.00%. C Class shares redeemed within 12 months of purchase are subject to a maximum CDSC of 1.00%. The SEC requires that mutual funds provide performance information net of maximum sales charges in all cases where charges could be applied. |
Data presented reflect past performance. Past performance is no guarantee of future results. Current performance may be higher or lower than the performance shown. Investment return and principal value will fluctuate, and redemption value may be more or less than original cost. To obtain performance data current to the most recent month end, please call 1-800-345-2021 or visit americancentury.com. The fund’s investment process may result in high portfolio turnover, which could mean high transaction costs, affecting both performance and capital gains tax liabilities to investors. In addition, its investment approach may involve higher volatility, short sales risk and overweighting risk. International investing involves special risks, such as political instability and currency fluctuations.
Unless otherwise indicated, performance reflects Investor Class shares; performance for other share classes will vary due to differences in fee structure. For information about other share classes available, please consult the prospectus. Data assumes reinvestment of dividends and capital gains, and none of the charts reflect the deduction of taxes that a shareholder would pay on fund distributions or the redemption of fund shares. Returns for the index are provided for comparison. The fund’s total returns include operating expenses (such as transaction costs and management fees) that reduce returns, while the total returns of the index do not.
| Growth of $10,000 Over Life of Class |
| $10,000 investment made September 30, 2005 |
*From 9/30/05, the Investor Class’s inception date. Not annualized.
| Total Annual Fund Operating Expenses |
| Investor Class | Institutional Class | A Class | C Class | R Class |
| 3.51% | 3.31% | 3.76% | 4.51% | 4.01% |
The total annual fund operating expenses shown is as stated in the fund’s prospectus current as of the date of this report. The prospectus may vary from the expense ratio shown elsewhere in this report because it is based on a different time period, includes acquired fund fees and expenses, and, if applicable, does not include fee waivers or expense reimbursements.
Data presented reflect past performance. Past performance is no guarantee of future results. Current performance may be higher or lower than the performance shown. Investment return and principal value will fluctuate, and redemption value may be more or less than original cost. To obtain performance data current to the most recent month end, please call 1-800-345-2021 or visit americancentury.com. The fund’s investment process may result in high portfolio turnover, which could mean high transaction costs, affecting both performance and capital gains tax liabilities to investors. In addition, its investment approach may involve higher volatility, short sales risk and overweighting risk. International investing involves special risks, such as political instability and currency fluctuations.
Unless otherwise indicated, performance reflects Investor Class shares; performance for other share classes will vary due to differences in fee structure. For information about other share classes available, please consult the prospectus. Data assumes reinvestment of dividends and capital gains, and none of the charts reflect the deduction of taxes that a shareholder would pay on fund distributions or the redemption of fund shares. Returns for the index are provided for comparison. The fund’s total returns include operating expenses (such as transaction costs and management fees) that reduce returns, while the total returns of the index do not.
Portfolio Managers: Brian Garbe and Claudia Musat
Performance Summary
Equity Market Neutral returned 1.64%* for the fiscal year ended June 30, 2012, compared with the 0.04% return of its benchmark, the Barclays U.S. 1–3 Month Treasury Bill Index.
Equity Market Neutral is designed to generate capital appreciation in all market environments, regardless of general stock market performance, so the fund uses a riskless asset—a short-term Treasury bill index—as its benchmark. In a volatile market environment that produced mixed results for stocks (see page 3 for details), the fund met its investment objective, posting a positive overall return and outperforming its benchmark. The outperformance was driven primarily by the fund’s short positions, which delivered positive results for the 12-month period and more than offset the decline in the fund’s long positions.
Short Positions Outperformed
Equity Market Neutral’s short positions—which are designed to profit when a stock’s price declines—produced positive returns for the reporting period. Short positions in the information technology and consumer discretionary sectors contributed the most to performance. The leading contributors in the information technology sector included short positions in solar power products maker First Solar and communications equipment manufacturer Acme Packet. First Solar fell sharply as demand for solar power installations declined substantially, while Acme Packet failed to meet earnings expectations amid weak capital spending by domestic telecommunication services providers.
In the consumer discretionary sector, the top short positions were photo company Eastman Kodak and airline operator AMR. Both companies filed for bankruptcy protection during the 12-month period, sending their share prices down precipitously. Other meaningful contributors to performance among the fund’s short positions included semiconductor maker MEMC Electronic Materials, which has significant exposure to the solar industry, and steelmaker AK Steel, which struggled with declining global demand for steel and falling prices.
On the downside, the portfolio’s short positions in the more defensive health care and consumer staples sectors detracted the most from performance. Biotechnology firm VIVUS, homebuilder Ryland Group, and auto parts maker Westport Innovations were the most significant individual detractors among short positions. VIVUS soared as its medication to treat obesity and diabetes moved closer to FDA approval; Ryland Group rallied as the market for new homes appeared to show early signs of an upturn; and Westport Innovations, which makes engines that run on natural gas, benefited from a developing shift from diesel to natural gas among long-haul truckers.
*All fund returns referenced in this commentary are for Investor Class shares.
Long Positions Declined
The long portion of the Equity Market Neutral portfolio posted a negative return for the 12-month period, driven in large part by stock selection in the information technology and materials sectors. In the information technology sector, the most significant detractors among long positions included semiconductor maker GT Advanced Technologies and electronic components maker Vishay Intertechnology. GT Advanced Technologies fell amid concerns about oversupply in its primary business of solar power products, while Vishay reported disappointing earnings as sales volumes fell and profit margins narrowed.
In the materials sector, metals and mining stocks detracted the most, led by two silver producers—Pan American Silver and Hecla Mining. Both companies struggled with declining silver prices during the period; in addition, Pan American Silver faced hurdles in its flagship development project in Argentina, while higher costs and mine disruptions weighed on Hecla’s earnings.
Other notable decliners in the long portion of the portfolio included auto parts maker TRW Automotive and grocery chain SUPERVALU. TRW slumped amid a slowdown in vehicle sales and narrowing profit margins resulting from higher raw materials costs, while SUPERVALU reported weak same-store sales growth and suspended its dividend.
On the positive side, the fund’s long positions in the health care sector produced the best returns. Top individual contributors included health care provider WellCare Health Plans and biotechnology firm Pharmacyclics. WellCare Health Plans delivered better-than-expected profits thanks to a strong increase in enrollment and cost reductions. Pharmacyclics, which focuses on small-molecule medications used to treat cancer and auto-immune diseases, rallied sharply as the company announced promising clinical trial data for an experimental lymphoma drug.
Elsewhere in the portfolio, long positions in building products maker Masco and internet services provider AOL added value for the 12 months. Masco benefited from an improving outlook for the housing sector, while AOL advanced as the company reported strong earnings and agreed to sell its patent portfolio for over $1 billion.
A Look Ahead
As we move into the second half of 2012, the U.S. equity market is likely to remain volatile given the uncertainty regarding the economic outlook, the European debt situation, and the upcoming U.S. presidential election. Heightened levels of volatility often provide investment opportunities in both the long and short portions of the portfolio. Our disciplined, objective, and systematic investment strategy is designed to take advantage of these opportunities at the individual company level. We believe this approach is the most powerful way to capitalize on market inefficiencies that lead to the mispricing of individual stocks.
| JUNE 30, 2012 | |
| Top Ten Long Holdings | % of net assets |
| Dean Foods Co. | 0.77% |
| PetSmart, Inc. | 0.74% |
| Beacon Roofing Supply, Inc. | 0.73% |
| PulteGroup, Inc. | 0.72% |
| Allied World Assurance Co. Holdings AG | 0.72% |
| Alliance Data Systems Corp. | 0.70% |
| Foot Locker, Inc. | 0.69% |
| Marathon Petroleum Corp. | 0.68% |
| Con-way, Inc. | 0.68% |
| Synopsys, Inc. | 0.68% |
| | |
| Top Ten Short Holdings | % of net assets |
| Textainer Group Holdings Ltd. | (0.80)% |
| Concur Technologies, Inc. | (0.76)% |
| American International Group, Inc. | (0.75)% |
| CoStar Group, Inc. | (0.72)% |
| Wright Express Corp. | (0.72)% |
| HMS Holdings Corp. | (0.72)% |
| Gildan Activewear, Inc. | (0.72)% |
| Louisiana-Pacific Corp. | (0.69)% |
| Family Dollar Stores, Inc. | (0.69)% |
| MBIA, Inc. | (0.69)% |
| | |
| Types of Investments in Portfolio | % of net assets |
| Common Stocks | 99.5% |
| Common Stocks Sold Short | (99.2)% |
| Temporary Cash Investments | 1.3% |
| Other Assets and Liabilities* | 98.4% |
| * | Amount relates primarily to deposits with broker for securities sold short at period end. |
Fund shareholders may incur two types of costs: (1) transaction costs, including sales charges (loads) on purchase payments and redemption/exchange fees; and (2) ongoing costs, including management fees; distribution and service (12b-1) fees; and other fund expenses. This example is intended to help you understand your ongoing costs (in dollars) of investing in your fund and to compare these costs with the ongoing cost of investing in other mutual funds.
The example is based on an investment of $1,000 made at the beginning of the period and held for the entire period from January 1, 2012 to June 30, 2012.
Actual Expenses
The table provides information about actual account values and actual expenses for each class. You may use the information, together with the amount you invested, to estimate the expenses that you paid over the period. First, identify the share class you own. Then simply divide your account value by $1,000 (for example, an $8,600 account value divided by $1,000 = 8.6), then multiply the result by the number under the heading “Expenses Paid During Period” to estimate the expenses you paid on your account during this period.
If you hold Investor Class shares of any American Century Investments fund, or Institutional Class shares of the American Century Diversified Bond Fund, in an American Century Investments account (i.e., not a financial intermediary or retirement plan account), American Century Investments may charge you a $12.50 semiannual account maintenance fee if the value of those shares is less than $10,000. We will redeem shares automatically in one of your accounts to pay the $12.50 fee. In determining your total eligible investment amount, we will include your investments in all personal accounts (including American Century Investments Brokerage accounts) registered under your Social Security number. Personal accounts include individual accounts, joint accounts, UGMA/UTMA accounts, personal trusts, Coverdell Education Savings Accounts and IRAs (including traditional, Roth, Rollover, SEP-, SARSEP- and SIMPLE-IRAs), and certain other retirement accounts. If you have only business, business retirement, employer-sponsored or American Century Investments Brokerage accounts, you are currently not subject to this fee. If you are subject to the Account Maintenance Fee, your account value could be reduced by the fee amount.
Hypothetical Example for Comparison Purposes
The table also provides information about hypothetical account values and hypothetical expenses based on the actual expense ratio of each class of your fund and an assumed rate of return of 5% per year before expenses, which is not the actual return of a fund’s share class. The hypothetical account values and expenses may not be used to estimate the actual ending account balance or expenses you paid for the period. You may use this information to compare the ongoing costs of investing in your fund and other funds. To do so, compare this 5% hypothetical example with the 5% hypothetical examples that appear in the shareholder reports of the other funds.
Please note that the expenses shown in the table are meant to highlight your ongoing costs only and do not reflect any transactional costs, such as sales charges (loads) or redemption/exchange fees. Therefore, the table is useful in comparing ongoing costs only, and will not help you determine the relative total costs of owning different funds. In addition, if these transactional costs were included, your costs would have been higher.
| | Beginning Account Value 1/1/12 | Ending Account Value 6/30/12 | Expenses Paid During Period(1) 1/1/12 – 6/30/12 | Annualized Expense Ratio(1) |
| Actual | | | | |
| Investor Class | $1,000 | $990.60 | $17.57 | 3.55% |
| Institutional Class | $1,000 | $990.70 | $16.58 | 3.35% |
| A Class | $1,000 | $988.60 | $18.79 | 3.80% |
| C Class | $1,000 | $985.20 | $22.46 | 4.55% |
| R Class | $1,000 | $987.50 | $20.01 | 4.05% |
| Hypothetical | | | | |
| Investor Class | $1,000 | $1,007.21 | $17.72 | 3.55% |
| Institutional Class | $1,000 | $1,008.21 | $16.73 | 3.35% |
| A Class | $1,000 | $1,005.97 | $18.95 | 3.80% |
| C Class | $1,000 | $1,002.24 | $22.65 | 4.55% |
| R Class | $1,000 | $1,004.72 | $20.19 | 4.05% |
| (1) | Expenses are equal to the class’s annualized expense ratio listed in the table above, multiplied by the average account value over the period, multiplied by 182, the number of days in the most recent fiscal half-year, divided by 366, to reflect the one-half year period. |
| | | Shares | | | Value | |
| Common Stocks — 99.5% | |
| AEROSPACE AND DEFENSE — 2.3% | |
Huntington Ingalls Industries, Inc.(1)(2) | | | 9,814 | | | | $394,915 | |
| L-3 Communications Holdings, Inc. | | | 1,398 | | | | 103,466 | |
Northrop Grumman Corp.(1) | | | 6,288 | | | | 401,112 | |
Teledyne Technologies, Inc.(1)(2) | | | 5,728 | | | | 353,131 | |
Textron, Inc.(1) | | | 12,937 | | | | 321,743 | |
| | | | | | | | 1,574,367 | |
| AIR FREIGHT AND LOGISTICS — 0.6% | |
| FedEx Corp. | | | 4,135 | | | | 378,807 | |
| AUTO COMPONENTS — 0.9% | |
Lear Corp.(1) | | | 7,270 | | | | 274,297 | |
WABCO Holdings, Inc.(1)(2) | | | 6,862 | | | | 363,206 | |
| | | | | | | | 637,503 | |
| BEVERAGES — 1.2% | |
Boston Beer Co., Inc., Class A(1)(2) | | | 3,710 | | | | 448,910 | |
Constellation Brands, Inc., Class A(1)(2) | | | 14,670 | | | | 396,970 | |
| | | | | | | | 845,880 | |
| BIOTECHNOLOGY — 1.7% | |
| Amgen, Inc. | | | 2,409 | | | | 175,954 | |
Biogen Idec, Inc.(2) | | | 931 | | | | 134,418 | |
Celgene Corp.(2) | | | 2,727 | | | | 174,964 | |
Cubist Pharmaceuticals, Inc.(1)(2) | | | 4,166 | | | | 157,933 | |
Momenta Pharmaceuticals, Inc.(2) | | | 9,141 | | | | 123,586 | |
Pharmacyclics, Inc.(2) | | | 4,202 | | | | 229,471 | |
United Therapeutics Corp.(2) | | | 3,649 | | | | 180,188 | |
| | | | | | | | 1,176,514 | |
| BUILDING PRODUCTS — 0.5% | |
Masco Corp.(1) | | | 24,616 | | | | 341,424 | |
| CAPITAL MARKETS — 2.1% | |
Affiliated Managers Group, Inc.(1)(2) | | | 3,781 | | | | 413,831 | |
| Greenhill & Co., Inc. | | | 3,466 | | | | 123,563 | |
Investment Technology Group, Inc.(1)(2) | | | 20,555 | | | | 189,106 | |
Legg Mason, Inc.(1) | | | 10,765 | | | | 283,873 | |
| LPL Financial Holdings, Inc. | | | 9,505 | | | | 320,984 | |
| Waddell & Reed Financial, Inc. | | | 2,026 | | | | 61,347 | |
| | | | | | | | 1,392,704 | |
| CHEMICALS — 4.9% | |
CF Industries Holdings, Inc.(1) | | | 2,335 | | | | 452,383 | |
Cytec Industries, Inc.(1) | | | 6,035 | | | | 353,892 | |
Georgia Gulf Corp.(1) | | | 2,196 | | | | 56,371 | |
Huntsman Corp.(1) | | | 30,300 | | | | 392,082 | |
LyondellBasell Industries NV, Class A(1) | | | 6,752 | | | | 271,903 | |
Methanex Corp.(1) | | | 12,707 | | | | 353,763 | |
Monsanto Co.(1) | | | 4,944 | | | | 409,264 | |
| NewMarket Corp. | | | 1,754 | | | | 379,917 | |
PPG Industries, Inc.(1) | | | 1,921 | | | | 203,857 | |
Rockwood Holdings, Inc.(1) | | | 6,712 | | | | 297,677 | |
W.R. Grace & Co.(2) | | | 2,848 | | | | 143,682 | |
| | | | | | | | 3,314,791 | |
| COMMERCIAL BANKS — 1.4% | |
CapitalSource, Inc.(1) | | | 54,738 | | | | 367,839 | |
| PacWest Bancorp. | | | 5,270 | | | | 124,741 | |
Regions Financial Corp.(1) | | | 63,766 | | | | 430,421 | |
| | | | | | | | 923,001 | |
| COMMERCIAL SERVICES AND SUPPLIES — 0.5% | |
Portfolio Recovery Associates, Inc.(2) | | | 3,605 | | | | 328,992 | |
| COMMUNICATIONS EQUIPMENT — 2.2% | |
Arris Group, Inc.(1)(2) | | | 29,757 | | | | 413,920 | |
Brocade Communications Systems, Inc.(1)(2) | | | 78,471 | | | | 386,862 | |
Ciena Corp.(1)(2) | | | 27,866 | | | | 456,166 | |
Research In Motion Ltd.(1)(2) | | | 32,738 | | | | 241,934 | |
| | | | | | | | 1,498,882 | |
| COMPUTERS AND PERIPHERALS — 1.1% | |
Seagate Technology plc(1) | | | 15,985 | | | | 395,309 | |
Western Digital Corp.(1)(2) | | | 10,871 | | | | 331,348 | |
| | | | | | | | 726,657 | |
| CONSTRUCTION AND ENGINEERING — 1.6% | |
Chicago Bridge & Iron Co. NV New York Shares(1) | | | 10,574 | | | | 401,389 | |
Granite Construction, Inc.(1) | | | 13,575 | | | | 354,443 | |
URS Corp.(1) | | | 10,406 | | | | 362,962 | |
| | | | | | | | 1,118,794 | |
| CONSUMER FINANCE — 0.9% | |
| American Express Co. | | | 3,969 | | | | 231,036 | |
Cash America International, Inc.(1) | | | 8,527 | | | | 375,529 | |
| | | | | | | | 606,565 | |
| | | | Shares | | | | Value | |
| CONTAINERS AND PACKAGING — 0.7% | | | | | | | | |
Graphic Packaging Holding Co.(1)(2) | | | 26,910 | | | | $148,005 | |
Owens-Illinois, Inc.(1)(2) | | | 18,102 | | | | 347,015 | |
| | | | | | | | 495,020 | |
| DIVERSIFIED CONSUMER SERVICES — 2.3% | |
Apollo Group, Inc., Class A(1)(2) | | | 10,443 | | | | 377,932 | |
Bridgepoint Education, Inc.(1)(2) | | | 15,777 | | | | 343,939 | |
Coinstar, Inc.(1)(2) | | | 6,149 | | | | 422,190 | |
ITT Educational Services, Inc.(1)(2) | | | 6,154 | | | | 373,855 | |
| Regis Corp. | | | 2,004 | | | | 35,992 | |
| | | | | | | | 1,553,908 | |
| DIVERSIFIED FINANCIAL SERVICES — 1.3% | |
| Bank of America Corp. | | | 21,871 | | | | 178,905 | |
Interactive Brokers Group, Inc., Class A(1) | | | 21,751 | | | | 320,175 | |
Moody’s Corp.(1) | | | 5,537 | | | | 202,377 | |
NASDAQ OMX Group, Inc. (The)(1) | | | 9,061 | | | | 205,413 | |
| | | | | | | | 906,870 | |
| DIVERSIFIED TELECOMMUNICATION SERVICES — 0.4% | |
Vonage Holdings Corp.(1)(2) | | | 118,928 | | | | 239,045 | |
| ELECTRICAL EQUIPMENT — 1.7% | |
Acuity Brands, Inc.(1) | | | 7,067 | | | | 359,781 | |
Belden, Inc.(1) | | | 11,684 | | | | 389,661 | |
Brady Corp., Class A(1) | | | 1,358 | | | | 37,359 | |
EnerSys(1)(2) | | | 11,289 | | | | 395,905 | |
| | | | | | | | 1,182,706 | |
| ELECTRONIC EQUIPMENT, INSTRUMENTS AND COMPONENTS — 2.6% | |
Celestica, Inc.(1)(2) | | | 49,636 | | | | 360,357 | |
Itron, Inc.(1)(2) | | | 10,499 | | | | 432,979 | |
Molex, Inc.(1) | | | 15,949 | | | | 381,819 | |
Tech Data Corp.(1)(2) | | | 7,582 | | | | 365,225 | |
Vishay Intertechnology, Inc.(1)(2) | | | 23,309 | | | | 219,804 | |
| | | | | | | | 1,760,184 | |
| ENERGY EQUIPMENT AND SERVICES — 2.0% | |
Diamond Offshore Drilling, Inc.(1) | | | 3,615 | | | | 213,755 | |
Exterran Holdings, Inc.(1)(2) | | | 24,992 | | | | 318,648 | |
Gulfmark Offshore, Inc. Class A(2) | | | 3,678 | | | | 125,199 | |
Helix Energy Solutions Group, Inc.(1)(2) | | | 23,502 | | | | 385,668 | |
National Oilwell Varco, Inc.(1) | | | 5,198 | | | | 334,959 | |
| | | | | | | | 1,378,229 | |
| FOOD AND STAPLES RETAILING — 0.5% | |
SUPERVALU, Inc.(1) | | | 70,191 | | | | 363,589 | |
| FOOD PRODUCTS — 1.3% | |
| Archer-Daniels-Midland Co. | | | 4,854 | | | | 143,290 | |
Dean Foods Co.(1)(2) | | | 30,882 | | | | 525,921 | |
Tyson Foods, Inc., Class A(1) | | | 10,516 | | | | 198,016 | |
| | | | | | | | 867,227 | |
| GAS UTILITIES — 0.5% | |
Northwest Natural Gas Co.(1) | | | 7,712 | | | | 367,091 | |
| HEALTH CARE EQUIPMENT AND SUPPLIES — 2.2% | |
Align Technology, Inc.(1)(2) | | | 11,835 | | | | 395,999 | |
Boston Scientific Corp.(2) | | | 28,942 | | | | 164,101 | |
Hill-Rom Holdings, Inc.(1) | | | 10,043 | | | | 309,827 | |
Hologic, Inc.(1)(2) | | | 19,577 | | | | 353,169 | |
Thoratec Corp.(1)(2) | | | 7,208 | | | | 242,045 | |
| | | | | | | | 1,465,141 | |
| HEALTH CARE PROVIDERS AND SERVICES — 2.0% | |
Humana, Inc.(1) | | | 5,023 | | | | 388,981 | |
| McKesson Corp. | | | 4,424 | | | | 414,750 | |
Molina Healthcare, Inc.(1)(2) | | | 14,011 | | | | 328,698 | |
| Omnicare, Inc. | | | 5,488 | | | | 171,390 | |
Select Medical Holdings Corp.(2) | | | 5,015 | | | | 50,702 | |
| | | | | | | | 1,354,521 | |
| HOTELS, RESTAURANTS AND LEISURE — 2.1% | |
Ameristar Casinos, Inc.(1) | | | 8,027 | | | | 142,640 | |
Bob Evans Farms, Inc.(1) | | | 9,818 | | | | 394,684 | |
Brinker International, Inc.(1) | | | 10,391 | | | | 331,161 | |
Papa John’s International, Inc.(2) | | | 3,273 | | | | 155,697 | |
Penn National Gaming, Inc.(1)(2) | | | 8,450 | | | | 376,785 | |
| | | | | | | | 1,400,967 | |
| HOUSEHOLD DURABLES — 1.7% | |
| Garmin Ltd. | | | 4,462 | | | | 170,850 | |
Harman International Industries, Inc.(1) | | | 7,038 | | | | 278,705 | |
| Jarden Corp. | | | 1,969 | | | | 82,737 | |
PulteGroup, Inc.(1)(2) | | | 45,962 | | | | 491,793 | |
Tempur-Pedic International, Inc.(1)(2) | | | 4,197 | | | | 98,168 | |
| | | | | | | | 1,122,253 | |
| HOUSEHOLD PRODUCTS — 0.4% | |
Spectrum Brands Holdings, Inc.(1)(2) | | | 8,216 | | | | 267,595 | |
| | | | Shares | | | | Value | |
| INDEPENDENT POWER PRODUCERS AND ENERGY TRADERS — 0.4% | | | | | | | | |
| AES Corp. (The)(1)(2) | | | 4,279 | | | | $54,899 | |
GenOn Energy, Inc.(2) | | | 46,590 | | | | 79,669 | |
| TransAlta Corp. | | | 9,468 | | | | 160,672 | |
| | | | | | | | 295,240 | |
| INSURANCE — 6.5% | |
Allied World Assurance Co. Holdings AG(1) | | | 6,113 | | | | 485,800 | |
| American National Insurance Co. | | | 2,771 | | | | 197,489 | |
Arch Capital Group Ltd.(1)(2) | | | 9,033 | | | | 358,520 | |
| Aspen Insurance Holdings Ltd. | | | 12,091 | | | | 349,430 | |
Assurant, Inc.(1) | | | 8,990 | | | | 313,212 | |
| Axis Capital Holdings Ltd. | | | 3,039 | | | | 98,919 | |
CNA Financial Corp.(1) | | | 12,879 | | | | 357,006 | |
| Everest Re Group Ltd. | | | 3,520 | | | | 364,285 | |
Loews Corp.(1) | | | 9,100 | | | | 372,281 | |
Principal Financial Group, Inc.(1) | | | 14,885 | | | | 390,433 | |
Protective Life Corp.(1) | | | 14,167 | | | | 416,651 | |
Prudential Financial, Inc.(1) | | | 7,065 | | | | 342,158 | |
Validus Holdings Ltd.(1) | | | 11,391 | | | | 364,854 | |
| | | | | | | | 4,411,038 | |
| INTERNET SOFTWARE AND SERVICES — 1.5% | |
Ancestry.com, Inc.(1)(2) | | | 12,330 | | | | 339,445 | |
AOL, Inc.(1)(2) | | | 13,523 | | | | 379,726 | |
Dice Holdings, Inc.(1)(2) | | | 34,102 | | | | 320,218 | |
| | | | | | | | 1,039,389 | |
| IT SERVICES — 3.4% | |
Acxiom Corp.(1)(2) | | | 25,592 | | | | 386,695 | |
Alliance Data Systems Corp.(1)(2) | | | 3,520 | | | | 475,200 | |
CACI International, Inc., Class A(1)(2) | | | 6,644 | | | | 365,553 | |
| Computer Sciences Corp. | | | 1,644 | | | | 40,804 | |
Heartland Payment Systems, Inc.(1) | | | 12,514 | | | | 376,421 | |
| SAIC, Inc. | | | 3,844 | | | | 46,590 | |
Total System Services, Inc.(1) | | | 15,814 | | | | 378,429 | |
Unisys Corp.(1)(2) | | | 13,533 | | | | 264,570 | |
| | | | | | | | 2,334,262 | |
| LEISURE EQUIPMENT AND PRODUCTS — 0.1% | |
Polaris Industries, Inc.(1) | | | 906 | | | | 64,761 | |
| LIFE SCIENCES TOOLS AND SERVICES — 0.9% | |
| Agilent Technologies, Inc. | | | 7,222 | | | | 283,392 | |
Charles River Laboratories International, Inc.(2) | | | 5,137 | | | | 168,288 | |
Life Technologies Corp.(2) | | | 4,288 | | | | 192,917 | |
| | | | | | | | 644,597 | |
| MACHINERY — 3.4% | |
Actuant Corp., Class A(1) | | | 16,090 | | | | 437,004 | |
| Cummins, Inc. | | | 3,860 | | | | 374,073 | |
| Lincoln Electric Holdings, Inc. | | | 7,945 | | | | 347,911 | |
Oshkosh Corp.(2) | | | 4,316 | | | | 90,420 | |
Parker-Hannifin Corp.(1) | | | 527 | | | | 40,516 | |
Robbins & Myers, Inc.(1) | | | 7,756 | | | | 324,356 | |
Sauer-Danfoss, Inc.(1) | | | 10,449 | | | | 364,984 | |
Wabtec Corp.(1) | | | 4,010 | | | | 312,820 | |
| | | | | | | | 2,292,084 | |
| MEDIA — 2.4% | |
CBS Corp., Class B(1) | | | 13,675 | | | | 448,266 | |
Live Nation Entertainment, Inc.(2) | | | 3,873 | | | | 35,554 | |
Regal Entertainment Group Class A(1) | | | 26,852 | | | | 369,484 | |
Scholastic Corp.(1) | | | 12,352 | | | | 347,832 | |
| Scripps Networks Interactive, Inc. Class A | | | 903 | | | | 51,345 | |
Sirius XM Radio, Inc.(1)(2) | | | 186,593 | | | | 345,197 | |
| | | | | | | | 1,597,678 | |
| METALS AND MINING — 2.9% | |
Coeur d’Alene Mines Corp.(1)(2) | | | 21,512 | | | | 377,751 | |
Freeport-McMoRan Copper & Gold, Inc.(1) | | | 2,317 | | | | 78,940 | |
Nevsun Resources Ltd.(1) | | | 61,900 | | | | 200,556 | |
Silver Wheaton Corp.(1) | | | 14,281 | | | | 383,302 | |
Steel Dynamics, Inc.(1) | | | 22,526 | | | | 264,681 | |
Stillwater Mining Co.(1)(2) | | | 32,858 | | | | 280,607 | |
Teck Resources Ltd.(1) | | | 12,175 | | | | 376,694 | |
| | | | | | | | 1,962,531 | |
| MULTI-UTILITIES — 0.6% | |
Ameren Corp.(1) | | | 11,755 | | | | 394,263 | |
| MULTILINE RETAIL — 1.6% | |
Dillard’s, Inc., Class A(1) | | | 5,404 | | | | 344,127 | |
Macy’s, Inc.(1) | | | 9,402 | | | | 322,958 | |
Saks, Inc.(1)(2) | | | 41,946 | | | | 446,725 | |
| | | | | | | | 1,113,810 | |
| | | Shares | | | Value | |
OIL, GAS AND CONSUMABLE FUELS — 6.1% | | | | | | | |
| Apache Corp. | | | 3,952 | | | | $347,341 | |
Chevron Corp.(1) | | | 3,664 | | | | 386,552 | |
Cloud Peak Energy, Inc.(1)(2) | | | 21,661 | | | | 366,288 | |
ConocoPhillips(1) | | | 5,243 | | | | 292,979 | |
Denbury Resources, Inc.(1)(2) | | | 24,594 | | | | 371,615 | |
Energy XXI Bermuda Ltd.(1) | | | 13,087 | | | | 409,492 | |
Gran Tierra Energy, Inc.(2) | | | 15,181 | | | | 74,539 | |
| HollyFrontier Corp. | | | 6,185 | | | | 219,135 | |
Marathon Petroleum Corp.(1) | | | 10,324 | | | | 463,754 | |
| Occidental Petroleum Corp. | | | 4,416 | | | | 378,760 | |
Suncor Energy, Inc.(1) | | | 13,095 | | | | 379,100 | |
Western Refining, Inc.(1) | | | 19,557 | | | | 435,535 | |
| | | | | | | | 4,125,090 | |
| PAPER AND FOREST PRODUCTS — 0.6% | |
| Buckeye Technologies, Inc. | | | 1,809 | | | | 51,539 | |
Domtar Corp.(1) | | | 4,499 | | | | 345,118 | |
| | | | | | | | 396,657 | |
| PERSONAL PRODUCTS — 0.4% | |
| Nu Skin Enterprises, Inc., Class A | | | 5,421 | | | | 254,245 | |
| PHARMACEUTICALS — 2.6% | |
Eli Lilly & Co.(1) | | | 9,453 | | | | 405,628 | |
Merck & Co., Inc.(1) | | | 9,447 | | | | 394,412 | |
Pfizer, Inc.(1) | | | 17,401 | | | | 400,223 | |
ViroPharma, Inc.(1)(2) | | | 7,781 | | | | 184,410 | |
Warner Chilcott plc Class A(1)(2) | | | 19,949 | | | | 357,486 | |
| | | | | | | | 1,742,159 | |
| PROFESSIONAL SERVICES — 1.7% | |
Corporate Executive Board Co. (The)(1) | | | 10,120 | | | | 413,705 | |
Robert Half International, Inc.(1) | | | 12,517 | | | | 357,611 | |
Towers Watson & Co., Class A(1) | | | 5,840 | | | | 349,816 | |
| | | | | | | | 1,121,132 | |
| REAL ESTATE INVESTMENT TRUSTS (REITs) — 3.3% | |
CBL & Associates Properties, Inc.(1) | | | 21,707 | | | | 424,155 | |
First Industrial Realty Trust, Inc.(1)(2) | | | 30,955 | | | | 390,652 | |
LaSalle Hotel Properties(1) | | | 14,701 | | | | 428,387 | |
Lexington Realty Trust(1) | | | 42,377 | | | | 358,933 | |
Post Properties, Inc.(1) | | | 5,821 | | | | 284,938 | |
Taubman Centers, Inc.(1) | | | 4,741 | | | | 365,816 | |
| | | | | | | | 2,252,881 | |
| ROAD AND RAIL — 1.8% | |
Con-way, Inc.(1) | | | 12,795 | | | | 462,027 | |
Dollar Thrifty Automotive Group, Inc.(1)(2) | | | 5,248 | | | | 424,878 | |
Landstar System, Inc.(1) | | | 6,923 | | | | 358,058 | |
| | | | | | | | 1,244,963 | |
| SEMICONDUCTORS AND SEMICONDUCTOR EQUIPMENT — 3.3% | |
Advanced Micro Devices, Inc.(1)(2) | | | 62,860 | | | | 360,188 | |
Cypress Semiconductor Corp.(1)(2) | | | 21,980 | | | | 290,576 | |
GT Advanced Technologies, Inc.(1)(2) | | | 46,802 | | | | 247,114 | |
KLA-Tencor Corp.(1) | | | 7,720 | | | | 380,210 | |
Lam Research Corp.(2) | | | 4,419 | | | | 166,773 | |
LSI Corp.(1)(2) | | | 56,522 | | | | 360,045 | |
NVIDIA Corp.(1)(2) | | | 29,117 | | | | 402,397 | |
| | | | | | | | 2,207,303 | |
| SOFTWARE — 5.0% | |
Activision Blizzard, Inc.(1) | | | 30,069 | | | | 360,527 | |
Autodesk, Inc.(1)(2) | | | 11,624 | | | | 406,724 | |
Cadence Design Systems, Inc.(1)(2) | | | 38,310 | | | | 421,027 | |
JDA Software Group, Inc.(1)(2) | | | 11,078 | | | | 328,906 | |
Mentor Graphics Corp.(1)(2) | | | 29,803 | | | | 447,045 | |
Oracle Corp.(1) | | | 13,750 | | | | 408,375 | |
Symantec Corp.(1)(2) | | | 23,862 | | | | 348,624 | |
Synopsys, Inc.(1)(2) | | | 15,640 | | | | 460,285 | |
TiVo, Inc.(2) | | | 5,019 | | | | 41,507 | |
Zynga, Inc. Class A(2) | | | 30,019 | | | | 163,303 | |
| | | | | | | | 3,386,323 | |
| SPECIALTY RETAIL — 3.9% | |
Aaron’s, Inc.(1) | | | 9,386 | | | | 265,718 | |
| Advance Auto Parts, Inc. | | | 2,256 | | | | 153,904 | |
Best Buy Co., Inc.(1) | | | 19,519 | | | | 409,118 | |
Foot Locker, Inc.(1) | | | 15,380 | | | | 470,321 | |
GameStop Corp., Class A(1) | | | 16,165 | | | | 296,789 | |
| Home Depot, Inc. (The) | | | 4,322 | | | | 229,023 | |
O’Reilly Automotive, Inc.(2) | | | 1,164 | | | | 97,508 | |
PetSmart, Inc.(1) | | | 7,371 | | | | 502,555 | |
Select Comfort Corp.(1)(2) | | | 11,216 | | | | 234,639 | |
| | | | | | | | 2,659,575 | |
| TEXTILES, APPAREL AND LUXURY GOODS — 1.9% | |
Crocs, Inc.(1)(2) | | | 19,157 | | | | 309,385 | |
Fifth & Pacific Cos., Inc.(1)(2) | | | 28,215 | | | | 302,747 | |
| | | Shares | | | Value | |
Iconix Brand Group, Inc.(1)(2) | | | 21,446 | | | | $374,662 | |
| Jones Group, Inc. (The)(1) | | | 31,081 | | | | 297,134 | |
| | | | | | | | 1,283,928 | |
| THRIFTS AND MORTGAGE FINANCE — 0.1% | |
| People’s United Financial, Inc. | | | 4,745 | | | | 55,089 | |
| TRADING COMPANIES AND DISTRIBUTORS — 0.8% | |
Beacon Roofing Supply, Inc.(1)(2) | | | 19,776 | | | | 498,751 | |
| W.W. Grainger, Inc. | | | 222 | | | | 42,455 | |
| | | | | | | | 541,206 | |
| WIRELESS TELECOMMUNICATION SERVICES — 0.7% | |
Sprint Nextel Corp.(1)(2) | | | 114,013 | | | | 371,682 | |
United States Cellular Corp.(2) | | | 2,795 | | | | 107,943 | |
| | | | | | | | 479,625 | |
TOTAL COMMON STOCKS(Cost $63,095,006) | | | | 67,489,056 | |
| Temporary Cash Investments — 1.3% | |
Repurchase Agreement, Bank of America Merrill Lynch, (collateralized by various U.S. Treasury obligations, 1.50% – 4.00%, 2/15/15 – 6/30/16, valued at $291,081), in a joint trading account at 0.10%, dated 6/29/12, due 7/2/12 (Delivery value $285,538) | | | | 285,536 | |
Repurchase Agreement, Credit Suisse First Boston, Inc., (collateralized by various U.S. Treasury obligations, 3.75%, 8/15/41, valued at $291,986), in a joint trading account at 0.10%, dated 6/29/12, due 7/2/12 (Delivery value $285,537) | | | | 285,535 | |
Repurchase Agreement, Goldman Sachs & Co., (collateralized by various U.S. Treasury obligations, 4.375%, 5/15/40, valued at $72,714), in a joint trading account at 0.06%, dated 6/29/12, due 7/2/12 (Delivery value $71,384) | | | | 71,384 | |
| SSgA U.S. Government Money Market Fund | | | 250,941 | | | | 250,941 | |
TOTAL TEMPORARY CASH INVESTMENTS (Cost $893,396) | | | | 893,396 | |
TOTAL INVESTMENT SECURITIES BEFORE SECURITIES SOLD SHORT — 100.8% (Cost $63,988,402) | | | | 68,382,452 | |
| Common Stocks Sold Short — (99.2)% | |
| AEROSPACE AND DEFENSE — (2.0)% | |
| AAR Corp. | | | (17,964 | ) | | | (242,155 | ) |
| CAE, Inc. | | | (34,131 | ) | | | (330,388 | ) |
| Precision Castparts Corp. | | | (2,210 | ) | | | (363,523 | ) |
| Spirit Aerosystems Holdings, Inc. Class A | | | (19,055 | ) | | | (454,080 | ) |
| | | | | | | | (1,390,146 | ) |
| AIR FREIGHT AND LOGISTICS — (0.5)% | |
| Atlas Air Worldwide Holdings, Inc. | | | (8,468 | ) | | | (368,443 | ) |
| AIRLINES — (0.9)% | |
| Allegiant Travel Co. | | | (3,470 | ) | | | (241,790 | ) |
| US Airways Group, Inc. | | | (27,225 | ) | | | (362,909 | ) |
| | | | | | | | (604,699 | ) |
| AUTO COMPONENTS — (1.7)% | |
| Gentex Corp. | | | (16,601 | ) | | | (346,463 | ) |
| Goodyear Tire & Rubber Co. (The) | | | (37,490 | ) | | | (442,757 | ) |
| Johnson Controls, Inc. | | | (12,374 | ) | | | (342,883 | ) |
| | | | | | | | (1,132,103 | ) |
| AUTOMOBILES — (0.3)% | |
| Tesla Motors, Inc. | | | (5,962 | ) | | | (186,551 | ) |
| BEVERAGES — (0.7)% | |
| Beam, Inc. | | | (6,030 | ) | | | (376,815 | ) |
| Brown-Forman Corp. Class B | | | (1,257 | ) | | | (121,740 | ) |
| | | | | | | | (498,555 | ) |
| BIOTECHNOLOGY — (2.9)% | |
| Ariad Pharmaceuticals, Inc. | | | (9,864 | ) | | | (169,759 | ) |
| BioMarin Pharmaceutical, Inc. | | | (4,621 | ) | | | (182,899 | ) |
| Cepheid, Inc. | | | (4,268 | ) | | | (190,993 | ) |
| Halozyme Therapeutics, Inc. | | | (14,858 | ) | | | (131,642 | ) |
| Idenix Pharmaceuticals, Inc. | | | (18,245 | ) | | | (187,924 | ) |
| Incyte Corp. Ltd. | | | (7,587 | ) | | | (172,225 | ) |
| Ironwood Pharmaceuticals, Inc. | | | (12,764 | ) | | | (175,888 | ) |
| Medivation, Inc. | | | (2,015 | ) | | | (184,171 | ) |
| Regeneron Pharmaceuticals, Inc. | | | (1,405 | ) | | | (160,479 | ) |
| Seattle Genetics, Inc. | | | (6,831 | ) | | | (173,439 | ) |
| Theravance, Inc. | | | (9,493 | ) | | | (210,935 | ) |
| | | | | | | | (1,940,354 | ) |
| BUILDING PRODUCTS — (0.5)% | |
| Owens Corning | | | (12,075 | ) | | | (344,621 | ) |
| CAPITAL MARKETS — (2.3)% | |
| Ares Capital Corp. | | | (23,826 | ) | | | (380,263 | ) |
| Knight Capital Group, Inc. Class A | | | (31,935 | ) | | | (381,304 | ) |
| Morgan Stanley | | | (22,155 | ) | | | (323,241 | ) |
| Prospect Capital Corp. | | | (39,459 | ) | | | (449,438 | ) |
| Teton Advisors, Inc., Class B | | | (20 | ) | | | (8 | ) |
| | | | | | | | (1,534,254 | ) |
| | | Shares | | | Value | |
| CHEMICALS — (3.6)% | | | | | | |
| Air Products & Chemicals, Inc. | | | (4,520 | ) | | | $(364,899 | ) |
| Ashland, Inc. | | | (6,628 | ) | | | (459,387 | ) |
| Cabot Corp. | | | (11,207 | ) | | | (456,125 | ) |
| Ecolab, Inc. | | | (6,141 | ) | | | (420,843 | ) |
| Intrepid Potash, Inc. | | | (10,897 | ) | | | (248,016 | ) |
| Olin Corp. | | | (4,034 | ) | | | (84,270 | ) |
| Praxair, Inc. | | | (3,501 | ) | | | (380,664 | ) |
| | | | | | | | (2,414,204 | ) |
| COMMERCIAL BANKS — (2.5)% | |
| CIT Group, Inc. | | | (5,136 | ) | | | (183,047 | ) |
| First Niagara Financial Group, Inc. | | | (42,841 | ) | | | (327,734 | ) |
| First Republic Bank | | | (8,135 | ) | | | (273,336 | ) |
| Iberiabank Corp. | | | (1,324 | ) | | | (66,796 | ) |
| Texas Capital Bancshares, Inc. | | | (10,724 | ) | | | (433,142 | ) |
| Toronto-Dominion Bank (The) | | | (598 | ) | | | (46,781 | ) |
| Valley National Bancorp | | | (31,830 | ) | | | (337,398 | ) |
| | | | | | | | (1,668,234 | ) |
| COMMERCIAL SERVICES AND SUPPLIES — (1.2)% | |
| Geo Group, Inc. (The) | | | (20,437 | ) | | | (464,329 | ) |
| Interface, Inc. | | | (26,726 | ) | | | (364,275 | ) |
| | | | | | | | (828,604 | ) |
| COMMUNICATIONS EQUIPMENT — (2.0)% | |
| Acme Packet, Inc. | | | (13,236 | ) | | | (246,851 | ) |
| InterDigital, Inc. | | | (15,009 | ) | | | (442,915 | ) |
| Juniper Networks, Inc. | | | (18,054 | ) | | | (294,461 | ) |
| Viasat, Inc. | | | (9,484 | ) | | | (358,211 | ) |
| | | | | | | | (1,342,438 | ) |
| COMPUTERS AND PERIPHERALS — (1.3)% | |
| Fusion-io, Inc. | | | (18,705 | ) | | | (390,748 | ) |
| Hewlett-Packard Co. | | | (3,067 | ) | | | (61,677 | ) |
| SanDisk Corp. | | | (11,159 | ) | | | (407,080 | ) |
| | | | | | | | (859,505 | ) |
| CONSTRUCTION AND ENGINEERING — (0.5)% | |
| MasTec, Inc. | | | (21,576 | ) | | | (324,503 | ) |
| CONTAINERS AND PACKAGING — (1.1)% | |
| Rock-Tenn Co., Class A | | | (6,760 | ) | | | (368,758 | ) |
| Sealed Air Corp. | | | (23,688 | ) | | | (365,743 | ) |
| | | | | | | | (734,501 | ) |
| DIVERSIFIED CONSUMER SERVICES — (0.3)% | |
| K12, Inc. | | | (2,848 | ) | | | (66,358 | ) |
| Sotheby’s | | | (3,872 | ) | | | (129,170 | ) |
| | | | | | | | (195,528 | ) |
| DIVERSIFIED TELECOMMUNICATION SERVICES — (0.1)% | |
| BCE, Inc. | | | (866 | ) | | | (35,679 | ) |
| ELECTRIC UTILITIES — (0.6)% | |
| Northeast Utilities | | | (9,963 | ) | | | (386,664 | ) |
| ELECTRICAL EQUIPMENT — (1.2)% | |
| General Cable Corp. | | | (1,317 | ) | | | (34,163 | ) |
| GrafTech International Ltd. | | | (37,435 | ) | | | (361,248 | ) |
| II-VI, Inc. | | | (19,120 | ) | | | (318,730 | ) |
| Polypore International, Inc. | | | (2,797 | ) | | | (112,971 | ) |
| | | | | | | | (827,112 | ) |
| ELECTRONIC EQUIPMENT, INSTRUMENTS AND COMPONENTS — (2.8)% | |
| Arrow Electronics, Inc. | | | (9,139 | ) | | | (299,850 | ) |
| Benchmark Electronics, Inc. | | | (24,126 | ) | | | (336,558 | ) |
| Corning, Inc. | | | (26,594 | ) | | | (343,860 | ) |
| IPG Photonics Corp. | | | (7,667 | ) | | | (334,204 | ) |
| National Instruments Corp. | | | (3,410 | ) | | | (91,593 | ) |
| Scansource, Inc. | | | (9,881 | ) | | | (302,754 | ) |
| Universal Display Corp. | | | (5,688 | ) | | | (204,427 | ) |
| | | | | | | | (1,913,246 | ) |
| ENERGY EQUIPMENT AND SERVICES — (2.9)% | |
| Atwood Oceanics, Inc. | | | (3,821 | ) | | | (144,587 | ) |
| FMC Technologies, Inc. | | | (9,150 | ) | | | (358,954 | ) |
| Lufkin Industries, Inc. | | | (6,462 | ) | | | (351,016 | ) |
| Noble Corp. | | | (11,913 | ) | | | (387,530 | ) |
| Rowan Cos. plc | | | (12,033 | ) | | | (389,027 | ) |
| SEACOR Holdings, Inc. | | | (4,141 | ) | | | (370,122 | ) |
| | | | | | | | (2,001,236 | ) |
| FOOD AND STAPLES RETAILING — (1.5)% | |
| Casey’s General Stores, Inc. | | | (5,582 | ) | | | (329,282 | ) |
| Pricesmart, Inc. | | | (4,891 | ) | | | (330,191 | ) |
| United Natural Foods, Inc. | | | (6,381 | ) | | | (350,062 | ) |
| | | | | | | | (1,009,535 | ) |
| FOOD PRODUCTS — (0.8)% | |
| Flowers Foods, Inc. | | | (17,885 | ) | | | (415,469 | ) |
| Green Mountain Coffee Roasters, Inc. | | | (7,536 | ) | | | (164,134 | ) |
| | | | | | | | (579,603 | ) |
| GAS UTILITIES — (1.6)% | |
| National Fuel Gas Co. | | | (8,060 | ) | | | (378,659 | ) |
| ONEOK, Inc. | | | (8,962 | ) | | | (379,182 | ) |
| South Jersey Industries, Inc. | | | (6,732 | ) | | | (343,130 | ) |
| | | | | | | | (1,100,971 | ) |
| HEALTH CARE EQUIPMENT AND SUPPLIES — (1.7)% | |
| DENTSPLY International, Inc. | | | (1,057 | ) | | | (39,965 | ) |
| DexCom, Inc. | | | (29,512 | ) | | | (382,476 | ) |
| Edwards Lifesciences Corp. | | | (2,310 | ) | | | (238,623 | ) |
| Meridian Bioscience, Inc. | | | (5,387 | ) | | | (110,218 | ) |
| Neogen Corp. | | | (8,632 | ) | | | (398,798 | ) |
| | | | | | | | (1,170,080 | ) |
| | | Shares | | | Value | |
HEALTH CARE PROVIDERS AND SERVICES — (2.7)% | | | | | | | | |
| Brookdale Senior Living, Inc. | | | (2,630 | ) | | | $(46,656 | ) |
| Cigna Corp. | | | (7,350 | ) | | | (323,400 | ) |
| HMS Holdings Corp. | | | (14,659 | ) | | | (488,291 | ) |
| Kindred Healthcare, Inc. | | | (28,795 | ) | | | (283,055 | ) |
| MWI Veterinary Supply, Inc. | | | (3,382 | ) | | | (347,568 | ) |
| Owens & Minor, Inc. | | | (11,941 | ) | | | (365,753 | ) |
| | | | | | | | (1,854,723 | ) |
| HEALTH CARE TECHNOLOGY — (0.3)% | |
| Quality Systems, Inc. | | | (8,668 | ) | | | (238,457 | ) |
| HOTELS, RESTAURANTS AND LEISURE — (1.7)% | |
| BJ’s Restaurants, Inc. | | | (4,163 | ) | | | (158,194 | ) |
| Darden Restaurants, Inc. | | | (8,529 | ) | | | (431,823 | ) |
| Hyatt Hotels Corp. Class A | | | (9,795 | ) | | | (363,982 | ) |
| MGM Resorts International | | | (12,727 | ) | | | (142,033 | ) |
| Tim Hortons, Inc. | | | (1,135 | ) | | | (59,747 | ) |
| | | | | | | | (1,155,779 | ) |
| HOUSEHOLD DURABLES — (0.8)% | |
| Mohawk Industries, Inc. | | | (697 | ) | | | (48,672 | ) |
| NVR, Inc. | | | (492 | ) | | | (418,200 | ) |
| Ryland Group, Inc. | | | (3,368 | ) | | | (86,153 | ) |
| | | | | | | | (553,025 | ) |
| HOUSEHOLD PRODUCTS — (0.2)% | |
| Procter & Gamble Co. (The) | | | (2,277 | ) | | | (139,466 | ) |
| INDEPENDENT POWER PRODUCERS AND ENERGY TRADERS — (0.6)% | |
| NRG Energy, Inc. | | | (23,375 | ) | | | (405,790 | ) |
| INSURANCE — (7.5)% | |
| Alleghany Corp. | | | (1,103 | ) | | | (374,744 | ) |
| American International Group, Inc. | | | (15,897 | ) | | | (510,135 | ) |
| Enstar Group Ltd. | | | (3,921 | ) | | | (387,944 | ) |
| Fairfax Financial Holdings Ltd. | | | (897 | ) | | | (351,355 | ) |
| Genworth Financial, Inc., Class A | | | (12,818 | ) | | | (72,550 | ) |
| Kemper Corp. | | | (11,337 | ) | | | (348,613 | ) |
| MBIA, Inc. | | | (43,369 | ) | | | (468,819 | ) |
| Old Republic International Corp. | | | (43,886 | ) | | | (363,815 | ) |
| OneBeacon Insurance Group Ltd. Class A | | | (22,216 | ) | | | (289,252 | ) |
| Platinum Underwriters Holdings Ltd. | | | (10,195 | ) | | | (388,430 | ) |
| Primerica, Inc. | | | (15,388 | ) | | | (411,321 | ) |
| Sun Life Financial, Inc. | | | (18,394 | ) | | | (400,253 | ) |
| Unum Group | | | (18,578 | ) | | | (355,397 | ) |
| White Mountains Insurance Group Ltd. | | | (690 | ) | | | (360,007 | ) |
| | | | | | | | (5,082,635 | ) |
| INTERNET AND CATALOG RETAIL — (0.1)% | |
| Amazon.com, Inc. | | | (165 | ) | | | (37,678 | ) |
| INTERNET SOFTWARE AND SERVICES — (1.6)% | |
| CoStar Group, Inc. | | | (6,058 | ) | | | (491,909 | ) |
| Equinix, Inc. | | | (2,230 | ) | | | (391,700 | ) |
| LinkedIn Corp. | | | (1,650 | ) | | | (175,345 | ) |
| | | | | | | | (1,058,954 | ) |
| IT SERVICES — (2.5)% | |
| Cognizant Technology Solutions Corp. | | | (1,620 | ) | | | (97,200 | ) |
| Genpact Ltd. | | | (18,952 | ) | | | (315,172 | ) |
| Global Payments, Inc. | | | (8,527 | ) | | | (368,622 | ) |
| Syntel, Inc. | | | (1,067 | ) | | | (64,767 | ) |
| VeriFone Systems, Inc. | | | (10,777 | ) | | | (356,611 | ) |
| Wright Express Corp. | | | (7,935 | ) | | | (489,748 | ) |
| | | | | | | | (1,692,120 | ) |
| MACHINERY — (2.9)% | |
| Colfax Corp. | | | (13,075 | ) | | | (360,478 | ) |
| Flowserve Corp. | | | (3,593 | ) | | | (412,297 | ) |
| Joy Global, Inc. | | | (6,203 | ) | | | (351,896 | ) |
| Navistar International Corp. | | | (5,211 | ) | | | (147,836 | ) |
| PACCAR, Inc. | | | (1,474 | ) | | | (57,766 | ) |
| SPX Corp. | | | (5,361 | ) | | | (350,181 | ) |
| Westport Innovations, Inc. | | | (8,010 | ) | | | (294,367 | ) |
| | | | | | | | (1,974,821 | ) |
| MEDIA — (3.6)% | |
| DreamWorks Animation SKG, Inc., Class A | | | (14,736 | ) | | | (280,868 | ) |
| Imax Corp. | | | (18,818 | ) | | | (452,197 | ) |
| Liberty Global, Inc. Class A | | | (3,959 | ) | | | (196,485 | ) |
| Liberty Media Corp. – Liberty Capital, Series A | | | (4,318 | ) | | | (379,596 | ) |
| Lions Gate Entertainment Corp. | | | (29,941 | ) | | | (441,330 | ) |
| Morningstar, Inc. | | | (6,529 | ) | | | (377,637 | ) |
| Pandora Media, Inc. | | | (26,196 | ) | | | (284,751 | ) |
| | | | | | | | (2,412,864 | ) |
| METALS AND MINING — (4.7)% | |
| AK Steel Holding Corp. | | | (44,950 | ) | | | (263,857 | ) |
| Allied Nevada Gold Corp. | | | (5,751 | ) | | | (163,213 | ) |
| AuRico Gold, Inc. | | | (40,493 | ) | | | (324,349 | ) |
| Carpenter Technology Corp. | | | (7,007 | ) | | | (335,215 | ) |
| Compass Minerals International, Inc. | | | (4,986 | ) | | | (380,332 | ) |
| Hecla Mining Co. | | | (35,998 | ) | | | (170,991 | ) |
| HudBay Minerals, Inc. | | | (5,276 | ) | | | (40,678 | ) |
| New Gold, Inc. | | | (17,502 | ) | | | (166,269 | ) |
| North American Palladium Ltd. | | | (46,479 | ) | | | (94,352 | ) |
| Northern Dynasty Minerals Ltd. | | | (36,750 | ) | | | $(85,995 | ) |
| Rubicon Minerals Corp. | | | (41,226 | ) | | | (125,327 | ) |
| Silver Standard Resources, Inc. | | | (27,239 | ) | | | (306,166 | ) |
| Thompson Creek Metals Co., Inc. | | | (59,910 | ) | | | (191,113 | ) |
| Titanium Metals Corp. | | | (31,769 | ) | | | (359,308 | ) |
| Walter Energy, Inc. | | | (4,745 | ) | | | (209,539 | ) |
| | | | | | | | (3,216,704 | ) |
| MULTI-UTILITIES — (0.3)% | |
| Black Hills Corp. | | | (7,355 | ) | | | (236,610 | ) |
| MULTILINE RETAIL — (1.2)% | |
| Family Dollar Stores, Inc. | | | (7,065 | ) | | | (469,681 | ) |
| J.C. Penney Co., Inc. | | | (14,005 | ) | | | (326,457 | ) |
| | | | | | | | (796,138 | ) |
| OFFICE ELECTRONICS — (0.4)% | |
| Zebra Technologies Corp., Class A | | | (7,472 | ) | | | (256,738 | ) |
| OIL, GAS AND CONSUMABLE FUELS — (5.8)% | |
| Approach Resources, Inc. | | | (11,012 | ) | | | (281,246 | ) |
| Bill Barrett Corp. | | | (15,974 | ) | | | (342,163 | ) |
| Cimarex Energy Co. | | | (4,044 | ) | | | (222,905 | ) |
| Consol Energy, Inc. | | | (3,944 | ) | | | (119,267 | ) |
| Enbridge, Inc. | | | (2,743 | ) | | | (109,501 | ) |
| EXCO Resources, Inc. | | | (53,785 | ) | | | (408,228 | ) |
| Golar LNG Ltd. | | | (10,763 | ) | | | (405,765 | ) |
| Hess Corp. | | | (1,884 | ) | | | (81,860 | ) |
| Kodiak Oil & Gas Corp. | | | (49,359 | ) | | | (405,237 | ) |
| Newfield Exploration Co. | | | (1,498 | ) | | | (43,906 | ) |
| Northern Oil and Gas, Inc. | | | (20,473 | ) | | | (326,340 | ) |
| Range Resources Corp. | | | (677 | ) | | | (41,886 | ) |
| Ship Finance International Ltd. | | | (5,303 | ) | | | (82,886 | ) |
| SM Energy Co. | | | (5,591 | ) | | | (274,574 | ) |
| Spectra Energy Corp. | | | (12,523 | ) | | | (363,918 | ) |
| Teekay Corp. | | | (1,446 | ) | | | (42,339 | ) |
| W&T Offshore, Inc. | | | (3,385 | ) | | | (51,791 | ) |
| World Fuel Services Corp. | | | (9,466 | ) | | | (359,992 | ) |
| | | | | | | | (3,963,804 | ) |
| PAPER AND FOREST PRODUCTS — (1.2)% | |
| Louisiana-Pacific Corp. | | | (43,333 | ) | | | (471,463 | ) |
| MeadWestvaco Corp. | | | (11,408 | ) | | | (327,980 | ) |
| | | | | | | | (799,443 | ) |
| PHARMACEUTICALS — (1.9)% | |
| Akorn, Inc. | | | (6,931 | ) | | | (109,302 | ) |
| Impax Laboratories, Inc. | | | (18,841 | ) | | | (381,907 | ) |
| Par Pharmaceutical Cos., Inc. | | | (5,236 | ) | | | (189,229 | ) |
| Valeant Pharmaceuticals International, Inc. | | | (8,778 | ) | | | (393,167 | ) |
| VIVUS, Inc. | | | (6,489 | ) | | | (185,196 | ) |
| | | | | | | | (1,258,801 | ) |
| PROFESSIONAL SERVICES — (0.7)% | |
| IHS, Inc. Class A | | | (4,131 | ) | | | (445,033 | ) |
| REAL ESTATE INVESTMENT TRUSTS (REITs) — (2.3)% | |
| DuPont Fabros Technology, Inc. | | | (11,037 | ) | | | (315,217 | ) |
| Equity Lifestyle Properties, Inc. | | | (4,704 | ) | | | (324,435 | ) |
| HCP, Inc. | | | (9,244 | ) | | | (408,123 | ) |
| Rayonier, Inc. | | | (4,113 | ) | | | (184,674 | ) |
| Senior Housing Properties Trust | | | (12,010 | ) | | | (268,063 | ) |
| UDR, Inc. | | | (1,478 | ) | | | (38,191 | ) |
| | | | | | | | (1,538,703 | ) |
| REAL ESTATE MANAGEMENT AND DEVELOPMENT — (2.3)% | |
| Brookfield Asset Management, Inc. Class A | | | (13,292 | ) | | | (439,965 | ) |
| Brookfield Office Properties, Inc. | | | (23,250 | ) | | | (405,015 | ) |
| Forest City Enterprises, Inc. Class A | | | (23,688 | ) | | | (345,845 | ) |
| St Joe Co. (The) | | | (23,880 | ) | | | (377,543 | ) |
| | | | | | | | (1,568,368 | ) |
| ROAD AND RAIL — (1.3)% | |
| Genesee & Wyoming, Inc. Class A | | | (7,078 | ) | | | (374,001 | ) |
| Hertz Global Holdings, Inc. | | | (31,719 | ) | | | (406,003 | ) |
| Ryder System, Inc. | | | (2,555 | ) | | | (92,006 | ) |
| | | | | | | | (872,010 | ) |
| SEMICONDUCTORS AND SEMICONDUCTOR EQUIPMENT — (3.9)% | |
| Atmel Corp. | | | (53,867 | ) | | | (360,909 | ) |
| Cavium, Inc. | | | (14,764 | ) | | | (413,392 | ) |
| First Solar, Inc. | | | (28,820 | ) | | | (434,029 | ) |
| Hittite Microwave Corp. | | | (2,683 | ) | | | (137,155 | ) |
| International Rectifier Corp. | | | (19,962 | ) | | | (399,040 | ) |
| MEMC Electronic Materials, Inc. | | | (85,786 | ) | | | (186,156 | ) |
| Semtech Corp. | | | (9,698 | ) | | | (235,855 | ) |
| Texas Instruments, Inc. | | | (12,279 | ) | | | (352,285 | ) |
| TriQuint Semiconductor, Inc. | | | (19,356 | ) | | | (106,458 | ) |
| | | | | | | | (2,625,279 | ) |
| SOFTWARE — (3.0)% | |
| ACI Worldwide, Inc. | | | (3,277 | ) | | | (144,876 | ) |
| Concur Technologies, Inc. | | | (7,557 | ) | | | (514,632 | ) |
| Informatica Corp. | | | (8,843 | ) | | | (374,589 | ) |
| NetSuite, Inc. | �� | | (3,336 | ) | | | (182,713 | ) |
| | | | Shares | | | | Value | |
| Salesforce.com, Inc. | | | (2,345 | ) | | | $(324,220 | ) |
| Solera Holdings, Inc. | | | (8,838 | ) | | | (369,340 | ) |
| Take-Two Interactive Software, Inc. | | | (15,716 | ) | | | (148,673 | ) |
| | | | | | | | (2,059,043 | ) |
| SPECIALTY RETAIL — (3.0)% | |
| Abercrombie & Fitch Co. Class A | | | (11,140 | ) | | | (380,320 | ) |
| AutoNation, Inc. | | | (6,650 | ) | | | (234,612 | ) |
| CarMax, Inc. | | | (12,727 | ) | | | (330,138 | ) |
| JOS A Bank Clothiers, Inc. | | | (8,632 | ) | | | (366,515 | ) |
| Tiffany & Co. | | | (6,430 | ) | | | (340,468 | ) |
| Urban Outfitters, Inc. | | | (15,123 | ) | | | (417,244 | ) |
| | | | | | | | (2,069,297 | ) |
| TEXTILES, APPAREL AND LUXURY GOODS — (2.3)% | |
| Columbia Sportswear Co. | | | (2,035 | ) | | | (109,117 | ) |
| Deckers Outdoor Corp. | | | (7,022 | ) | | | (309,038 | ) |
| Fossil, Inc. | | | (5,005 | ) | | | (383,083 | ) |
| Gildan Activewear, Inc. | | | (17,726 | ) | | | (487,819 | ) |
| Under Armour, Inc., Class A | | | (3,271 | ) | | | (309,044 | ) |
| | | | | | | | (1,598,101 | ) |
| THRIFTS AND MORTGAGE FINANCE — (0.1)% | |
| MGIC Investment Corp. | | | (30,865 | ) | | | (88,891 | ) |
| TRADING COMPANIES AND DISTRIBUTORS — (2.4)% | |
| Air Lease Corp. | | | (17,529 | ) | | | (339,887 | ) |
| Fastenal Co. | | | (8,165 | ) | | | (329,131 | ) |
| TAL International Group, Inc. | | | (11,071 | ) | | | (370,768 | ) |
| Textainer Group Holdings Ltd. | | | (14,623 | ) | | | (539,589 | ) |
| United Rentals, Inc. | | | (1,299 | ) | | | (44,218 | ) |
| | | | | | | | (1,623,593 | ) |
| WIRELESS TELECOMMUNICATION SERVICES — (0.4)% | |
| NII Holdings, Inc. | | | (9,710 | ) | | | (99,333 | ) |
| Shenandoah Telecommunications Co. | | | (14,480 | ) | | | (197,073 | ) |
| | | | | | | | (296,406 | ) |
TOTAL COMMON STOCKS SOLD SHORT — (99.2)% (Proceeds $69,149,696) | | | | (67,310,643 | ) |
OTHER ASSETS AND LIABILITIES(3) — 98.4% | | | | 66,804,314 | |
| TOTAL NET ASSETS — 100.0% | | | | $67,876,123 | |
Notes to Schedule of Investments
| (1) | Security, or a portion thereof, has been pledged at the custodian bank or with a broker for collateral requirements on securities sold short. At the period end, the aggregate value of securities pledged was $51,661,281. |
| (3) | Amount relates primarily to deposits with broker for securities sold short at period end. |
See Notes to Financial Statements.
Statement of Assets and Liabilities |
| JUNE 30, 2012 | |
| Assets | |
| Investment securities, at value (cost of $63,988,402) | | | $68,382,452 | |
| Cash | | | 6,750 | |
| Deposits with broker for securities sold short | | | 66,961,513 | |
| Receivable for investments sold | | | 2,418 | |
| Receivable for capital shares sold | | | 22,226 | |
| Dividends and interest receivable | | | 68,155 | |
| | | | 135,443,514 | |
| | | | | |
| Liabilities | | | | |
| Securities sold short, at value (proceeds of $69,149,696) | | | 67,310,643 | |
| Payable for capital shares redeemed | | | 125,576 | |
| Accrued management fees | | | 77,802 | |
| Distribution and service fees payable | | | 11,907 | |
| Dividend expense payable on securities sold short | | | 39,098 | |
| Broker fees and charges payable on securities sold short | | | 2,365 | |
| | | | 67,567,391 | |
| | | | | |
| Net Assets | | | $67,876,123 | |
| | | | | |
| Net Assets Consist of: | | | | |
| Capital (par value and paid-in surplus) | | | $76,086,856 | |
| Accumulated net investment loss | | | (857,655 | ) |
| Accumulated net realized loss | | | (13,586,106 | ) |
| Net unrealized appreciation | | | 6,233,028 | |
| | | | $67,876,123 | |
| | Net assets | Shares outstanding | Net asset value per share |
| Investor Class, $0.01 Par Value | $23,018,829 | 2,183,867 | $10.54 |
| Institutional Class, $0.01 Par Value | $5,617,533 | 527,225 | $10.65 |
| A Class, $0.01 Par Value | $32,386,126 | 3,111,317 | $10.41* |
| C Class, $0.01 Par Value | $5,814,548 | 583,104 | $9.97 |
| R Class, $0.01 Par Value | $1,039,087 | 101,230 | $10.26 |
*Maximum offering price $11.05 (net asset value divided by 0.9425)
See Notes to Financial Statements.
| YEAR ENDED JUNE 30, 2012 | |
| Investment Income (Loss) | |
| Income: | | | |
| Dividends (net of foreign taxes withheld of $3,955) | | | $883,558 | |
| Interest | | | 770 | |
| | | | 884,328 | |
| | | | | |
| Expenses: | | | | |
| Dividend expense on securities sold short | | | 950,343 | |
| Broker fees and charges on securities sold short | | | 382,570 | |
| Management fees | | | 925,695 | |
| Distribution and service fees: | | | | |
| A Class | | | 77,481 | |
| B Class | | | 4,768 | |
| C Class | | | 64,989 | |
| R Class | | | 5,081 | |
| Directors’ fees and expenses | | | 5,737 | |
| Other expenses | | | 460 | |
| | | | 2,417,124 | |
| | | | | |
| Net investment income (loss) | | | (1,532,796 | ) |
| | | | | |
| Realized and Unrealized Gain (Loss) | | | | |
| Net realized gain (loss) on: | | | | |
| Investment transactions | | | 5,996,198 | |
| Securities sold short transactions | | | (9,885 | ) |
| Foreign currency transactions | | | 87 | |
| | | | 5,986,400 | |
| | | | | |
| Change in net unrealized appreciation (depreciation) on: | | | | |
| Investments | | | (7,440,113 | ) |
| Securities sold short | | | 3,737,562 | |
| Translation of assets and liabilities in foreign currencies | | | 73 | |
| | | | (3,702,478 | ) |
| | | | | |
| Net realized and unrealized gain (loss) | | | 2,283,922 | |
| | | | | |
| Net Increase (Decrease) in Net Assets Resulting from Operations | | | $751,126 | |
See Notes to Financial Statements.
Statement of Changes in Net Assets |
| YEARS ENDED JUNE 30, 2012 AND JUNE 30, 2011 | |
| Increase (Decrease) in Net Assets | June 30, 2012 | | | June 30, 2011 | |
| Operations | |
| Net investment income (loss) | | $(1,532,796 | ) | | | $(2,218,422 | ) |
| Net realized gain (loss) | | 5,986,400 | | | | 19,049,580 | |
| Change in net unrealized appreciation (depreciation) | | (3,702,478 | ) | | | (14,322,526 | ) |
| Net increase (decrease) in net assets resulting from operations | | 751,126 | | | | 2,508,632 | |
| | | | | | | | |
| Capital Share Transactions | | | | | | | |
| Net increase (decrease) in net assets from capital share transactions | | 3,082,233 | | | | (53,103,549 | ) |
| | | | | | | | |
| Net increase (decrease) in net assets | | 3,833,359 | | | | (50,594,917 | ) |
| | | | | | | | |
| Net Assets | | | | | | | |
| Beginning of period | | 64,042,764 | | | | 114,637,681 | |
| End of period | | $67,876,123 | | | | $64,042,764 | |
| | | | | | | | |
| Accumulated net investment loss | | $(857,655 | ) | | | $(56 | ) |
See Notes to Financial Statements.
Notes to Financial Statements |
JUNE 30, 2012
1. Organization
American Century Quantitative Equity Funds, Inc. (the corporation) is registered under the Investment Company Act of 1940, as amended (the 1940 Act), as an open-end management investment company and is organized as a Maryland corporation. Equity Market Neutral Fund (the fund) is one fund in a series issued by the corporation. The fund is diversified as defined under the 1940 Act. The fund’s investment objective is to seek capital appreciation independent of equity market conditions. The fund pursues its objective by investing primarily in publicly-traded U.S. companies that have a market capitalization greater than $1 billion. The fund takes long positions in equity securities that have been identified as undervalued and short positions in equity securities that have been identified as overvalued. The fund’s investment process is designed to maintain approximately equal dollar amounts invested in long and short positions at all times.
The fund offers the Investor Class, the Institutional Class, the A Class, the C Class and the R Class. The A Class may incur an initial sales charge. The A Class and C Class may be subject to a contingent deferred sales charge. The share classes differ principally in their respective sales charges and distribution and shareholder servicing expenses and arrangements. The Institutional Class is made available to institutional shareholders or through financial intermediaries whose clients do not require the same level of shareholder and administrative services as shareholders of other classes. As a result, the Institutional Class is charged a lower unified management fee. On October 21, 2011, all outstanding B Class shares were converted to A Class shares and the fund discontinued offering the B Class.
2. Significant Accounting Policies
The following is a summary of significant accounting policies consistently followed by the fund in preparation of its financial statements. The financial statements are prepared in conformity with accounting principles generally accepted in the United States of America, which may require management to make certain estimates and assumptions at the date of the financial statements. Actual results could differ from these estimates.
Investment Valuations — The fund determines the fair value of its investments and computes its net asset value per share as of the close of regular trading (usually 4 p.m. Eastern time) on the New York Stock Exchange (NYSE) on each day the NYSE is open.
Equity securities that are listed or traded on a domestic securities exchange are valued at the last reported sales price or at the official closing price as provided by the exchange. Equity securities traded on foreign securities exchanges are typically valued at the closing price on the exchange where primarily traded or as of the close of the NYSE, if that is earlier. If no last sales price is reported, or if local convention or regulation so provides, the mean of the latest bid and asked prices is used. Depending on local convention or regulation, securities traded over-the-counter are valued at the mean of the latest bid and asked prices, the last sales price, or the official closing price. In its determination of fair value, the fund may review several factors including: market information specific to a security; news developments in U.S. and foreign markets; the performance of particular U.S. and foreign securities, indices, comparable securities, American Depositary Receipts, Exchange-Traded Funds, and other relevant market indicators.
Debt securities maturing within 60 days at the time of purchase may be valued at cost, plus or minus any amortized discount or premium or at the evaluated mean as provided by an independent pricing service. Evaluated mean prices are commonly derived through utilization of market models, which may consider, among other factors, trade data, quotations from dealers and active market makers, relevant yield curve and spread data, related sector levels, creditworthiness, and other relevant market information on the same or comparable securities.
Investments in open-end management investment companies are valued at the reported net asset value per share. Repurchase agreements are valued at cost.
The value of investments initially expressed in foreign currencies is translated into U.S. dollars at prevailing exchange rates.
If the fund determines that the market price for a portfolio security is not readily available or the valuation methods mentioned above do not reflect a security’s fair value, such security is valued as determined in good faith by the Board of Directors or its designee, in accordance with procedures adopted by the Board of Directors. Circumstances that may cause the fund to use these procedures to value a security include, but are not limited to: a security has been declared in default; trading in a security has been halted during the trading day; there is a foreign market holiday and no trading occurred; or an event occurred between the close of a foreign exchange and the NYSE that may affect the value of a security.
Security Transactions — Security transactions are accounted for as of the trade date. Net realized gains and losses are determined on the identified cost basis, which is also used for federal income tax purposes.
Investment Income — Dividend income less foreign taxes withheld, if any, is recorded as of the ex-dividend date. Interest income is recorded on the accrual basis and includes accretion of discounts and amortization of premiums.
Securities Sold Short —The fund enters into short sales, which is selling securities it does not own, as part of its normal investment activities. Upon selling a security short, the fund will segregate cash, cash equivalents or other appropriate liquid securities in at least an amount equal to the current market value of the securities sold short until the fund replaces the borrowed security. Interest earned on segregated cash for securities sold short is reflected as interest income. The fund is required to pay any dividends or interest due on securities sold short. Such dividends and interest are recorded as an expense. The fund may pay fees or charges on the assets borrowed for securities sold short. Liabilities for securities sold short are valued daily and changes in value are recorded as change in net unrealized appreciation (depreciation) on securities sold short. The fund records realized gain (loss) on a security sold short when it is terminated by the fund and includes as a component of net realized gain (loss) on securities sold short transactions.
Foreign Currency Translations — All assets and liabilities initially expressed in foreign currencies are translated into U.S. dollars at prevailing exchange rates at period end. The fund may enter into spot foreign currency exchange contracts to facilitate transactions denominated in a foreign currency. Purchases and sales of investment securities, dividend and interest income, spot foreign currency exchange contracts, and expenses are translated at the rates of exchange prevailing on the respective dates of such transactions. Net realized and unrealized foreign currency exchange gains or losses related to investment securities are a component of net realized gain (loss) on investment transactions and change in net unrealized appreciation (depreciation) on investments, respectively. Net realized and unrealized foreign currency exchange gains or losses related to securities sold short are a component of net realized gain (loss) on securities sold short transactions and change in net unrealized appreciation (depreciation) on securities sold short, respectively.
Repurchase Agreements — The fund may enter into repurchase agreements with institutions that American Century Investment Management, Inc. (ACIM) (the investment advisor) has determined are creditworthy pursuant to criteria adopted by the Board of Directors. The fund requires that the collateral, represented by securities, received in a repurchase transaction be transferred to the custodian in a manner sufficient to enable the fund to obtain those securities in the event of a default under the repurchase agreement. ACIM monitors, on a daily basis, the securities transferred to ensure the value, including accrued interest, of the securities under each repurchase agreement is equal to or greater than amounts owed to the fund under each repurchase agreement.
Joint Trading Account — Pursuant to an Exemptive Order issued by the Securities and Exchange Commission, the fund, along with certain other funds in the American Century Investments family of funds, may transfer uninvested cash balances into a joint trading account. These balances are invested in one or more repurchase agreements that are collateralized by U.S. Treasury or Agency obligations.
Segregated Assets — In accordance with the 1940 Act, the fund segregates assets on its books and records to cover certain types of investments, including, but not limited to, futures contracts and short sales. ACIM monitors, on a daily basis, the securities segregated to ensure the fund designates a sufficient amount of liquid assets, marked-to-market daily. The fund may also receive assets or be required to pledge assets at the custodian bank or with a broker for margin requirements on futures contracts and short sales.
Income Tax Status — It is the fund’s policy to distribute substantially all net investment income and net realized gains to shareholders and to otherwise qualify as a regulated investment company under provisions of the Internal Revenue Code. The fund is no longer subject to examination by tax authorities for years prior to 2009. At this time, management believes there are no uncertain tax positions which, based on their technical merit, would not be sustained upon examination and for which it is reasonably possible that the total amounts of unrecognized tax benefits will significantly change in the next twelve months. Accordingly, no provision has been made for federal or state income taxes.
Multiple Class — All shares of the fund represent an equal pro rata interest in the net assets of the class to which such shares belong, and have identical voting, dividend, liquidation and other rights and the same terms and conditions, except for class specific expenses and exclusive rights to vote on matters affecting only individual classes. Income, non-class specific expenses, and realized and unrealized capital gains and losses of the fund are allocated to each class of shares based on their relative net assets.
Distributions to Shareholders — Distributions from net investment income, if any, are generally declared and paid semiannually. Distributions from net realized gains, if any, are generally declared and paid annually.
Indemnifications — Under the corporation’s organizational documents, its officers and directors are indemnified against certain liabilities arising out of the performance of their duties to the fund. In addition, in the normal course of business, the fund enters into contracts that provide general indemnifications. The maximum exposure under these arrangements is unknown as this would involve future claims that may be made against a fund. The risk of material loss from such claims is considered by management to be remote.
3. Fees and Transactions with Related Parties
Management Fees — The corporation has entered into a management agreement with ACIM, under which ACIM provides the fund with investment advisory and management services in exchange for a single, unified management fee (the fee) per class. The agreement provides that all expenses of managing and operating the fund, except distribution and service fees, brokerage expenses, taxes, interest, fees and expenses of the independent directors (including legal counsel fees), and extraordinary expenses, will be paid by ACIM. The fee is computed and accrued daily based on each class’s daily net assets and paid monthly in arrears. The fee consists of (1) an Investment Category Fee based on the daily net assets of the fund and certain other accounts managed by the investment advisor that are in the same broad investment category as the fund and (2) a Complex Fee based on the assets of all the funds in the American Century Investments family of funds. The rates for the Investment Category Fee range from 1.0480% to 1.2300%. The rates for the Complex Fee range from 0.2500% to 0.3100% for the Investor Class, A Class, B Class, C Class and R Class. The Institutional Class is 0.2000% less at each point within the Complex Fee range. The effective annual management fee for each class for the year ended June 30, 2012 was 1.39% for the Investor Class, A Class, C Class and R Class and 1.19% for the Institutional Class.
Distribution and Service Fees — The Board of Directors has adopted a separate Master Distribution and Individual Shareholder Services Plan for each of the A Class, B Class, C Class and R Class (collectively the plans), pursuant to Rule 12b-1 of the 1940 Act. The plans provide that the A Class will pay American Century Investment Services, Inc. (ACIS) an annual distribution and service fee of 0.25%. The plans provide that the B Class and C Class will each pay ACIS an annual distribution and service fee of 1.00%, of which 0.25% is paid for individual shareholder services and 0.75% is paid for distribution services. The plans provide that the R Class will pay ACIS an annual distribution and service fee of 0.50%. The fees are computed and accrued daily based on each class’s daily net assets and
paid monthly in arrears. The fees are used to pay financial intermediaries for distribution and individual shareholder services. Fees incurred under the plans during the year ended June 30, 2012 are detailed in the Statement of Operations.
Related Parties — Certain officers and directors of the corporation are also officers and/or directors of American Century Companies, Inc., the parent of the corporation’s investment advisor, ACIM, the distributor of the corporation, ACIS, and the corporation’s transfer agent, American Century Services, LLC.
4. Investment Transactions
Purchases and sales of investment securities and securities sold short, excluding short-term investments, for the year ended June 30, 2012 were $160,936,475 and $162,857,563, respectively.
5. Capital Share Transactions
Transactions in shares of the fund were as follows:
| | Year ended June 30, 2012 | | Year ended June 30, 2011 | |
| | Shares | | Amount | | Shares | | Amount | |
| Investor Class/Shares Authorized | | 50,000,000 | | | | | 50,000,000 | | | |
| Sold | | 1,620,653 | | | $17,110,664 | | | 1,195,601 | | | $11,968,740 | |
| Redeemed | | (1,544,690 | ) | | (16,273,093 | ) | | (744,261 | ) | | (7,468,960 | ) |
| | | 75,963 | | | 837,571 | | | 451,340 | | | 4,499,780 | |
| Institutional Class/Shares Authorized | | 50,000,000 | | | | | | 50,000,000 | | | | |
| Sold | | 199,402 | | | 2,120,737 | | | 108,261 | | | 1,094,820 | |
| Redeemed | | (72,932 | ) | | (776,372 | ) | | (887,343 | ) | | (8,807,772 | ) |
| | | 126,470 | | | 1,344,365 | | | (779,082 | ) | | (7,712,952 | ) |
| A Class/Shares Authorized | | 70,000,000 | | | | | | 70,000,000 | | | | |
| Sold | | 1,814,978 | | | 18,985,401 | | | 1,305,940 | | | 12,973,766 | |
| Redeemed | | (1,497,517 | ) | | (15,582,495 | ) | | (5,844,746 | ) | | (58,522,465 | ) |
| | | 317,461 | | | 3,402,906 | | | (4,538,806 | ) | | (45,548,699 | ) |
| B Class/Shares Authorized | | N/A | | | | | | 10,000,000 | | | | |
| Sold | | — | | | — | | | 412 | | | 4,000 | |
| Redeemed | | (162,298 | ) | | (1,615,385 | ) | | (73,864 | ) | | (713,531 | ) |
| | | (162,298 | ) | | (1,615,385 | ) | | (73,452 | ) | | (709,531 | ) |
| C Class/Shares Authorized | | 10,000,000 | | | | | | 10,000,000 | | | | |
| Sold | | 79,102 | | | 793,444 | | | 85,170 | | | 825,574 | |
| Redeemed | | (186,631 | ) | | (1,871,781 | ) | | (486,684 | ) | | (4,684,340 | ) |
| | | (107,529 | ) | | (1,078,337 | ) | | (401,514 | ) | | (3,858,766 | ) |
| R Class/Shares Authorized | | 10,000,000 | | | | | | 10,000,000 | | | | |
| Sold | | 58,373 | | | 600,649 | | | 48,738 | | | 480,644 | |
| Redeemed | | (39,576 | ) | | (409,536 | ) | | (25,826 | ) | | (254,025 | ) |
| | | 18,797 | | | 191,113 | | | 22,912 | | | 226,619 | |
| Net increase (decrease) | | 268,864 | | | $3,082,233 | | | (5,318,602 | ) | | $(53,103,549 | ) |
6. Fair Value Measurements
The fund’s securities valuation process is based on several considerations and may use multiple inputs to determine the fair value of the positions held by the fund. In conformity with accounting principles generally accepted in the United States of America, the inputs used to determine a valuation are classified into three broad levels as follows:
| • | Level 1 valuation inputs consist of unadjusted quoted prices in an active market for identical securities; |
| • | Level 2 valuation inputs consist of direct or indirect observable market data (including quoted prices for similar securities, evaluations of subsequent market events, interest rates, prepayment speeds, credit risk, etc.); or |
| • | Level 3 valuation inputs consist of unobservable data (including a fund’s own assumptions). |
The level classification is based on the lowest level input that is significant to the fair valuation measurement. The valuation inputs are not necessarily an indication of the risks associated with investing in these securities or other financial instruments.
The following is a summary of the level classifications as of period end. The Schedule of Investments provides additional information on the fund’s portfolio holdings.
| | | | | | | | | |
| | Level 1 | | Level 2 | | Level 3 |
| Investment Securities | | | | | | | | |
| Domestic Common Stocks | | $60,584,784 | | | | — | | | | — | |
| Foreign Common Stocks | | 6,904,272 | | | | — | | | | — | |
| Temporary Cash Investments | | 250,941 | | | | $642,455 | | | | — | |
| Total Value of Investment Securities | | $67,739,997 | | | | $642,455 | | | | — | |
| | | | | | | | | | | | |
| Securities Sold Short | | | | | | | | | | | |
| Domestic Common Stocks | | $(60,565,109 | ) | | | — | | | | — | |
| Foreign Common Stocks | | (6,745,534 | ) | | | — | | | | — | |
| Total Value of Securities Sold Short | | $(67,310,643 | ) | | | — | | | | — | |
7. Risk Factors
The fund’s investment process may result in high portfolio turnover, which could mean high transaction costs, affecting both performance and capital gains tax liabilities to investors.
The fund is subject to short sales risk. If the market price of a security increases after the fund borrows the security, the fund may suffer a loss when it replaces the borrowed security at the higher price. Any loss will be increased by the amount of compensation, interest or dividends, and transaction costs the fund must pay to the lender of the borrowed security.
If the fund is overweighted in a stock or sector, any negative development related to that stock or sector will have a greater impact on the fund than other funds that are not overweighted in that stock or sector.
There are certain risks involved in investing in foreign securities. These risks include those resulting from future adverse political, social and economic developments, fluctuations in currency exchange rates, the possible imposition of exchange controls, and other foreign laws or restrictions.
8. Federal Tax Information
The book-basis character of distributions made during the year from net investment income or net realized gains may differ from their ultimate characterization for federal income tax purposes. These differences reflect the differing character of certain income items and net realized gains and losses for financial statement and tax purposes, and may result in reclassification among certain capital accounts on the financial statements. There were no distributions paid by the fund during the years ended June 30, 2012 and June 30, 2011.
The reclassifications, which are primarily due to net operating losses, were made to capital $(682,629), accumulated net investment loss $675,197, and accumulated net realized loss $7,432.
As of June 30, 2012, the federal tax cost of investments and the components of distributable earnings on a tax-basis were as follows:
| | | | | |
| Federal tax cost of investments | | | $64,034,909 | |
| Gross tax appreciation of investments | | | $8,245,633 | |
| Gross tax depreciation of investments | | | (3,898,090 | ) |
| Net tax appreciation (depreciation) of investments | | | $4,347,543 | |
| Net tax appreciation (depreciation) on securities sold short | | | $1,511,910 | |
Net tax appreciation (depreciation) on translation of assets and liabilities in foreign currencies | | | $(75 | ) |
| Net tax appreciation (depreciation) | | | $5,859,378 | |
| Undistributed ordinary income | | | — | |
| Accumulated short-term capital losses | | | $(12,776,596 | ) |
| Post-October capital loss deferral | | | $(435,860 | ) |
| Late-year ordinary loss deferral | | | $(857,655 | ) |
The difference between book-basis and tax-basis cost and unrealized appreciation (depreciation) is attributable primarily to the tax deferral of losses on wash sales.
The accumulated capital losses represent net capital loss carryovers that may be used to offset future realized capital gains for federal income tax purposes. Future capital loss carryover utilization in any given year may be subject to Internal Revenue Code limitations. Capital loss carryovers of $(3,625,547) and $(9,151,049) expire in 2017 and 2018, respectively.
The loss deferrals represent certain qualified losses that the fund has elected to treat as having been incurred in the following fiscal year for federal income tax purposes.
| For a Share Outstanding Throughout the Years Ended June 30 (except as noted) |
| Per-Share Data | Ratios and Supplemental Data |
| | | Income From Investment Operations: | | | | Ratio to Average Net Assets of: | | |
| | Net Asset Value, Beginning of Period | Net Investment Income (Loss)(1) | Net Realized and Unrealized Gain (Loss) | Total From Investment Operations | Distributions From Net Investment Income | Net Asset Value, End of Period | Total Return(2) | Operating Expenses | Operating Expenses (excluding expenses on securities sold short) | Net Investment Income (Loss) | Portfolio Turnover Rate | Net Assets, End of Period (in thousands) |
| Investor Class |
| 2012 | $10.37 | (0.22) | 0.39 | 0.17 | — | $10.54 | 1.64% | 3.38% | 1.40% | (2.07)% | 252% | $23,019 |
| 2011 | $10.00 | (0.22) | 0.59 | 0.37 | — | $10.37 | 3.70% | 3.50% | 1.42% | (2.34)% | 261% | $21,866 |
| 2010 | $10.01 | (0.17) | 0.16 | (0.01) | — | $10.00 | (0.10)% | 3.09% | 1.42% | (1.68)% | 140% | $16,570 |
| 2009 | $10.92 | (0.16) | (0.75) | (0.91) | — | $10.01 | (8.33)% | 3.34% | 1.41% | (1.56)% | 330% | $22,956 |
| 2008 | $11.22 | 0.08 | (0.15) | (0.07) | (0.23) | $10.92 | (0.67)% | 2.89% | 1.39% | 0.90% | 356% | $28,939 |
| Institutional Class |
| 2012 | $10.46 | (0.20) | 0.39 | 0.19 | — | $10.65 | 1.82% | 3.18% | 1.20% | (1.87)% | 252% | $5,618 |
| 2011 | $10.07 | (0.26) | 0.65 | 0.39 | — | $10.46 | 3.87% | 3.30% | 1.22% | (2.14)% | 261% | $4,194 |
| 2010 | $10.06 | (0.16) | 0.17 | 0.01 | — | $10.07 | 0.10% | 2.89% | 1.22% | (1.48)% | 140% | $11,882 |
| 2009 | $10.95 | (0.15) | (0.74) | (0.89) | — | $10.06 | (8.13)% | 3.14% | 1.21% | (1.36)% | 330% | $22,354 |
| 2008 | $11.24 | 0.17 | (0.22) | (0.05) | (0.24) | $10.95 | (0.48)% | 2.69% | 1.19% | 1.10% | 356% | $12,989 |
| A Class |
| 2012 | $10.27 | (0.24) | 0.38 | 0.14 | — | $10.41 | 1.36% | 3.63% | 1.65% | (2.32)% | 252% | $32,386 |
| 2011 | $9.93 | (0.26) | 0.60 | 0.34 | — | $10.27 | 3.42% | 3.75% | 1.67% | (2.59)% | 261% | $28,691 |
| 2010 | $9.96 | (0.19) | 0.16 | (0.03) | — | $9.93 | (0.30)% | 3.34% | 1.67% | (1.93)% | 140% | $72,781 |
| 2009 | $10.89 | (0.18) | (0.75) | (0.93) | — | $9.96 | (8.54)% | 3.59% | 1.66% | (1.81)% | 330% | $104,634 |
| 2008 | $11.21 | 0.07 | (0.18) | (0.11) | (0.21) | $10.89 | (0.98)% | 3.14% | 1.64% | 0.65% | 356% | $145,265 |
| For a Share Outstanding Throughout the Years Ended June 30 (except as noted) |
| Per-Share Data | Ratios and Supplemental Data |
| | | Income From Investment Operations: | | | | Ratio to Average Net Assets of: | | |
| | Net Asset Value, Beginning of Period | Net Investment Income (Loss)(1) | Net Realized and Unrealized Gain (Loss) | Total From Investment Operations | Distributions From Net Investment Income | Net Asset Value, End of Period | Total Return(2) | Operating Expenses | Operating Expenses (excluding expenses on securities sold short) | Net Investment Income (Loss) | Portfolio Turnover Rate | Net Assets, End of Period (in thousands) |
| C Class |
| 2012 | $9.91 | (0.31) | 0.37 | 0.06 | — | $9.97 | 0.61% | 4.38% | 2.40% | (3.07)% | 252% | $5,815 |
| 2011 | $9.65 | (0.32) | 0.58 | 0.26 | — | $9.91 | 2.69% | 4.50% | 2.42% | (3.34)% | 261% | $6,845 |
| 2010 | $9.76 | (0.26) | 0.15 | (0.11) | — | $9.65 | (1.13)% | 4.09% | 2.42% | (2.68)% | 140% | $10,543 |
| 2009 | $10.75 | (0.26) | (0.73) | (0.99) | — | $9.76 | (9.21)% | 4.34% | 2.41% | (2.56)% | 330% | $17,821 |
| 2008 | $11.11 | —(3) | (0.19) | (0.19) | (0.17) | $10.75 | (1.72)% | 3.89% | 2.39% | (0.10)% | 356% | $20,673 |
| R Class |
| 2012 | $10.15 | (0.26) | 0.37 | 0.11 | — | $10.26 | 1.08% | 3.88% | 1.90% | (2.57)% | 252% | $1,039 |
| 2011 | $9.84 | (0.26) | 0.57 | 0.31 | — | $10.15 | 3.15% | 4.00% | 1.92% | (2.84)% | 261% | $837 |
| 2010 | $9.89 | (0.21) | 0.16 | (0.05) | — | $9.84 | (0.51)% | 3.59% | 1.92% | (2.18)% | 140% | $586 |
| 2009 | $10.85 | (0.22) | (0.74) | (0.96) | — | $9.89 | (8.85)% | 3.84% | 1.91% | (2.06)% | 330% | $1,004 |
| 2008 | $11.18 | 0.04 | (0.17) | (0.13) | (0.20) | $10.85 | (1.19)% | 3.39% | 1.89% | 0.40% | 356% | $694 |
Notes to Financial Highlights
| (1) | Computed using average shares outstanding throughout the period. |
| (2) | Total returns are calculated based on the net asset value of the last business day and do not reflect applicable sales charges, if any. Total returns for periods less than one year are not annualized. |
| (3) | Per-share amount was less than $0.005. |
See Notes to Financial Statements.
Report of Independent Registered Public Accounting Firm |
To the Directors of the American Century Quantitative Equity Funds, Inc.
and Shareholders of the Equity Market Neutral Fund:
In our opinion, the accompanying statement of assets and liabilities, including the schedule of investments, and the related statements of operations and of changes in net assets and the financial highlights present fairly, in all material respects, the financial position of the Equity Market Neutral Fund (one of the fourteen funds comprising the American Century Quantitative Equity Funds, Inc., hereafter referred to as the “Fund”) at June 30, 2012, the results of its operations for the year then ended, the changes in its net assets for each of the two years in the period then ended and the financial highlights for each of the five years in the period then ended, in conformity with accounting principles generally accepted in the United States of America. These financial statements and financial highlights (hereafter referred to as “financial statements”) are the responsibility of the Fund’s management; our responsibility is to express an opinion on these financial statements based on our audits. We conducted our audits of these financial statements in accordance with the standards of the Public Company Accounting Oversight Board (United States). Those standards require that we plan and perform the audit to obtain reasonable assurance about whether the financial statements are free of material misstatement. An audit includes examining, on a test basis, evidence supporting the amounts and disclosures in the financial statements, assessing the accounting principles used and significant estimates made by management, and evaluating the overall financial statement presentation. We believe that our audits, which included confirmation of securities at June 30, 2012 by correspondence with the custodian and brokers, provide a reasonable basis for our opinion.
PricewaterhouseCoopers LLP
Kansas City, Missouri
August 21, 2012
Board of Directors
The individuals listed below serve as directors of the funds. Each director will continue to serve in this capacity until death, retirement, resignation or removal from office. The mandatory retirement age for directors who are not “interested persons,” as that term is defined in the Investment Company Act (independent directors), is 73. However, the mandatory retirement age may be extended for a period not to exceed two years with the approval of the remaining independent directors.
Mr. Thomas is the only director who is an “interested person” because he currently serves as President and Chief Executive Officer of American Century Companies, Inc. (ACC), the parent company of American Century Investment Management, Inc. (ACIM or the advisor).
The other directors (more than three-fourths of the total number) are independent; that is, they have never been employees, directors or officers of, and have no financial interest in, ACC or any of its wholly owned, direct or indirect, subsidiaries, including ACIM, American Century Investment Services, Inc. (ACIS) and American Century Services, LLC (ACS). The directors serve in this capacity for eight (in the case of Mr. Thomas, 15) registered investment companies in the American Century Investments family of funds.
The following table presents additional information about the directors. The mailing address for each director other than Mr. Thomas is 1665 Charleston Road, Mountain View, California 94043. The mailing address for Mr. Thomas is 4500 Main Street, Kansas City, Missouri 64111.
Name (Year of Birth) | Position(s) Held with Funds | Length of Time Served | | Principal Occupation(s) During Past 5 Years | | Number of American Century Portfolios Overseen by Director | Other Directorships Held During Past 5 Years |
| Independent Directors |
Tanya S. Beder (1955) | Director | Since 2011 | | Chairman, SBCC Group Inc. (investment advisory services)(2006 to present); Fellow in Practice, International Center for Finance, Yale University School of Management (1985 to present) | | 42 | CYS Investments, Inc. (specialty finance company) |
Jeremy I. Bulow (1954) | Director | Since 2011 | | Professor of Economics, Stanford University, Graduate School of Business (1979 to present) | | 42 | None |
Ronald J. Gilson (1946) | Director and Chairman of the Board | Since 1995 | | Charles J. Meyers Professor of Law and Business, Stanford Law School (1979 to present); Marc and Eva Stern Professor of Law and Business, Columbia University School of Law (1992 to present) | | 42 | None |
Name (Year of Birth) | Position(s) Held with Funds | Length of Time Served | | Principal Occupation(s) During Past 5 Years | | Number of American Century Portfolios Overseen by Director | Other Directorships Held During Past 5 Years |
| Independent Directors |
Frederick L. A. Grauer (1946) | Director | Since 2008 | | Senior Advisor, BlackRock, Inc. (investment management firm) (2010 to 2011); Senior Advisor, Barclays Global Investors (investment management firm) (2003 to 2009) | | 42 | None |
Peter F. Pervere (1947) | Director | Since 2007 | | Retired | | 42 | Intraware, Inc. (2003 to 2009) |
Myron S. Scholes (1941) | Director | Since 1980 | | Chairman, Platinum Grove Asset Management, L.P. (asset manager) (1999 to 2009); Frank E. Buck Professor of Finance-Emeritus, Stanford Graduate School of Business (1996 to present) | | 42 | Dimensional Fund Advisors (investment advisor); CME Group, Inc. (futures and options exchange) |
John B. Shoven (1947) | Director | Since 2002 | | Professor of Economics, Stanford University (1973 to present) | | 42 | Cadence Design Systems; Exponent; Financial Engines |
| |
| Interested Director |
Jonathan S. Thomas (1963) | Director and President | Since 2007 | | President and Chief Executive Officer, ACC (March 2007 to present); Chief Administrative Officer, ACC (February 2006 to February 2007); Executive Vice President, ACC (November 2005 to February 2007). Also serves as Chief Executive Officer and Manager, ACS; Executive Vice President, ACIM; Director, ACC, ACIM and other ACC subsidiaries | | 108 | None |
Officers
The following table presents certain information about the executive officers of the funds. Each officer serves as an officer for each of the 15 investment companies in the American Century family of funds, unless otherwise noted. No officer is compensated for his or her service as an officer of the funds. The listed officers are interested persons of the funds and are appointed or re-appointed on an annual basis. The mailing address for each of the officers listed below is 4500 Main Street, Kansas City, Missouri 64111.
Name (Year of Birth) | Offices with the Funds | Principal Occupation(s) During the Past Five Years |
Jonathan S. Thomas (1963) | Director and President since 2007 | President and Chief Executive Officer, ACC (March 2007 to present); Chief Administrative Officer, ACC (February 2006 to February 2007); Executive Vice President, ACC (November 2005 to February 2007). Also serves as Chief Executive Officer and Manager, ACS; Executive Vice President, ACIM; Director, ACC, ACIM and other ACC subsidiaries |
Barry Fink (1955) | Executive Vice President since 2007 | Chief Operating Officer and Executive Vice President, ACC (September 2007 to present); President, ACS (October 2007 to present); Managing Director, Morgan Stanley (2000 to 2007). Also serves as Manager, ACS and Director, ACC and certain ACC subsidiaries |
Maryanne L. Roepke (1956) | Chief Compliance Officer since 2006 and Senior Vice President since 2000 | Chief Compliance Officer, American Century funds, ACIM and ACS (August 2006 to present). Also serves as Senior Vice President, ACS |
Charles A. Etherington (1957) | General Counsel since 2007 and Senior Vice President since 2006 | Attorney, ACC (February 1994 to present); Vice President, ACC (November 2005 to present), General Counsel, ACC (March 2007 to present); Also serves as General Counsel, ACIM, ACS, ACIS and other ACC subsidiaries; and Senior Vice President, ACIM and ACS |
C. Jean Wade (1964) | Vice President, Treasurer and Chief Financial Officer since 2012 | Vice President, ACS (February 2000 to present) |
Robert J. Leach (1966) | Vice President since 2006 and Assistant Treasurer since 2012 | Vice President, ACS (February 2000 to present) |
David H. Reinmiller (1963) | Vice President since 2001 | Attorney, ACC (January 1994 to present); Associate General Counsel, ACC (January 2001 to present); Also serves as Vice President, ACIM and ACS |
Ward D. Stauffer (1960) | Secretary since 2005 | Attorney, ACC (June 2003 to present) |
The Statement of Additional Information has additional information about the fund’s directors and is available without charge, upon request, by calling 1-800-345-2021.
Approval of Management Agreement |
At a meeting held on June 14, 2012, the Fund’s Board of Directors/Trustees unanimously approved the renewal of the management agreement pursuant to which American Century Investment Management, Inc. (the “Advisor”) acts as the investment advisor for the Fund. Under Section 15(c) of the Investment Company Act, contracts for investment advisory services are required to be reviewed, evaluated, and approved by a majority of a fund’s independent directors/trustees (the “Directors”) each year.
As a part of the approval process, the Board requested and reviewed extensive data and information compiled by the Advisor and certain independent providers of evaluation data concerning the Fund and the services provided to the Fund by the Advisor. This review was in addition to the oversight and evaluation undertaken by the Board and its committees on a continuous basis throughout the year and included, but was not limited to the following:
| • | the nature, extent, and quality of investment management, shareholder services, and other services provided by the Advisor to the Fund; |
| • | the wide range of other programs and services the Advisor provides to the Fund and its shareholders on a routine and non-routine basis; |
| • | the investment performance of the fund, including data comparing the Fund’s performance to appropriate benchmarks and/or a peer group of other mutual funds with similar investment objectives and strategies; |
| • | data comparing the cost of owning the Fund to the cost of owning similar funds; |
| • | the Advisor’s compliance policies, procedures, and regulatory experience; |
| • | financial data showing the cost of services provided to the Fund, the profitability of the Fund to the Advisor, and the overall profitability of the Advisor; |
| • | data comparing services provided and charges to other investment management clients of the Advisor; and |
| • | •consideration of collateral benefits derived by the Advisor from the management of the Fund and any potential economies of scale relating thereto. |
In keeping with its practice, the Board held two in-person meetings to review and discuss the information provided. The Board also had the benefit of the advice of its independent counsel throughout the period.
Factors Considered
The Directors considered all of the information provided by the Advisor, the independent data providers, and the Board’s independent counsel, and evaluated such information for the Fund. In connection with their review, the Directors did not identify any single factor as being all-important or controlling, and each Director may have attributed different levels of importance to different factors. In deciding to renew the management agreement, the Board based its decision on a number of factors, including the following:
Nature, Extent and Quality of Services — Generally. Under the management agreement, the Advisor is responsible for providing or arranging for all services necessary for the operation of the Fund. The Board noted that under the management agreement, the Advisor provides or arranges at its own expense a wide variety of services including:
| • | constructing and designing the Fund |
| • | portfolio research and security selection |
| • | initial capitalization/funding |
| • | daily valuation of the Fund’s portfolio |
| • | shareholder servicing and transfer agency, including shareholder confirmations, recordkeeping, and communications |
| • | regulatory and portfolio compliance |
| • | marketing and distribution |
The Board noted that many of these services have expanded over time both in terms of quantity and complexity in response to shareholder demands, competition in the industry, changing distribution channels, and the changing regulatory environment.
Investment Management Services. The nature of the investment management services provided to the Fund is quite complex and allows Fund shareholders access to professional money management, instant diversification of their investments within an asset class, the opportunity to easily diversify among asset classes by investing in or exchanging among various American Century Investments funds, and liquidity. In evaluating investment performance, the Board expects the Advisor to manage the Fund in accordance with its investment objectives and approved strategies. Further, the Directors recognize that the Advisor has an obligation to seek the best execution of fund trades. In providing these services, the Advisor utilizes teams of investment professionals (portfolio managers, analysts, research assistants, and securities traders) who require extensive information technology, research, training, compliance and other systems to conduct their business. The Board, directly and through its Portfolio Committee, regularly reviews investment performance information for the Fund, together with comparative information for appropriate benchmarks and/or peer groups of similarly-managed funds, over different time horizons. The Directors also review detailed performance information during the management agreement approval
process. If performance concerns are identified, the Fund receives special reviews until performance improves, during which the Board discusses with the Advisor the reasons for such results (e.g., market conditions, security selection) and any efforts being undertaken to improve performance. The Board found the investment management services provided by the Advisor to the Fund to meet or exceed industry standards. More detailed information about the Fund’s performance can be found in the Performance and Portfolio Commentary sections of this report.
Shareholder and Other Services. Under the management agreement, the Advisor provides the Fund with a comprehensive package of transfer agency, shareholder, and other services. The Board, directly and through various committees of the Board, regularly reviews reports and evaluations of such services at its regular meetings. These reports include, but are not limited to, information regarding the operational efficiency and accuracy of the shareholder and transfer agency services provided, staffing levels, shareholder satisfaction (as measured by external as well as internal sources), technology support, new products and services offered to Fund shareholders, securities trading activities, portfolio valuation services, auditing services, and legal and operational compliance activities. Certain aspects of shareholder and transfer agency service level efficiency and the quality of securities trading activities are measured by independent third party providers and are presented in comparison to other fund groups not managed by the Advisor. The Board found the services provided by the Advisor to the Fund under the management agreement to be competitive and of high quality.
Costs of Services and Profitability. The Advisor provides detailed information concerning its cost of providing various services to the Fund, its profitability in managing the Fund, its overall profitability, and its financial condition. The Directors have reviewed with the Advisor the methodology used to prepare this financial information. The financial information regarding the Advisor is considered in evaluating the Advisor’s financial condition, ability to continue to provide services under the management agreement, and the reasonableness of the current management fee. The Board concluded that the Advisor’s profits were reasonable in light of the services provided to the Fund.
Ethics. The Board generally considers the Advisor’s commitment to providing quality services to shareholders and to conducting its business ethically. They noted that the Advisor’s practices generally meet or exceed industry best practices.
Economies of Scale. The Board also reviewed information provided by the Advisor regarding the possible existence of economies of scale in connection with the management of the Fund. The Board concluded that economies of scale are difficult to measure and predict with precision, especially on a fund-by-fund basis. The Board concluded that the Advisor is appropriately sharing economies of scale through its competitive fee structure, offering competitive fees from fund inception, and through reinvestment in its business to provide shareholders additional content and services.
Comparison to Other Funds’ Fees. The management agreement provides that the Fund pay the Advisor a single, all-inclusive (or unified) management fee for providing all services necessary for the management and operation of the Fund, other than brokerage expenses, taxes, interest, extraordinary expenses, and the fees and expenses of the Fund’s independent directors (including their independent legal counsel) and expenses incurred in connection with the provision of shareholder services and distribution services under a plan adopted pursuant to Rule 12b-1 under the 1940 Act. Under the unified fee structure, the Advisor is responsible for providing all investment advisory, custody, audit, administrative, compliance, recordkeeping, marketing and shareholder services, or arranging and supervising third parties to provide such services. By contrast, most other funds are charged a variety of fees, including an investment advisory fee, a transfer agency fee, an administrative fee, distribution charges and other expenses. Other than their investment advisory fees and any applicable Rule 12b-1 distribution fees, all other components of the total fees charged by these other funds may be increased without shareholder approval. The Board believes the unified fee structure is a benefit to Fund shareholders because it clearly discloses to shareholders the cost of owning Fund shares, and, since the unified fee cannot be increased without a vote of Fund shareholders, it shifts to the Advisor the risk of increased costs of operating the Fund and provides a direct incentive to minimize administrative inefficiencies. Part of the Board’s analysis of fee levels involves reviewing certain evaluative data compiled by an independent provider and comparing the Fund’s unified fee to the total expense ratio of other funds in the Fund’s peer group. The Board concluded that the management fee paid by the Fund to the Advisor under the management agreement is reasonable in light of the services provided to the Fund.
Comparison to Fees and Services Provided to Other Clients of the Advisor. The Board also requested and received information from the Advisor concerning the nature of the services, fees, costs and profitability of its advisory services to advisory clients other than the Fund. They observed that these varying types of client accounts require different services and involve different regulatory and entrepreneurial risks than the management of the Fund. The Board analyzed this information and concluded that the fees charged and services provided to the Fund were reasonable by comparison.
Collateral or “Fall-Out” Benefits Derived by the Advisor. The Board considered the existence of collateral benefits the Advisor may receive as a result of its relationship with the Fund. They concluded that the Advisor’s primary business is managing mutual funds and it generally does not use fund or shareholder information to generate profits in other lines of business, and therefore does not derive any significant collateral benefits from them. The Board noted that the Advisor receives proprietary research from broker-dealers that execute fund portfolio transactions and concluded that this research is likely to benefit Fund shareholders. The Board also determined that the Advisor is able to provide investment management services to certain clients other than the Fund, at least in part, due to its existing infrastructure built to serve the fund complex. The Board concluded, however, that the assets of those other clients are not material to the analysis and, where applicable, may be included with the assets of the Fund to determine breakpoints in the management fee schedule.
Existing Relationship. The Board also considered whether there was any reason for not continuing the existing arrangement with the Advisor. In this regard, the Board was mindful of the potential disruptions of the Fund’s operations and various risks, uncertainties, and other effects that could occur as a result of a decision not to continue such relationship. In particular, the Board recognized that most shareholders have invested in the Fund on the strength of the Advisor’s industry standing and reputation and in the expectation that the Advisor will have a continuing role in providing advisory services to the Fund.
Conclusion of the Directors. As a result of this process, the Board, including all of the independent directors and assisted by the advice of independent legal counsel, taking into account all of the factors discussed above and the information provided by the Advisor and others, concluded that the management agreement between the Fund and the Advisor is fair and reasonable in light of the services provided and should be renewed.
Retirement Account Information
As required by law, distributions you receive from certain IRAs, or 403(b), 457 and qualified plans are subject to federal income tax withholding, unless you elect not to have withholding apply. Tax will be withheld on the total amount withdrawn even though you may be receiving amounts that are not subject to withholding, such as nondeductible contributions. In such case, excess amounts of withholding could occur. You may adjust your withholding election so that a greater or lesser amount will be withheld.
If you don’t want us to withhold on this amount, you must notify us to not withhold the federal income tax. You may notify us in writing or in certain situations by telephone or through other electronic means. You have the right to revoke your withholding election at any time and any election you make may remain in effect until revoked by filing a new election.
Remember, even if you elect not to have income tax withheld, you are liable for paying income tax on the taxable portion of your withdrawal. If you elect not to have income tax withheld or you don’t have enough income tax withheld, you may be responsible for payment of estimated tax. You may incur penalties under the estimated tax rules if your withholding and estimated tax payments are not sufficient. You can reduce or defer the income tax on a distribution by directly or indirectly rolling such distribution over to another IRA or eligible plan. You should consult your tax advisor for additional information.
State tax will be withheld if, at the time of your distribution, your address is within one of the mandatory withholding states and you have federal income tax withheld. State taxes will be withheld from your distribution in accordance with the respective state rules.
Proxy Voting Guidelines
American Century Investment Management, Inc., the fund’s investment advisor, is responsible for exercising the voting rights associated with the securities purchased and/or held by the fund. A description of the policies and procedures the advisor uses in fulfilling this responsibility is available without charge, upon request, by calling 1-800-345-2021. It is also available on American Century Investments’ website at americancentury.com and on the Securities and Exchange Commission’s website at sec.gov. Information regarding how the investment advisor voted proxies relating to portfolio securities during the most recent 12-month period ended June 30 is available on the “About Us” page at americancentury.com. It is also available at sec.gov.
Quarterly Portfolio Disclosure
The fund files its complete schedule of portfolio holdings with the Securities and Exchange Commission (SEC) for the first and third quarters of each fiscal year on Form N-Q. The fund’s Forms N-Q are available on the SEC’s website at sec.gov, and may be reviewed and copied at the SEC’s Public Reference Room in Washington, DC. Information on the operation of the Public Reference Room may be obtained by calling 1-800-SEC-0330. The fund also makes its complete schedule of portfolio holdings for the most recent quarter of its fiscal year available on its website at americancentury.com and, upon request, by calling 1-800-345-2021.
| Contact Us | americancentury.com |
| Automated Information Line | 1-800-345-8765 |
| Investor Services Representative | 1-800-345-2021 or 816-531-5575 |
| Investors Using Advisors | 1-800-378-9878 |
| Business, Not-For-Profit, Employer-Sponsored Retirement Plans | 1-800-345-3533 |
| Banks and Trust Companies, Broker-Dealers, Financial Professionals, Insurance Companies | 1-800-345-6488 |
| Telecommunications Device for the Deaf | 1-800-634-4113 |
American Century Quantitative Equity Funds, Inc.
Investment Advisor:
American Century Investment Management, Inc.
Kansas City, Missouri
This report and the statements it contains are submitted for the general information of our shareholders. The report is not authorized for distribution to prospective investors unless preceded or accompanied by an effective prospectus.
©2012 American Century Proprietary Holdings, Inc. All rights reserved.
CL-ANN-75836 1208
ITEM 2. CODE OF ETHICS.
ITEM 3. AUDIT COMMITTEE FINANCIAL EXPERT.
ITEM 4. PRINCIPAL ACCOUNTANT FEES AND SERVICES.
The aggregate fees billed for each of the last two fiscal years for professional services rendered by the principal accountant for the audit of the registrant’s annual financial statements or services that are normally provided by the accountant in connection with statutory and regulatory filings or engagements for those fiscal years were as follows:
The aggregate fees billed in each of the last two fiscal years for assurance and related services by the principal accountant that are reasonably related to the performance of the audit of the registrant’s financial statements and are not reported under paragraph (a) of this Item were as follows:
Fees required to be approved pursuant to paragraph (c)(7)(ii) of Rule 2-01 of Regulation S-X (relating to certain engagements for non-audit services with the registrant’s investment adviser and its affiliates):
The aggregate fees billed in each of the last two fiscal years for professional services rendered by the principal accountant for tax compliance, tax advice, and tax planning were as follows:
Fees required to be approved pursuant to paragraph (c)(7)(ii) of Rule 2-01 of Regulation S-X (relating to certain engagements for non-audit services with the registrant’s investment adviser and its affiliates):
The aggregate fees billed in each of the last two fiscal years for products and services provided by the principal accountant, other than the services reported in paragraphs (a) through (c) of this Item were as follows:
Fees required to be approved pursuant to paragraph (c)(7)(ii) of Rule 2-01 of Regulation S-X (relating to certain engagements for non-audit services with the registrant’s investment adviser and its affiliates):
ITEM 5. AUDIT COMMITTEE OF LISTED REGISTRANTS.
ITEM 6. INVESTMENTS.
ITEM 7. DISCLOSURE OF PROXY VOTING POLICIES AND PROCEDURES FOR CLOSED-END MANAGEMENT INVESTMENT COMPANIES.
ITEM 8. PORTFOLIO MANAGERS OF CLOSED-END MANAGEMENT INVESTMENT COMPANIES.
ITEM 9. PURCHASES OF EQUITY SECURITIES BY CLOSED-END MANAGEMENT INVESTMENT COMPANY AND AFFILIATED PURCHASERS.
ITEM 10. SUBMISSION OF MATTERS TO A VOTE OF SECURITY HOLDERS.
During the reporting period, there were no material changes to the procedures by which shareholders may recommend nominees to the registrant’s board.
ITEM 11. CONTROLS AND PROCEDURES.
ITEM 12. EXHIBITS.
Pursuant to the requirements of the Securities Exchange Act of 1934 and the Investment Company Act of 1940, the registrant has duly caused this report to be signed on its behalf by the undersigned, thereunto duly authorized.
Pursuant to the requirements of the Securities Exchange Act of 1934 and the Investment Company Act of 1940, this report has been signed below by the following persons on behalf of the registrant and in the capacities and on the dates indicated.