UNITED STATES
SECURITIES AND EXCHANGE COMMISSION
Washington, D.C. 20549
FORM N-CSR
CERTIFIED SHAREHOLDER REPORT OF REGISTERED
MANAGEMENT INVESTMENT COMPANIES
Investment Company Act file number | 811-05447 |
| | |
| | |
| | |
AMERICAN CENTURY QUANTITATIVE EQUITY FUNDS, INC. |
(Exact name of registrant as specified in charter) |
| | |
| | |
| | |
4500 MAIN STREET, KANSAS CITY, MISSOURI | 64111 |
(Address of principal executive offices) | (Zip Code) |
| | |
| | |
| | |
CHARLES A. ETHERINGTON 4500 MAIN STREET, KANSAS CITY, MISSOURI 64111 |
(Name and address of agent for service) |
| | |
| | |
Registrant’s telephone number, including area code: | 816-531-5575 |
| | |
| | |
Date of fiscal year end: | 06-30 |
| | |
| | |
Date of reporting period: | 06-30-2013 |
ITEM 1. REPORTS TO STOCKHOLDERS.
ANNUAL REPORT | JUNE 30, 2013 |


Core Equity Plus Fund
President’s Letter | 2 |
Market Perspective | 3 |
Performance | 4 |
Portfolio Commentary | 6 |
Fund Characteristics | 8 |
Shareholder Fee Example | 9 |
Schedule of Investments | 11 |
Statement of Assets and Liabilities | 17 |
Statement of Operations | 18 |
Statement of Changes in Net Assets | 19 |
Statement of Cash Flows | 20 |
Notes to Financial Statements | 21 |
Financial Highlights | 28 |
Report of Independent Registered Public Accounting Firm | 30 |
Management | 31 |
Approval of Management Agreement | 34 |
Additional Information | 39 |
Any opinions expressed in this report reflect those of the author as of the date of the report, and do not necessarily represent the opinions of American Century Investments® or any other person in the American Century Investments organization. Any such opinions are subject to change at any time based upon market or other conditions and American Century Investments disclaims any responsibility to update such opinions. These opinions may not be relied upon as investment advice and, because investment decisions made by American Century Investments funds are based on numerous factors, may not be relied upon as an indication of trading intent on behalf of any American Century Investments fund. Security examples are used for representational purposes only and are not intended as recommendations to purchase or sell securities. Performance information for comparative indices and securities is provided to American Century Investments by third party vendors. To the best of American Century Investments’ knowledge, such information is accurate at the time of printing.

Jonathan Thomas
Dear Investor:
Thank you for reviewing this annual report for the 12 months ended June 30, 2013. It provides investment performance, market analysis, and portfolio information, presented with the expert perspective of our portfolio management team.
Annual reports remain important vehicles for conveying information about fund returns, including key factors that affected fund performance. For additional, updated investment and market insights, we encourage you to visit our website, americancentury.com.
Generally Favorable Fiscal-Year Returns for U.S. Stocks and High-Yield Bonds
The 12-month reporting period began in the summer of 2012 with uncertainties caused by slowing economies, as well as the upcoming November elections and year-end fiscal deadlines in the U.S. It ended with more uncertainty about the future of U.S. monetary stimulus. In between, aggressive monetary intervention by central banks encouraged investors to take more risk, generally boosting stocks at the expense of government bonds.
U.S. mid-cap, small-cap, and value stock indices achieved performance leadership during the period, outpacing the S&P 500 Index’s 20.60% return. U.S. stocks generally outperformed non-U.S. equities—the MSCI EAFE Index returned 18.62% and the MSCI Emerging Markets Index advanced 2.87%, affected by slowing growth in emerging market economies.
Slower emerging market growth also hindered commodity price gains and helped keep inflation under control. As a result, assets used as inflation hedges, including inflation-indexed securities and precious metals, lagged other assets. Gold, in particular, plunged, starting last October. And Treasury inflation-protected securities (TIPS) were among the lowest performers in the U.S. bond market. Bond index returns generally ranged from approximately 10% gains for U.S. corporate high-yield indices all the way down to negative returns for longer-maturity global Treasury benchmarks.
Despite signs of improvement in 2013, U.S. economic growth is subpar compared with past recession recoveries, and remains vulnerable to threats that could trigger another slowdown and market volatility. Therefore, we continue to believe in a disciplined, diversified, long-term investment approach, using professionally managed stock and bond portfolios—as appropriate—for meeting financial goals. We appreciate your continued trust in us in this volatile environment.
Sincerely,

Jonathan Thomas
President and Chief Executive Officer
American Century Investments

By Scott Wittman, Chief Investment Officer, Asset Allocation and
Quantitative Equity
Central Bank Actions, Relative U.S. Economic Gains Drove Stocks Higher
Stock market performance remained robust during the 12-month period ended June 30, 2013. Despite persistent concerns about weak global growth and Europe’s ongoing financial crisis, investors largely focused on central bank stimulus measures and marginally-improving U.S. economic data, which fueled market optimism.
Early in the period, in response to disappointing U.S. economic data, the U.S. Federal Reserve (the Fed) launched its third—and most aggressive—quantitative easing (QE) program, or monthly purchases of $40 billion in government agency mortgage-backed securities. Later in 2012, the Fed expanded the program to include $45 billion in Treasury purchases, bringing its total bond buying to $85 billion per month. This unprecedented program, combined with relatively healthy corporate earnings, significant housing market gains and modest improvements in the labor market, helped keep stocks and other riskier assets
in favor.
The Fed rattled the financial markets late in the reporting period, with comments about “tapering” its quantitative easing program. Fed Chairman Ben Bernanke said the central bank could begin scaling back its bond buying later in 2013 if the economy continues to improve. After reaching record highs in May, stocks stumbled in June, following Bernanke’s comments. Late in the month, the Fed toned down its tapering talk, and stocks recovered some of their June losses. Overall, most U.S. stock benchmarks generated stellar 12-month returns, largely aided by strong double-digit gains posted during the first calendar quarter of 2013.
Value Stocks Outpaced Growth Stocks
Across the capitalization spectrum, value stocks were the performance leaders for the 12-month period. Much of this was due to strong one-year returns from the financials and health care sectors, where many value-oriented stocks reside. In particular, expectations for rising interest rates—and the late-quarter rate increase triggered by Fed tapering talk—helped boost returns within the financial sector’s banking industry. At the opposite end, the rate-sensitive utilities sector was the weakest relative performer, held back by the prospect of rising interest rates.
U.S. Stock Index Returns |
For the 12 months ended June 30, 2013 |
Russell 1000 Index (Large-Cap) | 21.24% | | Russell 2000 Index (Small-Cap) | 24.21% |
Russell 1000 Growth Index | 17.07% | | Russell 2000 Growth Index | 23.67% |
Russell 1000 Value Index | 25.32% | | Russell 2000 Value Index | 24.77% |
Russell Midcap Index | 25.41% | | | |
Russell Midcap Growth Index | 22.88% | | | |
Russell Midcap Value Index | 27.65% | | | |
Total Returns as of June 30, 2013 |
| | | | Average
Annual Returns | |
| | Ticker Symbol | 1 year | Since Inception | Inception Date |
Investor Class | ACPVX | 22.33% | 18.17% | 10/31/11 |
S&P 500 Index | — | 20.60% | 18.72% | — |
Institutional Class | ACPKX | 22.45% | 18.39% | 10/31/11 |
A Class No sales charge* With sales charge* | ACPQX | 22.01% 14.97% | 17.88% 13.77% | 10/31/11 |
C Class | ACPHX | 20.99% | 16.96% | 10/31/11 |
R Class | ACPWX | 21.70% | 17.57% | 10/31/11 |
* Sales charges include initial sales charges and contingent deferred sales charges (CDSCs), as applicable. A Class shares have a 5.75% maximum initial sales charge and may be subject to a maximum CDSC of 1.00%. C Class shares redeemed within 12 months of purchase are subject to a maximum CDSC of 1.00%. The SEC requires that mutual funds provide performance information net of maximum sales charges in all cases where charges could be applied.
Data presented reflect past performance. Past performance is no guarantee of future results. Current performance may be higher or lower than the performance shown. Investment return and principal value will fluctuate, and redemption value may be more or less than original cost. To obtain performance data current to the most recent month end, please call 1-800-345-2021 or visit americancentury.com. The fund’s investment process may result in high portfolio turnover, which could mean high transaction costs, affecting both performance and capital gains tax liabilities to investors. In addition, its investment approach may involve higher price volatility, short sales risk, leverage risk and overweighting risk.
Unless otherwise indicated, performance reflects Investor Class shares; performance for other share classes will vary due to differences in fee structure. For information about other share classes available, please consult the prospectus. Data assumes reinvestment of dividends and capital gains, and none of the charts reflect the deduction of taxes that a shareholder would pay on fund distributions or the redemption of fund shares. Returns for the index are provided for comparison. The fund’s total returns include operating expenses (such as transaction costs and management fees) that reduce returns, while the total returns of the index do not.
Growth of $10,000 Over Life of Class |
$10,000 investment made October 31, 2011 |
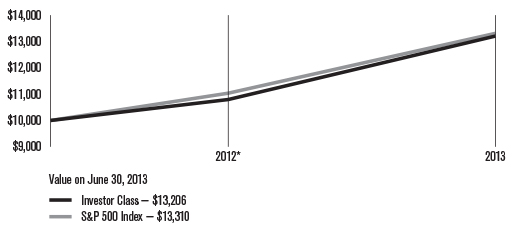
*From 10/31/11, the Investor Class’s inception date. Not annualized.
Total Annual Fund Operating Expenses |
Investor Class | Institutional Class | A Class | C Class | R Class |
2.06% | 1.86% | 2.31% | 3.06% | 2.56% |
The total annual fund operating expenses shown is as stated in the fund’s prospectus current as of the date of this report. The prospectus may vary from the expense ratio shown elsewhere in this report because it is based on a different time period, includes acquired fund fees and expenses, and, if applicable, does not include fee waivers or expense reimbursements.
Data presented reflect past performance. Past performance is no guarantee of future results. Current performance may be higher or lower than the performance shown. Investment return and principal value will fluctuate, and redemption value may be more or less than original cost. To obtain performance data current to the most recent month end, please call 1-800-345-2021 or visit americancentury.com. The fund’s investment process may result in high portfolio turnover, which could mean high transaction costs, affecting both performance and capital gains tax liabilities to investors. In addition, its investment approach may involve higher price volatility, short sales risk, leverage risk and overweighting risk.
Unless otherwise indicated, performance reflects Investor Class shares; performance for other share classes will vary due to differences in fee structure. For information about other share classes available, please consult the prospectus. Data assumes reinvestment of dividends and capital gains, and none of the charts reflect the deduction of taxes that a shareholder would pay on fund distributions or the redemption of fund shares. Returns for the index are provided for comparison. The fund’s total returns include operating expenses (such as transaction costs and management fees) that reduce returns, while the total returns of the index do not.
Portfolio Managers: Scott Wittman, Bill Martin, and Claudia Musat
Performance Summary
Core Equity Plus returned 22.33%* for the fiscal year ended June 30, 2013, compared with the 20.60% return of its benchmark, the S&P 500 Index.
In a year of strength for U.S. equity markets (see page 3 for details), Core Equity Plus posted a solid gain for the 12-month period, outperforming the S&P 500 Index. The fund is managed to have a 100% net exposure to the equity market by investing approximately 130% of its net assets in long positions, while 30% of its net assets are sold short. The proceeds from the securities sold short are used to fund the purchase of the additional 30% of long positions. The portfolio’s stock selection process incorporates factors of growth, value, quality, and momentum, and is designed to minimize unintended risks along industries and other risk characteristics. Quality and value signals were aligned with outperforming names in the fund, while momentum insights, particularly with longer horizon signals, detracted from returns during the year.
Absolute Performance Driven by Health Care and Financials
The fund’s strong absolute returns were driven primarily by holdings in the health care and financials sectors. In health care, where pharmaceuticals were particularly helpful, drug maker Pfizer and consumer health manufacturer Johnson & Johnson contributed the most with gains of 26% and 31%, respectively. In financials, the biggest boost came from financial services giant JPMorgan Chase, whose shares rose more than 50% for the year. Among individual securities, positions in several mega-cap technology companies, including Google and Cisco Systems, as well as home improvement retailer Home Depot also boosted absolute returns.
No sector declined on an absolute basis during the year, but a number of short positions—which are designed to profit when a stock’s price declines—weighed on results during a period when many stocks saw significant appreciation.
Materials and Health Care Outperformed
The materials and health care sectors were the best contributors to the fund’s returns relative to the S&P 500. Materials sector outperformance was driven by stock picks in both the metals and mining and chemicals industries. Short positions in a number of mining companies were particularly successful during a period when precious metals prices weakened. A top performer here was gold and silver producer Allied Nevada Gold, whose stock price declined over 80% during the year. An out-of-benchmark position in integrated chemicals and building products manufacturer Axiall (formerly Georgia Gulf) was also beneficial. Axiall’s stock rose nearly 40% thanks to strong demand from an improving housing sector.
In health care, the biggest industry-level contributions came from holdings in health care equipment and supplies and pharmaceuticals. Medical device manufacturer Boston Scientific, where the fund had more exposure than the index, was especially beneficial. Our research shows strong rankings across growth and quality, and we maintain our overweight. Likewise, biopharmaceutical holding Bristol-Myers Squibb enhanced performance after the company posted healthy gains on consistent earnings growth and sector momentum.
*All fund returns referenced in this commentary are for Investor Class shares.
Other holdings that added value included electronic game retailer GameStop, oil refiner Marathon Petroleum, and mobile hydraulic manufacturer Sauer-Danfoss. GameStop, whose stock climbed 140% during the year, appreciated on improved revenue outlook as investor concerns regarding new console compatibility with prior generations’ games were allayed.
Technology and Consumer Discretionary Detracted from Results
The fund’s holdings in the information technology and consumer discretionary sectors had a negative impact on performance during the year. The most significant detractor in the technology sector, as well as the fund, was a short position in solar industry semiconductor producer SunEdison (formerly MEMC Electronic Materials). Despite high valuations and negative net margins, the company’s stock appreciated on hopes of increased traction of solar energy usage. However, our research confirms that the company looks expensive, and we maintain the fund’s short position. Similarly, a short position in broadband service provider ViaSat hurt results after investors overlooked negative earnings and below-estimate revenue guidance, sending shares soaring 90% during the year. An overweight to semiconductor manufacturer Advanced Micro Devices was also detrimental.
The consumer discretionary sector also proved difficult for relative performance, especially in the diversified consumer services industry. Top detractors in the sector included Bridgepoint Education, whose shares tumbled along with other for-profit education companies. A position in Outerwall Inc. (formerly Coinstar, Inc.) also impacted results after the company issued a weaker-than-expected outlook early in the fiscal year. Our research suggests strong value and quality indicators, and we maintain exposure to the company.
Elsewhere in the portfolio, short positions in several industrials sector holdings also detracted meaningfully. Infrastructure construction company MasTec and industrial manufacturer Colfax both saw significant stock price appreciation on steady revenue growth.
A Look Ahead
As we move into the second half of 2013, the U.S. economic recovery seems to be progressing, albeit with headwinds. Improvements in housing, employment, and economic indicators have been consistent and point to slow but positive growth. Volatility is likely to remain elevated as ongoing concerns over interest rates, Federal Reserve action, and a potential slowdown in China dominate headlines. Heightened levels of volatility often provide investment opportunities in both the long and short portions of the portfolio. Our disciplined, objective, and systematic investment strategy is designed to take advantage of these opportunities at the individual company level. We believe this approach is the most powerful way to capitalize on market inefficiencies that lead to the mispricing of individual stocks.
JUNE 30, 2013 | |
Top Ten Long Holdings | | % of net assets |
Exxon Mobil Corp. | | | 3.49 | % |
Apple, Inc. | | | 2.88 | % |
Microsoft Corp. | | | 2.59 | % |
Johnson & Johnson | | | 2.40 | % |
Pfizer, Inc. | | | 2.13 | % |
AT&T, Inc. | | | 2.05 | % |
Google, Inc., Class A | | | 1.85 | % |
Cisco Systems, Inc. | | | 1.74 | % |
Merck & Co., Inc. | | | 1.71 | % |
Home Depot, Inc. (The) | | | 1.57 | % |
| | | | | |
Top Five Short Holdings | | % of net assets |
DreamWorks Animation SKG, Inc., Class A | | | (0.95 | )% |
NCR Corp. | | | (0.88 | )% |
SunEdison, Inc. | | | (0.86 | )% |
Hexcel Corp. | | | (0.81 | )% |
Air Lease Corp. | | | (0.80 | )% |
| | | | | |
Types of Investments in Portfolio | | % of net assets |
Common Stocks | | | 128.1 | % |
Common Stocks Sold Short | | | (29.3 | )% |
Temporary Cash Investments | | | 1.1 | % |
Other Assets and Liabilities | | | 0.1 | % |
Fund shareholders may incur two types of costs: (1) transaction costs, including sales charges (loads) on purchase payments and redemption/exchange fees; and (2) ongoing costs, including management fees; distribution and service (12b-1) fees; and other fund expenses. This example is intended to help you understand your ongoing costs (in dollars) of investing in your fund and to compare these costs with the ongoing cost of investing in other mutual funds.
The example is based on an investment of $1,000 made at the beginning of the period and held for the entire period from January 1, 2013 to June 30, 2013.
Actual Expenses
The table provides information about actual account values and actual expenses for each class. You may use the information, together with the amount you invested, to estimate the expenses that you paid over the period. First, identify the share class you own. Then simply divide your account value by $1,000 (for example, an $8,600 account value divided by $1,000 = 8.6), then multiply the result by the number under the heading “Expenses Paid During Period” to estimate the expenses you paid on your account during this period.
If you hold Investor Class shares of any American Century Investments fund, or Institutional Class shares of the American Century Diversified Bond Fund, in an American Century Investments account (i.e., not a financial intermediary or retirement plan account), American Century Investments may charge you a $12.50 semiannual account maintenance fee if the value of those shares is less than $10,000. We will redeem shares automatically in one of your accounts to pay the $12.50 fee. In determining your total eligible investment amount, we will include your investments in all personal accounts (including American Century Investments Brokerage accounts) registered under your Social Security number. Personal accounts include individual accounts, joint accounts, UGMA/UTMA accounts, personal trusts, Coverdell Education Savings Accounts and IRAs (including traditional, Roth, Rollover, SEP-, SARSEP- and SIMPLE-IRAs), and certain other retirement accounts. If you have only business, business retirement, employer-sponsored or American Century Investments Brokerage accounts, you are currently not subject to this fee. If you are subject to the Account Maintenance Fee, your account value could be reduced by the fee amount.
Hypothetical Example for Comparison Purposes
The table also provides information about hypothetical account values and hypothetical expenses based on the actual expense ratio of each class of your fund and an assumed rate of return of 5% per year before expenses, which is not the actual return of a fund’s share class. The hypothetical account values and expenses may not be used to estimate the actual ending account balance or expenses you paid for the period. You may use this information to compare the ongoing costs of investing in your fund and other funds. To do so, compare this 5% hypothetical example with the 5% hypothetical examples that appear in the shareholder reports of the other funds.
Please note that the expenses shown in the table are meant to highlight your ongoing costs only and do not reflect any transactional costs, such as sales charges (loads) or redemption/exchange fees. Therefore, the table is useful in comparing ongoing costs only, and will not help you determine the relative total costs of owning different funds. In addition, if these transactional costs were included, your costs would have been higher.
| | Beginning
Account Value 1/1/13 | Ending
Account Value 6/30/13 | Expenses Paid During Period(1) 1/1/13 – 6/30/13 | Annualized
Expense Ratio(1) |
Actual |
Investor Class | $1,000 | $1,144.00 | $9.46 | 1.78% |
Institutional Class | $1,000 | $1,145.00 | $8.40 | 1.58% |
A Class | $1,000 | $1,142.70 | $10.78 | 2.03% |
C Class | $1,000 | $1,138.00 | $14.74 | 2.78% |
R Class | $1,000 | $1,141.50 | $12.11 | 2.28% |
Hypothetical |
Investor Class | $1,000 | $1,015.97 | $8.90 | 1.78% |
Institutional Class | $1,000 | $1,016.96 | $7.90 | 1.58% |
A Class | $1,000 | $1,014.73 | $10.14 | 2.03% |
C Class | $1,000 | $1,011.01 | $13.86 | 2.78% |
R Class | $1,000 | $1,013.49 | $11.38 | 2.28% |
(1) | Expenses are equal to the class’s annualized expense ratio listed in the table above, multiplied by the average account value over the period, multiplied by 181, the number of days in the most recent fiscal half-year, divided by 365, to reflect the one-half year period. |
JUNE 30, 2013
| | | | | | |
| | | Shares | | | Value | |
Common Stocks — 128.1% | |
AEROSPACE AND DEFENSE — 6.3% | |
Alliant Techsystems, Inc. | | 6,479 | | | $ 533,416 | |
Boeing Co. (The)(1) | | 16,386 | | | 1,678,582 | |
Esterline Technologies Corp.(2) | | 6,758 | | | 488,536 | |
General Dynamics Corp.(1) | | 13,254 | | | 1,038,186 | |
Honeywell International, Inc.(1) | | 14,914 | | | 1,183,276 | |
L-3 Communications Holdings, Inc. | | 1,252 | | | 107,346 | |
Northrop Grumman Corp.(1) | | 14,441 | | | 1,195,715 | |
Raytheon Co. | | 8,483 | | | 560,896 | |
Textron, Inc.(1) | | 30,458 | | | 793,431 | |
| | | | | | 7,579,384 | |
AUTO COMPONENTS — 0.2% | |
BorgWarner, Inc.(2) | | 3,048 | | | 262,585 | |
BEVERAGES — 0.4% | |
Coca-Cola Co. (The)(1) | | 8,752 | | | 351,043 | |
PepsiCo, Inc.(1) | | 852 | | | 69,685 | |
| | | | | | 420,728 | |
BIOTECHNOLOGY — 2.4% | |
Amgen, Inc.(1) | | 8,939 | | | 881,922 | |
Biogen Idec, Inc.(1)(2) | | 921 | | | 198,199 | |
Celgene Corp.(1)(2) | | 5,951 | | | 695,731 | |
Cubist Pharmaceuticals, Inc.(2) | | 5,738 | | | 277,145 | |
Gilead Sciences, Inc.(1)(2) | | 9,655 | | | 494,433 | |
United Therapeutics Corp.(1)(2) | | 4,355 | | | 286,646 | |
| | | | | | 2,834,076 | |
CAPITAL MARKETS — 3.9% | |
Evercore Partners, Inc., Class A | | 12,380 | | | 486,286 | |
Federated Investors, Inc., Class B(1) | | 37,602 | | | 1,030,671 | |
Goldman Sachs Group, Inc. (The) | | 9,642 | | | 1,458,353 | |
Investment Technology Group, Inc.(1)(2) | | 28,968 | | | 404,973 | |
Janus Capital Group, Inc.(1) | | 36,767 | | | 312,887 | |
SEI Investments Co.(1) | | 22,576 | | | 641,836 | |
T. Rowe Price Group, Inc. | | 916 | | | 67,005 | |
Waddell & Reed Financial, Inc., Class A | | 6,960 | | | 302,760 | |
| | | | | | 4,704,771 | |
CHEMICALS — 4.6% | |
CF Industries Holdings, Inc.(1) | | 4,053 | | | 695,089 | |
LyondellBasell Industries NV, Class A(1) | | 16,796 | | | 1,112,903 | |
Monsanto Co.(1) | | 13,128 | | | 1,297,046 | |
NewMarket Corp. | | 2,651 | | | 696,047 | |
PPG Industries, Inc. | | 7,561 | | | 1,107,006 | |
Sherwin-Williams Co. (The) | | 988 | | | 174,481 | |
Valspar Corp. (The)(1) | | 6,959 | | | 450,039 | |
| | | | | | 5,532,611 | |
COMMERCIAL BANKS — 0.8% | |
Hancock Holding Co. | | 2,545 | | | 76,528 | |
Wells Fargo & Co.(1) | | 20,359 | | | 840,216 | |
| | | | | | 916,744 | |
COMMERCIAL SERVICES AND SUPPLIES — 1.7% | |
Deluxe Corp. | | 17,495 | | | 606,202 | |
Mine Safety Appliances Co.(1) | | 15,211 | | | 708,072 | |
RR Donnelley & Sons Co.(1) | | 48,188 | | | 675,114 | |
| | | | | | 1,989,388 | |
COMMUNICATIONS EQUIPMENT — 3.9% | |
ARRIS Group, Inc.(2) | | 32,308 | | | 463,620 | |
Brocade Communications Systems, Inc.(1)(2) | | 119,948 | | | 690,900 | |
Cisco Systems, Inc.(1) | | 85,729 | | | 2,084,072 | |
InterDigital, Inc. | | 1,601 | | | 71,485 | |
QUALCOMM, Inc.(1) | | 11,471 | | | 700,649 | |
Research In Motion Ltd.(1)(2) | | 62,841 | | | 657,945 | |
| | | | | | 4,668,671 | |
COMPUTERS AND PERIPHERALS — 4.9% | |
Apple, Inc.(1) | | 8,710 | | | 3,449,857 | |
EMC Corp.(1) | | 54,839 | | | 1,295,297 | |
Hewlett-Packard Co. | | 34,784 | | | 862,643 | |
Seagate Technology plc(1) | | 2,569 | | | 115,168 | |
Western Digital Corp. | | 3,232 | | | 200,675 | |
| | | | | | 5,923,640 | |
CONSTRUCTION AND ENGINEERING — 0.5% | |
AECOM Technology Corp.(2) | | 19,963 | | | 634,624 | |
CONSUMER FINANCE — 0.8% | |
Cash America International, Inc.(1) | | 17,728 | | | 805,915 | |
Credit Acceptance Corp.(2) | | 1,491 | | | 156,629 | |
| | | | | | 962,544 | |
CONTAINERS AND PACKAGING — 2.3% | |
Greif, Inc., Class A(1) | | 14,899 | | | 784,730 | |
Owens-Illinois, Inc.(1)(2) | | 36,794 | | | 1,022,505 | |
Packaging Corp. of America | | 18,314 | | | 896,654 | |
| | | | | | 2,703,889 | |
DIVERSIFIED CONSUMER SERVICES — 0.7% | |
Coinstar, Inc.(1)(2) | | 14,195 | | | 832,821 | |
DIVERSIFIED FINANCIAL SERVICES — 2.7% | |
Bank of America Corp.(1) | | 16,587 | | | $ 213,309 | |
Citigroup, Inc.(1) | | 4,098 | | | 196,581 | |
JPMorgan Chase & Co.(1) | | 29,722 | | | 1,569,024 | |
Moody’s Corp. | | 7,149 | | | 435,589 | |
MSCI, Inc., Class A(1)(2) | | 26,167 | | | 870,576 | |
| | | | | | 3,285,079 | |
DIVERSIFIED TELECOMMUNICATION SERVICES — 4.1% | |
AT&T, Inc.(1) | | 69,346 | | | 2,454,848 | |
CenturyLink, Inc.(1) | | 30,328 | | | 1,072,095 | |
Verizon Communications, Inc.(1) | | 25,780 | | | 1,297,765 | |
Vonage Holdings Corp.(1)(2) | | 50,982 | | | 144,279 | |
| | | | | | 4,968,987 | |
ELECTRIC UTILITIES — 1.6% | |
Edison International(1) | | 21,814 | | | 1,050,562 | |
Portland General Electric Co.(1) | | 28,417 | | | 869,276 | |
| | | | | | 1,919,838 | |
ELECTRICAL EQUIPMENT — 2.8% | |
Brady Corp., Class A(1) | | 8,556 | | | 262,926 | |
Emerson Electric Co.(1) | | 21,673 | | | 1,182,045 | |
EnerSys(1) | | 19,571 | | | 959,762 | |
Rockwell Automation, Inc. | | 11,485 | | | 954,863 | |
| | | | | | 3,359,596 | |
ELECTRONIC EQUIPMENT, INSTRUMENTS AND COMPONENTS — 1.1% | |
Itron, Inc.(1)(2) | | 16,287 | | | 691,058 | |
TE Connectivity Ltd. | | 12,982 | | | 591,200 | |
| | | | | | 1,282,258 | |
ENERGY EQUIPMENT AND SERVICES — 1.4% | |
Ensco plc, Class A | | 1,155 | | | 67,128 | |
Nabors Industries Ltd.(1) | | 42,328 | | | 648,042 | |
RPC, Inc.(1) | | 68,633 | | | 947,822 | |
| | | | | | 1,662,992 | |
FOOD AND STAPLES RETAILING — 3.0% | |
CVS Caremark Corp.(1) | | 25,948 | | | 1,483,707 | |
Rite Aid Corp.(1)(2) | | 310,133 | | | 886,980 | |
Safeway, Inc. | | 40,844 | | | 966,369 | |
Wal-Mart Stores, Inc.(1) | | 4,140 | | | 308,389 | |
| | | | | | 3,645,445 | |
FOOD PRODUCTS — 2.3% | |
Archer-Daniels-Midland Co. | | 32,450 | | | 1,100,379 | |
General Mills, Inc. | | 11,556 | | | 560,813 | |
Hershey Co. (The) | | 3,461 | | | 308,998 | |
Ingredion, Inc. | | 6,929 | | | 454,681 | |
Pilgrim’s Pride Corp.(1)(2) | | 18,696 | | | 279,318 | |
| | | | | | 2,704,189 | |
GAS UTILITIES — 0.4% | |
UGI Corp. | | 11,469 | | | 448,553 | |
HEALTH CARE EQUIPMENT AND SUPPLIES — 5.0% | |
Abbott Laboratories(1) | | 37,768 | | | 1,317,348 | |
Becton Dickinson and Co. | | 7,329 | | | 724,325 | |
Boston Scientific Corp.(1)(2) | | 107,316 | | | 994,819 | |
Medtronic, Inc.(1) | | 26,855 | | | 1,382,227 | |
St. Jude Medical, Inc.(1) | | 23,155 | | | 1,056,563 | |
Stryker Corp.(1) | | 7,211 | | | 466,407 | |
| | | | | | 5,941,689 | |
HEALTH CARE PROVIDERS AND SERVICES — 1.0% | |
AmerisourceBergen Corp. | | 11,322 | | | 632,107 | |
Select Medical Holdings Corp.(1) | | 63,993 | | | 524,743 | |
| | | | | | 1,156,850 | |
HOTELS, RESTAURANTS AND LEISURE — 2.2% | |
Bally Technologies, Inc.(1)(2) | | 16,810 | | | 948,420 | |
Cracker Barrel Old Country Store, Inc. | | 8,264 | | | 782,270 | |
International Game Technology(1) | | 55,431 | | | 926,252 | |
| | | | | | 2,656,942 | |
HOUSEHOLD DURABLES — 1.4% | |
Garmin Ltd.(1) | | 20,340 | | | 735,494 | |
Newell Rubbermaid, Inc.(1) | | 37,158 | | | 975,398 | |
| | | | | | 1,710,892 | |
HOUSEHOLD PRODUCTS — 2.4% | |
Energizer Holdings, Inc. | | 9,461 | | | 950,925 | |
Kimberly-Clark Corp. | | 12,221 | | | 1,187,148 | |
Procter & Gamble Co. (The)(1) | | 8,993 | | | 692,371 | |
| | | | | | 2,830,444 | |
INDEPENDENT POWER PRODUCERS AND ENERGY TRADERS — 0.5% | |
AES Corp. (The)(1) | | 51,129 | | | 613,037 | |
INDUSTRIAL CONGLOMERATES — 2.0% | |
3M Co. | | 2,449 | | | 267,798 | |
Danaher Corp.(1) | | 19,225 | | | 1,216,943 | |
General Electric Co.(1) | | 40,621 | | | 942,001 | |
| | | | | | 2,426,742 | |
INSURANCE — 7.4% | |
Aflac, Inc.(1) | | 21,022 | | | 1,221,799 | |
American International Group, Inc.(1)(2) | | 32,241 | | | 1,441,173 | |
Amtrust Financial Services, Inc. | | 11,749 | | | 419,439 | |
Axis Capital Holdings Ltd.(1) | | 20,452 | | | 936,293 | |
Berkshire Hathaway, Inc., Class B(1)(2) | | 7,122 | | | 797,094 | |
First American Financial Corp. | | 29,170 | | | 642,907 | |
HCC Insurance Holdings, Inc.(1) | | 13,738 | | | 592,245 | |
MetLife, Inc.(1) | | 21,457 | | | $ 981,872 | |
Prudential Financial, Inc.(1) | | 3,850 | | | 281,165 | |
Reinsurance Group of America, Inc. | | 2,512 | | | 173,604 | |
RenaissanceRe Holdings Ltd. | | 919 | | | 79,760 | |
Torchmark Corp. | | 6,923 | | | 450,964 | |
Travelers Cos., Inc. (The) | | 6,416 | | | 512,767 | |
XL Group plc | | 11,797 | | | 357,685 | |
| | | | | | 8,888,767 | |
INTERNET AND CATALOG RETAIL — 1.1% | |
Expedia, Inc.(1) | | 16,463 | | | 990,249 | |
HomeAway, Inc.(2) | | 11,937 | | | 386,043 | |
| | | | | | 1,376,292 | |
INTERNET SOFTWARE AND SERVICES — 2.0% | |
Dice Holdings, Inc.(1)(2) | | 7,510 | | | 69,167 | |
Google, Inc., Class A(1)(2) | | 2,527 | | | 2,224,695 | |
United Online, Inc.(1) | | 13,795 | | | 104,566 | |
| | | | | | 2,398,428 | |
IT SERVICES — 1.9% | |
Accenture plc, Class A(1) | | 1,668 | | | 120,029 | |
CoreLogic, Inc.(2) | | 8,097 | | | 187,608 | |
International Business Machines Corp.(1) | | 6,983 | | | 1,334,521 | |
SAIC, Inc.(1) | | 25,909 | | | 360,912 | |
Unisys Corp.(1)(2) | | 9,918 | | | 218,890 | |
| | | | | | 2,221,960 | |
LEISURE EQUIPMENT AND PRODUCTS — 2.2% | |
Hasbro, Inc.(1) | | 20,936 | | | 938,561 | |
Mattel, Inc.(1) | | 22,927 | | | 1,038,822 | |
Polaris Industries, Inc. | | 7,000 | | | 665,000 | |
| | | | | | 2,642,383 | |
LIFE SCIENCES TOOLS AND SERVICES — 1.5% | |
Agilent Technologies, Inc.(1) | | 17,574 | | | 751,464 | |
Thermo Fisher Scientific, Inc.(1) | | 12,609 | | | 1,067,100 | |
| | | | | | 1,818,564 | |
MACHINERY — 2.8% | |
Actuant Corp., Class A(1) | | 22,498 | | | 741,759 | |
Crane Co.(1) | | 16,764 | | | 1,004,499 | |
Dover Corp. | | 5,472 | | | 424,956 | |
Ingersoll-Rand plc(1) | | 4,436 | | | 246,287 | |
WABCO Holdings, Inc.(2) | | 11,921 | | | 890,379 | |
| | | | | | 3,307,880 | |
MEDIA — 4.2% | |
Comcast Corp., Class A(1) | | 42,589 | | | 1,783,627 | |
DIRECTV(2) | | 1,126 | | | 69,384 | |
Gannett Co., Inc. | | 26,441 | | | 646,747 | |
Lions Gate Entertainment Corp.(2) | | 6,177 | | | 169,682 | |
Regal Entertainment Group, Class A | | 6,798 | | | 121,684 | |
Scholastic Corp.(1) | | 16,339 | | | 478,569 | |
Time Warner Cable, Inc.(1) | | 10,293 | | | 1,157,757 | |
Time Warner, Inc. | | 10,252 | | | 592,771 | |
| | | | | | 5,020,221 | |
METALS AND MINING — 1.1% | |
Coeur Mining, Inc.(1)(2) | | 30,545 | | | 406,249 | |
Reliance Steel & Aluminum Co. | | 5,093 | | | 333,897 | |
Worthington Industries, Inc.(1) | | 19,419 | | | 615,776 | |
| | | | | | 1,355,922 | |
MULTILINE RETAIL — 0.6% | |
Dillard’s, Inc., Class A(1) | | 7,833 | | | 642,071 | |
Macy’s, Inc.(1) | | 1,972 | | | 94,656 | |
| | | | | | 736,727 | |
OIL, GAS AND CONSUMABLE FUELS — 8.4% | |
Chevron Corp.(1) | | 8,491 | | | 1,004,825 | |
ConocoPhillips(1) | | 20,700 | | | 1,252,350 | |
Delek US Holdings, Inc. | | 3,936 | | | 113,278 | |
Exxon Mobil Corp.(1) | | 46,298 | | | 4,183,024 | |
Marathon Petroleum Corp.(1) | | 14,300 | | | 1,016,158 | |
Suncor Energy, Inc.(1) | | 5,966 | | | 175,937 | |
Tesoro Corp.(1) | | 15,107 | | | 790,398 | |
Valero Energy Corp.(1) | | 23,702 | | | 824,119 | |
Western Refining, Inc.(1) | | 26,335 | | | 739,224 | |
| | | | | | 10,099,313 | |
PHARMACEUTICALS — 8.5% | |
AbbVie, Inc. | | 12,907 | | | 533,575 | |
Allergan, Inc. | | 2,036 | | | 171,513 | |
Bristol-Myers Squibb Co.(1) | | 19,777 | | | 883,834 | |
Eli Lilly & Co.(1) | | 22,980 | | | 1,128,778 | |
Johnson & Johnson(1) | | 33,473 | | | 2,873,992 | |
Merck & Co., Inc.(1) | | 44,052 | | | 2,046,215 | |
Pfizer, Inc.(1) | | 91,063 | | | 2,550,675 | |
| | | | | | 10,188,582 | |
PROFESSIONAL SERVICES — 0.5% | |
Dun & Bradstreet Corp. | | 6,531 | | | 636,446 | |
SEMICONDUCTORS AND SEMICONDUCTOR EQUIPMENT — 3.3% | |
Applied Materials, Inc.(1) | | 62,323 | | | 929,236 | |
Broadcom Corp., Class A(1) | | 28,679 | | | 968,203 | |
First Solar, Inc.(2) | | 8,175 | | | 365,668 | |
Intel Corp.(1) | | 3,064 | | | 74,210 | |
KLA-Tencor Corp.(1) | | 11,598 | | | 646,356 | |
LSI Corp.(1)(2) | | 70,559 | | | 503,791 | |
NVIDIA Corp.(1) | | 32,429 | | | 454,979 | |
| | | | | | 3,942,443 | |
SOFTWARE — 6.2% | |
Activision Blizzard, Inc.(1) | | 51,562 | | | $ 735,274 | |
CA, Inc. | | 2,574 | | | 73,694 | |
Cadence Design Systems, Inc.(1)(2) | | 4,875 | | | 70,590 | |
Intuit, Inc. | | 1,037 | | | 63,288 | |
Mentor Graphics Corp.(1) | | 38,347 | | | 749,684 | |
Microsoft Corp.(1) | | 90,115 | | | 3,111,671 | |
Oracle Corp.(1) | | 56,375 | | | 1,731,840 | |
Symantec Corp.(1) | | 39,983 | | | 898,418 | |
| | | | | | 7,434,459 | |
SPECIALTY RETAIL — 5.4% | |
Abercrombie & Fitch Co., Class A | | 5,576 | | | 252,314 | |
American Eagle Outfitters, Inc. | | 9,516 | | | 173,762 | |
Buckle, Inc. (The)(1) | | 14,052 | | | 730,985 | |
Foot Locker, Inc.(1) | | 8,440 | | | 296,497 | |
GameStop Corp., Class A(1) | | 26,158 | | | 1,099,421 | |
Gap, Inc. (The)(1) | | 26,237 | | | 1,094,870 | |
Home Depot, Inc. (The)(1) | | 24,282 | | | 1,881,127 | |
PetSmart, Inc.(1) | | 14,603 | | | 978,255 | |
| | | | | | 6,507,231 | |
TEXTILES, APPAREL AND LUXURY GOODS — 1.1% | |
Hanesbrands, Inc.(1) | | 19,542 | | | 1,004,850 | |
Iconix Brand Group, Inc.(1)(2) | | 11,359 | | | 334,068 | |
| | | | | | 1,338,918 | |
THRIFTS AND MORTGAGE FINANCE — 0.7% | |
Ocwen Financial Corp.(1)(2) | | 19,808 | | | 816,486 | |
TOBACCO — 1.5% | |
Altria Group, Inc. | | 16,757 | | | 586,327 | |
Philip Morris International, Inc.(1) | | 3,751 | | | 324,912 | |
Universal Corp.(1) | | 15,443 | | | 893,378 | |
| | | | | | 1,804,617 | |
TRADING COMPANIES AND DISTRIBUTORS — 0.4% | |
MRC Global, Inc.(2) | | 19,369 | | | 534,972 | |
TOTAL COMMON STOCKS (Cost $130,818,362) | | | 153,650,620 | |
Temporary Cash Investments — 1.1% | |
Repurchase Agreement, Bank of America Merrill Lynch, (collateralized by various U.S. Treasury obligations, 1.00%, 1/15/14, valued at $176,890), in a joint trading account at 0.06%, dated 6/28/13, due 7/1/13 (Delivery value $173,273) | | | 173,272 | |
Repurchase Agreement, Credit Suisse First Boston, Inc., (collateralized by various U.S. Treasury obligations, 4.25%, 11/15/40, valued at $529,638), in a joint trading account at 0.05%, dated 6/28/13,
due 7/1/13 (Delivery value $519,817) | | | 519,815 | |
Repurchase Agreement, Goldman Sachs & Co., (collateralized by various U.S. Treasury obligations, 3.125%, 11/15/41, valued at $176,241), in a joint trading account at 0.04%, dated 6/28/13, due 7/1/13 (Delivery value $173,273) | | | 173,272 | |
SSgA U.S. Government Money Market Fund | | 487,467 | | | 487,467 | |
TOTAL TEMPORARY CASH INVESTMENTS (Cost $1,353,826) | | | 1,353,826 | |
TOTAL INVESTMENT SECURITIES BEFORE SECURITIES SOLD SHORT — 129.2% (Cost $132,172,188) | | | 155,004,446 | |
Common Stocks Sold Short — (29.3)% | |
AEROSPACE AND DEFENSE — (1.3)% | |
DigitalGlobe, Inc. | | (18,902 | ) | | (586,151 | ) |
Hexcel Corp. | | (28,509 | ) | | (970,731 | ) |
| | | | | | (1,556,882 | ) |
AIR FREIGHT AND LOGISTICS — (0.5)% | |
UTi Worldwide, Inc. | | (39,649 | ) | | (653,019 | ) |
BIOTECHNOLOGY — (0.7)% | |
Ariad Pharmaceuticals, Inc. | | (15,972 | ) | | (279,350 | ) |
Medivation, Inc. | | (6,070 | ) | | (298,644 | ) |
Theravance, Inc. | | (7,684 | ) | | (296,065 | ) |
| | | | | | (874,059 | ) |
CAPITAL MARKETS — (0.4)% | |
Cohen & Steers, Inc. | | (4,583 | ) | | (155,731 | ) |
Stifel Financial Corp. | | (9,763 | ) | | (348,246 | ) |
| | | | | | (503,977 | ) |
CHEMICALS — (1.3)% | |
Cytec Industries, Inc. | | (11,537 | ) | | (845,085 | ) |
Praxair, Inc. | | (2,004 | ) | | (230,781 | ) |
Tronox Ltd., Class A | | (26,160 | ) | | (527,124 | ) |
| | | | | | (1,602,990 | ) |
COMMERCIAL BANKS — (0.4)% | |
Investors Bancorp, Inc. | | (3,561 | ) | | (75,066 | ) |
Trustmark Corp. | | (16,429 | ) | | (403,825 | ) |
| | | | | | (478,891 | ) |
COMMERCIAL SERVICES AND SUPPLIES — (0.3)% | |
Clean Harbors, Inc. | | (6,729 | ) | | (340,016 | ) |
COMMUNICATIONS EQUIPMENT — (0.8)% | |
ViaSat, Inc. | | (12,778 | ) | | (913,116 | ) |
COMPUTERS AND PERIPHERALS — (0.9)% | |
NCR Corp. | | (32,046 | ) | | (1,057,198 | ) |
CONTAINERS AND PACKAGING — (0.3)% | |
MeadWestvaco Corp. | | (9,794 | ) | | $ (334,073 | ) |
ELECTRICAL EQUIPMENT — (0.5)% | |
Franklin Electric Co., Inc. | | (6,421 | ) | | (216,067 | ) |
GrafTech International Ltd. | | (56,770 | ) | | (413,285 | ) |
| | | | | | (629,352 | ) |
ENERGY EQUIPMENT AND SERVICES — (0.5)% | |
Hornbeck Offshore Services, Inc. | | (1,752 | ) | | (93,732 | ) |
SEACOR Holdings, Inc. | | (6,076 | ) | | (504,612 | ) |
Unit Corp. | | (1,602 | ) | | (68,213 | ) |
| | | | | | (666,557 | ) |
FOOD PRODUCTS — (0.9)% | |
Hain Celestial Group, Inc. (The) | | (7,609 | ) | | (494,357 | ) |
Snyders-Lance, Inc. | | (20,703 | ) | | (588,172 | ) |
| | | | | | (1,082,529 | ) |
GAS UTILITIES — (0.9)% | |
New Jersey Resources Corp. | | (14,920 | ) | | (619,627 | ) |
ONEOK, Inc. | | (5,841 | ) | | (241,292 | ) |
South Jersey Industries, Inc. | | (4,451 | ) | | (255,532 | ) |
| | | | | | (1,116,451 | ) |
HEALTH CARE EQUIPMENT AND SUPPLIES — (1.0)% | |
Haemonetics Corp. | | (18,341 | ) | | (758,400 | ) |
Hologic, Inc. | | (24,476 | ) | | (472,387 | ) |
| | | | | | (1,230,787 | ) |
HEALTH CARE PROVIDERS AND SERVICES — (1.4)% | |
Air Methods Corp. | | (1,729 | ) | | (58,579 | ) |
Catamaran Corp. | | (4,441 | ) | | (216,366 | ) |
DaVita HealthCare Partners, Inc. | | (2,116 | ) | | (255,613 | ) |
Health Net, Inc. | | (14,393 | ) | | (457,985 | ) |
Team Health Holdings, Inc. | | (7,934 | ) | | (325,849 | ) |
WellCare Health Plans, Inc. | | (6,197 | ) | | (344,243 | ) |
| | | | | | (1,658,635 | ) |
HOTELS, RESTAURANTS AND LEISURE — (0.5)% | |
BJ’s Restaurants, Inc. | | (8,975 | ) | | (332,973 | ) |
Penn National Gaming, Inc. | | (4,841 | ) | | (255,895 | ) |
| | | | | | (588,868 | ) |
HOUSEHOLD DURABLES — (1.3)% | |
Ryland Group, Inc. | | (7,196 | ) | | (288,559 | ) |
Standard Pacific Corp. | | (84,988 | ) | | (707,950 | ) |
Toll Brothers, Inc. | | (18,133 | ) | | (591,680 | ) |
| | | | | | (1,588,189 | ) |
INDEPENDENT POWER PRODUCERS AND ENERGY TRADERS — (0.7)% | |
NRG Energy, Inc. | | (31,617 | ) | | (844,174 | ) |
INSURANCE — (0.6)% | |
RLI Corp. | | (8,825 | ) | | (674,318 | ) |
IT SERVICES — (0.6)% | |
Convergys Corp. | | (39,575 | ) | | (689,792 | ) |
MACHINERY — (0.5)% | |
Pentair Ltd. | | (10,467 | ) | | (603,841 | ) |
MEDIA — (1.7)% | |
DreamWorks Animation SKG, Inc., Class A | | (44,560 | ) | | (1,143,409 | ) |
Loral Space & Communications, Inc. | | (14,156 | ) | | (849,077 | ) |
| | | | | | (1,992,486 | ) |
METALS AND MINING — (2.0)% | |
AK Steel Holding Corp. | | (25,644 | ) | | (77,958 | ) |
Allied Nevada Gold Corp. | | (21,031 | ) | | (136,281 | ) |
AuRico Gold, Inc. | | (56,818 | ) | | (248,295 | ) |
Compass Minerals International, Inc. | | (3,883 | ) | | (328,230 | ) |
Hecla Mining Co. | | (76,165 | ) | | (226,972 | ) |
Royal Gold, Inc. | | (5,428 | ) | | (228,410 | ) |
Silver Standard Resources, Inc. | | (27,416 | ) | | (173,817 | ) |
Stillwater Mining Co. | | (62,183 | ) | | (667,845 | ) |
Tahoe Resources, Inc. | | (4,538 | ) | | (64,213 | ) |
Thompson Creek Metals Co., Inc. | | (81,873 | ) | | (248,075 | ) |
| | | | | | (2,400,096 | ) |
MULTILINE RETAIL — (0.1)% | |
J.C. Penney Co., Inc. | | (4,200 | ) | | (71,736 | ) |
OIL, GAS AND CONSUMABLE FUELS — (1.4)% | |
Approach Resources, Inc. | | (4,252 | ) | | (104,472 | ) |
Bill Barrett Corp. | | (11,618 | ) | | (234,916 | ) |
Consol Energy, Inc. | | (16,931 | ) | | (458,830 | ) |
Gulfport Energy Corp. | | (1,611 | ) | | (75,830 | ) |
Kodiak Oil & Gas Corp. | | (38,134 | ) | | (339,011 | ) |
Range Resources Corp. | | (900 | ) | | (69,588 | ) |
SM Energy Co. | | (7,227 | ) | | (433,475 | ) |
| | | | | | (1,716,122 | ) |
PHARMACEUTICALS — (0.2)% | |
ViroPharma, Inc. | | (3,807 | ) | | (109,071 | ) |
VIVUS, Inc. | | (13,538 | ) | | (170,308 | ) |
| | | | | | (279,379 | ) |
REAL ESTATE INVESTMENT TRUSTS (REITs) — (0.2)% | |
SL Green Realty Corp. | | (3,078 | ) | | (271,449 | ) |
REAL ESTATE MANAGEMENT AND DEVELOPMENT — (0.7)% | |
Brookfield Office Properties, Inc. | | (50,242 | ) | | (838,037 | ) |
Forest City Enterprises, Inc., Class A | | (3,841 | ) | | (68,792 | ) |
| | | | | | (906,829 | ) |
ROAD AND RAIL — (0.7)% | |
Genesee & Wyoming, Inc., Class A | | (9,722 | ) | | $ (824,814 | ) |
SEMICONDUCTORS AND SEMICONDUCTOR EQUIPMENT — (0.9)% | |
SunEdison, Inc. | | (126,480 | ) | | (1,033,342 | ) |
SOFTWARE — (0.4)% | |
Solera Holdings, Inc. | | (7,806 | ) | | (434,404 | ) |
SPECIALTY RETAIL — (1.9)% | |
CarMax, Inc. | | (19,208 | ) | | (886,641 | ) |
Pier 1 Imports, Inc. | | (23,668 | ) | | (555,962 | ) |
Tiffany & Co. | | (11,588 | ) | | (844,070 | ) |
| | | | | | (2,286,673 | ) |
TEXTILES, APPAREL AND LUXURY GOODS — (0.5)% | |
Wolverine World Wide, Inc. | | (10,328 | ) | | (564,012 | ) |
THRIFTS AND MORTGAGE FINANCE — (0.2)% | |
Capitol Federal Financial, Inc. | | (8,544 | ) | | (103,724 | ) |
MGIC Investment Corp. | | (15,254 | ) | | (92,592 | ) |
| | | | | | (196,316 | ) |
TRADING COMPANIES AND DISTRIBUTORS — (2.1)% | |
Air Lease Corp. | | (34,760 | ) | | (959,029 | ) |
GATX Corp. | | (3,265 | ) | | (154,859 | ) |
Textainer Group Holdings Ltd. | | (23,750 | ) | | (912,950 | ) |
Watsco, Inc. | | (5,493 | ) | | (461,192 | ) |
| | | | | | (2,488,030 | ) |
TOTAL COMMON STOCKS SOLD SHORT — (29.3)% (Proceeds $33,453,088) | | | (35,153,402 | ) |
OTHER ASSETS AND LIABILITIES — 0.1% | | | 121,083 | |
TOTAL NET ASSETS — 100.0% | | | $ 119,972,127 | |
Notes to Schedule of Investments
(1) | Security, or a portion thereof, has been pledged at the custodian bank or with a broker for collateral requirements on securities sold short. At the period end, the aggregate value of securities pledged was $99,828,778. |
See Notes to Financial Statements.
Statement of Assets and Liabilities |
JUNE 30, 2013 | |
Assets | |
Investment securities, at value (cost of $132,172,188) | | $155,004,446 | |
Deposits with broker for securities sold short | | 123,022 | |
Receivable for capital shares sold | | 15,242 | |
Dividends and interest receivable | | 135,166 | |
| | | 155,277,876 | |
| | | | |
Liabilities | | | |
Securities sold short, at value (proceeds of $33,453,088) | | 35,153,402 | |
Payable for capital shares redeemed | | 2,075 | |
Accrued management fees | | 128,115 | |
Distribution and service fees payable | | 467 | |
Dividend expense payable on securities sold short | | 20,767 | |
Broker fees and charges payable on securities sold short | | 923 | |
| | | 35,305,749 | |
| | | | |
Net Assets | | $119,972,127 | |
| | | | |
Net Assets Consist of: | | | |
Capital (par value and paid-in surplus) | | $ 94,572,909 | |
Undistributed net investment income | | 169,014 | |
Undistributed net realized gain | | 4,098,260 | |
Net unrealized appreciation | | 21,131,944 | |
| | | $119,972,127 | |
| | | Net assets | | Shares outstanding | | Net asset value per share |
Investor Class, $0.01 Par Value | | $114,443,772 | | | 8,913,261 | | | $12.84 | |
Institutional Class, $0.01 Par Value | | $4,427,461 | | | 344,739 | | | $12.84 | |
A Class, $0.01 Par Value | | $515,450 | | | 40,150 | | | $12.84* | |
C Class, $0.01 Par Value | | $448,637 | | | 35,094 | | | $12.78 | |
R Class, $0.01 Par Value | | $136,807 | | | 10,663 | | | $12.83 | |
*Maximum offering price $13.62 (net asset value divided by 0.9425). | |
See Notes to Financial Statements.
YEAR ENDED JUNE 30, 2013 | |
Investment Income (Loss) | |
Income: | | | |
Dividends (net of foreign taxes withheld of $8,190) | | $ 3,132,797 | |
Interest | | 1,642 | |
| | | 3,134,439 | |
| | | | |
Expenses: | | | |
Dividend expense on securities sold short | | 327,925 | |
Broker fees and charges on securities sold short | | 254,628 | |
Management fees | | 1,344,355 | |
Distribution and service fees: | | | |
A Class | | 1,036 | |
C Class | | 1,908 | |
R Class | | 621 | |
Directors’ fees and expenses | | 4,670 | |
| | | 1,935,143 | |
| | | | |
Net investment income (loss) | | 1,199,296 | |
| | | | |
Realized and Unrealized Gain (Loss) | | | |
Net realized gain (loss) on: | | | |
Investment transactions | | 10,111,012 | |
Securities sold short transactions | | (4,080,875 | ) |
Foreign currency transactions | | 197 | |
| | | 6,030,334 | |
| | | | |
Change in net unrealized appreciation (depreciation) on: | | | |
Investments | | 16,839,910 | |
Securities sold short | | (3,083,349 | ) |
Translation of assets and liabilities in foreign currencies | | (47 | ) |
| | | 13,756,514 | |
| | | | |
Net realized and unrealized gain (loss) | | 19,786,848 | |
| | | | |
Net Increase (Decrease) in Net Assets Resulting from Operations | | $20,986,144 | |
See Notes to Financial Statements.
Statement of Changes in Net Assets |
YEAR ENDED JUNE 30, 2013 AND PERIOD ENDED JUNE 30, 2012 |
Increase (Decrease) in Net Assets | June 30, 2013 | | | June 30, 2012(1) | |
Operations |
Net investment income (loss) | $1,199,296 | | | $187,820 | |
Net realized gain (loss) | 6,030,334 | | | (315,357 | ) |
Change in net unrealized appreciation (depreciation) | 13,756,514 | | | 7,375,430 | |
Net increase (decrease) in net assets resulting from operations | 20,986,144 | | | 7,247,893 | |
| | | | | | |
Distributions to Shareholders |
From net investment income: | | | | | |
Investor Class | (1,217,032 | ) | | (35,029 | ) |
Institutional Class | (52,597 | ) | | (82 | ) |
A Class | (3,014 | ) | | (9 | ) |
R Class | (593 | ) | | — | |
From net realized gains: | | | | | |
Investor Class | (1,479,849 | ) | | — | |
Institutional Class | (38,590 | ) | | — | |
A Class | (4,572 | ) | | — | |
C Class | (2,741 | ) | | — | |
R Class | (1,862 | ) | | — | |
Decrease in net assets from distributions | (2,800,850 | ) | | (35,120 | ) |
| | | | | | |
Capital Share Transactions |
Net increase (decrease) in net assets from capital share transactions | 16,682,302 | | | 77,891,758 | |
| | | | | | |
Net increase (decrease) in net assets | 34,867,596 | | | 85,104,531 | |
| | | | | | |
Net Assets |
Beginning of period | 85,104,531 | | | — | |
End of period | $119,972,127 | | | $85,104,531 | |
| | | | | | |
Undistributed net investment income | $169,014 | | | $160,238 | |
(1) | October 31, 2011 (fund inception) through June 30, 2012. |
See Notes to Financial Statements.
YEAR ENDED JUNE 30, 2013 | |
Cash Flows From (Used In) Operating Activities | |
Net increase (decrease) in net assets resulting from operations | | $20,986,144 | |
Adjustments to reconcile net increase (decrease) in net assets resulting from operations to net cash from (used in) operating activities: | | | |
Purchases of investment securities | | (114,448,835 | ) |
Proceeds from investments sold | | 97,170,560 | |
Purchases to cover securities sold short | | (41,291,614 | ) |
Proceeds from securities sold short | | 43,783,764 | |
(Increase) decrease in short-term investments | | (1,178,864 | ) |
(Increase) decrease in deposits with broker for securities sold short | | 440,972 | |
(Increase) decrease in receivable for investments sold | | 428,068 | |
(Increase) decrease in dividends and interest receivable | | (29,698 | ) |
Increase (decrease) in accrued management fees | | 40,132 | |
Increase (decrease) in distribution and service fees payable | | 290 | |
Increase (decrease) in dividend expense payable on securities sold short | | 12,645 | |
Increase (decrease) in broker fees and charges payable on securities sold short | | (869 | ) |
Change in net unrealized (appreciation) depreciation on investments | | (16,839,910 | ) |
Net realized (gain) loss on investment transactions | | (10,111,012 | ) |
Change in net unrealized (appreciation) depreciation on securities sold short | | 3,083,349 | |
Net realized (gain) loss on securities sold short transactions | | 4,080,875 | |
Net cash from (used in) operating activities | | (13,874,003 | ) |
| | | | |
Cash Flows From (Used In) Financing Activities | |
Proceeds from shares sold | | 19,695,079 | |
Payments for shares redeemed | | (5,822,561 | ) |
Distributions paid, net of reinvestments | | (4,486 | ) |
Net cash from (used in) financing activities | | 13,868,032 | |
| | | | |
Net Increase (Decrease) In Cash | | (5,971 | ) |
Cash at beginning of period | | 5,971 | |
Cash at end of period | | — | |
Supplemental disclosure of cash flow information:
Non cash financing activities not included herein consist of all reinvestment of distributions of $2,796,364.
See Notes to Financial Statements.
Notes to Financial Statements |
JUNE 30, 2013
1. Organization
American Century Quantitative Equity Funds, Inc. (the corporation) is registered under the Investment Company Act of 1940, as amended (the 1940 Act), as an open-end management investment company and is organized as a Maryland corporation. Core Equity Plus Fund (the fund) is one fund in a series issued by the corporation. The fund is diversified as defined under the 1940 Act. The fund’s investment objective is to seek long-term
capital growth.
The fund offers the Investor Class, the Institutional Class, the A Class, the C Class and the R Class. The A Class may incur an initial sales charge. The A Class and C Class may be subject to a contingent deferred sales charge. The share classes differ principally in their respective sales charges and distribution and shareholder servicing expenses and arrangements. The Institutional Class is made available to institutional shareholders or through financial intermediaries whose clients do not require the same level of shareholder and administrative services as shareholders of other classes. As a result, the Institutional Class is charged a lower unified management fee. All classes of the fund commenced sale on October 31, 2011, the fund’s inception date.
2. Significant Accounting Policies
The following is a summary of significant accounting policies consistently followed by the fund in preparation of its financial statements. The financial statements are prepared in conformity with accounting principles generally accepted in the United States of America, which may require management to make certain estimates and assumptions at the date of the financial statements. Actual results could differ from these estimates.
Investment Valuations — The fund determines the fair value of its investments and computes its net asset value per share as of the close of regular trading (usually 4 p.m. Eastern time) on the New York Stock Exchange (NYSE) on each day the NYSE is open.
Equity securities that are listed or traded on a domestic securities exchange are valued at the last reported sales price or at the official closing price as provided by the exchange. Equity securities traded on foreign securities exchanges are typically valued at the closing price on the exchange where primarily traded or as of the close of the NYSE, if that is earlier. If no last sales price is reported, or if local convention or regulation so provides, the mean of the latest bid and asked prices is used. Depending on local convention or regulation, securities traded over-the-counter are valued at the mean of the latest bid and asked prices, the last sales price, or the official closing price. In its determination of fair value, the fund may review several factors including: market information specific to a security; news developments in U.S. and foreign markets; the performance of particular U.S. and foreign securities, indices, comparable securities, American Depositary Receipts, Exchange-Traded Funds, and other relevant market indicators.
Debt securities maturing within 60 days at the time of purchase may be valued at cost, plus or minus any amortized discount or premium or at the evaluated mean as provided by an independent pricing service. Evaluated mean prices are commonly derived through utilization of market models, which may consider, among other factors, trade data, quotations from dealers and active market makers, relevant yield curve and spread data, related sector levels, creditworthiness, and other relevant market information on the same or comparable securities.
Investments in open-end management investment companies are valued at the reported net asset value per share. Repurchase agreements are valued at cost.
The value of investments initially expressed in foreign currencies is translated into U.S. dollars at prevailing exchange rates.
If the fund determines that the market price for a portfolio security is not readily available or the valuation methods mentioned above do not reflect a security’s fair value, such security is valued as determined in good faith by the Board of Directors or its designee, in accordance with procedures adopted by the Board of Directors. Circumstances that may cause the fund to use these procedures to value a security include, but are not limited to: a security has been declared in default; trading in a security has been halted during the trading day; there is a foreign market holiday and no trading occurred; or an event occurred between the close of a foreign exchange and the NYSE that may affect the value of a security.
Security Transactions — Security transactions are accounted for as of the trade date. Net realized gains and losses are determined on the identified cost basis, which is also used for federal income tax purposes.
Investment Income — Dividend income less foreign taxes withheld, if any, is recorded as of the ex-dividend date. Distributions received on securities that represent a return of capital or long-term capital gain are recorded as a reduction of cost of investments and/or as a realized gain. The fund may estimate the components of distributions received that may be considered nontaxable distributions or long-term capital gain distributions for income tax purposes. Interest income is recorded on the accrual basis and includes accretion of discounts and amortization of premiums.
Securities Sold Short — The fund enters into short sales, which is selling securities it does not own, as part of its normal investment activities. Upon selling a security short, the fund will segregate cash, cash equivalents or other appropriate liquid securities in at least an amount equal to the current market value of the securities sold short until the fund replaces the borrowed security. Interest earned on segregated cash for securities sold short is reflected as interest income. The fund is required to pay any dividends or interest due on securities sold short. Such dividends and interest are recorded as an expense. The fund may pay fees or charges on the assets borrowed for securities sold short. Liabilities for securities sold short are valued daily and changes in value are recorded as change in net unrealized appreciation (depreciation) on securities sold short. The fund records realized gain (loss) on a security sold short when it is terminated by the fund and includes as a component of net realized gain (loss) on securities sold short transactions.
Foreign Currency Translations — All assets and liabilities initially expressed in foreign currencies are translated into U.S. dollars at prevailing exchange rates at period end. The fund may enter into spot foreign currency exchange contracts to facilitate transactions denominated in a foreign currency. Purchases and sales of investment securities, dividend and interest income, spot foreign currency exchange contracts, and expenses are translated at the rates of exchange prevailing on the respective dates of such transactions. Net realized and unrealized foreign currency exchange gains or losses related to investment securities are a component of net realized gain (loss) on investment transactions and change in net unrealized appreciation (depreciation) on investments, respectively. Net realized and unrealized foreign currency exchange gains or losses related to securities sold short are a component of net realized gain (loss) on securities sold short transactions and change in net unrealized appreciation (depreciation) on securities sold short, respectively.
Repurchase Agreements — The fund may enter into repurchase agreements with institutions that American Century Investment Management, Inc. (ACIM) (the investment advisor) has determined are creditworthy pursuant to criteria adopted by the Board of Directors. The fund requires that the collateral, represented by securities, received in a repurchase transaction be transferred to the custodian in a manner sufficient to enable the fund to obtain those securities in the event of a default under the repurchase agreement. ACIM monitors, on a daily basis, the securities transferred to ensure the value, including accrued interest, of the securities under each repurchase agreement is equal to or greater than amounts owed to the fund under each repurchase agreement.
Joint Trading Account — Pursuant to an Exemptive Order issued by the Securities and Exchange Commission, the fund, along with certain other funds in the American Century Investments family of funds, may transfer uninvested cash balances into a joint trading account. These balances are invested in one or more repurchase agreements that are collateralized by U.S. Treasury or Agency obligations.
Segregated Assets — In accordance with the 1940 Act, the fund segregates assets on its books and records to cover certain types of investments, including, but not limited to, futures contracts and short sales. ACIM monitors, on a daily basis, the securities segregated to ensure the fund designates a sufficient amount of liquid assets, marked-to-market daily. The fund may also receive assets or be required to pledge assets at the custodian bank or with a broker for margin requirements on futures contracts and short sales.
Income Tax Status — It is the fund’s policy to distribute substantially all net investment income and net realized gains to shareholders and to otherwise qualify as a regulated investment company under provisions of the Internal Revenue Code. Accordingly, no provision has been made for income taxes. The fund files U.S. federal, state, local and non-U.S. tax returns as applicable. The fund’s tax returns are subject to examination by the relevant taxing authority until expiration of the applicable statute of limitations, which is generally three years from the date of filing but can be longer in certain jurisdictions. At this time, management believes there are no uncertain tax positions which, based on their technical merit, would not be sustained upon examination and for which it is reasonably possible that the total amounts of unrecognized tax benefits will significantly change in the next twelve months.
Multiple Class — All shares of the fund represent an equal pro rata interest in the net assets of the class to which such shares belong, and have identical voting, dividend, liquidation and other rights and the same terms and conditions, except for class specific expenses and exclusive rights to vote on matters affecting only individual classes. Income, non-class specific expenses, and realized and unrealized capital gains and losses of the fund are allocated to each class of shares based on their relative net assets.
Distributions to Shareholders — Distributions from net investment income, if any, are generally declared and paid semiannually. Distributions from net realized gains, if any, are generally declared and paid annually.
Indemnifications — Under the corporation’s organizational documents, its officers and directors are indemnified against certain liabilities arising out of the performance of their duties to the fund. In addition, in the normal course of business, the fund enters into contracts that provide general indemnifications. The maximum exposure under these arrangements is unknown as this would involve future claims that may be made against a fund. The risk of material loss from such claims is considered by management to be remote.
Statement of Cash Flows — The beginning of period and end of period cash in the Statement of Cash Flows is the amount of domestic and foreign currency included in the fund’s Statement of Assets and Liabilities and represents the cash on hand at the custodian bank and does not include any short-term investments or deposits with brokers for securities sold short.
3. Fees and Transactions with Related Parties
Management Fees — The corporation has entered into a management agreement with ACIM, under which ACIM provides the fund with investment advisory and management services in exchange for a single, unified management fee (the fee) per class. The agreement provides that all expenses of managing and operating the fund, except distribution and service fees, expenses on securities sold short, brokerage expenses, taxes, interest, fees and expenses of the independent directors (including legal counsel fees), and extraordinary expenses, will be paid by ACIM. The fee is computed and accrued daily based on each class’s daily net assets and paid monthly in arrears. The fee consists of (1) an Investment Category Fee based on the daily net assets of the fund and certain other accounts managed by the investment advisor that are in the same broad investment category as the fund and (2) a Complex Fee based on the assets of all the funds in the American Century Investments family of funds. The rates for the Investment Category Fee range from 0.9680% to 1.1500%. The rates for the Complex Fee range from 0.2500% to 0.3100% for the Investor Class, A Class, C Class and R Class. The Institutional Class is 0.2000% less at each point within the Complex Fee range. The effective annual management fee for each class for the year ended June 30, 2013 was 1.30% for the Investor Class, A Class, C Class and R Class and 1.10% for the Institutional Class.
Distribution and Service Fees — The Board of Directors has adopted a separate Master Distribution and Individual Shareholder Services Plan for each of the A Class, C Class and R Class (collectively the plans), pursuant to Rule 12b-1 of the 1940 Act. The plans provide that the A Class will pay American Century Investment Services, Inc. (ACIS) an annual distribution and service fee of 0.25%. The plans provide that the C Class will pay ACIS an annual distribution and service fee of 1.00%, of which 0.25% is paid for individual shareholder services and 0.75% is paid for distribution services. The plans provide that the R Class will pay ACIS an annual distribution and service fee of 0.50%. The fees are computed and accrued daily based on each class’s daily net assets and paid monthly in arrears. The fees are used to pay financial intermediaries for distribution and individual shareholder services. Fees incurred under the plans during the year ended June 30, 2013 are detailed in the Statement of Operations.
Related Parties — Certain officers and directors of the corporation are also officers and/or directors of American Century Companies, Inc. (ACC). The corporation’s investment advisor, ACIM, the corporation’s distributor, ACIS, and the corporation’s transfer agent, American Century Services, LLC are wholly owned, directly or indirectly, by ACC. Various funds issued by American Century Asset Allocation Portfolios, Inc. and American Century Strategic Asset Allocations, Inc. own, in aggregate, 94% of the shares of the fund. Related parties do not invest in the fund for the purpose of exercising management or control.
4. Investment Transactions
Purchases and sales of investment securities and securities sold short, excluding short-term investments, for the year ended June 30, 2013 were $155,591,633 and $140,934,031, respectively.
5. Capital Share Transactions
Transactions in shares of the fund were as follows:
| | | Year ended June 30, 2013 | | | Period ended June 30, 2012(1) | |
| | | Shares | | | Amount | | | Shares | | | Amount | |
Investor Class/Shares Authorized | | 70,000,000 | | | | | | 70,000,000 | | | | |
Sold | | 1,247,179 | | | $14,456,890 | | | 8,085,420 | | | $80,041,339 | |
Issued in reinvestment of distributions | | 233,568 | | | 2,692,484 | | | 3,502 | | | 34,990 | |
Redeemed | | (360,423 | ) | | (4,304,852 | ) | | (295,985 | ) | | (3,167,463 | ) |
| | | 1,120,324 | | | 12,844,522 | | | 7,792,937 | | | 76,908,866 | |
Institutional Class/Shares Authorized | | 10,000,000 | | | | | | 10,000,000 | | | | |
Sold | | 389,399 | | | 4,516,129 | | | 80,225 | | | 821,989 | |
Issued in reinvestment of distributions | | 7,857 | | | 91,187 | | | 8 | | | 82 | |
Redeemed | | (101,967 | ) | | (1,290,661 | ) | | (30,783 | ) | | (297,884 | ) |
| | | 295,289 | | | 3,316,655 | | | 49,450 | | | 524,187 | |
A Class/Shares Authorized | | 10,000,000 | | | | | | 10,000,000 | | | | |
Sold | | 36,112 | | | 420,654 | | | 65,012 | | | 662,759 | |
Issued in reinvestment of distributions | | 651 | | | 7,497 | | | 1 | | | 9 | |
Redeemed | | (18,020 | ) | | (216,949 | ) | | (43,606 | ) | | (433,630 | ) |
| | | 18,743 | | | 211,202 | | | 21,407 | | | 229,138 | |
C Class/Shares Authorized | | 10,000,000 | | | | | | 10,000,000 | | | | |
Sold | | 25,347 | | | 316,261 | | | 43,858 | | | 440,045 | |
Issued in reinvestment of distributions | | 243 | | | 2,741 | | | — | | | — | |
Redeemed | | (913 | ) | | (11,921 | ) | | (33,441 | ) | | (326,171 | ) |
| | | 24,677 | | | 307,081 | | | 10,417 | | | 113,874 | |
R Class/Shares Authorized | | 10,000,000 | | | | | | 10,000,000 | | | | |
Sold | | 30 | | | 387 | | | 40,000 | | | 400,000 | |
Issued in reinvestment of distributions | | 216 | | | 2,455 | | | — | | | — | |
Redeemed | | — | | | — | | | (29,583 | ) | | (284,307 | ) |
| | | 246 | | | 2,842 | | | 10,417 | | | 115,693 | |
Net increase (decrease) | | 1,459,279 | | | $16,682,302 | | | 7,884,628 | | | $77,891,758 | |
(1) | October 31, 2011 (fund inception) through June 30, 2012. |
6. Fair Value Measurements
The fund’s securities valuation process is based on several considerations and may use multiple inputs to determine the fair value of the positions held by the fund. In conformity with accounting principles generally accepted in the United States of America, the inputs used to determine a valuation are classified into three broad levels as follows:
• | Level 1 valuation inputs consist of unadjusted quoted prices in an active market for identical securities; |
• | Level 2 valuation inputs consist of direct or indirect observable market data (including quoted prices for similar securities, evaluations of subsequent market events, interest rates, prepayment speeds, credit risk, etc.); or |
• | Level 3 valuation inputs consist of unobservable data (including a fund’s own assumptions). |
The level classification is based on the lowest level input that is significant to the fair valuation measurement. The valuation inputs are not necessarily an indication of the risks associated with investing in these securities or other financial instruments.
The following is a summary of the level classifications as of period end. The Schedule of Investments provides additional information on the fund’s portfolio holdings.
| | | | | | | | | | |
| | | Level 1 | | Level 2 | | Level 3 |
Investment Securities | |
Common Stocks | | $153,650,620 | | | — | | | — | |
Temporary Cash Investments | | 487,467 | | | $866,359 | | | — | |
Total Value of Investment Securities | | $154,138,087 | | | $866,359 | | | — | |
| | | | | | | | | | |
Securities Sold Short | |
Total Value of Common Stocks Sold Short | | $(35,153,402 | ) | | — | | | — | |
7. Risk Factors
The fund’s investment strategy utilizes leverage, which can increase market exposure and subject the fund to greater risk and higher volatility.
The fund’s investment process may result in high portfolio turnover, which could mean high transaction costs, affecting both performance and capital gains tax liabilities to investors.
The fund is subject to short sales risk. If the market price of a security increases after the fund borrows the security, the fund may suffer a loss when it replaces the borrowed security at the higher price. Any loss will be increased by the amount of compensation, interest or dividends, and transaction costs the fund must pay to the lender of the borrowed security.
If the fund is overweighted in a stock or sector, any negative development related to that stock or sector will have a greater impact on the fund than other funds that are not overweighted in that stock or sector.
8. Federal Tax Information
The tax character of distributions paid during the year ended June 30, 2013 and period October 31, 2011 (fund inception) through June 30, 2012 were as follows:
| | | 2013 | | | 2012 | |
Distributions Paid From | |
Ordinary income | | $2,800,850 | | | $35,120 | |
Long-term capital gains | | — | | | — | |
The book-basis character of distributions made during the year from net investment income or net realized gains may differ from their ultimate characterization for federal income tax purposes. These differences reflect the differing character of certain income items and net realized gains and losses for financial statement and tax purposes, and may result in reclassification among certain capital accounts on the financial statements.
As of June 30, 2013, the federal tax cost of investments and the components of distributable earnings on a tax-basis were as follows:
Federal tax cost of investments | | $132,212,308 | |
Gross tax appreciation of investments | | $24,845,664 | |
Gross tax depreciation of investments | | (2,053,526 | ) |
Net tax appreciation (depreciation) of investments | | $22,792,138 | |
Net tax appreciation (depreciation) on securities sold short | | $(1,700,779 | ) |
Net tax appreciation (depreciation) | | $21,091,359 | |
Undistributed ordinary income | | $1,043,975 | |
Accumulated long-term gains | | $3,263,884 | |
The difference between book-basis and tax-basis unrealized appreciation (depreciation) is attributable primarily to the tax deferral of losses on wash sales.
| |
For a Share Outstanding Throughout the Years Ended June 30 (except as noted) |
Per-Share Data | Ratios and Supplemental Data |
| | | Income From Investment Operations: | Distributions From: | | | Ratio to Average Net Assets of: | | |
| | Net Asset Value, Beginning
of Period | Net
Investment Income
(Loss)(1) | Net
Realized and Unrealized Gain (Loss) | Total From Investment Operations | Net
Investment Income | Net
Realized
Gains | Total Distributions | Net Asset Value,
End of Period | Total
Return(2) | Operating Expenses | Operating Expenses (excluding expenses on securities
sold short) | Net
Investment Income
(Loss) | Portfolio Turnover
Rate | Net Assets, End of Period (in thousands) |
Investor Class |
2013 | $10.79 | 0.14 | 2.23 | 2.37 | (0.14) | (0.18) | (0.32) | $12.84 | 22.33% | 1.87% | 1.30% | 1.15% | 107% | $114,444 |
2012(3) | $10.00 | 0.03 | 0.76 | 0.79 | —(4) | — | —(4) | $10.79 | 7.95% | 2.06%(5) | 1.31%(5) | 0.39%(5) | 105% | $84,116 |
Institutional Class |
2013 | $10.80 | 0.15 | 2.25 | 2.40 | (0.18) | (0.18) | (0.36) | $12.84 | 22.45% | 1.67% | 1.10% | 1.35% | 107% | $4,427 |
2012(3) | $10.00 | 0.06 | 0.75 | 0.81 | (0.01) | — | (0.01) | $10.80 | 8.19% | 1.86%(5) | 1.11%(5) | 0.59%(5) | 105% | $534 |
A Class | | | | | | | | | | | | | | |
2013 | $10.78 | 0.10 | 2.24 | 2.34 | (0.10) | (0.18) | (0.28) | $12.84 | 22.01% | 2.12% | 1.55% | 0.90% | 107% | $515 |
2012(3) | $10.00 | 0.04 | 0.74 | 0.78 | —(4) | — | —(4) | $10.78 | 7.80% | 2.31%(5) | 1.56%(5) | 0.14%(5) | 105% | $231 |
C Class |
2013 | $10.73 | 0.01 | 2.22 | 2.23 | — | (0.18) | (0.18) | $12.78 | 20.99% | 2.87% | 2.30% | 0.15% | 107% | $449 |
2012(3) | $10.00 | —(4) | 0.73 | 0.73 | — | — | — | $10.73 | 7.30% | 3.06%(5) | 2.31%(5) | (0.61)%(5) | 105% | $112 |
R Class |
2013 | $10.76 | 0.08 | 2.23 | 2.31 | (0.06) | (0.18) | (0.24) | $12.83 | 21.70% | 2.37% | 1.80% | 0.65% | 107% | $137 |
2012(3) | $10.00 | 0.03 | 0.73 | 0.76 | — | — | — | $10.76 | 7.60% | 2.56%(5) | 1.81%(5) | (0.11)%(5) | 105% | $112 |
Notes to Financial Highlights
(1) | Computed using average shares outstanding throughout the period. |
(2) | Total returns are calculated based on the net asset value of the last business day and do not reflect applicable sales charges, if any. Total returns for periods less than one year are not annualized. |
(3) | October 31, 2011 (fund inception) through June 30, 2012. |
(4) | Per-share amount was less than $0.005. |
See Notes to Financial Statements.
Report of Independent Registered Public Accounting Firm |
To the Directors of the American Century Quantitative Equity Funds, Inc. and Shareholders of the Core Equity Plus Fund:
In our opinion, the accompanying statement of assets and liabilities, including the schedule of investments, and the related statements of operations, of changes in net assets and of cash flows and the financial highlights present fairly, in all material respects, the financial position of the Core Equity Plus Fund (one of the fourteen funds comprising the American Century Quantitative Equity Funds, Inc., hereafter referred to as the “Fund”) at June 30, 2013, the results of its operations for the year then ended, the changes in its net assets for each of the periods presented, its cash flows for the year then ended, and the financial highlights for each of the periods presented, in conformity with accounting principles generally accepted in the United States of America. These financial statements and financial highlights (hereafter referred to as “financial statements”) are the responsibility of the Fund’s management; our responsibility is to express an opinion on these financial statements based on our audits. We conducted our audits of these financial statements in accordance with the standards of the Public Company Accounting Oversight Board (United States). Those standards require that we plan and perform the audit to obtain reasonable assurance about whether the financial statements are free of material misstatement. An audit includes examining, on a test basis, evidence supporting the amounts and disclosures in the financial statements, assessing the accounting principles used and significant estimates made by management, and evaluating the overall financial statement presentation. We believe that our audits, which included confirmation of securities at June 30, 2013 by correspondence with the custodian and brokers, provide a reasonable basis for our opinion.
PricewaterhouseCoopers LLP
Kansas City, Missouri
August 21, 2013
Board of Directors
The individuals listed below serve as directors of the funds. Each director will continue to serve in this capacity until death, retirement, resignation or removal from office. The board has adopted a mandatory retirement age for directors who are not “interested persons,” as that term is defined in the Investment Company Act (independent directors). Independent directors shall retire on December 31 of the year in which they reach their 75th birthday; provided, however, that on or after January 1, 2022, independent directors shall retire on December 31 of the year in which they reach their 76th birthday.
Mr. Thomas is the only director who is an “interested person” because he currently serves as President and Chief Executive Officer of American Century Companies, Inc. (ACC), the parent company of American Century Investment Management, Inc. (ACIM or the advisor).
The other directors (more than three-fourths of the total number) are independent; that is, they have never been employees, directors or officers of, and have no financial interest in, ACC or any of its wholly owned, direct or indirect, subsidiaries, including ACIM, American Century Investment Services, Inc. (ACIS) and American Century Services, LLC (ACS). The directors serve in this capacity for eight (in the case of Mr. Thomas, 15) registered investment companies in the American Century Investments family of funds.
The following table presents additional information about the directors. The mailing address for each director other than Mr. Thomas is 1665 Charleston Road, Mountain View, California 94043. The mailing address for Mr. Thomas is 4500 Main Street, Kansas City, Missouri 64111.
Name
(Year of Birth) | Position(s) Held with Funds | Length of Time Served | Principal Occupation(s) During Past 5 Years | | Number of American Century Portfolios Overseen
by Director | Other Directorships Held During Past 5 Years |
Independent Directors |
Tanya S. Beder
(1955) | Director | Since 2011 | Chairman, SBCC Group Inc. (independent advisory services) (2006 to present) | | 41 | CYS Investments, Inc. (specialty finance company) |
Jeremy I. Bulow
(1954) | Director | Since 2011 | Professor of Economics, Stanford University, Graduate School of Business (1979 to present) | | 41 | None |
Ronald J. Gilson
(1946) | Director and Chairman of the Board | Since 1995 | Charles J. Meyers Professor of Law and Business, Stanford Law School (1979 to present); Marc and Eva Stern Professor of Law and Business, Columbia University School of Law (1992 to present) | | 41 | None |
Frederick L. A. Grauer
(1946) | Director | Since 2008 | Senior Advisor, BlackRock, Inc. (investment management firm) (2010 to 2011); Senior Advisor, Barclays Global Investors (investment management firm) (2003 to 2009) | | 41 | None |
Name
(Year of Birth) | Position(s) Held with Funds | Length of Time Served | Principal Occupation(s) During Past 5 Years | | Number of American Century Portfolios Overseen
by Director | Other Directorships Held During Past 5 Years |
Independent Directors |
Peter F. Pervere
(1947) | Director | Since 2007 | Retired | | 41 | Intraware, Inc. (2003 to 2009) |
Myron S. Scholes
(1941) | Director | Since 1980 | Chairman, Platinum Grove Asset Management, L.P. (asset manager) (1999 to 2009); Frank E. Buck Professor of Finance-Emeritus, Stanford Graduate School of Business (1996 to present) | | 41 | Dimensional Fund Advisors (investment advisor); CME Group, Inc. (futures and options exchange) |
John B. Shoven
(1947) | Director | Since 2002 | Professor of Economics, Stanford University (1973 to present) | | 41 | Cadence Design Systems; Exponent; Financial Engines |
| | | | | | | |
Interested Director |
Jonathan S. Thomas
(1963) | Director and President | Since 2007 | President and Chief Executive Officer, ACC (March 2007 to present). Also serves as Chief Executive Officer and Manager, ACS; Executive Vice President, ACIM; Director, ACC, ACIM and other ACC subsidiaries | | 106 | None |
Officers
The following table presents certain information about the executive officers of the funds. Each officer serves as an officer for each of the 15 investment companies in the American Century family of funds, unless otherwise noted. No officer is compensated for his or her service as an officer of the funds. The listed officers are interested persons of the funds and are appointed or re-appointed on an annual basis. The mailing address for each of the officers listed below is 4500 Main Street, Kansas City, Missouri 64111.
Name
(Year of Birth) | Offices with the Funds | | Principal Occupation(s) During the Past Five Years |
Jonathan S. Thomas
(1963) | Director and President since 2007 | | President and Chief Executive Officer, ACC (March 2007 to present). Also serves as Chief Executive Officer and Manager, ACS; Executive Vice President, ACIM; Director, ACC, ACIM and other ACC subsidiaries |
Maryanne L. Roepke
(1956) | Chief Compliance Officer since 2006 and Senior Vice President since 2000 | | Chief Compliance Officer, American Century funds, ACIM and ACS (August 2006 to present). Also serves as Senior Vice President, ACS |
Charles A. Etherington
(1957) | General Counsel since 2007 and Senior Vice President since 2006 | | Attorney, ACC (February 1994 to present); Vice President, ACC (November 2005 to present); General Counsel, ACC (March 2007 to present). Also serves as General Counsel, ACIM, ACS, ACIS and other ACC subsidiaries; and Senior Vice President, ACIM and ACS |
C. Jean Wade
(1964) | Vice President, Treasurer and Chief Financial Officer since 2012 | | Vice President, ACS (February 2000 to present) |
Robert J. Leach
(1966) | Vice President since 2006 and Assistant Treasurer since 2012 | | Vice President, ACS (February 2000 to present) |
David H. Reinmiller
(1963) | Vice President since 2001 | | Attorney, ACC (January 1994 to present); Associate General Counsel, ACC (January 2001 to present). Also serves as Vice President, ACIM and ACS |
Ward D. Stauffer
(1960) | Secretary since 2005 | | Attorney, ACC (June 2003 to present) |
The Statement of Additional Information has additional information about the fund’s directors and is available without charge, upon request, by calling 1-800-345-2021.
Approval of Management Agreement |
At a meeting held on June 11, 2013, the Fund’s Board of Directors/Trustees unanimously approved the renewal of the management agreement pursuant to which American Century Investment Management, Inc. (the “Advisor”) acts as the investment advisor for the Fund. Under Section 15(c) of the Investment Company Act, contracts for investment advisory services are required to be reviewed, evaluated, and approved by a majority of a fund’s directors/trustees (the “Directors”), including a majority of the independent Directors each year. The Board regards this annual evaluation and renewal as one of its most important responsibilities.
In connection with their annual review and evaluation, the independent Directors memorialized a statement regarding the relationship between their ongoing obligations to oversee and evaluate the performance of the Advisor and their consideration of renewal of the management agreement. In that statement, the independent Directors noted that their assessment of the Advisor’s performance is an ongoing process that takes place over the entire year and is informed by all of the information that the Board and its committees receive and consider over time. This information, together with the materials provided in connection with the review, are central to the Board’s assessment of the Advisor’s performance and its determination whether to renew the Fund’s management agreement.
Prior to its consideration of the renewal of the management agreement, the Board requested and reviewed extensive data and analysis relating to the proposed renewal. This information and analysis was compiled by the Advisor and certain independent providers of evaluation data concerning the Fund and the services provided to the Fund by the Advisor.
In connection with its consideration of the renewal of the management agreement, the Board’s review and evaluation of the services provided by the Advisor included, but was not limited to, the following:
• | the nature, extent, and quality of investment management, shareholder services, and other services provided by the Advisor to the Fund; |
• | the wide range of other programs and services the Advisor provides to the Fund and its shareholders on a routine and non-routine basis; |
• | the investment performance of the Fund, including data comparing the Fund’s performance to appropriate benchmarks and/or a peer group of other mutual funds with similar investment objectives and strategies; |
• | data comparing the cost of owning the Fund to the cost of owning similar funds; |
• | the Advisor’s compliance policies, procedures, and regulatory experience; |
• | financial data showing the cost of services provided to the Fund, the profitability of the Fund to the Advisor, and the overall profitability of the Advisor; |
• | possible economies of scale associated with the Advisor’s management of the Fund and other accounts under its management; |
• | data comparing services provided and charges to other investment management clients of the Advisor; and |
• | consideration of collateral benefits derived by the Advisor from the management of the Fund. |
In keeping with its practice, the Board held two in-person meetings to review and discuss the information provided. The Board also had the benefit of the advice of its independent counsel throughout the period.
Factors Considered
The Directors considered all of the information provided by the Advisor, the independent data providers, and the Board’s independent counsel in connection with the review, and evaluated such information for the Fund. In connection with their review, the Directors did not identify any single factor as being all-important or controlling and each Director may have attributed different levels of importance to different factors. In deciding to renew the management agreement, the Board based its decision on a number of factors, including the following:
Nature, Extent and Quality of Services — Generally. Under the management agreement, the Advisor is responsible for providing or arranging for all services necessary for the operation of the Fund. The Board noted that under the management agreement, the Advisor provides or arranges at its own expense a wide variety of services including:
• | constructing and designing the Fund |
• | portfolio research and security selection |
• | initial capitalization/funding |
• | daily valuation of the Fund’s portfolio |
• | shareholder servicing and transfer agency, including shareholder confirmations, recordkeeping, and communications |
• | regulatory and portfolio compliance |
• | marketing and distribution |
The Board noted that many of these services have expanded over time both in terms of quantity and complexity in response to shareholder demands, competition in the industry, changing distribution channels, and the changing regulatory environment.
Investment Management Services. The nature of the investment management services provided to the Fund is quite complex and allows Fund shareholders access to professional money management, instant diversification of their investments within an asset class, the opportunity to easily diversify among asset classes by investing in or exchanging among various American Century Investments funds, and liquidity. In evaluating investment performance, the Board expects the Advisor to manage the Fund in accordance with its investment objectives and approved strategies. Further, the Directors recognize that the Advisor has an obligation to seek the best execution of fund trades. In providing these services, the Advisor utilizes teams of investment professionals (portfolio managers, analysts, research assistants, and securities traders) who require extensive information technology, research, training, compliance and other systems to conduct their business. The Board, directly and through its Portfolio Committee, regularly reviews investment performance information for the Fund, together with comparative information for appropriate benchmarks and/or peer groups of similarly-managed funds, over different time horizons. The Directors also review detailed performance information during the management agreement approval process. If performance concerns are identified, the Fund receives special reviews until performance improves, during which the Board discusses with the Advisor the reasons for such results (e.g., market conditions, security selection) and any efforts being undertaken to improve performance. The Board found the investment management services provided by the Advisor to the Fund to meet or exceed industry standards. More detailed information about the Fund’s performance can be found in the Performance and Portfolio Commentary sections of this report.
Shareholder and Other Services. Under the management agreement, the Advisor provides the Fund with a comprehensive package of transfer agency, shareholder, and other services. The Board, directly and through various committees of the Board, regularly reviews reports and evaluations of such services at its regular meetings. These reports include, but are not limited to, information regarding the operational efficiency and accuracy of the shareholder and transfer agency services provided, staffing levels, shareholder satisfaction (as measured by external as well as internal sources), technology support, new products and services offered to Fund shareholders, securities trading activities, portfolio valuation services, auditing services, and legal and operational compliance activities. Certain aspects of shareholder and transfer agency service level efficiency and the quality of securities trading activities are measured by independent third party providers and are presented in comparison to other fund groups not managed by the Advisor. The Board found the services provided by the Advisor to the Fund under the management agreement to be competitive and of high quality.
Costs of Services and Profitability. The Advisor provides detailed information concerning its cost of providing various services to the Fund, its profitability in managing the Fund, its overall profitability, and its financial condition. The Directors have reviewed with the Advisor the methodology used to prepare this financial information. The financial information regarding the Advisor is considered in evaluating the Advisor’s financial condition, its ability to continue to provide services under the management agreement, and the reasonableness of the current management fee. The Board concluded that the Advisor’s profits were reasonable in light of the services provided to the Fund.
Ethics. The Board generally considers the Advisor’s commitment to providing quality services to shareholders and to conducting its business ethically. They noted that the Advisor’s practices generally meet or exceed industry best practices.
Economies of Scale. The Board also reviewed information provided by the Advisor regarding the possible existence of economies of scale in connection with the management of the Fund. The Board concluded that economies of scale are difficult to measure and predict with precision, especially on a fund-by-fund basis. The Board concluded that the Advisor is appropriately sharing economies of scale through its competitive fee structure, offering competitive fees from fund inception, and through reinvestment in its business to provide shareholders additional content and services.
Comparison to Other Funds’ Fees. The management agreement provides that the Fund pay the Advisor a single, all-inclusive (or unified) management fee for providing all services necessary for the management and operation of the Fund, other than brokerage expenses, taxes, interest, extraordinary expenses, and the fees and expenses of the Fund’s independent directors (including their independent legal counsel) and expenses incurred in connection with the provision of shareholder services and distribution services under a plan adopted pursuant to Rule 12b-1 under the 1940 Act. Under the unified fee structure, the Advisor is responsible for providing all investment advisory, custody, audit, administrative, compliance, recordkeeping, marketing and shareholder services, or arranging and supervising third parties to provide such services. By contrast, most other funds are charged a variety of fees, including an investment advisory fee, a transfer agency fee, an administrative fee, distribution charges and other expenses. Other than their investment advisory fees and any applicable Rule 12b-1 distribution fees, all other components of the total fees charged by these other funds may be increased without shareholder approval. The Board believes the unified fee structure is a benefit to Fund shareholders because it clearly discloses to shareholders the cost of owning Fund shares, and, since the unified fee cannot be increased without a vote of Fund shareholders, it shifts to the Advisor the risk of increased costs of operating the Fund and provides a direct incentive to minimize administrative inefficiencies. Part of the Board’s analysis of fee levels involves reviewing certain evaluative data compiled by an independent provider and comparing the Fund’s unified fee to the total expense ratio of other funds in the Fund’s peer group. The Board concluded that the management fee paid by the Fund to the Advisor under the management agreement is reasonable in light of the services provided to the Fund.
Comparison to Fees and Services Provided to Other Clients of the Advisor. The Board also requested and received information from the Advisor concerning the nature of the services, fees, costs and profitability of its advisory services to advisory clients other than the Fund. They observed that these varying types of client accounts require different services and involve different regulatory and entrepreneurial risks than the management of the Fund. The Board analyzed this information and concluded that the fees charged and services provided to the Fund were reasonable by comparison.
Collateral or “Fall-Out” Benefits Derived by the Advisor. The Board considered the existence of collateral benefits the Advisor may receive as a result of its relationship with the Fund. They concluded that the Advisor’s primary business is managing mutual funds and it generally does not use fund or shareholder information to generate profits in other lines of business, and therefore does not derive any significant collateral benefits from them. The Board noted that the Advisor receives proprietary research from broker-dealers that execute fund portfolio transactions and concluded that this research is likely to benefit Fund shareholders. The Board also determined that the Advisor is able to provide investment management services to certain clients other than the Fund, at least in part, due to its existing infrastructure built to serve the fund complex. The Board concluded, however, that the assets of those other clients are not material to the analysis and, where applicable, may be included with the assets of the Fund to determine breakpoints in the management fee schedule.
Existing Relationship. The Board also considered whether there was any reason for not continuing the existing arrangement with the Advisor. In this regard, the Board was mindful of the potential disruptions of the Fund’s operations and various risks, uncertainties, and other effects that could occur as a result of a decision not to continue such relationship. In particular, the Board recognized that most shareholders have invested in the Fund on the strength of the Advisor’s industry standing and reputation and in the expectation that the Advisor will have a continuing role in providing advisory services to the Fund.
Conclusion of the Directors. As a result of this process, the Board, including all of the independent directors and assisted by the advice of independent legal counsel, taking into account all of the factors discussed above and the information provided by the Advisor and others, concluded that the management agreement between the Fund and the Advisor is fair and reasonable in light of the services provided and should be renewed.
Retirement Account Information
As required by law, distributions you receive from certain IRAs are subject to federal income tax withholding, unless you elect not to have withholding apply. Tax will be withheld on the total amount withdrawn even though you may be receiving amounts that are not subject to withholding, such as nondeductible contributions. In such case, excess amounts of withholding could occur. You may adjust your withholding election so that a greater or lesser amount will be withheld.
If you don’t want us to withhold on this amount, you must notify us to not withhold the federal income tax. You may notify us in writing or in certain situations by telephone or through other electronic means. For systematic withdrawals, your withholding election will remain in effect until revoked or changed by filing a new election. You have the right to revoke your election at any time.
Remember, even if you elect not to have income tax withheld, you are liable for paying income tax on the taxable portion of your withdrawal. If you elect not to have income tax withheld or you don’t have enough income tax withheld, you may be responsible for payment of estimated tax. You may incur penalties under the estimated tax rules if your withholding and estimated tax payments are not sufficient. You can reduce or defer the income tax on a distribution by directly or indirectly rolling such distribution over to another IRA or eligible plan. You should consult your tax advisor for additional information.
State tax will be withheld if, at the time of your distribution, your address is within one of the mandatory withholding states and you have federal income tax withheld (or as otherwise required by state law). State taxes will be withheld from your distribution in accordance with the respective state rules.
Distributions you receive from 403(b), 457 and qualified plans are subject to special tax and withholding rules. Your plan administrator or plan sponsor is required to provide you with a special tax notice explaining those rules at the time you request a distribution. If applicable, federal and/or state taxes may be withheld from your distribution amount.
Proxy Voting Guidelines
American Century Investment Management, Inc., the fund’s investment advisor, is responsible for exercising the voting rights associated with the securities purchased and/or held by the fund. A description of the policies and procedures the advisor uses in fulfilling this responsibility is available without charge, upon request, by calling 1-800-345-2021. It is also available on American Century Investments’ website at americancentury.com and on the Securities and Exchange Commission’s website at sec.gov. Information regarding how the investment advisor voted proxies relating to portfolio securities during the most recent 12-month period ended June 30 is available on the “About Us” page at americancentury.com. It is also available at sec.gov.
Quarterly Portfolio Disclosure
The fund files its complete schedule of portfolio holdings with the Securities and Exchange Commission (SEC) for the first and third quarters of each fiscal year on Form N-Q. The fund’s Forms N-Q are available on the SEC’s website at sec.gov, and may be reviewed and copied at the SEC’s Public Reference Room in Washington, DC. Information on the operation of the Public Reference Room may be obtained by calling 1-800-SEC-0330. The fund also makes its complete schedule of portfolio holdings for the most recent quarter of its fiscal year available on its website at americancentury.com and, upon request, by calling 1-800-345-2021.
Other Tax Information
The following information is provided pursuant to provisions of the Internal Revenue Code.
The fund hereby designates up to the maximum amount allowable as qualified dividend income for the fiscal year ended June 30, 2013.
For corporate taxpayers, the fund hereby designates $2,800,850, or up to the maximum amount allowable, of ordinary income distributions paid during the fiscal year ended June 30, 2013 as qualified for the corporate dividends received deduction.
The fund hereby designates $1,527,614 as qualified short-term capital gain distributions for purposes of Internal Revenue Code Section 871.
Contact Us | americancentury.com |
Automated Information Line | 1-800-345-8765 |
Investor Services Representative | 1-800-345-2021
or 816-531-5575 |
Investors Using Advisors | 1-800-378-9878 |
Business, Not-For-Profit, Employer-Sponsored Retirement Plans | 1-800-345-3533 |
Banks and Trust Companies, Broker-Dealers, Financial Professionals, Insurance Companies | 1-800-345-6488 |
Telecommunications Device for the Deaf | 1-800-634-4113 |
American Century Quantitative Equity Funds, Inc.
Investment Advisor:
American Century Investment Management, Inc.
Kansas City, Missouri
This report and the statements it contains are submitted for the general information of our shareholders. The report is not authorized for distribution to prospective investors unless preceded or accompanied by an effective prospectus.
©2013 American Century Proprietary Holdings, Inc. All rights reserved.
CL-ANN-79319 1308
ANNUAL REPORT | JUNE 30, 2013 |
Disciplined Growth Fund
President’s Letter | 2 |
Market Perspective | 3 |
Performance | 4 |
Portfolio Commentary | 6 |
Fund Characteristics | 8 |
Shareholder Fee Example | 9 |
Schedule of Investments | 11 |
Statement of Assets and Liabilities | 14 |
Statement of Operations | 15 |
Statement of Changes in Net Assets | 16 |
Notes to Financial Statements | 17 |
Financial Highlights | 22 |
Report of Independent Registered Public Accounting Firm | 24 |
Management | 25 |
Approval of Management Agreement | 28 |
Additional Information | 33 |
Any opinions expressed in this report reflect those of the author as of the date of the report, and do not necessarily represent the opinions of American Century Investments® or any other person in the American Century Investments organization. Any such opinions are subject to change at any time based upon market or other conditions and American Century Investments disclaims any responsibility to update such opinions. These opinions may not be relied upon as investment advice and, because investment decisions made by American Century Investments funds are based on numerous factors, may not be relied upon as an indication of trading intent on behalf of any American Century Investments fund. Security examples are used for representational purposes only and are not intended as recommendations to purchase or sell securities. Performance information for comparative indices and securities is provided to American Century Investments by third party vendors. To the best of American Century Investments’ knowledge, such information is accurate at the time of printing.
Letter
Jonathan Thomas
Dear Investor:
Thank you for reviewing this annual report for the 12 months ended June 30, 2013. It provides investment performance, market analysis, and portfolio information, presented with the expert perspective of our portfolio management team.
Annual reports remain important vehicles for conveying information about fund returns, including key factors that affected fund performance. For additional, updated investment and market insights, we encourage you to visit our website, americancentury.com.
Generally Favorable Fiscal-Year Returns for U.S. Stocks and High-Yield Bonds
The 12-month reporting period began in the summer of 2012 with uncertainties caused by slowing economies, as well as the upcoming November elections and year-end fiscal deadlines in the U.S. It ended with more uncertainty about the future of U.S. monetary stimulus. In between, aggressive monetary intervention by central banks encouraged investors to take more risk, generally boosting stocks at the expense of government bonds.
U.S. mid-cap, small-cap, and value stock indices achieved performance leadership during the period, outpacing the S&P 500 Index’s 20.60% return. U.S. stocks generally outperformed non-U.S. equities—the MSCI EAFE Index returned 18.62% and the MSCI Emerging Markets Index advanced 2.87%, affected by slowing growth in emerging market economies.
Slower emerging market growth also hindered commodity price gains and helped keep inflation under control. As a result, assets used as inflation hedges, including inflation-indexed securities and precious metals, lagged other assets. Gold, in particular, plunged, starting last October. And Treasury inflation-protected securities (TIPS) were among the lowest performers in the U.S. bond market. Bond index returns generally ranged from approximately 10% gains for U.S. corporate high-yield indices all the way down to negative returns for longer-maturity global Treasury benchmarks.
Despite signs of improvement in 2013, U.S. economic growth is subpar compared with past recession recoveries, and remains vulnerable to threats that could trigger another slowdown and market volatility. Therefore, we continue to believe in a disciplined, diversified, long-term investment approach, using professionally managed stock and bond portfolios—as appropriate—for meeting financial goals. We appreciate your continued trust in us in this volatile environment.
Sincerely,
Jonathan Thomas
President and Chief Executive Officer
American Century Investments
By Scott Wittman, Chief Investment Officer, Asset Allocation and Quantitative Equity
Central Bank Actions, Relative U.S. Economic Gains Drove Stocks Higher
Stock market performance remained robust during the 12-month period ended June 30, 2013. Despite persistent concerns about weak global growth and Europe’s ongoing financial crisis, investors largely focused on central bank stimulus measures and marginally-improving U.S. economic data, which fueled market optimism.
Early in the period, in response to disappointing U.S. economic data, the U.S. Federal Reserve (the Fed) launched its third—and most aggressive—quantitative easing (QE) program, or monthly purchases of $40 billion in government agency mortgage-backed securities. Later in 2012, the Fed expanded the program to include $45 billion in Treasury purchases, bringing its total bond buying to $85 billion per month. This unprecedented program, combined with relatively healthy corporate earnings, significant housing market gains and modest improvements in the labor market, helped keep stocks and other riskier assets in favor.
The Fed rattled the financial markets late in the reporting period, with comments about “tapering” its quantitative easing program. Fed Chairman Ben Bernanke said the central bank could begin scaling back its bond buying later in 2013 if the economy continues to improve. After reaching record highs in May, stocks stumbled in June, following Bernanke’s comments. Late in the month, the Fed toned down its tapering talk, and stocks recovered some of their June losses. Overall, most U.S. stock benchmarks generated stellar 12-month returns, largely aided by strong double-digit gains posted during the first calendar quarter of 2013.
Value Stocks Outpaced Growth Stocks
Across the capitalization spectrum, value stocks were the performance leaders for the 12-month period. Much of this was due to strong one-year returns from the financials and health care sectors, where many value-oriented stocks reside. In particular, expectations for rising interest rates—and the late-quarter rate increase triggered by Fed tapering talk—helped boost returns within the financial sector’s banking industry. At the opposite end, the rate-sensitive utilities sector was the weakest relative performer, held back by the prospect of rising interest rates.
U.S. Stock Index Returns |
For the 12 months ended June 30, 2013 |
Russell 1000 Index (Large-Cap) | 21.24% | | Russell 2000 Index (Small-Cap) | 24.21% |
Russell 1000 Growth Index | 17.07% | | Russell 2000 Growth Index | 23.67% |
Russell 1000 Value Index | 25.32% | | Russell 2000 Value Index | 24.77% |
Russell Midcap Index | 25.41% | | | |
Russell Midcap Growth Index | 22.88% | | | |
Russell Midcap Value Index | 27.65% | | | |
Total Returns as of June 30, 2013 |
| | | | Average Annual Returns | |
| | Ticker Symbol | 1 year | 5 years | Since Inception | Inception Date |
Investor Class | ADSIX | 17.70% | 7.59% | 6.97% | 9/30/05 |
Russell 1000 Growth Index | — | 17.07% | 7.47% | 6.57% | — |
Institutional Class | ADCIX | 17.99% | 7.82% | 7.19% | 9/30/05 |
A Class(1) No sales charge* With sales charge* | ADCVX | 17.42% 10.69% | 7.34% 6.07% | 6.71% 5.89% | 9/30/05 |
C Class | ADCCX | 16.55% | 6.52% | 3.48% | 9/28/07 |
R Class | ADRRX | 17.16% | 7.06% | 6.44% | 9/30/05 |
* | Sales charges include initial sales charges and contingent deferred sales charges (CDSCs), as applicable. A Class shares have a 5.75% maximum initial sales charge and may be subject to a maximum CDSC of 1.00%. C Class shares redeemed within 12 months of purchase are subject to a maximum CDSC of 1.00%. The SEC requires that mutual funds provide performance information net of maximum sales charges in all cases where charges could be applied. |
(1) | Prior to September 4, 2007, the A Class was referred to as the Advisor Class and did not have a front-end sales charge. Performance prior to that date has been adjusted to reflect this charge. |
Data presented reflect past performance. Past performance is no guarantee of future results. Current performance may be higher or lower than the performance shown. Investment return and principal value will fluctuate, and redemption value may be more or less than original cost. To obtain performance data current to the most recent month end, please call 1-800-345-2021 or visit americancentury.com.
Unless otherwise indicated, performance reflects Investor Class shares; performance for other share classes will vary due to differences in fee structure. For information about other share classes available, please consult the prospectus. Data assumes reinvestment of dividends and capital gains, and none of the charts reflect the deduction of taxes that a shareholder would pay on fund distributions or the redemption of fund shares. Returns for the index are provided for comparison. The fund’s total returns include operating expenses (such as transaction costs and management fees) that reduce returns, while the total returns of the index do not.
Growth of $10,000 Over Life of Fund |
$10,000 investment made September 30, 2005 |
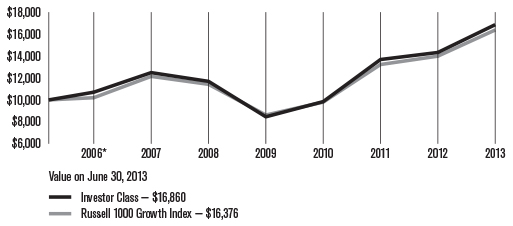
*From 9/30/05, the Investor Class’s inception date. Not annualized.
Total Annual Fund Operating Expenses |
Investor Class | Institutional Class | A Class | C Class | R Class |
1.04% | 0.84% | 1.29% | 2.04% | 1.54% |
The total annual fund operating expenses shown is as stated in the fund’s prospectus current as of the date of this report. The prospectus may vary from the expense ratio shown elsewhere in this report because it is based on a different time period, includes acquired fund fees and expenses, and, if applicable, does not include fee waivers or expense reimbursements.
Data presented reflect past performance. Past performance is no guarantee of future results. Current performance may be higher or lower than the performance shown. Investment return and principal value will fluctuate, and redemption value may be more or less than original cost. To obtain performance data current to the most recent month end, please call 1-800-345-2021 or visit americancentury.com.
Unless otherwise indicated, performance reflects Investor Class shares; performance for other share classes will vary due to differences in fee structure. For information about other share classes available, please consult the prospectus. Data assumes reinvestment of dividends and capital gains, and none of the charts reflect the deduction of taxes that a shareholder would pay on fund distributions or the redemption of fund shares. Returns for the index are provided for comparison. The fund’s total returns include operating expenses (such as transaction costs and management fees) that reduce returns, while the total returns of the index do not.
Portfolio Managers: Bill Martin and Lynette Pang
Performance Summary
Disciplined Growth returned 17.70%* for the fiscal year ended June 30, 2013, compared with the 17.07% return of its benchmark, the Russell 1000 Growth Index, and the 20.60%** return of the broad S&P 500 Index.
In a year of strength for U.S. equity markets (see page 3 for details), Disciplined Growth posted a solid gain for the 12-month period, outperforming the Russell 1000 Growth Index. The fund’s stock selection process incorporates factors of growth, value, quality, and momentum, and is designed to minimize unintended risks along industries and other risk characteristics. The key contribution to performance in the last 12 months came from companies offering attractive growth characteristics at reasonable prices. Momentum insights, particularly with longer horizon signals, failed to gain traction during the year, and quality insights also produced muted results in a strong risk-on environment. Overall, security selection was the main contributor to relative performance, although sector positioning also made a positive contribution.
Absolute Performance Driven by Health Care and Consumer Discretionary
Disciplined Growth’s absolute returns were driven primarily by strong performance in the health care and consumer discretionary sectors, both of which generated double-digit gains. Six of the fund’s top 10 contributors to absolute results came from these sectors. In health care, biotechnology manufacturers Celgene and Amgen, and pharmaceutical giant Bristol-Myers Squibb, were the top absolute contributors. The best consumer discretionary names were home improvement retailer Home Depot, cable provider Comcast, and consumer apparel manufacturer Hanesbrands. No sector posted a decline for the 12-month period.
Materials and Health Care Outperformed
The materials and health care sectors posted the highest contributions to the fund’s excess returns. Materials sector outperformance was driven by strong stock selection in each industry as well as by industry positioning in metals
and mining and chemicals. The single highest contributor in the sector was an out-of-benchmark position in Coeur Mining. Shares of the company gained over 36% during the second half of 2012 on increased production from the company’s silver and gold mines. Against a backdrop of price declines and softening gold prices in early 2013, both quality and momentum indicators weakened, and the fund exited this position in January. An overweight to chemicals manufacturer LyondellBasell Industries also produced strong relative performance after the company appreciated nearly 80% on robust earnings growth over the 12-month period.
Health care was among the strongest performers for the 12-month period, and the fund’s overweight exposure to the sector boosted results. Security selection in a number of industries was beneficial, but none more so than health care equipment and supplies where a number of medical and surgical equipment
* All fund returns referenced in this commentary are for Investor Class shares.
** The S&P 500 Index average annual returns were 7.01% for the five-year period ended June 30, 2013, and 5.74% since the fund’s inception on September 30, 2005.
manufacturers drove results. Top individual contributions came from the fund’s overweight positions in Celgene and global biotechnology tool company Life Technologies. Celgene, also a top absolute contributor during the year, rose 82% on increasing revenue guidance. Life Technologies was another notable contributor, posting gains in excess of 60% after a takeover bid.
Elsewhere in the portfolio, top individual relative contributors included mobile hydraulic manufacturer Sauer-Danfoss, Boeing (which was also a top absolute performer), and property and casualty insurer HCI Group. HCI benefited from strong analyst buy ratings toward the end of the period, while shares of Sauer-Danfoss rose on takeover news in late 2012. Boeing appreciated nearly 45% during the year as aircraft demand increased. The company shows strong quality and growth metrics, as well as above-average valuation signals.
Consumer Discretionary Detracted
The leading detractor from relative returns for the 12-month period was the consumer discretionary sector. Both an underweight to the top-performing sector as well as the fund’s security selection there weighed on overall performance. The biggest individual detractor in the sector was video rental and coin-counting kiosks operator Coinstar (now called Outerwall Inc.). The out-of-benchmark position hurt fund returns as the company’s stock declined during the early part of the period on a weaker-than-expected outlook for the coming year. An overweight to global positioning system maker Garmin was similarly detrimental after shares fell on lower than expected earnings.
Energy was the only other sector to detract from overall results. While no single position was notably weak, small negative contributions from multiple stocks accounted for the modest losses. Noteworthy individual portfolio positions that proved difficult included an overweight to mobile communications and computer manufacturer Apple, which fell over 30%. Similarly, although the fund maintained a position in biopharmaceutical manufacturer Gilead Sciences, our exposure was less than that of the benchmark. This underweight hurt relative results during a period when the company’s shares gained nearly 100%.
A Look Ahead
As we move into the second half of 2013, the U.S. economic recovery seems to be progressing, albeit with headwinds. Improvements in housing, employment, and economic indicators have been consistent and point to slow but positive growth. Driven by improving quality, growth and momentum signals, the fund added financials and consumer discretionary sector stocks to move to a modest overweight, while reducing industrials and telecommunication services exposure. Our disciplined, objective, and systematic investment strategy is designed to take advantage of opportunities at the individual company level. We believe this approach is the most powerful way to capitalize on market inefficiencies that lead to the mispricing of individual stocks.
JUNE 30, 2013 |
Top Ten Holdings | % of net assets |
Apple, Inc. | 4.9% |
Microsoft Corp. | 4.1% |
Google, Inc., Class A | 3.8% |
International Business Machines Corp. | 2.7% |
Home Depot, Inc. (The) | 2.3% |
Oracle Corp. | 2.3% |
QUALCOMM, Inc. | 2.1% |
Amgen, Inc. | 1.7% |
Boeing Co. (The) | 1.6% |
Honeywell International, Inc. | 1.6% |
| | |
Top Five Industries | % of net assets |
Software | 7.8% |
Computers and Peripherals | 6.5% |
Pharmaceuticals | 5.7% |
Specialty Retail | 5.6% |
IT Services | 5.5% |
| | |
Types of Investments in Portfolio | % of net assets |
Common Stocks | 98.7% |
Temporary Cash Investments | 1.2% |
Other Assets and Liabilities | 0.1% |
��
Fund shareholders may incur two types of costs: (1) transaction costs, including sales charges (loads) on purchase payments and redemption/exchange fees; and (2) ongoing costs, including management fees; distribution and service (12b-1) fees; and other fund expenses. This example is intended to help you understand your ongoing costs (in dollars) of investing in your fund and to compare these costs with the ongoing cost of investing in other mutual funds.
The example is based on an investment of $1,000 made at the beginning of the period and held for the entire period from January 1, 2013 to June 30, 2013.
Actual Expenses
The table provides information about actual account values and actual expenses for each class. You may use the information, together with the amount you invested, to estimate the expenses that you paid over the period. First, identify the share class you own. Then simply divide your account value by $1,000 (for example, an $8,600 account value divided by $1,000 = 8.6), then multiply the result by the number under the heading “Expenses Paid During Period” to estimate the expenses you paid on your account during this period.
If you hold Investor Class shares of any American Century Investments fund, or Institutional Class shares of the American Century Diversified Bond Fund, in an American Century Investments account (i.e., not a financial intermediary or retirement plan account), American Century Investments may charge you a $12.50 semiannual account maintenance fee if the value of those shares is less than $10,000. We will redeem shares automatically in one of your accounts to pay the $12.50 fee. In determining your total eligible investment amount, we will include your investments in all personal accounts (including American Century Investments Brokerage accounts) registered under your Social Security number. Personal accounts include individual accounts, joint accounts, UGMA/UTMA accounts, personal trusts, Coverdell Education Savings Accounts and IRAs (including traditional, Roth, Rollover, SEP-, SARSEP- and SIMPLE-IRAs), and certain other retirement accounts. If you have only business, business retirement, employer-sponsored or American Century Investments Brokerage accounts, you are currently not subject to this fee. If you are subject to the Account Maintenance Fee, your account value could be reduced by the fee amount.
Hypothetical Example for Comparison Purposes
The table also provides information about hypothetical account values and hypothetical expenses based on the actual expense ratio of each class of your fund and an assumed rate of return of 5% per year before expenses, which is not the actual return of a fund’s share class. The hypothetical account values and expenses may not be used to estimate the actual ending account balance or expenses you paid for the period. You may use this information to compare the ongoing costs of investing in your fund and other funds. To do so, compare this 5% hypothetical example with the 5% hypothetical examples that appear in the shareholder reports of the other funds.
Please note that the expenses shown in the table are meant to highlight your ongoing costs only and do not reflect any transactional costs, such as sales charges (loads) or redemption/exchange fees. Therefore, the table is useful in comparing ongoing costs only, and will not help you determine the relative total costs of owning different funds. In addition, if these transactional costs were included, your costs would have been higher.
| | | | | |
| | Beginning
Account Value 1/1/13 | Ending
Account Value 6/30/13 | Expenses Paid During Period(1) 1/1/13 – 6/30/13 | Annualized
Expense Ratio(1) |
Actual |
Investor Class | $1,000 | $1,128.50 | $5.44 | 1.03% |
Institutional Class | $1,000 | $1,129.90 | $4.38 | 0.83% |
A Class | $1,000 | $1,126.80 | $6.75 | 1.28% |
C Class | $1,000 | $1,122.30 | $10.68 | 2.03% |
R Class | $1,000 | $1,125.10 | $8.06 | 1.53% |
Hypothetical |
Investor Class | $1,000 | $1,019.69 | $5.16 | 1.03% |
Institutional Class | $1,000 | $1,020.68 | $4.16 | 0.83% |
A Class | $1,000 | $1,018.45 | $6.41 | 1.28% |
C Class | $1,000 | $1,014.73 | $10.14 | 2.03% |
R Class | $1,000 | $1,017.21 | $7.65 | 1.53% |
(1) | Expenses are equal to the class’s annualized expense ratio listed in the table above, multiplied by the average account value over the period, multiplied by 181, the number of days in the most recent fiscal half-year, divided by 365, to reflect the one-half year period. |
JUNE 30, 2013
| | | | | | | |
| | | Shares | | | Value | |
Common Stocks — 98.7% | |
AEROSPACE AND DEFENSE — 4.1% | |
Boeing Co. (The) | | 29,790 | | | $ 3,051,688 | |
Honeywell International, Inc. | | 36,904 | | | 2,927,963 | |
Rockwell Collins, Inc. | | 10,603 | | | 672,336 | |
Textron, Inc. | | 19,756 | | | 514,644 | |
United Technologies Corp. | | 4,902 | | | 455,592 | |
| | | | | | 7,622,223 | |
AIRLINES — 0.6% | |
Allegiant Travel Co. | | 9,819 | | | 1,040,716 | |
BEVERAGES — 2.6% | |
Coca-Cola Co. (The) | | 55,403 | | | 2,222,214 | |
PepsiCo, Inc. | | 31,574 | | | 2,582,438 | |
| | | | | | 4,804,652 | |
BIOTECHNOLOGY — 4.8% | |
Alkermes plc(1) | | 10,722 | | | 307,507 | |
Amgen, Inc. | | 33,047 | | | 3,260,417 | |
Biogen Idec, Inc.(1) | | 3,251 | | | 699,615 | |
Celgene Corp.(1) | | 22,968 | | | 2,685,189 | |
Cubist Pharmaceuticals, Inc.(1) | | 25,730 | | | 1,242,759 | |
Gilead Sciences, Inc.(1) | | 15,070 | | | 771,735 | |
| | | | | | 8,967,222 | |
CAPITAL MARKETS — 1.2% | |
T. Rowe Price Group, Inc. | | 22,362 | | | 1,635,780 | |
Waddell & Reed Financial, Inc., Class A | | 15,181 | | | 660,374 | |
| | | | | | 2,296,154 | |
CHEMICALS — 3.3% | |
CF Industries Holdings, Inc. | | 1,399 | | | 239,928 | |
LyondellBasell Industries NV, Class A | | 1,125 | | | 74,543 | |
Monsanto Co. | | 28,435 | | | 2,809,378 | |
NewMarket Corp. | | 4,472 | | | 1,174,168 | |
PPG Industries, Inc. | | 12,592 | | | 1,843,595 | |
| | | | | | 6,141,612 | |
COMMERCIAL SERVICES AND SUPPLIES — 0.4% | |
Deluxe Corp. | | 22,920 | | | 794,178 | |
COMMUNICATIONS EQUIPMENT — 2.1% | |
QUALCOMM, Inc. | | 64,094 | | | 3,914,862 | |
COMPUTERS AND PERIPHERALS — 6.5% | |
Apple, Inc. | | 23,266 | | | 9,215,197 | |
EMC Corp. | | 102,299 | | | 2,416,302 | |
NetApp, Inc.(1) | | 8,564 | | | 323,548 | |
Western Digital Corp. | | 1,309 | | | 81,276 | |
| | | | | | 12,036,323 | |
CONSUMER FINANCE — 0.2% | |
World Acceptance Corp.(1) | | 3,737 | | | 324,895 | |
CONTAINERS AND PACKAGING — 1.5% | |
Owens-Illinois, Inc.(1) | | 40,690 | | | 1,130,775 | |
Packaging Corp. of America | | 33,208 | | | 1,625,864 | |
| | | | | | 2,756,639 | |
DIVERSIFIED FINANCIAL SERVICES — 1.8% | |
Moody’s Corp. | | 29,719 | | | 1,810,779 | |
MSCI, Inc., Class A(1) | | 44,975 | | | 1,496,318 | |
| | | | | | 3,307,097 | |
DIVERSIFIED TELECOMMUNICATION SERVICES — 1.3% | |
Atlantic Tele-Network, Inc. | | 10,376 | | | 515,272 | |
Verizon Communications, Inc. | | 39,298 | | | 1,978,261 | |
| | | | | | 2,493,533 | |
ELECTRICAL EQUIPMENT — 2.2% | |
Emerson Electric Co. | | 39,804 | | | 2,170,910 | |
EnerSys | | 6,079 | | | 298,114 | |
Rockwell Automation, Inc. | | 20,149 | | | 1,675,188 | |
| | | | | | 4,144,212 | |
ENERGY EQUIPMENT AND SERVICES — 0.5% | |
RPC, Inc. | | 13,103 | | | 180,952 | |
Schlumberger Ltd. | | 11,553 | | | 827,888 | |
| | | | | | 1,008,840 | |
FOOD AND STAPLES RETAILING — 3.2% | |
CVS Caremark Corp. | | 32,240 | | | 1,843,483 | |
Kroger Co. (The) | | 26,787 | | | 925,223 | |
Rite Aid Corp.(1) | | 266,054 | | | 760,915 | |
Safeway, Inc. | | 60,232 | | | 1,425,089 | |
Wal-Mart Stores, Inc. | | 13,969 | | | 1,040,551 | |
| | | | | | 5,995,261 | |
FOOD PRODUCTS — 2.2% | |
General Mills, Inc. | | 41,895 | | | 2,033,164 | |
Ingredion, Inc. | | 21,009 | | | 1,378,611 | |
Sanderson Farms, Inc. | | 10,354 | | | 687,713 | |
| | | | | | 4,099,488 | |
HEALTH CARE EQUIPMENT AND SUPPLIES — 3.9% | |
Abbott Laboratories | | 54,374 | | | 1,896,565 | |
Becton Dickinson and Co. | | 19,793 | | | 1,956,142 | |
Medtronic, Inc. | | 15,626 | | | 804,270 | |
St. Jude Medical, Inc. | | 43,080 | | | 1,965,740 | |
Zimmer Holdings, Inc. | | 8,325 | | | 623,876 | |
| | | | | | 7,246,593 | |
HEALTH CARE PROVIDERS AND SERVICES — 1.0% | |
AmerisourceBergen Corp. | | 32,141 | | | 1,794,432 | |
HOTELS, RESTAURANTS AND LEISURE — 2.3% | |
Bally Technologies, Inc.(1) | | 29,057 | | | $ 1,639,396 | |
Cracker Barrel Old Country Store, Inc. | | 5,058 | | | 478,790 | |
International Game Technology | | 67,029 | | | 1,120,055 | |
Las Vegas Sands Corp. | | 3,469 | | | 183,614 | |
McDonald’s Corp. | | 8,840 | | | 875,160 | |
| | | | | | 4,297,015 | |
HOUSEHOLD DURABLES — 0.2% | |
Garmin Ltd. | | 9,665 | | | 349,486 | |
HOUSEHOLD PRODUCTS — 0.1% | |
Kimberly-Clark Corp. | | 2,608 | | | 253,341 | |
INDUSTRIAL CONGLOMERATES — 1.5% | |
3M Co. | | 1,419 | | | 155,168 | |
Carlisle Cos., Inc. | | 14,158 | | | 882,185 | |
Danaher Corp. | | 29,223 | | | 1,849,816 | |
| | | | | | 2,887,169 | |
INSURANCE — 2.3% | |
Amtrust Financial Services, Inc. | | 19,325 | | | 689,902 | |
First American Financial Corp. | | 6,598 | | | 145,420 | |
HCI Group, Inc. | | 51,222 | | | 1,573,540 | |
Travelers Cos., Inc. (The) | | 22,474 | | | 1,796,122 | |
| | | | | | 4,204,984 | |
INTERNET AND CATALOG RETAIL — 1.7% | |
Amazon.com, Inc.(1) | | 2,839 | | | 788,362 | |
Expedia, Inc. | | 22,609 | | | 1,359,932 | |
HomeAway, Inc.(1) | | 29,392 | | | 950,537 | |
| | | | | | 3,098,831 | |
INTERNET SOFTWARE AND SERVICES — 4.7% | |
Google, Inc., Class A(1) | | 8,081 | | | 7,114,270 | |
LinkedIn Corp., Class A(1) | | 9,447 | | | 1,684,400 | |
| | | | | | 8,798,670 | |
IT SERVICES — 5.5% | |
Accenture plc, Class A | | 34,916 | | | 2,512,556 | |
Broadridge Financial Solutions, Inc. | | 16,459 | | | 437,480 | |
International Business Machines Corp. | | 25,893 | | | 4,948,411 | |
Jack Henry & Associates, Inc. | | 5,463 | | | 257,471 | |
MasterCard, Inc., Class A | | 2,400 | | | 1,378,800 | |
Visa, Inc., Class A | | 3,692 | | | 674,713 | |
| | | | | | 10,209,431 | |
LEISURE EQUIPMENT AND PRODUCTS — 2.7% | |
Hasbro, Inc. | | 34,604 | | | 1,551,297 | |
Mattel, Inc. | | 38,079 | | | 1,725,359 | |
Polaris Industries, Inc. | | 17,898 | | | 1,700,310 | |
Sturm Ruger & Co., Inc. | | 867 | | | 41,651 | |
| | | | | | 5,018,617 | |
MACHINERY — 0.8% | |
Ingersoll-Rand plc | | 19,555 | | | 1,085,694 | |
Lindsay Corp. | | 6,475 | | | 485,495 | |
| | | | | | 1,571,189 | |
MEDIA — 2.8% | |
Comcast Corp., Class A | | 68,782 | | | 2,880,590 | |
DIRECTV(1) | | 3,158 | | | 194,596 | |
Time Warner Cable, Inc. | | 18,377 | | | 2,067,045 | |
| | | | | | 5,142,231 | |
MULTILINE RETAIL — 0.8% | |
Macy’s, Inc. | | 11,544 | | | 554,112 | |
Target Corp. | | 13,195 | | | 908,608 | |
| | | | | | 1,462,720 | |
OIL, GAS AND CONSUMABLE FUELS — 1.7% | |
Alon USA Energy, Inc. | | 28,515 | | | 412,327 | |
CVR Energy, Inc. | | 28,832 | | | 1,366,637 | |
Western Refining, Inc. | | 46,421 | | | 1,303,037 | |
| | | | | | 3,082,001 | |
PERSONAL PRODUCTS — 1.2% | |
Medifast, Inc.(1) | | 19,416 | | | 500,156 | |
USANA Health Sciences, Inc.(1) | | 23,318 | | | 1,687,757 | |
| | | | | | 2,187,913 | |
PHARMACEUTICALS — 5.7% | |
AbbVie, Inc. | | 45,724 | | | 1,890,230 | |
Allergan, Inc. | | 23,091 | | | 1,945,186 | |
Bristol-Myers Squibb Co. | | 51,331 | | | 2,293,982 | |
Eli Lilly & Co. | | 38,569 | | | 1,894,509 | |
Johnson & Johnson | | 31,168 | | | 2,676,085 | |
| | | | | | 10,699,992 | |
PROFESSIONAL SERVICES — 0.2% | |
Kforce, Inc. | | 11,229 | | | 163,943 | |
RPX Corp.(1) | | 12,036 | | | 202,205 | |
| | | | | | 366,148 | |
ROAD AND RAIL — 0.4% | |
Swift Transportation Co.(1) | | 34,997 | | | 578,850 | |
Union Pacific Corp. | | 1,196 | | | 184,519 | |
| | | | | | 763,369 | |
SEMICONDUCTORS AND SEMICONDUCTOR EQUIPMENT — 3.7% | |
Analog Devices, Inc. | | 31,735 | | | 1,429,979 | |
Broadcom Corp., Class A | | 49,747 | | | 1,679,459 | |
Intel Corp. | | 25,545 | | | 618,700 | |
Skyworks Solutions, Inc.(1) | | 42,443 | | | 929,077 | |
Texas Instruments, Inc. | | 67,044 | | | 2,337,824 | |
| | | | | | 6,995,039 | |
SOFTWARE — 7.8% | |
CA, Inc. | | 21,862 | | | $ 625,909 | |
Intuit, Inc. | | 31,786 | | | 1,939,899 | |
Microsoft Corp. | | 219,851 | | | 7,591,455 | |
Oracle Corp. | | 136,543 | | | 4,194,601 | |
Synopsys, Inc.(1) | | 7,593 | | | 271,450 | |
| | | | | | 14,623,314 | |
SPECIALTY RETAIL — 5.6% | |
American Eagle Outfitters, Inc. | | 61,362 | | | 1,120,470 | |
Buckle, Inc. (The) | | 10,056 | | | 523,113 | |
Gap, Inc. (The) | | 48,781 | | | 2,035,631 | |
Home Depot, Inc. (The) | | 54,967 | | | 4,258,294 | |
Lowe’s Cos., Inc. | | 22,790 | | | 932,111 | |
PetSmart, Inc. | | 24,478 | | | 1,639,781 | |
| | | | | | 10,509,400 | |
TEXTILES, APPAREL AND LUXURY GOODS — 1.8% | |
Hanesbrands, Inc. | | 31,058 | | | 1,597,003 | |
Ralph Lauren Corp. | | 9,653 | | | 1,677,112 | |
| | | | | | 3,274,115 | |
THRIFTS AND MORTGAGE FINANCE — 0.8% | |
Ocwen Financial Corp.(1) | | 37,280 | | | 1,536,682 | |
TOBACCO — 1.0% | |
Philip Morris International, Inc. | | 20,864 | | | 1,807,240 | |
TOTAL COMMON STOCKS (Cost $166,455,076) | | | 183,927,829 | |
Temporary Cash Investments — 1.2% | |
Repurchase Agreement, Bank of America Merrill Lynch, (collateralized by various
U.S. Treasury obligations, 1.00%, 1/15/14, valued at $290,649), in a joint trading
account at 0.06%, dated 6/28/13, due 7/1/13 (Delivery value $284,704) | | | 284,703 | |
Repurchase Agreement, Credit Suisse First Boston, Inc., (collateralized by various U.S. Treasury obligations, 4.25%, 11/15/40, valued at $870,250), in a joint trading
account at 0.05%, dated 6/28/13, due 7/1/13 (Delivery value $854,115) | | | 854,111 | |
Repurchase Agreement, Goldman Sachs & Co., (collateralized by various U.S. Treasury obligations, 3.125%, 11/15/41, valued at $289,583), in a joint trading account at 0.04%, dated 6/28/13, due 7/1/13 (Delivery value $284,705) | | | 284,704 | |
SSgA U.S. Government Money Market Fund | | 785,582 | | | 785,582 | |
TOTAL TEMPORARY CASH INVESTMENTS (Cost $2,209,100) | | | 2,209,100 | |
TOTAL INVESTMENT SECURITIES — 99.9% (Cost $168,664,176) | | | 186,136,929 | |
OTHER ASSETS AND LIABILITIES — 0.1% | | | 197,269 | |
TOTAL NET ASSETS — 100.0% | | | $186,334,198 | |
Notes to Schedule of Investments
See Notes to Financial Statements.
Statement of Assets and Liabilities |
| | |
JUNE 30, 2013 | |
Assets | |
Investment securities, at value (cost of $168,664,176) | | $186,136,929 | |
Receivable for capital shares sold | | 629,482 | |
Dividends and interest receivable | | 120,072 | |
| | | 186,886,483 | |
| | | | |
Liabilities | | | |
Payable for capital shares redeemed | | 379,555 | |
Accrued management fees | | 152,339 | |
Distribution and service fees payable | | 20,391 | |
| | | 552,285 | |
| | | | |
Net Assets | | $186,334,198 | |
| | | | |
Net Assets Consist of: | | | |
Capital (par value and paid-in surplus) | | $163,284,246 | |
Undistributed net investment income | | 32,350 | |
Undistributed net realized gain | | 5,544,849 | |
Net unrealized appreciation | | 17,472,753 | |
| | | $186,334,198 | |
| | | | |
| | Net assets | Shares outstanding | Net asset value per share |
Investor Class, $0.01 Par Value | $109,365,781 | 7,026,467 | $15.56 |
Institutional Class, $0.01 Par Value | $10,123,613 | 649,004 | $15.60 |
A Class, $0.01 Par Value | $51,897,132 | 3,343,419 | $15.52* |
C Class, $0.01 Par Value | $9,579,558 | 632,569 | $15.14 |
R Class, $0.01 Par Value | $5,368,114 | 348,736 | $15.39 |
*Maximum offering price $16.47 (net asset value divided by 0.9425). |
See Notes to Financial Statements.
YEAR ENDED JUNE 30, 2013 | |
Investment Income (Loss) | |
Income: | | | |
Dividends (net of foreign taxes withheld of $9,136) | | $ 2,527,427 | |
Interest | | 1,939 | |
| | | 2,529,366 | |
| | | | |
Expenses: | | | |
Management fees | | 1,225,527 | |
Distribution and service fees: | | | |
A Class | | 81,815 | |
C Class | | 59,799 | |
R Class | | 16,817 | |
Directors’ fees and expenses | | 7,210 | |
| | | 1,391,168 | |
| | | | |
Net investment income (loss) | | 1,138,198 | |
| | | | |
Realized and Unrealized Gain (Loss) | |
Net realized gain (loss) on: | | | |
Investment transactions | | 8,144,384 | |
Foreign currency transactions | | 70 | |
| | | 8,144,454 | |
| | | | |
Change in net unrealized appreciation (depreciation) on investments | | 9,207,526 | |
| | | | |
Net realized and unrealized gain (loss) | | 17,351,980 | |
| | | | |
Net Increase (Decrease) in Net Assets Resulting from Operations | | $18,490,178 | |
See Notes to Financial Statements.
Statement of Changes in Net Assets |
YEARS ENDED JUNE 30, 2013 AND JUNE 30, 2012 | |
Increase (Decrease) in Net Assets | | June 30, 2013 | | | June 30, 2012 | |
Operations | |
Net investment income (loss) | | $ 1,138,198 | | | $ 380,826 | |
Net realized gain (loss) | | 8,144,454 | | | (1,151,763 | ) |
Change in net unrealized appreciation (depreciation) | | 9,207,526 | | | 3,130,433 | |
Net increase (decrease) in net assets resulting from operations | | 18,490,178 | | | 2,359,496 | |
| | | | | | | |
Distributions to Shareholders | |
From net investment income: | | | | | | |
Investor Class | | (916,204 | ) | | (212,216 | ) |
Institutional Class | | (55,374 | ) | | (4,207 | ) |
A Class | | (269,562 | ) | | (19,403 | ) |
R Class | | (16,303 | ) | | (97 | ) |
Decrease in net assets from distributions | | (1,257,443 | ) | | (235,923 | ) |
| | | | | | | |
Capital Share Transactions | |
Net increase (decrease) in net assets from capital share transactions | | 90,430,843 | | | 38,209,077 | |
| | | | | | | |
Net increase (decrease) in net assets | | 107,663,578 | | | 40,332,650 | |
| | | | | | | |
Net Assets | |
Beginning of period | | 78,670,620 | | | 38,337,970 | |
End of period | | $186,334,198 | | | $78,670,620 | |
| | | | | | | |
Undistributed net investment income | | $32,350 | | | $173,326 | |
See Notes to Financial Statements.
Notes to Financial Statements |
JUNE 30, 2013
1. Organization
American Century Quantitative Equity Funds, Inc. (the corporation) is registered under the Investment Company Act of 1940, as amended (the 1940 Act), as an open-end management investment company and is organized as a Maryland corporation. Disciplined Growth Fund (the fund) is one fund in a series issued by the corporation. The fund is diversified as defined under the 1940 Act. The fund’s investment objective is to seek long-term capital growth.
The fund offers the Investor Class, the Institutional Class, the A Class, the C Class and the R Class. The A Class may incur an initial sales charge. The A Class and C Class may be subject to a contingent deferred sales charge. The share classes differ principally in their respective sales charges and distribution and shareholder servicing expenses and arrangements. The Institutional Class is made available to institutional shareholders or through financial intermediaries whose clients do not require the same level of shareholder and administrative services as shareholders of other classes. As a result, the Institutional Class is charged a lower unified management fee. On October 21, 2011, all outstanding B Class shares were converted to A Class shares and the fund discontinued offering the B Class.
2. Significant Accounting Policies
The following is a summary of significant accounting policies consistently followed by the fund in preparation of its financial statements. The financial statements are prepared in conformity with accounting principles generally accepted in the United States of America, which may require management to make certain estimates and assumptions at the date of the financial statements. Actual results could differ from these estimates.
Investment Valuations — The fund determines the fair value of its investments and computes its net asset value per share as of the close of regular trading (usually 4 p.m. Eastern time) on the New York Stock Exchange (NYSE) on each day the NYSE is open.
Equity securities that are listed or traded on a domestic securities exchange are valued at the last reported sales price or at the official closing price as provided by the exchange. Equity securities traded on foreign securities exchanges are typically valued at the closing price on the exchange where primarily traded or as of the close of the NYSE, if that is earlier. If no last sales price is reported, or if local convention or regulation so provides, the mean of the latest bid and asked prices is used. Depending on local convention or regulation, securities traded over-the-counter are valued at the mean of the latest bid and asked prices, the last sales price, or the official closing price. In its determination of fair value, the fund may review several factors including: market information specific to a security; news developments in U.S. and foreign markets; the performance of particular U.S. and foreign securities, indices, comparable securities, American Depositary Receipts, Exchange-Traded Funds, and other relevant market indicators.
Debt securities maturing within 60 days at the time of purchase may be valued at cost, plus or minus any amortized discount or premium or at the evaluated mean as provided by an independent pricing service. Evaluated mean prices are commonly derived through utilization of market models, which may consider, among other factors, trade data, quotations from dealers and active market makers, relevant yield curve and spread data, related sector levels, creditworthiness, and other relevant market information on the same or comparable securities.
Investments in open-end management investment companies are valued at the reported net asset value per share. Repurchase agreements are valued at cost.
The value of investments initially expressed in foreign currencies is translated into U.S. dollars at prevailing exchange rates.
If the fund determines that the market price for a portfolio security is not readily available or the valuation methods mentioned above do not reflect a security’s fair value, such security is valued as determined in good faith by the Board of Directors or its designee, in accordance with procedures adopted by the Board of Directors. Circumstances that may cause the fund to use these procedures to value a security include, but are not limited to: a security has been declared in default; trading in a security has been halted during the trading day; there is a foreign market holiday and no trading occurred; or an event occurred between the close of a foreign exchange and the NYSE that may affect the value of a security.
Security Transactions — Security transactions are accounted for as of the trade date. Net realized gains and losses are determined on the identified cost basis, which is also used for federal income tax purposes.
Investment Income — Dividend income less foreign taxes withheld, if any, is recorded as of the ex-dividend date. Distributions received on securities that represent a return of capital or long-term capital gain are recorded as a reduction of cost of investments and/or as a realized gain. The fund may estimate the components of distributions received that may be considered nontaxable distributions or long-term capital gain distributions for income tax purposes. Interest income is recorded on the accrual basis and includes accretion of discounts and amortization of premiums.
Foreign Currency Translations — All assets and liabilities initially expressed in foreign currencies are translated into U.S. dollars at prevailing exchange rates at period end. The fund may enter into spot foreign currency exchange contracts to facilitate transactions denominated in a foreign currency. Purchases and sales of investment securities, dividend and interest income, spot foreign currency exchange contracts, and expenses are translated at the rates of exchange prevailing on the respective dates of such transactions. Net realized and unrealized foreign currency exchange gains or losses related to investment securities are a component of net realized gain (loss) on investment transactions and change in net unrealized appreciation (depreciation) on investments, respectively.
Repurchase Agreements — The fund may enter into repurchase agreements with institutions that American Century Investment Management, Inc. (ACIM) (the investment advisor) has determined are creditworthy pursuant to criteria adopted by the Board of Directors. The fund requires that the collateral, represented by securities, received in a repurchase transaction be transferred to the custodian in a manner sufficient to enable the fund to obtain those securities in the event of a default under the repurchase agreement. ACIM monitors, on a daily basis, the securities transferred to ensure the value, including accrued interest, of the securities under each repurchase agreement is equal to or greater than amounts owed to the fund under each repurchase agreement.
Joint Trading Account — Pursuant to an Exemptive Order issued by the Securities and Exchange Commission, the fund, along with certain other funds in the American Century Investments family of funds, may transfer uninvested cash balances into a joint trading account. These balances are invested in one or more repurchase agreements that are collateralized by U.S. Treasury or Agency obligations.
Income Tax Status — It is the fund’s policy to distribute substantially all net investment income and net realized gains to shareholders and to otherwise qualify as a regulated investment company under provisions of the Internal Revenue Code. Accordingly, no provision has been made for income taxes. The fund files U.S. federal, state, local and non-U.S. tax returns as applicable. The fund’s tax returns are subject to examination by the relevant taxing authority until expiration of the applicable statute of limitations, which is generally three years from the date of filing but can be longer in certain jurisdictions. At this time, management believes there are no uncertain tax positions which, based on their technical merit, would not be sustained upon examination and for which it is reasonably possible that the total amounts of unrecognized tax benefits will significantly change in the next twelve months.
Multiple Class — All shares of the fund represent an equal pro rata interest in the net assets of the class to which such shares belong, and have identical voting, dividend, liquidation and other rights and the same terms and conditions, except for class specific expenses and exclusive rights to vote on matters affecting only individual classes. Income, non-class specific expenses, and realized and unrealized capital gains and losses of the fund are allocated to each class of shares based on their relative net assets.Distributions to Shareholders — Distributions from net investment income, if any, are generally declared and paid semiannually. Distributions from net realized gains, if any, are generally declared and paid annually.
Indemnifications — Under the corporation’s organizational documents, its officers and directors are indemnified against certain liabilities arising out of the performance of their duties to the fund. In addition, in the normal course of business, the fund enters into contracts that provide general indemnifications. The maximum exposure under these arrangements is unknown as this would involve future claims that may be made against a fund. The risk of material loss from such claims is considered by management to be remote.
3. Fees and Transactions with Related Parties
Management Fees — The corporation has entered into a management agreement with ACIM, under which ACIM provides the fund with investment advisory and management services in exchange for a single, unified management fee (the fee) per class. The agreement provides that all expenses of managing and operating the fund, except distribution and service fees, brokerage expenses, taxes, interest, fees and expenses of the independent directors (including legal counsel fees), and extraordinary expenses, will be paid by ACIM. The fee is computed and accrued daily based on each class’s daily net assets and paid monthly in arrears. The fee consists of (1) an Investment Category Fee based on the daily net assets of the fund and certain other accounts managed by the investment advisor that are in the same broad investment category as the fund and (2) a Complex Fee based on the assets of all the funds in the American Century Investments family of funds. The rates for the Investment Category Fee range from 0.6880% to 0.8700%. The rates for the Complex Fee range from 0.2500% to 0.3100% for the Investor Class, A Class, C Class and R Class. The Institutional Class is 0.2000% less at each point within the Complex Fee range. The effective annual management fee for each class for the year ended June 30, 2013 was 1.02% for the Investor Class, A Class, C Class and R Class and 0.82% for the Institutional Class.
Distribution and Service Fees — The Board of Directors has adopted a separate Master Distribution and Individual Shareholder Services Plan for each of the A Class, C Class and R Class (collectively the plans), pursuant to Rule 12b-1 of the 1940 Act. The plans provide that the A Class will pay American Century Investment Services, Inc. (ACIS) an annual distribution and service fee of 0.25%. The plans provide that the C Class will pay ACIS an annual distribution and service fee of 1.00%, of which 0.25% is paid for individual shareholder services and 0.75% is paid for distribution services. The plans provide that the R Class will pay ACIS an annual distribution and service fee of 0.50%. The fees are computed and accrued daily based on each class’s daily net assets and paid monthly in arrears. The fees are used to pay financial intermediaries for distribution and individual shareholder services. Fees incurred under the plans during the year ended June 30, 2013 are detailed in the Statement of Operations.
Related Parties — Certain officers and directors of the corporation are also officers and/or directors of American Century Companies, Inc. (ACC). The corporation’s investment advisor, ACIM, the corporation’s distributor, ACIS, and the corporation’s transfer agent, American Century Services, LLC are wholly owned, directly or indirectly, by ACC.
4. Investment Transactions
Purchases and sales of investment securities, excluding short-term investments, for the year ended June 30, 2013 were $201,527,268 and $112,698,255, respectively.
5. Capital Share Transactions
Transactions in shares of the fund were as follows:
| | | | | | | |
| | | Year ended June 30, 2013 | | | Year ended June 30, 2012 | |
| | | Shares | | | Amount | | | Shares | | | Amount | |
Investor Class/Shares Authorized | | 50,000,000 | | | | | | 50,000,000 | | | | |
Sold | | 4,258,230 | | | $ 63,225,442 | | | 3,578,682 | | | $ 46,180,344 | |
Issued in reinvestment of distributions | | 62,561 | | | 901,365 | | | 17,243 | | | 209,676 | |
Redeemed | | (1,612,468 | ) | | (23,296,506 | ) | | (1,725,812 | ) | | (21,732,668 | ) |
| | | 2,708,323 | | | 40,830,301 | | | 1,870,113 | | | 24,657,352 | |
Institutional Class/Shares Authorized | | 10,000,000 | | | | | | 10,000,000 | | | | |
Sold | | 664,297 | | | 10,129,591 | | | 32,264 | | | 419,527 | |
Issued in reinvestment of distributions | | 3,697 | | | 55,374 | | | 346 | | | 4,207 | |
Redeemed | | (84,401 | ) | | (1,253,578 | ) | | (207,473 | ) | | (2,522,693 | ) |
| | | 583,593 | | | 8,931,387 | | | (174,863 | ) | | (2,098,959 | ) |
A Class/Shares Authorized | | 10,000,000 | | | | | | 10,000,000 | | | | |
Sold | | 2,573,486 | | | 37,454,410 | | | 1,100,809 | | | 14,250,995 | |
Issued in reinvestment of distributions | | 18,265 | | | 262,997 | | | 1,565 | | | 18,988 | |
Redeemed | | (428,107 | ) | | (6,315,309 | ) | | (159,101 | ) | | (2,008,105 | ) |
| | | 2,163,644 | | | 31,402,098 | | | 943,273 | | | 12,261,878 | |
B Class/Shares Authorized | | N/A | | | | | | N/A | | | | |
Redeemed | | | | | | | | (8,382 | ) | | (97,146 | ) |
C Class/Shares Authorized | | 10,000,000 | | | | | | 10,000,000 | | | | |
Sold | | 465,146 | | | 6,674,767 | | | 269,754 | | | 3,378,081 | |
Redeemed | | (93,436 | ) | | (1,357,370 | ) | | (22,213 | ) | | (292,954 | ) |
| | | 371,710 | | | 5,317,397 | | | 247,541 | | | 3,085,127 | |
R Class/Shares Authorized | | 10,000,000 | | | | | | 10,000,000 | | | | |
Sold | | 337,570 | | | 4,761,451 | | | 73,366 | | | 928,543 | |
Issued in reinvestment of distributions | | 1,159 | | | 16,303 | | | 8 | | | 97 | |
Redeemed | | (57,956 | ) | | (828,094 | ) | | (44,265 | ) | | (527,815 | ) |
| | | 280,773 | | | 3,949,660 | | | 29,109 | | | 400,825 | |
Net increase (decrease) | | 6,108,043 | | | $ 90,430,843 | | | 2,906,791 | | | $ 38,209,077 | |
6. Fair Value Measurements
The fund’s securities valuation process is based on several considerations and may use multiple inputs to determine the fair value of the positions held by the fund. In conformity with accounting principles generally accepted in the United States of America, the inputs used to determine a valuation are classified into three broad levels as follows:
• | Level 1 valuation inputs consist of unadjusted quoted prices in an active market for identical securities; |
• | Level 2 valuation inputs consist of direct or indirect observable market data (including quoted prices for similar securities, evaluations of subsequent market events, interest rates, prepayment speeds, credit risk, etc.); or |
• | Level 3 valuation inputs consist of unobservable data (including a fund’s own assumptions). |
The level classification is based on the lowest level input that is significant to the fair valuation measurement. The valuation inputs are not necessarily an indication of the risks associated with investing in these securities or other financial instruments.
The following is a summary of the level classifications as of period end. The Schedule of Investments provides additional information on the fund’s portfolio holdings.
| | | | |
| | Level 1 | Level 2 | Level 3 |
Investment Securities |
Common Stocks | $183,927,829 | — | — |
Temporary Cash Investments | 785,582 | $1,423,518 | — |
Total Value of Investment Securities | $184,713,411 | $1,423,518 | — |
7. Federal Tax Information
The tax character of distributions paid during the years ended June 30, 2013 and June 30, 2012 were as follows:
| | | | | | | |
| | | 2013 | | | 2012 | |
Distributions Paid From | |
Ordinary income | | $1,257,443 | | | $235,923 | |
Long-term capital gains | | — | | | — | |
The book-basis character of distributions made during the year from net investment income or net realized gains may differ from their ultimate characterization for federal income tax purposes. These differences reflect the differing character of certain income items and net realized gains and losses for financial statement and tax purposes, and may result in reclassification among certain capital accounts on the financial statements.
As of June 30, 2013, the federal tax cost of investments and the components of distributable earnings on a tax-basis were as follows:
| | | | |
Federal tax cost of investments | | $169,311,551 | |
Gross tax appreciation of investments | | $18,837,041 | |
Gross tax depreciation of investments | | (2,011,663 | ) |
Net tax appreciation (depreciation) of investments | | $16,825,378 | |
Undistributed ordinary income | | $3,626,250 | |
Accumulated long-term gains | | $2,598,324 | |
The difference between book-basis and tax-basis unrealized appreciation (depreciation) is attributable primarily to the tax deferral of losses on wash sales.
| |
For a Share Outstanding Throughout the Years Ended June 30 (except as noted) |
Per-Share Data | Ratios and Supplemental Data |
| | | Income From Investment Operations: | | | | Ratio to Average Net Assets of: | | |
| | Net Asset
Value,
Beginning
of Period | Net Investment Income (Loss)(1) | Net Realized
and Unrealized Gain (Loss) | Total From Investment Operations | Distributions
From Net Investment Income | Net Asset Value, End of Period | Total Return(2) | Operating Expenses | Net Investment Income (Loss) | Portfolio
Turnover Rate | Net Assets,
End of Period
(in thousands) |
Investor Class |
2013 | $13.38 | 0.16 | 2.19 | 2.35 | (0.17) | $15.56 | 17.70% | 1.03% | 1.07% | 94% | $109,366 |
2012 | $12.85 | 0.09 | 0.50 | 0.59 | (0.06) | $13.38 | 4.68% | 1.04% | 0.73% | 94% | $57,780 |
2011 | $9.27 | 0.04 | 3.57 | 3.61 | (0.03) | $12.85 | 39.00% | 1.04% | 0.37% | 117% | $31,450 |
2010 | $8.01 | 0.04 | 1.27 | 1.31 | (0.05) | $9.27 | 16.35% | 1.05% | 0.46% | 84% | $12,787 |
2009 | $11.12 | 0.04 | (3.12) | (3.08) | (0.03) | $8.01 | (27.63)% | 1.05% | 0.44% | 98% | $10,440 |
Institutional Class |
2013 | $13.42 | 0.19 | 2.20 | 2.39 | (0.21) | $15.60 | 17.99% | 0.83% | 1.27% | 94% | $10,124 |
2012 | $12.89 | 0.10 | 0.52 | 0.62 | (0.09) | $13.42 | 4.87% | 0.84% | 0.93% | 94% | $878 |
2011 | $9.30 | 0.06 | 3.59 | 3.65 | (0.06) | $12.89 | 39.26% | 0.84% | 0.57% | 117% | $3,097 |
2010 | $8.03 | 0.06 | 1.28 | 1.34 | (0.07) | $9.30 | 16.67% | 0.85% | 0.66% | 84% | $2,152 |
2009 | $11.15 | 0.05 | (3.12) | (3.07) | (0.05) | $8.03 | (27.50)% | 0.85% | 0.64% | 98% | $2,265 |
A Class |
2013 | $13.33 | 0.12 | 2.19 | 2.31 | (0.12) | $15.52 | 17.42% | 1.28% | 0.82% | 94% | $51,897 |
2012 | $12.80 | 0.07 | 0.49 | 0.56 | (0.03) | $13.33 | 4.44% | 1.29% | 0.48% | 94% | $15,726 |
2011 | $9.23 | 0.02 | 3.55 | 3.57 | —(3) | $12.80 | 38.71% | 1.29% | 0.12% | 117% | $3,026 |
2010 | $7.98 | 0.02 | 1.26 | 1.28 | (0.03) | $9.23 | 16.00% | 1.30% | 0.21% | 84% | $661 |
2009 | $11.07 | 0.02 | (3.09) | (3.07) | (0.02) | $7.98 | (27.76)% | 1.30% | 0.19% | 98% | $408 |
| |
For a Share Outstanding Throughout the Years Ended June 30 (except as noted) |
Per-Share Data | Ratios and Supplemental Data |
| | | Income From Investment Operations: | | | | Ratio to Average Net Assets of: | | |
| | Net Asset
Value,
Beginning
of Period | Net Investment Income (Loss)(1) | Net Realized
and Unrealized Gain (Loss) | Total From Investment Operations | Distributions
From Net Investment Income | Net Asset Value, End of Period | Total Return(2) | Operating Expenses | Net Investment Income (Loss) | Portfolio
Turnover Rate | Net Assets,
End of Period
(in thousands) |
C Class |
2013 | $12.99 | 0.01 | 2.14 | 2.15 | — | $15.14 | 16.55% | 2.03% | 0.07% | 94% | $9,580 |
2012 | $12.53 | (0.03) | 0.49 | 0.46 | — | $12.99 | 3.67% | 2.04% | (0.27)% | 94% | $3,389 |
2011 | $9.11 | (0.07) | 3.49 | 3.42 | — | $12.53 | 37.54% | 2.04% | (0.63)% | 117% | $167 |
2010 | $7.91 | (0.05) | 1.25 | 1.20 | — | $9.11 | 15.17% | 2.05% | (0.54)% | 84% | $41 |
2009 | $11.04 | (0.04) | (3.09) | (3.13) | — | $7.91 | (28.35)% | 2.05% | (0.56)% | 98% | $54 |
R Class |
2013 | $13.20 | 0.09 | 2.17 | 2.26 | (0.07) | $15.39 | 17.16% | 1.53% | 0.57% | 94% | $5,368 |
2012 | $12.68 | 0.02 | 0.50 | 0.52 | —(3) | $13.20 | 4.13% | 1.54% | 0.23% | 94% | $897 |
2011 | $9.17 | (0.01) | 3.52 | 3.51 | — | $12.68 | 38.28% | 1.54% | (0.13)% | 117% | $493 |
2010 | $7.92 | —(3) | 1.25 | 1.25 | —(3) | $9.17 | 15.82% | 1.55% | (0.04)% | 84% | $264 |
2009 | $11.00 | —(3) | (3.08) | (3.08) | — | $7.92 | (28.00)% | 1.55% | (0.06)% | 98% | $417 |
Notes to Financial Highlights
(1) | Computed using average shares outstanding throughout the period. |
(2) | Total returns are calculated based on the net asset value of the last business day and do not reflect applicable sales charges, if any. Total returns for periods less than one year are not annualized. |
(3) | Per-share amount was less than $0.005. |
See Notes to Financial Statements.
Report of Independent Registered Public Accounting Firm |
To the Directors of the American Century Quantitative Equity Funds, Inc. and Shareholders of the Disciplined Growth Fund:
In our opinion, the accompanying statement of assets and liabilities, including the schedule of investments, and the related statements of operations and of changes in net assets and the financial highlights present fairly, in all material respects, the financial position of the Disciplined Growth Fund (one of the fourteen funds comprising the American Century Quantitative Equity Funds, Inc., hereafter referred to as the “Fund”) at June 30, 2013, the results of its operations for the year then ended, the changes in its net assets for each of the two years in the period then ended and the financial highlights for each of the five years in the period then ended, in conformity with accounting principles generally accepted in the United States of America. These financial statements and financial highlights (hereafter referred to as “financial statements”) are the responsibility of the Fund’s management; our responsibility is to express an opinion on these financial statements based on our audits. We conducted our audits of these financial statements in accordance with the standards of the Public Company Accounting Oversight Board (United States). Those standards require that we plan and perform the audit to obtain reasonable assurance about whether the financial statements are free of material misstatement. An audit includes examining, on a test basis, evidence supporting the amounts and disclosures in the financial statements, assessing the accounting principles used and significant estimates made by management, and evaluating the overall financial statement presentation. We believe that our audits, which included confirmation of securities at June 30, 2013 by correspondence with the custodian and brokers, provide a reasonable basis for our opinion.
PricewaterhouseCoopers LLP
Kansas City, Missouri
August 21, 2013
Board of Directors
The individuals listed below serve as directors of the funds. Each director will continue to serve in this capacity until death, retirement, resignation or removal from office. The board has adopted a mandatory retirement age for directors who are not “interested persons,” as that term is defined in the Investment Company Act (independent directors). Independent directors shall retire on December 31 of the year in which they reach their 75th birthday; provided, however, that on or after January 1, 2022, independent directors shall retire on December 31 of the year in which they reach their 76th birthday.
Mr. Thomas is the only director who is an “interested person” because he currently serves as President and Chief Executive Officer of American Century Companies, Inc. (ACC), the parent company of American Century Investment Management, Inc. (ACIM or the advisor).
The other directors (more than three-fourths of the total number) are independent; that is, they have never been employees, directors or officers of, and have no financial interest in, ACC or any of its wholly owned, direct or indirect, subsidiaries, including ACIM, American Century Investment Services, Inc. (ACIS) and American Century Services, LLC (ACS). The directors serve in this capacity for eight (in the case of Mr. Thomas, 15) registered investment companies in the American Century Investments family of funds.
The following table presents additional information about the directors. The mailing address for each director other than Mr. Thomas is 1665 Charleston Road, Mountain View, California 94043. The mailing address for Mr. Thomas is 4500 Main Street, Kansas City, Missouri 64111.
| | | | | | | |
Name
(Year of Birth) | Position(s) Held with Funds | Length of Time Served | Principal Occupation(s) During Past 5 Years | | Number of American Century Portfolios Overseen
by Director | Other Directorships Held During Past 5 Years |
Independent Directors |
Tanya S. Beder
(1955) | Director | Since 2011 | Chairman, SBCC Group Inc. (independent advisory services) (2006 to present) | | 41 | CYS Investments, Inc. (specialty finance company) |
Jeremy I. Bulow
(1954) | Director | Since 2011 | Professor of Economics, Stanford University, Graduate School of Business (1979 to present) | | 41 | None |
Ronald J. Gilson
(1946) | Director and Chairman of the Board | Since 1995 | Charles J. Meyers Professor of Law and Business, Stanford Law School (1979 to present); Marc and Eva Stern Professor of Law and Business, Columbia University School of Law (1992 to present) | | 41 | None |
Frederick L. A. Grauer
(1946) | Director | Since 2008 | Senior Advisor, BlackRock, Inc. (investment management firm) (2010 to 2011); Senior Advisor, Barclays Global Investors (investment management firm) (2003 to 2009) | | 41 | None |
| | | | | | | |
Name
(Year of Birth) | Position(s) Held with Funds | Length of Time Served | Principal Occupation(s) During Past 5 Years | | Number of American Century Portfolios Overseen
by Director | Other Directorships Held During Past 5 Years |
Independent Directors |
Peter F. Pervere
(1947) | Director | Since 2007 | Retired | | 41 | Intraware, Inc. (2003 to 2009) |
Myron S. Scholes
(1941) | Director | Since 1980 | Chairman, Platinum Grove Asset Management, L.P. (asset manager) (1999 to 2009); Frank E. Buck Professor of Finance-Emeritus, Stanford Graduate School of Business (1996 to present) | | 41 | Dimensional Fund Advisors (investment advisor); CME Group, Inc. (futures and options exchange) |
John B. Shoven
(1947) | Director | Since 2002 | Professor of Economics, Stanford University (1973 to present) | | 41 | Cadence Design Systems; Exponent; Financial Engines |
| | | | | | | |
Interested Director |
Jonathan S. Thomas
(1963) | Director and President | Since 2007 | President and Chief Executive Officer, ACC (March 2007 to present). Also serves as Chief Executive Officer and Manager, ACS; Executive Vice President, ACIM; Director, ACC, ACIM and other ACC subsidiaries | | 106 | None |
Officers
The following table presents certain information about the executive officers of the funds. Each officer serves as an officer for each of the 15 investment companies in the American Century family of funds, unless otherwise noted. No officer is compensated for his or her service as an officer of the funds. The listed officers are interested persons of the funds and are appointed or re-appointed on an annual basis. The mailing address for each of the officers listed below is 4500 Main Street, Kansas City, Missouri 64111.
| | | |
Name
(Year of Birth) | Offices with the Funds | Principal Occupation(s) During the Past Five Years |
Jonathan S. Thomas
(1963) | Director and President since 2007 | President and Chief Executive Officer, ACC (March 2007 to present). Also serves as Chief Executive Officer and Manager, ACS; Executive Vice President, ACIM; Director, ACC, ACIM and other ACC subsidiaries |
Maryanne L. Roepke
(1956) | Chief Compliance Officer since 2006 and Senior Vice President since 2000 | Chief Compliance Officer, American Century funds, ACIM and ACS (August 2006 to present). Also serves as Senior Vice President, ACS |
Charles A. Etherington
(1957) | General Counsel since 2007 and Senior Vice President since 2006 | Attorney, ACC (February 1994 to present); Vice President, ACC (November 2005 to present); General Counsel, ACC (March 2007 to present). Also serves as General Counsel, ACIM, ACS, ACIS and other ACC subsidiaries; and Senior Vice President, ACIM and ACS |
C. Jean Wade
(1964) | Vice President, Treasurer and Chief Financial Officer since 2012 | Vice President, ACS (February 2000 to present) |
Robert J. Leach
(1966) | Vice President since 2006 and Assistant Treasurer since 2012 | Vice President, ACS (February 2000 to present) |
David H. Reinmiller
(1963) | Vice President since 2001 | Attorney, ACC (January 1994 to present); Associate General Counsel, ACC (January 2001 to present). Also serves as Vice President, ACIM and ACS |
Ward D. Stauffer
(1960) | Secretary since 2005 | Attorney, ACC (June 2003 to present) |
The Statement of Additional Information has additional information about the fund’s directors and is available without charge, upon request, by calling 1-800-345-2021.
Approval of Management Agreement |
At a meeting held on June 11, 2013, the Fund’s Board of Directors/Trustees unanimously approved the renewal of the management agreement pursuant to which American Century Investment Management, Inc. (the “Advisor”) acts as the investment advisor for the Fund. Under Section 15(c) of the Investment Company Act, contracts for investment advisory services are required to be reviewed, evaluated, and approved by a majority of a fund’s directors/trustees (the “Directors”), including a majority of the independent Directors each year. The Board regards this annual evaluation and renewal as one of its most important responsibilities.
In connection with their annual review and evaluation, the independent Directors memorialized a statement regarding the relationship between their ongoing obligations to oversee and evaluate the performance of the Advisor and their consideration of renewal of the management agreement. In that statement, the independent Directors noted that their assessment of the Advisor’s performance is an ongoing process that takes place over the entire year and is informed by all of the information that the Board and its committees receive and consider over time. This information, together with the materials provided in connection with the review, are central to the Board’s assessment of the Advisor’s performance and its determination whether to renew the Fund’s management agreement.
Prior to its consideration of the renewal of the management agreement, the Board requested and reviewed extensive data and analysis relating to the proposed renewal. This information and analysis was compiled by the Advisor and certain independent providers of evaluation data concerning the Fund and the services provided to the Fund by the Advisor.
In connection with its consideration of the renewal of the management agreement, the Board’s review and evaluation of the services provided by the Advisor included, but was not limited to, the following:
• | the nature, extent, and quality of investment management, shareholder services, and other services provided by the Advisor to the Fund; |
• | the wide range of other programs and services the Advisor provides to the Fund and its shareholders on a routine and non-routine basis; |
• | the investment performance of the Fund, including data comparing the Fund’s performance to appropriate benchmarks and/or a peer group of other mutual funds with similar investment objectives and strategies; |
• | data comparing the cost of owning the Fund to the cost of owning similar funds; |
• | the Advisor’s compliance policies, procedures, and regulatory experience; |
• | financial data showing the cost of services provided to the Fund, the profitability of the Fund to the Advisor, and the overall profitability of the Advisor; |
• | possible economies of scale associated with the Advisor’s management of the Fund and other accounts under its management; |
• | data comparing services provided and charges to other investment management clients of the Advisor; and |
• | consideration of collateral benefits derived by the Advisor from the management of the Fund. |
In keeping with its practice, the Board held two in-person meetings to review and discuss the information provided. The Board also had the benefit of the advice of its independent counsel throughout the period.
Factors Considered
The Directors considered all of the information provided by the Advisor, the independent data providers, and the Board’s independent counsel in connection with the review, and evaluated such information for the Fund. In connection with their review, the Directors did not identify any single factor as being all-important or controlling and each Director may have attributed different levels of importance to different factors. In deciding to renew the management agreement, the Board based its decision on a number of factors, including the following:
Nature, Extent and Quality of Services — Generally. Under the management agreement, the Advisor is responsible for providing or arranging for all services necessary for the operation of the Fund. The Board noted that under the management agreement, the Advisor provides or arranges at its own expense a wide variety of services including:
• | constructing and designing the Fund |
• | portfolio research and security selection |
• | initial capitalization/funding |
• | daily valuation of the Fund’s portfolio |
• | shareholder servicing and transfer agency, including shareholder confirmations, recordkeeping, and communications |
• | regulatory and portfolio compliance |
• | marketing and distribution |
The Board noted that many of these services have expanded over time both in terms of quantity and complexity in response to shareholder demands, competition in the industry, changing distribution channels, and the changing regulatory environment.
Investment Management Services. The nature of the investment management services provided to the Fund is quite complex and allows Fund shareholders access to professional money management, instant diversification of their investments within an asset class, the opportunity to easily diversify among asset classes by investing in or exchanging among various American Century Investments funds, and liquidity. In evaluating investment performance, the Board expects the Advisor to manage the Fund in accordance with its investment objectives and approved strategies. Further, the Directors recognize that the Advisor has an obligation to seek the best execution of fund trades. In providing these services, the Advisor utilizes teams of investment professionals (portfolio managers, analysts, research assistants, and securities traders) who require extensive information technology, research, training, compliance and other systems to conduct their business. The Board, directly and through its Portfolio Committee, regularly reviews investment performance information for the Fund, together with comparative information for appropriate benchmarks and/or peer groups of similarly-managed funds, over different time horizons. The Directors also review detailed performance information during the management agreement approval process. If performance concerns are identified, the Fund receives special reviews until performance improves, during which the Board discusses with the Advisor the reasons for such results (e.g., market conditions, security selection) and any efforts being undertaken to improve performance. The Board found the investment management services provided by the Advisor to the Fund to meet or exceed industry standards. More detailed information about the Fund’s performance can be found in the Performance and Portfolio Commentary sections of this report.
Shareholder and Other Services. Under the management agreement, the Advisor provides the Fund with a comprehensive package of transfer agency, shareholder, and other services. The Board, directly and through various committees of the Board, regularly reviews reports and evaluations of such services at its regular meetings. These reports include, but are not limited to, information regarding the operational efficiency and accuracy of the shareholder and transfer agency services provided, staffing levels, shareholder satisfaction (as measured by external as well as internal sources), technology support, new products and services offered to Fund shareholders, securities trading activities, portfolio valuation services, auditing services, and legal and operational compliance activities. Certain aspects of shareholder and transfer agency service level efficiency and the quality of securities trading activities are measured by independent third party providers and are presented in comparison to other fund groups not managed by the Advisor. The Board found the services provided by the Advisor to the Fund under the management agreement to be competitive and of high quality.
Costs of Services and Profitability. The Advisor provides detailed information concerning its cost of providing various services to the Fund, its profitability in managing the Fund, its overall profitability, and its financial condition. The Directors have reviewed with the Advisor the methodology used to prepare this financial information. The financial information regarding the Advisor is considered in evaluating the Advisor’s financial condition, its ability to continue to provide services under the management agreement, and the reasonableness of the current management fee. The Board concluded that the Advisor’s profits were reasonable in light of the services provided to the Fund.
Ethics. The Board generally considers the Advisor’s commitment to providing quality services to shareholders and to conducting its business ethically. They noted that the Advisor’s practices generally meet or exceed industry best practices.
Economies of Scale. The Board also reviewed information provided by the Advisor regarding the possible existence of economies of scale in connection with the management of the Fund. The Board concluded that economies of scale are difficult to measure and predict with precision, especially on a fund-by-fund basis. The Board concluded that the Advisor is appropriately sharing economies of scale through its competitive fee structure, offering competitive fees from fund inception, and through reinvestment in its business to provide shareholders additional content and services.
Comparison to Other Funds’ Fees. The management agreement provides that the Fund pay the Advisor a single, all-inclusive (or unified) management fee for providing all services necessary for the management and operation of the Fund, other than brokerage expenses, taxes, interest, extraordinary expenses, and the fees and expenses of the Fund’s independent directors (including their independent legal counsel) and expenses incurred in connection with the provision of shareholder services and distribution services under a plan adopted pursuant to Rule 12b-1 under the 1940 Act. Under the unified fee structure, the Advisor is responsible for providing all investment advisory, custody, audit, administrative, compliance, recordkeeping, marketing and shareholder services, or arranging and supervising third parties to provide such services. By contrast, most other funds are charged a variety of fees, including an investment advisory fee, a transfer agency fee, an administrative fee, distribution charges and other expenses. Other than their investment advisory fees and any applicable Rule 12b-1 distribution fees, all other components of the total fees charged by these other funds may be increased without shareholder approval. The Board believes the unified fee structure is a benefit to Fund shareholders because it clearly discloses to shareholders the cost of owning Fund shares, and, since the unified fee cannot be increased without a vote of Fund shareholders, it shifts to the Advisor the risk of increased costs of operating the Fund and provides a direct incentive to minimize administrative inefficiencies. Part of the Board’s analysis of fee levels involves reviewing certain evaluative data compiled by an independent provider and comparing the Fund’s unified fee to the total expense ratio of other funds in the Fund’s peer group. The Board concluded that the management fee paid by the Fund to the Advisor under the management agreement is reasonable in light of the services provided to the Fund.
Comparison to Fees and Services Provided to Other Clients of the Advisor. The Board also requested and received information from the Advisor concerning the nature of the services, fees, costs and profitability of its advisory services to advisory clients other than the Fund. They observed that these varying types of client accounts require different services and involve different regulatory and entrepreneurial risks than the management of the Fund. The Board analyzed this information and concluded that the fees charged and services provided to the Fund were reasonable by comparison.
Collateral or “Fall-Out” Benefits Derived by the Advisor. The Board considered the existence of collateral benefits the Advisor may receive as a result of its relationship with the Fund. They concluded that the Advisor’s primary business is managing mutual funds and it generally does not use fund or shareholder information to generate profits in other lines of business, and therefore does not derive any significant collateral benefits from them. The Board noted that the Advisor receives proprietary research from broker-dealers that execute fund portfolio transactions and concluded that this research is likely to benefit Fund shareholders. The Board also determined that the Advisor is able to provide investment management services to certain clients other than the Fund, at least in part, due to its existing infrastructure built to serve the fund complex. The Board concluded, however, that the assets of those other clients are not material to the analysis and, where applicable, may be included with the assets of the Fund to determine breakpoints in the management fee schedule.
Existing Relationship. The Board also considered whether there was any reason for not continuing the existing arrangement with the Advisor. In this regard, the Board was mindful of the potential disruptions of the Fund’s operations and various risks, uncertainties, and other effects that could occur as a result of a decision not to continue such relationship. In particular, the Board recognized that most shareholders have invested in the Fund on the strength of the Advisor’s industry standing and reputation and in the expectation that the Advisor will have a continuing role in providing advisory services to the Fund.
Conclusion of the Directors. As a result of this process, the Board, including all of the independent directors and assisted by the advice of independent legal counsel, taking into account all of the factors discussed above and the information provided by the Advisor and others, concluded that the management agreement between the Fund and the Advisor is fair and reasonable in light of the services provided and should be renewed.
Retirement Account Information
As required by law, distributions you receive from certain IRAs are subject to federal income tax withholding, unless you elect not to have withholding apply. Tax will be withheld on the total amount withdrawn even though you may be receiving amounts that are not subject to withholding, such as nondeductible contributions. In such case, excess amounts of withholding could occur. You may adjust your withholding election so that a greater or lesser amount will be withheld.
If you don’t want us to withhold on this amount, you must notify us to not withhold the federal income tax. You may notify us in writing or in certain situations by telephone or through other electronic means. For systematic withdrawals, your withholding election will remain in effect until revoked or changed by filing a new election. You have the right to revoke your election at any time.
Remember, even if you elect not to have income tax withheld, you are liable for paying income tax on the taxable portion of your withdrawal. If you elect not to have income tax withheld or you don’t have enough income tax withheld, you may be responsible for payment of estimated tax. You may incur penalties under the estimated tax rules if your withholding and estimated tax payments are not sufficient. You can reduce or defer the income tax on a distribution by directly or indirectly rolling such distribution over to another IRA or eligible plan. You should consult your tax advisor for additional information.
State tax will be withheld if, at the time of your distribution, your address is within one of the mandatory withholding states and you have federal income tax withheld (or as otherwise required by state law). State taxes will be withheld from your distribution in accordance with the respective state rules.
Distributions you receive from 403(b), 457 and qualified plans are subject to special tax and withholding rules. Your plan administrator or plan sponsor is required to provide you with a special tax notice explaining those rules at the time you request a distribution. If applicable, federal and/or state taxes may be withheld from your distribution amount.
Proxy Voting Guidelines
American Century Investment Management, Inc., the fund’s investment advisor, is responsible for exercising the voting rights associated with the securities purchased and/or held by the fund. A description of the policies and procedures the advisor uses in fulfilling this responsibility is available without charge, upon request, by calling 1-800-345-2021. It is also available on American Century Investments’ website at americancentury.com and on the Securities and Exchange Commission’s website at sec.gov. Information regarding how the investment advisor voted proxies relating to portfolio securities during the most recent 12-month period ended June 30 is available on the “About Us” page at americancentury.com. It is also available at sec.gov.
Quarterly Portfolio Disclosure
The fund files its complete schedule of portfolio holdings with the Securities and Exchange Commission (SEC) for the first and third quarters of each fiscal year on Form N-Q. The fund’s Forms N-Q are available on the SEC’s website at sec.gov, and may be reviewed and copied at the SEC’s Public Reference Room in Washington, DC. Information on the operation of the Public Reference Room may be obtained by calling 1-800-SEC-0330. The fund also makes its complete schedule of portfolio holdings for the most recent quarter of its fiscal year available on its website at americancentury.com and, upon request, by calling 1-800-345-2021.
Other Tax Information
The following information is provided pursuant to provisions of the Internal Revenue Code.
The fund hereby designates up to the maximum amount allowable as qualified dividend income for the fiscal year ended June 30, 2013.
For corporate taxpayers, the fund hereby designates $1,257,443, or up to the maximum amount allowable, of ordinary income distributions paid during the fiscal year ended June 30, 2013 as qualified for the corporate dividends received deduction.
Contact Us | americancentury.com |
Automated Information Line | 1-800-345-8765 |
Investor Services Representative | 1-800-345-2021
or 816-531-5575 |
Investors Using Advisors | 1-800-378-9878 |
Business, Not-For-Profit, Employer-Sponsored Retirement Plans | 1-800-345-3533 |
Banks and Trust Companies, Broker-Dealers, Financial Professionals, Insurance Companies | 1-800-345-6488 |
Telecommunications Device for the Deaf | 1-800-634-4113 |
American Century Quantitative Equity Funds, Inc.
Investment Advisor:
American Century Investment Management, Inc.
Kansas City, Missouri
This report and the statements it contains are submitted for the general information of our shareholders. The report is not authorized for distribution to prospective investors unless preceded or accompanied by an effective prospectus.
©2013 American Century Proprietary Holdings, Inc. All rights reserved.
CL-ANN-79313 1308
ANNUAL REPORT | JUNE 30, 2013 |
Disciplined Growth Plus Fund
President’s Letter | 2 |
Market Perspective | 3 |
Performance | 4 |
Portfolio Commentary | 6 |
Fund Characteristics | 8 |
Shareholder Fee Example | 9 |
Schedule of Investments | 11 |
Statement of Assets and Liabilities | 18 |
Statement of Operations | 19 |
Statement of Changes in Net Assets | 20 |
Statement of Cash Flows | 21 |
Notes to Financial Statements | 22 |
Financial Highlights | 28 |
Report of Independent Registered Public Accounting Firm | 30 |
Management | 31 |
Approval of Management Agreement | 34 |
Additional Information | 39 |
Any opinions expressed in this report reflect those of the author as of the date of the report, and do not necessarily represent the opinions of American Century Investments® or any other person in the American Century Investments organization. Any such opinions are subject to change at any time based upon market or other conditions and American Century Investments disclaims any responsibility to update such opinions. These opinions may not be relied upon as investment advice and, because investment decisions made by American Century Investments funds are based on numerous factors, may not be relied upon as an indication of trading intent on behalf of any American Century Investments fund. Security examples are used for representational purposes only and are not intended as recommendations to purchase or sell securities. Performance information for comparative indices and securities is provided to American Century Investments by third party vendors. To the best of American Century Investments’ knowledge, such information is accurate at the time of printing.
Jonathan Thomas
Dear Investor:
Thank you for reviewing this annual report for the 12 months ended June 30, 2013. It provides investment performance, market analysis, and portfolio information, presented with the expert perspective of our portfolio management team.
Annual reports remain important vehicles for conveying information about fund returns, including key factors that affected fund performance. For additional, updated investment and market insights, we encourage you to visit our website, americancentury.com.
Generally Favorable Fiscal-Year Returns for U.S. Stocks and High-Yield Bonds
The 12-month reporting period began in the summer of 2012 with uncertainties caused by slowing economies, as well as the upcoming November elections and year-end fiscal deadlines in the U.S. It ended with more uncertainty about the future of U.S. monetary stimulus. In between, aggressive monetary intervention by central banks encouraged investors to take more risk, generally boosting stocks at the expense of government bonds.
U.S. mid-cap, small-cap, and value stock indices achieved performance leadership during the period, outpacing the S&P 500 Index’s 20.60% return. U.S. stocks generally outperformed non-U.S. equities—the MSCI EAFE Index returned 18.62% and the MSCI Emerging Markets Index advanced 2.87%, affected by slowing growth in emerging market economies.
Slower emerging market growth also hindered commodity price gains and helped keep inflation under control. As a result, assets used as inflation hedges, including inflation-indexed securities and precious metals, lagged other assets. Gold, in particular, plunged, starting last October. And Treasury inflation-protected securities (TIPS) were among the lowest performers in the U.S. bond market. Bond index returns generally ranged from approximately 10% gains for U.S. corporate high-yield indices all the way down to negative returns for longer-maturity global Treasury benchmarks.
Despite signs of improvement in 2013, U.S. economic growth is subpar compared with past recession recoveries, and remains vulnerable to threats that could trigger another slowdown and market volatility. Therefore, we continue to believe in a disciplined, diversified, long-term investment approach, using professionally managed stock and bond portfolios—as appropriate—for meeting financial goals. We appreciate your continued trust in us in this volatile environment.
Sincerely,
Jonathan Thomas
President and Chief Executive Officer
American Century Investments
By Scott Wittman, Chief Investment Officer, Asset Allocation and Quantitative Equity
Central Bank Actions, Relative U.S. Economic Gains Drove Stocks Higher
Stock market performance remained robust during the 12-month period ended June 30, 2013. Despite persistent concerns about weak global growth and Europe’s ongoing financial crisis, investors largely focused on central bank stimulus measures and marginally-improving U.S. economic data, which fueled market optimism.
Early in the period, in response to disappointing U.S. economic data, the U.S. Federal Reserve (the Fed) launched its third—and most aggressive—quantitative easing (QE) program, or monthly purchases of $40 billion in government agency mortgage-backed securities. Later in 2012, the Fed expanded the program to include $45 billion in Treasury purchases, bringing its total bond buying to $85 billion per month. This unprecedented program, combined with relatively healthy corporate earnings, significant housing market gains and modest improvements in the labor market, helped keep stocks and other riskier assets in favor.
The Fed rattled the financial markets late in the reporting period, with comments about “tapering” its quantitative easing program. Fed Chairman Ben Bernanke said the central bank could begin scaling back its bond buying later in 2013 if the economy continues to improve. After reaching record highs in May, stocks stumbled in June, following Bernanke’s comments. Late in the month, the Fed toned down its tapering talk, and stocks recovered some of their June losses. Overall, most U.S. stock benchmarks generated stellar 12-month returns, largely aided by strong double-digit gains posted during the first calendar quarter of 2013.
Value Stocks Outpaced Growth Stocks
Across the capitalization spectrum, value stocks were the performance leaders for the 12-month period. Much of this was due to strong one-year returns from the financials and health care sectors, where many value-oriented stocks reside. In particular, expectations for rising interest rates—and the late-quarter rate increase triggered by Fed tapering talk—helped boost returns within the financial sector’s banking industry. At the opposite end, the rate-sensitive utilities sector was the weakest relative performer, held back by the prospect of rising interest rates.
U.S. Stock Index Returns |
For the 12 months ended June 30, 2013 |
Russell 1000 Index (Large-Cap) | 21.24% | | Russell 2000 Index (Small-Cap) | 24.21% |
Russell 1000 Growth Index | 17.07% | | Russell 2000 Growth Index | 23.67% |
Russell 1000 Value Index | 25.32% | | Russell 2000 Value Index | 24.77% |
Russell Midcap Index | 25.41% | | | |
Russell Midcap Growth Index | 22.88% | | | |
Russell Midcap Value Index | 27.65% | | | |
Total Returns as of June 30, 2013 |
| | | | Average
Annual Returns | |
| | Ticker Symbol | 1 year | Since Inception | Inception Date |
Investor Class | ACDJX | 17.15% | 15.64% | 10/31/11 |
Russell 1000 Growth Index | — | 17.07% | 16.21% | — |
Institutional Class | ACDKX | 17.37% | 15.86% | 10/31/11 |
A Class No sales charge* With sales charge* | ACDQX | 16.79% 10.09% | 15.33% 11.30% | 10/31/11 |
C Class | ACDHX | 16.02% | 14.50% | 10/31/11 |
R Class | ACDWX | 16.62% | 15.07% | 10/31/11 |
*Sales charges include initial sales charges and contingent deferred sales charges (CDSCs), as applicable. A Class shares have a 5.75% maximum initial sales charge and may be subject to a maximum CDSC of 1.00%. C Class shares redeemed within 12 months of purchase are subject to a maximum CDSC of 1.00%. The SEC requires that mutual funds provide performance information net of maximum sales charges in all cases where charges could be applied.
Data presented reflect past performance. Past performance is no guarantee of future results. Current performance may be higher or lower than the performance shown. Investment return and principal value will fluctuate, and redemption value may be more or less than original cost. To obtain performance data current to the most recent month end, please call 1-800-345-2021 or visit americancentury.com. The fund’s investment process may result in high portfolio turnover, which could mean high transaction costs, affecting both performance and capital gains tax liabilities to investors. In addition, its investment approach may involve higher price volatility, short sales risk, leverage risk and overweighting risk.
Unless otherwise indicated, performance reflects Investor Class shares; performance for other share classes will vary due to differences in fee structure. For information about other share classes available, please consult the prospectus. Data assumes reinvestment of dividends and capital gains, and none of the charts reflect the deduction of taxes that a shareholder would pay on fund distributions or the redemption of fund shares. Returns for the index are provided for comparison. The fund’s total returns include operating expenses (such as transaction costs and management fees) that reduce returns, while the total returns of the index do not.
Growth of $10,000 Over Life of Class |
$10,000 investment made October 31, 2011 |
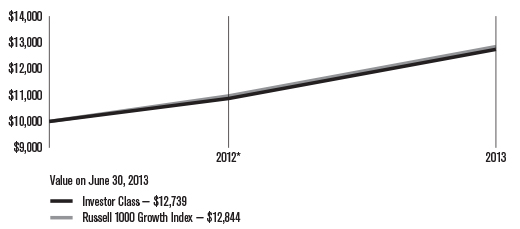
*From 10/31/11, the Investor Class’s inception date. Not annualized.
Total Annual Fund Operating Expenses |
Investor Class | Institutional Class | A Class | C Class | R Class |
2.48% | 2.28% | 2.73% | 3.48% | 2.98% |
The total annual fund operating expenses shown is as stated in the fund’s prospectus current as of the date of this report. The prospectus may vary from the expense ratio shown elsewhere in this report because it is based on a different time period, includes acquired fund fees and expenses, and, if applicable, does not include fee waivers or expense reimbursements.
Data presented reflect past performance. Past performance is no guarantee of future results. Current performance may be higher or lower than the performance shown. Investment return and principal value will fluctuate, and redemption value may be more or less than original cost. To obtain performance data current to the most recent month end, please call 1-800-345-2021 or visit americancentury.com. The fund’s investment process may result in high portfolio turnover, which could mean high transaction costs, affecting both performance and capital gains tax liabilities to investors. In addition, its investment approach may involve higher price volatility, short sales risk, leverage risk and overweighting risk.
Unless otherwise indicated, performance reflects Investor Class shares; performance for other share classes will vary due to differences in fee structure. For information about other share classes available, please consult the prospectus. Data assumes reinvestment of dividends and capital gains, and none of the charts reflect the deduction of taxes that a shareholder would pay on fund distributions or the redemption of fund shares. Returns for the index are provided for comparison. The fund’s total returns include operating expenses (such as transaction costs and management fees) that reduce returns, while the total returns of the index do not.
Portfolio Managers: Scott Wittman, Bill Martin, and Lynette Pang
Performance Summary
Disciplined Growth Plus returned 17.15%* for the fiscal year ended June 30, 2013, compared with the 17.07% return of its benchmark, the Russell 1000 Growth Index, and the 20.60%** return of the broad S&P 500 Index.
In a year of strength for U.S. equity markets (see page 3 for details), Disciplined Growth Plus posted a solid gain for the 12-month period, performing in line with the Russell 1000 Growth Index. The fund is managed to have a 100% net exposure to the equity market by investing approximately 130% of its net assets in long positions, while 30% of its net assets are sold short. The proceeds from the securities sold short are used to fund the purchase of the additional 30% of long positions. The fund’s stock selection process incorporates factors of growth, value, quality, and momentum, and is designed to minimize unintended risks along industries and other risk characteristics. Growth and quality indicators were generally rewarded by investors, while momentum insights, particularly with longer horizon signals, produced more muted results.
Absolute Performance Driven by Consumer Discretionary and Health Care
The fund’s absolute returns were driven primarily by strong performance in the consumer discretionary and health care sectors, both of which generated considerable gains. The best consumer discretionary name was home improvement retailer Home Depot, although a number of impactful holdings came from the media industry. In health care, biotechnology manufacturers Gilead Sciences and Celgene, as well as pharmaceutical giant Bristol-Myers Squibb, were top absolute performers.
Information technology was the only sector to produce a meaningful absolute decline for the 12-month period. This was due in large part to our position in mobile communications and computer manufacturer Apple, whose stock declined over 30%.
Materials and Health Care Outperformed
The materials and health care sectors were the main contributors to the fund’s excess returns. The materials sector’s strong stock selection in metals and mining drove outperformance. Here, a number of short positions were successful during a period when precious metals prices weakened. Particularly helpful was a short position in steel producer AK Steel whose shares dropped 47% during the year after the company suspended dividends and decreased earnings estimates. Exposure to non-benchmark name Headwaters, a construction materials company, was also beneficial as the company reported robust earnings growth over the 12-month period.
Health care was also a strong performer during the fiscal year. Security selection in a number of industries was beneficial, but none more so than health care equipment and supplies, where a number of positions, both long and short, drove results. Top individual sector contributions came from the fund’s overweight in pharmaceutical company Endocyte and a short position in health care
* All fund returns referenced in this commentary are for Investor Class shares.
** The S&P 500 Index average annual return was 18.72% since the fund’s inception on October 31, 2011.
benefits coordinator HMS. Endocyte’s stock gained in early 2013 on analysts’ upgrades and rising revenues, while HMS shares fell on lower revenue guidance. We covered the HMS short position in May after our research indicated improving quality and growth trends.
Elsewhere in the portfolio, substantial relative contributors included mortgage company Ocwen Financial, casino game maker Multimedia Games, and internet retailer Overstock.com. Ocwen saw strong revenue growth backed by a rebound in housing, which was reflected in its stock price. Shares of Multimedia Games surged during the second half of the fiscal year on healthy revenue and earnings increases.
Information Technology Detracted
The information technology sector was the only sector to negatively impact relative performance during the period. The weakest contributions came from short positions in solar-related holdings of the semiconductor industry. Despite high valuations and negative net margins, shares of SunEdison (formerly MEMC Electronics) climbed during the year on hopes of increased traction of solar energy usage. However, our research confirms that the company looks expensive, and we maintain the fund’s short position. SunPower appreciated on relatively strong solar demand but we covered the short position in May 2013 as the company showed improved fundamental characteristics across growth and quality. A short position in broadband service provider ViaSat also hurt results after investors overlooked negative earnings and below-estimate revenue guidance, sending shares soaring 90% during the year.
While no other sector detracted from excess returns, a number of short positions proved difficult, including chemicals manufacturer ADA-ES (formerly Advanced Emissions Solutions) and investment manager Virtus Investment Partners. Advanced Emissions’ improving earnings and higher projected growth boosted share price. While valuation and growth indicators remain weak, improving quality measures caused us to reduce our short position during the second quarter. Although Virtus rose on better-than-expected earnings driven by the strong stock market rally, we continue to see below-average fundamentals, most notably along growth and valuation.
A Look Ahead
As we move into the second half of 2013, the U.S. economic recovery seems to be progressing, albeit with headwinds. Improvements in housing, employment, and economic indicators have been consistent and point to slow but positive growth. Volatility is likely to remain elevated as ongoing concerns over interest rates, Federal Reserve action, and a potential slowdown in China dominate headlines. Heightened levels of volatility often provide investment opportunities in both the long and short portions of the portfolio. Our disciplined, objective, and systematic investment strategy is designed to take advantage of these opportunities at the individual company level. We believe this approach is the most powerful way to capitalize on market inefficiencies that lead to the mispricing of individual stocks.
JUNE 30, 2013 | |
Top Ten Long Holdings | | % of net assets |
Apple, Inc. | | | 4.37 | % |
Google, Inc., Class A | | | 3.63 | % |
Microsoft Corp. | | | 3.33 | % |
Oracle Corp. | | | 2.07 | % |
QUALCOMM, Inc. | | | 2.05 | % |
International Business Machines Corp. | | | 1.83 | % |
Boeing Co. (The) | | | 1.73 | % |
Bristol-Myers Squibb Co. | | | 1.69 | % |
Verizon Communications, Inc. | | | 1.60 | % |
Home Depot, Inc. (The) | | | 1.59 | % |
| | | | | |
Top Five Short Holdings | | % of net assets |
SunEdison, Inc. | | | (0.84 | )% |
ADA-ES, Inc. | | | (0.77 | )% |
Pacer International, Inc. | | | (0.75 | )% |
Meridian Interstate Bancorp, Inc. | | | (0.75 | )% |
Loral Space & Communications, Inc. | | | (0.72 | )% |
| | | | | |
Types of Investments in Portfolio | | % of net assets |
Common Stocks | | | 128.6 | % |
Common Stocks Sold Short | | | (29.7 | )% |
Temporary Cash Investments | | | 1.9 | % |
Other Assets and Liabilities | | | (0.8 | )% |
Fund shareholders may incur two types of costs: (1) transaction costs, including sales charges (loads) on purchase payments and redemption/exchange fees; and (2) ongoing costs, including management fees; distribution and service (12b-1) fees; and other fund expenses. This example is intended to help you understand your ongoing costs (in dollars) of investing in your fund and to compare these costs with the ongoing cost of investing in other mutual funds.
The example is based on an investment of $1,000 made at the beginning of the period and held for the entire period from January 1, 2013 to June 30, 2013.
Actual Expenses
The table provides information about actual account values and actual expenses for each class. You may use the information, together with the amount you invested, to estimate the expenses that you paid over the period. First, identify the share class you own. Then simply divide your account value by $1,000 (for example, an $8,600 account value divided by $1,000 = 8.6), then multiply the result by the number under the heading “Expenses Paid During Period” to estimate the expenses you paid on your account during this period.
If you hold Investor Class shares of any American Century Investments fund, or Institutional Class shares of the American Century Diversified Bond Fund, in an American Century Investments account (i.e., not a financial intermediary or retirement plan account), American Century Investments may charge you a $12.50 semiannual account maintenance fee if the value of those shares is less than $10,000. We will redeem shares automatically in one of your accounts to pay the $12.50 fee. In determining your total eligible investment amount, we will include your investments in all personal accounts (including American Century Investments Brokerage accounts) registered under your Social Security number. Personal accounts include individual accounts, joint accounts, UGMA/UTMA accounts, personal trusts, Coverdell Education Savings Accounts and IRAs (including traditional, Roth, Rollover, SEP-, SARSEP- and SIMPLE-IRAs), and certain other retirement accounts. If you have only business, business retirement, employer-sponsored or American Century Investments Brokerage accounts, you are currently not subject to this fee. If you are subject to the Account Maintenance Fee, your account value could be reduced by the fee amount.
Hypothetical Example for Comparison Purposes
The table also provides information about hypothetical account values and hypothetical expenses based on the actual expense ratio of each class of your fund and an assumed rate of return of 5% per year before expenses, which is not the actual return of a fund’s share class. The hypothetical account values and expenses may not be used to estimate the actual ending account balance or expenses you paid for the period. You may use this information to compare the ongoing costs of investing in your fund and other funds. To do so, compare this 5% hypothetical example with the 5% hypothetical examples that appear in the shareholder reports of the other funds.
Please note that the expenses shown in the table are meant to highlight your ongoing costs only and do not reflect any transactional costs, such as sales charges (loads) or redemption/exchange fees. Therefore, the table is useful in comparing ongoing costs only, and will not help you determine the relative total costs of owning different funds. In addition, if these transactional costs were included, your costs would have been higher.
| | | | | |
| | Beginning
Account Value 1/1/13 | Ending
Account Value 6/30/13 | Expenses Paid During Period(1) 1/1/13 – 6/30/13 | Annualized
Expense Ratio(1) |
Actual |
Investor Class | $1,000 | $1,122.40 | $9.21 | 1.75% |
Institutional Class | $1,000 | $1,123.30 | $8.16 | 1.55% |
A Class | $1,000 | $1,120.70 | $10.52 | 2.00% |
C Class | $1,000 | $1,117.80 | $14.44 | 2.75% |
R Class | $1,000 | $1,119.80 | $11.83 | 2.25% |
Hypothetical |
Investor Class | $1,000 | $1,016.12 | $8.75 | 1.75% |
Institutional Class | $1,000 | $1,017.11 | $7.75 | 1.55% |
A Class | $1,000 | $1,014.88 | $9.99 | 2.00% |
C Class | $1,000 | $1,011.16 | $13.71 | 2.75% |
R Class | $1,000 | $1,013.64 | $11.23 | 2.25% |
(1) | Expenses are equal to the class’s annualized expense ratio listed in the table above, multiplied by the average account value over the period, multiplied by 181, the number of days in the most recent fiscal half-year, divided by 365, to reflect the one-half year period. |
JUNE 30, 2013
| | | | | | | |
| | | Shares | | | Value | |
Common Stocks — 128.6% | |
AEROSPACE AND DEFENSE — 4.7% | |
American Science & Engineering, Inc. | | 315 | | | $ 17,640 | |
Boeing Co. (The)(1) | | 1,774 | | | 181,728 | |
Honeywell International, Inc.(1) | | 2,027 | | | 160,822 | |
Taser International, Inc.(1)(2) | | 7,303 | | | 62,222 | |
Textron, Inc.(1) | | 1,684 | | | 43,868 | |
United Technologies Corp.(1) | | 303 | | | 28,161 | |
| | | | | | 494,441 | |
AIR FREIGHT AND LOGISTICS — 0.1% | |
United Parcel Service, Inc., Class B(1) | | 70 | | | 6,054 | |
AIRLINES — 0.2% | |
Delta Air Lines, Inc.(1)(2) | | 1,164 | | | 21,778 | |
AUTO COMPONENTS — 0.8% | |
BorgWarner, Inc.(1)(2) | | 98 | | | 8,443 | |
Gentherm, Inc.(1)(2) | | 3,964 | | | 73,611 | |
| | | | | | 82,054 | |
BEVERAGES — 1.9% | |
Coca-Cola Co. (The)(1) | | 2,993 | | | 120,049 | |
PepsiCo, Inc.(1) | | 977 | | | 79,909 | |
| | | | | | 199,958 | |
BIOTECHNOLOGY — 5.7% | |
Alexion Pharmaceuticals, Inc.(2) | | 462 | | | 42,615 | |
Alkermes plc(2) | | 259 | | | 7,428 | |
Amgen, Inc.(1) | | 1,285 | | | 126,778 | |
Biogen Idec, Inc.(1)(2) | | 447 | | | 96,194 | |
Celgene Corp.(1)(2) | | 772 | | | 90,255 | |
Celldex Therapeutics, Inc.(2) | | 1,263 | | | 19,715 | |
Cubist Pharmaceuticals, Inc.(1)(2) | | 484 | | | 23,377 | |
Gilead Sciences, Inc.(1)(2) | | 2,083 | | | 106,671 | |
Regeneron Pharmaceuticals, Inc.(2) | | 31 | | | 6,971 | |
Sangamo Biosciences, Inc.(2) | | 2,362 | | | 18,447 | |
Threshold Pharmaceuticals, Inc.(2) | | 4,241 | | | 22,308 | |
United Therapeutics Corp.(1)(2) | | 432 | | | 28,434 | |
Vertex Pharmaceuticals, Inc.(1)(2) | | 72 | | | 5,751 | |
| | | | | | 594,944 | |
BUILDING PRODUCTS — 0.5% | |
AAON, Inc.(1) | | 1,498 | | | 49,554 | |
CAPITAL MARKETS — 1.3% | |
Federated Investors, Inc., Class B(1) | | 611 | | | 16,747 | |
SEI Investments Co.(1) | | 462 | | | 13,135 | |
T. Rowe Price Group, Inc.(1) | | 324 | | | 23,701 | |
Waddell & Reed Financial, Inc., Class A(1) | | 1,946 | | | 84,651 | |
| | | | | | 138,234 | |
CHEMICALS — 4.7% | |
CF Industries Holdings, Inc.(1) | | 88 | | | 15,092 | |
E.I. du Pont de Nemours & Co.(1) | | 1,038 | | | 54,495 | |
Flotek Industries, Inc.(1)(2) | | 1,518 | | | 27,233 | |
LyondellBasell Industries NV, Class A(1) | | 1,140 | | | 75,536 | |
Monsanto Co.(1) | | 1,452 | | | 143,458 | |
NewMarket Corp. | | 257 | | | 67,478 | |
PPG Industries, Inc.(1) | | 331 | | | 48,462 | |
Sherwin-Williams Co. (The) | | 164 | | | 28,962 | |
Valspar Corp. (The) | | 431 | | | 27,873 | |
| | | | | | 488,589 | |
COMMERCIAL SERVICES AND SUPPLIES — 1.6% | |
Deluxe Corp.(1) | | 961 | | | 33,299 | |
Mine Safety Appliances Co.(1) | | 457 | | | 21,273 | |
Steelcase, Inc., Class A(1) | | 4,948 | | | 72,142 | |
United Stationers, Inc.(1) | | 1,369 | | | 45,930 | |
| | | | | | 172,644 | |
COMMUNICATIONS EQUIPMENT — 3.3% | |
ARRIS Group, Inc.(1)(2) | | 1,230 | | | 17,651 | |
Ciena Corp.(1)(2) | | 1,621 | | | 31,480 | |
Harris Corp.(1) | | 309 | | | 15,218 | |
InterDigital, Inc.(1) | | 1,611 | | | 71,931 | |
QUALCOMM, Inc.(1) | | 3,525 | | | 215,307 | |
| | | | | | 351,587 | |
COMPUTERS AND PERIPHERALS — 6.6% | |
Apple, Inc.(1) | | 1,157 | | | 458,265 | |
EMC Corp.(1) | | 5,940 | | | 140,303 | |
NetApp, Inc.(2) | | 291 | | | 10,994 | |
Silicon Graphics International Corp.(2) | | 4,068 | | | 54,430 | |
Western Digital Corp.(1) | | 517 | | | 32,100 | |
| | | | | | 696,092 | |
CONSTRUCTION AND ENGINEERING — 0.6% | |
Argan, Inc.(1) | | 3,734 | | | 58,250 | |
CONSTRUCTION MATERIALS — 0.3% | |
Headwaters, Inc.(1)(2) | | 4,186 | | | 37,004 | |
CONSUMER FINANCE — 2.2% | |
American Express Co.(1) | | 1,039 | | | $ 77,676 | |
Cash America International, Inc.(1) | | 571 | | | 25,958 | |
DFC Global Corp.(1)(2) | | 2,931 | | | 40,477 | |
Portfolio Recovery Associates, Inc.(1)(2) | | 237 | | | 36,410 | |
World Acceptance Corp.(2) | | 596 | | | 51,816 | |
| | | | | | 232,337 | |
CONTAINERS AND PACKAGING — 2.3% | |
AEP Industries, Inc.(1)(2) | | 893 | | | 66,430 | |
Owens-Illinois, Inc.(1)(2) | | 3,260 | | | 90,595 | |
Packaging Corp. of America | | 1,713 | | | 83,869 | |
| | | | | | 240,894 | |
DIVERSIFIED CONSUMER SERVICES — 0.8% | |
Coinstar, Inc.(1)(2) | | 1,353 | | | 79,381 | |
DIVERSIFIED FINANCIAL SERVICES — 1.8% | |
CBOE Holdings, Inc.(1) | | 393 | | | 18,329 | |
Moody’s Corp.(1) | | 1,574 | | | 95,904 | |
MSCI, Inc., Class A(1)(2) | | 2,399 | | | 79,815 | |
| | | | | | 194,048 | |
DIVERSIFIED TELECOMMUNICATION SERVICES — 3.0% | |
Atlantic Tele-Network, Inc.(1) | | 1,754 | | | 87,103 | |
Fairpoint Communications, Inc.(2) | | 7,020 | | | 58,617 | |
Verizon Communications, Inc.(1) | | 3,326 | | | 167,431 | |
| | | | | | 313,151 | |
ELECTRICAL EQUIPMENT — 3.1% | |
Coleman Cable, Inc. | | 1,405 | | | 25,374 | |
Emerson Electric Co.(1) | | 2,223 | | | 121,243 | |
EnerSys(1) | | 1,730 | | | 84,839 | |
Rockwell Automation, Inc. | | 1,113 | | | 92,535 | |
| | | | | | 323,991 | |
ELECTRONIC EQUIPMENT, INSTRUMENTS AND COMPONENTS — 0.5% | |
Audience, Inc.(2) | | 1,885 | | | 24,901 | |
GSI Group, Inc.(1)(2) | | 3,803 | | | 30,576 | |
| | | | | | 55,477 | |
ENERGY EQUIPMENT AND SERVICES — 0.9% | |
CARBO Ceramics, Inc. | | 118 | | | 7,957 | |
RPC, Inc.(1) | | 2,355 | | | 32,523 | |
Schlumberger Ltd.(1) | | 673 | | | 48,227 | |
TGC Industries, Inc. | | 1,061 | | | 8,721 | |
| | | | | | 97,428 | |
FOOD AND STAPLES RETAILING — 3.9% | |
CVS Caremark Corp.(1) | | 1,671 | | | 95,548 | |
Kroger Co. (The)(1) | | 730 | | | 25,214 | |
Pantry, Inc. (The)(2) | | 2,926 | | | 35,639 | |
Rite Aid Corp.(1)(2) | | 26,848 | | | 76,785 | |
Safeway, Inc. | | 718 | | | 16,988 | |
Wal-Mart Stores, Inc.(1) | | 2,177 | | | 162,165 | |
| | | | | | 412,339 | |
FOOD PRODUCTS — 1.5% | |
Campbell Soup Co.(1) | | 881 | | | 39,460 | |
Darling International, Inc.(1)(2) | | 992 | | | 18,511 | |
General Mills, Inc. | | 270 | | | 13,103 | |
Sanderson Farms, Inc.(1) | | 1,327 | | | 88,139 | |
| | | | | | 159,213 | |
HEALTH CARE EQUIPMENT AND SUPPLIES — 4.5% | |
Abbott Laboratories(1) | | 2,775 | | | 96,792 | |
Becton Dickinson and Co. | | 1,036 | | | 102,388 | |
Cooper Cos., Inc. (The)(1) | | 58 | | | 6,905 | |
Exactech, Inc.(2) | | 982 | | | 19,394 | |
Intuitive Surgical, Inc.(2) | | 32 | | | 16,211 | |
Medtronic, Inc.(1) | | 692 | | | 35,617 | |
St. Jude Medical, Inc.(1) | | 2,083 | | | 95,047 | |
Stryker Corp.(1) | | 847 | | | 54,784 | |
Thoratec Corp.(1)(2) | | 540 | | | 16,907 | |
Zimmer Holdings, Inc.(1) | | 340 | | | 25,480 | |
| | | | | | 469,525 | |
HEALTH CARE PROVIDERS AND SERVICES — 1.6% | |
AmerisourceBergen Corp. | | 1,673 | | | 93,404 | |
Providence Service Corp. (The)(2) | | 806 | | | 23,446 | |
Quest Diagnostics, Inc.(1) | | 767 | | | 46,503 | |
| | | | | | 163,353 | |
HEALTH CARE TECHNOLOGY — 0.6% | |
Omnicell, Inc.(1)(2) | | 2,858 | | | 58,732 | |
HOTELS, RESTAURANTS AND LEISURE — 3.9% | |
Bally Technologies, Inc.(1)(2) | | 1,431 | | | 80,737 | |
Cracker Barrel Old Country Store, Inc.(1) | | 247 | | | 23,381 | |
Domino’s Pizza, Inc.(1) | | 212 | | | 12,328 | |
International Game Technology(1) | | 1,930 | | | 32,250 | |
Jack in the Box, Inc.(2) | | 148 | | | 5,815 | |
Las Vegas Sands Corp.(1) | | 737 | | | 39,009 | |
McDonald’s Corp.(1) | | 525 | | | 51,975 | |
Multimedia Games Holding Co., Inc.(1)(2) | | 3,429 | | | 89,394 | |
SHFL Entertainment, Inc.(1)(2) | | 969 | | | 17,161 | |
Sonic Corp.(1)(2) | | 2,521 | | | 36,706 | |
Town Sports International Holdings, Inc.(1) | | 2,267 | | | 24,416 | |
| | | | | | 413,172 | |
HOUSEHOLD DURABLES — 1.1% | |
Garmin Ltd.(1) | | 950 | | | $ 34,352 | |
iRobot Corp.(1)(2) | | 1,959 | | | 77,909 | |
| | | | | | 112,261 | |
HOUSEHOLD PRODUCTS — 0.5% | |
Procter & Gamble Co. (The) | | 646 | | | 49,736 | |
INDUSTRIAL CONGLOMERATES — 2.2% | |
3M Co.(1) | | 951 | | | 103,992 | |
Carlisle Cos., Inc. | | 411 | | | 25,609 | |
Danaher Corp.(1) | | 1,529 | | | 96,786 | |
| | | | | | 226,387 | |
INSURANCE — 1.6% | |
Allied World Assurance Co. Holdings AG(1) | | 127 | | | 11,622 | |
Amtrust Financial Services, Inc. | | 1,062 | | | 37,913 | |
HCI Group, Inc.(1) | | 1,456 | | | 44,728 | |
Marsh & McLennan Cos., Inc.(1) | | 193 | | | 7,705 | |
Travelers Cos., Inc. (The)(1) | | 811 | | | 64,815 | |
Universal Insurance Holdings, Inc. | | 708 | | | 5,013 | |
| | | | | | 171,796 | |
INTERNET AND CATALOG RETAIL — 3.1% | |
Amazon.com, Inc.(1)(2) | | 190 | | | 52,761 | |
Expedia, Inc.(1) | | 1,201 | | | 72,240 | |
HomeAway, Inc.(1)(2) | | 952 | | | 30,788 | |
Orbitz Worldwide, Inc.(2) | | 10,260 | | | 82,388 | |
Overstock.com, Inc.(2) | | 2,024 | | | 57,077 | |
PetMed Express, Inc.(1) | | 2,669 | | | 33,629 | |
| | | | | | 328,883 | |
INTERNET SOFTWARE AND SERVICES — 5.5% | |
Active Network, Inc. (The)(1)(2) | | 1,036 | | | 7,843 | |
Demand Media, Inc.(1)(2) | | 3,944 | | | 23,664 | |
eBay, Inc.(2) | | 109 | | | 5,637 | |
Google, Inc., Class A(1)(2) | | 433 | | | 381,200 | |
LinkedIn Corp., Class A(2) | | 371 | | | 66,149 | |
ValueClick, Inc.(2) | | 504 | | | 12,439 | |
XO Group, Inc.(1)(2) | | 7,154 | | | 80,125 | |
| | | | | | 577,057 | |
IT SERVICES — 6.0% | |
Accenture plc, Class A(1) | | 1,527 | | | 109,883 | |
CSG Systems International, Inc.(1)(2) | | 408 | | | 8,854 | |
Heartland Payment Systems, Inc. | | 255 | | | 9,499 | |
International Business Machines Corp.(1) | | 1,002 | | | 191,492 | |
Jack Henry & Associates, Inc.(1) | | 1,263 | | | 59,525 | |
Lender Processing Services, Inc.(1) | | 647 | | | 20,930 | |
MasterCard, Inc., Class A(1) | | 223 | | | 128,114 | |
NeuStar, Inc., Class A(2) | | 147 | | | 7,156 | |
SAIC, Inc.(1) | | 2,129 | | | 29,657 | |
Teradata Corp.(2) | | 106 | | | 5,324 | |
Total System Services, Inc.(1) | | 905 | | | 22,154 | |
Visa, Inc., Class A(1) | | 206 | | | 37,647 | |
| | | | | | 630,235 | |
LEISURE EQUIPMENT AND PRODUCTS — 2.2% | |
Arctic Cat, Inc.(1) | | 1,639 | | | 73,722 | |
Hasbro, Inc. | | 1,726 | | | 77,377 | |
LeapFrog Enterprises, Inc.(1)(2) | | 3,705 | | | 36,457 | |
Mattel, Inc. | | 194 | | | 8,790 | |
Polaris Industries, Inc.(1) | | 363 | | | 34,485 | |
| | | | | | 230,831 | |
LIFE SCIENCES TOOLS AND SERVICES — 0.2% | |
Agilent Technologies, Inc.(1) | | 508 | | | 21,722 | |
MACHINERY — 2.0% | |
Actuant Corp., Class A(1) | | 1,123 | | | 37,025 | |
Cummins, Inc.(1) | | 156 | | | 16,920 | |
Ingersoll-Rand plc(1) | | 1,022 | | | 56,741 | |
Lindsay Corp. | | 684 | | | 51,286 | |
Parker-Hannifin Corp.(1) | | 174 | | | 16,600 | |
WABCO Holdings, Inc.(1)(2) | | 436 | | | 32,565 | |
| | | | | | 211,137 | |
MEDIA — 3.2% | |
Comcast Corp., Class A(1) | | 3,436 | | | 143,900 | |
DIRECTV(2) | | 404 | | | 24,895 | |
Lions Gate Entertainment Corp.(2) | | 1,805 | | | 49,583 | |
News Corp., Class A(1) | | 219 | | | 7,140 | |
ReachLocal, Inc.(1)(2) | | 1,774 | | | 21,749 | |
Regal Entertainment Group, Class A(1) | | 1,788 | | | 32,005 | |
Time Warner Cable, Inc. | | 513 | | | 57,702 | |
| | | | | | 336,974 | |
METALS AND MINING — 0.2% | |
Coeur Mining, Inc.(1)(2) | | 1,235 | | | 16,426 | |
MULTILINE RETAIL — 0.1% | |
Macy’s, Inc.(1) | | 267 | | | 12,816 | |
OIL, GAS AND CONSUMABLE FUELS — 1.4% | |
Alon USA Energy, Inc.(1) | | 1,716 | | | 24,813 | |
CVR Energy, Inc. | | 1,069 | | | 50,671 | |
Western Refining, Inc.(1) | | 2,406 | | | 67,536 | |
| | | | | | 143,020 | |
PAPER AND FOREST PRODUCTS — 0.5% | |
Schweitzer-Mauduit International, Inc.(1) | | 1,156 | | | $ 57,661 | |
PERSONAL PRODUCTS — 0.8% | |
Medifast, Inc.(2) | | 791 | | | 20,376 | |
Nu Skin Enterprises, Inc., Class A(1) | | 420 | | | 25,670 | |
USANA Health Sciences, Inc.(1)(2) | | 531 | | | 38,434 | |
| | | | | | 84,480 | |
PHARMACEUTICALS — 6.7% | |
AbbVie, Inc.(1) | | 2,541 | | | 105,045 | |
Allergan, Inc.(1) | | 806 | | | 67,897 | |
Auxilium Pharmaceuticals, Inc.(1)(2) | | 332 | | | 5,521 | |
Bristol-Myers Squibb Co.(1) | | 3,965 | | | 177,196 | |
Cumberland Pharmaceuticals, Inc.(1)(2) | | 7,114 | | | 36,353 | |
Eli Lilly & Co.(1) | | 1,828 | | | 89,791 | |
Endocyte, Inc.(1)(2) | | 5,572 | | | 73,160 | |
Johnson & Johnson(1) | | 1,724 | | | 148,023 | |
| | | | | | 702,986 | |
PROFESSIONAL SERVICES — 2.4% | |
Dun & Bradstreet Corp.(1) | | 915 | | | 89,167 | |
Kforce, Inc.(1) | | 5,492 | | | 80,183 | |
RPX Corp.(1)(2) | | 4,844 | | | 81,379 | |
| | | | | | 250,729 | |
ROAD AND RAIL — 0.3% | |
Swift Transportation Co.(2) | | 728 | | | 12,041 | |
Union Pacific Corp.(1) | | 96 | | | 14,811 | |
| | | | | | 26,852 | |
SEMICONDUCTORS AND SEMICONDUCTOR EQUIPMENT — 4.9% | |
Analog Devices, Inc.(1) | | 972 | | | 43,798 | |
Broadcom Corp., Class A(1) | | 2,736 | | | 92,367 | |
Cabot Microelectronics Corp.(2) | | 466 | | | 15,383 | |
Intel Corp.(1) | | 2,799 | | | 67,792 | |
LSI Corp.(1)(2) | | 7,307 | | | 52,172 | |
Maxim Integrated Products, Inc.(1) | | 220 | | | 6,111 | |
MaxLinear, Inc., Class A(1)(2) | | 6,205 | | | 43,435 | |
PLX Technology, Inc.(1)(2) | | 4,025 | | | 19,159 | |
Semtech Corp.(2) | | 271 | | | 9,493 | |
Skyworks Solutions, Inc.(1)(2) | | 484 | | | 10,595 | |
Texas Instruments, Inc.(1) | | 2,825 | | | 98,508 | |
Volterra Semiconductor Corp.(1)(2) | | 3,864 | | | 54,560 | |
| | | | | | 513,373 | |
SOFTWARE — 9.5% | |
Adobe Systems, Inc.(1)(2) | | 835 | | | 38,043 | |
CA, Inc.(1) | | 939 | | | 26,883 | |
Cadence Design Systems, Inc.(1)(2) | | 5,191 | | | 75,166 | |
CommVault Systems, Inc.(2) | | 185 | | | 14,040 | |
Digimarc Corp.(1) | | 551 | | | 11,444 | |
Intuit, Inc.(1) | | 1,699 | | | 103,690 | |
Mentor Graphics Corp.(1) | | 1,951 | | | 38,142 | |
Microsoft Corp.(1) | | 10,120 | | | 349,443 | |
NetScout Systems, Inc.(2) | | 440 | | | 10,270 | |
Oracle Corp.(1) | | 7,055 | | | 216,730 | |
Symantec Corp.(1) | | 1,787 | | | 40,154 | |
Synopsys, Inc.(1)(2) | | 1,022 | | | 36,536 | |
VMware, Inc., Class A(1)(2) | | 625 | | | 41,869 | |
| | | | | | 1,002,410 | |
SPECIALTY RETAIL — 7.7% | |
Advance Auto Parts, Inc.(1) | | 63 | | | 5,114 | |
American Eagle Outfitters, Inc.(1) | | 3,672 | | | 67,051 | |
ANN, Inc.(1)(2) | | 876 | | | 29,083 | |
Buckle, Inc. (The) | | 266 | | | 13,837 | |
Chico’s FAS, Inc. | | 455 | | | 7,762 | |
Destination Maternity Corp.(1) | | 1,657 | | | 40,762 | |
Foot Locker, Inc.(1) | | 1,942 | | | 68,223 | |
Gap, Inc. (The)(1) | | 2,273 | | | 94,852 | |
Home Depot, Inc. (The)(1) | | 2,151 | | | 166,638 | |
O’Reilly Automotive, Inc.(1)(2) | | 940 | | | 105,863 | |
PetSmart, Inc.(1) | | 1,206 | | | 80,790 | |
TJX Cos., Inc. (The)(1) | | 2,479 | | | 124,099 | |
| | | | | | 804,074 | |
TEXTILES, APPAREL AND LUXURY GOODS — 1.5% | |
Coach, Inc.(1) | | 107 | | | 6,109 | |
Crocs, Inc.(1)(2) | | 1,179 | | | 19,453 | |
Hanesbrands, Inc.(1) | | 1,923 | | | 98,881 | |
Ralph Lauren Corp. | | 175 | | | 30,404 | |
RG Barry Corp.(1) | | 430 | | | 6,983 | |
| | | | | | 161,830 | |
THRIFTS AND MORTGAGE FINANCE — 0.6% | |
Ocwen Financial Corp.(1)(2) | | 1,426 | | | 58,780 | |
TOBACCO — 1.4% | |
Altria Group, Inc.(1) | | 1,377 | | | 48,181 | |
Philip Morris International, Inc.(1) | | 1,161 | | | 100,566 | |
| | | | | | 148,747 | |
TRADING COMPANIES AND DISTRIBUTORS — 0.1% | |
Aceto Corp. | | 647 | | | $ 9,013 | |
TOTAL COMMON STOCKS (Cost $11,947,455) | | | 13,494,440 | |
Temporary Cash Investments — 1.9% | |
Repurchase Agreement, Bank of America Merrill Lynch, (collateralized by various U.S. Treasury obligations, 1.00%, 1/15/14, valued at $26,354), in a joint trading account at 0.06%, dated 6/28/13, due 7/1/13 (Delivery value $25,815) | | | 25,815 | |
Repurchase Agreement, Credit Suisse First Boston, Inc., (collateralized by various U.S. Treasury obligations, 4.25%, 11/15/40, valued at $78,908), in a joint trading account at 0.05%, dated 6/28/13, due 7/1/13 (Delivery value $77,444) | | | 77,444 | |
Repurchase Agreement, Goldman Sachs & Co., (collateralized by various U.S. Treasury obligations, 3.125%, 11/15/41, valued at $26,257), in a joint trading account at 0.04%, dated 6/28/13, due 7/1/13 (Delivery value $25,815) | | | 25,815 | |
SSgA U.S. Government Money Market Fund | | 71,688 | | | 71,688 | |
TOTAL TEMPORARY CASH INVESTMENTS(Cost $200,762) | | | 200,762 | |
TOTAL INVESTMENT SECURITIES BEFORE SECURITIES SOLD SHORT — 130.5%(Cost $12,148,217) | | | 13,695,202 | |
Common Stocks Sold Short — (29.7)% | |
AEROSPACE AND DEFENSE — (0.2)% | |
CPI Aerostructures, Inc. | | (1,833 | ) | | (19,888 | ) |
AIR FREIGHT AND LOGISTICS — (0.7)% | |
Pacer International, Inc. | | (12,456 | ) | | (78,597 | ) |
AUTOMOBILES — (0.1)% | |
Winnebago Industries, Inc. | | (501 | ) | | (10,516 | ) |
BIOTECHNOLOGY — (0.2)% | |
Medivation, Inc. | | (462 | ) | | (22,730 | ) |
CAPITAL MARKETS — (0.6)% | |
Stifel Financial Corp. | | (423 | ) | | (15,088 | ) |
Virtus Investment Partners, Inc. | | (246 | ) | | (43,363 | ) |
| | | | | | (58,451 | ) |
CHEMICALS — (1.7)% | |
ADA-ES, Inc. | | (1,929 | ) | | (81,249 | ) |
Calgon Carbon Corp. | | (3,313 | ) | | (55,261 | ) |
LSB Industries, Inc. | | (1,551 | ) | | (47,166 | ) |
| | | | | | (183,676 | ) |
COMMERCIAL BANKS — (0.7)% | |
Bank of the Ozarks, Inc. | | (1,326 | ) | | (57,456 | ) |
Texas Capital Bancshares, Inc. | | (476 | ) | | (21,115 | ) |
| | | | | | (78,571 | ) |
COMMERCIAL SERVICES AND SUPPLIES — (1.0)% | |
Heritage-Crystal Clean, Inc. | | (4,790 | ) | | (69,982 | ) |
InnerWorkings, Inc. | | (1,237 | ) | | (13,422 | ) |
Interface, Inc. | | (769 | ) | | (13,050 | ) |
Standard Parking Corp. | | (457 | ) | | (9,807 | ) |
| | | | | | (106,261 | ) |
COMMUNICATIONS EQUIPMENT — (0.9)% | |
Aware, Inc. | | (7,477 | ) | | (38,880 | ) |
ViaSat, Inc. | | (773 | ) | | (55,239 | ) |
| | | | | | (94,119 | ) |
COMPUTERS AND PERIPHERALS — (0.5)% | |
Datalink Corp. | | (3,876 | ) | | (41,241 | ) |
Stratasys Ltd. | | (79 | ) | | (6,615 | ) |
| | | | | | (47,856 | ) |
CONSTRUCTION AND ENGINEERING — (0.6)% | |
Great Lakes Dredge & Dock Corp. | | (8,663 | ) | | (67,745 | ) |
DIVERSIFIED CONSUMER SERVICES — (0.5)% | |
Sotheby’s | | (1,308 | ) | | (49,586 | ) |
DIVERSIFIED TELECOMMUNICATION SERVICES — (0.4)% | |
Cincinnati Bell, Inc. | | (10,381 | ) | | (31,766 | ) |
Consolidated Communications Holdings, Inc. | | (323 | ) | | (5,623 | ) |
| | | | | | (37,389 | ) |
ELECTRIC UTILITIES — (0.1)% | |
ITC Holdings Corp. | | (68 | ) | | (6,208 | ) |
ELECTRICAL EQUIPMENT — (0.4)% | |
Franklin Electric Co., Inc. | | (1,364 | ) | | (45,899 | ) |
ELECTRONIC EQUIPMENT, INSTRUMENTS AND COMPONENTS — (0.8)% | |
Maxwell Technologies, Inc. | | (986 | ) | | (7,050 | ) |
OSI Systems, Inc. | | (960 | ) | | (61,843 | ) |
Rogers Corp. | | (369 | ) | | (17,461 | ) |
| | | | | | (86,354 | ) |
ENERGY EQUIPMENT AND SERVICES — (0.4)% | |
Atwood Oceanics, Inc. | | (151 | ) | | (7,860 | ) |
Gulfmark Offshore, Inc., Class A | | (269 | ) | | (12,129 | ) |
SEACOR Holdings, Inc. | | (217 | ) | | (18,022 | ) |
| | | | | | (38,011 | ) |
FOOD PRODUCTS — (0.1)% | |
Snyders-Lance, Inc. | | (201 | ) | | (5,710 | ) |
GAS UTILITIES — (0.4)% | |
ONEOK, Inc. | | (298 | ) | | (12,311 | ) |
South Jersey Industries, Inc. | | (476 | ) | | (27,327 | ) |
| | | | | | (39,638 | ) |
HEALTH CARE EQUIPMENT AND SUPPLIES — (1.5)% | |
Antares Pharma, Inc. | | (2,043 | ) | | $ (8,499 | ) |
AtriCure, Inc. | | (2,191 | ) | | (20,814 | ) |
Haemonetics Corp. | | (371 | ) | | (15,341 | ) |
Insulet Corp. | | (225 | ) | | (7,067 | ) |
Merit Medical Systems, Inc. | | (3,237 | ) | | (36,093 | ) |
Volcano Corp. | | (452 | ) | | (8,195 | ) |
West Pharmaceutical Services, Inc. | | (813 | ) | | (57,121 | ) |
| | | | | | (153,130 | ) |
HEALTH CARE PROVIDERS AND SERVICES — (0.6)% | |
Acadia Healthcare Co., Inc. | | (1,457 | ) | | (48,183 | ) |
Accretive Health, Inc. | | (1,153 | ) | | (12,464 | ) |
| | | | | | (60,647 | ) |
HOTELS, RESTAURANTS AND LEISURE — (0.6)% | |
BJ’s Restaurants, Inc. | | (1,300 | ) | | (48,230 | ) |
MTR Gaming Group, Inc. | | (5,577 | ) | | (18,683 | ) |
| | | | | | (66,913 | ) |
INSURANCE — (0.8)% | |
State Auto Financial Corp. | | (2,954 | ) | | (53,674 | ) |
Tower Group International Ltd. | | (1,421 | ) | | (29,145 | ) |
| | | | | | (82,819 | ) |
INTERNET SOFTWARE AND SERVICES — (1.7)% | |
Internap Network Services Corp. | | (5,134 | ) | | (42,458 | ) |
NIC, Inc. | | (1,403 | ) | | (23,192 | ) |
Spark Networks, Inc. | | (8,591 | ) | | (72,594 | ) |
SPS Commerce, Inc. | | (667 | ) | | (36,685 | ) |
| | | | | | (174,929 | ) |
IT SERVICES — (0.2)% | |
EPAM Systems, Inc. | | (678 | ) | | (18,428 | ) |
LEISURE EQUIPMENT AND PRODUCTS — (0.2)% | |
Marine Products Corp. | | (2,077 | ) | | (16,658 | ) |
LIFE SCIENCES TOOLS AND SERVICES — (0.1)% | |
Covance, Inc. | | (186 | ) | | (14,162 | ) |
MACHINERY — (0.1)% | |
Gorman-Rupp Co. (The) | | (200 | ) | | (6,368 | ) |
MARINE — (0.4)% | |
Rand Logistics, Inc. | | (8,369 | ) | | (42,933 | ) |
MEDIA — (0.9)% | |
Clear Channel Outdoor Holdings, Inc., Class A | | (1,660 | ) | | (12,384 | ) |
Loral Space & Communications, Inc. | | (1,265 | ) | | (75,875 | ) |
World Wrestling Entertainment, Inc., Class A | | (1,146 | ) | | (11,815 | ) |
| | | | | | (100,074 | ) |
METALS AND MINING — (0.9)% | |
AK Steel Holding Corp. | | (14,793 | ) | | (44,971 | ) |
Noranda Aluminum Holding Corp. | | (3,545 | ) | | (11,450 | ) |
Royal Gold, Inc. | | (430 | ) | | (18,094 | ) |
Tahoe Resources, Inc. | | (1,705 | ) | | (24,126 | ) |
| | | | | | (98,641 | ) |
OIL, GAS AND CONSUMABLE FUELS — (0.4)% | |
Kodiak Oil & Gas Corp. | | (1,353 | ) | | (12,028 | ) |
Panhandle Oil and Gas, Inc., Class A | | (982 | ) | | (27,987 | ) |
| | | | | | (40,015 | ) |
PAPER AND FOREST PRODUCTS — (0.6)% | |
Wausau Paper Corp. | | (5,781 | ) | | (65,903 | ) |
PHARMACEUTICALS — (1.2)% | |
Akorn, Inc. | | (1,574 | ) | | (21,281 | ) |
Depomed, Inc. | | (12,071 | ) | | (67,718 | ) |
Pain Therapeutics, Inc. | | (7,359 | ) | | (16,263 | ) |
Pernix Therapeutics Holdings | | (6,427 | ) | | (23,202 | ) |
| | | | | | (128,464 | ) |
PROFESSIONAL SERVICES — (0.9)% | |
Hill International, Inc. | | (17,383 | ) | | (47,629 | ) |
On Assignment, Inc. | | (1,933 | ) | | (51,650 | ) |
| | | | | | (99,279 | ) |
REAL ESTATE INVESTMENT TRUSTS (REITs) — (0.1)% | |
Rayonier, Inc. | | (104 | ) | | (5,761 | ) |
ROAD AND RAIL — (0.7)% | | | | | | |
Genesee & Wyoming, Inc., Class A | | (824 | ) | | (69,908 | ) |
SEMICONDUCTORS AND SEMICONDUCTOR EQUIPMENT — (1.5)% | |
GT Advanced Technologies, Inc. | | (17,253 | ) | | (71,600 | ) |
SunEdison, Inc. | | (10,758 | ) | | (87,893 | ) |
| | | | | | (159,493 | ) |
SOFTWARE — (0.7)% | |
Callidus Software, Inc. | | (10,395 | ) | | (68,503 | ) |
Solera Holdings, Inc. | | (109 | ) | | (6,066 | ) |
| | | | | | (74,569 | ) |
SPECIALTY RETAIL — (2.1)% | |
America’s Car-Mart, Inc. | | (118 | ) | | (5,102 | ) |
Asbury Automotive Group, Inc. | | (538 | ) | | (21,574 | ) |
bebe stores, Inc. | | (7,843 | ) | | (43,999 | ) |
CarMax, Inc. | | (904 | ) | | (41,729 | ) |
Finish Line, Inc. (The), Class A | | (1,084 | ) | | (23,696 | ) |
Monro Muffler Brake, Inc. | | (1,446 | ) | | (69,480 | ) |
Tiffany & Co. | | (244 | ) | | (17,773 | ) |
| | | | | | (223,353 | ) |
THRIFTS AND MORTGAGE FINANCE — (1.6)% | |
BofI Holding, Inc. | | (1,588 | ) | | $ (72,762 | ) |
Hingham Institution for Savings | | (329 | ) | | (22,332 | ) |
Meridian Interstate Bancorp, Inc. | | (4,166 | ) | | (78,446 | ) |
| | | | | | (173,540 | ) |
TRADING COMPANIES AND DISTRIBUTORS — (1.6)% | |
CAI International, Inc. | | (2,873 | ) | | (67,717 | ) |
H&E Equipment Services, Inc. | | (2,346 | ) | | (49,430 | ) |
Titan Machinery, Inc. | | (2,463 | ) | | (48,349 | ) |
| | | | | | (165,496 | ) |
TOTAL COMMON STOCKS SOLD SHORT — (29.7)% (Proceeds $2,814,946) | | | (3,118,688 | ) |
OTHER ASSETS AND LIABILITIES — (0.8)% | | | (85,381 | ) |
TOTAL NET ASSETS — 100.0% | | | $ 10,491,133 | |
Notes to Schedule of Investments
(1) | Security, or a portion thereof, has been pledged at the custodian bank or with a broker for collateral requirements on securities sold short. At the period end, the aggregate value of securities pledged was $8,618,202. |
See Notes to Financial Statements.
Statement of Assets and Liabilities |
JUNE 30, 2013 | |
Assets | |
Investment securities, at value (cost of $12,148,217) | | $ | 13,695,202 | |
Deposits with broker for securities sold short | | | 85,612 | |
Receivable for investments sold | | | 582,991 | |
Receivable for capital shares sold | | | 11,984 | |
Dividends and interest receivable | | | 8,197 | |
| | | | 14,383,986 | |
| | | | | |
Liabilities | | | | |
Securities sold short, at value (proceeds of $2,814,946) | | | 3,118,688 | |
Payable for investments purchased | | | 759,043 | |
Payable for capital shares redeemed | | | 1,683 | |
Accrued management fees | | | 12,386 | |
Distribution and service fees payable | | | 687 | |
Dividend expense payable on securities sold short | | | 294 | |
Broker fees and charges payable on securities sold short | | | 72 | |
| | | | 3,892,853 | |
| | | | | |
Net Assets | | $ | 10,491,133 | |
| | | | | |
Net Assets Consist of: | | | | |
Capital (par value and paid-in surplus) | | $ | 9,173,682 | |
Undistributed net realized gain | | | 74,208 | |
Net unrealized appreciation | | | 1,243,243 | |
| | | $ | 10,491,133 | |
| | | | |
| | Net assets | Shares outstanding | Net asset value per share |
Investor Class, $0.01 Par Value | $8,597,096 | 679,697 | $12.65 |
Institutional Class, $0.01 Par Value | $383,342 | 30,281 | $12.66 |
A Class, $0.01 Par Value | $653,673 | 51,756 | $12.63* |
C Class, $0.01 Par Value | $474,554 | 37,888 | $12.53 |
R Class, $0.01 Par Value | $382,468 | 30,317 | $12.62 |
*Maximum offering price $13.40 (net asset value divided by 0.9425). |
See Notes to Financial Statements.
YEAR ENDED JUNE 30, 2013 | |
Investment Income (Loss) | |
Income: | | | |
Dividends (net of foreign taxes withheld of $480) | | $ 157,056 | |
Interest | | 105 | |
| | | 157,161 | |
| | | | |
Expenses: | | | |
Dividend expense on securities sold short | | 11,809 | |
Broker fees and charges on securities sold short | | 16,227 | |
Management fees | | 98,847 | |
Distribution and service fees: | | | |
A Class | | 1,416 | |
C Class | | 4,228 | |
R Class | | 1,765 | |
Directors’ fees and expenses | | 365 | |
| | | 134,657 | |
| | | | |
Net investment income (loss) | | 22,504 | |
| | | | |
Realized and Unrealized Gain (Loss) | | | |
Net realized gain (loss) on: | | | |
Investment transactions | | 330,938 | |
Securities sold short transactions | | (241,023 | ) |
Foreign currency transactions | | 5 | |
| | | 89,920 | |
| | | | |
Change in net unrealized appreciation (depreciation) on: | | | |
Investments | | 1,421,823 | |
Securities sold short | | (369,746 | ) |
| | | 1,052,077 | |
| | | | |
Net realized and unrealized gain (loss) | | 1,141,997 | |
| | | | |
Net Increase (Decrease) in Net Assets Resulting from Operations | | $1,164,501 | |
See Notes to Financial Statements.
Statement of Changes in Net Assets |
YEAR ENDED JUNE 30, 2013 AND PERIOD ENDED JUNE 30, 2012 | |
Increase (Decrease) in Net Assets | | June 30, 2013 | | | June 30, 2012(1) | |
Operations | |
Net investment income (loss) | | $ 22,504 | | | $ (10,888 | ) |
Net realized gain (loss) | | 89,920 | | | (8,373 | ) |
Change in net unrealized appreciation (depreciation) | | 1,052,077 | | | 191,166 | |
Net increase (decrease) in net assets resulting from operations | | 1,164,501 | | | 171,905 | |
| | | | | | | |
Distributions to Shareholders | |
From net investment income: | | | | | | |
Investor Class | | (14,266 | ) | | (1,043 | ) |
Institutional Class | | (2,608 | ) | | (462 | ) |
A Class | | (1,698 | ) | | (244 | ) |
R Class | | (253 | ) | | (117 | ) |
Decrease in net assets from distributions | | (18,825 | ) | | (1,866 | ) |
| | | | | | | |
Capital Share Transactions | |
Net increase (decrease) in net assets from capital share transactions | | 5,545,799 | | | 3,629,619 | |
| | | | | | | |
Net increase (decrease) in net assets | | 6,691,475 | | | 3,799,658 | |
| | | | | | | |
Net Assets | |
Beginning of period | | 3,799,658 | | | — | |
End of period | | $10,491,133 | | | $3,799,658 | |
| | | | | | | |
Distributions in excess of net investment income | | — | | | $(10,918 | ) |
(1) | October 31, 2011 (fund inception) through June 30, 2012. |
See Notes to Financial Statements.
YEAR ENDED JUNE 30, 2013 | |
Cash Flows From (Used In) Operating Activities | |
Net increase (decrease) in net assets resulting from operations | | $ 1,164,501 | |
Adjustments to reconcile net increase (decrease) in net assets resulting from operations to net cash from (used in) operating activities: | | | |
Purchases of investment securities | | (12,007,351 | ) |
Proceeds from investments sold | | 5,151,606 | |
Purchases to cover securities sold short | | (2,223,409 | ) |
Proceeds from securities sold short | | 3,601,447 | |
(Increase) decrease in short-term investments | | (200,762 | ) |
(Increase) decrease in deposits with broker for securities sold short | | (60,193 | ) |
(Increase) decrease in receivable for investments sold | | (512,097 | ) |
(Increase) decrease in dividends and interest receivable | | (3,668 | ) |
Increase (decrease) in payable for investments purchased | | 721,451 | |
Increase (decrease) in accrued management fees | | 8,001 | |
Increase (decrease) in distribution and service fees payable | | 181 | |
Increase (decrease) in dividend expense payable on securities sold short | | (686 | ) |
Increase (decrease) in broker fees and charges payable on securities sold short | | (1 | ) |
Change in net unrealized (appreciation) depreciation on investments | | (1,421,823 | ) |
Net realized (gain) loss on investment transactions | | (330,938 | ) |
Change in net unrealized (appreciation) depreciation on securities sold short | | 369,746 | |
Net realized (gain) loss on securities sold short transactions | | 241,023 | |
Net cash from (used in) operating activities | | (5,502,972 | ) |
| | | | |
Cash Flows From (Used In) Financing Activities | |
Proceeds from shares sold | | 7,751,978 | |
Payments for shares redeemed | | (2,223,164 | ) |
Increase (decrease) in disbursements in excess of demand deposit cash | | (25,208 | ) |
Distributions paid, net of reinvestments | | (634 | ) |
Net cash from (used in) financing activities | | 5,502,972 | |
| | | | |
Net Increase (Decrease) In Cash | | — | |
Cash at beginning of period | | — | |
Cash at end of period | | — | |
Supplemental disclosure of cash flow information:
Non cash financing activities not included herein consist of all reinvestment of distributions of $18,191.
See Notes to Financial Statements.
Notes to Financial Statements |
JUNE 30, 2013
1. Organization
American Century Quantitative Equity Funds, Inc. (the corporation) is registered under the Investment Company Act of 1940, as amended (the 1940 Act), as an open-end management investment company and is organized as a Maryland corporation. Disciplined Growth Plus Fund (the fund) is one fund in a series issued by the corporation. The fund is diversified as defined under the 1940 Act. The fund’s investment objective is to seek long-term capital growth.
The fund offers the Investor Class, the Institutional Class, the A Class, the C Class and the R Class. The A Class may incur an initial sales charge. The A Class and C Class may be subject to a contingent deferred sales charge. The share classes differ principally in their respective sales charges and distribution and shareholder servicing expenses and arrangements. The Institutional Class is made available to institutional shareholders or through financial intermediaries whose clients do not require the same level of shareholder and administrative services as shareholders of other classes. As a result, the Institutional Class is charged a lower unified management fee. All classes of the fund commenced sale on October 31, 2011, the fund’s inception date.
2. Significant Accounting Policies
The following is a summary of significant accounting policies consistently followed by the fund in preparation of its financial statements. The financial statements are prepared in conformity with accounting principles generally accepted in the United States of America, which may require management to make certain estimates and assumptions at the date of the financial statements. Actual results could differ from these estimates.
Investment Valuations — The fund determines the fair value of its investments and computes its net asset value per share as of the close of regular trading (usually 4 p.m. Eastern time) on the New York Stock Exchange (NYSE) on each day the NYSE is open.
Equity securities that are listed or traded on a domestic securities exchange are valued at the last reported sales price or at the official closing price as provided by the exchange. Equity securities traded on foreign securities exchanges are typically valued at the closing price on the exchange where primarily traded or as of the close of the NYSE, if that is earlier. If no last sales price is reported, or if local convention or regulation so provides, the mean of the latest bid and asked prices is used. Depending on local convention or regulation, securities traded over-the-counter are valued at the mean of the latest bid and asked prices, the last sales price, or the official closing price. In its determination of fair value, the fund may review several factors including: market information specific to a security; news developments in U.S. and foreign markets; the performance of particular U.S. and foreign securities, indices, comparable securities, American Depositary Receipts, Exchange-Traded Funds, and other relevant market indicators.
Debt securities maturing within 60 days at the time of purchase may be valued at cost, plus or minus any amortized discount or premium or at the evaluated mean as provided by an independent pricing service. Evaluated mean prices are commonly derived through utilization of market models, which may consider, among other factors, trade data, quotations from dealers and active market makers, relevant yield curve and spread data, related sector levels, creditworthiness, and other relevant market information on the same or comparable securities.
Investments in open-end management investment companies are valued at the reported net asset value per share. Repurchase agreements are valued at cost.
The value of investments initially expressed in foreign currencies is translated into U.S. dollars at prevailing exchange rates.
If the fund determines that the market price for a portfolio security is not readily available or the valuation methods mentioned above do not reflect a security’s fair value, such security is valued as determined in good faith by the Board of Directors or its designee, in accordance with procedures adopted by the Board of Directors. Circumstances that may cause the fund to use these procedures to value a security include, but are not limited to: a security has been declared in default; trading in a security has been halted during the trading day; there is a foreign market holiday and no trading occurred; or an event occurred between the close of a foreign exchange and the NYSE that may affect the value of a security.Security Transactions — Security transactions are accounted for as of the trade date. Net realized gains and losses are determined on the identified cost basis, which is also used for federal income tax purposes.
Investment Income — Dividend income less foreign taxes withheld, if any, is recorded as of the ex-dividend date. Distributions received on securities that represent a return of capital or long-term capital gain are recorded as a reduction of cost of investments and/or as a realized gain. The fund may estimate the components of distributions received that may be considered nontaxable distributions or long-term capital gain distributions for income tax purposes. Interest income is recorded on the accrual basis and includes accretion of discounts and amortization of premiums.
Securities Sold Short — The fund enters into short sales, which is selling securities it does not own, as part of its normal investment activities. Upon selling a security short, the fund will segregate cash, cash equivalents or other appropriate liquid securities in at least an amount equal to the current market value of the securities sold short until the fund replaces the borrowed security. Interest earned on segregated cash for securities sold short is reflected as interest income. The fund is required to pay any dividends or interest due on securities sold short. Such dividends and interest are recorded as an expense. The fund may pay fees or charges on the assets borrowed for securities sold short. Liabilities for securities sold short are valued daily and changes in value are recorded as change in net unrealized appreciation (depreciation) on securities sold short. The fund records realized gain (loss) on a security sold short when it is terminated by the fund and includes as a component of net realized gain (loss) on securities sold short transactions.
Foreign Currency Translations — All assets and liabilities initially expressed in foreign currencies are translated into U.S. dollars at prevailing exchange rates at period end. The fund may enter into spot foreign currency exchange contracts to facilitate transactions denominated in a foreign currency. Purchases and sales of investment securities, dividend and interest income, spot foreign currency exchange contracts, and expenses are translated at the rates of exchange prevailing on the respective dates of such transactions. Net realized and unrealized foreign currency exchange gains or losses related to investment securities are a component of net realized gain (loss) on investment transactions and change in net unrealized appreciation (depreciation) on investments, respectively. Net realized and unrealized foreign currency exchange gains or losses related to securities sold short are a component of net realized gain (loss) on securities sold short transactions and change in net unrealized appreciation (depreciation) on securities sold short, respectively.
Repurchase Agreements — The fund may enter into repurchase agreements with institutions that American Century Investment Management, Inc. (ACIM) (the investment advisor) has determined are creditworthy pursuant to criteria adopted by the Board of Directors. The fund requires that the collateral, represented by securities, received in a repurchase transaction be transferred to the custodian in a manner sufficient to enable the fund to obtain those securities in the event of a default under the repurchase agreement. ACIM monitors, on a daily basis, the securities transferred to ensure the value, including accrued interest, of the securities under each repurchase agreement is equal to or greater than amounts owed to the fund under each repurchase agreement.
Joint Trading Account — Pursuant to an Exemptive Order issued by the Securities and Exchange Commission, the fund, along with certain other funds in the American Century Investments family of funds, may transfer uninvested cash balances into a joint trading account. These balances are invested in one or more repurchase agreements that are collateralized by U.S. Treasury or Agency obligations.
Segregated Assets — In accordance with the 1940 Act, the fund segregates assets on its books and records to cover certain types of investments, including, but not limited to, futures contracts and short sales. ACIM monitors, on a daily basis, the securities segregated to ensure the fund designates a sufficient amount of liquid assets, marked-to-market daily. The fund may also receive assets or be required to pledge assets at the custodian bank or with a broker for margin requirements on futures contracts and short sales.
Income Tax Status — It is the fund’s policy to distribute substantially all net investment income and net realized gains to shareholders and to otherwise qualify as a regulated investment company under provisions of the Internal Revenue Code. Accordingly, no provision has been made for income taxes. The fund files U.S. federal, state, local and non-U.S. tax returns as applicable. The fund’s tax returns are subject to examination by the relevant taxing authority until expiration of the applicable statute of limitations, which is generally three years from the date of filing but can be longer in certain jurisdictions. At this time, management believes there are no uncertain tax positions which, based on their technical merit, would not be sustained upon examination and for which it is reasonably possible that the total amounts of unrecognized tax benefits will significantly change in the next twelve months.
Multiple Class — All shares of the fund represent an equal pro rata interest in the net assets of the class to which such shares belong, and have identical voting, dividend, liquidation and other rights and the same terms and conditions, except for class specific expenses and exclusive rights to vote on matters affecting only individual classes. Income, non-class specific expenses, and realized and unrealized capital gains and losses of the fund are allocated to each class of shares based on their relative net assets.
Distributions to Shareholders — Distributions from net investment income, if any, are generally declared and paid semiannually. Distributions from net realized gains, if any, are generally declared and paid annually.
Indemnifications — Under the corporation’s organizational documents, its officers and directors are indemnified against certain liabilities arising out of the performance of their duties to the fund. In addition, in the normal course of business, the fund enters into contracts that provide general indemnifications. The maximum exposure under these arrangements is unknown as this would involve future claims that may be made against a fund. The risk of material loss from such claims is considered by management to be remote.
Statement of Cash Flows — The beginning of period and end of period cash in the Statement of Cash Flows is the amount of domestic and foreign currency included in the fund’s Statement of Assets and Liabilities and represents the cash on hand at the custodian bank and does not include any short-term investments or deposits with brokers for securities sold short.
3. Fees and Transactions with Related Parties
Management Fees — The corporation has entered into a management agreement with ACIM, under which ACIM provides the fund with investment advisory and management services in exchange for a single, unified management fee (the fee) per class. The agreement provides that all expenses of managing and operating the fund, except distribution and service fees, expenses on securities sold short, brokerage expenses, taxes, interest, fees and expenses of the independent directors (including legal counsel fees), and extraordinary expenses, will be paid by ACIM. The fee is computed and accrued daily based on each class’s daily net assets and paid monthly in arrears. The fee consists of (1) an Investment Category Fee based on the daily net assets of the fund and certain other accounts managed by the investment advisor that are in the same broad investment category as the fund and (2) a Complex Fee based on the assets of all the funds in the American Century Investments family of funds. The rates for the Investment Category Fee range from 1.1180% to 1.3000%. The rates for the Complex Fee range from 0.2500% to 0.3100% for the Investor Class, A Class, C Class and R Class. The Institutional Class is 0.2000% less at each point within the Complex Fee range. The effective annual management fee for each class for the year ended June 30, 2013 was 1.45% for the Investor Class, A Class, C Class and R Class and 1.25% for the Institutional Class.
Distribution and Service Fees — The Board of Directors has adopted a separate Master Distribution and Individual Shareholder Services Plan for each of the A Class, C Class and R Class (collectively the plans), pursuant to Rule 12b-1 of the 1940 Act. The plans provide that the A Class will pay American Century Investment Services, Inc. (ACIS) an annual distribution and service fee of 0.25%. The plans provide that the C Class will pay ACIS an annual distribution and service fee of 1.00%, of which 0.25% is paid for individual shareholder services and 0.75% is paid for distribution services. The plans provide that the R Class will pay ACIS an annual distribution and service fee of 0.50%. The fees are computed and accrued daily based on each class’s daily net assets and paid monthly in arrears. The fees are used to pay financial intermediaries for distribution and individual shareholder services. Fees incurred under the plans during the year ended June 30, 2013 are detailed in the Statement of Operations.
Related Parties — Certain officers and directors of the corporation are also officers and/or directors of American Century Companies, Inc. (ACC). The corporation’s investment advisor, ACIM, the corporation’s distributor, ACIS, and the corporation’s transfer agent, American Century Services, LLC are wholly owned, directly or indirectly, by ACC. ACIM owns 15% of the outstanding shares of the fund.
4. Investment Transactions
Purchases and sales of investment securities and securities sold short, excluding short-term investments, for the year ended June 30, 2013 were $14,229,186 and $8,753,053, respectively.
5. Capital Share Transactions
Transactions in shares of the fund were as follows:
| | | | | | | |
| | | Year ended June 30, 2013 | | | Period ended June 30, 2012(1) | |
| | | Shares | | | Amount | | | Shares | | | Amount | |
Investor Class/Shares Authorized | | 10,000,000 | | | | | | 10,000,000 | | | | |
Sold | | 646,550 | | | $ 7,547,211 | | | 259,750 | | | $2,749,927 | |
Issued in reinvestment of distributions | | 1,222 | | | 13,632 | | | 95 | | | 942 | |
Redeemed | | (175,129 | ) | | (2,103,544 | ) | | (52,791 | ) | | (569,221 | ) |
| | | 472,643 | | | 5,457,299 | | | 207,054 | | | 2,181,648 | |
Institutional Class/Shares Authorized | | 10,000,000 | | | | | | 10,000,000 | | | | |
Sold | | — | | | — | | | 30,000 | | | 300,000 | |
Issued in reinvestment of distributions | | 234 | | | 2,608 | | | 47 | | | 462 | |
| | | 234 | | | 2,608 | | | 30,047 | | | 300,462 | |
A Class/Shares Authorized | | 10,000,000 | | | | | | 10,000,000 | | | | |
Sold | | 9,549 | | | 116,097 | | | 53,230 | | | 549,047 | |
Issued in reinvestment of distributions | | 152 | | | 1,698 | | | 24 | | | 244 | |
Redeemed | | (10,244 | ) | | (116,000 | ) | | (955 | ) | | (10,319 | ) |
| | | (543 | ) | | 1,795 | | | 52,299 | | | 538,972 | |
C Class/Shares Authorized | | 10,000,000 | | | | | | 10,000,000 | | | | |
Sold | | 7,614 | | | 86,275 | | | 30,714 | | | 308,000 | |
Redeemed | | (440 | ) | | (5,303 | ) | | — | | | — | |
| | | 7,174 | | | 80,972 | | | 30,714 | | | 308,000 | |
R Class/Shares Authorized | | 10,000,000 | | | | | | 10,000,000 | | | | |
Sold | | 244 | | | 2,872 | | | 30,038 | | | 300,420 | |
Issued in reinvestment of distributions | | 23 | | | 253 | | | 12 | | | 117 | |
| | | 267 | | | 3,125 | | | 30,050 | | | 300,537 | |
Net increase (decrease) | | 479,775 | | | $ 5,545,799 | | | 350,164 | | | $3,629,619 | |
(1) | October 31, 2011 (fund inception) through June 30, 2012. |
6. Fair Value Measurements
The fund’s securities valuation process is based on several considerations and may use multiple inputs to determine the fair value of the positions held by the fund. In conformity with accounting principles generally accepted in the United States of America, the inputs used to determine a valuation are classified into three broad levels as follows:
• | Level 1 valuation inputs consist of unadjusted quoted prices in an active market for identical securities; |
• | Level 2 valuation inputs consist of direct or indirect observable market data (including quoted prices for similar securities, evaluations of subsequent market events, interest rates, prepayment speeds, credit risk, etc.); or |
• | Level 3 valuation inputs consist of unobservable data (including a fund’s own assumptions). |
The level classification is based on the lowest level input that is significant to the fair valuation measurement. The valuation inputs are not necessarily an indication of the risks associated with investing in these securities or other financial instruments.
The following is a summary of the level classifications as of period end. The Schedule of Investments provides additional information on the fund’s portfolio holdings.
| | | | |
| | Level 1 | Level 2 | Level 3 |
Investment Securities |
Common Stocks | $13,494,440 | — | — |
Temporary Cash Investments | 71,688 | $129,074 | — |
Total Value of Investment Securities | $13,566,128 | $129,074 | — |
| | | | |
Securities Sold Short |
Total Value of Common Stocks Sold Short | $(3,118,688) | — | — |
7. Risk Factors
The fund’s investment strategy utilizes leverage, which can increase market exposure and subject the fund to greater risk and higher volatility.
The fund’s investment process may result in high portfolio turnover, which could mean high transaction costs, affecting both performance and capital gains tax liabilities to investors.
The fund is subject to short sales risk. If the market price of a security increases after the fund borrows the security, the fund may suffer a loss when it replaces the borrowed security at the higher price. Any loss will be increased by the amount of compensation, interest or dividends, and transaction costs the fund must pay to the lender of the borrowed security.
If the fund is overweighted in a stock or sector, any negative development related to that stock or sector will have a greater impact on the fund than other funds that are not overweighted in that stock or sector.
8. Federal Tax Information
The tax character of distributions paid during the year ended June 30, 2013 and the period October 31, 2011 (fund inception) through June 30, 2012 were as follows:
| | | |
| | 2013 | 2012 |
Distributions Paid From |
Ordinary income | $16,263 | $1,866 |
Long-term capital gains | $2,562 | — |
The book-basis character of distributions made during the year from net investment income or net realized gains may differ from their ultimate characterization for federal income tax purposes. These differences reflect the differing character of certain income items and net realized gains and losses for financial statement and tax purposes, and may result in reclassification among certain capital accounts on the financial statements.
As of June 30, 2013, the federal tax cost of investments and the components of distributable earnings on a tax-basis were as follows:
| | |
Federal tax cost of investments | $12,149,651 |
Gross tax appreciation of investments | $1,834,489 |
Gross tax depreciation of investments | (288,938) |
Net tax appreciation (depreciation) of investments | $1,545,551 |
Net tax appreciation (depreciation) on securities sold short | $(328,608) |
Net tax appreciation (depreciation) | $1,216,943 |
Undistributed ordinary income | — |
Accumulated long-term gains | $144,475 |
Post-October capital loss deferral | $(43,967) |
The difference between book-basis and tax-basis unrealized appreciation (depreciation) is attributable primarily to short sale loss deferral on unsettled positions.
Loss deferrals represent certain qualified losses that the fund has elected to treat as having been incurred in the following fiscal year for federal income tax purposes.
| |
For a Share Outstanding Throughout the Years Ended June 30 (except as noted) |
Per-Share Data | Ratios and Supplemental Data |
| | | Income From Investment Operations: | | | | Ratio to Average Net Assets of: | | |
| | Net Asset
Value,
Beginning
of Period | Net
Investment Income
(Loss)(1) | Net
Realized and Unrealized
Gain (Loss) | Total From Investment Operations | Distributions From Net Investment Income | Net Asset
Value,
End of Period | Total
Return(2) | Operating Expenses | Operating Expenses (excluding expenses on securities
sold short) | Net
Investment Income
(Loss) | Portfolio Turnover
Rate | Net Assets,
End of Period
(in thousands) |
Investor Class |
2013 | $10.86 | 0.04 | 1.81 | 1.85 | (0.06) | $12.65 | 17.15% | 1.87% | 1.46% | 0.42% | 100% | $8,597 |
2012(3) | $10.00 | (0.03) | 0.90 | 0.87 | (0.01) | $10.86 | 8.73% | 2.48%(4) | 1.47%(4) | (0.38)%(4) | 89% | $2,249 |
Institutional Class |
2013 | $10.87 | 0.09 | 1.79 | 1.88 | (0.09) | $12.66 | 17.37% | 1.67% | 1.26% | 0.62% | 100% | $383 |
2012(3) | $10.00 | (0.01) | 0.90 | 0.89 | (0.02) | $10.87 | 8.87% | 2.28%(4) | 1.27%(4) | (0.18)%(4) | 89% | $327 |
A Class |
2013 | $10.85 | 0.04 | 1.78 | 1.82 | (0.04) | $12.63 | 16.79% | 2.12% | 1.71% | 0.17% | 100% | $654 |
2012(3) | $10.00 | (0.05) | 0.91 | 0.86 | (0.01) | $10.85 | 8.59% | 2.73%(4) | 1.72%(4) | (0.63)%(4) | 89% | $567 |
C Class |
2013 | $10.80 | (0.05) | 1.78 | 1.73 | — | $12.53 | 16.02% | 2.87% | 2.46% | (0.58)% | 100% | $475 |
2012(3) | $10.00 | (0.09) | 0.89 | 0.80 | — | $10.80 | 8.00% | 3.48%(4) | 2.47%(4) | (1.38)%(4) | 89% | $332 |
R Class |
2013 | $10.83 | 0.01 | 1.79 | 1.80 | (0.01) | $12.62 | 16.62% | 2.37% | 1.96% | (0.08)% | 100% | $382 |
2012(3) | $10.00 | (0.06) | 0.89 | 0.83 | —(5) | $10.83 | 8.34% | 2.98%(4) | 1.97%(4) | (0.88)%(4) | 89% | $326 |
Notes to Financial Highlights
(1) | Computed using average shares outstanding throughout the period. |
(2) | Total returns are calculated based on the net asset value of the last business day and do not reflect applicable sales charges, if any. Total returns for periods less than one year are not annualized. |
(3) | October 31, 2011 (fund inception) through June 30, 2012. |
(5) | Per-share amount was less than $0.005. |
See Notes to Financial Statements.
Report of Independent Registered Public Accounting Firm |
To the Directors of the American Century Quantitative Equity Funds, Inc. and Shareholders of the Disciplined Growth Plus Fund:
In our opinion, the accompanying statement of assets and liabilities, including the schedule of investments, and the related statements of operations, of changes in net assets and of cash flows and the financial highlights present fairly, in all material respects, the financial position of the Disciplined Growth Plus Fund (one of the fourteen funds comprising the American Century Quantitative Equity Funds, Inc., hereafter referred to as the “Fund”) at June 30, 2013, the results of its operations for the year then ended, the changes in its net assets for each of the periods presented, its cash flows for the year then ended, and the financial highlights for each of the periods presented, in conformity with accounting principles generally accepted in the United States of America. These financial statements and financial highlights (hereafter referred to as “financial statements”) are the responsibility of the Fund’s management; our responsibility is to express an opinion on these financial statements based on our audits. We conducted our audits of these financial statements in accordance with the standards of the Public Company Accounting Oversight Board (United States). Those standards require that we plan and perform the audit to obtain reasonable assurance about whether the financial statements are free of material misstatement. An audit includes examining, on a test basis, evidence supporting the amounts and disclosures in the financial statements, assessing the accounting principles used and significant estimates made by management, and evaluating the overall financial statement presentation. We believe that our audits, which included confirmation of securities at June 30, 2013 by correspondence with the custodian and brokers, provide a reasonable basis for our opinion.
PricewaterhouseCoopers LLP
Kansas City, Missouri
August 21, 2013
Board of Directors
The individuals listed below serve as directors of the funds. Each director will continue to serve in this capacity until death, retirement, resignation or removal from office. The board has adopted a mandatory retirement age for directors who are not “interested persons,” as that term is defined in the Investment Company Act (independent directors). Independent directors shall retire on December 31 of the year in which they reach their 75th birthday; provided, however, that on or after January 1, 2022, independent directors shall retire on December 31 of the year in which they reach their 76th birthday.
Mr. Thomas is the only director who is an “interested person” because he currently serves as President and Chief Executive Officer of American Century Companies, Inc. (ACC), the parent company of American Century Investment Management, Inc. (ACIM or the advisor).
The other directors (more than three-fourths of the total number) are independent; that is, they have never been employees, directors or officers of, and have no financial interest in, ACC or any of its wholly owned, direct or indirect, subsidiaries, including ACIM, American Century Investment Services, Inc. (ACIS) and American Century Services, LLC (ACS). The directors serve in this capacity for eight (in the case of Mr. Thomas, 15) registered investment companies in the American Century Investments family of funds.
The following table presents additional information about the directors. The mailing address for each director other than Mr. Thomas is 1665 Charleston Road, Mountain View, California 94043. The mailing address for Mr. Thomas is 4500 Main Street, Kansas City, Missouri 64111.
| | | | | | | |
Name
(Year of Birth) | Position(s) Held with Funds | Length of Time Served | Principal Occupation(s) During Past 5 Years | | Number of American Century Portfolios Overseen
by Director | Other Directorships Held During Past 5 Years |
Independent Directors |
Tanya S. Beder
(1955) | Director | Since 2011 | Chairman, SBCC Group Inc. (independent advisory services) (2006 to present) | | 41 | CYS Investments, Inc. (specialty finance company) |
Jeremy I. Bulow
(1954) | Director | Since 2011 | Professor of Economics, Stanford University, Graduate School of Business (1979 to present) | | 41 | None |
Ronald J. Gilson
(1946) | Director and Chairman of the Board | Since 1995 | Charles J. Meyers Professor of Law and Business, Stanford Law School (1979 to present); Marc and Eva Stern Professor of Law and Business, Columbia University School of Law (1992 to present) | | 41 | None |
Frederick L. A. Grauer
(1946) | Director | Since 2008 | Senior Advisor, BlackRock, Inc. (investment management firm) (2010 to 2011); Senior Advisor, Barclays Global Investors (investment management firm) (2003 to 2009) | | 41 | None |
| | | | | | | |
Name
(Year of Birth) | Position(s) Held with Funds | Length of Time Served | Principal Occupation(s) During Past 5 Years | | Number of American Century Portfolios Overseen
by Director | Other Directorships Held During Past 5 Years |
Independent Directors |
Peter F. Pervere
(1947) | Director | Since 2007 | Retired | | 41 | Intraware, Inc. (2003 to 2009) |
Myron S. Scholes
(1941) | Director | Since 1980 | Chairman, Platinum Grove Asset Management, L.P. (asset manager) (1999 to 2009); Frank E. Buck Professor of Finance-Emeritus, Stanford Graduate School of Business (1996 to present) | | 41 | Dimensional Fund Advisors (investment advisor); CME Group, Inc. (futures and options exchange) |
John B. Shoven
(1947) | Director | Since 2002 | Professor of Economics, Stanford University (1973 to present) | | 41 | Cadence Design Systems; Exponent; Financial Engines |
| | | | | | | |
Interested Director |
Jonathan S. Thomas
(1963) | Director and President | Since 2007 | President and Chief Executive Officer, ACC (March 2007 to present). Also serves as Chief Executive Officer and Manager, ACS; Executive Vice President, ACIM; Director, ACC, ACIM and other ACC subsidiaries | | 106 | None |
Officers
The following table presents certain information about the executive officers of the funds. Each officer serves as an officer for each of the 15 investment companies in the American Century family of funds, unless otherwise noted. No officer is compensated for his or her service as an officer of the funds. The listed officers are interested persons of the funds and are appointed or re-appointed on an annual basis. The mailing address for each of the officers listed below is 4500 Main Street, Kansas City, Missouri 64111.
| | | |
Name
(Year of Birth) | Offices with the Funds | Principal Occupation(s) During the Past Five Years |
Jonathan S.Thomas
(1963) | Director and President since 2007 | President and Chief Executive Officer, ACC (March 2007 to present). Also serves as Chief Executive Officer and Manager, ACS; Executive Vice President, ACIM; Director, ACC, ACIM and other ACC subsidiaries |
Maryanne L.Roepke
(1956) | Chief Compliance Officer since 2006 and Senior Vice President since 2000 | Chief Compliance Officer, American Century funds, ACIM and ACS (August 2006 to present). Also serves as Senior Vice President, ACS |
Charles A.Etherington
(1957) | General Counsel since 2007 and Senior Vice President since 2006 | Attorney, ACC (February 1994 to present); Vice President, ACC (November 2005 to present); General Counsel, ACC (March 2007 to present). Also serves as General Counsel, ACIM, ACS, ACIS and other ACC subsidiaries; and Senior Vice President, ACIM and ACS |
C. Jean Wade
(1964) | Vice President, Treasurer and Chief Financial Officer since 2012 | Vice President, ACS (February 2000 to present) |
Robert J. Leach
(1966) | Vice President since 2006 and Assistant Treasurer since 2012 | Vice President, ACS (February 2000 to present) |
David H. Reinmiller
(1963) | Vice President since 2001 | Attorney, ACC (January 1994 to present); Associate General Counsel, ACC (January 2001 to present). Also serves as Vice President, ACIM and ACS |
Ward D. Stauffer
(1960) | Secretary since 2005 | Attorney, ACC (June 2003 to present) |
The Statement of Additional Information has additional information about the fund’s directors and is available without charge, upon request, by calling 1-800-345-2021.
Approval of Management Agreement |
At a meeting held on June 11, 2013, the Fund’s Board of Directors/Trustees unanimously approved the renewal of the management agreement pursuant to which American Century Investment Management, Inc. (the “Advisor”) acts as the investment advisor for the Fund. Under Section 15(c) of the Investment Company Act, contracts for investment advisory services are required to be reviewed, evaluated, and approved by a majority of a fund’s directors/trustees (the “Directors”), including a majority of the independent Directors each year. The Board regards this annual evaluation and renewal as one of its most important responsibilities.
In connection with their annual review and evaluation, the independent Directors memorialized a statement regarding the relationship between their ongoing obligations to oversee and evaluate the performance of the Advisor and their consideration of renewal of the management agreement. In that statement, the independent Directors noted that their assessment of the Advisor’s performance is an ongoing process that takes place over the entire year and is informed by all of the information that the Board and its committees receive and consider over time. This information, together with the materials provided in connection with the review, are central to the Board’s assessment of the Advisor’s performance and its determination whether to renew the Fund’s management agreement.
Prior to its consideration of the renewal of the management agreement, the Board requested and reviewed extensive data and analysis relating to the proposed renewal. This information and analysis was compiled by the Advisor and certain independent providers of evaluation data concerning the Fund and the services provided to the Fund by the Advisor.
In connection with its consideration of the renewal of the management agreement, the Board’s review and evaluation of the services provided by the Advisor included, but was not limited to, the following:
• | the nature, extent, and quality of investment management, shareholder services, and other services provided by the Advisor to the Fund; |
• | the wide range of other programs and services the Advisor provides to the Fund and its shareholders on a routine and non-routine basis; |
• | the investment performance of the Fund, including data comparing the Fund’s performance to appropriate benchmarks and/or a peer group of other mutual funds with similar investment objectives and strategies; |
• | data comparing the cost of owning the Fund to the cost of owning similar funds; |
• | the Advisor’s compliance policies, procedures, and regulatory experience; |
• | financial data showing the cost of services provided to the Fund, the profitability of the Fund to the Advisor, and the overall profitability of the Advisor; |
• | possible economies of scale associated with the Advisor’s management of the Fund and other accounts under its management; |
• | data comparing services provided and charges to other investment management clients of the Advisor; and |
• | consideration of collateral benefits derived by the Advisor from the management of the Fund. |
In keeping with its practice, the Board held two in-person meetings to review and discuss the information provided. The Board also had the benefit of the advice of its independent counsel throughout the period.
Factors Considered
The Directors considered all of the information provided by the Advisor, the independent data providers, and the Board’s independent counsel in connection with the review, and evaluated such information for the Fund. In connection with their review, the Directors did not identify any single factor as being all-important or controlling and each Director may have attributed different levels of importance to different factors. In deciding to renew the management agreement, the Board based its decision on a number of factors, including the following:
Nature, Extent and Quality of Services — Generally. Under the management agreement, the Advisor is responsible for providing or arranging for all services necessary for the operation of the Fund. The Board noted that under the management agreement, the Advisor provides or arranges at its own expense a wide variety of services including:
• | constructing and designing the Fund |
• | portfolio research and security selection |
• | initial capitalization/funding |
• | daily valuation of the Fund’s portfolio |
• | shareholder servicing and transfer agency, including shareholder confirmations, recordkeeping, and communications |
• | regulatory and portfolio compliance |
• | marketing and distribution |
The Board noted that many of these services have expanded over time both in terms of quantity and complexity in response to shareholder demands, competition in the industry, changing distribution channels, and the changing regulatory environment.
Investment Management Services. The nature of the investment management services provided to the Fund is quite complex and allows Fund shareholders access to professional money management, instant diversification of their investments within an asset class, the opportunity to easily diversify among asset classes by investing in or exchanging among various American Century Investments funds, and liquidity. In evaluating investment performance, the Board expects the Advisor to manage the Fund in accordance with its investment objectives and approved strategies. Further, the Directors recognize that the Advisor has an obligation to seek the best execution of fund trades. In providing these services, the Advisor utilizes teams of investment professionals (portfolio managers, analysts, research assistants, and securities traders) who require extensive information technology, research, training, compliance and other systems to conduct their business. The Board, directly and through its Portfolio Committee, regularly reviews investment performance information for the Fund, together with comparative information for appropriate benchmarks and/or peer groups of similarly-managed funds, over different time horizons. The Directors also review detailed performance information during the management agreement approval process. If performance concerns are identified, the Fund receives special reviews until performance improves, during which the Board discusses with the Advisor the reasons for such results (e.g., market conditions, security selection) and any efforts being undertaken to improve performance. The Board found the investment management services provided by the Advisor to the Fund to meet or exceed industry standards. More detailed information about the Fund’s performance can be found in the Performance and Portfolio Commentary sections of this report.
Shareholder and Other Services. Under the management agreement, the Advisor provides the Fund with a comprehensive package of transfer agency, shareholder, and other services. The Board, directly and through various committees of the Board, regularly reviews reports and evaluations of such services at its regular meetings. These reports include, but are not limited to, information regarding the operational efficiency and accuracy of the shareholder and transfer agency services provided, staffing levels, shareholder satisfaction (as measured by external as well as internal sources), technology support, new products and services offered to Fund shareholders, securities trading activities, portfolio valuation services, auditing services, and legal and operational compliance activities. Certain aspects of shareholder and transfer agency service level efficiency and the quality of securities trading activities are measured by independent third party providers and are presented in comparison to other fund groups not managed by the Advisor. The Board found the services provided by the Advisor to the Fund under the management agreement to be competitive and of high quality.
Costs of Services and Profitability. The Advisor provides detailed information concerning its cost of providing various services to the Fund, its profitability in managing the Fund, its overall profitability, and its financial condition. The Directors have reviewed with the Advisor the methodology used to prepare this financial information. The financial information regarding the Advisor is considered in evaluating the Advisor’s financial condition, its ability to continue to provide services under the management agreement, and the reasonableness of the current management fee. The Board concluded that the Advisor’s profits were reasonable in light of the services provided to the Fund.
Ethics. The Board generally considers the Advisor’s commitment to providing quality services to shareholders and to conducting its business ethically. They noted that the Advisor’s practices generally meet or exceed industry
best practices.
Economies of Scale. The Board also reviewed information provided by the Advisor regarding the possible existence of economies of scale in connection with the management of the Fund. The Board concluded that economies of scale are difficult to measure and predict with precision, especially on a fund-by-fund basis. The Board concluded that the Advisor is appropriately sharing economies of scale through its competitive fee structure, offering competitive fees from fund inception, and through reinvestment in its business to provide shareholders additional content and services.
Comparison to Other Funds’ Fees. The management agreement provides that the Fund pay the Advisor a single, all-inclusive (or unified) management fee for providing all services necessary for the management and operation of the Fund, other than brokerage expenses, taxes, interest, extraordinary expenses, and the fees and expenses of the Fund’s independent directors (including their independent legal counsel) and expenses incurred in connection with the provision of shareholder services and distribution services under a plan adopted pursuant to Rule 12b-1 under the 1940 Act. Under the unified fee structure, the Advisor is responsible for providing all investment advisory, custody, audit, administrative, compliance, recordkeeping, marketing and shareholder services, or arranging and supervising third parties to provide such services. By contrast, most other funds are charged a variety of fees, including an investment advisory fee, a transfer agency fee, an administrative fee, distribution charges and other expenses. Other than their investment advisory fees and any applicable Rule 12b-1 distribution fees, all other components of the total fees charged by these other funds may be increased without shareholder approval. The Board believes the unified fee structure is a benefit to Fund shareholders because it clearly discloses to shareholders the cost of owning Fund shares, and, since the unified fee cannot be increased without a vote of Fund shareholders, it shifts to the Advisor the risk of increased costs of operating the Fund and provides a direct incentive to minimize administrative inefficiencies. Part of the Board’s analysis of fee levels involves reviewing certain evaluative data compiled by an independent provider and comparing the Fund’s unified fee to the total expense ratio of other funds in the Fund’s peer group. The Board concluded that the management fee paid by the Fund to the Advisor under the management agreement is reasonable in light of the services provided to the Fund.
Comparison to Fees and Services Provided to Other Clients of the Advisor. The Board also requested and received information from the Advisor concerning the nature of the services, fees, costs and profitability of its advisory services to advisory clients other than the Fund. They observed that these varying types of client accounts require different services and involve different regulatory and entrepreneurial risks than the management of the Fund. The Board analyzed this information and concluded that the fees charged and services provided to the Fund were reasonable by comparison.
Collateral or “Fall-Out” Benefits Derived by the Advisor. The Board considered the existence of collateral benefits the Advisor may receive as a result of its relationship with the Fund. They concluded that the Advisor’s primary business is managing mutual funds and it generally does not use fund or shareholder information to generate profits in other lines of business, and therefore does not derive any significant collateral benefits from them. The Board noted that the Advisor receives proprietary research from broker-dealers that execute fund portfolio transactions and concluded that this research is likely to benefit Fund shareholders. The Board also determined that the Advisor is able to provide investment management services to certain clients other than the Fund, at least in part, due to its existing infrastructure built to serve the fund complex. The Board concluded, however, that the assets of those other clients are not material to the analysis and, where applicable, may be included with the assets of the Fund to determine breakpoints in the management fee schedule.
Existing Relationship. The Board also considered whether there was any reason for not continuing the existing arrangement with the Advisor. In this regard, the Board was mindful of the potential disruptions of the Fund’s operations and various risks, uncertainties, and other effects that could occur as a result of a decision not to continue such relationship. In particular, the Board recognized that most shareholders have invested in the Fund on the strength of the Advisor’s industry standing and reputation and in the expectation that the Advisor will have a continuing role in providing advisory services to the Fund.
Conclusion of the Directors. As a result of this process, the Board, including all of the independent directors and assisted by the advice of independent legal counsel, taking into account all of the factors discussed above and the information provided by the Advisor and others, concluded that the management agreement between the Fund and the Advisor is fair and reasonable in light of the services provided and should be renewed.
Retirement Account Information
As required by law, distributions you receive from certain IRAs are subject to federal income tax withholding, unless you elect not to have withholding apply. Tax will be withheld on the total amount withdrawn even though you may be receiving amounts that are not subject to withholding, such as nondeductible contributions. In such case, excess amounts of withholding could occur. You may adjust your withholding election so that a greater or lesser amount will be withheld.
If you don’t want us to withhold on this amount, you must notify us to not withhold the federal income tax. You may notify us in writing or in certain situations by telephone or through other electronic means. For systematic withdrawals, your withholding election will remain in effect until revoked or changed by filing a new election. You have the right to revoke your election at any time.
Remember, even if you elect not to have income tax withheld, you are liable for paying income tax on the taxable portion of your withdrawal. If you elect not to have income tax withheld or you don’t have enough income tax withheld, you may be responsible for payment of estimated tax. You may incur penalties under the estimated tax rules if your withholding and estimated tax payments are not sufficient. You can reduce or defer the income tax on a distribution by directly or indirectly rolling such distribution over to another IRA or eligible plan. You should consult your tax advisor for additional information.
State tax will be withheld if, at the time of your distribution, your address is within one of the mandatory withholding states and you have federal income tax withheld (or as otherwise required by state law). State taxes will be withheld from your distribution in accordance with the respective state rules.
Distributions you receive from 403(b), 457 and qualified plans are subject to special tax and withholding rules. Your plan administrator or plan sponsor is required to provide you with a special tax notice explaining those rules at the time you request a distribution. If applicable, federal and/or state taxes may be withheld from your distribution amount.
Proxy Voting Guidelines
American Century Investment Management, Inc., the fund’s investment advisor, is responsible for exercising the voting rights associated with the securities purchased and/or held by the fund. A description of the policies and procedures the advisor uses in fulfilling this responsibility is available without charge, upon request, by calling 1-800-345-2021. It is also available on American Century Investments’ website at americancentury.com and on the Securities and Exchange Commission’s website at sec.gov. Information regarding how the investment advisor voted proxies relating to portfolio securities during the most recent 12-month period ended June 30 is available on the “About Us” page at americancentury.com. It is also available at sec.gov.
Quarterly Portfolio Disclosure
The fund files its complete schedule of portfolio holdings with the Securities and Exchange Commission (SEC) for the first and third quarters of each fiscal year on Form N-Q. The fund’s Forms N-Q are available on the SEC’s website at sec.gov, and may be reviewed and copied at the SEC’s Public Reference Room in Washington, DC. Information on the operation of the Public Reference Room may be obtained by calling 1-800-SEC-0330. The fund also makes its complete schedule of portfolio holdings for the most recent quarter of its fiscal year available on its website at americancentury.com and, upon request, by calling 1-800-345-2021.
Other Tax Information
The following information is provided pursuant to provisions of the Internal Revenue Code.
The fund hereby designates up to the maximum amount allowable as qualified dividend income for the fiscal year ended June 30, 2013.
For corporate taxpayers, the fund hereby designates $18,825, or up to the maximum amount allowable, of ordinary income distributions paid during the fiscal year ended June 30, 2013 as qualified for the corporate dividends received deduction.
The fund hereby designates $2,562, or up to the maximum amount allowable, as long-term capital gain distributions for the fiscal year ended June 30, 2013.
Contact Us | americancentury.com |
Automated Information Line | 1-800-345-8765 |
Investor Services Representative | 1-800-345-2021
or 816-531-5575 |
Investors Using Advisors | 1-800-378-9878 |
Business, Not-For-Profit, Employer-Sponsored Retirement Plans | 1-800-345-3533 |
Banks and Trust Companies, Broker-Dealers, Financial Professionals, Insurance Companies | 1-800-345-6488 |
Telecommunications Device for the Deaf | 1-800-634-4113 |
American Century Quantitative Equity Funds, Inc.
Investment Advisor:
American Century Investment Management, Inc.
Kansas City, Missouri
This report and the statements it contains are submitted for the general information of our shareholders. The report is not authorized for distribution to prospective investors unless preceded or accompanied by an effective prospectus.
©2013 American Century Proprietary Holdings, Inc. All rights reserved.
CL-ANN-79320 1308
ANNUAL REPORT | JUNE 30, 2013 |
Equity Growth Fund
President’s Letter | 2 |
Market Perspective | 3 |
Performance | 4 |
Portfolio Commentary | 6 |
Fund Characteristics | 8 |
Shareholder Fee Example | 9 |
Schedule of Investments | 11 |
Statement of Assets and Liabilities | 14 |
Statement of Operations | 15 |
Statement of Changes in Net Assets | 16 |
Notes to Financial Statements | 17 |
Financial Highlights | 23 |
Report of Independent Registered Public Accounting Firm | 25 |
Management | 26 |
Approval of Management Agreement | 29 |
Additional Information | 34 |
Any opinions expressed in this report reflect those of the author as of the date of the report, and do not necessarily represent the opinions of American Century Investments® or any other person in the American Century Investments organization. Any such opinions are subject to change at any time based upon market or other conditions and American Century Investments disclaims any responsibility to update such opinions. These opinions may not be relied upon as investment advice and, because investment decisions made by American Century Investments funds are based on numerous factors, may not be relied upon as an indication of trading intent on behalf of any American Century Investments fund. Security examples are used for representational purposes only and are not intended as recommendations to purchase or sell securities. Performance information for comparative indices and securities is provided to American Century Investments by third party vendors. To the best of American Century Investments’ knowledge, such information is accurate at the time of printing.
Jonathan Thomas
Dear Investor:
Thank you for reviewing this annual report for the 12 months ended June 30, 2013. It provides investment performance, market analysis, and portfolio information, presented with the expert perspective of our portfolio management team.
Annual reports remain important vehicles for conveying information about fund returns, including key factors that affected fund performance. For additional, updated investment and market insights, we encourage you to visit our website, americancentury.com.
Generally Favorable Fiscal-Year Returns for U.S. Stocks and High-Yield Bonds
The 12-month reporting period began in the summer of 2012 with uncertainties caused by slowing economies, as well as the upcoming November elections and year-end fiscal deadlines in the U.S. It ended with more uncertainty about the future of U.S. monetary stimulus. In between, aggressive monetary intervention by central banks encouraged investors to take more risk, generally boosting stocks at the expense of government bonds.
U.S. mid-cap, small-cap, and value stock indices achieved performance leadership during the period, outpacing the S&P 500 Index’s 20.60% return. U.S. stocks generally outperformed non-U.S. equities—the MSCI EAFE Index returned 18.62% and the MSCI Emerging Markets Index advanced 2.87%, affected by slowing growth in emerging market economies.
Slower emerging market growth also hindered commodity price gains and helped keep inflation under control. As a result, assets used as inflation hedges, including inflation-indexed securities and precious metals, lagged other assets. Gold, in particular, plunged, starting last October. And Treasury inflation-protected securities (TIPS) were among the lowest performers in the U.S. bond market. Bond index returns generally ranged from approximately 10% gains for U.S. corporate high-yield indices all the way down to negative returns for longer-maturity global Treasury benchmarks.
Despite signs of improvement in 2013, U.S. economic growth is subpar compared with past recession recoveries, and remains vulnerable to threats that could trigger another slowdown and market volatility. Therefore, we continue to believe in a disciplined, diversified, long-term investment approach, using professionally managed stock and bond portfolios—as appropriate—for meeting financial goals. We appreciate your continued trust in us in this volatile environment.
Sincerely,
Jonathan Thomas
President and Chief Executive Officer
American Century Investments
By Scott Wittman, Chief Investment Officer, Asset Allocation and Quantitative Equity
Central Bank Actions, Relative U.S. Economic Gains Drove Stocks Higher
Stock market performance remained robust during the 12-month period ended June 30, 2013. Despite persistent concerns about weak global growth and Europe’s ongoing financial crisis, investors largely focused on central bank stimulus measures and marginally-improving U.S. economic data, which fueled market optimism.
Early in the period, in response to disappointing U.S. economic data, the U.S. Federal Reserve (the Fed) launched its third—and most aggressive—quantitative easing (QE) program, or monthly purchases of $40 billion in government agency mortgage-backed securities. Later in 2012, the Fed expanded the program to include $45 billion in Treasury purchases, bringing its total bond buying to $85 billion per month. This unprecedented program, combined with relatively healthy corporate earnings, significant housing market gains and modest improvements in the labor market, helped keep stocks and other riskier assets in favor.
The Fed rattled the financial markets late in the reporting period, with comments about “tapering” its quantitative easing program. Fed Chairman Ben Bernanke said the central bank could begin scaling back its bond buying later in 2013 if the economy continues to improve. After reaching record highs in May, stocks stumbled in June, following Bernanke’s comments. Late in the month, the Fed toned down its tapering talk, and stocks recovered some of their June losses. Overall, most U.S. stock benchmarks generated stellar 12-month returns, largely aided by strong double-digit gains posted during the first calendar quarter of 2013.
Value Stocks Outpaced Growth Stocks
Across the capitalization spectrum, value stocks were the performance leaders for the 12-month period. Much of this was due to strong one-year returns from the financials and health care sectors, where many value-oriented stocks reside. In particular, expectations for rising interest rates—and the late-quarter rate increase triggered by Fed tapering talk—helped boost returns within the financial sector’s banking industry. At the opposite end, the rate-sensitive utilities sector was the weakest relative performer, held back by the prospect of rising interest rates.
U.S. Stock Index Returns |
For the 12 months ended June 30, 2013 |
Russell 1000 Index (Large-Cap) | 21.24% | | Russell 2000 Index (Small-Cap) | 24.21% |
Russell 1000 Growth Index | 17.07% | | Russell 2000 Growth Index | 23.67% |
Russell 1000 Value Index | 25.32% | | Russell 2000 Value Index | 24.77% |
Russell Midcap Index | 25.41% | | |
Russell Midcap Growth Index | 22.88% | | | |
Russell Midcap Value Index | 27.65% | | | |
Total Returns as of June 30, 2013 |
| | | | Average Annual Returns | |
| | Ticker Symbol | 1 year | 5 years | 10 years | Since Inception | Inception Date |
Investor Class | BEQGX | 21.19% | 6.52% | 7.54% | 9.14% | 5/9/91 |
S&P 500 Index | — | 20.60% | 7.01% | 7.29% | 8.95% | — |
Institutional Class | AMEIX | 21.42% | 6.73% | 7.74% | 5.40% | 1/2/98 |
A Class(1) No sales charge* With sales charge* | BEQAX | 20.91% 13.96% | 6.26% 5.01% | 7.27% 6.64% | 4.82% 4.43% | 10/9/97 |
C Class | AEYCX | 20.02% | 5.47% | 6.49% | 3.87% | 7/18/01 |
R Class | AEYRX | 20.60% | 5.99% | — | 4.60% | 7/29/05 |
* | Sales charges include initial sales charges and contingent deferred sales charges (CDSCs), as applicable. A Class shares have a 5.75% maximum initial sales charge and may be subject to a maximum CDSC of 1.00%. C Class shares redeemed within 12 months of purchase are subject to a maximum CDSC of 1.00%. The SEC requires that mutual funds provide performance information net of maximum sales charges in all cases where charges could be applied. |
(1) | Prior to September 4, 2007, the A Class was referred to as the Advisor Class and did not have a front-end sales charge. Performance prior to that date has been adjusted to reflect this charge. |
Data presented reflect past performance. Past performance is no guarantee of future results. Current performance may be higher or lower than the performance shown. Investment return and principal value will fluctuate, and redemption value may be more or less than original cost. To obtain performance data current to the most recent month end, please call 1-800-345-2021 or visit americancentury.com.
Unless otherwise indicated, performance reflects Investor Class shares; performance for other share classes will vary due to differences in fee structure. For information about other share classes available, please consult the prospectus. Data assumes reinvestment of dividends and capital gains, and none of the charts reflect the deduction of taxes that a shareholder would pay on fund distributions or the redemption of fund shares. Returns for the index are provided for comparison. The fund’s total returns include operating expenses (such as transaction costs and management fees) that reduce returns, while the total returns of the index do not.
Growth of $10,000 Over 10 Years |
$10,000 investment made June 30, 2003 |
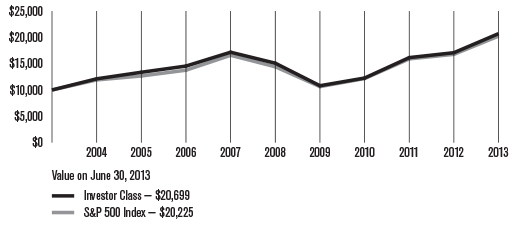
Total Annual Fund Operating Expenses |
Investor Class | Institutional Class | A Class | C Class | R Class |
0.68% | 0.48% | 0.93% | 1.68% | 1.18% |
The total annual fund operating expenses shown is as stated in the fund’s prospectus current as of the date of this report. The prospectus may vary from the expense ratio shown elsewhere in this report because it is based on a different time period, includes acquired fund fees and expenses, and, if applicable, does not include fee waivers or expense reimbursements.
Data presented reflect past performance. Past performance is no guarantee of future results. Current performance may be higher or lower than the performance shown. Investment return and principal value will fluctuate, and redemption value may be more or less than original cost. To obtain performance data current to the most recent month end, please call 1-800-345-2021 or visit americancentury.com.
Unless otherwise indicated, performance reflects Investor Class shares; performance for other share classes will vary due to differences in fee structure. For information about other share classes available, please consult the prospectus. Data assumes reinvestment of dividends and capital gains, and none of the charts reflect the deduction of taxes that a shareholder would pay on fund distributions or the redemption of fund shares. Returns for the index are provided for comparison. The fund’s total returns include operating expenses (such as transaction costs and management fees) that reduce returns, while the total returns of the index do not.
Portfolio Managers: Bill Martin and Claudia Musat
Performance Summary
Equity Growth returned 21.19%* for the fiscal year ended June 30, 2013, compared with the 20.60% return of its benchmark, the S&P 500 Index.
In a year of strength for U.S. equity markets (see page 3 for details), Equity Growth posted a solid gain for the 12-month period, outperforming the S&P 500. Holdings in the materials and information technology sectors contributed the most to the fund’s outperformance.
Equity Growth’s stock selection process incorporates factors of growth, value, quality, and momentum, and is designed to minimize unintended risks along industries and other risk characteristics. Each of these fundamental drivers of stock returns contributed to the success of the fund during the period.
Absolute Performance Driven by Financials and Health Care
Equity Growth’s absolute returns were driven primarily by holdings in the financials and health care sectors. In financials, the strongest gains were attributable to financial services giant JPMorgan Chase, whose shares rose more than 50% for the year, while in health care, consumer health manufacturer Johnson & Johnson and drug maker Pfizer contributed most, with gains of 31% and 26%, respectively. Among individual securities, positions in several mega-cap technology companies including Google and Cisco Systems also boosted absolute returns. No sector detracted from performance for the 12-month period.
Materials and Technology Outperformed
The materials and information technology sectors posted the highest contributions to the fund’s returns relative to the S&P 500. Materials sector outperformance was driven by strong stock selection in both the chemicals and metals and mining industries. The single highest contributor in the sector was above-index exposure to chemicals manufacturer LyondellBasell Industries, which appreciated nearly 80% on robust earnings growth over the 12-month period. Our research suggests continued strong growth as well as attractive valuations, and we maintain an overweight position in the holding. Small positive contributions from a number of other materials stocks also contributed to gains.
In information technology, the biggest industry-level contributions came from software, communications equipment, and computers and peripherals, while top individual contributors were spread throughout a variety of industries. Among the most successful holdings were Western Digital and Seagate Technology. Western Digital, a maker of storage product solutions, gained 108% for the year on robust revenue and earnings gains. Our research shows a strong fundamental profile across value, quality, growth, and momentum. Hard-disk manufacturer Seagate Technology had a strong fundamental profile and benefited from several analyst upgrades. Networking giant Cisco and security software maker Symantec also contributed favorably to relative results.
*All fund returns referenced in this commentary are for Investor Class shares.
Other top-performing overweight positions in the portfolio included oil refiner Marathon Petroleum (which was also a top absolute performer), mobile hydraulic manufacturer Sauer-Danfoss, and airplane manufacturer Boeing.
Financials Main Detractor
Although the financials sector was the strongest contributor to the fund’s absolute returns, the sector proved challenging to relative performance. The negative contribution was a result of both an underweight to the sector as well as challenging stock selection. The greatest negative impact came from lower-than-index exposure to several banking names that appreciated significantly during the period. For example, it hurt to have no exposure for much of the year to banking giant Citigroup, which gained 75% during the period as it rebounded from multi-year lows. Our current research shows an improved profile from a year ago, particularly in expected growth and momentum. Accordingly, we initiated a position in the company during the second quarter of 2013. Similarly, although the fund maintained a position in Bank of America, our exposure was less than that of the benchmark. This underweight hurt relative results during a period when Bank of America shares saw a 58% gain.
The consumer discretionary sector also proved difficult for relative performance as small losses across several industries and holdings limited performance. Top detractors in the sector included ITT Educational Services, whose shares tumbled along with other for-profit education companies. A relatively small position in Coinstar (now called Outerwall Inc.) hurt results after issuing a weaker-than-expected outlook early in the fiscal year. Our research suggests strong value and quality indicators, and we maintain exposure to the company.
Elsewhere in the portfolio, individual relative detractors included biopharmaceutical company Gilead Sciences, semiconductor manufacturer Advanced Micro Devices, and energy drink maker Monster Beverage Corp.
A Look Ahead
As we move into the second half of 2013, the U.S. economic recovery seems to be progressing, albeit with headwinds. Improvements in housing, employment, and economic indicators have been consistent and point to slow but positive growth. Volatility is likely to remain elevated as ongoing concerns over interest rates, Federal Reserve action, and a potential slowdown in China dominate headlines. Heightened levels of volatility often provide investment opportunities, and our disciplined, objective, and systematic investment strategy is designed to take advantage of these opportunities at the individual company level. We believe this approach is the most powerful way to capitalize on market inefficiencies that lead to the mispricing of individual stocks. Our strategy is designed to provide investors with well-diversified and risk-controlled exposure to broad U.S. equities. As such we do not see significant deviations versus the S&P 500. Currently, the fund’s largest, but modest, overweights are in technology, consumer discretionary, and health care, while the underweights are led by energy and financials.
JUNE 30, 2013 |
Top Ten Holdings | % of net assets |
Exxon Mobil Corp. | 3.5% |
Apple, Inc. | 3.3% |
Microsoft Corp. | 2.7% |
Johnson & Johnson | 2.4% |
Pfizer, Inc. | 2.2% |
AT&T, Inc. | 2.1% |
Google, Inc., Class A | 1.8% |
Cisco Systems, Inc. | 1.8% |
Merck & Co., Inc. | 1.8% |
International Business Machines Corp. | 1.7% |
| | |
Top Five Industries | % of net assets |
Pharmaceuticals | 7.8% |
Oil, Gas and Consumable Fuels | 7.7% |
Insurance | 6.9% |
Computers and Peripherals | 6.2% |
Software | 5.6% |
| | |
Types of Investments in Portfolio | % of net assets |
Common Stocks | 98.8% |
Temporary Cash Investments | 1.1% |
Other Assets and Liabilities | 0.1% |
Fund shareholders may incur two types of costs: (1) transaction costs, including sales charges (loads) on purchase payments and redemption/exchange fees; and (2) ongoing costs, including management fees; distribution and service (12b-1) fees; and other fund expenses. This example is intended to help you understand your ongoing costs (in dollars) of investing in your fund and to compare these costs with the ongoing cost of investing in other mutual funds.
The example is based on an investment of $1,000 made at the beginning of the period and held for the entire period from January 1, 2013 to June 30, 2013.
Actual Expenses
The table provides information about actual account values and actual expenses for each class. You may use the information, together with the amount you invested, to estimate the expenses that you paid over the period. First, identify the share class you own. Then simply divide your account value by $1,000 (for example, an $8,600 account value divided by $1,000 = 8.6), then multiply the result by the number under the heading “Expenses Paid During Period” to estimate the expenses you paid on your account during this period.
If you hold Investor Class shares of any American Century Investments fund, or Institutional Class shares of the American Century Diversified Bond Fund, in an American Century Investments account (i.e., not a financial intermediary or retirement plan account), American Century Investments may charge you a $12.50 semiannual account maintenance fee if the value of those shares is less than $10,000. We will redeem shares automatically in one of your accounts to pay the $12.50 fee. In determining your total eligible investment amount, we will include your investments in all personal accounts (including American Century Investments Brokerage accounts) registered under your Social Security number. Personal accounts include individual accounts, joint accounts, UGMA/UTMA accounts, personal trusts, Coverdell Education Savings Accounts and IRAs (including traditional, Roth, Rollover, SEP-, SARSEP- and SIMPLE-IRAs), and certain other retirement accounts. If you have only business, business retirement, employer-sponsored or American Century Investments Brokerage accounts, you are currently not subject to this fee. If you are subject to the Account Maintenance Fee, your account value could be reduced by the fee amount.
Hypothetical Example for Comparison Purposes
The table also provides information about hypothetical account values and hypothetical expenses based on the actual expense ratio of each class of your fund and an assumed rate of return of 5% per year before expenses, which is not the actual return of a fund’s share class. The hypothetical account values and expenses may not be used to estimate the actual ending account balance or expenses you paid for the period. You may use this information to compare the ongoing costs of investing in your fund and other funds. To do so, compare this 5% hypothetical example with the 5% hypothetical examples that appear in the shareholder reports of the other funds.
Please note that the expenses shown in the table are meant to highlight your ongoing costs only and do not reflect any transactional costs, such as sales charges (loads) or redemption/exchange fees. Therefore, the table is useful in comparing ongoing costs only, and will not help you determine the relative total costs of owning different funds. In addition, if these transactional costs were included, your costs would have been higher.| | | | | |
| | Beginning
Account Value
1/1/13 | Ending
Account Value
6/30/13 | Expenses Paid During Period(1) 1/1/13 – 6/30/13 | Annualized
Expense Ratio(1) |
Actual |
Investor Class | $1,000 | $1,139.70 | $3.55 | 0.67% |
Institutional Class | $1,000 | $1,140.70 | $2.49 | 0.47% |
A Class | $1,000 | $1,138.60 | $4.88 | 0.92% |
C Class | $1,000 | $1,134.40 | $8.84 | 1.67% |
R Class | $1,000 | $1,136.80 | $6.20 | 1.17% |
Hypothetical |
Investor Class | $1,000 | $1,021.47 | $3.36 | 0.67% |
Institutional Class | $1,000 | $1,022.46 | $2.36 | 0.47% |
A Class | $1,000 | $1,020.23 | $4.61 | 0.92% |
C Class | $1,000 | $1,016.51 | $8.35 | 1.67% |
R Class | $1,000 | $1,018.99 | $5.86 | 1.17% |
(1) | Expenses are equal to the class’s annualized expense ratio listed in the table above, multiplied by the average account value over the period, multiplied by 181, the number of days in the most recent fiscal half-year, divided by 365, to reflect the one-half year period. |
JUNE 30, 2013
| | | Shares | | | Value | |
Common Stocks — 98.8% | |
AEROSPACE AND DEFENSE — 5.0% | |
Boeing Co. (The) | | 356,465 | | | $36,516,274 | |
General Dynamics Corp. | | 161,739 | | | 12,669,016 | |
Honeywell International, Inc. | | 402,147 | | | 31,906,343 | |
Northrop Grumman Corp. | | 324,102 | | | 26,835,646 | |
Raytheon Co. | | 358,866 | | | 23,728,220 | |
| | | | | | 131,655,499 | |
AUTO COMPONENTS — 0.5% | |
BorgWarner, Inc.(1) | | 156,088 | | | 13,446,981 | |
BEVERAGES — 0.4% | |
Coca-Cola Co. (The) | | 202,355 | | | 8,116,459 | |
PepsiCo, Inc. | | 42,703 | | | 3,492,678 | |
| | | | | | 11,609,137 | |
BIOTECHNOLOGY — 2.4% | |
Amgen, Inc. | | 341,030 | | | 33,646,020 | |
Celgene Corp.(1) | | 203,273 | | | 23,764,646 | |
Gilead Sciences, Inc.(1) | | 29,555 | | | 1,513,512 | |
United Therapeutics Corp.(1) | | 49,556 | | | 3,261,776 | |
| | | | | | 62,185,954 | |
CAPITAL MARKETS — 2.2% | |
Federated Investors, Inc., Class B | | 215,127 | | | 5,896,631 | |
Goldman Sachs Group, Inc. (The) | | 213,918 | | | 32,355,097 | |
T. Rowe Price Group, Inc. | | 40,517 | | | 2,963,819 | |
Waddell & Reed Financial, Inc., Class A | | 373,826 | | | 16,261,431 | |
| | | | | | 57,476,978 | |
CHEMICALS — 3.3% | |
CF Industries Holdings, Inc. | | 31,938 | | | 5,477,367 | |
LyondellBasell Industries NV, Class A | | 392,015 | | | 25,974,914 | |
Monsanto Co. | | 286,406 | | | 28,296,913 | |
NewMarket Corp. | | 13,923 | | | 3,655,623 | |
PPG Industries, Inc. | | 158,911 | | | 23,266,159 | |
| | | | | | 86,670,976 | |
COMMERCIAL BANKS — 1.6% | |
Wells Fargo & Co. | | 994,667 | | | 41,049,907 | |
COMMERCIAL SERVICES AND SUPPLIES — 0.2% | |
Deluxe Corp. | | 113,706 | | | 3,939,913 | |
COMMUNICATIONS EQUIPMENT — 2.4% | |
Brocade Communications Systems, Inc.(1) | | 358,350 | | | 2,064,096 | |
Cisco Systems, Inc. | | 1,934,768 | | | 47,034,210 | |
QUALCOMM, Inc. | | 240,432 | | | 14,685,587 | |
| | | | | | 63,783,893 | |
COMPUTERS AND PERIPHERALS — 6.2% | |
Apple, Inc. | | 220,381 | | | 87,288,506 | |
EMC Corp. | | 1,185,105 | | | 27,992,180 | |
Hewlett-Packard Co. | | 945,780 | | | 23,455,344 | |
Seagate Technology plc | | 185,965 | | | 8,336,811 | |
Western Digital Corp. | | 270,618 | | | 16,802,672 | |
| | | | | | 163,875,513 | |
CONSUMER FINANCE — 0.6% | |
Cash America International, Inc. | | 364,777 | | | 16,582,762 | |
CONTAINERS AND PACKAGING — 1.1% | |
Owens-Illinois, Inc.(1) | | 481,624 | | | 13,384,331 | |
Packaging Corp. of America | | 340,707 | | | 16,681,015 | |
| | | | | | 30,065,346 | |
DIVERSIFIED CONSUMER SERVICES — 0.2% | |
Coinstar, Inc.(1) | | 110,284 | | | 6,470,362 | |
DIVERSIFIED FINANCIAL SERVICES — 2.1% | |
Bank of America Corp. | | 303,711 | | | 3,905,723 | |
Citigroup, Inc. | | 173,032 | | | 8,300,345 | |
JPMorgan Chase & Co. | | 323,244 | | | 17,064,051 | |
Moody’s Corp. | | 383,083 | | | 23,341,247 | |
MSCI, Inc., Class A(1) | | 110,333 | | | 3,670,779 | |
| | | | | | 56,282,145 | |
DIVERSIFIED TELECOMMUNICATION SERVICES — 3.6% | |
AT&T, Inc. | | 1,582,097 | | | 56,006,234 | |
CenturyLink, Inc. | | 674,423 | | | 23,840,853 | |
Verizon Communications, Inc. | | 276,713 | | | 13,929,732 | |
| | | | | | 93,776,819 | |
ELECTRIC UTILITIES — 1.3% | |
Edison International | | 487,315 | | | 23,469,090 | |
Portland General Electric Co. | | 333,579 | | | 10,204,182 | |
| | | | | | 33,673,272 | |
ELECTRICAL EQUIPMENT — 1.8% | |
Emerson Electric Co. | | 492,157 | | | 26,842,243 | |
Rockwell Automation, Inc. | | 254,048 | | | 21,121,550 | |
| | | | | | 47,963,793 | |
ELECTRONIC EQUIPMENT, INSTRUMENTS AND COMPONENTS — 0.6% | |
TE Connectivity Ltd. | | 362,188 | | | 16,494,041 | |
ENERGY EQUIPMENT AND SERVICES — 0.2% | |
RPC, Inc. | | 332,720 | | | 4,594,863 | |
FOOD AND STAPLES RETAILING — 2.3% | |
CVS Caremark Corp. | | 347,959 | | | 19,896,296 | |
Kroger Co. (The) | | 383,531 | | | 13,247,161 | |
Rite Aid Corp.(1) | | 1,843,826 | | | 5,273,342 | |
Safeway, Inc. | | 870,954 | | | 20,606,772 | |
Wal-Mart Stores, Inc. | | 40,160 | | | 2,991,518 | |
| | | | | | 62,015,089 | |
FOOD PRODUCTS — 2.5% | |
Archer-Daniels-Midland Co. | | 743,437 | | | $25,209,949 | |
General Mills, Inc. | | 528,058 | | | 25,626,655 | |
Hershey Co. (The) | | 110,727 | | | 9,885,706 | |
Ingredion, Inc. | | 96,675 | | | 6,343,813 | |
| | | | | | 67,066,123 | |
HEALTH CARE EQUIPMENT AND SUPPLIES — 4.3% | |
Abbott Laboratories | | 837,111 | | | 29,198,432 | |
Becton Dickinson and Co. | | 237,612 | | | 23,483,194 | |
Medtronic, Inc. | | 594,339 | | | 30,590,628 | |
St. Jude Medical, Inc. | | 513,852 | | | 23,447,067 | |
Stryker Corp. | | 89,423 | | | 5,783,880 | |
Zimmer Holdings, Inc. | | 17,697 | | | 1,326,213 | |
| | | | | | 113,829,414 | |
HEALTH CARE PROVIDERS AND SERVICES — 0.4% | |
AmerisourceBergen Corp. | | 198,125 | | | 11,061,319 | |
HOTELS, RESTAURANTS AND LEISURE — 1.2% | |
Bally Technologies, Inc.(1) | | 207,956 | | | 11,732,878 | |
Cracker Barrel Old Country Store, Inc. | | 77,541 | | | 7,340,031 | |
International Game Technology | | 724,686 | | | 12,109,503 | |
| | | | | | 31,182,412 | |
HOUSEHOLD DURABLES — 1.4% | |
Garmin Ltd. | | 438,432 | | | 15,853,701 | |
Newell Rubbermaid, Inc. | | 796,945 | | | 20,919,806 | |
| | | | | | 36,773,507 | |
HOUSEHOLD PRODUCTS — 2.5% | |
Energizer Holdings, Inc. | | 207,554 | | | 20,861,253 | |
Kimberly-Clark Corp. | | 268,135 | | | 26,046,634 | |
Procter & Gamble Co. (The) | | 243,747 | | | 18,766,081 | |
| | | | | | 65,673,968 | |
INDUSTRIAL CONGLOMERATES — 2.1% | |
Carlisle Cos., Inc. | | 49,106 | | | 3,059,795 | |
Danaher Corp. | | 430,800 | | | 27,269,640 | |
General Electric Co. | | 1,064,164 | | | 24,677,963 | |
| | | | | | 55,007,398 | |
INSURANCE — 6.9% | |
Aflac, Inc. | | 462,153 | | | 26,860,332 | |
American International Group, Inc.(1) | | 726,181 | | | 32,460,291 | |
Amtrust Financial Services, Inc. | | 72,926 | | | 2,603,458 | |
Axis Capital Holdings Ltd. | | 238,767 | | | 10,930,753 | |
Berkshire Hathaway, Inc., Class B(1) | | 122,521 | | | 13,712,550 | |
First American Financial Corp. | | 188,748 | | | 4,160,006 | |
HCC Insurance Holdings, Inc. | | 76,138 | | | 3,282,309 | |
MetLife, Inc. | | 695,966 | | | 31,847,404 | |
Reinsurance Group of America, Inc. | | 196,562 | | | 13,584,400 | |
RenaissanceRe Holdings Ltd. | | 149,311 | | | 12,958,702 | |
Torchmark Corp. | | 81,094 | | | 5,282,463 | |
Travelers Cos., Inc. (The) | | 300,107 | | | 23,984,552 | |
| | | | | | 181,667,220 | |
INTERNET AND CATALOG RETAIL — 0.7% | |
Expedia, Inc. | | 324,898 | | | 19,542,615 | |
INTERNET SOFTWARE AND SERVICES — 1.8% | |
Google, Inc., Class A(1) | | 53,664 | | | 47,244,176 | |
IT SERVICES — 1.7% | |
International Business Machines Corp. | | 240,121 | | | 45,889,524 | |
LEISURE EQUIPMENT AND PRODUCTS — 1.7% | |
Hasbro, Inc. | | 477,918 | | | 21,425,064 | |
Mattel, Inc. | | 502,877 | | | 22,785,357 | |
| | | | | | 44,210,421 | |
MACHINERY — 0.3% | |
Crane Co. | | 123,107 | | | 7,376,571 | |
MEDIA — 2.1% | |
Comcast Corp., Class A | | 957,455 | | | 40,098,216 | |
Time Warner, Inc. | | 245,226 | | | 14,178,967 | |
| | | | | | 54,277,183 | |
METALS AND MINING — 0.2% | |
Worthington Industries, Inc. | | 145,999 | | | 4,629,628 | |
MULTILINE RETAIL — 0.8% | |
Dillard’s, Inc., Class A | | 92,622 | | | 7,592,226 | |
Target Corp. | | 192,441 | | | 13,251,487 | |
| | | | | | 20,843,713 | |
OIL, GAS AND CONSUMABLE FUELS — 7.7% | |
Chevron Corp. | | 194,134 | | | 22,973,818 | |
ConocoPhillips | | 169,100 | | | 10,230,550 | |
Delek US Holdings, Inc. | | 203,527 | | | 5,857,507 | |
Exxon Mobil Corp. | | 1,027,604 | | | 92,844,021 | |
Marathon Petroleum Corp. | | 320,691 | | | 22,788,303 | |
Tesoro Corp. | | 261,675 | | | 13,690,836 | |
Valero Energy Corp. | | 649,674 | | | 22,589,165 | |
Western Refining, Inc. | | 464,874 | | | 13,049,013 | |
| | | | | | 204,023,213 | |
PHARMACEUTICALS — 7.8% | |
AbbVie, Inc. | | 287,821 | | | 11,898,520 | |
Allergan, Inc. | | 13,259 | | | 1,116,938 | |
Eli Lilly & Co. | | 494,260 | | | 24,278,051 | |
Johnson & Johnson | | 753,790 | | | 64,720,410 | |
Merck & Co., Inc. | | 997,175 | | | 46,318,779 | |
Pfizer, Inc. | | 2,057,293 | | | 57,624,777 | |
| | | | | | 205,957,475 | |
SEMICONDUCTORS AND SEMICONDUCTOR EQUIPMENT — 1.7% | |
Broadcom Corp., Class A | | 692,715 | | | $23,386,058 | |
Intel Corp. | | 40,172 | | | 972,966 | |
KLA-Tencor Corp. | | 85,615 | | | 4,771,324 | |
Texas Instruments, Inc. | | 474,443 | | | 16,543,828 | |
| | | | | | 45,674,176 | |
SOFTWARE — 5.6% | |
Activision Blizzard, Inc. | | 855,974 | | | 12,206,189 | |
CA, Inc. | | 513,331 | | | 14,696,667 | |
Microsoft Corp. | | 2,043,819 | | | 70,573,070 | |
Oracle Corp. | | 1,270,012 | | | 39,014,769 | |
Symantec Corp. | | 525,111 | | | 11,799,244 | |
| | | | | | 148,289,939 | |
SPECIALTY RETAIL — 4.5% | |
American Eagle Outfitters, Inc. | | 672,021 | | | 12,271,103 | |
Buckle, Inc. (The) | | 100,467 | | | 5,226,293 | |
GameStop Corp., Class A | | 486,158 | | | 20,433,221 | |
Gap, Inc. (The) | | 568,394 | | | 23,719,082 | |
Home Depot, Inc. (The) | | 537,001 | | | 41,601,468 | |
PetSmart, Inc. | | 229,990 | | | 15,407,030 | |
| | | | | | 118,658,197 | |
TEXTILES, APPAREL AND LUXURY GOODS — 1.4% | |
Hanesbrands, Inc. | | 300,126 | | | 15,432,479 | |
Ralph Lauren Corp. | | 125,966 | | | 21,885,333 | |
| | | | | | 37,317,812 | |
THRIFTS AND MORTGAGE FINANCE — 0.6% | |
Ocwen Financial Corp.(1) | | 365,575 | | | 15,069,001 | |
TOBACCO — 0.9% | |
Philip Morris International, Inc. | | 81,997 | | | 7,102,580 | |
Universal Corp. | | 308,240 | | | 17,831,684 | |
| | | | | | 24,934,264 | |
TOTAL COMMON STOCKS (Cost $2,147,680,639) | | | 2,609,812,512 | |
Temporary Cash Investments — 1.1% | |
Repurchase Agreement, Bank of America Merrill Lynch, (collateralized by various U.S. Treasury obligations, 1.00%, 1/15/14, valued at $3,977,853), in a joint trading account at 0.06%, dated 6/28/13, due 7/1/13 (Delivery value $3,896,504) | | | 3,896,485 | |
Repurchase Agreement, Credit Suisse First Boston, Inc., (collateralized by various U.S. Treasury obligations, 4.25%, 11/15/40, valued at $11,910,339), in a joint trading account at 0.05%, dated 6/28/13, due 7/1/13 (Delivery value $11,689,505) | | | 11,689,456 | |
Repurchase Agreement, Goldman Sachs & Co., (collateralized by various U.S. Treasury obligations, 3.125%, 11/15/41, valued at $3,963,264), in a joint trading account at 0.04%, dated 6/28/13, due 7/1/13 (Delivery value $3,896,499) | | | 3,896,486 | |
SSgA U.S. Government Money Market Fund | | 10,756,308 | | | 10,756,308 | |
TOTAL TEMPORARY CASH INVESTMENTS (Cost $30,238,735) | | | 30,238,735 | |
TOTAL INVESTMENT SECURITIES — 99.9% (Cost $2,177,919,374) | | | 2,640,051,247 | |
OTHER ASSETS AND LIABILITIES — 0.1% | | | 2,302,835 | |
TOTAL NET ASSETS — 100.0% | | | $2,642,354,082 | |
Notes to Schedule of Investments
See Notes to Financial Statements.
Statement of Assets and Liabilities |
JUNE 30, 2013 | |
Assets | |
Investment securities, at value (cost of $2,177,919,374) | | $2,640,051,247 | |
Cash | | 1,239,000 | |
Receivable for capital shares sold | | 1,574,845 | |
Dividends and interest receivable | | 2,572,974 | |
| | | 2,645,438,066 | |
| | | | |
Liabilities | | | |
Payable for capital shares redeemed | | 1,595,504 | |
Accrued management fees | | 1,427,173 | |
Distribution and service fees payable | | 61,307 | |
| | | 3,083,984 | |
| | | | |
Net Assets | | $2,642,354,082 | |
| | | | |
Net Assets Consist of: | | | |
Capital (par value and paid-in surplus) | | $2,165,108,580 | |
Undistributed net investment income | | 1,760,891 | |
Undistributed net realized gain | | 13,352,738 | |
Net unrealized appreciation | | 462,131,873 | |
| | | $2,642,354,082 | |
| | | | |
| | Net assets | Shares outstanding | Net asset value per share |
Investor Class, $0.01 Par Value | $2,080,375,214 | 74,996,421 | $27.74 |
Institutional Class, $0.01 Par Value | $303,311,746 | 10,928,252 | $27.75 |
A Class, $0.01 Par Value | $240,027,463 | 8,659,862 | $27.72* |
C Class, $0.01 Par Value | $9,039,474 | 328,217 | $27.54 |
R Class, $0.01 Par Value | $9,600,185 | 346,168 | $27.73 |
*Maximum offering price $29.41 (net asset value divided by 0.9425).
See Notes to Financial Statements.
YEAR ENDED JUNE 30, 2013 | |
Investment Income (Loss) | |
Income: | | | |
Dividends (net of foreign taxes withheld of $393,639) | | $59,822,463 | |
Interest | | 27,540 | |
| | | 59,850,003 | |
| | | | |
Expenses: | | | |
Management fees | | 15,449,125 | |
Distribution and service fees: | | | |
A Class | | 529,434 | |
C Class | | 79,015 | |
R Class | | 41,093 | |
Directors’ fees and expenses | | 118,299 | |
Other expenses | | 46 | |
| | | 16,217,012 | |
| | | | |
Net investment income (loss) | | 43,632,991 | |
| | | | |
Realized and Unrealized Gain (Loss) | | | |
Net realized gain (loss) on: | | | |
Investment transactions | | 293,296,665 | |
Futures contract transactions | | 1,344,885 | |
Foreign currency transactions | | 2,333 | |
| | | 294,643,883 | |
| | | | |
Change in net unrealized appreciation (depreciation) on: | | | |
Investments | | 117,965,775 | |
Translation of assets and liabilities in foreign currencies | | (965 | ) |
| | | 117,964,810 | |
| | | | |
Net realized and unrealized gain (loss) | | 412,608,693 | |
| | | | |
Net Increase (Decrease) in Net Assets Resulting from Operations | | $456,241,684 | |
See Notes to Financial Statements.
Statement of Changes in Net Assets |
YEARS ENDED JUNE 30, 2013 AND JUNE 30, 2012 | |
Increase (Decrease) in Net Assets | | June 30, 2013 | | | June 30, 2012 | |
Operations | |
Net investment income (loss) | | $43,632,991 | | | $29,918,973 | |
Net realized gain (loss) | | 294,643,883 | | | 75,656,086 | |
Change in net unrealized appreciation (depreciation) | | 117,964,810 | | | 415,011 | |
Net increase (decrease) in net assets resulting from operations | | 456,241,684 | | | 105,990,070 | |
| | | | | | | |
Distributions to Shareholders | | | | | | |
From net investment income: | | | | | | |
Investor Class | | (33,048,796 | ) | | (23,667,137 | ) |
Institutional Class | | (6,069,274 | ) | | (3,489,986 | ) |
A Class | | (3,263,216 | ) | | (2,212,441 | ) |
B Class | | — | | | (72 | ) |
C Class | | (61,024 | ) | | (35,349 | ) |
R Class | | (106,615 | ) | | (62,251 | ) |
Decrease in net assets from distributions | | (42,548,925 | ) | | (29,467,236 | ) |
| | | | | | | |
Capital Share Transactions | | | | | | |
Net increase (decrease) in net assets from capital share transactions | | 160,369,984 | | | (18,326,490 | ) |
| | | | | | | |
Net increase (decrease) in net assets | | 574,062,743 | | | 58,196,344 | |
| | | | | | | |
Net Assets | | | | | | |
Beginning of period | | 2,068,291,339 | | | 2,010,094,995 | |
End of period | | $2,642,354,082 | | | $2,068,291,339 | |
| | | | | | | |
Undistributed net investment income | | $1,760,891 | | | $1,641,878 | |
See Notes to Financial Statements.
Notes to Financial Statements |
JUNE 30, 2013
1. Organization
American Century Quantitative Equity Funds, Inc. (the corporation) is registered under the Investment Company Act of 1940, as amended (the 1940 Act), as an open-end management investment company and is organized as a Maryland corporation. Equity Growth Fund (the fund) is one fund in a series issued by the corporation. The fund is diversified as defined under the 1940 Act. The fund’s investment objective is to seek long-term capital growth by investing in common stocks.
The fund offers the Investor Class, the Institutional Class, the A Class, the C Class and the R Class. The A Class may incur an initial sales charge. The A Class and C Class may be subject to a contingent deferred sales charge. The share classes differ principally in their respective sales charges and distribution and shareholder servicing expenses and arrangements. The Institutional Class is made available to institutional shareholders or through financial intermediaries whose clients do not require the same level of shareholder and administrative services as shareholders of other classes. As a result, the Institutional Class is charged a lower unified management fee. On October 21, 2011, all outstanding B Class shares were converted to A Class shares and the fund discontinued offering the B Class.
2. Significant Accounting Policies
The following is a summary of significant accounting policies consistently followed by the fund in preparation of its financial statements. The financial statements are prepared in conformity with accounting principles generally accepted in the United States of America, which may require management to make certain estimates and assumptions at the date of the financial statements. Actual results could differ from these estimates.
Investment Valuations — The fund determines the fair value of its investments and computes its net asset value per share as of the close of regular trading (usually 4 p.m. Eastern time) on the New York Stock Exchange (NYSE) on each day the NYSE is open.
Equity securities that are listed or traded on a domestic securities exchange are valued at the last reported sales price or at the official closing price as provided by the exchange. Equity securities traded on foreign securities exchanges are typically valued at the closing price on the exchange where primarily traded or as of the close of the NYSE, if that is earlier. If no last sales price is reported, or if local convention or regulation so provides, the mean of the latest bid and asked prices is used. Depending on local convention or regulation, securities traded over-the-counter are valued at the mean of the latest bid and asked prices, the last sales price, or the official closing price. In its determination of fair value, the fund may review several factors including: market information specific to a security; news developments in U.S. and foreign markets; the performance of particular U.S. and foreign securities, indices, comparable securities, American Depositary Receipts, Exchange-Traded Funds, and other relevant market indicators.
Debt securities maturing within 60 days at the time of purchase may be valued at cost, plus or minus any amortized discount or premium or at the evaluated mean as provided by an independent pricing service. Evaluated mean prices are commonly derived through utilization of market models, which may consider, among other factors, trade data, quotations from dealers and active market makers, relevant yield curve and spread data, related sector levels, creditworthiness, and other relevant market information on the same or comparable securities.
Investments in open-end management investment companies are valued at the reported net asset value per share. Repurchase agreements are valued at cost. Exchange-traded futures contracts are valued at the settlement price as provided by the appropriate clearing corporation.
The value of investments initially expressed in foreign currencies is translated into U.S. dollars at prevailing exchange rates.
If the fund determines that the market price for a portfolio security is not readily available or the valuation methods mentioned above do not reflect a security’s fair value, such security is valued as determined in good faith by the Board of Directors or its designee, in accordance with procedures adopted by the Board of Directors. Circumstances that may cause the fund to use these procedures to value a security include, but are not limited to: a security has been declared in default; trading in a security has been halted during the trading day; there is a foreign market holiday and no trading occurred; or an event occurred between the close of a foreign exchange and the NYSE that may affect the value of a security.
Security Transactions — Security transactions are accounted for as of the trade date. Net realized gains and losses are determined on the identified cost basis, which is also used for federal income tax purposes.
Investment Income — Dividend income less foreign taxes withheld, if any, is recorded as of the ex-dividend date. Distributions received on securities that represent a return of capital or long-term capital gain are recorded as a reduction of cost of investments and/or as a realized gain. The fund may estimate the components of distributions received that may be considered nontaxable distributions or long-term capital gain distributions for income tax purposes. Interest income is recorded on the accrual basis and includes accretion of discounts and amortization of premiums.
Foreign Currency Translations — All assets and liabilities initially expressed in foreign currencies are translated into U.S. dollars at prevailing exchange rates at period end. The fund may enter into spot foreign currency exchange contracts to facilitate transactions denominated in a foreign currency. Purchases and sales of investment securities, dividend and interest income, spot foreign currency exchange contracts, and expenses are translated at the rates of exchange prevailing on the respective dates of such transactions. Net realized and unrealized foreign currency exchange gains or losses related to investment securities are a component of net realized gain (loss) on investment transactions and change in net unrealized appreciation (depreciation) on investments, respectively.
Repurchase Agreements — The fund may enter into repurchase agreements with institutions that American Century Investment Management, Inc. (ACIM) (the investment advisor) has determined are creditworthy pursuant to criteria adopted by the Board of Directors. The fund requires that the collateral, represented by securities, received in a repurchase transaction be transferred to the custodian in a manner sufficient to enable the fund to obtain those securities in the event of a default under the repurchase agreement. ACIM monitors, on a daily basis, the securities transferred to ensure the value, including accrued interest, of the securities under each repurchase agreement is equal to or greater than amounts owed to the fund under each repurchase agreement.
Joint Trading Account — Pursuant to an Exemptive Order issued by the Securities and Exchange Commission, the fund, along with certain other funds in the American Century Investments family of funds, may transfer uninvested cash balances into a joint trading account. These balances are invested in one or more repurchase agreements that are collateralized by U.S. Treasury or Agency obligations.
Income Tax Status — It is the fund’s policy to distribute substantially all net investment income and net realized gains to shareholders and to otherwise qualify as a regulated investment company under provisions of the Internal Revenue Code. Accordingly, no provision has been made for income taxes. The fund files U.S. federal, state, local and non-U.S. tax returns as applicable. The fund’s tax returns are subject to examination by the relevant taxing authority until expiration of the applicable statute of limitations, which is generally three years from the date of filing but can be longer in certain jurisdictions. At this time, management believes there are no uncertain tax positions which, based on their technical merit, would not be sustained upon examination and for which it is reasonably possible that the total amounts of unrecognized tax benefits will significantly change in the next twelve months.
Segregated Assets — In accordance with the 1940 Act, the fund segregates assets on its books and records to cover futures contracts. ACIM monitors, on a daily basis, the securities segregated to ensure the fund designates a sufficient amount of liquid assets, marked-to-market daily. The fund may also receive assets or be required to pledge assets at the custodian bank or with a broker for margin requirements on futures contracts.
Multiple Class — All shares of the fund represent an equal pro rata interest in the net assets of the class to which such shares belong, and have identical voting, dividend, liquidation and other rights and the same terms and conditions, except for class specific expenses and exclusive rights to vote on matters affecting only individual classes. Income, non-class specific expenses, and realized and unrealized capital gains and losses of the fund are allocated to each class of shares based on their relative net assets.
Distributions to Shareholders — Distributions from net investment income, if any, are generally declared and paid quarterly. Distributions from net realized gains, if any, are generally declared and paid annually.
Indemnifications — Under the corporation’s organizational documents, its officers and directors are indemnified against certain liabilities arising out of the performance of their duties to the fund. In addition, in the normal course of business, the fund enters into contracts that provide general indemnifications. The maximum exposure under these arrangements is unknown as this would involve future claims that may be made against a fund. The risk of material loss from such claims is considered by management to be remote.
3. Fees and Transactions with Related Parties
Management Fees — The corporation has entered into a management agreement with ACIM, under which ACIM provides the fund with investment advisory and management services in exchange for a single, unified management fee (the fee) per class. The agreement provides that all expenses of managing and operating the fund, except distribution and service fees, brokerage expenses, taxes, interest, fees and expenses of the independent directors (including legal counsel fees), and extraordinary expenses, will be paid by ACIM. The fee is computed and accrued daily based on each class’s daily net assets and paid monthly in arrears. The fee consists of (1) an Investment Category Fee based on the daily net assets of the fund and certain other accounts managed by the investment advisor that are in the same broad investment category as the fund and (2) a Complex Fee based on the assets of all the funds in the American Century Investments family of funds. The rates for the Investment Category Fee range from 0.3380% to 0.5200%. The rates for the Complex Fee range from 0.2500% to 0.3100% for the Investor Class, A Class, C Class and R Class. The Institutional Class is 0.2000% less at each point within the Complex Fee range. The effective annual management fee for each class for the year ended June 30, 2013 was 0.67% for the Investor Class, A Class, C Class and R Class and 0.47% for the Institutional Class.
Distribution and Service Fees — The Board of Directors has adopted a separate Master Distribution and Individual Shareholder Services Plan for each of the A Class, C Class and R Class (collectively the plans), pursuant to Rule 12b-1 of the 1940 Act. The plans provide that the A Class will pay American Century Investment Services, Inc. (ACIS) an annual distribution and service fee of 0.25%. The plans provide that the C Class will pay ACIS an annual distribution and service fee of 1.00%, of which 0.25% is paid for individual shareholder services and 0.75% is paid for distribution services. The plans provide that the R Class will pay ACIS an annual distribution and service fee of 0.50%. The fees are computed and accrued daily based on each class’s daily net assets and paid monthly in arrears. The fees are used to pay financial intermediaries for distribution and individual shareholder services. Fees incurred under the plans during the year ended June 30, 2013 are detailed in the Statement of Operations.
Related Parties — Certain officers and directors of the corporation are also officers and/or directors of American Century Companies, Inc. (ACC). The corporation’s investment advisor, ACIM, the corporation’s distributor, ACIS, and the corporation’s transfer agent, American Century Services, LLC are wholly owned, directly or indirectly, by ACC. Various funds issued by American Century Asset Allocation Portfolios, Inc. own, in aggregate, 12% of the shares of the fund.
4. Investment Transactions
Purchases and sales of investment securities, excluding short-term investments, for the year ended June 30, 2013 were $2,361,230,091 and $2,214,456,788, respectively.
5. Capital Share Transactions
Transactions in shares of the fund were as follows:
| | | | | | | |
| | | Year ended June 30, 2013 | | | Year ended June 30, 2012 | |
| | | Shares | | | Amount | | | Shares | | | Amount | |
Investor Class/Shares Authorized | | 400,000,000 | | | | | | 400,000,000 | | | | |
Sold | | 15,328,834 | | | $ 390,764,923 | | | 13,662,697 | | | $ 304,186,412 | |
Issued in reinvestment of distributions | | 1,270,317 | | | 32,521,097 | | | 1,057,839 | | | 23,297,369 | |
Redeemed | | (12,603,686 | ) | | (322,348,337 | ) | | (15,962,625 | ) | | (348,644,466 | ) |
| | | 3,995,465 | | | 100,937,683 | | | (1,242,089 | ) | | (21,160,685 | ) |
Institutional Class/Shares Authorized | | 90,000,000 | | | | | | 90,000,000 | | | | |
Sold | | 7,780,588 | | | 193,149,671 | | | 1,700,903 | | | 36,390,642 | |
Issued in reinvestment of distributions | | 236,786 | | | 6,064,308 | | | 157,706 | | | 3,475,998 | |
Redeemed | | (6,389,784 | ) | | (160,992,644 | ) | | (1,503,528 | ) | | (32,878,378 | ) |
| | | 1,627,590 | | | 38,221,335 | | | 355,081 | | | 6,988,262 | |
A Class/Shares Authorized | | 80,000,000 | | | | | | 80,000,000 | | | | |
Sold | | 1,925,292 | | | 48,494,309 | | | 1,277,027 | | | 28,345,179 | |
Issued in reinvestment of distributions | | 125,102 | | | 3,194,532 | | | 99,262 | | | 2,185,121 | |
Redeemed | | (1,272,971 | ) | | (32,460,561 | ) | | (1,645,596 | ) | | (36,065,728 | ) |
| | | 777,423 | | | 19,228,280 | | | (269,307 | ) | | (5,535,428 | ) |
B Class/Shares Authorized | | N/A | | | | | | N/A | | | | |
Issued in reinvestment of distributions | | | | | | | | 4 | | | 72 | |
Redeemed | | | | | | | | (3,605 | ) | | (74,955 | ) |
| | | | | | | | | (3,601 | ) | | (74,883 | ) |
C Class/Shares Authorized | | 10,000,000 | | | | | | 10,000,000 | | | | |
Sold | | 87,682 | | | 2,217,568 | | | 86,960 | | | 1,911,255 | |
Issued in reinvestment of distributions | | 2,253 | | | 56,375 | | | 1,474 | | | 32,392 | |
Redeemed | | (64,868 | ) | | (1,613,380 | ) | | (82,883 | ) | | (1,800,660 | ) |
| | | 25,067 | | | 660,563 | | | 5,551 | | | 142,987 | |
R Class/Shares Authorized | | 10,000,000 | | | | | | 10,000,000 | | | | |
Sold | | 147,847 | | | 3,808,972 | | | 156,367 | | | 3,437,729 | |
Issued in reinvestment of distributions | | 4,180 | | | 106,615 | | | 2,821 | | | 62,251 | |
Redeemed | | (99,866 | ) | | (2,593,464 | ) | | (97,208 | ) | | (2,186,723 | ) |
| | | 52,161 | | | 1,322,123 | | | 61,980 | | | 1,313,257 | |
Net increase (decrease) | | 6,477,706 | | | $ 160,369,984 | | | (1,092,385 | ) | | $(18,326,490 | ) |
6. Fair Value Measurements
The fund’s securities valuation process is based on several considerations and may use multiple inputs to determine the fair value of the positions held by the fund. In conformity with accounting principles generally accepted in the United States of America, the inputs used to determine a valuation are classified into three broad levels as follows:
• | Level 1 valuation inputs consist of unadjusted quoted prices in an active market for identical securities; |
• | Level 2 valuation inputs consist of direct or indirect observable market data (including quoted prices for similar securities, evaluations of subsequent market events, interest rates, prepayment speeds, credit risk, etc.); or |
• | Level 3 valuation inputs consist of unobservable data (including a fund’s own assumptions). |
The level classification is based on the lowest level input that is significant to the fair valuation measurement. The valuation inputs are not necessarily an indication of the risks associated with investing in these securities or other financial instruments.
The following is a summary of the level classifications as of period end. The Schedule of Investments provides additional information on the fund’s portfolio holdings.
| | | | |
| | Level 1 | Level 2 | Level 3 |
Investment Securities |
Common Stocks | $2,609,812,512 | — | — |
Temporary Cash Investments | 10,756,308 | $19,482,427 | — |
Total Value of Investment Securities | $2,620,568,820 | $19,482,427 | — |
7. Derivative Instruments
Equity Price Risk — The fund is subject to equity price risk in the normal course of pursuing its investment objectives. A fund may enter into futures contracts based on an equity index in order to manage its exposure to changes in market conditions. A fund may purchase futures contracts to gain exposure to increases in market value or sell futures contracts to protect against a decline in market value. Upon entering into a futures contract, a fund is required to deposit either cash or securities in an amount equal to a certain percentage of the contract value (initial margin). Subsequent payments (variation margin) are made or received daily, in cash, by a fund. The variation margin is equal to the daily change in the contract value and is recorded as unrealized gains and losses. A fund recognizes a realized gain or loss when the contract is closed or expires. Net realized and unrealized gains or losses occurring during the holding period of futures contracts are a component of net realized gain (loss) on futures contract transactions and change in net unrealized appreciation (depreciation) on futures contracts, respectively. One of the risks of entering into futures contracts is the possibility that the change in value of the contract may not correlate with the changes in value of the underlying securities. During the period, the fund infrequently purchased equity price risk derivative instruments for temporary investment purposes.
At period end, the fund did not have any derivative instruments disclosed on the Statement of Assets and Liabilities. For the year ended June 30, 2013, the effect of equity price risk derivative instruments on the Statement of Operations was $1,344,885 in net realized gain (loss) on futures contract transactions.
8. Federal Tax Information
The tax character of distributions paid during the years ended June 30, 2013 and June 30, 2012 were as follows:
| | | |
| | 2013 | 2012 |
Distributions Paid From |
Ordinary income | $42,548,925 | $29,467,236 |
Long-term capital gains | — | — |
The book-basis character of distributions made during the year from net investment income or net realized gains may differ from their ultimate characterization for federal income tax purposes. These differences reflect the differing character of certain income items and net realized gains and losses for financial statement and tax purposes, and may result in reclassification among certain capital accounts on the financial statements.
As of June 30, 2013, the federal tax cost of investments and the components of distributable earnings on a tax-basis were as follows:
| | |
Federal tax cost of investments | $2,182,609,477 |
Gross tax appreciation of investments | $478,460,076 |
Gross tax depreciation of investments | (21,018,306) |
Net tax appreciation (depreciation) of investments | $457,441,770 |
Undistributed ordinary income | $1,760,891 |
Accumulated long-term gains | $18,042,841 |
The difference between book-basis and tax-basis unrealized appreciation (depreciation) is attributable primarily to the tax deferral of losses on wash sales.
| |
For a Share Outstanding Throughout the Years Ended June 30 (except as noted) |
Per-Share Data | Ratios and Supplemental Data |
| | | Income From Investment Operations: | | | | Ratio to Average Net Assets of: | | |
| | Net Asset
Value,
Beginning
of Period | Net
Investment
Income
(Loss)(1) | Net Realized
and Unrealized
Gain (Loss) | Total From
Investment
Operations | Distributions
From Net
Investment
Income | Net Asset
Value, End
of Period | Total
Return(2) | Operating
Expenses | Net
Investment
Income
(Loss) | Portfolio
Turnover
Rate | Net Assets,
End of Period
(in thousands) |
Investor Class |
2013 | $23.30 | 0.47 | 4.43 | 4.90 | (0.46) | $27.74 | 21.19% | 0.68% | 1.82% | 94% | $2,080,375 |
2012 | $22.37 | 0.34 | 0.93 | 1.27 | (0.34) | $23.30 | 5.76% | 0.68% | 1.55% | 86% | $1,654,130 |
2011 | $17.20 | 0.26 | 5.16 | 5.42 | (0.25) | $22.37 | 31.66% | 0.69% | 1.28% | 74% | $1,615,829 |
2010 | $15.32 | 0.21 | 1.87 | 2.08 | (0.20) | $17.20 | 13.47% | 0.70% | 1.14% | 64% | $1,371,992 |
2009 | $21.84 | 0.27 | (6.45) | (6.18) | (0.34) | $15.32 | (28.37)% | 0.70% | 1.66% | 107% | $1,339,582 |
Institutional Class |
2013 | $23.31 | 0.52 | 4.43 | 4.95 | (0.51) | $27.75 | 21.42% | 0.48% | 2.02% | 94% | $303,312 |
2012 | $22.38 | 0.38 | 0.93 | 1.31 | (0.38) | $23.31 | 5.97% | 0.48% | 1.75% | 86% | $216,802 |
2011 | $17.21 | 0.30 | 5.17 | 5.47 | (0.30) | $22.38 | 31.91% | 0.49% | 1.48% | 74% | $200,191 |
2010 | $15.33 | 0.24 | 1.87 | 2.11 | (0.23) | $17.21 | 13.69% | 0.50% | 1.34% | 64% | $203,860 |
2009 | $21.86 | 0.31 | (6.46) | (6.15) | (0.38) | $15.33 | (28.21)% | 0.50% | 1.86% | 107% | $168,092 |
A Class |
2013 | $23.28 | 0.40 | 4.43 | 4.83 | (0.39) | $27.72 | 20.91% | 0.93% | 1.57% | 94% | $240,027 |
2012 | $22.35 | 0.28 | 0.93 | 1.21 | (0.28) | $23.28 | 5.51% | 0.93% | 1.30% | 86% | $183,498 |
2011 | $17.19 | 0.20 | 5.16 | 5.36 | (0.20) | $22.35 | 31.30% | 0.94% | 1.03% | 74% | $182,195 |
2010 | $15.31 | 0.16 | 1.87 | 2.03 | (0.15) | $17.19 | 13.20% | 0.95% | 0.89% | 64% | $237,076 |
2009 | $21.81 | 0.23 | (6.44) | (6.21) | (0.29) | $15.31 | (28.54)% | 0.95% | 1.41% | 107% | $226,830 |
| |
For a Share Outstanding Throughout the Years Ended June 30 (except as noted) |
Per-Share Data | Ratios and Supplemental Data |
| | | Income From Investment Operations: | | | | Ratio to Average Net Assets of: | | |
| | Net Asset
Value,
Beginning
of Period | Net
Investment
Income
(Loss)(1) | Net Realized
and Unrealized
Gain (Loss) | Total From
Investment
Operations | Distributions
From Net
Investment
Income | Net Asset
Value, End
of Period | Total
Return(2) | Operating
Expenses | Net
Investment
Income
(Loss) | Portfolio
Turnover
Rate | Net Assets,
End of Period
(in thousands) |
C Class |
2013 | $23.13 | 0.21 | 4.40 | 4.61 | (0.20) | $27.54 | 20.02% | 1.68% | 0.82% | 94% | $9,039 |
2012 | $22.21 | 0.12 | 0.92 | 1.04 | (0.12) | $23.13 | 4.71% | 1.68% | 0.55% | 86% | $7,013 |
2011 | $17.08 | 0.06 | 5.12 | 5.18 | (0.05) | $22.21 | 30.34% | 1.69% | 0.28% | 74% | $6,611 |
2010 | $15.22 | 0.03 | 1.85 | 1.88 | (0.02) | $17.08 | 12.33% | 1.70% | 0.14% | 64% | $5,536 |
2009 | $21.64 | 0.11 | (6.40) | (6.29) | (0.13) | $15.22 | (29.06)% | 1.70% | 0.66% | 107% | $5,108 |
R Class |
2013 | $23.29 | 0.34 | 4.43 | 4.77 | (0.33) | $27.73 | 20.60% | 1.18% | 1.32% | 94% | $9,600 |
2012 | $22.36 | 0.23 | 0.93 | 1.16 | (0.23) | $23.29 | 5.24% | 1.18% | 1.05% | 86% | $6,848 |
2011 | $17.20 | 0.16 | 5.15 | 5.31 | (0.15) | $22.36 | 30.95% | 1.19% | 0.78% | 74% | $5,189 |
2010 | $15.32 | 0.12 | 1.87 | 1.99 | (0.11) | $17.20 | 12.91% | 1.20% | 0.64% | 64% | $3,770 |
2009 | $21.81 | 0.18 | (6.43) | (6.25) | (0.24) | $15.32 | (28.71)% | 1.20% | 1.16% | 107% | $1,764 |
Notes to Financial Highlights
(1) | Computed using average shares outstanding throughout the period. |
(2) | Total returns are calculated based on the net asset value of the last business day and do not reflect applicable sales charges, if any. Total returns for periods less than one year are not annualized. |
See Notes to Financial Statements.
Report of Independent Registered Public Accounting Firm |
To the Directors of the American Century Quantitative Equity Funds, Inc. and Shareholders of the Equity Growth Fund:
In our opinion, the accompanying statement of assets and liabilities, including the schedule of investments, and the related statements of operations and of changes in net assets and the financial highlights present fairly, in all material respects, the financial position of the Equity Growth Fund (one of the fourteen funds comprising the American Century Quantitative Equity Funds, Inc., hereafter referred to as the “Fund”) at June 30, 2013 the results of its operations for the year then ended, the changes in its net assets for each of the two years in the period then ended and the financial highlights for each of the five years in the period then ended, in conformity with accounting principles generally accepted in the United States of America. These financial statements and financial highlights (hereafter referred to as “financial statements”) are the responsibility of the Fund’s management; our responsibility is to express an opinion on these financial statements based on our audits. We conducted our audits of these financial statements in accordance with the standards of the Public Company Accounting Oversight Board (United States). Those standards require that we plan and perform the audit to obtain reasonable assurance about whether the financial statements are free of material misstatement. An audit includes examining, on a test basis, evidence supporting the amounts and disclosures in the financial statements, assessing the accounting principles used and significant estimates made by management, and evaluating the overall financial statement presentation. We believe that our audits, which included confirmation of securities at June 30, 2013 by correspondence with the custodian and brokers, provide a reasonable basis for our opinion.
PricewaterhouseCoopers LLP
Kansas City, Missouri
August 21, 2013
Board of Directors
The individuals listed below serve as directors of the funds. Each director will continue to serve in this capacity until death, retirement, resignation or removal from office. The board has adopted a mandatory retirement age for directors who are not “interested persons,” as that term is defined in the Investment Company Act (independent directors). Independent directors shall retire on December 31 of the year in which they reach their 75th birthday; provided, however, that on or after January 1, 2022, independent directors shall retire on December 31 of the year in which they reach their 76th birthday.
Mr. Thomas is the only director who is an “interested person” because he currently serves as President and Chief Executive Officer of American Century Companies, Inc. (ACC), the parent company of American Century Investment Management, Inc. (ACIM or the advisor).
The other directors (more than three-fourths of the total number) are independent; that is, they have never been employees, directors or officers of, and have no financial interest in, ACC or any of its wholly owned, direct or indirect, subsidiaries, including ACIM, American Century Investment Services, Inc. (ACIS) and American Century Services, LLC (ACS). The directors serve in this capacity for eight (in the case of Mr. Thomas, 15) registered investment companies in the American Century Investments family of funds.
The following table presents additional information about the directors. The mailing address for each director other than Mr. Thomas is 1665 Charleston Road, Mountain View, California 94043. The mailing address for Mr. Thomas is 4500 Main Street, Kansas City, Missouri 64111.
| | | | | | | |
Name
(Year of Birth) | Position(s) Held with Funds | Length of Time Served | Principal Occupation(s) During Past 5 Years | | Number of American Century Portfolios Overseen by Director | Other Directorships Held During Past 5 Years |
Independent Directors |
Tanya S. Beder (1955) | Director | Since 2011 | Chairman, SBCC Group Inc. (independent advisory services) (2006 to present) | | 41 | CYS Investments, Inc. (specialty finance company) |
Jeremy I. Bulow (1954) | Director | Since 2011 | Professor of Economics, Stanford University, Graduate School of Business (1979 to present) | | 41 | None |
Ronald J. Gilson (1946) | Director and Chairman of the Board | Since 1995 | Charles J. Meyers Professor of Law and Business, Stanford Law School (1979 to present); Marc and Eva Stern Professor of Law and Business, Columbia University School of Law
(1992 to present) | | 41 | None |
Frederick L. A. Grauer
(1946) | Director | Since 2008 | Senior Advisor, BlackRock, Inc. (investment management firm) (2010 to 2011); Senior Advisor, Barclays Global Investors (investment management firm) (2003 to 2009) | | 41 | None |
| | | | | | | |
Name
(Year of Birth) | Position(s) Held with Funds | Length of Time Served | Principal Occupation(s) During Past 5 Years | | Number of American Century Portfolios Overseen by Director | Other Directorships Held During Past 5 Years |
Independent Directors |
Peter F. Pervere (1947) | Director | Since 2007 | Retired | | 41 | Intraware, Inc. (2003 to 2009) |
Myron S. Scholes (1941) | Director | Since 1980 | Chairman, Platinum Grove Asset Management, L.P. (asset manager) (1999 to 2009); Frank E. Buck Professor of Finance-Emeritus, Stanford Graduate School of Business (1996 to present) | | 41 | Dimensional Fund Advisors (investment advisor); CME Group, Inc. (futures and options exchange) |
John B. Shoven (1947) | Director | Since 2002 | Professor of Economics, Stanford University (1973 to present) | | 41 | Cadence Design Systems; Exponent; Financial Engines |
| |
Interested Director |
Jonathan S. Thomas
(1963) | Director and President | Since 2007 | President and Chief Executive Officer, ACC (March 2007 to present). Also serves as Chief Executive Officer and Manager, ACS; Executive Vice President, ACIM; Director, ACC, ACIM and other ACC subsidiaries | | 106 | None |
Officers
The following table presents certain information about the executive officers of the funds. Each officer serves as an officer for each of the 15 investment companies in the American Century family of funds, unless otherwise noted. No officer is compensated for his or her service as an officer of the funds. The listed officers are interested persons of the funds and are appointed or re-appointed on an annual basis. The mailing address for each of the officers listed below is 4500 Main Street, Kansas City, Missouri 64111.
| | | |
Name
(Year of Birth) | Offices with the Funds | Principal Occupation(s) During the Past Five Years |
Jonathan S. Thomas
(1963) | Director and President since 2007 | President and Chief Executive Officer, ACC (March 2007 to present). Also serves as Chief Executive Officer and Manager, ACS; Executive Vice President, ACIM; Director, ACC, ACIM and other ACC subsidiaries |
Maryanne L. Roepke
(1956) | Chief Compliance Officer since 2006 and Senior Vice President since 2000 | Chief Compliance Officer, American Century funds, ACIM and ACS (August 2006 to present). Also serves as Senior Vice President, ACS |
Charles A. Etherington (1957) | General Counsel since 2007 and Senior Vice President since 2006 | Attorney, ACC (February 1994 to present); Vice President, ACC (November 2005 to present); General Counsel, ACC (March 2007 to present). Also serves as General Counsel, ACIM, ACS, ACIS and other ACC subsidiaries; and Senior Vice President, ACIM and ACS |
C. Jean Wade (1964) | Vice President, Treasurer and Chief Financial Officer since 2012 | Vice President, ACS (February 2000 to present) |
Robert J. Leach (1966) | Vice President since 2006 and Assistant Treasurer since 2012 | Vice President, ACS (February 2000 to present) |
David H. Reinmiller (1963) | Vice President since 2001 | Attorney, ACC (January 1994 to present); Associate General Counsel, ACC (January 2001 to present). Also serves as Vice President, ACIM and ACS |
Ward D. Stauffer (1960) | Secretary since 2005 | Attorney, ACC (June 2003 to present) |
The Statement of Additional Information has additional information about the fund’s directors and is available without charge, upon request, by calling 1-800-345-2021.
Approval of Management Agreement |
At a meeting held on June 11, 2013, the Fund’s Board of Directors/Trustees unanimously approved the renewal of the management agreement pursuant to which American Century Investment Management, Inc. (the “Advisor”) acts as the investment advisor for the Fund. Under Section 15(c) of the Investment Company Act, contracts for investment advisory services are required to be reviewed, evaluated, and approved by a majority of a fund’s directors/trustees (the “Directors”), including a majority of the independent Directors each year. The Board regards this annual evaluation and renewal as one of its most important responsibilities.
In connection with their annual review and evaluation, the independent Directors memorialized a statement regarding the relationship between their ongoing obligations to oversee and evaluate the performance of the Advisor and their consideration of renewal of the management agreement. In that statement, the independent Directors noted that their assessment of the Advisor’s performance is an ongoing process that takes place over the entire year and is informed by all of the information that the Board and its committees receive and consider over time. This information, together with the materials provided in connection with the review, are central to the Board’s assessment of the Advisor’s performance and its determination whether to renew the Fund’s management agreement.
Prior to its consideration of the renewal of the management agreement, the Board requested and reviewed extensive data and analysis relating to the proposed renewal. This information and analysis was compiled by the Advisor and certain independent providers of evaluation data concerning the Fund and the services provided to the Fund by the Advisor.
In connection with its consideration of the renewal of the management agreement, the Board’s review and evaluation of the services provided by the Advisor included, but was not limited to, the following:
• | the nature, extent, and quality of investment management, shareholder services, and other services provided by the Advisor to the Fund; |
• | the wide range of other programs and services the Advisor provides to the Fund and its shareholders on a routine and non-routine basis; |
• | the investment performance of the Fund, including data comparing the Fund’s performance to appropriate benchmarks and/or a peer group of other mutual funds with similar investment objectives and strategies; |
• | data comparing the cost of owning the Fund to the cost of owning similar funds; |
• | the Advisor’s compliance policies, procedures, and regulatory experience; |
• | financial data showing the cost of services provided to the Fund, the profitability of the Fund to the Advisor, and the overall profitability of the Advisor; |
• | possible economies of scale associated with the Advisor’s management of the Fund and other accounts under its management; |
• | data comparing services provided and charges to other investment management clients of the Advisor; and |
• | consideration of collateral benefits derived by the Advisor from the management of the Fund. |
In keeping with its practice, the Board held two in-person meetings to review and discuss the information provided. The Board also had the benefit of the advice of its independent counsel throughout the period.
Factors Considered
The Directors considered all of the information provided by the Advisor, the independent data providers, and the Board’s independent counsel in connection with the review, and evaluated such information for the Fund. In connection with their review, the Directors did not identify any single factor as being all-important or controlling and each Director may have attributed different levels of importance to different factors. In deciding to renew the management agreement, the Board based its decision on a number of factors, including the following:
Nature, Extent and Quality of Services — Generally. Under the management agreement, the Advisor is responsible for providing or arranging for all services necessary for the operation of the Fund. The Board noted that under the management agreement, the Advisor provides or arranges at its own expense a wide variety of services including:
• | constructing and designing the Fund |
• | portfolio research and security selection |
• | initial capitalization/funding |
• | daily valuation of the Fund’s portfolio |
• | shareholder servicing and transfer agency, including shareholder confirmations, recordkeeping, and communications |
• | regulatory and portfolio compliance |
• | marketing and distribution |
The Board noted that many of these services have expanded over time both in terms of quantity and complexity in response to shareholder demands, competition in the industry, changing distribution channels, and the changing regulatory environment.
Investment Management Services. The nature of the investment management services provided to the Fund is quite complex and allows Fund shareholders access to professional money management, instant diversification of their investments within an asset class, the opportunity to easily diversify among asset classes by investing in or exchanging among various American Century Investments funds, and liquidity. In evaluating investment performance, the Board expects the Advisor to manage the Fund in accordance with its investment objectives and approved strategies. Further, the Directors recognize that the Advisor has an obligation to seek the best execution of fund trades. In providing these services, the Advisor utilizes teams of investment professionals (portfolio managers, analysts, research assistants, and securities traders) who require extensive information technology, research, training, compliance and other systems to conduct their business. The Board, directly and through its Portfolio Committee, regularly reviews investment performance information for the Fund, together with comparative information for appropriate benchmarks and/or peer groups of similarly-managed funds, over different time horizons. The Directors also review detailed performance information during the management agreement approval process. If performance concerns are identified, the Fund receives special reviews until performance improves, during which the Board discusses with the Advisor the reasons for such results (e.g., market conditions, security selection) and any efforts being undertaken to improve performance. The Board found the investment management services provided by the Advisor to the Fund to meet or exceed industry standards. More detailed information about the Fund’s performance can be found in the Performance and Portfolio Commentary sections of this report.
Shareholder and Other Services. Under the management agreement, the Advisor provides the Fund with a comprehensive package of transfer agency, shareholder, and other services. The Board, directly and through various committees of the Board, regularly reviews reports and evaluations of such services at its regular meetings. These reports include, but are not limited to, information regarding the operational efficiency and accuracy of the shareholder and transfer agency services provided, staffing levels, shareholder satisfaction (as measured by external as well as internal sources), technology support, new products and services offered to Fund shareholders, securities trading activities, portfolio valuation services, auditing services, and legal and operational compliance activities. Certain aspects of shareholder and transfer agency service level efficiency and the quality of securities trading activities are measured by independent third party providers and are presented in comparison to other fund groups not managed by the Advisor. The Board found the services provided by the Advisor to the Fund under the management agreement to be competitive and of high quality.
Costs of Services and Profitability. The Advisor provides detailed information concerning its cost of providing various services to the Fund, its profitability in managing the Fund, its overall profitability, and its financial condition. The Directors have reviewed with the Advisor the methodology used to prepare this financial information. The financial information regarding the Advisor is considered in evaluating the Advisor’s financial condition, its ability to continue
to provide services under the management agreement, and the reasonableness of the current management fee. The Board concluded that the Advisor’s profits were reasonable in light of the services provided to the Fund.
Ethics. The Board generally considers the Advisor’s commitment to providing quality services to shareholders and to conducting its business ethically. They noted that the Advisor’s practices generally meet or exceed industry best practices.
Economies of Scale. The Board also reviewed information provided by the Advisor regarding the possible existence of economies of scale in connection with the management of the Fund. The Board concluded that economies of scale are difficult to measure and predict with precision, especially on a fund-by-fund basis. The Board concluded that the Advisor is appropriately sharing economies of scale through its competitive fee structure, offering competitive fees from fund inception, and through reinvestment in its business to provide shareholders additional content and services.
Comparison to Other Funds’ Fees. The management agreement provides that the Fund pay the Advisor a single, all-inclusive (or unified) management fee for providing all services necessary for the management and operation of the Fund, other than brokerage expenses, taxes, interest, extraordinary expenses, and the fees and expenses of the Fund’s independent directors (including their independent legal counsel) and expenses incurred in connection with the provision of shareholder services and distribution services under a plan adopted pursuant to Rule 12b-1 under the 1940 Act. Under the unified fee structure, the Advisor is responsible for providing all investment advisory, custody, audit, administrative, compliance, recordkeeping, marketing and shareholder services, or arranging and supervising third parties to provide such services. By contrast, most other funds are charged a variety of fees, including an investment advisory fee, a transfer agency fee, an administrative fee, distribution charges and other expenses. Other than their investment advisory fees and any applicable Rule 12b-1 distribution fees, all other components of the total fees charged by these other funds may be increased without shareholder approval. The Board believes the unified fee structure is a benefit to Fund shareholders because it clearly discloses to shareholders the cost of owning Fund shares, and, since the unified fee cannot be increased without a vote of Fund shareholders, it shifts to the Advisor the risk of increased costs of operating the Fund and provides a direct incentive to minimize administrative inefficiencies. Part of the Board’s analysis of fee levels involves reviewing certain evaluative data compiled by an independent provider and comparing the Fund’s unified fee to the total expense ratio of other funds in the Fund’s peer group. The Board concluded that the management fee paid by the Fund to the Advisor under the management agreement is reasonable in light of the services provided to the Fund.
Comparison to Fees and Services Provided to Other Clients of the Advisor. The Board also requested and received information from the Advisor concerning the nature of the services, fees, costs and profitability of its advisory services to advisory clients other than the Fund. They observed that these varying types of client accounts require different services and involve different regulatory and entrepreneurial risks than the management of the Fund. The Board analyzed this information and concluded that the fees charged and services provided to the Fund were reasonable by comparison.
Collateral or “Fall-Out” Benefits Derived by the Advisor. The Board considered the existence of collateral benefits the Advisor may receive as a result of its relationship with the Fund. They concluded that the Advisor’s primary business is managing mutual funds and it generally does not use fund or shareholder information to generate profits in other lines of business, and therefore does not derive any significant collateral benefits from them. The Board noted that the Advisor receives proprietary research from broker-dealers that execute fund portfolio transactions and concluded that this research is likely to benefit Fund shareholders. The Board also determined that the Advisor is able to provide investment management services to certain clients other than the Fund, at least in part, due to its existing infrastructure built to serve the fund complex. The Board concluded, however, that the assets of those other clients are not material to the analysis and, where applicable, may be included with the assets of the Fund to determine breakpoints in the management fee schedule.
Existing Relationship. The Board also considered whether there was any reason for not continuing the existing arrangement with the Advisor. In this regard, the Board was mindful of the potential disruptions of the Fund’s operations and various risks, uncertainties, and other effects that could occur as a result of a decision not to continue such relationship. In particular, the Board recognized that most shareholders have invested in the Fund on the strength of the Advisor’s industry standing and reputation and in the expectation that the Advisor will have a continuing role in providing advisory services to the Fund.
Conclusion of the Directors. As a result of this process, the Board, including all of the independent directors and assisted by the advice of independent legal counsel, taking into account all of the factors discussed above and the information provided by the Advisor and others, concluded that the management agreement between the Fund and the Advisor is fair and reasonable in light of the services provided and should be renewed.
Retirement Account Information
As required by law, distributions you receive from certain IRAs are subject to federal income tax withholding, unless you elect not to have withholding apply. Tax will be withheld on the total amount withdrawn even though you may be receiving amounts that are not subject to withholding, such as nondeductible contributions. In such case, excess amounts of withholding could occur. You may adjust your withholding election so that a greater or lesser amount will be withheld.
If you don’t want us to withhold on this amount, you must notify us to not withhold the federal income tax. You may notify us in writing or in certain situations by telephone or through other electronic means. For systematic withdrawals, your withholding election will remain in effect until revoked or changed by filing a new election. You have the right to revoke your election at any time.
Remember, even if you elect not to have income tax withheld, you are liable for paying income tax on the taxable portion of your withdrawal. If you elect not to have income tax withheld or you don’t have enough income tax withheld, you may be responsible for payment of estimated tax. You may incur penalties under the estimated tax rules if your withholding and estimated tax payments are not sufficient. You can reduce or defer the income tax on a distribution by directly or indirectly rolling such distribution over to another IRA or eligible plan. You should consult your tax advisor for additional information.
State tax will be withheld if, at the time of your distribution, your address is within one of the mandatory withholding states and you have federal income tax withheld (or as otherwise required by state law). State taxes will be withheld from your distribution in accordance with the respective state rules.
Distributions you receive from 403(b), 457 and qualified plans are subject to special tax and withholding rules. Your plan administrator or plan sponsor is required to provide you with a special tax notice explaining those rules at the time you request a distribution. If applicable, federal and/or state taxes may be withheld from your distribution amount.
Proxy Voting Guidelines
American Century Investment Management, Inc., the fund’s investment advisor, is responsible for exercising the voting rights associated with the securities purchased and/or held by the fund. A description of the policies and procedures the advisor uses in fulfilling this responsibility is available without charge, upon request, by calling 1-800-345-2021. It is also available on American Century Investments’ website at americancentury.com and on the Securities and Exchange Commission’s website at sec.gov. Information regarding how the investment advisor voted proxies relating to portfolio securities during the most recent 12-month period ended June 30 is available on the “About Us” page at americancentury.com. It is also available at sec.gov.
Quarterly Portfolio Disclosure
The fund files its complete schedule of portfolio holdings with the Securities and Exchange Commission (SEC) for the first and third quarters of each fiscal year on Form N-Q. The fund’s Forms N-Q are available on the SEC’s website at sec.gov, and may be reviewed and copied at the SEC’s Public Reference Room in Washington, DC. Information on the operation of the Public Reference Room may be obtained by calling 1-800-SEC-0330. The fund also makes its complete schedule of portfolio holdings for the most recent quarter of its fiscal year available on its website at americancentury.com and, upon request, by calling 1-800-345-2021.
Other Tax Information
The following information is provided pursuant to provisions of the Internal Revenue Code.
The fund hereby designates up to the maximum amount allowable as qualified dividend income for the fiscal year ended June 30, 2013.
For corporate taxpayers, the fund hereby designates $42,548,925, or up to the maximum amount allowable, of ordinary income distributions paid during the fiscal year ended June 30, 2013 as qualified for the corporate dividends received deduction.
Contact Us | americancentury.com |
Automated Information Line | 1-800-345-8765 |
Investor Services Representative | 1-800-345-2021
or 816-531-5575 |
Investors Using Advisors | 1-800-378-9878 |
Business, Not-For-Profit, Employer-Sponsored Retirement Plans | 1-800-345-3533 |
Banks and Trust Companies, Broker-Dealers, Financial Professionals, Insurance Companies | 1-800-345-6488 |
Telecommunications Device for the Deaf | 1-800-634-4113 |
American Century Quantitative Equity Funds, Inc.
Investment Advisor:
American Century Investment Management, Inc.
Kansas City, Missouri
This report and the statements it contains are submitted for the general information of our shareholders. The report is not authorized for distribution to prospective investors unless preceded or accompanied by an effective prospectus.
©2013 American Century Proprietary Holdings, Inc. All rights reserved.
CL-ANN-79314 1308
ANNUAL REPORT | JUNE 30, 2013 |
Equity Market Neutral Fund
President’s Letter | 2 |
Market Perspective | 3 |
Performance | 4 |
Portfolio Commentary | 6 |
Fund Characteristics | 8 |
Shareholder Fee Example | 9 |
Schedule of Investments | 11 |
Statement of Assets and Liabilities | 19 |
Statement of Operations | 20 |
Statement of Changes in Net Assets | 21 |
Notes to Financial Statements | 22 |
Financial Highlights | 28 |
Report of Independent Registered Public Accounting Firm | 30 |
Management | 31 |
Approval of Management Agreement | 34 |
Additional Information | 39 |
Any opinions expressed in this report reflect those of the author as of the date of the report, and do not necessarily represent the opinions of American Century Investments® or any other person in the American Century Investments organization. Any such opinions are subject to change at any time based upon market or other conditions and American Century Investments disclaims any responsibility to update such opinions. These opinions may not be relied upon as investment advice and, because investment decisions made by American Century Investments funds are based on numerous factors, may not be relied upon as an indication of trading intent on behalf of any American Century Investments fund. Security examples are used for representational purposes only and are not intended as recommendations to purchase or sell securities. Performance information for comparative indices and securities is provided to American Century Investments by third party vendors. To the best of American Century Investments’ knowledge, such information is accurate at the time of printing.
Jonathan Thomas
Dear Investor:
Thank you for reviewing this annual report for the 12 months ended June 30, 2013. It provides investment performance, market analysis, and portfolio information, presented with the expert perspective of our portfolio management team.
Annual reports remain important vehicles for conveying information about fund returns, including key factors that affected fund performance. For additional, updated investment and market insights, we encourage you to visit our website, americancentury.com.
Generally Favorable Fiscal-Year Returns for U.S. Stocks and High-Yield Bonds
The 12-month reporting period began in the summer of 2012 with uncertainties caused by slowing economies, as well as the upcoming November elections and year-end fiscal deadlines in the U.S. It ended with more uncertainty about the future of U.S. monetary stimulus. In between, aggressive monetary intervention by central banks encouraged investors to take more risk, generally boosting stocks at the expense of government bonds.
U.S. mid-cap, small-cap, and value stock indices achieved performance leadership during the period, outpacing the S&P 500 Index’s 20.60% return. U.S. stocks generally outperformed non-U.S. equities—the MSCI EAFE Index returned 18.62% and the MSCI Emerging Markets Index advanced 2.87%, affected by slowing growth in emerging market economies.
Slower emerging market growth also hindered commodity price gains and helped keep inflation under control. As a result, assets used as inflation hedges, including inflation-indexed securities and precious metals, lagged other assets. Gold, in particular, plunged, starting last October. And Treasury inflation-protected securities (TIPS) were among the lowest performers in the U.S. bond market. Bond index returns generally ranged from approximately 10% gains for U.S. corporate high-yield indices all the way down to negative returns for longer-maturity global Treasury benchmarks.
Despite signs of improvement in 2013, U.S. economic growth is subpar compared with past recession recoveries, and remains vulnerable to threats that could trigger another slowdown and market volatility. Therefore, we continue to believe in a disciplined, diversified, long-term investment approach, using professionally managed stock and bond portfolios—as appropriate—for meeting financial goals. We appreciate your continued trust in us in this volatile environment.
Sincerely,
Jonathan Thomas
President and Chief Executive Officer
American Century Investments
By Scott Wittman, Chief Investment Officer, Asset Allocation and Quantitative Equity
Central Bank Actions, Relative U.S. Economic Gains Drove Stocks Higher
Stock market performance remained robust during the 12-month period ended June 30, 2013. Despite persistent concerns about weak global growth and Europe’s ongoing financial crisis, investors largely focused on central bank stimulus measures and marginally-improving U.S. economic data, which fueled market optimism.
Early in the period, in response to disappointing U.S. economic data, the U.S. Federal Reserve (the Fed) launched its third—and most aggressive—quantitative easing (QE) program, or monthly purchases of $40 billion in government agency mortgage-backed securities. Later in 2012, the Fed expanded the program to include $45 billion in Treasury purchases, bringing its total bond buying to $85 billion per month. This unprecedented program, combined with relatively healthy corporate earnings, significant housing market gains and modest improvements in the labor market, helped keep stocks and other riskier assets in favor.
The Fed rattled the financial markets late in the reporting period, with comments about “tapering” its quantitative easing program. Fed Chairman Ben Bernanke said the central bank could begin scaling back its bond buying later in 2013 if the economy continues to improve. After reaching record highs in May, stocks stumbled in June, following Bernanke’s comments. Late in the month, the Fed toned down its tapering talk, and stocks recovered some of their June losses. Overall, most U.S. stock benchmarks generated stellar 12-month returns, largely aided by strong double-digit gains posted during the first calendar quarter of 2013.
Value Stocks Outpaced Growth Stocks
Across the capitalization spectrum, value stocks were the performance leaders for the 12-month period. Much of this was due to strong one-year returns from the financials and health care sectors, where many value-oriented stocks reside. In particular, expectations for rising interest rates—and the late-quarter rate increase triggered by Fed tapering talk—helped boost returns within the financial sector’s banking industry. At the opposite end, the rate-sensitive utilities sector was the weakest relative performer, held back by the prospect of rising interest rates.
U.S. Stock Index Returns |
For the 12 months ended June 30, 2013 |
Russell 1000 Index (Large-Cap) | 21.24% | | Russell 2000 Index (Small-Cap) | 24.21% |
Russell 1000 Growth Index | 17.07% | | Russell 2000 Growth Index | 23.67% |
Russell 1000 Value Index | 25.32% | | Russell 2000 Value Index | 24.77% |
Russell Midcap Index | 25.41% | | | |
Russell Midcap Growth Index | 22.88% | | | |
Russell Midcap Value Index | 27.65% | | | |
Total Returns as of June 30, 2013 |
| | | | Average Annual Returns | |
| | Ticker
Symbol | 1 year | 5 years | Since Inception | Inception
Date |
Investor Class | ALHIX | 2.28% | -0.26% | 1.34% | 9/30/05 |
Barclays U.S. 1-3 Month Treasury Bill Index | — | 0.08% | 0.23% | 1.62% | — |
Institutional Class | ALISX | 2.54% | -0.05% | 1.54% | 9/30/05 |
A Class No sales charge* With sales charge* | ALIAX | 2.02% -3.89% | -0.50% -1.66% | 1.09% 0.32% | 9/30/05 |
C Class | ALICX | 1.30% | -1.24% | 0.33% | 9/30/05 |
R Class | ALIRX | 1.85% | -0.75% | 0.83% | 9/30/05 |
*Sales charges include initial sales charges and contingent deferred sales charges (CDSCs), as applicable. A Class shares have a 5.75% maximum initial sales charge and may be subject to a maximum CDSC of 1.00%. C Class shares redeemed within 12 months of purchase are subject to a maximum CDSC of 1.00%. The SEC requires that mutual funds provide performance information net of maximum sales charges in all cases where charges could be applied.
Data presented reflect past performance. Past performance is no guarantee of future results. Current performance may be higher or lower than the performance shown. Investment return and principal value will fluctuate, and redemption value may be more or less than original cost. To obtain performance data current to the most recent month end, please call 1-800-345-2021 or visit americancentury.com. The fund’s investment process may result in high portfolio turnover, which could mean high transaction costs, affecting both performance and capital gains tax liabilities to investors. In addition, its investment approach may involve higher price volatility, short sales risk and overweighting risk.
Unless otherwise indicated, performance reflects Investor Class shares; performance for other share classes will vary due to differences in fee structure. For information about other share classes available, please consult the prospectus. Data assumes reinvestment of dividends and capital gains, and none of the charts reflect the deduction of taxes that a shareholder would pay on fund distributions or the redemption of fund shares. Returns for the index are provided for comparison. The fund’s total returns include operating expenses (such as transaction costs and management fees) that reduce returns, while the total returns of the index do not.
Growth of $10,000 Over Life of Class |
$10,000 investment made September 30, 2005 |
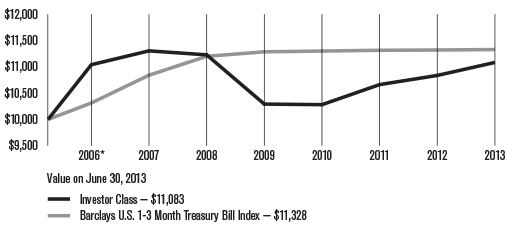
*From 9/30/05, the Investor Class’s inception date. Not annualized.
Total Annual Fund Operating Expenses |
Investor Class | Institutional Class | A Class | C Class | R Class |
3.38% | 3.18% | 3.63% | 4.38% | 3.88% |
The total annual fund operating expenses shown is as stated in the fund’s prospectus current as of the date of this report. The prospectus may vary from the expense ratio shown elsewhere in this report because it is based on a different time period, includes acquired fund fees and expenses, and, if applicable, does not include fee waivers or expense reimbursements.
Data presented reflect past performance. Past performance is no guarantee of future results. Current performance may be higher or lower than the performance shown. Investment return and principal value will fluctuate, and redemption value may be more or less than original cost. To obtain performance data current to the most recent month end, please call 1-800-345-2021 or visit americancentury.com. The fund’s investment process may result in high portfolio turnover, which could mean high transaction costs, affecting both performance and capital gains tax liabilities to investors. In addition, its investment approach may involve higher price volatility, short sales risk and overweighting risk.
Unless otherwise indicated, performance reflects Investor Class shares; performance for other share classes will vary due to differences in fee structure. For information about other share classes available, please consult the prospectus. Data assumes reinvestment of dividends and capital gains, and none of the charts reflect the deduction of taxes that a shareholder would pay on fund distributions or the redemption of fund shares. Returns for the index are provided for comparison. The fund’s total returns include operating expenses (such as transaction costs and management fees) that reduce returns, while the total returns of the index do not.
Portfolio Managers: Brian Garbe and Claudia Musat
Performance Summary
Equity Market Neutral returned 2.28%* for the fiscal year ended June 30, 2013, compared with the 0.08% return of its benchmark, the Barclays U.S. 1–3 Month Treasury Bill Index.
Equity Market Neutral is designed to generate capital appreciation in all market environments, regardless of general stock market performance, so the fund uses a riskless asset—a short-term Treasury bill index—as its benchmark. In a year of strength for U.S. equity markets (see page 3 for details), the fund met its investment objective, posting a positive overall return and outperforming its benchmark. The portfolio’s stock selection process incorporates factors of growth, value, quality, and momentum, and is designed to minimize unintended risks along industries and other risk characteristics. The key contribution to performance in the last 12 months came from companies offering attractive growth characteristics at reasonable prices. Quality measures were muted, while momentum insights, particularly with longer horizon signals, failed to gain traction during the year. The fund’s outperformance was driven primarily by long positions, which delivered positive results for the 12-month period and more than offset modest losses from the fund’s short holdings.
Long Positions Outperformed
The long portion of the Equity Market Neutral portfolio posted a positive return for the 12-month period, driven in large part by stock selection in the materials and consumer discretionary sectors. Materials sector outperformance was driven by holdings in the chemicals and metals and mining industries. The single highest contributor in the sector was chemicals manufacturer LyondellBasell Industries, which appreciated nearly 80% on robust earnings growth and analyst expectations during the reporting period. Other top sector performers included chemicals producer Huntsman and precious metals company Silver Wheaton Corp.
In the consumer discretionary sector, the biggest winners came from long positions in retailers and homebuilders. GameStop was among the most successful holdings in both the sector and the portfolio. The company’s stock price climbed 140% during the year on improved revenue outlook as investor concerns regarding new console compatibility with prior generations’ games were allayed. Shares of homebuilder Pulte Group rose 78% during the year thanks to a recovery in the housing sector.
Other long positions that significantly impacted fund performance included chicken producer Pilgrim’s Pride, which gained over 200% during the fiscal year on increased profits and higher price targets, natural gas company Exterran, and oil refiner Marathon Petroleum.
*All fund returns referenced in this commentary are for Investor Class shares.
Short Positions Declined Modestly
Equity Market Neutral’s short positions—which are designed to profit when a stock’s price declines—were detrimental during a period when many stocks saw significant appreciation. Information technology and utilities holdings produced the bulk of underperformance. In the information technology sector, the most significant detractors among short positions included solar industry semiconductor producer SunEdison (formerly MEMC Electronics) and broadband service provider ViaSat. Despite high valuations and negative net margins, shares of SunEdison rose during the year on hopes of increased traction of solar energy usage. The investment team remains confident in this short position as research suggests that the company looks expensive at nearly 60 times 2013 expected earnings and a negative return on equity. Similarly, the fund’s short position
in ViaSat hurt results after investors overlooked negative earnings and below-estimate revenue guidance, sending shares soaring 90% during the year.
In the utilities sector, gas utilities and independent power producers had the biggest negative impact, led by wholesale power generator and retail electricity producer NRG Energy. Shares of NRG returned 57% during the reporting period as the company raised its earnings estimates on increased demand for electric vehicles and solar technology. Elsewhere in the portfolio, short positions in industrials sector constituent MasTec and materials holding Louisiana-Pacific Corp. also detracted meaningfully. Infrastructure construction company MasTec rose 117% on higher revenues and earnings guidance while building products manufacturer Louisiana-Pacific Corp. gained on higher price targets.
A Look Ahead
As we move into the second half of 2013, the U.S. economic recovery seems to be progressing, albeit with headwinds. Improvements in housing, employment, and economic indicators have been consistent and point to slow but positive growth. Volatility is likely to remain elevated as ongoing concerns over interest rates, Federal Reserve action, and a potential slowdown in China dominate headlines. Heightened levels of volatility often provide investment opportunities in both the long and short portions of the portfolio. Our disciplined, objective, and systematic investment strategy is designed to take advantage of these opportunities at the individual company level. We believe this approach is the most powerful way to capitalize on market inefficiencies that lead to the mispricing of individual stocks.
JUNE 30, 2013 | |
Top Ten Long Holdings | % of net assets |
RR Donnelley & Sons Co. | 0.79% |
Mentor Graphics Corp. | 0.76% |
Northrop Grumman Corp. | 0.75% |
Regions Financial Corp. | 0.74% |
Owens-Illinois, Inc. | 0.72% |
Crane Co. | 0.72% |
Boston Scientific Corp. | 0.72% |
Greif, Inc., Class A | 0.72% |
Hanesbrands, Inc. | 0.70% |
Danaher Corp. | 0.69% |
| | |
Top Ten Short Holdings | % of net assets |
Charles Schwab Corp. (The) | (0.82)% |
SS&C Technologies Holdings, Inc. | (0.77)% |
Pioneer Natural Resources Co. | (0.72)% |
Hexcel Corp. | (0.71)% |
Platinum Underwriters Holdings Ltd. | (0.70)% |
CME Group, Inc. | (0.69)% |
Cabela’s, Inc. | (0.69)% |
Solera Holdings, Inc. | (0.68)% |
West Pharmaceutical Services, Inc. | (0.68)% |
Tiffany & Co. | (0.67)% |
| | |
Types of Investments in Portfolio | % of net assets |
Common Stocks | 95.1% |
Common Stocks Sold Short | (95.1)% |
Temporary Cash Investments | 2.5% |
Other Assets and Liabilities* | 97.5% |
*Amount relates primarily to deposits with broker for securities sold short at period end.
Fund shareholders may incur two types of costs: (1) transaction costs, including sales charges (loads) on purchase payments and redemption/exchange fees; and (2) ongoing costs, including management fees; distribution and service (12b-1) fees; and other fund expenses. This example is intended to help you understand your ongoing costs (in dollars) of investing in your fund and to compare these costs with the ongoing cost of investing in other mutual funds.
The example is based on an investment of $1,000 made at the beginning of the period and held for the entire period from January 1, 2013 to June 30, 2013.
Actual Expenses
The table provides information about actual account values and actual expenses for each class. You may use the information, together with the amount you invested, to estimate the expenses that you paid over the period. First, identify the share class you own. Then simply divide your account value by $1,000 (for example, an $8,600 account value divided by $1,000 = 8.6), then multiply the result by the number under the heading “Expenses Paid During Period” to estimate the expenses you paid on your account during this period.
If you hold Investor Class shares of any American Century Investments fund, or Institutional Class shares of the American Century Diversified Bond Fund, in an American Century Investments account (i.e., not a financial intermediary or retirement plan account), American Century Investments may charge you a $12.50 semiannual account maintenance fee if the value of those shares is less than $10,000. We will redeem shares automatically in one of your accounts to pay the $12.50 fee. In determining your total eligible investment amount, we will include your investments in all personal accounts (including American Century Investments Brokerage accounts) registered under your Social Security number. Personal accounts include individual accounts, joint accounts, UGMA/UTMA accounts, personal trusts, Coverdell Education Savings Accounts and IRAs (including traditional, Roth, Rollover, SEP-, SARSEP- and SIMPLE-IRAs), and certain other retirement accounts. If you have only business, business retirement, employer-sponsored or American Century Investments Brokerage accounts, you are currently not subject to this fee. If you are subject to the Account Maintenance Fee, your account value could be reduced by the fee amount.
Hypothetical Example for Comparison Purposes
The table also provides information about hypothetical account values and hypothetical expenses based on the actual expense ratio of each class of your fund and an assumed rate of return of 5% per year before expenses, which is not the actual return of a fund’s share class. The hypothetical account values and expenses may not be used to estimate the actual ending account balance or expenses you paid for the period. You may use this information to compare the ongoing costs of investing in your fund and other funds. To do so, compare this 5% hypothetical example with the 5% hypothetical examples that appear in the shareholder reports of the other funds.
Please note that the expenses shown in the table are meant to highlight your ongoing costs only and do not reflect any transactional costs, such as sales charges (loads) or redemption/exchange fees. Therefore, the table is useful in comparing ongoing costs only, and will not help you determine the relative total costs of owning different funds. In addition, if these transactional costs were included, your costs would have been higher.| | | | | |
| | Beginning
Account Value 1/1/13 | Ending
Account Value 6/30/13 | Expenses Paid During Period(1) 1/1/13 – 6/30/13 | Annualized
Expense Ratio(1) |
Actual | | | | |
Investor Class | $1,000 | $1,025.70 | $14.16 | 2.82% |
Institutional Class | $1,000 | $1,027.30 | $13.17 | 2.62% |
A Class | $1,000 | $1,025.10 | $15.41 | 3.07% |
C Class | $1,000 | $1,021.20 | $19.14 | 3.82% |
R Class | $1,000 | $1,023.50 | $16.66 | 3.32% |
Hypothetical | | | | |
Investor Class | $1,000 | $1,010.81 | $14.06 | 2.82% |
Institutional Class | $1,000 | $1,011.80 | $13.07 | 2.62% |
A Class | $1,000 | $1,009.57 | $15.30 | 3.07% |
C Class | $1,000 | $1,005.85 | $19.00 | 3.82% |
R Class | $1,000 | $1,008.33 | $16.53 | 3.32% |
(1) | Expenses are equal to the class’s annualized expense ratio listed in the table above, multiplied by the average account value over the period, multiplied by 181, the number of days in the most recent fiscal half-year, divided by 365, to reflect the one-half year period. |
JUNE 30, 2013
| | | | | | | |
| | | Shares | | | Value | |
Common Stocks — 95.1% | |
AEROSPACE AND DEFENSE — 3.5% | |
Alliant Techsystems, Inc. | | 3,093 | | | $254,647 | |
Boeing Co. (The) | | 2,435 | | | 249,441 | |
Esterline Technologies Corp.(1) | | 3,696 | | | 267,184 | |
Huntington Ingalls Industries, Inc.(2) | | 579 | | | 32,702 | |
L-3 Communications Holdings, Inc. | | 1,209 | | | 103,659 | |
Northrop Grumman Corp.(2) | | 4,180 | | | 346,104 | |
Raytheon Co. | | 2,183 | | | 144,340 | |
Textron, Inc.(2) | | 8,515 | | | 221,816 | |
| | | | | | 1,619,893 | |
AIR FREIGHT AND LOGISTICS — 0.1% | |
FedEx Corp. | | 552 | | | 54,416 | |
AIRLINES — 1.0% | |
Alaska Air Group, Inc.(1)(2) | | 4,257 | | | 221,364 | |
Allegiant Travel Co. | | 2,436 | | | 258,192 | |
| | | | | | 479,556 | |
AUTO COMPONENTS — 1.1% | |
BorgWarner, Inc.(1) | | 2,642 | | | 227,608 | |
Dana Holding Corp. | | 12,255 | | | 236,031 | |
Tenneco, Inc.(1) | | 830 | | | 37,583 | |
| | | | | | 501,222 | |
BIOTECHNOLOGY — 1.1% | |
Alkermes plc(1) | | 3,869 | | | 110,963 | |
Amgen, Inc. | | 919 | | | 90,668 | |
BioMarin Pharmaceutical, Inc.(1) | | 854 | | | 47,645 | |
Celgene Corp.(1) | | 245 | | | 28,643 | |
Cubist Pharmaceuticals, Inc.(1)(2) | | 2,287 | | | 110,462 | |
United Therapeutics Corp.(1) | | 1,690 | | | 111,236 | |
| | | | | | 499,617 | |
BUILDING PRODUCTS — 0.3% | |
Fortune Brands Home & Security, Inc. | | 4,019 | | | 155,696 | |
CAPITAL MARKETS — 3.2% | |
Evercore Partners, Inc., Class A | | 6,465 | | | 253,945 | |
Federated Investors, Inc., Class B(2) | | 8,534 | | | 233,917 | |
Investment Technology Group, Inc.(1)(2) | | 20,555 | | | 287,359 | |
Janus Capital Group, Inc.(2) | | 19,026 | | | 161,911 | |
SEI Investments Co.(2) | | 7,711 | | | 219,224 | |
Waddell & Reed Financial, Inc., Class A(2) | | 7,203 | | | 313,331 | |
| | | | | | 1,469,687 | |
CHEMICALS — 4.5% | |
CF Industries Holdings, Inc.(2) | | 1,557 | | | 267,026 | |
Chemtura Corp.(1)(2) | | 8,345 | | | 169,404 | |
LyondellBasell Industries NV, Class A(2) | | 4,486 | | | 297,242 | |
Monsanto Co.(2) | | 3,120 | | | 308,256 | |
NewMarket Corp. | | 1,112 | | | 291,967 | |
PPG Industries, Inc.(2) | | 1,823 | | | 266,905 | |
Valspar Corp. (The) | | 3,363 | | | 217,485 | |
W.R. Grace & Co.(1) | | 2,904 | | | 244,052 | |
| | | | | | 2,062,337 | |
COMMERCIAL BANKS — 1.0% | |
PacWest Bancorp. | | 4,459 | | | 136,668 | |
Regions Financial Corp.(2) | | 35,871 | | | 341,851 | |
| | | | | | 478,519 | |
COMMERCIAL SERVICES AND SUPPLIES — 2.0% | |
Deluxe Corp. | | 6,660 | | | 230,769 | |
Mine Safety Appliances Co.(2) | | 5,507 | | | 256,351 | |
RR Donnelley & Sons Co.(2) | | 25,751 | | | 360,772 | |
Steelcase, Inc., Class A | | 4,980 | | | 72,608 | |
| | | | | | 920,500 | |
COMMUNICATIONS EQUIPMENT — 2.5% | |
ARRIS Group, Inc.(1)(2) | | 18,991 | | | 272,521 | |
Brocade Communications Systems, Inc.(1)(2) | | 45,640 | | | 262,886 | |
Ciena Corp.(1)(2) | | 11,726 | | | 227,719 | |
InterDigital, Inc. | | 4,321 | | | 192,933 | |
Research In Motion Ltd.(1)(2) | | 18,523 | | | 193,936 | |
| | | | | | 1,149,995 | |
COMPUTERS AND PERIPHERALS — 0.2% | |
EMC Corp. | | 4,689 | | | 110,754 | |
CONSTRUCTION AND ENGINEERING — 0.7% | |
AECOM Technology Corp.(1)(2) | | 9,597 | | | 305,089 | |
CONSUMER FINANCE — 1.6% | |
Cash America International, Inc.(2) | | 5,703 | | | 259,259 | |
Credit Acceptance Corp.(1) | | 2,106 | | | 221,235 | |
Portfolio Recovery Associates, Inc.(1) | | 1,545 | | | 237,358 | |
| | | | | | 717,852 | |
CONTAINERS AND PACKAGING — 2.1% | |
Greif, Inc., Class A(2) | | 6,250 | | | $329,187 | |
Owens-Illinois, Inc.(1)(2) | | 11,982 | | | 332,980 | |
Packaging Corp. of America | | 5,935 | | | 290,578 | |
| | | | | | 952,745 | |
DIVERSIFIED CONSUMER SERVICES — 0.5% | |
Coinstar, Inc.(1)(2) | | 4,008 | | | 235,149 | |
DIVERSIFIED FINANCIAL SERVICES — 1.7% | |
Interactive Brokers Group, Inc., Class A(2) | | 16,370 | | | 261,429 | |
Moody’s Corp. | | 4,953 | | | 301,786 | |
MSCI, Inc., Class A(1)(2) | | 6,908 | | | 229,829 | |
| | | | | | 793,044 | |
DIVERSIFIED TELECOMMUNICATION SERVICES — 1.1% | |
AT&T, Inc.(2) | | 5,387 | | | 190,700 | |
CenturyLink, Inc. | | 3,023 | | | 106,863 | |
Vonage Holdings Corp.(1)(2) | | 78,502 | | | 222,161 | |
| | | | | | 519,724 | |
ELECTRIC UTILITIES — 1.7% | |
Edison International | | 5,195 | | | 250,191 | |
Pinnacle West Capital Corp. | | 4,143 | | | 229,813 | |
Portland General Electric Co.(2) | | 9,946 | | | 304,248 | |
| | | | | | 784,252 | |
ELECTRICAL EQUIPMENT — 2.6% | |
Babcock & Wilcox Co. (The) | | 7,654 | | | 229,850 | |
Brady Corp., Class A(2) | | 8,240 | | | 253,215 | |
Emerson Electric Co. | | 4,160 | | | 226,886 | |
EnerSys(2) | | 5,064 | | | 248,339 | |
Rockwell Automation, Inc. | | 2,773 | | | 230,547 | |
| | | | | | 1,188,837 | |
ELECTRONIC EQUIPMENT, INSTRUMENTS AND COMPONENTS — 0.8% | |
Celestica, Inc.(1)(2) | | 6,984 | | | 65,999 | |
Itron, Inc.(1)(2) | | 6,574 | | | 278,935 | |
| | | | | | 344,934 | |
ENERGY EQUIPMENT AND SERVICES — 2.8% | |
CARBO Ceramics, Inc. | | 3,517 | | | 237,151 | |
Ensco plc, Class A | | 3,986 | | | 231,667 | |
Exterran Holdings, Inc.(1)(2) | | 6,984 | | | 196,390 | |
Nabors Industries Ltd. | | 14,572 | | | 223,097 | |
Oil States International, Inc.(1) | | 300 | | | 27,792 | |
Patterson-UTI Energy, Inc. | | 6,664 | | | 128,982 | |
RPC, Inc.(2) | | 17,415 | | | 240,501 | |
| | | | | | 1,285,580 | |
FOOD AND STAPLES RETAILING — 1.7% | |
CVS Caremark Corp.(2) | | 4,857 | | | 277,723 | |
Rite Aid Corp.(1)(2) | | 88,925 | | | 254,326 | |
Safeway, Inc. | | 10,071 | | | 238,280 | |
| | | | | | 770,329 | |
FOOD PRODUCTS — 1.2% | |
Archer-Daniels-Midland Co. | | 7,088 | | | 240,354 | |
Ingredion, Inc. | | 754 | | | 49,478 | |
Pilgrim’s Pride Corp.(1)(2) | | 16,999 | | | 253,965 | |
| | | | | | 543,797 | |
GAS UTILITIES — 0.5% | |
UGI Corp. | | 6,207 | | | 242,756 | |
HEALTH CARE EQUIPMENT AND SUPPLIES — 2.0% | |
Abbott Laboratories | | 3,340 | | | 116,499 | |
Boston Scientific Corp.(1)(2) | | 35,686 | | | 330,809 | |
Hill-Rom Holdings, Inc.(2) | | 2,591 | | | 87,265 | |
Medtronic, Inc. | | 1,182 | | | 60,838 | |
St. Jude Medical, Inc. | | 2,279 | | | 103,991 | |
Thoratec Corp.(1)(2) | | 7,072 | | | 221,424 | |
| | | | | | 920,826 | |
HEALTH CARE PROVIDERS AND SERVICES — 1.9% | |
AmerisourceBergen Corp. | | 4,283 | | | 239,120 | |
Mednax, Inc.(1) | | 2,416 | | | 221,257 | |
Owens & Minor, Inc. | | 686 | | | 23,208 | |
Quest Diagnostics, Inc. | | 2,835 | | | 171,886 | |
Select Medical Holdings Corp.(2) | | 26,221 | | | 215,012 | |
| | | | | | 870,483 | |
HEALTH CARE TECHNOLOGY — 0.6% | |
Allscripts Healthcare Solutions, Inc.(1)(2) | | 21,155 | | | 273,746 | |
HOTELS, RESTAURANTS AND LEISURE — 2.2% | |
Bally Technologies, Inc.(1)(2) | | 4,794 | | | 270,478 | |
Cracker Barrel Old Country Store, Inc. | | 2,614 | | | 247,441 | |
Domino’s Pizza, Inc. | | 3,955 | | | 229,983 | |
International Game Technology(2) | | 16,191 | | | 270,552 | |
| | | | | | 1,018,454 | |
HOUSEHOLD DURABLES — 2.1% | |
Garmin Ltd.(2) | | 7,044 | | | 254,711 | |
Harman International Industries, Inc.(2) | | 4,628 | | | 250,837 | |
Newell Rubbermaid, Inc.(2) | | 8,320 | | | 218,400 | |
PulteGroup, Inc.(1)(2) | | 11,673 | | | 221,437 | |
| | | | | | 945,385 | |
HOUSEHOLD PRODUCTS — 0.6% | |
Energizer Holdings, Inc. | | 2,932 | | | 294,695 | |
INDEPENDENT POWER PRODUCERS AND ENERGY TRADERS — 0.6% | |
AES Corp. (The)(2) | | 22,032 | | | $264,164 | |
INDUSTRIAL CONGLOMERATES — 1.2% | |
Carlisle Cos., Inc. | | 3,444 | | | 214,595 | |
Danaher Corp.(2) | | 4,979 | | | 315,171 | |
| | | | | | 529,766 | |
INSURANCE — 3.1% | |
Aflac, Inc.(2) | | 5,214 | | | 303,038 | |
American International Group, Inc.(1) | | 1,440 | | | 64,368 | |
Amtrust Financial Services, Inc.(2) | | 7,350 | | | 262,395 | |
Arch Capital Group Ltd.(1)(2) | | 582 | | | 29,921 | |
Axis Capital Holdings Ltd. | | 3,039 | | | 139,125 | |
First American Financial Corp.(2) | | 9,790 | | | 215,771 | |
RenaissanceRe Holdings Ltd. | | 1,487 | | | 129,057 | |
Torchmark Corp. | | 479 | | | 31,202 | |
XL Group plc(2) | | 8,534 | | | 258,751 | |
| | | | | | 1,433,628 | |
INTERNET AND CATALOG RETAIL — 1.1% | |
Expedia, Inc. | | 4,053 | | | 243,788 | |
HomeAway, Inc.(1)(2) | | 7,768 | | | 251,217 | |
| | | | | | 495,005 | |
INTERNET SOFTWARE AND SERVICES — 1.0% | |
Dice Holdings, Inc.(1)(2) | | 24,358 | | | 224,337 | |
ValueClick, Inc.(1) | | 6,888 | | | 169,996 | |
Zillow, Inc., Class A(1) | | 1,022 | | | 57,539 | |
| | | | | | 451,872 | |
IT SERVICES — 2.0% | |
Computer Sciences Corp.(2) | | 5,337 | | | 233,600 | |
CoreLogic, Inc.(1)(2) | | 8,487 | | | 196,644 | |
Jack Henry & Associates, Inc. | | 2,886 | | | 136,017 | |
NeuStar, Inc., Class A(1) | | 5,110 | | | 248,755 | |
Total System Services, Inc.(2) | | 1,997 | | | 48,887 | |
VeriFone Systems, Inc.(1) | | 4,354 | | | 73,191 | |
| | | | | | 937,094 | |
LEISURE EQUIPMENT AND PRODUCTS — 1.4% | |
Hasbro, Inc. | | 5,252 | | | 235,447 | |
Mattel, Inc. | | 2,452 | | | 111,100 | |
Polaris Industries, Inc.(2) | | 2,877 | | | 273,315 | |
| | | | | | 619,862 | |
LIFE SCIENCES TOOLS AND SERVICES — 0.8% | |
Agilent Technologies, Inc.(2) | | 4,100 | | | 175,316 | |
Illumina, Inc.(1) | | 2,722 | | | 203,714 | |
| | | | | | 379,030 | |
MACHINERY — 3.2% | |
Actuant Corp., Class A(2) | | 6,950 | | | 229,142 | |
Crane Co. | | 5,533 | | | 331,537 | |
Lincoln Electric Holdings, Inc.(2) | | 5,098 | | | 291,962 | |
Oshkosh Corp.(1) | | 4,316 | | | 163,879 | |
Terex Corp.(1) | | 7,268 | | | 191,148 | |
Toro Co. (The) | | 500 | | | 22,705 | |
WABCO Holdings, Inc.(1)(2) | | 3,036 | | | 226,759 | |
| | | | | | 1,457,132 | |
MEDIA — 3.2% | |
Comcast Corp., Class A(2) | | 4,442 | | | 186,031 | |
Gannett Co., Inc.(2) | | 9,144 | | | 223,662 | |
Lions Gate Entertainment Corp.(1) | | 8,263 | | | 226,985 | |
Regal Entertainment Group, Class A(2) | | 17,488 | | | 313,035 | |
Scholastic Corp.(2) | | 8,200 | | | 240,178 | |
Starz – Liberty Capital(1) | | 4,740 | | | 104,754 | |
Time Warner Cable, Inc. | | 1,627 | | | 183,005 | |
| | | | | | 1,477,650 | |
METALS AND MINING — 2.3% | |
Agnico-Eagle Mines Ltd. New York Shares | | 5,938 | | | 163,532 | |
Coeur Mining, Inc.(1)(2) | | 16,852 | | | 224,132 | |
Reliance Steel & Aluminum Co. | | 3,526 | | | 231,165 | |
Steel Dynamics, Inc. | | 1,619 | | | 24,139 | |
United States Steel Corp. | | 9,639 | | | 168,972 | |
Worthington Industries, Inc.(2) | | 8,410 | | | 266,681 | |
| | | | | | 1,078,621 | |
MULTI-UTILITIES — 1.8% | |
Ameren Corp.(2) | | 7,826 | | | 269,527 | |
Black Hills Corp. | | 4,877 | | | 237,754 | |
CenterPoint Energy, Inc. | | 10,154 | | | 238,518 | |
TECO Energy, Inc.(2) | | 5,439 | | | 93,496 | |
| | | | | | 839,295 | |
MULTILINE RETAIL — 1.2% | |
Dillard’s, Inc., Class A(2) | | 3,552 | | | 291,157 | |
Macy’s, Inc.(2) | | 5,832 | | | 279,936 | |
| | | | | | 571,093 | |
OIL, GAS AND CONSUMABLE FUELS — 4.0% | |
ConocoPhillips(2) | | 4,489 | | | 271,584 | |
CVR Energy, Inc. | | 848 | | | 40,195 | |
Delek US Holdings, Inc. | | 5,761 | | | 165,802 | |
Exxon Mobil Corp. | | 2,896 | | | 261,654 | |
Gran Tierra Energy, Inc.(1) | | 37,681 | | | 226,463 | |
PBF Energy, Inc. | | 2,157 | | | 55,866 | |
Suncor Energy, Inc.(2) | | 5,715 | | | $168,535 | |
Tesoro Corp. | | 2,924 | | | 152,984 | |
Ultra Petroleum Corp.(1) | | 2,596 | | | 51,453 | |
Valero Energy Corp.(2) | | 5,620 | | | 195,407 | |
Western Refining, Inc.(2) | | 8,773 | | | 246,258 | |
| | | | | | 1,836,201 | |
PERSONAL PRODUCTS — 0.6% | |
Nu Skin Enterprises, Inc., Class A | | 4,370 | | | 267,094 | |
PHARMACEUTICALS — 2.2% | |
Eli Lilly & Co.(2) | | 5,935 | | | 291,527 | |
Endo Health Solutions, Inc.(1) | | 1,358 | | | 49,961 | |
Johnson & Johnson | | 1,454 | | | 124,840 | |
Merck & Co., Inc.(2) | | 5,906 | | | 274,334 | |
Pfizer, Inc.(2) | | 7,990 | | | 223,800 | |
Questcor Pharmaceuticals, Inc. | | 557 | | | 25,321 | |
| | | | | | 989,783 | |
PROFESSIONAL SERVICES — 0.5% | |
Dun & Bradstreet Corp. | | 2,482 | | | 241,871 | |
REAL ESTATE INVESTMENT TRUSTS (REITs) — 1.0% | |
Apartment Investment & Management Co., Class A(2) | | 5,463 | | | 164,109 | |
Corrections Corp. of America | | 7,029 | | | 238,072 | |
Sunstone Hotel Investors, Inc.(1) | | 3,587 | | | 43,331 | |
| | | | | | 445,512 | |
ROAD AND RAIL — 1.0% | |
Avis Budget Group, Inc.(1)(2) | | 8,375 | | | 240,781 | |
Swift Transportation Co.(1)(2) | | 14,315 | | | 236,770 | |
| | | | | | 477,551 | |
SEMICONDUCTORS AND SEMICONDUCTOR EQUIPMENT — 2.0% | |
First Solar, Inc.(1) | | 3,786 | | | 169,348 | |
Freescale Semiconductor Ltd.(1)(2) | | 1,910 | | | 25,880 | |
KLA-Tencor Corp.(2) | | 4,686 | | | 261,151 | |
LSI Corp.(1)(2) | | 26,498 | | | 189,196 | |
NVIDIA Corp.(2) | | 18,210 | | | 255,486 | |
| | | | | | 901,061 | |
SOFTWARE — 4.0% | |
Activision Blizzard, Inc.(2) | | 16,568 | | | 236,260 | |
Aspen Technology, Inc.(1) | | 2,624 | | | 75,545 | |
Cadence Design Systems, Inc.(1)(2) | | 16,000 | | | 231,680 | |
Mentor Graphics Corp.(2) | | 17,877 | | | 349,495 | |
Open Text Corp. | | 4,289 | | | 293,668 | |
Oracle Corp.(2) | | 7,457 | | | 229,079 | |
Symantec Corp.(2) | | 8,201 | | | 184,276 | |
Synopsys, Inc.(1)(2) | | 6,636 | | | 237,237 | |
| | | | | | 1,837,240 | |
SPECIALTY RETAIL — 4.3% | |
American Eagle Outfitters, Inc.(2) | | 12,803 | | | 233,783 | |
ANN, Inc.(1)(2) | | 761 | | | 25,265 | |
Best Buy Co., Inc.(2) | | 11,434 | | | 312,491 | |
Buckle, Inc. (The)(2) | | 5,842 | | | 303,901 | |
DSW, Inc., Class A | | 2,132 | | | 156,638 | |
GameStop Corp., Class A(2) | | 7,080 | | | 297,572 | |
Gap, Inc. (The) | | 5,789 | | | 241,575 | |
PetSmart, Inc.(2) | | 3,255 | | | 218,053 | |
Staples, Inc. | | 11,072 | | | 175,602 | |
| | | | | | 1,964,880 | |
TEXTILES, APPAREL AND LUXURY GOODS — 1.6% | |
Crocs, Inc.(1)(2) | | 7,406 | | | 122,199 | |
Hanesbrands, Inc. | | 6,258 | | | 321,786 | |
Iconix Brand Group, Inc.(1)(2) | | 9,724 | | | 285,983 | |
| | | | | | 729,968 | |
THRIFTS AND MORTGAGE FINANCE — 0.7% | |
Ocwen Financial Corp.(1)(2) | | 7,443 | | | 306,800 | |
TOBACCO — 0.6% | |
Universal Corp.(2) | | 4,950 | | | 286,357 | |
TRADING COMPANIES AND DISTRIBUTORS — 0.8% | |
MRC Global, Inc.(1) | | 8,599 | | | 237,504 | |
WESCO International, Inc.(1) | | 1,652 | | | 112,270 | |
| | | | | | 349,774 | |
TOTAL COMMON STOCKS (Cost $36,750,090) | | | 43,678,173 | |
Temporary Cash Investments — 2.5% | |
Repurchase Agreement, Bank of America Merrill Lynch, (collateralized by various U.S. Treasury obligations, 1.00%, 1/15/14, valued at $152,949), in a joint trading account at 0.06%, dated 6/28/13, due 7/1/13 (Delivery value $149,821) | | | 149,820 | |
Repurchase Agreement, Credit Suisse First Boston, Inc., (collateralized by various U.S. Treasury obligations, 4.25%, 11/15/40, valued at $457,955), in a joint trading account at 0.05%, dated 6/28/13, due 7/1/13 (Delivery value $449,464) | | | 449,462 | |
Repurchase Agreement, Goldman Sachs & Co., (collateralized by various U.S. Treasury obligations, 3.125%, 11/15/41, valued at $152,388), in a joint trading account at 0.04%, dated 6/28/13, due 7/1/13 (Delivery value $149,821) | | | 149,821 | |
SSgA U.S. Government Money Market Fund | | 416,748 | | | $416,748 | |
TOTAL TEMPORARY CASH INVESTMENTS (Cost $1,165,851) | | | 1,165,851 | |
TOTAL INVESTMENT SECURITIES BEFORE SECURITIES SOLD SHORT — 97.6% (Cost $37,915,941) | | | 44,844,024 | |
Common Stocks Sold Short — (95.1)% | |
AEROSPACE AND DEFENSE — (2.8)% | |
CAE, Inc. | | (22,709 | ) | | (235,265 | ) |
DigitalGlobe, Inc. | | (7,578 | ) | | (234,994 | ) |
Hexcel Corp. | | (9,517 | ) | | (324,054 | ) |
Precision Castparts Corp. | | (1,320 | ) | | (298,333 | ) |
TransDigm Group, Inc. | | (1,331 | ) | | (208,661 | ) |
| | | | | | (1,301,307 | ) |
AIR FREIGHT AND LOGISTICS — (1.6)% | |
Atlas Air Worldwide Holdings, Inc. | | (5,399 | ) | | (236,260 | ) |
CH Robinson Worldwide, Inc. | | (4,159 | ) | | (234,193 | ) |
UTi Worldwide, Inc. | | (15,829 | ) | | (260,704 | ) |
| | | | | | (731,157 | ) |
AIRLINES — (0.1)% | |
JetBlue Airways Corp. | | (3,944 | ) | | (24,847 | ) |
AUTO COMPONENTS — (1.0)% | |
Johnson Controls, Inc. | | (6,714 | ) | | (240,294 | ) |
TRW Automotive Holdings Corp. | | (3,393 | ) | | (225,431 | ) |
| | | | | | (465,725 | ) |
AUTOMOBILES — (0.6)% | |
Ford Motor Co. | | (17,995 | ) | | (278,383 | ) |
BEVERAGES — (1.5)% | |
Beam, Inc. | | (3,971 | ) | | (250,610 | ) |
Brown-Forman Corp. Class B | | (468 | ) | | (31,613 | ) |
Coca-Cola Co. (The) | | (6,642 | ) | | (266,411 | ) |
Monster Beverage Corp. | | (2,299 | ) | | (139,710 | ) |
| | | | | | (688,344 | ) |
BIOTECHNOLOGY — (0.6)% | |
Ariad Pharmaceuticals, Inc. | | (2,243 | ) | | (39,230 | ) |
Medivation, Inc. | | (2,145 | ) | | (105,534 | ) |
Onyx Pharmaceuticals, Inc. | | (344 | ) | | (29,866 | ) |
Theravance, Inc. | | (3,065 | ) | | (118,095 | ) |
| | | | | | (292,725 | ) |
BUILDING PRODUCTS — (0.5)% | |
Armstrong World Industries, Inc. | | (4,976 | ) | | (237,803 | ) |
CAPITAL MARKETS — (2.5)% | |
Bank of New York Mellon Corp. (The) | | (9,670 | ) | | (271,244 | ) |
Charles Schwab Corp. (The) | | (17,709 | ) | | (375,962 | ) |
Cohen & Steers, Inc. | | (5,725 | ) | | (194,535 | ) |
Stifel Financial Corp. | | (8,470 | ) | | (302,125 | ) |
| | | | | | (1,143,866 | ) |
CHEMICALS — (5.2)% | |
Air Products & Chemicals, Inc. | | (2,947 | ) | | (269,857 | ) |
Cabot Corp. | | (7,166 | ) | | (268,152 | ) |
Cytec Industries, Inc. | | (3,140 | ) | | (230,005 | ) |
Intrepid Potash, Inc. | | (12,506 | ) | | (238,239 | ) |
PolyOne Corp. | | (9,028 | ) | | (223,714 | ) |
Praxair, Inc. | | (2,280 | ) | | (262,565 | ) |
Rockwood Holdings, Inc. | | (3,962 | ) | | (253,687 | ) |
RPM International, Inc. | | (2,817 | ) | | (89,975 | ) |
Sensient Technologies Corp. | | (7,327 | ) | | (296,524 | ) |
Tronox Ltd. Class A | | (12,290 | ) | | (247,643 | ) |
| | | | | | (2,380,361 | ) |
COMMERCIAL BANKS — (2.6)% | |
BankUnited, Inc. | | (1,936 | ) | | (50,355 | ) |
First Republic Bank | | (2,357 | ) | | (90,697 | ) |
Iberiabank Corp. | | (1,041 | ) | | (55,808 | ) |
Investors Bancorp, Inc. | | (7,338 | ) | | (154,685 | ) |
Texas Capital Bancshares, Inc. | | (6,575 | ) | | (291,667 | ) |
Trustmark Corp. | | (8,647 | ) | | (212,543 | ) |
UMB Financial Corp. | | (544 | ) | | (30,285 | ) |
Valley National Bancorp | | (31,352 | ) | | (296,904 | ) |
| | | | | | (1,182,944 | ) |
COMMERCIAL SERVICES AND SUPPLIES — (1.8)% | |
Clean Harbors, Inc. | | (4,581 | ) | | (231,478 | ) |
Interface, Inc. | | (15,827 | ) | | (268,584 | ) |
Iron Mountain, Inc. | | (8,053 | ) | | (214,291 | ) |
KAR Auction Services, Inc. | | (5,821 | ) | | (133,126 | ) |
| | | | | | (847,479 | ) |
COMMUNICATIONS EQUIPMENT — (1.1)% | |
EchoStar Corp. Class A | | (6,116 | ) | | (239,197 | ) |
ViaSat, Inc. | | (3,911 | ) | | (279,480 | ) |
| | | | | | (518,677 | ) |
COMPUTERS AND PERIPHERALS — (1.4)% | |
Diebold, Inc. | | (1,867 | ) | | (62,899 | ) |
NCR Corp. | | (8,947 | ) | | (295,162 | ) |
Stratasys Ltd. | | (3,356 | ) | | (281,031 | ) |
| | | | | | (639,092 | ) |
CONSTRUCTION AND ENGINEERING — (0.9)% | |
KBR, Inc. | | (5,235 | ) | | (170,138 | ) |
MasTec, Inc. | | (6,970 | ) | | (229,313 | ) |
| | | | | | (399,451 | ) |
CONSTRUCTION MATERIALS — (0.3)% | |
Texas Industries, Inc. | | (2,231 | ) | | (145,327 | ) |
CONSUMER FINANCE — (0.4)% | |
Capital One Financial Corp. | | (1,353 | ) | | $(84,982 | ) |
Discover Financial Services | | (1,611 | ) | | (76,748 | ) |
| | | | | | (161,730 | ) |
CONTAINERS AND PACKAGING — (0.6)% | |
MeadWestvaco Corp. | | (7,389 | ) | | (252,039 | ) |
DISTRIBUTORS — (0.6)% | |
LKQ Corp. | | (10,698 | ) | | (275,474 | ) |
DIVERSIFIED CONSUMER SERVICES — (1.1)% | |
Bright Horizons Family Solutions, Inc. | | (3,687 | ) | | (127,976 | ) |
H&R Block, Inc. | | (7,985 | ) | | (221,584 | ) |
Sotheby’s | | (3,950 | ) | | (149,744 | ) |
| | | | | | (499,304 | ) |
DIVERSIFIED FINANCIAL SERVICES — (1.2)% | |
CME Group, Inc. | | (4,183 | ) | | (317,824 | ) |
IntercontinentalExchange, Inc. | | (311 | ) | | (55,283 | ) |
Leucadia National Corp. | | (7,417 | ) | | (194,474 | ) |
| | | | | | (567,581 | ) |
ELECTRIC UTILITIES — (2.1)% | |
ALLETE, Inc. | | (3,946 | ) | | (196,708 | ) |
Duke Energy Corp. | | (1,328 | ) | | (89,640 | ) |
ITC Holdings Corp. | | (2,535 | ) | | (231,445 | ) |
NextEra Energy, Inc. | | (324 | ) | | (26,399 | ) |
Northeast Utilities | | (6,637 | ) | | (278,887 | ) |
Pepco Holdings, Inc. | | (7,385 | ) | | (148,882 | ) |
| | | | | | (971,961 | ) |
ELECTRICAL EQUIPMENT — (1.1)% | |
Eaton Corp. plc | | (620 | ) | | (40,802 | ) |
Franklin Electric Co., Inc. | | (7,146 | ) | | (240,463 | ) |
GrafTech International Ltd. | | (31,459 | ) | | (229,022 | ) |
| | | | | | (510,287 | ) |
ELECTRONIC EQUIPMENT, INSTRUMENTS AND COMPONENTS — (1.1)% | |
Arrow Electronics, Inc. | | (5,876 | ) | | (234,158 | ) |
Ingram Micro, Inc., Class A | | (13,109 | ) | | (248,940 | ) |
Jabil Circuit, Inc. | | (1,534 | ) | | (31,263 | ) |
| | | | | | (514,361 | ) |
ENERGY EQUIPMENT AND SERVICES — (3.6)% | |
Atwood Oceanics, Inc. | | (4,345 | ) | | (226,157 | ) |
FMC Technologies, Inc. | | (5,337 | ) | | (297,164 | ) |
Hornbeck Offshore Services, Inc. | | (2,554 | ) | | (136,639 | ) |
Noble Corp. | | (7,750 | ) | | (291,245 | ) |
Rowan Cos. plc | | (7,469 | ) | | (254,469 | ) |
SEACOR Holdings, Inc. | | (3,368 | ) | | (279,713 | ) |
Unit Corp. | | (4,412 | ) | | (187,863 | ) |
| | | | | | (1,673,250 | ) |
FOOD AND STAPLES RETAILING — (0.7)% | |
Casey’s General Stores, Inc. | | (4,872 | ) | | (293,100 | ) |
Sysco Corp. | | (889 | ) | | (30,368 | ) |
| | | | | | (323,468 | ) |
FOOD PRODUCTS — (1.6)% | |
Bunge Ltd. | | (3,123 | ) | | (221,015 | ) |
Hain Celestial Group, Inc. (The) | | (3,783 | ) | | (245,781 | ) |
Snyders-Lance, Inc. | | (9,772 | ) | | (277,623 | ) |
| | | | | | (744,419 | ) |
GAS UTILITIES — (1.9)% | |
National Fuel Gas Co. | | (5,205 | ) | | (301,630 | ) |
New Jersey Resources Corp. | | (3,178 | ) | | (131,982 | ) |
ONEOK, Inc. | | (4,566 | ) | | (188,622 | ) |
South Jersey Industries, Inc. | | (3,988 | ) | | (228,951 | ) |
| | | | | | (851,185 | ) |
HEALTH CARE EQUIPMENT AND SUPPLIES — (1.6)% | |
Haemonetics Corp. | | (5,779 | ) | | (238,962 | ) |
Hologic, Inc. | | (10,404 | ) | | (200,797 | ) |
West Pharmaceutical Services, Inc. | | (4,455 | ) | | (313,008 | ) |
| | | | | | (752,767 | ) |
HEALTH CARE PROVIDERS AND SERVICES — (3.3)% | |
Acadia Healthcare Co., Inc. | | (677 | ) | | (22,388 | ) |
Air Methods Corp. | | (6,160 | ) | | (208,701 | ) |
Brookdale Senior Living, Inc. | | (2,630 | ) | | (69,537 | ) |
Catamaran Corp. | | (4,441 | ) | | (216,365 | ) |
DaVita HealthCare Partners, Inc. | | (1,979 | ) | | (239,063 | ) |
Health Net, Inc. | | (9,023 | ) | | (287,112 | ) |
Team Health Holdings, Inc. | | (7,027 | ) | | (288,599 | ) |
WellCare Health Plans, Inc. | | (3,661 | ) | | (203,369 | ) |
| | | | | | (1,535,134 | ) |
HEALTH CARE TECHNOLOGY — (0.3)% | |
athenahealth, Inc. | | (1,427 | ) | | (120,895 | ) |
HOTELS, RESTAURANTS AND LEISURE — (3.7)% | |
BJ’s Restaurants, Inc. | | (6,179 | ) | | (229,241 | ) |
Buffalo Wild Wings, Inc. | | (1,201 | ) | | (117,890 | ) |
Darden Restaurants, Inc. | | (5,687 | ) | | (287,080 | ) |
Dunkin’ Brands Group, Inc. | | (6,395 | ) | | (273,834 | ) |
Life Time Fitness, Inc. | | (4,603 | ) | | (230,656 | ) |
McDonald’s Corp. | | (2,732 | ) | | (270,468 | ) |
MGM Resorts International | | (11,759 | ) | | (173,798 | ) |
Penn National Gaming, Inc. | | (1,939 | ) | | (102,496 | ) |
| | | | | | (1,685,463 | ) |
HOUSEHOLD DURABLES — (2.6)% | |
DR Horton, Inc. | | (10,518 | ) | | (223,823 | ) |
Lennar Corp., Class A | | (3,203 | ) | | (115,436 | ) |
NVR, Inc. | | (66 | ) | | (60,852 | ) |
Ryland Group, Inc. | | (3,368 | ) | | $(135,057 | ) |
Standard Pacific Corp. | | (18,034 | ) | | (150,223 | ) |
Tempur-Pedic International, Inc. | | (5,958 | ) | | (261,556 | ) |
Toll Brothers, Inc. | | (7,382 | ) | | (240,875 | ) |
| | | | | | (1,187,822 | ) |
INDEPENDENT POWER PRODUCERS AND ENERGY TRADERS — (0.7)% | |
NRG Energy, Inc. | | (11,184 | ) | | (298,613 | ) |
INSURANCE — (1.5)% | |
Berkshire Hathaway, Inc., Class B | | (970 | ) | | (108,562 | ) |
Platinum Underwriters Holdings Ltd. | | (5,608 | ) | | (320,890 | ) |
RLI Corp. | | (3,616 | ) | | (276,299 | ) |
| | | | | | (705,751 | ) |
INTERNET SOFTWARE AND SERVICES — (1.0)% | |
CoStar Group, Inc. | | (1,906 | ) | | (246,007 | ) |
Equinix, Inc. | | (1,068 | ) | | (197,281 | ) |
Yahoo!, Inc. | | (998 | ) | | (25,060 | ) |
| | | | | | (468,348 | ) |
IT SERVICES — (3.6)% | |
Automatic Data Processing, Inc. | | (4,446 | ) | | (306,151 | ) |
Convergys Corp. | | (15,215 | ) | | (265,197 | ) |
Genpact Ltd. | | (13,858 | ) | | (266,628 | ) |
MAXIMUS, Inc. | | (989 | ) | | (73,661 | ) |
Paychex, Inc. | | (7,459 | ) | | (272,403 | ) |
Visa, Inc. A Shares | | (1,405 | ) | | (256,764 | ) |
WEX, Inc. | | (2,814 | ) | | (215,834 | ) |
| | | | | | (1,656,638 | ) |
LIFE SCIENCES TOOLS AND SERVICES — (0.5)% | |
Covance, Inc. | | (2,995 | ) | | (228,039 | ) |
MACHINERY — (2.4)% | |
Chart Industries, Inc. | | (2,423 | ) | | (227,980 | ) |
Joy Global, Inc. | | (2,380 | ) | | (115,502 | ) |
PACCAR, Inc. | | (5,135 | ) | | (275,544 | ) |
Pentair Ltd. | | (4,778 | ) | | (275,643 | ) |
Stanley Black & Decker, Inc. | | (2,898 | ) | | (224,015 | ) |
| | | | | | (1,118,684 | ) |
MARINE — (0.6)% | |
Kirby Corp. | | (3,199 | ) | | (254,448 | ) |
MEDIA — (1.6)% | |
DreamWorks Animation SKG, Inc., Class A | | (10,624 | ) | | (272,612 | ) |
Interpublic Group of Cos., Inc. (The) | | (16,168 | ) | | (235,245 | ) |
Loral Space & Communications, Inc. | | (3,781 | ) | | (226,784 | ) |
| | | | | | (734,641 | ) |
METALS AND MINING — (3.5)% | |
AK Steel Holding Corp. | | (44,950 | ) | | (136,648 | ) |
Allied Nevada Gold Corp. | | (9,898 | ) | | (64,139 | ) |
AuRico Gold, Inc. | | (17,054 | ) | | (74,526 | ) |
Barrick Gold Corp. | | (11,865 | ) | | (186,755 | ) |
Carpenter Technology Corp. | | (5,886 | ) | | (265,282 | ) |
Compass Minerals International, Inc. | | (2,861 | ) | | (241,840 | ) |
Goldcorp, Inc. | | (1,543 | ) | | (38,158 | ) |
Hecla Mining Co. | | (29,413 | ) | | (87,651 | ) |
New Gold, Inc. | | (5,570 | ) | | (35,760 | ) |
Newmont Mining Corp. | | (1,091 | ) | | (32,676 | ) |
Royal Gold, Inc. | | (2,208 | ) | | (92,913 | ) |
Silver Standard Resources, Inc. | | (17,145 | ) | | (108,699 | ) |
Stillwater Mining Co. | | (19,710 | ) | | (211,685 | ) |
Thompson Creek Metals Co., Inc. | | (15,713 | ) | | (47,610 | ) |
| | | | | | (1,624,342 | ) |
MULTI-UTILITIES — (1.5)% | |
MDU Resources Group, Inc. | | (10,170 | ) | | (263,505 | ) |
NiSource, Inc. | | (9,060 | ) | | (259,478 | ) |
Sempra Energy | | (1,996 | ) | | (163,193 | ) |
| | | | | | (686,176 | ) |
MULTILINE RETAIL — (1.1)% | |
Family Dollar Stores, Inc. | | (4,326 | ) | | (269,553 | ) |
J.C. Penney Co., Inc. | | (14,864 | ) | | (253,877 | ) |
| | | | | | (523,430 | ) |
OIL, GAS AND CONSUMABLE FUELS — (5.0)% | |
Approach Resources, Inc. | | (7,817 | ) | | (192,063 | ) |
Consol Energy, Inc. | | (7,035 | ) | | (190,648 | ) |
Devon Energy Corp. | | (2,350 | ) | | (121,918 | ) |
Enbridge, Inc. | | (5,418 | ) | | (227,935 | ) |
Kinder Morgan, Inc. | | (2,953 | ) | | (112,657 | ) |
Kodiak Oil & Gas Corp. | | (31,330 | ) | | (278,524 | ) |
Oasis Petroleum, Inc. | | (1,116 | ) | | (43,379 | ) |
Pioneer Natural Resources Co. | | (2,273 | ) | | (329,017 | ) |
SM Energy Co. | | (4,038 | ) | | (242,199 | ) |
Spectra Energy Corp. | | (8,245 | ) | | (284,123 | ) |
World Fuel Services Corp. | | (6,262 | ) | | (250,355 | ) |
| | | | | | (2,272,818 | ) |
PHARMACEUTICALS — (0.7)% | |
Akorn, Inc. | | (7,683 | ) | | (103,874 | ) |
Forest Laboratories, Inc. | | (774 | ) | | (31,734 | ) |
Valeant Pharmaceuticals International, Inc. | | (1,346 | ) | | (115,864 | ) |
ViroPharma, Inc. | | (1,022 | ) | | (29,280 | ) |
VIVUS, Inc. | | (1,534 | ) | | (19,298 | ) |
| | | | | | (300,050 | ) |
PROFESSIONAL SERVICES — (1.1)% | |
Corporate Executive Board Co. (The) | | (4,589 | ) | | $(290,116 | ) |
IHS, Inc. Class A | | (2,194 | ) | | (229,010 | ) |
| | | | | | (519,126 | ) |
REAL ESTATE INVESTMENT TRUSTS (REITs) — (2.5)% | |
AvalonBay Communities, Inc. | | (610 | ) | | (82,295 | ) |
CBL & Associates Properties, Inc. | | (10,735 | ) | | (229,944 | ) |
National Retail Properties, Inc. | | (1,824 | ) | | (62,746 | ) |
Rayonier, Inc. | | (4,559 | ) | | (252,523 | ) |
SL Green Realty Corp. | | (2,616 | ) | | (230,705 | ) |
WP Carey, Inc. | | (4,449 | ) | | (294,390 | ) |
| | | | | | (1,152,603 | ) |
REAL ESTATE MANAGEMENT AND DEVELOPMENT — (1.5)% | |
Altisource Portfolio Solutions SA | | (1,384 | ) | | (130,207 | ) |
Brookfield Asset Management, Inc., Class A | | (2,303 | ) | | (82,954 | ) |
Brookfield Office Properties, Inc. | | (15,787 | ) | | (263,327 | ) |
Forest City Enterprises, Inc., Class A | | (12,229 | ) | | (219,021 | ) |
| | | | | | (695,509 | ) |
ROAD AND RAIL — (2.2)% | |
Genesee & Wyoming, Inc., Class A | | (3,005 | ) | | (254,944 | ) |
Kansas City Southern | | (1,007 | ) | | (106,702 | ) |
Old Dominion Freight Line, Inc. | | (7,374 | ) | | (306,906 | ) |
Ryder System, Inc. | | (2,555 | ) | | (155,318 | ) |
Werner Enterprises, Inc. | | (7,218 | ) | | (174,459 | ) |
| | | | | | (998,329 | ) |
SEMICONDUCTORS AND SEMICONDUCTOR EQUIPMENT — (0.5)% | |
SunEdison, Inc. | | (28,524 | ) | | (233,041 | ) |
SOFTWARE — (2.6)% | |
Concur Technologies, Inc. | | (2,794 | ) | | (227,375 | ) |
FactSet Research Systems, Inc. | | (1,050 | ) | | (107,037 | ) |
QLIK Technologies, Inc. | | (6,566 | ) | | (185,621 | ) |
Solera Holdings, Inc. | | (5,626 | ) | | (313,087 | ) |
SS&C Technologies Holdings, Inc. | | (10,761 | ) | | (354,037 | ) |
| | | | | | (1,187,157 | ) |
SPECIALTY RETAIL — (3.7)% | |
Ascena Retail Group, Inc. | | (3,176 | ) | | (55,421 | ) |
AutoNation, Inc. | | (1,305 | ) | | (56,624 | ) |
Cabela’s, Inc. | | (4,864 | ) | | (314,993 | ) |
CarMax, Inc. | | (5,141 | ) | | (237,309 | ) |
JOS A Bank Clothiers, Inc. | | (5,516 | ) | | (227,921 | ) |
Penske Automotive Group, Inc. | | (6,399 | ) | | (195,425 | ) |
Pier 1 Imports, Inc. | | (12,318 | ) | | (289,350 | ) |
Tiffany & Co. | | (4,256 | ) | | (310,007 | ) |
| | | | | | (1,687,050 | ) |
TEXTILES, APPAREL AND LUXURY GOODS — (0.8)% | |
Fifth & Pacific Cos., Inc. | | (1,106 | ) | | (24,708 | ) |
PVH Corp. | | (293 | ) | | (36,640 | ) |
Wolverine World Wide, Inc. | | (5,463 | ) | | (298,334 | ) |
| | | | | | (359,682 | ) |
THRIFTS AND MORTGAGE FINANCE — (1.7)% | |
Capitol Federal Financial, Inc. | | (21,631 | ) | | (262,600 | ) |
EverBank Financial Corp. | | (15,257 | ) | | (252,656 | ) |
Nationstar Mortgage Holdings, Inc. | | (6,370 | ) | | (238,493 | ) |
TFS Financial Corp. | | (3,101 | ) | | (34,731 | ) |
| | | | | | (788,480 | ) |
TRADING COMPANIES AND DISTRIBUTORS — (2.3)% | |
Air Lease Corp. | | (11,180 | ) | | (308,456 | ) |
GATX Corp. | | (2,403 | ) | | (113,974 | ) |
Textainer Group Holdings Ltd. | | (5,683 | ) | | (218,455 | ) |
United Rentals, Inc. | | (4,484 | ) | | (223,796 | ) |
Watsco, Inc. | | (2,289 | ) | | (192,185 | ) |
| | | | | | (1,056,866 | ) |
WIRELESS TELECOMMUNICATION SERVICES — (0.5)% | |
Crown Castle International Corp. | | (3,448 | ) | | (249,601 | ) |
TOTAL COMMON STOCKS SOLD SHORT — (95.1)% (Proceeds $41,757,645) | | | (43,704,050 | ) |
OTHER ASSETS AND LIABILITIES(3) — 97.5% | | | 44,793,218 | |
TOTAL NET ASSETS — 100.0% | | | $45,933,192 | |
Notes to Schedule of Investments
(2) | Security, or a portion thereof, has been pledged at the custodian bank or with a broker for collateral requirements on securities sold short. At the period end, the aggregate value of securities pledged was $24,699,911. |
(3) | Amount relates primarily to deposits with brokers for securities sold short at period end. |
See Notes to Financial Statements.
Statement of Assets and Liabilities |
JUNE 30, 2013 | |
Assets | |
Investment securities, at value (cost of $37,915,941) | | $44,844,024 | |
Deposits with broker for securities sold short | | 45,648,616 | |
Receivable for capital shares sold | | 17,805 | |
Dividends and interest receivable | | 145,899 | |
| | | 90,656,344 | |
| | | | |
Liabilities | | | |
Securities sold short, at value (proceeds of $41,757,645) | | 43,704,050 | |
Payable for capital shares redeemed | | 916,756 | |
Accrued management fees | | 52,079 | |
Distribution and service fees payable | | 8,100 | |
Dividend expense payable on securities sold short | | 41,338 | |
Broker fees and charges payable on securities sold short | | 829 | |
| | | 44,723,152 | |
| | | | |
Net Assets | | $45,933,192 | |
| | | | |
Net Assets Consist of: | | | |
Capital (par value and paid-in surplus) | | $52,296,989 | |
Accumulated net investment loss | | (319,360 | ) |
Accumulated net realized loss | | (11,026,119 | ) |
Net unrealized appreciation | | 4,981,682 | |
| | | $45,933,192 | |
| | | | |
| | Net assets | Shares outstanding | Net asset value per share |
Investor Class, $0.01 Par Value | $17,915,973 | 1,661,548 | $10.78 |
Institutional Class, $0.01 Par Value | $4,490,944 | 411,218 | $10.92 |
A Class, $0.01 Par Value | $17,545,104 | 1,651,986 | $10.62* |
C Class, $0.01 Par Value | $4,376,718 | 433,379 | $10.10 |
R Class, $0.01 Par Value | $1,604,453 | 153,580 | $10.45 |
*Maximum offering price $11.27 (net asset value divided by 0.9425).
See Notes to Financial Statements.
YEAR ENDED JUNE 30, 2013 | |
Investment Income (Loss) | |
Income: | | | |
Dividends (net of foreign taxes withheld of $6,718) | | $1,082,210 | |
Interest | | 1,070 | |
| | | 1,083,280 | |
| | | | |
Expenses: | | | |
Dividend expense on securities sold short | | 740,433 | |
Broker fees and charges on securities sold short | | 142,331 | |
Management fees | | 713,553 | |
Distribution and service fees: | | | |
A Class | | 56,102 | |
C Class | | 50,667 | |
R Class | | 5,860 | |
Directors’ fees and expenses | | 4,086 | |
Other expenses | | 918 | |
| | | 1,713,950 | |
| | | | |
Net investment income (loss) | | (630,670 | ) |
| | | | |
Realized and Unrealized Gain (Loss) | | | |
Net realized gain (loss) on: | | | |
Investment transactions | | 10,002,389 | |
Securities sold short transactions | | (7,133,488 | ) |
Foreign currency transactions | | (179 | ) |
| | | 2,868,722 | |
| | | | |
Change in net unrealized appreciation (depreciation) on: | | | |
Investments | | 2,534,033 | |
Securities sold short | | (3,785,458 | ) |
Translation of assets and liabilities in foreign currencies | | 79 | |
| | | (1,251,346 | ) |
| | | | |
Net realized and unrealized gain (loss) | | 1,617,376 | |
| | | | |
Net Increase (Decrease) in Net Assets Resulting from Operations | | $986,706 | |
See Notes to Financial Statements.
Statement of Changes in Net Assets |
YEARS ENDED JUNE 30, 2013 AND JUNE 30, 2012 | |
Increase (Decrease) in Net Assets | | June 30, 2013 | | | June 30, 2012 | |
Operations | |
Net investment income (loss) | | $(630,670 | ) | | $(1,532,796 | ) |
Net realized gain (loss) | | 2,868,722 | | | 5,986,400 | |
Change in net unrealized appreciation (depreciation) | | (1,251,346 | ) | | (3,702,478 | ) |
Net increase (decrease) in net assets resulting from operations | | 986,706 | | | 751,126 | |
| | | | | | | |
Capital Share Transactions | | | | | | |
Net increase (decrease) in net assets from capital share transactions | | (22,929,637 | ) | | 3,082,233 | |
| | | | | | | |
Net increase (decrease) in net assets | | (21,942,931 | ) | | 3,833,359 | |
| | | | | | | |
Net Assets | | | | | | |
Beginning of period | | 67,876,123 | | | 64,042,764 | |
End of period | | $45,933,192 | | | $67,876,123 | |
| | | | | | | |
Accumulated net investment loss | | $(319,360 | ) | | $(857,655 | ) |
See Notes to Financial Statements.
Notes to Financial Statements |
JUNE 30, 2013
1. Organization
American Century Quantitative Equity Funds, Inc. (the corporation) is registered under the Investment Company Act of 1940, as amended (the 1940 Act), as an open-end management investment company and is organized as a Maryland corporation. Equity Market Neutral Fund (the fund) is one fund in a series issued by the corporation. The fund is diversified as defined under the 1940 Act. The fund’s investment objective is to seek capital appreciation independent of equity market conditions.
The fund offers the Investor Class, the Institutional Class, the A Class, the C Class and the R Class. The A Class may incur an initial sales charge. The A Class and C Class may be subject to a contingent deferred sales charge. The share classes differ principally in their respective sales charges and distribution and shareholder servicing expenses and arrangements. The Institutional Class is made available to institutional shareholders or through financial intermediaries whose clients do not require the same level of shareholder and administrative services as shareholders of other classes. As a result, the Institutional Class is charged a lower unified management fee. On October 21, 2011, all outstanding B Class shares were converted to A Class shares and the fund discontinued offering the B Class.
2. Significant Accounting Policies
The following is a summary of significant accounting policies consistently followed by the fund in preparation of its financial statements. The financial statements are prepared in conformity with accounting principles generally accepted in the United States of America, which may require management to make certain estimates and assumptions at the date of the financial statements. Actual results could differ from these estimates.
Investment Valuations — The fund determines the fair value of its investments and computes its net asset value per share as of the close of regular trading (usually 4 p.m. Eastern time) on the New York Stock Exchange (NYSE) on each day the NYSE is open.
Equity securities that are listed or traded on a domestic securities exchange are valued at the last reported sales price or at the official closing price as provided by the exchange. Equity securities traded on foreign securities exchanges are typically valued at the closing price on the exchange where primarily traded or as of the close of the NYSE, if that is earlier. If no last sales price is reported, or if local convention or regulation so provides, the mean of the latest bid and asked prices is used. Depending on local convention or regulation, securities traded over-the-counter are valued at the mean of the latest bid and asked prices, the last sales price, or the official closing price. In its determination of fair value, the fund may review several factors including: market information specific to a security; news developments in U.S. and foreign markets; the performance of particular U.S. and foreign securities, indices, comparable securities, American Depositary Receipts, Exchange-Traded Funds, and other relevant market indicators.
Debt securities maturing within 60 days at the time of purchase may be valued at cost, plus or minus any amortized discount or premium or at the evaluated mean as provided by an independent pricing service. Evaluated mean prices are commonly derived through utilization of market models, which may consider, among other factors, trade data, quotations from dealers and active market makers, relevant yield curve and spread data, related sector levels, creditworthiness, and other relevant market information on the same or comparable securities.
Investments in open-end management investment companies are valued at the reported net asset value per share. Repurchase agreements are valued at cost.
The value of investments initially expressed in foreign currencies is translated into U.S. dollars at prevailing exchange rates.
If the fund determines that the market price for a portfolio security is not readily available or the valuation methods mentioned above do not reflect a security’s fair value, such security is valued as determined in good faith by the Board of Directors or its designee, in accordance with procedures adopted by the Board of Directors. Circumstances that may cause the fund to use these procedures to value a security include, but are not limited to: a security has been declared in default; trading in a security has been halted during the trading day; there is a foreign market holiday and no trading occurred; or an event occurred between the close of a foreign exchange and the NYSE that may affect the value of a security.
Security Transactions — Security transactions are accounted for as of the trade date. Net realized gains and losses are determined on the identified cost basis, which is also used for federal income tax purposes.
Investment Income — Dividend income less foreign taxes withheld, if any, is recorded as of the ex-dividend date. Distributions received on securities that represent a return of capital or long-term capital gain are recorded as a reduction of cost of investments and/or as a realized gain. The fund may estimate the components of distributions received that may be considered nontaxable distributions or long-term capital gain distributions for income tax purposes. Interest income is recorded on the accrual basis and includes accretion of discounts and amortization of premiums.
Securities Sold Short — The fund enters into short sales, which is selling securities it does not own, as part of its normal investment activities. Upon selling a security short, the fund will segregate cash, cash equivalents or other appropriate liquid securities in at least an amount equal to the current market value of the securities sold short until the fund replaces the borrowed security. Interest earned on segregated cash for securities sold short is reflected as interest income. The fund is required to pay any dividends or interest due on securities sold short. Such dividends and interest are recorded as an expense. The fund may pay fees or charges on the assets borrowed for securities sold short. Liabilities for securities sold short are valued daily and changes in value are recorded as change in net unrealized appreciation (depreciation) on securities sold short. The fund records realized gain (loss) on a security sold short when it is terminated by the fund and includes as a component of net realized gain (loss) on securities sold short transactions.
Foreign Currency Translations — All assets and liabilities initially expressed in foreign currencies are translated into U.S. dollars at prevailing exchange rates at period end. The fund may enter into spot foreign currency exchange contracts to facilitate transactions denominated in a foreign currency. Purchases and sales of investment securities, dividend and interest income, spot foreign currency exchange contracts, and expenses are translated at the rates of exchange prevailing on the respective dates of such transactions. Net realized and unrealized foreign currency exchange gains or losses related to investment securities are a component of net realized gain (loss) on investment transactions and change in net unrealized appreciation (depreciation) on investments, respectively. Net realized and unrealized foreign currency exchange gains or losses related to securities sold short are a component of net realized gain (loss) on securities sold short transactions and change in net unrealized appreciation (depreciation) on securities sold short, respectively.
Repurchase Agreements — The fund may enter into repurchase agreements with institutions that American Century Investment Management, Inc. (ACIM) (the investment advisor) has determined are creditworthy pursuant to criteria adopted by the Board of Directors. The fund requires that the collateral, represented by securities, received in a repurchase transaction be transferred to the custodian in a manner sufficient to enable the fund to obtain those securities in the event of a default under the repurchase agreement. ACIM monitors, on a daily basis, the securities transferred to ensure the value, including accrued interest, of the securities under each repurchase agreement is equal to or greater than amounts owed to the fund under each repurchase agreement.
Joint Trading Account — Pursuant to an Exemptive Order issued by the Securities and Exchange Commission, the fund, along with certain other funds in the American Century Investments family of funds, may transfer uninvested cash balances into a joint trading account. These balances are invested in one or more repurchase agreements that are collateralized by U.S. Treasury or Agency obligations.
Segregated Assets — In accordance with the 1940 Act, the fund segregates assets on its books and records to cover certain types of investments, including, but not limited to, futures contracts and short sales. ACIM monitors, on a daily basis, the securities segregated to ensure the fund designates a sufficient amount of liquid assets, marked-to-market daily. The fund may also receive assets or be required to pledge assets at the custodian bank or with a broker for margin requirements on futures contracts and short sales.
Income Tax Status — It is the fund’s policy to distribute substantially all net investment income and net realized gains to shareholders and to otherwise qualify as a regulated investment company under provisions of the Internal Revenue Code. Accordingly, no provision has been made for income taxes. The fund files U.S. federal, state, local and non-U.S. tax returns as applicable. The fund’s tax returns are subject to examination by the relevant taxing authority until expiration of the applicable statute of limitations, which is generally three years from the date of filing but can be longer in certain jurisdictions. At this time, management believes there are no uncertain tax positions which, based on their technical merit, would not be sustained upon examination and for which it is reasonably possible that the total amounts of unrecognized tax benefits will significantly change in the next twelve months.
Multiple Class — All shares of the fund represent an equal pro rata interest in the net assets of the class to which such shares belong, and have identical voting, dividend, liquidation and other rights and the same terms and conditions, except for class specific expenses and exclusive rights to vote on matters affecting only individual classes. Income, non-class specific expenses, and realized and unrealized capital gains and losses of the fund are allocated to each class of shares based on their relative net assets.
Distributions to Shareholders — Distributions from net investment income, if any, are generally declared and paid semiannually. Distributions from net realized gains, if any, are generally declared and paid annually.
Indemnifications — Under the corporation’s organizational documents, its officers and directors are indemnified against certain liabilities arising out of the performance of their duties to the fund. In addition, in the normal course of business, the fund enters into contracts that provide general indemnifications. The maximum exposure under these arrangements is unknown as this would involve future claims that may be made against a fund. The risk of material loss from such claims is considered by management to be remote.
3. Fees and Transactions with Related Parties
Management Fees — The corporation has entered into a management agreement with ACIM, under which ACIM provides the fund with investment advisory and management services in exchange for a single, unified management fee (the fee) per class. The agreement provides that all expenses of managing and operating the fund, except distribution and service fees, expenses on securities sold short, brokerage expenses, taxes, interest, fees and expenses of the independent directors (including legal counsel fees), and extraordinary expenses, will be paid by ACIM. The fee is computed and accrued daily based on each class’s daily net assets and paid monthly in arrears. The fee consists of (1) an Investment Category Fee based on the daily net assets of the fund and certain other accounts managed by the investment advisor that are in the same broad investment category as the fund and (2) a Complex Fee based on the assets of all the funds in the American Century Investments family of funds. The rates for the Investment Category Fee range from 1.0480% to 1.2300%. The rates for the Complex Fee range from 0.2500% to 0.3100% for the Investor Class, A Class, C Class and R Class. The Institutional Class is 0.2000% less at each point within the Complex Fee range. The effective annual management fee for each class for the year ended June 30, 2013 was 1.38% for the Investor Class, A Class, C Class and R Class and 1.18% for the Institutional Class.
Distribution and Service Fees — The Board of Directors has adopted a separate Master Distribution and Individual Shareholder Services Plan for each of the A Class, C Class and R Class (collectively the plans), pursuant to Rule 12b-1 of the 1940 Act. The plans provide that the A Class will pay American Century Investment Services, Inc. (ACIS) an annual distribution and service fee of 0.25%. The plans provide that the C Class will pay ACIS an annual distribution and service fee of 1.00%, of which 0.25% is paid for individual shareholder services and 0.75% is paid for distribution services. The plans provide that the R Class will pay ACIS an annual distribution and service fee of 0.50%. The fees are computed and accrued daily based on each class’s daily net assets and paid monthly in arrears. The fees are used to pay financial intermediaries for distribution and individual shareholder services. Fees incurred under the plans during the year ended June 30, 2013 are detailed in the Statement of Operations.
Related Parties — Certain officers and directors of the corporation are also officers and/or directors of American Century Companies, Inc. (ACC). The corporation’s investment advisor, ACIM, the corporation’s distributor, ACIS, and the corporation’s transfer agent, American Century Services, LLC are wholly owned, directly or indirectly, by ACC.
4. Investment Transactions
Purchases and sales of investment securities and securities sold short, excluding short-term investments, for the year ended June 30, 2013 were $112,099,918 and $113,749,534, respectively.
5. Capital Share Transactions
Transactions in shares of the fund were as follows:
| | | | | | | |
| | | Year ended June 30, 2013 | | | Year ended June 30, 2012 | |
| | | Shares | | | Amount | | | Shares | | | Amount | |
Investor Class/Shares Authorized | | 50,000,000 | | | | | | 50,000,000 | | | | |
Sold | | 717,061 | | | $7,634,531 | | | 1,620,653 | | | $17,110,664 | |
Redeemed | | (1,239,380 | ) | | (13,161,107 | ) | | (1,544,690 | ) | | (16,273,093 | ) |
| | | (522,319 | ) | | (5,526,576 | ) | | 75,963 | | | 837,571 | |
Institutional Class/Shares Authorized | | 50,000,000 | | | | | | 50,000,000 | | | | |
Sold | | 137,867 | | | 1,490,538 | | | 199,402 | | | 2,120,737 | |
Redeemed | | (253,874 | ) | | (2,732,320 | ) | | (72,932 | ) | | (776,372 | ) |
| | | (116,007 | ) | | (1,241,782 | ) | | 126,470 | | | 1,344,365 | |
A Class/Shares Authorized | | 70,000,000 | | | | | | 70,000,000 | | | | |
Sold | | 433,325 | | | 4,544,382 | | | 1,814,978 | | | 18,985,401 | |
Redeemed | | (1,892,656 | ) | | (19,750,815 | ) | | (1,497,517 | ) | | (15,582,495 | ) |
| | | (1,459,331 | ) | | (15,206,433 | ) | | 317,461 | | | 3,402,906 | |
B Class/Shares Authorized | | N/A | | | | | | N/A | | | | |
Redeemed | | | | | | | | (162,298 | ) | | (1,615,385 | ) |
C Class/Shares Authorized | | 10,000,000 | | | | | | 10,000,000 | | | | |
Sold | | 33,360 | | | 333,152 | | | 79,102 | | | 793,444 | |
Redeemed | | (183,085 | ) | | (1,829,832 | ) | | (186,631 | ) | | (1,871,781 | ) |
| | | (149,725 | ) | | (1,496,680 | ) | | (107,529 | ) | | (1,078,337 | ) |
R Class/Shares Authorized | | 10,000,000 | | | | | | 10,000,000 | | | | |
Sold | | 91,159 | | | 943,682 | | | 58,373 | | | 600,649 | |
Redeemed | | (38,809 | ) | | (401,848 | ) | | (39,576 | ) | | (409,536 | ) |
| | | 52,350 | | | 541,834 | | | 18,797 | | | 191,113 | |
Net increase (decrease) | | (2,195,032 | ) | | $(22,929,637 | ) | | 268,864 | | | $3,082,233 | |
6. Fair Value Measurements
The fund’s securities valuation process is based on several considerations and may use multiple inputs to determine the fair value of the positions held by the fund. In conformity with accounting principles generally accepted in the United States of America, the inputs used to determine a valuation are classified into three broad levels as follows:
• | Level 1 valuation inputs consist of unadjusted quoted prices in an active market for identical securities; |
• | Level 2 valuation inputs consist of direct or indirect observable market data (including quoted prices for similar securities, evaluations of subsequent market events, interest rates, prepayment speeds, credit risk, etc.); or |
• | Level 3 valuation inputs consist of unobservable data (including a fund’s own assumptions). |
The level classification is based on the lowest level input that is significant to the fair valuation measurement. The valuation inputs are not necessarily an indication of the risks associated with investing in these securities or other financial instruments.
The following is a summary of the level classifications as of period end. The Schedule of Investments provides additional information on the fund’s portfolio holdings.
| | | | |
| | Level 1 | Level 2 | Level 3 |
Investment Securities | | | |
Common Stocks | $43,678,173 | — | — |
Temporary Cash Investments | 416,748 | $749,103 | — |
Total Value of Investment Securities | $44,094,921 | $749,103 | — |
| | | | |
Securities Sold Short | | | |
Total Value of Common Stocks Sold Short | $(43,704,050) | — | — |
7. Risk Factors
The fund’s investment process may result in high portfolio turnover, which could mean high transaction costs, affecting both performance and capital gains tax liabilities to investors.
The fund is subject to short sales risk. If the market price of a security increases after the fund borrows the security, the fund may suffer a loss when it replaces the borrowed security at the higher price. Any loss will be increased by the amount of compensation, interest or dividends, and transaction costs the fund must pay to the lender of the borrowed security.
If the fund is overweighted in a stock or sector, any negative development related to that stock or sector will have a greater impact on the fund than other funds that are not overweighted in that stock or sector.
8. Federal Tax Information
The book-basis character of distributions made during the year from net investment income or net realized gains may differ from their ultimate characterization for federal income tax purposes. These differences reflect the differing character of certain income items and net realized gains and losses for financial statement and tax purposes, and may result in reclassification among certain capital accounts on the financial statements. There were no distributions paid by the fund during the years ended June 30, 2013 and June 30, 2012.
The reclassifications, which are primarily due to net operating losses, were made to capital $(860,230), accumulated net investment loss $1,168,965 and accumulated net realized loss $(308,735).
As of June 30, 2013, the federal tax cost of investments and the components of distributable earnings on a tax-basis were as follows:
| | |
Federal tax cost of investments | $37,949,398 |
Gross tax appreciation of investments | $7,713,483 |
Gross tax depreciation of investments | (818,857) |
Net tax appreciation (depreciation) of investments | $6,894,626 |
Net tax appreciation (depreciation) on securities sold short | $(2,024,078) |
Net tax appreciation (depreciation) | $ 4,870,548 |
Undistributed ordinary income | — |
Accumulated short-term capital losses | $(8,042,891) |
Late-year ordinary loss deferral | $(319,360) |
Post-October capital loss deferral | $(2,872,094) |
The difference between book-basis and tax-basis unrealized appreciation (depreciation) is attributable primarily to the tax deferral of losses on wash sales.
Accumulated capital losses represent net capital loss carryovers that may be used to offset future realized capital gains for federal income tax purposes. Future capital loss carryover utilization in any given year may be subject to Internal Revenue Code limitations. Capital loss carryovers expire in 2018.
Loss deferrals represent certain qualified losses that the fund has elected to treat as having been incurred in the following fiscal year for federal income tax purposes.
| |
For a Share Outstanding Throughout the Years Ended June 30 (except as noted) |
Per-Share Data | Ratios and Supplemental Data |
| | | Income From Investment Operations: | | | Ratio to Average Net Assets of: | | |
| | Net Asset
Value,
Beginning
of Period | Net
Investment Income
(Loss)(1) | Net
Realized and Unrealized
Gain (Loss) | Total From investment Operations | Net Asset
Value,
End of Period | Total
Return(2) | Operating Expenses | Operating Expenses (excluding expenses
on securities
sold short) | Net
Investment Income
(Loss) | Portfolio
Turnover
Rate | Net Assets,
End of Period
(in thousands) |
Investor Class |
2013 | $10.54 | (0.11) | 0.35 | 0.24 | $10.78 | 2.28% | 3.07% | 1.39% | (1.00)% | 222% | $17,916 |
2012 | $10.37 | (0.22) | 0.39 | 0.17 | $10.54 | 1.64% | 3.38% | 1.40% | (2.07)% | 252% | $23,019 |
2011 | $10.00 | (0.22) | 0.59 | 0.37 | $10.37 | 3.70% | 3.50% | 1.42% | (2.34)% | 261% | $21,866 |
2010 | $10.01 | (0.17) | 0.16 | (0.01) | $10.00 | (0.10)% | 3.09% | 1.42% | (1.68)% | 140% | $16,570 |
2009 | $10.92 | (0.16) | (0.75) | (0.91) | $10.01 | (8.33)% | 3.34% | 1.41% | (1.56)% | 330% | $22,956 |
Institutional Class |
2013 | $10.65 | (0.08) | 0.35 | 0.27 | $10.92 | 2.54% | 2.87% | 1.19% | (0.80)% | 222% | $4,491 |
2012 | $10.46 | (0.20) | 0.39 | 0.19 | $10.65 | 1.82% | 3.18% | 1.20% | (1.87)% | 252% | $5,618 |
2011 | $10.07 | (0.26) | 0.65 | 0.39 | $10.46 | 3.87% | 3.30% | 1.22% | (2.14)% | 261% | $4,194 |
2010 | $10.06 | (0.16) | 0.17 | 0.01 | $10.07 | 0.10% | 2.89% | 1.22% | (1.48)% | 140% | $11,882 |
2009 | $10.95 | (0.15) | (0.74) | (0.89) | $10.06 | (8.13)% | 3.14% | 1.21% | (1.36)% | 330% | $22,354 |
A Class |
2013 | $10.41 | (0.13) | 0.34 | 0.21 | $10.62 | 2.02% | 3.32% | 1.64% | (1.25)% | 222% | $17,545 |
2012 | $10.27 | (0.24) | 0.38 | 0.14 | $10.41 | 1.36% | 3.63% | 1.65% | (2.32)% | 252% | $32,386 |
2011 | $9.93 | (0.26) | 0.60 | 0.34 | $10.27 | 3.42% | 3.75% | 1.67% | (2.59)% | 261% | $28,691 |
2010 | $9.96 | (0.19) | 0.16 | (0.03) | $9.93 | (0.30)% | 3.34% | 1.67% | (1.93)% | 140% | $72,781 |
2009 | $10.89 | (0.18) | (0.75) | (0.93) | $9.96 | (8.54)% | 3.59% | 1.66% | (1.81)% | 330% | $104,634 |
| |
For a Share Outstanding Throughout the Years Ended June 30 (except as noted) |
Per-Share Data | Ratios and Supplemental Data |
| | | Income From Investment Operations: | | | Ratio to Average Net Assets of: | | |
| | Net Asset
Value,
Beginning
of Period | Net
Investment Income
(Loss)(1) | Net
Realized and Unrealized
Gain (Loss) | Total From investment Operations | Net Asset
Value,
End of Period | Total
Return(2) | Operating Expenses | Operating Expenses (excluding expenses
on securities
sold short) | Net
Investment Income
(Loss) | Portfolio
Turnover
Rate | Net Assets,
End of Period
(in thousands) |
C Class |
2013 | $9.97 | (0.20) | 0.33 | 0.13 | $10.10 | 1.30% | 4.07% | 2.39% | (2.00)% | 222% | $4,377 |
2012 | $9.91 | (0.31) | 0.37 | 0.06 | $9.97 | 0.61% | 4.38% | 2.40% | (3.07)% | 252% | $5,815 |
2011 | $9.65 | (0.32) | 0.58 | 0.26 | $9.91 | 2.69% | 4.50% | 2.42% | (3.34)% | 261% | $6,845 |
2010 | $9.76 | (0.26) | 0.15 | (0.11) | $9.65 | (1.13)% | 4.09% | 2.42% | (2.68)% | 140% | $10,543 |
2009 | $10.75 | (0.26) | (0.73) | (0.99) | $9.76 | (9.21)% | 4.34% | 2.41% | (2.56)% | 330% | $17,821 |
R Class |
2013 | $10.26 | (0.16) | 0.35 | 0.19 | $10.45 | 1.85% | 3.57% | 1.89% | (1.50)% | 222% | $1,604 |
2012 | $10.15 | (0.26) | 0.37 | 0.11 | $10.26 | 1.08% | 3.88% | 1.90% | (2.57)% | 252% | $1,039 |
2011 | $9.84 | (0.26) | 0.57 | 0.31 | $10.15 | 3.15% | 4.00% | 1.92% | (2.84)% | 261% | $837 |
2010 | $9.89 | (0.21) | 0.16 | (0.05) | $9.84 | (0.51)% | 3.59% | 1.92% | (2.18)% | 140% | $586 |
2009 | $10.85 | (0.22) | (0.74) | (0.96) | $9.89 | (8.85)% | 3.84% | 1.91% | (2.06)% | 330% | $1,004 |
Notes to Financial Highlights
(1) | Computed using average shares outstanding throughout the period. |
(2) | Total returns are calculated based on the net asset value of the last business day and do not reflect applicable sales charges, if any. Total returns for periods less than one year are not annualized. |
See Notes to Financial Statements.
Report of Independent Registered Public Accounting Firm |
To the Directors of the American Century Quantitative Equity Funds, Inc.
and Shareholders of the Equity Market Neutral Fund:
In our opinion, the accompanying statement of assets and liabilities, including the schedule of investments, and the related statements of operations and of changes in net assets and the financial highlights present fairly, in all material respects, the financial position of the Equity Market Neutral Fund (one of the fourteen funds comprising the American Century Quantitative Equity Funds, Inc., hereafter referred to as the “Fund”) at June 30, 2013, the results of its operations for the year then ended, the changes in its net assets for each of the two years in the period then ended and the financial highlights for each of the five years in the period then ended, in conformity with accounting principles generally accepted in the United States of America. These financial statements and financial highlights (hereafter referred to as “financial statements”) are the responsibility of the Fund’s management; our responsibility is to express an opinion on these financial statements based on our audits. We conducted our audits of these financial statements in accordance with the standards of the Public Company Accounting Oversight Board (United States). Those standards require that we plan and perform the audit to obtain reasonable assurance about whether the financial statements are free of material misstatement. An audit includes examining, on a test basis, evidence supporting the amounts and disclosures in the financial statements, assessing the accounting principles used and significant estimates made by management, and evaluating the overall financial statement presentation. We believe that our audits, which included confirmation of securities at June 30, 2013 by correspondence with the custodian and brokers, provide a reasonable basis for our opinion.
PricewaterhouseCoopers LLP
Kansas City, Missouri
August 21, 2013
Board of Directors
The individuals listed below serve as directors of the funds. Each director will continue to serve in this capacity until death, retirement, resignation or removal from office. The board has adopted a mandatory retirement age for directors who are not “interested persons,” as that term is defined in the Investment Company Act (independent directors). Independent directors shall retire on December 31 of the year in which they reach their 75th birthday; provided, however, that on or after January 1, 2022, independent directors shall retire on December 31 of the year in which they reach their 76th birthday.
Mr. Thomas is the only director who is an “interested person” because he currently serves as President and Chief Executive Officer of American Century Companies, Inc. (ACC), the parent company of American Century Investment Management, Inc. (ACIM or the advisor).
The other directors (more than three-fourths of the total number) are independent; that is, they have never been employees, directors or officers of, and have no financial interest in, ACC or any of its wholly owned, direct or indirect, subsidiaries, including ACIM, American Century Investment Services, Inc. (ACIS) and American Century Services, LLC (ACS). The directors serve in this capacity for eight (in the case of Mr. Thomas, 15) registered investment companies in the American Century Investments family of funds.
The following table presents additional information about the directors. The mailing address for each director other than Mr. Thomas is 1665 Charleston Road, Mountain View, California 94043. The mailing address for Mr. Thomas is 4500 Main Street, Kansas City, Missouri 64111.
| | | | | | | |
Name
(Year of Birth) | Position(s) Held with Funds | Length
of Time Served | Principal Occupation(s) During Past 5 Years | | Number of American Century Portfolios Overseen
by Director | Other Directorships Held During Past 5 Years |
Independent Directors |
Tanya S. Beder (1955) | Director | Since 2011 | Chairman, SBCC Group Inc. (independent advisory services) (2006 to present) | | 41 | CYS Investments, Inc. (specialty finance company) |
Jeremy I. Bulow (1954) | Director | Since 2011 | Professor of Economics, Stanford University, Graduate School of Business (1979 to present) | | 41 | None |
Ronald J. Gilson (1946) | Director and Chairman of the Board | Since 1995 | Charles J. Meyers Professor of Law and Business, Stanford Law School (1979 to present); Marc and Eva Stern Professor of Law and Business, Columbia University School of Law (1992 to present) | | 41 | None |
Frederick L. A. Grauer
(1946) | Director | Since 2008 | Senior Advisor, BlackRock, Inc. (investment management firm) (2010 to 2011); Senior Advisor, Barclays Global Investors (investment management firm) (2003 to 2009) | | 41 | None |
| | | | | | | |
Name
(Year of Birth) | Position(s) Held with Funds | Length
of Time Served | Principal Occupation(s) During Past 5 Years | | Number of American Century Portfolios Overseen
by Director | Other Directorships Held During Past 5 Years |
Independent Directors |
Peter F. Pervere (1947) | Director | Since 2007 | Retired | | 41 | Intraware, Inc. (2003 to 2009) |
Myron S. Scholes (1941) | Director | Since 1980 | Chairman, Platinum Grove Asset Management, L.P. (asset manager) (1999 to 2009); Frank E. Buck Professor of Finance-Emeritus, Stanford Graduate School of Business (1996 to present) | | 41 | Dimensional Fund Advisors (investment advisor); CME Group, Inc. (futures and options exchange) |
John B. Shoven (1947) | Director | Since 2002 | Professor of Economics, Stanford University (1973 to present) | | 41 | Cadence Design Systems; Exponent; Financial Engines |
| |
Interested Director |
Jonathan S. Thomas
(1963) | Director and President | Since 2007 | President and Chief Executive Officer, ACC (March 2007 to present). Also serves as Chief Executive Officer and Manager, ACS; Executive Vice President, ACIM; Director, ACC, ACIM and other ACC subsidiaries | | 106 | None |
Officers
The following table presents certain information about the executive officers of the funds. Each officer serves as an officer for each of the 15 investment companies in the American Century family of funds, unless otherwise noted.
No officer is compensated for his or her service as an officer of the funds. The listed officers are interested persons of the funds and are appointed or re-appointed on an annual basis. The mailing address for each of the officers listed below is 4500 Main Street, Kansas City, Missouri 64111.
| | | | |
Name
(Year of Birth) | Offices with the Funds | | Principal Occupation(s) During the Past Five Years |
Jonathan S. Thomas
(1963) | Director and President since 2007 | | President and Chief Executive Officer, ACC (March 2007 to present). Also serves as Chief Executive Officer and Manager, ACS; Executive Vice President, ACIM; Director, ACC, ACIM and other ACC subsidiaries |
Maryanne L. Roepke
(1956) | Chief Compliance Officer since 2006 and Senior Vice President since 2000 | | Chief Compliance Officer, American Century funds, ACIM and ACS (August 2006 to present). Also serves as Senior Vice President, ACS |
Charles A. Etherington (1957) | General Counsel since 2007 and Senior Vice President since 2006 | | Attorney, ACC (February 1994 to present); Vice President, ACC (November 2005 to present); General Counsel, ACC (March 2007 to present). Also serves as General Counsel, ACIM, ACS, ACIS and other ACC subsidiaries; and Senior Vice President, ACIM and ACS |
C. Jean Wade (1964) | Vice President, Treasurer and Chief Financial Officer since 2012 | | Vice President, ACS (February 2000 to present) |
Robert J. Leach (1966) | Vice President since 2006 and Assistant Treasurer since 2012 | | Vice President, ACS (February 2000 to present) |
David H. Reinmiller (1963) | Vice President since 2001 | | Attorney, ACC (January 1994 to present); Associate General Counsel, ACC (January 2001 to present). Also serves as Vice President, ACIM and ACS |
Ward D. Stauffer (1960) | Secretary since 2005 | | Attorney, ACC (June 2003 to present) |
The Statement of Additional Information has additional information about the fund’s directors and is available without charge, upon request, by calling 1-800-345-2021.
Approval of Management Agreement |
At a meeting held on June 11, 2013, the Fund’s Board of Directors/Trustees unanimously approved the renewal of the management agreement pursuant to which American Century Investment Management, Inc. (the “Advisor”) acts as the investment advisor for the Fund. Under Section 15(c) of the Investment Company Act, contracts for investment advisory services are required to be reviewed, evaluated, and approved by a majority of a fund’s directors/trustees (the “Directors”), including a majority of the independent Directors each year. The Board regards this annual evaluation and renewal as one of its most important responsibilities.
In connection with their annual review and evaluation, the independent Directors memorialized a statement regarding the relationship between their ongoing obligations to oversee and evaluate the performance of the Advisor and their consideration of renewal of the management agreement. In that statement, the independent Directors noted that their assessment of the Advisor’s performance is an ongoing process that takes place over the entire year and is informed by all of the information that the Board and its committees receive and consider over time. This information, together with the materials provided in connection with the review, are central to the Board’s assessment of the Advisor’s performance and its determination whether to renew the Fund’s management agreement.
Prior to its consideration of the renewal of the management agreement, the Board requested and reviewed extensive data and analysis relating to the proposed renewal. This information and analysis was compiled by the Advisor and certain independent providers of evaluation data concerning the Fund and the services provided to the Fund by the Advisor.
In connection with its consideration of the renewal of the management agreement, the Board’s review and evaluation of the services provided by the Advisor included, but was not limited to, the following:
• | the nature, extent, and quality of investment management, shareholder services, and other services provided by the Advisor to the Fund; |
• | the wide range of other programs and services the Advisor provides to the Fund and its shareholders on a routine and non-routine basis; |
• | the investment performance of the Fund, including data comparing the Fund’s performance to appropriate benchmarks and/or a peer group of other mutual funds with similar investment objectives and strategies; |
• | data comparing the cost of owning the Fund to the cost of owning similar funds; |
• | the Advisor’s compliance policies, procedures, and regulatory experience; |
• | financial data showing the cost of services provided to the Fund, the profitability of the Fund to the Advisor, and the overall profitability of the Advisor; |
• | possible economies of scale associated with the Advisor’s management of the Fund and other accounts under its management; |
• | data comparing services provided and charges to other investment management clients of the Advisor; and |
• | consideration of collateral benefits derived by the Advisor from the management of the Fund. |
In keeping with its practice, the Board held two in-person meetings to review and discuss the information provided. The Board also had the benefit of the advice of its independent counsel throughout the period.
Factors Considered
The Directors considered all of the information provided by the Advisor, the independent data providers, and the Board’s independent counsel in connection with the review, and evaluated such information for the Fund. In connection with their review, the Directors did not identify any single factor as being all-important or controlling and each Director may have attributed different levels of importance to different factors. In deciding to renew the management agreement, the Board based its decision on a number of factors, including the following:
Nature, Extent and Quality of Services — Generally. Under the management agreement, the Advisor is responsible for providing or arranging for all services necessary for the operation of the Fund. The Board noted that under the management agreement, the Advisor provides or arranges at its own expense a wide variety of services including:
• | constructing and designing the Fund |
• | portfolio research and security selection |
• | initial capitalization/funding |
• | daily valuation of the Fund’s portfolio |
• | shareholder servicing and transfer agency, including shareholder confirmations, recordkeeping, and communications |
• | regulatory and portfolio compliance |
• | marketing and distribution |
The Board noted that many of these services have expanded over time both in terms of quantity and complexity in response to shareholder demands, competition in the industry, changing distribution channels, and the changing regulatory environment.
Investment Management Services. The nature of the investment management services provided to the Fund is quite complex and allows Fund shareholders access to professional money management, instant diversification of their investments within an asset class, the opportunity to easily diversify among asset classes by investing in or exchanging among various American Century Investments funds, and liquidity. In evaluating investment performance, the Board expects the Advisor to manage the Fund in accordance with its investment objectives and approved strategies. Further, the Directors recognize that the Advisor has an obligation to seek the best execution of fund trades. In providing these services, the Advisor utilizes teams of investment professionals (portfolio managers, analysts, research assistants, and securities traders) who require extensive information technology, research, training, compliance and other systems to conduct their business. The Board, directly and through its Portfolio Committee, regularly reviews investment performance information for the Fund, together with comparative information for appropriate benchmarks and/or peer groups of similarly-managed funds, over different time horizons. The Directors also review detailed performance information during the management agreement approval process. If performance concerns are identified, the Fund receives special reviews until performance improves, during which the Board discusses with the Advisor the reasons for such results (e.g., market conditions, security selection) and any efforts being undertaken to improve performance. The Board found the investment management services provided by the Advisor to the Fund to meet or exceed industry standards. More detailed information about the Fund’s performance can be found in the Performance and Portfolio Commentary sections of this report.
Shareholder and Other Services. Under the management agreement, the Advisor provides the Fund with a comprehensive package of transfer agency, shareholder, and other services. The Board, directly and through various committees of the Board, regularly reviews reports and evaluations of such services at its regular meetings. These reports include, but are not limited to, information regarding the operational efficiency and accuracy of the shareholder and transfer agency services provided, staffing levels, shareholder satisfaction (as measured by external as well as internal sources), technology support, new products and services offered to Fund shareholders, securities trading activities, portfolio valuation services, auditing services, and legal and operational compliance activities. Certain aspects of shareholder and transfer agency service level efficiency and the quality of securities trading activities are measured by independent third party providers and are presented in comparison to other fund groups not managed by the Advisor. The Board found the services provided by the Advisor to the Fund under the management agreement to be competitive and of high quality.
Costs of Services and Profitability. The Advisor provides detailed information concerning its cost of providing various services to the Fund, its profitability in managing the Fund, its overall profitability, and its financial condition. The Directors have reviewed with the Advisor the methodology used to prepare this financial information. The financial information regarding the Advisor is considered in evaluating the Advisor’s financial condition, its ability to continue to provide services under the management agreement, and the reasonableness of the current management fee. The Board concluded that the Advisor’s profits were reasonable in light of the services provided to the Fund.
Ethics. The Board generally considers the Advisor’s commitment to providing quality services to shareholders and to conducting its business ethically. They noted that the Advisor’s practices generally meet or exceed industry best practices.
Economies of Scale. The Board also reviewed information provided by the Advisor regarding the possible existence of economies of scale in connection with the management of the Fund. The Board concluded that economies of scale are difficult to measure and predict with precision, especially on a fund-by-fund basis. The Board concluded that the Advisor is appropriately sharing economies of scale through its competitive fee structure, offering competitive fees from fund inception, and through reinvestment in its business to provide shareholders additional content and services.
Comparison to Other Funds’ Fees. The management agreement provides that the Fund pay the Advisor a single, all-inclusive (or unified) management fee for providing all services necessary for the management and operation of the Fund, other than brokerage expenses, taxes, interest, extraordinary expenses, and the fees and expenses of the Fund’s independent directors (including their independent legal counsel) and expenses incurred in connection with the provision of shareholder services and distribution services under a plan adopted pursuant to Rule 12b-1 under the 1940 Act. Under the unified fee structure, the Advisor is responsible for providing all investment advisory, custody, audit, administrative, compliance, recordkeeping, marketing and shareholder services, or arranging and supervising third parties to provide such services. By contrast, most other funds are charged a variety of fees, including an investment advisory fee, a transfer agency fee, an administrative fee, distribution charges and other expenses. Other than their investment advisory fees and any applicable Rule 12b-1 distribution fees, all other components of the total fees charged by these other funds may be increased without shareholder approval. The Board believes the unified fee structure is a benefit to Fund shareholders because it clearly discloses to shareholders the cost of owning Fund shares, and, since the unified fee cannot be increased without a vote of Fund shareholders, it shifts to the Advisor the risk of increased costs of operating the Fund and provides a direct incentive to minimize administrative inefficiencies. Part of the Board’s analysis of fee levels involves reviewing certain evaluative data compiled by an independent provider and comparing the Fund’s unified fee to the total expense ratio of other funds in the Fund’s peer group. The Board concluded that the management fee paid by the Fund to the Advisor under the management agreement is reasonable in light of the services provided to the Fund.
Comparison to Fees and Services Provided to Other Clients of the Advisor. The Board also requested and received information from the Advisor concerning the nature of the services, fees, costs and profitability of its advisory services to advisory clients other than the Fund. They observed that these varying types of client accounts require different services and involve different regulatory and entrepreneurial risks than the management of the Fund. The Board analyzed this information and concluded that the fees charged and services provided to the Fund were reasonable by comparison.
Collateral or “Fall-Out” Benefits Derived by the Advisor. The Board considered the existence of collateral benefits the Advisor may receive as a result of its relationship with the Fund. They concluded that the Advisor’s primary business is managing mutual funds and it generally does not use fund or shareholder information to generate profits in other lines of business, and therefore does not derive any significant collateral benefits from them. The Board noted that the Advisor receives proprietary research from broker-dealers that execute fund portfolio transactions and concluded that this research is likely to benefit Fund shareholders. The Board also determined that the Advisor is able to provide investment management services to certain clients other than the Fund, at least in part, due to its existing infrastructure built to serve the fund complex. The Board concluded, however, that the assets of those other clients are not material to the analysis and, where applicable, may be included with the assets of the Fund to determine breakpoints in the management fee schedule.
Existing Relationship. The Board also considered whether there was any reason for not continuing the existing arrangement with the Advisor. In this regard, the Board was mindful of the potential disruptions of the Fund’s operations and various risks, uncertainties, and other effects that could occur as a result of a decision not to continue such relationship. In particular, the Board recognized that most shareholders have invested in the Fund on the strength of the Advisor’s industry standing and reputation and in the expectation that the Advisor will have a continuing role in providing advisory services to the Fund.
Conclusion of the Directors. As a result of this process, the Board, including all of the independent directors and assisted by the advice of independent legal counsel, taking into account all of the factors discussed above and the information provided by the Advisor and others, concluded that the management agreement between the Fund and the Advisor is fair and reasonable in light of the services provided and should be renewed.
Retirement Account Information
As required by law, distributions you receive from certain IRAs are subject to federal income tax withholding, unless you elect not to have withholding apply. Tax will be withheld on the total amount withdrawn even though you may be receiving amounts that are not subject to withholding, such as nondeductible contributions. In such case, excess amounts of withholding could occur. You may adjust your withholding election so that a greater or lesser amount will be withheld.
If you don’t want us to withhold on this amount, you must notify us to not withhold the federal income tax. You may notify us in writing or in certain situations by telephone or through other electronic means. For systematic withdrawals, your withholding election will remain in effect until revoked or changed by filing a new election. You have the right to revoke your election at any time.
Remember, even if you elect not to have income tax withheld, you are liable for paying income tax on the taxable portion of your withdrawal. If you elect not to have income tax withheld or you don’t have enough income tax withheld, you may be responsible for payment of estimated tax. You may incur penalties under the estimated tax rules if your withholding and estimated tax payments are not sufficient. You can reduce or defer the income tax on a distribution by directly or indirectly rolling such distribution over to another IRA or eligible plan. You should consult your tax advisor for additional information.
State tax will be withheld if, at the time of your distribution, your address is within one of the mandatory withholding states and you have federal income tax withheld (or as otherwise required by state law). State taxes will be withheld from your distribution in accordance with the respective state rules.
Distributions you receive from 403(b), 457 and qualified plans are subject to special tax and withholding rules. Your plan administrator or plan sponsor is required to provide you with a special tax notice explaining those rules at the time you request a distribution. If applicable, federal and/or state taxes may be withheld from your distribution amount.
Proxy Voting Guidelines
American Century Investment Management, Inc., the fund’s investment advisor, is responsible for exercising the voting rights associated with the securities purchased and/or held by the fund. A description of the policies and procedures the advisor uses in fulfilling this responsibility is available without charge, upon request, by calling 1-800-345-2021. It is also available on American Century Investments’ website at americancentury.com and on the Securities and Exchange Commission’s website at sec.gov. Information regarding how the investment advisor voted proxies relating to portfolio securities during the most recent 12-month period ended June 30 is available on the “About Us” page at americancentury.com. It is also available at sec.gov.
Quarterly Portfolio Disclosure
The fund files its complete schedule of portfolio holdings with the Securities and Exchange Commission (SEC) for the first and third quarters of each fiscal year on Form N-Q. The fund’s Forms N-Q are available on the SEC’s website at sec.gov, and may be reviewed and copied at the SEC’s Public Reference Room in Washington, DC. Information on the operation of the Public Reference Room may be obtained by calling 1-800-SEC-0330. The fund also makes its complete schedule of portfolio holdings for the most recent quarter of its fiscal year available on its website at americancentury.com and, upon request, by calling 1-800-345-2021.
Contact Us | americancentury.com |
Automated Information Line | 1-800-345-8765 |
Investor Services Representative | 1-800-345-2021
or 816-531-5575 |
Investors Using Advisors | 1-800-378-9878 |
Business, Not-For-Profit, Employer-Sponsored Retirement Plans | 1-800-345-3533 |
Banks and Trust Companies, Broker-Dealers, Financial Professionals, Insurance Companies | 1-800-345-6488 |
Telecommunications Device for the Deaf | 1-800-634-4113 |
American Century Quantitative Equity Funds, Inc.
Investment Advisor:
American Century Investment Management, Inc.
Kansas City, Missouri
This report and the statements it contains are submitted for the general information of our shareholders. The report is not authorized for distribution to prospective investors unless preceded or accompanied by an effective prospectus.
©2013 American Century Proprietary Holdings, Inc. All rights reserved.
CL-ANN-79311 1308
ANNUAL REPORT | JUNE 30, 2013 |
Global Gold Fund
President’s Letter | 2 |
Market Perspective | 3 |
Performance | 4 |
Portfolio Commentary | 6 |
Fund Characteristics | 8 |
Shareholder Fee Example | 9 |
Schedule of Investments | 11 |
Statement of Assets and Liabilities | 13 |
Statement of Operations | 14 |
Statement of Changes in Net Assets | 15 |
Notes to Financial Statements | 16 |
Financial Highlights | 22 |
Report of Independent Registered Public Accounting Firm | 24 |
Management | 25 |
Approval of Management Agreement | 28 |
Additional Information | 33 |
Any opinions expressed in this report reflect those of the author as of the date of the report, and do not necessarily represent the opinions of American Century Investments® or any other person in the American Century Investments organization. Any such opinions are subject to change at any time based upon market or other conditions and American Century Investments disclaims any responsibility to update such opinions. These opinions may not be relied upon as investment advice and, because investment decisions made by American Century Investments funds are based on numerous factors, may not be relied upon as an indication of trading intent on behalf of any American Century Investments fund. Security examples are used for representational purposes only and are not intended as recommendations to purchase or sell securities. Performance information for comparative indices and securities is provided to American Century Investments by third party vendors. To the best of American Century Investments’ knowledge, such information is accurate at the time of printing.
Jonathan Thomas
Dear Investor:
Thank you for reviewing this annual report for the 12 months ended June 30, 2013. It provides investment performance, market analysis, and portfolio information, presented with the expert perspective of our portfolio management team.
Annual reports remain important vehicles for conveying information about fund returns, including key factors that affected fund performance. For additional, updated investment and market insights, we encourage you to visit our website, americancentury.com.
Generally Favorable Fiscal-Year Returns for U.S. Stocks and High-Yield Bonds
The 12-month reporting period began in the summer of 2012 with uncertainties caused by slowing economies, as well as the upcoming November elections and year-end fiscal deadlines in the U.S. It ended with more uncertainty about the future of U.S. monetary stimulus. In between, aggressive monetary intervention by central banks encouraged investors to take more risk, generally boosting stocks at the expense of government bonds.
U.S. mid-cap, small-cap, and value stock indices achieved performance leadership during the period, outpacing the S&P 500 Index’s 20.60% return. U.S. stocks generally outperformed non-U.S. equities—the MSCI EAFE Index returned 18.62% and the MSCI Emerging Markets Index advanced 2.87%, affected by slowing growth in emerging market economies.
Slower emerging market growth also hindered commodity price gains and helped keep inflation under control. As a result, assets used as inflation hedges, including inflation-indexed securities and precious metals, lagged other assets. Gold, in particular, plunged, starting last October. And Treasury inflation-protected securities (TIPS) were among the lowest performers in the U.S. bond market. Bond index returns generally ranged from approximately 10% gains for U.S. corporate high-yield indices all the way down to negative returns for longer-maturity global Treasury benchmarks.
Despite signs of improvement in 2013, U.S. economic growth is subpar compared with past recession recoveries, and remains vulnerable to threats that could trigger another slowdown and market volatility. Therefore, we continue to believe in a disciplined, diversified, long-term investment approach, using professionally managed stock and bond portfolios—as appropriate—for meeting financial goals. We appreciate your continued trust in us in this volatile environment.
Sincerely
Jonathan Thomas
President and Chief Executive Officer
American Century Investments
By Scott Wittman, Chief Investment Officer, Asset Allocation and Quantitative Equity
Gold Prices Plunged
Gold prices tumbled during the 12-month period ended June 30, 2013, leading to sharply negative returns for most mutual funds that invest in gold and gold-related stocks. The bulk of the decline occurred in the second calendar quarter of 2013, amid market speculation that improving U.S. economic conditions would prompt the Federal Reserve (the Fed) to cut back on its massive monetary stimulus.
Prior to the second quarter of 2013, gold prices had been volatile due to global growth and demand uncertainties. But, at the end of the first calendar quarter of 2013, the price of an ounce of gold bullion was $1,598.25, relatively flat compared with June 30, 2012, when it was $1,598.50. By the end of June 2013, the price of an ounce of gold bullion had plunged to $1,192.00, a loss of 25%.
The prospect for less market liquidity, higher U.S. interest rates, and a stronger U.S. dollar resulting from reduced Fed support drove down gold prices in the second quarter. Gold, which is priced in U.S. dollars and generally moves in the opposite direction of the dollar, became more expensive for foreign buyers.
Meanwhile, low current inflation decreased gold’s attractiveness as a potential hedge against rising inflation. The U.S. inflation rate, as measured by the 12-month change in the Consumer Price Index, was 1.8% as of June 30, 2013, well below the Fed’s targets.
Supply and Demand Backdrop Mixed
Demand for gold comes from jewelry, industrial sources, and central banks, and from investment, including exchange-traded funds (ETFs). According to the World Gold Council’s latest data, investment demand accounts for little more than 5% of the market for gold, but largely determines the metal’s spot price. So despite record jewelry demand, the flight from gold ETFs pummeled the precious metal.
The supply picture was more positive, with central banks being net purchasers of gold, miners cutting production and shuttering some high-profile projects, and less recycled gold hitting the market.
12-Month Total Returns |
As of June 30, 2013 |
S&P Goldman Sachs Commodities Index (total returns) | 2.04% |
London Gold PM Fix, in U.S. dollars | -25.43% |
Lipper Precious Metals Funds Index | -41.92% |
U.S. Dollar vs. South African Rand* | 20.92% |
U.S. Dollar vs. Australian Dollar* | 11.91% |
U.S. Dollar vs. Euro* | -2.78% |
*All percentage changes in foreign exchange rates are calculated on the basis of that currency per one U.S. dollar.
Total Returns as of June 30, 2013 |
| | | | Average Annual Returns | |
| | Ticker Symbol | 1 year | 5 years | 10 years | Since Inception | Inception Date |
Investor Class | BGEIX | -42.43% | -10.44% | 4.36% | 2.06% | 8/17/88 |
NYSE Arca Gold
Miners Index | — | -44.40% | -11.86% | N/A(1) | N/A(1) | — |
MSCI World Index | — | 18.58% | 2.70% | 7.24% | 6.83%(2) | — |
Institutional Class | AGGNX | -42.30% | -10.26% | — | -7.55% | 9/28/07 |
A Class(3) No sales charge* With sales charge* | ACGGX | -42.61% -45.91% | -10.68% -11.73% | 4.11% 3.49% | 4.46% 4.05% | 5/6/98 |
C Class | AGYCX | -43.02% | -11.33% | — | -8.65% | 9/28/07 |
R Class | AGGWX | -42.74% | -10.90% | — | -8.20% | 9/28/07 |
* | Sales charges include initial sales charges and contingent deferred sales charges (CDSCs), as applicable. A Class shares have a 5.75% maximum initial sales charge and may be subject to a maximum CDSC of 1.00%. C Class shares redeemed within 12 months of purchase are subject to a maximum CDSC of 1.00%. The SEC requires that mutual funds provide performance information net of maximum sales charges in all cases where charges could be applied. |
(1) | Benchmark total return data first available October 2004. |
(2) | Since 8/31/88, the date nearest the Investor Class’s inception for which data are available. |
(3) | Prior to September 4, 2007, the A Class was referred to as the Advisor Class and did not have a front-end sales charge. Performance prior to that date has been adjusted to reflect this charge. |
Data presented reflect past performance. Past performance is no guarantee of future results. Current performance may be higher or lower than the performance shown. Investment return and principal value will fluctuate, and redemption value may be more or less than original cost. To obtain performance data current to the most recent month end, please call 1-800-345-2021 or visit americancentury.com. International investing involves special risks, such as political instability and currency fluctuations. Investing in emerging markets may accentuate these risks. Gold stocks are generally considered speculative because of high share price volatility. The price of gold will likely impact the value of the companies in which the fund invests.
Unless otherwise indicated, performance reflects Investor Class shares; performance for other share classes will vary due to differences in fee structure. For information about other share classes available, please consult the prospectus. Data assumes reinvestment of dividends and capital gains, and none of the charts reflect the deduction of taxes that a shareholder would pay on fund distributions or the redemption of fund shares. Returns for the indices are provided for comparison. The fund’s total returns include operating expenses (such as transaction costs and management fees) that reduce returns, while the total returns of the indices do not.
Growth of $10,000 Over 10 Years* |
$10,000 investment made June 30, 2003 |
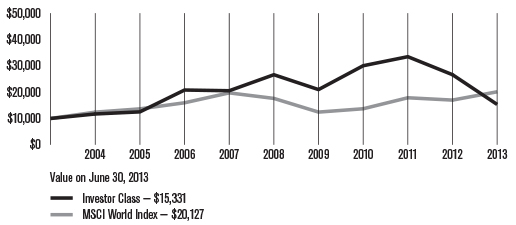
*Since NYSE Arca Gold Miners Index total return data is only available from October 2004, it is not included in the line chart.
Total Annual Fund Operating Expenses |
Investor Class | Institutional Class | A Class | C Class | R Class |
0.69% | 0.49% | 0.94% | 1.69% | 1.19% |
The total annual fund operating expenses shown is as stated in the fund’s prospectus current as of the date of this report. The prospectus may vary from the expense ratio shown elsewhere in this report because it is based on a different time period, includes acquired fund fees and expenses, and, if applicable, does not include fee waivers or expense reimbursements.
Data presented reflect past performance. Past performance is no guarantee of future results. Current performance may be higher or lower than the performance shown. Investment return and principal value will fluctuate, and redemption value may be more or less than original cost. To obtain performance data current to the most recent month end, please call 1-800-345-2021 or visit americancentury.com. International investing involves special risks, such as political instability and currency fluctuations. Investing in emerging markets may accentuate these risks. Gold stocks are generally considered speculative because of high share price volatility. The price of gold will likely impact the value of the companies in which the fund invests.
Unless otherwise indicated, performance reflects Investor Class shares; performance for other share classes will vary due to differences in fee structure. For information about other share classes available, please consult the prospectus. Data assumes reinvestment of dividends and capital gains, and none of the charts reflect the deduction of taxes that a shareholder would pay on fund distributions or the redemption of fund shares. Returns for the indices are provided for comparison. The fund’s total returns include operating expenses (such as transaction costs and management fees) that reduce returns, while the total returns of the indices do not.
Portfolio Managers: Bill Martin and Lynette Pang
Performance Summary
Global Gold declined -42.43%* for the 12 months ended June 30, 2013. The portfolio’s benchmark, the NYSE Arca Gold Miners Index, declined -44.40% for the same period. The fund’s return reflects operating expenses, while the benchmark’s return does not.
Weaker Gold Prices Weighed on Mining Stocks
Gold bullion started the period on an upswing, climbing nearly $200 between July 1, 2012, and October 4, 2012, to $1,791.75 an ounce—the highpoint for the 12-month period. After that, the price generally tumbled. Weaker gold prices put significant pressure on gold mining stocks during the period. In addition, higher production costs (energy, parts, labor) and geopolitical risks (concerns about rising taxes and fees imposed by governments where overseas mining operations are based) further contributed to the challenging environment for mining companies.
Gold, Mining Stocks Continued to Decouple
Despite a backdrop of generally slow global economic growth, global stock benchmarks advanced during the 12-month period, primarily due to the effects of continued central bank easing and relatively healthy corporate earnings. Gold-related stocks did not participate in the rally and sharply underperformed these benchmarks. For more than two years, rising production costs and geopolitical risks have led to a decoupling of gold prices and gold stocks—that is, gold mining shares have underperformed the price action of the metal itself. Because Global Gold invests in gold mining stocks, as opposed to gold bullion, this performance disparity has detracted from performance.
The fund’s outperformance relative to the benchmark primarily was due to security selection. In particular, a preference for holdings with higher-quality deposits, ready access to financing, and less exposure to political risk aided results on a relative basis.
Positioning Favored Quality
The fund typically holds a 20% allocation to explorers and emerging producers, which are more closely tied to the performance of the metal than the larger gold producers. The fund’s investment team believes these companies provide most of the growth opportunities in the sector, compared with senior miners. Nevertheless, the fund’s allocation to the explorers was slightly underweight during the 12-month period. The team increased the quality of the allocation by looking for higher-grade projects and operations in “safe” geopolitical jurisdictions, while avoiding companies that will need financing in the next two years.
To counteract concerns about rising costs, the team held an overweight position in stocks of companies with pre-negotiated revenue streams and the ability to participate in the upside of production growth. The team believes these companies should perform well when financing is tight.
*All fund returns referenced in this commentary are for Investor Class shares.
Canada Led Contributors
Overall, stock selection in Canada, the largest country weighting in the fund, and an underweight allocation to South Africa contributed to the portfolio’s relative performance. In terms of individual holdings, a position in Canada’s CGA Mining, a gold mining company whose primary asset is the largest gold project in the Philippines, contributed favorably to fund performance. Shares advanced after the company agreed to merge with Canada’s B2Gold at a price that represented a 26% premium to CGA’s previous close.
In addition, a position in Canada’s Tahoe Resources, a silver mining company, contributed to performance. Although the company has not yet produced any silver, investors remained optimistic about its Escobal mine in Guatemala, one of the largest silver mines in the world, which will begin production in 2014.
Gold Mining Trust Led Contributors
Stock selection in the United Kingdom and a fund-only (represented in the fund but not the benchmark) allocation to Australia detracted from relative results. In terms of individual holdings, a position in Belo Sun Mining, a Canada-based gold exploration company, weighed on the fund’s relative performance. Shares suffered after the company released a prefeasibility study of one of its Brazilian properties. Investors remained skeptical of the ability of Belo Sun and other explorers to develop mines in a difficult financing environment.
In addition, a position in Canada’s Pan American Silver, a silver miner, detracted from relative results. The company lost more than 30% of its value in the first four months of 2013, due to economic weakness in North America and Europe and an overall decline in metals prices. In response, analysts cut their targets for the company.
Gold Price Likely Volatile
The fund’s investment team believes supply constraints should provide support for gold prices. Central banks remain net buyers, taking supply off the market, recycling activity is down, and miners have already started shutting down high-cost production. Nevertheless, gold’s price will likely remain volatile until there’s greater clarity about central bank monetary policy and its ultimate effect on growth and inflation.
Although gold mining companies continue to face various challenges (shrinking margins, geopolitical risks), some companies may perform better than others. In particular, the team favors companies with higher-quality means, proven reserves, and healthier balance sheets. The team will seek to provide an investment that moves in line with gold prices and add value wherever possible.
JUNE 30, 2013 | |
Top Ten Holdings | % of net assets |
Goldcorp, Inc.(1) | 14.0% |
Barrick Gold Corp. | 8.4% |
Newmont Mining Corp. | 8.1% |
Yamana Gold, Inc.(1) | 6.0% |
Randgold Resources Ltd. ADR | 5.5% |
Silver Wheaton Corp. | 5.1% |
Agnico-Eagle Mines Ltd. | 4.3% |
Kinross Gold Corp.(1) | 4.1% |
New Gold, Inc. | 3.6% |
Royal Gold, Inc. | 3.5% |
(1)Includes shares traded on all exchanges. | |
| | |
Geographic Composition | % of net assets |
Canada | 69.0% |
United States | 13.7% |
United Kingdom | 5.8% |
South Africa | 5.4% |
Peru | 2.9% |
Australia | 0.2% |
Cash and Equivalents(2) | 3.0% |
(2)Includes temporary cash investments and other assets and liabilities. |
| | |
Types of Investments in Portfolio | % of net assets |
Foreign Common Stocks | 83.3% |
Domestic Common Stocks | 13.7% |
Warrants | —(3) |
Total Equity Exposure | 97.0% |
Temporary Cash Investments | 3.0% |
Other Assets and Liabilities | —(3) |
(3)Category is less than 0.05% of total net assets. | |
Fund shareholders may incur two types of costs: (1) transaction costs, including sales charges (loads) on purchase payments and redemption/exchange fees; and (2) ongoing costs, including management fees; distribution and service (12b-1) fees; and other fund expenses. This example is intended to help you understand your ongoing costs (in dollars) of investing in your fund and to compare these costs with the ongoing cost of investing in other mutual funds.
The example is based on an investment of $1,000 made at the beginning of the period and held for the entire period from January 1, 2013 to June 30, 2013.
Actual Expenses
The table provides information about actual account values and actual expenses for each class. You may use the information, together with the amount you invested, to estimate the expenses that you paid over the period. First, identify the share class you own. Then simply divide your account value by $1,000 (for example, an $8,600 account value divided by $1,000 = 8.6), then multiply the result by the number under the heading “Expenses Paid During Period” to estimate the expenses you paid on your account during this period.
If you hold Investor Class shares of any American Century Investments fund, or Institutional Class shares of the American Century Diversified Bond Fund, in an American Century Investments account (i.e., not a financial intermediary or retirement plan account), American Century Investments may charge you a $12.50 semiannual account maintenance fee if the value of those shares is less than $10,000. We will redeem shares automatically in one of your accounts to pay the $12.50 fee. In determining your total eligible investment amount, we will include your investments in all personal accounts (including American Century Investments Brokerage accounts) registered under your Social Security number. Personal accounts include individual accounts, joint accounts, UGMA/UTMA accounts, personal trusts, Coverdell Education Savings Accounts and IRAs (including traditional, Roth, Rollover, SEP-, SARSEP- and SIMPLE-IRAs), and certain other retirement accounts. If you have only business, business retirement, employer-sponsored or American Century Investments Brokerage accounts, you are currently not subject to this fee. If you are subject to the Account Maintenance Fee, your account value could be reduced by the fee amount.
Hypothetical Example for Comparison Purposes
The table also provides information about hypothetical account values and hypothetical expenses based on the actual expense ratio of each class of your fund and an assumed rate of return of 5% per year before expenses, which is not the actual return of a fund’s share class. The hypothetical account values and expenses may not be used to estimate the actual ending account balance or expenses you paid for the period. You may use this information to compare the ongoing costs of investing in your fund and other funds. To do so, compare this 5% hypothetical example with the 5% hypothetical examples that appear in the shareholder reports of the other funds.
Please note that the expenses shown in the table are meant to highlight your ongoing costs only and do not reflect any transactional costs, such as sales charges (loads) or redemption/exchange fees. Therefore, the table is useful in comparing ongoing costs only, and will not help you determine the relative total costs of owning different funds. In addition, if these transactional costs were included, your costs would have been higher.
| | | | | |
| | Beginning
Account Value 1/1/13 | Ending
Account Value 6/30/13 | Expenses Paid During Period(1) 1/1/13 — 6/30/13 | Annualized
Expense Ratio(1) |
Actual | | | | |
Investor Class | $1,000 | $540.90 | $2.60 | 0.68% |
Institutional Class | $1,000 | $541.40 | $1.83 | 0.48% |
A Class | $1,000 | $539.90 | $3.55 | 0.93% |
C Class | $1,000 | $538.30 | $6.41 | 1.68% |
R Class | $1,000 | $539.40 | $4.50 | 1.18% |
Hypothetical | | | | |
Investor Class | $1,000 | $1,021.42 | $3.41 | 0.68% |
Institutional Class | $1,000 | $1,022.41 | $2.41 | 0.48% |
A Class | $1,000 | $1,020.18 | $4.66 | 0.93% |
C Class | $1,000 | $1,016.46 | $8.40 | 1.68% |
R Class | $1,000 | $1,018.94 | $5.91 | 1.18% |
(1) | Expenses are equal to the class’s annualized expense ratio listed in the table above, multiplied by the average account value over the period, multiplied by 181, the number of days in the most recent fiscal half-year, divided by 365, to reflect the one-half year period. |
JUNE 30, 2013
| | | Shares | | | Value | |
Common Stocks — 97.0% | |
AUSTRALIA — 0.2% | |
Newcrest Mining Ltd. | | 108,113 | | | $ 975,894 | |
CANADA — 69.0% | | | | | | |
Agnico-Eagle Mines Ltd. | | 344,568 | | | 9,501,257 | |
Agnico-Eagle Mines Ltd. New York Shares | | 350,200 | | | 9,644,508 | |
Alamos Gold, Inc. | | 186,000 | | | 2,253,152 | |
Argonaut Gold, Inc.(1) | | 88,400 | | | 478,269 | |
ATAC Resources Ltd.(1) | | 1,124,700 | | | 887,611 | |
AuRico Gold, Inc. | | 1,277,671 | | | 5,600,517 | |
B2Gold Corp.(1) | | 3,687,582 | | | 7,854,125 | |
Barrick Gold Corp. | | 2,397,612 | | | 37,738,413 | |
Belo Sun Mining Corp.(1) | | 5,253,800 | | | 2,347,900 | |
Centerra Gold, Inc. | | 118,800 | | | 375,027 | |
Continental Gold Ltd.(1) | | 484,400 | | | 1,519,939 | |
Detour Gold Corp.(1) | | 254,601 | | | 1,997,203 | |
Dundee Precious Metals, Inc.(1) | | 578,200 | | | 2,364,039 | |
Eldorado Gold Corp. | | 2,407,400 | | | 14,901,753 | |
First Majestic Silver Corp.(1) | | 531,700 | | | 5,642,077 | |
Franco-Nevada Corp. | | 269,400 | | | 9,644,300 | |
GoGold Resources, Inc.(1) | | 4,050,000 | | | 4,004,944 | |
Goldcorp, Inc. | | 2,484,576 | | | 61,706,879 | |
Goldcorp, Inc. New York Shares | | 39,500 | | | 976,835 | |
Golden Star Resources Ltd.(1) | | 785,700 | | | 388,480 | |
IAMGOLD Corp. | | 1,494,119 | | | 6,279,363 | |
Ivanplats Ltd.(1) | | 484,700 | | | 705,135 | |
Kinross Gold Corp. | | 2,382,552 | | | 12,210,664 | |
Kinross Gold Corp. New York Shares | | 1,206,157 | | | 6,151,401 | |
Kirkland Lake Gold, Inc.(1) | | 170,900 | | | 718,245 | |
Midas Gold Corp.(1) | | 1,567,250 | | | 1,087,851 | |
Nevsun Resources Ltd. | | 767,300 | | | 2,268,996 | |
New Gold, Inc.(1) | | 2,508,100 | | | 16,240,526 | |
Osisko Mining Corp.(1) | | 813,800 | | | 2,692,806 | |
Pan American Silver Corp. | | 119,570 | | | 1,392,728 | |
Pan American Silver Corp. NASDAQ Shares | | 341,800 | | | 3,978,552 | |
Premier Gold Mines Ltd.(1) | | 1,198,800 | | | 2,085,960 | |
Sabina Gold & Silver Corp.(1) | | 642,400 | | | 598,604 | |
Sandstorm Gold Ltd.(1) | | 1,075,607 | | | 6,310,255 | |
Seabridge Gold, Inc.(1) | | 107,400 | | | 1,012,782 | |
SEMAFO, Inc. | | 638,700 | | | 941,319 | |
Silver Standard Resources, Inc.(1) | | 215,400 | | | 1,365,636 | |
Silver Wheaton Corp. | | 1,162,700 | | | $ 22,870,309 | |
Tahoe Resources, Inc.(1) | | 377,300 | | | 5,349,000 | |
Timmins Gold Corp.(1) | | 225,600 | | | 497,663 | |
Torex Gold Resources, Inc.(1) | | 5,115,990 | | | 6,469,779 | |
Virginia Mines, Inc.(1) | | 171,900 | | | 1,430,184 | |
Yamana Gold, Inc. | | 1,994,842 | | | 19,024,689 | |
Yamana Gold, Inc. New York Shares | | 837,881 | | | 7,968,248 | |
| | | | | | 309,477,923 | |
PERU — 2.9% | | | | | | |
Cia de Minas Buenaventura SA ADR | | 867,600 | | | 12,805,776 | |
SOUTH AFRICA — 5.4% | | | | | | |
AngloGold Ashanti Ltd. | | 453,402 | | | 6,447,755 | |
AngloGold Ashanti Ltd. ADR | | 499,676 | | | 7,145,367 | |
Gold Fields Ltd. | | 1,462,510 | | | 7,571,284 | |
Harmony Gold Mining Co. Ltd. | | 867,150 | | | 3,223,809 | |
| | | | | | 24,388,215 | |
UNITED KINGDOM — 5.8% | |
Fresnillo plc | | 112,003 | | | 1,502,495 | |
Randgold Resources Ltd. ADR | | 385,000 | | | 24,659,250 | |
| | | | | | 26,161,745 | |
UNITED STATES — 13.7% | | | | | | |
Allied Nevada Gold Corp.(1) | | 354,800 | | | 2,283,917 | |
Coeur Mining, Inc.(1) | | 355,259 | | | 4,724,945 | |
Gold Resource Corp. | | 31,700 | | | 276,107 | |
Hecla Mining Co. | | 679,075 | | | 2,023,644 | |
Newmont Mining Corp. | | 1,215,514 | | | 36,404,644 | |
Royal Gold, Inc. | | 373,621 | | | 15,721,972 | |
| | | | | | 61,435,229 | |
TOTAL COMMON STOCKS (Cost $386,755,748) | | | 435,244,782 | |
Warrants† | | | | | | |
CANADA† | | | | | | |
GoGold Resources, Inc.(1) | | 1,923,750 | | | 2 | |
Sandstorm Gold Ltd.(1) | | 115,000 | | | 127,935 | |
TOTAL WARRANTS (Cost $—) | | | 127,937 | |
Temporary Cash Investments — 3.0% | |
Repurchase Agreement, Bank of America Merrill Lynch, (collateralized by various U.S. Treasury obligations, 1.00%, 1/15/14, valued at $1,792,944), in a joint trading account at 0.06%, dated 6/28/13, due 7/1/13 (Delivery value $1,756,278) | | | 1,756,269 | |
Repurchase Agreement, Credit Suisse First Boston, Inc., (collateralized by various U.S. Treasury obligations, 4.25%, 11/15/40, valued at $5,368,366), in a joint trading account at 0.05%, dated 6/28/13, due 7/1/13 (Delivery value $5,268,829) | | | $ 5,268,807 | |
Repurchase Agreement, Goldman Sachs & Co., (collateralized by various U.S. Treasury obligations, 3.125%, 11/15/41, valued at $1,786,368), in a joint trading account at 0.04%, dated 6/28/13, due 7/1/13 (Delivery value $1,756,275) | | | 1,756,269 | |
SSgA U.S. Government Money Market Fund | | 4,727,249 | | | 4,727,249 | |
TOTAL TEMPORARY CASH INVESTMENTS (Cost $13,508,594) | | | 13,508,594 | |
TOTAL INVESTMENT SECURITIES — 100.0% (Cost $400,264,342) | | | 448,881,313 | |
OTHER ASSETS AND LIABILITIES† | | | 34,505 | |
TOTAL NET ASSETS — 100.0% | | | $448,915,818 | |
Notes to Schedule of Investments
ADR = American Depositary Receipt
† | Category is less than 0.05% of total net assets. |
See Notes to Financial Statements.
Statement of Assets and Liabilities |
JUNE 30, 2013 | |
Assets | |
Investment securities, at value (cost of $400,264,342) | | $ | 448,881,313 | |
Foreign currency holdings, at value (cost of $98,833) | | | 97,023 | |
Receivable for capital shares sold | | | 2,060,370 | |
Dividends and interest receivable | | | 371,274 | |
| | | | 451,409,980 | |
| | | | | |
Liabilities | | | | |
Payable for investments purchased | | | 1,961,787 | |
Payable for capital shares redeemed | | | 257,626 | |
Accrued management fees | | | 269,817 | |
Distribution and service fees payable | | | 4,932 | |
| | | | 2,494,162 | |
| | | | | |
Net Assets | | $ | 448,915,818 | |
| | | | | |
Net Assets Consist of: | | | | |
Capital (par value and paid-in surplus) | | $ | 456,161,274 | |
Distributions in excess of net investment income | | | (26,388,397 | ) |
Accumulated net realized loss | | | (29,470,743 | ) |
Net unrealized appreciation | | | 48,613,684 | |
| | | $ | 448,915,818 | |
| | | | |
| | Net assets | Shares outstanding | Net asset value per share |
Investor Class, $0.01 Par Value | $419,703,210 | 43,194,538 | $9.72 |
Institutional Class, $0.01 Par Value | $13,976,082 | 1,433,798 | $9.75 |
A Class, $0.01 Par Value | $10,561,073 | 1,098,677 | $9.61* |
C Class, $0.01 Par Value | $2,101,941 | 223,129 | $9.42 |
R Class, $0.01 Par Value | $2,573,512 | 268,319 | $9.59 |
*Maximum offering price $10.20 (net asset value divided by 0.9425).
See Notes to Financial Statements.
YEAR ENDED JUNE 30, 2013 | |
Investment Income (Loss) | |
Income: | | | |
Dividends (net of foreign taxes withheld of $1,176,497) | | $ 9,889,228 | |
Interest | | 7,822 | |
| | | 9,897,050 | |
| | | | |
Expenses: | | | |
Management fees | | 5,120,144 | |
Distribution and service fees: | | | |
A Class | | 41,305 | |
C Class | | 28,292 | |
R Class | | 13,795 | |
Directors’ fees and expenses | | 37,799 | |
Other expenses | | 418 | |
| | | 5,241,753 | |
| | | | |
Net investment income (loss) | | 4,655,297 | |
| | | | |
Realized and Unrealized Gain (Loss) | | | |
Net realized gain (loss) on: | | | |
Investment transactions | | (8,422,551 | ) |
Foreign currency transactions | | (9,549 | ) |
| | | (8,432,100 | ) |
| | | | |
Change in net unrealized appreciation (depreciation) on: | | | |
Investments | | (329,122,213 | ) |
Translation of assets and liabilities in foreign currencies | | (4,735 | ) |
| | | (329,126,948 | ) |
| | | | |
Net realized and unrealized gain (loss) | | (337,559,048 | ) |
| | | | |
Net Increase (Decrease) in Net Assets Resulting from Operations | | $(332,903,751 | ) |
See Notes to Financial Statements.
Statement of Changes in Net Assets |
YEARS ENDED JUNE 30, 2013 AND JUNE 30, 2012 | |
Increase (Decrease) in Net Assets | | June 30, 2013 | | | June 30, 2012 | |
Operations | |
Net investment income (loss) | | $ 4,655,297 | | | $ 2,427,806 | |
Net realized gain (loss) | | (8,432,100 | ) | | 10,675,588 | |
Change in net unrealized appreciation (depreciation) | | (329,126,948 | ) | | (228,359,328 | ) |
Net increase (decrease) in net assets resulting from operations | | (332,903,751 | ) | | (215,255,934 | ) |
| | | | | | | |
Distributions to Shareholders | | | | | | |
From net investment income: | | | | | | |
Investor Class | | (9,167,987 | ) | | — | |
Institutional Class | | (254,455 | ) | | — | |
A Class | | (164,538 | ) | | — | |
C Class | | (4,958 | ) | | — | |
R Class | | (17,663 | ) | | — | |
From net realized gains: | | | | | | |
Investor Class | | — | | | (62,330,676 | ) |
Institutional Class | | — | | | (1,210,470 | ) |
A Class | | — | | | (1,344,005 | ) |
C Class | | — | | | (231,742 | ) |
R Class | | — | | | (176,128 | ) |
Decrease in net assets from distributions | | (9,609,601 | ) | | (65,293,021 | ) |
| | | | | | | |
Capital Share Transactions | | | | | | |
Net increase (decrease) in net assets from capital share transactions | | (34,733,148 | ) | | (23,527,458 | ) |
| | | | | | | |
Redemption Fees | | | | | | |
Increase in net assets from redemption fees | | 56,943 | | | 103,257 | |
| | | | | | | |
Net increase (decrease) in net assets | | (377,189,557 | ) | | (303,973,156 | ) |
| | | | | | | |
Net Assets | | | | | | |
Beginning of period | | 826,105,375 | | | 1,130,078,531 | |
End of period | | $ 448,915,818 | | | $ 826,105,375 | |
| | | | | | | |
Distributions in excess of net investment income | | $ (26,388,397 | ) | | $ (28,157,410 | ) |
See Notes to Financial Statements.
Notes to Financial Statements |
June 30, 2013
1. Organization
American Century Quantitative Equity Funds, Inc. (the corporation) is registered under the Investment Company Act of 1940, as amended (the 1940 Act), as an open-end management investment company and is organized as a Maryland corporation. Global Gold Fund (the fund) is one fund in a series issued by the corporation. The fund is nondiversified as defined under the 1940 Act. The fund’s investment objective is to seek to realize a total return (capital growth and dividends) consistent with investment in securities of companies that are engaged in mining, processing, fabricating or distributing gold or other precious metals throughout the world.
The fund offers the Investor Class, the Institutional Class, the A Class, the C Class and the R Class. The A Class may incur an initial sales charge. The A Class and C Class may be subject to a contingent deferred sales charge. The share classes differ principally in their respective sales charges and distribution and shareholder servicing expenses and arrangements. The Institutional Class is made available to institutional shareholders or through financial intermediaries whose clients do not require the same level of shareholder and administrative services as shareholders of other classes. As a result, the Institutional Class is charged a lower unified management fee. On October 21, 2011, all outstanding B Class shares were converted to A Class shares and the fund discontinued offering the B Class.
2. Significant Accounting Policies
The following is a summary of significant accounting policies consistently followed by the fund in preparation of its financial statements. The financial statements are prepared in conformity with accounting principles generally accepted in the United States of America, which may require management to make certain estimates and assumptions at the date of the financial statements. Actual results could differ from these estimates.
Investment Valuations — The fund determines the fair value of its investments and computes its net asset value per share as of the close of regular trading (usually 4 p.m. Eastern time) on the New York Stock Exchange (NYSE) on each day the NYSE is open.
Equity securities that are listed or traded on a domestic securities exchange are valued at the last reported sales price or at the official closing price as provided by the exchange. Equity securities traded on foreign securities exchanges are typically valued at the closing price on the exchange where primarily traded or as of the close of the NYSE, if that is earlier. If no last sales price is reported, or if local convention or regulation so provides, the mean of the latest bid and asked prices is used. Depending on local convention or regulation, securities traded over-the-counter are valued at the mean of the latest bid and asked prices, the last sales price, or the official closing price. In its determination of fair value, the fund may review several factors including: market information specific to a security; news developments in U.S. and foreign markets; the performance of particular U.S. and foreign securities, indices, comparable securities, American Depositary Receipts, Exchange-Traded Funds, and other relevant market indicators.
Debt securities maturing within 60 days at the time of purchase may be valued at cost, plus or minus any amortized discount or premium or at the evaluated mean as provided by an independent pricing service. Evaluated mean prices are commonly derived through utilization of market models, which may consider, among other factors, trade data, quotations from dealers and active market makers, relevant yield curve and spread data, related sector levels, creditworthiness, and other relevant market information on the same or comparable securities.
Investments in open-end management investment companies are valued at the reported net asset value per share. Repurchase agreements are valued at cost.
The value of investments initially expressed in foreign currencies is translated into U.S. dollars at prevailing exchange rates.
If the fund determines that the market price for a portfolio security is not readily available or the valuation methods mentioned above do not reflect a security’s fair value, such security is valued as determined in good faith by the Board of Directors or its designee, in accordance with procedures adopted by the Board of Directors. Circumstances that may cause the fund to use these procedures to value a security include, but are not limited to: a security has been declared in default; trading in a security has been halted during the trading day; there is a foreign market holiday and no trading occurred; or an event occurred between the close of a foreign exchange and the NYSE that may affect the value of a security.
Security Transactions — Security transactions are accounted for as of the trade date. Net realized gains and losses are determined on the identified cost basis, which is also used for federal income tax purposes.
Investment Income — Dividend income less foreign taxes withheld, if any, is recorded as of the ex-dividend date. Distributions received on securities that represent a return of capital or long-term capital gain are recorded as a reduction of cost of investments and/or as a realized gain. The fund may estimate the components of distributions received that may be considered nontaxable distributions or long-term capital gain distributions for income tax purposes. Interest income is recorded on the accrual basis and includes accretion of discounts and amortization of premiums.
Foreign Currency Translations — All assets and liabilities initially expressed in foreign currencies are translated into U.S. dollars at prevailing exchange rates at period end. The fund may enter into spot foreign currency exchange contracts to facilitate transactions denominated in a foreign currency. Purchases and sales of investment securities, dividend and interest income, spot foreign currency exchange contracts, and expenses are translated at the rates of exchange prevailing on the respective dates of such transactions. Net realized and unrealized foreign currency exchange gains or losses related to investment securities are a component of net realized gain (loss) on investment transactions and change in net unrealized appreciation (depreciation) on investments, respectively.
Repurchase Agreements — The fund may enter into repurchase agreements with institutions that American Century Investment Management, Inc. (ACIM) (the investment advisor) has determined are creditworthy pursuant to criteria adopted by the Board of Directors. The fund requires that the collateral, represented by securities, received in a repurchase transaction be transferred to the custodian in a manner sufficient to enable the fund to obtain those securities in the event of a default under the repurchase agreement. ACIM monitors, on a daily basis, the securities transferred to ensure the value, including accrued interest, of the securities under each repurchase agreement is equal to or greater than amounts owed to the fund under each repurchase agreement.
Joint Trading Account — Pursuant to an Exemptive Order issued by the Securities and Exchange Commission, the fund, along with certain other funds in the American Century Investments family of funds, may transfer uninvested cash balances into a joint trading account. These balances are invested in one or more repurchase agreements that are collateralized by U.S. Treasury or Agency obligations.
Income Tax Status — It is the fund’s policy to distribute substantially all net investment income and net realized gains to shareholders and to otherwise qualify as a regulated investment company under provisions of the Internal Revenue Code. Accordingly, no provision has been made for income taxes. The fund files U.S. federal, state, local and non-U.S. tax returns as applicable. The fund’s tax returns are subject to examination by the relevant taxing authority until expiration of the applicable statute of limitations, which is generally three years from the date of filing but can be longer in certain jurisdictions. At this time, management believes there are no uncertain tax positions which, based on their technical merit, would not be sustained upon examination and for which it is reasonably possible that the total amounts of unrecognized tax benefits will significantly change in the next twelve months.
Multiple Class — All shares of the fund represent an equal pro rata interest in the net assets of the class to which such shares belong, and have identical voting, dividend, liquidation and other rights and the same terms and conditions, except for class specific expenses and exclusive rights to vote on matters affecting only individual classes. Income, non-class specific expenses, and realized and unrealized capital gains and losses of the fund are allocated to each class of shares based on their relative net assets.
Distributions to Shareholders — Distributions from net investment income, if any, are generally declared and paid semiannually. Distributions from net realized gains, if any, are generally declared and paid annually.
Redemption —The fund may impose a 1.00% redemption fee on shares held less than 60 days. The fee may not be applicable to all classes. The redemption fee is retained by the fund and helps cover transaction costs that long-term investors may bear when the fund sells securities to meet investor redemptions.
Indemnifications — Under the corporation’s organizational documents, its officers and directors are indemnified against certain liabilities arising out of the performance of their duties to the fund. In addition, in the normal course of business, the fund enters into contracts that provide general indemnifications. The maximum exposure under these arrangements is unknown as this would involve future claims that may be made against a fund. The risk of material loss from such claims is considered by management to be remote.
3. Fees and Transactions with Related Parties
Management Fees — The corporation has entered into a management agreement with ACIM, under which ACIM provides the fund with investment advisory and management services in exchange for a single, unified management fee (the fee) per class. The agreement provides that all expenses of managing and operating the fund, except distribution and service fees, brokerage expenses, taxes, interest, fees and expenses of the independent directors (including legal counsel fees), and extraordinary expenses, will be paid by ACIM. The fee is computed and accrued daily based on each class’s daily net assets and paid monthly in arrears. The fee consists of (1) an Investment Category Fee based on the daily net assets of the fund and certain other accounts managed by the investment advisor that are in the same broad investment category as the fund and (2) a Complex Fee based on the assets of all the funds in the American Century Investments family of funds. The rates for the Investment Category Fee range from 0.3380% to 0.5200%. The rates for the Complex Fee range from 0.2500% to 0.3100% for the Investor Class, A Class, C Class and R Class. The Institutional Class is 0.2000% less at each point within the Complex Fee range. The effective annual management fee for each class for the year ended June 30, 2013 was 0.67% for the Investor Class, A Class, C Class and R Class and 0.47% for the Institutional Class.
Distribution and Service Fees — The Board of Directors has adopted a separate Master Distribution and Individual Shareholder Services Plan for each of the A Class, C Class and R Class (collectively the plans), pursuant to Rule 12b-1 of the 1940 Act. The plans provide that the A Class will pay American Century Investment Services, Inc. (ACIS) an annual distribution and service fee of 0.25%. The plans provide that the C Class will pay ACIS an annual distribution and service fee of 1.00%, of which 0.25% is paid for individual shareholder services and 0.75% is paid for distribution services. The plans provide that the R Class will pay ACIS an annual distribution and service fee of 0.50%. The fees are computed and accrued daily based on each class’s daily net assets and paid monthly in arrears. The fees are used to pay financial intermediaries for distribution and individual shareholder services. Fees incurred under the plans during the year ended June 30, 2013 are detailed in the Statement of Operations.
Related Parties — Certain officers and directors of the corporation are also officers and/or directors of American Century Companies, Inc. (ACC). The corporation’s investment advisor, ACIM, the corporation’s distributor, ACIS, and the corporation’s transfer agent, American Century Services, LLC are wholly owned, directly or indirectly, by ACC.
4. Investment Transactions
Purchases and sales of investment securities, excluding short-term investments, for the year ended June 30, 2013 were $43,899,541 and $85,030,828, respectively.
5. Capital Share Transactions
Transactions in shares of the fund were as follows:
| | | | | | | |
| | | Year ended June 30, 2013 | | | Year ended June 30, 2012 | |
| | | Shares | | | Amount | | | Shares | | | Amount | |
Investor Class/Shares Authorized | | 200,000,000 | | | | | | 200,000,000 | | | | |
Sold | | 7,569,342 | | | $114,272,021 | | | 5,806,654 | | | $124,924,527 | |
Issued in reinvestment of distributions | | 482,896 | | | 8,426,551 | | | 2,827,619 | | | 57,853,227 | |
Redeemed | | (11,065,457 | ) | | (169,504,740 | ) | | (9,646,763 | ) | | (207,328,985 | ) |
| | | (3,013,219 | ) | | (46,806,168 | ) | | (1,012,490 | ) | | (24,551,231 | ) |
Institutional Class/Shares Authorized | | 10,000,000 | | | | | | 10,000,000 | | | | |
Sold | | 905,601 | | | 13,367,519 | | | 354,270 | | | 7,690,633 | |
Issued in reinvestment of distributions | | 14,549 | | | 254,455 | | | 59,019 | | | 1,210,470 | |
Redeemed | | (418,567 | ) | | (6,265,764 | ) | | (347,270 | ) | | (7,530,923 | ) |
| | | 501,583 | | | 7,356,210 | | | 66,019 | | | 1,370,180 | |
A Class/Shares Authorized | | 20,000,000 | | | | | | 20,000,000 | | | | |
Sold | | 1,218,153 | | | 18,638,390 | | | 613,953 | | | 12,775,556 | |
Issued in reinvestment of distributions | | 8,757 | | | 151,405 | | | 59,626 | | | 1,209,218 | |
Redeemed | | (1,048,455 | ) | | (16,218,355 | ) | | (690,337 | ) | | (14,041,150 | ) |
| | | 178,455 | | | 2,571,440 | | | (16,758 | ) | | (56,376 | ) |
B Class/Shares Authorized | | N/A | | | | | | N/A | | | | |
Sold | | | | | | | | 1,998 | | | 48,275 | |
Redeemed | | | | | | | | (69,501 | ) | | (1,505,515 | ) |
| | | | | | | | | (67,503 | ) | | (1,457,240 | ) |
C Class/Shares Authorized | | 10,000,000 | | | | | | 10,000,000 | | | | |
Sold | | 99,945 | | | 1,433,539 | | | 44,299 | | | 998,056 | |
Issued in reinvestment of distributions | | 235 | | | 3,997 | | | 8,033 | | | 160,254 | |
Redeemed | | (47,714 | ) | | (685,081 | ) | | (41,633 | ) | | (893,049 | ) |
| | | 52,466 | | | 752,455 | | | 10,699 | | | 265,261 | |
R Class/Shares Authorized | | 10,000,000 | | | | | | 10,000,000 | | | | |
Sold | | 183,825 | | | 2,480,710 | | | 89,907 | | | 1,917,174 | |
Issued in reinvestment of distributions | | 1,023 | | | 17,663 | | | 8,693 | | | 176,128 | |
Redeemed | | (72,152 | ) | | (1,105,458 | ) | | (55,906 | ) | | (1,191,354 | ) |
| | | 112,696 | | | 1,392,915 | | | 42,694 | | | 901,948 | |
Net increase (decrease) | | (2,168,019 | ) | | $(34,733,148 | ) | | (977,339 | ) | | $(23,527,458 | ) |
6. Fair Value Measurements
The fund’s securities valuation process is based on several considerations and may use multiple inputs to determine the fair value of the positions held by the fund. In conformity with accounting principles generally accepted in the United States of America, the inputs used to determine a valuation are classified into three broad levels as follows:
• | Level 1 valuation inputs consist of unadjusted quoted prices in an active market for identical securities; |
• | Level 2 valuation inputs consist of direct or indirect observable market data (including quoted prices for similar securities, evaluations of subsequent market events, interest rates, prepayment speeds, credit risk, etc.); or |
• | Level 3 valuation inputs consist of unobservable data (including a fund’s own assumptions). |
The level classification is based on the lowest level input that is significant to the fair valuation measurement. The valuation inputs are not necessarily an indication of the risks associated with investing in these securities or other financial instruments.
The following is a summary of the level classifications as of period end. The Schedule of Investments provides additional information on the fund’s portfolio holdings.
| | | | |
| | Level 1 | Level 2 | Level 3 |
Investment Securities | | | |
Foreign Common Stocks | $136,317,077 | $237,492,476 | — |
Domestic Common Stocks | 59,151,312 | 2,283,917 | — |
Warrants | — | 127,937 | — |
Temporary Cash Investments | 4,727,249 | 8,781,345 | — |
Total Value of Investment Securities | $200,195,638 | $248,685,675 | — |
7. Risk Factors
There are certain risks involved in investing in foreign securities. These risks include those resulting from future adverse political, social and economic developments, fluctuations in currency exchange rates, the possible imposition of exchange controls, and other foreign laws or restrictions. Investing in emerging markets may accentuate these risks.
The fund concentrates its investments in a narrow segment of the total market. Because of this, the fund may be subject to greater risk and market fluctuations than a portfolio representing a broader range of industries. Gold stocks are generally considered speculative because of high share price volatility. The price of gold will likely impact the value of the companies in which the fund invests. The price of gold will fluctuate, sometimes considerably. Though many investors believe that gold investments hedge against inflation, currency devaluations and stock market declines, there is no guarantee that these historical inverse relationships will continue.
8. Federal Tax Information
The tax character of distributions paid during the years ended June 30, 2013 and June 30, 2012 were as follows:
| | 2013 | 2012 |
Distributions Paid From | | |
Ordinary income | $9,609,601 | — |
Long-term capital gains | — | $65,293,021 |
The book-basis character of distributions made during the year from net investment income or net realized gains may differ from their ultimate characterization for federal income tax purposes. These differences reflect the differing character of certain income items and net realized gains and losses for financial statement and tax purposes, and may result in reclassification among certain capital accounts on the financial statements.
The reclassifications, which are primarily due to passive foreign investment company transactions were made to distributions in excess of net investment income $6,723,317 and accumulated net realized loss $(6,723,317).
As of June 30, 2013, the federal tax cost of investments and the components of distributable earnings on a tax-basis were as follows:
| | |
Federal tax cost of investments | $425,797,950 |
Gross tax appreciation of investments | $134,115,636 |
Gross tax depreciation of investments | (111,032,273) |
Net tax appreciation (depreciation) of investments | $23,083,363 |
Net tax appreciation (depreciation) on translation of assets and liabilities in foreign currencies | $(3,288) |
Net tax appreciation (depreciation) | $23,080,075 |
Accumulated short-term capital losses | $(5,527,914) |
Accumulated long-term capital losses | $(8,366,204) |
Late-year ordinary loss deferral | $(8,928,575) |
Post-October capital loss deferral | $(7,502,838) |
The difference between book-basis and tax-basis unrealized appreciation (depreciation) is attributable primarily to the realization for tax purposes of unrealized gains on investments in passive foreign investment companies.
Accumulated capital losses represent net capital loss carryovers that may be used to offset future realized capital gains for federal income tax purposes. The capital loss carryovers may be carried forward for an unlimited period. Future capital loss carryover utilization in any given year may be subject to Internal Revenue Code limitations.
Loss deferrals represent certain qualified losses that the fund has elected to treat as having been incurred in the following fiscal year for federal income tax purposes.
| |
For a Share Outstanding Throughout the Years Ended June 30 (except as noted) |
Per-Share Data | Ratios and Supplemental Data |
| | | Income From Investment Operations: | Distributions From: | | | Ratio to Average Net Assets of: | | |
| | Net Asset Value, Beginning
of Period | Net
Investment Income
(Loss)(1) | Net
Realized
and Unrealized Gain (Loss) | Total From Investment Operations | Net
Investment Income | Net
Realized
Gains | Total Distributions | Net Asset
Value,
End of
Period | Total
Return(2) | Operating Expenses | Net
Investment Income
(Loss) | Portfolio Turnover
Rate | Net Assets,
End of Period (in thousands) |
Investor Class |
2013 | $17.08 | 0.10 | (7.26) | (7.16) | (0.20) | — | (0.20) | $9.72 | (42.43)% | 0.68% | 0.61% | 6% | $419,703 |
2012 | $22.90 | 0.05 | (4.50) | (4.45) | — | (1.37) | (1.37) | $17.08 | (20.43)% | 0.69% | 0.23% | 8% | $789,135 |
2011 | $23.11 | (0.04) | 3.06 | 3.02 | (1.60) | (1.63) | (3.23) | $22.90 | 11.44% | 0.69% | (0.18)% | 32% | $1,081,258 |
2010 | $16.24 | (0.03) | 7.03 | 7.00 | (0.13) | — | (0.13) | $23.11 | 43.18% | 0.69% | (0.16)% | 24% | $1,032,309 |
2009 | $23.54 | (0.01) | (5.35) | (5.36) | —(3) | (1.94) | (1.94) | $16.24 | (21.19)% | 0.70% | (0.09)% | 20% | $792,814 |
Institutional Class |
2013 | $17.13 | 0.14 | (7.28) | (7.14) | (0.24) | — | (0.24) | $9.75 | (42.30)% | 0.48% | 0.81% | 6% | $13,976 |
2012 | $22.92 | 0.10 | (4.52) | (4.42) | — | (1.37) | (1.37) | $17.13 | (20.28)% | 0.49% | 0.43% | 8% | $15,971 |
2011 | $23.13 | 0.01 | 3.06 | 3.07 | (1.65) | (1.63) | (3.28) | $22.92 | 11.64% | 0.49% | 0.02% | 32% | $19,854 |
2010 | $16.25 | 0.01 | 7.04 | 7.05 | (0.17) | — | (0.17) | $23.13 | 43.51% | 0.49% | 0.04% | 24% | $15,751 |
2009 | $23.55 | 0.01 | (5.34) | (5.33) | (0.03) | (1.94) | (1.97) | $16.25 | (21.04)% | 0.50% | 0.11% | 20% | $9,076 |
A Class | | | | | | | | | | | | | |
2013 | $16.90 | 0.06 | (7.19) | (7.13) | (0.16) | — | (0.16) | $9.61 | (42.61)% | 0.93% | 0.36% | 6% | $10,561 |
2012 | $22.72 | —(3) | (4.45) | (4.45) | — | (1.37) | (1.37) | $16.90 | (20.60)% | 0.94% | (0.02)% | 8% | $15,550 |
2011 | $22.95 | (0.10) | 3.03 | 2.93 | (1.53) | (1.63) | (3.16) | $22.72 | 11.15% | 0.94% | (0.43)% | 32% | $21,292 |
2010 | $16.13 | (0.08) | 6.97 | 6.89 | (0.07) | — | (0.07) | $22.95 | 42.80% | 0.94% | (0.41)% | 24% | $20,879 |
2009 | $23.46 | (0.06) | (5.33) | (5.39) | — | (1.94) | (1.94) | $16.13 | (21.40)% | 0.95% | (0.34)% | 20% | $16,866 |
| |
For a Share Outstanding Throughout the Years Ended June 30 (except as noted) |
Per-Share Data | Ratios and Supplemental Data |
| | | Income From Investment Operations: | Distributions From: | | | Ratio to Average Net Assets of: | | |
| | Net Asset Value, Beginning
of Period | Net
Investment Income
(Loss)(1) | Net
Realized
and Unrealized Gain (Loss) | Total From Investment Operations | Net
Investment Income | Net
Realized
Gains | Total Distributions | Net Asset
Value,
End of
Period | Total
Return(2) | Operating Expenses | Net
Investment Income
(Loss) | Portfolio Turnover
Rate | Net Assets,
End of Period (in thousands) |
C Class | | | | | | | | | | | | | |
2013 | $16.56 | (0.05) | (7.06) | (7.11) | (0.03) | — | (0.03) | $9.42 | (43.02)% | 1.68% | (0.39)% | 6% | $2,102 |
2012 | $22.46 | (0.16) | (4.37) | (4.53) | — | (1.37) | (1.37) | $16.56 | (21.21)% | 1.69% | (0.77)% | 8% | $2,826 |
2011 | $22.72 | (0.29) | 2.99 | 2.70 | (1.33) | (1.63) | (2.96) | $22.46 | 10.31% | 1.69% | (1.18)% | 32% | $3,593 |
2010 | $16.02 | (0.23) | 6.93 | 6.70 | — | — | — | $22.72 | 41.82% | 1.69% | (1.16)% | 24% | $2,318 |
2009 | $23.48 | (0.18) | (5.34) | (5.52) | — | (1.94) | (1.94) | $16.02 | (21.98)% | 1.70% | (1.09)% | 20% | $1,006 |
R Class | | | | | | | | | | | | | |
2013 | $16.86 | 0.03 | (7.18) | (7.15) | (0.12) | — | (0.12) | $9.59 | (42.74)% | 1.18% | 0.11% | 6% | $2,574 |
2012 | $22.73 | (0.05) | (4.45) | (4.50) | — | (1.37) | (1.37) | $16.86 | (20.82)% | 1.19% | (0.27)% | 8% | $2,623 |
2011 | $22.96 | (0.16) | 3.02 | 2.86 | (1.46) | (1.63) | (3.09) | $22.73 | 10.87% | 1.19% | (0.68)% | 32% | $2,567 |
2010 | $16.13 | (0.13) | 6.98 | 6.85 | (0.02) | — | (0.02) | $22.96 | 42.50% | 1.19% | (0.66)% | 24% | $1,117 |
2009 | $23.52 | (0.11) | (5.34) | (5.45) | — | (1.94) | (1.94) | $16.13 | (21.62)% | 1.20% | (0.59)% | 20% | $313 |
Notes to Financial Highlights
(1) | Computed using average shares outstanding throughout the period. |
(2) | Total returns are calculated based on the net asset value of the last business day and do not reflect applicable sales charges, if any. Total returns for periods less than one year are not annualized. |
(3) | Per-share amount was less than $0.005. |
See Notes to Financial Statements.
Report of Independent Registered Public Accounting Firm |
To the Directors of the American Century Quantitative Equity Funds, Inc.
and Shareholders of the Global Gold Fund:
In our opinion, the accompanying statement of assets and liabilities, including the schedule of investments, and the related statements of operations and of changes in net assets and the financial highlights present fairly, in all material respects, the financial position of the Global Gold Fund (one of the fourteen funds comprising the American Century Quantitative Equity Funds, Inc., hereafter referred to as the “Fund”) at June 30, 2013, the results of its operations for the year then ended, the changes in its net assets for each of the two years in the period then ended and the financial highlights for each of the five years in the period then ended, in conformity with accounting principles generally accepted in the United States of America. These financial statements and financial highlights (hereafter referred to as “financial statements”) are the responsibility of the Fund’s management; our responsibility is to express an opinion on these financial statements based on our audits. We conducted our audits of these financial statements in accordance with the standards of the Public Company Accounting Oversight Board (United States). Those standards require that we plan and perform the audit to obtain reasonable assurance about whether the financial statements are free of material misstatement. An audit includes examining, on a test basis, evidence supporting the amounts and disclosures in the financial statements, assessing the accounting principles used and significant estimates made by management, and evaluating the overall financial statement presentation. We believe that our audits, which included confirmation of securities at June 30, 2013 by correspondence with the custodian and brokers, provide a reasonable basis for our opinion.
PricewaterhouseCoopers LLP LLP LLP
Kansas City, Missouri
August 21, 2013
Board of Directors
The individuals listed below serve as directors of the funds. Each director will continue to serve in this capacity until death, retirement, resignation or removal from office. The board has adopted a mandatory retirement age for directors who are not “interested persons,” as that term is defined in the Investment Company Act (independent directors). Independent directors shall retire on December 31 of the year in which they reach their 75th birthday; provided, however, that on or after January 1, 2022, independent directors shall retire on December 31 of the year in which they reach their 76th birthday.
Mr. Thomas is the only director who is an “interested person” because he currently serves as President and Chief Executive Officer of American Century Companies, Inc. (ACC), the parent company of American Century Investment Management, Inc. (ACIM or the advisor).
The other directors (more than three-fourths of the total number) are independent; that is, they have never been employees, directors or officers of, and have no financial interest in, ACC or any of its wholly owned, direct or indirect, subsidiaries, including ACIM, American Century Investment Services, Inc. (ACIS) and American Century Services, LLC (ACS). The directors serve in this capacity for eight (in the case of Mr. Thomas, 15) registered investment companies in the American Century Investments family of funds.
The following table presents additional information about the directors. The mailing address for each director other than Mr. Thomas is 1665 Charleston Road, Mountain View, California 94043. The mailing address for Mr. Thomas is 4500 Main Street, Kansas City, Missouri 64111.
| | | | | | | |
Name
(Year of Birth) | Position(s) Held with Funds | Length of Time Served | Principal Occupation(s) During Past 5 Years | | Number of American Century Portfolios Overseen by Director | Other Directorships Held During Past 5 Years |
Independent Directors |
Tanya S. Beder (1955) | Director | Since 2011 | Chairman, SBCC Group Inc. (independent advisory services) (2006 to present) | | 41 | CYS Investments, Inc. (specialty finance company) |
Jeremy I. Bulow (1954) | Director | Since 2011 | Professor of Economics, Stanford University, Graduate School of Business (1979 to present) | | 41 | None |
Ronald J. Gilson (1946) | Director and Chairman of the Board | Since 1995 | Charles J. Meyers Professor of Law and Business, Stanford Law School (1979 to present); Marc and Eva Stern Professor of Law and Business, Columbia University School of Law (1992 to present) | | 41 | None |
Frederick L. A. Grauer
(1946) | Director | Since 2008 | Senior Advisor, BlackRock, Inc. (investment management firm) (2010 to 2011); Senior Advisor, Barclays Global Investors (investment management firm) (2003 to 2009) | | 41 | None |
| | | | | | | |
Name
(Year of Birth) | Position(s) Held with Funds | Length of Time Served | Principal Occupation(s) During Past 5 Years | | Number of American Century Portfolios Overseen by Director | Other Directorships Held During Past 5 Years |
Independent Directors |
Peter F. Pervere (1947) | Director | Since 2007 | Retired | | 41 | Intraware, Inc. (2003 to 2009) |
Myron S. Scholes (1941) | Director | Since 1980 | Chairman, Platinum Grove Asset Management, L.P. (asset manager) (1999 to 2009); Frank E. Buck Professor of Finance-Emeritus, Stanford Graduate School of Business (1996 to present) | | 41 | Dimensional Fund Advisors (investment advisor); CME Group, Inc. (futures and options exchange) |
John B. Shoven (1947) | Director | Since 2002 | Professor of Economics, Stanford University (1973 to present) | | 41 | Cadence Design Systems; Exponent; Financial Engines |
| |
Interested Director |
Jonathan S. Thomas
(1963) | Director and President | Since 2007 | President and Chief Executive Officer, ACC (March 2007 to present). Also serves as Chief Executive Officer and Manager, ACS; Executive Vice President, ACIM; Director, ACC, ACIM and other ACC subsidiaries | | 106 | None |
Officers
The following table presents certain information about the executive officers of the funds. Each officer serves as an officer for each of the 15 investment companies in the American Century family of funds, unless otherwise noted. No officer is compensated for his or her service as an officer of the funds. The listed officers are interested persons of the funds and are appointed or re-appointed on an annual basis. The mailing address for each of the officers listed below is 4500 Main Street, Kansas City, Missouri 64111.
| | | |
Name
(Year of Birth) | Offices with the Funds | Principal Occupation(s) During the Past Five Years |
Jonathan S.Thomas
(1963) | Director and President since 2007 | President and Chief Executive Officer, ACC (March 2007 to present). Also serves as Chief Executive Officer and Manager, ACS; Executive Vice President, ACIM; Director, ACC, ACIM and other ACC subsidiaries |
Maryanne L. Roepke
(1956) | Chief Compliance Officer since 2006 and Senior Vice President since 2000 | Chief Compliance Officer, American Century funds, ACIM and ACS (August 2006 to present). Also serves as Senior Vice President, ACS |
Charles A. Etherington (1957) | General Counsel since 2007 and Senior Vice President since 2006 | Attorney, ACC (February 1994 to present); Vice President, ACC (November 2005 to present); General Counsel, ACC (March 2007 to present). Also serves as General Counsel, ACIM, ACS, ACIS and other ACC subsidiaries; and Senior Vice President, ACIM and ACS |
C. Jean Wade (1964) | Vice President, Treasurer and Chief Financial Officer since 2012 | Vice President, ACS (February 2000 to present) |
Robert J. Leach (1966) | Vice President since 2006 and Assistant Treasurer since 2012 | Vice President, ACS (February 2000 to present) |
David H. Reinmiller (1963) | Vice President since 2001 | Attorney, ACC (January 1994 to present); Associate General Counsel, ACC (January 2001 to present). Also serves as Vice President, ACIM and ACS |
Ward D. Stauffer (1960) | Secretary since 2005 | Attorney, ACC (June 2003 to present) |
The Statement of Additional Information has additional information about the fund’s directors and is available without charge, upon request, by calling 1-800-345-2021.
Approval of Management Agreement |
At a meeting held on June 11, 2013, the Fund’s Board of Directors/Trustees unanimously approved the renewal of the management agreement pursuant to which American Century Investment Management, Inc. (the “Advisor”) acts as the investment advisor for the Fund. Under Section 15(c) of the Investment Company Act, contracts for investment advisory services are required to be reviewed, evaluated, and approved by a majority of a fund’s directors/trustees (the “Directors”), including a majority of the independent Directors each year. The Board regards this annual evaluation and renewal as one of its most important responsibilities.
In connection with their annual review and evaluation, the independent Directors memorialized a statement regarding the relationship between their ongoing obligations to oversee and evaluate the performance of the Advisor and their consideration of renewal of the management agreement. In that statement, the independent Directors noted that their assessment of the Advisor’s performance is an ongoing process that takes place over the entire year and is informed by all of the information that the Board and its committees receive and consider over time. This information, together with the materials provided in connection with the review, are central to the Board’s assessment of the Advisor’s performance and its determination whether to renew the Fund’s management agreement.
Prior to its consideration of the renewal of the management agreement, the Board requested and reviewed extensive data and analysis relating to the proposed renewal. This information and analysis was compiled by the Advisor and certain independent providers of evaluation data concerning the Fund and the services provided to the Fund by the Advisor.
In connection with its consideration of the renewal of the management agreement, the Board’s review and evaluation of the services provided by the Advisor included, but was not limited to, the following:
• | the nature, extent, and quality of investment management, shareholder services, and other services provided by the Advisor to the Fund; |
• | the wide range of other programs and services the Advisor provides to the Fund and its shareholders on a routine and non-routine basis; |
• | the investment performance of the Fund, including data comparing the Fund’s performance to appropriate benchmarks and/or a peer group of other mutual funds with similar investment objectives and strategies; |
• | data comparing the cost of owning the Fund to the cost of owning similar funds; |
• | the Advisor’s compliance policies, procedures, and regulatory experience; |
• | financial data showing the cost of services provided to the Fund, the profitability of the Fund to the Advisor, and the overall profitability of the Advisor; |
• | possible economies of scale associated with the Advisor’s management of the Fund and other accounts under its management; |
• | data comparing services provided and charges to other investment management clients of the Advisor; and |
• | consideration of collateral benefits derived by the Advisor from the management of the Fund. |
In keeping with its practice, the Board held two in-person meetings to review and discuss the information provided. The Board also had the benefit of the advice of its independent counsel throughout the period.
Factors Considered
The Directors considered all of the information provided by the Advisor, the independent data providers, and the Board’s independent counsel in connection with the review, and evaluated such information for the Fund. In connection with their review, the Directors did not identify any single factor as being all-important or controlling and each Director may have attributed different levels of importance to different factors. In deciding to renew the management agreement, the Board based its decision on a number of factors, including the following:
Nature, Extent and Quality of Services - Generally. Under the management agreement, the Advisor is responsible for providing or arranging for all services necessary for the operation of the Fund. The Board noted that under the management agreement, the Advisor provides or arranges at its own expense a wide variety of services including:
• | constructing and designing the Fund |
• | portfolio research and security selection |
• | initial capitalization/funding |
• | daily valuation of the Fund’s portfolio |
• | shareholder servicing and transfer agency, including shareholder confirmations, recordkeeping, and communications |
• | regulatory and portfolio compliance |
• | marketing and distribution |
The Board noted that many of these services have expanded over time both in terms of quantity and complexity in response to shareholder demands, competition in the industry, changing distribution channels, and the changing regulatory environment.
Investment Management Services. The nature of the investment management services provided to the Fund is quite complex and allows Fund shareholders access to professional money management, instant diversification of their investments within an asset class, the opportunity to easily diversify among asset classes by investing in or exchanging among various American Century Investments funds, and liquidity. In evaluating investment performance, the Board expects the Advisor to manage the Fund in accordance with its investment objectives and approved strategies. Further, the Directors recognize that the Advisor has an obligation to seek the best execution of fund trades. In providing these services, the Advisor utilizes teams of investment professionals (portfolio managers, analysts, research assistants, and securities traders) who require extensive information technology, research, training, compliance and other systems to conduct their business. The Board, directly and through its Portfolio Committee, regularly reviews investment performance information for the Fund, together with comparative information for appropriate benchmarks and/or peer groups of similarly-managed funds, over different time horizons. The Directors also review detailed performance information during the management agreement approval process. If performance concerns are identified, the Fund receives special reviews until performance improves, during which the Board discusses with the Advisor the reasons for such results (e.g., market conditions, security selection) and any efforts being undertaken to improve performance. The Board found the investment management services provided by the Advisor to the Fund to meet or exceed industry standards. More detailed information about the Fund’s performance can be found in the Performance and Portfolio Commentary sections of this report.
Shareholder and Other Services. Under the management agreement, the Advisor provides the Fund with a comprehensive package of transfer agency, shareholder, and other services. The Board, directly and through various committees of the Board, regularly reviews reports and evaluations of such services at its regular meetings. These reports include, but are not limited to, information regarding the operational efficiency and accuracy of the shareholder and transfer agency services provided, staffing levels, shareholder satisfaction (as measured by external as well as internal sources), technology support, new products and services offered to Fund shareholders, securities trading activities, portfolio valuation services, auditing services, and legal and operational compliance activities. Certain aspects of shareholder and transfer agency service level efficiency and the quality of securities trading activities are measured by independent third party providers and are presented in comparison to other fund groups not managed by the Advisor. The Board found the services provided by the Advisor to the Fund under the management agreement to be competitive and of high quality.
Costs of Services and Profitability. The Advisor provides detailed information concerning its cost of providing various services to the Fund, its profitability in managing the Fund, its overall profitability, and its financial condition. The Directors have reviewed with the Advisor the methodology used to prepare this financial information. The financial information regarding the Advisor is considered in evaluating the Advisor’s financial condition, its ability to continue to provide services under the management agreement, and the reasonableness of the current management fee. The Board concluded that the Advisor’s profits were reasonable in light of the services provided to the Fund.
Ethics. The Board generally considers the Advisor’s commitment to providing quality services to shareholders and to conducting its business ethically. They noted that the Advisor’s practices generally meet or exceed industry best practices.
Economies of Scale. The Board also reviewed information provided by the Advisor regarding the possible existence of economies of scale in connection with the management of the Fund. The Board concluded that economies of scale are difficult to measure and predict with precision, especially on a fund-by-fund basis. The Board concluded that the Advisor is appropriately sharing economies of scale through its competitive fee structure, offering competitive fees from fund inception, and through reinvestment in its business to provide shareholders additional content and services.
Comparison to Other Funds’ Fees. The management agreement provides that the Fund pay the Advisor a single, all-inclusive (or unified) management fee for providing all services necessary for the management and operation of the Fund, other than brokerage expenses, taxes, interest, extraordinary expenses, and the fees and expenses of the Fund’s independent directors (including their independent legal counsel) and expenses incurred in connection with the provision of shareholder services and distribution services under a plan adopted pursuant to Rule 12b-1 under the 1940 Act. Under the unified fee structure, the Advisor is responsible for providing all investment advisory, custody, audit, administrative, compliance, recordkeeping, marketing and shareholder services, or arranging and supervising third parties to provide such services. By contrast, most other funds are charged a variety of fees, including an investment advisory fee, a transfer agency fee, an administrative fee, distribution charges and other expenses. Other than their investment advisory fees and any applicable Rule 12b-1 distribution fees, all other components of the total fees charged by these other funds may be increased without shareholder approval. The Board believes the unified fee structure is a benefit to Fund shareholders because it clearly discloses to shareholders the cost of owning Fund shares, and, since the unified fee cannot be increased without a vote of Fund shareholders, it shifts to the Advisor the risk of increased costs of operating the Fund and provides a direct incentive to minimize administrative inefficiencies. Part of the Board’s analysis of fee levels involves reviewing certain evaluative data compiled by an independent provider and comparing the Fund’s unified fee to the total expense ratio of other funds in the Fund’s peer group. The Board concluded that the management fee paid by the Fund to the Advisor under the management agreement is reasonable in light of the services provided to the Fund.
Comparison to Fees and Services Provided to Other Clients of the Advisor. The Board also requested and received information from the Advisor concerning the nature of the services, fees, costs and profitability of its advisory services to advisory clients other than the Fund. They observed that these varying types of client accounts require different services and involve different regulatory and entrepreneurial risks than the management of the Fund. The Board analyzed this information and concluded that the fees charged and services provided to the Fund were reasonable by comparison.
Collateral or “Fall-Out” Benefits Derived by the Advisor. The Board considered the existence of collateral benefits the Advisor may receive as a result of its relationship with the Fund. They concluded that the Advisor’s primary business is managing mutual funds and it generally does not use fund or shareholder information to generate profits in other lines of business, and therefore does not derive any significant collateral benefits from them. The Board noted that the Advisor receives proprietary research from broker-dealers that execute fund portfolio transactions and concluded that this research is likely to benefit Fund shareholders. The Board also determined that the Advisor is able to provide investment management services to certain clients other than the Fund, at least in part, due to its existing infrastructure built to serve the fund complex. The Board concluded, however, that the assets of those other clients are not material to the analysis and, where applicable, may be included with the assets of the Fund to determine breakpoints in the management fee schedule.
Existing Relationship. The Board also considered whether there was any reason for not continuing the existing arrangement with the Advisor. In this regard, the Board was mindful of the potential disruptions of the Fund’s operations and various risks, uncertainties, and other effects that could occur as a result of a decision not to continue such relationship. In particular, the Board recognized that most shareholders have invested in the Fund on the strength of the Advisor’s industry standing and reputation and in the expectation that the Advisor will have a continuing role in providing advisory services to the Fund.
Conclusion of the Directors. As a result of this process, the Board, including all of the independent directors and assisted by the advice of independent legal counsel, taking into account all of the factors discussed above and the information provided by the Advisor and others, concluded that the management agreement between the Fund and the Advisor is fair and reasonable in light of the services provided and should be renewed.
Retirement Account Information
As required by law, distributions you receive from certain IRAs are subject to federal income tax withholding, unless you elect not to have withholding apply. Tax will be withheld on the total amount withdrawn even though you may be receiving amounts that are not subject to withholding, such as nondeductible contributions. In such case, excess amounts of withholding could occur. You may adjust your withholding election so that a greater or lesser amount will be withheld.
If you don’t want us to withhold on this amount, you must notify us to not withhold the federal income tax. You may notify us in writing or in certain situations by telephone or through other electronic means. For systematic withdrawals, your withholding election will remain in effect until revoked or changed by filing a new election. You have the right to revoke your election at any time.
Remember, even if you elect not to have income tax withheld, you are liable for paying income tax on the taxable portion of your withdrawal. If you elect not to have income tax withheld or you don’t have enough income tax withheld, you may be responsible for payment of estimated tax. You may incur penalties under the estimated tax rules if your withholding and estimated tax payments are not sufficient. You can reduce or defer the income tax on a distribution by directly or indirectly rolling such distribution over to another IRA or eligible plan. You should consult your tax advisor for additional information.
State tax will be withheld if, at the time of your distribution, your address is within one of the mandatory withholding states and you have federal income tax withheld (or as otherwise required by state law). State taxes will be withheld from your distribution in accordance with the respective state rules.
Distributions you receive from 403(b), 457 and qualified plans are subject to special tax and withholding rules. Your plan administrator or plan sponsor is required to provide you with a special tax notice explaining those rules at the time you request a distribution. If applicable, federal and/or state taxes may be withheld from your distribution amount.
Proxy Voting Guidelines
American Century Investment Management, Inc., the fund’s investment advisor, is responsible for exercising the voting rights associated with the securities purchased and/or held by the fund. A description of the policies and procedures the advisor uses in fulfilling this responsibility is available without charge, upon request, by calling 1-800-345-2021. It is also available on American Century Investments’ website at americancentury.com and on the Securities and Exchange Commission’s website at sec.gov. Information regarding how the investment advisor voted proxies relating to portfolio securities during the most recent 12-month period ended June 30 is available on the “About Us” page at americancentury.com. It is also available at sec.gov.
Quarterly Portfolio Disclosure
The fund files its complete schedule of portfolio holdings with the Securities and Exchange Commission (SEC) for the first and third quarters of each fiscal year on Form N-Q. The fund’s Forms N-Q are available on the SEC’s website at sec.gov, and may be reviewed and copied at the SEC’s Public Reference Room in Washington, DC. Information on the operation of the Public Reference Room may be obtained by calling 1-800-SEC-0330. The fund also makes its complete schedule of portfolio holdings for the most recent quarter of its fiscal year available on its website at americancentury.com and, upon request, by calling 1-800-345-2021.
Other Tax Information
The following information is provided pursuant to provisions of the Internal Revenue Code.
The fund hereby designates up to the maximum amount allowable as qualified dividend income for the fiscal year ended June 30, 2013.
For corporate taxpayers, the fund hereby designates $2,271,988, or up to the maximum amount allowable, of ordinary income distributions paid during the fiscal year ended June 30, 2013 as qualified for the corporate dividends received deduction.
For the fiscal year ended June 30, 2013, the fund intends to pass through to shareholders $1,176,497 or up to the maximum amount allowable, as a foreign tax credit which represents taxes paid on income derived from sources within foreign countries or possessions of the United States. During the fiscal year ended June 30, 2013, the fund earned $8,793,737 from income derived from foreign sources. Foreign source income and foreign tax expense per outstanding share on June 30, 2013 are $0.1903 and $0.0255, respectively.
Contact Us | americancentury.com |
Automated Information Line | 1-800-345-8765 |
Investor Services Representative | 1-800-345-2021
or 816-531-5575 |
Investors Using Advisors | 1-800-378-9878 |
Business, Not-For-Profit, Employer-Sponsored Retirement Plans | 1-800-345-3533 |
Banks and Trust Companies, Broker-Dealers, Financial Professionals, Insurance Companies | 1-800-345-6488 |
Telecommunications Device for the Deaf | 1-800-634-4113 |
American Century Quantitative Equity Funds, Inc.
Investment Advisor:
American Century Investment Management, Inc.
Kansas City, Missouri
This report and the statements it contains are submitted for the general information of our shareholders. The report is not authorized for distribution to prospective investors unless preceded or accompanied by an effective prospectus.
©2013 American Century Proprietary Holdings, Inc. All rights reserved.
CL-ANN-79312 1308
ANNUAL REPORT | JUNE 30, 2013 |
Income & Growth Fund
President’s Letter | 2 |
Market Perspective | 3 |
Performance | 4 |
Portfolio Commentary | 6 |
Fund Characteristics | 8 |
Shareholder Fee Example | 9 |
Schedule of Investments | 11 |
Statement of Assets and Liabilities | 14 |
Statement of Operations | 15 |
Statement of Changes in Net Assets | 16 |
Notes to Financial Statements | 17 |
Financial Highlights | 23 |
Report of Independent Registered Public Accounting Firm | 25 |
Management | 26 |
Approval of Management Agreement | 29 |
Additional Information | 34 |
Any opinions expressed in this report reflect those of the author as of the date of the report, and do not necessarily represent the opinions of American Century Investments® or any other person in the American Century Investments organization. Any such opinions are subject to change at any time based upon market or other conditions and American Century Investments disclaims any responsibility to update such opinions. These opinions may not be relied upon as investment advice and, because investment decisions made by American Century Investments funds are based on numerous factors, may not be relied upon as an indication of trading intent on behalf of any American Century Investments fund. Security examples are used for representational purposes only and are not intended as recommendations to purchase or sell securities. Performance information for comparative indices and securities is provided to American Century Investments by third party vendors. To the best of American Century Investments’ knowledge, such information is accurate at the time of printing.
Jonathan Thomas
Dear Investor:
Thank you for reviewing this annual report for the 12 months ended June 30, 2013. It provides investment performance, market analysis, and portfolio information, presented with the expert perspective of our portfolio management team.
Annual reports remain important vehicles for conveying information about fund returns, including key factors that affected fund performance. For additional, updated investment and market insights, we encourage you to visit our website, americancentury.com.
Generally Favorable Fiscal-Year Returns for U.S. Stocks and High-Yield Bonds
The 12-month reporting period began in the summer of 2012 with uncertainties caused by slowing economies, as well as the upcoming November elections and year-end fiscal deadlines in the U.S. It ended with more uncertainty about the future of U.S. monetary stimulus. In between, aggressive monetary intervention by central banks encouraged investors to take more risk, generally boosting stocks at the expense of government bonds.
U.S. mid-cap, small-cap, and value stock indices achieved performance leadership during the period, outpacing the S&P 500 Index’s 20.60% return. U.S. stocks generally outperformed non-U.S. equities—the MSCI EAFE Index returned 18.62% and the MSCI Emerging Markets Index advanced 2.87%, affected by slowing growth in emerging market economies.
Slower emerging market growth also hindered commodity price gains and helped keep inflation under control. As a result, assets used as inflation hedges, including inflation-indexed securities and precious metals, lagged other assets. Gold, in particular, plunged, starting last October. And Treasury inflation-protected securities (TIPS) were among the lowest performers in the U.S. bond market. Bond index returns generally ranged from approximately 10% gains for U.S. corporate high-yield indices all the way down to negative returns for longer-maturity global Treasury benchmarks.
Despite signs of improvement in 2013, U.S. economic growth is subpar compared with past recession recoveries, and remains vulnerable to threats that could trigger another slowdown and market volatility. Therefore, we continue to believe in a disciplined, diversified, long-term investment approach, using professionally managed stock and bond portfolios—as appropriate—for meeting financial goals. We appreciate your continued trust in us in this volatile environment.
Sincerely,
Jonathan Thomas
President and Chief Executive Officer
American Century Investments
By Scott Wittman, Chief Investment Officer, Asset Allocation and Quantitative Equity
Central Bank Actions, Relative U.S. Economic Gains Drove Stocks Higher
Stock market performance remained robust during the 12-month period ended June 30, 2013. Despite persistent concerns about weak global growth and Europe’s ongoing financial crisis, investors largely focused on central bank stimulus measures and marginally-improving U.S. economic data, which fueled market optimism.
Early in the period, in response to disappointing U.S. economic data, the U.S. Federal Reserve (the Fed) launched its third—and most aggressive—quantitative easing (QE) program, or monthly purchases of $40 billion in government agency mortgage-backed securities. Later in 2012, the Fed expanded the program to include $45 billion in Treasury purchases, bringing its total bond buying to $85 billion per month. This unprecedented program, combined with relatively healthy corporate earnings, significant housing market gains and modest improvements in the labor market, helped keep stocks and other riskier assets
in favor.
The Fed rattled the financial markets late in the reporting period, with comments about “tapering” its quantitative easing program. Fed Chairman Ben Bernanke said the central bank could begin scaling back its bond buying later in 2013 if the economy continues to improve. After reaching record highs in May, stocks stumbled in June, following Bernanke’s comments. Late in the month, the Fed toned down its tapering talk, and stocks recovered some of their June losses. Overall, most U.S. stock benchmarks generated stellar 12-month returns, largely aided by strong double-digit gains posted during the first calendar quarter of 2013.
Value Stocks Outpaced Growth Stocks
Across the capitalization spectrum, value stocks were the performance leaders for the 12-month period. Much of this was due to strong one-year returns from the financials and health care sectors, where many value-oriented stocks reside. In particular, expectations for rising interest rates—and the late-quarter rate increase triggered by Fed tapering talk—helped boost returns within the financial sector’s banking industry. At the opposite end, the rate-sensitive utilities sector was the weakest relative performer, held back by the prospect of rising interest rates.
U.S. Stock Index Returns |
For the 12 months ended June 30, 2013 |
Russell 1000 Index (Large-Cap) | 21.24% | | Russell 2000 Index (Small-Cap) | 24.21% |
Russell 1000 Growth Index | 17.07% | | Russell 2000 Growth Index | 23.67% |
Russell 1000 Value Index | 25.32% | | Russell 2000 Value Index | 24.77% |
Russell Midcap Index | 25.41% | | | |
Russell Midcap Growth Index | 22.88% | | | |
Russell Midcap Value Index | 27.65% | | | |
Total Returns as of June 30, 2013 |
| | | | Average Annual Returns | |
| | Ticker Symbol | 1 year | 5 years | 10 years | Since Inception | Inception Date |
Investor Class | BIGRX | 22.86% | 6.58% | 6.82% | 9.84% | 12/17/90 |
S&P 500 Index | — | 20.60% | 7.01% | 7.29% | 9.56% | — |
Institutional Class | AMGIX | 23.12% | 6.79% | 7.03% | 5.34% | 1/28/98 |
A Class(1) No sales charge* With sales charge* | AMADX | 22.58% 15.54% | 6.32% 5.07% | 6.56% 5.94% | 4.90% 4.50% | 12/15/97 |
C Class | ACGCX | 21.63% | 5.53% | 5.78% | 3.34% | 6/28/01 |
R Class | AICRX | 22.26% | 6.05% | — | 6.14% | 8/29/03 |
* | Sales charges include initial sales charges and contingent deferred sales charges (CDSCs), as applicable. A Class shares have a 5.75% maximum initial sales charge and may be subject to a maximum CDSC of 1.00%. C Class shares redeemed within 12 months of purchase are subject to a maximum CDSC of 1.00%. The SEC requires that mutual funds provide performance information net of maximum sales charges in all cases where charges could be applied. |
(1) | Prior to September 4, 2007, the A Class was referred to as the Advisor Class and did not have a front-end sales charge. Performance prior to that date has been adjusted to reflect this charge. |
Data presented reflect past performance. Past performance is no guarantee of future results. Current performance may be higher or lower than the performance shown. Investment return and principal value will fluctuate, and redemption value may be more or less than original cost. To obtain performance data current to the most recent month end, please call 1-800-345-2021 or visit americancentury.com.
Unless otherwise indicated, performance reflects Investor Class shares; performance for other share classes will vary due to differences in fee structure. For information about other share classes available, please consult the prospectus. Data assumes reinvestment of dividends and capital gains, and none of the charts reflect the deduction of taxes that a shareholder would pay on fund distributions or the redemption of fund shares. Returns for the index are provided for comparison. The fund’s total returns include operating expenses (such as transaction costs and management fees) that reduce returns, while the total returns of the index do not.
Growth of $10,000 Over 10 Years |
$10,000 investment made June 30, 2003 |
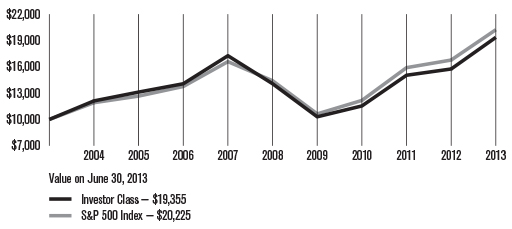
Total Annual Fund Operating Expenses |
Investor Class | Institutional Class | A Class | C Class | R Class |
0.68% | 0.48% | 0.93% | 1.68% | 1.18% |
The total annual fund operating expenses shown is as stated in the fund’s prospectus current as of the date of this report. The prospectus may vary from the expense ratio shown elsewhere in this report because it is based on a different time period, includes acquired fund fees and expenses, and, if applicable, does not include fee waivers or expense reimbursements.
Data presented reflect past performance. Past performance is no guarantee of future results. Current performance may be higher or lower than the performance shown. Investment return and principal value will fluctuate, and redemption value may be more or less than original cost. To obtain performance data current to the most recent month end, please call 1-800-345-2021 or visit americancentury.com.
Unless otherwise indicated, performance reflects Investor Class shares; performance for other share classes will vary due to differences in fee structure. For information about other share classes available, please consult the prospectus. Data assumes reinvestment of dividends and capital gains, and none of the charts reflect the deduction of taxes that a shareholder would pay on fund distributions or the redemption of fund shares. Returns for the index are provided for comparison. The fund’s total returns include operating expenses (such as transaction costs and management fees) that reduce returns, while the total returns of the index do not.
Portfolio Managers: Brian Garbe and Claudia Musat
Performance Summary
Income & Growth returned 22.86%* for the fiscal year ended June 30, 2013, compared with the 20.60% return of its benchmark, the S&P 500 Index.
In a year of strength for U.S. equity markets (see page 3 for details), Income & Growth posted a solid gain for the 12-month period, outperforming the S&P 500. As an added benefit, the fund targets companies with strong current income potential and thus produced higher levels of dividend income versus the index.
Income & Growth’s stock selection process incorporates factors of growth, value, quality, and momentum, and is designed to minimize unintended risks along industries and other risk characteristics. Led by value insights, each of these fundamental drivers of stock returns contributed to the success of the fund during the period. Security selection was the main driver of relative performance.
Absolute Performance Driven by Technology and Financials
All sectors produced positive total returns during the period, with Income & Growth’s absolute returns driven primarily by the information technology and financials sectors. Strong performers in information technology included Western Digital, networking giant Cisco Systems, and IT services provider Computer Sciences Corp. In financials, the biggest gains were attributable to financial services company JPMorgan Chase, whose shares rose more than 50% for the year. Among individual securities, positions in several consumer discretionary sector holdings (electronic game retailer GameStop and cable provider Comcast in particular), as well as drug maker Pfizer, and consumer health company Johnson & Johnson contributed significantly to absolute returns.
Technology and Consumer Discretionary Outperformed
The information technology and consumer discretionary sectors posted the highest contributions to the fund’s returns relative to the S&P 500. Technology sector outperformance was driven primarily by strong stock selection in computers and peripherals companies. Here, the most successful holdings were Western Digital and Seagate Technologies. Western Digital, a maker of storage product solutions, rose 108% for the year on robust revenue and earnings gains. Our research shows a strong fundamental profile across value, quality, growth, and momentum. Hard-disk manufacturer Seagate Technology was another source of strength. Seagate shows a strong fundamental profile and benefited from several analyst upgrades. Computer Sciences Corp, which gained nearly 100%, was also a main contributor.
Stock choices in the consumer discretionary sector also boosted returns. Among the stronger contributors to the fund’s positive relative performance were holdings in electronic game retailer GameStop, tax preparation company H&R Block, and office supplies retailer Staples. GameStop, both a top relative and absolute performer, rose 139% on strong earnings. Our research suggests compelling valuation and strong quality indicators, particularly along cash
flow generation.
*All fund returns referenced in this commentary are for Investor Class shares.
Elsewhere in the portfolio, strong individual contributors included oil refiners Marathon Petroleum and Valero Energy, and airplane manufacturer Boeing, which appreciated 42% during the year as aircraft demand increased. The company shows strong quality and growth metrics, as well as above-average valuation signals.
Financials and Consumer Staples Detracted
Although financials stocks were among the strongest contributors to the fund’s absolute returns, the sector proved challenging to relative performance. It detracted from relative results to have an underweight to the sector, particularly among capital markets and diversified financial services holdings. In particular, it hurt to have no exposure early in the year to banking giant Citigroup, which rebounded from multi-year lows. Our current research shows an improved profile from a year ago, particularly in expected growth and momentum. Accordingly, we initiated a position in the company during the second quarter of 2013. Similarly, although the fund maintained a position in Bank of America, our exposure was less than that of the benchmark. This underweight hurt relative results during a period when Bank of America shares saw a 58% gain. Goldman Sachs was another financials sector holding where an underweight position impacted relative results.
The consumer staples sector also proved difficult for relative performance, particularly security selection among food and staples retailing and food products companies. Modest overweights in grocery retailer SUPERVALU and food products manufacturer Tyson Foods detracted. Both stocks posted double-digit declines and were sold early in the fourth quarter of 2012 on weakening quality and growth prospects.
Noteworthy individual detractors included an overweight to computer processor manufacturer Intel, which declined during the year. Similarly, not holding biopharmaceutical manufacturer Gilead Sciences hurt performance during a period when the company’s shares gained nearly 100%.
A Look Ahead
As we move into the second half of 2013, the U.S. economic recovery seems to be progressing, albeit with headwinds. Improvements in housing, employment, and economic indicators have been consistent and point to slow but positive growth. Volatility is likely to remain elevated as ongoing concerns over interest rates, Federal Reserve action, and a potential slowdown in China dominate headlines. Heightened levels of volatility often provide investment opportunities, and our disciplined, objective, and systematic investment strategy is designed to take advantage of these opportunities at the individual company level. We believe this approach is the most powerful way to capitalize on market inefficiencies that lead to the mispricing of individual stocks. Our strategy is designed to provide broad U.S. equity market exposure with strong current income and exceptional risk management. Currently, the fund’s most significant sector weightings are in information technology and health care, while utilities and telecommunication services represent the smallest sector exposure.
JUNE 30, 2013 |
Top Ten Holdings | % of net assets |
Exxon Mobil Corp. | 3.5% |
Apple, Inc. | 3.2% |
Microsoft Corp. | 2.7% |
Johnson & Johnson | 2.4% |
Wells Fargo & Co. | 2.2% |
AT&T, Inc. | 2.2% |
Pfizer, Inc. | 2.1% |
Verizon Communications, Inc. | 1.9% |
Merck & Co., Inc. | 1.7% |
JPMorgan Chase & Co. | 1.7% |
| | |
Top Five Industries | % of net assets |
Pharmaceuticals | 8.3% |
Oil, Gas and Consumable Fuels | 7.8% |
Computers and Peripherals | 6.2% |
Insurance | 5.9% |
Aerospace and Defense | 5.0% |
| | |
Types of Investments in Portfolio | % of net assets |
Common Stocks | 98.6% |
Temporary Cash Investments | 1.2% |
Other Assets and Liabilities | 0.2% |
Fund shareholders may incur two types of costs: (1) transaction costs, including sales charges (loads) on purchase payments and redemption/exchange fees; and (2) ongoing costs, including management fees; distribution and service (12b-1) fees; and other fund expenses. This example is intended to help you understand your ongoing costs (in dollars) of investing in your fund and to compare these costs with the ongoing cost of investing in other mutual funds.
The example is based on an investment of $1,000 made at the beginning of the period and held for the entire period from January 1, 2013 to June 30, 2013.
Actual Expenses
The table provides information about actual account values and actual expenses for each class. You may use the information, together with the amount you invested, to estimate the expenses that you paid over the period. First, identify the share class you own. Then simply divide your account value by $1,000 (for example, an $8,600 account value divided by $1,000 = 8.6), then multiply the result by the number under the heading “Expenses Paid During Period” to estimate the expenses you paid on your account during this period.
If you hold Investor Class shares of any American Century Investments fund, or Institutional Class shares of the American Century Diversified Bond Fund, in an American Century Investments account (i.e., not a financial intermediary or retirement plan account), American Century Investments may charge you a $12.50 semiannual account maintenance fee if the value of those shares is less than $10,000. We will redeem shares automatically in one of your accounts to pay the $12.50 fee. In determining your total eligible investment amount, we will include your investments in all personal accounts (including American Century Investments Brokerage accounts) registered under your Social Security number. Personal accounts include individual accounts, joint accounts, UGMA/UTMA accounts, personal trusts, Coverdell Education Savings Accounts and IRAs (including traditional, Roth, Rollover, SEP-, SARSEP- and SIMPLE-IRAs), and certain other retirement accounts. If you have only business, business retirement, employer-sponsored or American Century Investments Brokerage accounts, you are currently not subject to this fee. If you are subject to the Account Maintenance Fee, your account value could be reduced by the fee amount.
Hypothetical Example for Comparison Purposes
The table also provides information about hypothetical account values and hypothetical expenses based on the actual expense ratio of each class of your fund and an assumed rate of return of 5% per year before expenses, which is not the actual return of a fund’s share class. The hypothetical account values and expenses may not be used to estimate the actual ending account balance or expenses you paid for the period. You may use this information to compare the ongoing costs of investing in your fund and other funds. To do so, compare this 5% hypothetical example with the 5% hypothetical examples that appear in the shareholder reports of the other funds.
Please note that the expenses shown in the table are meant to highlight your ongoing costs only and do not reflect any transactional costs, such as sales charges (loads) or redemption/exchange fees. Therefore, the table is useful in comparing ongoing costs only, and will not help you determine the relative total costs of owning different funds. In addition, if these transactional costs were included, your costs would have been higher.
| | Beginning
Account Value 1/1/13 | Ending
Account Value 6/30/13 | Expenses Paid During Period(1) 1/1/13 – 6/30/13 | Annualized
Expense Ratio(1) |
Actual |
Investor Class | $1,000 | $1,167.70 | $3.60 | 0.67% |
Institutional Class | $1,000 | $1,169.00 | $2.53 | 0.47% |
A Class | $1,000 | $1,166.20 | $4.94 | 0.92% |
C Class | $1,000 | $1,161.80 | $8.95 | 1.67% |
R Class | $1,000 | $1,164.80 | $6.28 | 1.17% |
Hypothetical |
Investor Class | $1,000 | $1,021.47 | $3.36 | 0.67% |
Institutional Class | $1,000 | $1,022.46 | $2.36 | 0.47% |
A Class | $1,000 | $1,020.23 | $4.61 | 0.92% |
C Class | $1,000 | $1,016.51 | $8.35 | 1.67% |
R Class | $1,000 | $1,018.99 | $5.86 | 1.17% |
(1) | Expenses are equal to the class’s annualized expense ratio listed in the table above, multiplied by the average account value over the period, multiplied by 181, the number of days in the most recent fiscal half-year, divided by 365, to reflect the one-half year period. |
JUNE 30, 2013
| | | Shares | | | Value | |
Common Stocks — 98.6% | |
AEROSPACE AND DEFENSE — 5.0% | |
Boeing Co. (The) | | 233,453 | | | $ 23,914,925 | |
General Dynamics Corp. | | 86,401 | | | 6,767,790 | |
Honeywell International, Inc. | | 60,969 | | | 4,837,281 | |
Lockheed Martin Corp. | | 135,887 | | | 14,738,304 | |
Northrop Grumman Corp. | | 191,967 | | | 15,894,868 | |
Raytheon Co. | | 262,159 | | | 17,333,953 | |
| | | | | | 83,487,121 | |
BEVERAGES — 1.3% | |
Coca-Cola Co. (The) | | 134,411 | | | 5,391,225 | |
PepsiCo, Inc. | | 196,306 | | | 16,055,868 | |
| | | | | | 21,447,093 | |
BIOTECHNOLOGY — 1.4% | |
Amgen, Inc. | | 233,272 | | | 23,014,615 | |
CAPITAL MARKETS — 2.0% | |
Goldman Sachs Group, Inc. (The) | | 63,163 | | | 9,553,404 | |
Janus Capital Group, Inc. | | 649,286 | | | 5,525,424 | |
T. Rowe Price Group, Inc. | | 60,114 | | | 4,397,339 | |
Waddell & Reed Financial, Inc., Class A | | 308,664 | | | 13,426,884 | |
| | | | | | 32,903,051 | |
CHEMICALS — 3.5% | |
Dow Chemical Co. (The) | | 372,553 | | | 11,985,030 | |
E.I. du Pont de Nemours & Co. | | 379,433 | | | 19,920,232 | |
Monsanto Co. | | 198,847 | | | 19,646,084 | |
Potash Corp. of Saskatchewan, Inc. | | 205,633 | | | 7,840,786 | |
| | | | | | 59,392,132 | |
COMMERCIAL BANKS — 2.2% | |
Wells Fargo & Co. | | 897,221 | | | 37,028,311 | |
COMMERCIAL SERVICES AND SUPPLIES — 0.9% | |
Pitney Bowes, Inc. | | 1,064,865 | | | 15,632,218 | |
COMMUNICATIONS EQUIPMENT — 3.9% | |
Cisco Systems, Inc. | | 1,134,618 | | | 27,582,563 | |
Harris Corp. | | 259,623 | | | 12,786,433 | |
QUALCOMM, Inc. | | 402,147 | | | 24,563,139 | |
| | | | | | 64,932,135 | |
COMPUTERS AND PERIPHERALS — 6.2% | |
Apple, Inc. | | 136,677 | | | 54,135,026 | |
Hewlett-Packard Co. | | 435,186 | | | 10,792,613 | |
Lexmark International, Inc., Class A | | 477,666 | | | 14,602,250 | |
Seagate Technology plc | | 340,365 | | | 15,258,563 | |
Western Digital Corp. | | 142,537 | | | 8,850,122 | |
| | | | | | 103,638,574 | |
CONSUMER FINANCE† | |
Cash America International, Inc. | | 7,337 | | | $ 333,540 | |
CONTAINERS AND PACKAGING — 0.9% | |
Packaging Corp. of America | | 300,640 | | | 14,719,334 | |
Sonoco Products Co. | | 25,712 | | | 888,864 | |
| | | | | | 15,608,198 | |
DIVERSIFIED FINANCIAL SERVICES — 2.0% | |
Citigroup, Inc. | | 91,440 | | | 4,386,377 | |
JPMorgan Chase & Co. | | 545,774 | | | 28,811,409 | |
| | | | | | 33,197,786 | |
DIVERSIFIED TELECOMMUNICATION SERVICES — 4.8% | |
AT&T, Inc. | | 1,042,531 | | | 36,905,598 | |
BCE, Inc. | | 289,462 | | | 11,873,731 | |
Verizon Communications, Inc. | | 629,403 | | | 31,684,147 | |
| | | | | | 80,463,476 | |
ELECTRIC UTILITIES — 2.0% | |
Edison International | | 179,351 | | | 8,637,544 | |
Pinnacle West Capital Corp. | | 234,474 | | | 13,006,273 | |
Portland General Electric Co. | | 419,573 | | | 12,834,738 | |
| | | | | | 34,478,555 | |
ELECTRICAL EQUIPMENT — 1.8% | |
Emerson Electric Co. | | 306,820 | | | 16,733,963 | |
Rockwell Automation, Inc. | | 160,758 | | | 13,365,420 | |
| | | | | | 30,099,383 | |
ENERGY EQUIPMENT AND SERVICES — 0.8% | |
Ensco plc, Class A | | 232,323 | | | 13,502,613 | |
FOOD AND STAPLES RETAILING — 1.9% | |
CVS Caremark Corp. | | 121,876 | | | 6,968,870 | |
Safeway, Inc. | | 575,349 | | | 13,612,757 | |
Wal-Mart Stores, Inc. | | 142,397 | | | 10,607,153 | |
| | | | | | 31,188,780 | |
FOOD PRODUCTS — 1.5% | |
Archer-Daniels-Midland Co. | | 252,586 | | | 8,565,191 | |
General Mills, Inc. | | 336,026 | | | 16,307,342 | |
| | | | | | 24,872,533 | |
HEALTH CARE EQUIPMENT AND SUPPLIES — 4.2% | |
Abbott Laboratories | | 547,750 | | | 19,105,520 | |
Becton Dickinson and Co. | | 149,704 | | | 14,795,246 | |
Medtronic, Inc. | | 401,222 | | | 20,650,896 | |
St. Jude Medical, Inc. | | 369,563 | | | 16,863,160 | |
| | | | | | 71,414,822 | |
HOUSEHOLD DURABLES — 1.6% | |
Garmin Ltd. | | 371,113 | | | 13,419,446 | |
Newell Rubbermaid, Inc. | | 541,735 | | | 14,220,544 | |
| | | | | | 27,639,990 | |
HOUSEHOLD PRODUCTS — 2.2% | |
Kimberly-Clark Corp. | | 173,442 | | | $ 16,848,156 | |
Procter & Gamble Co. (The) | | 254,789 | | | 19,616,205 | |
| | | | | | 36,464,361 | |
INDUSTRIAL CONGLOMERATES — 0.9% | |
General Electric Co. | | 644,762 | | | 14,952,031 | |
INSURANCE — 5.9% | |
ACE Ltd. | | 64,177 | | | 5,742,558 | |
Aflac, Inc. | | 308,822 | | | 17,948,735 | |
Axis Capital Holdings Ltd. | | 294,468 | | | 13,480,745 | |
Berkshire Hathaway, Inc., Class B(1) | | 100,112 | | | 11,204,535 | |
MetLife, Inc. | | 436,231 | | | 19,961,930 | |
Prudential Financial, Inc. | | 165,803 | | | 12,108,593 | |
Reinsurance Group of America, Inc. | | 15,127 | | | 1,045,427 | |
Sun Life Financial, Inc. | | 322,122 | | | 9,541,254 | |
Travelers Cos., Inc. (The) | | 111,672 | | | 8,924,826 | |
| | | | | | 99,958,603 | |
INTERNET SOFTWARE AND SERVICES — 0.8% | |
Google, Inc., Class A(1) | | 14,783 | | | 13,014,510 | |
IT SERVICES — 2.1% | |
Accenture plc, Class A | | 6,083 | | | 437,733 | |
International Business Machines Corp. | | 112,551 | | | 21,509,621 | |
SAIC, Inc. | | 949,687 | | | 13,229,140 | |
| | | | | | 35,176,494 | |
LEISURE EQUIPMENT AND PRODUCTS — 1.7% | |
Hasbro, Inc. | | 332,457 | | | 14,904,047 | |
Mattel, Inc. | | 318,756 | | | 14,442,835 | |
| | | | | | 29,346,882 | |
MEDIA — 3.3% | |
Comcast Corp., Class A | | 411,952 | | | 17,252,550 | |
Regal Entertainment Group, Class A | | 359,265 | | | 6,430,843 | |
Thomson Reuters Corp. | | 395,776 | | | 12,890,424 | |
Time Warner Cable, Inc. | | 170,960 | | | 19,229,581 | |
| | | | | | 55,803,398 | |
MULTI-UTILITIES — 0.3% | |
CenterPoint Energy, Inc. | | 247,459 | | | 5,812,812 | |
MULTILINE RETAIL — 0.5% | |
Target Corp. | | 124,848 | | | 8,597,033 | |
OIL, GAS AND CONSUMABLE FUELS — 7.8% | |
Chevron Corp. | | 175,739 | | | 20,796,953 | |
ConocoPhillips | | 380,263 | | | 23,005,911 | |
Exxon Mobil Corp. | | 657,565 | | | 59,410,998 | |
Marathon Petroleum Corp. | | 193,297 | | | 13,735,685 | |
Valero Energy Corp. | | 392,070 | | | 13,632,274 | |
| | | | | | 130,581,821 | |
PAPER AND FOREST PRODUCTS — 0.3% | |
International Paper Co. | | 127,035 | | | 5,628,921 | |
PHARMACEUTICALS — 8.3% | |
AbbVie, Inc. | | 181,511 | | | 7,503,665 | |
Bristol-Myers Squibb Co. | | 194,660 | | | 8,699,355 | |
Eli Lilly & Co. | | 361,231 | | | 17,743,667 | |
Johnson & Johnson | | 468,044 | | | 40,186,258 | |
Merck & Co., Inc. | | 629,311 | | | 29,231,496 | |
Pfizer, Inc. | | 1,268,600 | | | 35,533,486 | |
| | | | | | 138,897,927 | |
REAL ESTATE INVESTMENT TRUSTS (REITs) — 0.2% | |
Senior Housing Properties Trust | | 101,690 | | | 2,636,822 | |
SEMICONDUCTORS AND SEMICONDUCTOR EQUIPMENT — 4.1% | |
Applied Materials, Inc. | | 480,726 | | | 7,167,625 | |
Intel Corp. | | 1,104,108 | | | 26,741,496 | |
KLA-Tencor Corp. | | 272,673 | | | 15,196,066 | |
Texas Instruments, Inc. | | 554,721 | | | 19,343,121 | |
| | | | | | 68,448,308 | |
SOFTWARE — 4.4% | |
Activision Blizzard, Inc. | | 117,611 | | | 1,677,133 | |
CA, Inc. | | 550,689 | | | 15,766,226 | |
Microsoft Corp. | | 1,336,759 | | | 46,158,288 | |
Oracle Corp. | | 345,952 | | | 10,627,646 | |
| | | | | | 74,229,293 | |
SPECIALTY RETAIL — 3.7% | |
American Eagle Outfitters, Inc. | | 628,347 | | | 11,473,616 | |
Best Buy Co., Inc. | | 289,269 | | | 7,905,722 | |
CST Brands, Inc.(1) | | 1 | | | 31 | |
Foot Locker, Inc. | | 52,325 | | | 1,838,177 | |
GameStop Corp., Class A | | 371,962 | | | 15,633,563 | |
Home Depot, Inc. (The) | | 89,385 | | | 6,924,656 | |
Staples, Inc. | | 1,111,270 | | | 17,624,742 | |
| | | | | | 61,400,507 | |
THRIFTS AND MORTGAGE FINANCE — 0.2% | |
New York Community Bancorp, Inc. | | 286,145 | | | 4,006,030 | |
TOBACCO — 4.0% | |
Altria Group, Inc. | | 587,695 | | | 20,563,448 | |
Lorillard, Inc. | | 336,109 | | | 14,681,241 | |
Philip Morris International, Inc. | | 54,231 | | | 4,697,489 | |
Reynolds American, Inc. | | 316,548 | | | 15,311,427 | |
Universal Corp. | | 216,344 | | | 12,515,500 | |
| | | | | | 67,769,105 | |
TOTAL COMMON STOCKS (Cost $1,245,926,473) | | | 1,656,999,784 | |
Temporary Cash Investments — 1.2% | |
Repurchase Agreement, Bank of America Merrill Lynch, (collateralized by various
U.S. Treasury obligations, 1.00%, 1/15/14, valued at $2,609,809), in a joint trading account at 0.06%, dated 6/28/13, due 7/1/13 (Delivery value $2,556,438) | | | $ 2,556,425 | |
Repurchase Agreement, Credit Suisse First Boston, Inc., (collateralized by various U.S. Treasury obligations, 4.25%, 11/15/40, valued at $7,814,193), in a joint trading account at 0.05%, dated 6/28/13, due 7/1/13 (Delivery value $7,669,307) | | | 7,669,275 | |
Repurchase Agreement, Goldman Sachs & Co., (collateralized by various U.S. Treasury obligations, 3.125%, 11/15/41, valued at $2,600,237), in a joint trading account at 0.04%, dated 6/28/13, due 7/1/13 (Delivery value $2,556,434) | | | 2,556,425 | |
SSgA U.S. Government Money Market Fund | | 7,056,978 | | | 7,056,978 | |
TOTAL TEMPORARY CASH INVESTMENTS (Cost $19,839,103) | | | 19,839,103 | |
TOTAL INVESTMENT SECURITIES — 99.8% (Cost $1,265,765,576) | | | 1,676,838,887 | |
OTHER ASSETS AND LIABILITIES — 0.2% | | | 4,130,993 | |
TOTAL NET ASSETS — 100.0% | | | $1,680,969,880 | |
Notes to Schedule of Investments
† | Category is less than 0.05% of total net assets. |
See Notes to Financial Statements.
Statement of Assets and Liabilities |
JUNE 30, 2013 | |
Assets | |
Investment securities, at value (cost of $1,265,765,576) | | $1,676,838,887 | |
Cash | | 93,404 | |
Receivable for capital shares sold | | 903,391 | |
Dividends and interest receivable | | 4,548,841 | |
| | | 1,682,384,523 | |
| | | | |
Liabilities | |
Payable for capital shares redeemed | | 450,108 | |
Accrued management fees | | 922,521 | |
Distribution and service fees payable | | 42,014 | |
| | | 1,414,643 | |
| | | | |
Net Assets | | $1,680,969,880 | |
| | | | |
Net Assets Consist of: | |
Capital (par value and paid-in surplus) | | $1,465,822,715 | |
Undistributed net investment income | | 2,636,322 | |
Accumulated net realized loss | | (198,558,223 | ) |
Net unrealized appreciation | | 411,069,066 | |
| | | $1,680,969,880 | |
| | | | |
| | Net assets | Shares outstanding | Net asset value per share |
Investor Class, $0.01 Par Value | $1,417,796,425 | 44,896,691 | $31.58 |
Institutional Class, $0.01 Par Value | $68,151,668 | 2,156,241 | $31.61 |
A Class, $0.01 Par Value | $191,006,699 | 6,054,787 | $31.55* |
C Class, $0.01 Par Value | $1,964,892 | 62,380 | $31.50 |
R Class, $0.01 Par Value | $2,050,196 | 64,937 | $31.57 |
*Maximum offering price $33.47 (net asset value divided by 0.9425). |
See Notes to Financial Statements.
YEAR ENDED JUNE 30, 2013 | |
Investment Income (Loss) | |
Income: | | | |
Dividends (net of foreign taxes withheld of $224,922) | | $ 48,991,647 | |
Interest | | 15,128 | |
| | | 49,006,775 | |
| | | | |
Expenses: | | | |
Management fees | | 10,546,391 | |
Distribution and service fees: | | | |
A Class | | 423,332 | |
C Class | | 14,731 | |
R Class | | 7,440 | |
Directors’ fees and expenses | | 80,492 | |
Other expenses | | 3,697 | |
| | | 11,076,083 | |
| | | | |
Net investment income (loss) | | 37,930,692 | |
| | | | |
Realized and Unrealized Gain (Loss) | |
Net realized gain (loss) on: | | | |
Investment transactions | | 226,740,222 | |
Futures contract transactions | | (430,670 | ) |
Foreign currency transactions | | (1,314 | ) |
| | | 226,308,238 | |
| | | | |
Change in net unrealized appreciation (depreciation) on: | | | |
Investments | | 62,877,122 | |
Translation of assets and liabilities in foreign currencies | | (5,084 | ) |
| | | 62,872,038 | |
| | | | |
Net realized and unrealized gain (loss) | | 289,180,276 | |
| | | | |
Net Increase (Decrease) in Net Assets Resulting from Operations | | $327,110,968 | |
See Notes to Financial Statements.
Statement of Changes in Net Assets |
YEARS ENDED JUNE 30, 2013 AND JUNE 30, 2012 | |
Increase (Decrease) in Net Assets | | June 30, 2013 | | | June 30, 2012 | |
Operations | |
Net investment income (loss) | | $ 37,930,692 | | | $ 26,006,879 | |
Net realized gain (loss) | | 226,308,238 | | | 61,234,053 | |
Change in net unrealized appreciation (depreciation) | | 62,872,038 | | | (22,980,488 | ) |
Net increase (decrease) in net assets resulting from operations | | 327,110,968 | | | 64,260,444 | |
| | | | | | | |
Distributions to Shareholders | |
From net investment income: | | | | | | |
Investor Class | | (30,297,598 | ) | | (22,166,360 | ) |
Institutional Class | | (2,073,548 | ) | | (2,131,405 | ) |
A Class | | (3,500,707 | ) | | (1,703,017 | ) |
B Class | | — | | | (171 | ) |
C Class | | (18,979 | ) | | (7,366 | ) |
R Class | | (26,746 | ) | | (8,302 | ) |
Decrease in net assets from distributions | | (35,917,578 | ) | | (26,016,621 | ) |
| | | | | | | |
Capital Share Transactions | |
Net increase (decrease) in net assets from capital share transactions | | (133,196,359 | ) | | (126,126,611 | ) |
| | | | | | | |
Net increase (decrease) in net assets | | 157,997,031 | | | (87,882,788 | ) |
| | | | | | | |
Net Assets | |
Beginning of period | | 1,522,972,849 | | | 1,610,855,637 | |
End of period | | $1,680,969,880 | | | $1,522,972,849 | |
| | | | | | | |
Undistributed net investment income | | $2,636,322 | | | $1,276,101 | |
See Notes to Financial Statements.
Notes to Financial Statements |
JUNE 30, 2013
1. Organization
American Century Quantitative Equity Funds, Inc. (the corporation) is registered under the Investment Company Act of 1940, as amended (the 1940 Act), as an open-end management investment company and is organized as a Maryland corporation. Income & Growth Fund (the fund) is one fund in a series issued by the corporation. The fund is diversified as defined under the 1940 Act. The fund’s investment objective is to seek long-term capital growth. Income is a secondary objective.
The fund offers the Investor Class, the Institutional Class, the A Class, the C Class and the R Class. The A Class may incur an initial sales charge. The A Class and C Class may be subject to a contingent deferred sales charge. The share classes differ principally in their respective sales charges and distribution and shareholder servicing expenses and arrangements. The Institutional Class is made available to institutional shareholders or through financial intermediaries whose clients do not require the same level of shareholder and administrative services as shareholders of other classes. As a result, the Institutional Class is charged a lower unified management fee. On October 21, 2011, all outstanding B Class shares were converted to A Class shares and the fund discontinued offering the B Class.
2. Significant Accounting Policies
The following is a summary of significant accounting policies consistently followed by the fund in preparation of its financial statements. The financial statements are prepared in conformity with accounting principles generally accepted in the United States of America, which may require management to make certain estimates and assumptions at the date of the financial statements. Actual results could differ from these estimates.
Investment Valuations — The fund determines the fair value of its investments and computes its net asset value per share as of the close of regular trading (usually 4 p.m. Eastern time) on the New York Stock Exchange (NYSE) on each day the NYSE is open.
Equity securities that are listed or traded on a domestic securities exchange are valued at the last reported sales price or at the official closing price as provided by the exchange. Equity securities traded on foreign securities exchanges are typically valued at the closing price on the exchange where primarily traded or as of the close of the NYSE, if that is earlier. If no last sales price is reported, or if local convention or regulation so provides, the mean of the latest bid and asked prices is used. Depending on local convention or regulation, securities traded over-the-counter are valued at the mean of the latest bid and asked prices, the last sales price, or the official closing price. In its determination of fair value, the fund may review several factors including: market information specific to a security; news developments in U.S. and foreign markets; the performance of particular U.S. and foreign securities, indices, comparable securities, American Depositary Receipts, Exchange-Traded Funds, and other relevant market indicators.
Debt securities maturing within 60 days at the time of purchase may be valued at cost, plus or minus any amortized discount or premium or at the evaluated mean as provided by an independent pricing service. Evaluated mean prices are commonly derived through utilization of market models, which may consider, among other factors, trade data, quotations from dealers and active market makers, relevant yield curve and spread data, related sector levels, creditworthiness, and other relevant market information on the same or comparable securities.
Investments in open-end management investment companies are valued at the reported net asset value per share. Repurchase agreements are valued at cost. Exchange-traded futures contracts are valued at the settlement price as provided by the appropriate clearing corporation.
The value of investments initially expressed in foreign currencies is translated into U.S. dollars at prevailing exchange rates.
If the fund determines that the market price for a portfolio security is not readily available or the valuation methods mentioned above do not reflect a security’s fair value, such security is valued as determined in good faith by the Board of Directors or its designee, in accordance with procedures adopted by the Board of Directors. Circumstances that may cause the fund to use these procedures to value a security include, but are not limited to: a security has been declared in default; trading in a security has been halted during the trading day; there is a foreign market holiday and no trading occurred; or an event occurred between the close of a foreign exchange and the NYSE that may affect the value of a security.
Security Transactions — Security transactions are accounted for as of the trade date. Net realized gains and losses are determined on the identified cost basis, which is also used for federal income tax purposes.
Investment Income — Dividend income less foreign taxes withheld, if any, is recorded as of the ex-dividend date. Distributions received on securities that represent a return of capital or long-term capital gain are recorded as a reduction of cost of investments and/or as a realized gain. The fund may estimate the components of distributions received that may be considered nontaxable distributions or long-term capital gain distributions for income tax purposes. Interest income is recorded on the accrual basis and includes accretion of discounts and amortization of premiums.
Foreign Currency Translations — All assets and liabilities initially expressed in foreign currencies are translated into U.S. dollars at prevailing exchange rates at period end. The fund may enter into spot foreign currency exchange contracts to facilitate transactions denominated in a foreign currency. Purchases and sales of investment securities, dividend and interest income, spot foreign currency exchange contracts, and expenses are translated at the rates of exchange prevailing on the respective dates of such transactions. Net realized and unrealized foreign currency exchange gains or losses related to investment securities are
a component of net realized gain (loss) on investment transactions and change in net unrealized appreciation (depreciation) on investments, respectively.
Repurchase Agreements — The fund may enter into repurchase agreements with institutions that American Century Investment Management, Inc. (ACIM) (the investment advisor) has determined are creditworthy pursuant to criteria adopted by the Board of Directors. The fund requires that the collateral, represented by securities, received in a repurchase transaction be transferred to the custodian in a manner sufficient to enable the fund to obtain those securities in the event of a default under the repurchase agreement. ACIM monitors, on a daily basis, the securities transferred to ensure the value, including accrued interest, of the securities under each repurchase agreement is equal to or greater than amounts owed to the fund under each repurchase agreement.
Joint Trading Account — Pursuant to an Exemptive Order issued by the Securities and Exchange Commission, the fund, along with certain other funds in the American Century Investments family of funds, may transfer uninvested cash balances into a joint trading account. These balances are invested in one or more repurchase agreements that are collateralized by U.S. Treasury or Agency obligations.
Segregated Assets — In accordance with the 1940 Act, the fund segregates assets on its books and records to cover futures contracts. ACIM monitors, on a daily basis, the securities segregated to ensure the fund designates a sufficient amount of liquid assets, marked-to-market daily. The fund may also receive assets or be required to pledge assets at the custodian bank or with a broker for margin requirements on futures contracts.
Income Tax Status — It is the fund’s policy to distribute substantially all net investment income and net realized gains to shareholders and to otherwise qualify as a regulated investment company under provisions of the Internal Revenue Code. Accordingly, no provision has been made for income taxes. The fund files U.S. federal, state, local and non-U.S. tax returns as applicable. The fund’s tax returns are subject to examination by the relevant taxing authority until expiration of the applicable statute of limitations, which is generally three years from the date of filing but can be longer in certain jurisdictions. At this time, management believes there are no uncertain tax positions which, based on their technical merit, would not be sustained upon examination and for which it is reasonably possible that the total amounts of unrecognized tax benefits will significantly change in the next twelve months.
Multiple Class — All shares of the fund represent an equal pro rata interest in the net assets of the class to which such shares belong, and have identical voting, dividend, liquidation and other rights and the same terms and conditions, except for class specific expenses and exclusive rights to vote on matters affecting only individual classes. Income, non-class specific expenses, and realized and unrealized capital gains and losses of the fund are allocated to each class of shares based on their relative net assets.
Distributions to Shareholders — Distributions from net investment income, if any, are generally declared and paid quarterly. Distributions from net realized gains, if any, are generally declared and paid annually.
Indemnifications — Under the corporation’s organizational documents, its officers and directors are indemnified against certain liabilities arising out of the performance of their duties to the fund. In addition, in the normal course of business, the fund enters into contracts that provide general indemnifications. The maximum exposure under these arrangements is unknown as this would involve future claims that may be made against a fund. The risk of material loss from such claims is considered by management to be remote.
3. Fees and Transactions with Related Parties
Management Fees — The corporation has entered into a management agreement with ACIM, under which ACIM provides the fund with investment advisory and management services in exchange for a single, unified management fee (the fee) per class. The agreement provides that all expenses of managing and operating the fund, except distribution and service fees, brokerage expenses, taxes, interest, fees and expenses of the independent directors (including legal counsel fees), and extraordinary expenses, will be paid by ACIM. The fee is computed and accrued daily based on each class’s daily net assets and paid monthly in arrears. The fee consists of (1) an Investment Category Fee based on the daily net assets of the fund and certain other accounts managed by the investment advisor that are in the same broad investment category as the fund and (2) a Complex Fee based on the assets of all the funds in the American Century Investments family of funds. The rates for the Investment Category Fee range from 0.3380% to 0.5200%. The rates for the Complex Fee range from 0.2500% to 0.3100% for the Investor Class, A Class, C Class and R Class. The Institutional Class is 0.2000% less at each point within the Complex Fee range. The effective annual management fee for each class for the year ended June 30, 2013 was 0.67% for the Investor Class, A Class, C Class and R Class and 0.47% for the Institutional Class.
Distribution and Service Fees — The Board of Directors has adopted a separate Master Distribution and Individual Shareholder Services Plan for each of the A Class, C Class and R Class (collectively the plans), pursuant to Rule 12b-1 of the 1940 Act. The plans provide that the A Class will pay American Century Investment Services, Inc. (ACIS) an annual distribution and service fee of 0.25%. The plans provide that the C Class will pay ACIS an annual distribution and service fee of 1.00%, of which 0.25% is paid for individual shareholder services and 0.75% is paid for distribution services. The plans provide that the R Class will pay ACIS an annual distribution and service fee of 0.50%. The fees are computed and accrued daily based on each class’s daily net assets and paid monthly in arrears. The fees are used to pay financial intermediaries for distribution and individual shareholder services. Fees incurred under the plans during the year ended June 30, 2013 are detailed in the Statement of Operations.
Related Parties — Certain officers and directors of the corporation are also officers and/or directors of American Century Companies, Inc. (ACC). The corporation’s investment advisor, ACIM, the corporation’s distributor, ACIS, and the corporation’s transfer agent, American Century Services, LLC are wholly owned, directly or indirectly, by ACC.
4. Investment Transactions
Purchases and sales of investment securities, excluding short-term investments, for the year ended June 30, 2013 were $1,169,293,852 and $1,308,655,621, respectively.
5. Capital Share Transactions
Transactions in shares of the fund were as follows:
| | | | | | | |
| | | Year ended June 30, 2013 | | | Year ended June 30, 2012 | |
| | | Shares | | | Amount | | | Shares | | | Amount | |
Investor Class/Shares Authorized | | 230,000,000 | | | | | | 230,000,000 | | | | |
Sold | | 3,881,646 | | | $ 112,671,468 | | | 3,224,252 | | | $ 81,186,437 | |
Issued in reinvestment of distributions | | 1,008,361 | | | 29,157,438 | | | 857,331 | | | 21,323,146 | |
Redeemed | | (9,680,455 | ) | | (276,089,844 | ) | | (7,326,884 | ) | | (182,293,645 | ) |
| | | (4,790,448 | ) | | (134,260,938 | ) | | (3,245,301 | ) | | (79,784,062 | ) |
Institutional Class/Shares Authorized | | 75,000,000 | | | | | | 75,000,000 | | | | |
Sold | | 877,214 | | | 25,831,442 | | | 722,826 | | | 18,132,028 | |
Issued in reinvestment of distributions | | 60,220 | | | 1,737,950 | | | 74,524 | | | 1,845,822 | |
Redeemed | | (2,498,610 | ) | | (71,948,164 | ) | | (2,106,105 | ) | | (52,366,864 | ) |
| | | (1,561,176 | ) | | (44,378,772 | ) | | (1,308,755 | ) | | (32,389,014 | ) |
A Class/Shares Authorized | | 75,000,000 | | | | | | 75,000,000 | | | | |
Sold | | 3,177,243 | | | 89,779,424 | | | 735,867 | | | 18,374,764 | |
Issued in reinvestment of distributions | | 119,774 | | | 3,465,169 | | | 67,472 | | | 1,676,653 | |
Redeemed | | (1,687,925 | ) | | (49,082,569 | ) | | (1,410,073 | ) | | (34,585,102 | ) |
| | | 1,609,092 | | | 44,162,024 | | | (606,734 | ) | | (14,533,685 | ) |
B Class/Shares Authorized | | N/A | | | | | | N/A | | | | |
Issued in reinvestment of distributions | | | | | | | | 7 | | | 171 | |
Redeemed | | | | | | | | (3,650 | ) | | (87,522 | ) |
| | | | | | | | | (3,643 | ) | | (87,351 | ) |
C Class/Shares Authorized | | 10,000,000 | | | | | | 10,000,000 | | | | |
Sold | | 35,630 | | | 1,040,918 | | | 14,803 | | | 378,581 | |
Issued in reinvestment of distributions | | 456 | | | 13,219 | | | 204 | | | 5,057 | |
Redeemed | | (17,573 | ) | | (514,886 | ) | | (7,752 | ) | | (191,694 | ) |
| | | 18,513 | | | 539,251 | | | 7,255 | | | 191,944 | |
R Class/Shares Authorized | | 10,000,000 | | | | | | 10,000,000 | | | | |
Sold | | 49,094 | | | 1,368,318 | | | 27,268 | | | 700,916 | |
Issued in reinvestment of distributions | | 756 | | | 22,119 | | | 221 | | | 5,575 | |
Redeemed | | (22,826 | ) | | (648,361 | ) | | (9,405 | ) | | (230,934 | ) |
| | | 27,024 | | | 742,076 | | | 18,084 | | | 475,557 | |
Net increase (decrease) | | (4,696,995 | ) | | $(133,196,359 | ) | | (5,139,094 | ) | | $(126,126,611 | ) |
6. Fair Value Measurements
The fund’s securities valuation process is based on several considerations and may use multiple inputs to determine the fair value of the positions held by the fund. In conformity with accounting principles generally accepted in the United States of America, the inputs used to determine a valuation are classified into three broad levels as follows:
• | Level 1 valuation inputs consist of unadjusted quoted prices in an active market for identical securities; |
• | Level 2 valuation inputs consist of direct or indirect observable market data (including quoted prices for similar securities, evaluations of subsequent market events, interest rates, prepayment speeds, credit risk, etc.); or |
• | Level 3 valuation inputs consist of unobservable data (including a fund’s own assumptions). |
The level classification is based on the lowest level input that is significant to the fair valuation measurement. The valuation inputs are not necessarily an indication of the risks associated with investing in these securities or other financial instruments.
The following is a summary of the level classifications as of period end. The Schedule of Investments provides additional information on the fund’s portfolio holdings.
| | | | |
| | Level 1 | Level 2 | Level 3 |
Investment Securities |
Common Stocks | $1,656,999,784 | — | — |
Temporary Cash Investments | 7,056,978 | $12,782,125 | — |
Total Value of Investment Securities | $1,664,056,762 | $12,782,125 | — |
7. Derivative Instruments
Equity Price Risk — The fund is subject to equity price risk in the normal course of pursuing its investment objectives. A fund may enter into futures contracts based on an equity index in order to manage its exposure to changes in market conditions. A fund may purchase futures contracts to gain exposure to increases in market value or sell futures contracts to protect against a decline in market value. Upon entering into a futures contract, a fund is required to deposit either cash or securities in an amount equal to a certain percentage of the contract value (initial margin). Subsequent payments (variation margin) are made or received daily, in cash, by a fund. The variation margin is equal to the daily change in the contract value and is recorded as unrealized gains and losses. A fund recognizes a realized gain or loss when the contract is closed or expires. Net realized and unrealized gains or losses occurring during the holding period of futures contracts are a component of net realized gain (loss) on futures contract transactions and change in net unrealized appreciation (depreciation) on futures contracts, respectively. One of the risks of entering into futures contracts is the possibility that the change in value of the contract may not correlate with the changes in value of the underlying securities. During the period, the fund infrequently purchased equity price risk derivative instruments for temporary investment purposes.
At period end, the fund did not have any derivative instruments disclosed on the Statement of Assets and Liabilities. For the year ended June 30, 2013, the effect of equity price risk derivative instruments on the Statement of Operations was $(430,670) in net realized gain (loss) on futures contract transactions.
8. Federal Tax Information
The tax character of distributions paid during the years ended June 30, 2013 and June 30, 2012 were as follows:
| | | |
| | 2013 | 2012 |
Distributions Paid From |
Ordinary income | $35,917,578 | $26,016,621 |
Long-term capital gains | — | — |
The book-basis character of distributions made during the year from net investment income or net realized gains may differ from their ultimate characterization for federal income tax purposes. These differences reflect the differing character of certain income items and net realized gains and losses for financial statement and tax purposes, and may result in reclassification among certain capital accounts on the financial statements.
As of June 30, 2013, the federal tax cost of investments and the components of distributable earnings on a tax-basis were as follows:
| | |
Federal tax cost of investments | $1,269,162,306 |
Gross tax appreciation of investments | $417,337,099 |
Gross tax depreciation of investments | (9,660,518) |
Net tax appreciation (depreciation) of investments | $407,676,581 |
Net tax appreciation (depreciation) on translation
of assets and liabilities in foreign currencies | $(4,245) |
Net tax appreciation (depreciation) | $407,672,336 |
Undistributed ordinary income | $2,636,322 |
Accumulated short-term capital losses | $(195,161,493) |
The difference between book-basis and tax-basis unrealized appreciation (depreciation) is attributable primarily to the tax deferral of losses on wash sales.
Accumulated capital losses represent net capital loss carryovers that may be used to offset future realized capital gains for federal income tax purposes. Future capital loss carryover utilization in any given year may be subject to Internal Revenue Code limitations. Capital loss carryovers expire in 2018.
| |
For a Share Outstanding Throughout the Years Ended June 30 (except as noted) |
Per-Share Data | Ratios and Supplemental Data |
| | | Income From Investment Operations: | | | | Ratio to Average Net Assets of: | | |
| | Net Asset
Value,
Beginning
of Period | Net Investment Income (Loss)(1) | Net Realized
and Unrealized
Gain (Loss) | Total From Investment Operations | Distributions
From Net Investment Income | Net Asset Value,
End of Period | Total Return(2) | Operating Expenses | Net Investment Income (Loss) | Portfolio
Turnover Rate | Net Assets,
End of Period
(in thousands) |
Investor Class |
2013 | $26.29 | 0.68 | 5.27 | 5.95 | (0.66) | $31.58 | 22.86% | 0.68% | 2.39% | 74% | $1,417,796 |
2012 | $25.54 | 0.43 | 0.76 | 1.19 | (0.44) | $26.29 | 4.75% | 0.68% | 1.73% | 53% | $1,306,254 |
2011 | $19.88 | 0.36 | 5.64 | 6.00 | (0.34) | $25.54 | 30.31% | 0.69% | 1.52% | 42% | $1,351,936 |
2010 | $18.03 | 0.33 | 1.85 | 2.18 | (0.33) | $19.88 | 11.99% | 0.70% | 1.58% | 45% | $1,227,234 |
2009 | $25.32 | 0.44 | (7.20) | (6.76) | (0.53) | $18.03 | (26.76)% | 0.70% | 2.27% | 49% | $1,281,418 |
Institutional Class |
2013 | $26.31 | 0.74 | 5.27 | 6.01 | (0.71) | $31.61 | 23.12% | 0.48% | 2.59% | 74% | $68,152 |
2012 | $25.56 | 0.48 | 0.76 | 1.24 | (0.49) | $26.31 | 4.96% | 0.48% | 1.93% | 53% | $97,809 |
2011 | $19.89 | 0.40 | 5.66 | 6.06 | (0.39) | $25.56 | 30.61% | 0.49% | 1.72% | 42% | $128,468 |
2010 | $18.04 | 0.38 | 1.85 | 2.23 | (0.38) | $19.89 | 12.20% | 0.50% | 1.78% | 45% | $197,196 |
2009 | $25.35 | 0.48 | (7.21) | (6.73) | (0.58) | $18.04 | (26.63)% | 0.50% | 2.47% | 49% | $268,346 |
A Class |
2013 | $26.26 | 0.63 | 5.24 | 5.87 | (0.58) | $31.55 | 22.58% | 0.93% | 2.14% | 74% | $191,007 |
2012 | $25.52 | 0.37 | 0.74 | 1.11 | (0.37) | $26.26 | 4.46% | 0.93% | 1.48% | 53% | $116,762 |
2011 | $19.86 | 0.30 | 5.64 | 5.94 | (0.28) | $25.52 | 30.02% | 0.94% | 1.27% | 42% | $128,920 |
2010 | $18.01 | 0.28 | 1.85 | 2.13 | (0.28) | $19.86 | 11.72% | 0.95% | 1.33% | 45% | $125,981 |
2009 | $25.28 | 0.40 | (7.20) | (6.80) | (0.47) | $18.01 | (26.95)% | 0.95% | 2.02% | 49% | $182,331 |
| |
For a Share Outstanding Throughout the Years Ended June 30 (except as noted) |
Per-Share Data | Ratios and Supplemental Data |
| | | Income From Investment Operations: | | | | Ratio to Average Net Assets of: | | |
| | Net Asset
Value,
Beginning
of Period | Net Investment Income (Loss)(1) | Net Realized
and Unrealized
Gain (Loss) | Total From Investment Operations | Distributions
From Net Investment Income | Net Asset Value,
End of Period | Total Return(2) | Operating Expenses | Net Investment Income (Loss) | Portfolio
Turnover Rate | Net Assets,
End of Period
(in thousands) |
C Class |
2013 | $26.23 | 0.41 | 5.23 | 5.64 | (0.37) | $31.50 | 21.63% | 1.68% | 1.39% | 74% | $1,965 |
2012 | $25.48 | 0.18 | 0.76 | 0.94 | (0.19) | $26.23 | 3.73% | 1.68% | 0.73% | 53% | $1,151 |
2011 | $19.83 | 0.12 | 5.63 | 5.75 | (0.10) | $25.48 | 29.04% | 1.69% | 0.52% | 42% | $933 |
2010 | $17.99 | 0.12 | 1.84 | 1.96 | (0.12) | $19.83 | 10.85% | 1.70% | 0.58% | 45% | $863 |
2009 | $25.20 | 0.24 | (7.17) | (6.93) | (0.28) | $17.99 | (27.48)% | 1.70% | 1.27% | 49% | $815 |
R Class |
2013 | $26.28 | 0.57 | 5.23 | 5.80 | (0.51) | $31.57 | 22.26% | 1.18% | 1.89% | 74% | $2,050 |
2012 | $25.54 | 0.31 | 0.74 | 1.05 | (0.31) | $26.28 | 4.19% | 1.18% | 1.23% | 53% | $997 |
2011 | $19.87 | 0.24 | 5.65 | 5.89 | (0.22) | $25.54 | 29.73% | 1.19% | 1.02% | 42% | $506 |
2010 | $18.03 | 0.23 | 1.84 | 2.07 | (0.23) | $19.87 | 11.38% | 1.20% | 1.08% | 45% | $279 |
2009 | $25.29 | 0.36 | (7.21) | (6.85) | (0.41) | $18.03 | (27.13)% | 1.20% | 1.77% | 49% | $176 |
Notes to Financial Highlights
(1) | Computed using average shares outstanding throughout the period. |
(2) | Total returns are calculated based on the net asset value of the last business day and do not reflect applicable sales charges, if any. Total returns for periods less than one year are not annualized. |
See Notes to Financial Statements.
Report of Independent Registered Public Accounting Firm |
To the Directors of the American Century Quantitative Equity Funds, Inc. and Shareholders of the Income & Growth Fund:
In our opinion, the accompanying statement of assets and liabilities, including the schedule of investments, and the related statements of operations and of changes in net assets and the financial highlights present fairly, in all material respects, the financial position of the Income & Growth Fund (one of the fourteen funds comprising the American Century Quantitative Equity Funds, Inc., hereafter referred to as the “Fund”) at June 30, 2013, the results of its operations for the year then ended, the changes in its net assets for each of the two years in the period then ended and the financial highlights for each of the five years in the period then ended, in conformity with accounting principles generally accepted in the United States of America. These financial statements and financial highlights (hereafter referred to as “financial statements”) are the responsibility of the Fund’s management; our responsibility is to express an opinion on these financial statements based on our audits. We conducted our audits of these financial statements in accordance with the standards of the Public Company Accounting Oversight Board (United States). Those standards require that we plan and perform the audit to obtain reasonable assurance about whether the financial statements are free of material misstatement. An audit includes examining, on a test basis, evidence supporting the amounts and disclosures in the financial statements, assessing the accounting principles used and significant estimates made by management, and evaluating the overall financial statement presentation. We believe that our audits, which included confirmation of securities at June 30, 2013 by correspondence with the custodian and brokers, provide a reasonable basis for our opinion.
PricewaterhouseCoopers LLP
Kansas City, Missouri
August 21, 2013
Board of Directors
The individuals listed below serve as directors of the funds. Each director will continue to serve in this capacity until death, retirement, resignation or removal from office. The board has adopted a mandatory retirement age for directors who are not “interested persons,” as that term is defined in the Investment Company Act (independent directors). Independent directors shall retire on December 31 of the year in which they reach their 75th birthday; provided, however, that on or after January 1, 2022, independent directors shall retire on December 31 of the year in which they reach their 76th birthday.
Mr. Thomas is the only director who is an “interested person” because he currently serves as President and Chief Executive Officer of American Century Companies, Inc. (ACC), the parent company of American Century Investment Management, Inc. (ACIM or the advisor).
The other directors (more than three-fourths of the total number) are independent; that is, they have never been employees, directors or officers of, and have no financial interest in, ACC or any of its wholly owned, direct or indirect, subsidiaries, including ACIM, American Century Investment Services, Inc. (ACIS) and American Century Services, LLC (ACS). The directors serve in this capacity for eight (in the case of Mr. Thomas, 15) registered investment companies in the American Century Investments family of funds.
The following table presents additional information about the directors. The mailing address for each director other than Mr. Thomas is 1665 Charleston Road, Mountain View, California 94043. The mailing address for Mr. Thomas is 4500 Main Street, Kansas City, Missouri 64111.
| | | | | | | |
Name
(Year of Birth) | Position(s) Held with Funds | Length of Time Served | Principal Occupation(s) During Past 5 Years | | Number of American Century Portfolios Overseen
by Director | Other Directorships Held During Past 5 Years |
Independent Directors |
Tanya S. Beder
(1955) | Director | Since 2011 | Chairman, SBCC Group Inc. (independent advisory services) (2006 to present) | | 41 | CYS Investments, Inc. (specialty finance company) |
Jeremy I. Bulow
(1954) | Director | Since 2011 | Professor of Economics, Stanford University, Graduate School of Business (1979 to present) | | 41 | None |
Ronald J. Gilson
(1946) | Director and Chairman of the Board | Since 1995 | Charles J. Meyers Professor of Law and Business, Stanford Law School (1979 to present); Marc and Eva Stern Professor of Law and Business, Columbia University School of Law (1992 to present) | | 41 | None |
Frederick L. A. Grauer
(1946) | Director | Since 2008 | Senior Advisor, BlackRock, Inc. (investment management firm) (2010 to 2011); Senior Advisor, Barclays Global Investors (investment management firm) (2003 to 2009) | | 41 | None |
| | | | | | | |
Name
(Year of Birth) | Position(s) Held with Funds | Length of Time Served | Principal Occupation(s) During Past 5 Years | | Number of American Century Portfolios Overseen
by Director | Other Directorships Held During Past 5 Years |
Independent Directors |
Peter F. Pervere
(1947) | Director | Since 2007 | Retired | | 41 | Intraware, Inc. (2003 to 2009) |
Myron S. Scholes
(1941) | Director | Since 1980 | Chairman, Platinum Grove Asset Management, L.P. (asset manager) (1999 to 2009); Frank E. Buck Professor of Finance-Emeritus, Stanford Graduate School of Business (1996 to present) | | 41 | Dimensional Fund Advisors (investment advisor); CME Group, Inc. (futures and options exchange) |
John B. Shoven
(1947) | Director | Since 2002 | Professor of Economics, Stanford University (1973 to present) | | 41 | Cadence Design Systems; Exponent; Financial Engines |
| | | | | | | |
Interested Director | | | | | | |
Jonathan S. Thomas
(1963) | Director and President | Since 2007 | President and Chief Executive Officer, ACC (March 2007 to present). Also serves as Chief Executive Officer and Manager, ACS; Executive Vice President, ACIM; Director, ACC, ACIM and other ACC subsidiaries | | 106 | None |
Officers
The following table presents certain information about the executive officers of the funds. Each officer serves as an officer for each of the 15 investment companies in the American Century family of funds, unless otherwise noted. No officer is compensated for his or her service as an officer of the funds. The listed officers are interested persons of the funds and are appointed or re-appointed on an annual basis. The mailing address for each of the officers listed below is 4500 Main Street, Kansas City, Missouri 64111.
| | | |
Name
(Year of Birth) | Offices with the Funds | Principal Occupation(s) During the Past Five Years |
Jonathan S. Thomas
(1963) | Director and President since 2007 | President and Chief Executive Officer, ACC (March 2007 to present). Also serves as Chief Executive Officer and Manager, ACS; Executive Vice President, ACIM; Director, ACC, ACIM and other ACC subsidiaries |
Maryanne L. Roepke
(1956) | Chief Compliance Officer since 2006 and Senior Vice President since 2000 | Chief Compliance Officer, American Century funds, ACIM and ACS (August 2006 to present). Also serves as Senior Vice President, ACS |
Charles A. Etherington
(1957) | General Counsel since 2007 and Senior Vice President since 2006 | Attorney, ACC (February 1994 to present); Vice President, ACC (November 2005 to present); General Counsel, ACC (March 2007 to present). Also serves as General Counsel, ACIM, ACS, ACIS and other ACC subsidiaries; and Senior Vice President, ACIM and ACS |
C. Jean Wade
(1964) | Vice President, Treasurer and Chief Financial Officer since 2012 | Vice President, ACS (February 2000 to present) |
Robert J. Leach
(1966) | Vice President since 2006 and Assistant Treasurer since 2012 | Vice President, ACS (February 2000 to present) |
David H. Reinmiller
(1963) | Vice President since 2001 | Attorney, ACC (January 1994 to present); Associate General Counsel, ACC (January 2001 to present). Also serves as Vice President, ACIM and ACS |
Ward D. Stauffer
(1960) | Secretary since 2005 | Attorney, ACC (June 2003 to present) |
The Statement of Additional Information has additional information about the fund’s directors and is available without charge, upon request, by calling 1-800-345-2021.
Approval of Management Agreement |
At a meeting held on June 11, 2013, the Fund’s Board of Directors/Trustees unanimously approved the renewal of the management agreement pursuant to which American Century Investment Management, Inc. (the “Advisor”) acts as the investment advisor for the Fund. Under Section 15(c) of the Investment Company Act, contracts for investment advisory services are required to be reviewed, evaluated, and approved by a majority of a fund’s directors/trustees (the “Directors”), including a majority of the independent Directors each year. The Board regards this annual evaluation and renewal as one of its most important responsibilities.
In connection with their annual review and evaluation, the independent Directors memorialized a statement regarding the relationship between their ongoing obligations to oversee and evaluate the performance of the Advisor and their consideration of renewal of the management agreement. In that statement, the independent Directors noted that their assessment of the Advisor’s performance is an ongoing process that takes place over the entire year and is informed by all of the information that the Board and its committees receive and consider over time. This information, together with the materials provided in connection with the review, are central to the Board’s assessment of the Advisor’s performance and its determination whether to renew the Fund’s management agreement.
Prior to its consideration of the renewal of the management agreement, the Board requested and reviewed extensive data and analysis relating to the proposed renewal. This information and analysis was compiled by the Advisor and certain independent providers of evaluation data concerning the Fund and the services provided to the Fund by the Advisor.
In connection with its consideration of the renewal of the management agreement, the Board’s review and evaluation of the services provided by the Advisor included, but was not limited to, the following:
• | the nature, extent, and quality of investment management, shareholder services, and other services provided by the Advisor to the Fund; |
• | the wide range of other programs and services the Advisor provides to the Fund and its shareholders on a routine and non-routine basis; |
• | the investment performance of the Fund, including data comparing the Fund’s performance to appropriate benchmarks and/or a peer group of other mutual funds with similar investment objectives and strategies; |
• | data comparing the cost of owning the Fund to the cost of owning similar funds; |
• | the Advisor’s compliance policies, procedures, and regulatory experience; |
• | financial data showing the cost of services provided to the Fund, the profitability of the Fund to the Advisor, and the overall profitability of the Advisor; |
• | possible economies of scale associated with the Advisor’s management of the Fund and other accounts under its management; |
• | data comparing services provided and charges to other investment management clients of the Advisor; and |
• | consideration of collateral benefits derived by the Advisor from the management of the Fund. |
In keeping with its practice, the Board held two in-person meetings to review and discuss the information provided. The Board also had the benefit of the advice of its independent counsel throughout the period.
Factors Considered
The Directors considered all of the information provided by the Advisor, the independent data providers, and the Board’s independent counsel in connection with the review, and evaluated such information for the Fund. In connection with their review, the Directors did not identify any single factor as being all-important or controlling and each Director may have attributed different levels of importance to different factors. In deciding to renew the management agreement, the Board based its decision on a number of factors, including the following:
Nature, Extent and Quality of Services — Generally. Under the management agreement, the Advisor is responsible for providing or arranging for all services necessary for the operation of the Fund. The Board noted that under the management agreement, the Advisor provides or arranges at its own expense a wide variety of services including:
• | constructing and designing the Fund |
• | portfolio research and security selection |
• | initial capitalization/funding |
• | daily valuation of the Fund’s portfolio |
• | shareholder servicing and transfer agency, including shareholder confirmations, recordkeeping, and communications |
• | regulatory and portfolio compliance |
• | marketing and distribution |
The Board noted that many of these services have expanded over time both in terms of quantity and complexity in response to shareholder demands, competition in the industry, changing distribution channels, and the changing regulatory environment.
Investment Management Services. The nature of the investment management services provided to the Fund is quite complex and allows Fund shareholders access to professional money management, instant diversification of their investments within an asset class, the opportunity to easily diversify among asset classes by investing in or exchanging among various American Century Investments funds, and liquidity. In evaluating investment performance, the Board expects the Advisor to manage the Fund in accordance with its investment objectives and approved strategies. Further, the Directors recognize that the Advisor has an obligation to seek the best execution of fund trades. In providing these services, the Advisor utilizes teams of investment professionals (portfolio managers, analysts, research assistants, and securities traders) who require extensive information technology, research, training, compliance and other systems to conduct their business. The Board, directly and through its Portfolio Committee, regularly reviews investment performance information for the Fund, together with comparative information for appropriate benchmarks and/or peer groups of similarly-managed funds, over different time horizons. The Directors also review detailed performance information during the management agreement approval process. If performance concerns are identified, the Fund receives special reviews until performance improves, during which the Board discusses with the Advisor the reasons for such results (e.g., market conditions, security selection) and any efforts being undertaken to improve performance. The Board found the investment management services provided by the Advisor to the Fund to meet or exceed industry standards. More detailed information about the Fund’s performance can be found in the Performance and Portfolio Commentary sections of this report.
Shareholder and Other Services. Under the management agreement, the Advisor provides the Fund with a comprehensive package of transfer agency, shareholder, and other services. The Board, directly and through various committees of the Board, regularly reviews reports and evaluations of such services at its regular meetings. These reports include, but are not limited to, information regarding the operational efficiency and accuracy of the shareholder and transfer agency services provided, staffing levels, shareholder satisfaction (as measured by external as well as internal sources), technology support, new products and services offered to Fund shareholders, securities trading activities, portfolio valuation services, auditing services, and legal and operational compliance activities. Certain aspects of shareholder and transfer agency service level efficiency and the quality of securities trading activities are measured by independent third party providers and are presented in comparison to other fund groups not managed by the Advisor. The Board found the services provided by the Advisor to the Fund under the management agreement to be competitive and of high quality.
Costs of Services and Profitability. The Advisor provides detailed information concerning its cost of providing various services to the Fund, its profitability in managing the Fund, its overall profitability, and its financial condition. The Directors have reviewed with the Advisor the methodology used to prepare this financial information. The financial information regarding the Advisor is considered in evaluating the Advisor’s financial condition, its ability to continue to provide services under the management agreement, and the reasonableness of the current management fee. The Board concluded that the Advisor’s profits were reasonable in light of the services provided to the Fund.
Ethics. The Board generally considers the Advisor’s commitment to providing quality services to shareholders and to conducting its business ethically. They noted that the Advisor’s practices generally meet or exceed industry
best practices.
Economies of Scale. The Board also reviewed information provided by the Advisor regarding the possible existence of economies of scale in connection with the management of the Fund. The Board concluded that economies of scale are difficult to measure and predict with precision, especially on a fund-by-fund basis. The Board concluded that the Advisor is appropriately sharing economies of scale through its competitive fee structure, offering competitive fees from fund inception, and through reinvestment in its business to provide shareholders additional content and services.
Comparison to Other Funds’ Fees. The management agreement provides that the Fund pay the Advisor a single, all-inclusive (or unified) management fee for providing all services necessary for the management and operation of the Fund, other than brokerage expenses, taxes, interest, extraordinary expenses, and the fees and expenses of the Fund’s independent directors (including their independent legal counsel) and expenses incurred in connection with the provision of shareholder services and distribution services under a plan adopted pursuant to Rule 12b-1 under the 1940 Act. Under the unified fee structure, the Advisor is responsible for providing all investment advisory, custody, audit, administrative, compliance, recordkeeping, marketing and shareholder services, or arranging and supervising third parties to provide such services. By contrast, most other funds are charged a variety of fees, including an investment advisory fee, a transfer agency fee, an administrative fee, distribution charges and other expenses. Other than their investment advisory fees and any applicable Rule 12b-1 distribution fees, all other components of the total fees charged by these other funds may be increased without shareholder approval. The Board believes the unified fee structure is a benefit to Fund shareholders because it clearly discloses to shareholders the cost of owning Fund shares, and, since the unified fee cannot be increased without a vote of Fund shareholders, it shifts to the Advisor the risk of increased costs of operating the Fund and provides a direct incentive to minimize administrative inefficiencies. Part of the Board’s analysis of fee levels involves reviewing certain evaluative data compiled by an independent provider and comparing the Fund’s unified fee to the total expense ratio of other funds in the Fund’s peer group. The Board concluded that the management fee paid by the Fund to the Advisor under the management agreement is reasonable in light of the services provided to the Fund.
Comparison to Fees and Services Provided to Other Clients of the Advisor. The Board also requested and received information from the Advisor concerning the nature of the services, fees, costs and profitability of its advisory services to advisory clients other than the Fund. They observed that these varying types of client accounts require different services and involve different regulatory and entrepreneurial risks than the management of the Fund. The Board analyzed this information and concluded that the fees charged and services provided to the Fund were reasonable by comparison.
Collateral or “Fall-Out” Benefits Derived by the Advisor. The Board considered the existence of collateral benefits the Advisor may receive as a result of its relationship with the Fund. They concluded that the Advisor’s primary business is managing mutual funds and it generally does not use fund or shareholder information to generate profits in other lines of business, and therefore does not derive any significant collateral benefits from them. The Board noted that the Advisor receives proprietary research from broker-dealers that execute fund portfolio transactions and concluded that this research is likely to benefit Fund shareholders. The Board also determined that the Advisor is able to provide investment management services to certain clients other than the Fund, at least in part, due to its existing infrastructure built to serve the fund complex. The Board concluded, however, that the assets of those other clients are not material to the analysis and, where applicable, may be included with the assets of the Fund to determine breakpoints in the management fee schedule.
Existing Relationship. The Board also considered whether there was any reason for not continuing the existing arrangement with the Advisor. In this regard, the Board was mindful of the potential disruptions of the Fund’s operations and various risks, uncertainties, and other effects that could occur as a result of a decision not to continue such relationship. In particular, the Board recognized that most shareholders have invested in the Fund on the strength of the Advisor’s industry standing and reputation and in the expectation that the Advisor will have a continuing role in providing advisory services to the Fund.
Conclusion of the Directors. As a result of this process, the Board, including all of the independent directors and assisted by the advice of independent legal counsel, taking into account all of the factors discussed above and the information provided by the Advisor and others, concluded that the management agreement between the Fund and the Advisor is fair and reasonable in light of the services provided and should be renewed.
Retirement Account Information
As required by law, distributions you receive from certain IRAs are subject to federal income tax withholding, unless you elect not to have withholding apply. Tax will be withheld on the total amount withdrawn even though you may be receiving amounts that are not subject to withholding, such as nondeductible contributions. In such case, excess amounts of withholding could occur. You may adjust your withholding election so that a greater or lesser amount will be withheld.
If you don’t want us to withhold on this amount, you must notify us to not withhold the federal income tax. You may notify us in writing or in certain situations by telephone or through other electronic means. For systematic withdrawals, your withholding election will remain in effect until revoked or changed by filing a new election. You have the right to revoke your election at any time.
Remember, even if you elect not to have income tax withheld, you are liable for paying income tax on the taxable portion of your withdrawal. If you elect not to have income tax withheld or you don’t have enough income tax withheld, you may be responsible for payment of estimated tax. You may incur penalties under the estimated tax rules if your withholding and estimated tax payments are not sufficient. You can reduce or defer the income tax on a distribution by directly or indirectly rolling such distribution over to another IRA or eligible plan. You should consult your tax advisor for additional information.
State tax will be withheld if, at the time of your distribution, your address is within one of the mandatory withholding states and you have federal income tax withheld (or as otherwise required by state law). State taxes will be withheld from your distribution in accordance with the respective state rules.
Distributions you receive from 403(b), 457 and qualified plans are subject to special tax and withholding rules. Your plan administrator or plan sponsor is required to provide you with a special tax notice explaining those rules at the time you request a distribution. If applicable, federal and/or state taxes may be withheld from your distribution amount.
Proxy Voting Guidelines
American Century Investment Management, Inc., the fund’s investment advisor, is responsible for exercising the voting rights associated with the securities purchased and/or held by the fund. A description of the policies and procedures the advisor uses in fulfilling this responsibility is available without charge, upon request, by calling 1-800-345-2021. It is also available on American Century Investments’ website at americancentury.com and on the Securities and Exchange Commission’s website at sec.gov. Information regarding how the investment advisor voted proxies relating to portfolio securities during the most recent 12-month period ended June 30 is available on the “About Us” page at americancentury.com. It is also available at sec.gov.
Quarterly Portfolio Disclosure
The fund files its complete schedule of portfolio holdings with the Securities and Exchange Commission (SEC) for the first and third quarters of each fiscal year on Form N-Q. The fund’s Forms N-Q are available on the SEC’s website at sec.gov, and may be reviewed and copied at the SEC’s Public Reference Room in Washington, DC. Information on the operation of the Public Reference Room may be obtained by calling 1-800-SEC-0330. The fund also makes its complete schedule of portfolio holdings for the most recent quarter of its fiscal year available on its website at americancentury.com and, upon request, by calling 1-800-345-2021.
Other Tax Information
The following information is provided pursuant to provisions of the Internal Revenue Code.
The fund hereby designates up to the maximum amount allowable as qualified dividend income for the fiscal year ended June 30, 2013.
For corporate taxpayers, the fund hereby designates $35,917,578, or up to the maximum amount allowable, of ordinary income distributions paid during the fiscal year ended June 30, 2013 as qualified for the corporate dividends received deduction.
Contact Us | americancentury.com |
Automated Information Line | 1-800-345-8765 |
Investor Services Representative | 1-800-345-2021
or 816-531-5575 |
Investors Using Advisors | 1-800-378-9878 |
Business, Not-For-Profit, Employer-Sponsored Retirement Plans | 1-800-345-3533 |
Banks and Trust Companies, Broker-Dealers, Financial Professionals, Insurance Companies | 1-800-345-6488 |
Telecommunications Device for the Deaf | 1-800-634-4113 |
American Century Quantitative Equity Funds, Inc.
Investment Advisor:
American Century Investment Management, Inc.
Kansas City, Missouri
This report and the statements it contains are submitted for the general information of our shareholders. The report is not authorized for distribution to prospective investors unless preceded or accompanied by an effective prospectus.
©2013 American Century Proprietary Holdings, Inc. All rights reserved.
CL-ANN-79315 1308
ANNUAL REPORT | JUNE 30, 2013 |
International Core Equity Fund
President’s Letter | 2 |
Market Perspective | 3 |
Performance | 4 |
Portfolio Commentary | 6 |
Fund Characteristics | 8 |
Shareholder Fee Example | 9 |
Schedule of Investments | 11 |
Statement of Assets and Liabilities | 14 |
Statement of Operations | 15 |
Statement of Changes in Net Assets | 16 |
Notes to Financial Statements | 17 |
Financial Highlights | 23 |
Report of Independent Registered Public Accounting Firm | 25 |
Management | 26 |
Approval of Management Agreement | 29 |
Additional Information | 34 |
Any opinions expressed in this report reflect those of the author as of the date of the report, and do not necessarily represent the opinions of American Century Investments® or any other person in the American Century Investments organization. Any such opinions are subject to change at any time based upon market or other conditions and American Century Investments disclaims any responsibility to update such opinions. These opinions may not be relied upon as investment advice and, because investment decisions made by American Century Investments funds are based on numerous factors, may not be relied upon as an indication of trading intent on behalf of any American Century Investments fund. Security examples are used for representational purposes only and are not intended as recommendations to purchase or sell securities. Performance information for comparative indices and securities is provided to American Century Investments by third party vendors. To the best of American Century Investments’ knowledge, such information is accurate at the time of printing.
Jonathan Thomas
Dear Investor:
Thank you for reviewing this annual report for the 12 months ended June 30, 2013. It provides investment performance, market analysis, and portfolio information, presented with the expert perspective of our portfolio management team.
Annual reports remain important vehicles for conveying information about fund returns, including key factors that affected fund performance. For additional, updated investment and market insights, we encourage you to visit our website, americancentury.com.
Generally Favorable Fiscal-Year Returns for U.S. Stocks and High-Yield Bonds
The 12-month reporting period began in the summer of 2012 with uncertainties caused by slowing economies, as well as the upcoming November elections and year-end fiscal deadlines in the U.S. It ended with more uncertainty about the future of U.S. monetary stimulus. In between, aggressive monetary intervention by central banks encouraged investors to take more risk, generally boosting stocks at the expense of government bonds.
U.S. mid-cap, small-cap, and value stock indices achieved performance leadership during the period, outpacing the S&P 500 Index’s 20.60% return. U.S. stocks generally outperformed non-U.S. equities—the MSCI EAFE Index returned 18.62% and the MSCI Emerging Markets Index advanced 2.87%, affected by slowing growth in emerging market economies.
Slower emerging market growth also hindered commodity price gains and helped keep inflation under control. As a result, assets used as inflation hedges, including inflation-indexed securities and precious metals, lagged other assets. Gold, in particular, plunged, starting last October. And Treasury inflation-protected securities (TIPS) were among the lowest performers in the U.S. bond market. Bond index returns generally ranged from approximately 10% gains for U.S. corporate high-yield indices all the way down to negative returns for longer-maturity global Treasury benchmarks.
Despite signs of improvement in 2013, U.S. economic growth is subpar compared with past recession recoveries, and remains vulnerable to threats that could trigger another slowdown and market volatility. Therefore, we continue to believe in a disciplined, diversified, long-term investment approach, using professionally managed stock and bond portfolios—as appropriate—for meeting financial goals. We appreciate your continued trust in us in this volatile environment.
Sincerely,
Jonathan Thomas
President and Chief Executive Officer
American Century Investments
By Scott Wittman, Chief Investment Officer, Asset Allocation and Quantitative Equity
Central Bank Action Drove Stocks Higher
Despite a backdrop of generally weak global economic growth and ongoing sovereign debt problems in Europe, most international stock benchmarks rallied during the 12-month period ended June 30, 2013. Investors generally overlooked the lackluster economic data, recession fears (which eventually turned to reality for Europe), and the financial instability of the eurozone. Instead, they focused on the optimism inspired by unprecedented central bank intervention.
The world’s leading central banks—including the European Central Bank (ECB), the U.S. Federal Reserve, and the Bank of Japan—set the tone early on and maintained aggressive stimulus programs throughout the period. The enhanced market liquidity and lower interest rates stemming from these programs, combined with relatively healthy corporate balance sheets, generally kept investor optimism intact, which drove international stock markets higher.
Developed Markets Outperformed
Overall, developed international markets outperformed emerging markets for the 12-month period, even as many emerging economies enjoyed higher absolute levels of growth. Strong stock market performance in Europe and Japan primarily drove the better relative results in the developed markets. The positive reaction to the ECB’s program to purchase the sovereign debt of financially strapped member nations, combined with an interest rate cut from the ECB and a new bailout deal for Greece, helped buoy European markets. In Japan, the late-2012 election of a new reform-minded prime minister, who promised to ease monetary policy, end deflation, and introduce structural overhauls, led to robust stock market returns in Japan, particularly during the second half of the reporting period.
Slowing economic growth and falling commodity prices generally weighed on emerging markets stocks during the period. In particular, poor performance in Latin America dragged down the broad emerging markets benchmark. Brazil was a key detractor, as high inflation (and subsequent rising interest rates), massive government taxation of natural resources, and growing civil unrest triggered double-digit losses for the nation’s stock market. Meanwhile, emerging markets in Asia were among the developing world’s leading performers, while European emerging markets were relatively flat.
International Equity Total Returns |
For the 12 months ended June 30, 2013 (in U.S. dollars) |
MSCI EAFE Index | 18.62% | | MSCI Europe Index | 18.86% |
MSCI EAFE Growth Index | 18.67% | | MSCI World Index | 18.58% |
MSCI EAFE Value Index | 18.56% | | MSCI Japan Index | 22.24% |
MSCI Emerging Markets Index | 2.87% | | |
Total Returns as of June 30, 2013 |
| | | | Average Annual Returns | |
| | Ticker Symbol | 1 year | 5 years | Since Inception | Inception Date |
Investor Class | ACIMX | 20.60% | -1.78% | -0.74% | 11/30/06 |
MSCI EAFE Index | — | 18.62% | -0.63% | -0.17% | — |
Institutional Class | ACIUX | 20.81% | -1.58% | -0.54% | 11/30/06 |
A Class No sales charge* With sales charge* | ACIQX | 20.34% 13.35% | -2.03% -3.17% | -0.98% -1.87% | 11/30/06 |
C Class | ACIKX | 19.40% | -2.75% | -1.72% | 11/30/06 |
R Class | ACIRX | 19.93% | -2.28% | -1.24% | 11/30/06 |
*Sales charges include initial sales charges and contingent deferred sales charges (CDSCs), as applicable. A Class shares have a 5.75% maximum initial sales charge and may be subject to a maximum CDSC of 1.00%. C Class shares redeemed within 12 months of purchase are subject to a maximum CDSC of 1.00%. The SEC requires that mutual funds provide performance information net of maximum sales charges in all cases where charges could be applied.
Data presented reflect past performance. Past performance is no guarantee of future results. Current performance may be higher or lower than the performance shown. Investment return and principal value will fluctuate, and redemption value may be more or less than original cost. To obtain performance data current to the most recent month end, please call 1-800-345-2021 or visit americancentury.com. International investing involves special risks, such as political instability and currency fluctuations. Investing in emerging markets may accentuate these risks. The fund’s investment process may result in high portfolio turnover, which could mean high transaction costs, affecting both performance and capital gains tax liabilities to investors.
Unless otherwise indicated, performance reflects Investor Class shares; performance for other share classes will vary due to differences in fee structure. For information about other share classes available, please consult the prospectus. Data assumes reinvestment of dividends and capital gains, and none of the charts reflect the deduction of taxes that a shareholder would pay on fund distributions or the redemption of fund shares. Returns for the index are provided for comparison. The fund’s total returns include operating expenses (such as transaction costs and management fees) that reduce returns, while the total returns of the index do not.
Growth of $10,000 Over Life of Class |
$10,000 investment made November 30, 2006 |
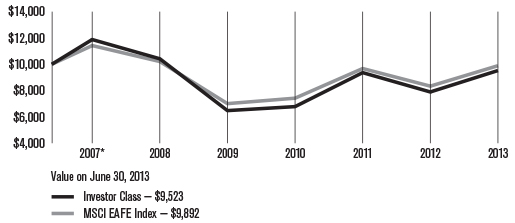
*From 11/30/06, the Investor Class’s inception date. Not annualized.
Total Annual Fund Operating Expenses |
Investor Class | Institutional Class | A Class | C Class | R Class |
1.18% | 0.98% | 1.43% | 2.18% | 1.68% |
The total annual fund operating expenses shown is as stated in the fund’s prospectus current as of the date of this report. The prospectus may vary from the expense ratio shown elsewhere in this report because it is based on a different time period, includes acquired fund fees and expenses, and, if applicable, does not include fee waivers or expense reimbursements.
Data presented reflect past performance. Past performance is no guarantee of future results. Current performance may be higher or lower than the performance shown. Investment return and principal value will fluctuate, and redemption value may be more or less than original cost. To obtain performance data current to the most recent month end, please call 1-800-345-2021 or visit americancentury.com. International investing involves special risks, such as political instability and currency fluctuations. Investing in emerging markets may accentuate these risks. The fund’s investment process may result in high portfolio turnover, which could mean high transaction costs, affecting both performance and capital gains tax liabilities to investors.
Unless otherwise indicated, performance reflects Investor Class shares; performance for other share classes will vary due to differences in fee structure. For information about other share classes available, please consult the prospectus. Data assumes reinvestment of dividends and capital gains, and none of the charts reflect the deduction of taxes that a shareholder would pay on fund distributions or the redemption of fund shares. Returns for the index are provided for comparison. The fund’s total returns include operating expenses (such as transaction costs and management fees) that reduce returns, while the total returns of the index do not.
Portfolio Managers: Elizabeth Xie, Yulin Long, and Vinod Chandrashekaran
Performance Summary
International Core Equity returned 20.60%* for the fiscal year ended June 30, 2013, compared with the 18.62% return of the fund’s benchmark, the MSCI EAFE Index.
In a year of strength for developed equity markets (see page 3 for details), International Core Equity posted a solid gain, outperforming the MSCI EAFE Index. Individual stock selection was the primary factor behind the outperformance relative to the index, particularly in the consumer discretionary sector. From a geographical perspective, holdings in Germany, Hong Kong, and Australia were particularly beneficial, while stock selection in Japan, the U.K., and Italy detracted the most. The fund’s stock selection process incorporates factors of value, quality and momentum, and is designed to minimize unintended risks along industries and other risk characteristics. Stock selection insights based on quality and momentum measures worked best while value insights were more muted during the year.
Absolute Performance Driven by Consumer Discretionary and Financials
International Core Equity’s strong absolute performance was driven primarily by solid advances in the financials and consumer discretionary sectors. Together these sectors represented approximately 35% of the portfolio, and their solid gains significantly impacted the fund’s returns. Within financials, the commercial banking and insurance industries were the main drivers of performance. Winning banking positions included Australia’s Westpac Banking and HSBC Holdings of the U.K. Spain’s Mapfre and Helvetia Holding of Switzerland led insurance providers. The most impactful consumer discretionary names came from hotels, restaurants and leisure as well as media companies. In hotels, restaurants and leisure, Hong Kong casino developer MGM China Holdings was particularly helpful. No sector detracted on an absolute basis from the fund’s total returns.
Consumer Discretionary Outperformed
In addition to being the top absolute performers, the portfolio’s consumer discretionary holdings also posted the best relative results versus the MSCI EAFE Index. Hotels, restaurants and leisure names had the biggest relative impact on performance, with media holdings also helping to add value. A significant contribution in the sector came from overweight exposure to Germany’s ProSiebenSat.1. The broadcaster, which also made a leading absolute contribution to the fund, saw its shares climb after reporting higher-than-expected revenues early in 2013. Hong Kong casino developer MGM China Holdings, another prominent absolute performer, benefited the fund after its shares appreciated 87% during the year on solid revenue and earnings growth. With a 4.7% dividend yield, the stock is particularly attractive to those on the hunt for yield. Elsewhere in the sector, Japan’s Fuji Heavy Industries, manufacturer of Subaru cars, was both the top sector and portfolio contributor.
*All fund returns referenced in this commentary are for Investor Class shares.
Materials Also Top Relative Performers
The fund’s stock selection in the materials sectors also added significantly to returns relative to the MSCI EAFE Index. The sector’s holdings, especially among chemicals, metals and mining, and paper and forest products companies, outperformed their index counterparts helping to drive fund outperformance. In chemicals, no single stock had a major impact on performance, but small positive contributions across a number of positions helped to propel the industry as the top contributor to the sector’s results. Holdings in the metals and mining industry were also beneficial. Here, out-of-benchmark exposure to German copper producer Aurubis was particularly helpful as the company’s shares saw significant gains during the second half of 2012. Likewise, not owning U.K. mining company Anglo American helped as its stock tumbled nearly 40% during the year. Mondi plc, an international paper and packaging company based in the U.K., was also impactful, rising 47% on expectations of higher earnings and improved margins.
Financials and Consumer Staples Lagged
International Core Equity’s holdings in financials, though positive for total returns, underperformed their index counterparts and proved difficult for relative results. The commercial banks and capital markets industries drove the majority of underperformance in the sector, and while no single position was a major detractor, small negative contributions from a number of holdings led performance lower. The biggest negative impact came from not owning several banks that saw substantial gains during the period such as U.K.’s Barclays, which rose 69% during the year despite weak value and quality measures. Not owning Japan’s Mitsubishi UFJ Financial Group and Sumitomo Mitsui Financial Group, as well French banking giant BNP Paribas, also had a negative impact on results.
The fund’s consumer staples holdings were also detrimental. While sector positioning produced slight gains, they were offset by a negative contribution from stock selection, particularly from food and staples retailers. This was particularly pronounced in Japan where several food retail holdings significantly dampened the fund’s performance. Among them, maintaining an overweight to convenience store operator FamilyMart hurt returns as the holding underperformed its industry counterparts. The fund exited this position in early 2013 on weakening quality and momentum signals. An out-of-benchmark position in wholesale food distributor Mitsubishi Shokuhin was similarly detrimental due the stock’s decline.
A Look Ahead
As we move into the second half of 2013, we believe the low-growth environment seen in many international markets is likely to persist. While economic conditions in Japan appear to be improving, Europe’s recovery continues to lag that of the U.S., and we expect international equity market volatility to remain elevated. Heightened levels of volatility often provide investment opportunities, and our disciplined, objective, and systematic investment strategy is designed to take advantage of these opportunities at the individual company level. We believe this approach is the most powerful way to capitalize on market inefficiencies that lead to the mispricing of individual stocks.
JUNE 30, 2013 |
Top Ten Holdings | % of net assets |
HSBC Holdings plc | 2.6% |
Roche Holding AG | 2.5% |
Sanofi | 1.8% |
Commonwealth Bank of Australia | 1.8% |
Nestle SA | 1.7% |
British American Tobacco plc | 1.6% |
Total SA | 1.6% |
Westpac Banking Corp. | 1.5% |
Australia & New Zealand Banking Group Ltd. | 1.4% |
AstraZeneca plc | 1.4% |
| | |
Investments by Country | % of net assets |
Japan | 20.9% |
United Kingdom | 20.2% |
Australia | 8.4% |
France | 8.2% |
Germany | 8.1% |
Switzerland | 7.9% |
Hong Kong | 3.9% |
Italy | 2.8% |
Netherlands | 2.4% |
Spain | 2.3% |
Sweden | 2.1% |
Other Countries | 10.0% |
Exchange-Traded Funds | 1.7% |
Cash and Equivalents* | 1.1% |
*Includes temporary cash investments and other assets and liabilities. | |
| | |
Types of Investments in Portfolio | % of net assets |
Foreign Common Stocks | 97.2% |
Exchange-Traded Funds | 1.7% |
Total Equity Exposure | 98.9% |
Temporary Cash Investments | 1.0% |
Other Assets and Liabilities | 0.1% |
Fund shareholders may incur two types of costs: (1) transaction costs, including sales charges (loads) on purchase payments and redemption/exchange fees; and (2) ongoing costs, including management fees; distribution and service (12b-1) fees; and other fund expenses. This example is intended to help you understand your ongoing costs (in dollars) of investing in your fund and to compare these costs with the ongoing cost of investing in other mutual funds.
The example is based on an investment of $1,000 made at the beginning of the period and held for the entire period from January 1, 2013 to June 30, 2013.
Actual Expenses
The table provides information about actual account values and actual expenses for each class. You may use the information, together with the amount you invested, to estimate the expenses that you paid over the period. First, identify the share class you own. Then simply divide your account value by $1,000 (for example, an $8,600 account value divided by $1,000 = 8.6), then multiply the result by the number under the heading “Expenses Paid During Period” to estimate the expenses you paid on your account during this period.
If you hold Investor Class shares of any American Century Investments fund, or Institutional Class shares of the American Century Diversified Bond Fund, in an American Century Investments account (i.e., not a financial intermediary or retirement plan account), American Century Investments may charge you a $12.50 semiannual account maintenance fee if the value of those shares is less than $10,000. We will redeem shares automatically in one of your accounts to pay the $12.50 fee. In determining your total eligible investment amount, we will include your investments in all personal accounts (including American Century Investments Brokerage accounts) registered under your Social Security number. Personal accounts include individual accounts, joint accounts, UGMA/UTMA accounts, personal trusts, Coverdell Education Savings Accounts and IRAs (including traditional, Roth, Rollover, SEP-, SARSEP- and SIMPLE-IRAs), and certain other retirement accounts. If you have only business, business retirement, employer-sponsored or American Century Investments Brokerage accounts, you are currently not subject to this fee. If you are subject to the Account Maintenance Fee, your account value could be reduced by the fee amount.
Hypothetical Example for Comparison Purposes
The table also provides information about hypothetical account values and hypothetical expenses based on the actual expense ratio of each class of your fund and an assumed rate of return of 5% per year before expenses, which is not the actual return of a fund’s share class. The hypothetical account values and expenses may not be used to estimate the actual ending account balance or expenses you paid for the period. You may use this information to compare the ongoing costs of investing in your fund and other funds. To do so, compare this 5% hypothetical example with the 5% hypothetical examples that appear in the shareholder reports of the other funds.
Please note that the expenses shown in the table are meant to highlight your ongoing costs only and do not reflect any transactional costs, such as sales charges (loads) or redemption/exchange fees. Therefore, the table is useful in comparing ongoing costs only, and will not help you determine the relative total costs of owning different funds. In addition, if these transactional costs were included, your costs would have been higher.| | | | | |
| | Beginning
Account Value 1/1/13 | Ending
Account Value 6/30/13 | Expenses Paid During Period(1) 1/1/13 - 6/30/13 | Annualized
Expense Ratio(1) |
Actual |
Investor Class | $1,000 | $1,057.10 | $5.92 | 1.16% |
Institutional Class | $1,000 | $1,057.10 | $4.90 | 0.96% |
A Class | $1,000 | $1,055.80 | $7.19 | 1.41% |
C Class | $1,000 | $1,051.80 | $10.99 | 2.16% |
R Class | $1,000 | $1,053.10 | $8.45 | 1.66% |
Hypothetical |
Investor Class | $1,000 | $1,019.04 | $5.81 | 1.16% |
Institutional Class | $1,000 | $1,020.03 | $4.81 | 0.96% |
A Class | $1,000 | $1,017.80 | $7.05 | 1.41% |
C Class | $1,000 | $1,014.08 | $10.79 | 2.16% |
R Class | $1,000 | $1,016.56 | $8.30 | 1.66% |
(1) | Expenses are equal to the class’s annualized expense ratio listed in the table above, multiplied by the average account value over the period, multiplied by 181, the number of days in the most recent fiscal half-year, divided by 365, to reflect the one-half year period. |
JUNE 30, 2013
| | | | | | | |
| | | Shares | | | Value | |
Common Stocks — 97.2% | |
AUSTRALIA — 8.4% | |
Australia & New Zealand Banking Group Ltd. | | 4,341 | | | $113,464 | |
Bendigo and Adelaide Bank Ltd. | | 1,324 | | | 12,193 | |
BlueScope Steel Ltd.(1) | | 9,147 | | | 39,066 | |
Commonwealth Bank of Australia | | 2,204 | | | 139,444 | |
National Australia Bank Ltd. | | 3,938 | | | 106,893 | |
Resolute Mining Ltd. | | 5,422 | | | 2,975 | |
Seven Group Holdings Ltd. | | 2,254 | | | 14,224 | |
Telstra Corp. Ltd. | | 19,208 | | | 83,793 | |
Westpac Banking Corp. | | 4,344 | | | 114,735 | |
Woolworths Ltd. | | 1,032 | | | 30,967 | |
| | | | | | 657,754 | |
AUSTRIA — 0.8% | |
Oesterreichische Post AG | | 1,679 | | | 65,564 | |
BELGIUM — 1.4% | |
Ageas | | 1,071 | | | 37,605 | |
Delhaize Group SA | | 823 | | | 50,874 | |
KBC Groep NV | | 460 | | | 17,127 | |
| | | | | | 105,606 | |
DENMARK — 0.7% | |
Coloplast A/S B Shares | | 1,022 | | | 57,306 | |
FINLAND — 0.9% | |
Kone Oyj | | 162 | | | 12,873 | |
Nokia Oyj(1) | | 9,245 | | | 34,248 | |
UPM-Kymmene Oyj | | 2,268 | | | 22,230 | |
| | | | | | 69,351 | |
FRANCE — 8.2% | |
AXA SA | | 496 | | | 9,746 | |
Bouygues SA | | 3,111 | | | 79,409 | |
Cie Generale des Etablissements Michelin Class B | | 84 | | | 7,512 | |
CNP Assurances | | 1,153 | | | 16,546 | |
GDF Suez | | 3,903 | | | 76,434 | |
Sanofi | | 1,383 | | | 143,330 | |
Technicolor SA(1) | | 8,464 | | | 33,713 | |
Thales SA | | 333 | | | 15,550 | |
Total SA | | 2,570 | | | 125,463 | |
UbiSoft Entertainment SA(1) | | 6,407 | | | 83,897 | |
Vinci SA | | 740 | | | 37,137 | |
Vivendi SA | | 885 | | | 16,761 | |
| | | | | | 645,498 | |
GERMANY — 8.1% | |
Allianz SE | | 403 | | | $58,883 | |
BASF SE | | 1,164 | | | 103,983 | |
Bayer AG | | 938 | | | 100,032 | |
Deutsche Lufthansa AG(1) | | 3,555 | | | 72,164 | |
Deutsche Telekom AG | | 3,201 | | | 37,349 | |
Gildemeister AG | | 1,531 | | | 34,147 | |
Kabel Deutschland Holding AG | | 258 | | | 28,337 | |
Metro AG | | 351 | | | 11,111 | |
Muenchener Rueckversicherungs AG | | 249 | | | 45,829 | |
ProSiebenSat.1 Media AG Preference Shares | | 2,132 | | | 91,634 | |
SAP AG | | 299 | | | 21,896 | |
Siemens AG | | 263 | | | 26,582 | |
| | | | | | 631,947 | |
HONG KONG — 3.9% | |
BOC Hong Kong Holdings Ltd. | | 22,500 | | | 69,188 | |
Galaxy Entertainment Group Ltd.(1) | | 7,000 | | | 34,296 | |
Hopewell Holdings Ltd. | | 8,000 | | | 26,663 | |
MGM China Holdings Ltd. | | 30,800 | | | 82,202 | |
SJM Holdings Ltd. | | 7,000 | | | 17,021 | |
Wharf Holdings Ltd. | | 9,000 | | | 75,657 | |
| | | | | | 305,027 | |
IRELAND — 0.8% | |
Smurfit Kappa Group plc | | 3,638 | | | 60,755 | |
ISRAEL — 1.4% | |
Bank Hapoalim BM(1) | | 9,478 | | | 42,626 | |
Delek Group Ltd. | | 163 | | | 42,304 | |
Israel Chemicals Ltd. | | 2,421 | | | 23,853 | |
| | | | | | 108,783 | |
ITALY — 2.8% | |
Enel SpA | | 23,400 | | | 73,405 | |
ENI SpA | | 4,929 | | | 101,242 | |
Mediaset SpA(1) | | 8,219 | | | 31,025 | |
Prysmian SpA | | 916 | | | 17,110 | |
| | | | | | 222,782 | |
JAPAN — 20.9% | |
Aisin Seiki Co. Ltd. | | 800 | | | 30,611 | |
Alfresa Holdings Corp. | | 1,100 | | | 58,893 | |
Astellas Pharma, Inc. | | 200 | | | 10,869 | |
Bridgestone Corp. | | 2,600 | | | 88,607 | |
Central Japan Railway Co. | | 800 | | | 97,842 | |
Daihatsu Motor Co. Ltd. | | 1,000 | | | 18,955 | |
Daiwa House Industry Co. Ltd. | | 1,000 | | | $18,663 | |
East Japan Railway Co. | | 100 | | | 7,774 | |
Fuji Heavy Industries Ltd. | | 4,000 | | | 98,609 | |
GMO Internet, Inc. | | 800 | | | 7,663 | |
Hino Motors Ltd. | | 4,000 | | | 58,721 | |
Ito En Ltd. | | 300 | | | 6,945 | |
Japan Airlines Co. Ltd. | | 600 | | | 30,853 | |
Japan Tobacco, Inc. | | 2,700 | | | 95,417 | |
Kao Corp. | | 2,400 | | | 81,670 | |
KDDI Corp. | | 800 | | | 41,621 | |
Kirin Holdings Co. Ltd. | | 1,000 | | | 15,668 | |
Lawson, Inc. | | 100 | | | 7,633 | |
Matsumotokiyoshi Holdings Co. Ltd. | | 700 | | | 20,228 | |
Mitsui Engineering & Shipbuilding Co. Ltd. | | 28,000 | | | 40,936 | |
MS&AD Insurance Group Holdings | | 1,500 | | | 38,143 | |
Nippon Paint Co. Ltd. | | 4,000 | | | 48,235 | |
Nippon Telegraph & Telephone Corp. | | 600 | | | 31,095 | |
NTT Data Corp. | | 15 | | | 53,237 | |
Panasonic Corp.(1) | | 1,100 | | | 8,839 | |
Resona Holdings, Inc. | | 4,500 | | | 21,915 | |
Resorttrust, Inc. | | 1,000 | | | 31,508 | |
Seven & I Holdings Co. Ltd. | | 600 | | | 21,930 | |
Shionogi & Co. Ltd. | | 400 | | | 8,348 | |
SOFTBANK Corp. | | 1,700 | | | 99,244 | |
Sony Corp. | | 3,100 | | | 64,951 | |
Sumitomo Mitsui Trust Holdings, Inc. | | 12,000 | | | 56,019 | |
T&D Holdings, Inc. | | 1,800 | | | 24,210 | |
Takeda Pharmaceutical Co., Ltd. | | 1,900 | | | 85,824 | |
Tokai Rika Co. Ltd. | | 1,200 | | | 23,956 | |
Toshiba TEC Corp. | | 7,000 | | | 37,760 | |
Toyota Motor Corp. | | 800 | | | 48,316 | |
TS Tech Co. Ltd. | | 1,600 | | | 50,817 | |
Yokohama Rubber Co. Ltd. (The) | | 4,000 | | | 40,210 | |
| | | | | | 1,632,735 | |
NETHERLANDS — 2.4% | |
ING Groep NV CVA(1) | | 9,248 | | | 84,263 | |
Koninklijke Ahold NV | | 5,545 | | | 82,534 | |
Unilever CVA | | 429 | | | 16,895 | |
| | | | | | 183,692 | |
NEW ZEALAND — 0.4% | |
Telecom Corp. of New Zealand Ltd. | | 19,683 | | | 34,320 | |
NORWAY — 1.7% | |
Statoil ASA | | 761 | | | 15,698 | |
TGS Nopec Geophysical Co. ASA | | 1,878 | | | 54,568 | |
Yara International ASA | | 1,561 | | | 62,241 | |
| | | | | | 132,507 | |
PORTUGAL — 0.3% | |
EDP - Energias de Portugal SA | | 7,635 | | | 24,597 | |
SINGAPORE — 1.6% | |
ComfortDelGro Corp. Ltd. | | 13,000 | | | 18,821 | |
Oversea-Chinese Banking Corp. Ltd. | | 2,000 | | | 15,779 | |
StarHub Ltd. | | 12,000 | | | 39,574 | |
United Overseas Bank Ltd. | | 3,000 | | | 47,006 | |
| | | | | | 121,180 | |
SPAIN — 2.3% | |
ACS Actividades de Construccion y Servicios SA | | 1,214 | | | 32,157 | |
Banco Santander SA | | 12,023 | | | 76,715 | |
Endesa SA | | 3,196 | | | 68,267 | |
| | | | | | 177,139 | |
SWEDEN — 2.1% | |
Axfood AB | | 1,275 | | | 53,349 | |
Industrivarden AB C Shares | | 2,470 | | | 41,252 | |
Intrum Justitia AB | | 1,768 | | | 36,250 | |
Telefonaktiebolaget LM Ericsson B Shares | | 3,197 | | | 36,208 | |
| | | | | | 167,059 | |
SWITZERLAND — 7.9% | |
Helvetia Holding AG | | 36 | | | 14,540 | |
Implenia AG | | 168 | | | 8,377 | |
Inficon Holding AG | | 65 | | | 19,286 | |
Nestle SA | | 2,003 | | | 131,370 | |
Novartis AG | | 949 | | | 67,416 | |
OC Oerlikon Corp. AG | | 671 | | | 7,956 | |
Roche Holding AG | | 797 | | | 198,290 | |
Swiss Life Holding AG | | 31 | | | 5,041 | |
Swiss Reinsurance Co. | | 1,097 | | | 81,647 | |
Zurich Financial Services AG | | 338 | | | 87,672 | |
| | | | | | 621,595 | |
UNITED KINGDOM — 20.2% | |
Afren plc(1) | | 32,422 | | | 63,859 | |
Antofagasta plc | | 2,379 | | | 28,766 | |
AstraZeneca plc | | 2,327 | | | 110,248 | |
BAE Systems plc | | 15,185 | | | $88,456 | |
Berendsen plc | | 1,428 | | | 16,170 | |
BHP Billiton plc | | 1,792 | | | 45,844 | |
Bodycote plc | | 3,600 | | | 28,691 | |
BP plc | | 2,208 | | | 15,288 | |
British American Tobacco plc | | 2,490 | | | 127,533 | |
British Sky Broadcasting Group plc | | 6,183 | | | 74,480 | |
Britvic plc | | 2,665 | | | 20,794 | |
BT Group plc | | 14,518 | | | 68,275 | |
Catlin Group Ltd. | | 9,033 | | | 68,584 | |
Centrica plc | | 6,527 | | | 35,758 | |
Evraz plc | | 18,435 | | | 27,085 | |
HSBC Holdings plc | | 19,644 | | | 203,765 | |
Investec plc | | 2,952 | | | 18,574 | |
Lloyds Banking Group plc(1) | | 17,414 | | | 16,728 | |
Micro Focus International plc | | 4,186 | | | 45,204 | |
Mondi plc | | 6,011 | | | 74,785 | |
Next plc | | 302 | | | 20,936 | |
Royal Dutch Shell plc B Shares | | 3,289 | | | 108,852 | |
Soco International plc(1) | | 4,060 | | | 21,569 | |
Standard Chartered plc | | 3,351 | | | 72,730 | |
Standard Life plc | | 7,688 | | | 40,423 | |
Thomas Cook Group plc(1) | | 10,095 | | | 19,853 | |
TUI Travel plc | | 5,937 | | | 32,228 | |
Unilever plc | | 1,078 | | | 43,646 | |
Vodafone Group plc | | 10,921 | | | 31,202 | |
WH Smith plc | | 1,313 | | | 14,338 | |
| | | | | | 1,584,664 | |
TOTAL COMMON STOCKS (Cost $6,979,390) | | | 7,609,861 | |
Exchange-Traded Funds — 1.7% | |
iShares MSCI Japan
Index Fund | | 3,430 | | | 38,485 | |
iShares MSCI EAFE
Index Fund | | 1,600 | | | 91,808 | |
TOTAL EXCHANGE-TRADED FUNDS (Cost $132,690) | | | 130,293 | |
Temporary Cash Investments — 1.0% | |
Repurchase Agreement, Bank of America Merrill Lynch, (collateralized by various U.S. Treasury obligations, 1.00%, 1/15/14, valued at $10,498), in a joint trading account at 0.06%, dated 6/28/13, due 7/1/13 (Delivery value $10,283) | | | 10,283 | |
Repurchase Agreement, Credit Suisse First Boston, Inc., (collateralized by various U.S. Treasury obligations, 4.25%, 11/15/40, valued at $31,433), in a joint trading account at 0.05%, dated 6/28/13, due 7/1/13 (Delivery value $30,850) | | | 30,850 | |
Repurchase Agreement, Goldman Sachs & Co., (collateralized by various U.S. Treasury obligations, 3.125%, 11/15/41, valued at $10,460), in a joint trading account at 0.04%, dated 6/28/13, due 7/1/13 (Delivery value $10,283) | | | 10,283 | |
SSgA U.S. Government Money Market Fund | | 28,387 | | | 28,387 | |
TOTAL TEMPORARY CASH INVESTMENTS (Cost $79,803) | | | 79,803 | |
TOTAL INVESTMENT SECURITIES — 99.9% (Cost $7,191,883) | | | 7,819,957 | |
OTHER ASSETS AND LIABILITIES — 0.1% | | | 9,469 | |
TOTAL NET ASSETS — 100.0% | | | $7,829,426 | |
Market Sector Diversification | |
(as a % of net assets) | |
Financials | | 24.2 | % |
Consumer Discretionary | | 12.8 | % |
Industrials | | 11.7 | % |
Health Care | | 10.7 | % |
Consumer Staples | | 10.6 | % |
Materials | | 6.8 | % |
Energy | | 6.5 | % |
Telecommunication Services | | 6.0 | % |
Information Technology | | 4.3 | % |
Utilities | | 3.6 | % |
Exchange-Traded Funds | | 1.7 | % |
Cash and Equivalents* | | 1.1 | % |
*Includes temporary cash investments and other assets and liabilities.
Notes to Schedule of Investments
CVA = Certificaten Van Aandelen
See Notes to Financial Statements.
Statement of Assets and Liabilities |
JUNE 30, 2013 | |
Assets | |
Investment securities, at value (cost of $7,191,883) | | $7,819,957 | |
Foreign currency holdings, at value (cost of $16,943) | | 16,775 | |
Receivable for capital shares sold | | 29,459 | |
Dividends and interest receivable | | 25,830 | |
| | | 7,892,021 | |
| | | | |
Liabilities | |
Payable for investments purchased | | 48,154 | |
Payable for capital shares redeemed | | 5,502 | |
Accrued management fees | | 7,306 | |
Distribution and service fees payable | | 1,633 | |
| | | 62,595 | |
| | | | |
Net Assets | | $7,829,426 | |
| | | | |
| | | | |
Net Assets Consist of: | |
Capital (par value and paid-in surplus) | | $10,343,326 | |
Undistributed net investment income | | 119,171 | |
Accumulated net realized loss | | (3,259,829 | ) |
Net unrealized appreciation | | 626,758 | |
| | | $7,829,426 | |
| | | | |
| | Net assets | Shares outstanding | Net asset value per share |
Investor Class, $0.01 Par Value | $3,233,057 | 416,168 | $7.77 |
Institutional Class, $0.01 Par Value | $503,865 | 64,771 | $7.78 |
A Class, $0.01 Par Value | $2,162,389 | 278,726 | $7.76* |
C Class, $0.01 Par Value | $973,694 | 126,149 | $7.72 |
R Class, $0.01 Par Value | $956,421 | 123,526 | $7.74 |
*Maximum offering price $8.23 (net asset value divided by 0.9425).
See Notes to Financial Statements.
YEAR ENDED JUNE 30, 2013 | |
Investment Income (Loss) | |
Income: | | | |
Dividends (net of foreign taxes withheld of $18,456) | | $268,916 | |
Interest | | 53 | |
| | | 268,969 | |
| | | | |
Expenses: | | | |
Management fees | | 76,165 | |
Distribution and service fees: | | | |
A Class | | 5,126 | |
C Class | | 8,162 | |
R Class | | 4,516 | |
Directors’ fees and expenses | | 506 | |
Other expenses | | 57 | |
| | | 94,532 | |
| | | | |
Net investment income (loss) | | 174,437 | |
| | | | |
Realized and Unrealized Gain (Loss) | |
Net realized gain (loss) on: | | | |
Investment transactions | | 467,192 | |
Foreign currency transactions | | (1,560 | ) |
| | | 465,632 | |
| | | | |
Change in net unrealized appreciation (depreciation) on: | | | |
Investments | | 503,298 | |
Translation of assets and liabilities in foreign currencies | | (1,133 | ) |
| | | 502,165 | |
| | | | |
Net realized and unrealized gain (loss) | | 967,797 | |
| | | | |
Net Increase (Decrease) in Net Assets Resulting from Operations | | $1,142,234 | |
See Notes to Financial Statements.
Statement of Changes in Net Assets |
YEARS ENDED JUNE 30, 2013 AND JUNE 30, 2012 | |
Increase (Decrease) in Net Assets | | June 30, 2013 | | | June 30, 2012 | |
Operations | |
Net investment income (loss) | | $174,437 | | | $168,410 | |
Net realized gain (loss) | | 465,632 | | | (876,436 | ) |
Change in net unrealized appreciation (depreciation) | | 502,165 | | | (642,331 | ) |
Net increase (decrease) in net assets resulting from operations | | 1,142,234 | | | (1,350,357 | ) |
| | | | | | | |
Distributions to Shareholders | |
From net investment income: | | | | | | |
Investor Class | | (67,431 | ) | | (95,745 | ) |
Institutional Class | | (16,249 | ) | | (9,630 | ) |
A Class | | (65,085 | ) | | (35,410 | ) |
C Class | | (18,335 | ) | | (9,514 | ) |
R Class | | (24,988 | ) | | (13,100 | ) |
Decrease in net assets from distributions | | (192,088 | ) | | (163,399 | ) |
| | | | | | | |
Capital Share Transactions | |
Net increase (decrease) in net assets from capital share transactions | | 1,205,213 | | | (584,115 | ) |
| | | | | | | |
Redemption Fees | |
Increase in net assets from redemption fees | | 257 | | | 3,364 | |
| | | | | | | |
Net increase (decrease) in net assets | | 2,155,616 | | | (2,094,507 | ) |
| | | | | | | |
Net Assets | |
Beginning of period | | 5,673,810 | | | 7,768,317 | |
End of period | | $7,829,426 | | | $5,673,810 | |
| | | | | | | |
Undistributed net investment income | | $119,171 | | | $134,462 | |
See Notes to Financial Statements.
Notes to Financial Statements |
JUNE 30, 2013
1. Organization
American Century Quantitative Equity Funds, Inc. (the corporation) is registered under the Investment Company Act of 1940, as amended (the 1940 Act), as an open-end management investment company and is organized as a Maryland corporation. International Core Equity Fund (the fund) is one fund in a series issued by the corporation. The fund is diversified as defined under the 1940 Act. The fund’s investment objective is to seek long-term capital growth.
The fund offers the Investor Class, the Institutional Class, the A Class, the C Class and the R Class. The A Class may incur an initial sales charge. The A Class and C Class may be subject to a contingent deferred sales charge. The share classes differ principally in their respective sales charges and distribution and shareholder servicing expenses and arrangements. The Institutional Class is made available to institutional shareholders or through financial intermediaries whose clients do not require the same level of shareholder and administrative services as shareholders of other classes. As a result, the Institutional Class is charged a lower unified management fee. On October 21, 2011, all outstanding B Class shares were converted to A Class shares and the fund discontinued offering the B Class.
2. Significant Accounting Policies
The following is a summary of significant accounting policies consistently followed by the fund in preparation of its financial statements. The financial statements are prepared in conformity with accounting principles generally accepted in the United States of America, which may require management to make certain estimates and assumptions at the date of the financial statements. Actual results could differ from these estimates.
Investment Valuations — The fund determines the fair value of its investments and computes its net asset value per share as of the close of regular trading (usually 4 p.m. Eastern time) on the New York Stock Exchange (NYSE) on each day the NYSE is open.
Equity securities that are listed or traded on a domestic securities exchange are valued at the last reported sales price or at the official closing price as provided by the exchange. Equity securities traded on foreign securities exchanges are typically valued at the closing price on the exchange where primarily traded or as of the close of the NYSE, if that is earlier. If no last sales price is reported, or if local convention or regulation so provides, the mean of the latest bid and asked prices is used. Depending on local convention or regulation, securities traded over-the-counter are valued at the mean of the latest bid and asked prices, the last sales price, or the official closing price. In its determination of fair value, the fund may review several factors including: market information specific to a security; news developments in U.S. and foreign markets; the performance of particular U.S. and foreign securities, indices, comparable securities, American Depositary Receipts, Exchange-Traded Funds, and other relevant market indicators.
Debt securities maturing within 60 days at the time of purchase may be valued at cost, plus or minus any amortized discount or premium or at the evaluated mean as provided by an independent pricing service. Evaluated mean prices are commonly derived through utilization of market models, which may consider, among other factors, trade data, quotations from dealers and active market makers, relevant yield curve and spread data, related sector levels, creditworthiness, and other relevant market information on the same or comparable securities.
Investments in open-end management investment companies are valued at the reported net asset value per share. Repurchase agreements are valued at cost.
The value of investments initially expressed in foreign currencies is translated into U.S. dollars at prevailing exchange rates.
If the fund determines that the market price for a portfolio security is not readily available or the valuation methods mentioned above do not reflect a security’s fair value, such security is valued as determined in good faith by the Board of Directors or its designee, in
accordance with procedures adopted by the Board of Directors. Circumstances that may cause the fund to use these procedures to value a security include, but are not limited to: a security has been declared in default; trading in a security has been halted during the trading day; there is a foreign market holiday and no trading occurred; or an event occurred between the close of a foreign exchange and the NYSE that may affect the value of a security.
Security Transactions — Security transactions are accounted for as of the trade date. Net realized gains and losses are determined on the identified cost basis, which is also used for federal income tax purposes.
Investment Income — Dividend income less foreign taxes withheld, if any, is recorded as of the ex-dividend date. Distributions received on securities that represent a return of capital or long-term capital gain are recorded as a reduction of cost of investments and/or as a realized gain. The fund may estimate the components of distributions received that may be considered nontaxable distributions or long-term capital gain distributions for income tax purposes. Interest income is recorded on the accrual basis and includes accretion of discounts and amortization of premiums.
Foreign Currency Translations — All assets and liabilities initially expressed in foreign currencies are translated into U.S. dollars at prevailing exchange rates at period end. The fund may enter into spot foreign currency exchange contracts to facilitate transactions denominated in a foreign currency. Purchases and sales of investment securities, dividend and interest income, spot foreign currency exchange contracts, and expenses are translated at the rates of exchange prevailing on the respective dates of such transactions. Net realized and unrealized foreign currency exchange gains or losses related to investment securities are a component of net realized gain (loss) on investment transactions and change in net unrealized appreciation (depreciation) on investments, respectively.
Repurchase Agreements — The fund may enter into repurchase agreements with institutions that American Century Investment Management, Inc. (ACIM) (the investment advisor) has determined are creditworthy pursuant to criteria adopted by the Board of Directors. The fund requires that the collateral, represented by securities, received in a repurchase transaction be transferred to the custodian in a manner sufficient to enable the fund to obtain those securities in the event of a default under the repurchase agreement. ACIM monitors, on a daily basis, the securities transferred to ensure the value, including accrued interest, of the securities under each repurchase agreement is equal to or greater than amounts owed to the fund under each repurchase agreement.
Joint Trading Account — Pursuant to an Exemptive Order issued by the Securities and Exchange Commission, the fund, along with certain other funds in the American Century Investments family of funds, may transfer uninvested cash balances into a joint trading account. These balances are invested in one or more repurchase agreements that are collateralized by U.S. Treasury or Agency obligations.
Income Tax Status — It is the fund’s policy to distribute substantially all net investment income and net realized gains to shareholders and to otherwise qualify as a regulated investment company under provisions of the Internal Revenue Code. Accordingly, no provision has been made for income taxes. The fund files U.S. federal, state, local and non-U.S. tax returns as applicable. The fund’s tax returns are subject to examination by the relevant taxing authority until expiration of the applicable statute of limitations, which is generally three years from the date of filing but can be longer in certain jurisdictions. At this time, management believes there are no uncertain tax positions which, based on their technical merit, would not be sustained upon examination and for which it is reasonably possible that the total amounts of unrecognized tax benefits will significantly change in the next twelve months.
Multiple Class — All shares of the fund represent an equal pro rata interest in the net assets of the class to which such shares belong, and have identical voting, dividend, liquidation and other rights and the same terms and conditions, except for class specific expenses and exclusive rights to vote on matters affecting only individual classes. Income, non-class specific expenses, and realized and unrealized capital gains and losses of the fund are allocated to each class of shares based on their relative net assets.
Distributions to Shareholders — Distributions from net investment income and net realized gains, if any, are generally declared and paid annually.
Redemption — The fund may impose a 2.00% redemption fee on shares held less than 60 days. The fee may not be applicable to all classes. The redemption fee is retained by the fund and helps cover transaction costs that long-term investors may bear when the fund sells securities to meet investor redemptions.
Indemnifications — Under the corporation’s organizational documents, its officers and directors are indemnified against certain liabilities arising out of the performance of their duties to the fund. In addition, in the normal course of business, the fund enters into contracts that provide general indemnifications. The maximum exposure under these arrangements is unknown as this would involve future claims that may be made against a fund. The risk of material loss from such claims is considered by management to be remote.
3. Fees and Transactions with Related Parties
Management Fees — The corporation has entered into a management agreement with ACIM, under which ACIM provides the fund with investment advisory and management services in exchange for a single, unified management fee (the fee) per class. The agreement provides that all expenses of managing and operating the fund, except distribution and service fees, brokerage expenses, taxes, interest, fees and expenses of the independent directors (including legal counsel fees), and extraordinary expenses, will be paid by ACIM. The fee is computed and accrued daily based on each class’s daily net assets and paid monthly in arrears. The fee consists of (1) an Investment Category Fee based on the daily net assets of the fund and certain other accounts managed by the investment advisor that are in the same broad investment category as the fund and (2) a Complex Fee based on the assets of all the funds in the American Century Investments family of funds. The rates for the Investment Category Fee range from 0.8180% to 1.0000%. The rates for the Complex Fee range from 0.2500% to 0.3100% for the Investor Class, A Class, C Class and R Class. The Institutional Class is 0.2000% less at each point within the Complex Fee range. The effective annual management fee for each class for the year ended June 30, 2013 was 1.15% for the Investor Class, A Class, C Class and R Class and 0.95% for the Institutional Class.
Distribution and Service Fees — The Board of Directors has adopted a separate Master Distribution and Individual Shareholder Services Plan for each of the A Class, C Class and R Class (collectively the plans), pursuant to Rule 12b-1 of the 1940 Act. The plans provide that the A Class will pay American Century Investment Services, Inc. (ACIS) an annual distribution and service fee of 0.25%. The plans provide that the C Class will pay ACIS an annual distribution and service fee of 1.00%, of which 0.25% is paid for individual shareholder services and 0.75% is paid for distribution services. The plans provide that the R Class will pay ACIS an annual distribution and service fee of 0.50%. The fees are computed and accrued daily based on each class’s daily net assets and paid monthly in arrears. The fees are used to pay financial intermediaries for distribution and individual shareholder services. Fees incurred under the plans during the year ended June 30, 2013 are detailed in the Statement of Operations.
Related Parties — Certain officers and directors of the corporation are also officers and/or directors of American Century Companies, Inc. (ACC). The corporation’s investment advisor, ACIM, the corporation’s distributor, ACIS, and the corporation’s transfer agent, American Century Services, LLC are wholly owned, directly or indirectly, by ACC. ACIM owns 44% of the outstanding shares of the fund. Related parties do not invest in the fund for the purpose of exercising management or control.
4. Investment Transactions
Purchases and sales of investment securities, excluding short-term investments, for the year ended June 30, 2013 were $7,847,889 and $6,693,433, respectively.
5. Capital Share Transactions
Transactions in shares of the fund were as follows:
| | | | | | | |
| | | Year ended June 30, 2013 | | | Year ended June 30, 2012 | |
| | | Shares | | | Amount | | | Shares | | | Amount | |
Investor Class/Shares Authorized | | 50,000,000 | | | | | | 50,000,000 | | | | |
Sold | | 202,052 | | | $1,541,413 | | | 466,379 | | | $3,322,640 | |
Issued in reinvestment of distributions | | 9,208 | | | 66,666 | | | 15,272 | | | 95,603 | |
Redeemed | | (82,972 | ) | | (619,598 | ) | | (534,563 | ) | | (3,643,820 | ) |
| | | 128,288 | | | 988,481 | | | (52,912 | ) | | (225,577 | ) |
Institutional Class/Shares Authorized | | 50,000,000 | | | | | | 50,000,000 | | | | |
Sold | | — | | | — | | | 2,141 | | | 16,749 | |
Issued in reinvestment of distributions | | 2,244 | | | 16,249 | | | 1,538 | | | 9,630 | |
Redeemed | | (258 | ) | | (1,918 | ) | | (78,660 | ) | | (535,315 | ) |
| | | 1,986 | | | 14,331 | | | (74,981 | ) | | (508,936 | ) |
A Class/Shares Authorized | | 10,000,000 | | | | | | 10,000,000 | | | | |
Sold | | 53,752 | | | 405,391 | | | 189,346 | | | 1,307,866 | |
Issued in reinvestment of distributions | | 7,572 | | | 54,819 | | | 5,171 | | | 32,369 | |
Redeemed | | (60,072 | ) | | (447,241 | ) | | (43,221 | ) | | (294,767 | ) |
| | | 1,252 | | | 12,969 | | | 151,296 | | | 1,045,468 | |
B Class/Shares Authorized | | N/A | | | | | | N/A | | | | |
Redeemed | | | | | | | | (116,418 | ) | | (792,308 | ) |
C Class/Shares Authorized | | 10,000,000 | | | | | | 10,000,000 | | | | |
Sold | | 20,494 | | | 163,261 | | | 6,487 | | | 45,414 | |
Issued in reinvestment of distributions | | 2,528 | | | 18,282 | | | 1,491 | | | 9,316 | |
Redeemed | | (2,404 | ) | | (19,042 | ) | | (21,405 | ) | | (142,155 | ) |
| | | 20,618 | | | 162,501 | | | (13,427 | ) | | (87,425 | ) |
R Class/Shares Authorized | | 10,000,000 | | | | | | 10,000,000 | | | | |
Sold | | 300 | | | 2,325 | | | 2,496 | | | 19,245 | |
Issued in reinvestment of distributions | | 3,456 | | | 24,988 | | | 2,096 | | | 13,100 | |
Redeemed | | (55 | ) | | (382 | ) | | (7,306 | ) | | (47,682 | ) |
| | | 3,701 | | | 26,931 | | | (2,714 | ) | | (15,337 | ) |
Net increase (decrease) | | 155,845 | | | $1,205,213 | | | (109,156 | ) | | $(584,115 | ) |
6. Fair Value Measurements
The fund’s securities valuation process is based on several considerations and may use multiple inputs to determine the fair value of the positions held by the fund. In conformity with accounting principles generally accepted in the United States of America, the inputs used to determine a valuation are classified into three broad levels as follows:
• | Level 1 valuation inputs consist of unadjusted quoted prices in an active market for identical securities; |
• | Level 2 valuation inputs consist of direct or indirect observable market data (including quoted prices for similar securities, evaluations of subsequent market events, interest rates, prepayment speeds, credit risk, etc.); or |
• | Level 3 valuation inputs consist of unobservable data (including a fund’s own assumptions). |
The level classification is based on the lowest level input that is significant to the fair valuation measurement. The valuation inputs are not necessarily an indication of the risks associated with investing in these securities or other financial instruments.
The following is a summary of the level classifications as of period end. The Schedule of Investments provides additional information on the fund’s portfolio holdings.
| | | | |
| | Level 1 | Level 2 | Level 3 |
Investment Securities |
Foreign Common Stocks | — | $7,609,861 | — |
Exchange-Traded Funds | $130,293 | — | — |
Temporary Cash Investments | 28,387 | 51,416 | — |
Total Value of Investment Securities | $158,680 | $7,661,277 | — |
7. Risk Factors
There are certain risks involved in investing in foreign securities. These risks include those resulting from future adverse political, social and economic developments, fluctuations in currency exchange rates, the possible imposition of exchange controls, and other foreign laws or restrictions. Investing in emerging markets may accentuate these risks.
The fund’s investment process may result in high portfolio turnover, which could mean high transaction costs, affecting both performance and capital gains tax liabilities to investors.
8. Federal Tax Information
The tax character of distributions paid during the years ended June 30, 2013 and June 30, 2012 were as follows:
| | | |
| | 2013 | 2012 |
Distributions Paid From | | |
Ordinary income | $192,088 | $163,399 |
Long-term capital gains | — | — |
The book-basis character of distributions made during the year from net investment income or net realized gains may differ from their ultimate characterization for federal income tax purposes. These differences reflect the differing character of certain income items and net realized gains and losses for financial statement and tax purposes, and may result in reclassification among certain capital accounts on the financial statements.
As of June 30, 2013, the federal tax cost of investments and the components of distributable earnings on a tax-basis were as follows:
| | |
Federal tax cost of investments | $7,225,358 |
Gross tax appreciation of investments | $913,933 |
Gross tax depreciation of investments | (319,334) |
Net tax appreciation (depreciation) of investments | $594,599 |
Net tax appreciation (depreciation) on translation of assets and liabilities in foreign currencies | $(1,307) |
Net tax appreciation (depreciation) | $593,292 |
Undistributed ordinary income | $119,162 |
Accumulated short-term capital losses | $(3,226,354) |
The difference between book-basis and tax-basis unrealized appreciation (depreciation) is attributable primarily to the tax deferral of losses on wash sales.
Accumulated capital losses represent net capital loss carryovers that may be used to offset future realized capital gains for federal income tax purposes. Any unlimited losses will be required to be utilized prior to the losses which carry an expiration date. Future capital loss carryover utilization in any given year may be subject to Internal Revenue Code limitations. Capital loss carryovers expire as follows:
| | | |
2017 | 2018 | Unlimited |
$(816,093) | $(1,979,923) | $(430,338) |
| |
For a Share Outstanding Throughout the Years Ended June 30 (except as noted) |
Per-Share Data | Ratios and Supplemental Data |
| | | Income From Investment Operations: | | | | Ratio to Average Net Assets of: | | |
| | Net
Asset Value,
Beginning
of Period | Net
Investment Income
(Loss)(1) | Net
Realized and
Unrealized
Gain (Loss) | Total From
Investment
Operations | Distributions
From Net
Investment
Income | Net Asset
Value, End
of Period | Total
Return(2) | Operating
Expenses | Net
Investment
Income
(Loss) | Portfolio
Turnover
Rate | Net Assets,
End of
Period (in
thousands) |
Investor Class |
2013 | $6.66 | 0.22 | 1.13 | 1.35 | (0.24) | $7.77 | 20.60% | 1.16% | 2.85% | 101% | $3,233 |
2012 | $8.08 | 0.15 | (1.43) | (1.28) | (0.14) | $6.66 | (15.68)% | 1.18% | 2.42% | 113% | $1,917 |
2011 | $5.95 | 0.20 | 2.05 | 2.25 | (0.12) | $8.08 | 38.09% | 1.18% | 2.53% | 77% | $2,755 |
2010 | $5.80 | 0.10 | 0.19 | 0.29 | (0.14) | $5.95 | 4.68% | 1.18% | 1.55% | 83% | $1,490 |
2009 | $9.72 | 0.20 | (3.87) | (3.67) | (0.25) | $5.80 | (37.81)% | 1.17% | 3.09% | 131% | $1,704 |
Institutional Class |
2013 | $6.67 | 0.22 | 1.15 | 1.37 | (0.26) | $7.78 | 20.81% | 0.96% | 3.05% | 101% | $504 |
2012 | $8.10 | 0.18 | (1.45) | (1.27) | (0.16) | $6.67 | (15.59)% | 0.98% | 2.62% | 113% | $419 |
2011 | $5.96 | 0.21 | 2.07 | 2.28 | (0.14) | $8.10 | 38.47% | 0.98% | 2.73% | 77% | $1,116 |
2010 | $5.81 | 0.11 | 0.19 | 0.30 | (0.15) | $5.96 | 4.88% | 0.98% | 1.75% | 83% | $653 |
2009 | $9.73 | 0.20 | (3.86) | (3.66) | (0.26) | $5.81 | (37.65)% | 0.97% | 3.29% | 131% | $862 |
A Class |
2013 | $6.65 | 0.19 | 1.15 | 1.34 | (0.23) | $7.76 | 20.34% | 1.41% | 2.60% | 101% | $2,162 |
2012 | $8.07 | 0.18 | (1.47) | (1.29) | (0.13) | $6.65 | (15.92)% | 1.43% | 2.17% | 113% | $1,845 |
2011 | $5.94 | 0.16 | 2.08 | 2.24 | (0.11) | $8.07 | 37.80% | 1.43% | 2.28% | 77% | $1,019 |
2010 | $5.79 | 0.09 | 0.18 | 0.27 | (0.12) | $5.94 | 4.42% | 1.43% | 1.30% | 83% | $730 |
2009 | $9.71 | 0.17 | (3.86) | (3.69) | (0.23) | $5.79 | (38.00)% | 1.42% | 2.84% | 131% | $903 |
| |
For a Share Outstanding Throughout the Years Ended June 30 (except as noted) |
Per-Share Data | Ratios and Supplemental Data |
| | | Income From Investment Operations: | | | | Ratio to Average Net Assets of: | | |
| | Net
Asset Value,
Beginning
of Period | Net
Investment Income
(Loss)(1) | Net
Realized and
Unrealized
Gain (Loss) | Total From
Investment
Operations | Distributions
From Net
Investment
Income | Net Asset
Value, End
of Period | Total
Return(2) | Operating
Expenses | Net
Investment
Income
(Loss) | Portfolio
Turnover
Rate | Net Assets,
End of
Period (in
thousands) |
C Class |
2013 | $6.62 | 0.14 | 1.13 | 1.27 | (0.17) | $7.72 | 19.40% | 2.16% | 1.85% | 101% | $974 |
2012 | $8.04 | 0.11 | (1.45) | (1.34) | (0.08) | $6.62 | (16.62)% | 2.18% | 1.42% | 113% | $698 |
2011 | $5.92 | 0.11 | 2.06 | 2.17 | (0.05) | $8.04 | 36.72% | 2.18% | 1.53% | 77% | $956 |
2010 | $5.77 | 0.04 | 0.18 | 0.22 | (0.07) | $5.92 | 3.64% | 2.18% | 0.55% | 83% | $631 |
2009 | $9.66 | 0.13 | (3.83) | (3.70) | (0.19) | $5.77 | (38.34)% | 2.17% | 2.09% | 131% | $742 |
R Class |
2013 | $6.64 | 0.17 | 1.14 | 1.31 | (0.21) | $7.74 | 19.93% | 1.66% | 2.35% | 101% | $956 |
2012 | $8.06 | 0.14 | (1.45) | (1.31) | (0.11) | $6.64 | (16.15)% | 1.68% | 1.92% | 113% | $795 |
2011 | $5.93 | 0.15 | 2.07 | 2.22 | (0.09) | $8.06 | 37.52% | 1.68% | 2.03% | 77% | $988 |
2010 | $5.78 | 0.08 | 0.17 | 0.25 | (0.10) | $5.93 | 4.16% | 1.68% | 1.05% | 83% | $682 |
2009 | $9.69 | 0.16 | (3.85) | (3.69) | (0.22) | $5.78 | (38.13)% | 1.67% | 2.59% | 131% | $652 |
Notes to Financial Highlights
(1) | Computed using average shares outstanding throughout the period. |
(2) | Total returns are calculated based on the net asset value of the last business day and do not reflect applicable sales charges, if any. Total returns for periods less than one year are not annualized. |
See Notes to Financial Statements.
Report of Independent Registered Public Accounting Firm |
To the Directors of the American Century Quantitative Equity Funds, Inc. and Shareholders of the International Core Equity Fund:
In our opinion, the accompanying statement of assets and liabilities, including the schedule of investments, and the related statements of operations and of changes in net assets and the financial highlights present fairly, in all material respects, the financial position of the International Core Equity Fund (one of the fourteen funds comprising the American Century Quantitative Equity Funds, Inc., hereafter referred to as the “Fund”) at June 30, 2013, the results of its operations for the year then ended, the changes in its net assets for each of the two years in the period then ended and the financial highlights for each of the five years in the period then ended, in conformity with accounting principles generally accepted in the United States of America. These financial statements and financial highlights (hereafter referred to as “financial statements”) are the responsibility of the Fund’s management; our responsibility is to express an opinion on these financial statements based on our audits. We conducted our audits of these financial statements in accordance with the standards of the Public Company Accounting Oversight Board (United States). Those standards require that we plan and perform the audit to obtain reasonable assurance about whether the financial statements are free of material misstatement. An audit includes examining, on a test basis, evidence supporting the amounts and disclosures in the financial statements, assessing the accounting principles used and significant estimates made by management, and evaluating the overall financial statement presentation. We believe that our audits, which included confirmation of securities at June 30, 2013 by correspondence with the custodian, provide a reasonable basis for our opinion.
PricewaterhouseCoopers LLP
Kansas City, Missouri
August 21, 2013
Board of Directors
The individuals listed below serve as directors of the funds. Each director will continue to serve in this capacity until death, retirement, resignation or removal from office. The board has adopted a mandatory retirement age for directors who are not “interested persons,” as that term is defined in the Investment Company Act (independent directors). Independent directors shall retire on December 31 of the year in which they reach their 75th birthday; provided, however, that on or after January 1, 2022, independent directors shall retire on December 31 of the year in which they reach their 76th birthday.
Mr. Thomas is the only director who is an “interested person” because he currently serves as President and Chief Executive Officer of American Century Companies, Inc. (ACC), the parent company of American Century Investment Management, Inc. (ACIM or the advisor).
The other directors (more than three-fourths of the total number) are independent; that is, they have never been employees, directors or officers of, and have no financial interest in, ACC or any of its wholly owned, direct or indirect, subsidiaries, including ACIM, American Century Investment Services, Inc. (ACIS) and American Century Services, LLC (ACS). The directors serve in this capacity for eight (in the case of Mr. Thomas, 15) registered investment companies in the American Century Investments family of funds.
The following table presents additional information about the directors. The mailing address for each director other than Mr. Thomas is 1665 Charleston Road, Mountain View, California 94043. The mailing address for Mr. Thomas is 4500 Main Street, Kansas City, Missouri 64111.
| | | | | | | |
Name
(Year of Birth) | Position(s) Held with Funds | Length
of Time
Served | Principal Occupation(s) During Past 5 Years | | Number of American Century Portfolios Overseen
by Director | Other Directorships Held During Past 5 Years |
Independent Directors |
Tanya S. Beder
(1955) | Director | Since 2011 | Chairman, SBCC Group Inc. (independent advisory services) (2006 to present) | | 41 | CYS Investments, Inc. (specialty finance company) |
Jeremy I. Bulow
(1954) | Director | Since 2011 | Professor of Economics, Stanford University, Graduate School of Business (1979 to present) | | 41 | None |
Ronald J. Gilson
(1946) | Director and Chairman of the Board | Since 1995 | Charles J. Meyers Professor of Law and Business, Stanford Law School (1979 to present); Marc and Eva Stern Professor of Law and Business, Columbia University School of Law (1992 to present) | | 41 | None |
Frederick L. A. Grauer
(1946) | Director | Since 2008 | Senior Advisor, BlackRock, Inc. (investment management firm) (2010 to 2011); Senior Advisor, Barclays Global Investors (investment management firm) (2003 to 2009) | | 41 | None |
| | | | | | | |
Name
(Year of Birth) | Position(s) Held with Funds | Length
of Time
Served | Principal Occupation(s) During Past 5 Years | | Number of American Century Portfolios Overseen
by Director | Other Directorships Held During Past 5 Years |
Independent Directors |
Peter F. Pervere
(1947) | Director | Since 2007 | Retired | | 41 | Intraware, Inc. (2003 to 2009) |
Myron S. Scholes
(1941) | Director | Since 1980 | Chairman, Platinum Grove Asset Management, L.P. (asset manager) (1999 to 2009); Frank E. Buck Professor of Finance-Emeritus, Stanford Graduate School of Business (1996 to present) | | 41 | Dimensional Fund Advisors (investment advisor); CME Group, Inc. (futures and options exchange) |
John B. Shoven
(1947) | Director | Since 2002 | Professor of Economics, Stanford University (1973 to present) | | 41 | Cadence Design Systems; Exponent; Financial Engines |
| |
Interested Director |
Jonathan S. Thomas
(1963) | Director and President | Since 2007 | President and Chief Executive Officer, ACC (March 2007 to present). Also serves as Chief Executive Officer and Manager, ACS; Executive Vice President, ACIM; Director, ACC, ACIM and other ACC subsidiaries | | 106 | None |
Officers
The following table presents certain information about the executive officers of the funds. Each officer serves as an officer for each of the 15 investment companies in the American Century family of funds, unless otherwise noted. No officer is compensated for his or her service as an officer of the funds. The listed officers are interested persons of the funds and are appointed or re-appointed on an annual basis. The mailing address for each of the officers listed below is 4500 Main Street, Kansas City, Missouri 64111.
| | | |
Name
(Year of Birth) | Offices with the Funds | Principal Occupation(s) During the Past Five Years |
Jonathan S. Thomas
(1963) | Director and President since 2007 | President and Chief Executive Officer, ACC (March 2007 to present). Also serves as Chief Executive Officer and Manager, ACS; Executive Vice President, ACIM; Director, ACC, ACIM and other ACC subsidiaries |
Maryanne L. Roepke
(1956) | Chief Compliance Officer since 2006 and Senior Vice President since 2000 | Chief Compliance Officer, American Century funds, ACIM and ACS (August 2006 to present). Also serves as Senior Vice President, ACS |
Charles A. Etherington
(1957) | General Counsel since 2007 and Senior Vice President since 2006 | Attorney, ACC (February 1994 to present); Vice President, ACC (November 2005 to present); General Counsel, ACC (March 2007 to present). Also serves as General Counsel, ACIM, ACS, ACIS and other ACC subsidiaries; and Senior Vice President, ACIM and ACS |
C. Jean Wade
(1964) | Vice President, Treasurer and Chief Financial Officer since 2012 | Vice President, ACS (February 2000 to present) |
Robert J. Leach
(1966) | Vice President since 2006 and Assistant Treasurer since 2012 | Vice President, ACS (February 2000 to present) |
David H. Reinmiller
(1963) | Vice President since 2001 | Attorney, ACC (January 1994 to present); Associate General Counsel, ACC (January 2001 to present). Also serves as Vice President, ACIM and ACS |
Ward D. Stauffer
(1960) | Secretary since 2005 | Attorney, ACC (June 2003 to present) |
The Statement of Additional Information has additional information about the fund’s directors and is available without charge, upon request, by calling 1-800-345-2021.
Approval of Management Agreement |
At a meeting held on June 11, 2013, the Fund’s Board of Directors/Trustees unanimously approved the renewal of the management agreement pursuant to which American Century Investment Management, Inc. (the “Advisor”) acts as the investment advisor for the Fund. Under Section 15(c) of the Investment Company Act, contracts for investment advisory services are required to be reviewed, evaluated, and approved by a majority of a fund’s directors/trustees (the “Directors”), including a majority of the independent Directors each year. The Board regards this annual evaluation and renewal as one of its most important responsibilities.
In connection with their annual review and evaluation, the independent Directors memorialized a statement regarding the relationship between their ongoing obligations to oversee and evaluate the performance of the Advisor and their consideration of renewal of the management agreement. In that statement, the independent Directors noted that their assessment of the Advisor’s performance is an ongoing process that takes place over the entire year and is informed by all of the information that the Board and its committees receive and consider over time. This information, together with the materials provided in connection with the review, are central to the Board’s assessment of the Advisor’s performance and its determination whether to renew the Fund’s management agreement.
Prior to its consideration of the renewal of the management agreement, the Board requested and reviewed extensive data and analysis relating to the proposed renewal. This information and analysis was compiled by the Advisor and certain independent providers of evaluation data concerning the Fund and the services provided to the Fund by the Advisor.
In connection with its consideration of the renewal of the management agreement, the Board’s review and evaluation of the services provided by the Advisor included, but was not limited to, the following:
• | the nature, extent, and quality of investment management, shareholder services, and other services provided by the Advisor to the Fund; |
• | the wide range of other programs and services the Advisor provides to the Fund and its shareholders on a routine and non-routine basis; |
• | the investment performance of the Fund, including data comparing the Fund’s performance to appropriate benchmarks and/or a peer group of other mutual funds with similar investment objectives and strategies; |
• | data comparing the cost of owning the Fund to the cost of owning similar funds; |
• | the Advisor’s compliance policies, procedures, and regulatory experience; |
• | financial data showing the cost of services provided to the Fund, the profitability of the Fund to the Advisor, and the overall profitability of the Advisor; |
• | possible economies of scale associated with the Advisor’s management of the Fund and other accounts under its management; |
• | data comparing services provided and charges to other investment management clients of the Advisor; and |
• | consideration of collateral benefits derived by the Advisor from the management of the Fund. |
In keeping with its practice, the Board held two in-person meetings to review and discuss the information provided. The Board also had the benefit of the advice of its independent counsel throughout the period.
Factors Considered
The Directors considered all of the information provided by the Advisor, the independent data providers, and the Board’s independent counsel in connection with the review, and evaluated such information for the Fund. In connection with their review, the Directors did not identify any single factor as being all-important or controlling and each Director may have attributed different levels of importance to different factors. In deciding to renew the management agreement, the Board based its decision on a number of factors, including the following:
Nature, Extent and Quality of Services - Generally. Under the management agreement, the Advisor is responsible for providing or arranging for all services necessary for the operation of the Fund. The Board noted that under the management agreement, the Advisor provides or arranges at its own expense a wide variety of services including:
• | constructing and designing the Fund |
• | portfolio research and security selection |
• | initial capitalization/funding |
• | daily valuation of the Fund’s portfolio |
• | shareholder servicing and transfer agency, including shareholder confirmations, recordkeeping, and communications |
• | regulatory and portfolio compliance |
• | marketing and distribution |
The Board noted that many of these services have expanded over time both in terms of quantity and complexity in response to shareholder demands, competition in the industry, changing distribution channels, and the changing regulatory environment.
Investment Management Services. The nature of the investment management services provided to the Fund is quite complex and allows Fund shareholders access to professional money management, instant diversification of their investments within an asset class, the opportunity to easily diversify among asset classes by investing in or exchanging among various American Century Investments funds, and liquidity. In evaluating investment performance, the Board expects the Advisor to manage the Fund in accordance with its investment objectives and approved strategies. Further, the Directors recognize that the Advisor has an obligation to seek the best execution of fund trades. In providing these services, the Advisor utilizes teams of investment professionals (portfolio managers, analysts, research assistants, and securities traders) who require extensive information technology, research, training, compliance and other systems to conduct their business. The Board, directly and through its Portfolio Committee, regularly reviews investment performance information for the Fund, together with comparative information for appropriate benchmarks and/or peer groups of similarly-managed funds, over different time horizons. The Directors also review detailed performance information during the management agreement approval process. If performance concerns are identified, the Fund receives special reviews until performance improves, during which the Board discusses with the Advisor the reasons for such results (e.g., market conditions, security selection) and any efforts being undertaken to improve performance. The Board found the investment management services provided by the Advisor to the Fund to meet or exceed industry standards. More detailed information about the Fund’s performance can be found in the Performance and Portfolio Commentary sections of this report.
Shareholder and Other Services. Under the management agreement, the Advisor provides the Fund with a comprehensive package of transfer agency, shareholder, and other services. The Board, directly and through various committees of the Board, regularly reviews reports and evaluations of such services at its regular meetings. These reports include, but are not limited to, information regarding the operational efficiency and accuracy of the shareholder and transfer agency services provided, staffing levels, shareholder satisfaction (as measured by external as well as internal sources), technology support, new products and services offered to Fund shareholders, securities trading activities, portfolio valuation services, auditing services, and legal and operational compliance activities. Certain aspects of shareholder and transfer agency service level efficiency and the quality of securities trading activities are measured by independent third party providers and are presented in comparison to other fund groups not managed by the Advisor. The Board found the services provided by the Advisor to the Fund under the management agreement to be competitive and of high quality.
Costs of Services and Profitability. The Advisor provides detailed information concerning its cost of providing various services to the Fund, its profitability in managing the Fund, its overall profitability, and its financial condition. The Directors have reviewed with the Advisor the methodology used to prepare this financial information. The financial information regarding the Advisor is considered in evaluating the Advisor’s financial condition, its ability to continue
to provide services under the management agreement, and the reasonableness of the current management fee. The Board concluded that the Advisor’s profits were reasonable in light of the services provided to the Fund.
Ethics. The Board generally considers the Advisor’s commitment to providing quality services to shareholders and to conducting its business ethically. They noted that the Advisor’s practices generally meet or exceed industry best practices.
Economies of Scale. The Board also reviewed information provided by the Advisor regarding the possible existence of economies of scale in connection with the management of the Fund. The Board concluded that economies of scale are difficult to measure and predict with precision, especially on a fund-by-fund basis. The Board concluded that the Advisor is appropriately sharing economies of scale through its competitive fee structure, offering competitive fees from fund inception, and through reinvestment in its business to provide shareholders additional content and services.
Comparison to Other Funds’ Fees. The management agreement provides that the Fund pay the Advisor a single, all-inclusive (or unified) management fee for providing all services necessary for the management and operation of the Fund, other than brokerage expenses, taxes, interest, extraordinary expenses, and the fees and expenses of the Fund’s independent directors (including their independent legal counsel) and expenses incurred in connection with the provision of shareholder services and distribution services under a plan adopted pursuant to Rule 12b-1 under the 1940 Act. Under the unified fee structure, the Advisor is responsible for providing all investment advisory, custody, audit, administrative, compliance, recordkeeping, marketing and shareholder services, or arranging and supervising third parties to provide such services. By contrast, most other funds are charged a variety of fees, including an investment advisory fee, a transfer agency fee, an administrative fee, distribution charges and other expenses. Other than their investment advisory fees and any applicable Rule 12b-1 distribution fees, all other components of the total fees charged by these other funds may be increased without shareholder approval. The Board believes the unified fee structure is a benefit to Fund shareholders because it clearly discloses to shareholders the cost of owning Fund shares, and, since the unified fee cannot be increased without a vote of Fund shareholders, it shifts to the Advisor the risk of increased costs of operating the Fund and provides a direct incentive to minimize administrative inefficiencies. Part of the Board’s analysis of fee levels involves reviewing certain evaluative data compiled by an independent provider and comparing the Fund’s unified fee to the total expense ratio of other funds in the Fund’s peer group. The Board concluded that the management fee paid by the Fund to the Advisor under the management agreement is reasonable in light of the services provided to the Fund.
Comparison to Fees and Services Provided to Other Clients of the Advisor. The Board also requested and received information from the Advisor concerning the nature of the services, fees, costs and profitability of its advisory services to advisory clients other than the Fund. They observed that these varying types of client accounts require different services and involve different regulatory and entrepreneurial risks than the management of the Fund. The Board analyzed this information and concluded that the fees charged and services provided to the Fund were reasonable by comparison.
Collateral or “Fall-Out” Benefits Derived by the Advisor. The Board considered the existence of collateral benefits the Advisor may receive as a result of its relationship with the Fund. They concluded that the Advisor’s primary business is managing mutual funds and it generally does not use fund or shareholder information to generate profits in other lines of business, and therefore does not derive any significant collateral benefits from them. The Board noted that the Advisor receives proprietary research from broker-dealers that execute fund portfolio transactions and concluded that this research is likely to benefit Fund shareholders. The Board also determined that the Advisor is able to provide investment management services to certain clients other than the Fund, at least in part, due to its existing infrastructure built to serve the fund complex. The Board concluded, however, that the assets of those other clients are not material to the analysis and, where applicable, may be included with the assets of the Fund to determine breakpoints in the management fee schedule.
Existing Relationship. The Board also considered whether there was any reason for not continuing the existing arrangement with the Advisor. In this regard, the Board was mindful of the potential disruptions of the Fund’s operations and various risks, uncertainties, and other effects that could occur as a result of a decision not to continue such relationship. In particular, the Board recognized that most shareholders have invested in the Fund on the strength of the Advisor’s industry standing and reputation and in the expectation that the Advisor will have a continuing role in providing advisory services to the Fund.
Conclusion of the Directors. As a result of this process, the Board, including all of the independent directors and assisted by the advice of independent legal counsel, taking into account all of the factors discussed above and the information provided by the Advisor and others, concluded that the management agreement between the Fund and the Advisor is fair and reasonable in light of the services provided and should be renewed.
Retirement Account Information
As required by law, distributions you receive from certain IRAs are subject to federal income tax withholding, unless you elect not to have withholding apply. Tax will be withheld on the total amount withdrawn even though you may be receiving amounts that are not subject to withholding, such as nondeductible contributions. In such case, excess amounts of withholding could occur. You may adjust your withholding election so that a greater or lesser amount will be withheld.
If you don’t want us to withhold on this amount, you must notify us to not withhold the federal income tax. You may notify us in writing or in certain situations by telephone or through other electronic means. For systematic withdrawals, your withholding election will remain in effect until revoked or changed by filing a new election. You have the right to revoke your election at any time.
Remember, even if you elect not to have income tax withheld, you are liable for paying income tax on the taxable portion of your withdrawal. If you elect not to have income tax withheld or you don’t have enough income tax withheld, you may be responsible for payment of estimated tax. You may incur penalties under the estimated tax rules if your withholding and estimated tax payments are not sufficient. You can reduce or defer the income tax on a distribution by directly or indirectly rolling such distribution over to another IRA or eligible plan. You should consult your tax advisor for additional information.
State tax will be withheld if, at the time of your distribution, your address is within one of the mandatory withholding states and you have federal income tax withheld (or as otherwise required by state law). State taxes will be withheld from your distribution in accordance with the respective state rules.
Distributions you receive from 403(b), 457 and qualified plans are subject to special tax and withholding rules. Your plan administrator or plan sponsor is required to provide you with a special tax notice explaining those rules at the time you request a distribution. If applicable, federal and/or state taxes may be withheld from your distribution amount.
Proxy Voting Guidelines
American Century Investment Management, Inc., the fund’s investment advisor, is responsible for exercising the voting rights associated with the securities purchased and/or held by the fund. A description of the policies and procedures the advisor uses in fulfilling this responsibility is available without charge, upon request, by calling 1-800-345-2021. It is also available on American Century Investments’ website at americancentury.com and on the Securities and Exchange Commission’s website at sec.gov. Information regarding how the investment advisor voted proxies relating to portfolio securities during the most recent 12-month period ended June 30 is available on the “About Us” page at americancentury.com. It is also available at sec.gov.
Quarterly Portfolio Disclosure
The fund files its complete schedule of portfolio holdings with the Securities and Exchange Commission (SEC) for the first and third quarters of each fiscal year on Form N-Q. The fund’s Forms N-Q are available on the SEC’s website at sec.gov, and may be reviewed and copied at the SEC’s Public Reference Room in Washington, DC. Information on the operation of the Public Reference Room may be obtained by calling 1-800-SEC-0330. The fund also makes its complete schedule of portfolio holdings for the most recent quarter of its fiscal year available on its website at americancentury.com and, upon request, by calling 1-800-345-2021.
Other Tax Information
The following information is provided pursuant to provisions of the Internal Revenue Code.
The fund hereby designates up to the maximum amount allowable as qualified dividend income for the fiscal year ended June 30, 2013.
For the fiscal year ended June 30, 2013, the fund intends to pass through to shareholders $18,456, or up to the maximum amount allowable, as a foreign tax credit which represents taxes paid on income derived from sources within foreign countries or possessions of the United States. During the fiscal year ended June 30, 2013, the fund earned $285,019 from income derived from foreign sources. Foreign source income and foreign tax expense per outstanding share on June 30, 2013 are $0.2824 and $0.0183, respectively.
Contact Us | americancentury.com |
Automated Information Line | 1-800-345-8765 |
Investor Services Representative | 1-800-345-2021
or 816-531-5575 |
Investors Using Advisors | 1-800-378-9878 |
Business, Not-For-Profit, Employer-Sponsored Retirement Plans | 1-800-345-3533 |
Banks and Trust Companies, Broker-Dealers, Financial Professionals, Insurance Companies | 1-800-345-6488 |
Telecommunications Device for the Deaf | 1-800-634-4113 |
American Century Quantitative Equity Funds, Inc.
Investment Advisor:
American Century Investment Management, Inc.
Kansas City, Missouri
This report and the statements it contains are submitted for the general information of our shareholders. The report is not authorized for distribution to prospective investors unless preceded or accompanied by an effective prospectus.
©2013 American Century Proprietary Holdings, Inc. All rights reserved.
CL-ANN-79309 1308
ANNUAL REPORT | JUNE 30, 2013 |
NT Core Equity Plus Fund
President’s Letter | 2 |
Market Perspective | 3 |
Performance | 4 |
Portfolio Commentary | 5 |
Fund Characteristics | 7 |
Shareholder Fee Example | 8 |
Schedule of Investments | 10 |
Statement of Assets and Liabilities | 16 |
Statement of Operations | 17 |
Statement of Changes in Net Assets | 18 |
Statement of Cash Flows | 19 |
Notes to Financial Statements | 20 |
Financial Highlights | 25 |
Report of Independent Registered Public Accounting Firm | 26 |
Management | 27 |
Approval of Management Agreement | 30 |
Additional Information | 35 |
Any opinions expressed in this report reflect those of the author as of the date of the report, and do not necessarily represent the opinions of American Century Investments® or any other person in the American Century Investments organization. Any such opinions are subject to change at any time based upon market or other conditions and American Century Investments disclaims any responsibility to update such opinions. These opinions may not be relied upon as investment advice and, because investment decisions made by American Century Investments funds are based on numerous factors, may not be relied upon as an indication of trading intent on behalf of any American Century Investments fund. Security examples are used for representational purposes only and are not intended as recommendations to purchase or sell securities. Performance information for comparative indices and securities is provided to American Century Investments by third party vendors. To the best of American Century Investments’ knowledge, such information is accurate at the time of printing.
Jonathan Thomas
Dear Investor:
Thank you for reviewing this annual report for the 12 months ended June 30, 2013. It provides investment performance, market analysis, and portfolio information, presented with the expert perspective of our portfolio management team.
Annual reports remain important vehicles for conveying information about fund returns, including key factors that affected fund performance. For additional, updated investment and market insights, we encourage you to visit our website, americancentury.com.
Generally Favorable Fiscal-Year Returns for U.S. Stocks and High-Yield Bonds
The 12-month reporting period began in the summer of 2012 with uncertainties caused by slowing economies, as well as the upcoming November elections and year-end fiscal deadlines in the U.S. It ended with more uncertainty about the future of U.S. monetary stimulus. In between, aggressive monetary intervention by central banks encouraged investors to take more risk, generally boosting stocks at the expense of government bonds.
U.S. mid-cap, small-cap, and value stock indices achieved performance leadership during the period, outpacing the S&P 500 Index’s 20.60% return. U.S. stocks generally outperformed non-U.S. equities—the MSCI EAFE Index returned 18.62% and the MSCI Emerging Markets Index advanced 2.87%, affected by slowing growth in emerging market economies.
Slower emerging market growth also hindered commodity price gains and helped keep inflation under control. As a result, assets used as inflation hedges, including inflation-indexed securities and precious metals, lagged other assets. Gold, in particular, plunged, starting last October. And Treasury inflation-protected securities (TIPS) were among the lowest performers in the U.S. bond market. Bond index returns generally ranged from approximately 10% gains for U.S. corporate high-yield indices all the way down to negative returns for longer-maturity global Treasury benchmarks.
Despite signs of improvement in 2013, U.S. economic growth is subpar compared with past recession recoveries, and remains vulnerable to threats that could trigger another slowdown and market volatility. Therefore, we continue to believe in a disciplined, diversified, long-term investment approach, using professionally managed stock and bond portfolios—as appropriate—for meeting financial goals. We appreciate your continued trust in us in this volatile environment.
Sincerely,
Jonathan Thomas
President and Chief Executive Officer
American Century Investments
By Scott Wittman, Chief Investment Officer, Asset Allocation and Quantitative Equity
Central Bank Actions, Relative U.S. Economic Gains Drove Stocks Higher
Stock market performance remained robust during the 12-month period ended June 30, 2013. Despite persistent concerns about weak global growth and Europe’s ongoing financial crisis, investors largely focused on central bank stimulus measures and marginally-improving U.S. economic data, which fueled market optimism.
Early in the period, in response to disappointing U.S. economic data, the U.S. Federal Reserve (the Fed) launched its third—and most aggressive—quantitative easing (QE) program, or monthly purchases of $40 billion in government agency mortgage-backed securities. Later in 2012, the Fed expanded the program to include $45 billion in Treasury purchases, bringing its total bond buying to $85 billion per month. This unprecedented program, combined with relatively healthy corporate earnings, significant housing market gains and modest improvements in the labor market, helped keep stocks and other riskier assets in favor.
The Fed rattled the financial markets late in the reporting period, with comments about “tapering” its quantitative easing program. Fed Chairman Ben Bernanke said the central bank could begin scaling back its bond buying later in 2013 if the economy continues to improve. After reaching record highs in May, stocks stumbled in June, following Bernanke’s comments. Late in the month, the Fed toned down its tapering talk, and stocks recovered some of their June losses. Overall, most U.S. stock benchmarks generated stellar 12-month returns, largely aided by strong double-digit gains posted during the first calendar quarter of 2013.
Value Stocks Outpaced Growth Stocks
Across the capitalization spectrum, value stocks were the performance leaders for the 12-month period. Much of this was due to strong one-year returns from the financials and health care sectors, where many value-oriented stocks reside. In particular, expectations for rising interest rates—and the late-quarter rate increase triggered by Fed tapering talk—helped boost returns within the financial sector’s banking industry. At the opposite end, the rate-sensitive utilities sector was the weakest relative performer, held back by the prospect of rising interest rates.
U.S. Stock Index Returns |
For the 12 months ended June 30, 2013 |
Russell 1000 Index (Large-Cap) | 21.24% | | Russell 2000 Index (Small-Cap) | 24.21% |
Russell 1000 Growth Index | 17.07% | | Russell 2000 Growth Index | 23.67% |
Russell 1000 Value Index | 25.32% | | Russell 2000 Value Index | 24.77% |
Russell Midcap Index | 25.41% | | |
Russell Midcap Growth Index | 22.88% | | | |
Russell Midcap Value Index | 27.65% | | | |
Total Returns as of June 30, 2013 |
| | | | Average Annual Returns | |
| | Ticker Symbol | 1 year | Since
Inception | Inception
Date |
Institutional Class | ACNKX | 22.54% | 20.47% | 12/1/11 |
S&P 500 Index | — | 20.60% | 20.13% | — |
Growth of $10,000 Over Life of Class |
$10,000 investment made December 1, 2011 |
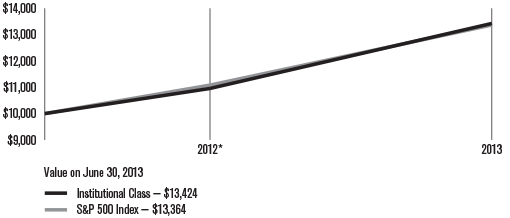
*From 12/1/11, the Institutional Class’s inception date. Not annualized.
Total Annual Fund Operating Expenses |
Institutional Class 1.86% |
The total annual fund operating expenses shown is as stated in the fund’s prospectus current as of the date of this report. The prospectus may vary from the expense ratio shown elsewhere in this report because it is based on a different time period, includes acquired fund fees and expenses, and, if applicable, does not include fee waivers or expense reimbursements.
Data presented reflect past performance. Past performance is no guarantee of future results. Current performance may be higher or lower than the performance shown. Investment return and principal value will fluctuate, and redemption value may be more or less than original cost. To obtain performance data current to the most recent month end, please call 1-800-345-2021 or visit americancentury.com. The fund’s investment process may result in high portfolio turnover, which could mean high transaction costs, affecting both performance and capital gains tax liabilities to investors. In addition, its investment approach may involve higher price volatility, short sales risk, leverage risk and overweighting risk.
Data assumes reinvestment of dividends and capital gains, and none of the charts reflect the deduction of taxes that a shareholder would pay on fund distributions or the redemption of fund shares. Returns for the index are provided for comparison. The fund’s total returns include operating expenses (such as transaction costs and management fees) that reduce returns, while the total returns of the index do not.
Portfolio Managers: Scott Wittman, Bill Martin and Claudia Musat
Performance Summary
NT Core Equity Plus returned 22.54% for the fiscal year ended June 30, 2013, compared with the 20.60% return of its benchmark, the S&P 500 Index.
In a year of strength for U.S. equity markets (see page 3 for details), NT Core Equity Plus posted a solid gain for the 12-month period, outperforming the S&P 500 Index. The fund is managed to have a 100% net exposure to the equity market by investing approximately 130% of its net assets in long positions, while 30% of its net assets are sold short. The proceeds from the securities sold short are used to fund the purchase of the additional 30% of long positions. The portfolio’s stock selection process incorporates factors of growth, value, quality, and momentum, and is designed to minimize unintended risks along industries and other risk characteristics. Quality and value signals were aligned with outperforming names in the fund, while momentum insights, particularly with longer horizon signals, detracted from returns during the year.
Absolute Performance Driven by Health Care and Financials
The fund’s strong absolute returns were driven primarily by holdings in the health care and financials sectors. In health care, where pharmaceuticals were particularly helpful, drug maker Pfizer and consumer health manufacturer Johnson & Johnson contributed the most with gains of 26% and 31%, respectively. In financials, the biggest boost came from financial services giant JPMorgan Chase, whose shares rose more than 50% for the year. Among individual securities, positions in several mega-cap technology companies, including Google and Cisco Systems, as well as home improvement retailer Home Depot also boosted absolute returns.
No sector declined on an absolute basis during the year, but a number of short positions—which are designed to profit when a stock’s price declines—weighed on results during a period when many stocks saw significant appreciation.
Materials and Health Care Outperformed
The materials and health care sectors were the best contributors to the fund’s returns relative to the S&P 500. Materials sector outperformance was driven by stock picks in both the metals and mining and chemicals industries. Short positions in a number of mining companies were particularly successful during a period when precious metals prices weakened. A top performer here was gold and silver producer Allied Nevada Gold, whose stock price declined over 80% during the year. An out-of-benchmark position in integrated chemicals and building products manufacturer Axiall (formerly Georgia Gulf) was also beneficial. Axiall’s stock rose nearly 40% thanks to strong demand from an improving housing sector.
In health care, the biggest industry-level contributions came from holdings in health care equipment and supplies and pharmaceuticals. Medical device manufacturer Boston Scientific, where the fund had more exposure than the index, was especially beneficial. Our research shows strong rankings across growth and quality, and we maintain our overweight. Likewise, biopharmaceutical holding Bristol-Myers Squibb enhanced performance after the company posted healthy gains on consistent earnings growth and sector momentum.
Other holdings that added value included electronic game retailer GameStop, oil refiner Marathon Petroleum, and mobile hydraulic manufacturer Sauer-Danfoss. GameStop, whose stock climbed 140% during the year, appreciated on improved revenue outlook as investor concerns regarding new console compatibility with prior generations’ games were allayed.
Technology and Consumer Discretionary Detracted from Results
The fund’s holdings in the information technology and consumer discretionary sectors had a negative impact on performance during the year. The most significant detractor in the technology sector, as well as the fund, was a short position in solar industry semiconductor producer SunEdison (formerly MEMC Electronic Materials). Despite high valuations and negative net margins, the company’s stock appreciated on hopes of increased traction of solar energy usage. However, our research confirms that the company looks expensive, and we maintain the fund’s short position. Similarly, a short position in broadband service provider ViaSat hurt results after investors overlooked negative earnings and below-estimate revenue guidance, sending shares soaring 90% during the year. An overweight to semiconductor manufacturer Advanced Micro Devices was also detrimental.
The consumer discretionary sector also proved difficult for relative performance, especially in the diversified consumer services industry. Top detractors in the sector included Bridgepoint Education, whose shares tumbled along with other for-profit education companies. A position in Outerwall Inc. (formerly Coinstar, Inc.) also impacted results after the company issued a weaker-than-expected outlook early in the fiscal year. Our research suggests strong value and quality indicators, and we maintain exposure to the company.
Elsewhere in the portfolio, short positions in several industrials sector holdings also detracted meaningfully. Infrastructure construction company MasTec and industrial manufacturer Colfax both saw significant stock price appreciation on steady revenue growth.
A Look Ahead
As we move into the second half of 2013, the U.S. economic recovery seems to be progressing, albeit with headwinds. Improvements in housing, employment, and economic indicators have been consistent and point to slow but positive growth. Volatility is likely to remain elevated as ongoing concerns over interest rates, Federal Reserve action, and a potential slowdown in China dominate headlines. Heightened levels of volatility often provide investment opportunities in both the long and short portions of the portfolio. Our disciplined, objective, and systematic investment strategy is designed to take advantage of these opportunities at the individual company level. We believe this approach is the most powerful way to capitalize on market inefficiencies that lead to the mispricing of individual stocks.
JUNE 30, 2013 |
Top Ten Long Holdings | % of net assets |
Exxon Mobil Corp. | 3.49% |
Apple, Inc. | 2.89% |
Microsoft Corp. | 2.66% |
Johnson & Johnson | 2.45% |
Pfizer, Inc. | 2.12% |
AT&T, Inc. | 2.02% |
Google, Inc., Class A | 1.83% |
Cisco Systems, Inc. | 1.79% |
Merck & Co., Inc. | 1.67% |
Home Depot, Inc. (The) | 1.55% |
| | |
Top Five Short Holdings | % of net assets |
DreamWorks Animation SKG, Inc., Class A | (0.94)% |
SunEdison, Inc. | (0.87)% |
NCR Corp. | (0.86)% |
Hexcel Corp. | (0.84)% |
Air Lease Corp. | (0.81)% |
| | |
Types of Investments in Portfolio | % of net assets |
Common Stocks | 128.4% |
Common Stocks Sold Short | (29.3)% |
Temporary Cash Investments | 0.9% |
Other Assets and Liabilities | —* |
*Category is less than 0.05% of total net assets. | |
Fund shareholders may incur two types of costs: (1) transaction costs, including sales charges (loads) on purchase payments and redemption/exchange fees; and (2) ongoing costs, including management fees; distribution and service (12b-1) fees; and other fund expenses. This example is intended to help you understand your ongoing costs (in dollars) of investing in your fund and to compare these costs with the ongoing cost of investing in other mutual funds.
The example is based on an investment of $1,000 made at the beginning of the period and held for the entire period from January 1, 2013 to June 30, 2013.
Actual Expenses
The table provides information about actual account values and actual expenses for each class. You may use the information, together with the amount you invested, to estimate the expenses that you paid over the period. First, identify the share class you own. Then simply divide your account value by $1,000 (for example, an $8,600 account value divided by $1,000 = 8.6), then multiply the result by the number under the heading “Expenses Paid During Period” to estimate the expenses you paid on your account during this period.
If you hold Investor Class shares of any American Century Investments fund, or Institutional Class shares of the American Century Diversified Bond Fund, in an American Century Investments account (i.e., not a financial intermediary or retirement plan account), American Century Investments may charge you a $12.50 semiannual account maintenance fee if the value of those shares is less than $10,000. We will redeem shares automatically in one of your accounts to pay the $12.50 fee. In determining your total eligible investment amount, we will include your investments in all personal accounts (including American Century Investments Brokerage accounts) registered under your Social Security number. Personal accounts include individual accounts, joint accounts, UGMA/UTMA accounts, personal trusts, Coverdell Education Savings Accounts and IRAs (including traditional, Roth, Rollover, SEP-, SARSEP- and SIMPLE-IRAs), and certain other retirement accounts. If you have only business, business retirement, employer-sponsored or American Century Investments Brokerage accounts, you are currently not subject to this fee. If you are subject to the Account Maintenance Fee, your account value could be reduced by the fee amount.
Hypothetical Example for Comparison Purposes
The table also provides information about hypothetical account values and hypothetical expenses based on the actual expense ratio of each class of your fund and an assumed rate of return of 5% per year before expenses, which is not the actual return of a fund’s share class. The hypothetical account values and expenses may not be used to estimate the actual ending account balance or expenses you paid for the period. You may use this information to compare the ongoing costs of investing in your fund and other funds. To do so, compare this 5% hypothetical example with the 5% hypothetical examples that appear in the shareholder reports of the other funds.
Please note that the expenses shown in the table are meant to highlight your ongoing costs only and do not reflect any transactional costs, such as sales charges (loads) or redemption/exchange fees. Therefore, the table is useful in comparing ongoing costs only, and will not help you determine the relative total costs of owning different funds. In addition, if these transactional costs were included, your costs would have been higher.
| | | | | |
| | Beginning
Account Value
1/1/13 | Ending
Account Value
6/30/13 | Expenses Paid During Period(1) 1/1/13 – 6/30/13 | Annualized
Expense Ratio(1) |
Actual |
Institutional Class | $1,000 | $1,146.10 | $8.41 | 1.58% |
Hypothetical |
Institutional Class | $1,000 | $1,016.96 | $7.90 | 1.58% |
(1) | Expenses are equal to the class’s annualized expense ratio listed in the table above, multiplied by the average account value over the period, multiplied by 181, the number of days in the most recent fiscal half-year, divided by 365, to reflect the one-half year period. |
JUNE 30, 2013
| | | | | | | |
| | | Shares | | | Value | |
Common Stocks — 128.4% | |
AEROSPACE AND DEFENSE — 6.2% | |
Alliant Techsystems, Inc. | | 14,813 | | | $ 1,219,554 | |
Boeing Co. (The)(1) | | 36,680 | | | 3,757,499 | |
Esterline Technologies Corp.(2) | | 15,534 | | | 1,122,953 | |
General Dynamics Corp.(1) | | 28,640 | | | 2,243,371 | |
Honeywell International, Inc.(1) | | 33,602 | | | 2,665,983 | |
L-3 Communications Holdings, Inc. | | 2,683 | | | 230,040 | |
Northrop Grumman Corp.(1) | | 31,701 | | | 2,624,843 | |
Raytheon Co. | | 16,680 | | | 1,102,882 | |
Textron, Inc.(1) | | 65,292 | | | 1,700,857 | |
| | | | | | 16,667,982 | |
AUTO COMPONENTS — 0.2% | |
BorgWarner, Inc.(2) | | 6,396 | | | 551,015 | |
BEVERAGES — 0.4% | | | | | | |
Coca-Cola Co. (The)(1) | | 17,429 | | | 699,077 | |
PepsiCo, Inc.(1) | | 3,547 | | | 290,109 | |
| | | | | | 989,186 | |
BIOTECHNOLOGY — 2.4% | | | | | | |
Amgen, Inc.(1) | | 21,244 | | | 2,095,933 | |
Biogen Idec, Inc.(1)(2) | | 1,679 | | | 361,321 | |
Celgene Corp.(1)(2) | | 13,133 | | | 1,535,379 | |
Cubist Pharmaceuticals, Inc.(2) | | 13,683 | | | 660,889 | |
Gilead Sciences, Inc.(1)(2) | | 20,930 | | | 1,071,825 | |
United Therapeutics Corp.(1)(2) | | 11,741 | | | 772,793 | |
| | | | | | 6,498,140 | |
CAPITAL MARKETS — 4.0% | |
Evercore Partners, Inc., Class A | | 26,811 | | | 1,053,136 | |
Federated Investors, Inc., Class B(1) | | 85,874 | | | 2,353,806 | |
Goldman Sachs Group, Inc. (The) | | 21,230 | | | 3,211,037 | |
Investment Technology Group, Inc.(1)(2) | | 71,012 | | | 992,748 | |
Janus Capital Group, Inc.(1) | | 81,011 | | | 689,404 | |
SEI Investments Co.(1) | | 49,364 | | | 1,403,419 | |
T. Rowe Price Group, Inc. | | 3,373 | | | 246,735 | |
Waddell & Reed Financial, Inc., Class A | | 14,464 | | | 629,184 | |
| | | | | | 10,579,469 | |
CHEMICALS — 4.8% | |
CF Industries Holdings, Inc.(1) | | 9,011 | | | 1,545,387 | |
LyondellBasell Industries NV, Class A(1) | | 36,605 | | | 2,425,447 | |
Monsanto Co.(1) | | 30,335 | | | 2,997,098 | |
NewMarket Corp. | | 6,075 | | | 1,595,052 | |
PPG Industries, Inc. | | 17,073 | | | 2,499,658 | |
Sherwin-Williams Co. (The) | | 3,750 | | | 662,250 | |
Valspar Corp. (The)(1) | | 16,018 | | | 1,035,884 | |
| | | | | | 12,760,776 | |
COMMERCIAL BANKS — 0.8% | |
Hancock Holding Co. | | 7,910 | | | 237,854 | |
Wells Fargo & Co.(1) | | 46,498 | | | 1,918,972 | |
| | | | | | 2,156,826 | |
COMMERCIAL SERVICES AND SUPPLIES — 1.7% | |
Deluxe Corp.(1) | | 38,871 | | | 1,346,880 | |
Mine Safety Appliances Co.(1) | | 36,052 | | | 1,678,221 | |
RR Donnelley & Sons Co.(1) | | 112,137 | | | 1,571,039 | |
| | | | | | 4,596,140 | |
COMMUNICATIONS EQUIPMENT — 3.9% | |
ARRIS Group, Inc.(1)(2) | | 74,110 | | | 1,063,479 | |
Brocade Communications Systems, Inc.(1)(2) | | 266,582 | | | 1,535,513 | |
Cisco Systems, Inc.(1) | | 196,675 | | | 4,781,169 | |
InterDigital, Inc. | | 2,868 | | | 128,056 | |
QUALCOMM, Inc.(1) | | 25,176 | | | 1,537,750 | |
Research In Motion Ltd.(1)(2) | | 141,460 | | | 1,481,086 | |
| | | | | | 10,527,053 | |
COMPUTERS AND PERIPHERALS — 4.9% | |
Apple, Inc.(1) | | 19,538 | | | 7,738,611 | |
EMC Corp.(1) | | 122,991 | | | 2,905,047 | |
Hewlett-Packard Co.(1) | | 76,626 | | | 1,900,325 | |
Seagate Technology plc(1) | | 4,418 | | | 198,059 | |
Western Digital Corp. | | 7,145 | | | 443,633 | |
| | | | | | 13,185,675 | |
CONSTRUCTION AND ENGINEERING — 0.5% | |
AECOM Technology Corp.(2) | | 42,540 | | | 1,352,347 | |
CONSUMER FINANCE — 0.8% | |
Cash America International, Inc.(1) | | 39,416 | | | 1,791,851 | |
Credit Acceptance Corp.(2) | | 3,480 | | | 365,574 | |
| | | | | | 2,157,425 | |
CONTAINERS AND PACKAGING — 2.3% | |
Greif, Inc., Class A(1) | | 34,152 | | | 1,798,786 | |
Owens-Illinois, Inc.(1)(2) | | 79,042 | | | 2,196,577 | |
Packaging Corp. of America(1) | | 42,493 | | | 2,080,457 | |
| | | | | | 6,075,820 | |
DIVERSIFIED CONSUMER SERVICES — 0.7% | |
Coinstar, Inc.(1)(2) | | 31,689 | | | 1,859,194 | |
DIVERSIFIED FINANCIAL SERVICES — 2.7% | |
Bank of America Corp.(1) | | 30,772 | | | $ 395,728 | |
Citigroup, Inc.(1) | | 9,311 | | | 446,648 | |
JPMorgan Chase & Co.(1) | | 67,518 | | | 3,564,275 | |
Moody’s Corp. | | 15,989 | | | 974,210 | |
MSCI, Inc., Class A(1)(2) | | 58,740 | | | 1,954,280 | |
| | | | | | 7,335,141 | |
DIVERSIFIED TELECOMMUNICATION SERVICES — 4.2% | |
AT&T, Inc.(1) | | 152,306 | | | 5,391,632 | |
CenturyLink, Inc. | | 64,691 | | | 2,286,827 | |
Verizon Communications, Inc.(1) | | 62,778 | | | 3,160,244 | |
Vonage Holdings Corp.(1)(2) | | 116,132 | | | 328,654 | |
| | | | | | 11,167,357 | |
ELECTRIC UTILITIES — 1.7% | |
Edison International(1) | | 49,683 | | | 2,392,733 | |
Portland General Electric Co.(1) | | 73,738 | | | 2,255,646 | |
| | | | | | 4,648,379 | |
ELECTRICAL EQUIPMENT — 2.9% | |
Brady Corp., Class A(1) | | 24,171 | | | 742,775 | |
Emerson Electric Co.(1) | | 46,904 | | | 2,558,144 | |
EnerSys(1) | | 44,373 | | | 2,176,052 | |
Rockwell Automation, Inc. | | 25,792 | | | 2,144,347 | |
| | | | | | 7,621,318 | |
ELECTRONIC EQUIPMENT, INSTRUMENTS AND COMPONENTS — 1.1% | |
Itron, Inc.(1)(2) | | 37,876 | | | 1,607,079 | |
TE Connectivity Ltd. | | 26,749 | | | 1,218,149 | |
| | | | | | 2,825,228 | |
ENERGY EQUIPMENT AND SERVICES — 1.4% | |
Ensco plc, Class A | | 3,453 | | | 200,688 | |
Nabors Industries Ltd. | | 96,557 | | | 1,478,288 | |
RPC, Inc.(1) | | 156,844 | | | 2,166,016 | |
| | | | | | 3,844,992 | |
FOOD AND STAPLES RETAILING — 3.2% | |
CVS Caremark Corp.(1) | | 58,607 | | | 3,351,148 | |
Rite Aid Corp.(1)(2) | | 693,761 | | | 1,984,157 | |
Safeway, Inc. | | 93,146 | | | 2,203,834 | |
Wal-Mart Stores, Inc.(1) | | 12,866 | | | 958,388 | |
| | | | | | 8,497,527 | |
FOOD PRODUCTS — 2.5% | |
Archer-Daniels-Midland Co.(1) | | 76,883 | | | 2,607,102 | |
General Mills, Inc. | | 29,198 | | | 1,416,979 | |
Hershey Co. (The) | | 9,447 | | | 843,428 | |
Ingredion, Inc. | | 16,632 | | | 1,091,392 | |
Pilgrim’s Pride Corp.(2) | | 44,371 | | | 662,903 | |
| | | | | | 6,621,804 | |
GAS UTILITIES — 0.4% | |
UGI Corp. | | 27,641 | | | 1,081,040 | |
HEALTH CARE EQUIPMENT AND SUPPLIES — 5.2% | |
Abbott Laboratories(1) | | 85,083 | | | 2,967,695 | |
Becton Dickinson and Co. | | 17,122 | | | 1,692,167 | |
Boston Scientific Corp.(1)(2) | | 244,849 | | | 2,269,750 | |
Medtronic, Inc.(1) | | 60,403 | | | 3,108,943 | |
St. Jude Medical, Inc.(1) | | 52,941 | | | 2,415,698 | |
Stryker Corp.(1) | | 20,856 | | | 1,348,966 | |
| | | | | | 13,803,219 | |
HEALTH CARE PROVIDERS AND SERVICES — 1.0% | |
AmerisourceBergen Corp. | | 26,459 | | | 1,477,206 | |
Select Medical Holdings Corp.(1) | | 142,272 | | | 1,166,630 | |
| | | | | | 2,643,836 | |
HOTELS, RESTAURANTS AND LEISURE — 2.3% | |
Bally Technologies, Inc.(1)(2) | | 37,773 | | | 2,131,153 | |
Cracker Barrel Old Country Store, Inc. | | 20,246 | | | 1,916,486 | |
International Game Technology | | 118,634 | | | 1,982,374 | |
| | | | | | 6,030,013 | |
HOUSEHOLD DURABLES — 1.5% | |
Garmin Ltd.(1) | | 47,994 | | | 1,735,463 | |
Newell Rubbermaid, Inc.(1) | | 83,162 | | | 2,183,003 | |
| | | | | | 3,918,466 | |
HOUSEHOLD PRODUCTS — 2.5% | |
Energizer Holdings, Inc.(1) | | 22,011 | | | 2,212,326 | |
Kimberly-Clark Corp. | | 27,368 | | | 2,658,527 | |
Procter & Gamble Co. (The)(1) | | 21,806 | | | 1,678,844 | |
| | | | | | 6,549,697 | |
INDEPENDENT POWER PRODUCERS AND ENERGY TRADERS — 0.5% | |
AES Corp. (The)(1) | | 115,676 | | | 1,386,955 | |
INDUSTRIAL CONGLOMERATES — 2.1% | |
3M Co.(1) | | 7,628 | | | 834,122 | |
Danaher Corp.(1) | | 43,177 | | | 2,733,104 | |
General Electric Co.(1) | | 83,964 | | | 1,947,125 | |
| | | | | | 5,514,351 | |
INSURANCE — 7.4% | |
Aflac, Inc.(1) | | 45,404 | | | 2,638,881 | |
American International Group, Inc.(1)(2) | | 72,237 | | | 3,228,994 | |
Amtrust Financial Services, Inc. | | 26,763 | | | 955,439 | |
Axis Capital Holdings Ltd.(1) | | 49,612 | | | 2,271,237 | |
Berkshire Hathaway, Inc., Class B(1)(2) | | 12,103 | | | 1,354,568 | |
First American Financial Corp.(1) | | 64,793 | | | 1,428,038 | |
HCC Insurance Holdings, Inc. | | 31,431 | | | 1,354,990 | |
MetLife, Inc.(1) | | 48,822 | | | $ 2,234,095 | |
Prudential Financial, Inc.(1) | | 8,288 | | | 605,273 | |
Reinsurance Group of America, Inc. | | 6,594 | | | 455,711 | |
RenaissanceRe Holdings Ltd. | | 3,302 | | | 286,581 | |
Torchmark Corp. | | 15,572 | | | 1,014,360 | |
Travelers Cos., Inc. (The) | | 14,085 | | | 1,125,673 | |
XL Group plc | | 28,742 | | | 871,457 | |
| | | | | | 19,825,297 | |
INTERNET AND CATALOG RETAIL — 1.1% | |
Expedia, Inc.(1) | | 36,242 | | | 2,179,956 | |
HomeAway, Inc.(2) | | 26,207 | | | 847,535 | |
| | | | | | 3,027,491 | |
INTERNET SOFTWARE AND SERVICES — 2.0% | |
Dice Holdings, Inc.(1)(2) | | 23,086 | | | 212,622 | |
Google, Inc., Class A(1)(2) | | 5,561 | | | 4,895,737 | |
United Online, Inc.(1) | | 35,060 | | | 265,755 | |
| | | | | | 5,374,114 | |
IT SERVICES — 1.8% | |
Accenture plc, Class A(1) | | 3,423 | | | 246,319 | |
CoreLogic, Inc.(2) | | 18,173 | | | 421,069 | |
International Business Machines Corp.(1) | | 16,002 | | | 3,058,142 | |
SAIC, Inc.(1) | | 55,727 | | | 776,277 | |
Unisys Corp.(1)(2) | | 19,815 | | | 437,317 | |
| | | | | | 4,939,124 | |
LEISURE EQUIPMENT AND PRODUCTS — 2.2% | |
Hasbro, Inc.(1) | | 46,232 | | | 2,072,581 | |
Mattel, Inc.(1) | | 49,100 | | | 2,224,721 | |
Polaris Industries, Inc. | | 15,313 | | | 1,454,735 | |
| | | | | | 5,752,037 | |
LIFE SCIENCES TOOLS AND SERVICES — 1.5% | |
Agilent Technologies, Inc.(1) | | 41,795 | | | 1,787,154 | |
Thermo Fisher Scientific, Inc. | | 27,798 | | | 2,352,545 | |
| | | | | | 4,139,699 | |
MACHINERY — 2.7% | |
Actuant Corp., Class A(1) | | 51,206 | | | 1,688,262 | |
Crane Co.(1) | | 36,611 | | | 2,193,731 | |
Dover Corp. | | 10,791 | | | 838,029 | |
Ingersoll-Rand plc(1) | | 11,276 | | | 626,044 | |
WABCO Holdings, Inc.(1)(2) | | 25,616 | | | 1,913,259 | |
| | | | | | 7,259,325 | |
MEDIA — 4.1% | |
Comcast Corp., Class A(1) | | 91,955 | | | 3,851,075 | |
DIRECTV(2) | | 2,272 | | | 140,001 | |
Gannett Co., Inc. | | 58,660 | | | 1,434,824 | |
Lions Gate Entertainment Corp.(2) | | 12,939 | | | 355,434 | |
Regal Entertainment Group, Class A | | 17,165 | | | 307,254 | |
Scholastic Corp.(1) | | 38,687 | | | 1,133,142 | |
Time Warner Cable, Inc.(1) | | 22,711 | | | 2,554,533 | |
Time Warner, Inc. | | 22,408 | | | 1,295,631 | |
| | | | | | 11,071,894 | |
METALS AND MINING — 1.1% | |
Coeur Mining, Inc.(1)(2) | | 66,095 | | | 879,063 | |
Reliance Steel & Aluminum Co. | | 10,914 | | | 715,522 | |
Worthington Industries, Inc.(1) | | 44,273 | | | 1,403,897 | |
| | | | | | 2,998,482 | |
MULTILINE RETAIL — 0.6% | |
Dillard’s, Inc., Class A(1) | | 17,147 | | | 1,405,540 | |
Macy’s, Inc.(1) | | 4,029 | | | 193,392 | |
| | | | | | 1,598,932 | |
OIL, GAS AND CONSUMABLE FUELS — 8.7% | |
Chevron Corp.(1) | | 20,258 | | | 2,397,332 | |
ConocoPhillips(1) | | 49,451 | | | 2,991,785 | |
Delek US Holdings, Inc. | | 9,791 | | | 281,785 | |
Exxon Mobil Corp.(1) | | 103,271 | | | 9,330,535 | |
Marathon Petroleum Corp.(1) | | 32,565 | | | 2,314,069 | |
Suncor Energy, Inc.(1) | | 19,963 | | | 588,709 | |
Tesoro Corp.(1) | | 34,031 | | | 1,780,502 | |
Valero Energy Corp.(1) | | 53,906 | | | 1,874,311 | |
Western Refining, Inc.(1) | | 60,413 | | | 1,695,793 | |
| | | | | | 23,254,821 | |
PHARMACEUTICALS — 8.6% | |
AbbVie, Inc. | | 30,734 | | | 1,270,543 | |
Allergan, Inc. | | 4,322 | | | 364,085 | |
Bristol-Myers Squibb Co.(1) | | 46,840 | | | 2,093,280 | |
Eli Lilly & Co.(1) | | 52,017 | | | 2,555,075 | |
Johnson & Johnson(1) | | 76,451 | | | 6,564,083 | |
Merck & Co., Inc.(1) | | 96,063 | | | 4,462,126 | |
Pfizer, Inc.(1) | | 202,681 | | | 5,677,095 | |
| | | | | | 22,986,287 | |
PROFESSIONAL SERVICES — 0.5% | |
Dun & Bradstreet Corp. | | 14,583 | | | 1,421,113 | |
SEMICONDUCTORS AND SEMICONDUCTOR EQUIPMENT — 3.3% | |
Applied Materials, Inc.(1) | | 134,443 | | | 2,004,545 | |
Broadcom Corp., Class A(1) | | 62,794 | | | 2,119,926 | |
First Solar, Inc.(2) | | 17,400 | | | 778,302 | |
Intel Corp.(1) | | 6,404 | | | 155,105 | |
KLA-Tencor Corp.(1) | | 27,377 | | | 1,525,720 | |
LSI Corp.(1)(2) | | 153,763 | | | 1,097,868 | |
NVIDIA Corp.(1) | | 78,542 | | | 1,101,944 | |
| | | | | | 8,783,410 | |
SOFTWARE — 6.3% | |
Activision Blizzard, Inc.(1) | | 121,040 | | | $ 1,726,031 | |
CA, Inc. | | 7,416 | | | 212,320 | |
Cadence Design Systems, Inc.(1)(2) | | 18,121 | | | 262,392 | |
Mentor Graphics Corp.(1) | | 85,735 | | | 1,676,119 | |
Microsoft Corp.(1) | | 205,995 | | | 7,113,007 | |
Oracle Corp.(1) | | 127,996 | | | 3,932,037 | |
Symantec Corp.(1) | | 90,472 | | | 2,032,906 | |
| | | | | | 16,954,812 | |
SPECIALTY RETAIL — 5.5% | |
Abercrombie & Fitch Co., Class A | | 11,986 | | | 542,367 | |
American Eagle Outfitters, Inc. | | 22,405 | | | 409,115 | |
Buckle, Inc. (The)(1) | | 33,855 | | | 1,761,137 | |
Foot Locker, Inc.(1) | | 21,619 | | | 759,476 | |
GameStop Corp., Class A(1) | | 58,647 | | | 2,464,933 | |
Gap, Inc. (The)(1) | | 59,314 | | | 2,475,173 | |
Home Depot, Inc. (The)(1) | | 53,603 | | | 4,152,624 | |
PetSmart, Inc.(1) | | 31,992 | | | 2,143,144 | |
| | | | | | 14,707,969 | |
TEXTILES, APPAREL AND LUXURY GOODS — 1.1% | |
Hanesbrands, Inc.(1) | | 44,238 | | | 2,274,718 | |
Iconix Brand Group, Inc.(1)(2) | | 24,218 | | | 712,251 | |
| | | | | | 2,986,969 | |
THRIFTS AND MORTGAGE FINANCE — 0.7% | |
Ocwen Financial Corp.(1)(2) | | 43,352 | | | 1,786,969 | |
TRADING COMPANIES AND DISTRIBUTORS — 0.4% | |
MRC Global, Inc.(2) | | 43,384 | | | 1,198,266 | |
TOTAL COMMON STOCKS (Cost $294,913,908) | | | 343,513,382 | |
Temporary Cash Investments — 0.9% | |
Repurchase Agreement, Bank of America Merrill Lynch, (collateralized by various U.S. Treasury obligations, 1.00%, 1/15/14, valued at $329,232), in a joint trading account at 0.06%, dated 6/28/13, due 7/1/13 (Delivery value $322,500) | | | 322,498 | |
Repurchase Agreement, Credit Suisse First Boston, Inc., (collateralized by various U.S. Treasury obligations, 4.25%, 11/15/40, valued at $985,775), in a joint trading account at 0.05%, dated 6/28/13, due 7/1/13 (Delivery value $967,498) | | | 967,494 | |
Repurchase Agreement, Goldman Sachs & Co., (collateralized by various U.S. Treasury obligations, 3.125%, 11/15/41, valued at $328,025), in a joint trading account at 0.04%, dated 6/28/13, due 7/1/13 (Delivery value $322,499) | | | 322,498 | |
SSgA U.S. Government Money Market Fund | | 911,848 | | | $ 911,848 | |
TOTAL TEMPORARY CASH INVESTMENTS (Cost $2,524,338) | | | 2,524,338 | |
TOTAL INVESTMENT SECURITIES BEFORE SECURITIES SOLD SHORT — 129.3% (Cost $297,438,246) | | | 346,037,720 | |
Common Stocks Sold Short — (29.3)% | |
AEROSPACE AND DEFENSE — (1.3)% | |
DigitalGlobe, Inc. | | (40,501 | ) | | (1,255,936 | ) |
Hexcel Corp. | | (65,680 | ) | | (2,236,404 | ) |
| | | | | | (3,492,340 | ) |
AIR FREIGHT AND LOGISTICS — (0.5)% | |
UTi Worldwide, Inc. | | (88,948 | ) | | (1,464,974 | ) |
BIOTECHNOLOGY — (0.8)% | |
Ariad Pharmaceuticals, Inc. | | (38,269 | ) | | (669,325 | ) |
Medivation, Inc. | | (14,847 | ) | | (730,472 | ) |
Theravance, Inc. | | (17,547 | ) | | (676,086 | ) |
| | | | | | (2,075,883 | ) |
CAPITAL MARKETS — (0.4)% | |
Cohen & Steers, Inc. | | (10,521 | ) | | (357,504 | ) |
Stifel Financial Corp. | | (23,079 | ) | | (823,228 | ) |
| | | | | | (1,180,732 | ) |
CHEMICALS — (1.3)% | |
Cytec Industries, Inc. | | (25,601 | ) | | (1,875,273 | ) |
Praxair, Inc. | | (3,905 | ) | | (449,700 | ) |
Tronox Ltd., Class A | | (58,914 | ) | | (1,187,117 | ) |
| | | | | | (3,512,090 | ) |
COMMERCIAL BANKS — (0.3)% | |
Trustmark Corp. | | (31,276 | ) | | (768,764 | ) |
COMMERCIAL SERVICES AND SUPPLIES — (0.3)% | |
Clean Harbors, Inc. | | (15,364 | ) | | (776,343 | ) |
COMMUNICATIONS EQUIPMENT — (0.8)% | |
ViaSat, Inc. | | (29,713 | ) | | (2,123,291 | ) |
COMPUTERS AND PERIPHERALS — (0.9)% | |
NCR Corp. | | (69,365 | ) | | (2,288,351 | ) |
CONTAINERS AND PACKAGING — (0.3)% | |
MeadWestvaco Corp. | | (20,239 | ) | | (690,352 | ) |
ELECTRICAL EQUIPMENT — (0.5)% | |
Franklin Electric Co., Inc. | | (13,836 | ) | | (465,582 | ) |
GrafTech International Ltd. | | (119,605 | ) | | (870,724 | ) |
| | | | | | (1,336,306 | ) |
ENERGY EQUIPMENT AND SERVICES — (0.5)% | |
Hornbeck Offshore Services, Inc. | | (3,431 | ) | | (183,558 | ) |
SEACOR Holdings, Inc. | | (12,686 | ) | | (1,053,572 | ) |
Unit Corp. | | (3,258 | ) | | (138,726 | ) |
| | | | | | (1,375,856 | ) |
FOOD PRODUCTS — (0.8)% | |
Hain Celestial Group, Inc. (The) | | (16,166 | ) | | $ (1,050,305 | ) |
Snyders-Lance, Inc. | | (43,566 | ) | | (1,237,710 | ) |
| | | | | | (2,288,015 | ) |
GAS UTILITIES — (0.9)% | |
New Jersey Resources Corp. | | (32,202 | ) | | (1,337,349 | ) |
ONEOK, Inc. | | (11,441 | ) | | (472,628 | ) |
South Jersey Industries, Inc. | | (9,029 | ) | | (518,355 | ) |
| | | | | | (2,328,332 | ) |
HEALTH CARE EQUIPMENT AND SUPPLIES — (1.0)% | |
Haemonetics Corp. | | (40,155 | ) | | (1,660,409 | ) |
Hologic, Inc. | | (54,213 | ) | | (1,046,311 | ) |
| | | | | | (2,706,720 | ) |
HEALTH CARE PROVIDERS AND SERVICES — (1.4)% | |
Air Methods Corp. | | (3,809 | ) | | (129,049 | ) |
Catamaran Corp. | | (9,925 | ) | | (483,546 | ) |
DaVita HealthCare Partners, Inc. | | (4,279 | ) | | (516,903 | ) |
Health Net, Inc. | | (34,621 | ) | | (1,101,640 | ) |
Team Health Holdings, Inc. | | (16,640 | ) | | (683,405 | ) |
WellCare Health Plans, Inc. | | (13,924 | ) | | (773,478 | ) |
| | | | | | (3,688,021 | ) |
HOTELS, RESTAURANTS AND LEISURE — (0.5)% | |
BJ’s Restaurants, Inc. | | (18,376 | ) | | (681,750 | ) |
Penn National Gaming, Inc. | | (11,390 | ) | | (602,075 | ) |
| | | | | | (1,283,825 | ) |
HOUSEHOLD DURABLES — (1.4)% | |
Ryland Group, Inc. | | (18,173 | ) | | (728,737 | ) |
Standard Pacific Corp. | | (191,646 | ) | | (1,596,411 | ) |
Toll Brothers, Inc. | | (40,960 | ) | | (1,336,525 | ) |
| | | | | | (3,661,673 | ) |
INDEPENDENT POWER PRODUCERS AND ENERGY TRADERS — (0.7)% | |
NRG Energy, Inc. | | (70,241 | ) | | (1,875,435 | ) |
INSURANCE — (0.5)% | |
RLI Corp. | | (16,586 | ) | | (1,267,336 | ) |
IT SERVICES — (0.6)% | |
Convergys Corp. | | (87,199 | ) | | (1,519,879 | ) |
MACHINERY — (0.5)% | |
Pentair Ltd. | | (25,716 | ) | | (1,483,556 | ) |
MEDIA — (1.6)% | |
DreamWorks Animation SKG, Inc., Class A | | (97,681 | ) | | (2,506,495 | ) |
Loral Space & Communications, Inc. | | (31,936 | ) | | (1,915,521 | ) |
| | | | | | (4,422,016 | ) |
METALS AND MINING — (2.1)% | |
AK Steel Holding Corp. | | (49,767 | ) | | (151,292 | ) |
Allied Nevada Gold Corp. | | (48,719 | ) | | (315,699 | ) |
AuRico Gold, Inc. | | (131,010 | ) | | (572,514 | ) |
Compass Minerals International, Inc. | | (10,569 | ) | | (893,397 | ) |
Hecla Mining Co. | | (185,622 | ) | | (553,153 | ) |
Royal Gold, Inc. | | (10,722 | ) | | (451,182 | ) |
Silver Standard Resources, Inc. | | (59,171 | ) | | (375,144 | ) |
Stillwater Mining Co. | | (141,847 | ) | | (1,523,437 | ) |
Tahoe Resources, Inc. | | (17,354 | ) | | (245,559 | ) |
Thompson Creek Metals Co., Inc. | | (190,097 | ) | | (575,994 | ) |
| | | | | | (5,657,371 | ) |
MULTILINE RETAIL — (0.1)% | |
J.C. Penney Co., Inc. | | (8,089 | ) | | (138,160 | ) |
OIL, GAS AND CONSUMABLE FUELS — (1.5)% | |
Approach Resources, Inc. | | (9,045 | ) | | (222,236 | ) |
Bill Barrett Corp. | | (26,830 | ) | | (542,502 | ) |
Consol Energy, Inc. | | (38,965 | ) | | (1,055,951 | ) |
Gulfport Energy Corp. | | (4,501 | ) | | (211,862 | ) |
Kodiak Oil & Gas Corp. | | (93,802 | ) | | (833,900 | ) |
Range Resources Corp. | | (3,352 | ) | | (259,177 | ) |
SM Energy Co. | | (16,561 | ) | | (993,329 | ) |
| | | | | | (4,118,957 | ) |
PHARMACEUTICALS — (0.2)% | |
ViroPharma, Inc. | | (9,039 | ) | | (258,967 | ) |
VIVUS, Inc. | | (32,115 | ) | | (404,007 | ) |
| | | | | | (662,974 | ) |
REAL ESTATE INVESTMENT TRUSTS (REITs) — (0.3)% | |
SL Green Realty Corp. | | (9,185 | ) | | (810,025 | ) |
REAL ESTATE MANAGEMENT AND DEVELOPMENT — (0.8)% | |
Brookfield Office Properties, Inc. | | (113,109 | ) | | (1,886,658 | ) |
Forest City Enterprises, Inc., Class A | | (8,407 | ) | | (150,570 | ) |
| | | | | | (2,037,228 | ) |
ROAD AND RAIL — (0.7)% | |
Genesee & Wyoming, Inc., Class A | | (22,635 | ) | | (1,920,353 | ) |
SEMICONDUCTORS AND SEMICONDUCTOR EQUIPMENT — (0.9)% | |
SunEdison, Inc. | | (285,309 | ) | | (2,330,975 | ) |
SOFTWARE — (0.3)% | |
Solera Holdings, Inc. | | (16,225 | ) | | (902,921 | ) |
SPECIALTY RETAIL — (1.9)% | |
CarMax, Inc. | | (44,608 | ) | | (2,059,105 | ) |
Pier 1 Imports, Inc. | | (52,724 | ) | | (1,238,487 | ) |
Tiffany & Co. | | (25,307 | ) | | (1,843,362 | ) |
| | | | | | (5,140,954 | ) |
TEXTILES, APPAREL AND LUXURY GOODS — (0.5)% | |
Wolverine World Wide, Inc. | | (23,336 | ) | | (1,274,379 | ) |
THRIFTS AND MORTGAGE FINANCE — (0.1)% | |
MGIC Investment Corp. | | (33,910 | ) | | $ (205,834 | ) |
TRADING COMPANIES AND DISTRIBUTORS — (2.1)% | |
Air Lease Corp. | | (78,427 | ) | | (2,163,801 | ) |
GATX Corp. | | (6,254 | ) | | (296,627 | ) |
Textainer Group Holdings Ltd. | | (54,739 | ) | | (2,104,167 | ) |
Watsco, Inc. | | (13,879 | ) | | (1,165,281 | ) |
| | | | | | (5,729,876 | ) |
TOTAL COMMON STOCKS SOLD SHORT — (29.3)% (Proceeds $74,869,567) | | | (78,540,097 | ) |
OTHER ASSETS AND LIABILITIES† | | | 78,014 | |
TOTAL NET ASSETS — 100.0% | | | $267,575,637 | |
Notes to Schedule of Investments
† | Category is less than 0.05% of total net assets. |
(1) | Security, or a portion thereof, has been pledged at the custodian bank or with a broker for collateral requirements on securities sold short. At the period end, the aggregate value of securities pledged was $222,564,339. |
See Notes to Financial Statements.
Statement of Assets and Liabilities |
JUNE 30, 2013 | |
Assets | |
Investment securities, at value (cost of $297,438,246) | | $346,037,720 | |
Deposits with broker for securities sold short | | 54,910 | |
Receivable for capital shares sold | | 27,298 | |
Dividends and interest receivable | | 287,166 | |
| | | 346,407,094 | |
| | | | |
Liabilities | | | |
Securities sold short, at value (proceeds of $74,869,567) | | 78,540,097 | |
Accrued management fees | | 243,514 | |
Dividend expense payable on securities sold short | | 45,780 | |
Broker fees and charges payable on securities sold short | | 2,066 | |
| | | 78,831,457 | |
| | | | |
Net Assets | | $267,575,637 | |
| | | | |
Institutional Class Capital Shares, $0.01 Par Value | | | |
Shares authorized | | 100,000,000 | |
Shares outstanding | | 20,496,477 | |
| | | | |
Net Asset Value Per Share | | $13.05 | |
| | | | |
Net Assets Consist of: | | | |
Capital (par value and paid-in surplus) | | $214,080,350 | |
Undistributed net investment income | | 128,812 | |
Undistributed net realized gain | | 8,437,531 | |
Net unrealized appreciation | | 44,928,944 | |
| | | $267,575,637 | |
See Notes to Financial Statements.
YEAR ENDED JUNE 30, 2013 | |
Investment Income (Loss) | |
Income: | | | |
Dividends (net of foreign taxes withheld of $18,098) | | $6,737,558 | |
Interest | | 4,647 | |
| | | 6,742,205 | |
| | | | |
Expenses: | | | |
Dividend expense on securities sold short | | 689,139 | |
Broker fees and charges on securities sold short | | 550,619 | |
Management fees | | 2,469,857 | |
Directors’ fees and expenses | | 10,014 | |
Other expenses | | 52 | |
| | | 3,719,681 | |
| | | | |
Net investment income (loss) | | 3,022,524 | |
| | | | |
Realized and Unrealized Gain (Loss) | | | |
Net realized gain (loss) on: | | | |
Investment transactions | | 20,002,370 | |
Securities sold short transactions | | (8,674,847 | ) |
Futures contract transactions | | 422,359 | |
Foreign currency transactions | | 460 | |
| | | 11,750,342 | |
| | | | |
Change in net unrealized appreciation (depreciation) on: | | | |
Investments | | 37,409,241 | |
Securities sold short | | (6,608,286 | ) |
Translation of assets and liabilities in foreign currencies | | (120 | ) |
| | | 30,800,835 | |
| | | | |
Net realized and unrealized gain (loss) | | 42,551,177 | |
| | | | |
Net Increase (Decrease) in Net Assets Resulting from Operations | | $45,573,701 | |
See Notes to Financial Statements.
Statement of Changes in Net Assets |
YEAR ENDED JUNE 30, 2013 AND PERIOD ENDED JUNE 30, 2012 | |
Increase (Decrease) in Net Assets | | June 30, 2013 | | | June 30, 2012(1) | |
Operations | |
Net investment income (loss) | | $3,022,524 | | | $518,240 | |
Net realized gain (loss) | | 11,750,342 | | | (655,559 | ) |
Change in net unrealized appreciation (depreciation) | | 30,800,835 | | | 14,128,109 | |
Net increase (decrease) in net assets resulting from operations | | 45,573,701 | | | 13,990,790 | |
| | | | | | | |
Distributions to Shareholders | | | | | | |
From net investment income | | (3,503,918 | ) | | (62,154 | ) |
From net realized gains | | (2,503,132 | ) | | — | |
Decrease in net assets from distributions | | (6,007,050 | ) | | (62,154 | ) |
| | | | | | | |
Capital Share Transactions | | | | | | |
Proceeds from shares sold | | 55,757,312 | | | 174,768,199 | |
Proceeds from reinvestment of distributions | | 6,007,050 | | | 62,154 | |
Payments for shares redeemed | | (22,403,513 | ) | | (110,852 | ) |
Net increase (decrease) in net assets from capital share transactions | | 39,360,849 | | | 174,719,501 | |
| | | | | | | |
Net increase (decrease) in net assets | | 78,927,500 | | | 188,648,137 | |
| | | | | | | |
Net Assets | | | | | | |
Beginning of period | | 188,648,137 | | | — | |
End of period | | $267,575,637 | | | $188,648,137 | |
| | | | | | | |
Undistributed net investment income | | $128,812 | | | $465,551 | |
| | | | | | | |
Transactions in Shares of the Fund | | | | | | |
Sold | | 4,747,230 | | | 17,234,318 | |
Issued in reinvestment of distributions | | 507,547 | | | 6,130 | |
Redeemed | | (1,988,165 | ) | | (10,583 | ) |
Net increase (decrease) in shares of the fund | | 3,266,612 | | | 17,229,865 | |
(1) | December 1, 2011 (fund inception) through June 30, 2012. |
See Notes to Financial Statements.
YEAR ENDED JUNE 30, 2013 | |
Cash Flows From (Used In) Operating Activities | |
Net increase (decrease) in net assets resulting from operations | | $45,573,701 | |
Adjustments to reconcile net increase (decrease) in net assets resulting from operations to net cash from (used in) operating activities: | | | |
Purchases of investment securities | | (265,613,406 | ) |
Proceeds from investments sold | | 219,501,199 | |
Purchases to cover securities sold short | | (90,289,999 | ) |
Proceeds from securities sold short | | 97,581,797 | |
(Increase) decrease in short-term investments | | (1,257,253 | ) |
(Increase) decrease in deposits with broker for securities sold short | | 2,222,463 | |
(Increase) decrease in receivable for investments sold | | 1,017,795 | |
(Increase) decrease in dividends and interest receivable | | (87,461 | ) |
Increase (decrease) in accrued management fees | | 79,769 | |
Increase (decrease) in dividend expense payable on securities sold short | | 25,451 | |
Increase (decrease) in broker fees and charges payable on securities sold short | | (1,886 | ) |
Change in net unrealized (appreciation) depreciation on investments | | (37,409,241 | ) |
Net realized (gain) loss on investment transactions | | (20,002,370 | ) |
Change in net unrealized (appreciation) depreciation on securities sold short | | 6,608,286 | |
Net realized (gain) loss on securities sold short transactions | | 8,674,847 | |
Net cash from (used in) operating activities | | (33,376,308 | ) |
| | | | |
Cash Flows From (Used In) Financing Activities | | | |
Proceeds from shares sold | | 55,767,012 | |
Payments for shares redeemed | | (22,403,513 | ) |
Distributions paid, net of reinvestments | | — | |
Net cash from (used in) financing activities | | 33,363,499 | |
| | | | |
Net Increase (Decrease) In Cash | | (12,809 | ) |
Cash at beginning of period | | 12,809 | |
Cash at end of period | | — | |
| | | | |
Supplemental disclosure of cash flow information: | | | |
Non cash financing activities not included herein consist of all reinvestment of distributions of $6,007,050. | | | |
See Notes to Financial Statements.
Notes to Financial Statements |
JUNE 30, 2013
1. Organization
American Century Quantitative Equity Funds, Inc. (the corporation) is registered under the Investment Company Act of 1940, as amended (the 1940 Act), as an open-end management investment company and is organized as a Maryland corporation. NT Core Equity Plus Fund (the fund) is one fund in a series issued by the corporation. The fund is diversified as defined under the 1940 Act. The fund’s investment objective is to seek long-term capital growth. The fund is not permitted to invest in securities issued by companies assigned the Global Industry Classification Standard for the tobacco industry. The fund incepted on December 1, 2011.
2. Significant Accounting Policies
The following is a summary of significant accounting policies consistently followed by the fund in preparation of its financial statements. The financial statements are prepared in conformity with accounting principles generally accepted in the United States of America, which may require management to make certain estimates and assumptions at the date of the financial statements. Actual results could differ from these estimates.
Investment Valuations — The fund determines the fair value of its investments and computes its net asset value per share as of the close of regular trading (usually 4 p.m. Eastern time) on the New York Stock Exchange (NYSE) on each day the NYSE is open.
Equity securities that are listed or traded on a domestic securities exchange are valued at the last reported sales price or at the official closing price as provided by the exchange. Equity securities traded on foreign securities exchanges are typically valued at the closing price on the exchange where primarily traded or as of the close of the NYSE, if that is earlier. If no last sales price is reported, or if local convention or regulation so provides, the mean of the latest bid and asked prices is used. Depending on local convention or regulation, securities traded over-the-counter are valued at the mean of the latest bid and asked prices, the last sales price, or the official closing price. In its determination of fair value, the fund may review several factors including: market information specific to a security; news developments in U.S. and foreign markets; the performance of particular U.S. and foreign securities, indices, comparable securities, American Depositary Receipts, Exchange-Traded Funds, and other relevant market indicators.
Debt securities maturing within 60 days at the time of purchase may be valued at cost, plus or minus any amortized discount or premium or at the evaluated mean as provided by an independent pricing service. Evaluated mean prices are commonly derived through utilization of market models, which may consider, among other factors, trade data, quotations from dealers and active market makers, relevant yield curve and spread data, related sector levels, creditworthiness, and other relevant market information on the same or comparable securities.
Investments in open-end management investment companies are valued at the reported net asset value per share. Repurchase agreements are valued at cost. Exchange-traded futures contracts are valued at the settlement price as provided by the appropriate clearing corporation.
The value of investments initially expressed in foreign currencies is translated into U.S. dollars at prevailing exchange rates.
If the fund determines that the market price for a portfolio security is not readily available or the valuation methods mentioned above do not reflect a security’s fair value, such security is valued as determined in good faith by the Board of Directors or its designee, in accordance with procedures adopted by the Board of Directors. Circumstances that may cause the fund to use these procedures to value a security include, but are not limited to: a security has been declared in default; trading in a security has been halted during the trading day; there is a foreign market holiday and no trading occurred; or an event occurred between the close of a foreign exchange and the NYSE that may affect the value of a security.
Security Transactions — Security transactions are accounted for as of the trade date. Net realized gains and losses are determined on the identified cost basis, which is also used for federal income tax purposes.Investment Income — Dividend income less foreign taxes withheld, if any, is recorded as of the ex-dividend date. Distributions received on securities that represent a return of capital or long-term capital gain are recorded as a reduction of cost of investments and/or as a realized gain. The fund may estimate the components of distributions received that may be considered nontaxable distributions or long-term capital gain distributions for income tax purposes. Interest income is recorded on the accrual basis and includes accretion of discounts and amortization of premiums.
Securities Sold Short — The fund enters into short sales, which is selling securities it does not own, as part of its normal investment activities. Upon selling a security short, the fund will segregate cash, cash equivalents or other appropriate liquid securities in at least an amount equal to the current market value of the securities sold short until the fund replaces the borrowed security. Interest earned on segregated cash for securities sold short is reflected as interest income. The fund is required to pay any dividends or interest due on securities sold short. Such dividends and interest are recorded as an expense. The fund may pay fees or charges on the assets borrowed for securities sold short. Liabilities for securities sold short are valued daily and changes in value are recorded as change in net unrealized appreciation (depreciation) on securities sold short. The fund records realized gain (loss) on a security sold short when it is terminated by the fund and includes as a component of net realized gain (loss) on securities sold short transactions.
Foreign Currency Translations — All assets and liabilities initially expressed in foreign currencies are translated into U.S. dollars at prevailing exchange rates at period end. The fund may enter into spot foreign currency exchange contracts to facilitate transactions denominated in a foreign currency. Purchases and sales of investment securities, dividend and interest income, spot foreign currency exchange contracts, and expenses are translated at the rates of exchange prevailing on the respective dates of such transactions. Net realized and unrealized foreign currency exchange gains or losses related to investment securities are a component of net realized gain (loss) on investment transactions and change in net unrealized appreciation (depreciation) on investments, respectively. Net realized and unrealized foreign currency exchange gains or losses related to securities sold short are a component of net realized gain (loss) on securities sold short transactions and change in net unrealized appreciation (depreciation) on securities sold short, respectively.
Repurchase Agreements — The fund may enter into repurchase agreements with institutions that American Century Investment Management, Inc. (ACIM) (the investment advisor) has determined are creditworthy pursuant to criteria adopted by the Board of Directors. The fund requires that the collateral, represented by securities, received in a repurchase transaction be transferred to the custodian in a manner sufficient to enable the fund to obtain those securities in the event of a default under the repurchase agreement. ACIM monitors, on a daily basis, the securities transferred to ensure the value, including accrued interest, of the securities under each repurchase agreement is equal to or greater than amounts owed to the fund under each repurchase agreement.
Joint Trading Account — Pursuant to an Exemptive Order issued by the Securities and Exchange Commission, the fund, along with certain other funds in the American Century Investments family of funds, may transfer uninvested cash balances into a joint trading account. These balances are invested in one or more repurchase agreements that are collateralized by U.S. Treasury or Agency obligations.
Segregated Assets — In accordance with the 1940 Act, the fund segregates assets on its books and records to cover certain types of investments, including, but not limited to, futures contracts and short sales. ACIM monitors, on a daily basis, the securities segregated to ensure the fund designates a sufficient amount of liquid assets, marked-to-market daily. The fund may also receive assets or be required to pledge assets at the custodian bank or with a broker for margin requirements on futures contracts and short sales.
Income Tax Status — It is the fund’s policy to distribute substantially all net investment income and net realized gains to shareholders and to otherwise qualify as a regulated investment company under provisions of the Internal Revenue Code. Accordingly, no provision has been made for income taxes. The fund files U.S. federal, state, local and non-U.S. tax returns as applicable. The fund’s tax returns are subject to examination by the relevant taxing authority until expiration of the applicable statute of limitations, which is generally three years from the date of filing but can be longer in certain jurisdictions. At this time, management believes there are no uncertain tax positions which, based on their technical merit, would not be sustained upon examination and for which it is reasonably possible that the total amounts of unrecognized tax benefits will significantly change in the next twelve months.Distributions to Shareholders — Distributions from net investment income, if any, are generally declared and paid semiannually. Distributions from net realized gains, if any, are generally declared and paid annually.
Indemnifications — Under the corporation’s organizational documents, its officers and directors are indemnified against certain liabilities arising out of the performance of their duties to the fund. In addition, in the normal course of business, the fund enters into contracts that provide general indemnifications. The maximum exposure under these arrangements is unknown as this would involve future claims that may be made against a fund. The risk of material loss from such claims is considered by management to be remote.
Statement of Cash Flows — The beginning of period and end of period cash in the Statement of Cash Flows is the amount of domestic and foreign currency included in the fund’s Statement of Assets and Liabilities and represents the cash on hand at the custodian bank and does not include any short-term investments or deposits with brokers for securities sold short.
3. Fees and Transactions with Related Parties
Management Fees — The corporation has entered into a management agreement with ACIM, under which ACIM provides the fund with investment advisory and management services in exchange for a single, unified management fee (the fee). The agreement provides that all expenses of managing and operating the fund, except distribution and service fees, expenses on securities sold short, brokerage expenses, taxes, interest, fees and expenses of the independent directors (including legal counsel fees), and extraordinary expenses, will be paid by ACIM. The fee is computed and accrued daily based on the daily net assets of the fund and paid monthly in arrears. The fee consists of (1) an Investment Category Fee based on the daily net assets of the fund and certain other accounts managed by the investment advisor that are in the same broad investment category as the fund and (2) a Complex Fee based on the assets of all the funds in the American Century Investments family of funds. The rates for the Investment Category Fee range from 0.9680% to 1.1500%. The rates for the Complex Fee range from 0.0500% to 0.1100%. The effective annual management fee for the year ended June 30, 2013 was 1.10%.
Related Parties — Certain officers and directors of the corporation are also officers and/or directors of American Century Companies, Inc. (ACC). The corporation’s investment advisor, ACIM, the corporation’s distributor, American Century Investment Services, Inc., and the corporation’s transfer agent, American Century Services, LLC are wholly owned, directly or indirectly, by ACC. Various funds issued by American Century Asset Allocation Portfolios, Inc. own, in aggregate, 100% of the shares of the fund. Related parties do not invest in the fund for the purpose of exercising management or control.
4. Investment Transactions
Purchases and sales of investment securities and securities sold short, excluding short-term investments, for the year ended June 30, 2013 were $355,575,963 and $317,023,863, respectively.
5. Fair Value MeasurementsThe fund’s securities valuation process is based on several considerations and may use multiple inputs to determine the fair value of the positions held by the fund. In conformity with accounting principles generally accepted in the United States of America, the inputs used to determine a valuation are classified into three broad levels as follows:
• | Level 1 valuation inputs consist of unadjusted quoted prices in an active market for identical securities; |
• | Level 2 valuation inputs consist of direct or indirect observable market data (including quoted prices for similar securities, evaluations of subsequent market events, interest rates, prepayment speeds, credit risk, etc.); or |
• | Level 3 valuation inputs consist of unobservable data (including a fund’s own assumptions). |
The level classification is based on the lowest level input that is significant to the fair valuation measurement. The valuation inputs are not necessarily an indication of the risks associated with investing in these securities or other financial instruments.
The following is a summary of the level classifications as of period end. The Schedule of Investments provides additional information on the fund’s portfolio holdings.
| | | | |
| | Level 1 | Level 2 | Level 3 |
Investment Securities |
Common Stocks | $343,513,382 | — | — |
Temporary Cash Investments | 911,848 | $1,612,490 | — |
Total Value of Investment Securities | $344,425,230 | $1,612,490 | — |
| |
Securities Sold Short |
Total Value of Common Stocks Sold Short | $(78,540,097) | — | — |
6. Derivative Instruments
Equity Price Risk — The fund is subject to equity price risk in the normal course of pursuing its investment objectives. A fund may enter into futures contracts based on an equity index in order to manage its exposure to changes in market conditions. A fund may purchase futures contracts to gain exposure to increases in market value or sell futures contracts to protect against a decline in market value. Upon entering into a futures contract, a fund is required to deposit either cash or securities in an amount equal to a certain percentage of the contract value (initial margin). Subsequent payments (variation margin) are made or received daily, in cash, by a fund. The variation margin is equal to the daily change in the contract value and is recorded as unrealized gains and losses. A fund recognizes a realized gain or loss when the contract is closed or expires. Net realized and unrealized gains or losses occurring during the holding period of futures contracts are a component of net realized gain (loss) on futures contract transactions and change in net unrealized appreciation (depreciation) on futures contracts, respectively. One of the risks of entering into futures contracts is the possibility that the change in value of the contract may not correlate with the changes in value of the underlying securities. During the period, the fund infrequently purchased equity price risk derivative instruments for temporary investment purposes.
At period end, the fund did not have any derivative instruments disclosed on the Statement of Assets and Liabilities. For the year ended June 30, 2013, the effect of equity price risk derivative instruments on the Statement of Operations was $422,359 in net realized gain (loss) on futures contract transactions.
7. Risk Factors
The fund’s investment strategy utilizes leverage, which can increase market exposure and subject the fund to greater risk and higher volatility.
The fund’s investment process may result in high portfolio turnover, which could mean high transaction costs, affecting both performance and capital gains tax liabilities to investors.
The fund is subject to short sales risk. If the market price of a security increases after the fund borrows the security, the fund may suffer a loss when it replaces the borrowed security at the higher price. Any loss will be increased by the amount of compensation, interest or dividends, and transaction costs the fund must pay to the lender of the borrowed security.
If the fund is overweighted in a stock or sector, any negative development related to that stock or sector will have a greater impact on the fund than other funds that are not overweighted in that stock or sector.
8. Federal Tax Information
The tax character of distributions paid during the year ended June 30, 2013 and period December 1, 2011 (fund inception) through June 30, 2012 were as follows:
| | | |
| | 2013 | 2012 |
Distributions Paid From |
Ordinary income | $5,753,135 | $62,154 |
Long-term capital gains | $253,915 | — |
The book-basis character of distributions made during the year from net investment income or net realized gains may differ from their ultimate characterization for federal income tax purposes. These differences reflect the differing character of certain income items and net realized gains and losses for financial statement and tax purposes, and may result in reclassification among certain capital accounts on the financial statements.
As of June 30, 2013, the federal tax cost of investments and the components of distributable earnings on a tax-basis were as follows:
| | |
Federal tax cost of investments | $297,596,590 |
Gross tax appreciation of investments | $53,126,279 |
Gross tax depreciation of investments | (4,685,149) |
Net tax appreciation (depreciation) of investments | $48,441,130 |
Net tax appreciation (depreciation) on securities sold short | $(3,792,221) |
Net tax appreciation (depreciation) | $44,648,909 |
Undistributed ordinary income | $2,422,105 |
Accumulated long-term gains | $6,424,273 |
The difference between book-basis and tax-basis unrealized appreciation (depreciation) is attributable primarily to the tax deferral of losses on wash sales.
| |
For a Share Outstanding Throughout the Years Ended June 30 (except as noted) |
Per-Share Data | Ratios and Supplemental Data |
| | | Income From Investment Operations: | Distributions From: | | | Ratio to Average Net Assets of: | | |
| | Net Asset
Value,
Beginning
of Period | Net
Investment
Income
(Loss)(1) | Net
Realized
and
Unrealized
Gain (Loss) | Total From
Investment
Operations | Net
Investment
Income | Net
Realized
Gains | Total
Distributions | Net Asset
Value, End
of Period | Total
Return(2) | Operating
Expenses | Operating
Expenses
(excluding
expenses on
securities
sold short) | Net
Investment
Income
(Loss) | Portfolio
Turnover
Rate | Net Assets, End of Period (in thousands) |
Institutional Class |
2013 | $10.95 | 0.16 | 2.26 | 2.42 | (0.18) | (0.14) | (0.32) | $13.05 | 22.54% | 1.66% | 1.10% | 1.35% | 111% | $267,576 |
2012(3) | $10.00 | 0.03 | 0.92 | 0.95 | —(4) | — | —(4) | $10.95 | 9.55% | 1.86%(5) | 1.11%(5) | 0.53%(5) | 81% | $188,648 |
Notes to Financial Highlights
(1) | Computed using average shares outstanding throughout the period. |
(2) | Total returns are calculated based on the net asset value of the last business day. Total returns for periods less than one year are not annualized. |
(3) | December 1, 2011 (fund inception) through June 30, 2012. |
(4) | Per-share amount was less than $0.005. |
See Notes to Financial Statements.
Report of Independent Registered Public Accounting Firm |
To the Directors of the American Century Quantitative Equity Funds, Inc. and Shareholders of the NT Core Equity Plus Fund:
In our opinion, the accompanying statement of assets and liabilities, including the schedule of investments, and the related statements of operations, of changes in net assets and of cash flows and the financial highlights present fairly, in all material respects, the financial position of the NT Core Equity Plus Fund (one of the fourteen funds comprising the American Century Quantitative Equity Funds, Inc., hereafter referred to as the “Fund”) at June 30, 2013, the results of its operations for the year then ended, the changes in its net assets for each of the periods presented, its cash flows for the year then ended, and the financial highlights for each of the periods presented, in conformity with accounting principles generally accepted in the United States of America. These financial statements and financial highlights (hereafter referred to as “financial statements”) are the responsibility of the Fund’s management; our responsibility is to express an opinion on these financial statements based on our audits. We conducted our audits of these financial statements in accordance with the standards of the Public Company Accounting Oversight Board (United States). Those standards require that we plan and perform the audit to obtain reasonable assurance about whether the financial statements are free of material misstatement. An audit includes examining, on a test basis, evidence supporting the amounts and disclosures in the financial statements, assessing the accounting principles used and significant estimates made by management, and evaluating the overall financial statement presentation. We believe that our audits, which included confirmation of securities at June 30, 2013 by correspondence with the custodian and brokers, provide a reasonable basis for our opinion.
PricewaterhouseCoopers LLP
Kansas City, Missouri
August 21, 2013
Board of Directors
The individuals listed below serve as directors of the funds. Each director will continue to serve in this capacity until death, retirement, resignation or removal from office. The board has adopted a mandatory retirement age for directors who are not “interested persons,” as that term is defined in the Investment Company Act (independent directors). Independent directors shall retire on December 31 of the year in which they reach their 75th birthday; provided, however, that on or after January 1, 2022, independent directors shall retire on December 31 of the year in which they reach their 76th birthday.
Mr. Thomas is the only director who is an “interested person” because he currently serves as President and Chief Executive Officer of American Century Companies, Inc. (ACC), the parent company of American Century Investment Management, Inc. (ACIM or the advisor).
The other directors (more than three-fourths of the total number) are independent; that is, they have never been employees, directors or officers of, and have no financial interest in, ACC or any of its wholly owned, direct or indirect, subsidiaries, including ACIM, American Century Investment Services, Inc. (ACIS) and American Century Services, LLC (ACS). The directors serve in this capacity for eight (in the case of Mr. Thomas, 15) registered investment companies in the American Century Investments family of funds.
The following table presents additional information about the directors. The mailing address for each director other than Mr. Thomas is 1665 Charleston Road, Mountain View, California 94043. The mailing address for Mr. Thomas is 4500 Main Street, Kansas City, Missouri 64111.
| | | | | | | |
Name
(Year of Birth) | Position(s) Held with Funds | Length of Time Served | Principal Occupation(s) During Past 5 Years | | Number of American Century Portfolios Overseen by Director | Other Directorships Held During Past 5 Years |
Independent Directors |
Tanya S. Beder (1955) | Director | Since 2011 | Chairman, SBCC Group Inc. (independent advisory services) (2006 to present) | | 41 | CYS Investments, Inc. (specialty finance company) |
Jeremy I. Bulow (1954) | Director | Since 2011 | Professor of Economics, Stanford University, Graduate School of Business (1979 to present) | | 41 | None |
Ronald J. Gilson (1946) | Director and Chairman of the Board | Since 1995 | Charles J. Meyers Professor of Law and Business, Stanford Law School (1979 to present); Marc and Eva Stern Professor of Law and Business, Columbia University School of Law (1992 to present) | | 41 | None |
Frederick L. A. Grauer
(1946) | Director | Since 2008 | Senior Advisor, BlackRock, Inc. (investment management firm) (2010 to 2011); Senior Advisor, Barclays Global Investors (investment management firm) (2003 to 2009) | | 41 | None |
| | | | | | | |
Name
(Year of Birth) | Position(s) Held with Funds | Length of Time Served | Principal Occupation(s) During Past 5 Years | | Number of American Century Portfolios Overseen by Director | Other Directorships Held During Past 5 Years |
Independent Directors |
Peter F. Pervere (1947) | Director | Since 2007 | Retired | | 41 | Intraware, Inc. (2003 to 2009) |
Myron S. Scholes (1941) | Director | Since 1980 | Chairman, Platinum Grove Asset Management, L.P. (asset manager) (1999 to 2009); Frank E. Buck Professor of Finance-Emeritus, Stanford Graduate School of Business (1996 to present) | | 41 | Dimensional Fund Advisors (investment advisor); CME Group, Inc. (futures and options exchange) |
John B. Shoven (1947) | Director | Since 2002 | Professor of Economics, Stanford University (1973 to present) | | 41 | Cadence Design Systems; Exponent; Financial Engines |
| |
Interested Director |
Jonathan S. Thomas
(1963) | Director and President | Since 2007 | President and Chief Executive Officer, ACC (March 2007 to present). Also serves as Chief Executive Officer and Manager, ACS; Executive Vice President, ACIM; Director, ACC, ACIM and other ACC subsidiaries | | 106 | None |
Officers
The following table presents certain information about the executive officers of the funds. Each officer serves as an officer for each of the 15 investment companies in the American Century family of funds, unless otherwise noted. No officer is compensated for his or her service as an officer of the funds. The listed officers are interested persons of the funds and are appointed or re-appointed on an annual basis. The mailing address for each of the officers listed below is 4500 Main Street, Kansas City, Missouri 64111.
| | | |
Name
(Year of Birth) | Offices with the Funds | Principal Occupation(s) During the Past Five Years |
Jonathan S. Thomas
(1963) | Director and President since 2007 | President and Chief Executive Officer, ACC (March 2007 to present). Also serves as Chief Executive Officer and Manager, ACS; Executive Vice President, ACIM; Director, ACC, ACIM and other ACC subsidiaries |
Maryanne L. Roepke
(1956) | Chief Compliance Officer since 2006 and Senior Vice President since 2000 | Chief Compliance Officer, American Century funds, ACIM and ACS (August 2006 to present). Also serves as Senior Vice President, ACS |
Charles A. Etherington (1957) | General Counsel since 2007 and Senior Vice President since 2006 | Attorney, ACC (February 1994 to present); Vice President, ACC (November 2005 to present); General Counsel, ACC (March 2007 to present). Also serves as General Counsel, ACIM, ACS, ACIS and other ACC subsidiaries; and Senior Vice President, ACIM and ACS |
C. Jean Wade (1964) | Vice President, Treasurer and Chief Financial Officer since 2012 | Vice President, ACS (February 2000 to present) |
Robert J. Leach (1966) | Vice President since 2006 and Assistant Treasurer since 2012 | Vice President, ACS (February 2000 to present) |
David H. Reinmiller (1963) | Vice President since 2001 | Attorney, ACC (January 1994 to present); Associate General Counsel, ACC (January 2001 to present). Also serves as Vice President, ACIM and ACS |
Ward D. Stauffer (1960) | Secretary since 2005 | Attorney, ACC (June 2003 to present) |
The Statement of Additional Information has additional information about the fund’s directors and is available without charge, upon request, by calling 1-800-345-2021.
Approval of Management Agreement |
At a meeting held on June 11, 2013, the Fund’s Board of Directors/Trustees unanimously approved the renewal of the management agreement pursuant to which American Century Investment Management, Inc. (the “Advisor”) acts as the investment advisor for the Fund. Under Section 15(c) of the Investment Company Act, contracts for investment advisory services are required to be reviewed, evaluated, and approved by a majority of a fund’s directors/trustees (the “Directors”), including a majority of the independent Directors each year. The Board regards this annual evaluation and renewal as one of its most important responsibilities.
In connection with their annual review and evaluation, the independent Directors memorialized a statement regarding the relationship between their ongoing obligations to oversee and evaluate the performance of the Advisor and their consideration of renewal of the management agreement. In that statement, the independent Directors noted that their assessment of the Advisor’s performance is an ongoing process that takes place over the entire year and is informed by all of the information that the Board and its committees receive and consider over time. This information, together with the materials provided in connection with the review, are central to the Board’s assessment of the Advisor’s performance and its determination whether to renew the Fund’s management agreement.
Prior to its consideration of the renewal of the management agreement, the Board requested and reviewed extensive data and analysis relating to the proposed renewal. This information and analysis was compiled by the Advisor and certain independent providers of evaluation data concerning the Fund and the services provided to the Fund by the Advisor.
In connection with its consideration of the renewal of the management agreement, the Board’s review and evaluation of the services provided by the Advisor included, but was not limited to, the following:
• | the nature, extent, and quality of investment management, shareholder services, and other services provided by the Advisor to the Fund; |
• | the wide range of other programs and services the Advisor provides to the Fund and its shareholders on a routine and non-routine basis; |
• | the investment performance of the Fund, including data comparing the Fund’s performance to appropriate benchmarks and/or a peer group of other mutual funds with similar investment objectives and strategies; |
• | data comparing the cost of owning the Fund to the cost of owning similar funds; |
• | the Advisor’s compliance policies, procedures, and regulatory experience; |
• | financial data showing the cost of services provided to the Fund, the profitability of the Fund to the Advisor, and the overall profitability of the Advisor; |
• | possible economies of scale associated with the Advisor’s management of the Fund and other accounts under its management; |
• | data comparing services provided and charges to other investment management clients of the Advisor; and |
• | consideration of collateral benefits derived by the Advisor from the management of the Fund. |
In keeping with its practice, the Board held two in-person meetings to review and discuss the information provided. The Board also had the benefit of the advice of its independent counsel throughout the period.
Factors Considered
The Directors considered all of the information provided by the Advisor, the independent data providers, and the Board’s independent counsel in connection with the review, and evaluated such information for the Fund. In connection with their review, the Directors did not identify any single factor as being all-important or controlling and each Director may have attributed different levels of importance to different factors. In deciding to renew the management agreement, the Board based its decision on a number of factors, including the following:
Nature, Extent and Quality of Services — Generally. Under the management agreement, the Advisor is responsible for providing or arranging for all services necessary for the operation of the Fund. The Board noted that under the management agreement, the Advisor provides or arranges at its own expense a wide variety of services including:
• | constructing and designing the Fund |
• | portfolio research and security selection |
• | initial capitalization/funding |
• | daily valuation of the Fund’s portfolio |
• | shareholder servicing and transfer agency, including shareholder confirmations, recordkeeping, and communications |
• | regulatory and portfolio compliance |
• | marketing and distribution |
The Board noted that many of these services have expanded over time both in terms of quantity and complexity in response to shareholder demands, competition in the industry, changing distribution channels, and the changing regulatory environment.
Investment Management Services. The nature of the investment management services provided to the Fund is quite complex and allows Fund shareholders access to professional money management, instant diversification of their investments within an asset class, the opportunity to easily diversify among asset classes by investing in or exchanging among various American Century Investments funds, and liquidity. In evaluating investment performance, the Board expects the Advisor to manage the Fund in accordance with its investment objectives and approved strategies. Further, the Directors recognize that the Advisor has an obligation to seek the best execution of fund trades. In providing these services, the Advisor utilizes teams of investment professionals (portfolio managers, analysts, research assistants, and securities traders) who require extensive information technology, research, training, compliance and other systems to conduct their business. The Board, directly and through its Portfolio Committee, regularly reviews investment performance information for the Fund, together with comparative information for appropriate benchmarks and/or peer groups of similarly-managed funds, over different time horizons. The Directors also review detailed performance information during the management agreement approval process. If performance concerns are identified, the Fund receives special reviews until performance improves, during which the Board discusses with the Advisor the reasons for such results (e.g., market conditions, security selection) and any efforts being undertaken to improve performance. The Board found the investment management services provided by the Advisor to the Fund to meet or exceed industry standards. More detailed information about the Fund’s performance can be found in the Performance and Portfolio Commentary sections of this report.
Shareholder and Other Services. Under the management agreement, the Advisor provides the Fund with a comprehensive package of transfer agency, shareholder, and other services. The Board, directly and through various committees of the Board, regularly reviews reports and evaluations of such services at its regular meetings. These reports include, but are not limited to, information regarding the operational efficiency and accuracy of the shareholder and transfer agency services provided, staffing levels, shareholder satisfaction (as measured by external as well as internal sources), technology support, new products and services offered to Fund shareholders, securities trading activities, portfolio valuation services, auditing services, and legal and operational compliance activities. Certain aspects of shareholder and transfer agency service level efficiency and the quality of securities trading activities are measured by independent third party providers and are presented in comparison to other fund groups not managed by the Advisor. The Board found the services provided by the Advisor to the Fund under the management agreement to be competitive and of high quality.
Costs of Services and Profitability. The Advisor provides detailed information concerning its cost of providing various services to the Fund, its profitability in managing the Fund, its overall profitability, and its financial condition. The Directors have reviewed with the Advisor the methodology used to prepare this financial information. The financial information regarding the Advisor is considered in evaluating the Advisor’s financial condition, its ability to continue
to provide services under the management agreement, and the reasonableness of the current management fee. The Board concluded that the Advisor’s profits were reasonable in light of the services provided to the Fund.
Ethics. The Board generally considers the Advisor’s commitment to providing quality services to shareholders and to conducting its business ethically. They noted that the Advisor’s practices generally meet or exceed industry best practices.
Economies of Scale. The Board also reviewed information provided by the Advisor regarding the possible existence of economies of scale in connection with the management of the Fund. The Board concluded that economies of scale are difficult to measure and predict with precision, especially on a fund-by-fund basis. The Board concluded that the Advisor is appropriately sharing economies of scale through its competitive fee structure, offering competitive fees from fund inception, and through reinvestment in its business to provide shareholders additional content and services.
Comparison to Other Funds’ Fees. The management agreement provides that the Fund pay the Advisor a single, all-inclusive (or unified) management fee for providing all services necessary for the management and operation of the Fund, other than brokerage expenses, taxes, interest, extraordinary expenses, and the fees and expenses of the Fund’s independent directors (including their independent legal counsel) and expenses incurred in connection with the provision of shareholder services and distribution services under a plan adopted pursuant to Rule 12b-1 under the 1940 Act. Under the unified fee structure, the Advisor is responsible for providing all investment advisory, custody, audit, administrative, compliance, recordkeeping, marketing and shareholder services, or arranging and supervising third parties to provide such services. By contrast, most other funds are charged a variety of fees, including an investment advisory fee, a transfer agency fee, an administrative fee, distribution charges and other expenses. Other than their investment advisory fees and any applicable Rule 12b-1 distribution fees, all other components of the total fees charged by these other funds may be increased without shareholder approval. The Board believes the unified fee structure is a benefit to Fund shareholders because it clearly discloses to shareholders the cost of owning Fund shares, and, since the unified fee cannot be increased without a vote of Fund shareholders, it shifts to the Advisor the risk of increased costs of operating the Fund and provides a direct incentive to minimize administrative inefficiencies. Part of the Board’s analysis of fee levels involves reviewing certain evaluative data compiled by an independent provider and comparing the Fund’s unified fee to the total expense ratio of other funds in the Fund’s peer group. The Board concluded that the management fee paid by the Fund to the Advisor under the management agreement is reasonable in light of the services provided to the Fund.
Comparison to Fees and Services Provided to Other Clients of the Advisor. The Board also requested and received information from the Advisor concerning the nature of the services, fees, costs and profitability of its advisory services to advisory clients other than the Fund. They observed that these varying types of client accounts require different services and involve different regulatory and entrepreneurial risks than the management of the Fund. The Board analyzed this information and concluded that the fees charged and services provided to the Fund were reasonable by comparison.
Collateral or “Fall-Out” Benefits Derived by the Advisor. The Board considered the existence of collateral benefits the Advisor may receive as a result of its relationship with the Fund. They concluded that the Advisor’s primary business is managing mutual funds and it generally does not use fund or shareholder information to generate profits in other lines of business, and therefore does not derive any significant collateral benefits from them. The Board noted that the Advisor receives proprietary research from broker-dealers that execute fund portfolio transactions and concluded that this research is likely to benefit Fund shareholders. The Board also determined that the Advisor is able to provide investment management services to certain clients other than the Fund, at least in part, due to its existing infrastructure built to serve the fund complex. The Board concluded, however, that the assets of those other clients are not material to the analysis and, where applicable, may be included with the assets of the Fund to determine breakpoints in the management fee schedule.
Existing Relationship. The Board also considered whether there was any reason for not continuing the existing arrangement with the Advisor. In this regard, the Board was mindful of the potential disruptions of the Fund’s operations and various risks, uncertainties, and other effects that could occur as a result of a decision not to continue such relationship. In particular, the Board recognized that most shareholders have invested in the Fund on the strength of the Advisor’s industry standing and reputation and in the expectation that the Advisor will have a continuing role in providing advisory services to the Fund.
Conclusion of the Directors. As a result of this process, the Board, including all of the independent directors and assisted by the advice of independent legal counsel, taking into account all of the factors discussed above and the information provided by the Advisor and others, concluded that the management agreement between the Fund and the Advisor is fair and reasonable in light of the services provided and should be renewed.
Retirement Account Information
As required by law, distributions you receive from certain IRAs are subject to federal income tax withholding, unless you elect not to have withholding apply. Tax will be withheld on the total amount withdrawn even though you may be receiving amounts that are not subject to withholding, such as nondeductible contributions. In such case, excess amounts of withholding could occur. You may adjust your withholding election so that a greater or lesser amount will be withheld.
If you don’t want us to withhold on this amount, you must notify us to not withhold the federal income tax. You may notify us in writing or in certain situations by telephone or through other electronic means. For systematic withdrawals, your withholding election will remain in effect until revoked or changed by filing a new election. You have the right to revoke your election at any time.
Remember, even if you elect not to have income tax withheld, you are liable for paying income tax on the taxable portion of your withdrawal. If you elect not to have income tax withheld or you don’t have enough income tax withheld, you may be responsible for payment of estimated tax. You may incur penalties under the estimated tax rules if your withholding and estimated tax payments are not sufficient. You can reduce or defer the income tax on a distribution by directly or indirectly rolling such distribution over to another IRA or eligible plan. You should consult your tax advisor for additional information.
State tax will be withheld if, at the time of your distribution, your address is within one of the mandatory withholding states and you have federal income tax withheld (or as otherwise required by state law). State taxes will be withheld from your distribution in accordance with the respective state rules.
Distributions you receive from 403(b), 457 and qualified plans are subject to special tax and withholding rules. Your plan administrator or plan sponsor is required to provide you with a special tax notice explaining those rules at the time you request a distribution. If applicable, federal and/or state taxes may be withheld from your distribution amount.
Proxy Voting Guidelines
American Century Investment Management, Inc., the fund’s investment advisor, is responsible for exercising the voting rights associated with the securities purchased and/or held by the fund. A description of the policies and procedures the advisor uses in fulfilling this responsibility is available without charge, upon request, by calling 1-800-345-2021. It is also available on American Century Investments’ website at americancentury.com and on the Securities and Exchange Commission’s website at sec.gov. Information regarding how the investment advisor voted proxies relating to portfolio securities during the most recent 12-month period ended June 30 is available on the “About Us” page at americancentury.com. It is also available at sec.gov.
Quarterly Portfolio Disclosure
The fund files its complete schedule of portfolio holdings with the Securities and Exchange Commission (SEC) for the first and third quarters of each fiscal year on Form N-Q. The fund’s Forms N-Q are available on the SEC’s website at sec.gov, and may be reviewed and copied at the SEC’s Public Reference Room in Washington, DC. Information on the operation of the Public Reference Room may be obtained by calling 1-800-SEC-0330. The fund also makes its complete schedule of portfolio holdings for the most recent quarter of its fiscal year available upon request by calling 1-800-345-2021.
Other Tax Information
The following information is provided pursuant to provisions of the Internal Revenue Code.
The fund hereby designates up to the maximum amount allowable as qualified dividend income for the fiscal year ended June 30, 2013.
For corporate taxpayers, the fund hereby designates $5,753,135, or up to the maximum amount allowable, of ordinary income distributions paid during the fiscal year ended June 30, 2013 as qualified for the corporate dividends received deduction.
The fund hereby designates $253,915, or up to the maximum amount allowable, as long-term capital gain distributions for the fiscal year ended June 30, 2013.
The fund hereby designates $2,249,217 as qualified short-term capital gain distributions for purposes of Internal Revenue Code Section 871.
Contact Us | americancentury.com |
Automated Information Line | 1-800-345-8765 |
Investor Services Representative | 1-800-345-2021
or 816-531-5575 |
Investors Using Advisors | 1-800-378-9878 |
Business, Not-For-Profit, Employer-Sponsored Retirement Plans | 1-800-345-3533 |
Banks and Trust Companies, Broker-Dealers, Financial Professionals, Insurance Companies | 1-800-345-6488 |
Telecommunications Device for the Deaf | 1-800-634-4113 |
American Century Quantitative Equity Funds, Inc.
Investment Advisor:
American Century Investment Management, Inc.
Kansas City, Missouri
This report and the statements it contains are submitted for the general information of our shareholders. The report is not authorized for distribution to prospective investors unless preceded or accompanied by an effective prospectus.
©2013 American Century Proprietary Holdings, Inc. All rights reserved.
CL-ANN-79323 1308
ANNUAL REPORT | JUNE 30, 2013 |
NT Equity Growth Fund
President’s Letter | 2 |
Market Perspective | 3 |
Performance | 4 |
Portfolio Commentary | 5 |
Fund Characteristics | 7 |
Shareholder Fee Example | 8 |
Schedule of Investments | 10 |
Statement of Assets and Liabilities | 13 |
Statement of Operations | 14 |
Statement of Changes in Net Assets | 15 |
Notes to Financial Statements | 16 |
Financial Highlights | 21 |
Report of Independent Registered Public Accounting Firm | 22 |
Management | 23 |
Approval of Management Agreement | 26 |
Additional Information | 31 |
Any opinions expressed in this report reflect those of the author as of the date of the report, and do not necessarily represent the opinions of American Century Investments® or any other person in the American Century Investments organization. Any such opinions are subject to change at any time based upon market or other conditions and American Century Investments disclaims any responsibility to update such opinions. These opinions may not be relied upon as investment advice and, because investment decisions made by American Century Investments funds are based on numerous factors, may not be relied upon as an indication of trading intent on behalf of any American Century Investments fund. Security examples are used for representational purposes only and are not intended as recommendations to purchase or sell securities. Performance information for comparative indices and securities is provided to American Century Investments by third party vendors. To the best of American Century Investments’ knowledge, such information is accurate at the time of printing.
Jonathan Thomas
Dear Investor:
Thank you for reviewing this annual report for the 12 months ended June 30, 2013. It provides investment performance, market analysis, and portfolio information, presented with the expert perspective of our portfolio management team.
Annual reports remain important vehicles for conveying information about fund returns, including key factors that affected fund performance. For additional, updated investment and market insights, we encourage you to visit our website, americancentury.com.
Generally Favorable Fiscal-Year Returns for U.S. Stocks and High-Yield Bonds
The 12-month reporting period began in the summer of 2012 with uncertainties caused by slowing economies, as well as the upcoming November elections and year-end fiscal deadlines in the U.S. It ended with more uncertainty about the future of U.S. monetary stimulus. In between, aggressive monetary intervention by central banks encouraged investors to take more risk, generally boosting stocks at the expense of government bonds.
U.S. mid-cap, small-cap, and value stock indices achieved performance leadership during the period, outpacing the S&P 500 Index’s 20.60% return. U.S. stocks generally outperformed non-U.S. equities—the MSCI EAFE Index returned 18.62% and the MSCI Emerging Markets Index advanced 2.87%, affected by slowing growth in emerging market economies.
Slower emerging market growth also hindered commodity price gains and helped keep inflation under control. As a result, assets used as inflation hedges, including inflation-indexed securities and precious metals, lagged other assets. Gold, in particular, plunged, starting last October. And Treasury inflation-protected securities (TIPS) were among the lowest performers in the U.S. bond market. Bond index returns generally ranged from approximately 10% gains for U.S. corporate high-yield indices all the way down to negative returns for longer-maturity global Treasury benchmarks.
Despite signs of improvement in 2013, U.S. economic growth is subpar compared with past recession recoveries, and remains vulnerable to threats that could trigger another slowdown and market volatility. Therefore, we continue to believe in a disciplined, diversified, long-term investment approach, using professionally managed stock and bond portfolios—as appropriate—for meeting financial goals. We appreciate your continued trust in us in this volatile environment.
Sincerely,
Jonathan Thomas
President and Chief Executive Officer
American Century Investments
By Scott Wittman, Chief Investment Officer, Asset Allocation and Quantitative Equity
Central Bank Actions, Relative U.S. Economic Gains Drove Stocks Higher
Stock market performance remained robust during the 12-month period ended June 30, 2013. Despite persistent concerns about weak global growth and Europe’s ongoing financial crisis, investors largely focused on central bank stimulus measures and marginally-improving U.S. economic data, which fueled market optimism.
Early in the period, in response to disappointing U.S. economic data, the U.S. Federal Reserve (the Fed) launched its third—and most aggressive—quantitative easing (QE) program, or monthly purchases of $40 billion in government agency mortgage-backed securities. Later in 2012, the Fed expanded the program to include $45 billion in Treasury purchases, bringing its total bond buying to $85 billion per month. This unprecedented program, combined with relatively healthy corporate earnings, significant housing market gains and modest improvements in the labor market, helped keep stocks and other riskier assets in favor.
The Fed rattled the financial markets late in the reporting period, with comments about “tapering” its quantitative easing program. Fed Chairman Ben Bernanke said the central bank could begin scaling back its bond buying later in 2013 if the economy continues to improve. After reaching record highs in May, stocks stumbled in June, following Bernanke’s comments. Late in the month, the Fed toned down its tapering talk, and stocks recovered some of their June losses. Overall, most U.S. stock benchmarks generated stellar 12-month returns, largely aided by strong double-digit gains posted during the first calendar quarter of 2013.
Value Stocks Outpaced Growth Stocks
Across the capitalization spectrum, value stocks were the performance leaders for the 12-month period. Much of this was due to strong one-year returns from the financials and health care sectors, where many value-oriented stocks reside. In particular, expectations for rising interest rates—and the late-quarter rate increase triggered by Fed tapering talk—helped boost returns within the financial sector’s banking industry. At the opposite end, the rate-sensitive utilities sector was the weakest relative performer, held back by the prospect of rising interest rates.
U.S. Stock Index Returns |
For the 12 months ended June 30, 2013 |
Russell 1000 Index (Large-Cap) | 21.24% | | Russell 2000 Index (Small-Cap) | 24.21% |
Russell 1000 Growth Index | 17.07% | | Russell 2000 Growth Index | 23.67% |
Russell 1000 Value Index | 25.32% | | Russell 2000 Value Index | 24.77% |
Russell Midcap Index | 25.41% | | |
Russell Midcap Growth Index | 22.88% | | | |
Russell Midcap Value Index | 27.65% | | | |
Total Returns as of June 30, 2013 |
| | | | Average Annual Returns | |
| | Ticker Symbol | 1 year | 5 years | Since Inception | Inception Date |
Institutional Class | ACLEX | 21.39% | 6.70% | 5.07% | 5/12/06 |
S&P 500 Index | — | 20.60% | 7.01% | 5.34% | — |
Growth of $10,000 Over Life of Class |
$10,000 investment made May 12, 2006 |
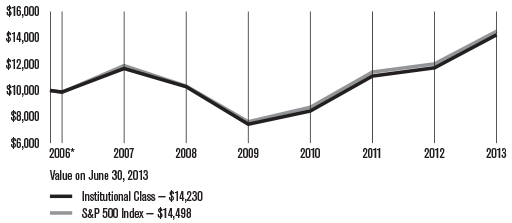
*From 5/12/06, the Institutional Class’s inception date. Not annualized.
Total Annual Fund Operating Expenses |
Institutional Class 0.48% |
The total annual fund operating expenses shown is as stated in the fund’s prospectus current as of the date of this report. The prospectus may vary from the expense ratio shown elsewhere in this report because it is based on a different time period, includes acquired fund fees and expenses, and, if applicable, does not include fee waivers or expense reimbursements.
Data presented reflect past performance. Past performance is no guarantee of future results. Current performance may be higher or lower than the performance shown. Investment return and principal value will fluctuate, and redemption value may be more or less than original cost. To obtain performance data current to the most recent month end, please call 1-800-345-2021 or visit americancentury.com.
Data assumes reinvestment of dividends and capital gains, and none of the charts reflect the deduction of taxes that a shareholder would pay on fund distributions or the redemption of fund shares. Returns for the index are provided for comparison. The fund’s total returns include operating expenses (such as transaction costs and management fees) that reduce returns, while the total returns of the index do not.
Portfolio Managers: Bill Martin and Claudia Musat
Performance Summary
NT Equity Growth returned 21.39% for the fiscal year ended June 30, 2013, compared with the 20.60% return of its benchmark, the S&P 500 Index.
In a year of strength for U.S. equity markets (see page 3 for details), NT Equity Growth posted a solid gain for the 12-month period, outperforming the S&P 500. Holdings in the materials and information technology sectors contributed the most to the fund’s outperformance.
NT Equity Growth’s stock selection process incorporates factors of growth, value, quality, and momentum, and is designed to minimize unintended risks along industries and other risk characteristics. Each of these fundamental drivers of stock returns contributed to the success of the fund during the period.
Absolute Performance Driven by Financials and Health Care
NT Equity Growth’s absolute returns were driven primarily by holdings in the financials and health care sectors. In financials, the strongest gains were attributable to financial services giant JPMorgan Chase, whose shares rose more than 50% for the year, while in health care, consumer health manufacturer Johnson & Johnson and drug maker Pfizer contributed most, with gains of 31% and 26%, respectively. Among individual securities, positions in several mega-cap technology companies including Google and Cisco Systems also boosted absolute returns. No sector detracted from performance for the 12-month period.
Materials and Technology Outperformed
The materials and information technology sectors posted the highest contributions to the fund’s returns relative to the S&P 500. Materials sector outperformance was driven by strong stock selection in both the chemicals and metals and mining industries. The single highest contributor in the sector was above-index exposure to chemicals manufacturer LyondellBasell Industries, which appreciated nearly 80% on robust earnings growth over the 12-month period. Our research suggests continued strong growth as well as attractive valuations, and we maintain an overweight position in the holding. Small positive contributions from a number of other materials stocks also contributed to gains.
In information technology, the biggest industry-level contributions came from software, communications equipment, and computers and peripherals, while top individual contributors were spread throughout a variety of industries. Among the most successful holdings were Western Digital and Seagate Technology. Western Digital, a maker of storage product solutions, gained 108% for the year on robust revenue and earnings gains. Our research shows a strong fundamental profile across value, quality, growth, and momentum. Hard-disk manufacturer Seagate Technology had a strong fundamental profile and benefited from several analyst upgrades. Networking giant Cisco and security software maker Symantec also contributed favorably to relative results.
Other top-performing overweight positions in the portfolio included oil refiner Marathon Petroleum (which was also a top absolute performer), mobile hydraulic manufacturer Sauer-Danfoss, and airplane manufacturer Boeing. Avoiding the tobacco industry also helped as that industry underperformed the broad market.
Financials Main Detractor
Although the financials sector was the strongest contributor to the fund’s absolute returns, the sector proved challenging to relative performance. The negative contribution was a result of both an underweight to the sector as well as challenging stock selection. The greatest negative impact came from lower-than-index exposure to several banking names that appreciated significantly during the period. For example, it hurt to have no exposure for much of the year to banking giant Citigroup, which gained 75% during the period as it rebounded from multi-year lows. Our current research shows an improved profile from a year ago, particularly in expected growth and momentum. Accordingly, we initiated a position in the company during the second quarter of 2013. Similarly, although the fund maintained a position in Bank of America, our exposure was less than that of the benchmark. This underweight hurt relative results during a period when Bank of America shares saw a 58% gain.
The consumer discretionary sector also proved difficult for relative performance as small losses across several industries and holdings limited performance. Top detractors in the sector included ITT Educational Services, whose shares tumbled along with other for-profit education companies. A relatively small position in Coinstar (now called Outerwall Inc.) hurt results after issuing a weaker-than-expected outlook early in the fiscal year. Our research suggests strong value and quality indicators, and we maintain exposure to the company.
Elsewhere in the portfolio, individual relative detractors included biopharmaceutical company Gilead Sciences, semiconductor manufacturer Advanced Micro Devices, and energy drink maker Monster Beverage Corp.
A Look Ahead
As we move into the second half of 2013, the U.S. economic recovery seems to be progressing, albeit with headwinds. Improvements in housing, employment, and economic indicators have been consistent and point to slow but positive growth. Volatility is likely to remain elevated as ongoing concerns over interest rates, Federal Reserve action, and a potential slowdown in China dominate headlines. Heightened levels of volatility often provide investment opportunities, and our disciplined, objective, and systematic investment strategy is designed to take advantage of these opportunities at the individual company level. We believe this approach is the most powerful way to capitalize on market inefficiencies that lead to the mispricing of individual stocks. Our strategy is designed to provide investors with well-diversified and risk-controlled exposure to broad U.S. equities. As such we do not see significant deviations versus the S&P 500. Currently, the fund’s largest, but modest, overweights are in technology, consumer discretionary, and health care, while the underweights are led by energy and financials.
JUNE 30, 2013 |
Top Ten Holdings | % of net assets |
Exxon Mobil Corp. | 3.5% |
Apple, Inc. | 3.3% |
Microsoft Corp. | 2.7% |
Johnson & Johnson | 2.5% |
Pfizer, Inc. | 2.2% |
AT&T, Inc. | 2.1% |
Cisco Systems, Inc. | 1.8% |
Google, Inc., Class A | 1.8% |
Merck & Co., Inc. | 1.7% |
International Business Machines Corp. | 1.7% |
| | |
Top Five Industries | % of net assets |
Pharmaceuticals | 7.9% |
Oil, Gas and Consumable Fuels | 7.8% |
Insurance | 6.9% |
Computers and Peripherals | 6.3% |
Software | 5.6% |
| | |
Types of Investments in Portfolio | % of net assets |
Common Stocks | 99.1% |
Temporary Cash Investments | 0.9% |
Other Assets and Liabilities | —* |
*Category is less than 0.05% of total net assets.
Fund shareholders may incur two types of costs: (1) transaction costs, including sales charges (loads) on purchase payments and redemption/exchange fees; and (2) ongoing costs, including management fees; distribution and service (12b-1) fees; and other fund expenses. This example is intended to help you understand your ongoing costs (in dollars) of investing in your fund and to compare these costs with the ongoing cost of investing in other mutual funds.
The example is based on an investment of $1,000 made at the beginning of the period and held for the entire period from January 1, 2013 to June 30, 2013.
Actual Expenses
The table provides information about actual account values and actual expenses for each class. You may use the information, together with the amount you invested, to estimate the expenses that you paid over the period. First, identify the share class you own. Then simply divide your account value by $1,000 (for example, an $8,600 account value divided by $1,000 = 8.6), then multiply the result by the number under the heading “Expenses Paid During Period” to estimate the expenses you paid on your account during this period.
If you hold Investor Class shares of any American Century Investments fund, or Institutional Class shares of the American Century Diversified Bond Fund, in an American Century Investments account (i.e., not a financial intermediary or retirement plan account), American Century Investments may charge you a $12.50 semiannual account maintenance fee if the value of those shares is less than $10,000. We will redeem shares automatically in one of your accounts to pay the $12.50 fee. In determining your total eligible investment amount, we will include your investments in all personal accounts (including American Century Investments Brokerage accounts) registered under your Social Security number. Personal accounts include individual accounts, joint accounts, UGMA/UTMA accounts, personal trusts, Coverdell Education Savings Accounts and IRAs (including traditional, Roth, Rollover, SEP-, SARSEP- and SIMPLE-IRAs), and certain other retirement accounts. If you have only business, business retirement, employer-sponsored or American Century Investments Brokerage accounts, you are currently not subject to this fee. If you are subject to the Account Maintenance Fee, your account value could be reduced by the fee amount.
Hypothetical Example for Comparison Purposes
The table also provides information about hypothetical account values and hypothetical expenses based on the actual expense ratio of each class of your fund and an assumed rate of return of 5% per year before expenses, which is not the actual return of a fund’s share class. The hypothetical account values and expenses may not be used to estimate the actual ending account balance or expenses you paid for the period. You may use this information to compare the ongoing costs of investing in your fund and other funds. To do so, compare this 5% hypothetical example with the 5% hypothetical examples that appear in the shareholder reports of the other funds.
Please note that the expenses shown in the table are meant to highlight your ongoing costs only and do not reflect any transactional costs, such as sales charges (loads) or redemption/exchange fees. Therefore, the table is useful in comparing ongoing costs only, and will not help you determine the relative total costs of owning different funds. In addition, if these transactional costs were included, your costs would have been higher.| | | | | |
| | Beginning
Account Value 1/1/13 | Ending
Account Value 6/30/13 | Expenses Paid During Period(1) 1/1/13 - 6/30/13 | Annualized
Expense Ratio(1) |
Actual | | | | |
Institutional Class | $1,000 | $1,141.00 | $2.49 | 0.47% |
Hypothetical | | | | |
Institutional Class | $1,000 | $1,022.46 | $2.36 | 0.47% |
(1) | Expenses are equal to the class’s annualized expense ratio listed in the table above, multiplied by the average account value over the period, multiplied by 181, the number of days in the most recent fiscal half-year, divided by 365, to reflect the one-half year period. |
JUNE 30, 2013
| | | | | | | |
| | | Shares | | | Value | |
Common Stocks — 99.1% | |
AEROSPACE AND DEFENSE — 4.9% | |
Boeing Co. (The) | | 104,181 | | | $10,672,302 | |
General Dynamics Corp. | | 48,077 | | | 3,765,871 | |
Honeywell International, Inc. | | 115,027 | | | 9,126,242 | |
Northrop Grumman Corp. | | 98,044 | | | 8,118,043 | |
Raytheon Co. | | 102,623 | | | 6,785,433 | |
| | | | | | 38,467,891 | |
AUTO COMPONENTS — 0.5% | |
BorgWarner, Inc.(1) | | 44,284 | | | 3,815,067 | |
BEVERAGES — 0.5% | |
Coca-Cola Co. (The) | | 56,657 | | | 2,272,512 | |
PepsiCo, Inc. | | 15,560 | | | 1,272,653 | |
| | | | | | 3,545,165 | |
BIOTECHNOLOGY — 2.3% | |
Amgen, Inc. | | 101,352 | | | 9,999,388 | |
Celgene Corp.(1) | | 59,255 | | | 6,927,502 | |
Gilead Sciences, Inc.(1) | | 5,906 | | | 302,446 | |
United Therapeutics Corp.(1) | | 16,385 | | | 1,078,461 | |
| | | | | | 18,307,797 | |
CAPITAL MARKETS — 2.1% | |
Federated Investors, Inc., Class B | | 67,033 | | | 1,837,375 | |
Goldman Sachs Group, Inc. (The) | | 60,844 | | | 9,202,655 | |
T. Rowe Price Group, Inc. | | 9,470 | | | 692,730 | |
Waddell & Reed Financial, Inc., Class A | | 107,976 | | | 4,696,956 | |
| | | | | | 16,429,716 | |
CHEMICALS — 3.4% | |
CF Industries Holdings, Inc. | | 12,994 | | | 2,228,471 | |
LyondellBasell Industries NV, Class A | | 114,289 | | | 7,572,789 | |
Monsanto Co. | | 85,800 | | | 8,477,040 | |
NewMarket Corp. | | 6,421 | | | 1,685,898 | |
PPG Industries, Inc. | | 47,226 | | | 6,914,359 | |
| | | | | | 26,878,557 | |
COMMERCIAL BANKS — 1.7% | |
Wells Fargo & Co. | | 324,366 | | | 13,386,585 | |
COMMERCIAL SERVICES AND SUPPLIES — 0.2% | |
Deluxe Corp. | | 34,127 | | | 1,182,501 | |
COMMUNICATIONS EQUIPMENT — 2.4% | |
Brocade Communications Systems, Inc.(1) | | 123,113 | | | 709,131 | |
Cisco Systems, Inc. | | 575,369 | | | 13,987,220 | |
QUALCOMM, Inc. | | 68,524 | | | 4,185,446 | |
| | | | | | 18,881,797 | |
COMPUTERS AND PERIPHERALS — 6.3% | |
Apple, Inc. | | 65,222 | | | 25,833,130 | |
EMC Corp. | | 368,784 | | | 8,710,678 | |
Hewlett-Packard Co. | | 276,890 | | | 6,866,872 | |
Seagate Technology plc | | 54,981 | | | 2,464,798 | |
Western Digital Corp. | | 80,011 | | | 4,967,883 | |
| | | | | | 48,843,361 | |
CONSUMER FINANCE — 0.6% | |
Cash America International, Inc. | | 111,509 | | | 5,069,199 | |
CONTAINERS AND PACKAGING — 1.1% | |
Owens-Illinois, Inc.(1) | | 134,779 | | | 3,745,508 | |
Packaging Corp. of America | | 100,586 | | | 4,924,691 | |
| | | | | | 8,670,199 | |
DIVERSIFIED CONSUMER SERVICES — 0.3% | |
Coinstar, Inc.(1) | | 34,459 | | | 2,021,709 | |
DIVERSIFIED FINANCIAL SERVICES — 2.1% | |
Bank of America Corp. | | 72,660 | | | 934,408 | |
Citigroup, Inc. | | 50,784 | | | 2,436,108 | |
JPMorgan Chase & Co. | | 97,413 | | | 5,142,432 | |
Moody’s Corp. | | 111,793 | | | 6,811,548 | |
MSCI, Inc., Class A(1) | | 34,560 | | | 1,149,811 | |
| | | | | | 16,474,307 | |
DIVERSIFIED TELECOMMUNICATION SERVICES — 3.7% | |
AT&T, Inc. | | 459,547 | | | 16,267,964 | |
CenturyLink, Inc. | | 197,808 | | | 6,992,513 | |
Verizon Communications, Inc. | | 108,851 | | | 5,479,559 | |
| | | | | | 28,740,036 | |
ELECTRIC UTILITIES — 1.4% | |
Edison International | | 146,664 | | | 7,063,338 | |
Portland General Electric Co. | | 134,753 | | | 4,122,094 | |
| | | | | | 11,185,432 | |
ELECTRICAL EQUIPMENT — 1.8% | |
Emerson Electric Co. | | 141,482 | | | 7,716,428 | |
Rockwell Automation, Inc. | | 73,198 | | | 6,085,682 | |
| | | | | | 13,802,110 | |
ELECTRONIC EQUIPMENT, INSTRUMENTS AND COMPONENTS — 0.6% | |
TE Connectivity Ltd. | | 103,992 | | | 4,735,796 | |
ENERGY EQUIPMENT AND SERVICES — 0.2% | |
RPC, Inc. | | 111,928 | | | 1,545,726 | |
FOOD AND STAPLES RETAILING — 2.5% | |
CVS Caremark Corp. | | 125,620 | | | 7,182,952 | |
Kroger Co. (The) | | 114,529 | | | 3,955,832 | |
Rite Aid Corp.(1) | | 524,489 | | | 1,500,038 | |
Safeway, Inc. | | 259,369 | | | $6,136,670 | |
Wal-Mart Stores, Inc. | | 14,198 | | | 1,057,609 | |
| | | | | | 19,833,101 | |
FOOD PRODUCTS — 2.7% | |
Archer-Daniels-Midland Co. | | 223,496 | | | 7,578,749 | |
General Mills, Inc. | | 166,416 | | | 8,076,169 | |
Hershey Co. (The) | | 33,973 | | | 3,033,109 | |
Ingredion, Inc. | | 33,869 | | | 2,222,484 | |
| | | | | | 20,910,511 | |
HEALTH CARE EQUIPMENT AND SUPPLIES — 4.6% | |
Abbott Laboratories | | 248,680 | | | 8,673,958 | |
Becton Dickinson and Co. | | 73,944 | | | 7,307,885 | |
Medtronic, Inc. | | 177,947 | | | 9,158,932 | |
St. Jude Medical, Inc. | | 154,271 | | | 7,039,386 | |
Stryker Corp. | | 28,375 | | | 1,835,295 | |
Zimmer Holdings, Inc. | | 25,123 | | | 1,882,718 | |
| | | | | | 35,898,174 | |
HEALTH CARE PROVIDERS AND SERVICES — 0.4% | |
AmerisourceBergen Corp. | | 57,731 | | | 3,223,122 | |
HOTELS, RESTAURANTS AND LEISURE — 1.2% | |
Bally Technologies, Inc.(1) | | 61,344 | | | 3,461,029 | |
Cracker Barrel Old Country Store, Inc. | | 25,599 | | | 2,423,201 | |
International Game Technology | | 213,187 | | | 3,562,355 | |
| | | | | | 9,446,585 | |
HOUSEHOLD DURABLES — 1.4% | |
Garmin Ltd. | | 132,592 | | | 4,794,527 | |
Newell Rubbermaid, Inc. | | 233,500 | | | 6,129,375 | |
| | | | | | 10,923,902 | |
HOUSEHOLD PRODUCTS — 2.6% | |
Energizer Holdings, Inc. | | 64,556 | | | 6,488,524 | |
Kimberly-Clark Corp. | | 81,331 | | | 7,900,493 | |
Procter & Gamble Co. (The) | | 73,954 | | | 5,693,718 | |
| | | | | | 20,082,735 | |
INDUSTRIAL CONGLOMERATES — 2.0% | |
Carlisle Cos., Inc. | | 16,732 | | | 1,042,571 | |
Danaher Corp. | | 127,155 | | | 8,048,911 | |
General Electric Co. | | 283,820 | | | 6,581,786 | |
| | | | | | 15,673,268 | |
INSURANCE — 6.9% | |
Aflac, Inc. | | 135,612 | | | 7,881,769 | |
American International Group, Inc.(1) | | 213,488 | | | 9,542,913 | |
Amtrust Financial Services, Inc. | | 25,531 | | | 911,457 | |
Axis Capital Holdings Ltd. | | 80,438 | | | 3,682,452 | |
Berkshire Hathaway, Inc., Class B(1) | | 30,280 | | | 3,388,938 | |
First American Financial Corp. | | 64,299 | | | 1,417,150 | |
HCC Insurance Holdings, Inc. | | 27,249 | | | 1,174,704 | |
MetLife, Inc. | | 201,801 | | | 9,234,414 | |
Reinsurance Group of America, Inc. | | 59,163 | | | 4,088,755 | |
RenaissanceRe Holdings Ltd. | | 44,907 | | | 3,897,478 | |
Torchmark Corp. | | 22,727 | | | 1,480,437 | |
Travelers Cos., Inc. (The) | | 87,701 | | | 7,009,064 | |
| | | | | | 53,709,531 | |
INTERNET AND CATALOG RETAIL — 0.7% | |
Expedia, Inc. | | 93,378 | | | 5,616,687 | |
INTERNET SOFTWARE AND SERVICES — 1.8% | |
Google, Inc., Class A(1) | | 15,517 | | | 13,660,701 | |
IT SERVICES — 1.7% | |
International Business Machines Corp. | | 70,705 | | | 13,512,433 | |
LEISURE EQUIPMENT AND PRODUCTS — 1.6% | |
Hasbro, Inc. | | 140,946 | | | 6,318,609 | |
Mattel, Inc. | | 141,624 | | | 6,416,984 | |
| | | | | | 12,735,593 | |
MACHINERY — 0.3% | |
Crane Co. | | 33,586 | | | 2,012,473 | |
MEDIA — 2.0% | |
Comcast Corp., Class A | | 276,319 | | | 11,572,240 | |
Time Warner, Inc. | | 69,603 | | | 4,024,445 | |
| | | | | | 15,596,685 | |
METALS AND MINING — 0.2% | |
Worthington Industries, Inc. | | 41,752 | | | 1,323,956 | |
MULTILINE RETAIL — 0.8% | |
Dillard’s, Inc., Class A | | 25,843 | | | 2,118,351 | |
Target Corp. | | 54,418 | | | 3,747,223 | |
| | | | | | 5,865,574 | |
OIL, GAS AND CONSUMABLE FUELS — 7.8% | |
Chevron Corp. | | 56,672 | | | 6,706,564 | |
ConocoPhillips | | 50,940 | | | 3,081,870 | |
Delek US Holdings, Inc. | | 61,993 | | | 1,784,159 | |
Exxon Mobil Corp. | | 304,371 | | | 27,499,920 | |
Marathon Petroleum Corp. | | 95,917 | | | 6,815,862 | |
Tesoro Corp. | | 80,032 | | | 4,187,274 | |
Valero Energy Corp. | | 193,575 | | | 6,730,603 | |
Western Refining, Inc. | | 139,297 | | | 3,910,067 | |
| | | | | | 60,716,319 | |
PHARMACEUTICALS — 7.9% | |
AbbVie, Inc. | | 85,905 | | | 3,551,313 | |
Allergan, Inc. | | 3,154 | | | 265,693 | |
Eli Lilly & Co. | | 162,957 | | | 8,004,448 | |
Johnson & Johnson | | 223,273 | | | $19,170,220 | |
Merck & Co., Inc. | | 292,674 | | | 13,594,707 | |
Pfizer, Inc. | | 602,304 | | | 16,870,535 | |
| | | | | | 61,456,916 | |
SEMICONDUCTORS AND SEMICONDUCTOR EQUIPMENT — 1.8% | |
Broadcom Corp., Class A | | 200,290 | | | 6,761,790 | |
Intel Corp. | | 6,464 | | | 156,558 | |
KLA-Tencor Corp. | | 43,654 | | | 2,432,837 | |
Texas Instruments, Inc. | | 139,849 | | | 4,876,535 | |
| | | | | | 14,227,720 | |
SOFTWARE — 5.6% | |
Activision Blizzard, Inc. | | 253,264 | | | 3,611,545 | |
CA, Inc. | | 163,985 | | | 4,694,891 | |
Microsoft Corp. | | 602,068 | | | 20,789,408 | |
Oracle Corp. | | 370,359 | | | 11,377,428 | |
Symantec Corp. | | 149,804 | | | 3,366,096 | |
| | | | | | 43,839,368 | |
SPECIALTY RETAIL — 4.5% | |
American Eagle Outfitters, Inc. | | 203,406 | | | 3,714,194 | |
Buckle, Inc. (The) | | 32,861 | | | 1,709,429 | |
GameStop Corp., Class A | | 143,997 | | | 6,052,194 | |
Gap, Inc. (The) | | 169,618 | | | 7,078,159 | |
Home Depot, Inc. (The) | | 157,427 | | | 12,195,870 | |
PetSmart, Inc. | | 69,163 | | | 4,633,229 | |
| | | | | | 35,383,075 | |
TEXTILES, APPAREL AND LUXURY GOODS — 1.4% | |
Hanesbrands, Inc. | | 88,328 | | | 4,541,826 | |
Ralph Lauren Corp. | | 36,640 | | | 6,365,833 | |
| | | | | | 10,907,659 | |
THRIFTS AND MORTGAGE FINANCE — 0.6% | |
Ocwen Financial Corp.(1) | | 107,220 | | | 4,419,608 | |
TOTAL COMMON STOCKS (Cost $653,321,325) | | | 772,958,647 | |
Temporary Cash Investments — 0.9% | |
Repurchase Agreement, Bank of America Merrill Lynch, (collateralized by various U.S. Treasury obligations, 1.00%, 1/15/14, valued at $869,298), in a joint trading account at 0.06%, dated 6/28/13, due 7/1/13 (Delivery value $851,520) | | | 851,516 | |
Repurchase Agreement, Credit Suisse First Boston, Inc., (collateralized by various U.S. Treasury obligations, 4.25%, 11/15/40, valued at $2,602,819), in a joint trading account at 0.05%, dated 6/28/13, due 7/1/13 (Delivery value $2,554,559) | | | 2,554,548 | |
Repurchase Agreement, Goldman Sachs & Co., (collateralized by various U.S. Treasury obligations, 3.125%, 11/15/41, valued at $866,109), in a joint trading account at 0.04%, dated 6/28/13, due 7/1/13 (Delivery value $851,519) | | | 851,516 | |
SSgA U.S. Government Money Market Fund | | 2,350,599 | | | 2,350,599 | |
TOTAL TEMPORARY CASH INVESTMENTS (Cost $6,608,179) | | | 6,608,179 | |
TOTAL INVESTMENT SECURITIES — 100.0% (Cost $659,929,504) | | | 779,566,826 | |
OTHER ASSETS AND LIABILITIES† | | | 110,198 | |
TOTAL NET ASSETS — 100.0% | | | $779,677,024 | |
Notes to Schedule of Investments
† | Category is less than 0.05% of total net assets. |
See Notes to Financial Statements.
Statement of Assets and Liabilities |
JUNE 30, 2013 | |
Assets | |
Investment securities, at value (cost of $659,929,504) | | $779,566,826 | |
Receivable for capital shares sold | | 129,124 | |
Dividends and interest receivable | | 692,991 | |
| | | 780,388,941 | |
| | | | |
Liabilities | |
Payable for capital shares redeemed | | 407,856 | |
Accrued management fees | | 304,061 | |
| | | 711,917 | |
| | | | |
Net Assets | | $779,677,024 | |
| | | | |
Institutional Class Capital Shares, $0.01 Par Value | | | |
Shares authorized | | 200,000,000 | |
Shares outstanding | | 67,349,079 | |
| | | | |
Net Asset Value Per Share | | $11.58 | |
| | | | |
Net Assets Consist of: | |
Capital (par value and paid-in surplus) | | $608,194,022 | |
Undistributed net investment income | | 635,711 | |
Undistributed net realized gain | | 51,209,969 | |
Net unrealized appreciation | | 119,637,322 | |
| | | $779,677,024 | |
See Notes to Financial Statements.
YEAR ENDED JUNE 30, 2013 | |
Investment Income (Loss) | |
Income: | | | |
Dividends (net of foreign taxes withheld of $105,880) | | $16,453,630 | |
Interest | | 9,680 | |
| | | 16,463,310 | |
| | | | |
Expenses: | | | |
Management fees | | 3,099,476 | |
Directors’ fees and expenses | | 29,383 | |
| | | 3,128,859 | |
| | | | |
Net investment income (loss) | | 13,334,451 | |
| | | | |
Realized and Unrealized Gain (Loss) | |
Net realized gain (loss) on: | | | |
Investment transactions | | 70,576,229 | |
Futures contract transactions | | 1,336,271 | |
Foreign currency transactions | | 436 | |
| | | 71,912,936 | |
| | | | |
Change in net unrealized appreciation (depreciation) on: | | | |
Investments | | 42,809,125 | |
Translation of assets and liabilities in foreign currencies | | (250 | ) |
| | | 42,808,875 | |
| | | | |
Net realized and unrealized gain (loss) | | 114,721,811 | |
| | | | |
Net Increase (Decrease) in Net Assets Resulting from Operations | | $128,056,262 | |
See Notes to Financial Statements.
Statement of Changes in Net Assets |
YEARS ENDED JUNE 30, 2013 AND JUNE 30, 2012 | |
Increase (Decrease) in Net Assets | | June 30, 2013 | | | June 30, 2012 | |
Operations | |
Net investment income (loss) | | $13,334,451 | | | $9,053,571 | |
Net realized gain (loss) | | 71,912,936 | | | 15,069,568 | |
Change in net unrealized appreciation (depreciation) | | 42,808,875 | | | 426,546 | |
Net increase (decrease) in net assets resulting from operations | | 128,056,262 | | | 24,549,685 | |
| | | | | | | |
Distributions to Shareholders | |
From net investment income | | (12,886,615 | ) | | (8,917,757 | ) |
From net realized gains | | (28,744,659 | ) | | (17,931,780 | ) |
Decrease in net assets from distributions | | (41,631,274 | ) | | (26,849,537 | ) |
| | | | | | | |
Capital Share Transactions | |
Proceeds from shares sold | | 185,962,552 | | | 148,664,112 | |
Proceeds from reinvestment of distributions | | 41,631,274 | | | 26,849,537 | |
Payments for shares redeemed | | (93,334,487 | ) | | (164,422,725 | ) |
Net increase (decrease) in net assets from capital share transactions | | 134,259,339 | | | 11,090,924 | |
| | | | | | | |
Net increase (decrease) in net assets | | 220,684,327 | | | 8,791,072 | |
| | | | | | | |
Net Assets | |
Beginning of period | | 558,992,697 | | | 550,201,625 | |
End of period | | $779,677,024 | | | $558,992,697 | |
| | | | | | | |
Undistributed net investment income | | $635,711 | | | $452,866 | |
| | | | | | | |
Transactions in Shares of the Fund | |
Sold | | 17,428,384 | | | 15,241,901 | |
Issued in reinvestment of distributions | | 3,971,594 | | | 2,865,072 | |
Redeemed | | (8,840,152 | ) | | (16,916,462 | ) |
Net increase (decrease) in shares of the fund | | 12,559,826 | | | 1,190,511 | |
See Notes to Financial Statements.
Notes to Financial Statements |
JUNE 30, 2013
1. Organization
American Century Quantitative Equity Funds, Inc. (the corporation) is registered under the Investment Company Act of 1940, as amended (the 1940 Act), as an open-end management investment company and is organized as a Maryland corporation. NT Equity Growth Fund (the fund) is one fund in a series issued by the corporation. The fund is diversified as defined under the 1940 Act. The fund’s investment objective is to seek long-term capital growth. The fund is not permitted to invest in securities issued by companies assigned the Global Industry Classification Standard for the tobacco industry.
2. Significant Accounting Policies
The following is a summary of significant accounting policies consistently followed by the fund in preparation of its financial statements. The financial statements are prepared in conformity with accounting principles generally accepted in the United States of America, which may require management to make certain estimates and assumptions at the date of the financial statements. Actual results could differ from these estimates.
Investment Valuations — The fund determines the fair value of its investments and computes its net asset value per share as of the close of regular trading (usually 4 p.m. Eastern time) on the New York Stock Exchange (NYSE) on each day the NYSE is open.
Equity securities that are listed or traded on a domestic securities exchange are valued at the last reported sales price or at the official closing price as provided by the exchange. Equity securities traded on foreign securities exchanges are typically valued at the closing price on the exchange where primarily traded or as of the close of the NYSE, if that is earlier. If no last sales price is reported, or if local convention or regulation so provides, the mean of the latest bid and asked prices is used. Depending on local convention or regulation, securities traded over-the-counter are valued at the mean of the latest bid and asked prices, the last sales price, or the official closing price. In its determination of fair value, the fund may review several factors including: market information specific to a security; news developments in U.S. and foreign markets; the performance of particular U.S. and foreign securities, indices, comparable securities, American Depositary Receipts, Exchange-Traded Funds, and other relevant market indicators.
Debt securities maturing within 60 days at the time of purchase may be valued at cost, plus or minus any amortized discount or premium or at the evaluated mean as provided by an independent pricing service. Evaluated mean prices are commonly derived through utilization of market models, which may consider, among other factors, trade data, quotations from dealers and active market makers, relevant yield curve and spread data, related sector levels, creditworthiness, and other relevant market information on the same or comparable securities.
Investments in open-end management investment companies are valued at the reported net asset value per share. Repurchase agreements are valued at cost. Exchange-traded futures contracts are valued at the settlement price as provided by the appropriate clearing corporation.
The value of investments initially expressed in foreign currencies is translated into U.S. dollars at prevailing exchange rates.
If the fund determines that the market price for a portfolio security is not readily available or the valuation methods mentioned above do not reflect a security’s fair value, such security is valued as determined in good faith by the Board of Directors or its designee, in accordance with procedures adopted by the Board of Directors. Circumstances that may cause the fund to use these procedures to value a security include, but are not limited to: a security has been declared in default; trading in a security has been halted during the trading day; there is a foreign market holiday and no trading occurred; or an event occurred between the close of a foreign exchange and the NYSE that may affect the value of a security.
Security Transactions — Security transactions are accounted for as of the trade date. Net realized gains and losses are determined on the identified cost basis, which is also used for federal income tax purposes.
Investment Income — Dividend income less foreign taxes withheld, if any, is recorded as of the ex-dividend date. Distributions received on securities that represent a return of capital or long-term capital gain are recorded as a reduction of cost of investments and/or as a realized gain. The fund may estimate the components of distributions received that may be considered nontaxable distributions or long-term capital gain distributions for income tax purposes. Interest income is recorded on the accrual basis and includes accretion of discounts and amortization of premiums.
Foreign Currency Translations — All assets and liabilities initially expressed in foreign currencies are translated into U.S. dollars at prevailing exchange rates at period end. The fund may enter into spot foreign currency exchange contracts to facilitate transactions denominated in a foreign currency. Purchases and sales of investment securities, dividend and interest income, spot foreign currency exchange contracts, and expenses are translated at the rates of exchange prevailing on the respective dates of such transactions. Net realized and unrealized foreign currency exchange gains or losses related to investment securities are a component of net realized gain (loss) on investment transactions and change in net unrealized appreciation (depreciation) on investments, respectively.
Repurchase Agreements — The fund may enter into repurchase agreements with institutions that American Century Investment Management, Inc. (ACIM) (the investment advisor) has determined are creditworthy pursuant to criteria adopted by the Board of Directors. The fund requires that the collateral, represented by securities, received in a repurchase transaction be transferred to the custodian in a manner sufficient to enable the fund to obtain those securities in the event of a default under the repurchase agreement. ACIM monitors, on a daily basis, the securities transferred to ensure the value, including accrued interest, of the securities under each repurchase agreement is equal to or greater than amounts owed to the fund under each repurchase agreement.
Joint Trading Account — Pursuant to an Exemptive Order issued by the Securities and Exchange Commission, the fund, along with certain other funds in the American Century Investments family of funds, may transfer uninvested cash balances into a joint trading account. These balances are invested in one or more repurchase agreements that are collateralized by U.S. Treasury or Agency obligations.
Segregated Assets — In accordance with the 1940 Act, the fund segregates assets on its books and records to cover futures contracts. ACIM monitors, on a daily basis, the securities segregated to ensure the fund designates a sufficient amount of liquid assets, marked-to-market daily. The fund may also receive assets or be required to pledge assets at the custodian bank or with a broker for margin requirements on futures contracts.
Income Tax Status — It is the fund’s policy to distribute substantially all net investment income and net realized gains to shareholders and to otherwise qualify as a regulated investment company under provisions of the Internal Revenue Code. Accordingly, no provision has been made for income taxes. The fund files U.S. federal, state, local and non-U.S. tax returns as applicable. The fund’s tax returns are subject to examination by the relevant taxing authority until expiration of the applicable statute of limitations, which is generally three years from the date of filing but can be longer in certain jurisdictions. At this time, management believes there are no uncertain tax positions which, based on their technical merit, would not be sustained upon examination and for which it is reasonably possible that the total amounts of unrecognized tax benefits will significantly change in the next twelve months.
Distributions to Shareholders — Distributions from net investment income, if any, are generally declared and paid quarterly. Distributions from net realized gains, if any, are generally declared and paid annually.
Indemnifications — Under the corporation’s organizational documents, its officers and directors are indemnified against certain liabilities arising out of the performance of their duties to the fund. In addition, in the normal course of business, the fund enters into contracts that provide general indemnifications. The maximum exposure under these arrangements is unknown as this would involve future claims that may be made against a fund. The risk of material loss from such claims is considered by management to be remote.
3. Fees and Transactions with Related Parties
Management Fees — The corporation has entered into a management agreement with ACIM, under which ACIM provides the fund with investment advisory and management services in exchange for a single, unified management fee (the fee). The agreement provides that all expenses of managing and operating the fund, except distribution and service fees, brokerage expenses, taxes, interest, fees and expenses of the independent directors (including legal counsel fees), and extraordinary expenses, will be paid by ACIM. The fee is computed and accrued daily based on the daily net assets of the fund and paid monthly in arrears. The fee consists of (1) an Investment Category Fee based on the daily net assets of the fund and certain other accounts managed by the investment advisor that are in the same broad investment category as the fund and (2) a Complex Fee based on the assets of all the funds in the American Century Investments family of funds. The rates for the Investment Category Fee range from 0.3380% to 0.5200%. The rates for the Complex Fee range from 0.0500% to 0.1100%. The effective annual management fee for the year ended June 30, 2013 was 0.47%.
Related Parties — Certain officers and directors of the corporation are also officers and/or directors of American Century Companies, Inc. (ACC). The corporation’s investment advisor, ACIM, the corporation’s distributor, American Century Investment Services, Inc., and the corporation’s transfer agent, American Century Services, LLC are wholly owned, directly or indirectly, by ACC. Various funds issued by American Century Asset Allocation Portfolios, Inc. own, in aggregate, 100% of the shares of the fund. Related parties do not invest in the fund for the purpose of exercising management or control.
4. Investment Transactions
Purchases and sales of investment securities, excluding short-term investments, for the year ended June 30, 2013 were $723,039,930 and $615,417,093, respectively.
5. Fair Value Measurements
The fund’s securities valuation process is based on several considerations and may use multiple inputs to determine the fair value of the positions held by the fund. In conformity with accounting principles generally accepted in the United States of America, the inputs used to determine a valuation are classified into three broad levels as follows:
• | Level 1 valuation inputs consist of unadjusted quoted prices in an active market for identical securities; |
• | Level 2 valuation inputs consist of direct or indirect observable market data (including quoted prices for similar securities, evaluations of subsequent market events, interest rates, prepayment speeds, credit risk, etc.); or |
• | Level 3 valuation inputs consist of unobservable data (including a fund’s own assumptions). |
The level classification is based on the lowest level input that is significant to the fair valuation measurement. The valuation inputs are not necessarily an indication of the risks associated with investing in these securities or other financial instruments.
The following is a summary of the level classifications as of period end. The Schedule of Investments provides additional information on the fund’s portfolio holdings.| | | | |
| | Level 1 | Level 2 | Level 3 |
Investment Securities |
Common Stocks | $772,958,647 | — | — |
Temporary Cash Investments | 2,350,599 | $4,257,580 | — |
Total Value of Investment Securities | $775,309,246 | $4,257,580 | — |
6. Derivative Instruments
Equity Price Risk — The fund is subject to equity price risk in the normal course of pursuing its investment objectives. A fund may enter into futures contracts based on an equity index in order to manage its exposure to changes in market conditions. A fund may purchase futures contracts to gain exposure to increases in market value or sell futures contracts to protect against a decline in market value. Upon entering into a futures contract, a fund is required to deposit either cash or securities in an amount equal to a certain percentage of the contract value (initial margin). Subsequent payments (variation margin) are made or received daily, in cash, by a fund. The variation margin is equal to the daily change in the contract value and is recorded as unrealized gains and losses. A fund recognizes a realized gain or loss when the contract is closed or expires. Net realized and unrealized gains or losses occurring during the holding period of futures contracts are a component of net realized gain (loss) on futures contract transactions and change in net unrealized appreciation (depreciation) on futures contracts, respectively. One of the risks of entering into futures contracts is the possibility that the change in value of the contract may not correlate with the changes in value of the underlying securities. During the period, the fund infrequently purchased equity price risk derivative instruments for temporary investment purposes.
At period end, the fund did not have any derivative instruments disclosed on the Statement of Assets and Liabilities. For the year ended June 30, 2013, the effect of equity price risk derivative instruments on the Statement of Operations was $1,336,271 in net realized gain (loss) on futures contract transactions.
7. Federal Tax Information
The tax character of distributions paid during the years ended June 30, 2013 and June 30, 2012 were as follows:
| | | |
| | 2013 | 2012 |
Distributions Paid From | | |
Ordinary income | $13,826,058 | $9,564,690 |
Long-term capital gains | $27,805,216 | $17,284,847 |
The book-basis character of distributions made during the year from net investment income or net realized gains may differ from their ultimate characterization for federal income tax purposes. These differences reflect the differing character of certain income items and net realized gains and losses for financial statement and tax purposes, and may result in reclassification among certain capital accounts on the financial statements.
As of June 30, 2013, the federal tax cost of investments and the components of distributable earnings on a tax-basis were as follows:
| | |
Federal tax cost of investments | $663,002,417 |
Gross tax appreciation of investments | $122,569,887 |
Gross tax depreciation of investments | (6,005,478) |
Net tax appreciation (depreciation) of investments | $116,564,409 |
Undistributed ordinary income | $29,664,712 |
Accumulated long-term gains | $25,253,881 |
The difference between book-basis and tax-basis unrealized appreciation (depreciation) is attributable primarily to the tax deferral of losses on wash sales.
| |
For a Share Outstanding Throughout the Years Ended June 30 (except as noted) |
Per-Share Data | Ratios and Supplemental Data |
| | | Income From Investment Operations: | Distributions From: | | | Ratio to Average Net Assets of: | | |
| | Net
Asset Value, Beginning
of Period | Net
Investment
Income
(Loss)(1) | Net
Realized and Unrealized
Gain (Loss) | Total From
Investment
Operations | Net
Investment
Income | Net
Realized
Gains | Total
Distributions | Net Asset
Value, End
of Period | Total
Return(2) | Operating
Expenses | Net
Investment Income
(Loss) | Portfolio
Turnover
Rate | Net Assets,
End of
Period (in
thousands) |
Institutional Class |
2013 | $10.20 | 0.22 | 1.87 | 2.09 | (0.21) | (0.50) | (0.71) | $11.58 | 21.39% | 0.48% | 2.03% | 95% | $779,677 |
2012 | $10.27 | 0.17 | 0.35 | 0.52 | (0.18) | (0.41) | (0.59) | $10.20 | 5.65% | 0.48% | 1.75% | 104% | $558,993 |
2011 | $7.92 | 0.14 | 2.34 | 2.48 | (0.13) | — | (0.13) | $10.27 | 31.45% | 0.49% | 1.46% | 84% | $550,202 |
2010 | $7.06 | 0.11 | 0.85 | 0.96 | (0.10) | — | (0.10) | $7.92 | 13.53% | 0.49% | 1.31% | 69% | $320,958 |
2009 | $9.98 | 0.13 | (2.89) | (2.76) | (0.16) | — | (0.16) | $7.06 | (27.73)% | 0.50% | 1.82% | 109% | $191,046 |
Notes to Financial Highlights
(1) | Computed using average shares outstanding throughout the period. |
(2) | Total returns are calculated based on the net asset value of the last business day. Total returns for periods less than one year are not annualized. |
See Notes to Financial Statements.
Report of Independent Registered Public Accounting Firm |
To the Directors of the American Century Quantitative Equity Funds, Inc. and Shareholders of the NT Equity Growth Fund:
In our opinion, the accompanying statement of assets and liabilities, including the schedule of investments, and the related statements of operations and of changes in net assets and the financial highlights present fairly, in all material respects, the financial position of the NT Equity Growth Fund(one of the fourteen funds comprising the American Century Quantitative Equity Funds, Inc., hereafter referred to as the “Fund”) at June 30, 2013, the results of its operations for the year then ended, the changes in its net assets for each of the two years in the period then ended and the financial highlights for each of the five years in the period then ended, in conformity with accounting principles generally accepted in the United States of America. These financial statements and financial highlights (hereafter referred to as “financial statements”) are the responsibility of the Fund’s management; our responsibility is to express an opinion on these financial statements based on our audits. We conducted our audits of these financial statements in accordance with the standards of the Public Company Accounting Oversight Board (United States). Those standards require that we plan and perform the audit to obtain reasonable assurance about whether the financial statements are free of material misstatement. An audit includes examining, on a test basis, evidence supporting the amounts and disclosures in the financial statements, assessing the accounting principles used and significant estimates made by management, and evaluating the overall financial statement presentation. We believe that our audits, which included confirmation of securities at June 30, 2013 by correspondence with the custodian and brokers, provide a reasonable basis for our opinion.
PricewaterhouseCoopers LLP
Kansas City, Missouri
August 21, 2013
Board of Directors
The individuals listed below serve as directors of the funds. Each director will continue to serve in this capacity until death, retirement, resignation or removal from office. The board has adopted a mandatory retirement age for directors who are not “interested persons,” as that term is defined in the Investment Company Act (independent directors). Independent directors shall retire on December 31 of the year in which they reach their 75th birthday; provided, however, that on or after January 1, 2022, independent directors shall retire on December 31 of the year in which they reach their 76th birthday.
Mr. Thomas is the only director who is an “interested person” because he currently serves as President and Chief Executive Officer of American Century Companies, Inc. (ACC), the parent company of American Century Investment Management, Inc. (ACIM or the advisor).
The other directors (more than three-fourths of the total number) are independent; that is, they have never been employees, directors or officers of, and have no financial interest in, ACC or any of its wholly owned, direct or indirect, subsidiaries, including ACIM, American Century Investment Services, Inc. (ACIS) and American Century Services, LLC (ACS). The directors serve in this capacity for eight (in the case of Mr. Thomas, 15) registered investment companies in the American Century Investments family of funds.
The following table presents additional information about the directors. The mailing address for each director other than Mr. Thomas is 1665 Charleston Road, Mountain View, California 94043. The mailing address for Mr. Thomas is 4500 Main Street, Kansas City, Missouri 64111.
| | | | | | | |
Name
(Year of Birth) | Position(s) Held with Funds | Length of Time Served | Principal Occupation(s) During Past 5 Years | | Number of American Century Portfolios Overseen
by Director | Other Directorships Held During Past 5 Years |
Independent Directors |
Tanya S. Beder (1955) | Director | Since 2011 | Chairman, SBCC Group Inc. (independent advisory services) (2006 to present) | | 41 | CYS Investments, Inc. (specialty finance company) |
Jeremy I. Bulow (1954) | Director | Since 2011 | Professor of Economics, Stanford University, Graduate School of Business (1979 to present) | | 41 | None |
Ronald J. Gilson (1946) | Director and Chairman of the Board | Since 1995 | Charles J. Meyers Professor of Law and Business, Stanford Law School (1979 to present); Marc and Eva Stern Professor of Law and Business, Columbia University School of Law (1992 to present) | | 41 | None |
Frederick L. A. Grauer
(1946) | Director | Since 2008 | Senior Advisor, BlackRock, Inc. (investment management firm) (2010 to 2011); Senior Advisor, Barclays Global Investors (investment management firm) (2003 to 2009) | | 41 | None |
| | | | | | | |
Name
(Year of Birth) | Position(s) Held with Funds | Length of Time Served | Principal Occupation(s) During Past 5 Years | | Number of American Century Portfolios Overseen
by Director | Other Directorships Held During Past 5 Years |
Independent Directors |
Peter F. Pervere
(1947) | Director | Since 2007 | Retired | | 41 | Intraware, Inc. (2003 to 2009) |
Myron S. Scholes
(1941) | Director | Since 1980 | Chairman, Platinum Grove Asset Management, L.P. (asset manager) (1999 to 2009); Frank E. Buck Professor of Finance-Emeritus, Stanford Graduate School of Business (1996 to present) | | 41 | Dimensional Fund Advisors (investment advisor); CME Group, Inc. (futures and options exchange) |
John B. Shoven
(1947) | Director | Since 2002 | Professor of Economics, Stanford University (1973 to present) | | 41 | Cadence Design Systems; Exponent; Financial Engines |
| |
Interested Director |
Jonathan S. Thomas
(1963) | Director and President | Since 2007 | President and Chief Executive Officer, ACC (March 2007 to present). Also serves as Chief Executive Officer and Manager, ACS; Executive Vice President, ACIM; Director, ACC, ACIM and other ACC subsidiaries | | 106 | None |
Officers
The following table presents certain information about the executive officers of the funds. Each officer serves as an officer for each of the 15 investment companies in the American Century family of funds, unless otherwise noted. No officer is compensated for his or her service as an officer of the funds. The listed officers are interested persons of the funds and are appointed or re-appointed on an annual basis. The mailing address for each of the officers listed below is 4500 Main Street, Kansas City, Missouri 64111.
| | | |
Name
(Year of Birth) | Offices with the Funds | Principal Occupation(s) During the Past Five Years |
Jonathan S. Thomas
(1963) | Director and President since 2007 | President and Chief Executive Officer, ACC (March 2007 to present). Also serves as Chief Executive Officer and Manager, ACS; Executive Vice President, ACIM; Director, ACC, ACIM and other ACC subsidiaries |
Maryanne L. Roepke
(1956) | Chief Compliance Officer since 2006 and Senior Vice President since 2000 | Chief Compliance Officer, American Century funds, ACIM and ACS (August 2006 to present). Also serves as Senior Vice President, ACS |
Charles A. Etherington
(1957) | General Counsel since 2007 and Senior Vice President since 2006 | Attorney, ACC (February 1994 to present); Vice President, ACC (November 2005 to present); General Counsel, ACC (March 2007 to present). Also serves as General Counsel, ACIM, ACS, ACIS and other ACC subsidiaries; and Senior Vice President, ACIM and ACS |
C. Jean Wade
(1964) | Vice President, Treasurer and Chief Financial Officer since 2012 | Vice President, ACS (February 2000 to present) |
Robert J. Leach
(1966) | Vice President since 2006 and Assistant Treasurer since 2012 | Vice President, ACS (February 2000 to present) |
David H. Reinmiller (1963) | Vice President since 2001 | Attorney, ACC (January 1994 to present); Associate General Counsel, ACC (January 2001 to present). Also serves as Vice President, ACIM and ACS |
Ward D. Stauffer (1960) | Secretary since 2005 | Attorney, ACC (June 2003 to present) |
The Statement of Additional Information has additional information about the fund’s directors and is available without charge, upon request, by calling 1-800-345-2021.
Approval of Management Agreement |
At a meeting held on June 11, 2013, the Fund’s Board of Directors/Trustees unanimously approved the renewal of the management agreement pursuant to which American Century Investment Management, Inc. (the “Advisor”) acts as the investment advisor for the Fund. Under Section 15(c) of the Investment Company Act, contracts for investment advisory services are required to be reviewed, evaluated, and approved by a majority of a fund’s directors/trustees (the “Directors”), including a majority of the independent Directors each year. The Board regards this annual evaluation and renewal as one of its most important responsibilities.
In connection with their annual review and evaluation, the independent Directors memorialized a statement regarding the relationship between their ongoing obligations to oversee and evaluate the performance of the Advisor and their consideration of renewal of the management agreement. In that statement, the independent Directors noted that their assessment of the Advisor’s performance is an ongoing process that takes place over the entire year and is informed by all of the information that the Board and its committees receive and consider over time. This information, together with the materials provided in connection with the review, are central to the Board’s assessment of the Advisor’s performance and its determination whether to renew the Fund’s management agreement.
Prior to its consideration of the renewal of the management agreement, the Board requested and reviewed extensive data and analysis relating to the proposed renewal. This information and analysis was compiled by the Advisor and certain independent providers of evaluation data concerning the Fund and the services provided to the Fund by the Advisor.
In connection with its consideration of the renewal of the management agreement, the Board’s review and evaluation of the services provided by the Advisor included, but was not limited to, the following:
• | the nature, extent, and quality of investment management, shareholder services, and other services provided by the Advisor to the Fund; |
• | the wide range of other programs and services the Advisor provides to the Fund and its shareholders on a routine and non-routine basis; |
• | the investment performance of the Fund, including data comparing the Fund’s performance to appropriate benchmarks and/or a peer group of other mutual funds with similar investment objectives and strategies; |
• | data comparing the cost of owning the Fund to the cost of owning similar funds; |
• | the Advisor’s compliance policies, procedures, and regulatory experience; |
• | financial data showing the cost of services provided to the Fund, the profitability of the Fund to the Advisor, and the overall profitability of the Advisor; |
• | possible economies of scale associated with the Advisor’s management of the Fund and other accounts under its management; |
• | data comparing services provided and charges to other investment management clients of the Advisor; and |
• | consideration of collateral benefits derived by the Advisor from the management of the Fund. |
In keeping with its practice, the Board held two in-person meetings to review and discuss the information provided. The Board also had the benefit of the advice of its independent counsel throughout the period.
Factors Considered
The Directors considered all of the information provided by the Advisor, the independent data providers, and the Board’s independent counsel in connection with the review, and evaluated such information for the Fund. In connection with their review, the Directors did not identify any single factor as being all-important or controlling and each Director may have attributed different levels of importance to different factors. In deciding to renew the management agreement, the Board based its decision on a number of factors, including the following:
Nature, Extent and Quality of Services - Generally. Under the management agreement, the Advisor is responsible for providing or arranging for all services necessary for the operation of the Fund. The Board noted that under the management agreement, the Advisor provides or arranges at its own expense a wide variety of services including:
• | constructing and designing the Fund |
• | portfolio research and security selection |
• | initial capitalization/funding |
• | daily valuation of the Fund’s portfolio |
• | shareholder servicing and transfer agency, including shareholder confirmations, recordkeeping, and communications |
• | regulatory and portfolio compliance |
• | marketing and distribution |
The Board noted that many of these services have expanded over time both in terms of quantity and complexity in response to shareholder demands, competition in the industry, changing distribution channels, and the changing regulatory environment.
Investment Management Services. The nature of the investment management services provided to the Fund is quite complex and allows Fund shareholders access to professional money management, instant diversification of their investments within an asset class, the opportunity to easily diversify among asset classes by investing in or exchanging among various American Century Investments funds, and liquidity. In evaluating investment performance, the Board expects the Advisor to manage the Fund in accordance with its investment objectives and approved strategies. Further, the Directors recognize that the Advisor has an obligation to seek the best execution of fund trades. In providing these services, the Advisor utilizes teams of investment professionals (portfolio managers, analysts, research assistants, and securities traders) who require extensive information technology, research, training, compliance and other systems to conduct their business. The Board, directly and through its Portfolio Committee, regularly reviews investment performance information for the Fund, together with comparative information for appropriate benchmarks and/or peer groups of similarly-managed funds, over different time horizons. The Directors also review detailed performance information during the management agreement approval process. If performance concerns are identified, the Fund receives special reviews until performance improves, during which the Board discusses with the Advisor the reasons for such results (e.g., market conditions, security selection) and any efforts being undertaken to improve performance. The Board found the investment management services provided by the Advisor to the Fund to meet or exceed industry standards. More detailed information about the Fund’s performance can be found in the Performance and Portfolio Commentary sections of this report.
Shareholder and Other Services. Under the management agreement, the Advisor provides the Fund with a comprehensive package of transfer agency, shareholder, and other services. The Board, directly and through various committees of the Board, regularly reviews reports and evaluations of such services at its regular meetings. These reports include, but are not limited to, information regarding the operational efficiency and accuracy of the shareholder and transfer agency services provided, staffing levels, shareholder satisfaction (as measured by external as well as internal sources), technology support, new products and services offered to Fund shareholders, securities trading activities, portfolio valuation services, auditing services, and legal and operational compliance activities. Certain aspects of shareholder and transfer agency service level efficiency and the quality of securities trading activities are measured by independent third party providers and are presented in comparison to other fund groups not managed by the Advisor. The Board found the services provided by the Advisor to the Fund under the management agreement to be competitive and of high quality.
Costs of Services and Profitability. The Advisor provides detailed information concerning its cost of providing various services to the Fund, its profitability in managing the Fund, its overall profitability, and its financial condition. The Directors have reviewed with the Advisor the methodology used to prepare this financial information. The financial information regarding the Advisor is considered in evaluating the Advisor’s financial condition, its ability to continue to provide services under the management agreement, and the reasonableness of the current management fee. The Board concluded that the Advisor’s profits were reasonable in light of the services provided to the Fund.Ethics. The Board generally considers the Advisor’s commitment to providing quality services to shareholders and to conducting its business ethically. They noted that the Advisor’s practices generally meet or exceed industry best practices.
Economies of Scale. The Board also reviewed information provided by the Advisor regarding the possible existence of economies of scale in connection with the management of the Fund. The Board concluded that economies of scale are difficult to measure and predict with precision, especially on a fund-by-fund basis. The Board concluded that the Advisor is appropriately sharing economies of scale through its competitive fee structure, offering competitive fees from fund inception, and through reinvestment in its business to provide shareholders additional content and services.
Comparison to Other Funds’ Fees. The management agreement provides that the Fund pay the Advisor a single, all-inclusive (or unified) management fee for providing all services necessary for the management and operation of the Fund, other than brokerage expenses, taxes, interest, extraordinary expenses, and the fees and expenses of the Fund’s independent directors (including their independent legal counsel) and expenses incurred in connection with the provision of shareholder services and distribution services under a plan adopted pursuant to Rule 12b-1 under the 1940 Act. Under the unified fee structure, the Advisor is responsible for providing all investment advisory, custody, audit, administrative, compliance, recordkeeping, marketing and shareholder services, or arranging and supervising third parties to provide such services. By contrast, most other funds are charged a variety of fees, including an investment advisory fee, a transfer agency fee, an administrative fee, distribution charges and other expenses. Other than their investment advisory fees and any applicable Rule 12b-1 distribution fees, all other components of the total fees charged by these other funds may be increased without shareholder approval. The Board believes the unified fee structure is a benefit to Fund shareholders because it clearly discloses to shareholders the cost of owning Fund shares, and, since the unified fee cannot be increased without a vote of Fund shareholders, it shifts to the Advisor the risk of increased costs of operating the Fund and provides a direct incentive to minimize administrative inefficiencies. Part of the Board’s analysis of fee levels involves reviewing certain evaluative data compiled by an independent provider and comparing the Fund’s unified fee to the total expense ratio of other funds in the Fund’s peer group. The Board concluded that the management fee paid by the Fund to the Advisor under the management agreement is reasonable in light of the services provided to the Fund.
Comparison to Fees and Services Provided to Other Clients of the Advisor. The Board also requested and received information from the Advisor concerning the nature of the services, fees, costs and profitability of its advisory services to advisory clients other than the Fund. They observed that these varying types of client accounts require different services and involve different regulatory and entrepreneurial risks than the management of the Fund. The Board analyzed this information and concluded that the fees charged and services provided to the Fund were reasonable by comparison.Collateral or “Fall-Out” Benefits Derived by the Advisor. The Board considered the existence of collateral benefits the Advisor may receive as a result of its relationship with the Fund. They concluded that the Advisor’s primary business is managing mutual funds and it generally does not use fund or shareholder information to generate profits in other lines of business, and therefore does not derive any significant collateral benefits from them. The Board noted that the Advisor receives proprietary research from broker-dealers that execute fund portfolio transactions and concluded that this research is likely to benefit Fund shareholders. The Board also determined that the Advisor is able to provide investment management services to certain clients other than the Fund, at least in part, due to its existing infrastructure built to serve the fund complex. The Board concluded, however, that the assets of those other clients are not material to the analysis and, where applicable, may be included with the assets of the Fund to determine breakpoints in the management fee schedule.
Existing Relationship. The Board also considered whether there was any reason for not continuing the existing arrangement with the Advisor. In this regard, the Board was mindful of the potential disruptions of the Fund’s operations and various risks, uncertainties, and other effects that could occur as a result of a decision not to continue such relationship. In particular, the Board recognized that most shareholders have invested in the Fund on the strength of the Advisor’s industry standing and reputation and in the expectation that the Advisor will have a continuing role in providing advisory services to the Fund.
Conclusion of the Directors. As a result of this process, the Board, including all of the independent directors and assisted by the advice of independent legal counsel, taking into account all of the factors discussed above and the information provided by the Advisor and others, concluded that the management agreement between the Fund and the Advisor is fair and reasonable in light of the services provided and should be renewed.
Retirement Account Information
As required by law, distributions you receive from certain IRAs are subject to federal income tax withholding, unless you elect not to have withholding apply. Tax will be withheld on the total amount withdrawn even though you may be receiving amounts that are not subject to withholding, such as nondeductible contributions. In such case, excess amounts of withholding could occur. You may adjust your withholding election so that a greater or lesser amount will be withheld.
If you don’t want us to withhold on this amount, you must notify us to not withhold the federal income tax. You may notify us in writing or in certain situations by telephone or through other electronic means. For systematic withdrawals, your withholding election will remain in effect until revoked or changed by filing a new election. You have the right to revoke your election at any time.
Remember, even if you elect not to have income tax withheld, you are liable for paying income tax on the taxable portion of your withdrawal. If you elect not to have income tax withheld or you don’t have enough income tax withheld, you may be responsible for payment of estimated tax. You may incur penalties under the estimated tax rules if your withholding and estimated tax payments are not sufficient. You can reduce or defer the income tax on a distribution by directly or indirectly rolling such distribution over to another IRA or eligible plan. You should consult your tax advisor for additional information.
State tax will be withheld if, at the time of your distribution, your address is within one of the mandatory withholding states and you have federal income tax withheld (or as otherwise required by state law). State taxes will be withheld from your distribution in accordance with the respective state rules.
Distributions you receive from 403(b), 457 and qualified plans are subject to special tax and withholding rules. Your plan administrator or plan sponsor is required to provide you with a special tax notice explaining those rules at the time you request a distribution. If applicable, federal and/or state taxes may be withheld from your distribution amount.
Proxy Voting Guidelines
American Century Investment Management, Inc., the fund’s investment advisor, is responsible for exercising the voting rights associated with the securities purchased and/or held by the fund. A description of the policies and procedures the advisor uses in fulfilling this responsibility is available without charge, upon request, by calling 1-800-345-2021. It is also available on American Century Investments’ website at americancentury.com and on the Securities and Exchange Commission’s website at sec.gov. Information regarding how the investment advisor voted proxies relating to portfolio securities during the most recent 12-month period ended June 30 is available on the “About Us” page at americancentury.com. It is also available at sec.gov.
Quarterly Portfolio Disclosure
The fund files its complete schedule of portfolio holdings with the Securities and Exchange Commission (SEC) for the first and third quarters of each fiscal year on Form N-Q. The fund’s Forms N-Q are available on the SEC’s website at sec.gov, and may be reviewed and copied at the SEC’s Public Reference Room in Washington, DC. Information on the operation of the Public Reference Room may be obtained by calling 1-800-SEC-0330. The fund also makes its complete schedule of portfolio holdings for the most recent quarter of its fiscal year available upon request by calling 1-800-345-2021.
Other Tax Information
The following information is provided pursuant to provisions of the Internal Revenue Code.
The fund hereby designates up to the maximum amount allowable as qualified dividend income for the fiscal year ended June 30, 2013.
For corporate taxpayers, the fund hereby designates $13,826,058, or up to the maximum amount allowable, of ordinary income distributions paid during the fiscal year ended June 30, 2013 as qualified for the corporate dividends received deduction.
The fund hereby designates $27,805,216, or up to the maximum amount allowable, as long-term capital gain distributions for the fiscal year ended June 30, 2013.
The fund hereby designates $939,443 as qualified short-term capital gain distributions for purposes of Internal Revenue Code Section 871.
Contact Us | americancentury.com |
Automated Information Line | 1-800-345-8765 |
Investor Services Representative | 1-800-345-2021
or 816-531-5575 |
Investors Using Advisors | 1-800-378-9878 |
Business, Not-For-Profit, Employer-Sponsored Retirement Plans | 1-800-345-3533 |
Banks and Trust Companies, Broker-Dealers, Financial Professionals, Insurance Companies | 1-800-345-6488 |
Telecommunications Device for the Deaf | 1-800-634-4113 |
American Century Quantitative Equity Funds, Inc.
Investment Advisor:
American Century Investment Management, Inc.
Kansas City, Missouri
This report and the statements it contains are submitted for the general information of our shareholders. The report is not authorized for distribution to prospective investors unless preceded or accompanied by an effective prospectus.
©2013 American Century Proprietary Holdings, Inc. All rights reserved.
CL-ANN-79321 1308
ANNUAL REPORT | JUNE 30, 2013 |
NT Small Company Fund
President’s Letter | 2 |
Market Perspective | 3 |
Performance | 4 |
Portfolio Commentary | 5 |
Fund Characteristics | 7 |
Shareholder Fee Example | 8 |
Schedule of Investments | 10 |
Statement of Assets and Liabilities | 15 |
Statement of Operations | 16 |
Statement of Changes in Net Assets | 17 |
Notes to Financial Statements | 18 |
Financial Highlights | 23 |
Report of Independent Registered Public Accounting Firm | 24 |
Management | 25 |
Approval of Management Agreement | 28 |
Additional Information | 33 |
Any opinions expressed in this report reflect those of the author as of the date of the report, and do not necessarily represent the opinions of American Century Investments® or any other person in the American Century Investments organization. Any such opinions are subject to change at any time based upon market or other conditions and American Century Investments disclaims any responsibility to update such opinions. These opinions may not be relied upon as investment advice and, because investment decisions made by American Century Investments funds are based on numerous factors, may not be relied upon as an indication of trading intent on behalf of any American Century Investments fund. Security examples are used for representational purposes only and are not intended as recommendations to purchase or sell securities. Performance information for comparative indices and securities is provided to American Century Investments by third party vendors. To the best of American Century Investments’ knowledge, such information is accurate at the time of printing.
Jonathan Thomas
Dear Investor:
Thank you for reviewing this annual report for the 12 months ended June 30, 2013. It provides investment performance, market analysis, and portfolio information, presented with the expert perspective of our portfolio management team.
Annual reports remain important vehicles for conveying information about fund returns, including key factors that affected fund performance. For additional, updated investment and market insights, we encourage you to visit our website, americancentury.com.
Generally Favorable Fiscal-Year Returns for U.S. Stocks and High-Yield Bonds
The 12-month reporting period began in the summer of 2012 with uncertainties caused by slowing economies, as well as the upcoming November elections and year-end fiscal deadlines in the U.S. It ended with more uncertainty about the future of U.S. monetary stimulus. In between, aggressive monetary intervention by central banks encouraged investors to take more risk, generally boosting stocks at the expense of government bonds.
U.S. mid-cap, small-cap, and value stock indices achieved performance leadership during the period, outpacing the S&P 500 Index’s 20.60% return. U.S. stocks generally outperformed non-U.S. equities—the MSCI EAFE Index returned 18.62% and the MSCI Emerging Markets Index advanced 2.87%, affected by slowing growth in emerging market economies.
Slower emerging market growth also hindered commodity price gains and helped keep inflation under control. As a result, assets used as inflation hedges, including inflation-indexed securities and precious metals, lagged other assets. Gold, in particular, plunged, starting last October. And Treasury inflation-protected securities (TIPS) were among the lowest performers in the U.S. bond market. Bond index returns generally ranged from approximately 10% gains for U.S. corporate high-yield indices all the way down to negative returns for longer-maturity global Treasury benchmarks.
Despite signs of improvement in 2013, U.S. economic growth is subpar compared with past recession recoveries, and remains vulnerable to threats that could trigger another slowdown and market volatility. Therefore, we continue to believe in a disciplined, diversified, long-term investment approach, using professionally managed stock and bond portfolios—as appropriate—for meeting financial goals. We appreciate your continued trust in us in this volatile environment.
Sincerely,
Jonathan Thomas
President and Chief Executive Officer
American Century Investments
By Scott Wittman, Chief Investment Officer, Asset Allocation and Quantitative Equity
Central Bank Actions, Relative U.S. Economic Gains Drove Stocks Higher
Stock market performance remained robust during the 12-month period ended June 30, 2013. Despite persistent concerns about weak global growth and Europe’s ongoing financial crisis, investors largely focused on central bank stimulus measures and marginally-improving U.S. economic data, which fueled market optimism.
Early in the period, in response to disappointing U.S. economic data, the U.S. Federal Reserve (the Fed) launched its third—and most aggressive—quantitative easing (QE) program, or monthly purchases of $40 billion in government agency mortgage-backed securities. Later in 2012, the Fed expanded the program to include $45 billion in Treasury purchases, bringing its total bond buying to $85 billion per month. This unprecedented program, combined with relatively healthy corporate earnings, significant housing market gains and modest improvements in the labor market, helped keep stocks and other riskier assets in favor.
The Fed rattled the financial markets late in the reporting period, with comments about “tapering” its quantitative easing program. Fed Chairman Ben Bernanke said the central bank could begin scaling back its bond buying later in 2013 if the economy continues to improve. After reaching record highs in May, stocks stumbled in June, following Bernanke’s comments. Late in the month, the Fed toned down its tapering talk, and stocks recovered some of their June losses. Overall, most U.S. stock benchmarks generated stellar 12-month returns, largely aided by strong double-digit gains posted during the first calendar quarter of 2013.
Value Stocks Outpaced Growth Stocks
Across the capitalization spectrum, value stocks were the performance leaders for the 12-month period. Much of this was due to strong one-year returns from the financials and health care sectors, where many value-oriented stocks reside. In particular, expectations for rising interest rates—and the late-quarter rate increase triggered by Fed tapering talk—helped boost returns within the financial sector’s banking industry. At the opposite end, the rate-sensitive utilities sector was the weakest relative performer, held back by the prospect of rising interest rates.
U.S. Stock Index Returns |
For the 12 months ended June 30, 2013 |
Russell 1000 Index (Large-Cap) | 21.24% | | Russell 2000 Index (Small-Cap) | 24.21% |
Russell 1000 Growth Index | 17.07% | | Russell 2000 Growth Index | 23.67% |
Russell 1000 Value Index | 25.32% | | Russell 2000 Value Index | 24.77% |
Russell Midcap Index | 25.41% | | | |
Russell Midcap Growth Index | 22.88% | | | |
Russell Midcap Value Index | 27.65% | | | |
Total Returns as of June 30, 2013 |
| | | | Average Annual Returns | |
| | Ticker Symbol | 1 year | 5 years | Since Inception | Inception
Date |
Institutional Class | ACLOX | 26.98% | 6.31% | 2.29% | 5/12/06 |
Russell 2000 Index | — | 24.21% | 8.76% | 5.37% | — |
Growth of $10,000 Over Life of Class |
$10,000 investment made May 12, 2006 |
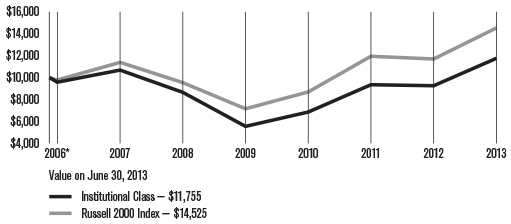
* From 5/12/06, the Institutional Class’s inception date.
Total Annual Fund Operating Expenses |
Institutional Class 0.69% |
The total annual fund operating expenses shown is as stated in the fund’s prospectus current as of the date of this report. The prospectus may vary from the expense ratio shown elsewhere in this report because it is based on a different time period, includes acquired fund fees and expenses, and, if applicable, does not include fee waivers or expense reimbursements.
Data presented reflect past performance. Past performance is no guarantee of future results. Current performance may be higher or lower than the performance shown. Investment return and principal value will fluctuate, and redemption value may be more or less than original cost. To obtain performance data current to the most recent month end, please call 1-800-345-2021 or visit americancentury.com. Historically, small company stocks have been more volatile than the stocks of larger, more established companies. The fund’s investment process may result in high portfolio turnover, which could mean high transaction costs, affecting both performance and capital gains tax liabilities to investors.
Data assumes reinvestment of dividends and capital gains, and none of the charts reflect the deduction of taxes that a shareholder would pay on fund distributions or the redemption of fund shares. Returns for the index are provided for comparison. The fund’s total returns include operating expenses (such as transaction costs and management fees) that reduce returns, while the total returns of the index do not.
Portfolio Managers: Brian Garbe and Tal Sansani
Performance Summary
NT Small Company returned 26.98% for the fiscal year ended June 30, 2013, compared with the 24.21% return of its benchmark, the Russell 2000 Index.
In a year of strength for U.S. equity markets (see page 3 for details), NT Small Company posted a solid gain, outperforming the Russell 2000 Index. NT Small Company’s stock selection process incorporates factors of growth, value, quality, and momentum, and is designed to minimize unintended risks along industries and other risk characteristics. Most fundamental drivers of stock returns contributed to the success of the fund, led by growth and quality indicators.
Absolute Performance Driven by Consumer Discretionary and Financials
Small-cap equities saw healthy advances over the past year, with every sector of the market contributing positively to the fund’s total returns. The consumer discretionary and financials sectors posted the highest absolute returns in the fund. In the consumer discretionary sector, leading contributors came from the hotel, restaurant, and leisure as well as media industries. Gaming and lottery machine maker Multimedia Games led results among leisure holdings after its 85% appreciation, mostly during the second half of the fiscal year. TV broadcasting companies Belo Corp. and Nexstar Broadcasting Group drove media returns. In financials, insurance companies were strong performers, especially National Financial Partners and HCI Group.
Industrials and Energy Led Outperformance
Nine out of 10 economic sectors finished the period with positive results compared to the index, with the industrials sector adding the most relative value. Here, the fund’s holdings in a number of industries including airlines, airfreight, electrical equipment, and machinery were advantageous. Republic Airways was among the strongest relative performers in this sector. The company’s stock soared more than 150% during the year, and the portfolio’s overweight position in the holding was especially helpful. Other individual decisions that worked well in the sector included higher-than-index weightings in printing company Quad/Graphics, which surged on above-estimate earnings, and mobile hydraulic manufacturer Sauer-Danfoss, which benefited from news of an acquisition at the end of 2012.
The energy sector was also a top contributor, with performance driven by the oil, gas, and consumable fuels industry. Greater-than-index exposure to several oil refineries, which benefited from the widening spread of input costs to output prices for much of the reporting period, was key to producing positive results. The top industry performers included Tesoro, Delek US, and Western Refining, all of which produced substantial gains during the fiscal year. Tesoro gains were also driven by announced plans to buy a California refinery.
Elsewhere in the portfolio, several significant relative contributors were also top absolute performers including Axiall (formerly Georgia Gulf) and Santarus. Integrated chemicals and building products company Axiall rose nearly 70%
thanks to strong demand from the housing sector. Biopharmaceutical holding Santarus appreciated after handily beating analyst earnings expectations for the first quarter of 2013.
Technology Detracted
Information technology was the only sector to detract from the fund’s return relative to the index. Weak results were most pronounced in the internet software and services industry. An overweight to internet media and domain services company Demand Media was particularly harmful after the company’s stock price declined during the second quarter of 2013 after an announced acquisition bid for online marketplace Society6. Internet real estate site Zillow also saw significant price declines after analysts questioned its business model.
While no other sector detracted from relative performance, several individual positions proved difficult during the year. Health care sector stocks Spectrum Pharmaceutical, Auxilium Pharmaceuticals, and Orthofix International negatively impacted the fund after suffering substantial losses. Biotechnology company Spectrum Pharmaceuticals was the largest individual portfolio detractor, falling over 50% in light of drastically lower-than-expected
revenue guidance.
Noteworthy individual positions that hurt results included overweights in silver and gold miner Coeur Mining and video rental and coin-counting kiosks operator Coinstar (now called Outerwall Inc.). Coeur Mining declined on softening precious metals prices in early 2013. Coinstar’s stock declined during the early part of the period on a weaker-than-expected outlook for the coming year.
A Look Ahead
As we move into the second half of 2013, the U.S. economic recovery seems to be progressing, albeit with headwinds. Improvements in housing, employment, economic indicators have been consistent and point to slow but positive growth. Volatility is likely to remain elevated as ongoing concerns over interest rates, Federal Reserve action, and a potential slowdown in China dominate headlines. Heightened levels of volatility often provide investment opportunities, and our disciplined, objective, and systematic investment strategy is designed to take advantage of these opportunities at the individual company level. We believe this approach is the most powerful way to capitalize on market inefficiencies that lead to the mispricing of individual stocks.
JUNE 30, 2013 |
Top Ten Holdings | % of net assets |
Portland General Electric Co. | 0.8% |
PAREXEL International Corp. | 0.7% |
Hancock Holding Co. | 0.7% |
Sanmina Corp. | 0.7% |
Sanderson Farms, Inc. | 0.7% |
Pilgrim’s Pride Corp. | 0.7% |
Iconix Brand Group, Inc. | 0.7% |
Cracker Barrel Old Country Store, Inc. | 0.7% |
Coinstar, Inc. | 0.7% |
Schweitzer-Mauduit International, Inc. | 0.7% |
| |
Top Five Industries | % of net assets |
Real Estate Investment Trusts (REITs) | 5.8% |
Insurance | 4.6% |
Commercial Banks | 4.3% |
Software | 4.2% |
Commercial Services and Supplies | 4.0% |
| |
Types of Investments in Portfolio | % of net assets |
Common Stocks | 99.7% |
Temporary Cash Investments | 0.7% |
Other Assets and Liabilities | (0.4)% |
Fund shareholders may incur two types of costs: (1) transaction costs, including sales charges (loads) on purchase payments and redemption/exchange fees; and (2) ongoing costs, including management fees; distribution and service (12b-1) fees; and other fund expenses. This example is intended to help you understand your ongoing costs (in dollars) of investing in your fund and to compare these costs with the ongoing cost of investing in other mutual funds.
The example is based on an investment of $1,000 made at the beginning of the period and held for the entire period from January 1, 2013 to June 30, 2013.
Actual Expenses
The table provides information about actual account values and actual expenses for each class. You may use the information, together with the amount you invested, to estimate the expenses that you paid over the period. First, identify the share class you own. Then simply divide your account value by $1,000 (for example, an $8,600 account value divided by $1,000 = 8.6), then multiply the result by the number under the heading “Expenses Paid During Period” to estimate the expenses you paid on your account during this period.
If you hold Investor Class shares of any American Century Investments fund, or Institutional Class shares of the American Century Diversified Bond Fund, in an American Century Investments account (i.e., not a financial intermediary or retirement plan account), American Century Investments may charge you a $12.50 semiannual account maintenance fee if the value of those shares is less than $10,000. We will redeem shares automatically in one of your accounts to pay the $12.50 fee. In determining your total eligible investment amount, we will include your investments in all personal accounts (including American Century Investments Brokerage accounts) registered under your Social Security number. Personal accounts include individual accounts, joint accounts, UGMA/UTMA accounts, personal trusts, Coverdell Education Savings Accounts and IRAs (including traditional, Roth, Rollover, SEP-, SARSEP- and SIMPLE-IRAs), and certain other retirement accounts. If you have only business, business retirement, employer-sponsored or American Century Investments Brokerage accounts, you are currently not subject to this fee. If you are subject to the Account Maintenance Fee, your account value could be reduced by the fee amount.
Hypothetical Example for Comparison Purposes
The table also provides information about hypothetical account values and hypothetical expenses based on the actual expense ratio of each class of your fund and an assumed rate of return of 5% per year before expenses, which is not the actual return of a fund’s share class. The hypothetical account values and expenses may not be used to estimate the actual ending account balance or expenses you paid for the period. You may use this information to compare the ongoing costs of investing in your fund and other funds. To do so, compare this 5% hypothetical example with the 5% hypothetical examples that appear in the shareholder reports of the other funds.
Please note that the expenses shown in the table are meant to highlight your ongoing costs only and do not reflect any transactional costs, such as sales charges (loads) or redemption/exchange fees. Therefore, the table is useful in comparing ongoing costs only, and will not help you determine the relative total costs of owning different funds. In addition, if these transactional costs were included, your costs would have been higher.| | | | | |
| | Beginning
Account Value 1/1/13 | Ending
Account Value 6/30/13 | Expenses Paid During Period(1) 1/1/13 – 6/30/13 | Annualized
Expense Ratio(1) |
Actual | | | | |
Institutional Class | $1,000 | $1,187.30 | $3.63 | 0.67% |
Hypothetical | | | | |
Institutional Class | $1,000 | $1,021.47 | $3.36 | 0.67% |
(1) | Expenses are equal to the class’s annualized expense ratio listed in the table above, multiplied by the average account value over the period, multiplied by 181, the number of days in the most recent fiscal half-year, divided by 365, to reflect the one-half year period. |
JUNE 30, 2013
| | | | | | | |
| | | Shares | | | Value | |
Common Stocks — 99.7% | |
AEROSPACE AND DEFENSE — 1.5% | |
AAR Corp. | | 44,990 | | | $988,880 | |
Alliant Techsystems, Inc. | | 4,753 | | | 391,314 | |
Esterline Technologies Corp.(1) | | 23,899 | | | 1,727,659 | |
National Presto Industries, Inc. | | 2,599 | | | 187,206 | |
Taser International, Inc.(1) | | 58,852 | | | 501,419 | |
| | | | | | 3,796,478 | |
AIR FREIGHT AND LOGISTICS — 0.1% | |
Park-Ohio Holdings Corp.(1) | | 9,612 | | | 317,004 | |
AIRLINES — 2.2% | |
Alaska Air Group, Inc.(1) | | 26,885 | | | 1,398,020 | |
Allegiant Travel Co. | | 13,699 | | | 1,451,957 | |
Republic Airways Holdings, Inc.(1) | | 131,617 | | | 1,491,221 | |
Skywest, Inc. | | 100,250 | | | 1,357,385 | |
| | | | | | 5,698,583 | |
AUTO COMPONENTS — 0.5% | |
Gentherm, Inc.(1) | | 48,172 | | | 894,554 | |
Stoneridge, Inc.(1) | | 30,462 | | | 354,578 | |
| | | | | | 1,249,132 | |
BEVERAGES — 0.1% | |
Coca-Cola Bottling Co. Consolidated | | 2,072 | | | 126,703 | |
BIOTECHNOLOGY — 2.2% | |
Alkermes plc(1) | | 51,792 | | | 1,485,394 | |
Cubist Pharmaceuticals, Inc.(1) | | 30,332 | | | 1,465,036 | |
Isis Pharmaceuticals, Inc.(1) | | 8,218 | | | 220,818 | |
MannKind Corp.(1) | | 44,216 | | | 287,404 | |
PDL BioPharma, Inc. | | 116,455 | | | 899,033 | |
United Therapeutics Corp.(1) | | 19,848 | | | 1,306,395 | |
| | | | | | 5,664,080 | |
BUILDING PRODUCTS — 0.5% | |
Gibraltar Industries, Inc.(1) | | 10,868 | | | 158,238 | |
Patrick Industries, Inc.(1) | | 32,292 | | | 671,351 | |
PGT, Inc.(1) | | 59,190 | | | 513,177 | |
| | | | | | 1,342,766 | |
CAPITAL MARKETS — 2.7% | |
Calamos Asset Management, Inc., Class A | | 77,815 | | | 817,058 | |
Diamond Hill Investment Group, Inc. | | 5,426 | | | 461,481 | |
Evercore Partners, Inc. Class A | | 39,499 | | | 1,551,521 | |
Investment Technology Group, Inc.(1) | | 107,302 | | | 1,500,082 | |
Manning & Napier, Inc. | | 68,319 | | | 1,213,345 | |
Pzena Investment Management, Inc., Class A | | 34,523 | | | 225,090 | |
WisdomTree Investments, Inc.(1) | | 105,204 | | | 1,217,210 | |
| | | | | | 6,985,787 | |
CHEMICALS — 0.6% | |
Flotek Industries, Inc.(1) | | 86,115 | | | 1,544,903 | |
COMMERCIAL BANKS — 4.3% | |
Bancorp, Inc.(1) | | 587 | | | 8,799 | |
Columbia Banking System, Inc. | | 45,214 | | | 1,076,545 | |
CVB Financial Corp. | | 132,729 | | | 1,560,893 | |
First Interstate Bancsystem, Inc. | | 27,780 | | | 575,879 | |
Hancock Holding Co. | | 61,391 | | | 1,846,027 | |
Home Bancshares, Inc. | | 48,381 | | | 1,256,455 | |
MB Financial, Inc. | | 24 | | | 643 | |
OFG Bancorp | | 62,869 | | | 1,138,558 | |
PacWest Bancorp | | 48,730 | | | 1,493,575 | |
PrivateBancorp, Inc. | | 73,375 | | | 1,556,284 | |
Renasant Corp. | | 22,360 | | | 544,242 | |
Washington Banking Co. | | 3,668 | | | 52,086 | |
| | | | | | 11,109,986 | |
COMMERCIAL SERVICES AND SUPPLIES — 4.0% | |
Cenveo, Inc.(1) | | 92,946 | | | 197,975 | |
Consolidated Graphics, Inc.(1) | | 27,698 | | | 1,302,083 | |
Deluxe Corp. | | 46,636 | | | 1,615,937 | |
Ennis, Inc. | | 13,129 | | | 227,000 | |
Intersections, Inc. | | 45,879 | | | 402,359 | |
Kimball International, Inc. Class B | | 57,299 | | | 556,373 | |
Mine Safety Appliances Co. | | 15,066 | | | 701,322 | |
Quad/Graphics, Inc. | | 59,342 | | | 1,430,142 | |
Steelcase, Inc., Class A | | 98,170 | | | 1,431,319 | |
Tetra Tech, Inc.(1) | | 9,011 | | | 211,849 | |
United Stationers, Inc. | | 42,217 | | | 1,416,380 | |
US Ecology, Inc. | | 861 | | | 23,626 | |
Viad Corp. | | 30,082 | | | 737,611 | |
| | | | | | 10,253,976 | |
COMMUNICATIONS EQUIPMENT — 2.7% | |
ARRIS Group, Inc.(1) | | 110,097 | | | 1,579,892 | |
Brocade Communications Systems, Inc.(1) | | 97,288 | | | 560,379 | |
CalAmp Corp.(1) | | 176 | | | 2,570 | |
Ciena Corp.(1) | | 80,465 | | | 1,562,630 | |
Globecomm Systems, Inc.(1) | | 15,340 | | | $193,898 | |
Harmonic, Inc.(1) | | 32,927 | | | 209,086 | |
InterDigital, Inc. | | 34,265 | | | 1,529,932 | |
Ixia(1) | | 62,537 | | | 1,150,681 | |
| | | | | | 6,789,068 | |
COMPUTERS AND PERIPHERALS — 1.3% | |
Electronics for Imaging, Inc.(1) | | 39,264 | | | 1,110,779 | |
Silicon Graphics International Corp.(1) | | 69,758 | | | 933,362 | |
Synaptics, Inc.(1) | | 36,302 | | | 1,399,805 | |
| | | | | | 3,443,946 | |
CONSTRUCTION AND ENGINEERING — 0.3% | |
Argan, Inc. | | 52,288 | | | 815,693 | |
CONSTRUCTION MATERIALS — 0.5% | |
Headwaters, Inc.(1) | | 141,751 | | | 1,253,079 | |
United States Lime & Minerals, Inc.(1) | | 1,107 | | | 57,841 | |
| | | | | | 1,310,920 | |
CONSUMER FINANCE — 1.7% | |
Cash America International, Inc. | | 32,895 | | | 1,495,407 | |
Credit Acceptance Corp.(1) | | 1,819 | | | 191,086 | |
DFC Global Corp.(1) | | 71,558 | | | 988,216 | |
Portfolio Recovery Associates, Inc.(1) | | 690 | | | 106,005 | |
World Acceptance Corp.(1) | | 17,778 | | | 1,545,619 | |
| | | | | | 4,326,333 | |
CONTAINERS AND PACKAGING — 1.4% | |
AEP Industries, Inc.(1) | | 10,078 | | | 749,702 | |
Berry Plastics Group, Inc.(1) | | 61,068 | | | 1,347,771 | |
Graphic Packaging Holding Co.(1) | | 177,503 | | | 1,373,873 | |
| | | | | | 3,471,346 | |
DIVERSIFIED CONSUMER SERVICES — 0.8% | |
Ascent Capital Group, Inc. Class A(1) | | 2,283 | | | 178,234 | |
Coinstar, Inc.(1) | | 30,095 | | | 1,765,673 | |
| | | | | | 1,943,907 | |
DIVERSIFIED FINANCIAL SERVICES — 0.8% | |
Interactive Brokers Group, Inc., Class A | | 39,697 | | | 633,961 | |
PHH Corp.(1) | | 69,547 | | | 1,417,368 | |
| | | | | | 2,051,329 | |
DIVERSIFIED TELECOMMUNICATION SERVICES — 1.7% | |
Atlantic Tele-Network, Inc. | | 19,098 | | | 948,407 | |
Cbeyond, Inc.(1) | | 1,042 | | | 8,169 | |
IDT Corp., Class B | | 34,867 | | | 651,664 | |
magicJack VocalTec Ltd.(1) | | 2,741 | | | 38,895 | |
Neutral Tandem, Inc. | | 92,732 | | | 533,209 | |
Premiere Global Services, Inc.(1) | | 115,299 | | | 1,391,659 | |
Vonage Holdings Corp.(1) | | 245,839 | | | 695,724 | |
| | | | | | 4,267,727 | |
ELECTRIC UTILITIES — 0.8% | |
Portland General Electric Co. | | 64,560 | | | 1,974,890 | |
ELECTRICAL EQUIPMENT — 0.7% | |
EnerSys | | 34,960 | | | 1,714,438 | |
ELECTRONIC EQUIPMENT, INSTRUMENTS AND COMPONENTS — 3.3% | |
Agilysys, Inc.(1) | | 11,861 | | | 133,911 | |
Audience, Inc.(1) | | 34,564 | | | 456,590 | |
Benchmark Electronics, Inc.(1) | | 29,423 | | | 591,402 | |
Checkpoint Systems, Inc.(1) | | 59,304 | | | 841,524 | |
GSI Group, Inc.(1) | | 44,629 | | | 358,817 | |
InvenSense, Inc.(1) | | 38,044 | | | 585,117 | |
Itron, Inc.(1) | | 14,290 | | | 606,325 | |
Littelfuse, Inc. | | 7,069 | | | 527,418 | |
MTS Systems Corp. | | 2,387 | | | 135,104 | |
PC Connection, Inc. | | 4,303 | | | 66,481 | |
Plexus Corp.(1) | | 17,298 | | | 517,037 | |
Sanmina Corp.(1) | | 126,226 | | | 1,811,343 | |
SYNNEX Corp.(1) | | 28,581 | | | 1,208,405 | |
Tech Data Corp.(1) | | 11,789 | | | 555,144 | |
| | | | | | 8,394,618 | |
ENERGY EQUIPMENT AND SERVICES — 0.8% | |
Dawson Geophysical Co.(1) | | 14,312 | | | 527,540 | |
Natural Gas Services Group, Inc.(1) | | 8,634 | | | 202,813 | |
Parker Drilling Co.(1) | | 231,711 | | | 1,153,921 | |
TGC Industries, Inc. | | 19,418 | | | 159,616 | |
| | | | | | 2,043,890 | |
FOOD AND STAPLES RETAILING — 1.0% | |
Pantry, Inc. (The)(1) | | 66,435 | | | 809,178 | |
Rite Aid Corp.(1) | | 111,340 | | | 318,433 | |
Roundy’s, Inc. | | 177,367 | | | 1,477,467 | |
| | | | | | 2,605,078 | |
FOOD PRODUCTS — 1.8% | |
Darling International, Inc.(1) | | 52,852 | | | 986,218 | |
Pilgrim’s Pride Corp.(1) | | 119,980 | | | 1,792,501 | |
Sanderson Farms, Inc. | | 27,120 | | | 1,801,311 | |
| | | | | | 4,580,030 | |
HEALTH CARE EQUIPMENT AND SUPPLIES — 2.5% | |
Anika Therapeutics, Inc.(1) | | 23,461 | | | 398,837 | |
CONMED Corp. | | 44,664 | | | 1,395,303 | |
Cyberonics, Inc.(1) | | 33,101 | | | 1,719,928 | |
Hill-Rom Holdings, Inc. | | 40,589 | | | 1,367,038 | |
NuVasive, Inc.(1) | | 22,679 | | | $562,213 | |
PhotoMedex, Inc.(1) | | 14,864 | | | 236,932 | |
Quidel Corp.(1) | | 26,795 | | | 684,076 | |
Rochester Medical Corp.(1) | | 7,512 | | | 110,652 | |
| | | | | | 6,474,979 | |
HEALTH CARE PROVIDERS AND SERVICES — 3.7% | |
Amsurg Corp.(1) | | 35,568 | | | 1,248,437 | |
Bio-Reference Labs, Inc.(1) | | 45,636 | | | 1,312,035 | |
Chemed Corp. | | 22,051 | | | 1,597,154 | |
LHC Group, Inc.(1) | | 10,112 | | | 197,993 | |
Molina Healthcare, Inc.(1) | | 45,294 | | | 1,684,031 | |
PharMerica Corp.(1) | | 57,441 | | | 796,132 | |
Providence Service Corp. (The)(1) | | 26,898 | | | 782,463 | |
Select Medical Holdings Corp. | | 124,500 | | | 1,020,900 | |
Skilled Healthcare Group, Inc. Class A(1) | | 33,996 | | | 227,093 | |
Triple-S Management Corp. Class B(1) | | 32,110 | | | 689,402 | |
| | | | | | 9,555,640 | |
HEALTH CARE TECHNOLOGY — 0.7% | |
MedAssets, Inc.(1) | | 84,849 | | | 1,505,221 | |
Omnicell, Inc.(1) | | 9,072 | | | 186,430 | |
| | | | | | 1,691,651 | |
HOTELS, RESTAURANTS AND LEISURE — 3.9% | |
Churchill Downs, Inc. | | 9,119 | | | 719,033 | |
Cracker Barrel Old Country Store, Inc. | | 18,725 | | | 1,772,508 | |
Interval Leisure Group, Inc. | | 36,871 | | | 734,470 | |
Isle of Capri Casinos, Inc.(1) | | 18,347 | | | 137,602 | |
Jack in the Box, Inc.(1) | | 42,575 | | | 1,672,772 | |
Jamba, Inc.(1) | | 31,043 | | | 463,472 | |
Marriott Vacations Worldwide Corp.(1) | | 25,340 | | | 1,095,702 | |
Multimedia Games Holding Co., Inc.(1) | | 30,809 | | | 803,191 | |
Red Robin Gourmet Burgers, Inc.(1) | | 15,633 | | | 862,629 | |
Sonic Corp.(1) | | 96,009 | | | 1,397,891 | |
Town Sports International Holdings, Inc. | | 32,197 | | | 346,762 | |
| | | | | | 10,006,032 | |
HOUSEHOLD DURABLES — 0.2% | |
CSS Industries, Inc. | | 15,683 | | | 390,977 | |
HOUSEHOLD PRODUCTS — 0.1% | |
Orchids Paper Products Co. | | 13,252 | | | 347,865 | |
INSURANCE — 4.6% | |
American Equity Investment Life Holding Co. | | 91,699 | | | 1,439,674 | |
American Safety Insurance Holdings Ltd.(1) | | 37,681 | | | 1,090,865 | |
AMERISAFE, Inc. | | 28,715 | | | 930,079 | |
Amtrust Financial Services, Inc. | | 44,244 | | | 1,579,511 | |
FBL Financial Group, Inc., Class A | | 12,152 | | | 528,734 | |
First American Financial Corp. | | 57,624 | | | 1,270,033 | |
HCI Group, Inc. | | 17,301 | | | 531,487 | |
Maiden Holdings Ltd. | | 122,815 | | | 1,377,984 | |
OneBeacon Insurance Group Ltd. Class A | | 13,379 | | | 193,728 | |
Stewart Information Services Corp. | | 50,754 | | | 1,329,247 | |
United Fire Group, Inc. | | 25,151 | | | 624,499 | |
Universal Insurance Holdings, Inc. | | 105,610 | | | 747,719 | |
| | | | | | 11,643,560 | |
INTERNET AND CATALOG RETAIL — 1.6% | |
Nutrisystem, Inc. | | 29,980 | | | 353,164 | |
Orbitz Worldwide, Inc.(1) | | 169,638 | | | 1,362,193 | |
Overstock.com, Inc.(1) | | 40,877 | | | 1,152,731 | |
PetMed Express, Inc. | | 97,494 | | | 1,228,425 | |
| | | | | | 4,096,513 | |
INTERNET SOFTWARE AND SERVICES — 1.9% | |
Demand Media, Inc.(1) | | 163,681 | | | 982,086 | |
IAC/InterActiveCorp | | 13,996 | | | 665,650 | |
United Online, Inc. | | 106,918 | | | 810,438 | |
ValueClick, Inc.(1) | | 65,515 | | | 1,616,910 | |
XO Group, Inc.(1) | | 61,184 | | | 685,261 | |
| | | | | | 4,760,345 | |
IT SERVICES — 2.9% | |
CACI International, Inc., Class A(1) | | 22,214 | | | 1,410,367 | |
CSG Systems International, Inc.(1) | | 29,517 | | | 640,519 | |
Euronet Worldwide, Inc.(1) | | 41,106 | | | 1,309,637 | |
Global Cash Access Holdings, Inc.(1) | | 165,427 | | | 1,035,573 | |
Heartland Payment Systems, Inc. | | 41,752 | | | 1,555,262 | |
PRGX Global, Inc.(1) | | 20,157 | | | 110,662 | |
Unisys Corp.(1) | | 60,501 | | | 1,335,257 | |
| | | | | | 7,397,277 | |
LEISURE EQUIPMENT AND PRODUCTS — 2.1% | |
Arctic Cat, Inc. | | 9,847 | | | 442,918 | |
LeapFrog Enterprises, Inc.(1) | | 141,287 | | | 1,390,264 | |
Polaris Industries, Inc. | | 6,570 | | | 624,150 | |
Smith & Wesson Holding Corp.(1) | | 150,092 | | | 1,497,918 | |
Sturm Ruger & Co., Inc. | | 31,842 | | | $1,529,690 | |
| | | | | | 5,484,940 | |
LIFE SCIENCES TOOLS AND SERVICES — 1.5% | |
Cambrex Corp.(1) | | 110,848 | | | 1,548,547 | |
Charles River Laboratories International, Inc.(1) | | 8,645 | | | 354,704 | |
PAREXEL International Corp.(1) | | 41,731 | | | 1,917,122 | |
| | | | | | 3,820,373 | |
MACHINERY — 3.3% | |
Actuant Corp., Class A | | 42,001 | | | 1,384,773 | |
Columbus McKinnon Corp.(1) | | 16,492 | | | 351,609 | |
FreightCar America, Inc. | | 13,597 | | | 231,013 | |
Hyster-Yale Materials Handling, Inc. | | 21,367 | | | 1,341,634 | |
Kadant, Inc. | | 19,102 | | | 576,307 | |
L.B. Foster Co., Class A | | 2,136 | | | 92,211 | |
Lindsay Corp. | | 18,517 | | | 1,388,405 | |
Lydall, Inc.(1) | | 40,775 | | | 595,315 | |
Mueller Water Products, Inc. Class A | | 214,434 | | | 1,481,739 | |
Standex International Corp. | | 3,633 | | | 191,641 | |
WABCO Holdings, Inc.(1) | | 10,995 | | | 821,217 | |
| | | | | | 8,455,864 | |
MEDIA — 1.7% | |
Carmike Cinemas, Inc.(1) | | 26,625 | | | 515,460 | |
E.W. Scripps Co. (The), Class A(1) | | 105,810 | | | 1,648,520 | |
Harte-Hanks, Inc. | | 70,766 | | | 608,588 | |
Journal Communications, Inc., Class A(1) | | 47,115 | | | 352,891 | |
Saga Communications, Inc. Class A | | 2,773 | | | 127,308 | |
Scholastic Corp. | | 34,536 | | | 1,011,560 | |
| | | | | | 4,264,327 | |
METALS AND MINING — 1.8% | |
Coeur Mining, Inc.(1) | | 114,068 | | | 1,517,105 | |
Handy & Harman Ltd.(1) | | 2,482 | | | 44,378 | |
Kaiser Aluminum Corp. | | 20,733 | | | 1,284,202 | |
Nevsun Resources Ltd. | | 86,275 | | | 254,511 | |
Worthington Industries, Inc. | | 46,906 | | | 1,487,389 | |
| | | | | | 4,587,585 | |
MULTILINE RETAIL — 0.3% | |
Dillard’s, Inc., Class A | | 9,321 | | | 764,042 | |
OIL, GAS AND CONSUMABLE FUELS — 2.5% | |
Alon USA Energy, Inc. | | 81,190 | | | 1,174,007 | |
CVR Energy, Inc. | | 21,434 | | | 1,015,972 | |
Delek US Holdings, Inc. | | 43,078 | | | 1,239,785 | |
Renewable Energy Group, Inc.(1) | | 3,967 | | | 56,450 | |
Rosetta Resources, Inc.(1) | | 4,909 | | | 208,731 | |
Tesoro Corp. | | 24,104 | | | 1,261,121 | |
Warren Resources, Inc.(1) | | 22,093 | | | 56,337 | |
Western Refining, Inc. | | 53,080 | | | 1,489,956 | |
| | | | | | 6,502,359 | |
PAPER AND FOREST PRODUCTS — 1.8% | |
Louisiana-Pacific Corp.(1) | | 101,399 | | | 1,499,691 | |
Resolute Forest Products(1) | | 94,089 | | | 1,239,152 | |
Schweitzer-Mauduit International, Inc. | | 35,337 | | | 1,762,610 | |
| | | | | | 4,501,453 | |
PERSONAL PRODUCTS — 1.1% | |
Medifast, Inc.(1) | | 55,621 | | | 1,432,797 | |
USANA Health Sciences, Inc.(1) | | 19,939 | | | 1,443,185 | |
| | | | | | 2,875,982 | |
PHARMACEUTICALS — 2.0% | |
BioDelivery Sciences International, Inc.(1) | | 97,706 | | | 396,686 | |
Endocyte, Inc.(1) | | 81,163 | | | 1,065,670 | |
Lannett Co., Inc.(1) | | 34,711 | | | 413,408 | |
Questcor Pharmaceuticals, Inc. | | 38,386 | | | 1,745,028 | |
Santarus, Inc.(1) | | 65,928 | | | 1,387,785 | |
| | | | | | 5,008,577 | |
PROFESSIONAL SERVICES — 2.2% | |
Barrett Business Services, Inc. | | 10,448 | | | 545,490 | |
FTI Consulting, Inc.(1) | | 17,125 | | | 563,241 | |
Huron Consulting Group, Inc.(1) | | 30,909 | | | 1,429,232 | |
Kforce, Inc. | | 84,465 | | | 1,233,189 | |
Navigant Consulting, Inc.(1) | | 34,608 | | | 415,296 | |
RPX Corp.(1) | | 92,720 | | | 1,557,696 | |
| | | | | | 5,744,144 | |
REAL ESTATE INVESTMENT TRUSTS (REITs) — 5.8% | |
Alexander’s, Inc. | | 272 | | | 79,889 | |
Apollo Commercial Real Estate Finance, Inc. | | 38,020 | | | 603,758 | |
Cousins Properties, Inc. | | 158,232 | | | 1,598,143 | |
EastGroup Properties, Inc. | | 28,617 | | | 1,610,279 | |
First Industrial Realty Trust, Inc. | | 99,688 | | | 1,512,267 | |
Geo Group, Inc. (The) | | 50,075 | | | 1,700,046 | |
Gramercy Property Trust, Inc.(1) | | 120,438 | | | 541,971 | |
LaSalle Hotel Properties | | 51,638 | | | 1,275,459 | |
Pennsylvania Real Estate Investment Trust | | 68,116 | | | 1,286,030 | |
RAIT Financial Trust | | 105,193 | | | 791,051 | |
RLJ Lodging Trust | | 73,597 | | | $1,655,196 | |
Ryman Hospitality Properties | | 26,620 | | | 1,038,446 | |
Spirit Realty Capital, Inc. | | 67,800 | | | 1,201,416 | |
| | | | | | 14,893,951 | |
ROAD AND RAIL — 0.9% | |
AMERCO, Inc. | | 3,492 | | | 565,355 | |
Swift Transportation Co.(1) | | 101,979 | | | 1,686,732 | |
| | | | | | 2,252,087 | |
SEMICONDUCTORS AND SEMICONDUCTOR EQUIPMENT — 2.9% | |
Advanced Energy Industries, Inc.(1) | | 70,906 | | | 1,234,474 | |
ATMI, Inc.(1) | | 19,493 | | | 461,010 | |
First Solar, Inc.(1) | | 33,174 | | | 1,483,873 | |
Kulicke & Soffa Industries, Inc.(1) | | 73,722 | | | 815,365 | |
LSI Corp.(1) | | 86,277 | | | 616,018 | |
MaxLinear, Inc. Class A(1) | | 62,210 | | | 435,470 | |
Microsemi Corp.(1) | | 76,619 | | | 1,743,082 | |
PLX Technology, Inc.(1) | | 139,144 | | | 662,325 | |
| | | | | | 7,451,617 | |
SOFTWARE — 4.2% | |
Aspen Technology, Inc.(1) | | 57,589 | | | 1,657,987 | |
Cadence Design Systems, Inc.(1) | | 49,832 | | | 721,567 | |
CommVault Systems, Inc.(1) | | 23,170 | | | 1,758,371 | |
Manhattan Associates, Inc.(1) | | 20,801 | | | 1,605,005 | |
Mentor Graphics Corp. | | 86,752 | | | 1,696,002 | |
Monotype Imaging Holdings, Inc. | | 15,433 | | | 392,153 | |
NetScout Systems, Inc.(1) | | 63,266 | | | 1,476,628 | |
PTC, Inc.(1) | | 43,798 | | | 1,074,365 | |
QAD, Inc., Class A | | 2,768 | | | 31,777 | |
TeleNav, Inc.(1) | | 51,533 | | | 269,518 | |
| | | | | | 10,683,373 | |
SPECIALTY RETAIL — 3.0% | |
ANN, Inc.(1) | | 9,816 | | | 325,891 | |
Big 5 Sporting Goods Corp. | | 58,651 | | | 1,287,390 | |
Brown Shoe Co., Inc. | | 68,674 | | | 1,478,551 | |
Buckle, Inc. (The) | | 30,670 | | | 1,595,453 | |
Childrens Place Retail Stores, Inc. (The)(1) | | 29,242 | | | 1,602,462 | |
Destination Maternity Corp. | | 15,350 | | | 377,610 | |
Francesca’s Holdings Corp.(1) | | 56 | | | 1,556 | |
GameStop Corp., Class A | | 25,178 | | | 1,058,231 | |
| | | | | | 7,727,144 | |
TEXTILES, APPAREL AND LUXURY GOODS — 1.1% | |
Culp, Inc. | | 21,374 | | | 371,694 | |
Iconix Brand Group, Inc.(1) | | 60,477 | | | 1,778,629 | |
RG Barry Corp. | | 6,331 | | | 102,815 | |
Unifi, Inc.(1) | | 22,913 | | | 473,612 | |
| | | | | | 2,726,750 | |
THRIFTS AND MORTGAGE FINANCE — 0.5% | |
Ocwen Financial Corp.(1) | | 33,527 | | | 1,381,983 | |
WATER UTILITIES — 0.5% | |
American States Water Co. | | 26,126 | | | 1,402,182 | |
WIRELESS TELECOMMUNICATION SERVICES — 0.1% | |
USA Mobility, Inc. | | 22,051 | | | 299,232 | |
TOTAL COMMON STOCKS (Cost $214,469,945) | | | 255,015,415 | |
Temporary Cash Investments — 0.7% | |
Repurchase Agreement, Bank of America Merrill Lynch, (collateralized by various U.S. Treasury obligations, 1.00%, 1/15/14, valued at $238,083), in a joint trading account at 0.06%, dated 6/28/13, due 7/1/13 (Delivery value $233,214) | | | 233,213 | |
Repurchase Agreement, Credit Suisse First Boston, Inc., (collateralized by various U.S. Treasury obligations, 4.25%, 11/15/40, valued at $712,858), in a joint trading account at 0.05%, dated 6/28/13, due 7/1/13 (Delivery value $699,641) | | | 699,638 | |
Repurchase Agreement, Goldman Sachs & Co., (collateralized by various U.S. Treasury obligations, 3.125%, 11/15/41, valued at $237,209), in a joint trading account at 0.04%, dated 6/28/13, due 7/1/13 (Delivery value $233,214) | | | 233,213 | |
SSgA U.S. Government Money Market Fund | | 643,780 | | | 643,780 | |
TOTAL TEMPORARY CASH INVESTMENTS (Cost $1,809,844) | | | 1,809,844 | |
TOTAL INVESTMENT SECURITIES — 100.4% (Cost $216,279,789) | | | 256,825,259 | |
OTHER ASSETS AND LIABILITIES — (0.4)% | | | (960,173 | ) |
TOTAL NET ASSETS — 100.0% | | | $255,865,086 | |
Notes to Schedule of Investments
See Notes to Financial Statements.
Statement of Assets and Liabilities |
JUNE 30, 2013 | |
Assets | |
Investment securities, at value (cost of $216,279,789) | | $256,825,259 | |
Receivable for capital shares sold | | 11,425 | |
Dividends and interest receivable | | 186,267 | |
| | | 257,022,951 | |
| | | | |
Liabilities | | | |
Payable for capital shares redeemed | | 1,016,060 | |
Accrued management fees | | 141,805 | |
| | | 1,157,865 | |
| | | | |
Net Assets | | $255,865,086 | |
| | | | |
Institutional Class Capital Shares, $0.01 Par Value | | | |
Shares authorized | | 100,000,000 | |
Shares outstanding | | 25,883,775 | |
| | | | |
Net Asset Value Per Share | | $9.89 | |
| | | | |
Net Assets Consist of: | | | |
Capital (par value and paid-in surplus) | | $196,778,885 | |
Undistributed net investment income | | 350,228 | |
Undistributed net realized gain | | 18,190,503 | |
Net unrealized appreciation | | 40,545,470 | |
| | | $255,865,086 | |
See Notes to Financial Statements.
YEAR ENDED JUNE 30, 2013 | |
Investment Income (Loss) | |
Income: | | | |
Dividends (net of foreign taxes withheld of $2,321) | | $3,777,168 | |
Interest | | 2,779 | |
| | | 3,779,947 | |
| | | | |
Expenses: | | | |
Management fees | | 1,415,495 | |
Directors’ fees and expenses | | 9,386 | |
Other expenses | | 401 | |
| | | 1,425,282 | |
| | | | |
Net investment income (loss) | | 2,354,665 | |
| | | | |
Realized and Unrealized Gain (Loss) | | | |
Net realized gain (loss) on: | | | |
Investment transactions | | 23,252,382 | |
Futures contract transactions | | 182,285 | |
| | | 23,434,667 | |
| | | | |
Change in net unrealized appreciation (depreciation) on investments | | 26,674,960 | |
| | | | |
Net realized and unrealized gain (loss) | | 50,109,627 | |
| | | | |
Net Increase (Decrease) in Net Assets Resulting from Operations | | $52,464,292 | |
See Notes to Financial Statements.
Statement of Changes in Net Assets |
YEARS ENDED JUNE 30, 2013 AND JUNE 30, 2012 | |
Increase (Decrease) in Net Assets | | June 30, 2013 | | | June 30, 2012 | |
Operations | |
Net investment income (loss) | | $2,354,665 | | | $989,157 | |
Net realized gain (loss) | | 23,434,667 | | | 6,257,262 | |
Change in net unrealized appreciation (depreciation) | | 26,674,960 | | | (6,549,616 | ) |
Net increase (decrease) in net assets resulting from operations | | 52,464,292 | | | 696,803 | |
| | | | | | | |
Distributions to Shareholders | | | | | | |
From net investment income | | (2,238,453 | ) | | (604,943 | ) |
From net realized gains | | (9,263,359 | ) | | (11,273,310 | ) |
Decrease in net assets from distributions | | (11,501,812 | ) | | (11,878,253 | ) |
| | | | | | | |
Capital Share Transactions | | | | | | |
Proceeds from shares sold | | 57,254,934 | | | 50,747,672 | |
Proceeds from reinvestment of distributions | | 11,501,812 | | | 11,878,253 | |
Payments for shares redeemed | | (31,289,776 | ) | | (5,581,048 | ) |
Net increase (decrease) in net assets from capital share transactions | | 37,466,970 | | | 57,044,877 | |
| | | | | | | |
Net increase (decrease) in net assets | | 78,429,450 | | | 45,863,427 | |
| | | | | | | |
Net Assets | | | | | | |
Beginning of period | | 177,435,636 | | | 131,572,209 | |
End of period | | $255,865,086 | | | $177,435,636 | |
| | | | | | | |
Undistributed net investment income | | $350,228 | | | $363,202 | |
| | | | | | | |
Transactions in Shares of the Fund | | | | | | |
Sold | | 6,635,354 | | | 6,219,375 | |
Issued in reinvestment of distributions | | 1,391,954 | | | 1,570,029 | |
Redeemed | | (3,604,188 | ) | | (677,031 | ) |
Net increase (decrease) in shares of the fund | | 4,423,120 | | | 7,112,373 | |
See Notes to Financial Statements.
Notes to Financial Statements |
JUNE 30, 2013
1. Organization
American Century Quantitative Equity Funds, Inc. (the corporation) is registered under the Investment Company Act of 1940, as amended (the 1940 Act), as an open-end management investment company and is organized as a Maryland corporation. NT Small Company Fund (the fund) is one fund in a series issued by the corporation. The fund is diversified as defined under the 1940 Act. The fund’s investment objective is to seek long-term capital growth. The fund is not permitted to invest in securities issued by companies assigned the Global Industry Classification Standard for the tobacco industry.
2. Significant Accounting Policies
The following is a summary of significant accounting policies consistently followed by the fund in preparation of its financial statements. The financial statements are prepared in conformity with accounting principles generally accepted in the United States of America, which may require management to make certain estimates and assumptions at the date of the financial statements. Actual results could differ from these estimates.
Investment Valuations — The fund determines the fair value of its investments and computes its net asset value per share as of the close of regular trading (usually 4 p.m. Eastern time) on the New York Stock Exchange (NYSE) on each day the NYSE is open.
Equity securities that are listed or traded on a domestic securities exchange are valued at the last reported sales price or at the official closing price as provided by the exchange. Equity securities traded on foreign securities exchanges are typically valued at the closing price on the exchange where primarily traded or as of the close of the NYSE, if that is earlier. If no last sales price is reported, or if local convention or regulation so provides, the mean of the latest bid and asked prices is used. Depending on local convention or regulation, securities traded over-the-counter are valued at the mean of the latest bid and asked prices, the last sales price, or the official closing price. In its determination of fair value, the fund may review several factors including: market information specific to a security; news developments in U.S. and foreign markets; the performance of particular U.S. and foreign securities, indices, comparable securities, American Depositary Receipts, Exchange-Traded Funds, and other relevant market indicators.
Debt securities maturing within 60 days at the time of purchase may be valued at cost, plus or minus any amortized discount or premium or at the evaluated mean as provided by an independent pricing service. Evaluated mean prices are commonly derived through utilization of market models, which may consider, among other factors, trade data, quotations from dealers and active market makers, relevant yield curve and spread data, related sector levels, creditworthiness, and other relevant market information on the same or comparable securities.
Investments in open-end management investment companies are valued at the reported net asset value per share. Repurchase agreements are valued at cost. Exchange-traded futures contracts are valued at the settlement price as provided by the appropriate clearing corporation.
If the fund determines that the market price for a portfolio security is not readily available or the valuation methods mentioned above do not reflect a security’s fair value, such security is valued as determined in good faith by the Board of Directors or its designee, in accordance with procedures adopted by the Board of Directors. Circumstances that may cause the fund to use these procedures to value a security include, but are not limited to: a security has been declared in default; trading in a security has been halted during the trading day; there is a foreign market holiday and no trading occurred; or an event occurred between the close of a foreign exchange and the NYSE that may affect the value of a security.
Security Transactions — Security transactions are accounted for as of the trade date. Net realized gains and losses are determined on the identified cost basis, which is also used for federal income tax purposes.
Investment Income — Dividend income less foreign taxes withheld, if any, is recorded as of the ex-dividend date. Distributions received on securities that represent a return of capital or long-term capital gain are recorded as a reduction of cost of investments and/or as a realized gain. The fund may estimate the components of distributions received that may be considered nontaxable distributions or long-term capital gain distributions for income tax purposes. Interest income is recorded on the accrual basis and includes accretion of discounts and amortization of premiums.
Repurchase Agreements — The fund may enter into repurchase agreements with institutions that American Century Investment Management, Inc. (ACIM) (the investment advisor) has determined are creditworthy pursuant to criteria adopted by the Board of Directors. The fund requires that the collateral, represented by securities, received in a repurchase transaction be transferred to the custodian in a manner sufficient to enable the fund to obtain those securities in the event of a default under the repurchase agreement. ACIM monitors, on a daily basis, the securities transferred to ensure the value, including accrued interest, of the securities under each repurchase agreement is equal to or greater than amounts owed to the fund under each repurchase agreement.
Joint Trading Account — Pursuant to an Exemptive Order issued by the Securities and Exchange Commission, the fund, along with certain other funds in the American Century Investments family of funds, may transfer uninvested cash balances into a joint trading account. These balances are invested in one or more repurchase agreements that are collateralized by U.S. Treasury or Agency obligations.
Segregated Assets — In accordance with the 1940 Act, the fund segregates assets on its books and records to cover futures contracts. ACIM monitors, on a daily basis, the securities segregated to ensure the fund designates a sufficient amount of liquid assets, marked-to-market daily. The fund may also receive assets or be required to pledge assets at the custodian bank or with a broker for margin requirements on futures contracts.
Income Tax Status — It is the fund’s policy to distribute substantially all net investment income and net realized gains to shareholders and to otherwise qualify as a regulated investment company under provisions of the Internal Revenue Code. Accordingly, no provision has been made for income taxes. The fund files U.S. federal, state, local and non-U.S. tax returns as applicable. The fund’s tax returns are subject to examination by the relevant taxing authority until expiration of the applicable statute of limitations, which is generally three years from the date of filing but can be longer in certain jurisdictions. At this time, management believes there are no uncertain tax positions which, based on their technical merit, would not be sustained upon examination and for which it is reasonably possible that the total amounts of unrecognized tax benefits will significantly change in the next twelve months.
Distributions to Shareholders — Distributions from net investment income, if any, are generally declared and paid quarterly. Distributions from net realized gains, if any, are generally declared and paid annually.
Indemnifications — Under the corporation’s organizational documents, its officers and directors are indemnified against certain liabilities arising out of the performance of their duties to the fund. In addition, in the normal course of business, the fund enters into contracts that provide general indemnifications. The maximum exposure under these arrangements is unknown as this would involve future claims that may be made against a fund. The risk of material loss from such claims is considered by management to be remote.
3. Fees and Transactions with Related Parties
Management Fees — The corporation has entered into a management agreement with ACIM, under which ACIM provides the fund with investment advisory and management services in exchange for a single, unified management fee (the fee). The agreement provides that all expenses of managing and operating the fund, except distribution and service fees, brokerage expenses, taxes, interest, fees and expenses of the independent directors (including legal counsel fees), and extraordinary expenses, will be paid by ACIM. The fee is computed and accrued daily based on the daily net assets of the fund and paid monthly in arrears. The fee consists of (1) an Investment Category Fee based on the daily net assets of the fund and certain other accounts managed by the investment advisor that are in the same broad investment category as the fund and (2) a Complex Fee based on the assets of all the funds in the American Century Investments family of funds. The rates for the Investment Category Fee range from 0.5380% to 0.7200%. The rates for the Complex Fee range from 0.0500% to 0.1100%. The effective annual management fee for the year ended June 30, 2013 was 0.67%.
Related Parties — Certain officers and directors of the corporation are also officers and/or directors of American Century Companies, Inc. (ACC). The corporation’s investment advisor, ACIM, the corporation’s distributor, American Century Investment Services, Inc., and the corporation’s transfer agent, American Century Services, LLC are wholly owned, directly or indirectly, by ACC. Various funds issued by American Century Asset Allocation Portfolios, Inc. own, in aggregate, 100% of the shares of the fund. Related parties do not invest in the fund for the purpose of exercising management or control.
4. Investment Transactions
Purchases and sales of investment securities, excluding short-term investments, for the year ended June 30, 2013 were $250,030,767 and $220,811,546, respectively.
5. Fair Value Measurements
The fund’s securities valuation process is based on several considerations and may use multiple inputs to determine the fair value of the positions held by the fund. In conformity with accounting principles generally accepted in the United States of America, the inputs used to determine a valuation are classified into three broad levels as follows:
• | Level 1 valuation inputs consist of unadjusted quoted prices in an active market for identical securities; |
• | Level 2 valuation inputs consist of direct or indirect observable market data (including quoted prices for similar securities, evaluations of subsequent market events, interest rates, prepayment speeds, credit risk, etc.); or |
• | Level 3 valuation inputs consist of unobservable data (including a fund’s own assumptions). |
The level classification is based on the lowest level input that is significant to the fair valuation measurement. The valuation inputs are not necessarily an indication of the risks associated with investing in these securities or other financial instruments.
The following is a summary of the level classifications as of period end. The Schedule of Investments provides additional information on the fund’s portfolio holdings.
| | | | |
| | Level 1 | Level 2 | Level 3 |
Investment Securities | | | |
Common Stocks | $255,015,415 | — | — |
Temporary Cash Investments | 643,780 | $1,166,064 | — |
Total Value of Investment Securities | $255,659,195 | $1,166,064 | — |
6. Derivative Instruments
Equity Price Risk — The fund is subject to equity price risk in the normal course of pursuing its investment objectives. A fund may enter into futures contracts based on an equity index in order to manage its exposure to changes in market conditions. A fund may purchase futures contracts to gain exposure to increases in market value or sell futures contracts to protect against a decline in market value. Upon entering into a futures contract, a fund is required to deposit either cash or securities in an amount equal to a certain percentage of the contract value (initial margin). Subsequent payments (variation margin) are made or received daily, in cash, by a fund. The variation margin is equal to the daily change in the contract value and is recorded as unrealized gains and losses. A fund recognizes a realized gain or loss when the contract is closed or expires. Net realized and unrealized gains or losses occurring during the holding period of futures contracts are a component of net realized gain (loss) on futures contract transactions and change in net unrealized appreciation (depreciation) on futures contracts, respectively. One of the risks of entering into futures contracts is the possibility that the change in value of the contract may not correlate with the changes in value of the underlying securities. During the period, the fund infrequently purchased equity price risk derivative instruments for temporary investment purposes.
At period end, the fund did not have any derivative instruments disclosed on the Statement of Assets and Liabilities. For the year ended June 30, 2013, the effect of equity price risk derivative instruments on the Statement of Operations was $182,285 in net realized gain (loss) on futures contract transactions.
7. Risk Factors
The fund’s investment process may result in high portfolio turnover, which could mean high transaction costs, affecting both performance and capital gains tax liabilities to investors.
The fund concentrates its investments in common stocks of small companies. Because of this, the fund may be subject to greater risk and market fluctuations than a fund investing in larger, more established companies.
8. Federal Tax Information
The tax character of distributions paid during the years ended June 30, 2013 and June 30, 2012 were as follows:
| | | |
| | 2013 | 2012 |
Distributions Paid From | | |
Ordinary income | $2,238,453 | $604,943 |
Long-term capital gains | $9,263,359 | $11,273,310 |
The book-basis character of distributions made during the year from net investment income or net realized gains may differ from their ultimate characterization for federal income tax purposes. These differences reflect the differing character of certain income items and net realized gains and losses for financial statement and tax purposes, and may result in reclassification among certain capital accounts on the financial statements.
As of June 30, 2013, the federal tax cost of investments and the components of distributable earnings on a tax-basis were as follows:
| | |
Federal tax cost of investments | $217,776,844 |
Gross tax appreciation of investments | $43,903,126 |
Gross tax depreciation of investments | (4,854,711) |
Net tax appreciation (depreciation) of investments | $39,048,415 |
Undistributed ordinary income | $9,224,033 |
Accumulated long-term gains | $10,813,753 |
The difference between book-basis and tax-basis unrealized appreciation (depreciation) is attributable primarily to the tax deferral of losses on wash sales.
| |
For a Share Outstanding Throughout the Years Ended June 30 (except as noted) |
Per-Share Data | Ratios and Supplemental Data |
| | | Income From Investment Operations: | Distributions From: | | | Ratio to Average Net Assets of: | | |
| | Net Asset Value, Beginning
of Period | Net
Investment Income
(Loss)(1) | Net
Realized and Unrealized
Gain (Loss) | Total From Investment Operations | Net
Investment Income | Net
Realized
Gains | Total Distributions | Net Asset Value,
End of Period | Total
Return(2) | Operating Expenses | Net
Investment Income
(Loss) | Portfolio Turnover
Rate | Net Assets,
End of Period (in thousands) |
Institutional Class |
2013 | $8.27 | 0.10 | 2.03 | 2.13 | (0.10) | (0.41) | (0.51) | $9.89 | 26.98% | 0.68% | 1.12% | 106% | $255,865 |
2012 | $9.17 | 0.06 | (0.23) | (0.17) | (0.03) | (0.70) | (0.73) | $8.27 | (0.98)% | 0.68% | 0.67% | 86% | $177,436 |
2011 | $6.76 | 0.03 | 2.42 | 2.45 | (0.04) | — | (0.04) | $9.17 | 36.29% | 0.69% | 0.38% | 93% | $131,572 |
2010 | $5.50 | 0.02 | 1.27 | 1.29 | (0.03) | — | (0.03) | $6.76 | 23.50% | 0.69% | 0.34% | 78% | $76,433 |
2009 | $8.60 | 0.03 | (3.11) | (3.08) | (0.02) | — | (0.02) | $5.50 | (35.83)% | 0.70% | 0.56% | 110% | $47,041 |
Notes to Financial Highlights
(1) | Computed using average shares outstanding throughout the period. |
(2) | Total returns are calculated based on the net asset value of the last business day. Total returns for periods less than one year are not annualized. |
See Notes to Financial Statements.
Report of Independent Registered Public Accounting Firm |
To the Directors of the American Century Quantitative Equity Funds, Inc.
and Shareholders of the NT Small Company Fund:
In our opinion, the accompanying statement of assets and liabilities, including the schedule of investments, and the related statements of operations and of changes in net assets and the financial highlights present fairly, in all material respects, the financial position of the NT Small Company Fund (one of the fourteen funds comprising the American Century Quantitative Equity Funds, Inc., hereafter referred to as the “Fund”) at June 30, 2013, the results of its operations for the year then ended, the changes in its net assets for each of the two years in the period then ended and the financial highlights for each of the five years in the period then ended, in conformity with accounting principles generally accepted in the United States of America. These financial statements and financial highlights (hereafter referred to as “financial statements”) are the responsibility of the Fund’s management; our responsibility is to express an opinion on these financial statements based on our audits. We conducted our audits of these financial statements in accordance with the standards of the Public Company Accounting Oversight Board (United States). Those standards require that we plan and perform the audit to obtain reasonable assurance about whether the financial statements are free of material misstatement. An audit includes examining, on a test basis, evidence supporting the amounts and disclosures in the financial statements, assessing the accounting principles used and significant estimates made by management, and evaluating the overall financial statement presentation. We believe that our audits, which included confirmation of securities at June 30, 2013 by correspondence with the custodian and brokers, provide a reasonable basis for our opinion.
PricewaterhouseCoopers LLP
Kansas City, Missouri
August 21, 2013
Board of Directors
The individuals listed below serve as directors of the funds. Each director will continue to serve in this capacity until death, retirement, resignation or removal from office. The board has adopted a mandatory retirement age for directors who are not “interested persons,” as that term is defined in the Investment Company Act (independent directors). Independent directors shall retire on December 31 of the year in which they reach their 75th birthday; provided, however, that on or after January 1, 2022, independent directors shall retire on December 31 of the year in which they reach their 76th birthday.
Mr. Thomas is the only director who is an “interested person” because he currently serves as President and Chief Executive Officer of American Century Companies, Inc. (ACC), the parent company of American Century Investment Management, Inc. (ACIM or the advisor).
The other directors (more than three-fourths of the total number) are independent; that is, they have never been employees, directors or officers of, and have no financial interest in, ACC or any of its wholly owned, direct or indirect, subsidiaries, including ACIM, American Century Investment Services, Inc. (ACIS) and American Century Services, LLC (ACS). The directors serve in this capacity for eight (in the case of Mr. Thomas, 15) registered investment companies in the American Century Investments family of funds.
The following table presents additional information about the directors. The mailing address for each director other than Mr. Thomas is 1665 Charleston Road, Mountain View, California 94043. The mailing address for Mr. Thomas is 4500 Main Street, Kansas City, Missouri 64111.
| | | | | | | |
Name
(Year of Birth) | Position(s) Held with Funds | Length
of Time Served | Principal Occupation(s) During Past 5 Years | | Number of American Century Portfolios Overseen
by Director | Other Directorships Held During Past 5 Years |
Independent Directors |
Tanya S. Beder (1955) | Director | Since 2011 | Chairman, SBCC Group Inc. (independent advisory services) (2006 to present) | | 41 | CYS Investments, Inc. (specialty finance company) |
Jeremy I. Bulow (1954) | Director | Since 2011 | Professor of Economics, Stanford University, Graduate School of Business (1979 to present) | | 41 | None |
Ronald J. Gilson (1946) | Director and Chairman of the Board | Since 1995 | Charles J. Meyers Professor of Law and Business, Stanford Law School (1979 to present); Marc and Eva Stern Professor of Law and Business, Columbia University School of Law
(1992 to present) | | 41 | None |
Frederick L. A. Grauer
(1946) | Director | Since 2008 | Senior Advisor, BlackRock, Inc. (investment management firm) (2010 to 2011); Senior Advisor, Barclays Global Investors (investment management firm) (2003 to 2009) | | 41 | None |
| | | | | | | |
Name
(Year of Birth) | Position(s) Held with Funds | Length
of Time Served | Principal Occupation(s) During Past 5 Years | | Number of American Century Portfolios Overseen
by Director | Other Directorships Held During Past 5 Years |
Independent Directors |
Peter F. Pervere (1947) | Director | Since 2007 | Retired | | 41 | Intraware, Inc. (2003 to 2009) |
Myron S. Scholes (1941) | Director | Since 1980 | Chairman, Platinum Grove Asset Management, L.P. (asset manager) (1999 to 2009); Frank E. Buck Professor of Finance-Emeritus, Stanford Graduate School of Business (1996 to present) | | 41 | Dimensional Fund Advisors (investment advisor); CME Group, Inc. (futures and options exchange) |
John B. Shoven (1947) | Director | Since 2002 | Professor of Economics, Stanford University (1973 to present) | | 41 | Cadence Design Systems; Exponent; Financial Engines |
| |
Interested Director |
Jonathan S. Thomas
(1963) | Director and President | Since 2007 | President and Chief Executive Officer, ACC (March 2007 to present). Also serves as Chief Executive Officer and Manager, ACS; Executive Vice President, ACIM; Director, ACC, ACIM and other ACC subsidiaries | | 106 | None |
Officers
The following table presents certain information about the executive officers of the funds. Each officer serves as an officer for each of the 15 investment companies in the American Century family of funds, unless otherwise noted. No officer is compensated for his or her service as an officer of the funds. The listed officers are interested persons of the funds and are appointed or re-appointed on an annual basis. The mailing address for each of the officers listed below is 4500 Main Street, Kansas City, Missouri 64111
| | | |
Name
(Year of Birth) | Offices with the Funds | Principal Occupation(s) During the Past Five Years |
Jonathan S. Thomas
(1963) | Director and President since 2007 | President and Chief Executive Officer, ACC (March 2007 to present). Also serves as Chief Executive Officer and Manager, ACS; Executive Vice President, ACIM; Director, ACC, ACIM and other ACC subsidiaries |
Maryanne L. Roepke
(1956) | Chief Compliance Officer since 2006 and Senior Vice President since 2000 | Chief Compliance Officer, American Century funds, ACIM and ACS (August 2006 to present). Also serves as Senior Vice President, ACS |
Charles A. Etherington (1957) | General Counsel since 2007 and Senior Vice President since 2006 | Attorney, ACC (February 1994 to present); Vice President, ACC (November 2005 to present); General Counsel, ACC (March 2007 to present). Also serves as General Counsel, ACIM, ACS, ACIS and other ACC subsidiaries; and Senior Vice President, ACIM and ACS |
C. Jean Wade (1964) | Vice President, Treasurer and Chief Financial Officer since 2012 | Vice President, ACS (February 2000 to present) |
Robert J. Leach (1966) | Vice President since 2006 and Assistant Treasurer since 2012 | Vice President, ACS (February 2000 to present) |
David H. Reinmiller (1963) | Vice President since 2001 | Attorney, ACC (January 1994 to present); Associate General Counsel, ACC (January 2001 to present). Also serves as Vice President, ACIM and ACS |
Ward D. Stauffer (1960) | Secretary since 2005 | Attorney, ACC (June 2003 to present) |
The Statement of Additional Information has additional information about the fund’s directors and is available without charge, upon request, by calling 1-800-345-2021.
Approval of Management Agreement |
At a meeting held on June 11, 2013, the Fund’s Board of Directors/Trustees unanimously approved the renewal of the management agreement pursuant to which American Century Investment Management, Inc. (the “Advisor”) acts as the investment advisor for the Fund. Under Section 15(c) of the Investment Company Act, contracts for investment advisory services are required to be reviewed, evaluated, and approved by a majority of a fund’s directors/trustees (the “Directors”), including a majority of the independent Directors each year. The Board regards this annual evaluation and renewal as one of its most important responsibilities.
In connection with their annual review and evaluation, the independent Directors memorialized a statement regarding the relationship between their ongoing obligations to oversee and evaluate the performance of the Advisor and their consideration of renewal of the management agreement. In that statement, the independent Directors noted that their assessment of the Advisor’s performance is an ongoing process that takes place over the entire year and is informed by all of the information that the Board and its committees receive and consider over time. This information, together with the materials provided in connection with the review, are central to the Board’s assessment of the Advisor’s performance and its determination whether to renew the Fund’s management agreement.
Prior to its consideration of the renewal of the management agreement, the Board requested and reviewed extensive data and analysis relating to the proposed renewal. This information and analysis was compiled by the Advisor and certain independent providers of evaluation data concerning the Fund and the services provided to the Fund by the Advisor.
In connection with its consideration of the renewal of the management agreement, the Board’s review and evaluation of the services provided by the Advisor included, but was not limited to, the following:
• | the nature, extent, and quality of investment management, shareholder services, and other services provided by the Advisor to the Fund; |
• | the wide range of other programs and services the Advisor provides to the Fund and its shareholders on a routine and non-routine basis; |
• | the investment performance of the Fund, including data comparing the Fund’s performance to appropriate benchmarks and/or a peer group of other mutual funds with similar investment objectives and strategies; |
• | data comparing the cost of owning the Fund to the cost of owning similar funds; |
• | the Advisor’s compliance policies, procedures, and regulatory experience; |
• | financial data showing the cost of services provided to the Fund, the profitability of the Fund to the Advisor, and the overall profitability of the Advisor; |
• | possible economies of scale associated with the Advisor’s management of the Fund and other accounts under its management; |
• | data comparing services provided and charges to other investment management clients of the Advisor; and |
• | consideration of collateral benefits derived by the Advisor from the management of the Fund. |
In keeping with its practice, the Board held two in-person meetings to review and discuss the information provided. The Board also had the benefit of the advice of its independent counsel throughout the period.
Factors Considered
The Directors considered all of the information provided by the Advisor, the independent data providers, and the Board’s independent counsel in connection with the review, and evaluated such information for the Fund. In connection with their review, the Directors did not identify any single factor as being all-important or controlling and each Director may have attributed different levels of importance to different factors. In deciding to renew the management agreement, the Board based its decision on a number of factors, including the following:
Nature, Extent and Quality of Services — Generally. Under the management agreement, the Advisor is responsible for providing or arranging for all services necessary for the operation of the Fund. The Board noted that under the management agreement, the Advisor provides or arranges at its own expense a wide variety of services including:
• | constructing and designing the Fund |
• | portfolio research and security selection |
• | initial capitalization/funding |
• | daily valuation of the Fund’s portfolio |
• | shareholder servicing and transfer agency, including shareholder confirmations, recordkeeping, and communications |
• | regulatory and portfolio compliance |
• | marketing and distribution |
The Board noted that many of these services have expanded over time both in terms of quantity and complexity in response to shareholder demands, competition in the industry, changing distribution channels, and the changing regulatory environment.
Investment Management Services. The nature of the investment management services provided to the Fund is quite complex and allows Fund shareholders access to professional money management, instant diversification of their investments within an asset class, the opportunity to easily diversify among asset classes by investing in or exchanging among various American Century Investments funds, and liquidity. In evaluating investment performance, the Board expects the Advisor to manage the Fund in accordance with its investment objectives and approved strategies. Further, the Directors recognize that the Advisor has an obligation to seek the best execution of fund trades. In providing these services, the Advisor utilizes teams of investment professionals (portfolio managers, analysts, research assistants, and securities traders) who require extensive information technology, research, training, compliance and other systems to conduct their business. The Board, directly and through its Portfolio Committee, regularly reviews investment performance information for the Fund, together with comparative information for appropriate benchmarks and/or peer groups of similarly-managed funds, over different time horizons. The Directors also review detailed performance information during the management agreement approval process. If performance concerns are identified, the Fund receives special reviews until performance improves, during which the Board discusses with the Advisor the reasons for such results (e.g., market conditions, security selection) and any efforts being undertaken to improve performance. The Board found the investment management services provided by the Advisor to the Fund to meet or exceed industry standards. More detailed information about the Fund’s performance can be found in the Performance and Portfolio Commentary sections of this report.
Shareholder and Other Services. Under the management agreement, the Advisor provides the Fund with a comprehensive package of transfer agency, shareholder, and other services. The Board, directly and through various committees of the Board, regularly reviews reports and evaluations of such services at its regular meetings. These reports include, but are not limited to, information regarding the operational efficiency and accuracy of the shareholder and transfer agency services provided, staffing levels, shareholder satisfaction (as measured by external as well as internal sources), technology support, new products and services offered to Fund shareholders, securities trading activities, portfolio valuation services, auditing services, and legal and operational compliance activities. Certain aspects of shareholder and transfer agency service level efficiency and the quality of securities trading activities are measured by independent third party providers and are presented in comparison to other fund groups not managed by the Advisor. The Board found the services provided by the Advisor to the Fund under the management agreement to be competitive and of high quality.
Costs of Services and Profitability. The Advisor provides detailed information concerning its cost of providing various services to the Fund, its profitability in managing the Fund, its overall profitability, and its financial condition. The Directors have reviewed with the Advisor the methodology used to prepare this financial information. The financial information regarding the Advisor is considered in evaluating the Advisor’s financial condition, its ability to continue to provide services under the management agreement, and the reasonableness of the current management fee. The Board concluded that the Advisor’s profits were reasonable in light of the services provided to the Fund.
Ethics. The Board generally considers the Advisor’s commitment to providing quality services to shareholders and to conducting its business ethically. They noted that the Advisor’s practices generally meet or exceed industry best practices.
Economies of Scale. The Board also reviewed information provided by the Advisor regarding the possible existence of economies of scale in connection with the management of the Fund. The Board concluded that economies of scale are difficult to measure and predict with precision, especially on a fund-by-fund basis. The Board concluded that the Advisor is appropriately sharing economies of scale through its competitive fee structure, offering competitive fees from fund inception, and through reinvestment in its business to provide shareholders additional content and services.
Comparison to Other Funds’ Fees. The management agreement provides that the Fund pay the Advisor a single, all-inclusive (or unified) management fee for providing all services necessary for the management and operation of the Fund, other than brokerage expenses, taxes, interest, extraordinary expenses, and the fees and expenses of the Fund’s independent directors (including their independent legal counsel) and expenses incurred in connection with the provision of shareholder services and distribution services under a plan adopted pursuant to Rule 12b-1 under the 1940 Act. Under the unified fee structure, the Advisor is responsible for providing all investment advisory, custody, audit, administrative, compliance, recordkeeping, marketing and shareholder services, or arranging and supervising third parties to provide such services. By contrast, most other funds are charged a variety of fees, including an investment advisory fee, a transfer agency fee, an administrative fee, distribution charges and other expenses. Other than their investment advisory fees and any applicable Rule 12b-1 distribution fees, all other components of the total fees charged by these other funds may be increased without shareholder approval. The Board believes the unified fee structure is a benefit to Fund shareholders because it clearly discloses to shareholders the cost of owning Fund shares, and, since the unified fee cannot be increased without a vote of Fund shareholders, it shifts to the Advisor the risk of increased costs of operating the Fund and provides a direct incentive to minimize administrative inefficiencies. Part of the Board’s analysis of fee levels involves reviewing certain evaluative data compiled by an independent provider and comparing the Fund’s unified fee to the total expense ratio of other funds in the Fund’s peer group. The Board concluded that the management fee paid by the Fund to the Advisor under the management agreement is reasonable in light of the services provided to the Fund.
Comparison to Fees and Services Provided to Other Clients of the Advisor. The Board also requested and received information from the Advisor concerning the nature of the services, fees, costs and profitability of its advisory services to advisory clients other than the Fund. They observed that these varying types of client accounts require different services and involve different regulatory and entrepreneurial risks than the management of the Fund. The Board analyzed this information and concluded that the fees charged and services provided to the Fund were reasonable by comparison.
Collateral or “Fall-Out” Benefits Derived by the Advisor. The Board considered the existence of collateral benefits the Advisor may receive as a result of its relationship with the Fund. They concluded that the Advisor’s primary business is managing mutual funds and it generally does not use fund or shareholder information to generate profits in other lines of business, and therefore does not derive any significant collateral benefits from them. The Board noted that the Advisor receives proprietary research from broker-dealers that execute fund portfolio transactions and concluded that this research is likely to benefit Fund shareholders. The Board also determined that the Advisor is able to provide investment management services to certain clients other than the Fund, at least in part, due to its existing infrastructure built to serve the fund complex. The Board concluded, however, that the assets of those other clients are not material to the analysis and, where applicable, may be included with the assets of the Fund to determine breakpoints in the management fee schedule.
Existing Relationship. The Board also considered whether there was any reason for not continuing the existing arrangement with the Advisor. In this regard, the Board was mindful of the potential disruptions of the Fund’s operations and various risks, uncertainties, and other effects that could occur as a result of a decision not to continue such relationship. In particular, the Board recognized that most shareholders have invested in the Fund on the strength of the Advisor’s industry standing and reputation and in the expectation that the Advisor will have a continuing role in providing advisory services to the Fund.
Conclusion of the Directors. As a result of this process, the Board, including all of the independent directors and assisted by the advice of independent legal counsel, taking into account all of the factors discussed above and the information provided by the Advisor and others, concluded that the management agreement between the Fund and the Advisor is fair and reasonable in light of the services provided and should be renewed.
Retirement Account Information
As required by law, distributions you receive from certain IRAs are subject to federal income tax withholding, unless you elect not to have withholding apply. Tax will be withheld on the total amount withdrawn even though you may be receiving amounts that are not subject to withholding, such as nondeductible contributions. In such case, excess amounts of withholding could occur. You may adjust your withholding election so that a greater or lesser amount will be withheld.
If you don’t want us to withhold on this amount, you must notify us to not withhold the federal income tax. You may notify us in writing or in certain situations by telephone or through other electronic means. For systematic withdrawals, your withholding election will remain in effect until revoked or changed by filing a new election. You have the right to revoke your election at any time.
Remember, even if you elect not to have income tax withheld, you are liable for paying income tax on the taxable portion of your withdrawal. If you elect not to have income tax withheld or you don’t have enough income tax withheld, you may be responsible for payment of estimated tax. You may incur penalties under the estimated tax rules if your withholding and estimated tax payments are not sufficient. You can reduce or defer the income tax on a distribution by directly or indirectly rolling such distribution over to another IRA or eligible plan. You should consult your tax advisor for additional information.
State tax will be withheld if, at the time of your distribution, your address is within one of the mandatory withholding states and you have federal income tax withheld (or as otherwise required by state law). State taxes will be withheld from your distribution in accordance with the respective state rules.
Distributions you receive from 403(b), 457 and qualified plans are subject to special tax and withholding rules. Your plan administrator or plan sponsor is required to provide you with a special tax notice explaining those rules at the time you request a distribution. If applicable, federal and/or state taxes may be withheld from your distribution amount.
Proxy Voting Guidelines
American Century Investment Management, Inc., the fund’s investment advisor, is responsible for exercising the voting rights associated with the securities purchased and/or held by the fund. A description of the policies and procedures the advisor uses in fulfilling this responsibility is available without charge, upon request, by calling 1-800-345-2021. It is also available on American Century Investments’ website at americancentury.com and on the Securities and Exchange Commission’s website at sec.gov. Information regarding how the investment advisor voted proxies relating to portfolio securities during the most recent 12-month period ended June 30 is available on the “About Us” page at americancentury.com. It is also available at sec.gov.
Quarterly Portfolio Disclosure
The fund files its complete schedule of portfolio holdings with the Securities and Exchange Commission (SEC) for the first and third quarters of each fiscal year on Form N-Q. The fund’s Forms N-Q are available on the SEC’s website at sec.gov, and may be reviewed and copied at the SEC’s Public Reference Room in Washington, DC. Information on the operation of the Public Reference Room may be obtained by calling 1-800-SEC-0330. The fund also makes its complete schedule of portfolio holdings for the most recent quarter of its fiscal year available upon request by calling 1-800-345-2021.
Other Tax Information
The following information is provided pursuant to provisions of the Internal Revenue Code.
The fund hereby designates up to the maximum amount allowable as qualified dividend income for the fiscal year ended June 30, 2013.
For corporate taxpayers, the fund hereby designates $2,238,453, or up to the maximum amount allowable, of ordinary income distributions paid during the fiscal year ended June 30, 2013 as qualified for the corporate dividends received deduction.
The fund hereby designates $9,263,359, or up to the maximum amount allowable, as long-term capital gain distributions for the fiscal year ended June 30, 2013.
Contact Us | americancentury.com |
Automated Information Line | 1-800-345-8765 |
Investor Services Representative | 1-800-345-2021
or 816-531-5575 |
Investors Using Advisors | 1-800-378-9878 |
Business, Not-For-Profit, Employer-Sponsored Retirement Plans | 1-800-345-3533 |
Banks and Trust Companies, Broker-Dealers, Financial Professionals, Insurance Companies | 1-800-345-6488 |
Telecommunications Device for the Deaf | 1-800-634-4113 |
American Century Quantitative Equity Funds, Inc.
Investment Advisor:
American Century Investment Management, Inc.
Kansas City, Missouri
This report and the statements it contains are submitted for the general information of our shareholders. The report is not authorized for distribution to prospective investors unless preceded or accompanied by an effective prospectus.
©2013 American Century Proprietary Holdings, Inc. All rights reserved.
CL-ANN-79322 1308
ANNUAL REPORT | JUNE 30, 2013 |
Small Company Fund
President’s Letter | 2 |
Market Perspective | 3 |
Performance | 4 |
Portfolio Commentary | 6 |
Fund Characteristics | 8 |
Shareholder Fee Example | 9 |
Schedule of Investments | 11 |
Statement of Assets and Liabilities | 17 |
Statement of Operations | 18 |
Statement of Changes in Net Assets | 19 |
Notes to Financial Statements | 20 |
Financial Highlights | 26 |
Report of Independent Registered Public Accounting Firm | 28 |
Management | 29 |
Approval of Management Agreement | 32 |
Additional Information | 37 |
Any opinions expressed in this report reflect those of the author as of the date of the report, and do not necessarily represent the opinions of American Century Investments® or any other person in the American Century Investments organization. Any such opinions are subject to change at any time based upon market or other conditions and American Century Investments disclaims any responsibility to update such opinions. These opinions may not be relied upon as investment advice and, because investment decisions made by American Century Investments funds are based on numerous factors, may not be relied upon as an indication of trading intent on behalf of any American Century Investments fund. Security examples are used for representational purposes only and are not intended as recommendations to purchase or sell securities. Performance information for comparative indices and securities is provided to American Century Investments by third party vendors. To the best of American Century Investments’ knowledge, such information is accurate at the time of printing.
Jonathan Thomas
Dear Investor:
Thank you for reviewing this annual report for the 12 months ended June 30, 2013. It provides investment performance, market analysis, and portfolio information, presented with the expert perspective of our portfolio management team.
Annual reports remain important vehicles for conveying information about fund returns, including key factors that affected fund performance. For additional, updated investment and market insights, we encourage you to visit our website, americancentury.com.
Generally Favorable Fiscal-Year Returns for U.S. Stocks and High-Yield Bonds
The 12-month reporting period began in the summer of 2012 with uncertainties caused by slowing economies, as well as the upcoming November elections and year-end fiscal deadlines in the U.S. It ended with more uncertainty about the future of U.S. monetary stimulus. In between, aggressive monetary intervention by central banks encouraged investors to take more risk, generally boosting stocks at the expense of government bonds.
U.S. mid-cap, small-cap, and value stock indices achieved performance leadership during the period, outpacing the S&P 500 Index’s 20.60% return. U.S. stocks generally outperformed non-U.S. equities—the MSCI EAFE Index returned 18.62% and the MSCI Emerging Markets Index advanced 2.87%, affected by slowing growth in emerging market economies.
Slower emerging market growth also hindered commodity price gains and helped keep inflation under control. As a result, assets used as inflation hedges, including inflation-indexed securities and precious metals, lagged other assets. Gold, in particular, plunged, starting last October. And Treasury inflation-protected securities (TIPS) were among the lowest performers in the U.S. bond market. Bond index returns generally ranged from approximately 10% gains for U.S. corporate high-yield indices all the way down to negative returns for longer-maturity global Treasury benchmarks.
Despite signs of improvement in 2013, U.S. economic growth is subpar compared with past recession recoveries, and remains vulnerable to threats that could trigger another slowdown and market volatility. Therefore, we continue to believe in a disciplined, diversified, long-term investment approach, using professionally managed stock and bond portfolios—as appropriate—for meeting financial goals. We appreciate your continued trust in us in this volatile environment.
Sincerely,
Jonathan Thomas
President and Chief Executive Officer
American Century Investments
By Scott Wittman, Chief Investment Officer, Asset Allocation and Quantitative Equity
Central Bank Actions, Relative U.S. Economic Gains Drove Stocks Higher
Stock market performance remained robust during the 12-month period ended June 30, 2013. Despite persistent concerns about weak global growth and Europe’s ongoing financial crisis, investors largely focused on central bank stimulus measures and marginally-improving U.S. economic data, which fueled market optimism.
Early in the period, in response to disappointing U.S. economic data, the U.S. Federal Reserve (the Fed) launched its third—and most aggressive—quantitative easing (QE) program, or monthly purchases of $40 billion in government agency mortgage-backed securities. Later in 2012, the Fed expanded the program to include $45 billion in Treasury purchases, bringing its total bond buying to $85 billion per month. This unprecedented program, combined with relatively healthy corporate earnings, significant housing market gains and modest improvements in the labor market, helped keep stocks and other riskier assets in favor.
The Fed rattled the financial markets late in the reporting period, with comments about “tapering” its quantitative easing program. Fed Chairman Ben Bernanke said the central bank could begin scaling back its bond buying later in 2013 if the economy continues to improve. After reaching record highs in May, stocks stumbled in June, following Bernanke’s comments. Late in the month, the Fed toned down its tapering talk, and stocks recovered some of their June losses. Overall, most U.S. stock benchmarks generated stellar 12-month returns, largely aided by strong double-digit gains posted during the first calendar quarter of 2013.
Value Stocks Outpaced Growth Stocks
Across the capitalization spectrum, value stocks were the performance leaders for the 12-month period. Much of this was due to strong one-year returns from the financials and health care sectors, where many value-oriented stocks reside. In particular, expectations for rising interest rates—and the late-quarter rate increase triggered by Fed tapering talk—helped boost returns within the financial sector’s banking industry. At the opposite end, the rate-sensitive utilities sector was the weakest relative performer, held back by the prospect of rising interest rates.
U.S. Stock Index Returns |
For the 12 months ended June 30, 2013 |
Russell 1000 Index (Large-Cap) | 21.24% | | Russell 2000 Index (Small-Cap) | 24.21% |
Russell 1000 Growth Index | 17.07% | | Russell 2000 Growth Index | 23.67% |
Russell 1000 Value Index | 25.32% | | Russell 2000 Value Index | 24.77% |
Russell Midcap Index | 25.41% | | |
Russell Midcap Growth Index | 22.88% | | |
Russell Midcap Value Index | 27.65% | | | |
Total Returns as of June 30, 2013 |
| | | | Average Annual Returns | |
| | Ticker Symbol | 1 year | 5 years | 10 years | Since Inception | Inception Date |
Investor Class | ASQIX | 26.92% | 6.32% | 8.58% | 8.14% | 7/31/98 |
Russell 2000 Index | — | 24.21% | 8.76% | 9.52% | 7.07% | — |
Institutional Class | ASCQX | 27.27% | 6.55% | 8.80% | 9.42% | 10/1/99 |
A Class(1) No sales charge* With sales charge* | ASQAX | 26.58% 19.34% | 6.02% 4.76% | 8.31% 7.68% | 7.25% 6.75% | 9/7/00 |
C Class | ASQCX | 25.68% | — | — | 14.85% | 3/1/10 |
R Class | ASCRX | 26.33% | 5.78% | — | 7.17% | 8/29/03 |
* | Sales charges include initial sales charges and contingent deferred sales charges (CDSCs), as applicable. A Class shares have a 5.75% maximum initial sales charge and may be subject to a maximum CDSC of 1.00%. C Class shares redeemed within 12 months of purchase are subject to a maximum CDSC of 1.00%. The SEC requires that mutual funds provide performance information net of maximum sales charges in all cases where charges could be applied. |
(1) | Prior to March 1, 2010, the A Class was referred to as the Advisor Class and did not have a front-end sales charge. Performance prior to that date has been adjusted to reflect this charge. |
Data presented reflect past performance. Past performance is no guarantee of future results. Current performance may be higher or lower than the performance shown. Investment return and principal value will fluctuate, and redemption value may be more or less than original cost. To obtain performance data current to the most recent month end, please call 1-800-345-2021 or visit americancentury.com. Historically, small company stocks have been more volatile than the stocks of larger, more established companies.
Unless otherwise indicated, performance reflects Investor Class shares; performance for other share classes will vary due to differences in fee structure. For information about other share classes available, please consult the prospectus. Data assumes reinvestment of dividends and capital gains, and none of the charts reflect the deduction of taxes that a shareholder would pay on fund distributions or the redemption of fund shares. Returns for the index are provided for comparison. The fund’s total returns include operating expenses (such as transaction costs and management fees) that reduce returns, while the total returns of the index do not.
Growth of $10,000 Over 10 Years |
$10,000 investment made June 30, 2003 |

Total Annual Fund Operating Expenses |
Investor Class | Institutional Class | A Class | C Class | R Class |
0.89% | 0.69% | 1.14% | 1.89% | 1.39% |
The total annual fund operating expenses shown is as stated in the fund’s prospectus current as of the date of this report. The prospectus may vary from the expense ratio shown elsewhere in this report because it is based on a different time period, includes acquired fund fees and expenses, and, if applicable, does not include fee waivers or expense reimbursements.
Data presented reflect past performance. Past performance is no guarantee of future results. Current performance may be higher or lower than the performance shown. Investment return and principal value will fluctuate, and redemption value may be more or less than original cost. To obtain performance data current to the most recent month end, please call 1-800-345-2021 or visit americancentury.com. Historically, small company stocks have been more volatile than the stocks of larger, more established companies.
Unless otherwise indicated, performance reflects Investor Class shares; performance for other share classes will vary due to differences in fee structure. For information about other share classes available, please consult the prospectus. Data assumes reinvestment of dividends and capital gains, and none of the charts reflect the deduction of taxes that a shareholder would pay on fund distributions or the redemption of fund shares. Returns for the index are provided for comparison. The fund’s total returns include operating expenses (such as transaction costs and management fees) that reduce returns, while the total returns of the index do not.
Portfolio Managers: Brian Garbe and Tal Sansani
Performance Summary
Small Company returned 26.92%* for the fiscal year ended June 30, 2013, compared with the 24.21% return of its benchmark, the Russell 2000 Index.
In a year of strength for U.S. equity markets (see page 3 for details), Small Company posted a solid gain, outperforming the Russell 2000 Index. Small Company’s stock selection process incorporates factors of growth, value, quality, and momentum, and is designed to minimize unintended risks along industries and other risk characteristics. Most fundamental drivers of stock returns contributed to the success of the fund, led by growth and quality indicators.
Absolute Performance Driven by Consumer Discretionary and Industrials
Small-cap equities saw healthy advances over the past year, with every sector of the market contributing positively to the fund’s total returns. The consumer discretionary and industrials sectors posted the highest absolute returns in the fund. In the consumer discretionary sector, leading contributors came from the hotel, restaurant, and leisure as well as media industries. Gaming and lottery machine maker Multimedia Games led results among leisure holdings after its 85% appreciation, mostly during the second half of the fiscal year. TV broadcasting companies Belo Corp. and Nexstar Broadcasting Group drove media returns. In industrials, airlines Alaska Air Group and Republic Airways returned 44% and 108% respectively.
Industrials and Energy Led Outperformance
Nine out of 10 economic sectors finished the period with positive results compared to the index, with the industrials sector adding the most relative value. Here, the fund’s holdings in a number of industries including airlines, airfreight, machinery, and electrical equipment were advantageous. Republic Airways, one of the fund’s best absolute performers, was also among the strongest relative performers in this sector. The company’s stock soared more than 150% during the year, and the portfolio’s overweight position in the holding was especially helpful. Other individual decisions that worked well in the sector included higher-than-index weightings in printing company Quad/Graphics, which surged on above-estimate earnings, and mobile hydraulic manufacturer Sauer-Danfoss, which benefited from news of an acquisition at the end of 2012.
The energy sector was also a top contributor, with performance driven by the oil, gas, and consumable fuels industry. Greater-than-index exposure to several oil refineries, which benefited from the widening spread of input costs to output prices for much of the reporting period, was key to producing positive results. The top industry performers included Tesoro, Delek US, Western Refining, all of which produced substantial gains during the fiscal year. Tesoro gains were also driven by announced plans to buy a California refinery.
*All fund returns referenced in this commentary are for Investor Class shares.
Elsewhere in the portfolio, several significant relative contributors were also top absolute performers including Axiall (formerly Georgia Gulf) and Santarus. Integrated chemicals and building products company Axiall rose nearly 70% thanks to strong demand from the housing sector. Biopharmaceutical holding Santarus appreciated after handily beating analyst earnings expectations for the first quarter of 2013.
Technology Detracted
Information technology was the only sector to detract from the fund’s return relative to the index. Weak results were most pronounced in the internet software and services industry. An overweight to internet media and domain services company Demand Media was particularly harmful after the company’s stock price declined during the second quarter of 2013 after an announced acquisition bid for online marketplace Society6. Internet real estate site Zillow also saw significant price declines after analysts questioned its business model.
While no other sector detracted from relative performance, several individual positions proved difficult during the year. Health care sector stocks Spectrum Pharmaceutical, Auxilium Pharmaceuticals, and Orthofix International negatively impacted the fund after suffering substantial losses. Biotechnology company Spectrum Pharmaceuticals was the largest individual portfolio detractor, falling over 50% in light of drastically lower-than-expected revenue guidance.
Noteworthy individual positions that hurt results included overweights in silver and gold miner Coeur Mining and video rental and coin-counting kiosks operator Coinstar (now called Outerwall Inc.). Coeur Mining declined on softening precious metals prices in early 2013. Coinstar’s stock declined during the early part of the period on a weaker-than-expected outlook for the coming year.
A Look Ahead
As we move into the second half of 2013, the U.S. economic recovery seems to be progressing, albeit with headwinds. Improvements in housing, employment, and economic indicators have been consistent and point to slow but positive growth. Volatility is likely to remain elevated as ongoing concerns over interest rates, Federal Reserve action, and a potential slowdown in China dominate headlines. Heightened levels of volatility often provide investment opportunities, and our disciplined, objective, and systematic investment strategy is designed to take advantage of these opportunities at the individual company level. We believe this approach is the most powerful way to capitalize on market inefficiencies that lead to the mispricing of individual stocks.
JUNE 30, 2013 | |
Top Ten Holdings | % of net assets |
PAREXEL International Corp. | 0.7% |
Sanmina Corp. | 0.7% |
Hancock Holding Co. | 0.7% |
CommVault Systems, Inc. | 0.7% |
Iconix Brand Group, Inc. | 0.7% |
Pilgrim’s Pride Corp. | 0.7% |
Sanderson Farms, Inc. | 0.7% |
Microsemi Corp. | 0.7% |
Coinstar, Inc. | 0.7% |
Questcor Pharmaceuticals, Inc. | 0.7% |
| | |
Top Five Industries | % of net assets |
Real Estate Investment Trusts (REITs) | 5.8% |
Insurance | 4.4% |
Commercial Banks | 4.2% |
Software | 4.1% |
Commercial Services and Supplies | 3.9% |
| | |
Types of Investments in Portfolio | % of net assets |
Common Stocks | 98.5% |
Temporary Cash Investments | 1.5% |
Other Assets and Liabilities | —* |
*Category is less than 0.05% of total net assets. | |
Fund shareholders may incur two types of costs: (1) transaction costs, including sales charges (loads) on purchase payments and redemption/exchange fees; and (2) ongoing costs, including management fees; distribution and service (12b-1) fees; and other fund expenses. This example is intended to help you understand your ongoing costs (in dollars) of investing in your fund and to compare these costs with the ongoing cost of investing in other mutual funds.
The example is based on an investment of $1,000 made at the beginning of the period and held for the entire period from January 1, 2013 to June 30, 2013.
Actual Expenses
The table provides information about actual account values and actual expenses for each class. You may use the information, together with the amount you invested, to estimate the expenses that you paid over the period. First, identify the share class you own. Then simply divide your account value by $1,000 (for example, an $8,600 account value divided by $1,000 = 8.6), then multiply the result by the number under the heading “Expenses Paid During Period” to estimate the expenses you paid on your account during this period.
If you hold Investor Class shares of any American Century Investments fund, or Institutional Class shares of the American Century Diversified Bond Fund, in an American Century Investments account (i.e., not a financial intermediary or retirement plan account), American Century Investments may charge you a $12.50 semiannual account maintenance fee if the value of those shares is less than $10,000. We will redeem shares automatically in one of your accounts to pay the $12.50 fee. In determining your total eligible investment amount, we will include your investments in all personal accounts (including American Century Investments Brokerage accounts) registered under your Social Security number. Personal accounts include individual accounts, joint accounts, UGMA/UTMA accounts, personal trusts, Coverdell Education Savings Accounts and IRAs (including traditional, Roth, Rollover, SEP-, SARSEP- and SIMPLE-IRAs), and certain other retirement accounts. If you have only business, business retirement, employer-sponsored or American Century Investments Brokerage accounts, you are currently not subject to this fee. If you are subject to the Account Maintenance Fee, your account value could be reduced by the fee amount.
Hypothetical Example for Comparison Purposes
The table also provides information about hypothetical account values and hypothetical expenses based on the actual expense ratio of each class of your fund and an assumed rate of return of 5% per year before expenses, which is not the actual return of a fund’s share class. The hypothetical account values and expenses may not be used to estimate the actual ending account balance or expenses you paid for the period. You may use this information to compare the ongoing costs of investing in your fund and other funds. To do so, compare this 5% hypothetical example with the 5% hypothetical examples that appear in the shareholder reports of the other funds.
Please note that the expenses shown in the table are meant to highlight your ongoing costs only and do not reflect any transactional costs, such as sales charges (loads) or redemption/exchange fees. Therefore, the table is useful in comparing ongoing costs only, and will not help you determine the relative total costs of owning different funds. In addition, if these transactional costs were included, your costs would have been higher.
| | | | | |
| | Beginning
Account Value 1/1/13 | Ending
Account Value 6/30/13 | Expenses Paid During Period(1) 1/1/13 – 6/30/13 | Annualized
Expense Ratio(1) |
Actual | | | | |
Investor Class | $1,000 | $1,186.70 | $4.72 | 0.87% |
Institutional Class | $1,000 | $1,188.40 | $3.64 | 0.67% |
A Class | $1,000 | $1,184.40 | $6.07 | 1.12% |
C Class | $1,000 | $1,180.90 | $10.11 | 1.87% |
R Class | $1,000 | $1,183.70 | $7.42 | 1.37% |
Hypothetical | | | | |
Investor Class | $1,000 | $1,020.48 | $4.36 | 0.87% |
Institutional Class | $1,000 | $1,021.47 | $3.36 | 0.67% |
A Class | $1,000 | $1,019.24 | $5.61 | 1.12% |
C Class | $1,000 | $1,015.52 | $9.35 | 1.87% |
R Class | $1,000 | $1,018.00 | $6.85 | 1.37% |
(1) | Expenses are equal to the class’s annualized expense ratio listed in the table above, multiplied by the average account value over the period, multiplied by 181, the number of days in the most recent fiscal half-year, divided by 365, to reflect the one-half year period. |
JUNE 30, 2013
| | | | | | | |
| | | Shares | | | Value | |
Common Stocks — 98.5% | |
AEROSPACE AND DEFENSE — 1.4% | |
AAR Corp. | | 52,691 | | | $ 1,158,148 | |
Alliant Techsystems, Inc. | | 5,175 | | | 426,058 | |
Esterline Technologies Corp.(1) | | 27,437 | | | 1,983,421 | |
National Presto Industries, Inc. | | 2,033 | | | 146,437 | |
Taser International, Inc.(1) | | 71,168 | | | 606,351 | |
| | | | | | 4,320,415 | |
AIR FREIGHT AND LOGISTICS — 0.1% | |
Park-Ohio Holdings Corp.(1) | | 11,418 | | | 376,566 | |
AIRLINES — 2.2% | | | | | | |
Alaska Air Group, Inc.(1) | | 31,298 | | | 1,627,496 | |
Allegiant Travel Co. | | 15,417 | | | 1,634,048 | |
Republic Airways Holdings, Inc.(1) | | 154,424 | | | 1,749,624 | |
Skywest, Inc. | | 116,759 | | | 1,580,917 | |
| | | | | | 6,592,085 | |
AUTO COMPONENTS — 0.5% | |
Gentherm, Inc.(1) | | 56,055 | | | 1,040,941 | |
Stoneridge, Inc.(1) | | 36,845 | | | 428,876 | |
| | | | | | 1,469,817 | |
BEVERAGES† | | | | | | |
Coca-Cola Bottling Co. Consolidated | | 2,022 | | | 123,645 | |
BIOTECHNOLOGY — 2.2% | | | | | | |
Alkermes plc(1) | | 60,420 | | | 1,732,846 | |
Cubist Pharmaceuticals, Inc.(1) | | 35,171 | | | 1,698,759 | |
Isis Pharmaceuticals, Inc.(1) | | 10,220 | | | 274,611 | |
MannKind Corp.(1) | | 53,705 | | | 349,083 | |
PDL BioPharma, Inc. | | 129,127 | | | 996,860 | |
United Therapeutics Corp.(1) | | 23,096 | | | 1,520,179 | |
| | | | | | 6,572,338 | |
BUILDING PRODUCTS — 0.5% | |
Gibraltar Industries, Inc.(1) | | 12,922 | | | 188,145 | |
Patrick Industries, Inc.(1) | | 39,028 | | | 811,392 | |
PGT, Inc.(1) | | 69,548 | | | 602,981 | |
| | | | | | 1,602,518 | |
CAPITAL MARKETS — 2.7% | |
Calamos Asset Management, Inc., Class A | | 90,521 | | | 950,470 | |
Diamond Hill Investment Group, Inc. | | 6,445 | | | 548,147 | |
Evercore Partners, Inc., Class A | | 45,903 | | | 1,803,070 | |
Investment Technology Group, Inc.(1) | | 127,464 | | | 1,781,947 | |
Manning & Napier, Inc. | | 78,916 | | | 1,401,548 | |
Pzena Investment Management, Inc., Class A | | 40,057 | | | 261,172 | |
WisdomTree Investments, Inc.(1) | | 122,708 | | | 1,419,732 | |
| | | | | | 8,166,086 | |
CHEMICALS — 0.6% | | | | | | |
Flotek Industries, Inc.(1) | | 101,441 | | | 1,819,852 | |
COMMERCIAL BANKS — 4.2% | |
Bancorp, Inc.(1) | | 2,468 | | | 36,995 | |
Columbia Banking System, Inc. | | 49,436 | | | 1,177,071 | |
CVB Financial Corp. | | 147,745 | | | 1,737,481 | |
First Interstate Bancsystem, Inc. | | 30,492 | | | 632,099 | |
Hancock Holding Co. | | 69,363 | | | 2,085,746 | |
Home Bancshares, Inc. | | 56,678 | | | 1,471,928 | |
MB Financial, Inc. | | 25 | | | 670 | |
OFG Bancorp | | 73,103 | | | 1,323,895 | |
PacWest Bancorp. | | 55,954 | | | 1,714,990 | |
PrivateBancorp, Inc. | | 86,842 | | | 1,841,919 | |
Renasant Corp. | | 26,301 | | | 640,166 | |
Washington Banking Co. | | 1,997 | | | 28,358 | |
| | | | | | 12,691,318 | |
COMMERCIAL SERVICES AND SUPPLIES — 3.9% | |
Cenveo, Inc.(1) | | 111,452 | | | 237,393 | |
Consolidated Graphics, Inc.(1) | | 31,986 | | | 1,503,662 | |
Deluxe Corp. | | 53,583 | | | 1,856,651 | |
Ennis, Inc. | | 14,116 | | | 244,065 | |
Intersections, Inc. | | 51,156 | | | 448,638 | |
Kimball International, Inc. Class B | | 66,660 | | | 647,268 | |
Mine Safety Appliances Co. | | 17,076 | | | 794,888 | |
Quad/Graphics, Inc. | | 70,321 | | | 1,694,736 | |
Steelcase, Inc., Class A | | 114,148 | | | 1,664,278 | |
Tetra Tech, Inc.(1) | | 11,321 | | | 266,157 | |
United Stationers, Inc. | | 47,895 | | | 1,606,877 | |
US Ecology, Inc. | | 1,481 | | | 40,639 | |
Viad Corp. | | 34,338 | | | 841,968 | |
| | | | | | 11,847,220 | |
COMMUNICATIONS EQUIPMENT — 2.6% | |
ARRIS Group, Inc.(1) | | 127,821 | | | 1,834,231 | |
Brocade Communications Systems, Inc.(1) | | 108,382 | | | 624,280 | |
CalAmp Corp.(1) | | 2,750 | | | 40,150 | |
Ciena Corp.(1) | | 95,092 | | | $ 1,846,687 | |
Globecomm Systems, Inc.(1) | | 21,247 | | | 268,562 | |
Harmonic, Inc.(1) | | 38,420 | | | 243,967 | |
InterDigital, Inc. | | 39,626 | | | 1,769,301 | |
Ixia(1) | | 72,009 | | | 1,324,966 | |
| | | | | | 7,952,144 | |
COMPUTERS AND PERIPHERALS — 1.3% | |
Electronics for Imaging, Inc.(1) | | 46,741 | | | 1,322,303 | |
Silicon Graphics International Corp.(1) | | 80,621 | | | 1,078,709 | |
Synaptics, Inc.(1) | | 41,922 | | | 1,616,512 | |
| | | | | | 4,017,524 | |
CONSTRUCTION AND ENGINEERING — 0.3% | |
Argan, Inc. | | 63,265 | | | 986,934 | |
CONSTRUCTION MATERIALS — 0.5% | |
Headwaters, Inc.(1) | | 165,499 | | | 1,463,011 | |
United States Lime & Minerals, Inc.(1) | | 1,357 | | | 70,903 | |
| | | | | | 1,533,914 | |
CONSUMER FINANCE — 1.6% | |
Cash America International, Inc. | | 37,541 | | | 1,706,614 | |
Credit Acceptance Corp.(1) | | 2,035 | | | 213,777 | |
DFC Global Corp.(1) | | 82,753 | | | 1,142,819 | |
Portfolio Recovery Associates, Inc.(1) | | 734 | | | 112,764 | |
World Acceptance Corp.(1) | | 20,090 | | | 1,746,625 | |
| | | | | | 4,922,599 | |
CONTAINERS AND PACKAGING — 1.4% | |
AEP Industries, Inc.(1) | | 12,241 | | | 910,608 | |
Berry Plastics Group, Inc.(1) | | 71,482 | | | 1,577,608 | |
Graphic Packaging Holding Co.(1) | | 213,495 | | | 1,652,451 | |
| | | | | | 4,140,667 | |
DIVERSIFIED CONSUMER SERVICES — 0.7% | |
Ascent Capital Group, Inc. Class A(1) | | 2,572 | | | 200,796 | |
Coinstar, Inc.(1) | | 34,669 | | | 2,034,030 | |
| | | | | | 2,234,826 | |
DIVERSIFIED FINANCIAL SERVICES — 0.8% | |
Interactive Brokers Group, Inc., Class A | | 49,534 | | | 791,058 | |
PHH Corp.(1) | | 82,901 | | | 1,689,522 | |
| | | | | | 2,480,580 | |
DIVERSIFIED TELECOMMUNICATION SERVICES — 1.7% | |
Atlantic Tele-Network, Inc. | | 21,879 | | | 1,086,511 | |
Cbeyond, Inc.(1) | | 3,415 | | | 26,774 | |
IDT Corp., Class B | | 42,949 | | | 802,717 | |
magicJack VocalTec Ltd.(1) | | 3,248 | | | 46,089 | |
Neutral Tandem, Inc. | | 107,649 | | | 618,982 | |
Premiere Global Services, Inc.(1) | | 134,850 | | | 1,627,639 | |
Vonage Holdings Corp.(1) | | 285,251 | | | 807,260 | |
| | | | | | 5,015,972 | |
ELECTRIC UTILITIES — 0.7% | |
Portland General Electric Co. | | 65,800 | | | 2,012,822 | |
ELECTRICAL EQUIPMENT — 0.7% | |
EnerSys | | 40,727 | | | 1,997,252 | |
ELECTRONIC EQUIPMENT, INSTRUMENTS AND COMPONENTS — 3.2% | |
Agilysys, Inc.(1) | | 13,568 | | | 153,183 | |
Audience, Inc.(1) | | 39,805 | | | 525,824 | |
Benchmark Electronics, Inc.(1) | | 32,601 | | | 655,280 | |
Checkpoint Systems, Inc.(1) | | 68,323 | | | 969,503 | |
GSI Group, Inc.(1) | | 50,192 | | | 403,544 | |
InvenSense, Inc.(1) | | 44,883 | | | 690,301 | |
Itron, Inc.(1) | | 16,480 | | | 699,246 | |
Littelfuse, Inc. | | 7,907 | | | 589,941 | |
MTS Systems Corp. | | 3,538 | | | 200,251 | |
PC Connection, Inc. | | 5,241 | | | 80,973 | |
Plexus Corp.(1) | | 20,021 | | | 598,428 | |
Sanmina Corp.(1) | | 145,616 | | | 2,089,590 | |
SYNNEX Corp.(1) | | 32,419 | | | 1,370,675 | |
Tech Data Corp.(1) | | 12,695 | | | 597,808 | |
| | | | | | 9,624,547 | |
ENERGY EQUIPMENT AND SERVICES — 0.8% | |
Dawson Geophysical Co.(1) | | 15,903 | | | 586,185 | |
Natural Gas Services Group, Inc.(1) | | 9,374 | | | 220,195 | |
Parker Drilling Co.(1) | | 263,334 | | | 1,311,403 | |
TGC Industries, Inc. | | 23,884 | | | 196,327 | |
| | | | | | 2,314,110 | |
FOOD AND STAPLES RETAILING — 1.0% | |
Pantry, Inc. (The)(1) | | 75,389 | | | 918,238 | |
Rite Aid Corp.(1) | | 132,889 | | | 380,062 | |
Roundy’s, Inc. | | 203,281 | | | 1,693,331 | |
| | | | | | 2,991,631 | |
FOOD PRODUCTS — 1.7% | | | | | | |
Darling International, Inc.(1) | | 60,280 | | | 1,124,825 | |
Pilgrim’s Pride Corp.(1) | | 136,932 | | | 2,045,764 | |
Sanderson Farms, Inc. | | 30,634 | | | 2,034,710 | |
| | | | | | 5,205,299 | |
HEALTH CARE EQUIPMENT AND SUPPLIES — 2.5% | |
Anika Therapeutics, Inc.(1) | | 27,213 | | | 462,621 | |
CONMED Corp. | | 50,664 | | | 1,582,743 | |
Cyberonics, Inc.(1) | | 38,620 | | | 2,006,695 | |
Hill-Rom Holdings, Inc. | | 46,506 | | | 1,566,322 | |
NuVasive, Inc.(1) | | 26,752 | | | $ 663,182 | |
PhotoMedex, Inc.(1) | | 16,259 | | | 259,169 | |
Quidel Corp.(1) | | 29,773 | | | 760,105 | |
Rochester Medical Corp.(1) | | 9,823 | | | 144,693 | |
| | | | | | 7,445,530 | |
HEALTH CARE PROVIDERS AND SERVICES — 3.7% | |
Amsurg Corp.(1) | | 40,918 | | | 1,436,222 | |
Bio-Reference Labs, Inc.(1) | | 52,384 | | | 1,506,040 | |
Chemed Corp. | | 25,534 | | | 1,849,428 | |
LHC Group, Inc.(1) | | 12,123 | | | 237,368 | |
Molina Healthcare, Inc.(1) | | 52,049 | | | 1,935,182 | |
PharMerica Corp.(1) | | 65,839 | | | 912,528 | |
Providence Service Corp. (The)(1) | | 31,419 | | | 913,979 | |
Select Medical Holdings Corp. | | 144,806 | | | 1,187,409 | |
Skilled Healthcare Group, Inc. Class A(1) | | 37,772 | | | 252,317 | |
Triple-S Management Corp. Class B(1) | | 35,588 | | | 764,074 | |
| | | | | | 10,994,547 | |
HEALTH CARE TECHNOLOGY — 0.6% | |
MedAssets, Inc.(1) | | 98,368 | | | 1,745,048 | |
Omnicell, Inc.(1) | | 8,919 | | | 183,286 | |
| | | | | | 1,928,334 | |
HOTELS, RESTAURANTS AND LEISURE — 3.9% | |
Churchill Downs, Inc. | | 10,682 | | | 842,276 | |
Cracker Barrel Old Country Store, Inc. | | 21,366 | | | 2,022,506 | |
Interval Leisure Group, Inc. | | 42,258 | | | 841,779 | |
Isle of Capri Casinos, Inc.(1) | | 21,535 | | | 161,513 | |
Jack in the Box, Inc.(1) | | 48,804 | | | 1,917,509 | |
Jamba, Inc.(1) | | 35,717 | | | 533,255 | |
Marriott Vacations Worldwide Corp.(1) | | 30,551 | | | 1,321,025 | |
Multimedia Games Holding Co., Inc.(1) | | 36,812 | | | 959,689 | |
Red Robin Gourmet Burgers, Inc.(1) | | 18,289 | | | 1,009,187 | |
Sonic Corp.(1) | | 111,170 | | | 1,618,635 | |
Town Sports International Holdings, Inc. | | 38,155 | | | 410,929 | |
| | | | | | 11,638,303 | |
HOUSEHOLD DURABLES — 0.1% | |
CSS Industries, Inc. | | 16,490 | | | 411,096 | |
HOUSEHOLD PRODUCTS — 0.1% | |
Orchids Paper Products Co. | | 14,053 | | | 368,891 | |
INSURANCE — 4.4% | | | | | | |
American Equity Investment Life Holding Co. | | 106,124 | | | 1,666,147 | |
American Safety Insurance Holdings Ltd.(1) | | 43,251 | | | 1,252,117 | |
AMERISAFE, Inc. | | 32,260 | | | 1,044,901 | |
Amtrust Financial Services, Inc. | | 49,977 | | | 1,784,179 | |
FBL Financial Group, Inc., Class A | | 15,179 | | | 660,438 | |
First American Financial Corp. | | 66,504 | | | 1,465,748 | |
HCI Group, Inc. | | 20,254 | | | 622,203 | |
Maiden Holdings Ltd. | | 139,811 | | | 1,568,679 | |
OneBeacon Insurance Group Ltd. Class A | | 12,319 | | | 178,379 | |
Stewart Information Services Corp. | | 59,849 | | | 1,567,445 | |
United Fire Group, Inc. | | 28,055 | | | 696,606 | |
Universal Insurance Holdings, Inc. | | 123,418 | | | 873,800 | |
| | | | | | 13,380,642 | |
INTERNET AND CATALOG RETAIL — 1.6% | |
Nutrisystem, Inc. | | 33,036 | | | 389,164 | |
Orbitz Worldwide, Inc.(1) | | 199,825 | | | 1,604,595 | |
Overstock.com, Inc.(1) | | 47,818 | | | 1,348,467 | |
PetMed Express, Inc. | | 111,598 | | | 1,406,135 | |
| | | | | | 4,748,361 | |
INTERNET SOFTWARE AND SERVICES — 1.8% | |
Demand Media, Inc.(1) | | 190,163 | | | 1,140,978 | |
IAC/InterActiveCorp | | 15,928 | | | 757,535 | |
United Online, Inc. | | 123,035 | | | 932,605 | |
ValueClick, Inc.(1) | | 76,579 | | | 1,889,970 | |
XO Group, Inc.(1) | | 71,709 | | | 803,141 | |
| | | | | | 5,524,229 | |
IT SERVICES — 2.9% | | | | | | |
CACI International, Inc., Class A(1) | | 25,535 | | | 1,621,217 | |
CSG Systems International, Inc.(1) | | 33,454 | | | 725,952 | |
Euronet Worldwide, Inc.(1) | | 47,611 | | | 1,516,886 | |
Global Cash Access Holdings, Inc.(1) | | 198,013 | | | 1,239,561 | |
Heartland Payment Systems, Inc. | | 49,463 | | | 1,842,497 | |
PRGX Global, Inc.(1) | | 23,047 | | | 126,528 | |
Unisys Corp.(1) | | 70,170 | | | 1,548,652 | |
| | | | | | 8,621,293 | |
LEISURE EQUIPMENT AND PRODUCTS — 2.1% | |
Arctic Cat, Inc. | | 12,169 | | | $ 547,362 | |
LeapFrog Enterprises, Inc.(1) | | 164,213 | | | 1,615,856 | |
Polaris Industries, Inc. | | 7,982 | | | 758,290 | |
Smith & Wesson Holding Corp.(1) | | 176,238 | | | 1,758,855 | |
Sturm Ruger & Co., Inc. | | 36,640 | | | 1,760,185 | |
| | | | | | 6,440,548 | |
LIFE SCIENCES TOOLS AND SERVICES — 1.5% | |
Cambrex Corp.(1) | | 127,986 | | | 1,787,964 | |
Charles River Laboratories International, Inc.(1) | | 9,148 | | | 375,343 | |
PAREXEL International Corp.(1) | | 48,797 | | | 2,241,734 | |
| | | | | | 4,405,041 | |
MACHINERY — 3.3% | | | | | | |
Actuant Corp., Class A | | 48,878 | | | 1,611,508 | |
Columbus McKinnon Corp.(1) | | 17,481 | | | 372,695 | |
FreightCar America, Inc. | | 19,127 | | | 324,968 | |
Hyster-Yale Materials Handling, Inc. | | 24,696 | | | 1,550,662 | |
Kadant, Inc. | | 22,224 | | | 670,498 | |
L.B. Foster Co., Class A | | 4,012 | | | 173,198 | |
Lindsay Corp. | | 21,170 | | | 1,587,326 | |
Lydall, Inc.(1) | | 46,592 | | | 680,243 | |
Mueller Water Products, Inc. Class A | | 252,436 | | | 1,744,333 | |
Standex International Corp. | | 6,206 | | | 327,366 | |
WABCO Holdings, Inc.(1) | | 13,139 | | | 981,352 | |
| | | | | | 10,024,149 | |
MEDIA — 1.7% | | | | | | |
Carmike Cinemas, Inc.(1) | | 33,637 | | | 651,212 | |
E.W. Scripps Co. (The), Class A(1) | | 125,173 | | | 1,950,196 | |
Harte-Hanks, Inc. | | 82,360 | | | 708,296 | |
Journal Communications, Inc., Class A(1) | | 57,166 | | | 428,173 | |
Saga Communications, Inc. Class A | | 3,466 | | | 159,124 | |
Scholastic Corp. | | 39,359 | | | 1,152,825 | |
| | | | | | 5,049,826 | |
METALS AND MINING — 1.8% | |
Coeur Mining, Inc.(1) | | 133,527 | | | 1,775,909 | |
Handy & Harman Ltd.(1) | | 4,306 | | | 76,991 | |
Kaiser Aluminum Corp. | | 25,067 | | | 1,552,650 | |
Nevsun Resources Ltd. | | 99,799 | | | 294,407 | |
Worthington Industries, Inc. | | 53,964 | | | 1,711,199 | |
| | | | | | 5,411,156 | |
MULTILINE RETAIL — 0.3% | |
Dillard’s, Inc., Class A | | 10,768 | | | 882,653 | |
OIL, GAS AND CONSUMABLE FUELS — 2.5% | |
Alon USA Energy, Inc. | | 93,141 | | | 1,346,819 | |
CVR Energy, Inc. | | 24,526 | | | 1,162,532 | |
Delek US Holdings, Inc. | | 49,092 | | | 1,412,868 | |
Renewable Energy Group, Inc.(1) | | 4,911 | | | 69,884 | |
Rosetta Resources, Inc.(1) | | 5,248 | | | 223,145 | |
Tesoro Corp. | | 27,273 | | | 1,426,923 | |
Warren Resources, Inc.(1) | | 33,165 | | | 84,571 | |
Western Refining, Inc. | | 60,360 | | | 1,694,305 | |
| | | | | | 7,421,047 | |
PAPER AND FOREST PRODUCTS — 1.7% | |
Louisiana-Pacific Corp.(1) | | 117,908 | | | 1,743,859 | |
Resolute Forest Products(1) | | 112,215 | | | 1,477,872 | |
Schweitzer-Mauduit International, Inc. | | 40,734 | | | 2,031,812 | |
| | | | | | 5,253,543 | |
PERSONAL PRODUCTS — 1.1% | |
Medifast, Inc.(1) | | 64,303 | | | 1,656,445 | |
USANA Health Sciences, Inc.(1) | | 22,841 | | | 1,653,232 | |
| | | | | | 3,309,677 | |
PHARMACEUTICALS — 1.9% | |
BioDelivery Sciences International, Inc.(1) | | 116,570 | | | 473,274 | |
Endocyte, Inc.(1) | | 94,248 | | | 1,237,476 | |
Lannett Co., Inc.(1) | | 40,213 | | | 478,937 | |
Questcor Pharmaceuticals, Inc. | | 44,728 | | | 2,033,335 | |
Santarus, Inc.(1) | | 76,718 | | | 1,614,914 | |
| | | | | | 5,837,936 | |
PROFESSIONAL SERVICES — 2.2% | |
Barrett Business Services, Inc. | | 11,909 | | | 621,769 | |
FTI Consulting, Inc.(1) | | 19,522 | | | 642,079 | |
Huron Consulting Group, Inc.(1) | | 35,458 | | | 1,639,578 | |
Kforce, Inc. | | 98,179 | | | 1,433,413 | |
Navigant Consulting, Inc.(1) | | 38,458 | | | 461,496 | |
RPX Corp.(1) | | 106,470 | | | 1,788,696 | |
| | | | | | 6,587,031 | |
REAL ESTATE INVESTMENT TRUSTS (REITs) — 5.8% | |
Alexander’s, Inc. | | 471 | | | 138,337 | |
Apollo Commercial Real Estate Finance, Inc. | | 43,742 | | | 694,623 | |
Cedar Realty Trust, Inc. | | 1,245 | | | 6,449 | |
Cousins Properties, Inc. | | 180,378 | | | 1,821,818 | |
EastGroup Properties, Inc. | | 31,326 | | | $ 1,762,714 | |
First Industrial Realty Trust, Inc. | | 116,581 | | | 1,768,534 | |
Geo Group, Inc. (The) | | 58,404 | | | 1,982,816 | |
Gramercy Property Trust, Inc.(1) | | 144,401 | | | 649,805 | |
LaSalle Hotel Properties | | 63,506 | | | 1,568,598 | |
Pennsylvania Real Estate Investment Trust | | 82,173 | | | 1,551,426 | |
RAIT Financial Trust | | 123,820 | | | 931,126 | |
RLJ Lodging Trust | | 88,353 | | | 1,987,059 | |
Ryman Hospitality Properties | | 31,389 | | | 1,224,485 | |
Spirit Realty Capital, Inc. | | 77,754 | | | 1,377,801 | |
| | | | | | 17,465,591 | |
ROAD AND RAIL — 0.9% | | | | | | |
AMERCO, Inc. | | 4,284 | | | 693,580 | |
Swift Transportation Co.(1) | | 118,380 | | | 1,958,005 | |
| | | | | | 2,651,585 | |
SEMICONDUCTORS AND SEMICONDUCTOR EQUIPMENT — 2.9% | |
Advanced Energy Industries, Inc.(1) | | 81,657 | | | 1,421,648 | |
ATMI, Inc.(1) | | 22,258 | | | 526,402 | |
First Solar, Inc.(1) | | 38,870 | | | 1,738,655 | |
Kulicke & Soffa Industries, Inc.(1) | | 86,004 | | | 951,204 | |
LSI Corp.(1) | | 104,807 | | | 748,322 | |
MaxLinear, Inc., Class A(1) | | 69,239 | | | 484,673 | |
Microsemi Corp.(1) | | 89,434 | | | 2,034,623 | |
PLX Technology, Inc.(1) | | 160,189 | | | 762,500 | |
| | | | | | 8,668,027 | |
SOFTWARE — 4.1% | | | | | | |
Aspen Technology, Inc.(1) | | 67,378 | | | 1,939,813 | |
Cadence Design Systems, Inc.(1) | | 57,871 | | | 837,972 | |
CommVault Systems, Inc.(1) | | 27,430 | | | 2,081,663 | |
Manhattan Associates, Inc.(1) | | 24,273 | | | 1,872,905 | |
Mentor Graphics Corp. | | 99,462 | | | 1,944,482 | |
Monotype Imaging Holdings, Inc. | | 16,799 | | | 426,862 | |
NetScout Systems, Inc.(1) | | 72,000 | | | 1,680,480 | |
PTC, Inc.(1) | | 49,609 | | | 1,216,909 | |
QAD, Inc., Class A | | 3,794 | | | 43,555 | |
TeleNav, Inc.(1) | | 58,714 | | | 307,074 | |
| | | | | | 12,351,715 | |
SPECIALTY RETAIL — 3.0% | |
ANN, Inc.(1) | | 11,301 | | | 375,193 | |
Big 5 Sporting Goods Corp. | | 68,030 | | | 1,493,259 | |
Brown Shoe Co., Inc. | | 79,698 | | | 1,715,898 | |
Buckle, Inc. (The) | | 35,753 | | | 1,859,871 | |
Childrens Place Retail Stores, Inc. (The)(1) | | 34,128 | | | 1,870,214 | |
Destination Maternity Corp. | | 16,000 | | | 393,600 | |
Francesca’s Holdings Corp.(1) | | 172 | | | 4,780 | |
GameStop Corp., Class A | | 30,079 | | | 1,264,220 | |
| | | | | | 8,977,035 | |
TEXTILES, APPAREL AND LUXURY GOODS — 1.1% | |
Culp, Inc. | | 24,807 | | | 431,394 | |
Iconix Brand Group, Inc.(1) | | 69,832 | | | 2,053,759 | |
RG Barry Corp. | | 7,499 | | | 121,784 | |
Unifi, Inc.(1) | | 26,797 | | | 553,894 | |
| | | | | | 3,160,831 | |
THRIFTS AND MORTGAGE FINANCE — 0.5% | |
Ocwen Financial Corp.(1) | | 38,955 | | | 1,605,725 | |
TOBACCO — 0.6% | | | | | | |
Universal Corp. | | 31,275 | | | 1,809,259 | |
WATER UTILITIES — 0.5% | | | | | | |
American States Water Co. | | 28,666 | | | 1,538,504 | |
WIRELESS TELECOMMUNICATION SERVICES — 0.1% | |
USA Mobility, Inc. | | 24,304 | | | 329,805 | |
TOTAL COMMON STOCKS (Cost $248,859,049) | | | 297,254,591 | |
Temporary Cash Investments — 1.5% | |
Repurchase Agreement, Bank of America Merrill Lynch, (collateralized by various U.S. Treasury obligations, 1.00%, 1/15/14, valued at $600,511), in a joint trading account at 0.06%, dated 6/28/13, due 7/1/13 (Delivery value $588,230) | | | 588,227 | |
Repurchase Agreement, Credit Suisse First Boston, Inc., (collateralized by various U.S. Treasury obligations, 4.25%, 11/15/40, valued at $1,798,028), in a joint trading account at 0.05%, dated 6/28/13, due 7/1/13 (Delivery value $1,764,689) | | | 1,764,682 | |
Repurchase Agreement, Goldman Sachs & Co., (collateralized by various U.S. Treasury obligations, 3.125%, 11/15/41, valued at $598,309), in a joint trading account at 0.04%, dated 6/28/13, due 7/1/13 (Delivery value $588,230) | | | 588,228 | |
SSgA U.S. Government Money Market Fund | | 1,623,794 | | | 1,623,794 | |
TOTAL TEMPORARY CASH INVESTMENTS (Cost $4,564,931) | | | 4,564,931 | |
TOTAL INVESTMENT SECURITIES — 100.0% (Cost $253,423,980) | | | 301,819,522 | |
OTHER ASSETS AND LIABILITIES† | | | (132,330 | ) |
TOTAL NET ASSETS — 100.0% | | | $301,687,192 | |
Notes to Schedule of Investments
† | Category is less than 0.05% of total net assets. |
See Notes to Financial Statements.
Statement of Assets and Liabilities |
JUNE 30, 2013 | |
Assets | |
Investment securities, at value (cost of $253,423,980) | | $301,819,522 | |
Receivable for capital shares sold | | 141,406 | |
Dividends and interest receivable | | 208,240 | |
| | | 302,169,168 | |
| | | | |
Liabilities | | | |
Payable for capital shares redeemed | | 266,067 | |
Accrued management fees | | 209,567 | |
Distribution and service fees payable | | 6,342 | |
| | | 481,976 | |
| | | | |
Net Assets | | $301,687,192 | |
| | | | |
Net Assets Consist of: | | | |
Capital (par value and paid-in surplus) | | $389,648,975 | |
Undistributed net investment income | | 459,547 | |
Accumulated net realized loss | | (136,816,872 | ) |
Net unrealized appreciation | | 48,395,542 | |
| | | $301,687,192 | |
| | | | |
| | Net assets | Shares outstanding | Net asset value per share |
Investor Class, $0.01 Par Value | $236,280,325 | 22,812,597 | $10.36 |
Institutional Class, $0.01 Par Value | $36,886,169 | 3,544,606 | $10.41 |
A Class, $0.01 Par Value | $26,861,713 | 2,645,188 | $10.15* |
C Class, $0.01 Par Value | $303,379 | 29,988 | $10.12 |
R Class, $0.01 Par Value | $1,355,606 | 134,899 | $10.05 |
*Maximum offering price $10.77 (net asset value divided by 0.9425).
See Notes to Financial Statements.
YEAR ENDED JUNE 30, 2013 | |
Investment Income (Loss) | |
Income: | | | |
Dividends (net of foreign taxes withheld of $2,793) | | $ 4,763,315 | |
Interest | | 2,594 | |
| | | 4,765,909 | |
| | | | |
Expenses: | | | |
Management fees | | 2,235,081 | |
Distribution and service fees: | | | |
A Class | | 62,917 | |
C Class | | 1,643 | |
R Class | | 5,374 | |
Directors’ fees and expenses | | 13,124 | |
| | | 2,318,139 | |
| | | | |
Net investment income (loss) | | 2,447,770 | |
| | | | |
Realized and Unrealized Gain (Loss) | | | |
Net realized gain (loss) on: | | | |
Investment transactions | | 33,861,405 | |
Futures contract transactions | | 8,788 | |
| | | 33,870,193 | |
| | | | |
Change in net unrealized appreciation (depreciation) on investments | | 27,284,573 | |
| | | | |
Net realized and unrealized gain (loss) | | 61,154,766 | |
| | | | |
Net Increase (Decrease) in Net Assets Resulting from Operations | | $63,602,536 | |
See Notes to Financial Statements.
Statement of Changes in Net Assets |
YEARS ENDED JUNE 30, 2013 AND JUNE 30, 2012 | |
Increase (Decrease) in Net Assets | | June 30, 2013 | | | June 30, 2012 | |
Operations | |
Net investment income (loss) | | $ 2,447,770 | | | $ 1,134,737 | |
Net realized gain (loss) | | 33,870,193 | | | 22,119,637 | |
Change in net unrealized appreciation (depreciation) | | 27,284,573 | | | (30,243,656 | ) |
Net increase (decrease) in net assets resulting from operations | | 63,602,536 | | | (6,989,282 | ) |
| | | | | | | |
Distributions to Shareholders | | | | | | |
From net investment income: | | | | | | |
Investor Class | | (1,851,351 | ) | | (606,377 | ) |
Institutional Class | | (338,268 | ) | | (181,344 | ) |
A Class | | (179,380 | ) | | (17,887 | ) |
C Class | | (322 | ) | | — | |
R Class | | (5,473 | ) | | — | |
Decrease in net assets from distributions | | (2,374,794 | ) | | (805,608 | ) |
| | | | | | | |
Capital Share Transactions | | | | | | |
Net increase (decrease) in net assets from capital share transactions | | (4,515,642 | ) | | (42,884,361 | ) |
| | | | | | | |
Net increase (decrease) in net assets | | 56,712,100 | | | (50,679,251 | ) |
| | | | | | | |
Net Assets | | | | | | |
Beginning of period | | 244,975,092 | | | 295,654,343 | |
End of period | | $301,687,192 | | | $244,975,092 | |
| | | | | | | |
Undistributed net investment income | | $459,547 | | | $559,352 | |
See Notes to Financial Statements.
Notes to Financial Statements |
June 30, 2013
1. Organization
American Century Quantitative Equity Funds, Inc. (the corporation) is registered under the Investment Company Act of 1940, as amended (the 1940 Act), as an open-end management investment company and is organized as a Maryland corporation. Small Company Fund (the fund) is one fund in a series issued by the corporation. The fund is diversified as defined under the 1940 Act. The fund’s investment objective is to seek long-term capital growth by investing primarily in stocks of small companies.
The fund offers the Investor Class, the Institutional Class, the A Class, the C Class and the R Class. The A Class may incur an initial sales charge. The A Class and C Class may be subject to a contingent deferred sales charge. The share classes differ principally in their respective sales charges and distribution and shareholder servicing expenses and arrangements. The Institutional Class is made available to institutional shareholders or through financial intermediaries whose clients do not require the same level of shareholder and administrative services as shareholders of other classes. As a result, the Institutional Class is charged a lower unified management fee.
2. Significant Accounting Policies
The following is a summary of significant accounting policies consistently followed by the fund in preparation of its financial statements. The financial statements are prepared in conformity with accounting principles generally accepted in the United States of America, which may require management to make certain estimates and assumptions at the date of the financial statements. Actual results could differ from these estimates.
Investment Valuations — The fund determines the fair value of its investments and computes its net asset value per share as of the close of regular trading (usually 4 p.m. Eastern time) on the New York Stock Exchange (NYSE) on each day the NYSE is open.
Equity securities that are listed or traded on a domestic securities exchange are valued at the last reported sales price or at the official closing price as provided by the exchange. Equity securities traded on foreign securities exchanges are typically valued at the closing price on the exchange where primarily traded or as of the close of the NYSE, if that is earlier. If no last sales price is reported, or if local convention or regulation so provides, the mean of the latest bid and asked prices is used. Depending on local convention or regulation, securities traded over-the-counter are valued at the mean of the latest bid and asked prices, the last sales price, or the official closing price. In its determination of fair value, the fund may review several factors including: market information specific to a security; news developments in U.S. and foreign markets; the performance of particular U.S. and foreign securities, indices, comparable securities, American Depositary Receipts, Exchange-Traded Funds, and other relevant market indicators.
Debt securities maturing within 60 days at the time of purchase may be valued at cost, plus or minus any amortized discount or premium or at the evaluated mean as provided by an independent pricing service. Evaluated mean prices are commonly derived through utilization of market models, which may consider, among other factors, trade data, quotations from dealers and active market makers, relevant yield curve and spread data, related sector levels, creditworthiness, and other relevant market information on the same or comparable securities.
Investments in open-end management investment companies are valued at the reported net asset value per share. Repurchase agreements are valued at cost. Exchange-traded futures contracts are valued at the settlement price as provided by the appropriate clearing corporation.
If the fund determines that the market price for a portfolio security is not readily available or the valuation methods mentioned above do not reflect a security’s fair value, such security is valued as determined in good faith by the Board of Directors or its designee, in accordance with procedures adopted by the Board of Directors. Circumstances that may cause the fund to use these procedures to value a security include, but are not limited to: a security has been declared in default; trading in a security has been halted during the trading day; there is a foreign market holiday and no trading occurred; or an event occurred between the close of a foreign exchange and the NYSE that may affect the value of a security.
Security Transactions — Security transactions are accounted for as of the trade date. Net realized gains and losses are determined on the identified cost basis, which is also used for federal income tax purposes.
Investment Income — Dividend income less foreign taxes withheld, if any, is recorded as of the ex-dividend date. Distributions received on securities that represent a return of capital or long-term capital gain are recorded as a reduction of cost of investments and/or as a realized gain. The fund may estimate the components of distributions received that may be considered nontaxable distributions or long-term capital gain distributions for income tax purposes. Interest income is recorded on the accrual basis and includes accretion of discounts and amortization of premiums.
Repurchase Agreements — The fund may enter into repurchase agreements with institutions that American Century Investment Management, Inc. (ACIM) (the investment advisor) has determined are creditworthy pursuant to criteria adopted by the Board of Directors. The fund requires that the collateral, represented by securities, received in a repurchase transaction be transferred to the custodian in a manner sufficient to enable the fund to obtain those securities in the event of a default under the repurchase agreement. ACIM monitors, on a daily basis, the securities transferred to ensure the value, including accrued interest, of the securities under each repurchase agreement is equal to or greater than amounts owed to the fund under each repurchase agreement.
Joint Trading Account — Pursuant to an Exemptive Order issued by the Securities and Exchange Commission, the fund, along with certain other funds in the American Century Investments family of funds, may transfer uninvested cash balances into a joint trading account. These balances are invested in one or more repurchase agreements that are collateralized by U.S. Treasury or Agency obligations.
Segregated Assets — In accordance with the 1940 Act, the fund segregates assets on its books and records to cover futures contracts. ACIM monitors, on a daily basis, the securities segregated to ensure the fund designates a sufficient amount of liquid assets, marked-to-market daily. The fund may also receive assets or be required to pledge assets at the custodian bank or with a broker for margin requirements on futures contracts.
Income Tax Status — It is the fund’s policy to distribute substantially all net investment income and net realized gains to shareholders and to otherwise qualify as a regulated investment company under provisions of the Internal Revenue Code. Accordingly, no provision has been made for income taxes. The fund files U.S. federal, state, local and non-U.S. tax returns as applicable. The fund’s tax returns are subject to examination by the relevant taxing authority until expiration of the applicable statute of limitations, which is generally three years from the date of filing but can be longer in certain jurisdictions. At this time, management believes there are no uncertain tax positions which, based on their technical merit, would not be sustained upon examination and for which it is reasonably possible that the total amounts of unrecognized tax benefits will significantly change in the next twelve months.
Multiple Class — All shares of the fund represent an equal pro rata interest in the net assets of the class to which such shares belong, and have identical voting, dividend, liquidation and other rights and the same terms and conditions, except for class specific expenses and exclusive rights to vote on matters affecting only individual classes. Income, non-class specific expenses, and realized and unrealized capital gains and losses of the fund are allocated to each class of shares based on their relative net assets.
Distributions to Shareholders — Distributions from net investment income, if any, are generally declared and paid quarterly. Distributions from net realized gains, if any, are generally declared and paid annually.
Indemnifications — Under the corporation’s organizational documents, its officers and directors are indemnified against certain liabilities arising out of the performance of their duties to the fund. In addition, in the normal course of business, the fund enters into contracts that provide general indemnifications. The maximum exposure under these arrangements is unknown as this would involve future claims that may be made against a fund. The risk of material loss from such claims is considered by management to be remote.
3. Fees and Transactions with Related Parties
Management Fees — The corporation has entered into a management agreement with ACIM, under which ACIM provides the fund with investment advisory and management services in exchange for a single, unified management fee (the fee) per class. The agreement provides that all expenses of managing and operating the fund, except distribution and service fees, brokerage expenses, taxes, interest, fees and expenses of the independent directors (including legal counsel fees), and extraordinary expenses, will be paid by ACIM. The fee is computed and accrued daily based on each class’s daily net assets and paid monthly in arrears. The fee consists of (1) an Investment Category Fee based on the daily net assets of the fund and certain other accounts managed by the investment advisor that are in the same broad investment category as the fund and (2) a Complex Fee based on the assets of all the funds in the American Century Investments family of funds. The rates for the Investment Category Fee range from 0.5380% to 0.7200%. The rates for the Complex Fee range from 0.2500% to 0.3100% for the Investor Class, A Class, C Class and R Class. The Institutional Class is 0.2000% less at each point within the Complex Fee range. The effective annual management fee for each class for the year ended June 30, 2013 was 0.87% for the Investor Class, A Class, C Class and R Class and 0.67% for the Institutional Class.
Distribution and Service Fees — The Board of Directors has adopted a separate Master Distribution and Individual Shareholder Services Plan for each of the A Class, C Class and R Class (collectively the plans), pursuant to Rule 12b-1 of the 1940 Act. The plans provide that the A Class will pay American Century Investment Services, Inc. (ACIS) an annual distribution and service fee of 0.25%. The plans provide that the C Class will pay ACIS an annual distribution and service fee of 1.00%, of which 0.25% is paid for individual shareholder services and 0.75% is paid for distribution services. The plans provide that the R Class will pay ACIS an annual distribution and service fee of 0.50%. The fees are computed and accrued daily based on each class’s daily net assets and paid monthly in arrears. The fees are used to pay financial intermediaries for distribution and individual shareholder services. Fees incurred under the plans during the year ended June 30, 2013 are detailed in the Statement of Operations.
Related Parties — Certain officers and directors of the corporation are also officers and/or directors of American Century Companies, Inc. (ACC). The corporation’s investment advisor, ACIM, the corporation’s distributor, ACIS, and the corporation’s transfer agent, American Century Services, LLC are wholly owned, directly or indirectly, by ACC. Various funds issued by American Century Asset Allocation Portfolios, Inc. and American Century Strategic Asset Allocations, Inc. own, in aggregate, 21% of the shares of the fund.
4. Investment Transactions
Purchases and sales of investment securities, excluding short-term investments, for the year ended June 30, 2013 were $243,181,926 and $249,574,496 respectively.
5. Capital Share Transactions
Transactions in shares of the fund were as follows:
| | | | | | | |
| | | Year ended June 30, 2013 | | | Year ended June 30, 2012 | |
| | | Shares | | | Amount | | | Shares | | | Amount | |
Investor Class/Shares Authorized | | 200,000,000 | | | | | | 200,000,000 | | | | |
Sold | | 3,498,387 | | | $32,689,224 | | | 4,492,903 | | | $35,130,570 | |
Issued in reinvestment of distributions | | 208,686 | | | 1,814,208 | | | 74,240 | | | 594,091 | |
Redeemed | | (3,781,840 | ) | | (34,374,585 | ) | | (7,786,139 | ) | | (62,419,731 | ) |
| | | (74,767 | ) | | 128,847 | | | (3,218,996 | ) | | (26,695,070 | ) |
Institutional Class/Shares Authorized | | 100,000,000 | | | | | | 100,000,000 | | | | |
Sold | | 725,575 | | | 6,624,102 | | | 1,173,172 | | | 9,379,013 | |
Issued in reinvestment of distributions | | 38,679 | | | 337,845 | | | 23,354 | | | 180,999 | |
Redeemed | | (786,549 | ) | | (7,168,177 | ) | | (2,682,434 | ) | | (19,252,370 | ) |
| | | (22,295 | ) | | (206,230 | ) | | (1,485,908 | ) | | (9,692,358 | ) |
A Class/Shares Authorized | | 140,000,000 | | | | | | 140,000,000 | | | | |
Sold | | 561,261 | | | 5,069,211 | | | 561,169 | | | 4,459,495 | |
Issued in reinvestment of distributions | | 20,992 | | | 178,740 | | | 2,105 | | | 17,854 | |
Redeemed | | (1,147,527 | ) | | (10,046,009 | ) | | (1,423,609 | ) | | (10,976,701 | ) |
| | | (565,274 | ) | | (4,798,058 | ) | | (860,335 | ) | | (6,499,352 | ) |
C Class/Shares Authorized | | 10,000,000 | | | | | | 10,000,000 | | | | |
Sold | | 26,032 | | | 239,425 | | | 2,211 | | | 17,729 | |
Issued in reinvestment of distributions | | 38 | | | 322 | | | — | | | — | |
Redeemed | | (5,586 | ) | | (51,722 | ) | | (1,685 | ) | | (11,539 | ) |
| | | 20,484 | | | 188,025 | | | 526 | | | 6,190 | |
R Class/Shares Authorized | | 10,000,000 | | | | | | 10,000,000 | | | | |
Sold | | 64,202 | | | 577,806 | | | 30,952 | | | 237,954 | |
Issued in reinvestment of distributions | | 605 | | | 5,089 | | | — | | | — | |
Redeemed | | (46,128 | ) | | (411,121 | ) | | (30,595 | ) | | (241,725 | ) |
| | | 18,679 | | | 171,774 | | | 357 | | | (3,771 | ) |
Net increase (decrease) | | (623,173 | ) | | $(4,515,642 | ) | | (5,564,356 | ) | | $(42,884,361 | ) |
6. Fair Value Measurements
The fund’s securities valuation process is based on several considerations and may use multiple inputs to determine the fair value of the positions held by the fund. In conformity with accounting principles generally accepted in the United States of America, the inputs used to determine a valuation are classified into three broad levels as follows:
• | Level 1 valuation inputs consist of unadjusted quoted prices in an active market for identical securities; |
• | Level 2 valuation inputs consist of direct or indirect observable market data (including quoted prices for similar securities, evaluations of subsequent market events, interest rates, prepayment speeds, credit risk, etc.); or |
• | Level 3 valuation inputs consist of unobservable data (including a fund’s own assumptions). |
The level classification is based on the lowest level input that is significant to the fair valuation measurement. The valuation inputs are not necessarily an indication of the risks associated with investing in these securities or other financial instruments.
The following is a summary of the level classifications as of period end. The Schedule of Investments provides additional information on the fund’s portfolio holdings.
| | | | |
| | Level 1 | Level 2 | Level 3 |
Investment Securities | | | |
Common Stocks | $297,254,591 | — | — |
Temporary Cash Investments | 1,623,794 | $2,941,137 | — |
Total Value of Investment Securities | $298,878,385 | $2,941,137 | — |
7. Derivative Instruments
Equity Price Risk — The fund is subject to equity price risk in the normal course of pursuing its investment objectives. A fund may enter into futures contracts based on an equity index in order to manage its exposure to changes in market conditions. A fund may purchase futures contracts to gain exposure to increases in market value or sell futures contracts to protect against a decline in market value. Upon entering into a futures contract, a fund is required to deposit either cash or securities in an amount equal to a certain percentage of the contract value (initial margin). Subsequent payments (variation margin) are made or received daily, in cash, by a fund. The variation margin is equal to the daily change in the contract value and is recorded as unrealized gains and losses. A fund recognizes a realized gain or loss when the contract is closed or expires. Net realized and unrealized gains or losses occurring during the holding period of futures contracts are a component of net realized gain (loss) on futures contract transactions and change in net unrealized appreciation (depreciation) on futures contracts, respectively. One of the risks of entering into futures contracts is the possibility that the change in value of the contract may not correlate with the changes in value of the underlying securities. During the period, the fund infrequently purchased equity price risk derivative instruments for temporary investment purposes.
At period end, the fund did not have any derivative instruments disclosed on the Statement of Assets and Liabilities. For the year ended June 30, 2013, the effect of equity price risk derivative instruments on the Statement of Operations was $8,788 in net realized gain (loss) on futures contract transactions.
8. Risk Factors
The fund concentrates its investments in common stocks of small companies. Because of this, the fund may be subject to greater risk and market fluctuations than a fund investing in larger, more established companies.
9. Federal Tax Information
The tax character of distributions paid during the years ended June 30, 2013 and June 30, 2012 were as follows:
| | | |
| | 2013 | 2012 |
Distributions Paid From | | |
Ordinary income | $2,374,794 | $805,608 |
Long-term capital gains | — | — |
The book-basis character of distributions made during the year from net investment income or net realized gains may differ from their ultimate characterization for federal income tax purposes. These differences reflect the differing character of certain income items and net realized gains and losses for financial statement and tax purposes, and may result in reclassification among certain capital accounts on the financial statements.
As of June 30, 2013, the federal tax cost of investments and the components of distributable earnings on a tax-basis were as follows:
| | |
Federal tax cost of investments | $253,560,260 |
Gross tax appreciation of investments | $54,861,436 |
Gross tax depreciation of investments | (6,602,174) |
Net tax appreciation (depreciation) of investments | $48,259,262 |
Undistributed ordinary income | $545,428 |
Accumulated short-term capital losses | $(136,766,473) |
The difference between book-basis and tax-basis unrealized appreciation (depreciation) is attributable primarily to the tax deferral of losses on wash sales and the realization for tax purposes of unrealized gains on investments in passive foreign investment companies.
Accumulated capital losses represent net capital loss carryovers that may be used to offset future realized capital gains for federal income tax purposes. Future capital loss carryover utilization in any given year may be subject to Internal Revenue Code limitations. Capital loss carryovers expire in 2018.
| |
For a Share Outstanding Throughout the Years Ended June 30 (except as noted) |
Per-Share Data | Ratios and Supplemental Data |
| | | Income From Investment Operations: | | | | Ratio to Average Net Assets of: | | |
| | Net Asset
Value,
Beginning
of Period | Net
Investment Income
(Loss)(1) | Net Realized
and Unrealized Gain (Loss) | Total From Investment Operations | Distributions From Net
Investment Income | Net Asset
Value, End
of Period | Total
Return(2) | Operating Expenses | Net
Investment Income
(Loss) | Portfolio
Turnover
Rate | Net Assets,
End of Period
(in thousands) |
Investor Class |
2013 | $8.24 | 0.08 | 2.12 | 2.20 | (0.08) | $10.36 | 26.92% | 0.88% | 0.92% | 93% | $236,280 |
2012 | $8.38 | 0.04 | (0.16) | (0.12) | (0.02) | $8.24 | (1.37)% | 0.89% | 0.45% | 72% | $188,519 |
2011 | $6.15 | 0.01 | 2.23 | 2.24 | (0.01) | $8.38 | 36.39% | 0.89% | 0.17% | 61% | $218,642 |
2010 | $5.00 | 0.01 | 1.16 | 1.17 | (0.02) | $6.15 | 23.39% | 0.90% | 0.12% | 44% | $234,727 |
2009 | $7.76 | 0.02 | (2.78) | (2.76) | —(3) | $5.00 | (35.51)% | 0.90% | 0.33% | 92% | $229,568 |
Institutional Class | | | | | | | | | | | |
2013 | $8.27 | 0.10 | 2.14 | 2.24 | (0.10) | $10.41 | 27.27% | 0.68% | 1.12% | 93% | $36,886 |
2012 | $8.42 | 0.05 | (0.15) | (0.10) | (0.05) | $8.27 | (1.20)% | 0.69% | 0.65% | 72% | $29,506 |
2011 | $6.19 | 0.03 | 2.22 | 2.25 | (0.02) | $8.42 | 36.43% | 0.69% | 0.37% | 61% | $42,541 |
2010 | $5.02 | 0.02 | 1.18 | 1.20 | (0.03) | $6.19 | 23.87% | 0.70% | 0.32% | 44% | $42,599 |
2009 | $7.79 | 0.03 | (2.79) | (2.76) | (0.01) | $5.02 | (35.38)% | 0.70% | 0.53% | 92% | $143,028 |
A Class(4) |
2013 | $8.08 | 0.06 | 2.07 | 2.13 | (0.06) | $10.15 | 26.58% | 1.13% | 0.67% | 93% | $26,862 |
2012 | $8.22 | 0.02 | (0.15) | (0.13) | (0.01) | $8.08 | (1.64)% | 1.14% | 0.20% | 72% | $25,944 |
2011 | $6.05 | (0.01) | 2.18 | 2.17 | — | $8.22 | 35.87% | 1.14% | (0.08)% | 61% | $33,452 |
2010 | $4.91 | (0.01) | 1.16 | 1.15 | (0.01) | $6.05 | 23.40% | 1.15% | (0.13)% | 44% | $35,567 |
2009 | $7.65 | —(3) | (2.74) | (2.74) | — | $4.91 | (35.82)% | 1.15% | 0.08% | 92% | $49,253 |
| |
For a Share Outstanding Throughout the Years Ended June 30 (except as noted) |
Per-Share Data | Ratios and Supplemental Data |
| | | Income From Investment Operations: | | | | Ratio to Average Net Assets of: | | |
| | Net Asset
Value,
Beginning
of Period | Net
Investment Income
(Loss)(1) | Net Realized
and Unrealized Gain (Loss) | Total From Investment Operations | Distributions From Net
Investment Income | Net Asset
Value, End
of Period | Total
Return(2) | Operating Expenses | Net
Investment Income
(Loss) | Portfolio
Turnover
Rate | Net Assets,
End of Period
(in thousands) |
C Class | | | | | | | | | | | |
2013 | $8.08 | (0.03) | 2.10 | 2.07 | (0.03) | $10.12 | 25.68% | 1.88% | (0.08)% | 93% | $303 |
2012 | $8.27 | (0.04) | (0.15) | (0.19) | — | $8.08 | (2.30)% | 1.89% | (0.55)% | 72% | $77 |
2011 | $6.13 | (0.06) | 2.20 | 2.14 | — | $8.27 | 34.91% | 1.89% | (0.83)% | 61% | $74 |
2010(5) | $6.40 | (0.02) | (0.25) | (0.27) | — | $6.13 | (4.22)% | 1.90%(6) | (0.79)%(6) | 44%(7) | $24 |
R Class | | | | | | | | | | | |
2013 | $8.00 | 0.04 | 2.06 | 2.10 | (0.05) | $10.05 | 26.33% | 1.38% | 0.42% | 93% | $1,356 |
2012 | $8.15 | —(3) | (0.15) | (0.15) | — | $8.00 | (1.84)% | 1.39% | (0.05)% | 72% | $930 |
2011 | $6.01 | (0.02) | 2.16 | 2.14 | — | $8.15 | 35.61% | 1.39% | (0.33)% | 61% | $945 |
2010 | $4.89 | (0.02) | 1.14 | 1.12 | — | $6.01 | 22.90% | 1.40% | (0.38)% | 44% | $384 |
2009 | $7.63 | (0.01) | (2.73) | (2.74) | — | $4.89 | (35.91)% | 1.40% | (0.17)% | 92% | $321 |
Notes to Financial Highlights
(1) | Computed using average shares outstanding throughout the period. |
(2) | Total returns are calculated based on the net asset value of the last business day and do not reflect applicable sales charges, if any. Total returns for periods less than one year are not annualized. |
(3) | Per-share amount was less than $0.005. |
(4) | Prior to March 1, 2010, the A Class was referred to as the Advisor Class. |
(5) | March 1, 2010 (commencement of sale) through June 30, 2010. |
(7) | Portfolio turnover is calculated at the fund level. Percentage indicated was calculated for the year ended June 30, 2010. |
See Notes to Financial Statements.
Report of Independent Registered Public Accounting Firm |
To the Directors of the American Century Quantitative Equity Funds, Inc.
and Shareholders of the Small Company Fund:
In our opinion, the accompanying statement of assets and liabilities, including the schedule of investments, and the related statements of operations and of changes in net assets and the financial highlights present fairly, in all material respects, the financial position of the Small Company Fund (one of the fourteen funds comprising the American Century Quantitative Equity Funds, Inc., hereafter referred to as the “Fund”) at June 30, 2013, the results of its operations for the year then ended, the changes in its net assets for each of the two years in the period then ended and the financial highlights for each of the periods presented, in conformity with accounting principles generally accepted in the United States of America. These financial statements and financial highlights (hereafter referred to as “financial statements”) are the responsibility of the Fund’s management; our responsibility is to express an opinion on these financial statements based on our audits. We conducted our audits of these financial statements in accordance with the standards of the Public Company Accounting Oversight Board (United States). Those standards require that we plan and perform the audit to obtain reasonable assurance about whether the financial statements are free of material misstatement. An audit includes examining, on a test basis, evidence supporting the amounts and disclosures in the financial statements, assessing the accounting principles used and significant estimates made by management, and evaluating the overall financial statement presentation. We believe that our audits, which included confirmation of securities at June 30, 2013 by correspondence with the custodian and brokers, provide a reasonable basis for our opinion.
PricewaterhouseCoopers LLP
Kansas City, Missouri
August 21, 2013
Board of Directors
The individuals listed below serve as directors of the funds. Each director will continue to serve in this capacity until death, retirement, resignation or removal from office. The board has adopted a mandatory retirement age for directors who are not “interested persons,” as that term is defined in the Investment Company Act (independent directors). Independent directors shall retire on December 31 of the year in which they reach their 75th birthday; provided, however, that on or after January 1, 2022, independent directors shall retire on December 31 of the year in which they reach their 76th birthday.
Mr. Thomas is the only director who is an “interested person” because he currently serves as President and Chief Executive Officer of American Century Companies, Inc. (ACC), the parent company of American Century Investment Management, Inc. (ACIM or the advisor).
The other directors (more than three-fourths of the total number) are independent; that is, they have never been employees, directors or officers of, and have no financial interest in, ACC or any of its wholly owned, direct or indirect, subsidiaries, including ACIM, American Century Investment Services, Inc. (ACIS) and American Century Services, LLC (ACS). The directors serve in this capacity for eight (in the case of Mr. Thomas, 15) registered investment companies in the American Century Investments family of funds.
The following table presents additional information about the directors. The mailing address for each director other than Mr. Thomas is 1665 Charleston Road, Mountain View, California 94043. The mailing address for Mr. Thomas is 4500 Main Street, Kansas City, Missouri 64111.
| | | | | | | |
Name
(Year of Birth) | Position(s) Held with Funds | Length of Time Served | Principal Occupation(s) During Past 5 Years | | Number of American Century Portfolios Overseen by Director | Other Directorships Held During Past 5 Years |
Independent Directors |
Tanya S. Beder (1955) | Director | Since 2011 | Chairman, SBCC Group Inc. (independent advisory services) (2006 to present) | | 41 | CYS Investments, Inc. (specialty finance company) |
Jeremy I. Bulow (1954) | Director | Since 2011 | Professor of Economics, Stanford University, Graduate School of Business (1979 to present) | | 41 | None |
Ronald J. Gilson (1946) | Director and Chairman of the Board | Since 1995 | Charles J. Meyers Professor of Law and Business, Stanford Law School (1979 to present); Marc and Eva Stern Professor of Law and Business, Columbia University School of Law (1992 to present) | | 41 | None |
Frederick L. A. Grauer
(1946) | Director | Since 2008 | Senior Advisor, BlackRock, Inc. (investment management firm) (2010 to 2011); Senior Advisor, Barclays Global Investors (investment management firm) (2003 to 2009) | | 41 | None |
| | | | | | | |
Name
(Year of Birth) | Position(s) Held with Funds | Length of Time Served | Principal Occupation(s) During Past 5 Years | | Number of American Century Portfolios Overseen by Director | Other Directorships Held During Past 5 Years |
Independent Directors |
Peter F. Pervere (1947) | Director | Since 2007 | Retired | | 41 | Intraware, Inc. (2003 to 2009) |
Myron S. Scholes (1941) | Director | Since 1980 | Chairman, Platinum Grove Asset Management, L.P. (asset manager) (1999 to 2009); Frank E. Buck Professor of Finance-Emeritus, Stanford Graduate School of Business (1996 to present) | | 41 | Dimensional Fund Advisors (investment advisor); CME Group, Inc. (futures and options exchange) |
John B. Shoven (1947) | Director | Since 2002 | Professor of Economics, Stanford University (1973 to present) | | 41 | Cadence Design Systems; Exponent; Financial Engines |
| |
Interested Director |
Jonathan S. Thomas
(1963) | Director and President | Since 2007 | President and Chief Executive Officer, ACC (March 2007 to present). Also serves as Chief Executive Officer and Manager, ACS; Executive Vice President, ACIM; Director, ACC, ACIM and other ACC subsidiaries | | 106 | None |
Officers
The following table presents certain information about the executive officers of the funds. Each officer serves as an officer for each of the 15 investment companies in the American Century family of funds, unless otherwise noted. No officer is compensated for his or her service as an officer of the funds. The listed officers are interested persons of the funds and are appointed or re-appointed on an annual basis. The mailing address for each of the officers listed below is 4500 Main Street, Kansas City, Missouri 64111
| | | |
Name
(Year of Birth) | Offices with the Funds | Principal Occupation(s) During the Past Five Years |
Jonathan S.Thomas
(1963) | Director and President since 2007 | President and Chief Executive Officer, ACC (March 2007 to present). Also serves as Chief Executive Officer and Manager, ACS; Executive Vice President, ACIM; Director, ACC, ACIM and other ACC subsidiaries |
Maryanne L. Roepke
(1956) | Chief Compliance Officer since 2006 and Senior Vice President since 2000 | Chief Compliance Officer, American Century funds, ACIM and ACS (August 2006 to present). Also serves as Senior Vice President, ACS |
Charles A. Etherington (1957) | General Counsel since 2007 and Senior Vice President since 2006 | Attorney, ACC (February 1994 to present); Vice President, ACC (November 2005 to present); General Counsel, ACC (March 2007 to present). Also serves as General Counsel, ACIM, ACS, ACIS and other ACC subsidiaries; and Senior Vice President, ACIM and ACS |
C. Jean Wade (1964) | Vice President, Treasurer and Chief Financial Officer since 2012 | Vice President, ACS (February 2000 to present) |
Robert J. Leach (1966) | Vice President since 2006 and Assistant Treasurer since 2012 | Vice President, ACS (February 2000 to present) |
David H. Reinmiller (1963) | Vice President since 2001 | Attorney, ACC (January 1994 to present); Associate General Counsel, ACC (January 2001 to present). Also serves as Vice President, ACIM and ACS |
Ward D. Stauffer (1960) | Secretary since 2005 | Attorney, ACC (June 2003 to present) |
The Statement of Additional Information has additional information about the fund’s directors and is available without charge, upon request, by calling 1-800-345-2021.
Approval of Management Agreement |
At a meeting held on June 11, 2013, the Fund’s Board of Directors/Trustees unanimously approved the renewal of the management agreement pursuant to which American Century Investment Management, Inc. (the “Advisor”) acts as the investment advisor for the Fund. Under Section 15(c) of the Investment Company Act, contracts for investment advisory services are required to be reviewed, evaluated, and approved by a majority of a fund’s directors/trustees (the “Directors”), including a majority of the independent Directors each year. The Board regards this annual evaluation and renewal as one of its most important responsibilities.
In connection with their annual review and evaluation, the independent Directors memorialized a statement regarding the relationship between their ongoing obligations to oversee and evaluate the performance of the Advisor and their consideration of renewal of the management agreement. In that statement, the independent Directors noted that their assessment of the Advisor’s performance is an ongoing process that takes place over the entire year and is informed by all of the information that the Board and its committees receive and consider over time. This information, together with the materials provided in connection with the review, are central to the Board’s assessment of the Advisor’s performance and its determination whether to renew the Fund’s management agreement.
Prior to its consideration of the renewal of the management agreement, the Board requested and reviewed extensive data and analysis relating to the proposed renewal. This information and analysis was compiled by the Advisor and certain independent providers of evaluation data concerning the Fund and the services provided to the Fund by the Advisor.
In connection with its consideration of the renewal of the management agreement, the Board’s review and evaluation of the services provided by the Advisor included, but was not limited to, the following:
• | the nature, extent, and quality of investment management, shareholder services, and other services provided by the Advisor to the Fund; |
• | the wide range of other programs and services the Advisor provides to the Fund and its shareholders on a routine and non-routine basis; |
• | the investment performance of the Fund, including data comparing the Fund’s performance to appropriate benchmarks and/or a peer group of other mutual funds with similar investment objectives and strategies; |
• | data comparing the cost of owning the Fund to the cost of owning similar funds; |
• | the Advisor’s compliance policies, procedures, and regulatory experience; |
• | financial data showing the cost of services provided to the Fund, the profitability of the Fund to the Advisor, and the overall profitability of the Advisor; |
• | possible economies of scale associated with the Advisor’s management of the Fund and other accounts under its management; |
• | data comparing services provided and charges to other investment management clients of the Advisor; and |
• | consideration of collateral benefits derived by the Advisor from the management of the Fund. |
In keeping with its practice, the Board held two in-person meetings to review and discuss the information provided. The Board also had the benefit of the advice of its independent counsel throughout the period.
Factors Considered
The Directors considered all of the information provided by the Advisor, the independent data providers, and the Board’s independent counsel in connection with the review, and evaluated such information for the Fund. In connection with their review, the Directors did not identify any single factor as being all-important or controlling and each Director may have attributed different levels of importance to different factors. In deciding to renew the management agreement, the Board based its decision on a number of factors, including the following:
Nature, Extent and Quality of Services - Generally. Under the management agreement, the Advisor is responsible for providing or arranging for all services necessary for the operation of the Fund. The Board noted that under the management agreement, the Advisor provides or arranges at its own expense a wide variety of services including:
• | constructing and designing the Fund |
• | portfolio research and security selection |
• | initial capitalization/funding |
• | daily valuation of the Fund’s portfolio |
• | shareholder servicing and transfer agency, including shareholder confirmations, recordkeeping, and communications |
• | regulatory and portfolio compliance |
• | marketing and distribution |
The Board noted that many of these services have expanded over time both in terms of quantity and complexity in response to shareholder demands, competition in the industry, changing distribution channels, and the changing regulatory environment.
Investment Management Services. The nature of the investment management services provided to the Fund is quite complex and allows Fund shareholders access to professional money management, instant diversification of their investments within an asset class, the opportunity to easily diversify among asset classes by investing in or exchanging among various American Century Investments funds, and liquidity. In evaluating investment performance, the Board expects the Advisor to manage the Fund in accordance with its investment objectives and approved strategies. Further, the Directors recognize that the Advisor has an obligation to seek the best execution of fund trades. In providing these services, the Advisor utilizes teams of investment professionals (portfolio managers, analysts, research assistants, and securities traders) who require extensive information technology, research, training, compliance and other systems to conduct their business. The Board, directly and through its Portfolio Committee, regularly reviews investment performance information for the Fund, together with comparative information for appropriate benchmarks and/or peer groups of similarly-managed funds, over different time horizons. The Directors also review detailed performance information during the management agreement approval process. If performance concerns are identified, the Fund receives special reviews until performance improves, during which the Board discusses with the Advisor the reasons for such results (e.g., market conditions, security selection) and any efforts being undertaken to improve performance. The Board found the investment management services provided by the Advisor to the Fund to meet or exceed industry standards. More detailed information about the Fund’s performance can be found in the Performance and Portfolio Commentary sections of this report.
Shareholder and Other Services. Under the management agreement, the Advisor provides the Fund with a comprehensive package of transfer agency, shareholder, and other services. The Board, directly and through various committees of the Board, regularly reviews reports and evaluations of such services at its regular meetings. These reports include, but are not limited to, information regarding the operational efficiency and accuracy of the shareholder and transfer agency services provided, staffing levels, shareholder satisfaction (as measured by external as well as internal sources), technology support, new products and services offered to Fund shareholders, securities trading activities, portfolio valuation services, auditing services, and legal and operational compliance activities. Certain aspects of shareholder and transfer agency service level efficiency and the quality of securities trading activities are measured by independent third party providers and are presented in comparison to other fund groups not managed by the Advisor. The Board found the services provided by the Advisor to the Fund under the management agreement to be competitive and of high quality.
Costs of Services and Profitability. The Advisor provides detailed information concerning its cost of providing various services to the Fund, its profitability in managing the Fund, its overall profitability, and its financial condition. The Directors have reviewed with the Advisor the methodology used to prepare this financial information. The financial information regarding the Advisor is considered in evaluating the Advisor’s financial condition, its ability to continue to provide services under the management agreement, and the reasonableness of the current management fee. The Board concluded that the Advisor’s profits were reasonable in light of the services provided to the Fund.
Ethics. The Board generally considers the Advisor’s commitment to providing quality services to shareholders and to conducting its business ethically. They noted that the Advisor’s practices generally meet or exceed industry best practices.
Economies of Scale. The Board also reviewed information provided by the Advisor regarding the possible existence of economies of scale in connection with the management of the Fund. The Board concluded that economies of scale are difficult to measure and predict with precision, especially on a fund-by-fund basis. The Board concluded that the Advisor is appropriately sharing economies of scale through its competitive fee structure, offering competitive fees from fund inception, and through reinvestment in its business to provide shareholders additional content and services.
Comparison to Other Funds’ Fees. The management agreement provides that the Fund pay the Advisor a single, all-inclusive (or unified) management fee for providing all services necessary for the management and operation of the Fund, other than brokerage expenses, taxes, interest, extraordinary expenses, and the fees and expenses of the Fund’s independent directors (including their independent legal counsel) and expenses incurred in connection with the provision of shareholder services and distribution services under a plan adopted pursuant to Rule 12b-1 under the 1940 Act. Under the unified fee structure, the Advisor is responsible for providing all investment advisory, custody, audit, administrative, compliance, recordkeeping, marketing and shareholder services, or arranging and supervising third parties to provide such services. By contrast, most other funds are charged a variety of fees, including an investment advisory fee, a transfer agency fee, an administrative fee, distribution charges and other expenses. Other than their investment advisory fees and any applicable Rule 12b-1 distribution fees, all other components of the total fees charged by these other funds may be increased without shareholder approval. The Board believes the unified fee structure is a benefit to Fund shareholders because it clearly discloses to shareholders the cost of owning Fund shares, and, since the unified fee cannot be increased without a vote of Fund shareholders, it shifts to the Advisor the risk of increased costs of operating the Fund and provides a direct incentive to minimize administrative inefficiencies. Part of the Board’s analysis of fee levels involves reviewing certain evaluative data compiled by an independent provider and comparing the Fund’s unified fee to the total expense ratio of other funds in the Fund’s peer group. The Board concluded that the management fee paid by the Fund to the Advisor under the management agreement is reasonable in light of the services provided to the Fund.
Comparison to Fees and Services Provided to Other Clients of the Advisor. The Board also requested and received information from the Advisor concerning the nature of the services, fees, costs and profitability of its advisory services to advisory clients other than the Fund. They observed that these varying types of client accounts require different services and involve different regulatory and entrepreneurial risks than the management of the Fund. The Board analyzed this information and concluded that the fees charged and services provided to the Fund were reasonable by comparison.
Collateral or “Fall-Out” Benefits Derived by the Advisor. The Board considered the existence of collateral benefits the Advisor may receive as a result of its relationship with the Fund. They concluded that the Advisor’s primary business is managing mutual funds and it generally does not use fund or shareholder information to generate profits in other lines of business, and therefore does not derive any significant collateral benefits from them. The Board noted that the Advisor receives proprietary research from broker-dealers that execute fund portfolio transactions and concluded that this research is likely to benefit Fund shareholders. The Board also determined that the Advisor is able to provide investment management services to certain clients other than the Fund, at least in part, due to its existing infrastructure built to serve the fund complex. The Board concluded, however, that the assets of those other clients are not material to the analysis and, where applicable, may be included with the assets of the Fund to determine breakpoints in the management fee schedule.
Existing Relationship. The Board also considered whether there was any reason for not continuing the existing arrangement with the Advisor. In this regard, the Board was mindful of the potential disruptions of the Fund’s operations and various risks, uncertainties, and other effects that could occur as a result of a decision not to continue such relationship. In particular, the Board recognized that most shareholders have invested in the Fund on the strength of the Advisor’s industry standing and reputation and in the expectation that the Advisor will have a continuing role in providing advisory services to the Fund.
Conclusion of the Directors. As a result of this process, the Board, including all of the independent directors and assisted by the advice of independent legal counsel, taking into account all of the factors discussed above and the information provided by the Advisor and others, concluded that the management agreement between the Fund and the Advisor is fair and reasonable in light of the services provided and should be renewed.
Retirement Account Information
As required by law, distributions you receive from certain IRAs are subject to federal income tax withholding, unless you elect not to have withholding apply. Tax will be withheld on the total amount withdrawn even though you may be receiving amounts that are not subject to withholding, such as nondeductible contributions. In such case, excess amounts of withholding could occur. You may adjust your withholding election so that a greater or lesser amount will be withheld.
If you don’t want us to withhold on this amount, you must notify us to not withhold the federal income tax. You may notify us in writing or in certain situations by telephone or through other electronic means. For systematic withdrawals, your withholding election will remain in effect until revoked or changed by filing a new election. You have the right to revoke your election at any time.
Remember, even if you elect not to have income tax withheld, you are liable for paying income tax on the taxable portion of your withdrawal. If you elect not to have income tax withheld or you don’t have enough income tax withheld, you may be responsible for payment of estimated tax. You may incur penalties under the estimated tax rules if your withholding and estimated tax payments are not sufficient. You can reduce or defer the income tax on a distribution by directly or indirectly rolling such distribution over to another IRA or eligible plan. You should consult your tax advisor for additional information.
State tax will be withheld if, at the time of your distribution, your address is within one of the mandatory withholding states and you have federal income tax withheld (or as otherwise required by state law). State taxes will be withheld from your distribution in accordance with the respective state rules.
Distributions you receive from 403(b), 457 and qualified plans are subject to special tax and withholding rules. Your plan administrator or plan sponsor is required to provide you with a special tax notice explaining those rules at the time you request a distribution. If applicable, federal and/or state taxes may be withheld from your distribution amount.
Proxy Voting Guidelines
American Century Investment Management, Inc., the fund’s investment advisor, is responsible for exercising the voting rights associated with the securities purchased and/or held by the fund. A description of the policies and procedures the advisor uses in fulfilling this responsibility is available without charge, upon request, by calling 1-800-345-2021. It is also available on American Century Investments’ website at americancentury.com and on the Securities and Exchange Commission’s website at sec.gov. Information regarding how the investment advisor voted proxies relating to portfolio securities during the most recent 12-month period ended June 30 is available on the “About Us” page at americancentury.com. It is also available at sec.gov.
Quarterly Portfolio Disclosure
The fund files its complete schedule of portfolio holdings with the Securities and Exchange Commission (SEC) for the first and third quarters of each fiscal year on Form N-Q. The fund’s Forms N-Q are available on the SEC’s website at sec.gov, and may be reviewed and copied at the SEC’s Public Reference Room in Washington, DC. Information on the operation of the Public Reference Room may be obtained by calling 1-800-SEC-0330. The fund also makes its complete schedule of portfolio holdings for the most recent quarter of its fiscal year available on its website at americancentury.com and, upon request, by calling 1-800-345-2021.
Other Tax Information
The following information is provided pursuant to provisions of the Internal Revenue Code.
The fund hereby designates up to the maximum amount allowable as qualified dividend income for the fiscal year ended June 30, 2013.
For corporate taxpayers, the fund hereby designates $2,374,794, or up to the maximum amount allowable, of ordinary income distributions paid during the fiscal year ended June 30, 2013 as qualified for the corporate dividends received deduction.
Contact Us | americancentury.com |
Automated Information Line | 1-800-345-8765 |
Investor Services Representative | 1-800-345-2021
or 816-531-5575 |
Investors Using Advisors | 1-800-378-9878 |
Business, Not-For-Profit, Employer-Sponsored Retirement Plans | 1-800-345-3533 |
Banks and Trust Companies, Broker-Dealers, Financial Professionals, Insurance Companies | 1-800-345-6488 |
Telecommunications Device for the Deaf | 1-800-634-4113 |
American Century Quantitative Equity Funds, Inc.
Investment Advisor:
American Century Investment Management, Inc.
Kansas City, Missouri
This report and the statements it contains are submitted for the general information of our shareholders. The report is not authorized for distribution to prospective investors unless preceded or accompanied by an effective prospectus.
©2013 American Century Proprietary Holdings, Inc. All rights reserved.
CL-ANN-79317 1308
ANNUAL REPORT | JUNE 30, 2013 |
Strategic Inflation Opportunities Fund
President’s Letter | 2 |
Market Perspective | 3 |
Performance | 4 |
Portfolio Commentary | 6 |
Fund Characteristics | 8 |
Shareholder Fee Example | 9 |
Schedule of Investments | 11 |
Statement of Assets and Liabilities | 21 |
Statement of Operations | 22 |
Statement of Changes in Net Assets | 23 |
Notes to Financial Statements | 24 |
Financial Highlights | 32 |
Report of Independent Registered Public Accounting Firm | 34 |
Management | 35 |
Approval of Management Agreement | 38 |
Additional Information | 43 |
Any opinions expressed in this report reflect those of the author as of the date of the report, and do not necessarily represent the opinions of American Century Investments® or any other person in the American Century Investments organization. Any such opinions are subject to change at any time based upon market or other conditions and American Century Investments disclaims any responsibility to update such opinions. These opinions may not be relied upon as investment advice and, because investment decisions made by American Century Investments funds are based on numerous factors, may not be relied upon as an indication of trading intent on behalf of any American Century Investments fund. Security examples are used for representational purposes only and are not intended as recommendations to purchase or sell securities. Performance information for comparative indices and securities is provided to American Century Investments by third party vendors. To the best of American Century Investments’ knowledge, such information is accurate at the time of printing.
Jonathan Thomas
Dear Investor:
Thank you for reviewing this annual report for the 12 months ended June 30, 2013. It provides investment performance, market analysis, and portfolio information, presented with the expert perspective of our portfolio management team.
Annual reports remain important vehicles for conveying information about fund returns, including key factors that affected fund performance. For additional, updated investment and market insights, we encourage you to visit our website, americancentury.com.
Generally Favorable Fiscal-Year Returns for U.S. Stocks and High-Yield Bonds
The 12-month reporting period began in the summer of 2012 with uncertainties caused by slowing economies, as well as the upcoming November elections and year-end fiscal deadlines in the U.S. It ended with more uncertainty about the future of U.S. monetary stimulus. In between, aggressive monetary intervention by central banks encouraged investors to take more risk, generally boosting stocks at the expense of government bonds.
U.S. mid-cap, small-cap, and value stock indices achieved performance leadership during the period, outpacing the S&P 500 Index’s 20.60% return. U.S. stocks generally outperformed non-U.S. equities—the MSCI EAFE Index returned 18.62% and the MSCI Emerging Markets Index advanced 2.87%, affected by slowing growth in emerging market economies.
Slower emerging market growth also hindered commodity price gains and helped keep inflation under control. As a result, assets used as inflation hedges, including inflation-indexed securities and precious metals, lagged other assets. Gold, in particular, plunged, starting last October. And Treasury inflation-protected securities (TIPS) were among the lowest performers in the U.S. bond market. Bond index returns generally ranged from approximately 10% gains for U.S. corporate high-yield indices all the way down to negative returns for longer-maturity global Treasury benchmarks.
Despite signs of improvement in 2013, U.S. economic growth is subpar compared with past recession recoveries, and remains vulnerable to threats that could trigger another slowdown and market volatility. Therefore, we continue to believe in a disciplined, diversified, long-term investment approach, using professionally managed stock and bond portfolios—as appropriate—for meeting financial goals. We appreciate your continued trust in us in this volatile environment.
Sincerely,
Jonathan Thomas
President and Chief Executive Officer
American Century Investments
By Scott Wittman, Chief Investment Officer, Asset Allocation and Quantitative Equity
Slow Growth Led to Muted Inflation
A combination of slow global growth and lingering political and economic uncertainties that continued to constrain economic activity helped stifle near-term inflationary pressures for the 12-month period ended June 30, 2013. With inflationary factors relatively tame, inflation-sensitive assets generated low to sharply negative results for the 12-month period.
The world’s leading central banks—including the European Central Bank (ECB), the U.S. Federal Reserve (the Fed), and the Bank of Japan—maintained aggressive stimulus programs throughout the period. These programs enhanced market liquidity, drove down interest rates, and generally encouraged risk-taking among investors. At the same time, these massive and unprecedented stimulus efforts continued to expand the global money supply and heighten the risk for higher long-term inflation.
Near-term inflation, though, was modest and remained below Fed targets. For example, the 12-month change in U.S. inflation was 1.8% at the end of June 2013, according to the Consumer Price Index (CPI). In June 2012, the 12-month CPI was 1.7%.
Fed Comments Sparked Dollar Rally, Broad Financial Markets Sell-off
Late in the period, comments from the Fed about potentially winding down quantitative easing (its $85 billion monthly bond-buying program) later in 2013 triggered a widespread sell-off in the global financial markets. The potential for less market liquidity and higher U.S. interest rates caused the U.S. dollar to strengthen versus most currencies. A stronger dollar makes goods priced in dollars, including commodities, less expensive to U.S. buyers. Most commodities priced in dollars plunged in value following the Fed’s comments, including silver and gold, which were among the hardest-hit.
Meanwhile, the Fed’s tapering talk—and the prospect for higher interest rates—also drove down returns in the global bond markets. In particular, U.S. Treasury Inflation Protected Securities (TIPS) and emerging market bonds suffered steep losses—TIPS due to their longer duration (price sensitivity to interest rate changes) and less liquidity than nominal Treasuries, and emerging market bonds because of the prospect for reduced market liquidity from the Fed.
12-Month Total Returns |
As of June 30, 2013 |
S&P Goldman Sachs Commodities Index (total returns) | 2.04% |
London Gold PM Fix, in U.S. dollars | -25.43% |
Barclays Global Treasury ex-U.S. Bond Index | -5.92% |
Barclays U.S. Treasury Inflation Protected Securities (TIPS) Index | -4.78% |
Barclays U.S. 1-3 Month Treasury Bill Index | 0.08% |
U.S. Dollar (Dollar Spot Index) | 1.85% |
Total Returns as of June 30, 2013 |
| | | | Average
Annual Returns | |
| | Ticker
Symbol | 1 year | Since
Inception | Inception
Date |
Investor Class | ASIOX | -0.70% | 0.53%(1) | 4/30/10 |
Barclays U.S. 1-3 Month
Treasury Bill Index | — | 0.08% | 0.09% | — |
Institutional Class | ASINX | -0.40% | 0.73%(1) | 4/30/10 |
A Class No sales charge* With sales charge* | ASIDX | -1.00% -6.71% | 0.26%(1) -1.60%(1) | 4/30/10 |
C Class | ASIZX | -1.62% | -0.49%(1) | 4/30/10 |
R Class | ASIUX | -1.11% | 0.02%(1) | 4/30/10 |
* Sales charges include initial sales charges and contingent deferred sales charges (CDSCs), as applicable. A Class shares have a 5.75% maximum initial sales charge and may be subject to a maximum CDSC of 1.00%. C Class shares redeemed within 12 months of purchase are subject to a maximum CDSC of 1.00%. The SEC requires that mutual funds provide performance information net of maximum sales charges in all cases where charges could be applied.
(1) | Returns would have been lower if a portion of the management fee had not been waived. |
Data presented reflect past performance. Past performance is no guarantee of future results. Current performance may be higher or lower than the performance shown. Investment return and principal value will fluctuate, and redemption value may be more or less than original cost. To obtain performance data current to the most recent month end, please call 1-800-345-2021 or visit americancentury.com. As interest rates rise, bond values will decline. International investing involves special risks, such as political instability and currency fluctuations. Investing in emerging markets may accentuate these risks. There are certain risks involved in investing in forward foreign currency exchange contracts; changes in the value of foreign currencies against the U.S. dollar could result in losses to the fund. Commodity- and gold-related investing involves special risks, such as weather, disease, embargoes, tariffs, taxes and economic, political and regulatory developments. The fund may be subject to certain risks similar to those associated with direct investment in real estate.
Unless otherwise indicated, performance reflects Investor Class shares; performance for other share classes will vary due to differences in fee structure. For information about other share classes available, please consult the prospectus. Data assumes reinvestment of dividends and capital gains, and none of the charts reflect the deduction of taxes that a shareholder would pay on fund distributions or the redemption of fund shares. Returns for the index are provided for comparison. The fund’s total returns include operating expenses (such as transaction costs and management fees) that reduce returns, while the total returns of the index do not.
Growth of $10,000 Over Life of Class |
$10,000 investment made April 30, 2010 |
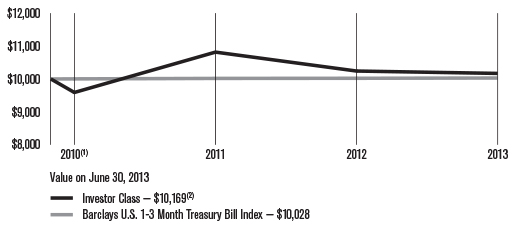
(1) | From 4/30/10, the Investor Class’s inception date. Not annualized. |
(2) | Ending value would have been lower if a portion of the management fee had not been waived. |
Total Annual Fund Operating Expenses |
Investor Class | Institutional Class | A Class | C Class | R Class |
1.19% | 0.99% | 1.44% | 2.19% | 1.69% |
The total annual fund operating expenses shown is as stated in the fund’s prospectus current as of the date of this report. The prospectus may vary from the expense ratio shown elsewhere in this report because it is based on a different time period, includes acquired fund fees and expenses, and, if applicable, does not include fee waivers or expense reimbursements.
Data presented reflect past performance. Past performance is no guarantee of future results. Current performance may be higher or lower than the performance shown. Investment return and principal value will fluctuate, and redemption value may be more or less than original cost. To obtain performance data current to the most recent month end, please call 1-800-345-2021 or visit americancentury.com. As interest rates rise, bond values will decline. International investing involves special risks, such as political instability and currency fluctuations. Investing in emerging markets may accentuate these risks. There are certain risks involved in investing in forward foreign currency exchange contracts; changes in the value of foreign currencies against the U.S. dollar could result in losses to the fund. Commodity- and gold-related investing involves special risks, such as weather, disease, embargoes, tariffs, taxes and economic, political and regulatory developments. The fund may be subject to certain risks similar to those associated with direct investment in real estate.
Unless otherwise indicated, performance reflects Investor Class shares; performance for other share classes will vary due to differences in fee structure. For information about other share classes available, please consult the prospectus. Data assumes reinvestment of dividends and capital gains, and none of the charts reflect the deduction of taxes that a shareholder would pay on fund distributions or the redemption of fund shares. Returns for the index are provided for comparison. The fund’s total returns include operating expenses (such as transaction costs and management fees) that reduce returns, while the total returns of the index do not.
Portfolio Managers: Bob Gahagan, Bill Martin, Brian Howell, John Lovito and Steven Brown
Performance Summary
For the 12 months ended June 30, 2013, Strategic Inflation Opportunities declined -0.70%.* The portfolio’s benchmark, the Barclays U.S. 1-3 Month Treasury Bill Index, advanced 0.08% during the same period.
In general, global economic growth and inflation remained relatively subdued during the 12-month period, despite continued intervention from the world’s leading central banks. Central bank action did have a notable influence on global equity markets, which benefited, in part, from heightened risk-taking that the central banks’ programs inspired. Meanwhile, other asset classes, including Treasury inflation-protected securities (TIPS), foreign currencies, and commodity-related investments, didn’t fare as well, tumbling sharply during the Federal Reserve’s (the Fed’s) tapering-inspired sell-off late in the period. Lagging performance from these assets primarily drove the portfolio’s underperformance relative to its Treasury bill benchmark.
Current Inflation Remained Slow
Current inflation was tame as commodity prices generally increased modestly (+2.04%, according to the S&P Goldman Sachs Commodities Index, a measure of global commodities prices) during the 12-month period. Within the commodities market, though, there was wide disparity in performance. For example, energy prices moved higher, with Brent oil increasing 4%, and West Texas Intermediate crude futures climbing 13%. Meanwhile, industrial and precious metals and certain agricultural commodities tumbled during the period. Gold bullion declined more than 25%, due to waning demand, which was triggered by a combination of a stronger U.S. dollar (gold is priced in dollars, so a stronger dollar makes it more expensive for foreign buyers), weaker economic growth in the emerging markets, and muted inflation (as opposed to the rising inflation that often triggers demand for gold from investors looking to hedge against
the threat).
Inflation Outlook Tempered
Longer-term inflation expectations declined slightly during the period, according to one market indicator. The yield difference (or breakeven rate) between 10-year TIPS and nominal 10-year Treasuries declined from 2.10 percentage points at the end of June 2012 to 1.99 percentage points at the end of June 2013. Theoretically, the 10-year breakeven rate reflects the market’s expectations for inflation for the next 10 years and also reflects the inflation rate required for TIPS to outperform nominal Treasuries during that period.
Portfolio Positioning & Strategy
Strategic Inflation Opportunities’ neutral asset mix as of June 30, 2013, was 45% inflation-linked bonds, 25% non-dollar investments, 15% commodity-related investments, 10% global real estate investment trusts (REITs), and 5% gold securities that track the price of gold bullion, including gold exchange-traded
*All fund returns referenced in this commentary are for Investor Class shares.
funds (ETFs). The portfolio’s actual asset weightings varied based on short-term tactical adjustments and fluctuating securities prices. The portfolio’s investment team makes modest tactical adjustments to its asset mix in an effort to add value and improve the portfolio’s ability to meet its investment objective. Late in the period, the team added strategic exposure to global REITs and gold securities—asset classes previously available only on a tactical basis. The team believes this change will improve the portfolio’s long-term risk-adjusted return profile through a more-diversified strategic allocation.
Within the portfolio’s inflation-linked securities allocation, TIPS underperformed the benchmark and detracted from the portfolio’s relative performance. As the period progressed, and longer-term inflation expectations waned, the investment team reduced its exposure to TIPS. The team is looking to increase TIPS exposure if breakeven rates continue to move lower to a better entry point. The portfolio also held higher-yielding mortgage-backed securities and investment-grade and high-yield corporate bonds in conjunction with inflation “swaps” (inflation-linked overlays for corporate and mortgage securities), which also declined, as inflation-linked securities generally lagged the portfolio’s benchmark.
Within the commodities-related component, the portfolio was invested in common stocks, commodity ETFs, and gold-related securities (such as holdings in mining companies). This exposure generated mixed results for the period. Energy-related stocks generally outperformed, while positions in the metals and mining industry weighed on results. The portfolio ended the period with overweight positions in energy and agriculture companies and underweight positions in industrial metals, livestock, and precious metals, relative to its neutral asset mix.
A small weighting to global REITs contributed positively to performance, as the global real estate environment generally improved throughout the period. At the end of June 2013, the portfolio was underweight mortgage and health care REITs and overweight lodging, retail and diversified REITs, relative to its neutral asset mix. Meanwhile, exposure to securities that track the price of gold bullion, including gold ETFs, detracted from portfolio performance.
The team continued to favor currencies of countries with higher growth potential and economies tied to commodity prices, including Canada, Norway, Australia, and New Zealand. Though currency values varied widely during the period and the U.S. dollar generally strengthened, the team’s selection and allocation decisions among currencies contributed to performance. By the end of the period, the portfolio’s largest currency overweight positions relative to the team’s neutral targets were in the Norwegian krone and Canadian dollar; the Japanese yen was the largest underweight stake.
Outlook
The portfolio’s investment team expects near-term inflation to remain contained. Longer term, record federal debt and the Fed’s aggressive monetary policy and stimulus programs eventually may result in higher inflation than what is currently priced into the Treasury market. The team believes this scenario underscores the importance of securing potential inflation hedges and protecting purchasing power through investments in inflation-fighting portfolios, such as Strategic Inflation Opportunities.
JUNE 30, 2013 | |
Types of Investments in Portfolio | % of net assets |
U.S. Treasury Securities | 31.5% |
Domestic Common Stocks | 14.0% |
Foreign Common Stocks | 8.4% |
Commercial Paper | 10.4% |
Exchange-Traded Funds | 9.3% |
Corporate Bonds | 3.3% |
Collateralized Mortgage Obligations | 3.0% |
Commercial Mortgage-Backed Securities | 2.2% |
Rights | —* |
Warrants | —* |
Temporary Cash Investments | 18.4% |
Other Assets and Liabilities | (0.5)% |
*Category is less than 0.05% of total net assets.
Fund shareholders may incur two types of costs: (1) transaction costs, including sales charges (loads) on purchase payments and redemption/exchange fees; and (2) ongoing costs, including management fees; distribution and service (12b-1) fees; and other fund expenses. This example is intended to help you understand your ongoing costs (in dollars) of investing in your fund and to compare these costs with the ongoing cost of investing in other mutual funds.
The example is based on an investment of $1,000 made at the beginning of the period and held for the entire period from January 1, 2013 to June 30, 2013.
Actual Expenses
The table provides information about actual account values and actual expenses for each class. You may use the information, together with the amount you invested, to estimate the expenses that you paid over the period. First, identify the share class you own. Then simply divide your account value by $1,000 (for example, an $8,600 account value divided by $1,000 = 8.6), then multiply the result by the number under the heading “Expenses Paid During Period” to estimate the expenses you paid on your account during this period.
If you hold Investor Class shares of any American Century Investments fund, or Institutional Class shares of the American Century Diversified Bond Fund, in an American Century Investments account (i.e., not a financial intermediary or retirement plan account), American Century Investments may charge you a $12.50 semiannual account maintenance fee if the value of those shares is less than $10,000. We will redeem shares automatically in one of your accounts to pay the $12.50 fee. In determining your total eligible investment amount, we will include your investments in all personal accounts (including American Century Investments Brokerage accounts) registered under your Social Security number. Personal accounts include individual accounts, joint accounts, UGMA/UTMA accounts, personal trusts, Coverdell Education Savings Accounts and IRAs (including traditional, Roth, Rollover, SEP-, SARSEP- and SIMPLE-IRAs), and certain other retirement accounts. If you have only business, business retirement, employer-sponsored or American Century Investments Brokerage accounts, you are currently not subject to this fee. If you are subject to the Account Maintenance Fee, your account value could be reduced by the fee amount.
Hypothetical Example for Comparison Purposes
The table also provides information about hypothetical account values and hypothetical expenses based on the actual expense ratio of each class of your fund and an assumed rate of return of 5% per year before expenses, which is not the actual return of a fund’s share class. The hypothetical account values and expenses may not be used to estimate the actual ending account balance or expenses you paid for the period. You may use this information to compare the ongoing costs of investing in your fund and other funds. To do so, compare this 5% hypothetical example with the 5% hypothetical examples that appear in the shareholder reports of the other funds.
Please note that the expenses shown in the table are meant to highlight your ongoing costs only and do not reflect any transactional costs, such as sales charges (loads) or redemption/exchange fees. Therefore, the table is useful in comparing ongoing costs only, and will not help you determine the relative total costs of owning different funds. In addition, if these transactional costs were included, your costs would have been higher.| | | | | |
| | Beginning
Account Value 1/1/13 | Ending
Account Value 6/30/13 | Expenses Paid During Period(1) 1/1/13 – 6/30/13 | Annualized
Expense Ratio(1) |
Actual | | | | |
Investor Class | $1,000 | $955.70 | $5.29 | 1.09% |
Institutional Class | $1,000 | $956.70 | $4.32 | 0.89% |
A Class | $1,000 | $953.60 | $6.49 | 1.34% |
C Class | $1,000 | $951.20 | $10.11 | 2.09% |
R Class | $1,000 | $953.40 | $7.70 | 1.59% |
Hypothetical | | | | |
Investor Class | $1,000 | $1,019.39 | $5.46 | 1.09% |
Institutional Class | $1,000 | $1,020.38 | $4.46 | 0.89% |
A Class | $1,000 | $1,018.15 | $6.71 | 1.34% |
C Class | $1,000 | $1,014.43 | $10.44 | 2.09% |
R Class | $1,000 | $1,016.91 | $7.95 | 1.59% |
(1) | Expenses are equal to the class’s annualized expense ratio listed in the table above, multiplied by the average account value over the period, multiplied by 181, the number of days in the most recent fiscal half-year, divided by 365, to reflect the one-half year period. |
JUNE 30, 2013
| | | Principal Amount/ Shares | | | Value | |
U.S. Treasury Securities — 31.5% | |
U.S. Treasury Inflation Indexed Notes, 1.25%, 4/15/14 | | $1,098,750 | | | $1,114,373 | |
U.S. Treasury Inflation Indexed Notes, 0.50%, 4/15/15(1) | | 702,808 | | | 720,708 | |
U.S. Treasury Inflation Indexed Notes, 2.00%, 1/15/16 | | 3,662,328 | | | 3,934,999 | |
U.S. Treasury Inflation Indexed Notes, 0.125%, 4/15/16 | | 3,450,082 | | | 3,540,108 | |
U.S. Treasury Inflation Indexed Notes, 2.50%, 7/15/16 | | 944,164 | | | 1,044,187 | |
U.S. Treasury Inflation Indexed Notes, 2.375%, 1/15/17 | | 3,920,404 | | | 4,346,442 | |
U.S. Treasury Inflation Indexed Notes, 0.125%, 4/15/17 | | 10,237,800 | | | 10,508,539 | |
U.S. Treasury Inflation Indexed Notes, 2.625%, 7/15/17 | | 841,463 | | | 954,798 | |
TOTAL U.S. TREASURY SECURITIES (Cost $26,556,502) | | | 26,164,154 | |
Common Stocks — 22.4% | |
CHEMICALS — 0.1% | |
CF Industries Holdings, Inc. | | 101 | | | 17,321 | |
Monsanto Co. | | 196 | | | 19,365 | |
Mosaic Co. (The) | | 326 | | | 17,542 | |
Potash Corp. of Saskatchewan, Inc. | | 467 | | | 17,807 | |
| | | | | | 72,035 | |
CONSTRUCTION MATERIALS — 0.1% | |
Martin Marietta Materials, Inc. | | 146 | | | 14,369 | |
Vulcan Materials Co. | | 1,021 | | | 49,427 | |
| | | | | | 63,796 | |
CONTAINERS AND PACKAGING — 0.1% | |
Crown Holdings, Inc.(2) | | 367 | | | 15,095 | |
MeadWestvaco Corp. | | 1,403 | | | 47,856 | |
Owens-Illinois, Inc.(2) | | 572 | | | 15,896 | |
Sealed Air Corp. | | 657 | | | 15,735 | |
| | | | | | 94,582 | |
ENERGY EQUIPMENT AND SERVICES — 1.4% | |
Baker Hughes, Inc. | | 2,159 | | | 99,595 | |
Calfrac Well Services Ltd. | | 652 | | | 18,790 | |
Ensco plc, Class A | | 940 | | | $54,633 | |
Halliburton Co. | | 5,096 | | | 212,605 | |
Nabors Industries Ltd. | | 2,435 | | | 37,280 | |
National Oilwell Varco, Inc. | | 2,013 | | | 138,696 | |
Noble Corp. | | 1,464 | | | 55,017 | |
Oceaneering International, Inc. | | 725 | | | 52,345 | |
Patterson-UTI Energy, Inc. | | 2,140 | | | 41,420 | |
Rowan Cos. plc(2) | | 364 | | | 12,401 | |
Schlumberger Ltd. | | 5,077 | | | 363,818 | |
Tidewater, Inc. | | 773 | | | 44,038 | |
Weatherford International Ltd.(2) | | 3,780 | | | 51,786 | |
| | | | | | 1,182,424 | |
HEALTH CARE PROVIDERS AND SERVICES — 0.3% | |
Brookdale Senior Living, Inc.(2) | | 9,276 | | | 245,257 | |
HOTELS, RESTAURANTS AND LEISURE — 1.1% | |
Galaxy Entertainment Group Ltd.(2) | | 23,000 | | | 112,686 | |
Las Vegas Sands Corp. | | 2,860 | | | 151,380 | |
Sands China Ltd. | | 25,600 | | | 120,639 | |
Starwood Hotels & Resorts Worldwide, Inc. | | 3,916 | | | 247,452 | |
Wyndham Worldwide Corp. | | 4,431 | | | 253,586 | |
| | | | | | 885,743 | |
HOUSEHOLD DURABLES — 0.2% | |
Sekisui House Ltd. | | 4,000 | | | 57,834 | |
Taylor Wimpey plc | | 79,756 | | | 116,150 | |
| | | | | | 173,984 | |
METALS AND MINING — 0.6% | |
B2Gold Corp.(2) | | 9,478 | | | 20,187 | |
Barrick Gold Corp. | | 1,530 | | | 24,082 | |
Franco-Nevada Corp. | | 1,218 | | | 43,603 | |
Freeport-McMoRan Copper & Gold, Inc. | | 4,167 | | | 115,051 | |
Goldcorp, Inc. New York Shares | | 3,419 | | | 84,552 | |
Kinross Gold Corp. New York Shares | | 2,221 | | | 11,327 | |
New Gold, Inc.(2) | | 1,840 | | | 11,915 | |
Newmont Mining Corp. | | 555 | | | 16,622 | |
Randgold Resources Ltd. ADR | | 245 | | | 15,692 | |
Royal Gold, Inc. | | 689 | | | 28,993 | |
Sandstorm Gold Ltd.(2) | | 4,225 | | | 24,787 | |
Silver Wheaton Corp. | | 938 | | | 18,451 | |
| | | | | | | |
| | | Principal Amount/ Shares | | | Value | |
Tahoe Resources, Inc.(2) | | 1,686 | | | $23,903 | |
Teck Resources Ltd. | | 1,063 | | | 22,716 | |
Yamana Gold, Inc. New York Shares | | 2,500 | | | 23,775 | |
| | | | | | 485,656 | |
OIL, GAS AND CONSUMABLE FUELS — 5.2% | |
Alpha Natural Resources, Inc.(2) | | 2,338 | | | 12,251 | |
Anadarko Petroleum Corp. | | 2,176 | | | 186,984 | |
Apache Corp. | | 1,495 | | | 125,326 | |
Cabot Oil & Gas Corp. | | 924 | | | 65,623 | |
Canadian Natural Resources Ltd. | | 2,590 | | | 73,193 | |
Cheniere Energy, Inc.(2) | | 1,820 | | | 50,523 | |
Chesapeake Energy Corp. | | 3,235 | | | 65,929 | |
Chevron Corp. | | 4,426 | | | 523,773 | |
Cimarex Energy Co. | | 499 | | | 32,430 | |
Cobalt International Energy, Inc.(2) | | 755 | | | 20,060 | |
ConocoPhillips | | 3,994 | | | 241,637 | |
Continental Resources, Inc.(2) | | 221 | | | 19,019 | |
Denbury Resources, Inc.(2) | | 1,763 | | | 30,535 | |
Devon Energy Corp. | | 1,912 | | | 99,195 | |
Encana Corp. | | 4,209 | | | 71,300 | |
Energy Transfer Equity LP | | 666 | | | 39,840 | |
Energy Transfer Partners LP | | 521 | | | 26,331 | |
Enterprise Products Partners LP | | 545 | | | 33,872 | |
EOG Resources, Inc. | | 1,314 | | | 173,028 | |
Exxon Mobil Corp. | | 6,034 | | | 545,172 | |
Hess Corp. | | 1,503 | | | 99,934 | |
Kinder Morgan, Inc. | | 3,254 | | | 124,140 | |
Marathon Oil Corp. | | 3,329 | | | 115,117 | |
Marathon Petroleum Corp. | | 1,373 | | | 97,565 | |
Newfield Exploration Co.(2) | | 732 | | | 17,487 | |
Noble Energy, Inc. | | 1,470 | | | 88,259 | |
Occidental Petroleum Corp. | | 3,254 | | | 290,354 | |
Peabody Energy Corp. | | 1,386 | | | 20,291 | |
Peyto Exploration & Development Corp. | | 1,040 | | | 30,062 | |
Phillips 66 | | 2,448 | | | 144,212 | |
Pioneer Natural Resources Co. | | 429 | | | 62,098 | |
Plains All American Pipeline LP | | 578 | | | 32,258 | |
Range Resources Corp. | | 879 | | | 67,964 | |
Southwestern Energy Co.(2) | | 1,320 | | | 48,220 | |
Spectra Energy Corp. | | 2,936 | | | 101,175 | |
StealthGas, Inc.(2) | | 3,095 | | | 34,045 | |
Suncor Energy, Inc. | | 5,440 | | | 160,426 | |
Talisman Energy, Inc., New York Shares | | 4,292 | | | 49,058 | |
Tesoro Corp. | | 432 | | | 22,602 | |
Ultra Petroleum Corp.(2) | | 1,179 | | | 23,368 | |
Valero Energy Corp. | | 2,643 | | | 91,897 | |
Veresen, Inc. | | 2,557 | | | 30,318 | |
Whiting Petroleum Corp.(2) | | 841 | | | 38,762 | |
Williams Cos., Inc. (The) | | 2,623 | | | 85,169 | |
WPX Energy, Inc.(2) | | 1,796 | | | 34,016 | |
| | | | | | 4,344,818 | |
PAPER AND FOREST PRODUCTS — 0.2% | |
Domtar Corp. | | 706 | | | 46,949 | |
International Paper Co. | | 1,066 | | | 47,234 | |
Louisiana-Pacific Corp.(2) | | 2,690 | | | 39,785 | |
| | | | | | 133,968 | |
REAL ESTATE INVESTMENT TRUSTS (REITs) — 8.4% | |
Apartment Investment & Management Co., Class A | | 10,053 | | | 301,992 | |
Big Yellow Group plc | | 13,719 | | | 80,250 | |
British Land Co. plc | | 11,257 | | | 96,992 | |
Camden Property Trust | | 4,582 | | | 316,799 | |
CapitaMall Trust | | 52,000 | | | 81,846 | |
Charter Hall Group | | 28,524 | | | 100,955 | |
Corio NV | | 2,755 | | | 109,607 | |
DCT Industrial Trust, Inc. | | 38,254 | | | 273,516 | |
DDR Corp. | | 17,450 | | | 290,543 | |
Derwent London plc | | 2,857 | | | 99,943 | |
Douglas Emmett, Inc. | | 11,150 | | | 278,193 | |
Extra Space Storage, Inc. | | 7,173 | | | 300,764 | |
Fibra Uno Administracion SA de CV | | 33,186 | | | 111,436 | |
Gecina SA | | 458 | | | 50,661 | |
GLP J-REIT | | 59 | | | 57,703 | |
Goodman Group | | 34,419 | | | 153,612 | |
Great Portland Estates plc | | 11,786 | | | 95,276 | |
Host Hotels & Resorts, Inc. | | 20,216 | | | 341,044 | |
Japan Real Estate Investment Corp. | | 8 | | | 89,292 | |
Kilroy Realty Corp. | | 5,687 | | | 301,468 | |
Link Real Estate Investment Trust (The) | | 30,500 | | | 150,022 | |
Macerich Co. (The) | | 5,442 | | | 331,799 | |
Mirvac Group | | 93,763 | | | 137,630 | |
Nippon Building Fund, Inc. | | 12 | | | 138,899 | |
Nippon Prologis REIT, Inc. | | 13 | | | 113,118 | |
Post Properties, Inc. | | 5,650 | | | 279,619 | |
| | | | | | | |
| | | Principal Amount/ Shares | | | Value | |
ProLogis, Inc. | | 10,996 | | | $414,769 | |
Simon Property Group, Inc. | | 4,373 | | | 690,584 | |
Taubman Centers, Inc. | | 3,858 | | | 289,929 | |
UDR, Inc. | | 12,667 | | | 322,882 | |
Unibail-Rodamco SE | | 1,227 | | | 285,885 | |
Westfield Group | | 26,773 | | | 280,111 | |
| | | | | | 6,967,139 | |
REAL ESTATE MANAGEMENT AND DEVELOPMENT — 4.7% | |
Aliansce Shopping Centers SA | | 8,500 | | | 72,530 | |
Ayala Land, Inc. | | 159,200 | | | 112,030 | |
BR Malls Participacoes SA | | 2,700 | | | 24,140 | |
Brookfield Asset Management, Inc. Class A | | 9,013 | | | 324,648 | |
Brookfield Office Properties, Inc. | | 7,438 | | | 124,066 | |
Capital & Counties Properties plc | | 18,017 | | | 89,608 | |
CapitaLand Ltd. | | 43,000 | | | 104,489 | |
Central Pattana PCL | | 49,200 | | | 71,385 | |
Cheung Kong Holdings Ltd. | | 11,000 | | | 149,200 | |
China Overseas Grand Oceans Group Ltd. | | 50,000 | | | 63,821 | |
China Overseas Land & Investment Ltd. | | 40,000 | | | 104,950 | |
China Resources Land Ltd. | | 36,000 | | | 98,401 | |
Corp. Inmobiliaria Vesta SAB de CV | | 18,436 | | | 36,566 | |
Country Garden Holdings Co. | | 170,000 | | | 88,989 | |
Countrywide plc(2) | | 13,856 | | | 106,425 | |
Daiwa House Industry Co. Ltd. | | 7,000 | | | 130,641 | |
Forest City Enterprises, Inc. Class A(2) | | 15,354 | | | 274,990 | |
Global Logistic Properties Ltd. | | 71,000 | | | 154,043 | |
Growthpoint Properties Ltd. | | 47,814 | | | 127,648 | |
Huaku Development Co. Ltd. | | 9,000 | | | 25,975 | |
Keppel Land Ltd. | | 25,000 | | | 66,075 | |
Mitsubishi Estate Co. Ltd. | | 9,000 | | | 239,655 | |
Mitsui Fudosan Co. Ltd. | | 11,000 | | | 323,523 | |
PT Ciputra Development Tbk | | 290,000 | | | 39,446 | |
PT Lippo Karawaci Tbk | | 345,000 | | | 52,836 | |
PT Pakuwon Jati Tbk | | 1,099,000 | | | 38,202 | |
Quality Houses PCL NVDR | | 504,600 | | | 50,436 | |
Shimao Property Holdings Ltd. | | 33,000 | | | 65,523 | |
Sumitomo Realty & Development Co. Ltd. | | 5,000 | | | 199,385 | |
Sun Hung Kai Properties Ltd. | | 14,000 | | | 180,685 | |
TAG Immobilien AG | | 3,015 | | | 32,891 | |
Unite Group plc | | 16,280 | | | 89,660 | |
Wharf Holdings Ltd. | | 25,000 | | | 210,158 | |
Wheelock & Co. Ltd. | | 15,000 | | | 75,232 | |
| | | | | | 3,948,252 | |
SPECIALTY RETAIL† | |
CST Brands, Inc.(2) | | 343 | | | 10,568 | |
TOTAL COMMON STOCKS (Cost $17,960,833) | | | 18,608,222 | |
Commercial Paper(3) — 10.4% | |
CRC Funding LLC, 0.24%, 8/7/13(4) | | 2,000,000 | | | 1,999,507 | |
Lexington Parker Capital, 0.17%, 7/8/13(4) | | 2,900,000 | | | 2,899,904 | |
Liberty Street Funding LLC, 0.16%, 7/22/13(4) | | 2,000,000 | | | 1,999,813 | |
Toyota Motor Credit Corp., 0.16%, 8/8/13 | | 1,750,000 | | | 1,749,705 | |
TOTAL COMMERCIAL PAPER (Cost $8,648,929) | | | 8,648,929 | |
Exchange-Traded Funds — 9.3% | |
iShares S&P GSCI Commodity Indexed Trust(2) | | 143,332 | | | 4,414,625 | |
PowerShares DB Commodity Index Tracking Fund(2) | | 36,563 | | | 918,828 | |
SPDR Gold Shares(2) | | 9,778 | | | 1,165,049 | |
Sprott Physical Gold Trust(2) | | 114,147 | | | 1,167,724 | |
TOTAL EXCHANGE-TRADED FUNDS (Cost $8,641,997) | | | 7,666,226 | |
Corporate Bonds — 3.3% | |
AUTO COMPONENTS — 0.1% | |
Visteon Corp., 6.75%, 4/15/19 | | 63,000 | | | 66,623 | |
AUTOMOBILES — 0.2% | |
Ford Motor Credit Co. LLC, 5.625%, 9/15/15 | | 70,000 | | | 75,375 | |
Ford Motor Credit Co. LLC, 5.00%, 5/15/18 | | 100,000 | | | 106,854 | |
| | | | | | 182,229 | |
BEVERAGES† | |
Anheuser-Busch InBev Worldwide, Inc., 5.375%, 1/15/20 | | 30,000 | | | 34,620 | |
CHEMICALS — 0.1% | |
Ashland, Inc., 4.75%, 8/15/22(4) | | 75,000 | | | 74,437 | |
| | | | | | | |
| | | Principal Amount/ Shares | | | Value | |
COMMERCIAL BANKS — 0.1% | |
Capital One Financial Corp., 2.125%, 7/15/14 | | $50,000 | | | $50,596 | |
COMMUNICATIONS EQUIPMENT — 0.2% | |
Crown Castle International Corp., 5.25%, 1/15/23 | | 75,000 | | | 72,281 | |
SBA Communications Corp., 5.625%, 10/1/19(4) | | 75,000 | | | 74,531 | |
| | | | | | 146,812 | |
CONSTRUCTION MATERIALS — 0.1% | |
Covanta Holding Corp., 7.25%, 12/1/20 | | 75,000 | | | 78,993 | |
CONSUMER FINANCE — 0.1% | |
CIT Group, Inc., 4.75%, 2/15/15(4) | | 75,000 | | | 76,406 | |
Credit Suisse (New York), 5.50%, 5/1/14 | | 20,000 | | | 20,819 | |
| | | | | | 97,225 | |
CONTAINERS AND PACKAGING — 0.1% | |
Ardagh Packaging Finance plc, 7.375%, 10/15/17(4) | | 70,000 | | | 75,075 | |
DIVERSIFIED FINANCIAL SERVICES — 0.3% | |
Ally Financial, Inc., 8.30%, 2/12/15 | | 70,000 | | | 75,600 | |
Citigroup, Inc., 6.00%, 12/13/13 | | 60,000 | | | 61,401 | |
Goldman Sachs Group, Inc. (The), 3.625%, 2/7/16 | | 45,000 | | | 46,997 | |
Morgan Stanley, 5.625%, 9/23/19 | | 20,000 | | | 21,515 | |
UBS AG (Stamford Branch), 2.25%, 8/12/13 | | 23,000 | | | 23,046 | |
| | | | | | 228,559 | |
DIVERSIFIED TELECOMMUNICATION SERVICES — 0.1% | |
Cincinnati Bell, Inc., 8.25%, 10/15/17 | | 70,000 | | | 73,325 | |
Windstream Corp., 7.875%, 11/1/17 | | 30,000 | | | 33,075 | |
| | | | | | 106,400 | |
FOOD PRODUCTS† | |
Tyson Foods, Inc., 6.60%, 4/1/16 | | 20,000 | | | 22,602 | |
HEALTH CARE PROVIDERS AND SERVICES — 0.2% | |
DaVita HealthCare Partners, Inc., 6.375%, 11/1/18 | | 25,000 | | | 26,156 | |
Fresenius Medical Care US Finance II, Inc., 5.625%, 7/31/19(4) | | 70,000 | | | 73,150 | |
Universal Health Services, Inc., 7.125%, 6/30/16 | | 40,000 | | | 44,300 | |
| | | | | | 143,606 | |
INDUSTRIAL CONGLOMERATES — 0.1% | |
Bombardier, Inc., 5.75%, 3/15/22(4) | | 70,000 | | | 69,825 | |
INSURANCE — 0.1% | |
International Lease Finance Corp., 4.875%, 4/1/15 | | 70,000 | | | 71,400 | |
IT SERVICES — 0.1% | |
Fidelity National Information Services, Inc., 5.00%, 3/15/22 | | 70,000 | | | 70,525 | |
International Business Machines Corp., 1.95%, 7/22/16 | | 50,000 | | | 51,280 | |
| | | | | | 121,805 | |
MEDIA — 0.2% | |
CCO Holdings LLC/CCO Holdings Capital Corp., 7.25%, 10/30/17 | | 70,000 | | | 74,462 | |
DISH DBS Corp., 7.00%, 10/1/13 | | 50,000 | | | 50,613 | |
Sirius XM Radio, Inc., 8.75%, 4/1/15(4) | | 70,000 | | | 77,350 | |
| | | | | | 202,425 | |
METALS AND MINING† | |
Barrick Gold Corp., 2.90%, 5/30/16 | | 30,000 | | | 29,608 | |
MULTI-UTILITIES — 0.1% | |
Calpine Corp., 7.25%, 10/15/17(4) | | 63,000 | | | 65,993 | |
CMS Energy Corp., 4.25%, 9/30/15 | | 30,000 | | | 31,830 | |
CMS Energy Corp., 8.75%, 6/15/19 | | 25,000 | | | 32,280 | |
| | | | | | 130,103 | |
OIL, GAS AND CONSUMABLE FUELS — 0.5% | |
Alpha Natural Resources, Inc., 6.00%, 6/1/19 | | 70,000 | | | 57,225 | |
Anadarko Petroleum Corp., 5.95%, 9/15/16 | | 20,000 | | | 22,446 | |
Bill Barrett Corp., 7.00%, 10/15/22 | | 75,000 | | | 75,375 | |
Denbury Resources, Inc., 8.25%, 2/15/20 | | 75,000 | | | 81,375 | |
Newfield Exploration Co., 6.875%, 2/1/20 | | 50,000 | | | 51,750 | |
Peabody Energy Corp., 7.375%, 11/1/16 | | 30,000 | | | 33,450 | |
Peabody Energy Corp., 6.50%, 9/15/20 | | 30,000 | | | 30,225 | |
QEP Resources, Inc., 5.25%, 5/1/23 | | 75,000 | | | 73,500 | |
| | | | | | 425,346 | |
| | | | | | | |
| | | Principal Amount/ Shares | | | Value | |
PERSONAL PRODUCTS — 0.1% | |
Procter & Gamble Co. (The), 0.70%, 8/15/14 | | $50,000 | | | $50,154 | |
PHARMACEUTICALS — 0.1% | |
Valeant Pharmaceuticals International, 6.50%, 7/15/16(4) | | 70,000 | | | 72,450 | |
REAL ESTATE INVESTMENT TRUSTS (REITs) — 0.1% | |
Reckson Operating Partnership LP, 6.00%, 3/31/16 | | 50,000 | | | 54,510 | |
SEMICONDUCTORS AND SEMICONDUCTOR EQUIPMENT — 0.1% | |
Advanced Micro Devices, Inc., 8.125%, 12/15/17 | | 70,000 | | | 72,625 | |
TEXTILES, APPAREL AND LUXURY GOODS — 0.1% | |
Hanesbrands, Inc., 6.375%, 12/15/20 | | 75,000 | | | 80,344 | |
WIRELESS TELECOMMUNICATION SERVICES — 0.1% | |
Sprint Nextel Corp., 6.00%, 12/1/16 | | 70,000 | | | 74,025 | |
TOTAL CORPORATE BONDS (Cost $2,719,225) | | | 2,762,397 | |
Collateralized Mortgage Obligations(5) — 3.0% | |
PRIVATE SPONSOR COLLATERALIZED MORTGAGE OBLIGATIONS — 2.9% | |
ABN Amro Mortgage Corp., Series 2003-6, Class 1A4, 5.50%, 5/25/33 | | 13,688 | | | 14,164 | |
Banc of America Mortgage Securities, Inc., Series 2004-7, Class 7A1, 5.00%, 8/25/19 | | 14,696 | | | 15,058 | |
Banc of America Mortgage Securities, Inc., Series 2005-1, Class 1A15, 5.50%, 2/25/35 | | 75,000 | | | 76,936 | |
Banc of America Mortgage Securities, Inc., Series 2007-1, Class 1A16, 5.625%, 3/25/37 | | 75,691 | | | 68,459 | |
Bear Stearns Adjustable Rate Mortgage Trust, Series 2004-12, Class 2A1, VRN, 2.85%, 7/1/13 | | 42,002 | | | 40,553 | |
Bear Stearns Adjustable Rate Mortgage Trust, Series 2006-1, Class A1, VRN, 2.37%, 7/1/13 | | 104,816 | | | 101,130 | |
Citigroup Mortgage Loan Trust, Inc., Series 2005-4, Class A, VRN, 5.29%, 7/1/13 | | 128,177 | | | 125,926 | |
Countrywide Home Loan Mortgage Pass-Through Trust, Series 2003-35, Class 1A3 SEQ, 5.00%, 9/25/18 | | $10,806 | | | $11,144 | |
Countrywide Home Loan Mortgage Pass-Through Trust, Series 2004-4, Class A19, 5.25%, 5/25/34 | | 102,189 | | | 105,165 | |
Countrywide Home Loan Mortgage Pass-Through Trust, Series 2004-5, Class 2A4, 5.50%, 5/25/34 | | 16,521 | | | 17,116 | |
First Horizon Mortgage Pass-Through Trust, Series 2005-AR3, Class 4A1, VRN, 5.29%, 7/1/13 | | 71,667 | | | 69,805 | |
GSR Mortgage Loan Trust, Series 2005-AR6, Class 2A1, VRN, 2.66%, 7/1/13 | | 89,204 | | | 88,087 | |
JPMorgan Mortgage Trust, Series 2005-A6, Class 7A1, VRN, 3.01%, 7/1/13 | | 92,651 | | | 85,577 | |
JPMorgan Mortgage Trust, Series 2013-1, Class 2A2, VRN, 2.50%, 7/1/13(4) | | 116,438 | | | 117,130 | |
MASTR Asset Securitization Trust, Series 2003-10, Class 3A1, 5.50%, 11/25/33 | | 33,715 | | | 35,439 | |
PHHMC Mortgage Pass-Through Certificates, Series 2007-6, Class A1, VRN, 5.73%, 7/1/13 | | 29,876 | | | 30,977 | |
Wamu Mortgage Pass-Through Certificates, Series 2003-S11, Class 3A5, 5.95%, 11/25/33 | | 22,962 | | | 24,369 | |
Wells Fargo Mortgage-Backed Securities Trust, Series 2004-1, Class A10, 5.50%, 2/25/34 | | 20,262 | | | 21,299 | |
Wells Fargo Mortgage-Backed Securities Trust, Series 2005-17, Class 1A1, 5.50%, 1/25/36 | | 99,656 | | | 100,552 | |
Wells Fargo Mortgage-Backed Securities Trust, Series 2005-5, Class 1A1, 5.00%, 5/25/20 | | 20,855 | | | 21,857 | |
Wells Fargo Mortgage-Backed Securities Trust, Series 2005-AR14, Class A1, VRN, 5.33%, 7/1/13 | | 35,606 | | | 35,198 | |
Wells Fargo Mortgage-Backed Securities Trust, Series 2005-AR16, Class 1A1, VRN, 2.70%, 7/1/13 | | 93,914 | | | 94,572 | |
| | | | | | | |
| | | Principal Amount/ Shares | | | Value | |
Wells Fargo Mortgage-Backed Securities Trust, Series 2005-AR16, Class 3A2, VRN, 2.68%, 7/1/13 | | $80,340 | | | $81,177 | |
Wells Fargo Mortgage-Backed Securities Trust, Series 2006-10, Class A4 SEQ, 6.00%, 8/25/36 | | 117,926 | | | 120,987 | |
Wells Fargo Mortgage-Backed Securities Trust, Series 2006-11, Class A9 SEQ, 6.50%, 9/25/36 | | 119,128 | | | 116,997 | |
Wells Fargo Mortgage-Backed Securities Trust, Series 2006-13, Class A5, 6.00%, 10/25/36 | | 148,953 | | | 151,029 | |
Wells Fargo Mortgage-Backed Securities Trust, Series 2006-3, Class A9 SEQ, 5.50%, 3/25/36 | | 74,052 | | | 73,860 | |
Wells Fargo Mortgage-Backed Securities Trust, Series 2006-9, Class 1A9 SEQ, 6.00%, 8/25/36 | | 41,564 | | | 42,811 | |
Wells Fargo Mortgage-Backed Securities Trust, Series 2006-AR15, Class A1, VRN, 5.47%, 7/1/13 | | 56,402 | | | 49,787 | |
Wells Fargo Mortgage-Backed Securities Trust, Series 2006-AR19, Class A1, VRN, 5.41%, 7/1/13 | | 27,369 | | | 26,495 | |
Wells Fargo Mortgage-Backed Securities Trust, Series 2006-AR2, Class 2A3, VRN, 2.64%, 7/1/13 | | 110,295 | | | 106,463 | |
Wells Fargo Mortgage-Backed Securities Trust, Series 2007-10, Class 1A5, 6.00%, 7/25/37 | | 86,284 | | | 83,274 | |
Wells Fargo Mortgage-Backed Securities Trust, Series 2007-11, Class A3 SEQ, 6.00%, 8/25/37 | | 66,390 | | | 65,050 | |
Wells Fargo Mortgage-Backed Securities Trust, Series 2007-13, Class A1, 6.00%, 9/25/37 | | 79,827 | | | 80,142 | |
Wells Fargo Mortgage-Backed Securities Trust, Series 2007-14, Class 2A2, 5.50%, 10/25/22 | | 43,355 | | | 46,045 | |
Wells Fargo Mortgage-Backed Securities Trust, Series 2007-16, Class 1A1, 6.00%, 12/28/37 | | 38,390 | | | 40,039 | |
Wells Fargo Mortgage-Backed Securities Trust, Series 2007-3, Class 3A1, 5.50%, 4/25/22 | | 18,930 | | | 19,567 | |
Wells Fargo Mortgage-Backed Securities Trust, Series 2007-AR10, Class 1A1, VRN, 6.05%, 7/1/13 | | 11,110 | | | 10,937 | |
| | | | | | 2,415,173 | |
U.S. GOVERNMENT AGENCY COLLATERALIZED MORTGAGE OBLIGATIONS — 0.1% | |
FHLMC, Series 2824, Class LB SEQ, 4.50%, 7/15/24 | | 83,572 | | | 91,032 | |
TOTAL COLLATERALIZED MORTGAGE OBLIGATIONS (Cost $2,480,824) | | | 2,506,205 | |
Commercial Mortgage-Backed Securities(5) — 2.2% | |
Banc of America Commercial Mortgage, Inc., Series 2004-1, Class A4 SEQ, 4.76%, 11/10/39 | | 145,118 | | | 146,380 | |
Banc of America Commercial Mortgage, Inc., Series 2004-6, Class A3 SEQ, 4.51%, 12/10/42 | | 2,265 | | | 2,273 | |
Banc of America Commercial Mortgage, Inc., Series 2005-5, Class A4, VRN, 5.12%, 7/1/13 | | 100,000 | | | 107,746 | |
Banc of America Commercial Mortgage, Inc., Series 2005-5, Class AM, VRN, 5.18%, 7/1/13 | | 75,000 | | | 79,938 | |
BB-UBS Trust, Series 2012-SHOW, Class A, 3.43%, 11/5/36(4) | | 100,000 | | | 94,273 | |
Greenwich Capital Commercial Funding Corp., Series 2004-GG1, Class B, VRN, 5.43%, 7/1/13 | | 25,000 | | | 25,684 | |
Greenwich Capital Commercial Funding Corp., Series 2005-GG3, Class A3 SEQ, 4.57%, 8/10/42 | | 22,615 | | | 22,599 | |
Greenwich Capital Commercial Funding Corp., Series 2005-GG3, Class A4, VRN, 4.80%, 7/1/13 | | 200,000 | | | 208,841 | |
GS Mortgage Securities Corp. II, Series 2004-GG2, Class A6 SEQ, VRN, 5.40%, 7/1/13 | | 200,000 | | | 205,826 | |
| | | | | | | |
| | | Principal Amount/ Shares | | | Value | |
GS Mortgage Securities Corp. II, Series 2005-GG4, Class A4A SEQ, 4.75%, 7/10/39 | | $200,000 | | | $210,323 | |
Irvine Core Office Trust, Series 2013-IRV, Class A2, VRN, 3.31%, 7/10/13(4) | | 75,000 | | | 71,048 | |
LB-UBS Commercial Mortgage Trust, Series 2004-C1, Class A4 SEQ, 4.57%, 1/15/31 | | 64,632 | | | 65,737 | |
LB-UBS Commercial Mortgage Trust, Series 2004-C2, Class A4 SEQ, 4.37%, 3/15/36 | | 155,000 | | | 157,776 | |
LB-UBS Commercial Mortgage Trust, Series 2004-C4, Class A4, VRN, 5.71%, 7/11/13 | | 150,000 | | | 154,386 | |
LB-UBS Commercial Mortgage Trust, Series 2004-C8, Class AJ, VRN, 4.86%, 7/11/13 | | 25,000 | | | 25,938 | |
LB-UBS Commercial Mortgage Trust, Series 2005-C5, Class AM, VRN, 5.02%, 7/11/13 | | 125,000 | | | 132,453 | |
LB-UBS Commercial Mortgage Trust, Series 2005-C7, Class AM SEQ, VRN, 5.26%, 7/11/13 | | 75,000 | | | 80,176 | |
Wachovia Bank Commercial Mortgage Trust, Series 2004-C15, Class A3 SEQ, 4.50%, 10/15/41 | | $12,872 | | | 13,014 | |
TOTAL COMMERCIAL MORTGAGE-BACKED SECURITIES (Cost $1,846,601) | | | 1,804,411 | |
Warrants† | |
METALS AND MINING† | |
GoGold Resources, Inc.(2) (Cost $—) | | 101,250 | | | — | |
Rights† | |
REAL ESTATE MANAGEMENT AND DEVELOPMENT† | |
New World Development Co., Ltd.(2) (Cost $—) | | 675 | | | — | |
Temporary Cash Investments — 18.4% | |
Federal Home Loan Bank Discount Notes, 0.07%, 8/7/13(3) | | $4,200,000 | | | 4,199,720 | |
SSgA U.S. Government Money Market Fund | | 11,064,544 | | | 11,064,544 | |
TOTAL TEMPORARY CASH INVESTMENTS (Cost $15,264,264) | | | 15,264,264 | |
TOTAL INVESTMENT SECURITIES — 100.5% (Cost $84,119,175) | | | 83,424,808 | |
OTHER ASSETS AND LIABILITIES — (0.5)% | | | (433,373 | ) |
TOTAL NET ASSETS — 100.0% | | | $82,991,435 | |
Forward Foreign Currency Exchange Contracts
| | | | | | | | | |
Currency Purchased | | Currency Sold | | Counterparty | Settlement Date | | Unrealized Gain (Loss) | |
AUD | | 150,000 | | USD | | 143,241 | | Westpac Group | 9/17/2013 | | $(6,824 | ) |
AUD | | 100,000 | | USD | | 93,828 | | Westpac Group | 9/17/2013 | | (2,884 | ) |
BRL | | 800,000 | | USD | | 368,375 | | Barclays Bank plc | 9/17/2013 | | (15,366 | ) |
CAD | | 2,700,000 | | USD | | 2,642,965 | | HSBC Holdings plc | 9/17/2013 | | (80,424 | ) |
USD | | 100,000 | | CAD | | 105,238 | | Barclays Bank plc | 9/17/2013 | | 120 | |
USD | | 78,347 | | CAD | | 80,000 | | Barclays Bank plc | 9/17/2013 | | 2,419 | |
USD | | 49,055 | | CAD | | 50,000 | | Deutsche Bank | 9/17/2013 | | 1,600 | |
CHF | | 350,000 | | USD | | 378,445 | | UBS AG | 9/17/2013 | | (7,643 | ) |
CNY | | 29,600,000 | | USD | | 4,802,310 | | HSBC Holdings plc | 9/17/2013 | | (34,960 | ) |
USD | | 122,513 | | CNY | | 760,000 | | Barclays Bank plc | 9/17/2013 | | 108 | |
USD | | 200,000 | | CNY | | 1,244,300 | | HSBC Holdings plc | 9/17/2013 | | (406 | ) |
USD | | 137,843 | | CNY | | 853,000 | | HSBC Holdings plc | 9/17/2013 | | 460 | |
USD | | 55,122 | | COP | | 105,999,991 | | Barclays Bank plc | 9/17/2013 | | 377 | |
EUR | | 2,850,000 | | USD | | 3,793,906 | | Barclays Bank plc | 9/17/2013 | | (82,960 | ) |
USD | | 260,261 | | EUR | | 200,000 | | Barclays Bank plc | 9/17/2013 | | (156 | ) |
Currency Purchased | | Currency Sold | | Counterparty | Settlement Date | | Unrealized Gain (Loss) | |
USD | | 107,311 | | EUR | | 80,000 | | Barclays Bank plc | 9/17/2013 | | $ 3,144 | |
USD | | 66,720 | | EUR | | 50,000 | | Barclays Bank plc | 9/17/2013 | | 1,616 | |
GBP | | 550,000 | | USD | | 859,535 | | HSBC Holdings plc | 9/17/2013 | | (23,433 | ) |
USD | | 122,908 | | GBP | | 80,000 | | Westpac Group | 9/17/2013 | | 1,294 | |
USD | | 92,349 | | GBP | | 60,000 | | Westpac Group | 9/17/2013 | | 1,138 | |
HKD | | 2,150,000 | | USD | | 277,000 | | Westpac Group | 9/17/2013 | | 283 | |
HUF | | 33,763,276 | | USD | | 150,011 | | Deutsche Bank | 9/17/2013 | | (2,132 | ) |
USD | | 200,000 | | HUF | | 45,946,000 | | Deutsche Bank | 9/17/2013 | | (1,237 | ) |
IDR | | 970,000,005 | | USD | | 95,661 | | Westpac Group | 9/17/2013 | | (1,495 | ) |
IDR | | 4,719,999,986 | | USD | | 457,451 | | UBS AG | 9/18/2013 | | 621 | |
ILS | | 900,000 | | USD | | 246,944 | | UBS AG | 9/18/2013 | | 49 | |
INR | | 11,600,000 | | USD | | 197,145 | | Westpac Group | 9/17/2013 | | (5,337 | ) |
INR | | 7,900,000 | | USD | | 133,177 | | UBS AG | 9/18/2013 | | (2,566 | ) |
USD | | 200,000 | | INR | | 12,353,000 | | Westpac Group | 9/17/2013 | | (4,258 | ) |
JPY | | 157,700,000 | | USD | | 1,641,054 | | Barclays Bank plc | 9/17/2013 | | (50,458 | ) |
USD | | 39,929 | | JPY | | 3,800,000 | | Barclays Bank plc | 9/17/2013 | | 1,602 | |
KRW | | 829,999,997 | | USD | | 728,837 | | HSBC Holdings plc | 9/17/2013 | | (4,850 | ) |
USD | | 200,000 | | KRW | | 232,050,000 | | HSBC Holdings plc | 9/17/2013 | | (2,411 | ) |
MXN | | 32,150,000 | | USD | | 2,487,928 | | Barclays Bank plc | 9/17/2013 | | (23,571 | ) |
USD | | 163,097 | | MXN | | 2,100,000 | | Barclays Bank plc | 9/17/2013 | | 2,128 | |
USD | | 64,723 | | MXN | | 840,000 | | Barclays Bank plc | 9/17/2013 | | 335 | |
MYR | | 1,050,000 | | USD | | 332,280 | | Westpac Group | 9/17/2013 | | (3,210 | ) |
USD | | 173,373 | | MYR | | 560,000 | | Westpac Group | 9/17/2013 | | (2,131 | ) |
USD | | 111,300 | | MYR | | 360,000 | | Westpac Group | 9/17/2013 | | (1,524 | ) |
USD | | 110,967 | | MYR | | 360,000 | | Westpac Group | 9/17/2013 | | (1,857 | ) |
NOK | | 1,000,000 | | USD | | 174,042 | | Deutsche Bank | 9/17/2013 | | (9,862 | ) |
USD | | 200,000 | | NOK | | 1,216,399 | | Barclays Bank plc | 9/17/2013 | | 291 | |
USD | | 60,212 | | NOK | | 360,000 | | Barclays Bank plc | 9/17/2013 | | 1,107 | |
USD | | 60,300 | | NOK | | 350,000 | | Deutsche Bank | 9/17/2013 | | 2,837 | |
USD | | 48,730 | | NOK | | 280,000 | | Deutsche Bank | 9/17/2013 | | 2,759 | |
PEN | | 300,000 | | USD | | 107,143 | | Barclays Bank plc | 9/17/2013 | | (14 | ) |
USD | | 108,323 | | PEN | | 300,000 | | Barclays Bank plc | 9/17/2013 | | 1,194 | |
PHP | | 5,700,000 | | USD | | 132,957 | | Westpac Group | 9/17/2013 | | (729 | ) |
USD | | 93,071 | | PHP | | 4,000,000 | | Westpac Group | 9/17/2013 | | 280 | |
PLN | | 334,784 | | USD | | 100,000 | | Barclays Bank plc | 9/17/2013 | | 282 | |
USD | | 119,921 | | PLN | | 387,146 | | Deutsche Bank | 9/17/2013 | | 3,954 | |
RUB | | 4,000,000 | | USD | | 124,465 | | Westpac Group | 9/17/2013 | | (4,184 | ) |
RUB | | 8,300,000 | | USD | | 252,098 | | UBS AG | 9/18/2013 | | (2,554 | ) |
USD | | 132,348 | | RUB | | 4,300,000 | | Deutsche Bank | 9/17/2013 | | 3,046 | |
USD | | 200,000 | | RUB | | 6,692,000 | | Westpac Group | 9/17/2013 | | (1,231 | ) |
SEK | | 600,000 | | USD | | 92,547 | | Deutsche Bank | 9/17/2013 | | (3,230 | ) |
SEK | | 550,000 | | USD | | 83,757 | | Deutsche Bank | 9/17/2013 | | (1,882 | ) |
USD | | 99,155 | | SEK | | 640,000 | | Deutsche Bank | 9/17/2013 | | 3,883 | |
SGD | | 100,000 | | USD | | 79,586 | | HSBC Holdings plc | 9/17/2013 | | (679 | ) |
THB | | 3,900,000 | | USD | | 125,199 | | Westpac Group | 9/17/2013 | | (368 | ) |
USD | | 228,462 | | TRY | | 438,666 | | Deutsche Bank | 9/17/2013 | | 3,727 | |
TWD | | 16,700,000 | | USD | | 559,970 | | HSBC Holdings plc | 9/17/2013 | | (2,268 | ) |
TWD | | 5,992,840 | | USD | | 200,000 | | HSBC Holdings plc | 9/17/2013 | | 133 | |
USD | | 244,720 | | TWD | | 7,300,000 | | HSBC Holdings plc | 9/17/2013 | | 934 | |
| | | | | | | | | |
Currency Purchased | | Currency Sold | | Counterparty | Settlement Date | | Unrealized Gain (Loss) | |
USD | | 238,017 | | TWD | | 7,200,000 | | HSBC Holdings plc | 9/17/2013 | | $(2,430 | ) |
USD | | 236,812 | | TWD | | 7,160,000 | | HSBC Holdings plc | 9/17/2013 | | (2,299 | ) |
USD | | 197,351 | | TWD | | 5,960,000 | | HSBC Holdings plc | 9/17/2013 | | (1,685 | ) |
USD | | 81,011 | | ZAR | | 825,129 | | Deutsche Bank | 9/17/2013 | | (1,544 | ) |
| | | | | | | | | | | | $(355,331 | ) |
| | Futures Contracts | |
| | Contracts Sold | Expiration Date | | Underlying Face Amount at Value | | | Unrealized Gain (Loss) | |
| | 3 | | U.S. Treasury 5-Year Notes | September 2013 | | $363,141 | | | $4,165 | |
Total Return Swap Agreements | |
Counterparty | | Notional Amount | | Floating Rate Referenced Index | Pay/Receive
Total
Return of Referenced Index | | Fixed Rate | Termination Date | | Value | |
Bank of America N.A. | | $500,000 | | U.S. CPI Urban Consumers NSA Index | Receive | | 1.77 | % | 8/8/14 | | $(3,464 | ) |
Bank of America N.A. | | 925,000 | | U.S. CPI Urban Consumers NSA Index | Receive | | 2.28 | % | 1/21/16 | | (12,715 | ) |
Bank of America N.A. | | 1,000,000 | | U.S. CPI Urban Consumers NSA Index | Receive | | 1.97 | % | 12/21/16 | | (10,355 | ) |
Barclays Bank plc | | 500,000 | | U.S. CPI Urban Consumers NSA Index | Receive | | 2.10 | % | 10/23/15 | | (6,704 | ) |
Barclays Bank plc | | 900,000 | | U.S. CPI Urban Consumers NSA Index | Receive | | 2.30 | % | 1/11/16 | | (12,972 | ) |
Barclays Bank plc | | 2,100,000 | | U.S. CPI Urban Consumers NSA Index | Receive | | 2.52 | % | 5/13/16 | | (74,032 | ) |
Barclays Bank plc | | 700,000 | | U.S. CPI Urban Consumers NSA Index | Receive | | 2.35 | % | 9/28/17 | | (13,096 | ) |
Morgan Stanley Capital Services LLC | | 800,000 | | U.S. CPI Urban Consumers NSA Index | Receive | | 2.24 | % | 10/9/15 | | (12,600 | ) |
| | | | | | | | | | | | $(145,938 | ) |
Notes to Schedule of Investments
ADR = American Depositary Receipt AUD = Australian Dollar BRL = Brazilian Real CAD = Canadian Dollar CHF = Swiss Franc CNY = Chinese Yuan COP = Colombian Peso CPI = Consumer Price Index EUR = Euro FHLMC = Federal Home Loan Mortgage Corporation GBP = British Pound HKD = Hong Kong Dollar HUF = Hungarian Forint IDR = Indonesian Rupiah ILS = Israeli Shekel INR = Indian Rupee JPY = Japanese Yen KRW = South Korea Won MXN = Mexican Peso MYR = Malaysian Ringgit NOK = Norwegian Krone NSA = Not Seasonally Adjusted NVDR = Non-Voting Depositary Receipt PEN = Peruvian Nuevo Sol PHP = Philippine Peso PLN = Polish Zloty | RUB = Russian Rouble SEK = Swedish Krona SEQ = Sequential Payer SGD = Singapore Dollar THB = Thai Baht TRY = Turkish Lira TWD = Taiwanese Dollar USD = United States Dollar VRN = Variable Rate Note. Interest reset date is indicated. Rate shown is effective at the period end. ZAR = South African Rand † Category is less than 0.05% of total net assets. (1) Security, or a portion thereof, has been pledged at the custodian bank or with a broker for margin requirements on futures contracts. At the period end, the aggregate value of securities pledged
was $11,003. (2) Non-income producing. (3) The rate indicated is the yield to maturity at purchase for
non-interest bearing securities. For interest bearing securities,
the stated coupon rate is shown. (4) Security was purchased under Rule 144A or Section 4(2) of the Securities Act of 1933 or is a private placement and, unless registered under the Act or exempted from registration, may only be sold to qualified institutional investors. The aggregate value of these securities at the period end was $7,840,892, which represented 9.4% of total net assets. (5) Final maturity date indicated, unless otherwise noted. See Notes to Financial Statements. |
Statement of Assets and Liabilities |
JUNE 30, 2013 | |
Assets | |
Investment securities, at value (cost of $84,119,175) | | $83,424,808 | |
Foreign currency holdings, at value (cost of $32,927) | | 32,862 | |
Receivable for investments sold | | 1,195,844 | |
Receivable for capital shares sold | | 13,815 | |
Unrealized gain on forward foreign currency exchange contracts | | 41,721 | |
Dividends and interest receivable | | 203,201 | |
Other assets | | 207 | |
| | | 84,912,458 | |
| | | | |
Liabilities | | | |
Disbursements in excess of demand deposit cash | | 42,224 | |
Payable for investments purchased | | 821,893 | |
Payable for capital shares redeemed | | 420,636 | |
Payable for variation margin on futures contracts | | 70 | |
Unrealized loss on forward foreign currency exchange contracts | | 397,052 | |
Swap agreements, at value | | 145,938 | |
Accrued management fees | | 78,237 | |
Distribution and service fees payable | | 14,973 | |
| | | 1,921,023 | |
| | | | |
Net Assets | | $82,991,435 | |
| | | | |
Net Assets Consist of: | | | |
Capital (par value and paid-in surplus) | | $87,367,024 | |
Undistributed net investment income | | 343,978 | |
Accumulated net realized loss | | (3,527,831 | ) |
Net unrealized depreciation | | (1,191,736 | ) |
| | | $82,991,435 | |
| | | | |
| | Net assets | Shares outstanding | Net asset value per share |
Investor Class, $0.01 Par Value | $45,728,111 | 4,610,322 | $9.92 |
Institutional Class, $0.01 Par Value | $2,994,736 | 301,160 | $9.94 |
A Class, $0.01 Par Value | $23,107,603 | 2,340,592 | $9.87* |
C Class, $0.01 Par Value | $11,024,795 | 1,132,008 | $9.74 |
R Class, $0.01 Par Value | $136,190 | 13,858 | $9.83 |
*Maximum offering price $10.47 (net asset value divided by 0.9425).
See Notes to Financial Statements.
YEAR ENDED JUNE 30, 2013 | |
Investment Income (Loss) | |
Income: | | | |
Dividends (net of foreign taxes withheld of $15,446) | | $443,654 | |
Interest | | 435,760 | |
| | | 879,414 | |
| | | | |
Expenses: | | | |
Management fees | | 1,196,672 | |
Distribution and service fees: | | | |
A Class | | 77,202 | |
C Class | | 101,167 | |
R Class | | 700 | |
Directors’ fees and expenses | | 7,556 | |
Other expenses | | 4,563 | |
| | | 1,387,860 | |
| | | | |
Net investment income (loss) | | (508,446 | ) |
| | | | |
Realized and Unrealized Gain (Loss) | | | |
Net realized gain (loss) on: | | | |
Investment transactions (net of foreign tax expenses paid (refunded) of $834) | | (938,574 | ) |
Futures contract transactions | | 17,394 | |
Swap agreement transactions | | 7,097 | |
Foreign currency transactions | | 294,004 | |
| | | (620,079 | ) |
| | | | |
Change in net unrealized appreciation (depreciation) on: | | | |
Investments (includes (increase) decrease in accrued foreign taxes of $132) | | 995,845 | |
Futures contracts | | 4,656 | |
Swap agreements | | (74,869 | ) |
Translation of assets and liabilities in foreign currencies | | 146,750 | |
| | | 1,072,382 | |
| | | | |
Net realized and unrealized gain (loss) | | 452,303 | |
| | | | |
Net Increase (Decrease) in Net Assets Resulting from Operations | | $(56,143 | ) |
See Notes to Financial Statements.
Statement of Changes in Net Assets |
YEARS ENDED JUNE 30, 2013 AND JUNE 30, 2012 | |
Increase (Decrease) in Net Assets | | June 30, 2013 | | | June 30, 2012 | |
Operations | |
Net investment income (loss) | | $(508,446 | ) | | $(24,259 | ) |
Net realized gain (loss) | | (620,079 | ) | | (2,781,232 | ) |
Change in net unrealized appreciation (depreciation) | | 1,072,382 | | | (3,241,621 | ) |
Net increase (decrease) in net assets resulting from operations | | (56,143 | ) | | (6,047,112 | ) |
| | | | | | | |
Distributions to Shareholders | | | | | | |
From net investment income: | | | | | | |
Investor Class | | — | | | (674,472 | ) |
Institutional Class | | — | | | (75,987 | ) |
A Class | | — | | | (369,850 | ) |
C Class | | — | | | (34,670 | ) |
R Class | | — | | | (1,046 | ) |
From net realized gains: | | | | | | |
Investor Class | | — | | | (145,643 | ) |
Institutional Class | | — | | | (13,696 | ) |
A Class | | — | | | (85,639 | ) |
C Class | | — | | | (18,728 | ) |
R Class | | — | | | (338 | ) |
Decrease in net assets from distributions | | — | | | (1,420,069 | ) |
| | | | | | | |
Capital Share Transactions | | | | | | |
Net increase (decrease) in net assets from capital share transactions | | (30,107,715 | ) | | 24,791,565 | |
| | | | | | | |
Net increase (decrease) in net assets | | (30,163,858 | ) | | 17,324,384 | |
| | | | | | | |
Net Assets | | | | | | |
Beginning of period | | 113,155,293 | | | 95,830,909 | |
End of period | | $82,991,435 | | | $113,155,293 | |
| | | | | | | |
Undistributed net investment income | | $343,978 | | | $294,710 | |
See Notes to Financial Statements.
Notes to Financial Statements |
JUNE 30, 2013
1. Organization
American Century Quantitative Equity Funds, Inc. (the corporation) is registered under the Investment Company Act of 1940, as amended (the 1940 Act), as an open-end management investment company and is organized as a Maryland corporation. Strategic Inflation Opportunities Fund (the fund) is one fund in a series issued by the corporation. The fund is nondiversified as defined under the 1940 Act. The fund’s investment objective is to seek total real return.
The fund offers the Investor Class, the Institutional Class, the A Class, the C Class and the R Class. The A Class may incur an initial sales charge. The A Class and C Class may be subject to a contingent deferred sales charge. The share classes differ principally in their respective sales charges and distribution and shareholder servicing expenses and arrangements. The Institutional Class is made available to institutional shareholders or through financial intermediaries whose clients do not require the same level of shareholder and administrative services as shareholders of other classes. As a result, the Institutional Class is charged a lower unified management fee.
2. Significant Accounting Policies
The following is a summary of significant accounting policies consistently followed by the fund in preparation of its financial statements. The financial statements are prepared in conformity with accounting principles generally accepted in the United States of America, which may require management to make certain estimates and assumptions at the date of the financial statements. Actual results could differ from these estimates.
Investment Valuations — The fund determines the fair value of its investments and computes its net asset value per share as of the close of regular trading (usually 4 p.m. Eastern time) on the New York Stock Exchange (NYSE) on each day the NYSE is open.
Debt securities maturing in greater than 60 days at the time of purchase are valued at the evaluated mean as provided by independent pricing services or at the mean of the most recent bid and asked prices as provided by investment dealers. Debt securities maturing within 60 days at the time of purchase may be valued at cost, plus or minus any amortized discount or premium or at the evaluated mean as provided by an independent pricing service. Evaluated mean prices are commonly derived through utilization of market models, which may consider, among other factors, trade data, quotations from dealers and active market makers, relevant yield curve and spread data, related sector levels, creditworthiness, and other relevant market information on the same or comparable securities.
Equity securities that are listed or traded on a domestic securities exchange are valued at the last reported sales price or at the official closing price as provided by the exchange. Equity securities traded on foreign securities exchanges are typically valued at the closing price on the exchange where primarily traded or as of the close of the NYSE, if that is earlier. If no last sales price is reported, or if local convention or regulation so provides, the mean of the latest bid and asked prices is used. Depending on local convention or regulation, securities traded over-the-counter are valued at the mean of the latest bid and asked prices, the last sales price, or the official closing price. In its determination of fair value, the fund may review several factors including: market information specific to a security; news developments in U.S. and foreign markets; the performance of particular U.S. and foreign securities, indices, comparable securities, American Depositary Receipts, Exchange-Traded Funds, and other relevant market indicators.
Investments in open-end management investment companies are valued at the reported net asset value per share. Exchange-traded futures contracts are valued at the settlement price as provided by the appropriate clearing corporation. Swap agreements are valued at an evaluated price as provided by independent pricing services or investment dealers. Forward foreign currency exchange contracts are valued at the mean of the latest bid and asked prices of the forward currency rates as provided by an independent pricing service.
The value of investments initially expressed in foreign currencies is translated into U.S. dollars at prevailing exchange rates.If the fund determines that the market price for a portfolio security is not readily available or the valuation methods mentioned above do not reflect a security’s fair value, such security is valued as determined in good faith by the Board of Directors or its designee, in accordance with procedures adopted by the Board of Directors. Circumstances that may cause the fund to use these procedures to value a security include, but are not limited to: a security has been declared in default; trading in a security has been halted during the trading day; there is a foreign market holiday and no trading occurred; or an event occurred between the close of a foreign exchange and the NYSE that may affect the value of a security.
Security Transactions — Security transactions are accounted for as of the trade date. Net realized gains and losses are determined on the identified cost basis, which is also used for federal income tax purposes. Certain countries impose taxes on realized gains on the sale of securities registered in their country. The fund records the foreign tax expense, if any, on an accrual basis. The foreign tax expense on realized gains and unrealized appreciation reduces the net realized gain (loss) on investment transactions and net unrealized appreciation (depreciation) on investments, respectively.
Investment Income — Dividend income less foreign taxes withheld, if any, is recorded as of the ex-dividend date. Distributions received on securities that represent a return of capital or long-term capital gain are recorded as a reduction of cost of investments and/or as a realized gain. The fund may estimate the components of distributions received that may be considered nontaxable distributions or long-term capital gain distributions for income tax purposes. Interest income is recorded on the accrual basis and includes paydown gain (loss) and accretion of discounts and amortization of premiums. Inflation adjustments related to inflation-linked debt securities are reflected as interest income.
Foreign Currency Translations — All assets and liabilities initially expressed in foreign currencies are translated into U.S. dollars at prevailing exchange rates at period end. The fund may enter into spot foreign currency exchange contracts to facilitate transactions denominated in a foreign currency. Purchases and sales of investment securities, dividend and interest income, spot foreign currency exchange contracts, and expenses are translated at the rates of exchange prevailing on the respective dates of such transactions. Net realized and unrealized foreign currency exchange gains or losses related to investment securities are a component of net realized gain (loss) on investment transactions and change in net unrealized appreciation (depreciation) on investments, respectively.
Income Tax Status — It is the fund’s policy to distribute substantially all net investment income and net realized gains to shareholders and to otherwise qualify as a regulated investment company under provisions of the Internal Revenue Code. Accordingly, no provision has been made for income taxes. The fund files U.S. federal, state, local and non-U.S. tax returns as applicable. The fund’s tax returns are subject to examination by the relevant taxing authority until expiration of the applicable statute of limitations, which is generally three years from the date of filing but can be longer in certain jurisdictions. At this time, management believes there are no uncertain tax positions which, based on their technical merit, would not be sustained upon examination and for which it is reasonably possible that the total amounts of unrecognized tax benefits will significantly change in the next twelve months.
Segregated Assets — In accordance with the 1940 Act, the fund segregates assets on its books and records to cover certain types of investments, including, but not limited to, futures contracts, forward commitments, when-issued securities, swap agreements and certain forward foreign currency exchange contracts. American Century Investment Management, Inc. (ACIM) (the investment advisor) monitors, on a daily basis, the securities segregated to ensure the fund designates a sufficient amount of liquid assets, marked-to-market daily. The fund may also receive assets or be required to pledge assets at the custodian bank or with a broker for margin requirements on futures contracts and swap agreements.
Multiple Class — All shares of the fund represent an equal pro rata interest in the net assets of the class to which such shares belong, and have identical voting, dividend, liquidation and other rights and the same terms and conditions, except for class specific expenses and exclusive rights to vote on matters affecting only individual classes. Income, non-class specific expenses, and realized and unrealized capital gains and losses of the fund are allocated to each class of shares based on their relative net assets.
Distributions to Shareholders — Distributions from net investment income, if any, are generally declared and paid quarterly. Distributions from net realized gains, if any, are generally declared and paid annually.
Indemnifications — Under the corporation’s organizational documents, its officers and directors are indemnified against certain liabilities arising out of the performance of their duties to the fund. In addition, in the normal course of business, the fund enters into contracts that provide general indemnifications. The maximum exposure under these arrangements is unknown as this would involve future claims that may be made against a fund. The risk of material loss from such claims is considered by management to be remote.
3. Fees and Transactions with Related Parties
Management Fees — The corporation has entered into a management agreement with ACIM, under which ACIM provides the fund with investment advisory and management services in exchange for a single, unified management fee (the fee) per class. The agreement provides that all expenses of managing and operating the fund, except distribution and service fees, brokerage expenses, taxes, interest, fees and expenses of the independent directors (including legal counsel fees), and extraordinary expenses, will be paid by ACIM. The fee is computed and accrued daily based on each class’s daily net assets and paid monthly in arrears. The fee consists of (1) an Investment Category Fee based on the daily net assets of the fund and certain other accounts managed by the investment advisor that are in the same broad investment category as the fund and (2) a Complex Fee based on the assets of all the funds in the American Century Investments family of funds. The rates for the Investment Category Fee range from 0.7754% to 0.8929%. The rates for the Complex Fee range from 0.2500% to 0.3100% for the Investor Class, A Class, C Class and R Class. The Institutional Class is 0.2000% less at each point within the Complex Fee range. The effective annual management fee for each class for the year ended June 30, 2013 was 1.08% for the Investor Class, A Class, C Class and R Class and 0.88% for the Institutional Class.
Distribution and Service Fees — The Board of Directors has adopted a separate Master Distribution and Individual Shareholder Services Plan for each of the A Class, C Class and R Class (collectively the plans), pursuant to Rule 12b-1 of the 1940 Act. The plans provide that the A Class will pay American Century Investment Services, Inc. (ACIS) an annual distribution and service fee of 0.25%. The plans provide that the C Class will pay ACIS an annual distribution and service fee of 1.00%, of which 0.25% is paid for individual shareholder services and 0.75% is paid for distribution services. The plans provide that the R Class will pay ACIS an annual distribution and service fee of 0.50%. The fees are computed and accrued daily based on each class’s daily net assets and paid monthly in arrears. The fees are used to pay financial intermediaries for distribution and individual shareholder services. Fees incurred under the plans during the year ended June 30, 2013 are detailed in the Statement of Operations.
Acquired Fund Fees and Expenses — The fund may invest in mutual funds, exchange-traded funds, and business development companies (the acquired funds). The fund will indirectly realize its pro rata share of the fees and expenses of the acquired funds in which it invests. These indirect fees and expenses are not paid out of the fund’s assets but are reflected in the return realized by the fund on its investment in the acquired funds.
Related Parties — Certain officers and directors of the corporation are also officers and/or directors of American Century Companies, Inc. (ACC). The corporation’s investment advisor, ACIM, the corporation’s distributor, ACIS, and the corporation’s transfer agent, American Century Services, LLC are wholly owned, directly or indirectly, by ACC.
4. Investment Transactions
Purchases of investment securities, excluding short-term investments, for the year ended June 30, 2013 totaled $70,555,655, of which $23,133,650 represented U.S. Treasury and Government Agency obligations.
Sales of investment securities, excluding short-term investments, for the year ended June 30, 2013 totaled $96,477,676, of which $39,624,512 represented U.S. Treasury and Government Agency obligations.
5. Capital Share Transactions
Transactions in shares of the fund were as follows:
| | | | | | | |
| | | Year ended June 30, 2013 | | | Year ended June 30, 2012 | |
| | | Shares | | | Amount | | | Shares | | | Amount | |
Investor Class/Shares Authorized | | 50,000,000 | | | | | | 50,000,000 | | | | |
Sold | | 1,972,806 | | | $20,427,855 | | | 3,937,761 | | | $40,224,169 | |
Issued in reinvestment of distributions | | — | | | — | | | 66,304 | | | 673,816 | |
Redeemed | | (3,967,497 | ) | | (40,974,107 | ) | | (2,414,685 | ) | | (24,702,735 | ) |
| | | (1,994,691 | ) | | (20,546,252 | ) | | 1,589,380 | | | 16,195,250 | |
Institutional Class/Shares Authorized | | 50,000,000 | | | | | | 50,000,000 | | | | |
Sold | | 258,744 | | | 2,682,273 | | | 278,083 | | | 2,856,280 | |
Issued in reinvestment of distributions | | — | | | — | | | 8,781 | | | 89,442 | |
Redeemed | | (665,890 | ) | | (6,874,904 | ) | | (85,296 | ) | | (866,892 | ) |
| | | (407,146 | ) | | (4,192,631 | ) | | 201,568 | | | 2,078,830 | |
A Class/Shares Authorized | | 50,000,000 | | | | | | 50,000,000 | | | | |
Sold | | 1,003,003 | | | 10,375,269 | | | 1,815,215 | | | 18,816,025 | |
Issued in reinvestment of distributions | | — | | | — | | | 41,547 | | | 422,365 | |
Redeemed | | (1,803,527 | ) | | (18,390,980 | ) | | (1,560,940 | ) | | (15,827,678 | ) |
| | | (800,524 | ) | | (8,015,711 | ) | | 295,822 | | | 3,410,712 | |
C Class/Shares Authorized | | 50,000,000 | | | | | | 50,000,000 | | | | |
Sold | | 558,435 | | | 5,698,256 | | | 460,021 | | | 4,733,335 | |
Issued in reinvestment of distributions | | — | | | — | | | 4,733 | | | 47,890 | |
Redeemed | | (301,454 | ) | | (3,052,321 | ) | | (169,032 | ) | | (1,695,509 | ) |
| | | 256,981 | | | 2,645,935 | | | 295,722 | | | 3,085,716 | |
R Class/Shares Authorized | | 50,000,000 | | | | | | 50,000,000 | | | | |
Sold | | 1,344 | | | 13,565 | | | 1,996 | | | 20,087 | |
Issued in reinvestment of distributions | | — | | | — | | | 136 | | | 1,384 | |
Redeemed | | (1,213 | ) | | (12,621 | ) | | (41 | ) | | (414 | ) |
| | | 131 | | | 944 | | | 2,091 | | | 21,057 | |
Net increase (decrease) | | (2,945,249 | ) | | $(30,107,715 | ) | | 2,384,583 | | | $24,791,565 | |
6. Fair Value Measurements
The fund’s securities valuation process is based on several considerations and may use multiple inputs to determine the fair value of the positions held by the fund. In conformity with accounting principles generally accepted in the United States of America, the inputs used to determine a valuation are classified into three broad levels as follows:
• | Level 1 valuation inputs consist of unadjusted quoted prices in an active market for identical securities; |
• | Level 2 valuation inputs consist of direct or indirect observable market data (including quoted prices for similar securities, evaluations of subsequent market events, interest rates, prepayment speeds, credit risk, etc.); or |
• | Level 3 valuation inputs consist of unobservable data (including a fund’s own assumptions). |
The level classification is based on the lowest level input that is significant to the fair valuation measurement. The valuation inputs are not necessarily an indication of the risks associated with investing in these securities or other financial instruments.
The following is a summary of the level classifications as of period end. The Schedule of Investments provides additional information on the fund’s portfolio holdings.
| | Level 1 | Level 2 | Level 3 |
Investment Securities | | | |
U.S. Treasury Securities | — | $26,164,154 | — |
Domestic Common Stocks | $11,608,490 | — | — |
Foreign Common Stocks | 931,072 | 6,068,660 | — |
Commercial Paper | — | 8,648,929 | — |
Exchange-Traded Funds | 7,666,226 | — | — |
Corporate Bonds | — | 2,762,397 | — |
Collateralized Mortgage Obligations | — | 2,506,205 | — |
Commercial Mortgage-Backed Securities | — | 1,804,411 | — |
Warrants | — | — | — |
Rights | — | — | — |
Temporary Cash Investments | 11,064,544 | 4,199,720 | — |
Total Value of Investment Securities | $31,270,332 | $52,154,476 | — |
| | | | |
Other Financial Instruments | | | |
Futures Contracts | $4,165 | — | — |
Swap Agreements | — | $(145,938) | — |
Forward Foreign Currency Exchange Contracts | — | (355,331) | — |
Total Unrealized Gain (Loss) on Other Financial Instruments | $4,165 | $(501,269) | — |
7. Derivative Instruments
Foreign Currency Risk — The fund is subject to foreign currency exchange rate risk in the normal course of pursuing its investment objectives. The value of foreign investments held by a fund may be significantly affected by changes in foreign currency exchange rates. The dollar value of a foreign security generally decreases when the value of the dollar rises against the foreign currency in which the security is denominated and tends to increase when the value of the dollar declines against such foreign currency. A fund may enter into forward foreign currency exchange contracts to reduce a fund’s exposure to foreign currency exchange rate fluctuations or to gain exposure to the fluctuations in the value of foreign currencies. The net U.S. dollar value of foreign currency underlying all contractual commitments held by a fund and the resulting unrealized appreciation or
depreciation are determined daily. Realized gain or loss is recorded upon the termination of the contract. Net realized and unrealized gains or losses occurring during the holding period of forward foreign currency exchange contracts are a component of net realized gain (loss) on foreign currency transactions and change in net unrealized appreciation (depreciation) on translation of assets and liabilities in foreign currencies, respectively. A fund bears the risk of an unfavorable change in the foreign currency exchange rate underlying the forward contract. Additionally, losses, up to the fair value, may arise if the counterparties do not perform under the contract terms. The foreign currency risk derivative instruments held at period end as disclosed on the Schedule of Investments are indicative of the fund’s typical volume during the period.
Interest Rate Risk — The fund is subject to interest rate risk in the normal course of pursuing its investment objectives. The value of bonds generally declines as interest rates rise. A fund may enter into futures contracts based on a bond index or a specific underlying security. A fund may purchase futures contracts to gain exposure to increases in market value or sell futures contracts to protect against a decline in market value. Upon entering into a futures contract, a fund will segregate cash, cash equivalents or other appropriate liquid securities on its records in amounts sufficient to meet requirements. Subsequent payments (variation margin) are made or received daily, in cash, by a fund. The variation margin is equal to the daily change in the contract value and is recorded as unrealized gains and losses. A fund recognizes a realized gain or loss when the futures contract is closed or expires. Net realized and unrealized gains or losses occurring during the holding period of futures contracts are a component of net realized gain (loss) on futures contract transactions and change in net unrealized appreciation (depreciation) on futures contracts, respectively. One of the risks of entering into futures contracts is the possibility that the change in value of the contract may not correlate with the changes in value of the underlying securities. The fund regularly purchased and sold interest rate risk derivative instruments throughout the reporting period and the instruments held at period end as disclosed on the Schedule of Investments are indicative of the fund’s typical volume.
Other Contracts — A fund may enter into total return swap agreements in order to attempt to obtain or preserve a particular return or spread at a lower cost than obtaining a return or spread through purchases and/or sales of instruments in other markets or gain exposure to certain markets in the most economical way possible. A fund will segregate cash, cash equivalents or other appropriate liquid securities on its records in amounts sufficient to meet requirements. Changes in value, including the periodic amounts of interest to be paid or received on swap agreements, are recorded as unrealized appreciation (depreciation) on swap agreements. Realized gain or loss is recorded upon receipt or payment of a periodic settlement or termination of swap agreements. Net realized and unrealized gains or losses occurring during the holding period of swap agreements are a component of net realized gain (loss) on swap agreement transactions and change in net unrealized appreciation (depreciation) on swap agreements, respectively. The risks of entering into swap agreements include the possible lack of liquidity, failure of the counterparty to meet its obligations, and that there may be unfavorable changes in the underlying investments or instruments. The other contracts derivative instruments held at period end as disclosed on the Schedule of Investments are indicative of the fund’s typical volume during the period.
Value of Derivative Instruments as of June 30, 2013 | |
| | Asset Derivatives | | | Liability Derivatives | |
Type of
Risk Exposure | Location on Statement
of Assets and Liabilities | | Value | | | Location on Statement
of Assets and Liabilities | | Value | |
Foreign Currency Risk | Unrealized gain on
forward foreign currency exchange contracts | | $41,721 | | | Unrealized loss on
forward foreign currency exchange contracts | | $397,052 | |
Interest Rate Risk | Receivable for variation margin on futures contracts* | | — | | | Payable for variation margin on futures contracts* | | 70 | |
Other Contracts | Swap agreements | | — | | | Swap agreements | | 145,938 | |
| | | | $41,721 | | | | | $543,060 | |
*Included in the unrealized gain (loss) on futures contracts as reported in the Schedule of Investments.
Effect of Derivative Instruments on the Statement of Operations for the Year Ended June 30, 2013 | |
| | Net Realized Gain (Loss) | | | Change in Net Unrealized
Appreciation (Depreciation) | |
Type of
Risk Exposure | Location on Statement
of Operations | | Value | | | Location on Statement
of Operations | | Value | |
Foreign Currency Risk | Net realized gain (loss) on foreign currency transactions | | $299,472 | | | Change in net unrealized appreciation (depreciation) on translation of assets and liabilities in foreign currencies | | $147,169 | |
Interest Rate Risk | Net realized gain (loss) on futures contract transactions | | 17,394 | | | Change in net unrealized appreciation (depreciation)
on futures contracts | | 4,656 | |
Other Contracts | Net realized gain (loss) on swap agreement transactions | | 7,097 | | | Change in net unrealized appreciation (depreciation)
on swap agreements | | (74,869) | |
| | | | $323,963 | | | | | $76,956 | |
8. Risk Factors
There are certain risks involved in investing in foreign securities. These risks include those resulting from future adverse political, social and economic developments, fluctuations in currency exchange rates, the possible imposition of exchange controls, and other foreign laws or restrictions. Investing in emerging markets may accentuate these risks.
There are certain risks involved with investing in forward foreign currency exchange contracts. Changes in the value of foreign currencies against the U.S. dollar could result in gains or losses to the fund. The value of a share of the fund is determined in U.S. dollars. As a result, the fund could recognize a gain or loss based solely upon a change in the exchange rate between the foreign currency and the U.S. dollar. Changes in exchange rates may increase losses and lower gains from the fund’s investments. The overall impact on the fund may be significant depending on the currencies represented in the portfolio and how each one appreciates or depreciates in relation to the U.S. dollar. Currency trends are unpredictable and exchange rates in foreign currencies may fluctuate significantly over short periods of time for a number of reasons, including changes in interest rates, intervention (or the failure to intervene) by U.S. or foreign governments, central banks or Supranational entities, or by the imposition of currency controls or other political developments in the United States or abroad.
The fund’s commodity- and gold-related investments may be subject to greater volatility than investments in traditional securities. The value of the fund’s commodity- and gold-related investments may be affected by changes in overall market movements, interest rate changes, and volatility in commodity- and gold-related indices. The value of these investments may also be affected by factors affecting a particular commodity, such as weather, disease, embargoes, tariffs, taxes and economic, political and regulatory developments.
The fund may be subject to certain risks similar to those associated with direct investment in real estate including but not limited to: local or regional economic conditions, changes in zoning laws, changes in property values, property tax increases, overbuilding, increased competition, environmental contamination, natural disasters, and interest rate risk.
9. Federal Tax Information
The tax character of distributions paid during the years ended June 30, 2013 and June 30, 2012 were as follows:
| | | |
| | 2013 | 2012 |
Distributions Paid From | | |
Ordinary income | — | $1,340,221 |
Long-term capital gains | — | $79,848 |
The book-basis character of distributions made during the year from net investment income or net realized gains may differ from their ultimate characterization for federal income tax purposes. These differences reflect the differing character of certain income items and net realized gains and losses for financial statement and tax purposes, and may result in reclassification among certain capital accounts on the financial statements.
As of June 30, 2013, the federal tax cost of investments and the components of distributable earnings on a tax-basis were as follows:
Federal tax cost of investments | $84,894,024 |
Gross tax appreciation of investments | $ 1,338,816 |
Gross tax depreciation of investments | (2,808,032) |
Net tax appreciation (depreciation) of investments | $(1,469,216) |
Net tax appreciation (depreciation) on derivatives and translation of assets and liabilities in foreign currencies | $ (162,637) |
Net tax appreciation (depreciation) | $(1,631,853) |
Other book-to-tax adjustments | $(5,831) |
Undistributed ordinary income | $110,406 |
Accumulated short-term capital losses | $(1,874,940) |
Accumulated long-term capital losses | $(973,371) |
The difference between book-basis and tax-basis unrealized appreciation (depreciation) is attributable primarily to the tax deferral of losses on wash sales, the realization for tax purposes of unrealized gains (losses) on certain foreign currency exchange contracts and the timing and recognition of partnership income. Other book-to-tax adjustments are attributable primarily to the tax deferral of losses on straddle positions.
Accumulated capital losses represent net capital loss carryovers that may be used to offset future realized capital gains for federal income tax purposes. The capital loss carryovers may be carried forward for an unlimited period. Future capital loss carryover utilization in any given year may be subject to Internal Revenue Code limitations.
For a Share Outstanding Throughout the Years Ended June 30 (except as noted) |
Per-Share Data | Ratios and Supplemental Data |
| | | Income From Investment Operations: | Distributions From: | | | Ratio to Average Net Assets of: | | |
| | Net Asset Value, Beginning
of Period | Net Investment Income (Loss)(1) | Net
Realized
and Unrealized Gain (Loss) | Total From Investment Operations | Net Investment Income | Net
Realized Gains | Total Distributions | Net Asset Value,
End
of Period | Total
Return(2) | Operating Expenses(3) | Operating Expenses (before expense waiver)(3) | Net Investment Income
(Loss) | Net Investment Income
(Loss)
(before expense waiver) | Portfolio Turnover
Rate | Net
Assets,
End of
Period
(in thousands) |
Investor Class |
2013 | $9.99 | (0.03) | (0.04) | (0.07) | — | — | — | $9.92 | (0.70)% | 1.09% | 1.09% | (0.31)% | (0.31)% | 85% | $45,728 |
2012 | $10.71 | 0.01 | (0.57) | (0.56) | (0.13) | (0.03) | (0.16) | $9.99 | (5.32)% | 1.08% | 1.09% | 0.12% | 0.11% | 80% | $65,968 |
2011 | $9.59 | 0.12 | 1.10 | 1.22 | (0.10) | —(4) | (0.10) | $10.71 | 12.78% | 0.95% | 1.09% | 1.27% | 1.13% | 52% | $53,696 |
2010(5) | $10.00 | 0.01 | (0.42) | (0.41) | — | — | — | $9.59 | (4.10)% | 0.95%(6) | 1.09%(6) | 0.79%(6) | 0.65%(6) | 0% | $4,044 |
Institutional Class |
2013 | $9.99 | (0.02) | (0.03) | (0.05) | — | — | — | $9.94 | (0.40)% | 0.89% | 0.89% | (0.11)% | (0.11)% | 85% | $2,995 |
2012 | $10.71 | 0.04 | (0.58) | (0.54) | (0.15) | (0.03) | (0.18) | $9.99 | (5.13)% | 0.88% | 0.89% | 0.32% | 0.31% | 80% | $7,078 |
2011 | $9.59 | 0.15 | 1.09 | 1.24 | (0.12) | —(4) | (0.12) | $10.71 | 12.93% | 0.75% | 0.89% | 1.47% | 1.33% | 52% | $5,428 |
2010(5) | $10.00 | 0.02 | (0.43) | (0.41) | — | — | — | $9.59 | (4.10)% | 0.75%(6) | 0.89%(6) | 0.99%(6) | 0.85%(6) | 0% | $144 |
A Class |
2013 | $9.97 | (0.05) | (0.05) | (0.10) | — | — | — | $9.87 | (1.00)% | 1.34% | 1.34% | (0.56)% | (0.56)% | 85% | $23,108 |
2012 | $10.69 | (0.02) | (0.56) | (0.58) | (0.11) | (0.03) | (0.14) | $9.97 | (5.51)% | 1.33% | 1.34% | (0.13)% | (0.14)% | 80% | $31,305 |
2011 | $9.58 | 0.13 | 1.06 | 1.19 | (0.08) | —(4) | (0.08) | $10.69 | 12.50% | 1.20% | 1.34% | 1.02% | 0.88% | 52% | $30,416 |
2010(5) | $10.00 | 0.01 | (0.43) | (0.42) | — | — | — | $9.58 | (4.20)% | 1.20%(6) | 1.34%(6) | 0.54%(6) | 0.40%(6) | 0% | $3,370 |
For a Share Outstanding Throughout the Years Ended June 30 (except as noted) |
Per-Share Data | Ratios and Supplemental Data |
| | | Income From Investment Operations: | Distributions From: | | | Ratio to Average Net Assets of: | | |
| | Net Asset Value, Beginning
of Period | Net Investment Income (Loss)(1) | Net
Realized
and Unrealized Gain (Loss) | Total From Investment Operations | Net Investment Income | Net
Realized Gains | Total Distributions | Net Asset Value,
End
of Period | Total
Return(2) | Operating Expenses(3) | Operating Expenses (before expense waiver)(3) | Net Investment Income
(Loss) | Net Investment Income
(Loss)
(before expense waiver) | Portfolio Turnover
Rate | Net
Assets,
End of
Period
(in thousands) |
C Class |
2013 | $9.90 | (0.12) | (0.04) | (0.16) | — | — | — | $9.74 | (1.62)% | 2.09% | 2.09% | (1.31)% | (1.31)% | 85% | $11,025 |
2012 | $10.65 | (0.08) | (0.59) | (0.67) | (0.05) | (0.03) | (0.08) | $9.90 | (6.33)% | 2.08% | 2.09% | (0.88)% | (0.89)% | 80% | $8,667 |
2011 | $9.57 | 0.08 | 1.03 | 1.11 | (0.03) | —(4) | (0.03) | $10.65 | 11.64% | 1.95% | 2.09% | 0.27% | 0.13% | 52% | $6,167 |
2010(5) | $10.00 | —(4) | (0.43) | (0.43) | — | — | — | $9.57 | (4.30)% | 1.95%(6) | 2.09%(6) | (0.21)%(6) | (0.35)%(6) | 0% | $356 |
R Class |
2013 | $9.94 | (0.08) | (0.03) | (0.11) | — | — | — | $9.83 | (1.11)% | 1.59% | 1.59% | (0.81)% | (0.81)% | 85% | $136 |
2012 | $10.67 | (0.04) | (0.57) | (0.61) | (0.09) | (0.03) | (0.12) | $9.94 | (5.78)% | 1.58% | 1.59% | (0.38)% | (0.39)% | 80% | $137 |
2011 | $9.58 | 0.01 | 1.15 | 1.16 | (0.07) | —(4) | (0.07) | $10.67 | 12.10% | 1.45% | 1.59% | 0.77% | 0.63% | 52% | $124 |
2010(5) | $10.00 | 0.01 | (0.43) | (0.42) | — | — | — | $9.58 | (4.20)% | 1.45%(6) | 1.59%(6) | 0.29%(6) | 0.15%(6) | 0% | $144 |
Notes to Financial Highlights
(1) | Computed using average shares outstanding throughout the period. |
(2) | Total returns are calculated based on the net asset value of the last business day and do not reflect applicable sales charges, if any. Total returns for periods less than one year are not annualized. |
(3) | Ratio of operating expenses to average net assets does not include any fees and expenses of the acquired funds. |
(4) | Per-share amount was less than $0.005. |
(5) | April 30, 2010 (fund inception) through June 30, 2010. |
See Notes to Financial Statements.
Report of Independent Registered Public Accounting Firm |
To the Directors of the American Century Quantitative Equity Funds, Inc.
and Shareholders of the Strategic Inflation Opportunities Fund:
In our opinion, the accompanying statement of assets and liabilities, including the schedule of investments, and the related statements of operations and of changes in net assets and the financial highlights present fairly, in all material respects, the financial position of the Strategic Inflation Opportunities Fund (one of the fourteen funds comprising the American Century Quantitative Equity Funds, Inc., hereafter referred to as the “Fund”) at June 30, 2013, the results of its operations for the year then ended, the changes in its net assets for each of the two years in the period then ended and the financial highlights for each of the periods presented, in conformity with accounting principles generally accepted in the United States of America. These financial statements and financial highlights (hereafter referred to as “financial statements”) are the responsibility of the Fund’s management; our responsibility is to express an opinion on these financial statements based on our audits. We conducted our audits of these financial statements in accordance with the standards of the Public Company Accounting Oversight Board (United States). Those standards require that we plan and perform the audit to obtain reasonable assurance about whether the financial statements are free of material misstatement. An audit includes examining, on a test basis, evidence supporting the amounts and disclosures in the financial statements, assessing the accounting principles used and significant estimates made by management, and evaluating the overall financial statement presentation. We believe that our audits, which included confirmation of securities at June 30, 2013 by correspondence with the custodian and brokers, provide a reasonable basis for our opinion.
PricewaterhouseCoopers LLP
Kansas City, Missouri
August 21, 2013
Board of Directors
The individuals listed below serve as directors of the funds. Each director will continue to serve in this capacity until death, retirement, resignation or removal from office. The board has adopted a mandatory retirement age for directors who are not “interested persons,” as that term is defined in the Investment Company Act (independent directors). Independent directors shall retire on December 31 of the year in which they reach their 75th birthday; provided, however, that on or after January 1, 2022, independent directors shall retire on December 31 of the year in which they reach their 76th birthday.
Mr. Thomas is the only director who is an “interested person” because he currently serves as President and Chief Executive Officer of American Century Companies, Inc. (ACC), the parent company of American Century Investment Management, Inc. (ACIM or the advisor).
The other directors (more than three-fourths of the total number) are independent; that is, they have never been employees, directors or officers of, and have no financial interest in, ACC or any of its wholly owned, direct or indirect, subsidiaries, including ACIM, American Century Investment Services, Inc. (ACIS) and American Century Services, LLC (ACS). The directors serve in this capacity for eight (in the case of Mr. Thomas, 15) registered investment companies in the American Century Investments family of funds.
The following table presents additional information about the directors. The mailing address for each director other than Mr. Thomas is 1665 Charleston Road, Mountain View, California 94043. The mailing address for Mr. Thomas is 4500 Main Street, Kansas City, Missouri 64111.
| | | | | | |
Name
(Year of Birth) | Position(s) Held with Funds | Length of Time Served | Principal Occupation(s) During Past 5 Years | Number of American Century Portfolios Overseen
by Director | Other Directorships Held During Past 5 Years |
Independent Directors |
Tanya S. Beder (1955) | Director | Since 2011 | Chairman, SBCC Group Inc. (independent advisory services) (2006 to present) | 41 | CYS Investments, Inc. (specialty finance company) |
Jeremy I. Bulow (1954) | Director | Since 2011 | Professor of Economics, Stanford University,
Graduate School of
Business (1979 to present) | 41 | None |
Ronald J. Gilson (1946) | Director and Chairman of the Board | Since 1995 | Charles J. Meyers Professor of Law and Business, Stanford Law School (1979 to present); Marc and Eva Stern Professor of Law and Business, Columbia University School of Law
(1992 to present) | 41 | None |
Frederick L. A. Grauer
(1946) | Director | Since 2008 | Senior Advisor, BlackRock, Inc. (investment management firm) (2010 to 2011); Senior Advisor, Barclays Global Investors (investment management firm) (2003 to 2009) | 41 | None |
| | | | | | |
Name
(Year of Birth) | Position(s) Held with Funds | Length of Time Served | Principal Occupation(s) During Past 5 Years | Number of American Century Portfolios Overseen
by Director | Other Directorships Held During Past 5 Years |
Independent Directors |
Peter F. Pervere (1947) | Director | Since 2007 | Retired | 41 | Intraware, Inc. (2003 to 2009) |
Myron S. Scholes (1941) | Director | Since 1980 | Chairman, Platinum Grove Asset Management, L.P. (asset manager) (1999 to 2009); Frank E. Buck Professor of Finance-Emeritus, Stanford Graduate School of Business (1996 to present) | 41 | Dimensional Fund Advisors (investment advisor); CME Group, Inc. (futures and options exchange) |
John B. Shoven (1947) | Director | Since 2002 | Professor of Economics, Stanford University
(1973 to present) | 41 | Cadence Design Systems; Exponent; Financial Engines |
| |
Interested Director |
Jonathan S. Thomas
(1963) | Director and President | Since 2007 | President and Chief Executive Officer, ACC (March 2007 to present). Also serves as Chief Executive Officer and Manager, ACS; Executive Vice President, ACIM; Director, ACC, ACIM and other ACC subsidiaries | 106 | None |
OfficersThe following table presents certain information about the executive officers of the funds. Each officer serves as an officer for each of the 15 investment companies in the American Century family of funds, unless otherwise noted. No officer is compensated for his or her service as an officer of the funds. The listed officers are interested persons of the funds and are appointed or re-appointed on an annual basis. The mailing address for each of the officers listed below is 4500 Main Street, Kansas City, Missouri 64111.
| | | |
Name
(Year of Birth) | Offices with the Funds | Principal Occupation(s) During the Past Five Years |
Jonathan S. Thomas
(1963) | Director and President since 2007 | President and Chief Executive Officer, ACC (March 2007 to present). Also serves as Chief Executive Officer and Manager, ACS; Executive Vice President, ACIM; Director, ACC, ACIM and other ACC subsidiaries |
Maryanne L. Roepke
(1956) | Chief Compliance Officer since 2006 and Senior Vice President since 2000 | Chief Compliance Officer, American Century funds, ACIM and ACS (August 2006 to present). Also serves as Senior Vice President, ACS |
Charles A. Etherington (1957) | General Counsel since 2007 and Senior Vice President since 2006 | Attorney, ACC (February 1994 to present); Vice President, ACC (November 2005 to present); General Counsel, ACC (March 2007 to present). Also serves as General Counsel, ACIM, ACS, ACIS and other ACC subsidiaries; and Senior Vice President, ACIM and ACS |
C. Jean Wade (1964) | Vice President, Treasurer and Chief Financial Officer since 2012 | Vice President, ACS (February 2000 to present) |
Robert J. Leach (1966) | Vice President since 2006 and Assistant Treasurer since 2012 | Vice President, ACS (February 2000 to present) |
David H. Reinmiller (1963) | Vice President since 2001 | Attorney, ACC (January 1994 to present); Associate General Counsel, ACC (January 2001 to present). Also serves as Vice President, ACIM and ACS |
Ward D. Stauffer (1960) | Secretary since 2005 | Attorney, ACC (June 2003 to present) |
The Statement of Additional Information has additional information about the fund’s directors and is available without charge, upon request, by calling 1-800-345-2021.
Approval of Management Agreement |
At a meeting held on June 11, 2013, the Fund’s Board of Directors/Trustees unanimously approved the renewal of the management agreement pursuant to which American Century Investment Management, Inc. (the “Advisor”) acts as the investment advisor for the Fund. Under Section 15(c) of the Investment Company Act, contracts for investment advisory services are required to be reviewed, evaluated, and approved by a majority of a fund’s directors/trustees (the “Directors”), including a majority of the independent Directors each year. The Board regards this annual evaluation and renewal as one of its most important responsibilities.
In connection with their annual review and evaluation, the independent Directors memorialized a statement regarding the relationship between their ongoing obligations to oversee and evaluate the performance of the Advisor and their consideration of renewal of the management agreement. In that statement, the independent Directors noted that their assessment of the Advisor’s performance is an ongoing process that takes place over the entire year and is informed by all of the information that the Board and its committees receive and consider over time. This information, together with the materials provided in connection with the review, are central to the Board’s assessment of the Advisor’s performance and its determination whether to renew the Fund’s management agreement.
Prior to its consideration of the renewal of the management agreement, the Board requested and reviewed extensive data and analysis relating to the proposed renewal. This information and analysis was compiled by the Advisor and certain independent providers of evaluation data concerning the Fund and the services provided to the Fund by the Advisor.
In connection with its consideration of the renewal of the management agreement, the Board’s review and evaluation of the services provided by the Advisor included, but was not limited to, the following:
• | the nature, extent, and quality of investment management, shareholder services, and other services provided by the Advisor to the Fund; |
• | the wide range of other programs and services the Advisor provides to the Fund and its shareholders on a routine and non-routine basis; |
• | the investment performance of the Fund, including data comparing the Fund’s performance to appropriate benchmarks and/or a peer group of other mutual funds with similar investment objectives and strategies; |
• | data comparing the cost of owning the Fund to the cost of owning similar funds; |
• | the Advisor’s compliance policies, procedures, and regulatory experience; |
• | financial data showing the cost of services provided to the Fund, the profitability of the Fund to the Advisor, and the overall profitability of the Advisor; |
• | possible economies of scale associated with the Advisor’s management of the Fund and other accounts under its management; |
• | data comparing services provided and charges to other investment management clients of the Advisor; and |
• | consideration of collateral benefits derived by the Advisor from the management of the Fund. |
In keeping with its practice, the Board held two in-person meetings to review and discuss the information provided. The Board also had the benefit of the advice of its independent counsel throughout the period.
Factors Considered
The Directors considered all of the information provided by the Advisor, the independent data providers, and the Board’s independent counsel in connection with the review, and evaluated such information for the Fund. In connection with their review, the Directors did not identify any single factor as being all-important or controlling and each Director may have attributed different levels of importance to different factors. In deciding to renew the management agreement, the Board based its decision on a number of factors, including the following:
Nature, Extent and Quality of Services — Generally. Under the management agreement, the Advisor is responsible for providing or arranging for all services necessary for the operation of the Fund. The Board noted that under the management agreement, the Advisor provides or arranges at its own expense a wide variety of services including:
• | constructing and designing the Fund |
• | portfolio research and security selection |
• | initial capitalization/funding |
• | daily valuation of the Fund’s portfolio |
• | shareholder servicing and transfer agency, including shareholder confirmations, recordkeeping, and communications |
• | regulatory and portfolio compliance |
• | marketing and distribution |
The Board noted that many of these services have expanded over time both in terms of quantity and complexity in response to shareholder demands, competition in the industry, changing distribution channels, and the changing regulatory environment.
Investment Management Services. The nature of the investment management services provided to the Fund is quite complex and allows Fund shareholders access to professional money management, instant diversification of their investments within an asset class, the opportunity to easily diversify among asset classes by investing in or exchanging among various American Century Investments funds, and liquidity. In evaluating investment performance, the Board expects the Advisor to manage the Fund in accordance with its investment objectives and approved strategies. Further, the Directors recognize that the Advisor has an obligation to seek the best execution of fund trades. In providing these services, the Advisor utilizes teams of investment professionals (portfolio managers, analysts, research assistants, and securities traders) who require extensive information technology, research, training, compliance and other systems to conduct their business. The Board, directly and through its Portfolio Committee, regularly reviews investment performance information for the Fund, together with comparative information for appropriate benchmarks and/or peer groups of similarly-managed funds, over different time horizons. The Directors also review detailed performance information during the management agreement approval process. If performance concerns are identified, the Fund receives special reviews until performance improves, during which the Board discusses with the Advisor the reasons for such results (e.g., market conditions, security selection) and any efforts being undertaken to improve performance. The Board found the investment management services provided by the Advisor to the Fund to meet or exceed industry standards. More detailed information about the Fund’s performance can be found in the Performance and Portfolio Commentary sections of this report.
Shareholder and Other Services. Under the management agreement, the Advisor provides the Fund with a comprehensive package of transfer agency, shareholder, and other services. The Board, directly and through various committees of the Board, regularly reviews reports and evaluations of such services at its regular meetings. These reports include, but are not limited to, information regarding the operational efficiency and accuracy of the shareholder and transfer agency services provided, staffing levels, shareholder satisfaction (as measured by external as well as internal sources), technology support, new products and services offered to Fund shareholders, securities trading activities, portfolio valuation services, auditing services, and legal and operational compliance activities. Certain aspects of shareholder and transfer agency service level efficiency and the quality of securities trading activities are measured by independent third party providers and are presented in comparison to other fund groups not managed by the Advisor. The Board found the services provided by the Advisor to the Fund under the management agreement to be competitive and of high quality.
Costs of Services and Profitability. The Advisor provides detailed information concerning its cost of providing various services to the Fund, its profitability in managing the Fund, its overall profitability, and its financial condition. The Directors have reviewed with the Advisor the methodology used to prepare this financial information. The financial information regarding the Advisor is considered in evaluating the Advisor’s financial condition, its ability to continue to provide services under the management agreement, and the reasonableness of the current management fee. The Board concluded that the Advisor’s profits were reasonable in light of the services provided to the Fund.
Ethics. The Board generally considers the Advisor’s commitment to providing quality services to shareholders and to conducting its business ethically. They noted that the Advisor’s practices generally meet or exceed industry best practices.
Economies of Scale. The Board also reviewed information provided by the Advisor regarding the possible existence of economies of scale in connection with the management of the Fund. The Board concluded that economies of scale are difficult to measure and predict with precision, especially on a fund-by-fund basis. The Board concluded that the Advisor is appropriately sharing economies of scale through its competitive fee structure, offering competitive fees from fund inception, and through reinvestment in its business to provide shareholders additional content and services.
Comparison to Other Funds’ Fees. The management agreement provides that the Fund pay the Advisor a single, all-inclusive (or unified) management fee for providing all services necessary for the management and operation of the Fund, other than brokerage expenses, taxes, interest, extraordinary expenses, and the fees and expenses of the Fund’s independent directors (including their independent legal counsel) and expenses incurred in connection with the provision of shareholder services and distribution services under a plan adopted pursuant to Rule 12b-1 under the 1940 Act. Under the unified fee structure, the Advisor is responsible for providing all investment advisory, custody, audit, administrative, compliance, recordkeeping, marketing and shareholder services, or arranging and supervising third parties to provide such services. By contrast, most other funds are charged a variety of fees, including an investment advisory fee, a transfer agency fee, an administrative fee, distribution charges and other expenses. Other than their investment advisory fees and any applicable Rule 12b-1 distribution fees, all other components of the total fees charged by these other funds may be increased without shareholder approval. The Board believes the unified fee structure is a benefit to Fund shareholders because it clearly discloses to shareholders the cost of owning Fund shares, and, since the unified fee cannot be increased without a vote of Fund shareholders, it shifts to the Advisor the risk of increased costs of operating the Fund and provides a direct incentive to minimize administrative inefficiencies. Part of the Board’s analysis of fee levels involves reviewing certain evaluative data compiled by an independent provider and comparing the Fund’s unified fee to the total expense ratio of other funds in the Fund’s peer group. The Board concluded that the management fee paid by the Fund to the Advisor under the management agreement is reasonable in light of the services provided to the Fund.
Comparison to Fees and Services Provided to Other Clients of the Advisor. The Board also requested and received information from the Advisor concerning the nature of the services, fees, costs and profitability of its advisory services to advisory clients other than the Fund. They observed that these varying types of client accounts require different services and involve different regulatory and entrepreneurial risks than the management of the Fund. The Board analyzed this information and concluded that the fees charged and services provided to the Fund were reasonable by comparison.
Collateral or “Fall-Out” Benefits Derived by the Advisor. The Board considered the existence of collateral benefits the Advisor may receive as a result of its relationship with the Fund. They concluded that the Advisor’s primary business is managing mutual funds and it generally does not use fund or shareholder information to generate profits in other lines of business, and therefore does not derive any significant collateral benefits from them. The Board noted that the Advisor receives proprietary research from broker-dealers that execute fund portfolio transactions and concluded that this research is likely to benefit Fund shareholders. The Board also determined that the Advisor is able to provide investment management services to certain clients other than the Fund, at least in part, due to its existing infrastructure built to serve the fund complex. The Board concluded, however, that the assets of those other clients are not material to the analysis and, where applicable, may be included with the assets of the Fund to determine breakpoints in the management fee schedule.
Existing Relationship. The Board also considered whether there was any reason for not continuing the existing arrangement with the Advisor. In this regard, the Board was mindful of the potential disruptions of the Fund’s operations and various risks, uncertainties, and other effects that could occur as a result of a decision not to continue such relationship. In particular, the Board recognized that most shareholders have invested in the Fund on the strength of the Advisor’s industry standing and reputation and in the expectation that the Advisor will have a continuing role in providing advisory services to the Fund.
Conclusion of the Directors. As a result of this process, the Board, including all of the independent directors and assisted by the advice of independent legal counsel, taking into account all of the factors discussed above and the information provided by the Advisor and others, concluded that the management agreement between the Fund and the Advisor is fair and reasonable in light of the services provided and should be renewed.
Retirement Account Information
As required by law, distributions you receive from certain IRAs are subject to federal income tax withholding, unless you elect not to have withholding apply. Tax will be withheld on the total amount withdrawn even though you may be receiving amounts that are not subject to withholding, such as nondeductible contributions. In such case, excess amounts of withholding could occur. You may adjust your withholding election so that a greater or lesser amount will be withheld.
If you don’t want us to withhold on this amount, you must notify us to not withhold the federal income tax. You may notify us in writing or in certain situations by telephone or through other electronic means. For systematic withdrawals, your withholding election will remain in effect until revoked or changed by filing a new election. You have the right to revoke your election at any time.
Remember, even if you elect not to have income tax withheld, you are liable for paying income tax on the taxable portion of your withdrawal. If you elect not to have income tax withheld or you don’t have enough income tax withheld, you may be responsible for payment of estimated tax. You may incur penalties under the estimated tax rules if your withholding and estimated tax payments are not sufficient. You can reduce or defer the income tax on a distribution by directly or indirectly rolling such distribution over to another IRA or eligible plan. You should consult your tax advisor for additional information.
State tax will be withheld if, at the time of your distribution, your address is within one of the mandatory withholding states and you have federal income tax withheld (or as otherwise required by state law). State taxes will be withheld from your distribution in accordance with the respective state rules.
Distributions you receive from 403(b), 457 and qualified plans are subject to special tax and withholding rules. Your plan administrator or plan sponsor is required to provide you with a special tax notice explaining those rules at the time you request a distribution. If applicable, federal and/or state taxes may be withheld from your distribution amount.
Proxy Voting Guidelines
American Century Investment Management, Inc., the fund’s investment advisor, is responsible for exercising the voting rights associated with the securities purchased and/or held by the fund. A description of the policies and procedures the advisor uses in fulfilling this responsibility is available without charge, upon request, by calling 1-800-345-2021. It is also available on American Century Investments’ website at americancentury.com and on the Securities and Exchange Commission’s website at sec.gov. Information regarding how the investment advisor voted proxies relating to portfolio securities during the most recent 12-month period ended June 30 is available on the “About Us” page at americancentury.com. It is also available at sec.gov.
Quarterly Portfolio Disclosure
The fund files its complete schedule of portfolio holdings with the Securities and Exchange Commission (SEC) for the first and third quarters of each fiscal year on Form N-Q. The fund’s Forms N-Q are available on the SEC’s website at sec.gov, and may be reviewed and copied at the SEC’s Public Reference Room in Washington, DC. Information on the operation of the Public Reference Room may be obtained by calling 1-800-SEC-0330. The fund also makes its complete schedule of portfolio holdings for the most recent quarter of its fiscal year available on its website at americancentury.com and, upon request, by calling 1-800-345-2021.
Contact Us | americancentury.com |
Automated Information Line | 1-800-345-8765 |
Investor Services Representative | 1-800-345-2021
or 816-531-5575 |
Investors Using Advisors | 1-800-378-9878 |
Business, Not-For-Profit, Employer-Sponsored Retirement Plans | 1-800-345-3533 |
Banks and Trust Companies, Broker-Dealers, Financial Professionals, Insurance Companies | 1-800-345-6488 |
Telecommunications Device for the Deaf | 1-800-634-4113 |
American Century Quantitative Equity Funds, Inc.
Investment Advisor:
American Century Investment Management, Inc.
Kansas City, Missouri
This report and the statements it contains are submitted for the general information of our shareholders. The report is not authorized for distribution to prospective investors unless preceded or accompanied by an effective prospectus.
©2013 American Century Proprietary Holdings, Inc. All rights reserved.
CL-ANN-79318 1308
ANNUAL REPORT | JUNE 30, 2013 |
Utilities Fund
President’s Letter | 2 |
Market Perspective | 3 |
Performance | 4 |
Portfolio Commentary | 5 |
Fund Characteristics | 7 |
Shareholder Fee Example | 8 |
Schedule of Investments | 10 |
Statement of Assets and Liabilities | 12 |
Statement of Operations | 13 |
Statement of Changes in Net Assets | 14 |
Notes to Financial Statements | 15 |
Financial Highlights | 19 |
Report of Independent Registered Public Accounting Firm | 20 |
Management | 21 |
Approval of Management Agreement | 24 |
Additional Information | 29 |
Any opinions expressed in this report reflect those of the author as of the date of the report, and do not necessarily represent the opinions of American Century Investments® or any other person in the American Century Investments organization. Any such opinions are subject to change at any time based upon market or other conditions and American Century Investments disclaims any responsibility to update such opinions. These opinions may not be relied upon as investment advice and, because investment decisions made by American Century Investments funds are based on numerous factors, may not be relied upon as an indication of trading intent on behalf of any American Century Investments fund. Security examples are used for representational purposes only and are not intended as recommendations to purchase or sell securities. Performance information for comparative indices and securities is provided to American Century Investments by third party vendors. To the best of American Century Investments’ knowledge, such information is accurate at the time of printing.
Jonathan Thomas
Dear Investor:
Thank you for reviewing this annual report for the 12 months ended June 30, 2013. It provides investment performance, market analysis, and portfolio information, presented with the expert perspective of our portfolio management team.
Annual reports remain important vehicles for conveying information about fund returns, including key factors that affected fund performance. For additional, updated investment and market insights, we encourage you to visit our website, americancentury.com.
Generally Favorable Fiscal-Year Returns for U.S. Stocks and High-Yield Bonds
The 12-month reporting period began in the summer of 2012 with uncertainties caused by slowing economies, as well as the upcoming November elections and year-end fiscal deadlines in the U.S. It ended with more uncertainty about the future of U.S. monetary stimulus. In between, aggressive monetary intervention by central banks encouraged investors to take more risk, generally boosting stocks at the expense of government bonds.
U.S. mid-cap, small-cap, and value stock indices achieved performance leadership during the period, outpacing the S&P 500 Index’s 20.60% return. U.S. stocks generally outperformed non-U.S. equities—the MSCI EAFE Index returned 18.62% and the MSCI Emerging Markets Index advanced 2.87%, affected by slowing growth in emerging market economies.
Slower emerging market growth also hindered commodity price gains and helped keep inflation under control. As a result, assets used as inflation hedges, including inflation-indexed securities and precious metals, lagged other assets. Gold, in particular, plunged, starting last October. And Treasury inflation-protected securities (TIPS) were among the lowest performers in the U.S. bond market. Bond index returns generally ranged from approximately 10% gains for U.S. corporate high-yield indices all the way down to negative returns for longer-maturity global Treasury benchmarks.
Despite signs of improvement in 2013, U.S. economic growth is subpar compared with past recession recoveries, and remains vulnerable to threats that could trigger another slowdown and market volatility. Therefore, we continue to believe in a disciplined, diversified, long-term investment approach, using professionally managed stock and bond portfolios—as appropriate—for meeting financial goals. We appreciate your continued trust in us in this volatile environment.
Sincerely,
Jonathan Thomas
President and Chief Executive Officer
American Century Investments
By Scott Wittman, Chief Investment Officer, Asset Allocation and Quantitative Equity
Central Bank Actions, Relative U.S. Economic Gains Drove Stocks Higher
Stock market performance remained robust during the 12-month period ended June 30, 2013. Despite persistent concerns about weak global growth and Europe’s ongoing financial crisis, investors largely focused on central bank stimulus measures and marginally-improving U.S. economic data, which fueled market optimism.
Early in the period, in response to disappointing U.S. economic data, the U.S. Federal Reserve (the Fed) launched its third—and most aggressive—quantitative easing (QE) program, or monthly purchases of $40 billion in government agency mortgage-backed securities. Later in 2012, the Fed expanded the program to include $45 billion in Treasury purchases, bringing its total bond buying to $85 billion per month. This unprecedented program, combined with relatively healthy corporate earnings, significant housing market gains and modest improvements in the labor market, helped keep stocks and other riskier assets in favor.
The Fed rattled the financial markets late in the reporting period, with comments about “tapering” its quantitative easing program. Fed Chairman Ben Bernanke said the central bank could begin scaling back its bond buying later in 2013 if the economy continues to improve. After reaching record highs in May, stocks stumbled in June, following Bernanke’s comments. Late in the month, the Fed toned down its tapering talk, and stocks recovered some of their June losses. Overall, most U.S. stock benchmarks generated stellar 12-month returns, largely aided by strong double-digit gains posted during the first calendar quarter of 2013.
Value Stocks Outpaced Growth Stocks
Across the capitalization spectrum, value stocks were the performance leaders for the 12-month period. Much of this was due to strong one-year returns from the financials and health care sectors, where many value-oriented stocks reside. In particular, expectations for rising interest rates—and the late-quarter rate increase triggered by Fed tapering talk—helped boost returns within the financial sector’s banking industry. At the opposite end, the rate-sensitive utilities sector was the weakest relative performer, held back by the prospect of rising interest rates.
U.S. Stock Index Returns |
For the 12 months ended June 30, 2013 |
Russell 1000 Index (Large-Cap) | 21.24% | | Russell 2000 Index (Small-Cap) | 24.21% |
Russell 1000 Growth Index | 17.07% | | Russell 2000 Growth Index | 23.67% |
Russell 1000 Value Index | 25.32% | | Russell 2000 Value Index | 24.77% |
Russell Midcap Index | 25.41% | | | |
Russell Midcap Growth Index | 22.88% | | | |
Russell Midcap Value Index | 27.65% | | | |
Total Returns as of June 30, 2013 |
| | | | Average Annual Returns | |
| | Ticker Symbol | 1 year | 5 years | 10 years | Since Inception | Inception Date |
Investor Class | BULIX | 12.06% | 4.31% | 10.14% | 7.89% | 3/1/93 |
Russell 3000
Utilities Index | — | 10.39% | 5.58% | 8.41% | N/A(1) | — |
S&P 500 Index | — | 20.60% | 7.01% | 7.29% | 8.64% | — |
(1) | Benchmark data first available August 1996. |
Growth of $10,000 Over 10 Years |
$10,000 investment made June 30, 2003 |
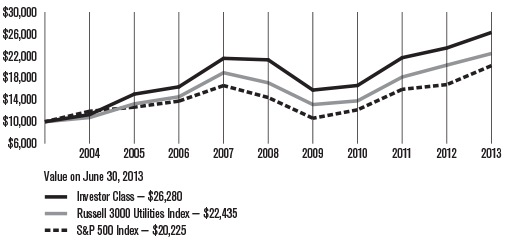
Total Annual Fund Operating Expenses |
Investor Class 0.68% |
The total annual fund operating expenses shown is as stated in the fund’s prospectus current as of the date of this report. The prospectus may vary from the expense ratio shown elsewhere in this report because it is based on a different time period, includes acquired fund fees and expenses, and, if applicable, does not include fee waivers or expense reimbursements.
Data presented reflect past performance. Past performance is no guarantee of future results. Current performance may be higher or lower than the performance shown. Investment return and principal value will fluctuate, and redemption value may be more or less than original cost. To obtain performance data current to the most recent month end, please call 1-800-345-2021 or visit americancentury.com. The fund concentrates its investments in a narrow segment of the total market and is therefore subject to greater risks and market fluctuations than a portfolio representing a broader range of industries.
Data assumes reinvestment of dividends and capital gains, and none of the charts reflect the deduction of taxes that a shareholder would pay on fund distributions or the redemption of fund shares. Returns for the indices are provided for comparison. The fund’s total returns include operating expenses (such as transaction costs and management fees) that reduce returns, while the total returns of
the indices do not.
Portfolio Managers: Bill Martin and Lynette Pang
Performance Summary
Utilities returned 12.06% for the 12 months ended June 30, 2013, outpacing the 10.39% return of its benchmark, the Russell 3000 Utilities Index. The S&P 500 Index, a broad market measure, returned 20.60%.
As described on page 3, the U.S. stock market achieved solid returns for the 12-month period, although global macroeconomic concerns kept volatility levels elevated throughout the period. Within the benchmark, wireless telecommunication companies experienced strong growth, benefiting from the trend toward mobile communicating and computing. Diversified telecom companies delivered sound, but more prosaic returns. Within the traditional utilities group, independent power producers performed well, benefiting from an easy supply of inexpensive natural gas for much of the reporting period. Against this backdrop, Utilities delivered gains on an absolute basis, and outperformed its benchmark.
From a broad sector perspective, stock selection within the traditional utilities sector and an overweight allocation to the information technology sector accounted for the vast majority of outperformance relative to the benchmark. Key detractors from relative performance resided in the industrials and telecommunications sectors.
Within the utilities sector, stock choices in the electric utilities industry contributed significantly to relative returns. Stock decisions in the gas utilities segment also benefited relative returns. Stock decisions among independent power producers detracted from relative results. The portfolio avoided water utilities, an allocation decision that trimmed results, as did stock decisions among multi-utilities.
Utilities Contributed
The traditional utilities sector, which represented almost 60% of the portfolio, was a meaningful source of positive relative returns for the reporting period. Within the sector, the electric utilities group accounted for the bulk of relative gains. In the group, the portfolio held underweight positions in Duke Energy and FirstEnergy, which both underperformed in the benchmark. In the gas utilities group, an overweight position in UGI contributed meaningfully. The company delivered earnings that exceeded analysts’ expectations due to colder winter weather, as well as a program to convert customers from heating oil to natural gas.
Not all segments of the traditional utilities sector contributed positively, however. Stock decisions among independent power producers trimmed relative gains. In the group, the portfolio missed several strong performers in the benchmark, while holding one position that was a benchmark laggard. It was a similar story in the multi-utilities segment, where stock choices hurt results versus the benchmark. Avoiding water utilities altogether also hurt relative returns, as the portfolio missed two benchmark companies that outperformed during the reporting period.
Information Technology, Energy Were Sources of Relative Gains
Several key contributors to relative gains were housed outside of the traditional utilities sector. The portfolio held an overweight position in technology company j2 Global. The provider of cloud communications and storage messaging services gained as it achieved record-high revenues and consistently grew its quarterly dividend through the reporting period.
The energy sector was home to another key contributor, Energen. The natural gas and oil producer’s share price climbed amid rising oil and natural gas prices.
Holdings in Industrials, Telecommunications Lagged, but Some Positions Helped
The portfolio held one position in the industrials sector, Pike Electric. The company detracted due to expansion costs and poor weather conditions, which crimped construction activity. The company’s share price declined while it was held in the portfolio, but delivered solid gains in the benchmark for the reporting period.
An underweight allocation to the telecommunications sector detracted from returns versus the benchmark, although the portfolio’s absolute returns outpaced those in the benchmark. The portfolio was underweight two positions—Verizon Communications and Sprint Nextel—that outperformed in the benchmark. Both companies benefited from strong subscriber growth as a result of iPhone activations. An underweight position in AT&T, though, benefited relative results. The company’s share price gained during the reporting period, but lagged benchmark returns.
Outlook
Utilities employs a structured, disciplined investment approach. The management team incorporates both growth and value measures into its stock selection process and attempts to balance the portfolio’s risk and expected return.
The team has continued to avoid water utilities and is underweight gas utilities in the portfolio. The portfolio has overweight allocations to multi-utilities, electric utilities, and independent power producers, as our quantitative process has identified opportunities in these areas.
Utilities Market Returns |
For the 12 months ended June 30, 2013 |
Broad U.S. Stock Market | | Primary Utilities Industries in Fund Benchmark |
S&P 500 Index | 20.60% | | Diversified Telecommunication Services | 8.67% |
Nasdaq Composite Index* | 15.95% | | Electric Utilities | 5.81% |
Broad Utilities Market | | | Multi-Utilities | 10.78% |
Lipper Utility Funds Index | 13.36% | | Gas Utilities | 13.55% |
Russell 3000 Utilities Index | 10.39% | | Wireless Telecommunication Services | 90.79% |
* Return does not reflect the reinvestment of dividends on securities in the index. Had such reinvestments been included, returns would have been higher.
JUNE 30, 2013 |
Top Ten Holdings | % of net assets |
AT&T, Inc. | 9.8% |
Verizon Communications, Inc. | 6.4% |
CenturyLink, Inc. | 4.6% |
Entergy Corp. | 4.5% |
PG&E Corp. | 4.4% |
Public Service Enterprise Group, Inc. | 4.4% |
Edison International | 4.3% |
DTE Energy Co. | 4.2% |
PPL Corp. | 4.1% |
Ameren Corp. | 3.9% |
| | |
Sub-Industry Allocation | % of net assets |
Electric Utilities | 29.9% |
Integrated Telecommunication Services | 23.8% |
Multi-Utilities | 21.8% |
Gas Utilities | 5.0% |
Wireless Telecommunication Services | 3.9% |
Internet Software and Services | 3.8% |
Independent Power Producers and Energy Traders | 3.8% |
Communications Equipment | 2.9% |
Construction and Engineering | 1.9% |
Alternative Carriers | 0.9% |
Oil and Gas Exploration and Production | 0.9% |
Cash and Equivalents* | 1.4% |
*Includes temporary cash investments and other assets and liabilities. |
| | |
Types of Investments in Portfolio | % of net assets |
Common Stocks | 98.6% |
Temporary Cash Investments | 1.1% |
Other Assets and Liabilities | 0.3% |
Fund shareholders may incur two types of costs: (1) transaction costs, including sales charges (loads) on purchase payments and redemption/exchange fees; and (2) ongoing costs, including management fees; distribution and service (12b-1) fees; and other fund expenses. This example is intended to help you understand your ongoing costs (in dollars) of investing in your fund and to compare these costs with the ongoing cost of investing in other mutual funds.
The example is based on an investment of $1,000 made at the beginning of the period and held for the entire period from January 1, 2013 to June 30, 2013.
Actual Expenses
The table provides information about actual account values and actual expenses for each class. You may use the information, together with the amount you invested, to estimate the expenses that you paid over the period. First, identify the share class you own. Then simply divide your account value by $1,000 (for example, an $8,600 account value divided by $1,000 = 8.6), then multiply the result by the number under the heading “Expenses Paid During Period” to estimate the expenses you paid on your account during this period.
If you hold Investor Class shares of any American Century Investments fund, or Institutional Class shares of the American Century Diversified Bond Fund, in an American Century Investments account (i.e., not a financial intermediary or retirement plan account), American Century Investments may charge you a $12.50 semiannual account maintenance fee if the value of those shares is less than $10,000. We will redeem shares automatically in one of your accounts to pay the $12.50 fee. In determining your total eligible investment amount, we will include your investments in all personal accounts (including American Century Investments Brokerage accounts) registered under your Social Security number. Personal accounts include individual accounts, joint accounts, UGMA/UTMA accounts, personal trusts, Coverdell Education Savings Accounts and IRAs (including traditional, Roth, Rollover, SEP-, SARSEP- and SIMPLE-IRAs), and certain other retirement accounts. If you have only business, business retirement, employer-sponsored or American Century Investments Brokerage accounts, you are currently not subject to this fee. If you are subject to the Account Maintenance Fee, your account value could be reduced by the fee amount.
Hypothetical Example for Comparison Purposes
The table also provides information about hypothetical account values and hypothetical expenses based on the actual expense ratio of each class of your fund and an assumed rate of return of 5% per year before expenses, which is not the actual return of a fund’s share class. The hypothetical account values and expenses may not be used to estimate the actual ending account balance or expenses you paid for the period. You may use this information to compare the ongoing costs of investing in your fund and other funds. To do so, compare this 5% hypothetical example with the 5% hypothetical examples that appear in the shareholder reports of the other funds.
Please note that the expenses shown in the table are meant to highlight your ongoing costs only and do not reflect any transactional costs, such as sales charges (loads) or redemption/exchange fees. Therefore, the table is useful in comparing ongoing costs only, and will not help you determine the relative total costs of owning different funds. In addition, if these transactional costs were included, your costs would have been higher.
| | | | | |
| | Beginning
Account Value 1/1/13 | Ending
Account Value 6/30/13 | Expenses Paid During Period(1) 1/1/13 – 6/30/13 | Annualized
Expense Ratio(1) |
Actual |
Investor Class | $1,000 | $1,138.60 | $3.55 | 0.67% |
Hypothetical | | | | |
Investor Class | $1,000 | $1,021.47 | $3.36 | 0.67% |
(1) | Expenses are equal to the class’s annualized expense ratio listed in the table above, multiplied by the average account value over the period, multiplied by 181, the number of days in the most recent fiscal half-year, divided by 365, to reflect the one-half year period. |
JUNE 30, 2013
| | | Shares | | | Value | |
Common Stocks — 98.6% | |
ALTERNATIVE CARRIERS — 0.9% | |
Neutral Tandem, Inc. | | 228,105 | | | $ 1,311,603 | |
Premiere Global Services, Inc.(1) | | 158,869 | | | 1,917,549 | |
| | | | | | 3,229,152 | |
COMMUNICATIONS EQUIPMENT — 2.9% | |
QUALCOMM, Inc. | | 168,197 | | | 10,273,473 | |
CONSTRUCTION AND ENGINEERING — 1.9% | |
Pike Electric Corp. | | 529,118 | | | 6,508,151 | |
ELECTRIC UTILITIES — 29.9% | |
American Electric Power Co., Inc. | | 300,151 | | | 13,440,762 | |
Duke Energy Corp. | | 48,582 | | | 3,279,285 | |
Edison International | | 308,925 | | | 14,877,828 | |
El Paso Electric Co. | | 37,584 | | | 1,327,091 | |
Entergy Corp. | | 225,988 | | | 15,746,844 | |
Exelon Corp. | | 81,060 | | | 2,503,133 | |
IDACORP, Inc. | | 16,183 | | | 772,900 | |
NextEra Energy, Inc. | | 44,652 | | | 3,638,245 | |
Pinnacle West Capital Corp. | | 222,816 | | | 12,359,604 | |
PNM Resources, Inc. | | 53,434 | | | 1,185,700 | |
Portland General Electric Co. | | 347,287 | | | 10,623,509 | |
PPL Corp. | | 474,686 | | | 14,363,998 | |
Southern Co. | | 75,411 | | | 3,327,887 | |
Westar Energy, Inc. | | 109,280 | | | 3,492,589 | |
Xcel Energy, Inc. | | 112,193 | | | 3,179,550 | |
| | | | | | 104,118,925 | |
GAS UTILITIES — 5.0% | |
Chesapeake Utilities Corp. | | 49,498 | | | 2,548,652 | |
Laclede Group, Inc. (The) | | 62,639 | | | 2,860,097 | |
UGI Corp. | | 307,347 | | | 12,020,341 | |
| | | | | | 17,429,090 | |
INDEPENDENT POWER PRODUCERS AND ENERGY TRADERS — 3.8% | |
AES Corp. (The) | | 1,094,524 | | | 13,123,343 | |
INTEGRATED TELECOMMUNICATION SERVICES — 23.8% | |
AT&T, Inc. | | 965,643 | | | 34,183,762 | |
Atlantic Tele-Network, Inc. | | 34,000 | | | 1,688,440 | |
BCE, Inc. | | 85,987 | | | 3,527,187 | |
CenturyLink, Inc. | | 448,411 | | | 15,851,329 | |
Frontier Communications Corp. | | 426,856 | | | 1,728,767 | |
HickoryTech Corp. | | 23,007 | | | 244,564 | |
IDT Corp., Class B | | 187,329 | | | 3,501,179 | |
Verizon Communications, Inc. | | 440,253 | | | 22,162,336 | |
| | | | | | 82,887,564 | |
INTERNET SOFTWARE AND SERVICES — 3.8% | |
j2 Global, Inc. | | 310,596 | | | 13,203,436 | |
MULTI-UTILITIES — 21.8% | |
Ameren Corp. | | 396,990 | | | 13,672,336 | |
CenterPoint Energy, Inc. | | 392,987 | | | 9,231,265 | |
Dominion Resources, Inc. | | 61,172 | | | 3,475,793 | |
DTE Energy Co. | | 220,112 | | | 14,749,705 | |
Integrys Energy Group, Inc. | | 69,208 | | | 4,050,744 | |
PG&E Corp. | | 338,644 | | | 15,486,190 | |
Public Service Enterprise Group, Inc. | | 464,931 | | | 15,184,646 | |
| | | | | | 75,850,679 | |
OIL AND GAS EXPLORATION AND PRODUCTION — 0.9% | |
Energen Corp. | | 61,264 | | | 3,201,657 | |
WIRELESS TELECOMMUNICATION SERVICES — 3.9% | |
America Movil SAB de CV Series L ADR | | 121,128 | | | 2,634,534 | |
NTELOS Holdings Corp. | | 219,391 | | | 3,611,176 | |
Shenandoah Telecommunications Co. | | 24,219 | | | 403,973 | |
T-Mobile US, Inc. | | 62,759 | | | 1,557,051 | |
USA Mobility, Inc. | | 240,355 | | | 3,261,617 | |
Vodafone Group plc ADR | | 75,878 | | | 2,180,734 | |
| | | | | | 13,649,085 | |
TOTAL COMMON STOCKS (Cost $287,606,312) | | | 343,474,555 | |
Temporary Cash Investments — 1.1% | |
Repurchase Agreement, Bank of America Merrill Lynch, (collateralized by various
U.S. Treasury obligations, 1.00%, 1/15/14, valued at $506,085), in a joint trading
account at 0.06%, dated 6/28/13, due 7/1/13 (Delivery value $495,735) | | | 495,733 | |
Repurchase Agreement, Credit Suisse First Boston, Inc., (collateralized by various U.S. Treasury obligations, 4.25%, 11/15/40, valued at $1,515,299), in a joint trading account at 0.05%, dated 6/28/13, due 7/1/13 (Delivery value $1,487,203) | | | 1,487,197 | |
Repurchase Agreement, Goldman Sachs & Co., (collateralized by various U.S. Treasury obligations, 3.125%, 11/15/41, valued at $504,228), in a joint trading account at 0.04%, dated 6/28/13, due 7/1/13 (Delivery value $495,734) | | | 495,732 | |
SSgA U.S. Government Money Market Fund | | 1,368,463 | | | 1,368,463 | |
TOTAL TEMPORARY CASH INVESTMENTS (Cost $3,847,125) | | | 3,847,125 | |
TOTAL INVESTMENT SECURITIES — 99.7% (Cost $291,453,437) | | | 347,321,680 | |
OTHER ASSETS AND LIABILITIES — 0.3% | | | 950,471 | |
TOTAL NET ASSETS — 100.0% | | | $348,272,151 | |
Notes to Schedule of Investments
ADR = American Depositary Receipt
See Notes to Financial Statements.
Statement of Assets and Liabilities |
JUNE 30, 2013 | |
Assets | |
Investment securities, at value (cost of $291,453,437) | | $347,321,680 | |
Receivable for capital shares sold | | 144,562 | |
Dividends and interest receivable | | 1,107,688 | |
| | | 348,573,930 | |
| | | | |
Liabilities | |
Payable for capital shares redeemed | | 111,884 | |
Accrued management fees | | 189,895 | |
| | | 301,779 | |
| | | | |
Net Assets | | $348,272,151 | |
| | | | |
Investor Class Capital Shares, $0.01 Par Value | |
Shares authorized | | 80,000,000 | |
Shares outstanding | | 20,606,436 | |
| | | | |
Net Asset Value Per Share | | $16.90 | |
| | | | |
Net Assets Consist of: | |
Capital (par value and paid-in surplus) | | $280,115,576 | |
Undistributed net investment income | | 1,741,486 | |
Undistributed net realized gain | | 10,548,452 | |
Net unrealized appreciation | | 55,866,637 | |
| | | $348,272,151 | |
See Notes to Financial Statements.
YEAR ENDED JUNE 30, 2013 | |
Investment Income (Loss) | |
Income: | | | |
Dividends (net of foreign taxes withheld of $30,667) | | $14,633,615 | |
Interest | | 3,386 | |
| | | 14,637,001 | |
| | | | |
Expenses: | | | |
Management fees | | 2,198,731 | |
Directors’ fees and expenses | | 14,942 | |
Other expenses | | 1,751 | |
| | | 2,215,424 | |
| | | | |
Net investment income (loss) | | 12,421,577 | |
| | | | |
Realized and Unrealized Gain (Loss) | |
Net realized gain (loss) on: | | | |
Investment transactions | | 12,825,707 | |
Foreign currency transactions | | 270 | |
| | | 12,825,977 | |
| | | | |
Change in net unrealized appreciation (depreciation) on: | | | |
Investments | | 10,933,991 | |
Translation of assets and liabilities in foreign currencies | | (1,458 | ) |
| | | 10,932,533 | |
| | | | |
Net realized and unrealized gain (loss) | | 23,758,510 | |
| | | | |
Net Increase (Decrease) in Net Assets Resulting from Operations | | $36,180,087 | |
See Notes to Financial Statements.
Statement of Changes in Net Assets |
YEARS ENDED JUNE 30, 2013 AND JUNE 30, 2012 |
Increase (Decrease) in Net Assets | June 30, 2013 | | | June 30, 2012 | |
Operations |
Net investment income (loss) | $ 12,421,577 | | | $ 11,017,810 | |
Net realized gain (loss) | 12,825,977 | | | 25,430,889 | |
Change in net unrealized appreciation (depreciation) | 10,932,533 | | | (12,860,005 | ) |
Net increase (decrease) in net assets resulting from operations | 36,180,087 | | | 23,588,694 | |
| | | | | | |
Distributions to Shareholders |
From net investment income | (11,910,971 | ) | | (10,207,695 | ) |
From net realized gains | (16,868,526 | ) | | (1,904,502 | ) |
Decrease in net assets from distributions | (28,779,497 | ) | | (12,112,197 | ) |
| | | | | | |
Capital Share Transactions |
Proceeds from shares sold | 96,109,879 | | | 78,049,539 | |
Proceeds from reinvestment of distributions | 27,339,089 | | | 11,419,325 | |
Payments for shares redeemed | (98,901,981 | ) | | (68,797,889 | ) |
Net increase (decrease) in net assets from capital share transactions | 24,546,987 | | | 20,670,975 | |
| | | | | | |
Net increase (decrease) in net assets | 31,947,577 | | | 32,147,472 | |
| | | | | | |
Net Assets |
Beginning of period | 316,324,574 | | | 284,177,102 | |
End of period | $348,272,151 | | | $316,324,574 | |
| | | | | | |
Undistributed net investment income | $1,741,486 | | | $1,159,833 | |
| | | | | | |
Transactions in Shares of the Fund |
Sold | 5,755,035 | | | 4,984,057 | |
Issued in reinvestment of distributions | 1,748,810 | | | 726,185 | |
Redeemed | (6,026,522 | ) | | (4,417,268 | ) |
Net increase (decrease) in shares of the fund | 1,477,323 | | | 1,292,974 | |
See Notes to Financial Statements.
Notes to Financial Statements |
JUNE 30, 2013
1. Organization
American Century Quantitative Equity Funds, Inc. (the corporation) is registered under the Investment Company Act of 1940, as amended (the 1940 Act), as an open-end management investment company and is organized as a Maryland corporation. Utilities Fund (the fund) is one fund in a series issued by the corporation. The fund is diversified as defined under the 1940 Act. The fund’s investment objectives are to seek current income and long-term growth of capital and income. The fund invests at least 80% of its assets in equity securities of companies engaged in the utilities industry.
2. Significant Accounting Policies
The following is a summary of significant accounting policies consistently followed by the fund in preparation of its financial statements. The financial statements are prepared in conformity with accounting principles generally accepted in the United States of America, which may require management to make certain estimates and assumptions at the date of the financial statements. Actual results could differ from these estimates.
Investment Valuations — The fund determines the fair value of its investments and computes its net asset value per share as of the close of regular trading (usually 4 p.m. Eastern time) on the New York Stock Exchange (NYSE) on each day the NYSE is open.
Equity securities that are listed or traded on a domestic securities exchange are valued at the last reported sales price or at the official closing price as provided by the exchange. Equity securities traded on foreign securities exchanges are typically valued at the closing price on the exchange where primarily traded or as of the close of the NYSE, if that is earlier. If no last sales price is reported, or if local convention or regulation so provides, the mean of the latest bid and asked prices is used. Depending on local convention or regulation, securities traded over-the-counter are valued at the mean of the latest bid and asked prices, the last sales price, or the official closing price. In its determination of fair value, the fund may review several factors including: market information specific to a security; news developments in U.S. and foreign markets; the performance of particular U.S. and foreign securities, indices, comparable securities, American Depositary Receipts, Exchange-Traded Funds, and other relevant market indicators.
Debt securities maturing within 60 days at the time of purchase may be valued at cost, plus or minus any amortized discount or premium or at the evaluated mean as provided by an independent pricing service. Evaluated mean prices are commonly derived through utilization of market models, which may consider, among other factors, trade data, quotations from dealers and active market makers, relevant yield curve and spread data, related sector levels, creditworthiness, and other relevant market information on the same or comparable securities.
Investments in open-end management investment companies are valued at the reported net asset value per share. Repurchase agreements are valued at cost.
The value of investments initially expressed in foreign currencies is translated into U.S. dollars at prevailing exchange rates.
If the fund determines that the market price for a portfolio security is not readily available or the valuation methods mentioned above do not reflect a security’s fair value, such security is valued as determined in good faith by the Board of Directors or its designee, in accordance with procedures adopted by the Board of Directors. Circumstances that may cause the fund to use these procedures to value a security include, but are not limited to: a security has been declared in default; trading in a security has been halted during the trading day; there is a foreign market holiday and no trading occurred; or an event occurred between the close of a foreign exchange and the NYSE that may affect the value of a security.
Security Transactions — Security transactions are accounted for as of the trade date. Net realized gains and losses are determined on the identified cost basis, which is also used for federal income tax purposes.
Investment Income — Dividend income less foreign taxes withheld, if any, is recorded as of the ex-dividend date. Distributions received on securities that represent a return of capital or long-term capital gain are recorded as a reduction of cost of investments and/or as a realized gain. The fund may estimate the components of distributions received that may be considered nontaxable distributions or long-term capital gain distributions for income tax purposes. Interest income is recorded on the accrual basis and includes accretion of discounts and amortization of premiums.
Foreign Currency Translations — All assets and liabilities initially expressed in foreign currencies are translated into U.S. dollars at prevailing exchange rates at period end. The fund may enter into spot foreign currency exchange contracts to facilitate transactions denominated in a foreign currency. Purchases and sales of investment securities, dividend and interest income, spot foreign currency exchange contracts, and expenses are translated at the rates of exchange prevailing on the respective dates of such transactions. Net realized and unrealized foreign currency exchange gains or losses related to investment securities are a component of net realized gain (loss) on investment transactions and change in net unrealized appreciation (depreciation) on investments, respectively.
Repurchase Agreements — The fund may enter into repurchase agreements with institutions that American Century Investment Management, Inc. (ACIM) (the investment advisor) has determined are creditworthy pursuant to criteria adopted by the Board of Directors. The fund requires that the collateral, represented by securities, received in a repurchase transaction be transferred to the custodian in a manner sufficient to enable the fund to obtain those securities in the event of a default under the repurchase agreement. ACIM monitors, on a daily basis, the securities transferred to ensure the value, including accrued interest, of the securities under each repurchase agreement is equal to or greater than amounts owed to the fund under each repurchase agreement.
Joint Trading Account — Pursuant to an Exemptive Order issued by the Securities and Exchange Commission, the fund, along with certain other funds in the American Century Investments family of funds, may transfer uninvested cash balances into a joint trading account. These balances are invested in one or more repurchase agreements that are collateralized by U.S. Treasury or Agency obligations.
Income Tax Status — It is the fund’s policy to distribute substantially all net investment income and net realized gains to shareholders and to otherwise qualify as a regulated investment company under provisions of the Internal Revenue Code. Accordingly, no provision has been made for income taxes. The fund files U.S. federal, state, local and non-U.S. tax returns as applicable. The fund’s tax returns are subject to examination by the relevant taxing authority until expiration of the applicable statute of limitations, which is generally three years from the date of filing but can be longer in certain jurisdictions. At this time, management believes there are no uncertain tax positions which, based on their technical merit, would not be sustained upon examination and for which it is reasonably possible that the total amounts of unrecognized tax benefits will significantly change in the next twelve months.
Distributions to Shareholders — Distributions from net investment income, if any, are generally declared and paid quarterly. Distributions from net realized gains, if any, are generally declared and paid annually.
Indemnifications — Under the corporation’s organizational documents, its officers and directors are indemnified against certain liabilities arising out of the performance of their duties to the fund. In addition, in the normal course of business, the fund enters into contracts that provide general indemnifications. The maximum exposure under these arrangements is unknown as this would involve future claims that may be made against a fund. The risk of material loss from such claims is considered by management to be remote.
3. Fees and Transactions with Related Parties
Management Fees — The corporation has entered into a management agreement with ACIM, under which ACIM provides the fund with investment advisory and management services in exchange for a single, unified management fee (the fee). The agreement provides that all expenses of managing and operating the fund, except distribution and service fees, brokerage expenses, taxes, interest, fees and expenses of the independent directors (including legal counsel fees), and extraordinary expenses, will be paid by ACIM. The fee is computed and accrued daily based on the daily net assets of the fund and paid monthly in arrears. The fee consists of (1) an Investment Category Fee based on the daily net assets of the fund and certain other accounts managed by the investment advisor that are in the same broad investment category as the fund and (2) a Complex Fee based on the assets of all the funds in the American Century Investments family of funds. The rates for the Investment Category Fee range from 0.3380% to 0.5200%. The rates for the Complex Fee range from 0.2500% to 0.3100%. The effective annual management fee for the year ended June 30, 2013 was 0.67%.
Related Parties — Certain officers and directors of the corporation are also officers and/or directors of American Century Companies, Inc. (ACC). The corporation’s investment advisor, ACIM, the corporation’s distributor, American Century Investment Services, Inc., and the corporation’s transfer agent, American Century Services, LLC are wholly owned, directly or indirectly, by ACC.
4. Investment Transactions
Purchases and sales of investment securities, excluding short-term investments, for the year ended June 30, 2013 were $144,176,567 and $134,372,260, respectively.
5. Fair Value Measurements
The fund’s securities valuation process is based on several considerations and may use multiple inputs to determine the fair value of the positions held by the fund. In conformity with accounting principles generally accepted in the United States of America, the inputs used to determine a valuation are classified into three broad levels as follows:
• | Level 1 valuation inputs consist of unadjusted quoted prices in an active market for identical securities; |
• | Level 2 valuation inputs consist of direct or indirect observable market data (including quoted prices for similar securities, evaluations of subsequent market events, interest rates, prepayment speeds, credit risk, etc.); or |
• | Level 3 valuation inputs consist of unobservable data (including a fund’s own assumptions). |
The level classification is based on the lowest level input that is significant to the fair valuation measurement. The valuation inputs are not necessarily an indication of the risks associated with investing in these securities or other financial instruments.
The following is a summary of the level classifications as of period end. The Schedule of Investments provides additional information on the fund’s portfolio holdings.
| | | | |
| | Level 1 | Level 2 | Level 3 |
Investment Securities |
Common Stocks | $343,474,555 | — | — |
Temporary Cash Investments | 1,368,463 | $2,478,662 | — |
Total Value of Investment Securities | $344,843,018 | $2,478,662 | — |
6. Risk Factors
The fund concentrates its investments in a narrow segment of the total market. Because of this, the fund may be subject to greater risk and market fluctuations than a portfolio representing a broader range of industries.
7. Federal Tax Information
The tax character of distributions paid during the years ended June 30, 2013 and June 30, 2012 were as follows:
| | | |
| | 2013 | 2012 |
Distributions Paid From |
Ordinary income | $12,275,738 | $10,207,695 |
Long-term capital gains | $16,503,759 | $1,904,502 |
The book-basis character of distributions made during the year from net investment income or net realized gains may differ from their ultimate characterization for federal income tax purposes. These differences reflect the differing character of certain income items and net realized gains and losses for financial statement and tax purposes, and may result in reclassification among certain capital accounts on the financial statements.
As of June 30, 2013, the federal tax cost of investments and the components of distributable earnings on a tax-basis were as follows:
| | |
Federal tax cost of investments | $292,242,827 |
Gross tax appreciation of investments | $59,567,105 |
Gross tax depreciation of investments | (4,488,252) |
Net tax appreciation (depreciation) of investments | $55,078,853 |
Net tax appreciation (depreciation) on translation of assets and liabilities in foreign currencies | $(1,604) |
Net tax appreciation (depreciation) | $55,077,249 |
Undistributed ordinary income | $5,972,479 |
Accumulated long-term gains | $7,106,847 |
The difference between book-basis and tax-basis unrealized appreciation (depreciation) is attributable primarily to the tax deferral of losses on wash sales.
For a Share Outstanding Throughout the Years Ended June 30 (except as noted) |
Per-Share Data | Ratios and Supplemental Data |
| | | Income From Investment Operations: | Distributions From: | | | Ratio to Average Net Assets of: | | |
| | Net Asset Value, Beginning
of Period | Net
Investment Income
(Loss)(1) | Net
Realized and Unrealized
Gain (Loss) | Total From Investment Operations | Net
Investment Income | Net
Realized
Gains | Total Distributions | Net Asset Value,
End of Period | Total
Return(2) | Operating Expenses | Net
Investment Income
(Loss) | Portfolio Turnover
Rate | Net Assets,
End of Period (in thousands) |
Investor Class |
2013 | $16.54 | 0.63 | 1.20 | 1.83 | (0.60) | (0.87) | (1.47) | $16.90 | 12.06% | 0.68% | 3.79% | 41% | $348,272 |
2012 | $15.93 | 0.60 | 0.66 | 1.26 | (0.55) | (0.10) | (0.65) | $16.54 | 8.20% | 0.68% | 3.83% | 55% | $316,325 |
2011 | $12.62 | 0.51 | 3.30 | 3.81 | (0.50) | — | (0.50) | $15.93 | 30.50% | 0.69% | 3.47% | 17% | $284,177 |
2010 | $12.42 | 0.49 | 0.19 | 0.68 | (0.48) | — | (0.48) | $12.62 | 5.30% | 0.70% | 3.75% | 11% | $228,101 |
2009 | $17.46 | 0.46 | (4.98) | (4.52) | (0.52) | — | (0.52) | $12.42 | (25.89)% | 0.70% | 3.54% | 14% | $236,734 |
Notes to Financial Highlights
(1) | Computed using average shares outstanding throughout the period. |
(2) | Total returns are calculated based on the net asset value of the last business day. Total returns for periods less than one year are not annualized. |
See Notes to Financial Statements.
Report of Independent Registered Public Accounting Firm |
To the Directors of the American Century Quantitative Equity Funds, Inc. and Shareholders of the Utilities Fund:
In our opinion, the accompanying statement of assets and liabilities, including the schedule of investments, and the related statements of operations and of changes in net assets and the financial highlights present fairly, in all material respects, the financial position of the Utilities Fund (one of the fourteen funds comprising the American Century Quantitative Equity Funds, Inc., hereafter referred to as the “Fund”) at June 30, 2013, the results of its operations for the year then ended, the changes in its net assets for each of the two years in the period then ended and the financial highlights for each of the five years in the period then ended, in conformity with accounting principles generally accepted in the United States of America. These financial statements and financial highlights (hereafter referred to as “financial statements”) are the responsibility of the Fund’s management; our responsibility is to express an opinion on these financial statements based on our audits. We conducted our audits of these financial statements in accordance with the standards of the Public Company Accounting Oversight Board (United States). Those standards require that we plan and perform the audit to obtain reasonable assurance about whether the financial statements are free of material misstatement. An audit includes examining, on a test basis, evidence supporting the amounts and disclosures in the financial statements, assessing the accounting principles used and significant estimates made by management, and evaluating the overall financial statement presentation. We believe that our audits, which included confirmation of securities at June 30, 2013 by correspondence with the custodian and brokers, provide a reasonable basis for our opinion.
PricewaterhouseCoopers LLP
Kansas City, Missouri
August 21, 2013
Board of Directors
The individuals listed below serve as directors of the funds. Each director will continue to serve in this capacity until death, retirement, resignation or removal from office. The board has adopted a mandatory retirement age for directors who are not “interested persons,” as that term is defined in the Investment Company Act (independent directors). Independent directors shall retire on December 31 of the year in which they reach their 75th birthday; provided, however, that on or after January 1, 2022, independent directors shall retire on December 31 of the year in which they reach their 76th birthday.
Mr. Thomas is the only director who is an “interested person” because he currently serves as President and Chief Executive Officer of American Century Companies, Inc. (ACC), the parent company of American Century Investment Management, Inc. (ACIM or the advisor).
The other directors (more than three-fourths of the total number) are independent; that is, they have never been employees, directors or officers of, and have no financial interest in, ACC or any of its wholly owned, direct or indirect, subsidiaries, including ACIM, American Century Investment Services, Inc. (ACIS) and American Century Services, LLC (ACS). The directors serve in this capacity for eight (in the case of Mr. Thomas, 15) registered investment companies in the American Century Investments family of funds.
The following table presents additional information about the directors. The mailing address for each director other than Mr. Thomas is 1665 Charleston Road, Mountain View, California 94043. The mailing address for Mr. Thomas is 4500 Main Street, Kansas City, Missouri 64111.
| | | | | | | |
Name
(Year of Birth) | Position(s) Held with Funds | Length of Time Served | Principal Occupation(s) During Past 5 Years | | Number of American Century Portfolios Overseen
by Director | Other Directorships Held During Past 5 Years |
Independent Directors |
Tanya S. Beder
(1955) | Director | Since 2011 | Chairman, SBCC Group Inc. (independent advisory services) (2006 to present) | | 41 | CYS Investments, Inc. (specialty finance company) |
Jeremy I. Bulow
(1954) | Director | Since 2011 | Professor of Economics, Stanford University, Graduate School of Business (1979 to present) | | 41 | None |
Ronald J. Gilson
(1946) | Director and Chairman of the Board | Since 1995 | Charles J. Meyers Professor of Law and Business, Stanford Law School (1979 to present); Marc and Eva Stern Professor of Law and Business, Columbia University School of Law (1992 to present) | | 41 | None |
Frederick L. A. Grauer
(1946) | Director | Since 2008 | Senior Advisor, BlackRock, Inc. (investment management firm) (2010 to 2011); Senior Advisor, Barclays Global Investors (investment management firm) (2003 to 2009) | | 41 | None |
| | | | | | | |
Name
(Year of Birth) | Position(s) Held with Funds | Length of Time Served | Principal Occupation(s) During Past 5 Years | | Number of American Century Portfolios Overseen
by Director | Other Directorships Held During Past 5 Years |
Independent Directors |
Peter F. Pervere
(1947) | Director | Since 2007 | Retired | | 41 | Intraware, Inc. (2003 to 2009) |
Myron S. Scholes
(1941) | Director | Since 1980 | Chairman, Platinum Grove Asset Management, L.P.
(asset manager) (1999 to 2009); Frank E. Buck Professor of Finance-Emeritus, Stanford Graduate School of Business (1996 to present) | | 41 | Dimensional Fund Advisors (investment advisor); CME Group, Inc. (futures and options exchange) |
John B. Shoven
(1947) | Director | Since 2002 | Professor of Economics, Stanford University
(1973 to present) | | 41 | Cadence Design Systems; Exponent; Financial Engines |
| | | | | | | |
Interested Director |
Jonathan S. Thomas
(1963) | Director and President | Since 2007 | President and Chief Executive Officer, ACC (March 2007 to present). Also serves as Chief Executive Officer and Manager, ACS; Executive Vice President, ACIM; Director, ACC, ACIM and other ACC subsidiaries | | 106 | None |
Officers
The following table presents certain information about the executive officers of the funds. Each officer serves as an officer for each of the 15 investment companies in the American Century family of funds, unless otherwise noted. No officer is compensated for his or her service as an officer of the funds. The listed officers are interested persons of the funds and are appointed or re-appointed on an annual basis. The mailing address for each of the officers listed below is 4500 Main Street, Kansas City, Missouri 64111.
| | | |
Name
(Year of Birth) | Offices with the Funds | Principal Occupation(s) During the Past Five Years |
Jonathan S. Thomas
(1963) | Director and President since 2007 | President and Chief Executive Officer, ACC (March 2007 to present). Also serves as Chief Executive Officer and Manager, ACS; Executive Vice President, ACIM; Director, ACC, ACIM and other ACC subsidiaries |
Maryanne L. Roepke
(1956) | Chief Compliance Officer since 2006 and Senior Vice President since 2000 | Chief Compliance Officer, American Century funds, ACIM and ACS (August 2006 to present). Also serves as Senior Vice President, ACS |
Charles A. Etherington
(1957) | General Counsel since 2007 and Senior Vice President since 2006 | Attorney, ACC (February 1994 to present); Vice President, ACC (November 2005 to present); General Counsel, ACC (March 2007 to present). Also serves as General Counsel, ACIM, ACS, ACIS and other ACC subsidiaries; and Senior Vice President, ACIM and ACS |
C. Jean Wade
(1964) | Vice President, Treasurer and Chief Financial Officer since 2012 | Vice President, ACS (February 2000 to present) |
Robert J. Leach
(1966) | Vice President since 2006 and Assistant Treasurer since 2012 | Vice President, ACS (February 2000 to present) |
David H. Reinmiller
(1963) | Vice President since 2001 | Attorney, ACC (January 1994 to present); Associate General Counsel, ACC (January 2001 to present). Also serves as Vice President, ACIM and ACS |
Ward D. Stauffer
(1960) | Secretary since 2005 | Attorney, ACC (June 2003 to present) |
The Statement of Additional Information has additional information about the fund’s directors and is available without charge, upon request, by calling 1-800-345-2021.
Approval of Management Agreement |
At a meeting held on June 11, 2013, the Fund’s Board of Directors/Trustees unanimously approved the renewal of the management agreement pursuant to which American Century Investment Management, Inc. (the “Advisor”) acts as the investment advisor for the Fund. Under Section 15(c) of the Investment Company Act, contracts for investment advisory services are required to be reviewed, evaluated, and approved by a majority of a fund’s directors/trustees (the “Directors”), including a majority of the independent Directors each year. The Board regards this annual evaluation and renewal as one of its most important responsibilities.
In connection with their annual review and evaluation, the independent Directors memorialized a statement regarding the relationship between their ongoing obligations to oversee and evaluate the performance of the Advisor and their consideration of renewal of the management agreement. In that statement, the independent Directors noted that their assessment of the Advisor’s performance is an ongoing process that takes place over the entire year and is informed by all of the information that the Board and its committees receive and consider over time. This information, together with the materials provided in connection with the review, are central to the Board’s assessment of the Advisor’s performance and its determination whether to renew the Fund’s management agreement.
Prior to its consideration of the renewal of the management agreement, the Board requested and reviewed extensive data and analysis relating to the proposed renewal. This information and analysis was compiled by the Advisor and certain independent providers of evaluation data concerning the Fund and the services provided to the Fund by the Advisor.
In connection with its consideration of the renewal of the management agreement, the Board’s review and evaluation of the services provided by the Advisor included, but was not limited to, the following:
• | the nature, extent, and quality of investment management, shareholder services, and other services provided by the Advisor to the Fund; |
• | the wide range of other programs and services the Advisor provides to the Fund and its shareholders on a routine and non-routine basis; |
• | the investment performance of the Fund, including data comparing the Fund’s performance to appropriate benchmarks and/or a peer group of other mutual funds with similar investment objectives and strategies; |
• | data comparing the cost of owning the Fund to the cost of owning similar funds; |
• | the Advisor’s compliance policies, procedures, and regulatory experience; |
• | financial data showing the cost of services provided to the Fund, the profitability of the Fund to the Advisor, and the overall profitability of the Advisor; |
• | possible economies of scale associated with the Advisor’s management of the Fund and other accounts under its management; |
• | data comparing services provided and charges to other investment management clients of the Advisor; and |
• | consideration of collateral benefits derived by the Advisor from the management of the Fund. |
In keeping with its practice, the Board held two in-person meetings to review and discuss the information provided. The Board also had the benefit of the advice of its independent counsel throughout the period.
Factors Considered
The Directors considered all of the information provided by the Advisor, the independent data providers, and the Board’s independent counsel in connection with the review, and evaluated such information for the Fund. In connection with their review, the Directors did not identify any single factor as being all-important or controlling and each Director may have attributed different levels of importance to different factors. In deciding to renew the management agreement, the Board based its decision on a number of factors, including the following:
Nature, Extent and Quality of Services — Generally. Under the management agreement, the Advisor is responsible for providing or arranging for all services necessary for the operation of the Fund. The Board noted that under the management agreement, the Advisor provides or arranges at its own expense a wide variety of services including:
• | constructing and designing the Fund |
• | portfolio research and security selection |
• | initial capitalization/funding |
• | daily valuation of the Fund’s portfolio |
• | shareholder servicing and transfer agency, including shareholder confirmations, recordkeeping, and communications |
• | regulatory and portfolio compliance |
• | marketing and distribution |
The Board noted that many of these services have expanded over time both in terms of quantity and complexity in response to shareholder demands, competition in the industry, changing distribution channels, and the changing regulatory environment.
Investment Management Services. The nature of the investment management services provided to the Fund is quite complex and allows Fund shareholders access to professional money management, instant diversification of their investments within an asset class, the opportunity to easily diversify among asset classes by investing in or exchanging among various American Century Investments funds, and liquidity. In evaluating investment performance, the Board expects the Advisor to manage the Fund in accordance with its investment objectives and approved strategies. Further, the Directors recognize that the Advisor has an obligation to seek the best execution of fund trades. In providing these services, the Advisor utilizes teams of investment professionals (portfolio managers, analysts, research assistants, and securities traders) who require extensive information technology, research, training, compliance and other systems to conduct their business. The Board, directly and through its Portfolio Committee, regularly reviews investment performance information for the Fund, together with comparative information for appropriate benchmarks and/or peer groups of similarly-managed funds, over different time horizons. The Directors also review detailed performance information during the management agreement approval process. If performance concerns are identified, the Fund receives special reviews until performance improves, during which the Board discusses with the Advisor the reasons for such results (e.g., market conditions, security selection) and any efforts being undertaken to improve performance. The Board found the investment management services provided by the Advisor to the Fund to meet or exceed industry standards. More detailed information about the Fund’s performance can be found in the Performance and Portfolio Commentary sections of this report.
Shareholder and Other Services. Under the management agreement, the Advisor provides the Fund with a comprehensive package of transfer agency, shareholder, and other services. The Board, directly and through various committees of the Board, regularly reviews reports and evaluations of such services at its regular meetings. These reports include, but are not limited to, information regarding the operational efficiency and accuracy of the shareholder and transfer agency services provided, staffing levels, shareholder satisfaction (as measured by external as well as internal sources), technology support, new products and services offered to Fund shareholders, securities trading activities, portfolio valuation services, auditing services, and legal and operational compliance activities. Certain aspects of shareholder and transfer agency service level efficiency and the quality of securities trading activities are measured by independent third party providers and are presented in comparison to other fund groups not managed by the Advisor. The Board found the services provided by the Advisor to the Fund under the management agreement to be competitive and of high quality.
Costs of Services and Profitability. The Advisor provides detailed information concerning its cost of providing various services to the Fund, its profitability in managing the Fund, its overall profitability, and its financial condition. The Directors have reviewed with the Advisor the methodology used to prepare this financial information. The financial information regarding the Advisor is considered in evaluating the Advisor’s financial condition, its ability to continue to provide services under the management agreement, and the reasonableness of the current management fee. The Board concluded that the Advisor’s profits were reasonable in light of the services provided to the Fund.
Ethics. The Board generally considers the Advisor’s commitment to providing quality services to shareholders and to conducting its business ethically. They noted that the Advisor’s practices generally meet or exceed industry
best practices.
Economies of Scale. The Board also reviewed information provided by the Advisor regarding the possible existence of economies of scale in connection with the management of the Fund. The Board concluded that economies of scale are difficult to measure and predict with precision, especially on a fund-by-fund basis. The Board concluded that the Advisor is appropriately sharing economies of scale through its competitive fee structure, offering competitive fees from fund inception, and through reinvestment in its business to provide shareholders additional content and services.
Comparison to Other Funds’ Fees. The management agreement provides that the Fund pay the Advisor a single, all-inclusive (or unified) management fee for providing all services necessary for the management and operation of the Fund, other than brokerage expenses, taxes, interest, extraordinary expenses, and the fees and expenses of the Fund’s independent directors (including their independent legal counsel) and expenses incurred in connection with the provision of shareholder services and distribution services under a plan adopted pursuant to Rule 12b-1 under the 1940 Act. Under the unified fee structure, the Advisor is responsible for providing all investment advisory, custody, audit, administrative, compliance, recordkeeping, marketing and shareholder services, or arranging and supervising third parties to provide such services. By contrast, most other funds are charged a variety of fees, including an investment advisory fee, a transfer agency fee, an administrative fee, distribution charges and other expenses. Other than their investment advisory fees and any applicable Rule 12b-1 distribution fees, all other components of the total fees charged by these other funds may be increased without shareholder approval. The Board believes the unified fee structure is a benefit to Fund shareholders because it clearly discloses to shareholders the cost of owning Fund shares, and, since the unified fee cannot be increased without a vote of Fund shareholders, it shifts to the Advisor the risk of increased costs of operating the Fund and provides a direct incentive to minimize administrative inefficiencies. Part of the Board’s analysis of fee levels involves reviewing certain evaluative data compiled by an independent provider and comparing the Fund’s unified fee to the total expense ratio of other funds in the Fund’s peer group. The Board concluded that the management fee paid by the Fund to the Advisor under the management agreement is reasonable in light of the services provided to the Fund.
Comparison to Fees and Services Provided to Other Clients of the Advisor. The Board also requested and received information from the Advisor concerning the nature of the services, fees, costs and profitability of its advisory services to advisory clients other than the Fund. They observed that these varying types of client accounts require different services and involve different regulatory and entrepreneurial risks than the management of the Fund. The Board analyzed this information and concluded that the fees charged and services provided to the Fund were reasonable by comparison.
Collateral or “Fall-Out” Benefits Derived by the Advisor. The Board considered the existence of collateral benefits the Advisor may receive as a result of its relationship with the Fund. They concluded that the Advisor’s primary business is managing mutual funds and it generally does not use fund or shareholder information to generate profits in other lines of business, and therefore does not derive any significant collateral benefits from them. The Board noted that the Advisor receives proprietary research from broker-dealers that execute fund portfolio transactions and concluded that this research is likely to benefit Fund shareholders. The Board also determined that the Advisor is able to provide investment management services to certain clients other than the Fund, at least in part, due to its existing infrastructure built to serve the fund complex. The Board concluded, however, that the assets of those other clients are not material to the analysis and, where applicable, may be included with the assets of the Fund to determine breakpoints in the management fee schedule.
Existing Relationship. The Board also considered whether there was any reason for not continuing the existing arrangement with the Advisor. In this regard, the Board was mindful of the potential disruptions of the Fund’s operations and various risks, uncertainties, and other effects that could occur as a result of a decision not to continue such relationship. In particular, the Board recognized that most shareholders have invested in the Fund on the strength of the Advisor’s industry standing and reputation and in the expectation that the Advisor will have a continuing role in providing advisory services to the Fund.
Conclusion of the Directors. As a result of this process, the Board, including all of the independent directors and assisted by the advice of independent legal counsel, taking into account all of the factors discussed above and the information provided by the Advisor and others, concluded that the management agreement between the Fund and the Advisor is fair and reasonable in light of the services provided and should be renewed.
Retirement Account Information
As required by law, distributions you receive from certain IRAs are subject to federal income tax withholding, unless you elect not to have withholding apply. Tax will be withheld on the total amount withdrawn even though you may be receiving amounts that are not subject to withholding, such as nondeductible contributions. In such case, excess amounts of withholding could occur. You may adjust your withholding election so that a greater or lesser amount will be withheld.
If you don’t want us to withhold on this amount, you must notify us to not withhold the federal income tax. You may notify us in writing or in certain situations by telephone or through other electronic means. For systematic withdrawals, your withholding election will remain in effect until revoked or changed by filing a new election. You have the right to revoke your election at any time.
Remember, even if you elect not to have income tax withheld, you are liable for paying income tax on the taxable portion of your withdrawal. If you elect not to have income tax withheld or you don’t have enough income tax withheld, you may be responsible for payment of estimated tax. You may incur penalties under the estimated tax rules if your withholding and estimated tax payments are not sufficient. You can reduce or defer the income tax on a distribution by directly or indirectly rolling such distribution over to another IRA or eligible plan. You should consult your tax advisor for additional information.
State tax will be withheld if, at the time of your distribution, your address is within one of the mandatory withholding states and you have federal income tax withheld (or as otherwise required by state law). State taxes will be withheld from your distribution in accordance with the respective state rules.
Distributions you receive from 403(b), 457 and qualified plans are subject to special tax and withholding rules. Your plan administrator or plan sponsor is required to provide you with a special tax notice explaining those rules at the time you request a distribution. If applicable, federal and/or state taxes may be withheld from your distribution amount.
Proxy Voting Guidelines
American Century Investment Management, Inc., the fund’s investment advisor, is responsible for exercising the voting rights associated with the securities purchased and/or held by the fund. A description of the policies and procedures the advisor uses in fulfilling this responsibility is available without charge, upon request, by calling 1-800-345-2021. It is also available on American Century Investments’ website at americancentury.com and on the Securities and Exchange Commission’s website at sec.gov. Information regarding how the investment advisor voted proxies relating to portfolio securities during the most recent 12-month period ended June 30 is available on the “About Us” page at americancentury.com. It is also available at sec.gov.
Quarterly Portfolio Disclosure
The fund files its complete schedule of portfolio holdings with the Securities and Exchange Commission (SEC) for the first and third quarters of each fiscal year on Form N-Q. The fund’s Forms N-Q are available on the SEC’s website at sec.gov, and may be reviewed and copied at the SEC’s Public Reference Room in Washington, DC. Information on the operation of the Public Reference Room may be obtained by calling 1-800-SEC-0330. The fund also makes its complete schedule of portfolio holdings for the most recent quarter of its fiscal year available on its website at americancentury.com and, upon request, by calling 1-800-345-2021.
Other Tax Information
The following information is provided pursuant to provisions of the Internal Revenue Code.
The fund hereby designates up to the maximum amount allowable as qualified dividend income for the fiscal year ended June 30, 2013.
For corporate taxpayers, the fund hereby designates $12,275,738, or up to the maximum amount allowable, of ordinary income distributions paid during the fiscal year ended June 30, 2013 as qualified for the corporate dividends received deduction.
The fund hereby designates $16,503,759, or up to the maximum amount allowable, as long-term capital gain distributions for the fiscal year ended June 30, 2013.
The fund hereby designates $364,767 as qualified short-term capital gain distributions for purposes of Internal Revenue Code Section 871.
Contact Us | americancentury.com |
Automated Information Line | 1-800-345-8765 |
Investor Services Representative | 1-800-345-2021
or 816-531-5575 |
Investors Using Advisors | 1-800-378-9878 |
Business, Not-For-Profit, Employer-Sponsored Retirement Plans | 1-800-345-3533 |
Banks and Trust Companies, Broker-Dealers, Financial Professionals, Insurance Companies | 1-800-345-6488 |
Telecommunications Device for the Deaf | 1-800-634-4113 |
American Century Quantitative Equity Funds, Inc.
Investment Advisor:
American Century Investment Management, Inc.
Kansas City, Missouri
This report and the statements it contains are submitted for the general information of our shareholders. The report is not authorized for distribution to prospective investors unless preceded or accompanied by an effective prospectus.
©2013 American Century Proprietary Holdings, Inc. All rights reserved.
CL-ANN-79310 1308
ITEM 2. CODE OF ETHICS.
(a) | The registrant has adopted a Code of Ethics for Senior Financial Officers that applies to the registrant’s principal executive officer, principal financial officer, principal accounting officer, and persons performing similar functions. |
(f) | The registrant’s Code of Ethics for Senior Financial Officers was filed as Exhibit 12 (a)(1) to American Century Asset Allocation Portfolios, Inc.’s Annual Certified Shareholder Report on Form N-CSR, File No. 811-21591, on September 29, 2005, and is incorporated herein by reference. |
ITEM 3. AUDIT COMMITTEE FINANCIAL EXPERT.
(a)(1) | The registrant's board has determined that the registrant has at least one audit committee financial expert serving on its audit committee. |
(a)(2) | Tanya S. Beder, Peter F. Pervere and Ronald J. Gilson are the registrant's designated audit committee financial experts. They are "independent" as defined in Item 3 of Form N-CSR. |
ITEM 4. PRINCIPAL ACCOUNTANT FEES AND SERVICES.
The aggregate fees billed for each of the last two fiscal years for professional services rendered by the principal accountant for the audit of the registrant’s annual financial statements or services that are normally provided by the accountant in connection with statutory and regulatory filings or engagements for those fiscal years were as follows:
FY 2012: $285,263
FY 2013: $454,859
The aggregate fees billed in each of the last two fiscal years for assurance and related services by the principal accountant that are reasonably related to the performance of the audit of the registrant’s financial statements and are not reported under paragraph (a) of this Item were as follows:
For services rendered to the registrant:
Fees required to be approved pursuant to paragraph (c)(7)(ii) of Rule 2-01 of Regulation S-X (relating to certain engagements for non-audit services with the registrant’s investment adviser and its affiliates):
The aggregate fees billed in each of the last two fiscal years for professional services rendered by the principal accountant for tax compliance, tax advice, and tax planning were as follows:
For services rendered to the registrant:
FY 2012: $0
FY 2013: $0
Fees required to be approved pursuant to paragraph (c)(7)(ii) of Rule 2-01 of Regulation S-X (relating to certain engagements for non-audit services with the registrant’s investment adviser and its affiliates):
FY 2012: $0
FY 2013: $0
The aggregate fees billed in each of the last two fiscal years for products and services provided by the principal accountant, other than the services reported in paragraphs (a) through (c) of this Item were as follows:
For services rendered to the registrant:
Fees required to be approved pursuant to paragraph (c)(7)(ii) of Rule 2-01 of Regulation S-X (relating to certain engagements for non-audit services with the registrant’s investment adviser and its affiliates):
(e)(1) | In accordance with paragraph (c)(7)(i)(A) of Rule 2-01 of Regulation S-X, before the accountant is engaged by the registrant to render audit or non-audit services, the engagement is approved by the registrant’s audit committee. Pursuant to paragraph (c)(7)(ii) of Rule 2-01 of Regulation S-X, the registrant’s audit committee also pre-approves its accountant’s engagements for non-audit services with the registrant’s investment adviser, its parent company, and any entity controlled by, or under common control with the investment adviser that provides ongoing services to the registrant, if the engagement relates directly to the operations and financial reporting of the registrant. |
(e)(2) | All services described in each of paragraphs (b) through (d) of this Item were pre-approved before the engagement by the registrant’s audit committee pursuant to paragraph (c)(7)(i)(A) of Rule 2-01 of Regulation S-X. Consequently, none of such services were required to be approved by the audit committee pursuant to paragraph (c)(7)(i)(C). |
(f) | The percentage of hours expended on the principal accountant’s engagement to audit the registrant’s financial statements for the most recent fiscal year that were attributed to work performed by persons other than the principal accountant’s full-time, permanent employees was less than 50%. |
(g) | The aggregate non-audit fees billed by the registrant’s accountant for services rendered to the registrant, and rendered to the registrant’s investment adviser (not including any sub-adviser whose role is primarily portfolio management and is subcontracted with or overseen by another investment adviser), and any entity controlling, controlled by, or under common control with the adviser that provides ongoing services to the registrant for each of the last two fiscal years of the registrant were as follows: |
FY 2012: $199,276
FY 2013: $151,650
(h) | The registrant’s investment adviser and accountant have notified the registrant’s audit committee of all non-audit services that were rendered by the registrant’s accountant to the registrant’s investment adviser, its parent company, and any entity controlled by, or under common control with the investment adviser that provides services to the registrant, which services were not required to be pre-approved pursuant to paragraph (c)(7)(ii) of Rule 2-01 of Regulation S-X. The notification provided to the registrant’s audit committee included sufficient details regarding such services to allow the registrant’s audit committee to consider the continuing independence of its principal accountant. |
ITEM 5. AUDIT COMMITTEE OF LISTED REGISTRANTS.
Not applicable.
ITEM 6. INVESTMENTS.
(a) | The schedule of investments is included as part of the report to stockholders filed under Item 1 of this Form. |
ITEM 7. DISCLOSURE OF PROXY VOTING POLICIES AND PROCEDURES FOR CLOSED-END MANAGEMENT INVESTMENT COMPANIES.
Not applicable.
ITEM 8. PORTFOLIO MANAGERS OF CLOSED-END MANAGEMENT INVESTMENT COMPANIES.
Not applicable.
ITEM 9. PURCHASES OF EQUITY SECURITIES BY CLOSED-END MANAGEMENT INVESTMENT COMPANY AND AFFILIATED PURCHASERS.
Not applicable.
ITEM 10. SUBMISSION OF MATTERS TO A VOTE OF SECURITY HOLDERS.
During the reporting period, there were no material changes to the procedures by which shareholders may recommend nominees to the registrant’s board.
ITEM 11. CONTROLS AND PROCEDURES.
(a) | The registrant's principal executive officer and principal financial officer have concluded that the registrant's disclosure controls and procedures (as defined in Rule 30a-3(c) under the Investment Company Act of 1940) are effective based on their evaluation of these controls and procedures as of a date within 90 days of the filing date of this report. |
(b) | There were no changes in the registrant's internal control over financial reporting (as defined in Rule 30a-3(d) under the Investment Company Act of 1940) that occurred during the registrant's second fiscal quarter of the period covered by this report that have materially affected, or are reasonably likely to materially affect, the registrant's internal control over financial reporting. |
ITEM 12. EXHIBITS.
(a)(1) | Registrant’s Code of Ethics for Senior Financial Officers, which is the subject of the disclosure required by Item 2 of Form N-CSR, was filed as Exhibit 12(a)(1) to American Century Asset Allocation Portfolios, Inc.’s Certified Shareholder Report on Form N-CSR, File No. 811-21591, on September 29, 2005. |
(a)(2) | Separate certifications by the registrant’s principal executive officer and principal financial officer, pursuant to Section 302 of the Sarbanes-Oxley Act of 2002 and Rule 30a-2(a) under the Investment Company Act of 1940, are filed and attached hereto as EX-99.CERT. |
(b) | A certification by the registrant’s chief executive officer and chief financial officer, pursuant to Section 906 of the Sarbanes-Oxley Act of 2002, is furnished and attached hereto as EX-99.906CERT. |
SIGNATURES
Pursuant to the requirements of the Securities Exchange Act of 1934 and the Investment Company Act of 1940, the registrant has duly caused this report to be signed on its behalf by the undersigned, thereunto duly authorized.
Registrant: | American Century Quantitative Equity Funds, Inc. | |
| | | | |
| | | | |
By: | /s/ Jonathan S. Thomas | |
| | Name: | Jonathan S. Thomas | |
| | Title: | President | |
| | | | |
Date: | August 29, 2013 | |
| | | |
Pursuant to the requirements of the Securities Exchange Act of 1934 and the Investment Company Act of 1940, this report has been signed below by the following persons on behalf of the registrant and in the capacities and on the dates indicated.
By: | /s/ Jonathan S. Thomas | |
| | Name: | Jonathan S. Thomas | |
| | Title: | President | |
| | | (principal executive officer) | |
| | | | |
| | | | |
Date: | August 29, 2013 | |
By: | /s/ C. Jean Wade | |
| | Name: | C. Jean Wade | |
| | Title: | Vice President, Treasurer, and | |
| | | Chief Financial Officer | |
| | | (principal financial officer) | |
| | | | |
Date: | August 29, 2013 | |