| | |
| UNITED STATES |
| SECURITIES AND EXCHANGE COMMISSION |
| Washington, D.C. 20549 |
|
| FORM N-CSR |
|
| CERTIFIED SHAREHOLDER REPORT OF REGISTERED |
| MANAGEMENT INVESTMENT COMPANIES |
| |
| Investment Company Act file number | 811-05447 |
| |
| AMERICAN CENTURY QUANTITATIVE EQUITY FUNDS, INC. |
| (Exact name of registrant as specified in charter) |
| |
| 4500 MAIN STREET, KANSAS CITY, MISSOURI | 64111 |
| (Address of principal executive offices) | (Zip Code) |
| |
| CHARLES A. ETHERINGTON |
| 4500 MAIN STREET, KANSAS CITY, MISSOURI 64111 |
| (Name and address of agent for service) |
|
| Registrant’s telephone number, including area code: | 816-531-5575 |
| |
| Date of fiscal year end: | 06-30 |
| |
| Date of reporting period: | 06-30-2010 |
| |
| |
| |
| | |
| |
| ITEM 1. REPORTS TO STOCKHOLDERS. |
|
| Annual Report | |
| June 30, 2010 | |

|
| American Century Investments® |
Utilities Fund
| |
| President’s Letter | 2 |
| Market Perspective | 3 |
| U.S. Stock Index Returns | 3 |
| |
| Utilities | |
| |
| Performance | 4 |
| Portfolio Commentary | 6 |
| Utilities Market Returns | 7 |
| Top Ten Holdings | 8 |
| Industry Breakdown | 8 |
| Types of Investments in Portfolio | 8 |
| |
| Shareholder Fee Example | 9 |
| |
| Financial Statements | |
| |
| Schedule of Investments | 11 |
| Statement of Assets and Liabilities | 13 |
| Statement of Operations | 14 |
| Statement of Changes in Net Assets | 15 |
| Notes to Financial Statements | 16 |
| Financial Highlights | 21 |
| Report of Independent Registered Public Accounting Firm | 22 |
| |
| Other Information | |
| |
| Proxy Voting Results | 23 |
| Management | 24 |
| Board Approval of Management Agreements | 28 |
| Additional Information | 34 |
| Index Definitions | 35 |
Any opinions expressed in this report reflect those of the author as of the date of the report, and do not necessarily represent the opinions of American Century Investments or any other person in the American Century Investments organization. Any such opinions are subject to change at any time based upon market or other conditions and American Century Investments disclaims any responsibility to update such opinions. These opinions may not be relied upon as investment advice and, because investment decisions made by American Century Investments funds are based on numerous factors, may not be relied upon as an indication of trading intent on behalf of any American Century Investments fund. Security examples are used for representational purposes only and are not intended as recommendations to purchase or sell securities. Performance information for comparative indices and securities is provided to American Century Investments by third party vendors. To the best of American Century Investments’ knowledge, such information is accurate at the time of printing.

Dear Investor:
To learn more about the capital markets, your investment, and the portfolio management strategies American Century Investments provides, we encourage you to review this shareholder report for the financial reporting period ended June 30, 2010.
On the following pages, you will find investment performance and portfolio information, presented with the expert perspective and commentary of our portfolio management team. This report remains one of our most important vehicles for conveying the information you need about your investment performance, and about the market factors and strategies that affect fund returns. For additional information on the markets, we encourage you to visit the “Insights & News” tab at our Web site, americancentury.com, for updates and further expert commentary.
The top of our Web site’s home page also provides a link to “Our Story,” which, first and foremost, outlines our commitment—since 1958—to helping clients reach their financial goals. We believe strongly that we will only be successful when our clients are successful. That’s who we are.
Another important, unique facet of our story and who we are is “Profits with a Purpose,” which describes our bond with the Stowers Institute for Medical Research (SIMR). SIMR is a world-class biomedical organization—founded by our company founder James E. Stowers, Jr. and his wife Virginia—that is dedicated to researching the causes, treatment, and prevention of gene-based diseases, including cancer. Through American Century Investments’ private ownership structure, more than 40% of our profits support SIMR.
Mr. Stowers’ example of achieving financial success and using that platform to help humanity motivates our entire American Century Investments team. His story inspires us to help each of our clients achieve success. Thank you for sharing your financial journey with us.
Sincerely,

Jonathan Thomas
President and Chief Executive Officer
American Century Investments
2

By Scott Wittman, Chief Investment Officer, Quantitative Equity and Asset Allocation
Stocks Rallied as Economy Improved
U.S. stocks posted double-digit gains for the 12 months ended June 30, 2010, thanks largely to improving economic conditions and unexpectedly strong corporate earnings. As the period began, the U.S. economy was starting to show early signs of recovery following a sharp downturn in late 2008 and early 2009. Led by improving results in manufacturing activity, housing, and consumer spending, the economy posted positive growth in the third and fourth quarters of 2009 after four consecutive quarters of declining output. By the first quarter of 2010, jobs data turned positive, providing further evidence of a burgeoning economic recovery.
In addition, corporate profits consistently exceeded expectations as many companies implemented stringent cost-management programs that helped boost profit margins. Rising demand for delayed big-ticket purchases, such as cars and appliances, also contributed to stronger earnings. As a result, stocks rose steadily for much of the period, with the major equity indices advancing by more than 30% from the beginning of the period through April 30, 2010.
Growing Uncertainty Led to Late Decline
Market conditions changed abruptly in the last two months of the period as persistent worries about sovereign debt problems in Europe and questions about the sustainability of the domestic economic recovery (validated to some degree by weaker economic data late in the period) weighed on investor confidence. With these headwinds, the equity market peaked in late April and then reversed direction in May and June. In addition, market volatility increased dramatically—the S&P 500 Index moved up or down by more than 1% on nearly half of the trading days in the second quarter of 2010.
Although stocks gave back a notable portion of their gains late in the period, the broad market indices returned approximately 15% overall for the 12 months. Mid- and small-cap stocks posted the best returns (see the table below), outpacing large-cap shares, while value stocks outperformed growth-oriented issues across all market capitalizations.
| | | | |
| U.S. Stock Index Returns | | | | |
| For the 12 months ended June 30, 2010 | | | | |
| Russell 1000 Index (Large-Cap) | 15.24% | | Russell 2000 Index (Small-Cap) | 21.48% |
| Russell 1000 Value Index | 16.92% | | Russell 2000 Value Index | 25.07% |
| Russell 1000 Growth Index | 13.62% | | Russell 2000 Growth Index | 17.96% |
| Russell Midcap Index | 25.13% | | | |
| Russell Midcap Value Index | 28.91% | | | |
| Russell Midcap Growth Index | 21.30% | | | |
3
| | | | | | | |
| Utilities | | | | | | |
| |
| Total Returns as of June 30, 2010 | | | | | |
| | | | | Average Annual Returns | |
| | | Ticker | | | | Since | Inception |
| | | Symbol | 1 year | 5 years | 10 years | Inception | Date |
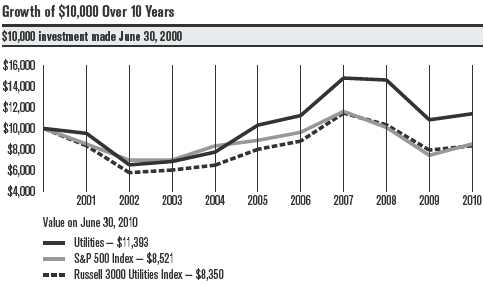
| Utilities | BULIX | 5.30% | 2.01% | 1.31% | 6.46% | 3/1/93 |
| Russell 3000 | | | | | | |
| Utilities Index | — | 5.13% | 0.81% | -1.79% | N/A(1) | — |
| S&P 500 Index | — | 14.43% | -0.79% | -1.59% | 7.04%(2) | — |
| (1) | Index data first available 7/1/96. | | | | | | |
| (2) | Since 2/28/93, the date nearest the fund’s inception for which data are available. | | | |
Data presented reflect past performance. Past performance is no guarantee of future results. Current performance may be higher or lower than the performance shown. Investment return and principal value will fluctuate, and redemption value may be more or less than original cost. To obtain performance data current to the most recent month end, please call 1-800-345-2021 or visit americancentury.com. The fund concentrates its investments in a narrow segment of the total market and is therefore subject to greater risks and market fluctuations than a portfolio representing a broader range of industries. International investing involves special risks, such as political instability and currency fluctuations.
Data assumes reinvestment of dividends and capital gains, and none of the charts reflect the deduction of taxes that a shareholder would pay on fund distributions or the redemption of fund shares. Returns for the indices are provided for comparison. The fund’s total returns include operating expenses (such as transaction costs and management fees) that reduce returns, while the total returns of the indices do not.
4
Utilities
| |
| Total Annual Fund Operating Expenses |
| Utilities | 0.70% |
The total annual fund operating expenses shown is as stated in the fund’s prospectus current as of the date of this report. The prospectus may vary from the expense ratio shown elsewhere in this report because it is based on a different time period, includes acquired fund fees and expenses, and, if applicable, does not include fee waivers or expense reimbursements.
Data presented reflect past performance. Past performance is no guarantee of future results. Current performance may be higher or lower than the performance shown. Investment return and principal value will fluctuate, and redemption value may be more or less than original cost. To obtain performance data current to the most recent month end, please call 1-800-345-2021 or visit americancentury.com. The fund concentrates its investments in a narrow segment of the total market and is therefore subject to g reater risks and market fluctuations than a portfolio representing a broader range of industries. International investing involves special risks, such as political instability and currency fluctuations.
Data assumes reinvestment of dividends and capital gains, and none of the charts reflect the deduction of taxes that a shareholder would pay on fund distributions or the redemption of fund shares. Returns for the indices are provided for comparison. The fund’s total returns include operating expenses (such as transaction costs and management fees) that reduce returns, while the total returns of the indices do not.
5
Utilities
Portfolio Manager: Joe Sterling
On March 31, 2010, Utilities portfolio manager John Schniedwind, who was also chief investment officer for quantitative equity, retired from American Century Investments after 27 years with the firm. Effective August 9, 2010, Bill Martin will join Joe Sterling as a portfolio manager of the Utilities Fund.
Performance Summary
Utilities Fund returned 5.30% for the 12 months ended June 30, 2010, outpacing the 5.13% return of its benchmark, the Russell 3000 Utilities Index. The S&P 500 Index, a broad market measure, returned 14.43%.
As described on page 3, equity indices advanced during the reporting period, responding positively to signs of improving economic conditions. Market gains were curbed in the second half of the reporting period, though, as economic trends in the U.S. and abroad softened, causing fears of a double-dip recession and reigniting concerns about the health of the global financial system. Against this backdrop, Utilities Fund delivered gains on an absolute basis, and modestly outperformed its benchmark.
From a broad sector perspective, an overweight allocation and effective stock selection within the traditional utilities sector accounted for the majority of the portfolio’s outperformance relative to its benchmark. Within the sector, a substantial overweight allocation to the gas utilities industry was a key contributor to absolute and relative gains. An underweight stake and effective stock selection in the independent power producer industry group also helped performance on a relative basis, although the group detracted from absolute returns. Holdings in the electric utilities industry were a source of underperformance. An overweight allocation and stock decisions in the telecommunications services sector also contributed significantly to relative returns. Stock selection in the information technology sector slightly trimmed returns relative to the benchmark.
Traditional Utilities Contributed
The traditional utilities group, which represented almost 75% of the portfolio, was the largest sector source of positive relative returns for the reporting period. Within the industry group, overweight positions in select gas utilities helped absolute and relative performance. In particular, a substantial overweight stake in ONEOK, Inc. represented the single largest contribution by far to relative gains, as the natural gas storage and transportation company’s share price climbed 53% in the period. The company had faced a number of issues early in 2009, including a weak economy, legislative debates over carbon restrictions, renewable energy mandates, and regulatory push back on recovery of costs and investments. During the reporting period, as investors gained confidence about these issues and recognized ONEOK’s sound fundamentals, the share price rebounded. Similarly, a significantly overweight positio n in diversified natural gas company National Fuel Gas Co. added meaningfully to absolute and relative performance as the company’s share price gained 31%.
An underweight allocation and effective stock decisions among independent power producers also helped relative returns. The portfolio successfully avoided key benchmark underperformers, including Dynegy, Inc. The electric power company reported a wider than expected net loss during the period due to lower commodities prices and slower demand. The portfolio also sidestepped energy company AES Corporation, which reported lower earnings and reduced its guidance for future earnings due to weaker forward prices and declining volume.
6
Utilities
The portfolio avoided the water utilities group altogether. This trimmed relative performance modestly, as water utilities delivered modest gains within the benchmark.
Stock selection in the electric utilities industry detracted from absolute and relative performance. Here, the portfolio held several detrimental positions in non-benchmark securities that declined amid sluggish demand for electricity.
Telecommunications, Energy Helped
The telecommunications services sector benefited relative returns. Within the sector, the portfolio held an underweight position in telecommunications provider Verizon. This decision proved advantageous, as the company’s share price declined due to charges associated with workforce reductions and a decline in contract customers. An overweight stake in telecommunications services provider Windstream Corp. added to absolute and relative performance. The company’s share price gained 39% as revenue climbed.
The energy sector also contributed to relative returns. Within the sector, the portfolio held select positions within the oil, gas, and consumable fuels group that were not benchmark members. These positions outperformed the benchmark average during the period.
Information Technology Detracted
The information technology sector was a source of weakness relative to the benchmark. Within the sector, the portfolio’s only position was QUALCOMM, which is not a benchmark constituent. The company’s share price declined during the period.
Outlook
Utilities Fund employs a structured, disciplined investment approach. The management team incorporates both growth and value measures into its stock selection process and attempts to balance the portfolio’s risk and expected return.
The team has continued to avoid water utilities in the portfolio. The portfolio has maintained overweight positions in gas utilities and multi-utilities, as our quantitative process has identified opportunities in these areas.
| | | | |
| Utilities Market Returns | | | | |
| For the 12 months ended June 30, 2010 | | | | |
| Broad U.S. Stock Market | | | Primary Utilities Industries in Fund Benchmark |
| S&P 500 Index | 14.43% | | Diversified Telecommunication Services | 3.23% |
| Nasdaq Composite Index* | 14.94% | | Electric Utilities | 0.98% |
| Broad Utilities Market | | | Multi-Utilities | 16.21% |
| Lipper Utility Fund Index | 9.09% | | Gas Utilities | 23.77% |
| Russell 3000 Utilities Index | 5.13% | | Independent Power Producers | |
| | | | & Energy Traders | -11.31% |
| | | | Wireless Telecommunication Services | –3.61% |
| *Return does not reflect the reinvestment of dividends on securities in the index. Had such reinvestments been included, returns would have |
| been higher. | | | | |
7
| |
| Utilities | |
| |
| Top Ten Holdings | |
| | % of net assets |
| | as of 6/30/10 |
| AT&T, Inc. | 4.6% |
| Verizon Communications, Inc. | 4.1% |
| Public Service Enterprise Group, Inc. | 3.5% |
| Southern Co. | 3.3% |
| Edison International | 3.1% |
| PG&E Corp. | 3.0% |
| ONEOK, Inc. | 3.0% |
| CenturyLink, Inc. | 3.0% |
| NextEra Energy, Inc. | 2.9% |
| American Electric Power Co., Inc. | 2.6% |
| |
| Industry Breakdown | |
| | % of net assets |
| | as of 6/30/10 |
| Electric Utilities | 26.0% |
| Multi-Utilities | 24.5% |
| Gas Utilities | 19.7% |
| Integrated Telecommunication Services | 17.7% |
| Wireless Telecommunication Services | 3.8% |
| Oil & Gas Storage & Transportation | 2.9% |
| Independent Power Producers & Energy Traders | 2.4% |
| Communications Equipment | 1.2% |
| Coal & Consumable Fuels | 0.4% |
| Cash & Equivalents(1) | 1.4% |
| (1) Includes temporary cash investments and other assets and liabilities. | |
| |
| Types of Investments in Portfolio | |
| | % of net assets |
| | as of 6/30/10 |
| Domestic Common Stocks | 92.3% |
| Foreign Common Stocks(2) | 6.3% |
| Total Common Stocks | 98.6% |
| Temporary Cash Investments | 1.2% |
| Other Assets and Liabilities | 0.2% |
| (2) Includes depositary shares, dual listed securities and foreign ordinary shares | |
8
|
| Shareholder Fee Example (Unaudited) |
Fund shareholders may incur two types of costs: (1) transaction costs, including sales charges (loads) on purchase payments and redemption/ exchange fees; and (2) ongoing costs, including management fees; distribution and service (12b-1) fees; and other fund expenses. This example is intended to help you understand your ongoing costs (in dollars) of investing in your fund and to compare these costs with the ongoing cost of investing in other mutual funds.
The example is based on an investment of $1,000 made at the beginning of the period and held for the entire period from January 1, 2010 to June 30, 2010.
Actual Expenses
The table provides information about actual account values and actual expenses for each class. You may use the information, together with the amount you invested, to estimate the expenses that you paid over the period. First, identify the share class you own. Then simply divide your account value by $1,000 (for example, an $8,600 account value divided by $1,000 = 8.6), then multiply the result by the number under the heading “Expenses Paid During Period” to estimate the expenses you paid on your account during this period.
If you hold Investor Class shares of any American Century Investments fund, or Institutional Class shares of the American Century Diversified Bond Fund, in an American Century Investments account (i.e., not a financial intermediary or retirement plan account), American Century Investments may charge you a $12.50 semiannual account maintenance fee if the value of those shares is less than $10,000. We will redeem shares automatically in one of your accounts to pay the $12.50 fee. In determining your total eligible investment amount, we will include your investments in all personal accounts (including American Century Investments Brokerage accounts) registered under your Social Security number. Personal accounts include individual accounts, joint accounts, UGMA/UTMA accounts, personal trusts, Coverdell Education Savings Accounts and IRAs (including traditional, Roth, Rollover, SEP-, SARSEP- and SIMPLE-IRAs), and certain other retirement accounts. If you have only business, business retirement, employer-sponsored or American Century Investments Brokerage accounts, you are currently not subject to this fee. We will not charge the fee as long as you choose to manage your accounts exclusively online. If you are subject to the Account Maintenance Fee, your account value could be reduced by the fee amount.
Hypothetical Example for Comparison Purposes
The table also provides information about hypothetical account values and hypothetical expenses based on the actual expense ratio of each class of your fund and an assumed rate of return of 5% per year before expenses, which is not the actual return of a fund’s share class. The hypothetical account values and expenses may not be used to estimate the actual ending account balance or expenses you paid for the period. You may use this information to compare the ongoing costs of investing in your fund and other funds. To do so, compare this 5% hypothetical example with the 5% hypothetical examples that appear in the shareholder reports of the other funds.
9
Please note that the expenses shown in the table are meant to highlight your ongoing costs only and do not reflect any transactional costs, such as sales charges (loads) or redemption/exchange fees. Therefore, the table is useful in comparing ongoing costs only, and will not help you determine the relative total costs of owning different funds. In addition, if these transactional costs were included, your costs would have been higher.
| | | | |
| | Beginning | Ending | Expenses Paid | |
| | Account Value | Account Value | During Period* | Annualized |
| | 1/1/10 | 6/30/10 | 1/1/10 – 6/30/10 | Expense Ratio* |
| Actual | $1,000 | $926.60 | $3.34 | 0.70% |
| Hypothetical | $1,000 | $1,021.32 | $3.51 | 0.70% |
| *Expenses are equal to the fund’s annualized expense ratio listed in the table above, multiplied by the average account value over the period, |
| multiplied by 181, the number of days in the most recent fiscal half-year, divided by 365, to reflect the one-half year period. |
10
| | | | | | |
| Utilities | | | | | | |
| |
| JUNE 30, 2010 | | | | | | |
| | Shares | Value | | | Shares | Value |
| Common Stocks — 98.6% | | | INTEGRATED TELECOMMUNICATION | |
| | | | | SERVICES—17.7% | | |
| COAL & CONSUMABLE FUELS—0.4% | | | AT&T, Inc. | 432,516 | $ 10,462,562 |
| Arch Coal, Inc. | 50,400 | $ 998,424 | | CenturyLink, Inc. | 204,254 | 6,803,701 |
| COMMUNICATIONS EQUIPMENT—1.2% | | | France Telecom SA ADR | 90,400 | 1,564,824 |
| QUALCOMM, Inc. | 81,900 | 2,689,596 | | Koninklijke KPN NV | 168,400 | 2,150,274 |
| ELECTRIC UTILITIES—26.0% | | | | Qwest Communications | | |
| Allegheny Energy, Inc. | 58,700 | 1,213,916 | | International, Inc. | 829,600 | 4,355,400 |
| American Electric | | | | Telefonica SA ADR | 20,000 | 1,110,600 |
| Power Co., Inc. | 184,440 | 5,957,412 | | Verizon | | |
| Duke Energy Corp. | 222,304 | 3,556,864 | | Communications, Inc. | 331,499 | 9,288,602 |
| E.ON AG ADR | 39,800 | 1,066,640 | | Windstream Corp. | 438,700 | 4,632,672 |
| Edison International | 224,500 | 7,121,140 | | | | 40,368,635 |
| EDP- Energias | | | | MULTI-UTILITIES—24.5% | | |
| de Portugal SA | 520,200 | 1,536,002 | | Alliant Energy Corp. | 39,600 | 1,256,904 |
| EDP- Energias | | | | CenterPoint Energy, Inc. | 438,900 | 5,775,924 |
| de Portugal SA ADR | 3,300 | 97,515 | | | | |
| Entergy Corp. | 65,500 | 4,691,110 | | CMS Energy Corp. | 168,700 | 2,471,455 |
| Exelon Corp. | 128,500 | 4,879,145 | | Consolidated Edison, Inc. | 126,600 | 5,456,460 |
| FirstEnergy Corp. | 105,300 | 3,709,719 | | Dominion Resources, Inc. | 147,712 | 5,722,363 |
| Iberdrola SA | 314,288 | 1,762,440 | | DTE Energy Co. | 97,200 | 4,433,292 |
| Iberdrola SA ADR | 1,410 | 31,626 | | MDU Resources Group, Inc. | 165,100 | 2,976,753 |
| NextEra Energy, Inc. | 135,900 | 6,626,484 | | NSTAR | 113,642 | 3,977,470 |
| PPL Corp. | 177,200 | 4,421,140 | | PG&E Corp. | 166,200 | 6,830,820 |
| | | | | Public Service | | |
| Progress Energy, Inc. | 88,000 | 3,451,360 | | Enterprise Group, Inc. | 255,500 | 8,004,815 |
| Southern Co. | 226,300 | 7,531,264 | | SCANA Corp. | 50,200 | 1,795,152 |
| UniSource Energy Corp. | 57,300 | 1,729,314 | | Sempra Energy | 49,100 | 2,297,389 |
| | | 59,383,091 | | Wisconsin Energy Corp. | 21,300 | 1,080,762 |
| GAS UTILITIES—19.7% | | | | Xcel Energy, Inc. | 180,400 | 3,718,044 |
| AGL Resources, Inc. | 128,100 | 4,588,542 | | | | 55,797,603 |
| Atmos Energy Corp. | 72,600 | 1,963,104 | | OIL & GAS STORAGE & TRANSPORTATION—2.9% |
| Energen Corp. | 99,900 | 4,428,567 | | El Paso Corp. | 346,900 | 3,854,059 |
| Laclede Group, Inc. (The) | 85,600 | 2,835,928 | | Williams Cos., Inc. (The) | 150,000 | 2,742,000 |
| National Fuel Gas Co. | 114,800 | 5,267,024 | | | | 6,596,059 |
| Nicor, Inc. | 137,800 | 5,580,900 | | WIRELESS TELECOMMUNICATION SERVICES—3.8% |
| Northwest Natural Gas Co. | 63,600 | 2,771,052 | | America Movil SAB de CV, | | |
| ONEOK, Inc. | 157,900 | 6,829,175 | | Series L ADR | 68,100 | 3,234,750 |
| Questar Corp. | 82,000 | 3,730,180 | | Sprint Nextel Corp.(1) | 903,042 | 3,828,898 |
| Southwest Gas Corp. | 41,100 | 1,212,450 | | Vodafone Group plc ADR | 83,000 | 1,715,610 |
| UGI Corp. | 221,000 | 5,622,240 | | | | 8,779,258 |
| | | 44,829,162 | | TOTAL COMMON STOCKS | | |
| INDEPENDENT POWER PRODUCERS | | | (Cost $216,581,908) | | 224,836,683 |
| & ENERGY TRADERS—2.4% | | | | | | |
| Constellation Energy | | | | | | |
| Group, Inc. | 83,100 | 2,679,975 | | | | |
| NRG Energy, Inc.(1) | 128,000 | 2,714,880 | | | | |
| | | 5,394,855 | | | | |
11
| | | | |
| Utilities | | | | |
| |
| | Shares | Value | | Notes to Schedule of Investments |
| Temporary Cash Investments — 1.2% | | ADR = American Depositary Receipt |
| JPMorgan U.S. Treasury | | | | (1) Non-income producing. |
| Plus Money Market | | | | |
| Fund Agency Shares | 39,761 | $ 39,761 | | Industry classifications are unaudited. |
| Repurchase Agreement, Bank of America | | | |
| Securities, LLC, (collateralized by various | | | |
| U.S. Treasury obligations, 1.125%, 6/30/11, | | | |
| valued at $2,855,814), in a joint trading | | | See Notes to Financial Statements. |
| account at 0.01%, dated 6/30/10, due | | | |
| 7/1/10 (Delivery value $2,800,001) | 2,800,000 | | |
| TOTAL TEMPORARY | | | | |
| CASH INVESTMENTS | | | | |
| (Cost $2,839,761) | | 2,839,761 | | |
| TOTAL INVESTMENT | | | | |
| SECURITIES — 99.8% | | | | |
| (Cost $219,421,669) | | 227,676,444 | | |
| OTHER ASSETS | | | | |
| AND LIABILITIES — 0.2% | | 424,770 | | |
| TOTAL NET ASSETS — 100.0% | | $228,101,214 | | |
12
|
| Statement of Assets and Liabilities |
| |
| JUNE 30, 2010 | |
| Assets | |
| Investment securities, at value (cost of $219,421,669) | $227,676,444 |
| Foreign currency holdings, at value (cost of $1,736) | 1,741 |
| Receivable for capital shares sold | 54,766 |
| Dividends and interest receivable | 857,854 |
| | 228,590,805 |
| | |
| Liabilities | |
| Payable for investments purchased | 313,028 |
| Payable for capital shares redeemed | 43,156 |
| Accrued management fees | 133,407 |
| | 489,591 |
| | |
| Net Assets | $228,101,214 |
| | |
| Capital Shares, $0.01 Par Value | |
| Authorized | 80,000,000 |
| Shares outstanding | 18,079,309 |
| | |
| Net Asset Value Per Share | $12.62 |
| | |
| Net Assets Consist of: | |
| Capital (par value and paid-in surplus) | $237,406,229 |
| Undistributed net investment income | 471,590 |
| Accumulated net realized loss on investment and foreign currency transactions | (18,030,633) |
| Net unrealized appreciation on investments and translation of assets and liabilities in foreign currencies | 8,254,028 |
| | $228,101,214 |
| |
| |
| See Notes to Financial Statements. | |
13
| |
| YEAR ENDED JUNE 30, 2010 | |
| Investment Income (Loss) | |
| Income: | |
| Dividends (net of foreign taxes withheld of $63,558) | $10,892,754 |
| Interest | 2,361 |
| | 10,895,115 |
| Expenses: | |
| Management fees | 1,689,841 |
| Directors’ fees and expenses | 7,413 |
| Other expenses | 10,588 |
| | 1,707,842 |
| | |
| Net investment income (loss) | 9,187,273 |
| | |
| Realized and Unrealized Gain (Loss) | |
| Net realized gain (loss) on investment and foreign currency transactions | (6,893,889) |
| Change in net unrealized appreciation (depreciation) on investments and translation | |
| of assets and liabilities in foreign currencies | 10,462,991 |
| | |
| Net realized and unrealized gain (loss) | 3,569,102 |
| | |
| Net Increase (Decrease) in Net Assets Resulting from Operations | $12,756,375 |
| |
| |
| See Notes to Financial Statements. | |
14
|
| Statement of Changes in Net Assets |
| | |
| YEARS ENDED JUNE 30, 2010 AND JUNE 30, 2009 | | |
| Increase (Decrease) in Net Assets | 2010 | 2009 |
| Operations | | |
| Net investment income (loss) | $ 9,187,273 | $ 9,289,159 |
| Net realized gain (loss) | (6,893,889) | (10,136,166) |
| Change in net unrealized appreciation (depreciation) | 10,462,991 | (96,933,284) |
| Net increase (decrease) in net assets resulting from operations | 12,756,375 | (97,780,291) |
| | | |
| Distributions to Shareholders | | |
| From net investment income | (8,908,274) | (10,297,789) |
| | | |
| Capital Share Transactions | | |
| Proceeds from shares sold | 38,240,653 | 26,237,168 |
| Proceeds from reinvestment of distributions | 8,390,010 | 9,704,306 |
| Payments for shares redeemed | (59,111,698) | (78,199,008) |
| Net increase (decrease) in net assets from capital share transactions | (12,481,035) | (42,257,534) |
| | | |
| Net increase (decrease) in net assets | (8,632,934) | (150,335,614) |
| | | |
| Net Assets | | |
| Beginning of period | 236,734,148 | 387,069,762 |
| End of period | $228,101,214 | $236,734,148 |
| | | |
| Undistributed net investment income | $471,590 | $453,735 |
| | | |
| Transactions in Shares of the Fund | | |
| Sold | 2,863,153 | 2,073,571 |
| Issued in reinvestment of distributions | 622,364 | 766,908 |
| Redeemed | (4,462,805) | (5,951,923) |
| Net increase (decrease) in shares of the fund | (977,288) | (3,111,444) |
| |
| |
| See Notes to Financial Statements. | | |
15
|
| Notes to Financial Statements |
JUNE 30, 2010
1. Organization and Summary of Significant Accounting Policies
Organization — American Century Quantitative Equity Funds, Inc. (the corporation) is registered under the Investment Company Act of 1940 (the 1940 Act) as an open-end management investment company. Utilities Fund (the fund) is one fund in a series issued by the corporation. The fund is diversified under the 1940 Act. The fund’s investment objective is to seek current income and long-term growth of capital and income. The fund invests at least 80% of its assets in equity securities of companies engaged in the utilities industry. The following is a summary of the fund’s significant accounting policies.
Security Valuations — Securities traded primarily on a principal securities exchange are valued at the last reported sales price, or at the mean of the latest bid and asked prices where no last sales price is available. Depending on local convention or regulation, securities traded over-the-counter are valued at the mean of the latest bid and asked prices, the last sales price, or the official close price. Investments in open-end management investment companies are valued at the reported net asset value. Discount notes may be valued through a commercial pricing service or at amortized cost, which approximates fair value. Securities traded on foreign securities exchanges and over-the-counter markets are normally completed before the close of business on days that the New York Stock Exchange (the Exchange) is open and may also take place on days when the Exchange is not open. If an event occurs after the value of a security was established but before the net asset value per share was determined that was likely to materially change the net asset value, that security would be valued as determined in accordance with procedures adopted by the Board of Directors. If the fund determines that the market price of a portfolio security is not readily available, or that the valuation methods mentioned above do not reflect the security’s fair value, such security is valued as determined by the Board of Directors or its designee, in accordance with procedures adopted by the Board of Directors, if such determination would materially impact a fund’s net asset value. Certain other circumstances may cause the fund to use alternative procedures to value a security such as: a security has been declared in default; trading in a security has been halted during the trading day; or there is a foreign market holiday and no trading will commence .
Security Transactions — For financial reporting purposes, security transactions are accounted for as of the trade date. Net realized gains and losses are determined on the identified cost basis, which is also used for federal income tax purposes.
Investment Income — Dividend income less foreign taxes withheld, if any, is recorded as of the ex-dividend date. Interest income is recorded on the accrual basis and includes accretion of discounts and amortization of premiums.
Foreign Currency Translations — All assets and liabilities initially expressed in foreign currencies are translated into U.S. dollars at prevailing exchange rates at period end. The fund may enter into spot foreign currency exchange contracts to facilitate transactions denominated in a foreign currency. Purchases and sales of investment securities, dividend and interest income, spot foreign currency exchange contracts, and certain expenses are translated at the rates of exchange prevailing on the respective dates of such transactions. For assets and liabilities, other than investments in securities, net realized and unrealized gains and losses from foreign currency translations arise from changes in currency exchange rates.
Net realized and unrealized foreign currency exchange gains or losses occurring during the holding period of investment securities are a component of net realized gain (loss) on investment transactions and net unrealized appreciation (depreciation) on investments, respectively. Certain countries may impose taxes on the contract amount of purchases and sales of foreign currency contracts in their currency. The fund records the foreign tax expense, if any, as a reduction to the net realized gain (loss) on foreign currency transactions.
Repurchase Agreements — The fund may enter into repurchase agreements with institutions that American Century Investment Management, Inc. (ACIM) (the investment advisor) has determined are creditworthy pursuant to criteria adopted by the Board of Directors.
16
Each repurchase agreement is recorded at cost. The fund requires that the collateral, represented by securities, received in a repurchase transaction be transferred to the custodian in a manner sufficient to enable the fund to obtain those securities in the event of a default under the repurchase agreement. ACIM monitors, on a daily basis, the securities transferred to ensure the value, including accrued interest, of the securities under each repurchase agreement is equal to or greater than amounts owed to the fund under each repurchase agreement.
Joint Trading Account — Pursuant to an Exemptive Order issued by the Securities and Exchange Commission, the fund, along with certain other funds in the American Century Investments family of funds, may transfer uninvested cash balances into a joint trading account. These balances are invested in one or more repurchase agreements that are collateralized by U.S. Treasury or Agency obligations.
Income Tax Status — It is the fund’s policy to distribute substantially all net investment income and net realized gains to shareholders and to otherwise qualify as a regulated investment company under provisions of the Internal Revenue Code. The fund is no longer subject to examination by tax authorities for years prior to 2006. At this time, management believes there are no uncertain tax positions which, based on their technical merit, would not be sustained upon examination and for which it is reasonably possible that the total amounts of unrecognized tax benefits will significantly change in the next twelve months. Accordingly, no provision has been made for federal or state income taxes.
Distributions to Shareholders — Distributions to shareholders are recorded on the ex-dividend date. Distributions from net investment income, if any, are generally declared and paid quarterly. Distributions from net realized gains, if any, are generally declared and paid annually.
Indemnifications — Under the corporation’s organizational documents, its officers and directors are indemnified against certain liabilities arising out of the performance of their duties to the fund. In addition, in the normal course of business, the fund enters into contracts that provide general indemnifications. The maximum exposure under these arrangements is unknown as this would involve future claims that may be made against a fund. The risk of material loss from such claims is considered by management to be remote.
Use of Estimates — The financial statements are prepared in conformity with accounting principles generally accepted in the United States of America, which may require management to make certain estimates and assumptions at the date of the financial statements. Actual results could differ from these estimates.
Subsequent Events — In preparing the financial statements, management evaluated the impact of events or transactions occurring through the date the financial statements were issued that would merit recognition or disclosure.
2. Fees and Transactions with Related Parties
Management Fees — The corporation has entered into a Management Agreement with ACIM, under which ACIM provides the fund with investment advisory and management services in exchange for a single, unified management fee (the fee). The Agreement provides that all expenses of managing and operating the fund, except brokerage expenses, taxes, interest, fees and expenses of the independent directors (including legal counsel fees), and extraordinary expenses, will be paid by ACIM. The fee is computed and accrued daily based on the daily net assets of the specific class of shares of the fund and paid monthly in arrears. The fee consists of (1) an Investment Category Fee based on the daily net assets of the fund and certain other accounts managed by the investment advisor that are in the same broad investment category as the fund and (2) a Complex Fee based on the assets of all the funds in the American Century Investments family of funds. The rates for the Investment Category Fee range from 0.3380% to 0.5200%. The rates for the Complex Fee range from 0.2500% to 0.3100%. The effective annual management fee for the year ended June 30, 2010 was 0.69%.
17
Related Parties — Certain officers and directors of the corporation are also officers and/ or directors of American Century Companies, Inc. (ACC), the parent of the corporation’s investment advisor, ACIM, the distributor of the corporation, American Century Investment Services, Inc., and the corporation’s transfer agent, American Century Services, LLC.
The fund is eligible to invest in a money market fund for temporary purposes, which is managed by J.P. Morgan Investment Management, Inc. (JPMIM). The fund has a Mutual Funds Services Agreement with J.P. Morgan Investor Services Co. (JPMIS) and a securities lending agreement with JPMorgan Chase Bank (JPMCB). JPMCB is a custodian of the fund. JPMIM, JPMIS and JPMCB are wholly owned subsidiaries of JPMorgan Chase & Co. (JPM). JPM is an equity investor in ACC.
3. Investment Transactions
Purchases and sales of investment securities, excluding short-term investments, for the year ended June 30, 2010, were $26,074,746 and $39,355,465, respectively.
4. Fair Value Measurements
The fund’s securities valuation process is based on several considerations and may use multiple inputs to determine the fair value of the positions held by the fund. In conformity with accounting principles generally accepted in the United States of America, the inputs used to determine a valuation are classified into three broad levels as follows:
• Level 1 valuation inputs consist of unadjusted quoted prices in an active market for identical securities;
• Level 2 valuation inputs consist of significant direct or indirect observable market data (including quoted prices for similar securities, evaluations of subsequent market events, interest rates, prepayment speeds, credit risk, etc.); or
• Level 3 valuation inputs consist of significant unobservable inputs (including a fund’s own assumptions).
The level classification is based on the lowest level input that is significant to the fair valuation measurement. The valuation inputs are not an indication of the risks associated with investing in these securities or other financial instruments.
The following is a summary of the valuation inputs used to determine the fair value of the fund’s securities as of June 30, 2010. The Schedule of Investments provides additional details on the fund’s portfolio holdings.
| | | |
| | Level 1 | Level 2 | Level 3 |
| Investment Securities | | | |
| Domestic Common Stocks | $210,566,402 | — | — |
| Foreign Common Stocks | 8,821,565 | $5,448,716 | — |
| Temporary Cash Investments | 39,761 | 2,800,000 | — |
| Total Value of Investment Securities | $219,427,728 | $8,248,716 | — |
18
5. Interfund Lending
The fund, along with certain other funds in the American Century Investments family of funds, may participate in an interfund lending program, pursuant to an Exemptive Order issued by the Securities and Exchange Commission (SEC). This program provides an alternative credit facility allowing the fund to borrow from or lend to other funds in the American Century Investments family of funds that permit such transactions. Interfund lending transactions are subject to each fund’s investment policies and borrowing and lending limits. The interfund loan rate earned/paid on interfund lending transactions is determined daily based on the average of certain current market rates. Interfund lending transactions normally extend only overnight, but can have a maximum duration of seven days. The program is subject to annual approval by the Board of Directors. During the year ended June 30, 2010, the fund did not utilize the program.
6. Risk Factors
The fund concentrates its investments in a narrow segment of the total market. Because of this, the fund may be subject to greater risk and market fluctuations than a portfolio representing a broader range of industries.
There are certain risks involved in investing in foreign securities. These risks include those resulting from future adverse political, social, and economic developments, fluctuations in currency exchange rates, the possible imposition of exchange controls, and other foreign laws or restrictions.
7. Federal Tax Information
The tax character of distributions paid during the years ended June 30, 2010 and June 30, 2009 were as follows:
| | |
| | 2010 | 2009 |
| Distributions Paid From | | |
| Ordinary income | $8,908,274 | $10,297,789 |
| Long-term capital gains | — | — |
The book-basis character of distributions made during the year from net investment income or net realized gains may differ from their ultimate characterization for federal income tax purposes. These differences reflect the differing character of certain income items and net realized gains and losses for financial statement and tax purposes, and may result in reclassification among certain capital accounts on the financial statements.
As of June 30, 2010, the federal tax cost of investments and the components of distributable earnings on a tax-basis were as follows:
| | |
| Federal tax cost of investments | $219,955,552 |
| Gross tax appreciation of investments | $ 28,504,301 |
| Gross tax depreciation of investments | (20,783,409) |
| Net tax appreciation (depreciation) of investments | $ 7,720,892 |
| Net tax appreciation (depreciation) on derivatives and translation | |
| of assets and liabilities in foreign currencies | $ (747) |
| Net tax appreciation (depreciation) | $7,720,145 |
| Undistributed ordinary income | $471,590 |
| Accumulated capital losses | $(14,489,405) |
| Capital loss deferral | $(3,007,345) |
The difference between book-basis and tax-basis cost and unrealized appreciation (depreciation) is attributable primarily to the tax deferral of losses on wash sales.
19
The accumulated capital losses listed on the previous page represent net capital loss carryovers that may be used to offset future realized capital gains for federal income tax purposes. Future capital loss carryover utilization in any given year may be subject to Internal Revenue Code limitations. The capital loss carryovers of $(492,967), $(2,580,682) and $(11,415,756) expire in 2011, 2017 and 2018, respectively.
The capital loss deferral listed on the previous page represents net capital losses incurred in the eight-month period ended June 30, 2010. The fund has elected to treat such losses as having been incurred in the following fiscal year for federal income tax purposes.
8. Corporate Event
As part of a long-standing estate and business succession plan established by ACC Co-Chairman James E. Stowers, Jr., the founder of American Century Investments, ACC Co-Chairman Richard W. Brown succeeded Mr. Stowers as trustee of a trust that holds a greater-than-25% voting interest in ACC, the parent corporation of the fund’s advisor. Under the 1940 Act, this is presumed to represent control of ACC even though it is less than a majority interest. The change of trustee may technically be considered a “change of control” of ACC and therefore also a change of control of the fund’s advisor even though there has been no change to its management and none is anticipated. The “change of control” resulted in the assignment of the fund’s investment advisory agreement. Under the 1940 Act, an assignment automatically terminated such agreement, making the approval of a new agreement neces sary.
On February 18, 2010, the Board of Directors approved an interim investment advisory agreement under which the fund will be managed until a new agreement is approved by fund shareholders. On April 1, 2010, the Board of Directors approved a new investment advisory agreement. The interim agreement and the new agreement are substantially identical to the terminated agreements (with the exception of different effective and termination dates) and will not result in changes in the management of American Century Investments, the fund, its investment objectives, fees or services provided.
The new agreement for the fund was approved by shareholders at a Special Meeting of Shareholders on June 16, 2010. The new agreement went into effect on July 16, 2010.
9. Other Tax Information (Unaudited)
The following information is provided pursuant to provisions of the Internal Revenue Code.
The fund hereby designates up to the maximum amount allowable as qualified dividend income for the fiscal year ended June 30, 2010.
For corporate taxpayers, the fund hereby designates $8,908,274, or up to the maximum amount allowable, of ordinary income distributions paid during the fiscal year ended June 30, 2010 as qualified for the corporate dividends received deduction.
20
| | | | | | | |
| Utilities | | | | | | |
| For a Share Outstanding Throughout the Years Ended June 30 (except as noted) | | |
| | | 2010 | 2009 | 2008 | 2007(1) | 2006 | 2005 |
| Per-Share Data | | | | | | |
| Net Asset Value, | | | | | | |
| Beginning of Period | $12.42 | $17.46 | $18.04 | $16.30 | $13.40 | $12.08 |
| Income From | | | | | | |
| Investment Operations | | | | | | |
| Net Investment | | | | | | |
| Income (Loss)(2) | 0.49 | 0.46 | 0.39 | 0.20 | 0.38 | 0.40 |
| Net Realized and | | | | | | |
| Unrealized Gain (Loss) | 0.19 | (4.98) | (0.61) | 1.70 | 2.92 | 1.32 |
| Total From | | | | | | |
| Investment Operations | 0.68 | (4.52) | (0.22) | 1.90 | 3.30 | 1.72 |
| Distributions | | | | | | |
| From Net | | | | | | |
| Investment Income | (0.48) | (0.52) | (0.36) | (0.16) | (0.40) | (0.40) |
| Net Asset Value, | | | | | | |
| End of Period | $12.62 | $12.42 | $17.46 | $18.04 | $16.30 | $13.40 |
| |
| Total Return(3) | 5.30% | (25.89)% | (1.26)% | 11.71% | 24.99% | 14.30% |
| | | | | | | |
| Ratios/Supplemental Data | | | | | | |
| Ratio of Operating | | | | | | |
| Expenses to Average | | | | | | |
| Net Assets | 0.70% | 0.70% | 0.68% | 0.67%(4) | 0.68% | 0.67% |
| Ratio of Net Investment | | | | | | |
| Income (Loss) | | | | | | |
| to Average Net Assets | 3.75% | 3.54% | 2.16% | 2.30%(4) | 2.62% | 3.09% |
| Portfolio Turnover Rate | 11% | 14% | 19% | 20% | 45% | 21% |
| Net Assets, End of Period | | | | | | |
| (in thousands) | $228,101 | $236,734 | $387,070 | $502,099 | $336,672 | $292,575 |
| (1) | January 1, 2007 through June 30, 2007. The fund’s fiscal year end was changed from December 31 to June 30, resulting in a six-month annual |
| | reporting period. For the years before June 30, 2007, the fund’s fiscal year end was December 31. | | |
| (2) | Computed using average shares outstanding throughout the period. | | | | |
| (3) | Total return assumes reinvestment of net investment income and capital gains distributions, if any. Total returns for periods less than one year |
| | are not annualized. Total returns are calculated based on the net asset value of the last business day. | | |
| (4) | Annualized. | | | | | | |
See Notes to Financial Statements.
21
|
| Report of Independent Registered Public Accounting Firm |
To the Directors of the American Century Quantitative Equity Funds, Inc.
and Shareholders of the Utilities Fund:
In our opinion, the accompanying statement of assets and liabilities, including the schedule of investments, and the related statements of operations and of changes in net assets and the financial highlights present fairly, in all material respects, the financial position of the Utilities Fund (one of the eleven funds comprising the American Century Quantitative Equity Funds, Inc., hereafter referred to as the “Fund”) at June 30, 2010, the results of its operations for the year then ended, the changes in its net assets for each of the two years in the period then ended and the financial highlights for each of the periods presented, in conformity with accounting principles generally accepted in the United States of America. These financial statements and financial highlights (hereafter referred to as “financial statements”) are the responsibility of the Fund’s management; our responsibility is to express an opinion on these financial statements based on our audits. We conducted our audits of these financial statements in accordance with the standards of the Public Company Accounting Oversight Board (United States). Those standards require that we plan and perform the audit to obtain reasonable assurance about whether the financial statements are free of material misstatement. An audit includes examining, on a test basis, evidence supporting the amounts and disclosures in the financial statements, assessing the accounting principles used and significant estimates made by management, and evaluating the overall financial statement presentation. We believe that our audits, which included confirmation of securities at June 30, 2010 by correspondence with the custodian and brokers, provide a reasonable basis for our opinion.
PricewaterhouseCoopers LLP
Kansas City, Missouri
August 19, 2010
22
A special meeting of shareholders was held on June 16, 2010, to vote on the following proposals. Each proposal received the required number of votes and was adopted. A summary of voting results is listed below each proposal.
Proposal 1:
To elect one Director to the Board of Directors of American Century Quantitative Equity Funds, Inc. (the proposal was voted on by all shareholders of funds issued by American Century Quantitative Equity Funds, Inc.):
| | |
| Frederick L.A. Grauer | For: | 4,067,909,978 |
| | Withhold: | 174,470,448 |
| | Abstain: | 0 |
| | Broker Non-Vote: | 0 |
The other directors whose term of office continued after the meeting include Jonathan S. Thomas, John Freidenrich, Ronald J. Gilson, Peter F. Pervere, Myron S. Scholes, and John B. Shoven.
Proposal 2:
To approve a management agreement between the fund and American Century Investment Management, Inc.:
| | |
| Investor Class | For: | 143,449,883 |
| | Against: | 4,877,008 |
| | Abstain: | 5,206,489 |
| | Broker Non-Vote: | 23,455,454 |
23
The Board of Directors
The individuals listed below serve as directors of the fund. Each director will continue to serve in this capacity until death, retirement, resignation or removal from office. The mandatory retirement age for directors who are not “interested persons,” as that term is defined in the Investment Company Act (independent directors), is 73. However, the mandatory retirement age may be extended for a period not to exceed two years with the approval of the remaining independent directors.
Mr. Thomas is the only director who is an “interested person” because he currently serves as President and Chief Executive Officer of American Century Companies, Inc. (ACC), the parent company of American Century Investment Management, Inc. (ACIM or the advisor).
The other directors (more than three-fourths of the total number) are independent; that is, they have never been employees, directors or officers of, and have no financial interest in, ACC or any of its wholly owned, direct or indirect, subsidiaries, including ACIM, American Century Investment Services, Inc. (ACIS) and American Century Services, LLC (ACS). The directors serve in this capacity for eight (in the case of Mr. Thomas, 15) registered investment companies in the American Century Investments family of funds.
The following presents additional information about the directors. The mailing address for each director other than Mr. Thomas is 1665 Charleston Road, Mountain View, California 94043. The mailing address for Mr. Thomas is 4500 Main Street, Kansas City, Missouri 64111.
Independent Directors
John Freidenrich
Year of Birth: 1937
Position(s) with the Fund: Director
Length of Time Served: Since 2005
Principal Occupation(s) During the Past Five Years: Founder, Member and Manager, Regis
Management Company, LLC (investment management firm) (April 2004 to present)
Number of Funds in Fund Complex Overseen by Director: 41
Other Directorships Held by Director During the Past Five Years: None
Education/Other Professional Experience: AB in Economics, Stanford University; LLB,
Stanford Law School; formerly, Partner and Founder, Ware and Freidenrich Law
Firm and Bay Partners; formerly, President, Board of Trustees, Stanford University
Ronald J. Gilson
Year of Birth: 1946
Position(s) with the Fund: Director and Chairman of the Board
Length of Time Served: Since 1995
Principal Occupation(s) During the Past Five Years: Charles J. Meyers Professor of Law and
Business, Stanford Law School (1979 to present); Marc and Eva Stern Professor of
Law and Business, Columbia University School of Law (1992 to present)
Number of Funds in Fund Complex Overseen by Director: 41
Other Directorships Held by Director During the Past Five Years: None
Education/Other Professional Experience: BA, Washington University; JD, Yale Law School;
formerly, Attorney, Steinhart, Goldberg, Feigenbaum & Ladar
24
Frederick L. A. Grauer
Year of Birth: 1946
Position(s) with the Fund: Director
Length of Time Served: Since 2008
Principal Occupation(s) During the Past Five Years: Senior Advisor, BlackRock, Inc. (investment
management firm) (2010 to present); Senior Advisor, Barclays Global Investors
(investment management firm) (2003 to 2009)
Number of Funds in Fund Complex Overseen by Director: 41
Other Directorships Held by Director During the Past Five Years: None
Education/Other Professional Experience: BA in Economics, University of British Columbia;
MA in Economics, University of Chicago; PhD in Business, Stanford University;
formerly, Executive Chairman, Barclays Global Investors; Chairman and Chief
Executive Officer, Wells Fargo Nikko Investment Advisors; and Vice President,
Merrill Lynch Capital Markets Group; formerly, Director, New York Stock Exchange,
Chicago Mercantile Exchange and Columbia University; formerly, Faculty Member,
Graduate School of Business, Columbia University and Alfred P. Sloan School of
Management, Massachusetts Institute of Technology
Peter F. Pervere
Year of Birth: 1947
Position(s) with the Fund: Director
Length of Time Served: Since 2007
Principal Occupation(s) During the Past Five Years: Retired
Number of Funds in Fund Complex Overseen by Director: 41
Other Directorships Held by Director During the Past Five Years: Intraware, Inc. (2003 to 2009);
Digital Impact, Inc. (2003 to 2005)
Education/Other Professional Experience: BA in History, Stanford University; CPA; formerly,
Vice President and Chief Financial Officer, Commerce One, Inc. (software and
services provider); formerly, Vice President and Corporate Controller, Sybase, Inc.;
formerly with accounting firm of Arthur Young & Co.
Myron S. Scholes
Year of Birth: 1941
Position(s) with the Fund: Director
Length of Time Served: Since 1980
Principal Occupation(s) During the Past Five Years: Chairman, Platinum Grove Asset
Management, L.P. (asset manager) (1999 to 2009); Frank E. Buck Professor of
Finance-Emeritus, Stanford Graduate School of Business (1996 to present)
Number of Funds in Fund Complex Overseen by Director: 41
Other Directorships Held by Director During the Past Five Years: Dimensional Fund Advisors
(investment advisor); CME Group, Inc. (futures and options exchange)
Education/Other Professional Experience: BA in Economics, McMaster University (Ontario);
MBA and PhD, University of Chicago; formerly, Senior Research Fellow at the
Hoover Institute; formerly, Edward Eagle Brown Professor of Finance, University of
Chicago; recipient of the Alfred Nobel Memorial Prize in Economic Sciences
25
John B. Shoven
Year of Birth: 1947
Position(s) with the Fund: Director
Length of Time Served: Since 2002
Principal Occupation(s) During the Past Five Years: Professor of Economics, Stanford University
(1973 to present)
Number of Funds in Fund Complex Overseen by Director: 41
Other Directorships Held by Director During the Past Five Years: Cadence Design Systems;
Exponent; Financial Engines; PalmSource, Inc. (2002 to 2005); Watson Wyatt
Worldwide (2002 to 2006)
Education/Other Professional Experience: BA in Physics, University of California; PhD in
Economics, Yale University; Director of the Stanford Institute for Economic Policy
Research (1999 to present); formerly, Chair of Economics and Dean of Humanities
and Sciences, Stanford University
Interested Director
Jonathan S. Thomas
Year of Birth: 1963
Position(s) with the Fund: Director and President
Length of Time Served: Since 2007
Principal Occupation(s) During the Past Five Years: President and Chief Executive Officer,
ACC (March 2007 to present); Chief Administrative Officer, ACC (February 2006 to
February 2007); Executive Vice President, ACC (November 2005 to February 2007);
Global Chief Operating Officer and Managing Director, Morgan Stanley (investment
management) (March 2000 to November 2005). Also serves as: Chief Executive
Officer and Manager, ACS; Executive Vice President, ACIM; Director, ACC, ACIM
and other ACC subsidiaries
Number of Funds in Fund Complex Overseen by Director: 104
Other Directorships Held by Director During the Past Five Years: None
Education/Other Professional Experience: BA in Economics, University of Massachusetts;
MBA, Boston College; formerly held senior leadership roles with Fidelity
Investments, Boston Financial Services and Bank of America; serves on the Board of
Governors of the Investment Company Institute
26
Officers
The following table presents certain information about the executive officers of the fund. Each officer serves as an officer for each of the 15 investment companies in the American Century family of funds, unless otherwise noted. No officer is compensated for his or her service as an officer of the fund. The listed officers are interested persons of the fund and are appointed or re-appointed on an annual basis. The mailing address for each of the officers listed below is 4500 Main Street, Kansas City, Missouri 64111.
| | |
| Name | Offices with | |
| (Year of Birth) | the Fund | Principal Occupation(s) During the Past Five Years |
| Jonathan S. | Director and | President and Chief Executive Officer, ACC (March 2007 to present); |
| Thomas | President | Chief Administrative Officer, ACC (February 2006 to February 2007); |
| (1963) | since 2007 | Executive Vice President, ACC (November 2005 to February 2007); Global |
| | | Chief Operating Officer and Managing Director, Morgan Stanley (March |
| | | 2000 to November 2005). Also serves as: Chief Executive Officer and |
| | | Manager, ACS; Executive Vice President, ACIM; Director, ACC, ACIM and |
| | | other ACC subsidiaries |
| Barry Fink | Executive | Chief Operating Officer and Executive Vice President, ACC (September 2007 |
| (1955) | Vice President | to present); President, ACS (October 2007 to present); Managing Director, |
| | since 2007 | Morgan Stanley (2000 to 2007); Global General Counsel, Morgan Stanley |
| | | (2000 to 2006). Also serves as: Manager, ACS, and Director, ACC and |
| | | certain ACC subsidiaries |
| Maryanne L. | Chief Compliance | Chief Compliance Officer, American Century funds, ACIM and ACS (August |
| Roepke | Officer since 2006 | 2006 to present); Assistant Treasurer, ACC (January 1995 to August 2006); |
| (1956) | and Senior | and Treasurer and Chief Financial Officer, various American Century funds |
| | Vice President | (July 2000 to August 2006). Also serves as: Senior Vice President, ACS |
| | since 2000 | |
| Charles A. | General Counsel | Attorney, ACC (February 1994 to present); Vice President, ACC (November |
| Etherington | since 2007 and | 2005 to present); General Counsel, ACC (March 2007 to present); Also |
| (1957) | Senior Vice | serves as General Counsel, ACIM, ACS, ACIS and other ACC subsidiaries; |
| | President | and Senior Vice President, ACIM and ACS |
| | since 2006 | |
| Robert J. Leach | Vice President, | Vice President, ACS (February 2000 to present); and Controller, various |
| (1966) | Treasurer and | American Century funds (1997 to September 2006) |
| | Chief Financial | |
| | Officer since 2006 | |
| David H. Reinmiller | Vice President | Attorney, ACC (January 1994 to present); Associate General Counsel, ACC |
| (1963) | since 2001 | (January 2001 to present); Chief Compliance Officer, American Century |
| | | funds and ACIM (January 2001 to February 2005). Also serves as: Vice |
| | | President, ACIM and ACS |
| Ward D. Stauffer | Secretary | Attorney, ACC (June 2003 to Present) |
| (1960) | since 2005 | |
The SAI has additional information about the fund’s directors and is available without charge, upon request, by calling 1-800-345-2021.
27
|
| Board Approval of Management Agreements |
American Century Investment Management, Inc. (“ACIM” or the “Advisor”) currently serves as investment advisor to the Fund under a management agreement (the “Current Management Agreement”) that took effect on July 16, 2010, following approval by the Fund’s Board of Directors (the “Board”) and shareholders. The Advisor previously served as investment advisor to the Fund pursuant to a prior management agreement (the “Prior Management Agreement”) and an interim management agreement (the “Interim Management Agreement”). The Interim Management Agreement terminated in accordance with its terms on July 16, 2010, upon the effectiveness of the Current Management Agreement. The Prior Management Agreement terminated on February 16, 2010, as a result of a change of control of the Advisor’s parent company, American Century Companies, Inc. (“ACC”). T he change in control occurred as the result of a change in the trustee of a trust created by James E. Stowers, Jr., the founder of American Century Investments that holds shares representing a significant interest in ACC stock. Mr. Stowers previously served as the trustee of the trust. On February 16, 2010, Richard W. Brown, Co-Chairman of ACC with Mr. Stowers, became the trustee in accordance with the terms of the trust and Mr. Stowers’ long-standing estate and succession plan.
On February 18, 2010, the Board approved the Interim Management Agreement in accordance with Rule 15a-4 under the Investment Company Act to ensure continued management of the Fund by the Advisor after the termination of the Prior Management Agreement and until shareholder approval of the Current Management Agreement as required under the Act. The Board approved the Current Management Agreement and recommended its approval to shareholders. Fund shareholders approved the Current Management Agreement at a meeting held on June 16, 2010.
The Interim Management Agreement and the Current Management Agreement are substantially identical to the Prior Management Agreement except for their effective dates and the termination provisions of the Interim Management Agreement. Under the Interim and Current Management Agreements, the Advisor will provide the same services to the Fund and receive the same compensation rate as under the Prior Management Agreement.
Basis for Board Approval of Interim Management Agreement
In considering the approval of the Interim Management Agreement, Rule 15a-4 requires the Board to approve the contract within ten business days of the termination of the prior agreement and to determine that the compensation to be received under the interim agreement is no greater than would have been received under the prior agreement. In connection with the approval, the Board noted that it oversees on a continuous basis and evaluates at its quarterly meetings, directly and through the committees of the Board, the nature and quality of significant services provided by the Advisor, the investment performance of the Fund, shareholder services, audit and compliance functions and a variety of other matters relating to the Fund’s operations.
28
In evaluating the Interim Management Agreement, the Board, assisted by the advice of its independent legal counsel, considered a number of factors in addition to those required by the rule with no one factor being determinative to its analysis. Among the factors considered by the Board were the circumstances and effect of the change of control, the fact that the Advisor will provide the same services and receive the same compensation rate as under the Prior Management Agreement, and that the change of control did not result in a change of the personnel managing the Fund. Upon completion of its analysis, the Board approved the Interim Management Agreement, determining that the continued management of the Fund by the Advisor was in the best interests of the Fund and Fund shareholders.
Basis for Board Approval of Current Management Agreement
At a meeting held on April 1, 2010, after considering all information presented, the Board approved, and determined to recommend that shareholders approve, the Current Management Agreement. In connection with that approval, the Board requested and reviewed extensive data and information compiled by the Advisor and certain independent providers of evaluation data concerning the Fund and services provided to the Fund by the Advisor. The Board oversees on a continuous basis and evaluates at its quarterly meetings, directly and through the committees of the Board, the nature and quality of significant services provided by the Advisor, the investment performance of the Fund, shareholder services, audit and compliance functions and a variety of other matters relating to the Fund’s operations. The information considered and the discussions held at the meetings included, but were not limited to:
• the nature, extent and quality of investment management, shareholder services and other services provided to the Fund;
• the wide range of programs and services the Advisor provides to the Fund and its shareholders on a routine and non-routine basis;
• the compliance policies, procedures, and regulatory experience of the Advisor;
• data comparing the cost of owning the Fund to the cost of owning similar funds;
• the fact that there will be no changes to the fees, services, or personnel who provide such services as compared to the Prior Management Agreement;
• data comparing the Fund’s performance to appropriate benchmarks and/or a peer group of other mutual funds with similar investment objectives and strategies;
• financial data showing the profitability of the Fund to the Advisor and the overall profitability of the Advisor;
• data comparing services provided and charges to the Fund with those for other non-fund investment management clients of the Advisor; and
29
• consideration of collateral or “fall-out” benefits derived by the Advisor from the management of the Fund and potential sharing of economies of scale in connection with the management of the Fund.
The Board also considered whether there was any reason for not continuing the existing arrangement with the Advisor. In particular, the Board recognized that shareholders may have invested in the Fund on the strength of the Advisor’s industry standing and reputation and in the expectation that the Advisor will have a continuing role in providing advisory services to the Fund.
The Board considered all of the information provided by the Advisor, the independent data providers, and the Board’s independent legal counsel, and evaluated such information for the Fund. The Board did not identify any single factor as being all-important or controlling, and each Board member may have attributed different levels of importance to different factors. In deciding to approve the Current Management Agreement under the terms ultimately determined by the Board to be appropriate, the Board based its decision on a number of factors, including the following:
Nature, Extent and Quality of Services — Generally. Under the Current Management Agreement, the Advisor is responsible for providing or arranging for all services necessary for the operation of the Fund. The Board noted that under the Current Management Agreement, the Advisor provides or arranges at its own expense a wide variety of services including:
• constructing and designing the Fund
• portfolio research and security selection
• initial capitalization/funding
• securities trading
• Fund administration
• custody of Fund assets
• daily valuation of the Fund’s portfolio
• shareholder servicing and transfer agency, including shareholder
confirmations, recordkeeping and communications
• legal services
• regulatory and portfolio compliance
• financial reporting
• marketing and distribution
30
The Board noted that many of these services have expanded over time both in terms of quantity and complexity in response to shareholder demands, competition in the industry, changing distribution channels and the changing regulatory environment.
Investment Management Services. The investment management services provided to the Fund are complex and provide Fund shareholders access to professional money management, instant diversification of their investments within an asset class, the opportunity to easily diversify among asset classes, and liquidity. As a part of its general oversight and in evaluating investment performance, the Board expects the Advisor to manage the Fund in accordance with its investment objectives and approved strategies. In providing these services, the Advisor utilizes teams of investment professionals who require extensive information technology, research, training, compliance and other systems to conduct their business. The Board, directly and through its Portfolio Committee, regularly reviews investment performance information for the Fund, t ogether with comparative information for appropriate benchmarks and/or peer groups of similarly-managed funds, over different time horizons. If performance concerns are identified, the underperforming Fund receives special reviews until performance improves, during which time the Board discusses with the Advisor the reasons for such underperformance and any efforts being undertaken to improve performance.
Shareholder and Other Services. Under the Current Management Agreement, the Advisor will also provide the Fund with a comprehensive package of transfer agency, shareholder, and other services. The Board, directly and through the various committees of the Board, regularly reviews reports and evaluations of such services. These reports include, but are not limited to, information regarding the operational efficiency and accuracy of the shareholder and transfer agency services provided, staffing levels, shareholder satisfaction (as measured by external as well as internal sources), technology support, new products and services offered to Fund shareholders, securities trading activities, portfolio valuation services, auditing services, and legal and operational compliance activities. Certain aspects of shareholder and transfer age ncy service level efficiency and the quality of securities trading activities are measured by independent third party providers and are presented in comparison to other fund groups not managed by the Advisor.
Costs of Services Provided and Profitability. The Advisor provided detailed information concerning its cost of providing various services to the Fund, its profitability in managing the Fund, its overall profitability, and its financial condition. The Board reviewed with the Advisor the methodology used to prepare this financial information. The Board has also reviewed with the Advisor its methodology for compensating the investment professionals that provide services to the Fund as well as compensation to the five highest paid personnel of the Advisor. This financial information regarding the Advisor is considered in order to evaluate the Advisor’s financial condition, its ability to continue to provide services under the Current Management Agreement, and the reasonableness of the current management fees.
31
Ethics. The Board generally considers the Advisor’s commitment to providing quality services to shareholders and to conducting its business ethically. It noted that the Advisor’s practices generally meet or exceed industry best practices.
Economies of Scale. The Board also reviewed information provided by the Advisor regarding the possible existence of economies of scale in connection with the management of the Fund. The Board concluded that economies of scale are difficult to measure and predict with precision, especially on a fund-by-fund basis. The analysis of economies of scale is further complicated by the additional services and content provided by the Advisor and its reinvestment in its ability to provide and expand those services. Accordingly, the Board seeks to evaluate economies of scale by reviewing information, such as year-over-year profitability of the Advisor generally, the profitability of its management of the Fund specifically, and the expenses incurred by the Advisor in providing various functions to the Fund. The Board believes the Advisor i s appropriately sharing economies of scale through its competitive fee structure, offering competitive fees from fund inception, fee breakpoints as the fund complex and the Fund increases in size, and through reinvestment in its business to provide shareholders additional services and enhancements to existing services. In particular, separate breakpoint schedules based on the size of the entire fund complex and on the size of the Fund reflect the complexity of assessing economies of scale.
Comparison to Fees of Funds not Managed by the Advisor. Both the Prior and Current Management Agreements provide that the Fund pays the Advisor a single, all-inclusive (or unified) management fee for providing all services necessary for the management and operation of the Fund, other than brokerage expenses, taxes, interest, extraordinary expenses, and the fees and expenses of the Fund’s Independent Directors (including their independent legal counsel) and expenses incurred in connection with the provision of shareholder services and distribution services under a plan adopted pursuant to Rule 12b-1 under the 1940 Act. Under the unified fee structure, the Advisor is responsible for providing all investment advisory, custody, audit, administrative, compliance, recordkeeping, marketing and shareholder services, or arranging and supervising third parties that provide such services. By contrast, most other funds are charged a variety of fees, including an investment advisory fee, a transfer agency fee, an administrative fee, distribution charges and other expenses. Other than their investment advisory fees and any applicable Rule 12b-1 distribution fees, the components of the total fees charged by these other funds may be increased without shareholder approval. The Board believes the unified fee structure is a benefit to Fund shareholders because it clearly discloses to shareholders the cost of owning Fund shares, and, since the unified fee cannot be increased without a vote of Fund shareholders, it shifts to the Advisor the risk of increased costs of operating the Fund and provides a direct incentive to minimize administrative inefficiencies. Part of the Board’s analysis of fee levels involves reviewing certain evaluative data compiled by an independent provider comparing the Fund’s unified fee to the total expense rat ios of similar funds not managed by the Advisor. The
32
Board concluded that the management fee to be paid by the Fund to the Advisor under the Current Management Agreement is reasonable in light of the services to be provided to the Fund.
Comparison to Fees and Services Provided to Other Clients of the Advisor. The Board also requested and received information from the Advisor concerning the nature and extent of the services, fees, and profitability of its advisory services to advisory clients other than the Fund. They observed that these varying types of client accounts require different services and involve different regulatory and entrepreneurial risks than the management of the Fund. The Board analyzed this information and concluded that the fees charged and services provided to the Fund were reasonable by comparison.
Collateral or “Fall-Out” Benefits Derived by the Advisor. The Board considered the existence of collateral benefits the Advisor may receive as a result of its relationship with the Fund. The Board concluded that the Advisor’s primary business is managing mutual funds and it generally does not use Fund or shareholder information to generate profits in other lines of business, and therefore does not derive any significant collateral benefits from them. The Board noted that the Advisor receives proprietary research from broker-dealers that execute Fund portfolio transactions and concluded that this research is likely to benefit Fund shareholders. The Board also determined that the Advisor is able to provide investment management services to certain clients other than the Fund, at least in part, due to its existing infrastructure built to serve the fund complex. The Board concluded, however, that the assets of those other clients are not material to the analysis and, in any event, are included with the assets of the Fund to determine breakpoints in the Fund’s fee schedule, provided they are managed using the same investment team and strategy.
Conclusion of the Board. As a result of this process, the Board, in the absence of particular circumstances and assisted by the advice of its independent legal counsel, taking into account all of the factors discussed above and the information provided by the Advisor and others, concluded that the Current Management Agreement be approved and recommended its approval to Fund shareholders.
33
Retirement Account Information
As required by law, distributions you receive from certain IRAs, or 403(b), 457 and qualified plans are subject to federal income tax withholding, unless you elect not to have withholding apply. Tax will be withheld on the total amount withdrawn even though you may be receiving amounts that are not subject to withholding, such as nondeductible contributions. In such case, excess amounts of withholding could occur. You may adjust your withholding election so that a greater or lesser amount will be withheld.
If you don’t want us to withhold on this amount, you must notify us to not withhold the federal income tax. You may notify us in writing or in certain situations by telephone or through other electronic means. You have the right to revoke your withholding election at any time and any election you make may remain in effect until revoked by filing a new election.
Remember, even if you elect not to have income tax withheld, you are liable for paying income tax on the taxable portion of your withdrawal. If you elect not to have income tax withheld or you don’t have enough income tax withheld, you may be responsible for payment of estimated tax. You may incur penalties under the estimated tax rules if your withholding and estimated tax payments are not sufficient. You can reduce or defer the income tax on a distribution by directly or indirectly rolling such distribution over to another IRA or eligible plan. You should consult your tax advisor for additional information.
State tax will be withheld if, at the time of your distribution, your address is within one of the mandatory withholding states and you have federal income tax withheld. State taxes will be withheld from your distribution in accordance with the respective state rules.
Proxy Voting Guidelines
American Century Investment Management, Inc., the fund’s investment advisor, is responsible for exercising the voting rights associated with the securities purchased and/or held by the fund. A description of the policies and procedures the advisor uses in fulfilling this responsibility is available without charge, upon request, by calling 1-800-345-2021. It is also available on American Century Investments’ website at americancentury.com and on the Securities and Exchange Commission’s website at sec.gov. Information regarding how the investment advisor voted proxies relating to portfolio securities during the most recent 12-month period ended June 30 is available on the “About Us” page at americancentury.com. It is also available at sec.gov.
Quarterly Portfolio Disclosure
The fund files its complete schedule of portfolio holdings with the Securities and Exchange Commission (SEC) for the first and third quarters of each fiscal year on Form N-Q. The fund’s Forms N-Q are available on the SEC’s website at sec.gov, and may be reviewed and copied at the SEC’s Public Reference Room in Washington, DC. Information on the operation of the Public Reference Room may be obtained by calling 1-800-SEC-0330. The fund also makes its complete schedule of portfolio holdings for the most recent quarter of its fiscal year available on its website at americancentury.com and, upon request, by calling 1-800-345-2021.
34
The following indices are used to illustrate investment market, sector, or style performance or to serve as fund performance comparisons. They are not investment products available for purchase.
The Lipper Utility Fund Index tracks the performance of the 10 largest funds in Lipper Inc.’s utilities fund category. Each fund in the category is at least 65% invested in utilities stocks.
The Nasdaq Composite Index is a market value-weighted index of all domestic and international common stocks listed on the Nasdaq stock market.
The Russell 1000® Index is a market-capitalization weighted, large-cap index created by Frank Russell Company to measure the performance of the 1,000 largest publicly traded U.S. companies, based on total market capitalization.
The Russell 1000® Growth Index measures the performance of those Russell 1000 Index companies (the 1,000 largest publicly traded U.S. companies, based on total market capitalization) with higher price-to-book ratios and higher forecasted growth values.
The Russell 1000® Value Index measures the performance of those Russell 1000 Index companies (the 1,000 largest publicly traded U.S. companies, based on total market capitalization) with lower price-to-book ratios and lower forecasted growth values.
The Russell 2000® Index is a market-capitalization weighted index created by Frank Russell Company to measure the performance of the 2,000 smallest of the 3,000 largest publicly traded U.S. companies, based on total market capitalization.
The Russell 2000® Growth Index measures the performance of those Russell 2000 Index companies (the 2,000 smallest of the 3,000 largest publicly traded U.S. companies, based on total market capitalization) with higher price-to-book ratios and higher forecasted growth values.
The Russell 2000® Value Index measures the performance of those Russell 2000 Index companies (the 2,000 smallest of the 3,000 largest publicly traded U.S. companies, based on total market capitalization) with lower price-to-book ratios and lower forecasted growth values.
The Russell 3000® Index measures the performance of the 3,000 largest U.S. companies based on total market capitalization, which represents approximately 98% of the investable U.S. equity market.
The Russell 3000® Utilities Index, a sub-index of the Russell 3000 Index, is a capitalization weighted index of companies in industries heavily affected by government regulation, including among others, basic public service providers (electricity, gas and water), telecommunication services, and oil and gas companies.
35
The Russell Midcap® Index measures the performance of the 800 smallest of the 1,000 largest publicly traded U.S. companies, based on total market capitalization.
The Russell Midcap® Growth Index measures the performance of those Russell Midcap Index companies (the 800 smallest of the 1,000 largest publicly traded U.S. companies, based on total market capitalization) with higher price-to-book ratios and higher forecasted growth values.
The Russell Midcap® Value Index measures the performance of those Russell Midcap Index companies (the 800 smallest of the 1,000 largest publicly traded U.S. companies, based on total market capitalization) with lower price-to-book ratios and lower forecasted growth values.
The S&P 500 Index is a market value-weighted index of the stocks of 500 publicly traded U.S. companies chosen for market size, liquidity, and industry group representation that are considered to be leading firms in dominant industries. Each stock’s weight in the index is proportionate to its market value. Created by Standard & Poor’s, it is considered to be a broad measure of U.S. stock market performance.
36

| |
| |
| Contact Us | |
| americancentury.com | |
| Automated Information Line | 1-800-345-8765 |
| Investor Services Representative | 1-800-345-2021 or |
| | 816-531-5575 |
| Investors Using Advisors | 1-800-378-9878 |
| Business, Not-For-Profit, Employer-Sponsored | |
| Retirement Plans | 1-800-345-3533 |
| Banks and Trust Companies, Broker-Dealers, | |
| Financial Professionals, Insurance Companies | 1-800-345-6488 |
| Telecommunications Device for the Deaf | 1-800-634-4113 |
| American Century Quantitative Equity Funds, Inc. | |
| Investment Advisor: | |
| American Century Investment Management, Inc. | |
| Kansas City, Missouri | |
This report and the statements it contains are submitted for the general
information of our shareholders. The report is not authorized for distribution to
prospective investors unless preceded or accompanied by an effective prospectus.
American Century Investment Services, Inc., Distributor
©2010 American Century Proprietary Holdings, Inc. All rights reserved.
1008
CL-ANN-69046
|
| Annual Report |
| June 30, 2010 |

|
| American Century Investments® |
Long-Short Market Neutral Fund
| |
| President’s Letter | 2 |
| Market Perspective | 3 |
| U.S. Stock Index Returns | 3 |
| |
| Long-Short Market Neutral | |
| |
| Performance | 4 |
| Portfolio Commentary | 6 |
| Top Ten Long Holdings | 8 |
| Top Ten Short Holdings. | 8 |
| Types of Investments in Portfolio | 8 |
| |
| Shareholder Fee Example | 9 |
| |
| Financial Statements | |
| |
| Schedule of Investments | 11 |
| Statement of Assets and Liabilities | 20 |
| Statement of Operations | 21 |
| Statement of Changes in Net Assets | 22 |
| Notes to Financial Statements | 23 |
| Financial Highlights | 29 |
| Report of Independent Registered Public Accounting Firm | 35 |
| |
| Other Information | |
| |
| Proxy Voting Results | 36 |
| Management | 37 |
| Board Approval of Management Agreements | 41 |
| Additional Information | 47 |
| Index Definitions | 48 |
Any opinions expressed in this report reflect those of the author as of the date of the report, and do not necessarily represent the opinions of American Century Investments or any other person in the American Century Investments organization. Any such opinions are subject to change at any time based upon market or other conditions and American Century Investments disclaims any responsibility to update such opinions. These opinions may not be relied upon as investment advice and, because investment decisions made by American Century Investments funds are based on numerous factors, may not be relied upon as an indication of trading intent on behalf of any American Century Investments fund. Security examples are used for representational purposes only and are not intended as recommendations to purchase or sell securities. Performance information for comparative indices and securities is provided to American Century Investments by third party vendors. To the best of American Century Investments’ knowledge, such information is accurate at the time of printing.

Dear Investor:
To learn more about the capital markets, your investment, and the portfolio management strategies American Century Investments provides, we encourage you to review this shareholder report for the financial reporting period ended June 30, 2010.
On the following pages, you will find investment performance and portfolio information, presented with the expert perspective and commentary of our portfolio management team. This report remains one of our most important vehicles for conveying the information you need about your investment performance, and about the market factors and strategies that affect fund returns. For additional information on the markets, we encourage you to visit the “Insights & News” tab at our Web site, americancentury.com, for updates and further expert commentary.
The top of our Web site’s home page also provides a link to “Our Story,” which, first and foremost, outlines our commitment—since 1958—to helping clients reach their financial goals. We believe strongly that we will only be successful when our clients are successful. That’s who we are.
Another important, unique facet of our story and who we are is “Profits with a Purpose,” which describes our bond with the Stowers Institute for Medical Research (SIMR). SIMR is a world-class biomedical organization—founded by our company founder James E. Stowers, Jr. and his wife Virginia—that is dedicated to researching the causes, treatment, and prevention of gene-based diseases, including cancer. Through American Century Investments’ private ownership structure, more than 40% of our profits support SIMR.
Mr. Stowers’ example of achieving financial success and using that platform to help humanity motivates our entire American Century Investments team. His story inspires us to help each of our clients achieve success. Thank you for sharing your financial journey with us.
Sincerely,

Jonathan Thomas
President and Chief Executive Officer
American Century Investments
2

By Scott Wittman, Chief Investment Officer, Quantitative Equity and Asset Allocation
Stocks Rallied as Economy Improved
U.S. stocks posted double-digit gains for the 12 months ended June 30, 2010, thanks largely to improving economic conditions and unexpectedly strong corporate earnings. As the period began, the U.S. economy was starting to show early signs of recovery following a sharp downturn in late 2008 and early 2009. Led by improving results in manufacturing activity, housing, and consumer spending, the economy posted positive growth in the third and fourth quarters of 2009 after four consecutive quarters of declining output. By the first quarter of 2010, jobs data turned positive, providing further evidence of a burgeoning economic recovery.
In addition, corporate profits consistently exceeded expectations as many companies implemented stringent cost-management programs that helped boost profit margins. Rising demand for delayed big-ticket purchases, such as cars and appliances, also contributed to stronger earnings. As a result, stocks rose steadily for much of the period, with the major equity indices advancing by more than 30% from the beginning of the period through April 30, 2010.
Growing Uncertainty Led to Late Decline
Market conditions changed abruptly in the last two months of the period as persistent worries about sovereign debt problems in Europe and questions about the sustainability of the domestic economic recovery (validated to some degree by weaker economic data late in the period) weighed on investor confidence. With these headwinds, the equity market peaked in late April and then reversed direction in May and June. In addition, market volatility increased dramatically—the S&P 500 Index moved up or down by more than 1% on nearly half of the trading days in the second quarter of 2010.
Although stocks gave back a notable portion of their gains late in the period, the broad market indices returned approximately 15% overall for the 12 months. Mid- and small-cap stocks posted the best returns (see the table below), outpacing large-cap shares, while value stocks outperformed growth-oriented issues across all market capitalizations.
| | | | |
| U.S. Stock Index Returns | | | | |
| For the 12 months ended June 30, 2010 | | | | |
| Russell 1000 Index (Large-Cap) | 15.24% | | Russell 2000 Index (Small-Cap) | 21.48% |
| Russell 1000 Value Index | 16.92% | | Russell 2000 Value Index | 25.07% |
| Russell 1000 Growth Index | 13.62% | | Russell 2000 Growth Index | 17.96% |
| Russell Midcap Index | 25.13% | | | |
| Russell Midcap Value Index | 28.91% | | | |
| Russell Midcap Growth Index | 21.30% | | | |
3
| | | | |
| Long-Short Market Neutral | | | |
| |
| Total Returns as of June 30, 2010 | | | | |
| | | | Average | |
| | | | Annual Returns | |
| | Ticker | | Since | Inception |
| | Symbol | 1 year | Inception | Date |
| Investor Class | ALHIX | -0.10% | 0.59% | 9/30/05 |
| Barclays Capital U.S. | | | | |
| 1–3 Month Treasury Bill Index(1) | — | 0.12% | 2.60% | — |
| Citigroup 3-Month | | | | |
| Treasury Bill Index | — | 0.12% | 2.60% | — |
| Institutional Class | ALISX | 0.10% | 0.80% | 9/30/05 |
| A Class | ALIAX | | | 9/30/05 |
| No sales charge* | | -0.30% | 0.36% | |
| With sales charge* | | -6.05% | -0.88% | |
| B Class | ALIBX | | | 9/30/05 |
| No sales charge* | | -1.02% | -0.40% | |
| With sales charge* | | -5.02% | -0.83% | |
| C Class | ALICX | -1.13% | -0.42% | 9/30/05 |
| R Class | ALIRX | -0.51% | 0.09% | 9/30/05 |
| *Sales charges include initial sales charges and contingent deferred sales charges (CDSCs), as applicable. A Class shares have a |
| 5.75% maximum initial sales charge for equity funds and may be subject to a maximum CDSC of 1.00%. B Class shares redeemed |
| within six years of purchase are subject to a CDSC that declines from 5.00% during the first year after purchase to 0.00% the sixth year |
| after purchase. C Class shares redeemed within 12 months of purchase are subject to a maximum CDSC of 1.00%. The SEC requires |
| that mutual funds provide performance information net of maximum sales charges in all cases where charges could be applied. |
| (1) In January 2010, the fund’s benchmark changed from the Citigroup 3-Month Treasury Bill Index to the Barclays Capital U.S. 1–3 Month Treasury |
| Bill Index. This reflects a change in the portfolio management analytics software used by American Century Investments’ fixed-income teams. |
| The investment process is unchanged. | | | | |
Data presented reflect past performance. Past performance is no guarantee of future results. Current performance may be higher or lower than the performance shown. Investment return and principal value will fluctuate, and redemption value may be more or less than original cost. To obtain performance data current to the most recent month end, please call 1-800-345-2021 or visit americancentury.com. The fund’s investment process may produce high portfolio turnover and high short-term capital gains distributions. In addition, its investment approach may involve higher volatility, short sales risk and overweighting risk.
Unless otherwise indicated, performance reflects Investor Class shares; performance for other share classes will vary due to differences in fee structure. For information about other share classes available, please consult the prospectus. Data assumes reinvestment of dividends and capital gains, and none of the charts reflect the deduction of taxes that a shareholder would pay on fund distributions or the redemption of fund shares. Returns for the indices are provided for comparison. The fund’s total returns include operating expenses (such as transaction costs and management fees) that reduce returns, while the total returns of the indices do not.
4
Long-Short Market Neutral
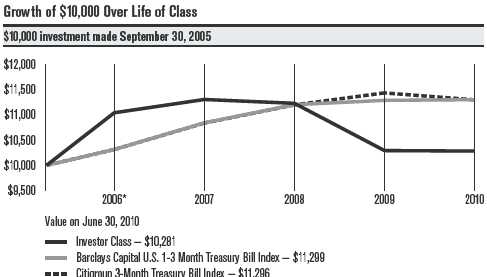
| | | | | |
| *From 9/30/05, the Investor Class’s inception date. Not annualized. | | | |
| |
| Total Annual Fund Operating Expenses | | | |
| | Institutional | | | | |
| Investor Class | Class | A Class | B Class | C Class | R Class |
| 3.34% | 3.14% | 3.59% | 4.34% | 4.34% | 3.84% |
The total annual fund operating expenses shown is as stated in the fund’s prospectus current as of the date of this report. The prospectus may vary from the expense ratio shown elsewhere in this report because it is based on a different time period, includes acquired fund fees and expenses, and, if applicable, does not include fee waivers or expense reimbursements.
Data presented reflect past performance. Past performance is no guarantee of future results. Current performance may be higher or lower than the performance shown. Investment return and principal value will fluctuate, and redemption value may be more or less than original cost. To obtain performance data current to the most recent month end, please call 1-800-345-2021 or visit americancentury.com. The fund’s investment process may produce high portfolio turnover and high short-term capital gains distributions. In addition, its investment approach may involve higher volatility, short sales risk and overweighting risk.
Unless otherwise indicated, performance reflects Investor Class shares; performance for other share classes will vary due to differences in fee structure. For information about other share classes available, please consult the prospectus. Data assumes reinvestment of dividends and capital gains, and none of the charts reflect the deduction of taxes that a shareholder would pay on fund distributions or the redemption of fund shares. Returns for the indices are provided for comparison. The fund’s tot al returns include operating expenses (such as transaction costs and management fees) that reduce returns, while the total returns of the indices do not.
5
Long-Short Market Neutral
Portfolio Managers: Kurt Borgwardt, Claudia Musat, and Zili Zhang
Performance Summary
Long-Short Market Neutral returned –0.10%* for the 12 months ended June 30, 2010, compared with the 0.12% return of its benchmark, the Barclays Capital U.S. 1–3 Month Treasury Bill Index, and the 15.24%** return of the Russell 1000 Index, a broad stock market measure.
Long-Short Market Neutral is designed to generate positive returns in all market environments, regardless of general stock market performance, so the fund uses a riskless asset—Barclays Capital U.S. 1–3 Month Treasury Bill Index—as its benchmark. For the 12-month period, the fund and the benchmark index were roughly flat overall, with the fund posting a fractionally negative return and the benchmark producing a very modest gain. Strong results in the portfolio’s long positions were offset by underperfor-mance on the short side of the portfolio.
Long Positions Performed Well
The fund’s long positions gained more than 20% for the 12-month period. The more economically sensitive sectors of the portfolio—including consumer discretionary, energy, industrials, and materials—contributed the most to performance in the long portion as economic conditions generally improved during the period.
The best individual performance contributor among long positions was a consumer discretionary stock, online movie rental firm Netflix. The company enjoyed strong subscriber growth and generated better-than-expected earnings amid increased customer usage of streaming video. Other top contributors from the consumer discretionary sector included outdoor apparel maker Columbia Sportswear, which consistently exceeded earnings expectations as retail spending improved, and auto parts maker TRW Automotive, which rallied as a recovery in auto sales led to a sharp increase in demand for its products.
The portfolio’s energy and industrials holdings were also meaningful contributors to performance on the long side. The leading contributors in the energy sector were coal producer Alpha Natural Resources, which enjoyed increased demand for metallurgical coal used in steelmaking, and energy exploration and production company Clayton Williams Energy, which benefited from its price-hedging strategies and an increase in oil production. Among industrials stocks, machinery manufacturer Gardner Denver and automotive equipment maker WABCO Holdings were both beneficiaries of the improving economic environment.
Other long positions that added value during the 12-month period included mortgage insurer MGIC Investment and software maker Sybase. MGIC saw a marked decrease in mortgage delinquencies, while Sybase agreed to a takeover by competitor SAP.
|
| * All fund returns referenced in this commentary are for Investor Class shares. |
| **The Russell 1000 Index returned -1.39% for the period from the fund’s inception on September 30, 2005, through June 30, 2010. |
6
Long-Short Market Neutral
The weaker-performing holdings in the long segment of the portfolio came primarily from the financials and information technology sectors. Notable examples from these sectors included commercial bank Flagstar Bancorp, which reported a series of losses resulting from elevated provisions for problem loans, and communications equipment manufacturer Arris Group, which struggled with growing industry competition. The most significant decliner in the long portfolio was for-profit education firm Corinthian Colleges, which was adversely affected by growing debt issues among students at private educational institutions, as well as the potential for more stringent regulatory requirements.
Short Positions Underperformed
Given the broad rally in the stock market, the fund’s short positions declined overall for the 12-month period. The biggest detractors in the short portion of the portfolio came from sectors tied to the economic recovery, such as consumer discretionary and industrials.
Railroad operator Kansas City Southern and management consulting firm Corporate Executive Board were the worst-performing short positions in the industrials sector. Better economic conditions and merger activity in the railroad industry boosted Kansas City Southern, while Corporate Executive Board repeatedly exceeded earnings estimates through effective cost management.
In the consumer discretionary sector, the biggest detractor among short positions was art auctioneer Sotheby’s, which rallied sharply amid signs that the global art market is beginning to recover. Clothing maker Hanes-brands was another detractor on the short side, advancing as the company reduced debt and delivered strong earnings growth.
On the positive side, short positions in the information technology and telecommunication services sectors added the most value during the period. Discount wireless services provider Leap Wireless International was among the top contributors among short positions. Deteriorating subscriber growth led to disappointing earnings, and merger talks with competitor MetroPCS Communications stalled. In the information technology sector, the best short position was semiconductor equipment manufacturer Form-factor, which reported a string of losses and declining market share that led to a management shake-up at the company.
The top-performing short position in the portfolio was Orient-Express Hotels, which owns and operates luxury hotels primarily in Europe. Sovereign debt issues in Greece and elsewhere in Europe weighed on economic activity, leading to lower occupancy rates at the company’s properties.
A Look Ahead
The market environment has grown increasingly choppy in recent months, reflecting greater uncertainty about the resilience of the economic recovery. Although most businesses weathered the 2008 recession relatively well, stubbornly high unemployment suggests that the corporate sector is not yet confident enough in the strength of the recovery to expand payrolls. This economic uncertainty—and the stock market volatility that often accompanies it—is likely to continue as we move into the second half of 2010.
7
| |
| Long-Short Market Neutral | |
| |
| Top Ten Long Holdings | |
| | % of net assets as of 6/30/10 |
| Syniverse Holdings, Inc. | 0.83% |
| World Fuel Services Corp. | 0.83% |
| Complete Production Services, Inc. | 0.82% |
| STERIS Corp. | 0.82% |
| Endurance Specialty Holdings Ltd. | 0.80% |
| Sonoco Products Co. | 0.80% |
| United States Cellular Corp. | 0.80% |
| Broadcom Corp., Class A | 0.79% |
| American Financial Group, Inc. | 0.79% |
| Arris Group, Inc. | 0.77% |
| |
| Top Ten Short Holdings | |
| | % of net assets as of 6/30/10 |
| Vector Group Ltd. | (0.78)% |
| Mercury General Corp. | (0.78)% |
| O’Reilly Automotive, Inc. | (0.77)% |
| Sigma-Aldrich Corp. | (0.77)% |
| Steelcase, Inc., Class A | (0.76)% |
| Clearwire Corp., Class A | (0.76)% |
| PACCAR, Inc. | (0.76)% |
| Holly Corp. | (0.76)% |
| Cavium Networks, Inc. | (0.76)% |
| Covance, Inc. | (0.76)% |
| |
| Types of Investments in Portfolio | |
| | % of net assets as of 6/30/10 |
| Common Stocks | 90.1% |
| Securities Sold Short | (89.4)% |
| Temporary Cash Investments | 1.1% |
8
|
| Shareholder Fee Example (Unaudited) |
Fund shareholders may incur two types of costs: (1) transaction costs, including sales charges (loads) on purchase payments and redemption/ exchange fees; and (2) ongoing costs, including management fees; distribution and service (12b-1) fees; and other fund expenses. This example is intended to help you understand your ongoing costs (in dollars) of investing in your fund and to compare these costs with the ongoing cost of investing in other mutual funds.
The example is based on an investment of $1,000 made at the beginning of the period and held for the entire period from January 1, 2010 to June 30, 2010.
Actual Expenses
The table provides information about actual account values and actual expenses for each class. You may use the information, together with the amount you invested, to estimate the expenses that you paid over the period. First, identify the share class you own. Then simply divide your account value by $1,000 (for example, an $8,600 account value divided by $1,000 = 8.6), then multiply the result by the number under the heading “Expenses Paid During Period” to estimate the expenses you paid on your account during this period.
If you hold Investor Class shares of any American Century Investments fund, or Institutional Class shares of the American Century Diversified Bond Fund, in an American Century Investments account (i.e., not a financial intermediary or retirement plan account), American Century Investments may charge you a $12.50 semiannual account maintenance fee if the value of those shares is less than $10,000. We will redeem shares automatically in one of your accounts to pay the $12.50 fee. In determining your total eligible investment amount, we will include your investments in all personal accounts (including American Century Investments Brokerage accounts) registered under your Social Security number. Personal accounts include individual accounts, joint accounts, UGMA/UTMA accounts, personal trusts, Coverdell Education Savings Accounts and IRAs (including traditional, Roth, Rollover, SEP-, SARSEP- and SIMPLE-IRAs), and certain other retirement accounts. If you have only business, business retirement, employer-sponsored or American Century Investments Brokerage accounts, you are currently not subject to this fee. We will not charge the fee as long as you choose to manage your accounts exclusively online. If you are subject to the Account Maintenance Fee, your account value could be reduced by the fee amount.
Hypothetical Example for Comparison Purposes
The table also provides information about hypothetical account values and hypothetical expenses based on the actual expense ratio of each class of your fund and an assumed rate of return of 5% per year before expenses, which is not the actual return of a fund’s share class. The hypothetical account values and expenses may not be used to estimate the actual ending account balance or expenses you paid for the period. You may use this information to compare the ongoing costs of investing in your fund and other funds. To do so, compare this 5% hypothetical example with the 5% hypothetical examples that appear in the shareholder reports of the other funds.
9
Please note that the expenses shown in the table are meant to highlight your ongoing costs only and do not reflect any transactional costs, such as sales charges (loads) or redemption/exchange fees. Therefore, the table is useful in comparing ongoing costs only, and will not help you determine the relative total costs of owning different funds. In addition, if these transactional costs were included, your costs would have been higher.
| | | | |
| | Beginning | Ending | Expenses Paid | |
| | Account Value | Account Value | During Period* | Annualized |
| | 1/1/10 | 6/30/10 | 1/1/10 – 6/30/10 | Expense Ratio* |
| Actual | | | | |
| Investor Class | $1,000 | $1,012.10 | $14.82 | 2.97% |
| Institutional Class | $1,000 | $1,013.10 | $13.83 | 2.77% |
| A Class | $1,000 | $1,011.20 | $16.06 | 3.22% |
| B Class | $1,000 | $1,007.30 | $19.76 | 3.97% |
| C Class | $1,000 | $1,006.30 | $19.75 | 3.97% |
| R Class | $1,000 | $1,009.20 | $17.29 | 3.47% |
| Hypothetical | | | | |
| Investor Class | $1,000 | $1,010.07 | $14.80 | 2.97% |
| Institutional Class | $1,000 | $1,011.06 | $13.81 | 2.77% |
| A Class | $1,000 | $1,008.83 | $16.04 | 3.22% |
| B Class | $1,000 | $1,005.11 | $19.74 | 3.97% |
| C Class | $1,000 | $1,005.11 | $19.74 | 3.97% |
| R Class | $1,000 | $1,007.59 | $17.27 | 3.47% |
| *Expenses are equal to the class’s annualized expense ratio listed in the table above, multiplied by the average account value over the period, |
| multiplied by 181, the number of days in the most recent fiscal half-year, divided by 365, to reflect the one-half year period. |
10
| | | | | | |
| Long-Short Market Neutral | | | | |
| |
| JUNE 30, 2010 | | | | | | |
| | Shares | Value | | | Shares | Value |
| Common Stocks(1) — 90.1% | | | optionsXpress | | |
| | | | | Holdings, Inc.(2) | 15,740 | $ 247,748 |
| AEROSPACE & DEFENSE — 1.1% | | | SEI Investments Co. | 43,414 | 883,909 |
| L-3 Communications | | | | | | 2,956,037 |
| Holdings, Inc. | 1,418 | $ 100,451 | | | | |
| Northrop Grumman Corp. | 15,607 | 849,645 | | CHEMICALS — 4.2% | | |
| Raytheon Co. | 5,312 | 257,048 | | Ashland, Inc. | 13,312 | 617,943 |
| | | 1,207,144 | | Huntsman Corp. | 73,452 | 636,829 |
| AIR FREIGHT & LOGISTICS — 0.8% | | | Lubrizol Corp. | 9,551 | 767,041 |
| Atlas Air Worldwide | | | | Minerals Technologies, Inc. | 12,594 | 598,719 |
| Holdings, Inc.(2) | 16,224 | 770,640 | | OM Group, Inc.(2) | 16,150 | 385,339 |
| UTi Worldwide, Inc. | 13,920 | 172,330 | | PolyOne Corp.(2) | 5,213 | 43,893 |
| | | 942,970 | | PPG Industries, Inc. | 2,159 | 130,425 |
| AIRLINES — 0.3% | | | | Scotts Miracle-Gro Co. | | |
| Allegiant Travel Co. | 8,353 | 356,590 | | (The), Class A | 13,194 | 585,946 |
| AUTO COMPONENTS — 1.5% | | | | Sherwin-Williams Co. (The) | 5,868 | 406,007 |
| Cooper Tire & Rubber Co. | 44,469 | 867,145 | | Valspar Corp. | 20,512 | 617,821 |
| TRW Automotive | | | | | | 4,789,963 |
| Holdings Corp.(2) | 31,061 | 856,352 | | COMMERCIAL BANKS — 0.4% | | |
| | | 1,723,497 | | Toronto-Dominion Bank | | |
| AUTOMOBILES — 0.3% | | | | (The) | 7,694 | 499,418 |
| Ford Motor Co.(2) | 36,631 | 369,240 | | COMMERCIAL SERVICES & SUPPLIES — 0.9% |
| BEVERAGES — 0.6% | | | | M&F Worldwide Corp.(2) | 8,226 | 222,925 |
| Dr Pepper Snapple | | | | Waste Management, Inc. | 24,823 | 776,711 |
| Group, Inc. | 18,746 | 700,913 | | | | 999,636 |
| BIOTECHNOLOGY — 2.3% | | | | COMMUNICATIONS EQUIPMENT — 1.7% | |
| Amgen, Inc.(2) | 5,332 | 280,463 | | Arris Group, Inc.(2) | 86,845 | 884,951 |
| Biogen Idec, Inc.(2) | 5,878 | 278,911 | | InterDigital, Inc.(2) | 11,086 | 273,713 |
| Cephalon, Inc.(2) | 5,078 | 288,177 | | Tellabs, Inc. | 129,783 | 829,313 |
| Cubist | | | | | | 1,987,977 |
| Pharmaceuticals, Inc.(2) | 13,707 | 282,364 | | COMPUTERS & PERIPHERALS — 2.6% | |
| Emergent | | | | Lexmark International, Inc., | | |
| Biosolutions, Inc.(2) | 18,689 | 305,378 | | Class A(2) | 23,791 | 785,817 |
| Incyte Corp. Ltd.(2) | 22,694 | 251,223 | | Seagate Technology(2) | 35,273 | 459,960 |
| Martek Biosciences Corp.(2) | 13,144 | 311,645 | | Teradata Corp.(2) | 28,382 | 865,083 |
| Medivation, Inc.(2) | 26,823 | 237,115 | | Western Digital Corp.(2) | 27,026 | 815,104 |
| PDL BioPharma, Inc. | 44,828 | 251,933 | | | | 2,925,964 |
| Talecris Biotherapeutics | | | | CONSTRUCTION & ENGINEERING — 1.1% | |
| Holdings Corp.(2) | 8,778 | 185,216 | | | | |
| | | | | EMCOR Group, Inc.(2) | 22,267 | 515,926 |
| | | 2,672,425 | | URS Corp.(2) | 19,528 | 768,427 |
| CAPITAL MARKETS — 2.6% | | | | | | 1,284,353 |
| Apollo Investment Corp. | 23,371 | 218,051 | | CONSUMER FINANCE — 1.2% | | |
| GFI Group, Inc. | 121,545 | 678,221 | | AmeriCredit Corp.(2) | 31,068 | 566,059 |
| Investment Technology | | | | | | |
| Group, Inc.(2) | 19,494 | 313,074 | | Cash America | | |
| | | | | International, Inc. | 23,158 | 793,625 |
| Legg Mason, Inc. | 21,942 | 615,034 | | | | 1,359,684 |
11
| | | | | | |
| Long-Short Market Neutral | | | | |
| |
| | Shares | Value | | | Shares | Value |
| CONTAINERS & PACKAGING — 1.9% | | | Noble Corp.(2) | 6,142 | $ 189,849 |
| Owens-Illinois, Inc.(2) | 12,797 | $ 338,481 | | Tetra Technologies, Inc.(2) | 52,754 | 479,006 |
| Rock-Tenn Co., Class A | 11,607 | 576,520 | | | | 2,694,532 |
| Sealed Air Corp. | 15,891 | 313,371 | | FOOD & STAPLES RETAILING — 0.3% | |
| Sonoco Products Co. | 30,102 | 917,508 | | SUPERVALU, INC. | 31,193 | 338,132 |
| | | 2,145,880 | | FOOD PRODUCTS — 2.9% | | |
| DIVERSIFIED CONSUMER SERVICES — 0.5% | | | Corn Products | | |
| Career Education Corp.(2) | 2,900 | 66,758 | | International, Inc. | 21,254 | 643,996 |
| Corinthian Colleges, Inc.(2) | 48,987 | 482,522 | | Darling International, Inc.(2) | 48,086 | 361,126 |
| | | 549,280 | | Del Monte Foods Co. | 58,887 | 847,385 |
| DIVERSIFIED FINANCIAL SERVICES — 0.8% | | | Fresh Del Monte | | |
| | | | | Produce, Inc.(2) | 5,755 | 116,481 |
| Bank of America Corp. | 11,224 | 161,289 | | | | |
| PHH Corp.(2) | 39,387 | 749,928 | | H.J. Heinz Co. | 3,902 | 168,644 |
| | | | | TreeHouse Foods, Inc.(2) | 11,772 | 537,510 |
| | | 911,217 | | | | |
| DIVERSIFIED TELECOMMUNICATION | | | Tyson Foods, Inc., Class A | 42,973 | 704,327 |
| SERVICES — 0.9% | | | | | | 3,379,469 |
| IDT Corp., Class B(2) | 49,793 | 634,861 | | GAS UTILITIES — 0.9% | | |
| Qwest Communications | | | | Nicor, Inc. | 9,943 | 402,692 |
| International, Inc. | 77,400 | 406,350 | | UGI Corp. | 25,740 | 654,825 |
| | | 1,041,211 | | | | 1,057,517 |
| ELECTRIC UTILITIES — 0.9% | | | | HEALTH CARE EQUIPMENT & SUPPLIES — 3.0% |
| DPL, Inc. | 24,102 | 576,039 | | American Medical Systems | | |
| Entergy Corp. | 1,628 | 116,597 | | Holdings, Inc.(2) | 27,122 | 599,938 |
| Exelon Corp. | 7,751 | 294,305 | | Beckman Coulter, Inc. | 6,013 | 362,524 |
| FirstEnergy Corp. | 2,378 | 83,777 | | Becton, Dickinson & Co. | 2,332 | 157,690 |
| | | 1,070,718 | | C.R. Bard, Inc. | 2,687 | 208,323 |
| ELECTRICAL EQUIPMENT — 0.9% | | | Hill-Rom Holdings, Inc. | 13,667 | 415,887 |
| Brady Corp., Class A | 24,782 | 617,567 | | Hologic, Inc.(2) | 19,486 | 271,440 |
| EnerSys(2) | 3,446 | 73,641 | | Hospira, Inc.(2) | 3,459 | 198,720 |
| Hubbell, Inc., Class B | 5,281 | 209,603 | | Kinetic Concepts, Inc.(2) | 5,813 | 212,233 |
| Thomas & Betts Corp.(2) | 5,314 | 184,396 | | Sirona Dental | | |
| | | | | Systems, Inc.(2) | 2,313 | 80,585 |
| | | 1,085,207 | | | | |
| ELECTRONIC EQUIPMENT, | | | | STERIS Corp. | 30,285 | 941,257 |
| INSTRUMENTS & COMPONENTS — 1.4% | | | | | 3,448,597 |
| Benchmark | | | | HEALTH CARE PROVIDERS & SERVICES — 1.2% |
| Electronics, Inc.(2) | 4,328 | 68,599 | | Centene Corp.(2) | 22,697 | 487,985 |
| Celestica, Inc.(2) | 98,788 | 796,231 | | Coventry Health Care, Inc.(2) | 7,619 | 134,704 |
| Flextronics | | | | Health Net, Inc.(2) | 13,245 | 322,781 |
| International Ltd.(2) | 12,527 | 70,151 | | | | |
| | | | | Humana, Inc.(2) | 2,810 | 128,333 |
| Vishay | | | | Omnicare, Inc. | 14,711 | 348,650 |
| Intertechnology, Inc.(2) | 81,555 | 631,236 | | | | |
| | | 1,566,217 | | | | 1,422,453 |
| ENERGY EQUIPMENT & SERVICES — 2.4% | | | HOTELS, RESTAURANTS & LEISURE — 2.2% | |
| Basic Energy | | | | Cheesecake Factory, Inc. | | |
| | | | | (The)(2) | 28,350 | 631,071 |
| Services, Inc.(2) | 34,965 | 269,231 | | | | |
| | | | | Hyatt Hotels Corp., Class A(2) | 6,431 | 238,526 |
| Complete Production | | | | | | |
| Services, Inc.(2) | 65,874 | 941,998 | | PF Chang’s China Bistro, Inc. | 18,563 | 736,023 |
| National Oilwell Varco, Inc. | 24,628 | 814,448 | | Starbucks Corp. | 25,618 | 622,517 |
12
| | | | | | |
| Long-Short Market Neutral | | | | |
| |
| | Shares | Value | | | Shares | Value |
| Starwood Hotels & Resorts | | | | IT SERVICES — 2.0% | | |
| Worldwide, Inc. | 7,855 | $ 325,433 | | Accenture plc, Class A | 4,377 | $ 169,171 |
| | | 2,553,570 | | Acxiom Corp.(2) | 40,635 | 596,928 |
| HOUSEHOLD DURABLES — 1.1% | | | Computer Sciences Corp. | 8,352 | 377,928 |
| American Greetings Corp., | | | | International Business | | |
| Class A | 5,364 | 100,629 | | Machines Corp. | 3,597 | 444,158 |
| D.R. Horton, Inc. | 13,041 | 128,193 | | TeleTech Holdings, Inc.(2) | 33,487 | 431,647 |
| Garmin Ltd. | 14,304 | 417,391 | | Western Union Co. (The) | 18,369 | 273,882 |
| Harman International | | | | | | 2,293,714 |
| Industries, Inc.(2) | 16,800 | 502,151 | | | | |
| Ryland Group, Inc. | 9,585 | 151,635 | | LEISURE EQUIPMENT & PRODUCTS — 0.7% | |
| | | 1,299,999 | | Polaris Industries, Inc. | 14,067 | 768,340 |
| INDEPENDENT POWER | | | | LIFE SCIENCES TOOLS & SERVICES — 0.9% | |
| PRODUCERS & ENERGY TRADERS — 1.7% | | | Bruker Corp.(2) | 68,138 | 828,558 |
| Calpine Corp.(2) | 26,777 | 340,603 | | PerkinElmer, Inc. | 12,539 | 259,181 |
| Constellation Energy | | | | | | 1,087,739 |
| Group, Inc. | 23,134 | 746,072 | | MACHINERY — 5.1% | | |
| NRG Energy, Inc.(2) | 39,350 | 834,613 | | AGCO Corp.(2) | 5,885 | 158,718 |
| | | 1,921,288 | | Cummins, Inc. | 13,076 | 851,640 |
| INDUSTRIAL CONGLOMERATES — 0.9% | | | Dover Corp. | 19,423 | 811,687 |
| Carlisle Cos., Inc. | 23,987 | 866,650 | | Gardner Denver, Inc. | 11,302 | 503,956 |
| Seaboard Corp. | 116 | 175,160 | | Mueller Industries, Inc. | 19,799 | 487,055 |
| | | 1,041,810 | | Navistar | | |
| INSURANCE — 4.9% | | | | International Corp.(2) | 6,248 | 307,402 |
| Allied World Assurance Co. | | | | Oshkosh Corp.(2) | 22,264 | 693,746 |
| Holdings Ltd. | 15,430 | 700,213 | | Parker-Hannifin Corp. | 14,893 | 825,966 |
| American Financial | | | | Timken Co. | 9,859 | 256,235 |
| Group, Inc. | 33,246 | 908,281 | | Wabtec Corp. | 9,222 | 367,866 |
| Axis Capital Holdings Ltd. | 25,193 | 748,736 | | Watts Water | | |
| Endurance Specialty | | | | Technologies, Inc., Class A | 14,907 | 427,235 |
| Holdings Ltd. | 24,503 | 919,598 | | | | 5,691,506 |
| Horace Mann | | | | MARINE — 0.5% | | |
| Educators Corp. | 31,900 | 488,070 | | | | |
| | | | | Kirby Corp.(2) | 16,076 | 614,907 |
| Navigators Group, Inc. | | | | | | |
| (The)(2) | 1,849 | 76,049 | | MEDIA — 3.1% | | |
| Platinum Underwriters | | | | CBS Corp., Class B | 29,871 | 386,232 |
| Holdings Ltd. | 9,233 | 335,066 | | Cinemark Holdings, Inc. | 15,752 | 207,139 |
| Principal Financial | | | | Comcast Corp., Class A | 35,892 | 623,444 |
| Group, Inc. | 28,513 | 668,345 | | DISH Network Corp., Class A | 17,097 | 310,311 |
| Travelers Cos., Inc. (The) | 13,613 | 670,440 | | Gannett Co., Inc. | 18,334 | 246,776 |
| | | 5,514,798 | | Harte-Hanks, Inc. | 22,861 | 238,897 |
| INTERNET & CATALOG RETAIL — 1.0% | | | Interpublic Group | | |
| HSN, Inc.(2) | 13,580 | 325,920 | | of Cos., Inc. (The)(2) | 56,552 | 403,216 |
| Netflix, Inc.(2) | 7,767 | 843,885 | | McGraw-Hill Cos., Inc. (The) | 12,243 | 344,518 |
| | | 1,169,805 | | Time Warner, Inc. | 29,219 | 844,721 |
| INTERNET SOFTWARE & SERVICES — 0.3% | | | | | 3,605,254 |
| AOL, Inc.(2) | 3,364 | 69,938 | | METALS & MINING — 1.8% | | |
| EarthLink, Inc. | 20,397 | 162,359 | | Golden Star | | |
| | | | | Resources Ltd.(2) | 66,334 | 290,543 |
| IAC/InterActiveCorp(2) | 7,073 | 155,394 | | | | |
| | | | | Hecla Mining Co.(2) | 131,154 | 684,624 |
| | | 387,691 | | | | |
13
| | | | | | |
| Long-Short Market Neutral | | | | |
| |
| | Shares | Value | | | Shares | Value |
| Reliance Steel & | | | | King Pharmaceuticals, Inc.(2) | 12,927 | $ 98,116 |
| Aluminum Co. | 18,021 | $ 651,459 | | ViroPharma, Inc.(2) | 24,978 | 280,003 |
| Schnitzer Steel | | | | | | 1,195,955 |
| Industries, Inc., Class A | 6,156 | 241,315 | | | | |
| | | | | REAL ESTATE INVESTMENT TRUSTS (REITS) — 1.6% |
| Titanium Metals Corp.(2) | 8,546 | 150,324 | | | | |
| | | | | Apartment Investment & | | |
| | | 2,018,265 | | Management Co., Class A | 28,248 | 547,164 |
| MULTILINE RETAIL — 1.2% | | | | CBL & Associates | | |
| Big Lots, Inc.(2) | 9,897 | 317,595 | | Properties, Inc. | 27,819 | 346,068 |
| Family Dollar Stores, Inc. | 14,040 | 529,167 | | Hospitality Properties Trust | 19,167 | 404,424 |
| Macy’s, Inc. | 24,754 | 443,097 | | Mack-Cali Realty Corp. | 16,397 | 487,483 |
| Sears Holdings Corp.(2) | 1,759 | 113,719 | | | | 1,785,139 |
| | | 1,403,578 | | ROAD & RAIL — 1.1% | | |
| MULTI-UTILITIES — 0.7% | | | | Dollar Thrifty Automotive | | |
| DTE Energy Co. | 3,613 | 164,789 | | Group, Inc.(2) | 9,868 | 420,475 |
| NSTAR | 17,988 | 629,580 | | Werner Enterprises, Inc. | 40,420 | 884,794 |
| Xcel Energy, Inc. | 2,771 | 57,110 | | | | 1,305,269 |
| | | 851,479 | | SEMICONDUCTORS & | | |
| | | | | SEMICONDUCTOR EQUIPMENT — 4.2% | |
| OFFICE ELECTRONICS — 0.1% | | | | | | |
| | | | | Advanced Micro | | |
| Xerox Corp. | 14,128 | 113,589 | | Devices, Inc.(2) | 27,194 | 199,060 |
| OIL, GAS & CONSUMABLE FUELS — 5.1% | | | Amkor Technology, Inc.(2) | 45,489 | 250,644 |
| Anadarko Petroleum Corp. | 15,603 | 563,112 | | Broadcom Corp., Class A | 27,625 | 910,795 |
| Bill Barrett Corp.(2) | 9,944 | 305,977 | | Fairchild Semiconductor | | |
| Chevron Corp. | 7,483 | 507,796 | | International, Inc.(2) | 33,411 | 280,987 |
| Cimarex Energy Co. | 592 | 42,375 | | Integrated Device | | |
| ConocoPhillips | 17,268 | 847,686 | | Technology, Inc.(2) | 59,030 | 292,199 |
| Hess Corp. | 8,462 | 425,977 | | Intel Corp. | 10,255 | 199,460 |
| Murphy Oil Corp. | 1,547 | 76,654 | | LSI Corp.(2) | 181,888 | 836,685 |
| Peabody Energy Corp. | 4,751 | 185,907 | | Marvell Technology | | |
| | | | | Group Ltd.(2) | 33,592 | 529,410 |
| Stone Energy Corp.(2) | 56,098 | 626,054 | | | | |
| W&T Offshore, Inc. | 69,746 | 659,797 | | Micron Technology, Inc.(2) | 68,658 | 582,906 |
| Williams Cos., Inc. (The) | 32,477 | 593,680 | | Teradyne, Inc.(2) | 38,394 | 374,342 |
| World Fuel Services Corp. | 36,556 | 948,262 | | Texas Instruments, Inc. | 13,184 | 306,924 |
| | | 5,783,277 | | | | 4,763,412 |
| PAPER & FOREST PRODUCTS — 1.0% | | | SOFTWARE — 2.5% | | |
| Clearwater Paper Corp.(2) | 9,621 | 526,847 | | Autodesk, Inc.(2) | 17,608 | 428,931 |
| International Paper Co. | 17,399 | 393,739 | | CA, Inc. | 21,215 | 390,356 |
| MeadWestvaco Corp. | 7,646 | 169,741 | | Microsoft Corp. | 31,290 | 719,983 |
| | | 1,090,327 | | Quest Software, Inc.(2) | 47,938 | 864,801 |
| PERSONAL PRODUCTS — 0.3% | | | Synopsys, Inc.(2) | 22,740 | 474,584 |
| Nu Skin Enterprises, Inc., | | | | | | 2,878,655 |
| Class A | 12,662 | 315,664 | | SPECIALTY RETAIL — 1.8% | | |
| PHARMACEUTICALS — 1.0% | | | | AutoZone, Inc.(2) | 1,086 | 209,837 |
| Eli Lilly & Co. | 9,611 | 321,969 | | Foot Locker, Inc. | 17,202 | 217,089 |
| Endo Pharmaceuticals | | | | Gap, Inc. (The) | 41,776 | 812,961 |
| Holdings, Inc.(2) | 7,928 | 172,989 | | | | |
| | | | | Rent-A-Center, Inc.(2) | 39,715 | 804,626 |
| Forest Laboratories, Inc.(2) | 11,771 | 322,878 | | | | |
| | | | | | | 2,044,513 |
14
| | | | | | |
| Long-Short Market Neutral | | | | |
| |
| | Shares | Value | | | Shares | Value |
| TEXTILES, APPAREL & LUXURY GOODS — 0.4% | | AIR FREIGHT & LOGISTICS — (0.6)% | |
| Timberland Co. (The), | | | | C.H. Robinson | | |
| Class A(2) | 31,729 | $ 512,423 | | Worldwide, Inc. | (11,922) | $ (663,579) |
| THRIFTS & MORTGAGE FINANCE — 0.5% | | | AIRLINES — (0.8)% | | |
| Flagstar Bancorp, Inc.(2) | 182,370 | 572,642 | | AMR Corp. | (113,494) | (769,490) |
| TOBACCO — 0.1% | | | | JetBlue Airways Corp. | (32,380) | (177,766) |
| Reynolds American, Inc. | 3,027 | 157,767 | | | | (947,256) |
| TRADING COMPANIES & DISTRIBUTORS — 0.4% | | AUTO COMPONENTS — (0.5)% | | |
| Applied Industrial | | | | BorgWarner, Inc. | (2,660) | (99,324) |
| Technologies, Inc. | 11,515 | 291,560 | | Magna International, Inc., | | |
| WESCO International, Inc.(2) | 3,448 | 116,094 | | Class A | (7,595) | (500,967) |
| | | 407,654 | | | | (600,291) |
| WIRELESS TELECOMMUNICATION SERVICES — 2.3% | | AUTOMOBILES — (1.2)% | | |
| NTELOS Holdings Corp. | 8,967 | 154,232 | | Harley-Davidson, Inc. | (33,198) | (737,992) |
| Sprint Nextel Corp.(2) | 144,034 | 610,704 | | Winnebago Industries, Inc. | (59,929) | (595,694) |
| Syniverse Holdings, Inc.(2) | 46,743 | 955,895 | | | | (1,333,686) |
| United States | | | | BEVERAGES — (1.0)% | | |
| Cellular Corp.(2) | 22,233 | 914,888 | | Coca-Cola Co. (The) | (8,054) | (403,666) |
| | | 2,635,719 | | PepsiCo, Inc. | (12,047) | (734,265) |
| TOTAL COMMON STOCKS | | | | | | (1,137,931) |
| (Cost $86,855,590) | | 103,271,989 | | BIOTECHNOLOGY — (2.9)% | | |
| Temporary Cash Investments — 1.1% | | Abraxis Bioscience, Inc. | (5,036) | (373,672) |
| JPMorgan U.S. Treasury | | | | Acorda Therapeutics, Inc. | (8,902) | (276,941) |
| Plus Money Market Fund | | | | Alexion | | |
| Agency Shares | 39,068 | 39,068 | | Pharmaceuticals, Inc. | (1,793) | (91,784) |
| Repurchase Agreement, Bank of America | | | AMAG Pharmaceuticals, Inc. | (8,667) | (297,711) |
| Securities, LLC, (collateralized by various | | | Amylin Pharmaceuticals, Inc. | (15,004) | (282,075) |
| U.S. Treasury obligations, 1.125%, 6/30/11, | | | | | |
| valued at $1,223,920), in a joint trading | | | BioMarin | | |
| account at 0.01%, dated 6/30/10, due | | | Pharmaceutical, Inc. | (3,192) | (60,520) |
| 7/1/10 (Delivery value $1,200,000) | | 1,200,000 | | Dendreon Corp. | (7,515) | (242,960) |
| TOTAL TEMPORARY | | | | Genzyme Corp. | (5,916) | (300,356) |
| CASH INVESTMENTS | | | | Isis Pharmaceuticals, Inc. | (31,286) | (299,408) |
| (Cost $1,239,068) | | 1,239,068 | | Myriad | | |
| TOTAL INVESTMENT | | | | Pharmaceuticals, Inc. | (15,233) | (57,276) |
| SECURITIES — 91.2% | | | | Pharmasset, Inc. | (9,539) | (260,796) |
| (Cost $88,094,658) | | 104,511,057 | | | | |
| TOTAL SECURITIES | | | | Theravance, Inc. | (18,885) | (237,384) |
| SOLD SHORT — (89.4)% | (102,460,720) | | United Therapeutics Corp. | (5,298) | (258,595) |
| OTHER ASSETS | | | | Vertex Pharmaceuticals, Inc. | (8,409) | (276,656) |
| AND LIABILITIES — 98.2% | | 112,587,344 | | | | (3,316,134) |
| TOTAL NET ASSETS — 100.0% | $ 114,637,681 | | CAPITAL MARKETS — (1.6)% | | |
| Securities Sold Short — (89.4)% | | | Charles Schwab Corp. (The) | (10,733) | (152,194) |
| AEROSPACE & DEFENSE — (1.0)% | | | Greenhill & Co., Inc. | (6,418) | (392,332) |
| | | | | Knight Capital Group, Inc., | | |
| CAE, Inc. | (29,739) | (258,432) | | Class A | (48,572) | (669,808) |
| Curtiss-Wright Corp. | (4,633) | (134,542) | | State Street Corp. | (18,266) | (617,756) |
| Spirit Aerosystems | | | | Teton Advisors, Inc., Class B | (35) | (14) |
| Holdings, Inc., Class A | (36,594) | (697,482) | | | | |
| | | (1,090,456) | | | | (1,832,104) |
15
| | | | | | |
| Long-Short Market Neutral | | | | |
| |
| | Shares | Value | | | Shares | Value |
| CHEMICALS — (5.0)% | | | | CONTAINERS & PACKAGING — (0.9)% | |
| Air Products & | | | | Bemis Co., Inc. | (18,685) | $ (504,495) |
| Chemicals, Inc. | (4,755) | $ (308,172) | | Pactiv Corp. | (12,527) | (348,877) |
| Celanese Corp., Series A | (5,892) | (146,770) | | Temple-Inland, Inc. | (8,201) | (169,515) |
| Ecolab, Inc. | (13,985) | (628,066) | | | | (1,022,887) |
| H.B. Fuller Co. | (5,443) | (103,363) | | DIVERSIFIED CONSUMER SERVICES — (1.4)% |
| Intrepid Potash, Inc. | (28,031) | (548,567) | | American Public | | |
| Methanex Corp. | (34,130) | (672,020) | | Education, Inc. | (12,041) | (526,192) |
| Mosaic Co. (The) | (4,505) | (175,605) | | Coinstar, Inc. | (6,068) | (260,742) |
| NL Industries, Inc. | (37,424) | (228,286) | | Strayer Education, Inc. | (3,716) | (772,519) |
| Olin Corp. | (34,147) | (617,719) | | | | (1,559,453) |
| Potash Corp. of | | | | DIVERSIFIED FINANCIAL SERVICES — (0.8)% |
| Saskatchewan, Inc. | (9,187) | (792,287) | | Interactive Brokers | | |
| Praxair, Inc. | (6,843) | (520,000) | | Group, Inc., Class A | (15,052) | (249,863) |
| Sigma-Aldrich Corp. | (17,607) | (877,356) | | Leucadia National Corp. | (32,829) | (640,494) |
| Valhi, Inc. | (12,177) | (150,264) | | | | (890,357) |
| | | (5,768,475) | | ELECTRIC UTILITIES — (1.4)% | | |
| COMMERCIAL SERVICES & SUPPLIES — (1.8)% | | Allete, Inc. | (14,870) | (509,149) |
| Clean Harbors, Inc. | (3,735) | (248,041) | | Cleco Corp. | (9,625) | (254,196) |
| Ritchie Bros. | | | | Great Plains Energy, Inc. | (50,224) | (854,813) |
| Auctioneers, Inc. | (28,463) | (518,596) | | | | (1,618,158) |
| Steelcase, Inc., Class A | (113,081) | (876,378) | | ELECTRICAL EQUIPMENT — (0.5)% | |
| Stericycle, Inc. | (6,998) | (458,929) | | American | | |
| | | (2,101,944) | | Superconductor Corp. | (7,840) | (209,250) |
| COMMUNICATIONS EQUIPMENT — (2.3)% | | | Canadian Solar, Inc. | (14,830) | (145,037) |
| Ciena Corp. | (4,498) | (57,035) | | First Solar, Inc. | (1,831) | (208,423) |
| Cisco Systems, Inc. | (33,284) | (709,282) | | | | (562,710) |
| Comverse Technology, Inc. | (24,168) | (188,510) | | ELECTRONIC EQUIPMENT, | | |
| EchoStar Corp., Class A | (13,049) | (248,975) | | INSTRUMENTS & COMPONENTS — (1.8)% | |
| Infinera Corp. | (102,313) | (657,873) | | Amphenol Corp., Class A | (12,392) | (486,758) |
| Viasat, Inc. | (25,243) | (821,912) | | Corning, Inc. | (42,852) | (692,059) |
| | | (2,683,587) | | FLIR Systems, Inc. | (4,546) | (132,243) |
| COMPUTERS & PERIPHERALS — (1.8)% | | | Ingram Micro, Inc., Class A | (38,104) | (578,800) |
| Diebold, Inc. | (7,969) | (217,155) | | Itron, Inc. | (2,817) | (174,147) |
| Isilon Systems, Inc. | (22,821) | (293,022) | | | | (2,064,007) |
| NCR Corp. | (53,872) | (652,928) | | ENERGY EQUIPMENT & SERVICES — (1.6)% | |
| NetApp, Inc. | (15,841) | (591,028) | | Atwood Oceanics, Inc. | (1,399) | (35,702) |
| QLogic Corp. | (16,960) | (281,875) | | Bristow Group, Inc. | (2,184) | (64,210) |
| | | (2,036,008) | | Dril-Quip, Inc. | (6,178) | (271,956) |
| CONSTRUCTION & ENGINEERING — (0.2)% | | | Global Industries Ltd. | (93,964) | (421,898) |
| Tutor Perini Corp. | (12,333) | (203,248) | | Patterson-UTI Energy, Inc. | (8,525) | (109,717) |
| CONSTRUCTION MATERIALS — (0.1)% | | | Pride International, Inc. | (13,440) | (300,250) |
| Eagle Materials, Inc. | (5,868) | (152,157) | | Weatherford | | |
| CONSUMER FINANCE — (0.8)% | | | International Ltd. | (44,663) | (586,871) |
| SLM Corp. | (80,207) | (833,351) | | | | (1,790,604) |
| Student Loan Corp. (The) | (3,989) | (96,055) | | | | |
| | | (929,406) | | | | |
16
| | | | | | |
| Long-Short Market Neutral | | | | |
| |
| | Shares | Value | | | Shares | Value |
| FOOD & STAPLES RETAILING — (1.2)% | | | INDEPENDENT POWER PRODUCERS & | |
| Costco Wholesale Corp. | (14,365) | $ (787,633) | | ENERGY TRADERS — (0.8)% | | |
| Rite Aid Corp. | (642,732) | (629,877) | | Ormat Technologies, Inc. | (29,057) | $ (822,023) |
| | | (1,417,510) | | TransAlta Corp. | (6,808) | (125,948) |
| FOOD PRODUCTS — (2.1)% | | | | | | (947,971) |
| Bunge Ltd. | (13,987) | (688,021) | | INDUSTRIAL CONGLOMERATES — (1.9)% | |
| Green Mountain Coffee | | | | General Electric Co. | (50,373) | (726,379) |
| Roasters, Inc. | (29,053) | (746,662) | | McDermott | | |
| Hain Celestial Group, Inc. | | | | International, Inc. | (36,496) | (790,503) |
| (The) | (28,965) | (584,224) | | Otter Tail Corp. | (32,581) | (629,791) |
| Kraft Foods, Inc., Class A | (15,861) | (444,108) | | | | (2,146,673) |
| | | (2,463,015) | | INSURANCE — (4.6)% | | |
| GAS UTILITIES — (0.7)% | | | | Assured Guaranty Ltd. | (47,932) | (636,058) |
| Northwest Natural Gas Co. | (18,211) | (793,453) | | Enstar Group Ltd. | (10,375) | (689,315) |
| HEALTH CARE EQUIPMENT & SUPPLIES — (2.5)% | | Fairfax Financial | | |
| Inverness Medical | | | | Holdings Ltd. | (2,314) | (857,823) |
| Innovations, Inc. | (5,050) | (134,633) | | Genworth Financial, Inc., | | |
| Meridian Bioscience, Inc. | (6,285) | (106,845) | | Class A | (4,081) | (53,339) |
| NuVasive, Inc. | (23,407) | (830,012) | | Hanover Insurance | | |
| Resmed, Inc. | (8,100) | (492,561) | | Group, Inc. (The) | (14,782) | (643,017) |
| | | | | Marsh & | | |
| Volcano Corp. | (39,412) | (859,970) | | McLennan Cos., Inc. | (22,068) | (497,633) |
| West Pharmaceutical | | | | MBIA, Inc. | (77,300) | (433,653) |
| Services, Inc. | (12,983) | (473,750) | | | | |
| | | (2,897,771) | | Mercury General Corp. | (21,447) | (888,763) |
| HEALTH CARE PROVIDERS & SERVICES — (0.8)% | | Wesco Financial Corp. | (1,741) | (562,691) |
| DaVita, Inc. | (3,214) | (200,682) | | XL Capital Ltd., Class A | (3,883) | (62,167) |
| Landauer, Inc. | (1,314) | (79,996) | | | | (5,324,459) |
| VCA Antech, Inc. | (25,234) | (624,794) | | INTERNET & CATALOG RETAIL — (0.2)% | |
| | | (905,472) | | priceline.com, Inc. | (1,467) | (258,984) |
| HEALTH CARE TECHNOLOGY — (0.8)% | | | INTERNET SOFTWARE & SERVICES — (1.3)% |
| athenahealth, Inc. | (9,880) | (258,164) | | Equinix, Inc. | (10,338) | (839,653) |
| Quality Systems, Inc. | (12,147) | (704,405) | | WebMD Health Corp. | (11,712) | (543,788) |
| | | (962,569) | | Yahoo!, Inc. | (8,422) | (116,476) |
| HOTELS, RESTAURANTS & LEISURE — (3.1)% | | | | (1,499,917) |
| Burger King Holdings, Inc. | (43,483) | (732,254) | | IT SERVICES — (1.0)% | | |
| Carnival Corp. | (16,434) | (496,964) | | Sapient Corp. | (26,064) | (264,289) |
| | | | | SRA International, Inc., | | |
| International | | | | Class A | (35,002) | (688,489) |
| Speedway Corp., Class A | (17,660) | (454,922) | | | | |
| Jack in the Box, Inc. | (39,765) | (773,429) | | Visa, Inc., Class A | (2,829) | (200,152) |
| Orient-Express Hotels Ltd., | | | | Wright Express Corp. | (1,363) | (40,481) |
| Class A | (70,464) | (521,434) | | | | (1,193,411) |
| Royal Caribbean Cruises Ltd. | (16,769) | (381,830) | | LIFE SCIENCES TOOLS & SERVICES — (1.1)% |
| Scientific Games Corp., | | | | Covance, Inc. | (16,921) | (868,386) |
| Class A | (15,322) | (140,962) | | Luminex Corp. | (16,551) | (268,457) |
| | | (3,501,795) | | Pharmaceutical Product | | |
| HOUSEHOLD DURABLES — (0.2)% | | | Development, Inc. | (3,117) | (79,203) |
| Lennar Corp., Class A | (18,190) | (253,023) | | | | (1,216,046) |
17
| | | | | | |
| Long-Short Market Neutral | | | | |
| |
| | Shares | Value | | | Shares | Value |
| MACHINERY — (4.1)% | | | | Enbridge, Inc. | (14,348) | $ (668,617) |
| Bucyrus International, Inc. | (3,971) | $ (188,424) | | EOG Resources, Inc. | (1,867) | (183,657) |
| CLARCOR, Inc. | (23,021) | (817,706) | | EQT Corp. | (21,553) | (778,924) |
| ESCO Technologies, Inc. | (4,715) | (121,411) | | Holly Corp. | (32,695) | (869,032) |
| Federal Signal Corp. | (113,308) | (684,380) | | Overseas Shipholding | | |
| Kaydon Corp. | (21,168) | (695,580) | | Group, Inc. | (14,597) | (540,673) |
| Kennametal, Inc. | (9,457) | (240,492) | | Petrohawk Energy Corp. | (39,183) | (664,936) |
| Middleby Corp. | (1,586) | (84,359) | | Plains Exploration & | | |
| PACCAR, Inc. | (21,895) | (872,955) | | Production Co. | (25,396) | (523,412) |
| Pall Corp. | (8,793) | (302,215) | | Range Resources Corp. | (4,417) | (177,343) |
| Terex Corp. | (37,261) | (698,271) | | Suncor Energy, Inc. | (26,345) | (775,597) |
| | | (4,705,793) | | Ultra Petroleum Corp. | (7,409) | (327,848) |
| MEDIA — (1.8)% | | | | | | (7,478,067) |
| Morningstar, Inc. | (14,453) | (614,541) | | PAPER & FOREST PRODUCTS — (0.7)% | |
| News Corp., Class A | (51,105) | (611,216) | | Weyerhaeuser Co. | (22,925) | (806,960) |
| Shaw Communications, Inc., | | | | PERSONAL PRODUCTS — (0.4)% | |
| Class B | (10,356) | (186,719) | | Avon Products, Inc. | (18,559) | (491,814) |
| Walt Disney Co. (The) | (19,364) | (609,966) | | PHARMACEUTICALS — (1.2)% | | |
| | | (2,022,442) | | Auxilium | | |
| METALS & MINING — (2.3)% | | | | Pharmaceuticals, Inc. | (13,368) | (314,148) |
| AK Steel Holding Corp. | (46,683) | (556,461) | | Merck & Co., Inc. | (4,186) | (146,384) |
| Alcoa, Inc. | (13,994) | (140,780) | | Salix Pharmaceuticals Ltd. | (10,026) | (391,315) |
| Allegheny Technologies, Inc. | (15,518) | (685,740) | | VIVUS, Inc. | (57,028) | (547,469) |
| Coeur d’Alene Mines Corp. | (11,385) | (179,655) | | | | (1,399,316) |
| Compass Minerals | | | | PROFESSIONAL SERVICES — (1.0)% | |
| International, Inc. | (447) | (31,415) | | IHS, Inc., Class A | (6,185) | (361,328) |
| RTI International Metals, Inc. | (9,150) | (220,607) | | Korn/Ferry International | (53,728) | (746,819) |
| Southern Copper Corp. | (2,610) | (69,269) | | | | (1,108,147) |
| Steel Dynamics, Inc. | (6,072) | (80,090) | | REAL ESTATE INVESTMENT TRUSTS (REITS) — (2.6)% |
| United States Steel Corp. | (16,003) | (616,916) | | Alexander’s, Inc. | (598) | (181,146) |
| | | (2,580,933) | | BioMed Realty Trust, Inc. | (11,440) | (184,070) |
| MULTILINE RETAIL — (0.3)% | | | | Digital Realty Trust, Inc. | (11,875) | (684,950) |
| Dollar General Corp. | (4,691) | (129,237) | | Franklin Street | | |
| Saks, Inc. | (4,705) | (35,711) | | Properties Corp. | (45,904) | (542,126) |
| Target Corp. | (3,913) | (192,402) | | Healthcare Realty Trust, Inc. | (6,423) | (141,113) |
| | | (357,350) | | Rayonier, Inc. | (10,524) | (463,266) |
| MULTI-UTILITIES — (1.0)% | | | | UDR, Inc. | (40,047) | (766,100) |
| Alliant Energy Corp. | (12,338) | (391,608) | | | | (2,962,771) |
| | | | | REAL ESTATE MANAGEMENT | | |
| Black Hills Corp. | (10,744) | (305,882) | | & DEVELOPMENT — (0.9)% | | |
| Dominion Resources, Inc. | (10,692) | (414,208) | | Brookfield Asset | | |
| | | (1,111,698) | | Management, Inc., Class A | (3,189) | (72,135) |
| OIL, GAS & CONSUMABLE FUELS — (6.6)% | | | Forest City Enterprises, Inc., | | |
| Boardwalk Pipeline | | | | Class A | (62,009) | (701,942) |
| Partners LP | (5,024) | (151,122) | | St. Joe Co. (The) | (11,346) | (262,773) |
| BPZ Resources, Inc. | (145,619) | (604,319) | | | | (1,036,850) |
| Chesapeake Energy Corp. | (29,259) | (612,976) | | ROAD & RAIL — (0.3)% | | |
| CONSOL Energy, Inc. | (17,761) | (599,611) | | Hertz Global Holdings, Inc. | (36,235) | (342,783) |
18
| | | | | | | |
| Long-Short Market Neutral | | | | | |
| |
| | Shares | Value | | | | Shares | Value |
| SEMICONDUCTORS & | | | | TOBACCO — (0.8)% | | |
| SEMICONDUCTOR EQUIPMENT — (4.3)% | | | Universal Corp. | (1,417) | $ (56,227) |
| Applied Materials, Inc. | (31,878) | $ (383,174) | | Vector Group Ltd. | (53,263) | (895,883) |
| Cavium Networks, Inc. | (33,175) | (868,853) | | | | | (952,110) |
| Cree, Inc. | (9,762) | (586,013) | | TRADING COMPANIES & DISTRIBUTORS — (0.9)% |
| Diodes, Inc. | (2,881) | (45,721) | | Fastenal Co. | (3,050) | (153,080) |
| Formfactor, Inc. | (62,159) | (671,317) | | GATX Corp. | (29,266) | (780,816) |
| International Rectifier Corp. | (13,986) | (260,279) | | Watsco, Inc. | (1,813) | (105,009) |
| MEMC Electronic | | | | | | | (1,038,905) |
| Materials, Inc. | (69,212) | (683,815) | | WATER UTILITIES — (0.5)% | | |
| Microchip Technology, Inc. | (19,027) | (527,809) | | Aqua America, Inc. | (32,868) | (581,106) |
| Netlogic Microsystems, Inc. | (7,446) | (202,531) | | WIRELESS TELECOMMUNICATION | |
| Rambus, Inc. | (38,971) | (682,772) | | SERVICES — (2.0)% | | |
| | | (4,912,284) | | Clearwire Corp., Class A | (120,153) | (874,713) |
| SOFTWARE — (2.0)% | | | | Crown Castle | | |
| AsiaInfo Holdings, Inc. | (11,588) | (253,314) | | International Corp. | (17,037) | (634,798) |
| Concur Technologies, Inc. | (15,697) | (669,948) | | Leap Wireless | | |
| Electronic Arts, Inc. | (15,489) | (223,042) | | International, Inc. | (25,523) | (331,289) |
| NetSuite, Inc. | (13,782) | (174,204) | | SBA Communications Corp., | | |
| salesforce.com, inc. | (2,492) | (213,863) | | Class A | (10,354) | (352,140) |
| | | | | Shenandoah | | |
| Take-Two Interactive | | | | Telecommunications Co. | (4,685) | (83,112) |
| Software, Inc. | (67,863) | (610,767) | | | | | |
| THQ, Inc. | (40,644) | (175,582) | | | | | (2,276,052) |
| | | | | TOTAL SECURITIES | | |
| | | (2,320,720) | | SOLD SHORT — (89.4)% | | |
| SPECIALTY RETAIL — (2.7)% | | | | (Proceeds $110,302,353) | $(102,460,720) |
| American Eagle | | | | | | | |
| Outfitters, Inc. | (45,433) | (533,838) | | | | | |
| Coldwater Creek, Inc. | (72,592) | (243,909) | | Notes to Schedule of Investments | |
| Lowe’s Cos., Inc. | (31,897) | (651,337) | | (1) | Securities are pledged with brokers as collateral for securities |
| O’Reilly Automotive, Inc. | (18,625) | (885,804) | | | sold short. At the period end, the value of securities pledged |
| Sally Beauty Holdings, Inc. | (29,006) | (237,849) | | | was $103,271,989. | | |
| Urban Outfitters, Inc. | (16,068) | (552,579) | | (2) | Non-income producing. | | |
| | | (3,105,316) | | | | | |
| THRIFTS & MORTGAGE FINANCE — (0.7)% | | | Industry classifications are unaudited. | | |
| Radian Group, Inc. | (84,016) | (608,276) | | | | | |
| Tree.com, Inc. | (27,614) | (174,520) | | | | | |
| | | (782,796) | | See Notes to Financial Statements. | | |
19
|
| Statement of Assets and Liabilities |
| |
| JUNE 30, 2010 | |
| Assets | |
| Investment securities, at value (cost of $88,094,658) | $104,511,057 |
| Cash on deposit with broker for securities sold short | 111,325,125 |
| Cash | 1,713,807 |
| Receivable for capital shares sold | 211,355 |
| Dividends and interest receivable | 41,361 |
| | 217,802,705 |
| | |
| Liabilities | |
| Securities sold short, at value (proceeds of $110,302,353) | 102,460,720 |
| Payable for capital shares redeemed | 494,022 |
| Accrued management fees | 131,203 |
| Service fees (and distribution fees — A Class and R Class) payable | 18,067 |
| Distribution fees payable | 8,103 |
| Dividend expense payable on securities sold short | 52,909 |
| | 103,165,024 |
| | |
| Net Assets | $114,637,681 |
| | |
| Net Assets Consist of: | |
| Capital (par value and paid-in surplus) | $129,051,601 |
| Accumulated net realized loss on investment and securities sold short transactions | (38,671,952) |
| Net unrealized appreciation on investments and securities sold short | 24,258,032 |
| | $114,637,681 |
| | | |
| | Net assets | Shares outstanding | Net asset value per share |
| Investor Class, $0.01 Par Value | $16,569,853 | 1,656,564 | $10.00 |
| Institutional Class, $0.01 Par Value | $11,881,852 | 1,179,837 | $10.07 |
| A Class, $0.01 Par Value | $72,780,848 | 7,332,662 | $9.93* |
| B Class, $0.01 Par Value | $2,276,224 | 235,750 | $9.66 |
| C Class, $0.01 Par Value | $10,543,261 | 1,092,147 | $9.65 |
| R Class, $0.01 Par Value | $585,643 | 59,521 | $9.84 |
| *Maximum offering price $10.54 (net asset value divided by 0.9425) | | |
| |
| |
| See Notes to Financial Statements. | | | |
20
| |
| YEAR ENDED JUNE 30, 2010 | |
| Investment Income (Loss) | |
| Income: | |
| Dividends (net of foreign taxes withheld of $11,645) | $ 2,054,039 |
| Interest | 3,839 |
| | 2,057,878 |
| | |
| Expenses: | |
| Dividend expense on securities sold short | 2,061,837 |
| Interest expense on securities sold short | 372,537 |
| Management fees | 2,012,792 |
| Distribution fees: | |
| B Class | 20,109 |
| C Class | 105,039 |
| Service fees: | |
| B Class | 6,703 |
| C Class | 35,013 |
| Distribution and service fees: | |
| A Class | 239,567 |
| R Class | 3,789 |
| Directors’ fees and expenses | 4,555 |
| Other expenses | 19,953 |
| | 4,881,894 |
| | |
| Net investment income (loss) | (2,824,016) |
| | |
| Realized and Unrealized Gain (Loss) | |
| Net realized gain (loss) on: | |
| Investment transactions | 34,514,612 |
| Securities sold short transactions | (28,008,122) |
| | 6,506,490 |
| | |
| Change in net unrealized appreciation (depreciation) on: | |
| Investments | (1,540,708) |
| Securities sold short | (2,742,344) |
| | (4,283,052) |
| | |
| Net realized and unrealized gain (loss) | 2,223,438 |
| | |
| Net Increase (Decrease) in Net Assets Resulting from Operations | $ (600,578) |
| |
| |
| See Notes to Financial Statements. | |
21
|
| Statement of Changes in Net Assets |
| | |
| YEARS ENDED JUNE 30, 2010 AND JUNE 30, 2009 | | |
| Increase (Decrease) in Net Assets | 2010 | 2009 |
| Operations | | |
| Net investment income (loss) | $ (2,824,016) | $ (3,635,683) |
| Net realized gain (loss) | 6,506,490 | (14,547,546) |
| Change in net unrealized appreciation (depreciation) | (4,283,052) | (1,057,542) |
| Net increase (decrease) in net assets resulting from operations | (600,578) | (19,240,771) |
| | | |
| Capital Share Transactions | | |
| Net increase (decrease) in net assets from capital share transactions | (56,599,782) | (20,550,832) |
| | | |
| Net increase (decrease) in net assets | (57,200,360) | (39,791,603) |
| | | |
| Net Assets | | |
| Beginning of period | 171,838,041 | 211,629,644 |
| End of period | $ 114,637,681 | $171,838,041 |
| |
| |
| See Notes to Financial Statements. | | |
22
|
| Notes to Financial Statements |
JUNE 30, 2010
1. Organization and Summary of Significant Accounting Policies
Organization — American Century Quantitative Equity Funds, Inc. (the corporation) is registered under the Investment Company Act of 1940 (the 1940 Act) as an open-end management investment company. Long-Short Market Neutral Fund (the fund) is one fund in a series issued by the corporation. The fund is diversified under the 1940 Act. The fund’s investment objective is to seek capital appreciation independent of equity market conditions. The fund buys, or takes long positions in, equity securities that have been identified as undervalued. The fund takes short positions in equity securities that have been identified as overvalued. The fund’s investment process is designed to maintain approximately equal dollar amounts invested in long and short positions at all times. The following is a summary of the fund’s signi ficant accounting policies.
Multiple Class — The fund is authorized to issue the Investor Class, the Institutional Class, the A Class, the B Class, the C Class and the R Class. The A Class may incur an initial sales charge. The A Class, B Class and C Class may be subject to a contingent deferred sales charge. The share classes differ principally in their respective sales charges and distribution and shareholder servicing expenses and arrangements. All shares of the fund represent an equal pro rata interest in the net assets of the class to which such shares belong, and have identical voting, dividend, liquidation and other rights and the same terms and conditions, except for class specific expenses and exclusive rights to vote on matters affecting only individual classes. Income, non-class specific expenses, and realized and unrealized capital gains and losses of the fund are allocated to each class of shares based on their relative net assets.
Security Valuations — Securities traded primarily on a principal securities exchange are valued at the last reported sales price, or at the mean of the latest bid and asked prices where no last sales price is available. Depending on local convention or regulation, securities traded over-the-counter are valued at the mean of the latest bid and asked prices, the last sales price, or the official close price. Investments in open-end management investment companies are valued at the reported net asset value. Discount notes may be valued through a commercial pricing service or at amortized cost, which approximates fair value. Securities traded on foreign securities exchanges and over-the-counter markets are normally completed before the close of business on days that the New York Stock Exchange (the Exchange) is open and may also take place on days when the Exchange is not open. If an event occurs after the value of a security was established but before the net asset value per share was determined that was likely to materially change the net asset value, that security would be valued as determined in accordance with procedures adopted by the Board of Directors. If the fund determines that the market price of a portfolio security is not readily available, or that the valuation methods mentioned above do not reflect the security’s fair value, such security is valued as determined by the Board of Directors or its designee, in accordance with procedures adopted by the Board of Directors, if such determination would materially impact a fund’s net asset value. Certain other circumstances may cause the fund to use alternative procedures to value a security such as: a security has been declared in default; trading in a security has been halted during the trading day; or there is a foreign market holiday and no trading will commence .
Security Transactions — For financial reporting purposes, security transactions are accounted for as of the trade date. Net realized gains and losses are determined on the identified cost basis, which is also used for federal income tax purposes.
Investment Income — Dividend income less foreign taxes withheld, if any, is recorded as of the ex-dividend date. Distributions received on securities that represent a return of capital or capital gain are recorded as a reduction of cost of investments and/or as a realized gain. The fund estimates the components of distributions received that may be considered nontaxable distributions or capital gain distributions for income tax purposes. Interest income is recorded on the accrual basis and includes accretion of discounts and amortization of premiums.
23
Securities Sold Short — The fund may enter into a short sale, which is selling a security it does not own, as part of its normal investment activities. Upon selling a security short, the fund will segregate cash, cash equivalents or other appropriate liquid securities in at least an amount equal to the current market value of the securities sold short until the fund replaces the borrowed security. Interest earned or paid on segregated cash for securities sold short is reflected as interest income or interest expense. The fund is required to pay any dividends or interest due on securities sold short. Such dividends and interest are recorded as an expense. Liabilities for securities sold short are valued daily and changes in value are recorded as unrealized appreciation (depreciation) on securities sold short. The fund reco rds realized gain (loss) on a security sold short when it is terminated by the fund and includes as a component of realized gain (loss) on securities sold short transactions. The fund’s risks in selling securities short include the possibility that the future increases in market value may exceed the liability recorded or that the lender of the security may terminate the loan at a disadvantageous price or time to the fund. In addition, while the realized gains on securities sold short are limited to the price at which it sold the security short, the losses may be unlimited.
Repurchase Agreements — The fund may enter into repurchase agreements with institutions that American Century Investment Management, Inc. (ACIM) (the investment advisor) has determined are creditworthy pursuant to criteria adopted by the Board of Directors. Each repurchase agreement is recorded at cost. The fund requires that the collateral, represented by securities, received in a repurchase transaction be transferred to the custodian in a manner sufficient to enable the fund to obtain those securities in the event of a default under the repurchase agreement. ACIM monitors, on a daily basis, the securities transferred to ensure the value, including accrued interest, of the securities under each repurchase agreement is equal to or greater than amounts owed to the fund under each repurchase agreement.
Joint Trading Account — Pursuant to an Exemptive Order issued by the Securities and Exchange Commission, the fund, along with certain other funds in the American Century Investments family of funds, may transfer uninvested cash balances into a joint trading account. These balances are invested in one or more repurchase agreements that are collateralized by U.S. Treasury or Agency obligations.
Income Tax Status — It is the fund’s policy to distribute substantially all net investment income and net realized gains to shareholders and to otherwise qualify as a regulated investment company under provisions of the Internal Revenue Code. The fund is no longer subject to examination by tax authorities for years prior to 2006. At this time, management believes there are no uncertain tax positions which, based on their technical merit, would not be sustained upon examination and for which it is reasonably possible that the total amounts of unrecognized tax benefits will significantly change in the next twelve months. Accordingly, no provision has been made for federal or state income taxes.
Distributions to Shareholders — Distributions to shareholders are recorded on the ex-dividend date. Distributions from net investment income, if any, are declared and paid semiannually. Distributions from net realized gains, if any, are generally declared and paid annually.
Indemnifications — Under the corporation’s organizational documents, its officers and directors are indemnified against certain liabilities arising out of the performance of their duties to the fund. In addition, in the normal course of business, the fund enters into contracts that provide general indemnifications. The maximum exposure under these arrangements is unknown as this would involve future claims that may be made against a fund. The risk of material loss from such claims is considered by management to be remote.
Use of Estimates — The financial statements are prepared in conformity with accounting principles generally accepted in the United States of America, which may require management to make certain estimates and assumptions at the date of the financial statements. Actual results could differ from these estimates.
24
Subsequent Events — In preparing the financial statements, management evaluated the impact of events or transactions occurring through the date the financial statements were issued that would merit recognition or disclosure.
2. Fees and Transactions with Related Parties
Management Fees — The corporation has entered into a Management Agreement with ACIM, under which ACIM provides the fund with investment advisory and management services in exchange for a single, unified management fee (the fee) per class. The Agreement provides that all expenses of managing and operating the fund, except brokerage expenses, taxes, interest, fees and expenses of the independent directors (including legal counsel fees), and extraordinary expenses, will be paid by ACIM. The fee is computed and accrued daily based on the daily net assets of the specific class of shares of the fund and paid monthly in arrears. The fee consists of (1) an Investment Category Fee based on the daily net assets of the fund and certain other accounts managed by the investment advisor that are in the same broad investment category as the fund and (2) a Complex Fee based on the assets of all the funds in the American Century Investments family of funds. The rates for the Investment Category Fee range from 1.0480% to 1.2300%. The rates for the Complex Fee range from 0.2500% to 0.3100% for the Investor Class, A Class, B Class, C Class and R Class. The Institutional Class is 0.2000% less at each point within the Complex Fee range. The effective annual management fee for each class for the year ended June 30, 2010, was 1.40% for the Investor Class, A Class, B Class, C Class and R Class and 1.20% for the Institutional Class.
Distribution and Service Fees — The Board of Directors has adopted a separate Master Distribution and Individual Shareholder Services Plan for each of the A Class, B Class, C Class and R Class (collectively the plans), pursuant to Rule 12b-1 of the 1940 Act. The plans provide that the A Class will pay American Century Investment Services, Inc. (ACIS) an annual distribution and service fee of 0.25%. The plans provide that the B Class and C Class will each pay ACIS an annual distribution fee of 0.75% and service fee of 0.25%. The plans provide that the R Class will pay ACIS an annual distribution and service fee of 0.50%. The fees are computed and accrued daily based on each class’s daily net assets and paid monthly in arrears. The fees are used to pay financial intermediaries for distribution and individual shareholde r services. Fees incurred under the plans during the year ended June 30, 2010, are detailed in the Statement of Operations.
Other Expenses — The fund’s total other expenses include the fees and expenses of the fund’s independent directors and their legal counsel and other miscellaneous expenses. A portion of these expenses was due to nonrecurring expenses paid by the fund. The impact of total other expenses to the annualized ratio of operating expenses to average net assets was 0.02%.
Related Parties — Certain officers and directors of the corporation are also officers and/or directors of American Century Companies, Inc. (ACC), the parent of the corporation’s investment advisor, ACIM, the distributor of the corporation, ACIS, and the corporation’s transfer agent, American Century Services, LLC.
The fund is eligible to invest in a money market fund for temporary purposes, which is managed by J.P. Morgan Investment Management, Inc. (JPMIM). The fund has a Mutual Funds Services Agreement with J.P. Morgan Investor Services Co. (JPMIS). JPMorgan Chase Bank (JPMCB) is a custodian of the fund. JPMIM, JPMIS and JPMCB are wholly owned subsidiaries of JPMorgan Chase & Co. (JPM). JPM is an equity investor in ACC.
25
3. Investment Transactions
Purchases and sales of investment securities and securities sold short, excluding short-term investments, for the year ended June 30, 2010, were $193,855,026 and $196,934,220, respectively.
| | | | |
| 4. Capital Share Transactions | | | | |
| |
| Transactions in shares of the fund were as follows: | | |
| | Year ended June 30, 2010 | Year ended June 30, 2009 |
| | Shares | Amount | Shares | Amount |
| Investor Class/Shares Authorized | 50,000,000 | | 50,000,000 | |
| Sold | 1,036,424 | $ 10,346,661 | 1,911,327 | $ 19,949,664 |
| Redeemed | (1,673,493) | (16,727,635) | (2,267,677) | (23,248,663) |
| | (637,069) | (6,380,974) | (356,350) | (3,298,999) |
| Institutional Class/Shares Authorized | 50,000,000 | | 50,000,000 | |
| Sold | 554,504 | 5,580,433 | 1,777,964 | 18,605,876 |
| Redeemed | (1,597,249) | (16,029,185) | (741,402) | (7,697,274) |
| | (1,042,745) | (10,448,752) | 1,036,562 | 10,908,602 |
| A Class/Shares Authorized | 70,000,000 | | 70,000,000 | |
| Sold | 7,169,067 | 71,213,377 | 4,329,302 | 45,040,978 |
| Redeemed | (10,345,618) | (102,705,155) | (7,158,059) | (72,955,762) |
| | (3,176,551) | (31,491,778) | (2,828,757) | (27,914,784) |
| B Class/Shares Authorized | 10,000,000 | | 10,000,000 | |
| Sold | 11,278 | 110,108 | 110,857 | 1,141,819 |
| Redeemed | (90,003) | (869,608) | (81,914) | (826,016) |
| | (78,725) | (759,500) | 28,943 | 315,803 |
| C Class/Shares Authorized | 10,000,000 | | 10,000,000 | |
| Sold | 344,797 | 3,352,577 | 584,193 | 5,930,556 |
| Redeemed | (1,079,003) | (10,457,305) | (680,115) | (6,872,873) |
| | (734,206) | (7,104,728) | (95,922) | (942,317) |
| R Class/Shares Authorized | 10,000,000 | | 10,000,000 | |
| Sold | 30,411 | 299,610 | 40,865 | 414,082 |
| Redeemed | (72,376) | (713,660) | (3,323) | (33,219) |
| | (41,965) | (414,050) | 37,542 | 380,863 |
| Net increase (decrease) | (5,711,261) | $ (56,599,782) | (2,177,982) | $(20,550,832) |
26
5. Fair Value Measurements
The fund’s securities valuation process is based on several considerations and may use multiple inputs to determine the fair value of the positions held by the fund. In conformity with accounting principles generally accepted in the United States of America, the inputs used to determine a valuation are classified into three broad levels as follows:
• Level 1 valuation inputs consist of unadjusted quoted prices in an active market for identical securities;
• Level 2 valuation inputs consist of significant direct or indirect observable market data (including quoted prices for similar securities, evaluations of subsequent market events, interest rates, prepayment speeds, credit risk, etc.); or
• Level 3 valuation inputs consist of significant unobservable inputs (including a fund’s own assumptions).
The level classification is based on the lowest level input that is significant to the fair valuation measurement. The valuation inputs are not an indication of the risks associated with investing in these securities or other financial instruments.
The following is a summary of the valuation inputs used to determine the fair value of the fund’s securities as of June 30, 2010. The Schedule of Investments provides additional details on the fund’s portfolio holdings.
| | | |
| | Level 1 | Level 2 | Level 3 |
| Investment Securities | | | |
| Domestic Common Stocks | $ 97,147,985 | — | — |
| Foreign Common Stocks | 6,124,004 | — | — |
| Temporary Cash Investments | 39,068 | $1,200,000 | — |
| Total Value of Investment Securities | $103,311,057 | $1,200,000 | — |
| | | | |
| Securities Sold Short | | | |
| Domestic Common Stocks | $ (94,137,385) | — | — |
| Foreign Common Stocks | (8,323,335) | — | — |
| Total Value of Securities Sold Short | $(102,460,720) | — | — |
6. Risk Factors
The fund’s investment process may produce high portfolio turnover and high short-term capital gains distributions. In addition, its investment approach may involve higher volatility, short sales risk and overweighting risk. The fund may suffer losses when taking long positions in market sectors or industries that are not offset by corresponding short positions, resulting in an over- or underweighted sector or industry.
27
7. Federal Tax Information
The book-basis character of distributions made during the year from net investment income or net realized gains may differ from their ultimate characterization for federal income tax purposes. These differences reflect the differing character of certain income items and net realized gains and losses for financial statement and tax purposes, and may result in reclassification among certain capital accounts on the financial statements.
There were no distributions paid by the fund during the years ended June 30, 2010 and June 30, 2009.
As of June 30, 2010, the federal tax cost of investments and the components of distributable earnings on a tax-basis were as follows:
| | |
| Federal tax cost of investments | $90,216,643 |
| Gross tax appreciation of investments | $20,634,251 |
| Gross tax depreciation of investments | (6,339,837) |
| Net tax appreciation (depreciation) of investments | $14,294,414 |
| Net tax appreciation (depreciation) on securities sold short | $ 7,841,633 |
| Net tax appreciation (depreciation) | $22,136,047 |
| Undistributed ordinary income | — |
| Accumulated capital losses | $(36,549,967) |
The difference between book-basis and tax-basis cost and unrealized appreciation (depreciation) is attributable primarily to the tax deferral of losses on wash sales.
The accumulated capital losses listed above represent net capital loss carryovers that may be used to offset future realized capital gains for federal income tax purposes. Future capital loss carryover utilization in any given year may be limited due to Internal Revenue Code Limitations. The capital loss carryovers of $(726,363), $(11,723,614), $(7,547,465), $(7,401,476) and $(9,151,049) expire in 2014, 2015, 2016, 2017 and 2018, respectively.
8. Corporate Event
As part of a long-standing estate and business succession plan established by ACC Co-Chairman James E. Stowers, Jr., the founder of American Century Investments, ACC Co-Chairman Richard W. Brown succeeded Mr. Stowers as trustee of a trust that holds a greater-than-25% voting interest in ACC, the parent corporation of the fund’s advisor. Under the 1940 Act, this is presumed to represent control of ACC even though it is less than a majority interest. The change of trustee may technically be considered a “change of control” of ACC and therefore also a change of control of the fund’s advisor even though there has been no change to its management and none is anticipated. The “change of control” resulted in the assignment of the fund’s investment advisory agreement. Under the 1940 Act, an assignment automatically terminated such agreement, making the approval of a new agreement necessa ry.
On February 18, 2010, the Board of Directors approved an interim investment advisory agreement under which the fund will be managed until a new agreement is approved by fund shareholders. On April 1, 2010, the Board of Directors approved a new investment advisory agreement. The interim agreement and the new agreement are substantially identical to the terminated agreements (with the exception of different effective and termination dates) and will not result in changes in the management of American Century Investments, the fund, its investment objectives, fees or services provided. The new agreement for the fund was approved by shareholders at a Special Meeting of Shareholders on June 16, 2010. The new agreement went into effect on July 16, 2010.
28
| | | | | | | |
| Long-Short Market Neutral | | | | |
| |
| Investor Class | | | | | | |
| For a Share Outstanding Throughout the Years Ended June 30 (except as noted) | | |
| | | 2010 | 2009 | 2008 | 2007(1) | 2006 | 2005(2) |
| Per-Share Data | | | | | | |
| Net Asset Value, | | | | | | |
| Beginning of Period | $10.01 | $10.92 | $11.22 | $10.40 | $9.97 | $10.00 |
| Income From | | | | | | |
| Investment Operations | | | | | | |
| Net Investment | | | | | | |
| Income (Loss)(3) | (0.17) | (0.16) | 0.08 | 0.14 | 0.24 | 0.06 |
| Net Realized and | | | | | | |
| Unrealized Gain (Loss) | 0.16 | (0.75) | (0.15) | 0.68 | 0.27 | (0.09) |
| Total From | | | | | | |
| Investment Operations | (0.01) | (0.91) | (0.07) | 0.82 | 0.51 | (0.03) |
| Distributions | | | | | | |
| From Net | | | | | | |
| Investment Income | — | — | (0.23) | — | (0.08) | — |
| Net Asset Value, | | | | | | |
| End of Period | $10.00 | $10.01 | $10.92 | $11.22 | $10.40 | $9.97 |
| |
| Total Return(4) | (0.10)% | (8.33)% | (0.67)% | 7.88% | 5.08% | (0.30)% |
| | | | | | | |
| Ratios/Supplemental Data | | | | | | |
| Ratio of Operating | | | | | | |
| Expenses to | | | | | | |
| Average Net Assets | 3.09% | 3.34% | 2.89% | 2.71%(5) | 3.45% | 2.76%(5) |
| Ratio of Net Investment | | | | | | |
| Income (Loss) to | | | | | | |
| Average Net Assets | (1.68)% | (1.56)% | 0.90% | 2.61%(5) | 2.17% | 2.23%(5) |
| Portfolio Turnover Rate | 140% | 330% | 356% | 181% | 428% | 171% |
| Portfolio Turnover Rate | | | | | | |
| Excluding Short Sales | 35% | 151% | 137% | 38% | 50% | 36% |
| Net Assets, End of Period | | | | | | |
| (in thousands) | $16,570 | $22,956 | $28,939 | $20,732 | $12,781 | $498 |
| Ratio of Operating | | | | | | |
| Expenses (excluding | | | | | | |
| expenses on securities | | | | | | |
| sold short) to | | | | | | |
| Average Net Assets | 1.42% | 1.41% | 1.39% | 1.39%(5) | 1.38% | 1.37%(5) |
| (1) | January 1, 2007 through June 30, 2007. The fund’s fiscal year end was changed from December 31 to June 30, resulting in a six-month annual |
| | reporting period. For the years before June 30, 2007, the fund’s fiscal year end was December 31. | | |
| (2) | September 30, 2005 (fund inception) through December 31, 2005. | | | | |
| (3) | Computed using average shares outstanding throughout the period. | | | | |
| (4) | Total return assumes reinvestment of net investment income and capital gains distributions, if any. Total returns for periods less than one year |
| | are not annualized. Total returns are calculated based on the net asset value of the last business day. The total return of the classes may not |
| | precisely reflect the class expense differences because of the impact of calculating the net asset values to two decimal places. If net asset |
| | values were calculated to three decimal places, the total return differences would more closely reflect the class expense differences. The |
| | calculation of net asset values to two decimal places is made in accordance with SEC guidelines and does not result in any gain or loss of value |
| | between one class and another. | | | | | |
| (5) | Annualized. | | | | | | |
See Notes to Financial Statements.
29
| | | | | | | |
| Long-Short Market Neutral | | | | |
| |
| Institutional Class | | | | | | |
| For a Share Outstanding Throughout the Years Ended June 30 (except as noted) | | |
| | | 2010 | 2009 | 2008 | 2007(1) | 2006 | 2005(2) |
| Per-Share Data | | | | | | |
| Net Asset Value, | | | | | | |
| Beginning of Period | $10.06 | $10.95 | $11.24 | $10.40 | $9.97 | $10.00 |
| Income From | | | | | | |
| Investment Operations | | | | | | |
| Net Investment | | | | | | |
| Income (Loss)(3) | (0.16) | (0.15) | 0.17 | 0.15 | 0.25 | 0.06 |
| Net Realized and | | | | | | |
| Unrealized Gain (Loss) | 0.17 | (0.74) | (0.22) | 0.69 | 0.28 | (0.09) |
| Total From | | | | | | |
| Investment Operations | 0.01 | (0.89) | (0.05) | 0.84 | 0.53 | (0.03) |
| Distributions | | | | | | |
| From Net | | | | | | |
| Investment Income | — | — | (0.24) | — | (0.10) | — |
| Net Asset Value, | | | | | | |
| End of Period | $10.07 | $10.06 | $10.95 | $11.24 | $10.40 | $9.97 |
| |
| Total Return(4) | 0.10% | (8.13)% | (0.48)% | 8.08% | 5.30% | (0.30)% |
| | | | | | | |
| Ratios/Supplemental Data | | | | | | |
| Ratio of Operating | | | | | | |
| Expenses to | | | | | | |
| Average Net Assets | 2.89% | 3.14% | 2.69% | 2.51%(5) | 3.25% | 2.56%(5) |
| Ratio of Net Investment | | | | | | |
| Income (Loss) to | | | | | | |
| Average Net Assets | (1.48)% | (1.36)% | 1.10% | 2.81%(5) | 2.37% | 2.43%(5) |
| Portfolio Turnover Rate | 140% | 330% | 356% | 181% | 428% | 171% |
| Portfolio Turnover Rate | | | | | | |
| Excluding Short Sales | 35% | 151% | 137% | 38% | 50% | 36% |
| Net Assets, End of Period | | | | | | |
| (in thousands) | $11,882 | $22,354 | $12,989 | $19,559 | $14,412 | $499 |
| Ratio of Operating | | | | | | |
| Expenses (excluding | | | | | | |
| expenses on securities | | | | | | |
| sold short) to | | | | | | |
| Average Net Assets | 1.22% | 1.21% | 1.19% | 1.19%(5) | 1.18% | 1.17%(5) |
| (1) | January 1, 2007 through June 30, 2007. The fund’s fiscal year end was changed from December 31 to June 30, resulting in a six-month annual |
| | reporting period. For the years before June 30, 2007, the fund’s fiscal year end was December 31. | | |
| (2) | September 30, 2005 (fund inception) through December 31, 2005. | | | | |
| (3) | Computed using average shares outstanding throughout the period. | | | | |
| (4) | Total return assumes reinvestment of net investment income and capital gains distributions, if any. Total returns for periods less than one year |
| | are not annualized. Total returns are calculated based on the net asset value of the last business day. The total return of the classes may not |
| | precisely reflect the class expense differences because of the impact of calculating the net asset values to two decimal places. If net asset |
| | values were calculated to three decimal places, the total return differences would more closely reflect the class expense differences. The |
| | calculation of net asset values to two decimal places is made in accordance with SEC guidelines and does not result in any gain or loss of value |
| | between one class and another. | | | | | |
| (5) | Annualized. | | | | | | |
See Notes to Financial Statements.
30
| | | | | | | |
| Long-Short Market Neutral | | | | |
| |
| A Class | | | | | | |
| For a Share Outstanding Throughout the Years Ended June 30 (except as noted) | | |
| | | 2010 | 2009 | 2008 | 2007(1) | 2006 | 2005(2) |
| Per-Share Data | | | | | | |
| Net Asset Value, | | | | | | |
| Beginning of Period | $9.96 | $10.89 | $11.21 | $10.40 | $9.96 | $10.00 |
| Income From | | | | | | |
| Investment Operations | | | | | | |
| Net Investment | | | | | | |
| Income (Loss)(3) | (0.19) | (0.18) | 0.07 | 0.13 | 0.20 | 0.05 |
| Net Realized and | | | | | | |
| Unrealized Gain (Loss) | 0.16 | (0.75) | (0.18) | 0.68 | 0.29 | (0.09) |
| Total From | | | | | | |
| Investment Operations | (0.03) | (0.93) | (0.11) | 0.81 | 0.49 | (0.04) |
| Distributions | | | | | | |
| From Net | | | | | | |
| Investment Income | — | — | (0.21) | — | (0.05) | — |
| Net Asset Value, | | | | | | |
| End of Period | $9.93 | $9.96 | $10.89 | $11.21 | $10.40 | $9.96 |
| |
| Total Return(4) | (0.30)% | (8.54)% | (0.98)% | 7.79% | 4.93% | (0.40)% |
| | | | | | | |
| Ratios/Supplemental Data | | | | | | |
| Ratio of Operating | | | | | | |
| Expenses to | | | | | | |
| Average Net Assets | 3.34% | 3.59% | 3.14% | 2.96%(5) | 3.70% | 3.01%(5) |
| Ratio of Net Investment | | | | | | |
| Income (Loss) to | | | | | | |
| Average Net Assets | (1.93)% | (1.81)% | 0.65% | 2.36%(5) | 1.92% | 1.98%(5) |
| Portfolio Turnover Rate | 140% | 330% | 356% | 181% | 428% | 171% |
| Portfolio Turnover Rate | | | | | | |
| Excluding Short Sales | 35% | 151% | 137% | 38% | 50% | 36% |
| Net Assets, End of Period | | | | | | |
| (in thousands) | $72,781 | $104,634 | $145,265 | $110,065 | $56,219 | $498 |
| Ratio of Operating | | | | | | |
| Expenses (excluding | | | | | | |
| expenses on securities | | | | | | |
| sold short) to | | | | | | |
| Average Net Assets | 1.67% | 1.66% | 1.64% | 1.64%(5) | 1.63% | 1.62%(5) |
| (1) | January 1, 2007 through June 30, 2007. The fund’s fiscal year end was changed from December 31 to June 30, resulting in a six-month annual |
| | reporting period. For the years before June 30, 2007, the fund’s fiscal year end was December 31. | | |
| (2) | September 30, 2005 (fund inception) through December 31, 2005. | | | | |
| (3) | Computed using average shares outstanding throughout the period. | | | | |
| (4) | Total return assumes reinvestment of net investment income and capital gains distributions, if any, and does not reflect applicable sales charges. |
| | Total returns for periods less than one year are not annualized. Total returns are calculated based on the net asset value of the last business day. |
| | The total return of the classes may not precisely reflect the class expense differences because of the impact of calculating the net asset values |
| | to two decimal places. If net asset values were calculated to three decimal places, the total return differences would more closely reflect the |
| | class expense differences. The calculation of net asset values to two decimal places is made in accordance with SEC guidelines and does not |
| | result in any gain or loss of value between one class and another. | | | | |
| (5) | Annualized. | | | | | | |
See Notes to Financial Statements.
31
| | | | | | | |
| Long-Short Market Neutral | | | | |
| |
| B Class | | | | | | |
| For a Share Outstanding Throughout the Years Ended June 30 (except as noted) | | |
| | | 2010 | 2009 | 2008 | 2007(1) | 2006 | 2005(2) |
| Per-Share Data | | | | | | |
| Net Asset Value, | | | | | | |
| Beginning of Period | $9.76 | $10.76 | $11.11 | $10.35 | $9.94 | $10.00 |
| Income From | | | | | | |
| Investment Operations | | | | | | |
| Net Investment | | | | | | |
| Income (Loss)(3) | (0.26) | (0.26) | —(4) | 0.09 | 0.12 | 0.03 |
| Net Realized and | | | | | | |
| Unrealized Gain (Loss) | 0.16 | (0.74) | (0.18) | 0.67 | 0.29 | (0.09) |
| Total From | | | | | | |
| Investment Operations | (0.10) | (1.00) | (0.18) | 0.76 | 0.41 | (0.06) |
| Distributions | | | | | | |
| From Net | | | | | | |
| Investment Income | — | — | (0.17) | — | — | — |
| Net Asset Value, | | | | | | |
| End of Period | $9.66 | $9.76 | $10.76 | $11.11 | $10.35 | $9.94 |
| |
| Total Return(5) | (1.02)% | (9.29)% | (1.63)% | 7.34% | 4.12% | (0.60)% |
| | | | | | | |
| Ratios/Supplemental Data | | | | | | |
| Ratio of Operating | | | | | | |
| Expenses to | | | | | | |
| Average Net Assets | 4.09% | 4.34% | 3.89% | 3.71%(6) | 4.45% | 3.76%(6) |
| Ratio of Net Investment | | | | | | |
| Income (Loss) to | | | | | | |
| Average Net Assets | (2.68)% | (2.56)% | (0.10)% | 1.61%(6) | 1.17% | 1.23%(6) |
| Portfolio Turnover Rate | 140% | 330% | 356% | 181% | 428% | 171% |
| Portfolio Turnover Rate | | | | | | |
| Excluding Short Sales | 35% | 151% | 137% | 38% | 50% | 36% |
| Net Assets, End of Period | | | | | | |
| (in thousands) | $2,276 | $3,069 | $3,071 | $3,020 | $1,505 | $497 |
| Ratio of Operating | | | | | | |
| Expenses (excluding | | | | | | |
| expenses on securities | | | | | | |
| sold short) to | | | | | | |
| Average Net Assets | 2.42% | 2.41% | 2.39% | 2.39%(6) | 2.38% | 2.37%(6) |
| (1) | January 1, 2007 through June 30, 2007. The fund’s fiscal year end was changed from December 31 to June 30, resulting in a six-month annual |
| | reporting period. For the years before June 30, 2007, the fund’s fiscal year end was December 31. | | |
| (2) | September 30, 2005 (fund inception) through December 31, 2005. | | | | |
| (3) | Computed using average shares outstanding throughout the period. | | | | |
| (4) | Per-share amount was less than $0.005. | | | | | |
| (5) | Total return assumes reinvestment of net investment income and capital gains distributions, if any, and does not reflect applicable sales charges. |
| | Total returns for periods less than one year are not annualized. Total returns are calculated based on the net asset value of the last business day. |
| | The total return of the classes may not precisely reflect the class expense differences because of the impact of calculating the net asset values |
| | to two decimal places. If net asset values were calculated to three decimal places, the total return differences would more closely reflect the |
| | class expense differences. The calculation of net asset values to two decimal places is made in accordance with SEC guidelines and does not |
| | result in any gain or loss of value between one class and another. | | | | |
| (6) | Annualized. | | | | | | |
See Notes to Financial Statements.
32
| | | | | | | |
| Long-Short Market Neutral | | | | |
| |
| C Class | | | | | | |
| For a Share Outstanding Throughout the Years Ended June 30 (except as noted) | | |
| | | 2010 | 2009 | 2008 | 2007(1) | 2006 | 2005(2) |
| Per-Share Data | | | | | | |
| Net Asset Value, | | | | | | |
| Beginning of Period | $9.76 | $10.75 | $11.11 | $10.35 | $9.94 | $10.00 |
| Income From | | | | | | |
| Investment Operations | | | | | | |
| Net Investment | | | | | | |
| Income (Loss)(3) | (0.26) | (0.26) | —(4) | 0.09 | 0.12 | 0.03 |
| Net Realized and | | | | | | |
| Unrealized Gain (Loss) | 0.15 | (0.73) | (0.19) | 0.67 | 0.29 | (0.09) |
| Total From | | | | | | |
| Investment Operations | (0.11) | (0.99) | (0.19) | 0.76 | 0.41 | (0.06) |
| Distributions | | | | | | |
| From Net | | | | | | |
| Investment Income | — | — | (0.17) | — | — | — |
| Net Asset Value, | | | | | | |
| End of Period | $9.65 | $9.76 | $10.75 | $11.11 | $10.35 | $9.94 |
| |
| Total Return(5) | (1.13)% | (9.21)% | (1.72)% | 7.34% | 4.12% | (0.60)% |
| | | | | | | |
| Ratios/Supplemental Data | | | | | | |
| Ratio of Operating | | | | | | |
| Expenses to | | | | | | |
| Average Net Assets | 4.09% | 4.34% | 3.89% | 3.71%(6) | 4.45% | 3.76%(6) |
| Ratio of Net Investment | | | | | | |
| Income (Loss) to | | | | | | |
| Average Net Assets | (2.68)% | (2.56)% | (0.10)% | 1.61%(6) | 1.17% | 1.23%(6) |
| Portfolio Turnover Rate | 140% | 330% | 356% | 181% | 428% | 171% |
| Portfolio Turnover Rate | | | | | | |
| Excluding Short Sales | 35% | 151% | 137% | 38% | 50% | 36% |
| Net Assets, End of Period | | | | | | |
| (in thousands) | $10,543 | $17,821 | $20,673 | $19,690 | $8,393 | $497 |
| Ratio of Operating | | | | | | |
| Expenses (excluding | | | | | | |
| expenses on securities | | | | | | |
| sold short) to | | | | | | |
| Average Net Assets | 2.42% | 2.41% | 2.39% | 2.39%(6) | 2.38% | 2.37%(6) |
| (1) | January 1, 2007 through June 30, 2007. The fund’s fiscal year end was changed from December 31 to June 30, resulting in a six-month annual |
| | reporting period. For the years before June 30, 2007, the fund’s fiscal year end was December 31. | | |
| (2) | September 30, 2005 (fund inception) through December 31, 2005. | | | | |
| (3) | Computed using average shares outstanding throughout the period. | | | | |
| (4) | Per-share amount was less than $0.005. | | | | | |
| (5) | Total return assumes reinvestment of net investment income and capital gains distributions, if any, and does not reflect applicable sales charges. |
| | Total returns for periods less than one year are not annualized. Total returns are calculated based on the net asset value of the last business day. |
| | The total return of the classes may not precisely reflect the class expense differences because of the impact of calculating the net asset values |
| | to two decimal places. If net asset values were calculated to three decimal places, the total return differences would more closely reflect the |
| | class expense differences. The calculation of net asset values to two decimal places is made in accordance with SEC guidelines and does not |
| | result in any gain or loss of value between one class and another. | | | | |
| (6) | Annualized. | | | | | | |
See Notes to Financial Statements.
33
| | | | | | | |
| Long-Short Market Neutral | | | | |
| |
| R Class | | | | | | |
| For a Share Outstanding Throughout the Years Ended June 30 (except as noted) | | |
| | | 2010 | 2009 | 2008 | 2007(1) | 2006 | 2005(2) |
| Per-Share Data | | | | | | |
| Net Asset Value, | | | | | | |
| Beginning of Period | $9.89 | $10.85 | $11.18 | $10.39 | $9.96 | $10.00 |
| Income From | | | | | | |
| Investment Operations | | | | | | |
| Net Investment | | | | | | |
| Income (Loss)(3) | (0.21) | (0.22) | 0.04 | 0.11 | 0.17 | 0.04 |
| Net Realized and | | | | | | |
| Unrealized Gain (Loss) | 0.16 | (0.74) | (0.17) | 0.68 | 0.29 | (0.08) |
| Total From | | | | | | |
| Investment Operations | (0.05) | (0.96) | (0.13) | 0.79 | 0.46 | (0.04) |
| Distributions | | | | | | |
| From Net | | | | | | |
| Investment Income | — | — | (0.20) | — | (0.03) | — |
| Net Asset Value, | | | | | | |
| End of Period | $9.84 | $9.89 | $10.85 | $11.18 | $10.39 | $9.96 |
| |
| Total Return(4) | (0.51)% | (8.85)% | (1.19)% | 7.60% | 4.57% | (0.40)% |
| | | | | | | |
| Ratios/Supplemental Data | | | | | | |
| Ratio of Operating | | | | | | |
| Expenses to | | | | | | |
| Average Net Assets | 3.59% | 3.84% | 3.39% | 3.21%(5) | 3.95% | 3.26%(5) |
| Ratio of Net Investment | | | | | | |
| Income (Loss) to | | | | | | |
| Average Net Assets | (2.18)% | (2.06)% | 0.40% | 2.11%(5) | 1.67% | 1.73%(5) |
| Portfolio Turnover Rate | 140% | 330% | 356% | 181% | 428% | 171% |
| Portfolio Turnover Rate | | | | | | |
| Excluding Short Sales | 35% | 151% | 137% | 38% | 50% | 36% |
| Net Assets, End of Period | | | | | | |
| (in thousands) | $586 | $1,004 | $694 | $561 | $521 | $498 |
| Ratio of Operating | | | | | | |
| Expenses (excluding | | | | | | |
| expenses on securities | | | | | | |
| sold short) to | | | | | | |
| Average Net Assets | 1.92% | 1.91% | 1.89% | 1.89%(5) | 1.88% | 1.87%(5) |
| (1) | January 1, 2007 through June 30, 2007. The fund’s fiscal year end was changed from December 31 to June 30, resulting in a six-month annual |
| | reporting period. For the years before June 30, 2007, the fund’s fiscal year end was December 31. | | |
| (2) | September 30, 2005 (fund inception) through December 31, 2005. | | | | |
| (3) | Computed using average shares outstanding throughout the period. | | | | |
| (4) | Total return assumes reinvestment of net investment income and capital gains distributions, if any. Total returns for periods less than one year |
| | are not annualized. Total returns are calculated based on the net asset value of the last business day. The total return of the classes may not |
| | precisely reflect the class expense differences because of the impact of calculating the net asset values to two decimal places. If net asset |
| | values were calculated to three decimal places, the total return differences would more closely reflect the class expense differences. The |
| | calculation of net asset values to two decimal places is made in accordance with SEC guidelines and does not result in any gain or loss of value |
| | between one class and another. | | | | | | |
| (5) | Annualized. | | | | | | |
See Notes to Financial Statements.
34
|
| Report of Independent Registered Public Accounting Firm |
To the Directors of the American Century Quantitative Equity Funds, Inc.
and Shareholders of the Long-Short Market Neutral Fund:
In our opinion, the accompanying statement of assets and liabilities, including the schedule of investments, and the related statements of operations and of changes in net assets and the financial highlights present fairly, in all material respects, the financial position of the Long-Short Market Neutral Fund (one of the eleven funds comprising the American Century Quantitative Equity Funds, Inc., hereafter referred to as the “Fund”) at June 30, 2010, the results of its operations for the year then ended, the changes in its net assets for each of the two years in the period then ended and the financial highlights for each of the periods presented, in conformity with accounting principles generally accepted in the United States of America. These financial statements and financial highlights (hereafter referred to as “financial statements”) are the responsibility of the Fund’s management; ou r responsibility is to express an opinion on these financial statements based on our audits. We conducted our audits of these financial statements in accordance with the standards of the Public Company Accounting Oversight Board (United States). Those standards require that we plan and perform the audit to obtain reasonable assurance about whether the financial statements are free of material misstatement. An audit includes examining, on a test basis, evidence supporting the amounts and disclosures in the financial statements, assessing the accounting principles used and significant estimates made by management, and evaluating the overall financial statement presentation. We believe that our audits, which included confirmation of securities at June 30, 2010 by correspondence with the custodian and brokers, provide a reasonable basis for our opinion.
PricewaterhouseCoopers LLP
Kansas City, Missouri
August 19, 2010
35
A special meeting of shareholders was held on June 16, 2010, to vote on the following proposals. Each proposal received the required number of votes and was adopted. A summary of voting results is listed below each proposal.
Proposal 1:
To elect one Director to the Board of Directors of American Century Quantitative Equity Funds, Inc. (the proposal was voted on by all shareholders of funds issued by American Century Quantitative Equity Funds, Inc.):
| | |
| Frederick L.A. Grauer | For: | 4,067,909,978 |
| | Withhold: | 174,470,448 |
| | Abstain: | 0 |
| | Broker Non-Vote: | 0 |
The other directors whose term of office continued after the meeting include Jonathan S. Thomas, John Freidenrich, Ronald J. Gilson, Peter F. Pervere, Myron S. Scholes, and John B. Shoven.
Proposal 2:
To approve a management agreement between the fund and American Century Investment Management, Inc.:
| | |
| Investor, A, B, C and R Classes | For: | 46,761,371 |
| | Against: | 932,968 |
| | Abstain: | 2,059,316 |
| | Broker Non-Vote: | 18,970,074 |
| |
| Institutional Class | For: | 6,570,443 |
| | Against: | 113,986 |
| | Abstain: | 9,980 |
| | Broker Non-Vote: | 1,277,794 |
36
The Board of Directors
The individuals listed below serve as directors of the fund. Each director will continue to serve in this capacity until death, retirement, resignation or removal from office. The mandatory retirement age for directors who are not “interested persons,” as that term is defined in the Investment Company Act (independent directors), is 73. However, the mandatory retirement age may be extended for a period not to exceed two years with the approval of the remaining independent directors.
Mr. Thomas is the only director who is an “interested person” because he currently serves as President and Chief Executive Officer of American Century Companies, Inc. (ACC), the parent company of American Century Investment Management, Inc. (ACIM or the advisor).
The other directors (more than three-fourths of the total number) are independent; that is, they have never been employees, directors or officers of, and have no financial interest in, ACC or any of its wholly owned, direct or indirect, subsidiaries, including ACIM, American Century Investment Services, Inc. (ACIS) and American Century Services, LLC (ACS). The directors serve in this capacity for eight (in the case of Mr. Thomas, 15) registered investment companies in the American Century Investments family of funds.
The following presents additional information about the directors. The mailing address for each director other than Mr. Thomas is 1665 Charleston Road, Mountain View, California 94043. The mailing address for Mr. Thomas is 4500 Main Street, Kansas City, Missouri 64111.
Independent Directors
John Freidenrich
Year of Birth: 1937
Position(s) with the Fund: Director
Length of Time Served: Since 2005
Principal Occupation(s) During the Past Five Years: Founder, Member and Manager, Regis
Management Company, LLC (investment management firm) (April 2004 to present)
Number of Funds in Fund Complex Overseen by Director: 41
Other Directorships Held by Director During the Past Five Years: None
Education/Other Professional Experience: AB in Economics, Stanford University; LLB,
Stanford Law School; formerly, Partner and Founder, Ware and Freidenrich Law
Firm and Bay Partners; formerly, President, Board of Trustees, Stanford University
37
Ronald J. Gilson
Year of Birth: 1946
Position(s) with the Fund: Director and Chairman of the Board
Length of Time Served: Since 1995
Principal Occupation(s) During the Past Five Years: Charles J. Meyers Professor of Law and
Business, Stanford Law School (1979 to present); Marc and Eva Stern Professor of
Law and Business, Columbia University School of Law (1992 to present)
Number of Funds in Fund Complex Overseen by Director: 41
Other Directorships Held by Director During the Past Five Years: None
Education/Other Professional Experience: BA, Washington University; JD, Yale Law School;
formerly, Attorney, Steinhart, Goldberg, Feigenbaum & Ladar
Frederick L. A. Grauer
Year of Birth: 1946
Position(s) with the Fund: Director
Length of Time Served: Since 2008
Principal Occupation(s) During the Past Five Years: Senior Advisor, BlackRock, Inc. (investment
management firm) (2010 to present); Senior Advisor, Barclays Global Investors
(investment management firm) (2003 to 2009)
Number of Funds in Fund Complex Overseen by Director: 41
Other Directorships Held by Director During the Past Five Years: None
Education/Other Professional Experience: BA in Economics, University of British Columbia;
MA in Economics, University of Chicago; PhD in Business, Stanford University;
formerly, Executive Chairman, Barclays Global Investors; Chairman and Chief
Executive Officer, Wells Fargo Nikko Investment Advisors; and Vice President,
Merrill Lynch Capital Markets Group; formerly, Director, New York Stock Exchange,
Chicago Mercantile Exchange and Columbia University; formerly, Faculty Member,
Graduate School of Business, Columbia University and Alfred P. Sloan School of
Management, Massachusetts Institute of Technology
Peter F. Pervere
Year of Birth: 1947
Position(s) with the Fund: Director
Length of Time Served: Since 2007
Principal Occupation(s) During the Past Five Years: Retired
Number of Funds in Fund Complex Overseen by Director: 41
Other Directorships Held by Director During the Past Five Years: Intraware, Inc. (2003 to 2009);
Digital Impact, Inc. (2003 to 2005)
Education/Other Professional Experience: BA in History, Stanford University; CPA; formerly,
Vice President and Chief Financial Officer, Commerce One, Inc. (software and
services provider); formerly, Vice President and Corporate Controller, Sybase, Inc.;
formerly with accounting firm of Arthur Young & Co.
38
Myron S. Scholes
Year of Birth: 1941
Position(s) with the Fund: Director
Length of Time Served: Since 1980
Principal Occupation(s) During the Past Five Years: Chairman, Platinum Grove Asset
Management, L.P. (asset manager) (1999 to 2009); Frank E. Buck Professor of
Finance-Emeritus, Stanford Graduate School of Business (1996 to present)
Number of Funds in Fund Complex Overseen by Director: 41
Other Directorships Held by Director During the Past Five Years: Dimensional Fund Advisors
(investment advisor); CME Group, Inc. (futures and options exchange)
Education/Other Professional Experience: BA in Economics, McMaster University (Ontario);
MBA and PhD, University of Chicago; formerly, Senior Research Fellow at the
Hoover Institute; formerly, Edward Eagle Brown Professor of Finance, University of
Chicago; recipient of the Alfred Nobel Memorial Prize in Economic Sciences
John B. Shoven
Year of Birth: 1947
Position(s) with the Fund: Director
Length of Time Served: Since 2002
Principal Occupation(s) During the Past Five Years: Professor of Economics, Stanford University
(1973 to present)
Number of Funds in Fund Complex Overseen by Director: 41
Other Directorships Held by Director During the Past Five Years: Cadence Design Systems;
Exponent; Financial Engines; PalmSource, Inc. (2002 to 2005); Watson Wyatt
Worldwide (2002 to 2006)
Education/Other Professional Experience: BA in Physics, University of California; PhD in
Economics, Yale University; Director of the Stanford Institute for Economic Policy
Research (1999 to present); formerly, Chair of Economics and Dean of Humanities
and Sciences, Stanford University
Interested Director
Jonathan S. Thomas
Year of Birth: 1963
Position(s) with the Fund: Director and President
Length of Time Served: Since 2007
Principal Occupation(s) During the Past Five Years: President and Chief Executive Officer,
ACC (March 2007 to present); Chief Administrative Officer, ACC (February 2006 to
February 2007); Executive Vice President, ACC (November 2005 to February 2007);
Global Chief Operating Officer and Managing Director, Morgan Stanley (investment
management) (March 2000 to November 2005). Also serves as: Chief Executive
Officer and Manager, ACS; Executive Vice President, ACIM; Director, ACC, ACIM
and other ACC subsidiaries
Number of Funds in Fund Complex Overseen by Director: 104
Other Directorships Held by Director During the Past Five Years: None
Education/Other Professional Experience: BA in Economics, University of Massachusetts;
MBA, Boston College; formerly held senior leadership roles with Fidelity
Investments, Boston Financial Services and Bank of America; serves on the Board of
Governors of the Investment Company Institute
39
Officers
The following table presents certain information about the executive officers of the fund. Each officer serves as an officer for each of the 15 investment companies in the American Century family of funds, unless otherwise noted. No officer is compensated for his or her service as an officer of the fund. The listed officers are interested persons of the fund and are appointed or re-appointed on an annual basis. The mailing address for each of the officers listed below is 4500 Main Street, Kansas City, Missouri 64111.
| | |
| Name | Offices with | |
| (Year of Birth) | the Fund | Principal Occupation(s) During the Past Five Years |
| Jonathan S. | Director and | President and Chief Executive Officer, ACC (March 2007 to present); Chief |
| Thomas (1963) | President | Administrative Officer, ACC (February 2006 to February 2007); Executive Vice |
| | since 2007 | President, ACC (November 2005 to February 2007); Global Chief Operating |
| | | Officer and Managing Director, Morgan Stanley (March 2000 to November |
| | | 2005). Also serves as: Chief Executive Officer and Manager, ACS; Executive |
| | | Vice President, ACIM; Director, ACC, ACIM and other ACC subsidiaries |
| Barry Fink (1955) | Executive | Chief Operating Officer and Executive Vice President, ACC (September 2007 |
| | Vice President | to present); President, ACS (October 2007 to present); Managing Director, |
| | since 2007 | Morgan Stanley (2000 to 2007); Global General Counsel, Morgan Stanley |
| | | (2000 to 2006). Also serves as: Manager, ACS, and Director, ACC and |
| | | certain ACC subsidiaries |
| Maryanne L. | Chief Compliance | Chief Compliance Officer, American Century funds, ACIM and ACS (August |
| Roepke (1956) | Officer since 2006 | 2006 to present); Assistant Treasurer, ACC (January 1995 to August 2006); |
| | and Senior Vice | and Treasurer and Chief Financial Officer, various American Century funds |
| | President | (July 2000 to August 2006). Also serves as: Senior Vice President, ACS |
| | since 2000 | |
| Charles A. | General Counsel | Attorney, ACC (February 1994 to present); Vice President, ACC (November |
| Etherington | since 2007 and | 2005 to present); General Counsel, ACC (March 2007 to present); Also |
| (1957) | Senior Vice | serves as General Counsel, ACIM, ACS, ACIS and other ACC subsidiaries; |
| | President | and Senior Vice President, ACIM and ACS |
| | since 2006 | |
| Robert J. Leach | Vice President, | Vice President, ACS (February 2000 to present); and Controller, various |
| (1966) | Treasurer and | American Century funds (1997 to September 2006) |
| | Chief Financial | |
| | Officer since 2006 | |
| David H. Reinmiller | Vice President | Attorney, ACC (January 1994 to present); Associate General Counsel, ACC |
| (1963) | since 2001 | (January 2001 to present); Chief Compliance Officer, American Century |
| | | funds and ACIM (January 2001 to February 2005). Also serves as: Vice |
| | | President, ACIM and ACS |
| Ward D. Stauffer | Secretary | Attorney, ACC (June 2003 to Present) |
| (1960) | since 2005 | |
The SAI has additional information about the fund’s directors and is available without charge, upon request, by calling 1-800-345-2021.
40
|
| Board Approval of Management Agreements |
American Century Investment Management, Inc. (“ACIM” or the “Advisor”) currently serves as investment advisor to the Fund under a management agreement (the “Current Management Agreement”) that took effect on July 16, 2010, following approval by the Fund’s Board of Directors (the “Board”) and shareholders. The Advisor previously served as investment advisor to the Fund pursuant to a prior management agreement (the “Prior Management Agreement”) and an interim management agreement (the “Interim Management Agreeement”). The Interim Management Agreement terminated in accordance with its terms on July 16, 2010, upon the effectiveness of the Current Management Agreement. The Prior Management Agreement terminated on February 16, 2010, as a result of a change of control of the Advisor’s parent company, American Century Companies, Inc. (“ACC”). The change in control occurred as the result of a change in the trustee of a trust created by James E. Stowers, Jr., the founder of American Century Investments that holds shares representing a significant interest in ACC stock. Mr. Stowers previously served as the trustee of the trust. On February 16, 2010, Mr. Richard W. Brown, Co-Chairman of ACC with Mr. Stowers, became the trustee in accordance with the terms of the trust and Mr. Stowers’ long-standing estate and succession plan.
On February 18, 2010, the Board approved the Interim Management Agreement in accordance with Rule 15a-4 under the Investment Company Act to ensure continued management of the Fund by the Advisor after the termination of the Prior Management Agreement and until shareholder approval of the Current Management Agreement as required under the Act. The Board approved the Current Management Agreement and recommended its approval to shareholders. Fund shareholders approved the Current Management Agreement at a meeting held on June 16, 2010.
The Interim Management Agreement and the Current Management Agreement are substantially identical to the Prior Management Agreement except for their effective dates and the termination provisions of the Interim Management Agreement. Under the Interim and Current Management Agreements, the Advisor will provide the same services to the Fund and receive the same compensation rate as under the Prior Management Agreement.
Basis for Board Approval of Interim Management Agreement
In considering the approval of the Interim Management Agreement, Rule 15a-4 requires the Board to approve the contract within ten business days of the termination of the prior agreement and to determine that the compensation to be received under the interim agreement is no greater than would have been received under the prior agreement. In connection with the approval, the Board noted that it oversees on a continuous basis and evaluates at its quarterly meetings, directly and through the committees of the Board, the nature and quality of significant services provided by the Advisor, the investment performance of the Fund, shareholder services, audit and compliance functions and a variety of other matters relating to the Fund’s operations.
41
In evaluating the Interim Management Agreement, the Board, assisted by the advice of its independent legal counsel, considered a number of factors in addition to those required by the rule with no one factor being determinative to its analysis. Among the factors considered by the Board were the circumstances and effect of the change of control, the fact that the Advisor will provide the same services and receive the same compensation rate as under the Prior Management Agreement, and that the change of control did not result in a change of the personnel managing the Fund. Upon completion of its analysis, the Board approved the Interim Management Agreement, determining that the continued management of the Fund by the Advisor was in the best interests of the Fund and Fund shareholders.
Basis for Board Approval of Current Management Agreement
At a meeting held on April 1, 2010, after considering all information presented, the Board approved, and determined to recommend that shareholders approve, the Current Management Agreement. In connection with that approval, the Board requested and reviewed extensive data and information compiled by the Advisor and certain independent providers of evaluation data concerning the Fund and services provided to the Fund by the Advisor. The Board oversees on a continuous basis and evaluates at its quarterly meetings, directly and through the committees of the Board, the nature and quality of significant services provided by the Advisor, the investment performance of the Fund, shareholder services, audit and compliance functions and a variety of other matters relating to the Fund’s operations. The information considered and the discussions held at the meetings included, but were not limited to:
• the nature, extent and quality of investment management, shareholder services and other services provided to the Fund;
• the wide range of programs and services the Advisor provides to the Fund and its shareholders on a routine and non-routine basis;
• the compliance policies, procedures, and regulatory experience of the Advisor;
• data comparing the cost of owning the Fund to the cost of owning similar funds;
• the fact that there will be no changes to the fees, services, or personnel who provide such services as compared to the Prior Management Agreement;
• data comparing the Fund’s performance to appropriate benchmarks and/ or a peer group of other mutual funds with similar investment objectives and strategies;
• financial data showing the profitability of the Fund to the Advisor and the overall profitability of the Advisor;
• data comparing services provided and charges to the Fund with those for other non-fund investment management clients of the Advisor; and
42
• consideration of collateral or “fall-out” benefits derived by the Advisor from the management of the Fund and potential sharing of economies of scale in connection with the management of the Fund.
The Board also considered whether there was any reason for not continuing the existing arrangement with the Advisor. In particular, the Board recognized that shareholders may have invested in the Fund on the strength of the Advisor’s industry standing and reputation and in the expectation that the Advisor will have a continuing role in providing advisory services to the Fund.
The Board considered all of the information provided by the Advisor, the independent data providers, and the Board’s independent legal counsel, and evaluated such information for the Fund. The Board did not identify any single factor as being all-important or controlling, and each Board member may have attributed different levels of importance to different factors. In deciding to approve the Current Management Agreement under the terms ultimately determined by the Board to be appropriate, the Board based its decision on a number of factors, including the following:
Nature, Extent and Quality of Services — Generally. Under the Current Management Agreement, the Advisor is responsible for providing or arranging for all services necessary for the operation of the Fund. The Board noted that under the Current Management Agreement, the Advisor provides or arranges at its own expense a wide variety of services including:
• constructing and designing the Fund
• portfolio research and security selection
• initial capitalization/funding
• securities trading
• Fund administration
• custody of Fund assets
• daily valuation of the Fund’s portfolio
• shareholder servicing and transfer agency, including shareholder
confirmations, recordkeeping and communications
• legal services
• regulatory and portfolio compliance
• financial reporting
• marketing and distribution
43
The Board noted that many of these services have expanded over time both in terms of quantity and complexity in response to shareholder demands, competition in the industry, changing distribution channels and the changing regulatory environment.
Investment Management Services. The investment management services provided to the Fund are complex and provide Fund shareholders access to professional money management, instant diversification of their investments within an asset class, the opportunity to easily diversify among asset classes, and liquidity. As a part of its general oversight and in evaluating investment performance, the Board expects the Advisor to manage the Fund in accordance with its investment objectives and approved strategies. In providing these services, the Advisor utilizes teams of investment professionals who require extensive information technology, research, training, compliance and other systems to conduct their business. The Board, directly and through its Portfolio Committee, regularly reviews investment performance information for the Fund, t ogether with comparative information for appropriate benchmarks and/or peer groups of similarly-managed funds, over different time horizons. If performance concerns are identified, the underperforming Fund receives special reviews until performance improves, during which time the Board discusses with the Advisor the reasons for such underperformance and any efforts being undertaken to improve performance.
Shareholder and Other Services. Under the Current Management Agreement, the Advisor will also provide the Fund with a comprehensive package of transfer agency, shareholder, and other services. The Board, directly and through the various committees of the Board, regularly reviews reports and evaluations of such services. These reports include, but are not limited to, information regarding the operational efficiency and accuracy of the shareholder and transfer agency services provided, staffing levels, shareholder satisfaction (as measured by external as well as internal sources), technology support, new products and services offered to Fund shareholders, securities trading activities, portfolio valuation services, auditing services, and legal and operational compliance activities. Certain aspects of shareholder and transfer age ncy service level efficiency and the quality of securities trading activities are measured by independent third party providers and are presented in comparison to other fund groups not managed by the Advisor.
Costs of Services Provided and Profitability. The Advisor provided detailed information concerning its cost of providing various services to the Fund, its profitability in managing the Fund, its overall profitability, and its financial condition. The Board reviewed with the Advisor the methodology used to prepare this financial information. The Board has also reviewed with the Advisor its methodology for compensating the investment professionals that provide services to the Fund as well as compensation to the five highest paid personnel of the Advisor. This financial information regarding the Advisor is considered in order to evaluate the Advisor’s financial condition, its ability to continue to provide services under the Current Management Agreement, and the reasonableness of the current management fees.
44
Ethics. The Board generally considers the Advisor’s commitment to providing quality services to shareholders and to conducting its business ethically. It noted that the Advisor’s practices generally meet or exceed industry best practices.
Economies of Scale. The Board also reviewed information provided by the Advisor regarding the possible existence of economies of scale in connection with the management of the Fund. The Board concluded that economies of scale are difficult to measure and predict with precision, especially on a fund-by-fund basis. The analysis of economies of scale is further complicated by the additional services and content provided by the Advisor and its reinvestment in its ability to provide and expand those services. Accordingly, the Board seeks to evaluate economies of scale by reviewing information, such as year-over-year profitability of the Advisor generally, the profitability of its management of the Fund specifically, and the expenses incurred by the Advisor in providing various functions to the Fund. The Board believes the Advisor i s appropriately sharing economies of scale through its competitive fee structure, offering competitive fees from fund inception, fee breakpoints as the fund complex and the Fund increases in size, and through reinvestment in its business to provide shareholders additional services and enhancements to existing services. In particular, separate breakpoint schedules based on the size of the entire fund complex and on the size of the Fund reflect the complexity of assessing economies of scale.
Comparison to Fees of Funds not Managed by the Advisor. Both the Prior and Current Management Agreements provide that the Fund pays the Advisor a single, all-inclusive (or unified) management fee for providing all services necessary for the management and operation of the Fund, other than brokerage expenses, taxes, interest, extraordinary expenses, and the fees and expenses of the Fund’s Independent Directors (including their independent legal counsel) and expenses incurred in connection with the provision of shareholder services and distribution services under a plan adopted pursuant to Rule 12b-1 under the 1940 Act. Under the unified fee structure, the Advisor is responsible for providing all investment advisory, custody, audit, administrative, compliance, recordkeeping, marketing and shareholder services, or arranging and supervising third parties that provide such services. By contrast, most other funds are charged a variety of fees, including an investment advisory fee, a transfer agency fee, an administrative fee, distribution charges and other expenses. Other than their investment advisory fees and any applicable Rule 12b-1 distribution fees, the components of the total fees charged by these other funds may be increased without shareholder approval. The Board believes the unified fee structure is a benefit to Fund shareholders because it clearly discloses to shareholders the cost of owning Fund shares, and, since the unified fee cannot be increased without a vote of Fund shareholders, it shifts to the Advisor the risk of increased costs of operating the Fund and provides a direct incentive to minimize administrative inefficiencies. Part of the Board’s analysis of fee levels involves reviewing certain evaluative data compiled by an independent provider comparing the Fund’s unified fee to the total expense rat ios of similar funds not managed by the Advisor. The
45
Board concluded that the management fee to be paid by the Fund to the Advisor under the Current Management Agreement is reasonable in light of the services to be provided to the Fund.
Comparison to Fees and Services Provided to Other Clients of the Advisor. The Board also requested and received information from the Advisor concerning the nature and extent of the services, fees, and profitability of its advisory services to advisory clients other than the Fund. They observed that these varying types of client accounts require different services and involve different regulatory and entrepreneurial risks than the management of the Fund. The Board analyzed this information and concluded that the fees charged and services provided to the Fund were reasonable by comparison.
Collateral or “Fall-Out” Benefits Derived by the Advisor. The Board considered the existence of collateral benefits the Advisor may receive as a result of its relationship with the Fund. The Board concluded that the Advisor’s primary business is managing mutual funds and it generally does not use Fund or shareholder information to generate profits in other lines of business, and therefore does not derive any significant collateral benefits from them. The Board noted that the Advisor receives proprietary research from broker-dealers that execute Fund portfolio transactions and concluded that this research is likely to benefit Fund shareholders. The Board also determined that the Advisor is able to provide investment management services to certain clients other than the Fund, at least in part, due to its existing infrastructure built to serve the fund complex. The Board concluded, however, that the assets of those other clients are not material to the analysis and, in any event, are included with the assets of the Fund to determine breakpoints in the Fund’s fee schedule, provided they are managed using the same investment team and strategy.
Conclusion of the Board. As a result of this process, the Board, in the absence of particular circumstances and assisted by the advice of its independent legal counsel, taking into account all of the factors discussed above and the information provided by the Advisor and others, concluded that the Current Management Agreement be approved and recommended its approval to Fund shareholders.
46
Retirement Account Information
As required by law, distributions you receive from certain IRAs, or 403(b), 457 and qualified plans are subject to federal income tax withholding, unless you elect not to have withholding apply. Tax will be withheld on the total amount withdrawn even though you may be receiving amounts that are not subject to withholding, such as nondeductible contributions. In such case, excess amounts of withholding could occur. You may adjust your withholding election so that a greater or lesser amount will be withheld.
If you don’t want us to withhold on this amount, you must notify us to not withhold the federal income tax. You may notify us in writing or in certain situations by telephone or through other electronic means. You have the right to revoke your withholding election at any time and any election you make may remain in effect until revoked by filing a new election.
Remember, even if you elect not to have income tax withheld, you are liable for paying income tax on the taxable portion of your withdrawal. If you elect not to have income tax withheld or you don’t have enough income tax withheld, you may be responsible for payment of estimated tax. You may incur penalties under the estimated tax rules if your withholding and estimated tax payments are not sufficient. You can reduce or defer the income tax on a distribution by directly or indirectly rolling such distribution over to another IRA or eligible plan. You should consult your tax advisor for additional information.
State tax will be withheld if, at the time of your distribution, your address is within one of the mandatory withholding states and you have federal income tax withheld. State taxes will be withheld from your distribution in accordance with the respective state rules.
Proxy Voting Guidelines
American Century Investment Management, Inc., the fund’s investment advisor, is responsible for exercising the voting rights associated with the securities purchased and/or held by the fund. A description of the policies and procedures the advisor uses in fulfilling this responsibility is available without charge, upon request, by calling 1-800-345-2021. It is also available on American Century Investments’ website at americancentury.com and on the Securities and Exchange Commission’s website at sec.gov. Information regarding how the investment advisor voted proxies relating to portfolio securities during the most recent 12-month period ended June 30 is available on the “About Us” page at americancentury.com. It is also available at sec.gov.
Quarterly Portfolio Disclosure
The fund files its complete schedule of portfolio holdings with the Securities and Exchange Commission (SEC) for the first and third quarters of each fiscal year on Form N-Q. The fund’s Forms N-Q are available on the SEC’s website at sec.gov, and may be reviewed and copied at the SEC’s Public Reference Room in Washington, DC. Information on the operation of the Public Reference Room may be obtained by calling 1-800-SEC-0330. The fund also makes its complete schedule of portfolio holdings for the most recent quarter of its fiscal year available on its website at americancentury.com and, upon request, by calling 1-800-345-2021.
47
The following indices are used to illustrate investment market, sector, or style performance or to serve as fund performance comparisons. They are not investment products available for purchase.
The Barclays Capital U.S. 1–3 Month Treasury Bill Index is a component of the Short Treasury Index, which includes aged U.S. Treasury bills, notes and bonds and excludes zero coupon strips.
The Citigroup 3-Month Treasury Bill Index measures monthly return equivalents of yield averages that are not marked to market. This index is an average of the last three 3-month Treasury bill issues.
The Russell 1000® Index is a market-capitalization weighted, large-cap index created by Frank Russell Company to measure the performance of the 1,000 largest publicly traded U.S. companies, based on total market capitalization.
The Russell 1000® Growth Index measures the performance of those Russell 1000 Index companies (the 1,000 largest publicly traded U.S. companies, based on total market capitalization) with higher price-to-book ratios and higher forecasted growth values.
The Russell 1000® Value Index measures the performance of those Russell 1000 Index companies (the 1,000 largest publicly traded U.S. companies, based on total market capitalization) with lower price-to-book ratios and lower forecasted growth values.
The Russell 2000® Index is a market-capitalization weighted index created by Frank Russell Company to measure the performance of the 2,000 smallest of the 3,000 largest publicly traded U.S. companies, based on total market capitalization.
The Russell 2000® Growth Index measures the performance of those Russell 2000 Index companies (the 2,000 smallest of the 3,000 largest publicly traded U.S. companies, based on total market capitalization) with higher price-to-book ratios and higher forecasted growth values.
The Russell 2000® Value Index measures the performance of those Russell 2000 Index companies (the 2,000 smallest of the 3,000 largest publicly traded U.S. companies, based on total market capitalization) with lower price-to-book ratios and lower forecasted growth values.
The Russell Midcap® Index measures the performance of the 800 smallest of the 1,000 largest publicly traded U.S. companies, based on total market capitalization.
The Russell Midcap® Growth Index measures the performance of those Russell Midcap Index companies (the 800 smallest of the 1,000 largest publicly traded U.S. companies, based on total market capitalization) with higher price-to-book ratios and higher forecasted growth values.
48
The Russell Midcap® Value Index measures the performance of those Russell Midcap Index companies (the 800 smallest of the 1,000 largest publicly traded U.S. companies, based on total market capitalization) with lower price-to-book ratios and lower forecasted growth values.
The S&P 500 Index is a market value-weighted index of the stocks of 500 publicly traded U.S. companies chosen for market size, liquidity, and industry group representation that are considered to be leading firms in dominant industries. Each stock’s weight in the index is proportionate to its market value. Created by Standard & Poor’s, it is considered to be a broad measure of U.S. stock market performance.
49
50
51
52

| |
| |
| Contact Us | |
| americancentury.com | |
| Automated Information Line | 1-800-345-8765 |
| Investor Services Representative | 1-800-345-2021 or |
| | 816-531-5575 |
| Investors Using Advisors | 1-800-378-9878 |
| Business, Not-For-Profit, Employer-Sponsored | |
| Retirement Plans | 1-800-345-3533 |
| Banks and Trust Companies, Broker-Dealers, | |
| Financial Professionals, Insurance Companies | 1-800-345-6488 |
| Telecommunications Device for the Deaf | 1-800-634-4113 |
| American Century Quantitative Equity Funds, Inc. | |
| Investment Advisor: | |
| American Century Investment Management, Inc. | |
| Kansas City, Missouri | |
This report and the statements it contains are submitted for the general
information of our shareholders. The report is not authorized for distribution to
prospective investors unless preceded or accompanied by an effective prospectus.
American Century Investment Services, Inc., Distributor
©2010 American Century Proprietary Holdings, Inc. All rights reserved.
1008
CL-ANN-69047
|
| Annual Report |
| June 30, 2010 |

|
| American Century Investments® |
Global Gold Fund
| |
| President’s Letter | 2 |
| Market Perspective | 3 |
| 12-Month Returns | 3 |
| |
| Global Gold | |
| |
| Performance | 4 |
| Portfolio Commentary | 6 |
| Market Returns | 7 |
| Top Ten Holdings | 8 |
| Geographic Composition | 8 |
| Types of Investments in Portfolio | 8 |
| |
| Shareholder Fee Example | 9 |
| |
| Financial Statements | |
| |
| Schedule of Investments | 11 |
| Statement of Assets and Liabilities | 13 |
| Statement of Operations | 14 |
| Statement of Changes in Net Assets | 15 |
| Notes to Financial Statements | 16 |
| Financial Highlights | 23 |
| Report of Independent Registered Public Accounting Firm | 29 |
| |
| Other Information | |
| |
| Proxy Voting Results | 30 |
| Management | 31 |
| Board Approval of Management Agreements | 35 |
| Additional Information | 41 |
| Index Definitions | 42 |
Any opinions expressed in this report reflect those of the author as of the date of the report, and do not necessarily represent the opinions of American Century Investments or any other person in the American Century Investments organization. Any such opinions are subject to change at any time based upon market or other conditions and American Century Investments disclaims any responsibility to update such opinions. These opinions may not be relied upon as investment advice and, because investment decisions made by American Century Investments funds are based on numerous factors, may not be relied upon as an indication of trading intent on behalf of any American Century Investments fund. Security examples are used for representational purposes only and are not intended as recommendations to purchase or sell securities. Performance information for comparative indices and securities is provided to American Century Investments by third party vendors. To the best of American Century Investments’ knowledge, such information is accurate at the time of printing.

Dear Investor:
To learn more about the capital markets, your investment, and the portfolio management strategies American Century Investments provides, we encourage you to review this shareholder report for the financial reporting period ended June 30, 2010.
On the following pages, you will find investment performance and portfolio information, presented with the expert perspective and commentary of our portfolio management team. This report remains one of our most important vehicles for conveying the information you need about your investment performance, and about the market factors and strategies that affect fund returns. For additional information on the markets, we encourage you to visit the “Insights & News” tab at our Web site, americancentury.com, for updates and further expert commentary.
The top of our Web site’s home page also provides a link to “Our Story,” which, first and foremost, outlines our commitment—since 1958—to helping clients reach their financial goals. We believe strongly that we will only be successful when our clients are successful. That’s who we are.
Another important, unique facet of our story and who we are is “Profits with a Purpose,” which describes our bond with the Stowers Institute for Medical Research (SIMR). SIMR is a world-class biomedical organization—founded by our company founder James E. Stowers, Jr. and his wife Virginia—that is dedicated to researching the causes, treatment, and prevention of gene-based diseases, including cancer. Through American Century Investments’ private ownership structure, more than 40% of our profits support SIMR.
Mr. Stowers’ example of achieving financial success and using that platform to help humanity motivates our entire American Century Investments team. His story inspires us to help each of our clients achieve success. Thank you for sharing your financial journey with us.
Sincerely,

Jonathan Thomas
President and Chief Executive Officer
American Century Investments
2

By Scott Wittman, Chief Investment Officer, Quantitative Equity and Asset Allocation
Economic Recovery Proved Fragile
The coordinated, massive, and global response by central banks and national treasuries to curb the worldwide financial crisis led to modest economic gains during the 12-month period. As business spending data improved in the second half of 2009, optimism gathered momentum. Many investors assumed the global economy was pulling out of the recession, despite significant headwinds, including excessive debt levels, high unemployment, and a still-struggling housing market.
Those headwinds gathered strength late in the period, evaporating the earlier optimism and blowing in fears of a double-dip recession. Sovereign debt problems in Europe combined with ongoing labor-, housing- and consumer-related setbacks and a plunging global stock market sent nervous investors seeking “safe-haven” investments, including U.S. Treasury securities and gold.
Gold Prices Soared Even as Dollar Rallied
In an unusual trio of events, gold prices skyrocketed during the period, as inflation remained tame and the U.S. dollar rallied against the euro. Strong investor demand for gold caused the price of an ounce of gold (as measured by the London Gold PM Fix) to increase from $934.50 on June 30, 2009, to $1,244 on June 30, 2010, shy of the record high of $1,261 reached on June 28, 2010.
Growing concerns about the financial stability of sovereign debt in Greece, Spain, and other European nations sent the euro tumbling and helped spark a rally for the U.S. dollar. Against the euro, the dollar advanced 14.66% for the 12-month period, but compared with the yen, the greenback declined 8.23%.
Weak economic growth and falling commodity prices (other than gold) late in the period led to relatively tame inflation. For the 12 months ended June 30, 2010, headline inflation, as measured by the Consumer Price Index (CPI), was up 1.1%. Nevertheless, the extraordinary fiscal and monetary stimulus still working through the financial system eventually may lead to higher inflation and a weaker U.S. dollar than are currently reflected in the market. Ultimately, this scenario should help push gold prices higher.
| |
| 12-Month Returns | |
| As of June 30, 2010 | |
| London Gold PM Fix, in U.S. dollars | 33.12% |
| U.S. Dollar vs. Euro (Calculated on the basis of one euro per one U.S. dollar) | 14.66% |
| S&P Goldman Sachs Commodities Index (total returns) | -5.43% |
3
| | | | | | | |
| Global Gold | | | | | | |
| |
| Total Returns as of June 30, 2010 | | | | | |
| | | | | Average Annual Returns | |
| | | Ticker | | | | Since | Inception |
| | | Symbol | 1 year(1) | 5 years | 10 years | Inception | Date |
| Investor Class | BGEIX | 43.18% | 19.14% | 20.19% | 5.54% | 8/17/88 |
| NYSE Arca Gold | | | | | | |
| Miners Index(2) | — | 37.78% | 17.08% | N/A(3) | N/A(3) | — |
| MSCI World Index | — | 10.20% | 0.06% | -1.02% | 5.92%(4) | — |
| FT-SE® Gold | | | | | | |
| Mines Index | — | 32.14% | 17.25% | 16.72% | N/A(5) | — |
| Institutional Class | AGGNX | 43.51% | — | — | 8.10% | 9/28/07 |
| A Class(6) | ACGGX | | | | | 5/6/98 |
| No sales charge* | | 42.80% | 18.83% | 19.94% | 11.67% | |
| With sales charge* | | 34.62% | 17.44% | 19.23% | 11.13% | |
| B Class | AGYBX | | | | | 9/28/07 |
| No sales charge* | | 41.76% | — | — | 6.80% | |
| With sales charge* | | 37.76% | — | — | 5.83% | |
| C Class | AGYCX | 41.82% | — | — | 6.82% | 9/28/07 |
| R Class | AGGWX | 42.50% | — | — | 7.34% | 9/28/07 |
| *Sales charges include initial sales charges and contingent deferred sales charges (CDSCs), as applicable. A Class shares have a 5.75% |
| maximum initial sales charge for equity funds and may be subject to a maximum CDSC of 1.00%. B Class shares redeemed within |
| six years of purchase are subject to a CDSC that declines from 5.00% during the first year after purchase to 0.00% the sixth year |
| after purchase. C Class shares redeemed within 12 months of purchase are subject to a maximum CDSC of 1.00%. The SEC requires |
| that mutual funds provide performance information net of maximum sales charges in all cases where charges could be applied. |
| (1) | Extraordinary performance is attributable in part to unusually favorable market conditions and may not be repeated or consistently achieved in |
| | the future. | | | | | | |
| (2) | Returns do not reflect the reinvestment of dividends on securities in the index. Had such reinvestments been included, returns would have |
| | been higher. | | | | | | |
| (3) | Benchmark data first available 2/1/05. | | | | | |
| (4) | Since 8/31/88, the date nearest the Investor Class’s inception for which data are available. | | | |
| (5) | Benchmark data first available 9/22/98. | | | | | |
| (6) | Prior to September 4, 2007, the A Class was referred to as the Advisor Class and did not have a front-end sales charge. Performance prior to that |
| | date has been adjusted to reflect this charge. | | | | | |
Data presented reflect past performance. Past performance is no guarantee of future results. Current performance may be higher or lower than the performance shown. Investment return and principal value will fluctuate, and redemption value may be more or less than original cost. To obtain performance data current to the most recent month end, please call 1-800-345-2021 or visit americancentury.com. The fund concentrates its investments in a narrow segment of the total market and is therefore subject to greater risks and market fluctuations than a portfolio representing a broader range of industries. International investing involves special risks, such as political instability and currency fluctuations. Investing in emerging markets may accentuate these risks.
Unless otherwise indicated, performance reflects Investor Class shares; performance for other share classes will vary due to differences in fee structure. For information about other share classes available, please consult the prospectus. Data assumes reinvestment of dividends and capital gains, and none of the charts reflect the deduction of taxes that a shareholder would pay on fund distributions or the redemption of fund shares. Returns for the indices are provided for comparison. The fund’s total returns include operating expenses (such as transaction costs and management fees) that reduce returns, while the total returns of the indices do not.
4
Global Gold
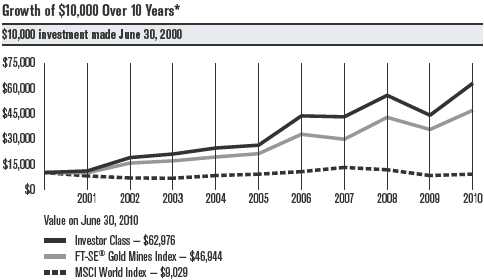
| | | | | |
| *Since NYSE Arca Gold Mines Index data is only available from 2/1/05, it is not included in the line chart. | | |
| |
| Total Annual Fund Operating Expenses | | | |
| | Institutional | | | | |
| Investor Class | Class | A Class | B Class | C Class | R Class |
| 0.70% | 0.50% | 0.95% | 1.70% | 1.70% | 1.20% |
The total annual fund operating expenses shown is as stated in the fund’s prospectus current as of the date of this report. The prospectus may vary from the expense ratio shown elsewhere in this report because it is based on a different time period, includes acquired fund fees and expenses, and, if applicable, does not include fee waivers or expense reimbursements.
Data presented reflect past performance. Past performance is no guarantee of future results. Current performance may be higher or lower than the performance shown. Investment return and principal value will fluctuate, and redemption value may be more or less than original cost. To obtain performance data current to the most recent month end, please call 1-800-345-2021 or visit americancentury.com. The fund concentrates its investments in a narrow segment of the total market and is therefore subject to greater risks and market fluctuations than a portfolio representing a broader range of industries. International investing involves special risks, such as political instability and currency fluctuations. Investing in emerging markets may accentuate t hese risks.
Unless otherwise indicated, performance reflects Investor Class shares; performance for other share classes will vary due to differences in fee structure. For information about other share classes available, please consult the prospectus. Data assumes reinvestment of dividends and capital gains, and none of the charts reflect the deduction of taxes that a shareholder would pay on fund distributions or the redemption of fund shares. Returns for the the indices are provided for comparison. The fund’s total returns include operating expenses (such as transaction costs and management fees) that reduce returns, while the total returns of the indices do not.
5
Global Gold
Portfolio Managers: Bill Martin and Joe Sterling
Performance Summary
Global Gold advanced 43.18%* for the 12 months ended June 30, 2010. The portfolio’s benchmark, the NYSE Arca Gold Miners Index, gained 37.78% for the same period. The portfolio’s return reflects operating expenses, while the benchmark’s return does not. Additionally, the benchmark’s return is not a “total return;” therefore, it does not reflect the reinvestment of dividends on securities in the index. If the benchmark’s return had included reinvested dividends, it would have been higher.
Gold rallied sharply throughout the 12-month period, as the precious metal assumed its “alternative currency” role by rising in all currencies. In the first half of the period, government spending aimed at reviving the U.S. economy led to U.S. dollar weakness. Investors looking to hedge against the weak U.S. dollar and potential rising inflation favored gold. (Usually, gold prices rise when the U.S. dollar falls, and vice versa.) Additionally, central banks, which for decades had been net sellers of gold, shifted their behavior and started purchasing small positions in 2009.
In early 2010, mounting sovereign debt concerns in Europe led to a weakening euro. The U.S. dollar gathered strength, but primarily in response to the euro’s troubles rather than any fundamental improvements in the greenback. Demand for gold remained robust, as investor concerns about the credit quality of sovereign debt and growing economic uncertainties prompted continued enthusiasm for “safe-haven” investments.
In this environment, overall stock performance remained strong, and gold-related stocks were among the stock market’s best performers. The portfolio’s outperformance relative to the benchmark primarily was due to our holdings among smaller-capitalization, non-benchmark companies.
Small-Cap Stocks Drove Results
Our strategy of generally underweighting the large-capitalization benchmark holdings and investing in small-capitalization, non-benchmark stocks was effective during the period. In particular, many of these smaller companies realized strong performance by aggressively growing their gold reserves.
Our position in Canada’s SEMAFO, Inc. was among the top contributors to performance. SEMAFO reported soaring profits driven by increased gold production and rising gold prices. Furthermore, late in the period, SEMAFO announced a 125% increase in reserves at its Mana Mine in Burkina Faso. Additionally, the company purchased a new mining fleet for its Niger mine, which boosted the company’s longer-term outlook. Our positions in Canada’s Red Back Mining, Inc. and Osisko Mining Corp. generated solid returns, with the companies reporting increases of 64% and 43%, respectively, in reserves during the first calendar quarter of 2010.
*All fund returns referenced in this commentary are for Investor Class shares.
6
Global Gold
Reserves Issues Hampered Larger Companies
In contrast, many of the larger companies represented in the benchmark lagged during the period, due to difficulties replacing their reserves. This was particularly true in South Africa, where reserve problems hindered Harmony Gold Mining Co., and our position in the company detracted from relative performance. In addition to its reserves problems, Harmony struggled with rising costs associated with bringing several of its mines into full operation at a time when the nation’s currency, the rand, was flat.
In addition, shares of South Africa-based AngloGold Ashanti Ltd. lagged due to low production from its South African mining operations. Our position in Gold Fields Ltd., another South Africa-based gold miner, suffered a similar fate.
Outlook
Looking ahead, we remain focused on gold mining companies that can continue to grow their reserve base while replacing production. One special situation we favor is the royalty business, where companies—such as Franco-Nevada Corp., Royal Gold, Inc. and Silver Wheaton Corp.—remain positioned to benefit from upside revenue growth either from rising gold prices or rising production. These companies offer a diversified portfolio with revenue streams tied to 35-40 assets. At the same time, these companies do not have the negative exposure associated with cost overruns or mine construction disappointments.
We will continue to invest in securities of companies engaged in the mining, processing, fabricating, or distributing of gold or other precious metals throughout the world. Regardless of macro developments, including the direction of gold prices and the strength of the U.S. dollar, we follow a disciplined investment approach. Shunning momentum-driven areas of the market, we strive to add value through tactical allocations in specific mining companies we believe are well-positioned to generate above-average returns.
| |
| Market Returns | |
| For the year ended June 30, 2010 | |
| Background Influences(1) | |
| U.S. Dollar vs. South African Rand | -0.56% |
| U.S. Dollar vs. Australian Dollar | -4.09% |
| Broad Gold Stock Market | |
| Lipper Precious Metals Fund Index | 45.31% |
| FT-SE® Gold Mines Index | 32.14% |
| Regional Components of FT-SE® Gold Mines Index | |
| FT-SE® Gold Mines Americas Index | 35.51% |
| FT-SE® Gold Mines Europe Middle East Africa Index | 25.14% |
| FT-SE® Gold Mines Asia Pacific Index | 23.87% |
| (1) All percentage changes in foreign exchange rates are calculated on the basis of that currency per 1 U.S. dollar. | |
7
| | |
| Global Gold | |
| |
| Top Ten Holdings | |
| | | % of net assets as of 6/30/10 |
| Barrick Gold Corp. | 13.6% |
| Goldcorp, Inc.(1) | 10.3% |
| Newmont Mining Corp. | 8.0% |
| Randgold Resources Ltd. | 5.2% |
| Silver Wheaton Corp. | 5.0% |
| Eldorado Gold Corp. | 4.7% |
| AngloGold Ashanti Ltd. | 4.2% |
| Compania de Minas Buenaventura SA | 4.1% |
| IAMGOLD Corp. | 3.4% |
| Lihir Gold Ltd. | 3.4% |
| (1) | Includes shares traded on all exchanges. | |
| |
| Geographic Composition | |
| | | % of net assets as of 6/30/10 |
| Canada | 65.0% |
| United States | 10.2% |
| South Africa | 8.3% |
| United Kingdom | 5.8% |
| Australia | 5.5% |
| Peru | 4.1% |
| Mexico | 0.8% |
| Sweden | —(2) |
| Cash and Equivalents(3) | 0.3% |
| (2) | Category is less than 0.05% of total net assets. | |
| (3) | Includes temporary cash investments and other assets and liabilities. | |
| |
| Types of Investments in Portfolio | |
| | | % of net assets as of 6/30/10 |
| Common Stocks & Warrants | 99.7% |
| Temporary Cash Investments | 0.3% |
| Other Assets and Liabilities | —(4) |
| (4) | Category is less than 0.05% of total net assets. | |
8
|
| Shareholder Fee Example (Unaudited) |
Fund shareholders may incur two types of costs: (1) transaction costs, including sales charges (loads) on purchase payments and redemption/ exchange fees; and (2) ongoing costs, including management fees; distribution and service (12b-1) fees; and other fund expenses. This example is intended to help you understand your ongoing costs (in dollars) of investing in your fund and to compare these costs with the ongoing cost of investing in other mutual funds.
The example is based on an investment of $1,000 made at the beginning of the period and held for the entire period from January 1, 2010 to June 30, 2010.
Actual Expenses
The table provides information about actual account values and actual expenses for each class. You may use the information, together with the amount you invested, to estimate the expenses that you paid over the period. First, identify the share class you own. Then simply divide your account value by $1,000 (for example, an $8,600 account value divided by $1,000 = 8.6), then multiply the result by the number under the heading “Expenses Paid During Period” to estimate the expenses you paid on your account during this period.
If you hold Investor Class shares of any American Century Investments fund, or Institutional Class shares of the American Century Diversified Bond Fund, in an American Century Investments account (i.e., not a financial intermediary or retirement plan account), American Century Investments may charge you a $12.50 semiannual account maintenance fee if the value of those shares is less than $10,000. We will redeem shares automatically in one of your accounts to pay the $12.50 fee. In determining your total eligible investment amount, we will include your investments in all personal accounts (including American Century Investments Brokerage accounts) registered under your Social Security number. Personal accounts include individual accounts, joint accounts, UGMA/UTMA accounts, personal trusts, Coverdell Education Savings Accounts and IRAs (including traditional, Roth, Rollover, SEP-, SARSEP- and SIMPLE-IRAs), and certain other retirement accounts. If you have only business, business retirement, employer-sponsored or American Century Investments Brokerage accounts, you are currently not subject to this fee. We will not charge the fee as long as you choose to manage your accounts exclusively online. If you are subject to the Account Maintenance Fee, your account value could be reduced by the fee amount.
Hypothetical Example for Comparison Purposes
The table also provides information about hypothetical account values and hypothetical expenses based on the actual expense ratio of each class of your fund and an assumed rate of return of 5% per year before expenses, which is not the actual return of a fund’s share class. The hypothetical account values and expenses may not be used to estimate the actual ending account balance or expenses you paid for the period. You may use this information to compare the ongoing costs of investing in your fund and other funds. To do so, compare this 5% hypothetical example with the 5% hypothetical examples that appear in the shareholder reports of the other funds.
9
Please note that the expenses shown in the table are meant to highlight your ongoing costs only and do not reflect any transactional costs, such as sales charges (loads) or redemption/exchange fees. Therefore, the table is useful in comparing ongoing costs only, and will not help you determine the relative total costs of owning different funds. In addition, if these transactional costs were included, your costs would have been higher.
| | | | |
| | Beginning | Ending | Expenses Paid | |
| | Account Value | Account Value | During Period* | Annualized |
| | 1/1/10 | 6/30/10 | 1/1/10 – 6/30/10 | Expense Ratio* |
| Actual | | | | |
| Investor Class | $1,000 | $1,140.70 | $3.66 | 0.69% |
| Institutional Class | $1,000 | $1,141.70 | $2.60 | 0.49% |
| A Class | $1,000 | $1,139.00 | $4.99 | 0.94% |
| B Class | $1,000 | $1,134.90 | $8.95 | 1.69% |
| C Class | $1,000 | $1,134.90 | $8.95 | 1.69% |
| R Class | $1,000 | $1,137.80 | $6.31 | 1.19% |
| Hypothetical | | | | |
| Investor Class | $1,000 | $1,021.37 | $3.46 | 0.69% |
| Institutional Class | $1,000 | $1,022.36 | $2.46 | 0.49% |
| A Class | $1,000 | $1,020.13 | $4.71 | 0.94% |
| B Class | $1,000 | $1,016.41 | $8.45 | 1.69% |
| C Class | $1,000 | $1,016.41 | $8.45 | 1.69% |
| R Class | $1,000 | $1,018.89 | $5.96 | 1.19% |
| *Expenses are equal to the class’s annualized expense ratio listed in the table above, multiplied by the average account value over the period, |
| multiplied by 181, the number of days in the most recent fiscal half-year, divided by 365, to reflect the one-half year period. |
10
| | | | | | |
| Global Gold | | | | | | |
| |
| JUNE 30, 2010 | | | | | | |
| | Shares | Value | | | Shares | Value |
| Common Stocks & Warrants — 99.7% | | MAG Silver Corp.(1) | 245,500 | $ 1,515,133 |
| AUSTRALIA — 5.5% | | | | Minefinders Corp. Ltd.(1) | 360,000 | 3,209,243 |
| Andean Resources Ltd.(1) | 3,420,300 | $ 9,895,753 | | Nevsun Resources Ltd.(1) | 1,200,000 | 4,170,776 |
| Centamin Egypt Ltd.(1) | 3,440,300 | 8,370,088 | | New Gold, Inc.(1) | 2,477,500 | 15,383,284 |
| CGA Mining Ltd.(1) | 2,379,741 | 4,470,886 | | Northgate Minerals Corp.(1) | 1,395,400 | 4,220,739 |
| Lihir Gold Ltd. | 9,975,997 | 36,016,594 | | Osisko Mining Corp.(1) | 1,329,200 | 14,333,959 |
| Sirius Resources NL(1) | 166,666 | 962 | | Pan American Silver Corp. | 464,900 | 11,752,672 |
| | | 58,754,283 | | Red Back Mining, Inc.(1) | 441,600 | 11,162,891 |
| CANADA — 65.0% | | | | San Gold Corp.(1) | 906,900 | 3,876,187 |
| Agnico-Eagle Mines Ltd. | 129,444 | 7,852,608 | | Seabridge Gold, Inc.(1) | 107,400 | 3,324,030 |
| Agnico-Eagle Mines Ltd. | | | | SEMAFO, Inc.(1) | 2,013,800 | 15,228,115 |
| New York Shares | 420,500 | 25,557,990 | | Silver Standard | | |
| Alamos Gold, Inc. | 519,400 | 7,967,500 | | Resources, Inc.(1) | 353,400 | 6,308,190 |
| Anatolia Minerals | | | | Silver Wheaton Corp.(1) | 2,680,400 | 53,876,040 |
| Development Ltd.(1) | 1,773,600 | 9,329,914 | | Torex Gold Resources, Inc.(1) | 10,286,190 | 10,821,974 |
| Aurizon Mines Ltd.(1) | 887,400 | 4,368,020 | | Torex Gold Resources, Inc. | | |
| Barrick Gold Corp. | 3,205,812 | 145,575,923 | | Warrants(1) | 1,321,547 | 310,354 |
| Centerra Gold, Inc.(1) | 236,600 | 2,604,812 | | Ventana Gold Corp.(1) | 700,200 | 5,229,055 |
| Clifton Star | | | | Wesdome Gold Mines Ltd. | 1,554,400 | 3,431,347 |
| Resources, Inc.(1) | 329,700 | 1,229,542 | | Yamana Gold, Inc. | 2,859,542 | 29,332,769 |
| Comaplex Minerals Corp.(1) | 615,400 | 6,358,931 | | Yamana Gold, Inc. | | |
| Detour Gold Corp.(1) | 480,401 | 10,672,569 | | New York Shares | 424,781 | 4,375,244 |
| East Asia Minerals Corp.(1) | 527,700 | 3,083,269 | | | | 698,169,690 |
| Eldorado Gold Corp. | 2,809,400 | 50,353,062 | | MEXICO — 0.8% | | |
| Exeter Resource Corp.(1) | 178,300 | 1,123,290 | | Fresnillo plc | 632,303 | 9,134,986 |
| Franco-Nevada Corp. | 513,800 | 15,637,706 | | PERU — 4.1% | | |
| Gammon Gold, Inc.(1) | 371,000 | 2,028,294 | | Compania de Minas | | |
| | | | | Buenaventura SA ADR | 1,142,600 | 43,921,544 |
| GBS Gold | | | | | | |
| International, Inc.(1) | 347,300 | 1,631 | | SOUTH AFRICA — 8.3% | | |
| Goldcorp, Inc. | 2,441,876 | 106,914,509 | | AngloGold Ashanti Ltd. | 493,102 | 21,313,392 |
| Goldcorp, Inc. | | | | AngloGold Ashanti Ltd. ADR | 545,076 | 23,536,382 |
| New York Shares | 78,900 | 3,459,765 | | Gold Fields Ltd. | 2,206,010 | 29,705,156 |
| Golden Star | | | | Harmony Gold | | |
| Resources Ltd.(1) | 1,116,500 | 4,929,360 | | Mining Co. Ltd. | 1,352,550 | 14,323,687 |
| Golden Star Resources Ltd. | | | | | | 88,878,617 |
| New York Shares(1) | 525,000 | 2,299,500 | | SWEDEN(2) | | |
| Great Basin Gold Ltd.(1) | 1,173,200 | 1,994,732 | | ScanMining AB(1) | 325,900 | — |
| Greystar Resources Ltd.(1) | 597,200 | 2,709,573 | | UNITED KINGDOM — 5.8% | | |
| IAMGOLD Corp. | 2,063,719 | 36,387,211 | | African Barrick Gold Ltd.(1) | 650,000 | 6,115,882 |
| Ivanhoe Mines Ltd.(1) | 579,600 | 7,508,040 | | Randgold Resources Ltd. | | |
| Jaguar Mining, Inc.(1) | 166,700 | 1,479,794 | | ADR | 588,300 | 55,741,425 |
| Kinross Gold Corp. | 1,615,306 | 27,615,959 | | | | 61,857,307 |
| Kinross Gold Corp. | | | | UNITED STATES — 10.2% | | |
| New York Shares | 308,457 | 5,271,530 | | Coeur d’Alene Mines Corp.(1) | 98,259 | 1,550,527 |
| Lake Shore Gold Corp.(1) | 662,900 | 1,992,654 | | Hecla Mining Co.(1) | 149,100 | 778,302 |
11
| | | | | |
| Global Gold | | | | | |
| |
| | Shares | Value | | Notes to Schedule of Investments |
| Newmont Mining Corp. | 1,393,714 | $ 86,047,902 | | ADR = American Depositary Receipt |
| Royal Gold, Inc. | 449,021 | 21,553,008 | | (1) | Non-income producing. |
| | | 109,929,739 | | (2) | Category is less than 0.05% of total net assets. |
| TOTAL COMMON STOCKS | | | | | |
| & WARRANTS | | | | Geographic classifications are unaudited. |
| (Cost $420,436,082) | | 1,070,646,166 | | | |
| Temporary Cash Investments — 0.3% | | | |
| JPMorgan U.S. Treasury | | | | See Notes to Financial Statements. |
| Plus Money Market Fund | | | | | |
| Agency Shares | 91,089 | 91,089 | | | |
| Repurchase Agreement, Bank of America | | | | |
| Securities, LLC, (collateralized by various | | | | |
| U.S. Treasury obligations, 1.125%, 6/30/11, | | | | |
| valued at $3,875,748), in a joint trading | | | | |
| account at 0.01%, dated 6/30/10, due | | | | |
| 7/1/10 (Delivery value $3,800,001) | | 3,800,000 | | | |
| TOTAL TEMPORARY | | | | | |
| CASH INVESTMENTS | | | | | |
| (Cost $3,891,089) | | 3,891,089 | | | |
| TOTAL INVESTMENT | | | | | |
| SECURITIES — 100.0% | | | | | |
| (Cost $424,327,171) | | 1,074,537,255 | | | |
| OTHER ASSETS AND LIABILITIES(2) | (508,878) | | | |
| TOTAL NET ASSETS — 100.0% | | $1,074,028,377 | | | |
12
|
| Statement of Assets and Liabilities |
| |
| JUNE 30, 2010 | |
| Assets | |
| Investment securities, at value (cost of $424,327,171) | $1,074,537,255 |
| Foreign currency holdings, at value (cost of $167,676) | 165,624 |
| Receivable for investments sold | 5,334,839 |
| Receivable for capital shares sold | 710,388 |
| Dividends and interest receivable | 82,289 |
| | 1,080,830,395 |
| | |
| Liabilities | |
| Disbursements in excess of demand deposit cash | 159,070 |
| Payable for investments purchased | 5,163,813 |
| Payable for capital shares redeemed | 864,546 |
| Accrued management fees | 606,690 |
| Service fees (and distribution fees — A Class and R Class) payable | 5,491 |
| Distribution fees payable | 2,408 |
| | 6,802,018 |
| | |
| Net Assets | $1,074,028,377 |
| | |
| Net Assets Consist of: | |
| Capital (par value and paid-in surplus) | $ 438,156,226 |
| Accumulated net investment loss | (4,148,509) |
| Accumulated net realized loss on investment and foreign currency transactions | (10,187,372) |
| Net unrealized appreciation on investments and translation of assets and liabilities in foreign currencies | 650,208,032 |
| | $1,074,028,377 |
| | | |
| | Net assets | Shares outstanding | Net asset value per share |
| Investor Class, $0.01 Par Value | $1,032,308,969 | 44,668,288 | $23.11 |
| Institutional Class, $0.01 Par Value | $15,751,398 | 681,056 | $23.13 |
| A Class, $0.01 Par Value | $20,879,038 | 909,660 | $22.95* |
| B Class, $0.01 Par Value | $1,654,281 | 72,849 | $22.71 |
| C Class, $0.01 Par Value | $2,317,790 | 102,022 | $22.72 |
| R Class, $0.01 Par Value | $1,116,901 | 48,639 | $22.96 |
| *Maximum offering price $24.35 (net asset value divided by 0.9425) | | |
| |
| |
| See Notes to Financial Statements. | | | |
13
| |
| YEAR ENDED JUNE 30, 2010 | |
| Investment Income (Loss) | |
| Income: | |
| Dividends (net of foreign taxes withheld of $412,218) | $ 5,178,777 |
| Interest | 5,723 |
| | 5,184,500 |
| | |
| Expenses: | |
| Management fees | 6,655,755 |
| Distribution fees: | |
| B Class | 10,771 |
| C Class | 13,011 |
| Service fees: | |
| B Class | 3,590 |
| C Class | 4,337 |
| Distribution and service fees: | |
| A Class | 43,677 |
| R Class | 3,307 |
| Directors’ fees and expenses | 28,100 |
| Other expenses | 18,926 |
| | 6,781,474 |
| | |
| Net investment income (loss) | (1,596,974) |
| | |
| Realized and Unrealized Gain (Loss) | |
| Net realized gain (loss) on: | |
| Investment transactions | 107,399,868 |
| Foreign currency transactions | 14,215,916 |
| | 121,615,784 |
| | |
| Change in net unrealized appreciation (depreciation) on: | |
| Investments | 220,353,465 |
| Translation of assets and liabilities in foreign currencies | (45,908) |
| | 220,307,557 |
| | |
| Net realized and unrealized gain (loss) | 341,923,341 |
| | |
| Net Increase (Decrease) in Net Assets Resulting from Operations | $340,326,367 |
| |
| |
| See Notes to Financial Statements. | |
14
|
| Statement of Changes in Net Assets |
| | |
| YEARS ENDED JUNE 30, 2010 AND JUNE 30, 2009 | | |
| Increase (Decrease) in Net Assets | 2010 | 2009 |
| Operations | | |
| Net investment income (loss) | $ (1,596,974) | $ (703,270) |
| Net realized gain (loss) | 121,615,784 | (99,819,961) |
| Change in net unrealized appreciation (depreciation) | 220,307,557 | (160,542,226) |
| Net increase (decrease) in net assets resulting from operations | 340,326,367 | (261,065,457) |
| | | |
| Distributions to Shareholders | | |
| From net investment income: | | |
| Investor Class | (5,817,616) | (46,658) |
| Institutional Class | (102,540) | (17,375) |
| A Class | (65,994) | — |
| R Class | (625) | — |
| From net realized gains: | | |
| Investor Class | — | (87,357,840) |
| Institutional Class | — | (949,464) |
| A Class | — | (1,115,065) |
| B Class | — | (8,055) |
| C Class | — | (52,311) |
| R Class | — | (7,776) |
| Decrease in net assets from distributions | (5,986,775) | (89,554,544) |
| | | |
| Capital Share Transactions | | |
| Net increase (decrease) in net assets from capital share transactions | (81,449,142) | 15,485,709 |
| | | |
| Redemption Fees | | |
| Increase in net assets from redemption fees | 153,362 | 216,838 |
| | | |
| Net increase (decrease) in net assets | 253,043,812 | (334,917,454) |
| | | |
| Net Assets | | |
| Beginning of period | 820,984,565 | 1,155,902,019 |
| End of period | $1,074,028,377 | $ 820,984,565 |
| | | |
| Accumulated net investment loss | $(4,148,509) | $(11,700,112) |
| |
| |
| See Notes to Financial Statements. | | |
15
|
| Notes to Financial Statements |
JUNE 30, 2010
1. Organization and Summary of Significant Accounting Policies
Organization — American Century Quantitative Equity Funds, Inc. (the corporation) is registered under the Investment Company Act of 1940 (the 1940 Act) as an open-end management investment company. Global Gold Fund (the fund) is one fund in a series issued by the corporation. The fund is nondiversified under the 1940 Act. The fund’s investment objective is to seek to realize a total return (capital growth and dividends) consistent with investment in securities of companies that are engaged in mining, processing, fabricating or distributing gold or other metals throughout the world. The fund invests primarily in equity securities. The following is a summary of the fund’s significant accounting policies.
Multiple Class — The fund is authorized to issue the Investor Class, the Institutional Class, the A Class, the B Class, the C Class and the R Class. The A Class may incur an initial sales charge. The A Class, B Class and C Class may be subject to a contingent deferred sales charge. The share classes differ principally in their respective sales charges and distribution and shareholder servicing expenses and arrangements. All shares of the fund represent an equal pro rata interest in the net assets of the class to which such shares belong, and have identical voting, dividend, liquidation and other rights and the same terms and conditions, except for class specific expenses and exclusive rights to vote on matters affecting only individual classes. Income, non-class specific expenses, and realized and unrealized capital gains and losses of the fund are allocated to each class of shares based on their relative net assets.
Security Valuations — Securities traded primarily on a principal securities exchange are valued at the last reported sales price, or at the mean of the latest bid and asked prices where no last sales price is available. Depending on local convention or regulation, securities traded over-the-counter are valued at the mean of the latest bid and asked prices, the last sales price, or the official close price. Investments in open-end management investment companies are valued at the reported net asset value. Discount notes may be valued through a commercial pricing service or at amortized cost, which approximates fair value. Securities traded on foreign securities exchanges and over-the-counter markets are normally completed before the close of business on days that the New York Stock Exchange (the Exchange) is open and may also take place on days when the Exchange is not open. If an event occurs after the value of a security was established but before the net asset value per share was determined that was likely to materially change the net asset value, that security would be valued as determined in accordance with procedures adopted by the Board of Directors. If the fund determines that the market price of a portfolio security is not readily available, or that the valuation methods mentioned above do not reflect the security’s fair value, such security is valued as determined by the Board of Directors or its designee, in accordance with procedures adopted by the Board of Directors, if such determination would materially impact a fund’s net asset value. Certain other circumstances may cause the fund to use alternative procedures to value a security such as: a security has been declared in default; trading in a security has been halted during the trading day; or there is a foreign market holiday and no trading will commence .
Security Transactions — For financial reporting purposes, security transactions are accounted for as of the trade date. Net realized gains and losses are determined on the identified cost basis, which is also used for federal income tax purposes.
Investment Income — Dividend income less foreign taxes withheld, if any, is recorded as of the ex-dividend date. Interest income is recorded on the accrual basis and includes accretion of discounts and amortization of premiums.
16
Foreign Currency Translations — All assets and liabilities initially expressed in foreign currencies are translated into U.S. dollars at prevailing exchange rates at period end. The fund may enter into spot foreign currency exchange contracts to facilitate transactions denominated in a foreign currency. Purchases and sales of investment securities, dividend and interest income, spot foreign currency exchange contracts, and certain expenses are translated at the rates of exchange prevailing on the respective dates of such transactions. Realized and unrealized gains and losses from foreign currency translations arise from changes in currency exchange rates.
Net realized and unrealized foreign currency exchange gains or losses occurring during the holding period of investment securities are a component of net realized gain (loss) on foreign currency transactions and net unrealized appreciation (depreciation) on translation of assets and liabilities in foreign currencies, respectively. Certain countries may impose taxes on the contract amount of purchases and sales of foreign currency contracts in their currency. The fund records the foreign tax expense, if any, as a reduction to the net realized gain (loss) on foreign currency transactions.
Repurchase Agreements — The fund may enter into repurchase agreements with institutions that American Century Investment Management, Inc. (ACIM) (the investment advisor) has determined are creditworthy pursuant to criteria adopted by the Board of Directors. Each repurchase agreement is recorded at cost. The fund requires that the collateral, represented by securities, received in a repurchase transaction be transferred to the custodian in a manner sufficient to enable the fund to obtain those securities in the event of a default under the repurchase agreement. ACIM monitors, on a daily basis, the securities transferred to ensure the value, including accrued interest, of the securities under each repurchase agreement is equal to or greater than amounts owed to the fund under each repurchase agreement.
Joint Trading Account — Pursuant to an Exemptive Order issued by the Securities and Exchange Commission, the fund, along with certain other funds in the American Century Investments family of funds, may transfer uninvested cash balances into a joint trading account. These balances are invested in one or more repurchase agreements that are collateralized by U.S. Treasury or Agency obligations.
Income Tax Status — It is the fund’s policy to distribute substantially all net investment income and net realized gains to shareholders and to otherwise qualify as a regulated investment company under provisions of the Internal Revenue Code. The fund is no longer subject to examination by tax authorities for years prior to 2006. At this time, management believes there are no uncertain tax positions which, based on their technical merit, would not be sustained upon examination and for which it is reasonably possible that the total amounts of unrecognized tax benefits will significantly change in the next twelve months. Accordingly, no provision has been made for federal or state income taxes.
Distributions to Shareholders — Distributions to shareholders are recorded on the ex-dividend date. Distributions from net investment income, if any, are declared and paid semiannually. Distributions from net realized gains, if any, are generally declared and paid annually.
Redemption — The fund may impose a 1.00% redemption fee on shares held less than 60 days. The fee may not be applicable to all classes. The redemption fee is retained by the fund and helps cover transaction costs that long-term investors may bear when the fund sells securities to meet investor redemptions.
Indemnifications — Under the corporation’s organizational documents, its officers and directors are indemnified against certain liabilities arising out of the performance of their duties to the fund. In addition, in the normal course of business, the fund enters into contracts that provide general indemnifications. The maximum exposure under these arrangements is unknown as this would involve future claims that may be made against a fund. The risk of material loss from such claims is considered by management to be remote.
17
Use of Estimates — The financial statements are prepared in conformity with accounting principles generally accepted in the United States of America, which may require management to make certain estimates and assumptions at the date of the financial statements. Actual results could differ from these estimates.
Subsequent Events — In preparing the financial statements, management evaluated the impact of events or transactions occurring through the date the financial statements were issued that would merit recognition or disclosure.
2. Fees and Transactions with Related Parties
Management Fees — The corporation has entered into a Management Agreement with ACIM, under which ACIM provides the fund with investment advisory and management services in exchange for a single, unified management fee (the fee) per class. The Agreement provides that all expenses of managing and operating the fund, except brokerage expenses, taxes, interest, fees and expenses of the independent directors (including legal counsel fees), and extraordinary expenses, will be paid by ACIM. The fee is computed and accrued daily based on the daily net assets of the specific class of shares of the fund and paid monthly in arrears. The fee consists of (1) an Investment Category Fee based on the daily net assets of the fund and certain other accounts managed by the investment advisor that are in the same broad investment category as the fund and (2) a Complex Fee based on the assets of all the funds in the American Century Investments family of funds. The rates for the Investment Category Fee range from 0.3380% to 0.5200%. The rates for the Complex Fee range from 0.2500% to 0.3100% for the Investor Class, A Class, B Class, C Class and R Class. The Institutional Class is 0.2000% less at each point within the Complex Fee range. The effective annual management fee for each class for the year ended June 30, 2010 was 0.69% for the Investor Class, A Class, B Class, C Class and R Class and 0.49% for the Institutional Class.
Distribution and Service Fees — The Board of Directors has adopted a separate Master Distribution and Individual Shareholder Services Plan for each of the A Class, B Class, C Class and R Class (collectively the plans), pursuant to Rule 12b-1 of the 1940 Act. The plans provide that the A Class will pay American Century Investment Services, Inc. (ACIS) an annual distribution and service fee of 0.25%. The plans provide that the B Class and the C Class will each pay ACIS an annual distribution fee of 0.75% and service fee of 0.25%. The plans provide that the R Class will pay ACIS an annual distribution and service fee of 0.50%. The fees are computed and accrued daily based on each class’s daily net assets and paid monthly in arrears. The fees are used to pay financial intermediaries for distribution and individual shareh older services. Fees incurred under the plans during the year ended June 30, 2010, are detailed in the Statement of Operations.
Related Parties — Certain officers and directors of the corporation are also officers and/or directors of American Century Companies, Inc. (ACC), the parent of the corporation’s investment advisor, ACIM, the distributor of the corporation, ACIS, and the corporation’s transfer agent, American Century Services, LLC.
The fund is eligible to invest in a money market fund for temporary purposes, which is managed by J.P. Morgan Investment Management, Inc. (JPMIM). The fund has a Mutual Funds Services Agreement with J.P. Morgan Investor Services Co. (JPMIS) and a securities lending agreement with JPMorgan Chase Bank (JPMCB). JPMCB is a custodian of the fund. JPMIM, JPMIS and JPMCB are wholly owned subsidiaries of JPMorgan Chase & Co. (JPM). JPM is an equity investor in ACC.
3. Investment Transactions
Purchases and sales of investment securities, excluding short-term investments, for the year ended June 30, 2010, were $229,739,830 and $314,674,467, respectively.
18
| | | | |
| 4. Capital Share Transactions | | | | |
| |
| Transactions in shares of the fund were as follows: | | |
| | Year ended June 30, 2010 | Year ended June 30, 2009 |
| | Shares | Amount | Shares | Amount |
| Investor Class/Shares Authorized | 200,000,000 | | 200,000,000 | |
| Sold | 7,567,069 | $ 154,310,795 | 11,247,965 | $ 170,093,349 |
| Issued in reinvestment of distributions | 268,781 | 5,445,498 | 6,035,699 | 82,207,513 |
| Redeemed | (11,990,931) | (243,553,721) | (16,748,609) | (249,396,470) |
| | (4,155,081) | (83,797,428) | 535,055 | 2,904,392 |
| Institutional Class/Shares Authorized | 10,000,000 | | 10,000,000 | |
| Sold | 306,887 | 6,186,758 | 350,512 | 5,232,382 |
| Issued in reinvestment of distributions | 5,061 | 102,540 | 70,847 | 966,839 |
| Redeemed | (189,413) | (3,778,037) | (302,414) | (4,644,348) |
| | 122,535 | 2,511,261 | 118,945 | 1,554,873 |
| A Class/Shares Authorized | 20,000,000 | | 20,000,000 | |
| Sold | 618,293 | 12,476,471 | 1,129,242 | 15,886,305 |
| Issued in reinvestment of distributions | 2,704 | 54,488 | 69,762 | 944,580 |
| Redeemed | (757,121) | (14,337,028) | (515,828) | (7,667,307) |
| | (136,124) | (1,806,069) | 683,176 | 9,163,578 |
| B Class/Shares Authorized | 10,000,000 | | 10,000,000 | |
| Sold | 21,272 | 366,451 | 67,759 | 1,039,513 |
| Issued in reinvestment of distributions | — | — | 432 | 5,829 |
| Redeemed | (5,176) | (104,738) | (16,699) | (255,945) |
| | 16,096 | 261,713 | 51,492 | 789,397 |
| C Class/Shares Authorized | 10,000,000 | | 10,000,000 | |
| Sold | 62,106 | 1,246,949 | 84,609 | 1,251,358 |
| Issued in reinvestment of distributions | — | — | 2,486 | 33,590 |
| Redeemed | (22,862) | (453,638) | (30,749) | (482,244) |
| | 39,244 | 793,311 | 56,346 | 802,704 |
| R Class/Shares Authorized | 10,000,000 | | 10,000,000 | |
| Sold | 45,887 | 892,013 | 19,043 | 283,180 |
| Issued in reinvestment of distributions | 31 | 625 | 573 | 7,776 |
| Redeemed | (16,681) | (304,568) | (1,371) | (20,191) |
| | 29,237 | 588,070 | 18,245 | 270,765 |
| Net increase (decrease) | (4,084,093) | $ (81,449,142) | 1,463,259 | $ 15,485,709 |
19
5. Fair Value Measurements
The fund’s securities valuation process is based on several considerations and may use multiple inputs to determine the fair value of the positions held by the fund. In conformity with accounting principles generally accepted in the United States of America, the inputs used to determine a valuation are classified into three broad levels as follows:
• Level 1 valuation inputs consist of unadjusted quoted prices in an active market for identical securities;
• Level 2 valuation inputs consist of significant direct or indirect observable market data (including quoted prices for similar securities, evaluations of subsequent market events, interest rates, prepayment speeds, credit risk, etc.); or
• Level 3 valuation inputs consist of significant unobservable inputs (including a fund’s own assumptions).
The level classification is based on the lowest level input that is significant to the fair valuation measurement. The valuation inputs are not an indication of the risks associated with investing in these securities or other financial instruments.
The following is a summary of the valuation inputs used to determine the fair value of the fund’s securities as of June 30, 2010. The Schedule of Investments provides additional details on the fund’s portfolio holdings.
| | | |
| | Level 1 | Level 2 | Level 3 |
| Investment Securities | | | |
| Foreign Common Stocks & Warrants | $386,123,525 | $574,592,902 | — |
| Domestic Common Stocks | 109,929,739 | — | — |
| Temporary Cash Investments | 91,089 | 3,800,000 | — |
| Total Value of Investment Securities | $496,144,353 | $578,392,902 | — |
6. Interfund Lending
The fund, along with certain other funds in the American Century Investments family of funds, may participate in an interfund lending program, pursuant to an Exemptive Order issued by the Securities and Exchange Commission (SEC). This program provides an alternative credit facility allowing the fund to borrow from or lend to other funds in the American Century Investments family of funds that permit such transactions. Interfund lending transactions are subject to each fund’s investment policies and borrowing and lending limits. The interfund loan rate earned/paid on interfund lending transactions is determined daily based on the average of certain current market rates. Interfund lending transactions normally extend only overnight, but can have a maximum duration of seven days. The program is subject to annual approval by the Board of Directors. During the year ended June 30, 2010, the fund did not utilize the program.
7. Risk Factors
There are certain risks involved in investing in foreign securities. These risks include those resulting from future adverse political, social, and economic developments, fluctuations in currency exchange rates, the possible imposition of exchange controls, and other foreign laws or restrictions. Investing in emerging markets may accentuate these risks.
The fund concentrates its investments in a narrow segment of the total market. Because of this, the fund may be subject to greater risk and market fluctuations than a portfolio representing a broader range of industries.
20
8. Federal Tax Information
The tax character of distributions paid during the years ended June 30, 2010 and June 30, 2009 were as follows:
| | |
| | 2010 | 2009 |
| Distributions Paid From | | |
| Ordinary income | $5,986,775 | $68,427 |
| Long-term capital gains | — | $89,486,117 |
The book-basis character of distributions made during the year from net investment income or net realized gains may differ from their ultimate characterization for federal income tax purposes. These differences reflect the differing character of certain income items and net realized gains and losses for financial statement and tax purposes, and may result in reclassification among certain capital accounts on the financial statements.
As of June 30, 2010, the federal tax cost of investments and the components of distributable earnings on a tax-basis were as follows:
| | |
| Federal tax cost of investments | $467,709,661 |
| Gross tax appreciation of investments | $613,378,557 |
| Gross tax depreciation of investments | (6,550,963) |
| Net tax appreciation (depreciation) of investments | $606,827,594 |
| Net tax appreciation (depreciation) on derivatives and translation of assets | |
| and liabilities in foreign currencies | $ (2,052) |
| Net tax appreciation (depreciation) | $606,825,542 |
| Undistributed ordinary income | $28,202,071 |
| Accumulated long-term gains | $844,538 |
The difference between book-basis and tax-basis cost and unrealized appreciation (depreciation) is attributable primarily to the tax deferral of losses on wash sales and the realization to ordinary income for tax purposes of unrealized gains on investments in passive foreign investment companies.
21
9. Corporate Event
As part of a long-standing estate and business succession plan established by ACC Co-Chairman James E. Stowers, Jr., the founder of American Century Investments, ACC Co-Chairman Richard W. Brown succeeded Mr. Stowers as trustee of a trust that holds a greater-than-25% voting interest in ACC, the parent corporation of the fund’s advisor. Under the 1940 Act, this is presumed to represent control of ACC even though it is less than a majority interest. The change of trustee may technically be considered a “change of control” of ACC and therefore also a change of control of the fund’s advisor even though there has been no change to its management and none is anticipated. The “change of control” resulted in the assignment of the fund’s investment advisory agreement. Under the 1940 Act, an assignment automatically terminated such agreement, making the approval of a new agreement necessa ry.
On February 18, 2010, the Board of Directors approved an interim investment advisory agreement under which the fund will be managed until a new agreement is approved by fund shareholders. On April 1, 2010, the Board of Directors approved a new investment advisory agreement. The interim agreement and the new agreement are substantially identical to the terminated agreements (with the exception of different effective and termination dates) and will not result in changes in the management of American Century Investments, the fund, its investment objectives, fees or services provided. The new agreement for the fund was approved by shareholders at a Special Meeting of Shareholders on June 16, 2010. The new agreement went into effect on July 16, 2010.
10. Other Tax Information (Unaudited)
The following information is provided pursuant to provisions of the Internal Revenue Code.
The fund hereby designates up to the maximum amount allowable as qualified dividend income for the fiscal year ended June 30, 2010.
For corporate taxpayers, the fund hereby designates $508,357, or up to the maximum amount allowable, of ordinary income distributions paid during the fiscal year ended June 30, 2010 as qualified for the corporate dividends received deduction.
As of June 30, 2010, the fund intends to pass through to shareholders $412,218, or up to the maximum amount allowable, as a foreign tax credit, which represents taxes paid on income derived from sources within foreign countries or possessions of the United States. During the fiscal year ended June 30, 2010, the fund earned $4,908,103 from income derived from foreign sources. Foreign source income and foreign tax expense per outstanding share on June 30, 2010 are $0.1056 and $0.0089, respectively.
22
| | | | | | | |
| Global Gold | | | | | | |
| |
| Investor Class | | | | | | |
| For a Share Outstanding Throughout the Years Ended June 30 (except as noted) | | |
| | | 2010 | 2009 | 2008 | 2007(1) | 2006 | 2005 |
| Per-Share Data | | | | | | |
| Net Asset Value, | | | | | | |
| Beginning of Period | $16.24 | $23.54 | $18.26 | $19.63 | $15.50 | $12.00 |
| Income From | | | | | | |
| Investment Operations | | | | | | |
| Net Investment | | | | | | |
| Income (Loss)(2) | (0.03) | (0.01) | (0.04) | (0.01) | (0.01) | 0.01 |
| Net Realized and | | | | | | |
| Unrealized Gain (Loss) | 7.03 | (5.35) | 5.42 | (1.24) | 4.18 | 3.49 |
| Total From | | | | | | |
| Investment Operations | 7.00 | (5.36) | 5.38 | (1.25) | 4.17 | 3.50 |
| Distributions | | | | | | |
| From Net | | | | | | |
| Investment Income | (0.13) | —(3) | (0.11) | (0.12) | (0.05) | — |
| From Net | | | | | | |
| Realized Gains | — | (1.94) | — | — | — | — |
| Total Distributions | (0.13) | (1.94) | (0.11) | (0.12) | (0.05) | — |
| Redemption Fees(2) | —(3) | —(3) | 0.01 | —(3) | 0.01 | —(3) |
| Net Asset Value, | | | | | | |
| End of Period | $23.11 | $16.24 | $23.54 | $18.26 | $19.63 | $15.50 |
| |
| Total Return(4) | 43.18% | (21.19)% | 29.61% | (6.36)% | 27.03% | 29.17% |
| | | | | | | |
| Ratios/Supplemental Data | | | | | | |
| Ratio of Operating | | | | | | |
| Expenses to | | | | | | |
| Average Net Assets | 0.69% | 0.70% | 0.68% | 0.67%(5) | 0.67% | 0.67% |
| Ratio of Net Investment | | | | | | |
| Income (Loss) to | | | | | | |
| Average Net Assets | (0.16)% | (0.09)% | (0.17)% | (0.12)%(5) | (0.03)% | 0.11% |
| Portfolio Turnover Rate | 24% | 20% | 17% | 3% | 18% | 5% |
| Net Assets, End of Period | | | | | | |
| (in thousands) | $1,032,309 | $792,814 | $1,136,741 | $949,426 | $1,071,545 | $775,971 |
| (1) | January 1, 2007 through June 30, 2007. The fund’s fiscal year end was changed from December 31 to June 30, resulting in a six-month annual |
| | reporting period. For the years before June 30, 2007, the fund’s fiscal year end was December 31. | | |
| (2) | Computed using average shares outstanding throughout the period. | | | | |
| (3) | Per-share amount was less than $0.005. | | | | | |
| (4) | Total return assumes reinvestment of net investment income and capital gains distributions, if any. Total returns for periods less than one year |
| | are not annualized. Total returns are calculated based on the net asset value of the last business day. The total return of the classes may not |
| | precisely reflect the class expense differences because of the impact of calculating the net asset values to two decimal places. If net asset |
| | values were calculated to three decimal places, the total return differences would more closely reflect the class expense differences. The |
| | calculation of net asset values to two decimal places is made in accordance with SEC guidelines and does not result in any gain or loss of value |
| | between one class and another. | | | | | |
| (5) | Annualized. | | | | | | |
See Notes to Financial Statements.
23
| | | | |
| Global Gold | | | |
| |
| Institutional Class | | | |
| For a Share Outstanding Throughout the Years Ended June 30 (except as noted) | | |
| | | 2010 | 2009 | 2008(1) |
| Per-Share Data | | | |
| Net Asset Value, Beginning of Period | $16.25 | $23.55 | $21.67 |
| Income From Investment Operations | | | |
| Net Investment Income (Loss)(2) | 0.01 | 0.01 | 0.01 |
| Net Realized and Unrealized Gain (Loss) | 7.04 | (5.34) | 1.99 |
| Total From Investment Operations | 7.05 | (5.33) | 2.00 |
| Distributions | | | |
| From Net Investment Income | (0.17) | (0.03) | (0.13) |
| From Net Realized Gains | — | (1.94) | — |
| Total Distributions | (0.17) | (1.97) | (0.13) |
| Redemption Fees(2) | —(3) | —(3) | 0.01 |
| Net Asset Value, End of Period | $23.13 | $16.25 | $23.55 |
| |
| Total Return(4) | 43.51% | (21.04)% | 9.37% |
| | | | |
| Ratios/Supplemental Data | | | |
| Ratio of Operating Expenses to Average Net Assets | 0.49% | 0.50% | 0.48%(5) |
| Ratio of Net Investment Income (Loss) to Average Net Assets | 0.04% | 0.11% | 0.05%(5) |
| Portfolio Turnover Rate | 24% | 20% | 17%(6) |
| Net Assets, End of Period (in thousands) | $15,751 | $9,076 | $10,353 |
| (1) | September 28, 2007 (commencement of sale) through June 30, 2008. | | | |
| (2) | Computed using average shares outstanding throughout the period. | | | |
| (3) | Per-share amount was less than $0.005. | | | |
| (4) | Total return assumes reinvestment of net investment income and capital gains distributions, if any. Total returns for periods less than one year |
| | are not annualized. Total returns are calculated based on the net asset value of the last business day. The total return of the classes may not |
| | precisely reflect the class expense differences because of the impact of calculating the net asset values to two decimal places. If net asset |
| | values were calculated to three decimal places, the total return differences would more closely reflect the class expense differences. The |
| | calculation of net asset values to two decimal places is made in accordance with SEC guidelines and does not result in any gain or loss of value |
| | between one class and another. | | | |
| (5) | Annualized. | | | |
| (6) | Portfolio turnover is calculated at the fund level. Percentage indicated was calculated for the year ended June 30, 2008. | |
See Notes to Financial Statements.
24
| | | | | | | |
| Global Gold | | | | | | |
| |
| A Class(1) | | | | | | |
| For a Share Outstanding Throughout the Years Ended June 30 (except as noted) | | |
| | | 2010 | 2009 | 2008 | 2007(2) | 2006 | 2005 |
| Per-Share Data | | | | | | |
| Net Asset Value, | | | | | | |
| Beginning of Period | $16.13 | $23.46 | $18.22 | $19.59 | $15.46 | $12.00 |
| Income From | | | | | | |
| Investment Operations | | | | | | |
| Net Investment | | | | | | |
| Income (Loss)(3) | (0.08) | (0.06) | (0.09) | (0.04) | (0.05) | (0.02) |
| Net Realized and | | | | | | |
| Unrealized Gain (Loss) | 6.97 | (5.33) | 5.40 | (1.23) | 4.18 | 3.48 |
| Total From | | | | | | |
| Investment Operations | 6.89 | (5.39) | 5.31 | (1.27) | 4.13 | 3.46 |
| Distributions | | | | | | |
| From Net | | | | | | |
| Investment Income | (0.07) | — | (0.08) | (0.10) | (0.01) | — |
| From Net | | | | | | |
| Realized Gains | — | (1.94) | — | — | — | — |
| Total Distributions | (0.07) | (1.94) | (0.08) | (0.10) | (0.01) | — |
| Redemption Fees(3) | —(4) | —(4) | 0.01 | —(4) | 0.01 | —(4) |
| Net Asset Value, | | | | | | |
| End of Period | $22.95 | $16.13 | $23.46 | $18.22 | $19.59 | $15.46 |
| |
| Total Return(5) | 42.80% | (21.40)% | 29.28% | (6.48)% | 26.77% | 28.94% |
| | | | | | | |
| Ratios/Supplemental Data | | | | | | |
| Ratio of Operating | | | | | | |
| Expenses to | | | | | | |
| Average Net Assets | 0.94% | 0.95% | 0.93% | 0.92%(6) | 0.92% | 0.92% |
| Ratio of Net Investment | | | | | | |
| Income (Loss) to | | | | | | |
| Average Net Assets | (0.41)% | (0.34)% | (0.42)% | (0.37)%(6) | (0.28)% | (0.14)% |
| Portfolio Turnover Rate | 24% | 20% | 17% | 3% | 18% | 5% |
| Net Assets, End of Period | | | | | | |
| (in thousands) | $20,879 | $16,866 | $8,506 | $5,442 | $6,206 | $5,311 |
| (1) | Prior to September 4, 2007, the A Class was referred to as the Advisor Class. | | | |
| (2) | January 1, 2007 through June 30, 2007. The fund’s fiscal year end was changed from December 31 to June 30, resulting in a six-month annual |
| | reporting period. For the years before June 30, 2007, the fund’s fiscal year end was December 31. | | |
| (3) | Computed using average shares outstanding throughout the period. | | | | |
| (4) | Per-share amount was less than $0.005. | | | | | |
| (5) | Total return assumes reinvestment of net investment income and capital gains distributions, if any, and does not reflect applicable sales charges. |
| | Total returns for periods less than one year are not annualized. Total returns are calculated based on the net asset value of the last business day. |
| | The total return of the classes may not precisely reflect the class expense differences because of the impact of calculating the net asset values |
| | to two decimal places. If net asset values were calculated to three decimal places, the total return differences would more closely reflect the |
| | class expense differences. The calculation of net asset values to two decimal places is made in accordance with SEC guidelines and does not |
| | result in any gain or loss of value between one class and another. | | | | |
| (6) | Annualized. | | | | | | |
See Notes to Financial Statements.
25
| | | | |
| Global Gold | | | |
| |
| B Class | | | |
| For a Share Outstanding Throughout the Years Ended June 30 (except as noted) | | |
| | | 2010 | 2009 | 2008(1) |
| Per-Share Data | | | |
| Net Asset Value, Beginning of Period | $16.02 | $23.48 | $21.67 |
| Income From Investment Operations | | | |
| Net Investment Income (Loss)(2) | (0.23) | (0.18) | (0.20) |
| Net Realized and Unrealized Gain (Loss) | 6.92 | (5.34) | 2.00 |
| Total From Investment Operations | 6.69 | (5.52) | 1.80 |
| Distributions | | | |
| From Net Realized Gains | — | (1.94) | — |
| Redemption Fees(2) | —(3) | —(3) | 0.01 |
| Net Asset Value, End of Period | $22.71 | $16.02 | $23.48 |
| |
| Total Return(4) | 41.76% | (21.98)% | 8.40% |
| | | | |
| Ratios/Supplemental Data | | | |
| Ratio of Operating Expenses to Average Net Assets | 1.69% | 1.70% | 1.68%(5) |
| Ratio of Net Investment Income (Loss) to Average Net Assets | (1.16)% | (1.09)% | (1.16)%(5) |
| Portfolio Turnover Rate | 24% | 20% | 17%(6) |
| Net Assets, End of Period (in thousands) | $1,654 | $909 | $124 |
| (1) | September 28, 2007 (commencement of sale) through June 30, 2008. | | | |
| (2) | Computed using average shares outstanding throughout the period. | | | |
| (3) | Per-share amount was less than $0.005. | | | |
| (4) | Total return assumes reinvestment of net investment income and capital gains distributions, if any, and does not reflect applicable sales charges. |
| | Total returns for periods less than one year are not annualized. Total returns are calculated based on the net asset value of the last business day. |
| | The total return of the classes may not precisely reflect the class expense differences because of the impact of calculating the net asset values |
| | to two decimal places. If net asset values were calculated to three decimal places, the total return differences would more closely reflect the |
| | class expense differences. The calculation of net asset values to two decimal places is made in accordance with SEC guidelines and does not |
| | result in any gain or loss of value between one class and another. | | | |
| (5) | Annualized. | | | |
| (6) | Portfolio turnover is calculated at the fund level. Percentage indicated was calculated for the year ended June 30, 2008. | |
See Notes to Financial Statements.
26
| | | | |
| Global Gold | | | |
| |
| C Class | | | |
| For a Share Outstanding Throughout the Years Ended June 30 (except as noted) | | |
| | | 2010 | 2009 | 2008(1) |
| Per-Share Data | | | |
| Net Asset Value, Beginning of Period | $16.02 | $23.48 | $21.67 |
| Income From Investment Operations | | | |
| Net Investment Income (Loss)(2) | (0.23) | (0.18) | (0.20) |
| Net Realized and Unrealized Gain (Loss) | 6.93 | (5.34) | 2.00 |
| Total From Investment Operations | 6.70 | (5.52) | 1.80 |
| Distributions | | | |
| From Net Realized Gains | — | (1.94) | — |
| Redemption Fees(2) | —(3) | —(3) | 0.01 |
| Net Asset Value, End of Period | $22.72 | $16.02 | $23.48 |
| |
| Total Return(4) | 41.82% | (21.98)% | 8.40% |
| | | | |
| Ratios/Supplemental Data | | | |
| Ratio of Operating Expenses to Average Net Assets | 1.69% | 1.70% | 1.68%(5) |
| Ratio of Net Investment Income (Loss) to Average Net Assets | (1.16)% | (1.09)% | (1.17)%(5) |
| Portfolio Turnover Rate | 24% | 20% | 17%(6) |
| Net Assets, End of Period (in thousands) | $2,318 | $1,006 | $151 |
| (1) | September 28, 2007 (commencement of sale) through June 30, 2008. | | | |
| (2) | Computed using average shares outstanding throughout the period. | | | |
| (3) | Per-share amount was less than $0.005. | | | |
| (4) | Total return assumes reinvestment of net investment income and capital gains distributions, if any, and does not reflect applicable sales charges. |
| | Total returns for periods less than one year are not annualized. Total returns are calculated based on the net asset value of the last business day. |
| | The total return of the classes may not precisely reflect the class expense differences because of the impact of calculating the net asset values |
| | to two decimal places. If net asset values were calculated to three decimal places, the total return differences would more closely reflect the |
| | class expense differences. The calculation of net asset values to two decimal places is made in accordance with SEC guidelines and does not |
| | result in any gain or loss of value between one class and another. | | | |
| (5) | Annualized. | | | |
| (6) | Portfolio turnover is calculated at the fund level. Percentage indicated was calculated for the year ended June 30, 2008. | |
See Notes to Financial Statements.
27
| | | | |
| Global Gold | | | |
| |
| R Class | | | |
| For a Share Outstanding Throughout the Years Ended June 30 (except as noted) | | |
| | | 2010 | 2009 | 2008(1) |
| Per-Share Data | | | |
| Net Asset Value, Beginning of Period | $16.13 | $23.52 | $21.67 |
| Income From Investment Operations | | | |
| Net Investment Income (Loss)(2) | (0.13) | (0.11) | (0.12) |
| Net Realized and Unrealized Gain (Loss) | 6.98 | (5.34) | 2.01 |
| Total From Investment Operations | 6.85 | (5.45) | 1.89 |
| Distributions | | | |
| From Net Investment Income | (0.02) | — | (0.05) |
| From Net Realized Gains | — | (1.94) | — |
| Total Distributions | (0.02) | (1.94) | (0.05) |
| Redemption Fees(2) | —(3) | —(3) | 0.01 |
| Net Asset Value, End of Period | $22.96 | $16.13 | $23.52 |
| |
| Total Return(4) | 42.50% | (21.62)% | 8.83% |
| | | | |
| Ratios/Supplemental Data | | | |
| Ratio of Operating Expenses to Average Net Assets | 1.19% | 1.20% | 1.18%(5) |
| Ratio of Net Investment Income (Loss) to Average Net Assets | (0.66)% | (0.59)% | (0.71)%(5) |
| Portfolio Turnover Rate | 24% | 20% | 17%(6) |
| Net Assets, End of Period (in thousands) | $1,117 | $313 | $27 |
| (1) | September 28, 2007 (commencement of sale) through June 30, 2008. | | | |
| (2) | Computed using average shares outstanding throughout the period. | | | |
| (3) | Per-share amount was less than $0.005. | | | |
| (4) | Total return assumes reinvestment of net investment income and capital gains distributions, if any. Total returns for periods less than one year |
| | are not annualized. Total returns are calculated based on the net asset value of the last business day. The total return of the classes may not |
| | precisely reflect the class expense differences because of the impact of calculating the net asset values to two decimal places. If net asset |
| | values were calculated to three decimal places, the total return differences would more closely reflect the class expense differences. The |
| | calculation of net asset values to two decimal places is made in accordance with SEC guidelines and does not result in any gain or loss of value |
| | between one class and another. | | | |
| (5) | Annualized. | | | |
| (6) | Portfolio turnover is calculated at the fund level. Percentage indicated was calculated for the year ended June 30, 2008. | |
See Notes to Financial Statements.
28
|
| Report of Independent Registered Public Accounting Firm |
To the Directors of the American Century Quantitative Equity Funds, Inc.
and Shareholders of the Global Gold Fund:
In our opinion, the accompanying statement of assets and liabilities, including the schedule of investments, and the related statements of operations and of changes in net assets and the financial highlights present fairly, in all material respects, the financial position of the Global Gold Fund (one of the eleven funds comprising the American Century Quantitative Equity Funds, Inc., hereafter referred to as the “Fund”) at June 30, 2010, the results of its operations for the year then ended, the changes in its net assets for each of the two years in the period then ended and the financial highlights for each of the periods presented, in conformity with accounting principles generally accepted in the United States of America. These financial statements and financial highlights (hereafter referred to as “financial statements”) are the responsibility of the Fund’s management; our responsibili ty is to express an opinion on these financial statements based on our audits. We conducted our audits of these financial statements in accordance with the standards of the Public Company Accounting Oversight Board (United States). Those standards require that we plan and perform the audit to obtain reasonable assurance about whether the financial statements are free of material misstatement. An audit includes examining, on a test basis, evidence supporting the amounts and disclosures in the financial statements, assessing the accounting principles used and significant estimates made by management, and evaluating the overall financial statement presentation. We believe that our audits, which included confirmation of securities at June 30, 2010 by correspondence with the custodian and brokers, provide a reasonable basis for our opinion.
PricewaterhouseCoopers LLP
Kansas City, Missouri
August 19, 2010
29
A special meeting of shareholders was held on June 16, 2010, to vote on the following proposals. Each proposal received the required number of votes and was adopted. A summary of voting results is listed below each proposal.
Proposal 1:
To elect one Director to the Board of Directors of American Century Quantitative Equity Funds, Inc. (the proposal was voted on by all shareholders of funds issued by American Century Quantitative Equity Funds, Inc.):
| | |
| Frederick L.A. Grauer | For: | 4,067,909,978 |
| | Withhold: | 174,470,448 |
| | Abstain: | 0 |
| | Broker Non-Vote: | 0 |
The other directors whose term of office continued after the meeting include Jonathan S. Thomas, John Freidenrich, Ronald J. Gilson, Peter F. Pervere, Myron S. Scholes, and John B. Shoven.
Proposal 2:
To approve a management agreement between the fund and American Century Investment Management, Inc.:
| | |
| Investor, A, B, C and R Classes | For: | 523,547,058 |
| | Against: | 12,583,993 |
| | Abstain: | 15,072,624 |
| | Broker Non-Vote: | 75,932,787 |
| |
| Institutional Class | For: | 11,478,396 |
| | Against: | 0 |
| | Abstain: | 0 |
| | Broker Non-Vote: | 0 |
30
The Board of Directors
The individuals listed below serve as directors of the fund. Each director will continue to serve in this capacity until death, retirement, resignation or removal from office. The mandatory retirement age for directors who are not “interested persons,” as that term is defined in the Investment Company Act (independent directors), is 73. However, the mandatory retirement age may be extended for a period not to exceed two years with the approval of the remaining independent directors.
Mr. Thomas is the only director who is an “interested person” because he currently serves as President and Chief Executive Officer of American Century Companies, Inc. (ACC), the parent company of American Century Investment Management, Inc. (ACIM or the advisor).
The other directors (more than three-fourths of the total number) are independent; that is, they have never been employees, directors or officers of, and have no financial interest in, ACC or any of its wholly owned, direct or indirect, subsidiaries, including ACIM, American Century Investment Services, Inc. (ACIS) and American Century Services, LLC (ACS). The directors serve in this capacity for eight (in the case of Mr. Thomas, 15) registered investment companies in the American Century Investments family of funds.
The following presents additional information about the directors. The mailing address for each director other than Mr. Thomas is 1665 Charleston Road, Mountain View, California 94043. The mailing address for Mr. Thomas is 4500 Main Street, Kansas City, Missouri 64111.
Independent Directors
John Freidenrich
Year of Birth: 1937
Position(s) with the Fund: Director
Length of Time Served: Since 2005
Principal Occupation(s) During the Past Five Years: Founder, Member and Manager, Regis
Management Company, LLC (investment management firm) (April 2004 to present)
Number of Funds in Fund Complex Overseen by Director: 41
Other Directorships Held by Director During the Past Five Years: None
Education/Other Professional Experience: AB in Economics, Stanford University; LLB,
Stanford Law School; formerly, Partner and Founder, Ware and Freidenrich Law
Firm and Bay Partners; formerly, President, Board of Trustees, Stanford University
31
Ronald J. Gilson
Year of Birth: 1946
Position(s) with the Fund: Director and Chairman of the Board
Length of Time Served: Since 1995
Principal Occupation(s) During the Past Five Years: Charles J. Meyers Professor of Law and
Business, Stanford Law School (1979 to present); Marc and Eva Stern Professor of
Law and Business, Columbia University School of Law (1992 to present)
Number of Funds in Fund Complex Overseen by Director: 41
Other Directorships Held by Director During the Past Five Years: None
Education/Other Professional Experience: BA, Washington University; JD, Yale Law School;
formerly, Attorney, Steinhart, Goldberg, Feigenbaum & Ladar
Frederick L. A. Grauer
Year of Birth: 1946
Position(s) with the Fund: Director
Length of Time Served: Since 2008
Principal Occupation(s) During the Past Five Years: Senior Advisor, BlackRock, Inc. (investment
management firm) (2010 to present); Senior Advisor, Barclays Global Investors
(investment management firm) (2003 to 2009)
Number of Funds in Fund Complex Overseen by Director: 41
Other Directorships Held by Director During the Past Five Years: None
Education/Other Professional Experience: BA in Economics, University of British Columbia;
MA in Economics, University of Chicago; PhD in Business, Stanford University;
formerly, Executive Chairman, Barclays Global Investors; Chairman and Chief
Executive Officer, Wells Fargo Nikko Investment Advisors; and Vice President,
Merrill Lynch Capital Markets Group; formerly, Director, New York Stock Exchange,
Chicago Mercantile Exchange and Columbia University; formerly, Faculty Member,
Graduate School of Business, Columbia University and Alfred P. Sloan School of
Management, Massachusetts Institute of Technology
Peter F. Pervere
Year of Birth: 1947
Position(s) with the Fund: Director
Length of Time Served: Since 2007
Principal Occupation(s) During the Past Five Years: Retired
Number of Funds in Fund Complex Overseen by Director: 41
Other Directorships Held by Director During the Past Five Years: Intraware, Inc. (2003 to 2009);
Digital Impact, Inc. (2003 to 2005)
Education/Other Professional Experience: BA in History, Stanford University; CPA; formerly,
Vice President and Chief Financial Officer, Commerce One, Inc. (software and
services provider); formerly, Vice President and Corporate Controller, Sybase, Inc.;
formerly with accounting firm of Arthur Young & Co.
32
Myron S. Scholes
Year of Birth: 1941
Position(s) with the Fund: Director
Length of Time Served: Since 1980
Principal Occupation(s) During the Past Five Years: Chairman, Platinum Grove Asset
Management, L.P. (asset manager) (1999 to 2009); Frank E. Buck Professor of
Finance-Emeritus, Stanford Graduate School of Business (1996 to present)
Number of Funds in Fund Complex Overseen by Director: 41
Other Directorships Held by Director During the Past Five Years: Dimensional Fund Advisors
(investment advisor); CME Group, Inc. (futures and options exchange)
Education/Other Professional Experience: BA in Economics, McMaster University (Ontario);
MBA and PhD, University of Chicago; formerly, Senior Research Fellow at the
Hoover Institute; formerly, Edward Eagle Brown Professor of Finance, University of
Chicago; recipient of the Alfred Nobel Memorial Prize in Economic Sciences
John B. Shoven
Year of Birth: 1947
Position(s) with the Fund: Director
Length of Time Served: Since 2002
Principal Occupation(s) During the Past Five Years: Professor of Economics, Stanford University
(1973 to present)
Number of Funds in Fund Complex Overseen by Director: 41
Other Directorships Held by Director During the Past Five Years: Cadence Design Systems;
Exponent; Financial Engines; PalmSource, Inc. (2002 to 2005); Watson Wyatt
Worldwide (2002 to 2006)
Education/Other Professional Experience: BA in Physics, University of California; PhD in
Economics, Yale University; Director of the Stanford Institute for Economic Policy
Research (1999 to present); formerly, Chair of Economics and Dean of Humanities
and Sciences, Stanford University
Interested Director
Jonathan S. Thomas
Year of Birth: 1963
Position(s) with the Fund: Director and President
Length of Time Served: Since 2007
Principal Occupation(s) During the Past Five Years: President and Chief Executive Officer,
ACC (March 2007 to present); Chief Administrative Officer, ACC (February 2006 to
February 2007); Executive Vice President, ACC (November 2005 to February 2007);
Global Chief Operating Officer and Managing Director, Morgan Stanley (investment
management) (March 2000 to November 2005). Also serves as: Chief Executive
Officer and Manager, ACS; Executive Vice President, ACIM; Director, ACC, ACIM
and other ACC subsidiaries
Number of Funds in Fund Complex Overseen by Director: 104
Other Directorships Held by Director During the Past Five Years: None
Education/Other Professional Experience: BA in Economics, University of Massachusetts;
MBA, Boston College; formerly held senior leadership roles with Fidelity
Investments, Boston Financial Services and Bank of America; serves on the Board of
Governors of the Investment Company Institute
33
Officers
The following table presents certain information about the executive officers of the fund. Each officer serves as an officer for each of the 15 investment companies in the American Century family of funds, unless otherwise noted. No officer is compensated for his or her service as an officer of the fund. The listed officers are interested persons of the fund and are appointed or re-appointed on an annual basis. The mailing address for each of the officers listed below is 4500 Main Street, Kansas City, Missouri 64111.
| | |
| Name | Offices with | |
| (Year of Birth) | the Fund | Principal Occupation(s) During the Past Five Years |
| Jonathan S. | Director and | Principal Occupation(s) During the Past Five Years: President and Chief |
| Thomas (1963) | President | Executive Officer, ACC (March 2007 to present); Chief Administrative |
| | since 2007 | Officer, ACC (February 2006 to February 2007); Executive Vice President, |
| | | ACC (November 2005 to February 2007); Global Chief Operating Officer |
| | | and Managing Director, Morgan Stanley (March 2000 to November 2005). |
| | | Also serves as: Chief Executive Officer and Manager, ACS; Executive Vice |
| | | President, ACIM; Director, ACC, ACIM and other ACC subsidiaries |
| Barry Fink (1955) | Executive | Chief Operating Officer and Executive Vice President, ACC (September 2007 |
| | Vice President | to present); President, ACS (October 2007 to present); Managing Director, |
| | since 2007 | Morgan Stanley (2000 to 2007); Global General Counsel, Morgan Stanley |
| | | (2000 to 2006). Also serves as: Manager, ACS, and Director, ACC and |
| | | certain ACC subsidiaries |
| Maryanne L. | Chief Compliance | Chief Compliance Officer, American Century funds, ACIM and ACS (August |
| Roepke (1956) | Officer since 2006 | 2006 to present); Assistant Treasurer, ACC (January 1995 to August 2006); |
| | and Senior Vice | and Treasurer and Chief Financial Officer, various American Century funds |
| | President | (July 2000 to August 2006). Also serves as: Senior Vice President, ACS |
| | since 2000 | |
| Charles A. | General Counsel | Attorney, ACC (February 1994 to present); Vice President, ACC (November |
| Etherington | since 2007 and | 2005 to present); General Counsel, ACC (March 2007 to present); Also |
| (1957) | Senior Vice | serves as General Counsel, ACIM, ACS, ACIS and other ACC subsidiaries; |
| | President | and Senior Vice President, ACIM and ACS |
| | since 2006 | |
| Robert J. Leach | Vice President, | Vice President, ACS (February 2000 to present); and Controller, various |
| (1966) | Treasurer and | American Century funds (1997 to September 2006) |
| | Chief Financial | |
| | Officer since 2006 | |
| David H. Reinmiller | Vice President | Attorney, ACC (January 1994 to present); Associate General Counsel, ACC |
| (1963) | since 2001 | (January 2001 to present); Chief Compliance Officer, American Century |
| | | funds and ACIM (January 2001 to February 2005). Also serves as: Vice |
| | | President, ACIM and ACS |
| Ward D. Stauffer | Secretary | Attorney, ACC (June 2003 to Present) |
| (1960) | since 2005 | |
The SAI has additional information about the fund’s directors and is available without charge, upon request, by calling 1-800-345-2021.
34
|
| Board Approval of Management Agreements |
American Century Investment Management, Inc. (“ACIM” or the “Advisor”) currently serves as investment advisor to the Fund under a management agreement (the “Current Management Agreement”) that took effect on July 16, 2010, following approval by the Fund’s Board of Directors (the “Board”) and shareholders. The Advisor previously served as investment advisor to the Fund pursuant to a prior management agreement (the “Prior Management Agreement”) and an interim management agreement (the “Interim Management Agreeement”). The Interim Management Agreement terminated in accordance with its terms on July 16, 2010, upon the effectiveness of the Current Management Agreement. The Prior Management Agreement terminated on February 16, 2010, as a result of a change of control of the Advisor’s parent company, American Century Companies, Inc. (“ACC”). The change in control occurred as the result of a change in the trustee of a trust created by James E. Stowers, Jr., the founder of American Century Investments that holds shares representing a significant interest in ACC stock. Mr. Stowers previously served as the trustee of the trust. On February 16, 2010, Richard W. Brown, Co-Chairman of ACC with Mr. Stowers, became the trustee in accordance with the terms of the trust and Mr. Stowers’ long-standing estate and succession plan.
On February 18, 2010, the Board approved the Interim Management Agreement in accordance with Rule 15a-4 under the Investment Company Act to ensure continued management of the Fund by the Advisor after the termination of the Prior Management Agreement and until shareholder approval of the Current Management Agreement as required under the Act. The Board approved the Current Management Agreement and recommended its approval to shareholders. Fund shareholders approved the Current Management Agreement at a meeting held on June 16, 2010.
The Interim Management Agreement and the Current Management Agreement are substantially identical to the Prior Management Agreement except for their effective dates and the termination provisions of the Interim Management Agreement. Under the Interim and Current Management Agreements, the Advisor will provide the same services to the Fund and receive the same compensation rate as under the Prior Management Agreement.
Basis for Board Approval of Interim Management Agreement
In considering the approval of the Interim Management Agreement, Rule 15a-4 requires the Board to approve the contract within ten business days of the termination of the prior agreement and to determine that the compensation to be received under the interim agreement is no greater than would have been received under the prior agreement. In connection with the approval, the Board noted that it oversees on a continuous basis and evaluates at its quarterly meetings, directly and through the committees of the Board, the nature and quality of significant services provided by the Advisor, the investment performance of the Fund, shareholder services, audit and compliance functions and a variety of other matters relating to the Fund’s operations.
35
In evaluating the Interim Management Agreement, the Board, assisted by the advice of its independent legal counsel, considered a number of factors in addition to those required by the rule with no one factor being determinative to its analysis. Among the factors considered by the Board were the circumstances and effect of the change of control, the fact that the Advisor will provide the same services and receive the same compensation rate as under the Prior Management Agreement, and that the change of control did not result in a change of the personnel managing the Fund. Upon completion of its analysis, the Board approved the Interim Management Agreement, determining that the continued management of the Fund by the Advisor was in the best interests of the Fund and Fund shareholders.
Basis for Board Approval of Current Management Agreement
At a meeting held on April 1, 2010, after considering all information presented, the Board approved, and determined to recommend that shareholders approve, the Current Management Agreement. In connection with that approval, the Board requested and reviewed extensive data and information compiled by the Advisor and certain independent providers of evaluation data concerning the Fund and services provided to the Fund by the Advisor. The Board oversees on a continuous basis and evaluates at its quarterly meetings, directly and through the committees of the Board, the nature and quality of significant services provided by the Advisor, the investment performance of the Fund, shareholder services, audit and compliance functions and a variety of other matters relating to the Fund’s operations. The information considered and the discussions held at the meetings included, but were not limited to:
• the nature, extent and quality of investment management, shareholder services and other services provided to the Fund;
• the wide range of programs and services the Advisor provides to the Fund and its shareholders on a routine and non-routine basis;
• the compliance policies, procedures, and regulatory experience of the Advisor;
• data comparing the cost of owning the Fund to the cost of owning similar funds;
• the fact that there will be no changes to the fees, services, or personnel who provide such services as compared to the Prior Management Agreement;
• data comparing the Fund’s performance to appropriate benchmarks and/ or a peer group of other mutual funds with similar investment objectives and strategies;
• financial data showing the profitability of the Fund to the Advisor and the overall profitability of the Advisor;
• data comparing services provided and charges to the Fund with those for other non-fund investment management clients of the Advisor; and
36
• consideration of collateral or “fall-out” benefits derived by the Advisor from the management of the Fund and potential sharing of economies of scale in connection with the management of the Fund.
The Board also considered whether there was any reason for not continuing the existing arrangement with the Advisor. In particular, the Board recognized that shareholders may have invested in the Fund on the strength of the Advisor’s industry standing and reputation and in the expectation that the Advisor will have a continuing role in providing advisory services to the Fund.
The Board considered all of the information provided by the Advisor, the independent data providers, and the Board’s independent legal counsel, and evaluated such information for the Fund. The Board did not identify any single factor as being all-important or controlling, and each Board member may have attributed different levels of importance to different factors. In deciding to approve the Current Management Agreement under the terms ultimately determined by the Board to be appropriate, the Board based its decision on a number of factors, including the following:
Nature, Extent and Quality of Services — Generally. Under the Current Management Agreement, the Advisor is responsible for providing or arranging for all services necessary for the operation of the Fund. The Board noted that under the Current Management Agreement, the Advisor provides or arranges at its own expense a wide variety of services including:
• constructing and designing the Fund
• portfolio research and security selection
• initial capitalization/funding
• securities trading
• Fund administration
• custody of Fund assets
• daily valuation of the Fund’s portfolio
• shareholder servicing and transfer agency, including shareholder
confirmations, recordkeeping and communications
• legal services
• regulatory and portfolio compliance
• financial reporting
• marketing and distribution
37
The Board noted that many of these services have expanded over time both in terms of quantity and complexity in response to shareholder demands, competition in the industry, changing distribution channels and the changing regulatory environment.
Investment Management Services. The investment management services provided to the Fund are complex and provide Fund shareholders access to professional money management, instant diversification of their investments within an asset class, the opportunity to easily diversify among asset classes, and liquidity. As a part of its general oversight and in evaluating investment performance, the Board expects the Advisor to manage the Fund in accordance with its investment objectives and approved strategies. In providing these services, the Advisor utilizes teams of investment professionals who require extensive information technology, research, training, compliance and other systems to conduct their business. The Board, directly and through its Portfolio Committee, regularly reviews investment performance information for the Fund, t ogether with comparative information for appropriate benchmarks and/or peer groups of similarly-managed funds, over different time horizons. If performance concerns are identified, the underperforming Fund receives special reviews until performance improves, during which time the Board discusses with the Advisor the reasons for such underperformance and any efforts being undertaken to improve performance.
Shareholder and Other Services. Under the Current Management Agreement, the Advisor will also provide the Fund with a comprehensive package of transfer agency, shareholder, and other services. The Board, directly and through the various committees of the Board, regularly reviews reports and evaluations of such services. These reports include, but are not limited to, information regarding the operational efficiency and accuracy of the shareholder and transfer agency services provided, staffing levels, shareholder satisfaction (as measured by external as well as internal sources), technology support, new products and services offered to Fund shareholders, securities trading activities, portfolio valuation services, auditing services, and legal and operational compliance activities. Certain aspects of shareholder and transfer age ncy service level efficiency and the quality of securities trading activities are measured by independent third party providers and are presented in comparison to other fund groups not managed by the Advisor.
Costs of Services Provided and Profitability. The Advisor provided detailed information concerning its cost of providing various services to the Fund, its profitability in managing the Fund, its overall profitability, and its financial condition. The Board reviewed with the Advisor the methodology used to prepare this financial information. The Board has also reviewed with the Advisor its methodology for compensating the investment professionals that provide services to the Fund as well as compensation to the five highest paid personnel of the Advisor. This financial information regarding the Advisor is considered in order to evaluate the Advisor’s financial condition, its ability to continue to provide services under the Current Management Agreement, and the reasonableness of the current management fees.
38
Ethics. The Board generally considers the Advisor’s commitment to providing quality services to shareholders and to conducting its business ethically. It noted that the Advisor’s practices generally meet or exceed industry best practices.
Economies of Scale. The Board also reviewed information provided by the Advisor regarding the possible existence of economies of scale in connection with the management of the Fund. The Board concluded that economies of scale are difficult to measure and predict with precision, especially on a fund-by-fund basis. The analysis of economies of scale is further complicated by the additional services and content provided by the Advisor and its reinvestment in its ability to provide and expand those services. Accordingly, the Board seeks to evaluate economies of scale by reviewing information, such as year-over-year profitability of the Advisor generally, the profitability of its management of the Fund specifically, and the expenses incurred by the Advisor in providing various functions to the Fund. The Board believes the Advisor i s appropriately sharing economies of scale through its competitive fee structure, offering competitive fees from fund inception, fee breakpoints as the fund complex and the Fund increases in size, and through reinvestment in its business to provide shareholders additional services and enhancements to existing services. In particular, separate breakpoint schedules based on the size of the entire fund complex and on the size of the Fund reflect the complexity of assessing economies of scale.
Comparison to Fees of Funds not Managed by the Advisor. Both the Prior and Current Management Agreements provide that the Fund pays the Advisor a single, all-inclusive (or unified) management fee for providing all services necessary for the management and operation of the Fund, other than brokerage expenses, taxes, interest, extraordinary expenses, and the fees and expenses of the Fund’s Independent Directors (including their independent legal counsel) and expenses incurred in connection with the provision of shareholder services and distribution services under a plan adopted pursuant to Rule 12b-1 under the 1940 Act. Under the unified fee structure, the Advisor is responsible for providing all investment advisory, custody, audit, administrative, compliance, recordkeeping, marketing and shareholder services, or arranging and supervising third parties that provide such services. By contrast, most other funds are charged a variety of fees, including an investment advisory fee, a transfer agency fee, an administrative fee, distribution charges and other expenses. Other than their investment advisory fees and any applicable Rule 12b-1 distribution fees, the components of the total fees charged by these other funds may be increased without shareholder approval. The Board believes the unified fee structure is a benefit to Fund shareholders because it clearly discloses to shareholders the cost of owning Fund shares, and, since the unified fee cannot be increased without a vote of Fund shareholders, it shifts to the Advisor the risk of increased costs of operating the Fund and provides a direct incentive to minimize administrative inefficiencies. Part of the Board’s analysis of fee levels involves reviewing certain evaluative data compiled by an independent provider comparing the Fund’s unified fee to the total expense rat ios of similar funds not managed by the Advisor. The
39
Board concluded that the management fee to be paid by the Fund to the Advisor under the Current Management Agreement is reasonable in light of the services to be provided to the Fund.
Comparison to Fees and Services Provided to Other Clients of the Advisor. The Board also requested and received information from the Advisor concerning the nature and extent of the services, fees, and profitability of its advisory services to advisory clients other than the Fund. They observed that these varying types of client accounts require different services and involve different regulatory and entrepreneurial risks than the management of the Fund. The Board analyzed this information and concluded that the fees charged and services provided to the Fund were reasonable by comparison.
Collateral or “Fall-Out” Benefits Derived by the Advisor. The Board considered the existence of collateral benefits the Advisor may receive as a result of its relationship with the Fund. The Board concluded that the Advisor’s primary business is managing mutual funds and it generally does not use Fund or shareholder information to generate profits in other lines of business, and therefore does not derive any significant collateral benefits from them. The Board noted that the Advisor receives proprietary research from broker-dealers that execute Fund portfolio transactions and concluded that this research is likely to benefit Fund shareholders. The Board also determined that the Advisor is able to provide investment management services to certain clients other than the Fund, at least in part, due to its existing infrastructure built to serve the fund complex. The Board concluded, however, that the assets of those other clients are not material to the analysis and, in any event, are included with the assets of the Fund to determine breakpoints in the Fund’s fee schedule, provided they are managed using the same investment team and strategy.
Conclusion of the Board. As a result of this process, the Board, in the absence of particular circumstances and assisted by the advice of its independent legal counsel, taking into account all of the factors discussed above and the information provided by the Advisor and others, concluded that the Current Management Agreement be approved and recommended its approval to Fund shareholders.
40
Retirement Account Information
As required by law, distributions you receive from certain IRAs, or 403(b), 457 and qualified plans are subject to federal income tax withholding, unless you elect not to have withholding apply. Tax will be withheld on the total amount withdrawn even though you may be receiving amounts that are not subject to withholding, such as nondeductible contributions. In such case, excess amounts of withholding could occur. You may adjust your withholding election so that a greater or lesser amount will be withheld.
If you don’t want us to withhold on this amount, you must notify us to not withhold the federal income tax. You may notify us in writing or in certain situations by telephone or through other electronic means. You have the right to revoke your withholding election at any time and any election you make may remain in effect until revoked by filing a new election.
Remember, even if you elect not to have income tax withheld, you are liable for paying income tax on the taxable portion of your withdrawal. If you elect not to have income tax withheld or you don’t have enough income tax withheld, you may be responsible for payment of estimated tax. You may incur penalties under the estimated tax rules if your withholding and estimated tax payments are not sufficient. You can reduce or defer the income tax on a distribution by directly or indirectly rolling such distribution over to another IRA or eligible plan. You should consult your tax advisor for additional information.
State tax will be withheld if, at the time of your distribution, your address is within one of the mandatory withholding states and you have federal income tax withheld. State taxes will be withheld from your distribution in accordance with the respective state rules.
Proxy Voting Guidelines
American Century Investment Management, Inc., the fund’s investment advisor, is responsible for exercising the voting rights associated with the securities purchased and/or held by the fund. A description of the policies and procedures the advisor uses in fulfilling this responsibility is available without charge, upon request, by calling 1-800-345-2021. It is also available on American Century Investments’ website at americancentury.com and on the Securities and Exchange Commission’s website at sec.gov. Information regarding how the investment advisor voted proxies relating to portfolio securities during the most recent 12-month period ended June 30 is available on the “About Us” page at americancentury.com. It is also available at sec.gov.
Quarterly Portfolio Disclosure
The fund files its complete schedule of portfolio holdings with the Securities and Exchange Commission (SEC) for the first and third quarters of each fiscal year on Form N-Q. The fund’s Forms N-Q are available on the SEC’s website at sec.gov, and may be reviewed and copied at the SEC’s Public Reference Room in Washington, DC. Information on the operation of the Public Reference Room may be obtained by calling 1-800-SEC-0330. The fund also makes its complete schedule of portfolio holdings for the most recent quarter of its fiscal year available on its website at americancentury.com and, upon request, by calling 1-800-345-2021.
41
The following indices are used to illustrate investment market, sector, or style performance or to serve as fund performance comparisons. They are not investment products available for purchase.
The FT-SE® Gold Mines Index(1) is designed to reflect the performance of the worldwide market in shares of companies whose principal activity is the mining of gold.
The Lipper Precious Metals Fund Index is an equally-weighted index of the 10 largest funds that invest in instruments based on mining, exploration or distribution of gold and other precious metals.
The Morgan Stanley Capital International (MSCI) World Index is a market-capitalization-weighted index designed to measure global developed-market equity performance.
The New York Stock Exchange (NYSE) Arca Gold Miners Index is a modified market capitalization-weighted index comprised of publicly traded companies involved primarily in the mining for gold and silver.
The S&P Goldman Sachs Commodities Index is a measure of price movements in the global commodities markets, including the principal physical commodities (energy, industrial metals, precious metals, agriculture, livestock) that are the subject of active, liquid futures markets.
| |
| (1) | The FT-SE Gold Mines Index is calculated by FT-SE International Limited in conjunction with the Institute of Actuaries. The FT-SE Gold Mines |
| | Index is a trademark of the London Stock Exchange Limited and the Financial Times Ltd. and is used by FT-SE International Limited under |
| | license. FT-SE International Limited does not sponsor, endorse, or promote the fund. |
42
43
44

| |
| |
| Contact Us | |
| americancentury.com | |
| Automated Information Line | 1-800-345-8765 |
| Investor Services Representative | 1-800-345-2021 or |
| | 816-531-5575 |
| Investors Using Advisors | 1-800-378-9878 |
| Business, Not-For-Profit, Employer-Sponsored | |
| Retirement Plans | 1-800-345-3533 |
| Banks and Trust Companies, Broker-Dealers, | |
| Financial Professionals, Insurance Companies | 1-800-345-6488 |
| Telecommunications Device for the Deaf | 1-800-634-4113 |
| American Century Quantitative Equity Funds, Inc. | |
| Investment Advisor: | |
| American Century Investment Management, Inc. | |
| Kansas City, Missouri | |
This report and the statements it contains are submitted for the general
information of our shareholders. The report is not authorized for distribution to
prospective investors unless preceded or accompanied by an effective prospectus.
American Century Investment Services, Inc., Distributor
©2010 American Century Proprietary Holdings, Inc. All rights reserved.
1008
CL-ANN-69048
|
| Annual Report |
| June 30, 2010 |

|
| American Century Investments® |
Disciplined Growth Fund
| |
| President’s Letter | 2 |
| Market Perspective | 3 |
| U.S. Stock Index Returns | 3 |
| |
| Disciplined Growth | |
| |
| Performance | 4 |
| Portfolio Commentary | 6 |
| Top Ten Holdings | 8 |
| Five Largest Overweights | 8 |
| Five Largest Underweights. | 8 |
| Types of Investments in Portfolio | 8 |
| |
| Shareholder Fee Example | 9 |
| |
| Financial Statements | |
| |
| Schedule of Investments | 11 |
| Statement of Assets and Liabilities | 14 |
| Statement of Operations | 15 |
| Statement of Changes in Net Assets | 16 |
| Notes to Financial Statements | 17 |
| Financial Highlights | 23 |
| Report of Independent Registered Public Accounting Firm | 29 |
| Proxy Voting Results | 30 |
| |
| Other Information | |
| |
| Management | 31 |
| Board Approval of Management Agreements | 35 |
| Additional Information | 41 |
| Index Definitions | 42 |
Any opinions expressed in this report reflect those of the author as of the date of the report, and do not necessarily represent the opinions of American Century Investments or any other person in the American Century Investments organization. Any such opinions are subject to change at any time based upon market or other conditions and American Century Investments disclaims any responsibility to update such opinions. These opinions may not be relied upon as investment advice and, because investment decisions made by American Century Investments funds are based on numerous factors, may not be relied upon as an indication of trading intent on behalf of any American Century Investments fund. Security examples are used for representational purposes only and are not intended as recommendations to purchase or sell securities. Performance information for comparative indices and securities is provided to American Century Investments by third party vendors. To the best of American Century Investments’ knowledge, such information is accurate at the time of printing.

Dear Investor:
To learn more about the capital markets, your investment, and the portfolio management strategies American Century Investments provides, we encourage you to review this shareholder report for the financial reporting period ended June 30, 2010.
On the following pages, you will find investment performance and portfolio information, presented with the expert perspective and commentary of our portfolio management team. This report remains one of our most important vehicles for conveying the information you need about your investment performance, and about the market factors and strategies that affect fund returns. For additional information on the markets, we encourage you to visit the “Insights & News” tab at our Web site, americancentury.com, for updates and further expert commentary.
The top of our Web site’s home page also provides a link to “Our Story,” which, first and foremost, outlines our commitment—since 1958—to helping clients reach their financial goals. We believe strongly that we will only be successful when our clients are successful. That’s who we are.
Another important, unique facet of our story and who we are is “Profits with a Purpose,” which describes our bond with the Stowers Institute for Medical Research (SIMR). SIMR is a world-class biomedical organization—founded by our company founder James E. Stowers, Jr. and his wife Virginia—that is dedicated to researching the causes, treatment, and prevention of gene-based diseases, including cancer. Through American Century Investments’ private ownership structure, more than 40% of our profits support SIMR.
Mr. Stowers’ example of achieving financial success and using that platform to help humanity motivates our entire American Century Investments team. His story inspires us to help each of our clients achieve success. Thank you for sharing your financial journey with us.
Sincerely,

Jonathan Thomas
President and Chief Executive Officer
American Century Investments
2

By Scott Wittman, Chief Investment Officer, Quantitative Equity and Asset Allocation
Stocks Rallied as Economy Improved
U.S. stocks posted double-digit gains for the 12 months ended June 30, 2010, thanks largely to improving economic conditions and unexpectedly strong corporate earnings. As the period began, the U.S. economy was starting to show early signs of recovery following a sharp downturn in late 2008 and early 2009. Led by improving results in manufacturing activity, housing, and consumer spending, the economy posted positive growth in the third and fourth quarters of 2009 after four consecutive quarters of declining output. By the first quarter of 2010, jobs data turned positive, providing further evidence of a burgeoning economic recovery.
In addition, corporate profits consistently exceeded expectations as many companies implemented stringent cost-management programs that helped boost profit margins. Rising demand for delayed big-ticket purchases, such as cars and appliances, also contributed to stronger earnings. As a result, stocks rose steadily for much of the period, with the major equity indices advancing by more than 30% from the beginning of the period through April 30, 2010.
Growing Uncertainty Led to Late Decline
Market conditions changed abruptly in the last two months of the period as persistent worries about sovereign debt problems in Europe and questions about the sustainability of the domestic economic recovery (validated to some degree by weaker economic data late in the period) weighed on investor confidence. With these headwinds, the equity market peaked in late April and then reversed direction in May and June. In addition, market volatility increased dramatically—the S&P 500 Index moved up or down by more than 1% on nearly half of the trading days in the second quarter of 2010.
Although stocks gave back a notable portion of their gains late in the period, the broad market indices returned approximately 15% overall for the 12 months. Mid- and small-cap stocks posted the best returns (see the table below), outpacing large-cap shares, while value stocks outperformed growth-oriented issues across all market capitalizations.
| | | | |
| U.S. Stock Index Returns | | | | |
| For the 12 months ended June 30, 2010 | | | | |
| Russell 1000 Index (Large-Cap) | 15.24% | | Russell 2000 Index (Small-Cap) | 21.48% |
| Russell 1000 Value Index | 16.92% | | Russell 2000 Value Index | 25.07% |
| Russell 1000 Growth Index | 13.62% | | Russell 2000 Growth Index | 17.96% |
| Russell Midcap Index | 25.13% | | | |
| Russell Midcap Value Index | 28.91% | | | |
| Russell Midcap Growth Index | 21.30% | | | |
3
| | | | |
| Disciplined Growth | | | | |
| |
| Total Returns as of June 30, 2010 | | | |
| | | | Average Annual | |
| | | | Returns | |
| | Ticker Symbol | 1 year | Since Inception | Inception Date |
| Investor Class | ADSIX | 16.35% | -0.33% | 9/30/05 |
| Russell 1000 Growth Index | — | 13.62% | -0.43% | — |
| Institutional Class | ADCIX | 16.67% | -0.13% | 9/30/05 |
| A Class(1) | ADCVX | | | 9/30/05 |
| No sales charge* | | 16.00% | -0.59% | |
| With sales charge* | | 9.28% | -1.82% | |
| B Class | ADYBX | | | 9/28/07 |
| No sales charge* | | 15.17% | -10.68% | |
| With sales charge* | | 11.17% | -12.02% | |
| C Class | ADCCX | 15.17% | -10.68% | 9/28/07 |
| R Class | ADRRX | 15.82% | -0.83% | 9/30/05 |
| *Sales charges include initial sales charges and contingent deferred sales charges (CDSCs), as applicable. A Class shares have a |
| maximum 5.75% initial sales charge and may be subject to a maximum CDSC of 1.00%. B Class shares redeemed within six years |
| of purchase are subject to a CDSC that declines from 5.00% during the first year after purchase to 0.00% the sixth year after |
| purchase. C Class shares redeemed within 12 months of purchase are subject to a maximum CDSC of 1.00%. The SEC requires that |
| mutual funds provide performance information net of maximum sales charges in all cases where charges could be applied. |
|
| (1) Prior to September 4, 2007, the A Class was referred to as the Advisor Class and did not have a front-end sales charge. Performance prior to that |
| date has been adjusted to reflect this charge. | | | |
Data presented reflect past performance. Past performance is no guarantee of future results. Current performance may be higher or lower than the performance shown. Investment return and principal value will fluctuate, and redemption value may be more or less than original cost. To obtain performance data current to the most recent month end, please call 1-800-345-2021 or visit americancentury.com.
Unless otherwise indicated, performance reflects Investor Class shares; performance for other share classes will vary due to differences in fee structure. For information about other share classes available, please consult the prospectus. Data assumes reinvestment of dividends and capital gains, and none of the charts reflect the deduction of taxes that a shareholder would pay on fund distributions or the redemption of fund shares. Returns for the index are provided for comparison. The fund’s total returns include operating expenses (such as transaction costs and management fees) that reduce returns, while the total returns of the index do not.
4
Disciplined Growth
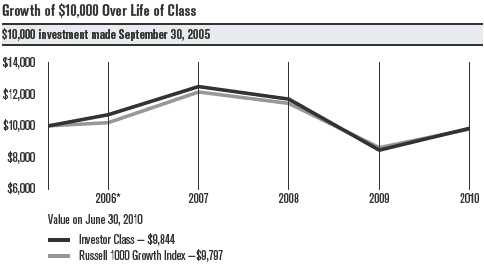
| | | | | |
| *From 9/30/05, the Investor Class’s inception date. Not annualized. | | | |
| |
| Total Annual Fund Operating Expenses | | | |
| | Institutional | | | | |
| Investor Class | Class | A Class | B Class | C Class | R Class |
| 1.05% | 0.85% | 1.30% | 2.05% | 2.05% | 1.55% |
The total annual fund operating expenses shown is as stated in the fund’s prospectus current as of the date of this report. The prospectus may vary from the expense ratio shown elsewhere in this report because it is based on a different time period, includes acquired fund fees and expenses, and, if applicable, does not include fee waivers or expense reimbursements.
Data presented reflect past performance. Past performance is no guarantee of future results. Current performance may be higher or lower than the performance shown. Investment return and principal value will fluctuate, and redemption value may be more or less than original cost. To obtain performance data current to the most recent month end, please call 1-800-345-2021 or visit americancentury.com.
Unless otherwise indicated, performance reflects Investor Class shares; performance for other share classes will vary due to differences in fee structure. For information about other share classes available, please consult the prospectus. Data assumes reinvestment of dividends and capital gains, and none of the charts reflect the deduction of taxes that a shareholder would pay on fund distributions or the redemption of fund shares. Returns for the index are provided for comparison. The fund’s total returns include operating expenses (such as transaction costs and management fees) that reduce returns, while the total returns of the index do not.
5
Disciplined Growth
Portfolio Managers: Bill Martin and Lynette Pang
In June 2010, portfolio manager Brian Ertley left American Century Investments to pursue other opportunities. Bill Martin and Lynette Pang remain as portfolio managers for Disciplined Growth.
Performance Summary
Disciplined Growth returned 16.35%* for the 12 months ended June 30, 2010, compared with the 13.62% return of its benchmark, the Russell 1000 Growth Index, and the 14.43% return of the broad S&P 500 Index.**
The double-digit gain for Disciplined Growth reflected the overall advance in the U.S. equity market. In addition, despite the general underperformance of growth-oriented stocks during the 12-month period, Disciplined Growth outperformed the broad market indices, as well as the growth-focused Russell 1000 Growth Index. The fund’s smaller average market capitalization contributed favorably to performance during the period, while price momentum detracted amid the market’s dramatic ebbs and flows.
Consumer Sectors Outperformed
Both sector allocation and individual stock selection contributed to the fund’s overall outperformance of the Russell 1000 Growth Index. This combination was best exemplified by the portfolio’s consumer discretionary holdings—consumer discretionary was the best-performing sector in the portfolio, so the fund’s overweight position in this sector added value, and stock selection was also favorable, particularly among internet retailers and specialty retailers. The best contributor in the portfolio was online movie rental firm Netflix, which enjoyed strong subscriber growth and generated better-than-expected earnings amid increased customer usage of streaming video. Other top contributors in the consumer discretionary sector included comic book publisher Marvel Entertainment, which was acquired by Disney, and mattress maker Tempur-Pedic International, which reported strong revenue growth thanks to improved consumer spending.
The consumer staples sector also contributed positively to relative results as stock choices among beverage companies and food products makers contributed the bulk of the outperformance. The best contributor in this sector was Coca-Cola Enterprises, which sold its North American bottling unit to Coca-Cola in early 2010. Another notable performer was cosmetics maker Estee Lauder, which produced robust earnings resulting from strong growth in Asia.
Technology and Materials Also Added Value
Disciplined Growth’s information technology and materials holdings also outperformed their counterparts in the Russell 1000 Growth Index. Virtually all of the outperformance in the information technology sector resulted from stock selection and an overweight position in computer hardware stocks. Consumer electronics maker Apple, the second-largest holding in the portfolio on average during the 12-month period, was the top contributor in this sector, benefiting from strong iPhone sales and the successful introduction of its iPad tablet computer. Data storage company EMC also fared well as demand improved and the company lowered its cost structure.
|
| * All fund returns referenced in this commentary are for Investor Class shares. |
| **The S&P 500 Index returned –1.57% since the fund’s inception September 30, 2005 through June 30, 2010. |
6
Disciplined Growth
In the materials sector, stock selection among chemicals producers and an overweight position in paper and forest products companies provided a lift to results. International Paper was a major contributor as resurgent demand for paper and packaging products boosted the company’s earnings. Eliminating agricultural chemicals maker Monsanto from the portfolio early in the period was also a favorable decision; Monsanto faced intense price competition in its Roundup herbicide business, as well as tepid demand for its new enhanced seed products, that weighed on earnings.
Other noteworthy positive contributors included drug maker Perrigo and flow control equipment manufacturer Flowserve. Perrigo advanced as the company gained market share in private-label over-the-counter medications, while Flowserve benefited from growing demand for infrastructure projects worldwide.
Industrials Detracted
The only sector in the portfolio to have a meaningful negative impact on performance versus the benchmark index was industrials. The underper-formance in this sector resulted largely from an underweight position in the airline industry and stock selection among aerospace and defense companies. The most significant detractor was truck and engine manufacturer Navistar International, which struggled with declining demand for much of the period.
The two biggest individual detractors in the portfolio for the 12-month period were health care stocks—diagnostic testing firm Myriad Genetics and biotechnology company Gilead Sciences. Myriad, which does molecular diagnostic testing, reported disappointing earnings in consecutive quarters as fewer physician visits resulted in declining demand for the company’s services. Gilead tumbled as the company lowered earnings guidance because of the impact of health care reform legislation on its business.
Another theme among the major decliners in the portfolio was for-profit education, most notably Apollo Group (which operates the University of Phoenix) and Corinthian Colleges. Both stocks were adversely affected by growing debt issues among students at private educational institutions, as well as the potential for more stringent regulatory requirements.
A Look Ahead
The market environment has grown increasingly choppy in recent months, reflecting greater uncertainty about the resilience of the economic recovery. Although most businesses weathered the 2008 recession relatively well, stubbornly high unemployment suggests that the corporate sector is not yet confident enough in the strength of the recovery to expand payrolls. This economic uncertainty—and the stock market volatility that often accompanies it—is likely to continue as we move into the second half of 2010.
The quantitative investment process we use to manage Disciplined Growth has a framework that is objective, disciplined, and systematic—in other words, it avoids getting caught up in the fads and emotions that can drive short-term market movements. We believe this approach will produce superior relative performance over the long term.
7
| | |
| Disciplined Growth | | |
| |
| Top Ten Holdings | | |
| | | % of net assets |
| | | as of 6/30/10 |
| Apple, Inc. | | 5.1% |
| Exxon Mobil Corp. | | 4.1% |
| International Business Machines Corp. | | 3.8% |
| Microsoft Corp. | | 3.1% |
| Google, Inc., Class A | | 2.6% |
| Cisco Systems, Inc. | | 2.4% |
| Intel Corp. | | 1.8% |
| Oracle Corp. | | 1.8% |
| 3M Co. | | 1.7% |
| Wal-Mart Stores, Inc. | | 1.6% |
| |
| Five Largest Overweights as of June 30, 2010 | | |
| | % of | % of Russell 1000 |
| | net assets | Growth Index |
| Raytheon Co. | 0.98% | — |
| Dollar Tree, Inc. | 1.07% | 0.10% |
| Perrigo Co. | 0.99% | 0.09% |
| Netflix, Inc. | 0.94% | 0.08% |
| Teradata Corp. | 0.94% | 0.10% |
| |
| Five Largest Underweights as of June 30, 2010 | | |
| | % of | % of Russell 1000 |
| | net assets | Growth Index |
| Exxon Mobil Corp. | 4.07% | 5.07% |
| Hewlett-Packard Co. | 0.94% | 1.93% |
| McDonald’s Corp. | 0.39% | 1.34% |
| Home Depot, Inc. | — | 0.90% |
| United Technologies Corp. | 0.17% | 1.05% |
| |
| Types of Investments in Portfolio | | |
| | | % of net assets |
| | | as of 6/30/10 |
| Common Stocks | | 99.2% |
| Temporary Cash Investments | | 0.8% |
| Other Assets and Liabilities | | —* |
| *Category is less than 0.05% of total net assets. | | |
8
|
| Shareholder Fee Example (Unaudited) |
Fund shareholders may incur two types of costs: (1) transaction costs, including sales charges (loads) on purchase payments and redemption/ exchange fees; and (2) ongoing costs, including management fees; distribution and service (12b-1) fees; and other fund expenses. This example is intended to help you understand your ongoing costs (in dollars) of investing in your fund and to compare these costs with the ongoing cost of investing in other mutual funds.
The example is based on an investment of $1,000 made at the beginning of the period and held for the entire period from January 1, 2010 to June 30, 2010.
Actual Expenses
The table provides information about actual account values and actual expenses for each class. You may use the information, together with the amount you invested, to estimate the expenses that you paid over the period. First, identify the share class you own. Then simply divide your account value by $1,000 (for example, an $8,600 account value divided by $1,000 = 8.6), then multiply the result by the number under the heading “Expenses Paid During Period” to estimate the expenses you paid on your account during this period.
If you hold Investor Class shares of any American Century Investments fund, or Institutional Class shares of the American Century Diversified Bond Fund, in an American Century Investments account (i.e., not a financial intermediary or retirement plan account), American Century Investments may charge you a $12.50 semiannual account maintenance fee if the value of those shares is less than $10,000. We will redeem shares automatically in one of your accounts to pay the $12.50 fee. In determining your total eligible investment amount, we will include your investments in all personal accounts (including American Century Investments Brokerage accounts) registered under your Social Security number. Personal accounts include individual accounts, joint accounts, UGMA/UTMA accounts, personal trusts, Coverdell Education Savings Accounts and IRAs (including traditional, Roth, Rollover, SEP-, SARSEP- and SIMPLE-IRAs), and certain other retirement accounts. If you have only business, business retirement, employer-sponsored or American Century Investments Brokerage accounts, you are currently not subject to this fee. We will not charge the fee as long as you choose to manage your accounts exclusively online. If you are subject to the Account Maintenance Fee, your account value could be reduced by the fee amount.
Hypothetical Example for Comparison Purposes
The table also provides information about hypothetical account values and hypothetical expenses based on the actual expense ratio of each class of your fund and an assumed rate of return of 5% per year before expenses, which is not the actual return of a fund’s share class. The hypothetical account values and expenses may not be used to estimate the actual ending account balance or expenses you paid for the period. You may use this information to compare the ongoing costs of investing in your fund and other funds. To do so, compare this 5% hypothetical example with the 5% hypothetical examples that appear in the shareholder reports of the other funds.
9
Please note that the expenses shown in the table are meant to highlight your ongoing costs only and do not reflect any transactional costs, such as sales charges (loads) or redemption/exchange fees. Therefore, the table is useful in comparing ongoing costs only, and will not help you determine the relative total costs of owning different funds. In addition, if these transactional costs were included, your costs would have been higher.
| | | | |
| | Beginning | Ending | Expenses Paid | |
| | Account Value | Account Value | During Period* | Annualized |
| | 1/1/10 | 6/30/10 | 1/1/10 - 6/30/10 | Expense Ratio* |
| Actual | | | | |
| Investor Class | $1,000 | $954.70 | $5.09 | 1.05% |
| Institutional Class | $1,000 | $955.80 | $4.12 | 0.85% |
| A Class | $1,000 | $953.50 | $6.30 | 1.30% |
| B Class | $1,000 | $949.90 | $9.91 | 2.05% |
| C Class | $1,000 | $949.90 | $9.91 | 2.05% |
| R Class | $1,000 | $952.20 | $7.50 | 1.55% |
| Hypothetical | | | | |
| Investor Class | $1,000 | $1,019.59 | $5.26 | 1.05% |
| Institutional Class | $1,000 | $1,020.58 | $4.26 | 0.85% |
| A Class | $1,000 | $1,018.35 | $6.51 | 1.30% |
| B Class | $1,000 | $1,014.63 | $10.24 | 2.05% |
| C Class | $1,000 | $1,014.63 | $10.24 | 2.05% |
| R Class | $1,000 | $1,017.11 | $7.75 | 1.55% |
| *Expenses are equal to the class’s annualized expense ratio listed in the table above, multiplied by the average account value over the period, |
| multiplied by 181, the number of days in the most recent fiscal half-year, divided by 365, to reflect the one-half year period. |
10
| | | | | | |
| Disciplined Growth | | | | | |
| |
| JUNE 30, 2010 | | | | | | |
| | Shares | Value | | | Shares | Value |
| Common Stocks — 99.2% | | | F5 Networks, Inc.(1) | 538 | $ 36,891 |
| AEROSPACE & DEFENSE — 2.1% | | | | QUALCOMM, Inc. | 2,072 | 68,044 |
| | | | | Research In Motion Ltd.(1) | 741 | 36,502 |
| Boeing Co. (The) | 1,983 | $ 124,433 | | | | |
| ITT Corp. | 634 | 28,479 | | | | 593,306 |
| Raytheon Co. | 3,244 | 156,977 | | COMPUTERS & PERIPHERALS — 8.7% | |
| United Technologies Corp. | 407 | 26,419 | | Apple, Inc.(1) | 3,257 | 819,233 |
| | | 336,308 | | EMC Corp.(1) | 7,921 | 144,954 |
| AIR FREIGHT & LOGISTICS — 1.0% | | | Hewlett-Packard Co. | 3,450 | 149,316 |
| United Parcel Service, Inc., | | | | SanDisk Corp.(1) | 238 | 10,013 |
| Class B | 2,930 | 166,688 | | Seagate Technology(1) | 3,656 | 47,674 |
| AUTO COMPONENTS — 0.3% | | | | Teradata Corp.(1) | 4,914 | 149,779 |
| Johnson Controls, Inc. | 1,463 | 39,311 | | Western Digital Corp.(1) | 2,381 | 71,811 |
| AUTOMOBILES — 0.7% | | | | | | 1,392,780 |
| Ford Motor Co.(1) | 10,647 | 107,322 | | CONSUMER FINANCE — 0.6% | | |
| BEVERAGES — 2.8% | | | | AmeriCredit Corp.(1) | 5,434 | 99,007 |
| Coca-Cola Co. (The) | 2,375 | 119,035 | | DIVERSIFIED CONSUMER SERVICES — 0.1% | |
| Coca-Cola Enterprises, Inc. | 5,439 | 140,653 | | ITT Educational | | |
| Dr Pepper Snapple | | | | Services, Inc.(1) | 131 | 10,876 |
| Group, Inc. | 3,375 | 126,191 | | DIVERSIFIED FINANCIAL SERVICES — 0.5% | |
| PepsiCo, Inc. | 1,043 | 63,571 | | JPMorgan Chase & Co. | 2,280 | 83,471 |
| | | 449,450 | | ELECTRICAL EQUIPMENT — 1.7% | |
| BIOTECHNOLOGY — 2.0% | | | | Emerson Electric Co. | 4,803 | 209,843 |
| Amgen, Inc.(1) | 2,025 | 106,515 | | Rockwell Automation, Inc. | 1,114 | 54,686 |
| Celgene Corp.(1) | 640 | 32,525 | | | | 264,529 |
| Gilead Sciences, Inc.(1) | 5,321 | 182,404 | | ELECTRONIC EQUIPMENT, INSTRUMENTS | |
| | | 321,444 | | & COMPONENTS — 0.7% | | |
| CAPITAL MARKETS — 0.2% | | | | Tyco Electronics Ltd. | 4,467 | 113,372 |
| Affiliated Managers | | | | ENERGY EQUIPMENT & SERVICES — 1.0% | |
| Group, Inc.(1) | 148 | 8,994 | | Schlumberger Ltd. | 1,604 | 88,765 |
| American Capital Ltd.(1) | 2,222 | 10,710 | | Weatherford | | |
| Bank of New York Mellon | | | | International Ltd.(1) | 5,063 | 66,528 |
| Corp. (The) | 181 | 4,469 | | | | 155,293 |
| T. Rowe Price Group, Inc. | 45 | 1,997 | | FOOD & STAPLES RETAILING — 2.4% | |
| | | 26,170 | | Wal-Mart Stores, Inc. | 5,175 | 248,762 |
| CHEMICALS — 1.2% | | | | Whole Foods Market, Inc.(1) | 3,853 | 138,785 |
| Eastman Chemical Co. | 2,047 | 109,228 | | | | 387,547 |
| Lubrizol Corp. | 1,093 | 87,779 | | FOOD PRODUCTS — 2.1% | | |
| | | 197,007 | | ConAgra Foods, Inc. | 4,760 | 111,003 |
| COMMERCIAL BANKS — 0.8% | | | | Corn Products | | |
| PNC Financial Services | | | | International, Inc. | 423 | 12,817 |
| Group, Inc. | 73 | 4,124 | | Hershey Co. (The) | 1,695 | 81,241 |
| Toronto-Dominion Bank (The) | 1,282 | 83,215 | | Mead Johnson Nutrition Co. | 948 | 47,514 |
| Wells Fargo & Co. | 1,653 | 42,317 | | Sara Lee Corp. | 278 | 3,920 |
| | | 129,656 | | Tyson Foods, Inc., Class A | 5,055 | 82,851 |
| COMMUNICATIONS EQUIPMENT — 3.7% | | | | | 339,346 |
| Acme Packet, Inc.(1) | 2,684 | 72,146 | | | | |
| Cisco Systems, Inc.(1) | 17,819 | 379,723 | | | | |
11
| | | | | | |
| Disciplined Growth | | | | | |
| |
| | Shares | Value | | | Shares | Value |
| HEALTH CARE EQUIPMENT & SUPPLIES — 3.8% | | IT SERVICES — 6.1% | | |
| Alcon, Inc. | 842 | $ 124,776 | | Accenture plc, Class A | 839 | $ 32,427 |
| Hill-Rom Holdings, Inc. | 1,261 | 38,372 | | Cognizant Technology | | |
| Hologic, Inc.(1) | 2,553 | 35,563 | | Solutions Corp., Class A(1) | 1,897 | 94,964 |
| Intuitive Surgical, Inc.(1) | 475 | 149,920 | | Global Payments, Inc. | 2,159 | 78,890 |
| Medtronic, Inc. | 3,830 | 138,914 | | International Business | | |
| Sirona Dental | | | | Machines Corp. | 4,937 | 609,621 |
| Systems, Inc.(1) | 3,093 | 107,760 | | Lender Processing | | |
| STERIS Corp. | 397 | 12,339 | | Services, Inc. | 1,078 | 33,752 |
| | | | | NeuStar, Inc., Class A(1) | 1,599 | 32,971 |
| | | 607,644 | | | | |
| HEALTH CARE PROVIDERS & SERVICES — 2.1% | | VeriFone Systems, Inc.(1) | 4,530 | 85,753 |
| Cardinal Health, Inc. | 2,100 | 70,581 | | | | 968,378 |
| Express Scripts, Inc.(1) | 1,662 | 78,147 | | LEISURE EQUIPMENT & PRODUCTS — 0.5% | |
| Medco Health | | | | Polaris Industries, Inc. | 1,525 | 83,295 |
| Solutions, Inc.(1) | 3,381 | 186,226 | | LIFE SCIENCES TOOLS & SERVICES — 1.0% | |
| | | 334,954 | | Bruker Corp.(1) | 113 | 1,374 |
| HEALTH CARE TECHNOLOGY — 0.6% | | | Illumina, Inc.(1) | 2,096 | 91,239 |
| SXC Health Solutions Corp.(1) | 1,187 | 86,948 | | Waters Corp.(1) | 1,064 | 68,841 |
| HOTELS, RESTAURANTS & LEISURE — 2.6% | | | | | 161,454 |
| Las Vegas Sands Corp.(1) | 4,340 | 96,088 | | MACHINERY — 3.8% | | |
| McDonald’s Corp. | 936 | 61,654 | | Caterpillar, Inc. | 1,786 | 107,285 |
| MGM Resorts International(1) | 7,119 | 68,627 | | Cummins, Inc. | 191 | 12,440 |
| Starbucks Corp. | 7,761 | 188,592 | | Donaldson Co., Inc. | 545 | 23,244 |
| | | 414,961 | | Graco, Inc. | 826 | 23,285 |
| HOUSEHOLD DURABLES — 1.1% | | | | Nordson Corp. | 1,866 | 104,645 |
| Tempur-Pedic | | | | Oshkosh Corp.(1) | 3,078 | 95,911 |
| International, Inc.(1) | 3,401 | 104,581 | | | | |
| | | | | Timken Co. | 4,296 | 111,653 |
| Whirlpool Corp. | 869 | 76,315 | | Toro Co. (The) | 2,529 | 124,224 |
| | | 180,896 | | | | 602,687 |
| HOUSEHOLD PRODUCTS — 2.2% | | | | MEDIA — 1.0% | | |
| Colgate-Palmolive Co. | 1,539 | 121,212 | | DIRECTV, Class A(1) | 4,614 | 156,507 |
| Kimberly-Clark Corp. | 1,406 | 85,246 | | | | |
| Procter & Gamble Co. (The) | 2,438 | 146,231 | | METALS & MINING — 1.3% | | |
| | | | | Freeport-McMoRan | | |
| | | 352,689 | | Copper & Gold, Inc. | 994 | 58,775 |
| INDUSTRIAL CONGLOMERATES — 2.3% | | | Newmont Mining Corp. | 1,077 | 66,494 |
| 3M Co. | 3,440 | 271,726 | | Reliance Steel | | |
| Carlisle Cos., Inc. | 2,640 | 95,383 | | & Aluminum Co. | 1,138 | 41,139 |
| | | 367,109 | | Walter Energy, Inc. | 695 | 42,291 |
| INSURANCE — 0.6% | | | | | | 208,699 |
| Aflac, Inc. | 2,259 | 96,391 | | MULTILINE RETAIL — 2.1% | | |
| INTERNET & CATALOG RETAIL — 2.1% | | | Dollar Tree, Inc.(1) | 4,116 | 171,349 |
| Amazon.com, Inc.(1) | 1,716 | 187,490 | | Family Dollar Stores, Inc. | 1,122 | 42,288 |
| Netflix, Inc.(1) | 1,381 | 150,046 | | Kohl’s Corp.(1) | 2,063 | 97,992 |
| | | 337,536 | | Nordstrom, Inc. | 140 | 4,507 |
| INTERNET SOFTWARE & SERVICES — 2.6% | | | Target Corp. | 457 | 22,471 |
| Google, Inc., Class A(1) | 939 | 417,808 | | | | 338,607 |
| VeriSign, Inc.(1) | 138 | 3,664 | | | | |
| | | 421,472 | | | | |
12
| | | | | | | |
| Disciplined Growth | | | | | | |
| |
| | Shares | Value | | | | Shares | Value |
| OIL, GAS & CONSUMABLE FUELS — 6.1% | | | SPECIALTY RETAIL — 3.8% | | |
| Cimarex Energy Co. | 677 | $ 48,460 | | Bed Bath & Beyond, Inc.(1) | 1,401 | $ 51,949 |
| Exxon Mobil Corp. | 11,370 | 648,886 | | Gap, Inc. (The) | 976 | 18,993 |
| Mariner Energy, Inc.(1) | 1,996 | 42,874 | | Limited Brands, Inc. | 263 | 5,804 |
| Massey Energy Co. | 315 | 8,615 | | PetSmart, Inc. | 3,598 | 108,552 |
| Occidental Petroleum Corp. | 299 | 23,068 | | Ross Stores, Inc. | 2,764 | 147,293 |
| Peabody Energy Corp. | 798 | 31,226 | | TJX Cos., Inc. (The) | 4,168 | 174,848 |
| Plains Exploration & | | | | Williams-Sonoma, Inc. | 4,007 | 99,454 |
| Production Co.(1) | 2,406 | 49,587 | | | | | |
| | | | | | | | 606,893 |
| Quicksilver Resources, Inc.(1) | 6,788 | 74,668 | | TEXTILES, APPAREL & LUXURY GOODS — 0.8% |
| SM Energy Co. | 723 | 29,036 | | Coach, Inc. | 466 | 17,032 |
| Suncor Energy, Inc. | 543 | 15,986 | | Deckers Outdoor Corp.(1) | 612 | 87,437 |
| | | 972,406 | | Lululemon Athletica, Inc.(1) | 514 | 19,131 |
| PAPER & FOREST PRODUCTS — 0.7% | | | | | | 123,600 |
| International Paper Co. | 4,980 | 112,697 | | | | | |
| | | | | TOBACCO — 1.4% | | |
| PERSONAL PRODUCTS — 1.3% | | | | | | | |
| | | | | Philip Morris | | |
| Estee Lauder Cos., Inc. (The), | | | | International, Inc. | 4,930 | 225,991 |
| Class A | 2,171 | 120,990 | | | | | |
| | | | | TOTAL COMMON STOCKS | | |
| Nu Skin Enterprises, Inc., | | | | (Cost $14,674,713) | | 15,832,514 |
| Class A | 3,200 | 79,776 | | | | | |
| | | 200,766 | | Temporary Cash Investments — 0.8% |
| PHARMACEUTICALS — 4.3% | | | | JPMorgan U.S. Treasury | | |
| Abbott Laboratories | 3,528 | 165,040 | | Plus Money Market Fund | | |
| Allergan, Inc. | 1,731 | 100,848 | | Agency Shares | 28,292 | 28,292 |
| | | | | Repurchase Agreement, Bank | | |
| Bristol-Myers Squibb Co. | 2,263 | 56,439 | | of America Securities, LLC, | | |
| Eli Lilly & Co. | 1,573 | 52,696 | | (collateralized by various | | |
| Johnson & Johnson | 2,490 | 147,059 | | U.S. Treasury obligations, 1.125%, | | |
| Perrigo Co. | 2,669 | 157,658 | | 6/30/11, valued at $101,993), in a | | |
| | | | | joint trading account at 0.01%, | | |
| | | 679,740 | | dated 6/30/10, due 7/1/10 | | |
| SEMICONDUCTORS & SEMICONDUCTOR | | | (Delivery value $100,000) | | 100,000 |
| EQUIPMENT — 5.1% | | | | TOTAL TEMPORARY | | |
| Broadcom Corp., Class A | 5,252 | 173,159 | | CASH INVESTMENTS | | |
| Intel Corp. | 15,173 | 295,115 | | (Cost $128,292) | | 128,292 |
| Marvell Technology | | | | TOTAL INVESTMENT | | |
| Group Ltd.(1) | 5,453 | 85,939 | | SECURITIES — 100.0% | | |
| Micron Technology, Inc.(1) | 3,321 | 28,195 | | (Cost $14,803,005) | | 15,960,806 |
| NVIDIA Corp.(1) | 1,025 | 10,465 | | OTHER ASSETS AND LIABILITIES(2) | (959) |
| Sunpower Corp., Class A(1) | 5,840 | 70,664 | | TOTAL NET ASSETS — 100.0% | | $15,959,847 |
| Texas Instruments, Inc. | 6,382 | 148,573 | | | | | |
| | | 812,110 | | Notes to Schedule of Investments | |
| SOFTWARE — 7.3% | | | | (1) | Non-income producing. | | |
| Activision Blizzard, Inc. | 4,190 | 43,953 | | (2) | Category is less than 0.05% of total net assets. | |
| Adobe Systems, Inc.(1) | 2,406 | 63,591 | | | | | |
| Intuit, Inc.(1) | 4,102 | 142,627 | | Industry classifications are unaudited. | | |
| Microsoft Corp. | 21,330 | 490,803 | | | | | |
| Oracle Corp. | 13,272 | 284,817 | | | | | |
| Symantec Corp.(1) | 1,165 | 16,170 | | See Notes to Financial Statements. | | |
| VMware, Inc., Class A(1) | 1,969 | 123,240 | | | | | |
| | | 1,165,201 | | | | | |
13
|
| Statement of Assets and Liabilities |
| |
| JUNE 30, 2010 | |
| Assets | |
| Investment securities, at value (cost of $14,803,005) | $15,960,806 |
| Receivable for capital shares sold | 2,520 |
| Dividends and interest receivable | 10,859 |
| | 15,974,185 |
| | |
| Liabilities | |
| Accrued management fees | 14,002 |
| Service fees (and distribution fees – A Class and R Class) payable | 273 |
| Distribution fees payable | 63 |
| | 14,338 |
| | |
| Net Assets | $15,959,847 |
| | |
| Net Assets Consist of: | |
| Capital (par value and paid-in surplus) | $19,061,090 |
| Accumulated net realized loss on investment transactions | (4,259,044) |
| Net unrealized appreciation on investments | 1,157,801 |
| | $15,959,847 |
| | | |
| | Net assets | Shares outstanding | Net asset value per share |
| Investor Class, $0.01 Par Value | $12,786,843 | 1,379,836 | $9.27 |
| Institutional Class, $0.01 Par Value | $2,152,497 | 231,537 | $9.30 |
| A Class, $0.01 Par Value | $661,125 | 71,622 | $9.23* |
| B Class, $0.01 Par Value | $54,664 | 6,002 | $9.11 |
| C Class, $0.01 Par Value | $40,980 | 4,499 | $9.11 |
| R Class, $0.01 Par Value | $263,738 | 28,773 | $9.17 |
| *Maximum offering price $9.79 (net asset value divided by 0.9425) | | |
| |
| |
| See Notes to Financial Statements. | | | |
14
| |
| YEAR ENDED JUNE 30, 2010 | |
| Investment Income (Loss) | |
| Income: | |
| Dividends | $ 240,058 |
| Interest | 106 |
| | 240,164 |
| | |
| Expenses: | |
| Management fees | 160,894 |
| Distribution fees: | |
| B Class | 330 |
| C Class | 376 |
| Service fees: | |
| B Class | 110 |
| C Class | 125 |
| Distribution and service fees: | |
| A Class | 1,111 |
| R Class | 1,768 |
| Directors’ fees and expenses | 474 |
| Other expenses | 518 |
| | 165,706 |
| | |
| Net investment income (loss) | 74,458 |
| | |
| Realized and Unrealized Gain (Loss) | |
| Net realized gain (loss) on investment transactions | 571,034 |
| Change in net unrealized appreciation (depreciation) on investments | 1,449,372 |
| | |
| Net realized and unrealized gain (loss) | 2,020,406 |
| | |
| Net Increase (Decrease) in Net Assets Resulting from Operations | $2,094,864 |
| |
| |
| See Notes to Financial Statements. | |
15
|
| Statement of Changes in Net Assets |
| | |
| YEARS ENDED JUNE 30, 2010 AND JUNE 30, 2009 | | |
| Increase (Decrease) in Net Assets | 2010 | 2009 |
| Operations | | |
| Net investment income (loss) | $ 74,458 | $ 66,088 |
| Net realized gain (loss) | 571,034 | (4,351,698) |
| Change in net unrealized appreciation (depreciation) | 1,449,372 | (1,749,087) |
| Net increase (decrease) in net assets resulting from operations | 2,094,864 | (6,034,697) |
| | | |
| Distributions to Shareholders | | |
| From net investment income: | | |
| Investor Class | (68,774) | (43,563) |
| Institutional Class | (20,108) | (15,865) |
| A Class | (1,108) | (641) |
| R Class | (95) | — |
| Decrease in net assets from distributions | (90,085) | (60,069) |
| | | |
| Capital Share Transactions | | |
| Net increase (decrease) in net assets from capital share transactions | 345,348 | (1,774,539) |
| | | |
| | | |
| Net increase (decrease) in net assets | 2,350,127 | (7,869,305) |
| | | |
| Net Assets | | |
| Beginning of period | 13,609,720 | 21,479,025 |
| End of period | $15,959,847 | $13,609,720 |
| | | |
| Undistributed net investment income | — | $6,924 |
| |
| |
| See Notes to Financial Statements. | | |
16
|
| Notes to Financial Statements |
JUNE 30, 2010
1. Organization and Summary of Significant Accounting Policies
Organization — American Century Quantitative Equity Funds, Inc. (the corporation) is registered under the Investment Company Act of 1940 (the 1940 Act) as an open-end management investment company. Disciplined Growth Fund (the fund) is one fund in a series issued by the corporation. The fund is diversified under the 1940 Act. The fund’s investment objective is to seek long-term capital growth by investing in common stocks. The following is a summary of the fund’s significant accounting policies.
Multiple Class — The fund is authorized to issue the Investor Class, the Institutional Class, the A Class, the B Class, the C Class and the R Class. The A Class may incur an initial sales charge. The A Class, B Class and C Class may be subject to a contingent deferred sales charge. The share classes differ principally in their respective sales charges and distribution and shareholder servicing expenses and arrangements. All shares of the fund represent an equal pro rata interest in the net assets of the class to which such shares belong, and have identical voting, dividend, liquidation and other rights and the same terms and conditions, except for class specific expenses and exclusive rights to vote on matters affecting only individual classes. Income, non-class specific expenses, and realized and unrealized capital gains and losses of the fund are allocated to each class of shares based on their relative net assets.
Security Valuations — Securities traded primarily on a principal securities exchange are valued at the last reported sales price, or at the mean of the latest bid and asked prices where no last sales price is available. Depending on local convention or regulation, securities traded over-the-counter are valued at the mean of the latest bid and asked prices, the last sales price, or the official close price. Investments in open-end management investment companies are valued at the reported net asset value. Discount notes may be valued through a commercial pricing service or at amortized cost, which approximates fair value. Securities traded on foreign securities exchanges and over-the-counter markets are normally completed before the close of business on days that the New York Stock Exchange (the Exchange) is open and may also take place on days when the Exchange is not open. If an event occurs after the value of a security was established but before the net asset value per share was determined that was likely to materially change the net asset value, that security would be valued as determined in accordance with procedures adopted by the Board of Directors. If the fund determines that the market price of a portfolio security is not readily available, or that the valuation methods mentioned above do not reflect the security’s fair value, such security is valued as determined by the Board of Directors or its designee, in accordance with procedures adopted by the Board of Directors, if such determination would materially impact a fund’s net asset value. Certain other circumstances may cause the fund to use alternative procedures to value a security such as: a security has been declared in default; trading in a security has been halted during the trading day; or there is a foreign market holiday and no trading will commence .
Security Transactions — For financial reporting purposes, security transactions are accounted for as of the trade date. Net realized gains and losses are determined on the identified cost basis, which is also used for federal income tax purposes.
Investment Income — Dividend income less foreign taxes withheld, if any, is recorded as of the ex-dividend date. Interest income is recorded on the accrual basis and includes accretion of discounts and amortization of premiums.
17
Repurchase Agreements — The fund may enter into repurchase agreements with institutions that American Century Investment Management, Inc. (ACIM) (the investment advisor) has determined are creditworthy pursuant to criteria adopted by the Board of Directors. Each repurchase agreement is recorded at cost. The fund requires that the collateral, represented by securities, received in a repurchase transaction be transferred to the custodian in a manner sufficient to enable the fund to obtain those securities in the event of a default under the repurchase agreement. ACIM monitors, on a daily basis, the securities transferred to ensure the value, including accrued interest, of the securities under each repurchase agreement is equal to or greater than amounts owed to the fund under each repurchase agreement.
Joint Trading Account — Pursuant to an Exemptive Order issued by the Securities and Exchange Commission, the fund, along with certain other funds in the American Century Investments family of funds, may transfer uninvested cash balances into a joint trading account. These balances are invested in one or more repurchase agreements that are collateralized by U.S. Treasury or Agency obligations.
Income Tax Status — It is the fund’s policy to distribute substantially all net investment income and net realized gains to shareholders and to otherwise qualify as a regulated investment company under provisions of the Internal Revenue Code. The fund is no longer subject to examination by tax authorities for years prior to 2006. At this time, management believes there are no uncertain tax positions which, based on their technical merit, would not be sustained upon examination and for which it is reasonably possible that the total amounts of unrecognized tax benefits will significantly change in the next twelve months. Accordingly, no provision has been made for federal or state income taxes.
Distributions to Shareholders — Distributions to shareholders are recorded on the ex-dividend date. Distributions from net investment income, if any, are generally declared and paid semiannually. Distributions from net realized gains, if any, are generally declared and paid annually.
Indemnifications — Under the corporation’s organizational documents, its officers and directors are indemnified against certain liabilities arising out of the performance of their duties to the fund. In addition, in the normal course of business, the fund enters into contracts that provide general indemnifications. The maximum exposure under these arrangements is unknown as this would involve future claims that may be made against a fund. The risk of material loss from such claims is considered by management to be remote.
Use of Estimates — The financial statements are prepared in conformity with accounting principles generally accepted in the United States of America, which may require management to make certain estimates and assumptions at the date of the financial statements. Actual results could differ from these estimates.
Subsequent Events — In preparing the financial statements, management evaluated the impact of events or transactions occurring through the date the financial statements were issued that would merit recognition or disclosure.
18
2. Fees and Transactions with Related Parties
Management Fees — The corporation has entered into a Management Agreement with ACIM, under which ACIM provides the fund with investment advisory and management services in exchange for a single, unified management fee (the fee) per class. The Agreement provides that all expenses of managing and operating the fund, except brokerage expenses, taxes, interest, fees and expenses of the independent directors (including legal counsel fees), and extraordinary expenses, will be paid by ACIM. The fee is computed and accrued daily based on the daily net assets of the specific class of shares of the fund and paid monthly in arrears. The fee consists of (1) an Investment Category Fee based on the daily net assets of the fund and certain other accounts managed by the investment advisor that are in the same broad investment category as the fund and (2) a Complex Fee based on the assets of all the funds in the American Century Investments family of funds. The rates for the Investment Category Fee range from 0.6880% to 0.8700%. The rates for the Complex Fee range from 0.2500% to 0.3100% for the Investor Class, A Class, B Class, C Class and R Class. The Institutional Class is 0.2000% less at each point within the Complex Fee range. The effective annual management fee for each class for the year ended June 30, 2010 was 1.04% for the Investor Class, A Class, B Class, C Class and R Class and 0.84% for the Institutional Class.
Distribution and Service Fees — The Board of Directors has adopted a separate Master Distribution and Individual Shareholder Services Plan for each of the A Class, B Class, C Class and R Class (collectively the plans), pursuant to Rule 12b-1 of the 1940 Act. The plans provide that the A Class will pay American Century Investment Services, Inc. (ACIS) an annual distribution and service fee of 0.25%. The plans provide that the B Class and C Class will each pay ACIS an annual distribution fee of 0.75% and service fee of 0.25%. The plans provide that the R Class will pay ACIS an annual distribution and service fee of 0.50%. The fees are computed and accrued daily based on each class’s daily net assets and paid monthly in arrears. The fees are used to pay financial intermediaries for distribution and individual shareholde r services. Fees incurred under the plans during the year ended June 30, 2010, are detailed in the Statement of Operations.
Related Parties — Certain officers and directors of the corporation are also officers and/ or directors of American Century Companies, Inc. (ACC), the parent of the corporation’s investment advisor, ACIM, the distributor of the corporation, ACIS, and the corporation’s transfer agent, American Century Services, LLC.
The fund is eligible to invest in a money market fund for temporary purposes, which is managed by J.P. Morgan Investment Management, Inc. (JPMIM). The fund has a Mutual Funds Services Agreement with J.P. Morgan Investor Services Co. (JPMIS) and a securities lending agreement with JPMorgan Chase Bank (JPMCB). JPMCB is a custodian of the fund. JPMIM, JPMIS and JPMCB are wholly owned subsidiaries of JPMorgan Chase & Co. (JPM). JPM is an equity investor in ACC.
3. Investment Transactions
Purchases and sales of investment securities, excluding short-term investments, for the year ended June 30, 2010, were $13,388,874 and $13,074,895, respectively.
19
| | | | |
| 4. Capital Share Transactions | | | | |
| |
| Transactions in shares of the fund were as follows: | | |
| | Year ended June 30, 2010 | Year ended June 30, 2009 |
| | Shares | Amount | Shares | Amount |
| Investor Class/Shares Authorized | 50,000,000 | | 80,000,000 | |
| Sold | 510,456 | $4,912,469 | 278,559 | $ 2,143,625 |
| Issued in reinvestment of distributions | 6,537 | 64,129 | 6,002 | 41,955 |
| Redeemed | (440,705) | (4,161,868) | (428,464) | (3,295,292) |
| | 76,288 | 814,730 | (143,903) | (1,109,712) |
| Institutional Class/Shares Authorized | 10,000,000 | | 10,000,000 | |
| Sold | 50,022 | 482,024 | 52,851 | 403,445 |
| Issued in reinvestment of distributions | 2,045 | 20,108 | 2,263 | 15,865 |
| Redeemed | (102,405) | (972,968) | (149,290) | (1,171,779) |
| | (50,338) | (470,836) | (94,176) | (752,469) |
| A Class/Shares Authorized | 10,000,000 | | 10,000,000 | |
| Sold | 52,199 | 516,352 | 38,955 | 304,771 |
| Issued in reinvestment of distributions | 111 | 1,086 | 90 | 630 |
| Redeemed | (31,879) | (293,445) | (39,437) | (279,324) |
| | 20,431 | 223,993 | (392) | 26,077 |
| B Class/Shares Authorized | 10,000,000 | | 10,000,000 | |
| Sold | 2,723 | 26,373 | 1,269 | 9,737 |
| C Class/Shares Authorized | 10,000,000 | | 10,000,000 | |
| Sold | 1,067 | 9,604 | 4,854 | 36,608 |
| Redeemed | (3,432) | (31,950) | — | — |
| | (2,365) | (22,346) | 4,854 | 36,608 |
| R Class/Shares Authorized | 10,000,000 | | 10,000,000 | |
| Sold | 119 | 1,182 | 3,945 | 38,118 |
| Issued in reinvestment of distributions | 10 | 95 | — | — |
| Redeemed | (24,009) | (227,843) | (3,692) | (22,898) |
| | (23,880) | (226,566) | 253 | 15,220 |
| Net increase (decrease) | 22,859 | $ 345,348 | (232,095) | $(1,774,539) |
5. Fair Value Measurements
The fund’s securities valuation process is based on several considerations and may use multiple inputs to determine the fair value of the positions held by the fund. In conformity with accounting principles generally accepted in the United States of America, the inputs used to determine a valuation are classified into three broad levels as follows:
• Level 1 valuation inputs consist of unadjusted quoted prices in an active market for identical securities;
• Level 2 valuation inputs consist of significant direct or indirect observable market data (including quoted prices for similar securities, evaluations of subsequent market events, interest rates, prepayment speeds, credit risk, etc.); or
• Level 3 valuation inputs consist of significant unobservable inputs (including a fund’s own assumptions).
20
The level classification is based on the lowest level input that is significant to the fair valuation measurement. The valuation inputs are not an indication of the risks associated with investing in these securities or other financial instruments.
The following is a summary of the valuation inputs used to determine the fair value of the fund’s securities as of June 30, 2010. The Schedule of Investments provides additional details on the fund’s portfolio holdings.
| | | |
| | Level 1 | Level 2 | Level 3 |
| Investment Securities | | | |
| Common Stocks | $15,832,514 | — | — |
| Temporary Cash Investments | 28,292 | $100,000 | — |
| Total Value of Investment Securities | $15,860,806 | $100,000 | — |
6. Interfund Lending
The fund, along with certain other funds in the American Century Investments family of funds, may participate in an interfund lending program, pursuant to an Exemptive Order issued by the Securities and Exchange Commission (SEC). This program provides an alternative credit facility allowing the fund to borrow from or lend to other funds in the American Century Investments family of funds that permit such transactions. Interfund lending transactions are subject to each fund’s investment policies and borrowing and lending limits. The interfund loan rate earned/paid on interfund lending transactions is determined daily based on the average of certain current market rates. Interfund lending transactions normally extend only overnight, but can have a maximum duration of seven days. The program is subject to annual approval by the Board of Directors. During the year ended June 30, 2010, the fund did not utilize the program.
7. Federal Tax Information
The tax character of distributions paid during the years ended June 30, 2010 and June 30, 2009 were as follows:
| | |
| | 2010 | 2009 |
| Distributions Paid From | | |
| Ordinary income | $90,085 | $60,069 |
| Long-term capital gains | — | — |
The book-basis character of distributions made during the year from net investment income or net realized gains may differ from their ultimate characterization for federal income tax purposes. These differences reflect the differing character of certain income items and net realized gains and losses for financial statement and tax purposes, and may result in reclassification among certain capital accounts on the financial statements.
As of June 30, 2010, the federal tax cost of investments and the components of distributable earnings on a tax-basis were as follows:
| | |
| Federal tax cost of investments | $14,860,686 |
| Gross tax appreciation of investments | $1,932,367 |
| Gross tax depreciation of investments | (832,247) |
| Net tax appreciation (depreciation) of investments | $1,100,120 |
| Undistributed ordinary income | — |
| Accumulated capital losses | $(4,201,363) |
21
The difference between book-basis and tax-basis cost and unrealized appreciation (depreciation) is attributable primarily to the tax deferral of losses on wash sales.
The accumulated capital losses listed on the previous page represent net capital loss carryovers that may be used to offset future realized capital gains for federal income tax purposes. Future capital loss carryover utilization in any given year may be subject to Internal Revenue Code limitations. Capital loss carryovers of $(1,666,672) and $(2,534,691) expire in 2017 and 2018, respectively.
8. Corporate Event
As part of a long-standing estate and business succession plan established by ACC Co-Chairman James E. Stowers, Jr., the founder of American Century Investments, ACC Co-Chairman Richard W. Brown succeeded Mr. Stowers as trustee of a trust that holds a greater-than-25% voting interest in ACC, the parent corporation of the fund’s advisor. Under the 1940 Act, this is presumed to represent control of ACC even though it is less than a majority interest. The change of trustee may technically be considered a “change of control” of ACC and therefore also a change of control of the fund’s advisor even though there has been no change to its management and none is anticipated. The “change of control” resulted in the assignment of the fund’s investment advisory agreement. Under the 1940 Act, an assignment automatically terminated such agreement, making the approval of a new agreement necessa ry.
On February 18, 2010, the Board of Directors approved an interim investment advisory agreement under which the fund will be managed until a new agreement is approved by fund shareholders. On April 1, 2010, the Board of Directors approved a new investment advisory agreement. The interim agreement and the new agreement are substantially identical to the terminated agreements (with the exception of different effective and termination dates) and will not result in changes in the management of American Century Investments, the fund, its investment objectives, fees or services provided. The new agreement for the fund was approved by shareholders at a Special Meeting of Shareholders on June 16, 2010. The new agreement went into effect on July 16, 2010.
9. Other Tax Information (Unaudited)
The following information is provided pursuant to provisions of the Internal Revenue Code.
The fund hereby designates up to the maximum amount allowable as qualified dividend income for the fiscal year ended June 30, 2010.
For corporate taxpayers, the fund hereby designates $90,085, or up to the maximum amount allowable, of ordinary income distributions paid during the fiscal year ended June 30, 2010 as qualified for the corporate dividends received deduction.
22
| | | | | | | |
| Disciplined Growth | | | | | |
| |
| Investor Class | | | | | | |
| For a Share Outstanding Throughout the Years Ended June 30 (except as noted) | | |
| | | 2010 | 2009 | 2008 | 2007(1) | 2006 | 2005(2) |
| Per-Share Data | | | | | | |
| Net Asset Value, | | | | | | |
| Beginning of Period | $8.01 | $11.12 | $12.35 | $11.59 | $10.47 | $10.00 |
| Income From | | | | | | |
| Investment Operations | | | | | | |
| Net Investment | | | | | | |
| Income (Loss)(3) | 0.04 | 0.04 | (0.01) | (0.02) | (0.02) | 0.01 |
| Net Realized and | | | | | | |
| Unrealized Gain (Loss) | 1.27 | (3.12) | (0.74) | 0.83 | 1.20 | 0.48 |
| Total From | | | | | | |
| Investment Operations | 1.31 | (3.08) | (0.75) | 0.81 | 1.18 | 0.49 |
| Distributions | | | | | | |
| From Net | | | | | | |
| Investment Income | (0.05) | (0.03) | — | — | — | (0.02) |
| From Net Realized Gains | — | — | (0.48) | (0.05) | (0.06) | — |
| Total Distributions | (0.05) | (0.03) | (0.48) | (0.05) | (0.06) | (0.02) |
| Net Asset Value, | | | | | | |
| End of Period | $9.27 | $8.01 | $11.12 | $12.35 | $11.59 | $10.47 |
| |
| Total Return(4) | 16.35% | (27.63)% | (6.38)% | 7.00% | 11.30% | 4.87% |
| | | | | | | |
| Ratios/Supplemental Data | | | | | | |
| Ratio of Operating | | | | | | |
| Expenses to Average | | | | | | |
| Net Assets | 1.05% | 1.05% | 1.03% | 1.02%(5) | 1.02% | 1.02%(5) |
| Ratio of Net Investment | | | | | | |
| Income (Loss) to Average | | | | | | |
| Net Assets | 0.46% | 0.44% | (0.07)% | (0.29)%(5) | (0.21)% | (0.28)%(5) |
| Portfolio Turnover Rate | 84% | 98% | 134% | 78% | 124% | 37% |
| Net Assets, End of Period | | | | | | |
| (in thousands) | $12,787 | $10,440 | $16,093 | $22,775 | $16,709 | $8,569 |
| (1) | January 1, 2007 through June 30, 2007. The fund’s fiscal year end was changed from December 31 to June 30, resulting in a six-month annual |
| | reporting period. For the years before June 30, 2007, the fund’s fiscal year end was December 31. | | |
| (2) | September 30, 2005 (fund inception) through December 31, 2005. | | | | |
| (3) | Computed using average shares outstanding throughout the period. | | | | |
| (4) | Total return assumes reinvestment of net investment income and capital gains distributions, if any. Total returns for periods less than one year |
| | are not annualized. Total returns are calculated based on the net asset value of the last business day. The total return of the classes may not |
| | precisely reflect the class expense differences because of the impact of calculating the net asset values to two decimal places. If net asset |
| | values were calculated to three decimal places, the total return differences would more closely reflect the class expense differences. The |
| | calculation of net asset values to two decimal places is made in accordance with SEC guidelines and does not result in any gain or loss of value |
| | between one class and another. | | | | | | |
| (5) | Annualized. | | | | | | |
See Notes to Financial Statements.
23
| | | | | | | |
| Disciplined Growth | | | | | |
| |
| Institutional Class | | | | | | |
| For a Share Outstanding Throughout the Years Ended June 30 (except as noted) | | |
| | | 2010 | 2009 | 2008 | 2007(1) | 2006 | 2005(2) |
| Per-Share Data | | | | | | |
| Net Asset Value, | | | | | | |
| Beginning of Period | $8.03 | $11.15 | $12.36 | $11.62 | $10.47 | $10.00 |
| Income From | | | | | | |
| Investment Operations | | | | | | |
| Net Investment | | | | | | |
| Income (Loss)(3) | 0.06 | 0.05 | 0.01 | —(4) | —(4) | 0.01 |
| Net Realized and | | | | | | |
| Unrealized Gain (Loss) | 1.28 | (3.12) | (0.74) | 0.81 | 1.21 | 0.48 |
| Total From | | | | | | |
| Investment Operations | 1.34 | (3.07) | (0.73) | 0.81 | 1.21 | 0.49 |
| Distributions | | | | | | |
| From Net | | | | | | |
| Investment Income | (0.07) | (0.05) | — | — | — | (0.02) |
| From Net Realized Gains | — | — | (0.48) | (0.07) | (0.06) | — |
| Total Distributions | (0.07) | (0.05) | (0.48) | (0.07) | (0.06) | (0.02) |
| Net Asset Value, | | | | | | |
| End of Period | $9.30 | $8.03 | $11.15 | $12.36 | $11.62 | $10.47 |
| |
| Total Return(5) | 16.67% | (27.50)% | (6.22)% | 7.02% | 11.59% | 4.91% |
| | | | | | | |
| Ratios/Supplemental Data | | | | | | |
| Ratio of Operating | | | | | | |
| Expenses to Average | | | | | | |
| Net Assets | 0.85% | 0.85% | 0.83% | 0.82%(6) | 0.82% | 0.82%(6) |
| Ratio of Net Investment | | | | | | |
| Income (Loss) to Average | | | | | | |
| Net Assets | 0.66% | 0.64% | 0.13% | (0.09)%(6) | (0.01)% | 0.48%(6) |
| Portfolio Turnover Rate | 84% | 98% | 134% | 78% | 124% | 37% |
| Net Assets, End of Period | | | | | | |
| (in thousands) | $2,152 | $2,265 | $4,194 | $6,918 | $3,940 | $524 |
| (1) | January 1, 2007 through June 30, 2007. The fund’s fiscal year end was changed from December 31 to June 30, resulting in a six-month annual |
| | reporting period. For the years before June 30, 2007, the fund’s fiscal year end was December 31. | | |
| (2) | September 30, 2005 (fund inception) through December 31, 2005. | | | | |
| (3) | Computed using average shares outstanding throughout the period. | | | | |
| (4) | Per-share amount was less than $0.005. | | | | | |
| (5) | Total return assumes reinvestment of net investment income and capital gains distributions, if any. Total returns for periods less than one year |
| | are not annualized. Total returns are calculated based on the net asset value of the last business day. The total return of the classes may not |
| | precisely reflect the class expense differences because of the impact of calculating the net asset values to two decimal places. If net asset |
| | values were calculated to three decimal places, the total return differences would more closely reflect the class expense differences. The |
| | calculation of net asset values to two decimal places is made in accordance with SEC guidelines and does not result in any gain or loss of value |
| | between one class and another. | | | | | | |
| (6) | Annualized. | | | | | | |
See Notes to Financial Statements.
24
| | | | | | | |
| Disciplined Growth | | | | | |
| |
| A Class(1) | | | | | | |
| For a Share Outstanding Throughout the Years Ended June 30 (except as noted) | | |
| | | 2010 | 2009 | 2008 | 2007(2) | 2006 | 2005(3) |
| Per-Share Data | | | | | | |
| Net Asset Value, | | | | | | |
| Beginning of Period | $7.98 | $11.07 | $12.33 | $11.56 | $10.46 | $10.00 |
| Income From | | | | | | |
| Investment Operations | | | | | | |
| Net Investment | | | | | | |
| Income (Loss)(4) | 0.02 | 0.02 | (0.04) | (0.03) | (0.05) | —(5) |
| Net Realized and | | | | | | |
| Unrealized Gain (Loss) | 1.26 | (3.09) | (0.74) | 0.82 | 1.21 | 0.47 |
| Total From | | | | | | |
| Investment Operations | 1.28 | (3.07) | (0.78) | 0.79 | 1.16 | 0.47 |
| Distributions | | | | | | |
| From Net | | | | | | |
| Investment Income | (0.03) | (0.02) | — | — | — | (0.01) |
| From Net Realized Gains | — | — | (0.48) | (0.02) | (0.06) | — |
| Total Distributions | (0.03) | (0.02) | (0.48) | (0.02) | (0.06) | (0.01) |
| Net Asset Value, | | | | | | |
| End of Period | $9.23 | $7.98 | $11.07 | $12.33 | $11.56 | $10.46 |
| |
| Total Return(6) | 16.00% | (27.76)% | (6.65)% | 6.84% | 11.12% | 4.72% |
| | | | | | | |
| Ratios/Supplemental Data | | | | | | |
| Ratio of Operating | | | | | | |
| Expenses to Average | | | | | | |
| Net Assets | 1.30% | 1.30% | 1.28% | 1.27%(7) | 1.27% | 1.27%(7) |
| Ratio of Net Investment | | | | | | |
| Income (Loss) to Average | | | | | | |
| Net Assets | 0.21% | 0.19% | (0.32)% | (0.54)%(7) | (0.46)% | 0.03%(7) |
| Portfolio Turnover Rate | 84% | 98% | 134% | 78% | 124% | 37% |
| Net Assets, End of Period | | | | | | |
| (in thousands) | $661 | $408 | $571 | $1,248 | $701 | $531 |
| (1) | Prior to September 4, 2007, the A Class was referred to as the Advisor Class. | | | |
| (2) | January 1, 2007 through June 30, 2007. The fund’s fiscal year end was changed from December 31 to June 30, resulting in a six-month annual |
| | reporting period. For the years before June 30, 2007, the fund’s fiscal year end was December 31. | | |
| (3) | September 30, 2005 (fund inception) through December 31, 2005. | | | | |
| (4) | Computed using average shares outstanding throughout the period. | | | | |
| (5) | Per-share amount was less than $0.005. | | | | | |
| (6) | Total return assumes reinvestment of net investment income and capital gains distributions, if any, and does not reflect applicable sales charges. |
| | Total returns for periods less than one year are not annualized. Total returns are calculated based on the net asset value of the last business day. |
| | The total return of the classes may not precisely reflect the class expense differences because of the impact of calculating the net asset values |
| | to two decimal places. If net asset values were calculated to three decimal places, the total return differences would more closely reflect the |
| | class expense differences. The calculation of net asset values to two decimal places is made in accordance with SEC guidelines and does not |
| | result in any gain or loss of value between one class and another. | | | | |
| (7) | Annualized. | | | | | | |
See Notes to Financial Statements.
25
| | | | |
| Disciplined Growth | | | |
| |
| B Class | | | |
| For a Share Outstanding Throughout the Years Ended June 30 (except as noted) | | |
| | | 2010 | 2009 | 2008(1) |
| Per-Share Data | | | |
| Net Asset Value, Beginning of Period | $7.91 | $11.04 | $12.93 |
| Income From Investment Operations | | | |
| Net Investment Income (Loss)(2) | (0.06) | (0.04) | (0.09) |
| Net Realized and Unrealized Gain (Loss) | 1.26 | (3.09) | (1.32) |
| Total From Investment Operations | 1.20 | (3.13) | (1.41) |
| Distributions | | | |
| From Net Realized Gains | — | — | (0.48) |
| Net Asset Value, End of Period | $9.11 | $7.91 | $11.04 |
| |
| Total Return(3) | 15.17% | (28.35)% | (11.22)% |
| | | | |
| Ratios/Supplemental Data | | | |
| Ratio of Operating Expenses to Average Net Assets | 2.05% | 2.05% | 2.03%(4) |
| Ratio of Net Investment Income (Loss) to Average Net Assets | (0.54)% | (0.56)% | (1.02)%(4) |
| Portfolio Turnover Rate | 84% | 98% | 134%(5) |
| Net Assets, End of Period (in thousands) | $55 | $26 | $22 |
| (1) | September 28, 2007 (commencement of sale) through June 30, 2008. | | | |
| (2) | Computed using average shares outstanding throughout the period. | | | |
| (3) | Total return assumes reinvestment of net investment income and capital gains distributions, if any, and does not reflect applicable sales charges. |
| | Total returns for periods less than one year are not annualized. Total returns are calculated based on the net asset value of the last business day. |
| | The total return of the classes may not precisely reflect the class expense differences because of the impact of calculating the net asset values |
| | to two decimal places. If net asset values were calculated to three decimal places, the total return differences would more closely reflect the |
| | class expense differences. The calculation of net asset values to two decimal places is made in accordance with SEC guidelines and does not |
| | result in any gain or loss of value between one class and another. | | | |
| (4) | Annualized. | | | |
| (5) | Portfolio turnover is calculated at the fund level. Percentage indicated was calculated for the year ended June 30, 2008. | |
See Notes to Financial Statements.
26
| | | | |
| Disciplined Growth | | | |
| |
| C Class | | | |
| For a Share Outstanding Throughout the Years Ended June 30 (except as noted) | | |
| | | 2010 | 2009 | 2008(1) |
| Per-Share Data | | | |
| Net Asset Value, Beginning of Period | $7.91 | $11.04 | $12.93 |
| Income From Investment Operations | | | |
| Net Investment Income (Loss)(2) | (0.05) | (0.04) | (0.09) |
| Net Realized and Unrealized Gain (Loss) | 1.25 | (3.09) | (1.32) |
| Total From Investment Operations | 1.20 | (3.13) | (1.41) |
| Distributions | | | |
| From Net Realized Gains | — | — | (0.48) |
| Net Asset Value, End of Period | $9.11 | $7.91 | $11.04 |
| |
| Total Return(3) | 15.17% | (28.35)% | (11.22)% |
| | | | |
| Ratios/Supplemental Data | | | |
| Ratio of Operating Expenses to Average Net Assets | 2.05% | 2.05% | 2.03%(4) |
| Ratio of Net Investment Income (Loss) to Average Net Assets | (0.54)% | (0.56)% | (1.01)%(4) |
| Portfolio Turnover Rate | 84% | 98% | 134%(5) |
| Net Assets, End of Period (in thousands) | $41 | $54 | $22 |
| (1) | September 28, 2007 (commencement of sale) through June 30, 2008. | | | |
| (2) | Computed using average shares outstanding throughout the period. | | | |
| (3) | Total return assumes reinvestment of net investment income and capital gains distributions, if any, and does not reflect applicable sales charges. |
| | Total returns for periods less than one year are not annualized. Total returns are calculated based on the net asset value of the last business day. |
| | The total return of the classes may not precisely reflect the class expense differences because of the impact of calculating the net asset values |
| | to two decimal places. If net asset values were calculated to three decimal places, the total return differences would more closely reflect the |
| | class expense differences. The calculation of net asset values to two decimal places is made in accordance with SEC guidelines and does not |
| | result in any gain or loss of value between one class and another. | | | |
| (4) | Annualized. | | | |
| (5) | Portfolio turnover is calculated at the fund level. Percentage indicated was calculated for the year ended June 30, 2008. | |
See Notes to Financial Statements.
27
| | | | | | | |
| Disciplined Growth | | | | | |
| |
| R Class | | | | | | |
| For a Share Outstanding Throughout the Years Ended June 30 (except as noted) | | |
| | | 2010 | 2009 | 2008 | 2007(1) | 2006 | 2005(2) |
| Per-Share Data | | | | | | |
| Net Asset Value, | | | | | | |
| Beginning of Period | $7.92 | $11.00 | $12.28 | $11.53 | $10.46 | $10.00 |
| Income From | | | | | | |
| Investment Operations | | | | | | |
| Net Investment | | | | | | |
| Income (Loss)(3) | —(4) | —(4) | (0.07) | (0.05) | (0.08) | —(4) |
| Net Realized and | | | | | | |
| Unrealized Gain (Loss) | 1.25 | (3.08) | (0.73) | 0.82 | 1.21 | 0.47 |
| Total From | | | | | | |
| Investment Operations | 1.25 | (3.08) | (0.80) | 0.77 | 1.13 | 0.47 |
| Distributions | | | | | | |
| From Net | | | | | | |
| Investment Income | —(4) | — | — | — | — | (0.01) |
| From Net Realized Gains | — | — | (0.48) | (0.02) | (0.06) | — |
| Total Distributions | —(4) | — | (0.48) | (0.02) | (0.06) | (0.01) |
| Net Asset Value, | | | | | | |
| End of Period | $9.17 | $7.92 | $11.00 | $12.28 | $11.53 | $10.46 |
| |
| Total Return(5) | 15.82% | (28.00)% | (6.84)% | 6.68% | 10.83% | 4.66% |
| | | | | | | |
| Ratios/Supplemental Data | | | | | | |
| Ratio of Operating | | | | | | |
| Expenses to Average | | | | | | |
| Net Assets | 1.55% | 1.55% | 1.53% | 1.52%(6) | 1.52% | 1.52%(6) |
| Ratio of Net Investment | | | | | | |
| Income (Loss) to Average | | | | | | |
| Net Assets | (0.04)% | (0.06)% | (0.57)% | (0.79)%(6) | (0.71)% | (0.22)%(6) |
| Portfolio Turnover Rate | 84% | 98% | 134% | 78% | 124% | 37% |
| Net Assets, End of Period | | | | | | |
| (in thousands) | $264 | $417 | $576 | $619 | $580 | $523 |
| (1) | January 1, 2007 through June 30, 2007. The fund’s fiscal year end was changed from December 31 to June 30, resulting in a six-month annual |
| | reporting period. For the years before June 30, 2007, the fund’s fiscal year end was December 31. | | |
| (2) | September 30, 2005 (fund inception) through December 31, 2005. | | | | |
| (3) | Computed using average shares outstanding throughout the period. | | | | |
| (4) | Per-share amount was less than $0.005. | | | | | |
| (5) | Total return assumes reinvestment of net investment income and capital gains distributions, if any. Total returns for periods less than one year |
| | are not annualized. Total returns are calculated based on the net asset value of the last business day. The total return of the classes may not |
| | precisely reflect the class expense differences because of the impact of calculating the net asset values to two decimal places. If net asset |
| | values were calculated to three decimal places, the total return differences would more closely reflect the class expense differences. The |
| | calculation of net asset values to two decimal places is made in accordance with SEC guidelines and does not result in any gain or loss of value |
| | between one class and another. | | | | | | |
| (6) | Annualized. | | | | | | |
See Notes to Financial Statements.
28
|
| Report of Independent Registered Public Accounting Firm |
To the Directors of the American Century Quantitative Equity Funds, Inc.
and Shareholders of the Disciplined Growth Fund:
In our opinion, the accompanying statement of assets and liabilities, including the schedule of investments, and the related statements of operations and of changes in net assets and the financial highlights present fairly, in all material respects, the financial position of the Disciplined Growth Fund (one of the eleven funds comprising the American Century Quantitative Equity Funds, Inc., hereafter referred to as the “Fund”) at June 30, 2010, the results of its operations for the year then ended, the changes in its net assets for each of the two years in the period then ended and the financial highlights for each of the periods presented, in conformity with accounting principles generally accepted in the United States of America. These financial statements and financial highlights (hereafter referred to as “financial statements”) are the responsibility of the Fund’s management; our respo nsibility is to express an opinion on these financial statements based on our audits. We conducted our audits of these financial statements in accordance with the standards of the Public Company Accounting Oversight Board (United States). Those standards require that we plan and perform the audit to obtain reasonable assurance about whether the financial statements are free of material misstatement. An audit includes examining, on a test basis, evidence supporting the amounts and disclosures in the financial statements, assessing the accounting principles used and significant estimates made by management, and evaluating the overall financial statement presentation. We believe that our audits, which included confirmation of securities at June 30, 2010 by correspondence with the custodian and brokers, provide a reasonable basis for our opinion.
PricewaterhouseCoopers LLP
Kansas City, Missouri
August 19, 2010
29
A special meeting of shareholders was held on June 16, 2010, to vote on the following proposals. Each proposal received the required number of votes and was adopted. A summary of voting results is listed below each proposal.
Proposal 1:
To elect one Director to the Board of Directors of American Century Quantitative Equity Funds, Inc. (the proposal was voted on by all shareholders of funds issued by American Century Quantitative Equity Funds, Inc.):
| | | |
| Frederick L.A. Grauer | For: | 4,067,909,978 |
| | Withhold: | 174,470,448 |
| | Abstain: | 0 |
| | Broker Non-Vote: | 0 |
The other directors whose term of office continued after the meeting include Jonathan S. Thomas, John Freidenrich, Ronald J. Gilson, Peter F. Pervere, Myron S. Scholes, and John B. Shoven.
Proposal 2:
To approve a management agreement between the fund and American Century Investment Management, Inc.:
| | | |
| Investor, A, B, C | | |
| and R Classes | For: | 9,621,472 |
| | Against: | 157,400 |
| | Abstain: | 72,005 |
| | Broker Non-Vote: | 1,439,979 |
| |
| Institutional Class | For: | 2,396,079 |
| | Against: | 0 |
| | Abstain: | 0 |
| | Broker Non-Vote: | 0 |
30
The Board of Directors
The individuals listed below serve as directors of the fund. Each director will continue to serve in this capacity until death, retirement, resignation or removal from office. The mandatory retirement age for directors who are not “interested persons,” as that term is defined in the Investment Company Act (independent directors), is 73. However, the mandatory retirement age may be extended for a period not to exceed two years with the approval of the remaining independent directors.
Mr. Thomas is the only director who is an “interested person” because he currently serves as President and Chief Executive Officer of American Century Companies, Inc. (ACC), the parent company of American Century Investment Management, Inc. (ACIM or the advisor).
The other directors (more than three-fourths of the total number) are independent; that is, they have never been employees, directors or officers of, and have no financial interest in, ACC or any of its wholly owned, direct or indirect, subsidiaries, including ACIM, American Century Investment Services, Inc. (ACIS) and American Century Services, LLC (ACS). The directors serve in this capacity for eight (in the case of Mr. Thomas, 15) registered investment companies in the American Century Investments family of funds.
The following presents additional information about the directors. The mailing address for each director other than Mr. Thomas is 1665 Charleston Road, Mountain View, California 94043. The mailing address for Mr. Thomas is 4500 Main Street, Kansas City, Missouri 64111.
Independent Directors
John Freidenrich
Year of Birth: 1937
Position(s) with the Fund: Director
Length of Time Served: Since 2005
Principal Occupation(s) During the Past Five Years: Founder, Member and Manager, Regis
Management Company, LLC (investment management firm) (April 2004 to present)
Number of Funds in Fund Complex Overseen by Director: 41
Other Directorships Held by Director During the Past Five Years: None
Education/Other Professional Experience: AB in Economics, Stanford University; LLB,
Stanford Law School; formerly, Partner and Founder, Ware and Freidenrich Law
Firm and Bay Partners; formerly, President, Board of Trustees, Stanford University
Ronald J. Gilson
Year of Birth: 1946
Position(s) with the Fund: Director and Chairman of the Board
Length of Time Served: Since 1995
Principal Occupation(s) During the Past Five Years: Charles J. Meyers Professor of Law and
Business, Stanford Law School (1979 to present); Marc and Eva Stern Professor of
Law and Business, Columbia University School of Law (1992 to present)
Number of Funds in Fund Complex Overseen by Director: 41
Other Directorships Held by Director During the Past Five Years: None
Education/Other Professional Experience: BA, Washington University; JD, Yale Law School;
formerly, Attorney, Steinhart, Goldberg, Feigenbaum & Ladar
31
Frederick L. A. Grauer
Year of Birth: 1946
Position(s) with the Fund: Director
Length of Time Served: Since 2008
Principal Occupation(s) During the Past Five Years: Senior Advisor, BlackRock, Inc. (investment
management firm) (2010 to present); Senior Advisor, Barclays Global Investors
(investment management firm) (2003 to 2009)
Number of Funds in Fund Complex Overseen by Director: 41
Other Directorships Held by Director During the Past Five Years: None
Education/Other Professional Experience: BA in Economics, University of British Columbia;
MA in Economics, University of Chicago; PhD in Business, Stanford University;
formerly, Executive Chairman, Barclays Global Investors; Chairman and Chief
Executive Officer, Wells Fargo Nikko Investment Advisors; and Vice President,
Merrill Lynch Capital Markets Group; formerly, Director, New York Stock Exchange,
Chicago Mercantile Exchange and Columbia University; formerly, Faculty Member,
Graduate School of Business, Columbia University and Alfred P. Sloan School of
Management, Massachusetts Institute of Technology
Peter F. Pervere
Year of Birth: 1947
Position(s) with the Fund: Director
Length of Time Served: Since 2007
Principal Occupation(s) During the Past Five Years: Retired
Number of Funds in Fund Complex Overseen by Director: 41
Other Directorships Held by Director During the Past Five Years: Intraware, Inc. (2003 to 2009);
Digital Impact, Inc. (2003 to 2005)
Education/Other Professional Experience: BA in History, Stanford University; CPA; formerly,
Vice President and Chief Financial Officer, Commerce One, Inc. (software and
services provider); formerly, Vice President and Corporate Controller, Sybase, Inc.;
formerly with accounting firm of Arthur Young & Co.
Myron S. Scholes
Year of Birth: 1941
Position(s) with the Fund: Director
Length of Time Served: Since 1980
Principal Occupation(s) During the Past Five Years: Chairman, Platinum Grove Asset
Management, L.P. (asset manager) (1999 to 2009); Frank E. Buck Professor of
Finance-Emeritus, Stanford Graduate School of Business (1996 to present)
Number of Funds in Fund Complex Overseen by Director: 41
Other Directorships Held by Director During the Past Five Years: Dimensional Fund Advisors
(investment advisor); CME Group, Inc. (futures and options exchange)
Education/Other Professional Experience: BA in Economics, McMaster University (Ontario);
MBA and PhD, University of Chicago; formerly, Senior Research Fellow at the
Hoover Institute; formerly, Edward Eagle Brown Professor of Finance, University of
Chicago; recipient of the Alfred Nobel Memorial Prize in Economic Sciences
32
John B. Shoven
Year of Birth: 1947
Position(s) with the Fund: Director
Length of Time Served: Since 2002
Principal Occupation(s) During the Past Five Years: Professor of Economics, Stanford University
(1973 to present)
Number of Funds in Fund Complex Overseen by Director: 41
Other Directorships Held by Director During the Past Five Years: Cadence Design Systems;
Exponent; Financial Engines; PalmSource, Inc. (2002 to 2005); Watson Wyatt
Worldwide (2002 to 2006)
Education/Other Professional Experience: BA in Physics, University of California; PhD in
Economics, Yale University; Director of the Stanford Institute for Economic Policy
Research (1999 to present); formerly, Chair of Economics and Dean of Humanities
and Sciences, Stanford University
Interested Director
Jonathan S. Thomas
Year of Birth: 1963
Position(s) with the Fund: Director and President
Length of Time Served: Since 2007
Principal Occupation(s) During the Past Five Years: President and Chief Executive Officer,
ACC (March 2007 to present); Chief Administrative Officer, ACC (February 2006 to
February 2007); Executive Vice President, ACC (November 2005 to February 2007);
Global Chief Operating Officer and Managing Director, Morgan Stanley (investment
management)(March 2000 to November 2005). Also serves as: Chief Executive
Officer and Manager, ACS; Executive Vice President, ACIM; Director, ACC, ACIM
and other ACC subsidiaries
Number of Funds in Fund Complex Overseen by Director: 104
Other Directorships Held by Director During the Past Five Years: None
Education/Other Professional Experience: BA in Economics, University of Massachusetts;
MBA, Boston College; formerly held senior leadership roles with Fidelity
Investments, Boston Financial Services and Bank of America; serves on the Board of
Governors of the Investment Company Institute
33
Officers
The following table presents certain information about the executive officers of the fund. Each officer serves as an officer for each of the 15 investment companies in the American Century family of funds, unless otherwise noted. No officer is compensated for his or her service as an officer of the fund. The listed officers are interested persons of the fund and are appointed or re-appointed on an annual basis. The mailing address for each of the officers listed below is 4500 Main Street, Kansas City, Missouri 64111.
| | |
| Name | Offices with | |
| (Year of Birth) | the Fund | Principal Occupation(s) During the Past Five Years |
| Jonathan S. | Director and | President and Chief Executive Officer, ACC (March 2007 to present); Chief |
| Thomas | President | Administrative Officer, ACC (February 2006 to February 2007); Executive Vice |
| (1963) | since 2007 | President, ACC (November 2005 to February 2007); Global Chief Operating |
| | | Officer and Managing Director, Morgan Stanley (March 2000 to November |
| | | 2005). Also serves as: Chief Executive Officer and Manager, ACS; Executive |
| | | Vice President, ACIM; Director, ACC, ACIM and other ACC subsidiaries |
| Barry Fink | Executive | Chief Operating Officer and Executive Vice President, ACC (September 2007 |
| (1955) | Vice President | to present); President, ACS (October 2007 to present); Managing Director, |
| | since 2007 | Morgan Stanley (2000 to 2007); Global General Counsel, Morgan Stanley |
| | | (2000 to 2006). Also serves as: Manager, ACS, and Director, ACC and |
| | | certain ACC subsidiaries |
| Maryanne L. | Chief Compliance | Chief Compliance Officer, American Century funds, ACIM and ACS (August |
| Roepke | Officer since | 2006 to present); Assistant Treasurer, ACC (January 1995 to August 2006); |
| (1956) | 2006 and Senior | and Treasurer and Chief Financial Officer, various American Century funds |
| | Vice President | (July 2000 to August 2006). Also serves as: Senior Vice President, ACS |
| | since 2000 | |
| Charles A. | General Counsel | Attorney, ACC (February 1994 to present); Vice President, ACC (November |
| Etherington | since 2007 | 2005 to present); General Counsel, ACC (March 2007 to present); Also |
| (1957) | and Senior | serves as General Counsel, ACIM, ACS, ACIS and other ACC subsidiaries; |
| | Vice President | and Senior Vice President, ACIM and ACS |
| | since 2006 | |
| Robert J. Leach | Vice President, | Vice President, ACS (February 2000 to present); and Controller, |
| (1966) | Treasurer and | various American Century funds (1997 to September 2006) |
| | Chief Financial | |
| | Officer since 2006 | |
| David H. Reinmiller | Vice President | Attorney, ACC (January 1994 to present); Associate General Counsel, ACC |
| (1963) | since 2001 | (January 2001 to present); Chief Compliance Officer, American Century |
| | | funds and ACIM (January 2001 to February 2005). Also serves as: Vice |
| | | President, ACIM and ACS |
| Ward D. Stauffer | Secretary | Attorney, ACC (June 2003 to Present) |
| (1960) | since 2005 | |
The SAI has additional information about the fund’s directors and is available without charge, upon request, by calling 1-800-345-2021.
34
|
| Board Approval of Management Agreements |
American Century Investment Management, Inc. (“ACIM” or the “Advisor”) currently serves as investment advisor to the Fund under a management agreement (the “Current Management Agreement”) that took effect on July 16, 2010, following approval by the Fund’s Board of Directors (the “Board”) and shareholders. The Advisor previously served as investment advisor to the Fund pursuant to a prior management agreement (the “Prior Management Agreement”) and an interim management agreement (the “Interim Management Agreeement”). The Interim Management Agreement terminated in accordance with its terms on July 16, 2010, upon the effectiveness of the Current Management Agreement. The Prior Management Agreement terminated on February 16, 2010, as a result of a change of control of the Advisor’s parent company, American Century Companies, Inc. (“ACC”). The change in control occurred as the result of a change in the trustee of a trust created by James E. Stowers, Jr., the founder of American Century Investments that holds shares representing a significant interest in ACC stock. Mr. Stowers previously served as the trustee of the trust. On February 16, 2010, Richard W. Brown, Co-Chairman of ACC with Mr. Stowers, became the trustee in accordance with the terms of the trust and Mr. Stowers’ long-standing estate and succession plan.
On February 18, 2010, the Board approved the Interim Management Agreement in accordance with Rule 15a-4 under the Investment Company Act to ensure continued management of the Fund by the Advisor after the termination of the Prior Management Agreement and until shareholder approval of the Current Management Agreement as required under the Act. The Board approved the Current Management Agreement and recommended its approval to shareholders. Fund shareholders approved the Current Management Agreement at a meeting held on June 16, 2010.
The Interim Management Agreement and the Current Management Agreement are substantially identical to the Prior Management Agreement except for their effective dates and the termination provisions of the Interim Management Agreement. Under the Interim and Current Management Agreements, the Advisor will provide the same services to the Fund and receive the same compensation rate as under the Prior Management Agreement.
Basis for Board Approval of Interim Management Agreement
In considering the approval of the Interim Management Agreement, Rule 15a-4 requires the Board to approve the contract within ten business days of the termination of the prior agreement and to determine that the compensation to be received under the interim agreement is no greater than would have been received under the prior agreement. In connection with the approval, the Board noted that it oversees on a continuous basis and evaluates at its quarterly meetings, directly and through the committees of the Board, the nature and quality of significant services provided by the Advisor, the investment performance of the Fund, shareholder services, audit and compliance functions and a variety of other matters relating to the Fund’s operations.
35
In evaluating the Interim Management Agreement, the Board, assisted by the advice of its independent legal counsel, considered a number of factors in addition to those required by the rule with no one factor being determinative to its analysis. Among the factors considered by the Board were the circumstances and effect of the change of control, the fact that the Advisor will provide the same services and receive the same compensation rate as under the Prior Management Agreement, and that the change of control did not result in a change of the personnel managing the Fund. Upon completion of its analysis, the Board approved the Interim Management Agreement, determining that the continued management of the Fund by the Advisor was in the best interests of the Fund and Fund shareholders.
Basis for Board Approval of Current Management Agreement
At a meeting held on April 1, 2010, after considering all information presented, the Board approved, and determined to recommend that shareholders approve, the Current Management Agreement. In connection with that approval, the Board requested and reviewed extensive data and information compiled by the Advisor and certain independent providers of evaluation data concerning the Fund and services provided to the Fund by the Advisor. The Board oversees on a continuous basis and evaluates at its quarterly meetings, directly and through the committees of the Board, the nature and quality of significant services provided by the Advisor, the investment performance of the Fund, shareholder services, audit and compliance functions and a variety of other matters relating to the Fund’s operations. The information considered and the discussions held at the meetings included, but were not limited to:
• the nature, extent and quality of investment management, shareholder services and other services provided to the Fund;
• the wide range of programs and services the Advisor provides to the Fund and its shareholders on a routine and non-routine basis;
• the compliance policies, procedures, and regulatory experience of the Advisor;
• data comparing the cost of owning the Fund to the cost of owning similar funds;
• the fact that there will be no changes to the fees, services, or personnel who provide such services as compared to the Prior Management Agreement;
• data comparing the Fund’s performance to appropriate benchmarks and/ or a peer group of other mutual funds with similar investment objectives and strategies;
• financial data showing the profitability of the Fund to the Advisor and the overall profitability of the Advisor;
• data comparing services provided and charges to the Fund with those for other non-fund investment management clients of the Advisor; and
36
• consideration of collateral or “fall-out” benefits derived by the Advisor from the management of the Fund and potential sharing of economies of scale in connection with the management of the Fund.
The Board also considered whether there was any reason for not continuing the existing arrangement with the Advisor. In particular, the Board recognized that shareholders may have invested in the Fund on the strength of the Advisor’s industry standing and reputation and in the expectation that the Advisor will have a continuing role in providing advisory services to the Fund.
The Board considered all of the information provided by the Advisor, the independent data providers, and the Board’s independent legal counsel, and evaluated such information for the Fund. The Board did not identify any single factor as being all-important or controlling, and each Board member may have attributed different levels of importance to different factors. In deciding to approve the Current Management Agreement under the terms ultimately determined by the Board to be appropriate, the Board based its decision on a number of factors, including the following:
Nature, Extent and Quality of Services – Generally. Under the Current Management Agreement, the Advisor is responsible for providing or arranging for all services necessary for the operation of the Fund. The Board noted that under the Current Management Agreement, the Advisor provides or arranges at its own expense a wide variety of services including:
• constructing and designing the Fund
• portfolio research and security selection
• initial capitalization/funding
• securities trading
• Fund administration
• custody of Fund assets
• daily valuation of the Fund’s portfolio
• shareholder servicing and transfer agency, including shareholder confir-
mations, recordkeeping and communications
• legal services
• regulatory and portfolio compliance
• financial reporting
• marketing and distribution
37
The Board noted that many of these services have expanded over time both in terms of quantity and complexity in response to shareholder demands, competition in the industry, changing distribution channels and the changing regulatory environment.
Investment Management Services. The investment management services provided to the Fund are complex and provide Fund shareholders access to professional money management, instant diversification of their investments within an asset class, the opportunity to easily diversify among asset classes, and liquidity. As a part of its general oversight and in evaluating investment performance, the Board expects the Advisor to manage the Fund in accordance with its investment objectives and approved strategies. In providing these services, the Advisor utilizes teams of investment professionals who require extensive information technology, research, training, compliance and other systems to conduct their business. The Board, directly and through its Portfolio Committee, regularly reviews investment performance information for the Fund, t ogether with comparative information for appropriate benchmarks and/or peer groups of similarly-managed funds, over different time horizons. If performance concerns are identified, the underperforming Fund receives special reviews until performance improves, during which time the Board discusses with the Advisor the reasons for such underperformance and any efforts being undertaken to improve performance.
Shareholder and Other Services. Under the Current Management Agreement, the Advisor will also provide the Fund with a comprehensive package of transfer agency, shareholder, and other services. The Board, directly and through the various committees of the Board, regularly reviews reports and evaluations of such services. These reports include, but are not limited to, information regarding the operational efficiency and accuracy of the shareholder and transfer agency services provided, staffing levels, shareholder satisfaction (as measured by external as well as internal sources), technology support, new products and services offered to Fund shareholders, securities trading activities, portfolio valuation services, auditing services, and legal and operational compliance activities. Certain aspects of shareholder and transfer age ncy service level efficiency and the quality of securities trading activities are measured by independent third party providers and are presented in comparison to other fund groups not managed by the Advisor.
Costs of Services Provided and Profitability. The Advisor provided detailed information concerning its cost of providing various services to the Fund, its profitability in managing the Fund, its overall profitability, and its financial condition. The Board reviewed with the Advisor the methodology used to prepare this financial information. The Board has also reviewed with the Advisor its methodology for compensating the investment professionals that provide services to the Fund as well as compensation to the five highest paid personnel of the Advisor. This financial information regarding the Advisor is considered in order to evaluate the Advisor’s financial condition, its ability to continue to provide services under the Current Management Agreement, and the reasonableness of the current management fees.
38
Ethics. The Board generally considers the Advisor’s commitment to providing quality services to shareholders and to conducting its business ethically. It noted that the Advisor’s practices generally meet or exceed industry best practices.
Economies of Scale. The Board also reviewed information provided by the Advisor regarding the possible existence of economies of scale in connection with the management of the Fund. The Board concluded that economies of scale are difficult to measure and predict with precision, especially on a fund-by-fund basis. The analysis of economies of scale is further complicated by the additional services and content provided by the Advisor and its reinvestment in its ability to provide and expand those services. Accordingly, the Board seeks to evaluate economies of scale by reviewing information, such as year-over-year profitability of the Advisor generally, the profitability of its management of the Fund specifically, and the expenses incurred by the Advisor in providing various functions to the Fund. The Board believes the Advisor i s appropriately sharing economies of scale through its competitive fee structure, offering competitive fees from fund inception, fee breakpoints as the fund complex and the Fund increases in size, and through reinvestment in its business to provide shareholders additional services and enhancements to existing services. In particular, separate breakpoint schedules based on the size of the entire fund complex and on the size of the Fund reflect the complexity of assessing economies of scale.
Comparison to Fees of Funds not Managed by the Advisor. Both the Prior and Current Management Agreements provide that the Fund pays the Advisor a single, all-inclusive (or unified) management fee for providing all services necessary for the management and operation of the Fund, other than brokerage expenses, taxes, interest, extraordinary expenses, and the fees and expenses of the Fund’s Independent Directors (including their independent legal counsel) and expenses incurred in connection with the provision of shareholder services and distribution services under a plan adopted pursuant to Rule 12b-1 under the 1940 Act. Under the unified fee structure, the Advisor is responsible for providing all investment advisory, custody, audit, administrative, compliance, recordkeeping, marketing and shareholder services, or arranging and supervising third parties that provide such services. By contrast, most other funds are charged a variety of fees, including an investment advisory fee, a transfer agency fee, an administrative fee, distribution charges and other expenses. Other than their investment advisory fees and any applicable Rule 12b-1 distribution fees, the components of the total fees charged by these other funds may be increased without shareholder approval. The Board believes the unified fee structure is a benefit to Fund shareholders because it clearly discloses to shareholders the cost of owning Fund shares, and, since the unified fee cannot be increased without a vote of Fund shareholders, it shifts to the Advisor the risk of increased costs of operating the Fund and provides a direct incentive to minimize administrative inefficiencies. Part of the Board’s analysis of fee levels involves reviewing certain evaluative data compiled by an independent provider comparing the Fund’s unified fee to the total expense rat ios of similar funds not managed by the Advisor. The Board concluded that the management fee to be paid by the Fund to the Advisor under the Current Management Agreement is reasonable in light of the services to be provided to the Fund.
39
Comparison to Fees and Services Provided to Other Clients of the Advisor. The Board also requested and received information from the Advisor concerning the nature and extent of the services, fees, and profitability of its advisory services to advisory clients other than the Fund. They observed that these varying types of client accounts require different services and involve different regulatory and entrepreneurial risks than the management of the Fund. The Board analyzed this information and concluded that the fees charged and services provided to the Fund were reasonable by comparison.
Collateral or “Fall-Out” Benefits Derived by the Advisor. The Board considered the existence of collateral benefits the Advisor may receive as a result of its relationship with the Fund. The Board concluded that the Advisor’s primary business is managing mutual funds and it generally does not use Fund or shareholder information to generate profits in other lines of business, and therefore does not derive any significant collateral benefits from them. The Board noted that the Advisor receives proprietary research from broker-dealers that execute Fund portfolio transactions and concluded that this research is likely to benefit Fund shareholders. The Board also determined that the Advisor is able to provide investment management services to certain clients other than the Fund, at least in part, due to its existing infrastructure built to serve the fund complex. The Board concluded, however, that the assets of those other clients are not material to the analysis and, in any event, are included with the assets of the Fund to determine breakpoints in the Fund’s fee schedule, provided they are managed using the same investment team and strategy.
Conclusion of the Board. As a result of this process, the Board, in the absence of particular circumstances and assisted by the advice of its independent legal counsel, taking into account all of the factors discussed above and the information provided by the Advisor and others, concluded that the Current Management Agreement be approved and recommended its approval to Fund shareholders.
40
Retirement Account Information
As required by law, distributions you receive from certain IRAs, or 403(b), 457 and qualified plans are subject to federal income tax withholding, unless you elect not to have withholding apply. Tax will be withheld on the total amount withdrawn even though you may be receiving amounts that are not subject to withholding, such as nondeductible contributions. In such case, excess amounts of withholding could occur. You may adjust your withholding election so that a greater or lesser amount will be withheld.
If you don’t want us to withhold on this amount, you must notify us to not withhold the federal income tax. You may notify us in writing or in certain situations by telephone or through other electronic means. You have the right to revoke your withholding election at any time and any election you make may remain in effect until revoked by filing a new election.
Remember, even if you elect not to have income tax withheld, you are liable for paying income tax on the taxable portion of your withdrawal. If you elect not to have income tax withheld or you don’t have enough income tax withheld, you may be responsible for payment of estimated tax. You may incur penalties under the estimated tax rules if your withholding and estimated tax payments are not sufficient. You can reduce or defer the income tax on a distribution by directly or indirectly rolling such distribution over to another IRA or eligible plan. You should consult your tax advisor for additional information.
State tax will be withheld if, at the time of your distribution, your address is within one of the mandatory withholding states and you have federal income tax withheld. State taxes will be withheld from your distribution in accordance with the respective state rules.
Proxy Voting Guidelines
American Century Investment Management, Inc., the fund’s investment advisor, is responsible for exercising the voting rights associated with the securities purchased and/or held by the fund. A description of the policies and procedures the advisor uses in fulfilling this responsibility is available without charge, upon request, by calling 1-800-345-2021. It is also available on American Century Investments’ website at americancentury.com and on the Securities and Exchange Commission’s website at sec.gov. Information regarding how the investment advisor voted proxies relating to portfolio securities during the most recent 12-month period ended June 30 is available on the “About Us” page at americancentury.com. It is also available at sec.gov.
Quarterly Portfolio Disclosure
The fund files its complete schedule of portfolio holdings with the Securities and Exchange Commission (SEC) for the first and third quarters of each fiscal year on Form N-Q. The fund’s Forms N-Q are available on the SEC’s website at sec.gov, and may be reviewed and copied at the SEC’s Public Reference Room in Washington, DC. Information on the operation of the Public Reference Room may be obtained by calling 1-800-SEC-0330. The fund also makes its complete schedule of portfolio holdings for the most recent quarter of its fiscal year available on its website at americancentury.com and, upon request, by calling 1-800-345-2021.
41
The following indices are used to illustrate investment market, sector, or style performance or to serve as fund performance comparisons. They are not investment products available for purchase.
The Russell 1000® Index is a market-capitalization weighted, large-cap index created by Frank Russell Company to measure the performance of the 1,000 largest publicly traded U.S. companies, based on total market capitalization.
The Russell 1000® Growth Index measures the performance of those Russell 1000 Index companies (the 1,000 largest publicly traded U.S. companies, based on total market capitalization) with higher price-to-book ratios and higher forecasted growth values.
The Russell 1000® Value Index measures the performance of those Russell 1000 Index companies (the 1,000 largest publicly traded U.S. companies, based on total market capitalization) with lower price-to-book ratios and lower forecasted growth values.
The Russell 2000® Index is a market-capitalization weighted index created by Frank Russell Company to measure the performance of the 2,000 smallest of the 3,000 largest publicly traded U.S. companies, based on total market capitalization.
The Russell 2000® Growth Index measures the performance of those Russell 2000 Index companies (the 2,000 smallest of the 3,000 largest publicly traded U.S. companies, based on total market capitalization) with higher price-to-book ratios and higher forecasted growth values.
The Russell 2000® Value Index measures the performance of those Russell 2000 Index companies (the 2,000 smallest of the 3,000 largest publicly traded U.S. companies, based on total market capitalization) with lower price-to-book ratios and lower forecasted growth values.
The Russell Midcap® Index measures the performance of the 800 smallest of the 1,000 largest publicly traded U.S. companies, based on total market capitalization.
The Russell Midcap® Growth Index measures the performance of those Russell Midcap Index companies (the 800 smallest of the 1,000 largest publicly traded U.S. companies, based on total market capitalization) with higher price-to-book ratios and higher forecasted growth values.
The Russell Midcap® Value Index measures the performance of those Russell Midcap Index companies (the 800 smallest of the 1,000 largest publicly traded U.S. companies, based on total market capitalization) with lower price-to-book ratios and lower forecasted growth values.
The S&P 500 Index is a market value-weighted index of the stocks of 500 publicly traded U.S. companies chosen for market size, liquidity, and industry group representation that are considered to be leading firms in dominant industries. Each stock’s weight in the index is proportionate to its market value. Created by Standard & Poor’s, it is considered to be a broad measure of U.S. stock market performance.
42
43
44

| |
| |
| Contact Us | |
| americancentury.com | |
| Automated Information Line | 1-800-345-8765 |
| Investor Services Representative | 1-800-345-2021 or |
| | 816-531-5575 |
| Investors Using Advisors | 1-800-378-9878 |
| Business, Not-For-Profit, Employer-Sponsored | |
| Retirement Plans | 1-800-345-3533 |
| Banks and Trust Companies, Broker-Dealers, | |
| Financial Professionals, Insurance Companies | 1-800-345-6488 |
| Telecommunications Device for the Deaf | 1-800-634-4113 |
| American Century Quantitative Equity Funds, Inc. | |
| Investment Advisor: | |
| American Century Investment Management, Inc. | |
| Kansas City, Missouri | |
This report and the statements it contains are submitted for the general
information of our shareholders. The report is not authorized for distribution to
prospective investors unless preceded or accompanied by an effective prospectus.
American Century Investment Services, Inc., Distributor
©2010 American Century Proprietary Holdings, Inc. All rights reserved.
1008
CL-ANN-69049
|
| Annual Report |
| June 30, 2010 |

|
| American Century Investments® |
Equity Growth Fund
| |
| President’s Letter | 2 |
| Market Perspective | 3 |
| U.S. Stock Index Returns | 3 |
| |
| Equity Growth | |
| |
| Performance | 4 |
| Portfolio Commentary | 6 |
| Top Ten Holdings | 8 |
| Five Largest Overweights | 8 |
| Five Largest Underweights. | 8 |
| Types of Investments in Portfolio | 8 |
| |
| Shareholder Fee Example | 9 |
| |
| Financial Statements | |
| |
| Schedule of Investments | 11 |
| Statement of Assets and Liabilities | 16 |
| Statement of Operations | 17 |
| Statement of Changes in Net Assets | 18 |
| Notes to Financial Statements | 19 |
| Financial Highlights | 26 |
| Report of Independent Registered Public Accounting Firm | 32 |
| |
| Other Information | |
| |
| Proxy Voting Results | 33 |
| Management | 34 |
| Board Approval of Management Agreements | 38 |
| Additional Information | 44 |
| Index Definitions | 45 |
Any opinions expressed in this report reflect those of the author as of the date of the report, and do not necessarily represent the opinions of American Century Investments or any other person in the American Century Investments organization. Any such opinions are subject to change at any time based upon market or other conditions and American Century Investments disclaims any responsibility to update such opinions. These opinions may not be relied upon as investment advice and, because investment decisions made by American Century Investments funds are based on numerous factors, may not be relied upon as an indication of trading intent on behalf of any American Century Investments fund. Security examples are used for representational purposes only and are not intended as recommendations to purchase or sell securities. Performance information for comparative indices and securities is provided to American Century Investments by third party vendors. To the best of American Century Investments’ knowledge, such information is accurate at the time of printing.

Dear Investor:
To learn more about the capital markets, your investment, and the portfolio management strategies American Century Investments provides, we encourage you to review this shareholder report for the financial reporting period ended June 30, 2010.
On the following pages, you will find investment performance and portfolio information, presented with the expert perspective and commentary of our portfolio management team. This report remains one of our most important vehicles for conveying the information you need about your investment performance, and about the market factors and strategies that affect fund returns. For additional information on the markets, we encourage you to visit the “Insights & News” tab at our Web site, americancentury.com, for updates and further expert commentary.
The top of our Web site’s home page also provides a link to “Our Story,” which, first and foremost, outlines our commitment—since 1958—to helping clients reach their financial goals. We believe strongly that we will only be successful when our clients are successful. That’s who we are.
Another important, unique facet of our story and who we are is “Profits with a Purpose,” which describes our bond with the Stowers Institute for Medical Research (SIMR). SIMR is a world-class biomedical organization—founded by our company founder James E. Stowers, Jr. and his wife Virginia—that is dedicated to researching the causes, treatment, and prevention of gene-based diseases, including cancer. Through American Century Investments’ private ownership structure, more than 40% of our profits support SIMR.
Mr. Stowers’ example of achieving financial success and using that platform to help humanity motivates our entire American Century Investments team. His story inspires us to help each of our clients achieve success. Thank you for sharing your financial journey with us.
Sincerely,

Jonathan Thomas
President and Chief Executive Officer
American Century Investments
2

By Scott Wittman, Chief Investment Officer, Quantitative Equity and Asset Allocation
Stocks Rallied as Economy Improved
U.S. stocks posted double-digit gains for the 12 months ended June 30, 2010, thanks largely to improving economic conditions and unexpectedly strong corporate earnings. As the period began, the U.S. economy was starting to show early signs of recovery following a sharp downturn in late 2008 and early 2009. Led by improving results in manufacturing activity, housing, and consumer spending, the economy posted positive growth in the third and fourth quarters of 2009 after four consecutive quarters of declining output. By the first quarter of 2010, jobs data turned positive, providing further evidence of a burgeoning economic recovery.
In addition, corporate profits consistently exceeded expectations as many companies implemented stringent cost-management programs that helped boost profit margins. Rising demand for delayed big-ticket purchases, such as cars and appliances, also contributed to stronger earnings. As a result, stocks rose steadily for much of the period, with the major equity indices advancing by more than 30% from the beginning of the period through April 30, 2010.
Growing Uncertainty Led to Late Decline
Market conditions changed abruptly in the last two months of the period as persistent worries about sovereign debt problems in Europe and questions about the sustainability of the domestic economic recovery (validated to some degree by weaker economic data late in the period) weighed on investor confidence. With these headwinds, the equity market peaked in late April and then reversed direction in May and June. In addition, market volatility increased dramatically—the S&P 500 Index moved up or down by more than 1% on nearly half of the trading days in the second quarter of 2010.
Although stocks gave back a notable portion of their gains late in the period, the broad market indices returned approximately 15% overall for the 12 months. Mid- and small-cap stocks posted the best returns (see the table below), outpacing large-cap shares, while value stocks outperformed growth-oriented issues across all market capitalizations.
| | | | |
| U.S. Stock Index Returns | | | | |
| For the 12 months ended June 30, 2010 | | | | |
| Russell 1000 Index (Large-Cap) | 15.24% | | Russell 2000 Index (Small-Cap) | 21.48% |
| Russell 1000 Value Index | 16.92% | | Russell 2000 Value Index | 25.07% |
| Russell 1000 Growth Index | 13.62% | | Russell 2000 Growth Index | 17.96% |
| Russell Midcap Index | 25.13% | | | |
| Russell Midcap Value Index | 28.91% | | | |
| Russell Midcap Growth Index | 21.30% | | | |
3
| | | | | | | |
| Equity Growth | | | | | | |
| |
| Total Returns as of June 30, 2010 | | | | | |
| | | | | Average Annual Returns | |
| | | Ticker | | | | Since | Inception |
| | | Symbol | 1 year | 5 years | 10 years | Inception | Date |
| Investor Class | BEQGX | 13.47% | -1.70% | -1.32% | 7.67% | 5/9/91 |
| S&P 500 Index | — | 14.43% | -0.79% | -1.59% | 7.59%(1) | — |
| Institutional Class | AMEIX | 13.69% | -1.50% | -1.12% | 2.31% | 1/2/98 |
| A Class(2) | BEQAX | | | | | 10/9/97 |
| No sales charge* | | 13.20% | -1.95% | -1.57% | 1.79% | |
| With sales charge* | | 6.72% | -3.10% | -2.15% | 1.31% | |
| B Class | AEYBX | | | | | 9/28/07 |
| No sales charge* | | 12.38% | — | — | -12.63% | |
| With sales charge* | | 8.38% | — | — | -14.03% | |
| C Class | AEYCX | 12.33% | -2.68% | — | -0.44% | 7/18/01 |
| R Class | AEYRX | 12.91% | — | — | -3.04% | 7/29/05 |
| *Sales charges include initial sales charges and contingent deferred sales charges (CDSCs), as applicable. A Class shares have a |
| maximum 5.75% initial sales charge and may be subject to a maximum CDSC of 1.00%. B Class shares redeemed within six years |
| of purchase are subject to a CDSC that declines from 5.00% during the first year after purchase to 0.00% the sixth year after |
| purchase. C Class shares redeemed within 12 months of purchase are subject to a maximum CDSC of 1.00%. The SEC requires that |
| mutual funds provide performance information net of maximum sales charges in all cases where charges could be applied. |
| (1) | Since April 30, 1991, the date nearest the Investor Class’s inception for which data are available. | | |
| (2) | Prior to September 4, 2007, the A Class was referred to as the Advisor Class and did not have a front-end sales charge. Performance prior to that |
| | date has been adjusted to reflect this charge. | | | | | |
Data presented reflect past performance. Past performance is no guarantee of future results. Current performance may be higher or lower than the performance shown. Investment return and principal value will fluctuate, and redemption value may be more or less than original cost. To obtain performance data current to the most recent month end, please call 1-800-345-2021 or visit americancentury.com.
Unless otherwise indicated, performance reflects Investor Class shares; performance for other share classes will vary due to differences in fee structure. For information about other share classes available, please consult the prospectus. Data assumes reinvestment of dividends and capital gains, and none of the charts reflect the deduction of taxes that a shareholder would pay on fund distributions or the redemption of fund shares. Returns for the index are provided for comparison. The fund’s total returns include operating expenses (such as transaction costs and management fees) that reduce returns, while the total returns of the index do not.
4
Equity Growth
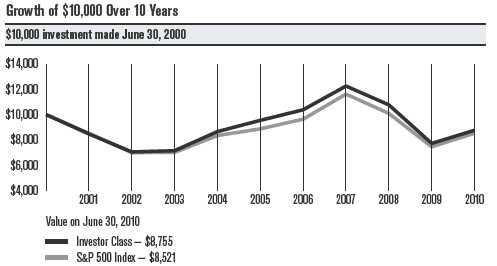
| | | | | |
| | | | | |
| Total Annual Fund Operating Expenses | | | |
| | Institutional | | | | |
| Investor Class | Class | A Class | B Class | C Class | R Class |
| 0.70% | 0.50% | 0.95% | 1.70% | 1.70% | 1.20% |
The total annual fund operating expenses shown is as stated in the fund’s prospectus current as of the date of this report. The prospectus may vary from the expense ratio shown elsewhere in this report because it is based on a different time period, includes acquired fund fees and expenses, and, if applicable, does not include fee waivers or expense reimbursements.
Data presented reflect past performance. Past performance is no guarantee of future results. Current performance may be higher or lower than the performance shown. Investment return and principal value will fluctuate, and redemption value may be more or less than original cost. To obtain performance data current to the most recent month end, please call 1-800-345-2021 or visit americancentury.com.
Unless otherwise indicated, performance reflects Investor Class shares; performance for other share classes will vary due to differences in fee structure. For information about other share classes available, please consult the prospectus. Data assumes reinvestment of dividends and capital gains, and none of the charts reflect the deduction of taxes that a shareholder would pay on fund distributions or the redemption of fund shares. Returns for the index are provided for comparison. The fund’s total returns include operating expenses (such as transaction costs and management fees) that reduce returns, while the total returns of the index do not.
5
Equity Growth
Portfolio Managers: Bill Martin and Claudia Musat
In June 2010, portfolio manager Thomas Vaiana left American Century Investments to pursue other opportunities. With his departure, Claudia Musat, a portfolio manager who has been with the firm since 2005, was named co-portfolio manager of Equity Growth with Bill Martin.
Performance Summary
Equity Growth returned 13.47%* for the 12 months ended June 30, 2010, compared with the 14.43% return of its benchmark, the S&P 500 Index.
The double-digit gain for both Equity Growth and the S&P 500 reflected the broad advance in the U.S. equity market. However, Equity Growth lagged the S&P 500 for the 12-month period. Although the fund’s smaller average market capitalization contributed favorably to performance during the period, price momentum detracted amid the market’s dramatic ebbs and flows.
Utilities Lagged
Stock selection in three key sectors produced essentially all of the under-performance versus the benchmark, with the utilities sector doing the most damage. An overweight position in independent power producers and stock choices among multi-utilities contributed virtually all of the underperformance in this sector. The three biggest individual detractors in the portfolio were utilities stocks, led by independent power producers NRG Energy and Mirant. NRG Energy, based in New Jersey, failed to meet earnings expectations for three consecutive quarters amid falling power prices and higher operating costs. Atlanta-based Mirant also struggled with higher costs, and the company’s emphasis on coal-fired power plants led to concerns about potential carbon taxes in forthcoming federal energy legislation. Late in the period, Mirant announced a merger agreement with competitor RRI Energy.
The other significant detractor in the utilities sector was electric and gas utility Public Services Enterprise Group, which operates primarily in the mid-Atlantic region. Declining demand for power weighed on the company’s earnings during the period.
Financials and Industrials Also Detracted
The portfolio’s financials and industrials holdings also underperformed their counterparts in the S&P 500. Underweight positions in real estate investment trusts and consumer finance companies, along with stock selection among capital markets firms, had the biggest negative impact on relative results in the financials sector. The most significant missed opportunities included credit card companies American Express and Capital One Financial, both of which rallied as credit conditions improved and consumer spending picked up. Investment bank Goldman Sachs was hurt by uncertainty surrounding the federal government’s regulatory overhaul of the financial industry, as well as a fraud lawsuit brought by the Securities and Exchange Commission.
*All fund returns referenced in this commentary are for Investor Class shares.
6
Equity Growth
Underperformance in the industrials sector was driven primarily by stock selection among aerospace and defense companies and an overweight position in construction and engineering firms. An underweight position in aircraft maker Boeing hindered results as increased aircraft orders and a successful test flight of its 787 Dreamliner boosted the stock. Construction and engineering firm Fluor was another noteworthy detractor, declining amid a slowdown in revenues from oil and gas projects.
Consumer and Energy Stocks Outperformed
On the positive side, stock selection was most successful in the consumer discretionary, energy, and consumer staples sectors. By far, security selection added the most value in the consumer discretionary sector, led by auto components manufacturers and internet retailers. An overweight position in household durable goods makers also contributed favorably to results in this sector. The top contributors among consumer discretionary stocks were auto parts maker TRW Automotive and online movie rental firm Netflix. TRW Automotive rallied as a recovery in auto sales led to a sharp increase in demand for its products, while Netflix enjoyed strong subscriber growth and generated better-than-expected earnings amid increased customer usage of streaming video.
Industry allocation was the key behind the outperformance in the energy sector, particularly an underweight position in oil and gas producers and an overweight position in energy equipment and services companies. In the consumer staples sector, stock selection among beverage makers and an underweight position in food and staples retailers contributed the most to outperformance. Top individual contributors included energy exploration and production company McMoRan Exploration, which rallied sharply in early 2010 after the company made a substantial oil discovery, and beverage distributor Coca-Cola Enterprises, which sold its North American bottling unit to Coca-Cola.
Stock selection in the chemicals industry also generated noteworthy outperformance, particularly an overweight position in fertilizer producer Terra Industries and an underweight position in agricultural chemicals maker Monsanto. Terra agreed to be acquired by competitor CF Industries Holdings, while Monsanto faced intense price competition in its Roundup herbicide business and tepid demand for its new enhanced seed products.
A Look Ahead
The market environment has grown increasingly choppy in recent months, reflecting greater uncertainty about the resilience of the economic recovery. Although most businesses weathered the 2008 recession relatively well, stubbornly high unemployment suggests that the corporate sector is not yet confident enough in the strength of the recovery to expand payrolls. This economic uncertainty—and the stock market volatility that often accompanies it—is likely to continue as we move into the second half of 2010.
The quantitative investment process we use to manage Equity Growth has a framework that is objective, disciplined, and systematic—in other words, it avoids getting caught up in the fads and emotions that can drive short-term market movements. We believe this approach will produce superior relative performance over the long term.
7
| | |
| Equity Growth | | |
| |
| Top Ten Holdings | | |
| | | % of net assets as of 6/30/10 |
| Exxon Mobil Corp. | | 3.1% |
| International Business Machines Corp. | | 2.6% |
| JPMorgan Chase & Co. | | 2.3% |
| Johnson & Johnson | | 2.3% |
| Microsoft Corp. | | 2.2% |
| Apple, Inc. | | 2.2% |
| AT&T, Inc. | | 2.2% |
| Chevron Corp. | | 2.0% |
| Intel Corp. | | 1.9% |
| Bank of America Corp. | | 1.9% |
| |
| Five Largest Overweights as of June 30, 2010 | |
| | % of net assets | % of S&P 500 Index |
| Constellation Energy Group, Inc. | 0.95% | 0.07% |
| Integrys Energy Group, Inc. | 0.90% | 0.04% |
| International Business Machines Corp. | 2.55% | 1.70% |
| Eli Lilly & Co. | 1.19% | 0.36% |
| Humana, Inc. | 0.90% | 0.08% |
| |
| Five Largest Underweights as of June 30, 2010 | |
| | % of net assets | % of S&P 500 Index |
| Berkshire Hathaway, Inc., Class B | 0.32% | 1.42% |
| Merck & Co., Inc. | 0.12% | 1.17% |
| Coca-Cola Co. (The) | 0.21% | 1.24% |
| PepsiCo, Inc. | 0.04% | 1.05% |
| Pfizer, Inc. | 0.24% | 1.23% |
| |
| Types of Investments in Portfolio | | |
| | | % of net assets as of 6/30/10 |
| Common Stocks | | 99.2% |
| Temporary Cash Investments | | 0.8% |
| Other Assets and Liabilities | | —(1) |
| (1) Category is less than 0.05% of total net assets. | | |
8
|
| Shareholder Fee Example (Unaudited) |
Fund shareholders may incur two types of costs: (1) transaction costs, including sales charges (loads) on purchase payments and redemption/ exchange fees; and (2) ongoing costs, including management fees; distribution and service (12b-1) fees; and other fund expenses. This example is intended to help you understand your ongoing costs (in dollars) of investing in your fund and to compare these costs with the ongoing cost of investing in other mutual funds.
The example is based on an investment of $1,000 made at the beginning of the period and held for the entire period from January 1, 2010 to June 30, 2010.
Actual Expenses
The table provides information about actual account values and actual expenses for each class. You may use the information, together with the amount you invested, to estimate the expenses that you paid over the period. First, identify the share class you own. Then simply divide your account value by $1,000 (for example, an $8,600 account value divided by $1,000 = 8.6), then multiply the result by the number under the heading “Expenses Paid During Period” to estimate the expenses you paid on your account during this period.
If you hold Investor Class shares of any American Century Investments fund, or Institutional Class shares of the American Century Diversified Bond Fund, in an American Century Investments account (i.e., not a financial intermediary or retirement plan account), American Century Investments may charge you a $12.50 semiannual account maintenance fee if the value of those shares is less than $10,000. We will redeem shares automatically in one of your accounts to pay the $12.50 fee. In determining your total eligible investment amount, we will include your investments in all personal accounts (including American Century Investments Brokerage accounts) registered under your Social Security number. Personal accounts include individual accounts, joint accounts, UGMA/UTMA accounts, personal trusts, Coverdell Education Savings Accounts and IRAs (including traditional, Roth, Rollover, SEP-, SARSEP- and SIMPLE-IRAs), and certain other retirement accounts. If you have only business, business retirement, employer-sponsored or American Century Investments Brokerage accounts, you are currently not subject to this fee. We will not charge the fee as long as you choose to manage your accounts exclusively online. If you are subject to the Account Maintenance Fee, your account value could be reduced by the fee amount.
Hypothetical Example for Comparison Purposes
The table also provides information about hypothetical account values and hypothetical expenses based on the actual expense ratio of each class of your fund and an assumed rate of return of 5% per year before expenses, which is not the actual return of a fund’s share class. The hypothetical account values and expenses may not be used to estimate the actual ending account balance or expenses you paid for the period. You may use this information to compare the ongoing costs of investing in your fund and other funds. To do so, compare this 5% hypothetical example with the 5% hypothetical examples that appear in the shareholder reports of the other funds.
9
Please note that the expenses shown in the table are meant to highlight your ongoing costs only and do not reflect any transactional costs, such as sales charges (loads) or redemption/exchange fees. Therefore, the table is useful in comparing ongoing costs only, and will not help you determine the relative total costs of owning different funds. In addition, if these transactional costs were included, your costs would have been higher.
| | | | |
| | Beginning | Ending | Expenses Paid | |
| | Account Value | Account Value | During Period* | Annualized |
| | 1/1/10 | 6/30/10 | 1/1/10 – 6/30/10 | Expense Ratio* |
| Actual | | | | |
| Investor Class | $1,000 | $939.30 | $3.37 | 0.70% |
| Institutional Class | $1,000 | $940.10 | $2.41 | 0.50% |
| A Class | $1,000 | $938.20 | $4.57 | 0.95% |
| B Class | $1,000 | $934.80 | $8.16 | 1.70% |
| C Class | $1,000 | $934.40 | $8.15 | 1.70% |
| R Class | $1,000 | $937.20 | $5.76 | 1.20% |
| Hypothetical | | | | |
| Investor Class | $1,000 | $1,021.32 | $3.51 | 0.70% |
| Institutional Class | $1,000 | $1,022.32 | $2.51 | 0.50% |
| A Class | $1,000 | $1,020.08 | $4.76 | 0.95% |
| B Class | $1,000 | $1,016.36 | $8.50 | 1.70% |
| C Class | $1,000 | $1,016.36 | $8.50 | 1.70% |
| R Class | $1,000 | $1,018.84 | $6.01 | 1.20% |
| *Expenses are equal to the class’s annualized expense ratio listed in the table above, multiplied by the average account value over the period, |
| multiplied by 181, the number of days in the most recent fiscal half-year, divided by 365, to reflect the one-half year period. |
10
| | | | | | |
| Equity Growth | | | | | | |
| |
| JUNE 30, 2010 | | | | | | |
| | Shares | Value | | | Shares | Value |
| Common Stocks — 99.2% | | | Sherwin-Williams Co. (The) | 57,479 | $ 3,976,972 |
| AEROSPACE & DEFENSE — 1.9% | | | Valspar Corp. | 100,827 | 3,036,909 |
| | | | | W.R. Grace & Co.(1) | 44,349 | 933,103 |
| Boeing Co. (The) | 211,877 | $ 13,295,282 | | | | |
| L-3 Communications | | | | | | 25,887,993 |
| Holdings, Inc. | 52,196 | 3,697,565 | | COMMERCIAL BANKS — 3.0% | |
| Northrop Grumman Corp. | 72,448 | 3,944,069 | | BB&T Corp. | 25,222 | 663,591 |
| Raytheon Co. | 272,167 | 13,170,161 | | KeyCorp | 142,825 | 1,098,324 |
| | | 34,107,077 | | PNC Financial Services | | |
| AIR FREIGHT & LOGISTICS — 0.8% | | | Group, Inc. | 93,500 | 5,282,750 |
| FedEx Corp. | 59,026 | 4,138,313 | | Regions Financial Corp. | 112,905 | 742,915 |
| United Parcel Service, Inc., | | | | Toronto-Dominion Bank (The) | 213,451 | 13,855,105 |
| Class B | 191,047 | 10,868,664 | | U.S. Bancorp. | 262,712 | 5,871,613 |
| | | 15,006,977 | | Wells Fargo & Co. | 1,088,752 | 27,872,051 |
| AUTO COMPONENTS — 0.5% | | | | | | 55,386,349 |
| TRW Automotive | | | | COMMERCIAL SERVICES & SUPPLIES — 0.1% |
| Holdings Corp.(1) | 318,272 | 8,774,759 | | R.R. Donnelley & Sons Co. | 68,893 | 1,127,779 |
| AUTOMOBILES — 0.2% | | | | Republic Services, Inc. | 25,736 | 765,131 |
| Ford Motor Co.(1) | 424,031 | 4,274,232 | | Waste Management, Inc. | 18,411 | 576,080 |
| BEVERAGES — 1.4% | | | | | | 2,468,990 |
| Coca-Cola Co. (The) | 77,887 | 3,903,696 | | COMMUNICATIONS EQUIPMENT — 1.2% | |
| Coca-Cola Enterprises, Inc. | 186,015 | 4,810,348 | | ADC Telecommunications, | | |
| Dr Pepper Snapple | | | | Inc.(1) | 166,811 | 1,236,069 |
| Group, Inc. | 435,981 | 16,301,330 | | Arris Group, Inc.(1) | 240,325 | 2,448,912 |
| PepsiCo, Inc. | 10,804 | 658,504 | | Cisco Systems, Inc.(1) | 489,611 | 10,433,610 |
| | | 25,673,878 | | CommScope, Inc.(1) | 90,266 | 2,145,623 |
| BIOTECHNOLOGY — 2.6% | | | | Harris Corp. | 60,227 | 2,508,455 |
| Amgen, Inc.(1) | 459,715 | 24,181,009 | | Plantronics, Inc. | 76,551 | 2,189,359 |
| Biogen Idec, Inc.(1) | 221,130 | 10,492,619 | | Tellabs, Inc. | 213,586 | 1,364,814 |
| Cephalon, Inc.(1) | 181,540 | 10,302,395 | | | | 22,326,842 |
| Cubist Pharmaceuticals, | | | | COMPUTERS & PERIPHERALS — 5.2% | |
| Inc.(1) | 126,635 | 2,608,681 | | Apple, Inc.(1) | 157,664 | 39,657,226 |
| Gilead Sciences, Inc.(1) | 8,141 | 279,073 | | EMC Corp.(1) | 214,528 | 3,925,862 |
| | | 47,863,777 | | Hewlett-Packard Co. | 206,192 | 8,923,990 |
| CAPITAL MARKETS — 2.3% | | | | Lexmark International, Inc., | | |
| Bank of New York Mellon | | | | Class A(1) | 247,156 | 8,163,563 |
| Corp. (The) | 332,062 | 8,198,611 | | SanDisk Corp.(1) | 213,352 | 8,975,718 |
| Goldman Sachs | | | | Seagate Technology(1) | 950,170 | 12,390,217 |
| Group, Inc. (The) | 177,034 | 23,239,253 | | | | |
| | | | | Synaptics, Inc.(1) | 57,020 | 1,568,050 |
| Investment Technology | | | | | | |
| Group, Inc.(1) | 34,749 | 558,069 | | Western Digital Corp.(1) | 349,063 | 10,527,740 |
| Legg Mason, Inc. | 327,231 | 9,172,285 | | | | 94,132,366 |
| | | 41,168,218 | | CONSTRUCTION & ENGINEERING — 0.7% | |
| CHEMICALS — 1.4% | | | | EMCOR Group, Inc.(1) | 307,626 | 7,127,695 |
| Ashland, Inc. | 70,651 | 3,279,619 | | Shaw Group, Inc. (The)(1) | 128,779 | 4,406,817 |
| Lubrizol Corp. | 151,137 | 12,137,813 | | URS Corp.(1) | 39,932 | 1,571,324 |
| OM Group, Inc.(1) | 105,766 | 2,523,577 | | | | 13,105,836 |
11
| | | | | | |
| Equity Growth | | | | | | |
| |
| | Shares | Value | | | Shares | Value |
| CONSUMER FINANCE — 0.6% | | | Schlumberger Ltd. | 104,667 | $ 5,792,272 |
| American Express Co. | 89,825 | $ 3,566,052 | | Transocean Ltd.(1) | 24,741 | 1,146,250 |
| AmeriCredit Corp.(1) | 90,513 | 1,649,147 | | | | 24,441,666 |
| Cash America | | | | FOOD & STAPLES RETAILING — 1.0% | |
| International, Inc. | 159,582 | 5,468,875 | | Safeway, Inc. | 466,756 | 9,176,423 |
| | | 10,684,074 | | SUPERVALU, INC. | 163,979 | 1,777,532 |
| CONTAINERS & PACKAGING — 0.3% | | | Wal-Mart Stores, Inc. | 136,614 | 6,567,035 |
| Graphic Packaging | | | | | | 17,520,990 |
| Holding Co.(1) | 690,333 | 2,174,549 | | | | |
| | | | | FOOD PRODUCTS — 3.5% | | |
| Rock-Tenn Co., Class A | 77,142 | 3,831,643 | | ConAgra Foods, Inc. | 412,491 | 9,619,290 |
| | | 6,006,192 | | Corn Products | | |
| DIVERSIFIED CONSUMER SERVICES — 0.3% | | International, Inc. | 240,638 | 7,291,331 |
| Career Education Corp.(1) | 54,073 | 1,244,760 | | Del Monte Foods Co. | 991,013 | 14,260,677 |
| Corinthian Colleges, Inc.(1) | 76,322 | 751,772 | | Dole Food Co., Inc.(1) | 214,731 | 2,239,644 |
| ITT Educational | | | | Hershey Co. (The) | 37,722 | 1,808,015 |
| Services, Inc.(1) | 35,326 | 2,932,765 | | | | |
| | | | | Lancaster Colony Corp. | 13,433 | 716,785 |
| | | 4,929,297 | | Mead Johnson Nutrition Co. | 38,339 | 1,921,551 |
| DIVERSIFIED FINANCIAL SERVICES — 4.1% | | | Sara Lee Corp. | 895,845 | 12,631,415 |
| Bank of America Corp. | 2,347,994 | 33,740,674 | | Tyson Foods, Inc., Class A | 761,313 | 12,477,920 |
| JPMorgan Chase & Co. | 1,140,243 | 41,744,296 | | | | 62,966,628 |
| | | 75,484,970 | | GAS UTILITIES — 0.3% | | |
| DIVERSIFIED TELECOMMUNICATION | | | Nicor, Inc. | 9,238 | 374,139 |
| SERVICES — 2.8% | | | | | | |
| AT&T, Inc. | 1,629,121 | 39,408,437 | | ONEOK, Inc. | 85,246 | 3,686,889 |
| Verizon Communications, Inc. | 400,787 | 11,230,052 | | UGI Corp. | 41,674 | 1,060,187 |
| | | 50,638,489 | | | | 5,121,215 |
| ELECTRIC UTILITIES — 0.8% | | | | HEALTH CARE EQUIPMENT & SUPPLIES — 1.0% |
| Entergy Corp. | 34,032 | 2,437,372 | | Becton, Dickinson & Co. | 37,341 | 2,524,998 |
| Exelon Corp. | 111,241 | 4,223,821 | | C.R. Bard, Inc. | 86,989 | 6,744,257 |
| | | | | Hospira, Inc.(1) | 15,461 | 888,235 |
| NextEra Energy, Inc. | 163,216 | 7,958,412 | | | | |
| | | 14,619,605 | | Medtronic, Inc. | 104,125 | 3,776,614 |
| ELECTRICAL EQUIPMENT — 0.1% | | | STERIS Corp. | 123,285 | 3,831,698 |
| General Cable Corp.(1) | 49,933 | 1,330,714 | | | | 17,765,802 |
| ELECTRONIC EQUIPMENT, INSTRUMENTS & | | | HEALTH CARE PROVIDERS & SERVICES — 3.0% |
| COMPONENTS — 1.1% | | | | Cardinal Health, Inc. | 447,225 | 15,031,232 |
| Anixter International, Inc.(1) | 49,814 | 2,122,076 | | Health Net, Inc.(1) | 41,335 | 1,007,334 |
| Celestica, Inc.(1) | 555,168 | 4,474,654 | | Humana, Inc.(1) | 357,259 | 16,316,018 |
| Tech Data Corp.(1) | 116,642 | 4,154,788 | | Magellan Health | | |
| | | | | Services, Inc.(1) | 57,900 | 2,102,928 |
| Tyco Electronics Ltd. | 365,815 | 9,284,385 | | | | |
| | | | | UnitedHealth Group, Inc. | 433,415 | 12,308,986 |
| Vishay Intertechnology, Inc.(1) | 57,125 | 442,148 | | | | |
| | | | | WellPoint, Inc.(1) | 155,118 | 7,589,924 |
| | | 20,478,051 | | | | |
| ENERGY EQUIPMENT & SERVICES — 1.3% | | | | | 54,356,422 |
| Complete Production | | | | HOTELS, RESTAURANTS & LEISURE — 0.6% | |
| Services, Inc.(1) | 186,731 | 2,670,253 | | McDonald’s Corp. | 96,313 | 6,344,137 |
| National Oilwell Varco, Inc. | 275,022 | 9,094,978 | | Panera Bread Co., Class A(1) | 47,587 | 3,582,825 |
| Oil States International, Inc.(1) | 144,970 | 5,737,913 | | Starbucks Corp. | 70,062 | 1,702,507 |
| | | | | | | 11,629,469 |
12
| | | | | | |
| Equity Growth | | | | | | |
| |
| | Shares | Value | | | Shares | Value |
| HOUSEHOLD DURABLES — 0.4% | | | INTERNET & CATALOG RETAIL — 0.5% | |
| American Greetings Corp., | | | | Amazon.com, Inc.(1) | 40,363 | $ 4,410,061 |
| Class A | 132,025 | $ 2,476,789 | | Netflix, Inc.(1) | 39,833 | 4,327,856 |
| D.R. Horton, Inc. | 139,908 | 1,375,295 | | | | 8,737,917 |
| Harman International | | | | INTERNET SOFTWARE & SERVICES — 1.6% | |
| Industries, Inc.(1) | 86,847 | 2,595,857 | | | | |
| | | | | AOL, Inc.(1) | 169,194 | 3,517,543 |
| Ryland Group, Inc. | 23,494 | 371,675 | | | | |
| | | 6,819,616 | | EarthLink, Inc. | 310,110 | 2,468,476 |
| | | | | Google, Inc., Class A(1) | 52,392 | 23,311,820 |
| HOUSEHOLD PRODUCTS — 2.4% | | | | | |
| Colgate-Palmolive Co. | 49,500 | 3,898,620 | | | | 29,297,839 |
| Kimberly-Clark Corp. | 128,390 | 7,784,285 | | IT SERVICES — 4.4% | | |
| Procter & Gamble Co. (The) | 531,010 | 31,849,980 | | Acxiom Corp.(1) | 17,788 | 261,306 |
| | | 43,532,885 | | Automatic Data | | |
| | | | | Processing, Inc. | 309,591 | 12,464,134 |
| INDEPENDENT POWER PRODUCERS & | | | | | |
| ENERGY TRADERS — 1.6% | | | | Computer Sciences Corp. | 241,494 | 10,927,603 |
| Constellation Energy | | | | Convergys Corp.(1) | 637,197 | 6,250,903 |
| Group, Inc. | 539,127 | 17,386,846 | | International Business | | |
| Mirant Corp.(1) | 533,803 | 5,636,960 | | Machines Corp. | 376,805 | 46,527,881 |
| NRG Energy, Inc.(1) | 243,741 | 5,169,746 | | NeuStar, Inc., Class A(1) | 44,055 | 908,414 |
| | | 28,193,552 | | Western Union Co. (The) | 233,591 | 3,482,842 |
| INDUSTRIAL CONGLOMERATES — 1.8% | | | | | 80,823,083 |
| 3M Co. | 140,902 | 11,129,849 | | LEISURE EQUIPMENT & PRODUCTS — 0.7% | |
| Carlisle Cos., Inc. | 235,597 | 8,512,120 | | Polaris Industries, Inc. | 216,011 | 11,798,521 |
| General Electric Co. | 934,370 | 13,473,615 | | LIFE SCIENCES TOOLS & SERVICES — 0.3% | |
| | | 33,115,584 | | Bruker Corp.(1) | 448,969 | 5,459,463 |
| INSURANCE — 5.1% | | | | MACHINERY — 2.8% | | |
| ACE Ltd. | 69,427 | 3,574,102 | | Briggs & Stratton Corp. | 150,539 | 2,562,174 |
| Allied World Assurance Co. | | | | Caterpillar, Inc. | 176,427 | 10,597,970 |
| Holdings Ltd. | 169,318 | 7,683,651 | | Cummins, Inc. | 109,397 | 7,125,027 |
| American Financial | | | | Deere & Co. | 165,140 | 9,194,995 |
| Group, Inc. | 513,094 | 14,017,728 | | Graco, Inc. | 40,854 | 1,151,674 |
| Arch Capital Group Ltd.(1) | 7,396 | 551,002 | | Mueller Industries, Inc. | 40,408 | 994,037 |
| Aspen Insurance | | | | Oshkosh Corp.(1) | 303,615 | 9,460,643 |
| Holdings Ltd. | 31,564 | 780,893 | | Timken Co. | 306,784 | 7,973,316 |
| Berkshire Hathaway, Inc., | | | | WABCO Holdings, Inc.(1) | 76,223 | 2,399,500 |
| Class B(1) | 72,811 | 5,802,309 | | | | |
| Chubb Corp. (The) | 99,650 | 4,983,497 | | | | 51,459,336 |
| CNA Financial Corp.(1) | 51,760 | 1,322,986 | | MEDIA — 2.5% | | |
| Endurance Specialty | | | | Comcast Corp., Class A | 1,024,771 | 17,800,272 |
| Holdings Ltd. | 140,147 | 5,259,717 | | DIRECTV, Class A(1) | 61,882 | 2,099,038 |
| Hartford Financial Services | | | | Discovery Communications, | | |
| Group, Inc. (The) | 27,279 | 603,684 | | Inc., Class C(1) | 34,144 | 1,056,074 |
| Horace Mann Educators Corp. | 56,976 | 871,733 | | Gannett Co., Inc. | 51,293 | 690,404 |
| Principal Financial Group, Inc. | 618,424 | 14,495,859 | | Liberty Media Corp. - Starz, | | |
| Protective Life Corp. | 39,485 | 844,584 | | Series A(1) | 20,446 | 1,059,921 |
| Prudential Financial, Inc. | 351,237 | 18,847,377 | | Scholastic Corp. | 76,477 | 1,844,625 |
| Transatlantic Holdings, Inc. | 14,065 | 674,557 | | Time Warner, Inc. | 638,297 | 18,453,166 |
| Travelers Cos., Inc. (The) | 266,598 | 13,129,951 | | Walt Disney Co. (The) | 60,236 | 1,897,434 |
| | | 93,443,630 | | | | 44,900,934 |
13
| | | | | | |
| Equity Growth | | | | | | |
| |
| | Shares | Value | | | Shares | Value |
| METALS & MINING — 2.0% | | | | Merck & Co., Inc. | 60,925 | $ 2,130,547 |
| Freeport-McMoRan | | | | Pfizer, Inc. | 301,693 | 4,302,142 |
| Copper & Gold, Inc. | 306,871 | $ 18,145,282 | | | | 119,503,780 |
| Newmont Mining Corp. | 188,965 | 11,666,699 | | REAL ESTATE INVESTMENT TRUSTS (REITs) — 0.4% |
| Reliance Steel & | | | | Annaly Capital | | |
| Aluminum Co. | 172,381 | 6,231,573 | | Management, Inc. | 41,025 | 703,579 |
| Worthington Industries, Inc. | 76,888 | 988,780 | | Boston Properties, Inc. | 24,136 | 1,721,862 |
| | | 37,032,334 | | CBL & Associates | | |
| MULTILINE RETAIL — 1.4% | | | | Properties, Inc. | 12,384 | 154,057 |
| Big Lots, Inc.(1) | 23,421 | 751,580 | | Equity LifeStyle | | |
| Dillard’s, Inc., Class A | 153,790 | 3,306,485 | | Properties, Inc. | 39,908 | 1,924,763 |
| Dollar Tree, Inc.(1) | 112,283 | 4,674,321 | | Federal Realty | | |
| | | | | Investment Trust | 1,454 | 102,173 |
| Family Dollar Stores, Inc. | 98,213 | 3,701,648 | | Mid-America Apartment | | |
| Macy’s, Inc. | 146,389 | 2,620,363 | | Communities, Inc. | 4,248 | 218,644 |
| Target Corp. | 213,508 | 10,498,188 | | Simon Property Group, Inc. | 19,682 | 1,589,321 |
| | | 25,552,585 | | | | 6,414,399 |
| MULTI-UTILITIES — 1.4% | | | | ROAD & RAIL — 0.4% | | |
| DTE Energy Co. | 197,480 | 9,007,063 | | CSX Corp. | 75,806 | 3,762,252 |
| Integrys Energy Group, Inc. | 375,518 | 16,425,157 | | Norfolk Southern Corp. | 69,580 | 3,691,219 |
| NiSource, Inc. | 54,367 | 788,322 | | | | 7,453,471 |
| | | 26,220,542 | | SEMICONDUCTORS & SEMICONDUCTOR | |
| OFFICE ELECTRONICS — 0.1% | | | EQUIPMENT — 3.5% | | |
| Xerox Corp. | 289,914 | 2,330,909 | | Advanced Micro | | |
| OIL, GAS & CONSUMABLE FUELS — 9.3% | | | Devices, Inc.(1) | 366,367 | 2,681,806 |
| Anadarko Petroleum Corp. | 98,325 | 3,548,549 | | Broadcom Corp., Class A | 259,885 | 8,568,408 |
| Apache Corp. | 98,270 | 8,273,351 | | Intel Corp. | 1,766,118 | 34,350,995 |
| Canadian Natural | | | | LSI Corp.(1) | 683,918 | 3,146,023 |
| Resources Ltd. | 295,708 | 9,826,377 | | Micron Technology, Inc.(1) | 346,095 | 2,938,347 |
| Chevron Corp. | 546,785 | 37,104,830 | | RF Micro Devices, Inc.(1) | 493,699 | 1,930,363 |
| Cimarex Energy Co. | 74,168 | 5,308,945 | | Texas Instruments, Inc. | 405,118 | 9,431,147 |
| ConocoPhillips | 473,316 | 23,235,083 | | | | 63,047,089 |
| Exxon Mobil Corp. | 974,117 | 55,592,857 | | SOFTWARE — 4.0% | | |
| Murphy Oil Corp. | 126,640 | 6,275,012 | | ACI Worldwide, Inc.(1) | 31,369 | 610,754 |
| Occidental Petroleum Corp. | 160,803 | 12,405,952 | | Fair Isaac Corp. | 69,230 | 1,508,522 |
| World Fuel Services Corp. | 291,737 | 7,567,658 | | Intuit, Inc.(1) | 453,113 | 15,754,739 |
| | | 169,138,614 | | Microsoft Corp. | 1,728,150 | 39,764,732 |
| PAPER & FOREST PRODUCTS — 0.2% | | | Oracle Corp. | 412,276 | 8,847,443 |
| International Paper Co. | 162,770 | 3,683,485 | | Quest Software, Inc.(1) | 54,066 | 975,351 |
| PHARMACEUTICALS — 6.6% | | | | Symantec Corp.(1) | 244,255 | 3,390,259 |
| Abbott Laboratories | 266,844 | 12,482,962 | | Synopsys, Inc.(1) | 128,090 | 2,673,238 |
| Bristol-Myers Squibb Co. | 583,531 | 14,553,263 | | | | |
| | | | | | | 73,525,038 |
| Eli Lilly & Co. | 649,903 | 21,771,751 | | SPECIALTY RETAIL — 2.3% | | |
| Endo Pharmaceuticals | | | | | | |
| Holdings, Inc.(1) | 496,908 | 10,842,533 | | AutoZone, Inc.(1) | 7,771 | 1,501,513 |
| Forest Laboratories, Inc.(1) | 307,848 | 8,444,271 | | Gap, Inc. (The) | 426,097 | 8,291,847 |
| Johnson & Johnson | 696,608 | 41,141,668 | | Home Depot, Inc. (The) | 16,161 | 453,639 |
| King Pharmaceuticals, Inc.(1) | 505,223 | 3,834,643 | | PetSmart, Inc. | 46,593 | 1,405,711 |
14
| | | | | |
| Equity Growth | | | | | |
| |
| | Shares | Value | | Notes to Schedule of Investments |
| Rent-A-Center, Inc.(1) | 241,041 | $ 4,883,491 | | (1) | Non-income producing. |
| Ross Stores, Inc. | 273,617 | 14,581,050 | | (2) | Category is less than 0.05% of total net assets. |
| Williams-Sonoma, Inc. | 436,746 | 10,840,036 | | | |
| | | 41,957,287 | | Industry classifications are unaudited. |
| TEXTILES, APPAREL & LUXURY GOODS — 0.2% | | | |
| Jones Apparel Group, Inc. | 207,051 | 3,281,758 | | See Notes to Financial Statements. |
| THRIFTS & MORTGAGE FINANCE(2) | | | | |
| Ocwen Financial Corp.(1) | 65,906 | 671,582 | | | |
| TOBACCO — 1.2% | | | | | |
| Altria Group, Inc. | 103,379 | 2,071,715 | | | |
| Philip Morris International, Inc. | 448,874 | 20,576,384 | | | |
| | | 22,648,099 | | | |
| TOTAL COMMON STOCKS | | | | | |
| (Cost $1,808,441,818) | | 1,808,194,210 | | | |
| Temporary Cash Investments — 0.8% | | | |
| JPMorgan U.S. Treasury | | | | | |
| Plus Money Market Fund | | | | | |
| Agency Shares | 75,599 | 75,599 | | | |
| Repurchase Agreement, Bank of America | | | | |
| Securities, LLC, (collateralized by various | | | | |
| U.S. Treasury obligations, 1.125%, 6/30/11, | | | | |
| valued at $14,687,044), in a joint trading | | | | |
| account at 0.01%, dated 6/30/10, due | | | | |
| 7/1/10 (Delivery value $14,400,004) | 14,400,000 | | | |
| TOTAL TEMPORARY | | | | | |
| CASH INVESTMENTS | | | | | |
| (Cost $14,475,599) | | 14,475,599 | | | |
| TOTAL INVESTMENT | | | | | |
| SECURITIES — 100.0% | | | | | |
| (Cost $1,822,917,417) | | 1,822,669,809 | | | |
| OTHER ASSETS AND LIABILITIES(2) | (362,562) | | | |
| TOTAL NET ASSETS — 100.0% | | $1,822,307,247 | | | |
15
|
| Statement of Assets and Liabilities |
| |
| JUNE 30, 2010 | |
| Assets | |
| Investment securities, at value (cost of $1,822,917,417) | $1,822,669,809 |
| Receivable for capital shares sold | 855,411 |
| Dividends and interest receivable | 1,788,236 |
| | 1,825,313,456 |
| | |
| Liabilities | |
| Payable for capital shares redeemed | 1,891,507 |
| Accrued management fees | 1,057,080 |
| Service fees (and distribution fees — A Class and R Class) payable | 53,926 |
| Distribution fees payable | 3,696 |
| | 3,006,209 |
| | |
| Net Assets | $1,822,307,247 |
| | |
| Net Assets Consist of: | |
| Capital (par value and paid-in surplus) | $2,357,981,370 |
| Undistributed net investment income | 689,598 |
| Accumulated net realized loss on investment transactions | (536,116,113) |
| Net unrealized depreciation on investments | (247,608) |
| | $1,822,307,247 |
| | | |
| | Net assets | Shares outstanding | Net asset value per share |
| Investor Class, $0.01 Par Value | $1,371,991,980 | 79,764,886 | $17.20 |
| Institutional Class, $0.01 Par Value | $203,860,092 | 11,845,680 | $17.21 |
| A Class, $0.01 Par Value | $237,075,516 | 13,793,549 | $17.19* |
| B Class, $0.01 Par Value | $73,363 | 4,266 | $17.20 |
| C Class, $0.01 Par Value | $5,536,459 | 324,091 | $17.08 |
| R Class, $0.01 Par Value | $3,769,837 | 219,188 | $17.20 |
| *Maximum offering price $18.24 (net asset value divided by 0.9425) | | |
| |
| |
| See Notes to Financial Statements. | | | |
16
| |
| YEAR ENDED JUNE 30, 2010 | |
| Investment Income (Loss) | |
| Income: | |
| Dividends (net of foreign taxes withheld of $61,528) | $ 36,316,188 |
| Interest | 10,261 |
| | 36,326,449 |
| | |
| Expenses: | |
| Management fees | 13,235,312 |
| Distribution fees: | |
| B Class | 576 |
| C Class | 45,091 |
| Service fees: | |
| B Class | 192 |
| C Class | 15,030 |
| Distribution and service fees: | |
| A Class | 667,682 |
| R Class | 16,158 |
| Directors’ fees and expenses | 59,031 |
| Other expenses | 47,560 |
| | 14,086,632 |
| | |
| Net investment income (loss) | 22,239,817 |
| | |
| Realized and Unrealized Gain (Loss) | |
| Net realized gain (loss) on: | |
| Investment transactions | 172,390,971 |
| Futures contract transactions | (1,921,048) |
| | 170,469,923 |
| | |
| Change in net unrealized appreciation (depreciation) on investments | 52,924,221 |
| | |
| Net realized and unrealized gain (loss) | 223,394,144 |
| | |
| Net Increase (Decrease) in Net Assets Resulting from Operations | $245,633,961 |
| |
| |
| See Notes to Financial Statements. | |
17
|
| Statement of Changes in Net Assets |
| | |
| YEARS ENDED JUNE 30, 2010 AND JUNE 30, 2009 | | |
| Increase (Decrease) in Net Assets | 2010 | 2009 |
| Operations | | |
| Net investment income (loss) | $ 22,239,817 | $ 33,724,767 |
| Net realized gain (loss) | 170,469,923 | (613,404,281) |
| Change in net unrealized appreciation (depreciation) | 52,924,221 | (204,285,394) |
| Net increase (decrease) in net assets resulting from operations | 245,633,961 | (783,964,908) |
| | | |
| Distributions to Shareholders | | |
| From net investment income: | | |
| Investor Class | (16,332,181) | (30,419,338) |
| Institutional Class | (2,596,043) | (7,046,596) |
| A Class | (2,255,148) | (4,230,042) |
| B Class | (80) | (381) |
| C Class | (6,146) | (42,370) |
| R Class | (19,178) | (16,018) |
| Decrease in net assets from distributions | (21,208,776) | (41,754,745) |
| | | |
| Capital Share Transactions | | |
| Net increase (decrease) in net assets from capital share transactions | (143,558,603) | (267,965,105) |
| | | |
| Net increase (decrease) in net assets | 80,866,582 | (1,093,684,758) |
| | | |
| Net Assets | | |
| Beginning of period | 1,741,440,665 | 2,835,125,423 |
| End of period | $1,822,307,247 | $ 1,741,440,665 |
| | | |
| Undistributed net investment income | $689,598 | $39,417 |
| |
| |
| See Notes to Financial Statements. | | |
18
|
| Notes to Financial Statements |
JUNE 30, 2010
1. Organization and Summary of Significant Accounting Policies
Organization — American Century Quantitative Equity Funds, Inc. (the corporation) is registered under the Investment Company Act of 1940 (the 1940 Act) as an open-end management investment company. Equity Growth Fund (the fund) is one fund in a series issued by the corporation. The fund is diversified under the 1940 Act. The fund’s investment objective is to seek long-term capital growth. The fund pursues its objective by investing in common stocks. The following is a summary of the fund’s significant accounting policies.
Multiple Class — The fund is authorized to issue the Investor Class, the Institutional Class, the A Class, the B Class, the C Class and the R Class. The A Class may incur an initial sales charge. The A Class, B Class and C Class may be subject to a contingent deferred sales charge. The share classes differ principally in their respective sales charges and distribution and shareholder servicing expenses and arrangements. All shares of the fund represent an equal pro rata interest in the net assets of the class to which such shares belong, and have identical voting, dividend, liquidation and other rights and the same terms and conditions, except for class specific expenses and exclusive rights to vote on matters affecting only individual classes. Income, non-class specific expenses, and realized and unrealized capital gains and losses of the fund are allocated to each class of shares based on their relative net assets.
Security Valuations — Securities traded primarily on a principal securities exchange are valued at the last reported sales price, or at the mean of the latest bid and asked prices where no last sales price is available. Depending on local convention or regulation, securities traded over-the-counter are valued at the mean of the latest bid and asked prices, the last sales price, or the official close price. Investments in open-end management investment companies are valued at the reported net asset value. Discount notes may be valued through a commercial pricing service or at amortized cost, which approximates fair value. Securities traded on foreign securities exchanges and over-the-counter markets are normally completed before the close of business on days that the New York Stock Exchange (the Exchange) is open and may also take place on days when the Exchange is not open. If an event occurs after the value of a security was established but before the net asset value per share was determined that was likely to materially change the net asset value, that security would be valued as determined in accordance with procedures adopted by the Board of Directors. If the fund determines that the market price of a portfolio security is not readily available, or that the valuation methods mentioned above do not reflect the security’s fair value, such security is valued as determined by the Board of Directors or its designee, in accordance with procedures adopted by the Board of Directors, if such determination would materially impact a fund’s net asset value. Certain other circumstances may cause the fund to use alternative procedures to value a security such as: a security has been declared in default; trading in a security has been halted during the trading day; or there is a foreign market holiday and no trading will commence .
Security Transactions — For financial reporting purposes, security transactions are accounted for as of the trade date. Net realized gains and losses are determined on the identified cost basis, which is also used for federal income tax purposes.
Investment Income — Dividend income less foreign taxes withheld, if any, is recorded as of the ex-dividend date. Interest income is recorded on the accrual basis and includes accretion of discounts and amortization of premiums.
19
Repurchase Agreements — The fund may enter into repurchase agreements with institutions that American Century Investment Management, Inc. (ACIM) (the investment advisor) has determined are creditworthy pursuant to criteria adopted by the Board of Directors. Each repurchase agreement is recorded at cost. The fund requires that the collateral, represented by securities, received in a repurchase transaction be transferred to the custodian in a manner sufficient to enable the fund to obtain those securities in the event of a default under the repurchase agreement. ACIM monitors, on a daily basis, the securities transferred to ensure the value, including accrued interest, of the securities under each repurchase agreement is equal to or greater than amounts owed to the fund under each repurchase agreement.
Joint Trading Account — Pursuant to an Exemptive Order issued by the Securities and Exchange Commission, the fund, along with certain other funds in the American Century Investments family of funds, may transfer uninvested cash balances into a joint trading account. These balances are invested in one or more repurchase agreements that are collateralized by U.S. Treasury or Agency obligations.
Income Tax Status — It is the fund’s policy to distribute substantially all net investment income and net realized gains to shareholders and to otherwise qualify as a regulated investment company under provisions of the Internal Revenue Code. The fund is no longer subject to examination by tax authorities for years prior to 2006. At this time, management believes there are no uncertain tax positions which, based on their technical merit, would not be sustained upon examination and for which it is reasonably possible that the total amounts of unrecognized tax benefits will significantly change in the next twelve months. Accordingly, no provision has been made for federal or state income taxes.
Distributions to Shareholders — Distributions to shareholders are recorded on the ex-dividend date. Distributions from net investment income, if any, are generally declared and paid quarterly. Distributions from net realized gains, if any, are generally declared and paid annually.
Indemnifications — Under the corporation’s organizational documents, its officers and directors are indemnified against certain liabilities arising out of the performance of their duties to the fund. In addition, in the normal course of business, the fund enters into contracts that provide general indemnifications. The maximum exposure under these arrangements is unknown as this would involve future claims that may be made against a fund. The risk of material loss from such claims is considered by management to be remote.
Use of Estimates — The financial statements are prepared in conformity with accounting principles generally accepted in the United States of America, which may require management to make certain estimates and assumptions at the date of the financial statements. Actual results could differ from these estimates.
Subsequent Events — In preparing the financial statements, management evaluated the impact of events or transactions occurring through the date the financial statements were issued that would merit recognition or disclosure.
20
2. Fees and Transactions with Related Parties
Management Fees — The corporation has entered into a Management Agreement with ACIM, under which ACIM provides the fund with investment advisory and management services in exchange for a single, unified management fee (the fee) per class. The Agreement provides that all expenses of managing and operating the fund, except brokerage expenses, taxes, interest, fees and expenses of the independent directors (including legal counsel fees), and extraordinary expenses, will be paid by ACIM. The fee is computed and accrued daily based on the daily net assets of the specific class of shares of the fund and paid monthly in arrears. The fee consists of (1) an Investment Category Fee based on the daily net assets of the fund and certain other accounts managed by the investment advisor that are in the same broad investment category as the fund and (2) a Complex Fee based on the assets of all the funds in the American Century Investments family of funds. The rates for the Investment Category Fee range from 0.3380% to 0.5200% for the fund. The rates for the Complex Fee range from 0.2500% to 0.3100% for the Investor Class, A Class, B Class, C Class and R Class. The Institutional Class is 0.2000% less at each point within the Complex Fee range. The effective annual management fee for each class for the year ended June 30, 2010, was 0.69% for the Investor Class, A Class, B Class, C Class and R Class and 0.49% for the Institutional Class.
Distribution and Service Fees — The Board of Directors has adopted a separate Master Distribution and Individual Shareholder Services Plan for each of the A Class, B Class, C Class and R Class (collectively the plans), pursuant to Rule 12b-1 of the 1940 Act. The plans provide that the A Class will pay American Century Investment Services, Inc. (ACIS) an annual distribution and service fee of 0.25%. The plans provide that the B Class and C Class will each pay ACIS an annual distribution fee of 0.75% and service fee of 0.25%. The plans provide that the R Class will pay ACIS an annual distribution and service fee of 0.50%. The fees are computed and accrued daily based on each class’s daily net assets and paid monthly in arrears. The fees are used to pay financial intermediaries for distribution and individual shareholde r services. Fees incurred under the plans during the year ended June 30, 2010, are detailed in the Statement of Operations.
Related Parties — Certain officers and directors of the corporation are also officers and/or directors of American Century Companies, Inc. (ACC), the parent of the corporation’s investment advisor, ACIM, the distributor of the corporation, ACIS, and the corporation’s transfer agent, American Century Services, LLC.
The fund is eligible to invest in a money market fund for temporary purposes, which is managed by J.P. Morgan Investment Management, Inc. (JPMIM). The fund has a Mutual Funds Services Agreement with J.P. Morgan Investor Services Co. (JPMIS) and a securities lending agreement with JPMorgan Chase Bank (JPMCB). JPMCB is a custodian of the fund. JPMIM, JPMIS and JPMCB are wholly owned subsidiaries of JPMorgan Chase & Co. (JPM). JPM is an equity investor in ACC.
3. Investment Transactions
Purchases and sales of investment securities, excluding short-term investments, for the year ended June 30, 2010, were $1,238,813,300 and $1,386,097,639, respectively.
21
| | | | |
| 4. Capital Share Transactions | | | | |
| |
| Transactions in shares of the fund were as follows: | | |
| | Year ended June 30, 2010 | Year ended June 30, 2009 |
| | Shares | Amount | Shares | Amount |
| Investor Class/Shares Authorized | 400,000,000 | | 400,000,000 | |
| Sold | 7,172,629 | $ 128,083,968 | 13,834,287 | $ 216,287,346 |
| Issued in reinvestment of distributions | 704,506 | 13,055,854 | 1,486,779 | 24,209,945 |
| Redeemed | (15,558,934) | (279,380,253) | (21,560,263) | (356,914,934) |
| | (7,681,799) | (138,240,431) | (6,239,197) | (116,417,643) |
| Institutional Class/Shares Authorized | 90,000,000 | | 90,000,000 | |
| Sold | 4,013,345 | 71,922,013 | 3,577,484 | 58,678,266 |
| Issued in reinvestment of distributions | 132,081 | 2,451,690 | 399,943 | 6,598,298 |
| Redeemed | (3,267,204) | (59,280,380) | (13,301,187) | (204,327,363) |
| | 878,222 | 15,093,323 | (9,323,760) | (139,050,799) |
| A Class/Shares Authorized | 80,000,000 | | 80,000,000 | |
| Sold | 5,303,375 | 94,772,509 | 4,755,754 | 76,867,990 |
| Issued in reinvestment of distributions | 91,586 | 1,694,836 | 207,347 | 3,356,825 |
| Redeemed | (6,419,652) | (118,477,685) | (5,593,868) | (93,689,779) |
| | (1,024,691) | (22,010,340) | (630,767) | (13,464,964) |
| B Class/Shares Authorized | 10,000,000 | | 10,000,000 | |
| Sold | 86 | 1,500 | 3,023 | 46,617 |
| Issued in reinvestment of distributions | 4 | 80 | 25 | 369 |
| Redeemed | (23) | (429) | (967) | (14,272) |
| | 67 | 1,151 | 2,081 | 32,714 |
| C Class/Shares Authorized | 10,000,000 | | 10,000,000 | |
| Sold | 86,695 | 1,541,988 | 83,085 | 1,300,447 |
| Issued in reinvestment of distributions | 317 | 5,851 | 2,694 | 40,500 |
| Redeemed | (98,512) | (1,782,489) | (102,960) | (1,633,457) |
| | (11,500) | (234,650) | (17,181) | (292,510) |
| R Class/Shares Authorized | 10,000,000 | | 10,000,000 | |
| Sold | 157,816 | 2,820,008 | 90,454 | 1,365,899 |
| Issued in reinvestment of distributions | 1,030 | 19,178 | 1,053 | 16,018 |
| Redeemed | (54,825) | (1,006,842) | (10,815) | (153,820) |
| | 104,021 | 1,832,344 | 80,692 | 1,228,097 |
| Net increase (decrease) | (7,735,680) | $(143,558,603) | (16,128,132) | $(267,965,105) |
22
5. Fair Value Measurements
The fund’s securities valuation process is based on several considerations and may use multiple inputs to determine the fair value of the positions held by the fund. In conformity with accounting principles generally accepted in the United States of America, the inputs used to determine a valuation are classified into three broad levels as follows:
• Level 1 valuation inputs consist of unadjusted quoted prices in an active market for identical securities;
• Level 2 valuation inputs consist of significant direct or indirect observable market data (including quoted prices for similar securities, evaluations of subsequent market events, interest rates, prepayment speeds, credit risk, etc.); or
• Level 3 valuation inputs consist of significant unobservable inputs (including a fund’s own assumptions).
The level classification is based on the lowest level input that is significant to the fair valuation measurement. The valuation inputs are not an indication of the risks associated with investing in these securities or other financial instruments.
The following is a summary of the valuation inputs used to determine the fair value of the fund’s securities as of June 30, 2010. The Schedule of Investments provides additional details on the fund’s portfolio holdings.
| | | |
| | Level 1 | Level 2 | Level 3 |
| Investment Securities | | | |
| Common Stocks | $1,808,194,210 | — | |
| Temporary Cash Investments | 75,599 | $14,400,000 | — |
| Total Value of Investment Securities | $1,808,269,809 | $14,400,000 | — |
6. Derivative Instruments
Equity Price Risk — The fund is subject to equity price risk in the normal course of pursuing its investment objectives. A fund may enter into futures contracts based on an equity index in order to manage its exposure to changes in market conditions. A fund may purchase futures contracts to gain exposure to increases in market value or sell futures contracts to protect against a decline in market value. Upon entering into a futures contract, a fund is required to deposit either cash or securities in an amount equal to a certain percentage of the contract value (initial margin). Subsequent payments (variation margin) are made or received daily, in cash, by a fund. The variation margin is equal to the daily change in the contract value and is recorded as unrealized gains and losses. A fund recognizes a realized gain or loss whe n the contract is closed or expires. Net realized and unrealized gains or losses occurring during the holding period of futures contracts are a component of net realized gain (loss) on futures contract transactions and change in net unrealized appreciation (depreciation) on futures contracts, respectively. One of the risks of entering into futures contracts is the possibility that the change in value of the contract may not correlate with the changes in value of the underlying securities. During the period, the fund infrequently purchased equity price risk derivative instruments for temporary investment purposes.
At period end, the fund did not have any equity price risk derivative instruments disclosed on the Statement of Assets and Liabilities. For the year ended June 30, 2010, the effect of equity price risk derivative instruments on the Statement of Operations was $(1,921,048) in net realized gain (loss) on futures contract transactions.
23
7. Interfund Lending
The fund, along with certain other funds in the American Century Investments family of funds, may participate in an interfund lending program, pursuant to an Exemptive Order issued by the Securities and Exchange Commission (SEC). This program provides an alternative credit facility allowing the fund to borrow from or lend to other funds in the American Century Investments family of funds that permit such transactions. Interfund lending transactions are subject to each fund’s investment policies and borrowing and lending limits. The interfund loan rate earned/paid on interfund lending transactions is determined daily based on the average of certain current market rates. Interfund lending transactions normally extend only overnight, but can have a maximum duration of seven days. The program is subject to annual approval by the Board of Directors. During the year ended June 30, 2010, the fund did not utilize the program.
8. Federal Tax Information
The tax character of distributions paid during the years ended June 30, 2010 and June 30, 2009 were as follows:
| | |
| | 2010 | 2009 |
| Distributions Paid From | | |
| Ordinary income | $21,208,776 | $41,588,499 |
| Long-term capital gains | — | $166,246 |
The book-basis character of distributions made during the year from net investment income or net realized gains may differ from their ultimate characterization for federal income tax purposes. These differences reflect the differing character of certain income items and net realized gains and losses for financial statement and tax purposes, and may result in reclassification among certain capital accounts on the financial statements.
As of June 30, 2010, the federal tax cost of investments and the components of distributable earnings on a tax-basis were as follows:
| | |
| Federal tax cost of investments | $1,840,854,939 |
| Gross tax appreciation of investments | $ 142,250,532 |
| Gross tax depreciation of investments | (160,435,662) |
| Net tax appreciation (depreciation) of investments | $ (18,185,130) |
| Undistributed ordinary income | $689,598 |
| Accumulated capital losses | $(518,178,591) |
The difference between book-basis and tax-basis cost and unrealized appreciation (depreciation) is attributable primarily to the tax deferral of losses on wash sales.
The accumulated capital losses listed above represent net capital loss carryovers that may be used to offset future realized capital gains for federal income tax purposes. Future capital loss carryover utilization in any given year may be subject to Internal Revenue Code limitations. The capital loss carryovers of $(190,964,078) and $(327,214,513) expire in 2017 and 2018, respectively.
24
9. Corporate Event
As part of a long-standing estate and business succession plan established by ACC Co-Chairman James E. Stowers, Jr., the founder of American Century Investments, ACC Co-Chairman Richard W. Brown succeeded Mr. Stowers as trustee of a trust that holds a greater-than-25% voting interest in ACC, the parent corporation of the fund’s advisor. Under the 1940 Act, this is presumed to represent control of ACC even though it is less than a majority interest. The change of trustee may technically be considered a “change of control” of ACC and therefore also a change of control of the fund’s advisor even though there has been no change to its management and none is anticipated. The “change of control” resulted in the assignment of the fund’s investment advisory agreement. Under the 1940 Act, an assignment automatically terminated such agreement, making the approval of a new agreement necessa ry.
On February 18, 2010, the Board of Directors approved an interim investment advisory agreement under which the fund will be managed until a new agreement is approved by fund shareholders. On April 1, 2010, the Board of Directors approved a new investment advisory agreement. The interim agreement and the new agreement are substantially identical to the terminated agreements (with the exception of different effective and termination dates) and will not result in changes in the management of American Century Investments, the fund, its investment objectives, fees or services provided. The new agreement for the fund was approved by shareholders at a Special Meeting of Shareholders on June 16, 2010. The new agreement went into effect on July 16, 2010.
10. Other Tax Information (Unaudited)
The following information is provided pursuant to provisions of the Internal Revenue Code.
The fund hereby designates up to the maximum amount allowable as qualified dividend income for the fiscal year ended June 30, 2010.
For corporate taxpayers, the fund hereby designates $21,208,776, or up to the maximum amount allowable, of ordinary income distributions paid during the fiscal year ended June 30, 2010 as qualified for the corporate dividends received deduction.
25
| | | | | | | |
| Equity Growth | | | | | |
| |
| Investor Class | | | | | | |
| For a Share Outstanding Throughout the Years Ended June 30 (except as noted) | | |
| | | 2010 | 2009 | 2008 | 2007(1) | 2006 | 2005 |
| Per-Share Data | | | | | | |
| Net Asset Value, | | | | | | |
| Beginning of Period | $15.32 | $21.84 | $26.91 | $25.64 | $23.37 | $22.08 |
| Income From | | | | | | |
| Investment Operations | | | | | | |
| Net Investment | | | | | | |
| Income (Loss)(2) | 0.21 | 0.27 | 0.25 | 0.11 | 0.22 | 0.22 |
| Net Realized and | | | | | | |
| Unrealized Gain (Loss) | 1.87 | (6.45) | (3.36) | 1.55 | 3.07 | 1.39 |
| Total From | | | | | | |
| Investment Operations | 2.08 | (6.18) | (3.11) | 1.66 | 3.29 | 1.61 |
| Distributions | | | | | | |
| From Net | | | | | | |
| Investment Income | (0.20) | (0.34) | (0.18) | (0.11) | (0.23) | (0.22) |
| From Net | | | | | | |
| Realized Gains | — | — | (1.78) | (0.28) | (0.79) | (0.10) |
| Total Distributions | (0.20) | (0.34) | (1.96) | (0.39) | (1.02) | (0.32) |
| Net Asset Value, | | | | | | |
| End of Period | $17.20 | $15.32 | $21.84 | $26.91 | $25.64 | $23.37 |
| |
| Total Return(3) | 13.47% | (28.37)% | (12.12)% | 6.52% | 14.14% | 7.30% |
| | | | | | | |
| Ratios/Supplemental Data | | | | | | |
| Ratio of Operating | | | | | | |
| Expenses to | | | | | | |
| Average Net Assets | 0.70% | 0.70% | 0.67% | 0.67%(4) | 0.67% | 0.67% |
| Ratio of Net Investment | | | | | | |
| Income (Loss) to | | | | | | |
| Average Net Assets | 1.14% | 1.66% | 1.01% | 0.82%(4) | 0.92% | 0.98% |
| Portfolio Turnover Rate | 64% | 107% | 105% | 52% | 102% | 106% |
| Net Assets, End of Period | | | | | | |
| (in thousands) | $1,371,992 | $1,339,582 | $2,046,107 | $2,675,773 | $2,488,267 | $1,962,596 |
| (1) | January 1, 2007 through June 30, 2007. The fund’s fiscal year end was changed from December 31 to June 30, resulting in a six-month annual |
| | reporting period. For the years before June 30, 2007, the fund’s fiscal year end was December 31. | | |
| (2) | Computed using average shares outstanding throughout the period. | | | | |
| (3) | Total return assumes reinvestment of net investment income and capital gains distributions, if any. Total returns for periods less than one year |
| | are not annualized. Total returns are calculated based on the net asset value of the last business day. The total return of the classes may not |
| | precisely reflect the class expense differences because of the impact of calculating the net asset values to two decimal places. If net asset |
| | values were calculated to three decimal places, the total return differences would more closely reflect the class expense differences. The |
| | calculation of net asset values to two decimal places is made in accordance with SEC guidelines and does not result in any gain or loss of |
| | value between one class and another. | | | | | |
| (4) | Annualized. | | | | | | |
See Notes to Financial Statements.
26
| | | | | | | |
| Equity Growth | | | | | |
| |
| Institutional Class | | | | | | |
| For a Share Outstanding Throughout the Years Ended June 30 (except as noted) | | |
| | | 2010 | 2009 | 2008 | 2007(1) | 2006 | 2005 |
| Per-Share Data | | | | | | |
| Net Asset Value, | | | | | | |
| Beginning of Period | $15.33 | $21.86 | $26.92 | $25.65 | $23.38 | $22.09 |
| Income From | | | | | | |
| Investment Operations | | | | | | |
| Net Investment | | | | | | |
| Income (Loss)(2) | 0.24 | 0.31 | 0.29 | 0.13 | 0.27 | 0.27 |
| Net Realized and | | | | | | |
| Unrealized Gain (Loss) | 1.87 | (6.46) | (3.35) | 1.55 | 3.07 | 1.38 |
| Total From | | | | | | |
| Investment Operations | 2.11 | (6.15) | (3.06) | 1.68 | 3.34 | 1.65 |
| Distributions | | | | | | |
| From Net | | | | | | |
| Investment Income | (0.23) | (0.38) | (0.22) | (0.13) | (0.28) | (0.26) |
| From Net | | | | | | |
| Realized Gains | — | — | (1.78) | (0.28) | (0.79) | (0.10) |
| Total Distributions | (0.23) | (0.38) | (2.00) | (0.41) | (1.07) | (0.36) |
| Net Asset Value, | | | | | | |
| End of Period | $17.21 | $15.33 | $21.86 | $26.92 | $25.65 | $23.38 |
| |
| Total Return(3) | 13.69% | (28.21)% | (11.95)% | 6.61% | 14.36% | 7.51% |
| | | | | | | |
| Ratios/Supplemental Data | | | | | | |
| Ratio of Operating | | | | | | |
| Expenses to | | | | | | |
| Average Net Assets | 0.50% | 0.50% | 0.47% | 0.47%(4) | 0.47% | 0.47% |
| Ratio of Net Investment | | | | | | |
| Income (Loss) to | | | | | | |
| Average Net Assets | 1.34% | 1.86% | 1.21% | 1.02%(4) | 1.12% | 1.18% |
| Portfolio Turnover Rate | 64% | 107% | 105% | 52% | 102% | 106% |
| Net Assets, End of Period | | | | | | |
| (in thousands) | $203,860 | $168,092 | $443,647 | $529,324 | $472,199 | $177,805 |
| (1) | January 1, 2007 through June 30, 2007. The fund’s fiscal year end was changed from December 31 to June 30, resulting in a six-month annual |
| | reporting period. For the years before June 30, 2007, the fund’s fiscal year end was December 31. | | |
| (2) | Computed using average shares outstanding throughout the period. | | | | |
| (3) | Total return assumes reinvestment of net investment income and capital gains distributions, if any. Total returns for periods less than one year |
| | are not annualized. Total returns are calculated based on the net asset value of the last business day. The total return of the classes may not |
| | precisely reflect the class expense differences because of the impact of calculating the net asset values to two decimal places. If net asset |
| | values were calculated to three decimal places, the total return differences would more closely reflect the class expense differences. The |
| | calculation of net asset values to two decimal places is made in accordance with SEC guidelines and does not result in any gain or loss of |
| | value between one class and another. | | | | | |
| (4) | Annualized. | | | | | | |
See Notes to Financial Statements.
27
| | | | | | | |
| Equity Growth | | | | | |
| |
| A Class(1) | | | | | | |
| For a Share Outstanding Throughout the Years Ended June 30 (except as noted) | | |
| | | 2010 | 2009 | 2008 | 2007(2) | 2006 | 2005 |
| Per-Share Data | | | | | | |
| Net Asset Value, | | | | | | |
| Beginning of Period | $15.31 | $21.81 | $26.89 | $25.62 | $23.35 | $22.07 |
| Income From | | | | | | |
| Investment Operations | | | | | | |
| Net Investment | | | | | | |
| Income (Loss)(3) | 0.16 | 0.23 | 0.18 | 0.07 | 0.16 | 0.17 |
| Net Realized and | | | | | | |
| Unrealized Gain (Loss) | 1.87 | (6.44) | (3.34) | 1.56 | 3.07 | 1.37 |
| Total From | | | | | | |
| Investment Operations | 2.03 | (6.21) | (3.16) | 1.63 | 3.23 | 1.54 |
| Distributions | | | | | | |
| From Net | | | | | | |
| Investment Income | (0.15) | (0.29) | (0.14) | (0.08) | (0.17) | (0.16) |
| From Net | | | | | | |
| Realized Gains | — | — | (1.78) | (0.28) | (0.79) | (0.10) |
| Total Distributions | (0.15) | (0.29) | (1.92) | (0.36) | (0.96) | (0.26) |
| Net Asset Value, | | | | | | |
| End of Period | $17.19 | $15.31 | $21.81 | $26.89 | $25.62 | $23.35 |
| |
| Total Return(4) | 13.20% | (28.54)% | (12.33)% | 6.40% | 13.86% | 6.99% |
| | | | | | | |
| Ratios/Supplemental Data | | | | | | |
| Ratio of Operating | | | | | | |
| Expenses to | | | | | | |
| Average Net Assets | 0.95% | 0.95% | 0.92% | 0.92%(5) | 0.92% | 0.92% |
| Ratio of Net Investment | | | | | | |
| Income (Loss) to | | | | | | |
| Average Net Assets | 0.89% | 1.41% | 0.76% | 0.57%(5) | 0.67% | 0.73% |
| Portfolio Turnover Rate | 64% | 107% | 105% | 52% | 102% | 106% |
| Net Assets, End of Period | | | | | | |
| (in thousands) | $237,076 | $226,830 | $336,939 | $479,540 | $417,950 | $265,812 |
| (1) | Prior to September 4, 2007, the A Class was referred to as the Advisor Class. | | | |
| (2) | January 1, 2007 through June 30, 2007. The fund’s fiscal year end was changed from December 31 to June 30, resulting in a six-month annual |
| | reporting period. For the years before June 30, 2007, the fund’s fiscal year end was December 31. | | |
| (3) | Computed using average shares outstanding throughout the period. | | | | |
| (4) | Total return assumes reinvestment of net investment income and capital gains distributions, if any, and does not reflect applicable sales charges. |
| | Total returns for periods less than one year are not annualized. Total returns are calculated based on the net asset value of the last business day. |
| | The total return of the classes may not precisely reflect the class expense differences because of the impact of calculating the net asset values |
| | to two decimal places. If net asset values were calculated to three decimal places, the total return differences would more closely reflect the |
| | class expense differences. The calculation of net asset values to two decimal places is made in accordance with SEC guidelines and does not |
| | result in any gain or loss of value between one class and another. | | | | |
| (5) | Annualized. | | | | | | |
See Notes to Financial Statements.
28
| | | | |
| Equity Growth | | | |
| |
| B Class | | | |
| For a Share Outstanding Throughout the Years Ended June 30 (except as noted) | | |
| | | 2010 | 2009 | 2008(1) |
| Per-Share Data | | | |
| Net Asset Value, Beginning of Period | $15.32 | $21.78 | $27.09 |
| Income From Investment Operations | | | |
| Net Investment Income (Loss)(2) | 0.03 | 0.11 | —(3) |
| Net Realized and Unrealized Gain (Loss) | 1.87 | (6.44) | (3.52) |
| Total From Investment Operations | 1.90 | (6.33) | (3.52) |
| Distributions | | | |
| From Net Investment Income | (0.02) | (0.13) | (0.01) |
| From Net Realized Gains | — | — | (1.78) |
| Total Distributions | (0.02) | (0.13) | (1.79) |
| Net Asset Value, End of Period | $17.20 | $15.32 | $21.78 |
| |
| Total Return(4) | 12.38% | (29.05)% | (13.55)% |
| | | | |
| Ratios/Supplemental Data | | | |
| Ratio of Operating Expenses to Average Net Assets | 1.70% | 1.70% | 1.67%(5) |
| Ratio of Net Investment Income (Loss) to Average Net Assets | 0.14% | 0.66% | 0.02%(5) |
| Portfolio Turnover Rate | 64% | 107% | 105%(6) |
| Net Assets, End of Period (in thousands) | $73 | $64 | $46 |
| (1) | September 28, 2007 (commencement of sale) through June 30, 2008. | | | |
| (2) | Computed using average shares outstanding throughout the period. | | | |
| (3) | Per-share amount was less than $0.005. | | | |
| (4) | Total return assumes reinvestment of net investment income and capital gains distributions, if any, and does not reflect applicable sales charges. |
| | Total returns for periods less than one year are not annualized. Total returns are calculated based on the net asset value of the last business day. |
| | The total return of the classes may not precisely reflect the class expense differences because of the impact of calculating the net asset values |
| | to two decimal places. If net asset values were calculated to three decimal places, the total return differences would more closely reflect the |
| | class expense differences. The calculation of net asset values to two decimal places is made in accordance with SEC guidelines and does not |
| | result in any gain or loss of value between one class and another. | | | |
| (5) | Annualized. | | | |
| (6) | Portfolio turnover is calculated at the fund level. Percentage indicated was calculated for the year ended June 30, 2008. | |
See Notes to Financial Statements.
29
| | | | | | | |
| Equity Growth | | | | | |
| |
| C Class | | | | | | |
| For a Share Outstanding Throughout the Years Ended June 30 (except as noted) | | |
| | | 2010 | 2009 | 2008 | 2007(1) | 2006 | 2005 |
| Per-Share Data | | | | | | |
| Net Asset Value, | | | | | | |
| Beginning of Period | $15.22 | $21.64 | $26.76 | $25.51 | $23.28 | $22.03 |
| Income From | | | | | | |
| Investment Operations | | | | | | |
| Net Investment | | | | | | |
| Income (Loss)(2) | 0.03 | 0.11 | —(3) | (0.02) | (0.02) | —(3) |
| Net Realized and | | | | | | |
| Unrealized Gain (Loss) | 1.85 | (6.40) | (3.33) | 1.55 | 3.04 | 1.37 |
| Total From | | | | | | |
| Investment Operations | 1.88 | (6.29) | (3.33) | 1.53 | 3.02 | 1.37 |
| Distributions | | | | | | |
| From Net | | | | | | |
| Investment Income | (0.02) | (0.13) | (0.01) | — | —(3) | (0.02) |
| From Net | | | | | | |
| Realized Gains | — | — | (1.78) | (0.28) | (0.79) | (0.10) |
| Total Distributions | (0.02) | (0.13) | (1.79) | (0.28) | (0.79) | (0.12) |
| Net Asset Value, | | | | | | |
| End of Period | $17.08 | $15.22 | $21.64 | $26.76 | $25.51 | $23.28 |
| |
| Total Return(4) | 12.33% | (29.06)% | (13.01)% | 5.99% | 13.02% | 6.23% |
| | | | | | | |
| Ratios/Supplemental Data | | | | | | |
| Ratio of Operating | | | | | | |
| Expenses to | | | | | | |
| Average Net Assets | 1.70% | 1.70% | 1.67% | 1.67%(5) | 1.67% | 1.67% |
| Ratio of Net Investment | | | | | | |
| Income (Loss) to | | | | | | |
| Average Net Assets | 0.14% | 0.66% | 0.01% | (0.18)%(5) | (0.08)% | (0.02)% |
| Portfolio Turnover Rate | 64% | 107% | 105% | 52% | 102% | 106% |
| Net Assets, End of Period | | | | | | |
| (in thousands) | $5,536 | $5,108 | $7,634 | $12,852 | $10,276 | $4,536 |
| (1) | January 1, 2007 through June 30, 2007. The fund’s fiscal year end was changed from December 31 to June 30, resulting in a six-month annual |
| | reporting period. For the years before June 30, 2007, the fund’s fiscal year end was December 31. | | |
| (2) | Computed using average shares outstanding throughout the period. | | | | |
| (3) | Per-share amount was less than $0.005. | | | | | |
| (4) | Total return assumes reinvestment of net investment income and capital gains distributions, if any, and does not reflect applicable sales charges. |
| | Total returns for periods less than one year are not annualized. Total returns are calculated based on the net asset value of the last business day. |
| | The total return of the classes may not precisely reflect the class expense differences because of the impact of calculating the net asset values |
| | to two decimal places. If net asset values were calculated to three decimal places, the total return differences would more closely reflect the |
| | class expense differences. The calculation of net asset values to two decimal places is made in accordance with SEC guidelines and does not |
| | result in any gain or loss of value between one class and another. | | | | |
| (5) | Annualized. | | | | | | |
See Notes to Financial Statements.
30
| | | | | | | |
| Equity Growth | | | | | |
| |
| R Class | | | | | | |
| For a Share Outstanding Throughout the Years Ended June 30 (except as noted) | | |
| | | 2010 | 2009 | 2008 | 2007(1) | 2006 | 2005(2) |
| Per-Share Data | | | | �� | | |
| Net Asset Value, | | | | | | |
| Beginning of Period | $15.32 | $21.81 | $26.91 | $25.64 | $23.37 | $23.27 |
| Income From | | | | | | |
| Investment Operations | | | | | | |
| Net Investment | | | | | | |
| Income (Loss)(3) | 0.12 | 0.18 | 0.13 | 0.04 | 0.14 | 0.08 |
| Net Realized and | | | | | | |
| Unrealized Gain (Loss) | 1.87 | (6.43) | (3.36) | 1.56 | 3.03 | 0.19 |
| Total From | | | | | | |
| Investment Operations | 1.99 | (6.25) | (3.23) | 1.60 | 3.17 | 0.27 |
| Distributions | | | | | | |
| From Net | | | | | | |
| Investment Income | (0.11) | (0.24) | (0.09) | (0.05) | (0.11) | (0.07) |
| From Net | | | | | | |
| Realized Gains | — | — | (1.78) | (0.28) | (0.79) | (0.10) |
| Total Distributions | (0.11) | (0.24) | (1.87) | (0.33) | (0.90) | (0.17) |
| Net Asset Value, | | | | | | |
| End of Period | $17.20 | $15.32 | $21.81 | $26.91 | $25.64 | $23.37 |
| |
| Total Return(4) | 12.91% | (28.71)% | (12.56)% | 6.27% | 13.57% | 1.15% |
| | | | | | | |
| Ratios/Supplemental Data | | | | | | |
| Ratio of Operating | | | | | | |
| Expenses to | | | | | | |
| Average Net Assets | 1.20% | 1.20% | 1.17% | 1.17%(5) | 1.17% | 1.17%(5) |
| Ratio of Net Investment | | | | | | |
| Income (Loss) to | | | | | | |
| Average Net Assets | 0.64% | 1.16% | 0.51% | 0.32%(5) | 0.42% | 0.78%(5) |
| Portfolio Turnover Rate | 64% | 107% | 105% | 52% | 102% | 106%(6) |
| Net Assets, End of Period | | | | | | |
| (in thousands) | $3,770 | $1,764 | $752 | $962 | $741 | $25 |
| (1) | January 1, 2007 through June 30, 2007. The fund’s fiscal year end was changed from December 31 to June 30, resulting in a six-month annual |
| | reporting period. For the years before June 30, 2007, the fund’s fiscal year end was December 31. | | |
| (2) | July 29, 2005 (commencement of sale) through December 31, 2005. | | | | |
| (3) | Computed using average shares outstanding throughout the period. | | | | |
| (4) | Total return assumes reinvestment of net investment income and capital gains distributions, if any. Total returns for periods less than one year |
| | are not annualized. Total returns are calculated based on the net asset value of the last business day. The total return of the classes may not |
| | precisely reflect the class expense differences because of the impact of calculating the net asset values to two decimal places. If net asset |
| | values were calculated to three decimal places, the total return differences would more closely reflect the class expense differences. The |
| | calculation of net asset values to two decimal places is made in accordance with SEC guidelines and does not result in any gain or loss of value |
| | between one class and another. | | | | | |
| (5) | Annualized. | | | | | | |
| (6) | Portfolio turnover is calculated at the fund level. Percentage indicated was calculated for the year ended December 31, 2005. | |
See Notes to Financial Statements.
31
|
| Report of Independent Registered Public Accounting Firm |
To the Directors of the American Century Quantitative Equity Funds, Inc.
and Shareholders of the Equity Growth Fund:
In our opinion, the accompanying statement of assets and liabilities, including the schedule of investments, and the related statements of operations and of changes in net assets and the financial highlights present fairly, in all material respects, the financial position of the Equity Growth Fund (one of the eleven funds comprising the American Century Quantitative Equity Funds, Inc., hereafter referred to as the “Fund”) at June 30, 2010, the results of its operations for the year then ended, the changes in its net assets for each of the two years in the period then ended and the financial highlights for each of the periods presented, in conformity with accounting principles generally accepted in the United States of America. These financial statements and financial highlights (hereafter referred to as “financial statements”) are the responsibility of the Fund’s management; our responsibi lity is to express an opinion on these financial statements based on our audits. We conducted our audits of these financial statements in accordance with the standards of the Public Company Accounting Oversight Board (United States). Those standards require that we plan and perform the audit to obtain reasonable assurance about whether the financial statements are free of material misstatement. An audit includes examining, on a test basis, evidence supporting the amounts and disclosures in the financial statements, assessing the accounting principles used and significant estimates made by management, and evaluating the overall financial statement presentation. We believe that our audits, which included confirmation of securities at June 30, 2010 by correspondence with the custodian and brokers, provide a reasonable basis for our opinion.
PricewaterhouseCoopers LLP
Kansas City, Missouri
August 19, 2010
32
A special meeting of shareholders was held on June 16, 2010, to vote on the following proposals. Each proposal received the required number of votes and was adopted. A summary of voting results is listed below each proposal.
Proposal 1:
To elect one Director to the Board of Directors of American Century Quantitative Equity Funds, Inc. (the proposal was voted on by all shareholders of funds issued by American Century Quantitative Equity Funds, Inc.):
| | |
| Frederick L.A. Grauer | For: | 4,067,909,978 |
| | Withhold: | 174,470,448 |
| | Abstain: | 0 |
| | Broker Non-Vote: | 0 |
The other directors whose term of office continued after the meeting include Jonathan S. Thomas, John Freidenrich, Ronald J. Gilson, Peter F. Pervere, Myron S. Scholes, and John B. Shoven.
Proposal 2:
To approve a management agreement between the fund and American Century Investment Management, Inc.:
| | |
| Investor, A, B, C and R Classes | For: | 1,112,772,990 |
| | Against: | 14,029,936 |
| | Abstain: | 42,420,385 |
| | Broker Non-Vote: | 168,266,279 |
| |
| Institutional Class | For: | 110,360,918 |
| | Against: | 748,877 |
| | Abstain: | 261,762 |
| | Broker Non-Vote: | 281,262 |
33
The Board of Directors
The individuals listed below serve as directors of the fund. Each director will continue to serve in this capacity until death, retirement, resignation or removal from office. The mandatory retirement age for directors who are not “interested persons,” as that term is defined in the Investment Company Act (independent directors), is 73. However, the mandatory retirement age may be extended for a period not to exceed two years with the approval of the remaining independent directors.
Mr. Thomas is the only director who is an “interested person” because he currently serves as President and Chief Executive Officer of American Century Companies, Inc. (ACC), the parent company of American Century Investment Management, Inc. (ACIM or the advisor).
The other directors (more than three-fourths of the total number) are independent; that is, they have never been employees, directors or officers of, and have no financial interest in, ACC or any of its wholly owned, direct or indirect, subsidiaries, including ACIM, American Century Investment Services, Inc. (ACIS) and American Century Services, LLC (ACS). The directors serve in this capacity for eight (in the case of Mr. Thomas, 15) registered investment companies in the American Century Investments family of funds.
The following presents additional information about the directors. The mailing address for each director other than Mr. Thomas is 1665 Charleston Road, Mountain View, California 94043. The mailing address for Mr. Thomas is 4500 Main Street, Kansas City, Missouri 64111.
Independent Directors
John Freidenrich
Year of Birth: 1937
Position(s) with the Fund: Director
Length of Time Served: Since 2005
Principal Occupation(s) During the Past Five Years: Founder, Member and Manager, Regis
Management Company, LLC (investment management firm) (April 2004 to present)
Number of Funds in Fund Complex Overseen by Director: 41
Other Directorships Held by Director During the Past Five Years: None
Education/Other Professional Experience: AB in Economics, Stanford University; LLB,
Stanford Law School; formerly, Partner and Founder, Ware and Freidenrich Law
Firm and Bay Partners; formerly, President, Board of Trustees, Stanford University
Ronald J. Gilson
Year of Birth: 1946
Position(s) with the Fund: Director and Chairman of the Board
Length of Time Served: Since 1995
Principal Occupation(s) During the Past Five Years: Charles J. Meyers Professor of Law and
Business, Stanford Law School (1979 to present); Marc and Eva Stern Professor of
Law and Business, Columbia University School of Law (1992 to present)
Number of Funds in Fund Complex Overseen by Director: 41
Other Directorships Held by Director During the Past Five Years: None
Education/Other Professional Experience: BA, Washington University; JD, Yale Law School;
formerly, Attorney, Steinhart, Goldberg, Feigenbaum & Ladar
34
Frederick L. A. Grauer
Year of Birth: 1946
Position(s) with the Fund: Director
Length of Time Served: Since 2008
Principal Occupation(s) During the Past Five Years: Senior Advisor, BlackRock, Inc. (investment
management firm) (2010 to present); Senior Advisor, Barclays Global Investors
(investment management firm) (2003 to 2009)
Number of Funds in Fund Complex Overseen by Director: 41
Other Directorships Held by Director During the Past Five Years: None
Education/Other Professional Experience: BA in Economics, University of British Columbia;
MA in Economics, University of Chicago; PhD in Business, Stanford University;
formerly, Executive Chairman, Barclays Global Investors; Chairman and Chief
Executive Officer, Wells Fargo Nikko Investment Advisors; and Vice President,
Merrill Lynch Capital Markets Group; formerly, Director, New York Stock Exchange,
Chicago Mercantile Exchange and Columbia University; formerly, Faculty Member,
Graduate School of Business, Columbia University and Alfred P. Sloan School of
Management, Massachusetts Institute of Technology
Peter F. Pervere
Year of Birth: 1947
Position(s) with the Fund: Director
Length of Time Served: Since 2007
Principal Occupation(s) During the Past Five Years: Retired
Number of Funds in Fund Complex Overseen by Director: 41
Other Directorships Held by Director During the Past Five Years: Intraware, Inc. (2003 to 2009);
Digital Impact, Inc. (2003 to 2005)
Education/Other Professional Experience: BA in History, Stanford University; CPA; formerly,
Vice President and Chief Financial Officer, Commerce One, Inc. (software and
services provider); formerly, Vice President and Corporate Controller, Sybase, Inc.;
formerly with accounting firm of Arthur Young & Co.
Myron S. Scholes
Year of Birth: 1941
Position(s) with the Fund: Director
Length of Time Served: Since 1980
Principal Occupation(s) During the Past Five Years: Chairman, Platinum Grove Asset
Management, L.P. (asset manager) (1999 to 2009); Frank E. Buck Professor of
Finance-Emeritus, Stanford Graduate School of Business (1996 to present)
Number of Funds in Fund Complex Overseen by Director: 41
Other Directorships Held by Director During the Past Five Years: Dimensional Fund Advisors
(investment advisor); CME Group, Inc. (futures and options exchange)
Education/Other Professional Experience: BA in Economics, McMaster University (Ontario);
MBA and PhD, University of Chicago; formerly, Senior Research Fellow at the
Hoover Institute; formerly, Edward Eagle Brown Professor of Finance, University of
Chicago; recipient of the Alfred Nobel Memorial Prize in Economic Sciences
35
John B. Shoven
Year of Birth: 1947
Position(s) with the Fund: Director
Length of Time Served: Since 2002
Principal Occupation(s) During the Past Five Years: Professor of Economics, Stanford University
(1973 to present)
Number of Funds in Fund Complex Overseen by Director: 41
Other Directorships Held by Director During the Past Five Years: Cadence Design Systems;
Exponent; Financial Engines; PalmSource, Inc. (2002 to 2005); Watson Wyatt
Worldwide (2002 to 2006)
Education/Other Professional Experience: BA in Physics, University of California; PhD in
Economics, Yale University; Director of the Stanford Institute for Economic Policy
Research (1999 to present); formerly, Chair of Economics and Dean of Humanities
and Sciences, Stanford University
Interested Director
Jonathan S. Thomas
Year of Birth: 1963
Position(s) with the Fund: Director and President
Length of Time Served: Since 2007
Principal Occupation(s) During the Past Five Years: President and Chief Executive Officer,
ACC (March 2007 to present); Chief Administrative Officer, ACC (February 2006 to
February 2007); Executive Vice President, ACC (November 2005 to February 2007);
Global Chief Operating Officer and Managing Director, Morgan Stanley (investment
management) (March 2000 to November 2005). Also serves as: Chief Executive
Officer and Manager, ACS; Executive Vice President, ACIM; Director, ACC, ACIM
and other ACC subsidiaries
Number of Funds in Fund Complex Overseen by Director: 104
Other Directorships Held by Director During the Past Five Years: None
Education/Other Professional Experience: BA in Economics, University of Massachusetts;
MBA, Boston College; formerly held senior leadership roles with Fidelity
Investments, Boston Financial Services and Bank of America; serves on the Board of
Governors of the Investment Company Institute
36
Officers
The following table presents certain information about the executive officers of the fund. Each officer serves as an officer for each of the 15 investment companies in the American Century family of funds, unless otherwise noted. No officer is compensated for his or her service as an officer of the fund. The listed officers are interested persons of the fund and are appointed or re-appointed on an annual basis. The mailing address for each of the officers listed below is 4500 Main Street, Kansas City, Missouri 64111.
| | |
| Name | Offices with | |
| (Year of Birth) | the Fund | Principal Occupation(s) During the Past Five Years |
| Jonathan S. | Director and | President and Chief Executive Officer, ACC (March 2007 to present); Chief |
| Thomas | President | Administrative Officer, ACC (February 2006 to February 2007); Executive Vice |
| (1963) | since 2007 | President, ACC (November 2005 to February 2007); Global Chief Operating |
| | | Officer and Managing Director, Morgan Stanley (March 2000 to November |
| | | 2005). Also serves as: Chief Executive Officer and Manager, ACS; Executive |
| | | Vice President, ACIM; Director, ACC, ACIM and other ACC subsidiaries |
| Barry Fink | Executive Vice | Chief Operating Officer and Executive Vice President, ACC (September 2007 |
| (1955) | President | to present); President, ACS (October 2007 to present); Managing Director, |
| | since 2007 | Morgan Stanley (2000 to 2007); Global General Counsel, Morgan Stanley |
| | | (2000 to 2006). Also serves as: Manager, ACS, and Director, ACC and |
| | | certain ACC subsidiaries |
| Maryanne L. | Chief Compliance | Chief Compliance Officer, American Century funds, ACIM and ACS (August |
| Roepke | Officer since 2006 | 2006 to present); Assistant Treasurer, ACC (January 1995 to August 2006); |
| (1956) | and Senior Vice | and Treasurer and Chief Financial Officer, various American Century funds |
| | President | (July 2000 to August 2006). Also serves as: Senior Vice President, ACS |
| | since 2000 | |
| Charles A. | General Counsel | Attorney, ACC (February 1994 to present); Vice President, ACC (November |
| Etherington | since 2007 and | 2005 to present); General Counsel, ACC (March 2007 to present); Also |
| (1957) | Senior Vice | serves as General Counsel, ACIM, ACS, ACIS and other ACC subsidiaries; |
| | President | and Senior Vice President, ACIM and ACS |
| | since 2006 | |
| Robert J. Leach | Vice President, | Vice President, ACS (February 2000 to present); and Controller, various |
| (1966) | Treasurer and | American Century funds (1997 to September 2006) |
| | Chief Financial | |
| | Officer since 2006 | |
| David H. Reinmiller | Vice President | Attorney, ACC (January 1994 to present); Associate General Counsel, ACC |
| (1963) | since 2001 | (January 2001 to present); Chief Compliance Officer, American Century |
| | | funds and ACIM (January 2001 to February 2005). Also serves as: Vice |
| | | President, ACIM and ACS |
| Ward D. Stauffer | Secretary | Attorney, ACC (June 2003 to Present) |
| (1960) | since 2005 | |
The SAI has additional information about the fund’s directors and is available without charge, upon request, by calling 1-800-345-2021.
37
|
| Board Approval of Management Agreements |
American Century Investment Management, Inc. (“ACIM” or the “Advisor”) currently serves as investment advisor to the Fund under a management agreement (the “Current Management Agreement”) that took effect on July 16, 2010, following approval by the Fund’s Board of Directors (the “Board”) and shareholders. The Advisor previously served as investment advisor to the Fund pursuant to a prior management agreement (the “Prior Management Agreement”) and an interim management agreement (the “Interim Management Agreeement”). The Interim Management Agreement terminated in accordance with its terms on July 16, 2010, upon the effectiveness of the Current Management Agreement. The Prior Management Agreement terminated on February 16, 2010, as a result of a change of control of the Advisor’s parent company, American Century Companies, Inc. (“ACC”). The change in control occurred as the result of a change in the trustee of a trust created by James E. Stowers, Jr., the founder of American Century Investments that holds shares representing a significant interest in ACC stock. Mr. Stowers previously served as the trustee of the trust. On February 16, 2010, Richard W. Brown, Co-Chairman of ACC with Mr. Stowers, became the trustee in accordance with the terms of the trust and Mr. Stowers’ long-standing estate and succession plan.
On February 18, 2010, the Board approved the Interim Management Agreement in accordance with Rule 15a-4 under the Investment Company Act to ensure continued management of the Fund by the Advisor after the termination of the Prior Management Agreement and until shareholder approval of the Current Management Agreement as required under the Act. The Board approved the Current Management Agreement and recommended its approval to shareholders. Fund shareholders approved the Current Management Agreement at a meeting held on June 16, 2010.
The Interim Management Agreement and the Current Management Agreement are substantially identical to the Prior Management Agreement except for their effective dates and the termination provisions of the Interim Management Agreement. Under the Interim and Current Management Agreements, the Advisor will provide the same services to the Fund and receive the same compensation rate as under the Prior Management Agreement.
Basis for Board Approval of Interim Management Agreement
In considering the approval of the Interim Management Agreement, Rule 15a-4 requires the Board to approve the contract within ten business days of the termination of the prior agreement and to determine that the compensation to be received under the interim agreement is no greater than would have been received under the prior agreement. In connection with the approval, the Board noted that it oversees on a continuous basis and evaluates at its quarterly meetings, directly and through the committees of the Board, the nature and quality of significant services provided by the Advisor, the investment performance of the Fund, shareholder services, audit and compliance functions and a variety of other matters relating to the Fund’s operations.
38
In evaluating the Interim Management Agreement, the Board, assisted by the advice of its independent legal counsel, considered a number of factors in addition to those required by the rule with no one factor being determinative to its analysis. Among the factors considered by the Board were the circumstances and effect of the change of control, the fact that the Advisor will provide the same services and receive the same compensation rate as under the Prior Management Agreement, and that the change of control did not result in a change of the personnel managing the Fund. Upon completion of its analysis, the Board approved the Interim Management Agreement, determining that the continued management of the Fund by the Advisor was in the best interests of the Fund and Fund shareholders.
Basis for Board Approval of Current Management Agreement
At a meeting held on April 1, 2010, after considering all information presented, the Board approved, and determined to recommend that shareholders approve, the Current Management Agreement. In connection with that approval, the Board requested and reviewed extensive data and information compiled by the Advisor and certain independent providers of evaluation data concerning the Fund and services provided to the Fund by the Advisor. The Board oversees on a continuous basis and evaluates at its quarterly meetings, directly and through the committees of the Board, the nature and quality of significant services provided by the Advisor, the investment performance of the Fund, shareholder services, audit and compliance functions and a variety of other matters relating to the Fund’s operations. The information considered and the discussions held at the meetings included, but were not limited to:
• the nature, extent and quality of investment management, shareholder services and other services provided to the Fund;
• the wide range of programs and services the Advisor provides to the Fund and its shareholders on a routine and non-routine basis;
• the compliance policies, procedures, and regulatory experience of the Advisor;
• data comparing the cost of owning the Fund to the cost of owning similar funds;
• the fact that there will be no changes to the fees, services, or personnel who provide such services as compared to the Prior Management Agreement;
• data comparing the Fund’s performance to appropriate benchmarks and/or a peer group of other mutual funds with similar investment objectives and strategies;
• financial data showing the profitability of the Fund to the Advisor and the overall profitability of the Advisor;
• data comparing services provided and charges to the Fund with those for other non-fund investment management clients of the Advisor; and
39
• consideration of collateral or “fall-out” benefits derived by the Advisor from the management of the Fund and potential sharing of economies of scale in connection with the management of the Fund.
The Board also considered whether there was any reason for not continuing the existing arrangement with the Advisor. In particular, the Board recognized that shareholders may have invested in the Fund on the strength of the Advisor’s industry standing and reputation and in the expectation that the Advisor will have a continuing role in providing advisory services to the Fund.
The Board considered all of the information provided by the Advisor, the independent data providers, and the Board’s independent legal counsel, and evaluated such information for the Fund. The Board did not identify any single factor as being all-important or controlling, and each Board member may have attributed different levels of importance to different factors. In deciding to approve the Current Management Agreement under the terms ultimately determined by the Board to be appropriate, the Board based its decision on a number of factors, including the following:
Nature, Extent and Quality of Services — Generally. Under the Current Management Agreement, the Advisor is responsible for providing or arranging for all services necessary for the operation of the Fund. The Board noted that under the Current Management Agreement, the Advisor provides or arranges at its own expense a wide variety of services including:
• constructing and designing the Fund
• portfolio research and security selection
• initial capitalization/funding
• securities trading
• Fund administration
• custody of Fund assets
• daily valuation of the Fund’s portfolio
• shareholder servicing and transfer agency, including shareholder
confirmations, recordkeeping and communications
• legal services
• regulatory and portfolio compliance
• financial reporting
• marketing and distribution
40
The Board noted that many of these services have expanded over time both in terms of quantity and complexity in response to shareholder demands, competition in the industry, changing distribution channels and the changing regulatory environment.
Investment Management Services. The investment management services provided to the Fund are complex and provide Fund shareholders access to professional money management, instant diversification of their investments within an asset class, the opportunity to easily diversify among asset classes, and liquidity. As a part of its general oversight and in evaluating investment performance, the Board expects the Advisor to manage the Fund in accordance with its investment objectives and approved strategies. In providing these services, the Advisor utilizes teams of investment professionals who require extensive information technology, research, training, compliance and other systems to conduct their business. The Board, directly and through its Portfolio Committee, regularly reviews investment performance information for the Fund, t ogether with comparative information for appropriate benchmarks and/or peer groups of similarly-managed funds, over different time horizons. If performance concerns are identified, the underperforming Fund receives special reviews until performance improves, during which time the Board discusses with the Advisor the reasons for such underperformance and any efforts being undertaken to improve performance.
Shareholder and Other Services. Under the Current Management Agreement, the Advisor will also provide the Fund with a comprehensive package of transfer agency, shareholder, and other services. The Board, directly and through the various committees of the Board, regularly reviews reports and evaluations of such services. These reports include, but are not limited to, information regarding the operational efficiency and accuracy of the shareholder and transfer agency services provided, staffing levels, shareholder satisfaction (as measured by external as well as internal sources), technology support, new products and services offered to Fund shareholders, securities trading activities, portfolio valuation services, auditing services, and legal and operational compliance activities. Certain aspects of shareholder and transfer age ncy service level efficiency and the quality of securities trading activities are measured by independent third party providers and are presented in comparison to other fund groups not managed by the Advisor.
Costs of Services Provided and Profitability. The Advisor provided detailed information concerning its cost of providing various services to the Fund, its profitability in managing the Fund, its overall profitability, and its financial condition. The Board reviewed with the Advisor the methodology used to prepare this financial information. The Board has also reviewed with the Advisor its methodology for compensating the investment professionals that provide services to the Fund as well as compensation to the five highest paid personnel of the Advisor. This financial information regarding the Advisor is considered in order to evaluate the Advisor’s financial condition, its ability to continue to provide services under the Current Management Agreement, and the reasonableness of the current management fees.
41
Ethics. The Board generally considers the Advisor’s commitment to providing quality services to shareholders and to conducting its business ethically. It noted that the Advisor’s practices generally meet or exceed industry best practices.
Economies of Scale. The Board also reviewed information provided by the Advisor regarding the possible existence of economies of scale in connection with the management of the Fund. The Board concluded that economies of scale are difficult to measure and predict with precision, especially on a fund-by-fund basis. The analysis of economies of scale is further complicated by the additional services and content provided by the Advisor and its reinvestment in its ability to provide and expand those services. Accordingly, the Board seeks to evaluate economies of scale by reviewing information, such as year-over-year profitability of the Advisor generally, the profitability of its management of the Fund specifically, and the expenses incurred by the Advisor in providing various functions to the Fund. The Board believes the Advisor i s appropriately sharing economies of scale through its competitive fee structure, offering competitive fees from fund inception, fee breakpoints as the fund complex and the Fund increases in size, and through reinvestment in its business to provide shareholders additional services and enhancements to existing services. In particular, separate breakpoint schedules based on the size of the entire fund complex and on the size of the Fund reflect the complexity of assessing economies of scale.
Comparison to Fees of Funds not Managed by the Advisor. Both the Prior and Current Management Agreements provide that the Fund pays the Advisor a single, all-inclusive (or unified) management fee for providing all services necessary for the management and operation of the Fund, other than brokerage expenses, taxes, interest, extraordinary expenses, and the fees and expenses of the Fund’s Independent Directors (including their independent legal counsel) and expenses incurred in connection with the provision of shareholder services and distribution services under a plan adopted pursuant to Rule 12b-1 under the 1940 Act. Under the unified fee structure, the Advisor is responsible for providing all investment advisory, custody, audit, administrative, compliance, recordkeeping, marketing and shareholder services, or arranging and supervising third parties that provide such services. By contrast, most other funds are charged a variety of fees, including an investment advisory fee, a transfer agency fee, an administrative fee, distribution charges and other expenses. Other than their investment advisory fees and any applicable Rule 12b-1 distribution fees, the components of the total fees charged by these other funds may be increased without shareholder approval. The Board believes the unified fee structure is a benefit to Fund shareholders because it clearly discloses to shareholders the cost of owning Fund shares, and, since the unified fee cannot be increased without a vote of Fund shareholders, it shifts to the Advisor the risk of increased costs of operating the Fund and provides a direct incentive to minimize administrative inefficiencies. Part of the Board’s analysis of fee levels involves reviewing certain evaluative data compiled by an independent provider comparing the Fund’s unified fee to
42
the total expense ratios of similar funds not managed by the Advisor. The Board concluded that the management fee to be paid by the Fund to the Advisor under the Current Management Agreement is reasonable in light of the services to be provided to the Fund.
Comparison to Fees and Services Provided to Other Clients of the Advisor. The Board also requested and received information from the Advisor concerning the nature and extent of the services, fees, and profitability of its advisory services to advisory clients other than the Fund. They observed that these varying types of client accounts require different services and involve different regulatory and entrepreneurial risks than the management of the Fund. The Board analyzed this information and concluded that the fees charged and services provided to the Fund were reasonable by comparison.
Collateral or “Fall-Out” Benefits Derived by the Advisor. The Board considered the existence of collateral benefits the Advisor may receive as a result of its relationship with the Fund. The Board concluded that the Advisor’s primary business is managing mutual funds and it generally does not use Fund or shareholder information to generate profits in other lines of business, and therefore does not derive any significant collateral benefits from them. The Board noted that the Advisor receives proprietary research from broker-dealers that execute Fund portfolio transactions and concluded that this research is likely to benefit Fund shareholders. The Board also determined that the Advisor is able to provide investment management services to certain clients other than the Fund, at least in part, due to its existing infrastructure built to serve the fund complex. The Board concluded, however, that the assets of those other clients are not material to the analysis and, in any event, are included with the assets of the Fund to determine breakpoints in the Fund’s fee schedule, provided they are managed using the same investment team and strategy.
Conclusion of the Board. As a result of this process, the Board, in the absence of particular circumstances and assisted by the advice of its independent legal counsel, taking into account all of the factors discussed above and the information provided by the Advisor and others, concluded that the Current Management Agreement be approved and recommended its approval to Fund shareholders.
43
Retirement Account Information
As required by law, distributions you receive from certain IRAs, or 403(b), 457 and qualified plans are subject to federal income tax withholding, unless you elect not to have withholding apply. Tax will be withheld on the total amount withdrawn even though you may be receiving amounts that are not subject to withholding, such as nondeductible contributions. In such case, excess amounts of withholding could occur. You may adjust your withholding election so that a greater or lesser amount will be withheld.
If you don’t want us to withhold on this amount, you must notify us to not withhold the federal income tax. You may notify us in writing or in certain situations by telephone or through other electronic means. You have the right to revoke your withholding election at any time and any election you make may remain in effect until revoked by filing a new election.
Remember, even if you elect not to have income tax withheld, you are liable for paying income tax on the taxable portion of your withdrawal. If you elect not to have income tax withheld or you don’t have enough income tax withheld, you may be responsible for payment of estimated tax. You may incur penalties under the estimated tax rules if your withholding and estimated tax payments are not sufficient. You can reduce or defer the income tax on a distribution by directly or indirectly rolling such distribution over to another IRA or eligible plan. You should consult your tax advisor for additional information.
State tax will be withheld if, at the time of your distribution, your address is within one of the mandatory withholding states and you have federal income tax withheld. State taxes will be withheld from your distribution in accordance with the respective state rules.
Proxy Voting Guidelines
American Century Investment Management, Inc., the fund’s investment advisor, is responsible for exercising the voting rights associated with the securities purchased and/or held by the fund. A description of the policies and procedures the advisor uses in fulfilling this responsibility is available without charge, upon request, by calling 1-800-345-2021. It is also available on American Century Investments’ website at americancentury.com and on the Securities and Exchange Commission’s website at sec.gov. Information regarding how the investment advisor voted proxies relating to portfolio securities during the most recent 12-month period ended June 30 is available on the “About Us” page at americancentury.com. It is also available at sec.gov.
Quarterly Portfolio Disclosure
The fund files its complete schedule of portfolio holdings with the Securities and Exchange Commission (SEC) for the first and third quarters of each fiscal year on Form N-Q. The fund’s Forms N-Q are available on the SEC’s website at sec.gov, and may be reviewed and copied at the SEC’s Public Reference Room in Washington, DC. Information on the operation of the Public Reference Room may be obtained by calling 1-800-SEC-0330. The fund also makes its complete schedule of portfolio holdings for the most recent quarter of its fiscal year available on its website at americancentury.com and, upon request, by calling 1-800-345-2021.
44
The following indices are used to illustrate investment market, sector, or style performance or to serve as fund performance comparisons. They are not investment products available for purchase.
The Russell 1000® Index is a market-capitalization weighted, large-cap index created by Frank Russell Company to measure the performance of the 1,000 largest publicly traded U.S. companies, based on total market capitalization.
The Russell 1000® Growth Index measures the performance of those Russell 1000 Index companies (the 1,000 largest publicly traded U.S. companies, based on total market capitalization) with higher price-to-book ratios and higher forecasted growth values.
The Russell 1000® Value Index measures the performance of those Russell 1000 Index companies (the 1,000 largest publicly traded U.S. companies, based on total market capitalization) with lower price-to-book ratios and lower forecasted growth values.
The Russell 2000® Index is a market-capitalization weighted index created by Frank Russell Company to measure the performance of the 2,000 smallest of the 3,000 largest publicly traded U.S. companies, based on total market capitalization.
The Russell 2000® Growth Index measures the performance of those Russell 2000 Index companies (the 2,000 smallest of the 3,000 largest publicly traded U.S. companies, based on total market capitalization) with higher price-to-book ratios and higher forecasted growth values.
The Russell 2000® Value Index measures the performance of those Russell 2000 Index companies (the 2,000 smallest of the 3,000 largest publicly traded U.S. companies, based on total market capitalization) with lower price-to-book ratios and lower forecasted growth values.
The Russell Midcap® Index measures the performance of the 800 smallest of the 1,000 largest publicly traded U.S. companies, based on total market capitalization.
The Russell Midcap® Growth Index measures the performance of those Russell Midcap Index companies (the 800 smallest of the 1,000 largest publicly traded U.S. companies, based on total market capitalization) with higher price-to-book ratios and higher forecasted growth values.
The Russell Midcap® Value Index measures the performance of those Russell Midcap Index companies (the 800 smallest of the 1,000 largest publicly traded U.S. companies, based on total market capitalization) with lower price-to-book ratios and lower forecasted growth values.
The S&P 500 Index is a market value-weighted index of the stocks of 500 publicly traded U.S. companies chosen for market size, liquidity, and industry group representation that are considered to be leading firms in dominant industries. Each stock’s weight in the index is proportionate to its market value. Created by Standard & Poor’s, it is considered to be a broad measure of U.S. stock market performance.
45
46
47
48

| |
| |
| Contact Us | |
| americancentury.com | |
| Automated Information Line | 1-800-345-8765 |
| Investor Services Representative | 1-800-345-2021 or |
| | 816-531-5575 |
| Investors Using Advisors | 1-800-378-9878 |
| Business, Not-For-Profit, Employer-Sponsored | |
| Retirement Plans | 1-800-345-3533 |
| Banks and Trust Companies, Broker-Dealers, | |
| Financial Professionals, Insurance Companies | 1-800-345-6488 |
| Telecommunications Device for the Deaf | 1-800-634-4113 |
| American Century Quantitative Equity Funds, Inc. | |
| Investment Advisor: | |
| American Century Investment Management, Inc. | |
| Kansas City, Missouri | |
This report and the statements it contains are submitted for the general
information of our shareholders. The report is not authorized for distribution to
prospective investors unless preceded or accompanied by an effective prospectus.
American Century Investment Services, Inc., Distributor
©2010 American Century Proprietary Holdings, Inc. All rights reserved.
1008
CL-ANN-69050
|
| Annual Report |
| June 30, 2010 |

|
| American Century Investments® |
Income & Growth Fund
| |
| President’s Letter | 2 |
| Market Perspective | 3 |
| U.S. Stock Index Returns | 3 |
| |
| Income & Growth | |
| |
| Performance | 4 |
| Portfolio Commentary | 6 |
| Top Ten Holdings | 8 |
| Five Largest Overweights | 8 |
| Five Largest Underweights. | 8 |
| Types of Investments in Portfolio | 8 |
| |
| Shareholder Fee Example | 9 |
| |
| Financial Statements | |
| |
| Schedule of Investments | 11 |
| Statement of Assets and Liabilities | 16 |
| Statement of Operations | 17 |
| Statement of Changes in Net Assets | 18 |
| Notes to Financial Statements | 19 |
| Financial Highlights | 26 |
| Report of Independent Registered Public Accounting Firm | 32 |
| |
| Other Information | |
| |
| Proxy Voting Results | 33 |
| Management | 34 |
| Board Approval of Management Agreements | 38 |
| Additional Information | 44 |
| Index Definitions | 45 |
Any opinions expressed in this report reflect those of the author as of the date of the report, and do not necessarily represent the opinions of American Century Investments or any other person in the American Century Investments organization. Any such opinions are subject to change at any time based upon market or other conditions and American Century Investments disclaims any responsibility to update such opinions. These opinions may not be relied upon as investment advice and, because investment decisions made by American Century Investments funds are based on numerous factors, may not be relied upon as an indication of trading intent on behalf of any American Century Investments fund. Security examples are used for representational purposes only and are not intended as recommendations to purchase or sell securities. Performance information for comparative indices and securities is provided to American Century Investments by third party vendors. To the best of American Century Investments’ knowledge, such information is accurate at the time of printing.

Dear Investor:
To learn more about the capital markets, your investment, and the portfolio management strategies American Century Investments provides, we encourage you to review this shareholder report for the financial reporting period ended June 30, 2010.
On the following pages, you will find investment performance and portfolio information, presented with the expert perspective and commentary of our portfolio management team. This report remains one of our most important vehicles for conveying the information you need about your investment performance, and about the market factors and strategies that affect fund returns. For additional information on the markets, we encourage you to visit the “Insights & News” tab at our Web site, americancentury.com, for updates and further expert commentary.
The top of our Web site’s home page also provides a link to “Our Story,” which, first and foremost, outlines our commitment—since 1958—to helping clients reach their financial goals. We believe strongly that we will only be successful when our clients are successful. That’s who we are.
Another important, unique facet of our story and who we are is “Profits with a Purpose,” which describes our bond with the Stowers Institute for Medical Research (SIMR). SIMR is a world-class biomedical organization—founded by our company founder James E. Stowers, Jr. and his wife Virginia—that is dedicated to researching the causes, treatment, and prevention of gene-based diseases, including cancer. Through American Century Investments’ private ownership structure, more than 40% of our profits support SIMR.
Mr. Stowers’ example of achieving financial success and using that platform to help humanity motivates our entire American Century Investments team. His story inspires us to help each of our clients achieve success. Thank you for sharing your financial journey with us.
Sincerely,

Jonathan Thomas
President and Chief Executive Officer
American Century Investments
2

By Scott Wittman, Chief Investment Officer, Quantitative Equity and Asset Allocation
Stocks Rallied as Economy Improved
U.S. stocks posted double-digit gains for the 12 months ended June 30, 2010, thanks largely to improving economic conditions and unexpectedly strong corporate earnings. As the period began, the U.S. economy was starting to show early signs of recovery following a sharp downturn in late 2008 and early 2009. Led by improving results in manufacturing activity, housing, and consumer spending, the economy posted positive growth in the third and fourth quarters of 2009 after four consecutive quarters of declining output. By the first quarter of 2010, jobs data turned positive, providing further evidence of a burgeoning economic recovery.
In addition, corporate profits consistently exceeded expectations as many companies implemented stringent cost-management programs that helped boost profit margins. Rising demand for delayed big-ticket purchases, such as cars and appliances, also contributed to stronger earnings. As a result, stocks rose steadily for much of the period, with the major equity indices advancing by more than 30% from the beginning of the period through April 30, 2010.
Growing Uncertainty Led to Late Decline
Market conditions changed abruptly in the last two months of the period as persistent worries about sovereign debt problems in Europe and questions about the sustainability of the domestic economic recovery (validated to some degree by weaker economic data late in the period) weighed on investor confidence. With these headwinds, the equity market peaked in late April and then reversed direction in May and June. In addition, market volatility increased dramatically—the S&P 500 Index moved up or down by more than 1% on nearly half of the trading days in the second quarter of 2010.
Although stocks gave back a notable portion of their gains late in the period, the broad market indices returned approximately 15% overall for the 12 months. Mid- and small-cap stocks posted the best returns (see the table below), outpacing large-cap shares, while value stocks outperformed growth-oriented issues across all market capitalizations.
| | | | |
| U.S. Stock Index Returns | | | | |
| For the 12 months ended June 30, 2010 | | | | |
| Russell 1000 Index (Large-Cap) | 15.24% | | Russell 2000 Index (Small-Cap) | 21.48% |
| Russell 1000 Value Index | 16.92% | | Russell 2000 Value Index | 25.07% |
| Russell 1000 Growth Index | 13.62% | | Russell 2000 Growth Index | 17.96% |
| Russell Midcap Index | 25.13% | | | |
| Russell Midcap Value Index | 28.91% | | | |
| Russell Midcap Growth Index | 21.30% | | | |
3
| | | | | | | |
| Income & Growth | | | | | |
| |
| Total Returns as of June 30, 2010 | | | | | |
| | | | | Average Annual Returns | |
| | | Ticker | | | | Since | Inception |
| | | Symbol | 1 year | 5 years | 10 years | Inception | Date |
| Investor Class | BIGRX | 11.99% | -2.53% | -1.19% | 8.53% | 12/17/90 |
| S&P 500 Index | — | 14.43% | -0.79% | -1.59% | 8.22%(1) | — |
| Institutional Class | AMGIX | 12.20% | -2.34% | -0.99% | 2.27% | 1/28/98 |
| A Class(2) | AMADX | | | | | 12/15/97 |
| No sales charge* | | 11.72% | -2.77% | -1.44% | 1.89% | |
| With sales charge* | | 5.29% | -3.91% | -2.02% | 1.41% | |
| B Class | AIGBX | | | | | 9/28/07 |
| No sales charge* | | 10.88% | — | — | -13.95% | |
| With sales charge* | | 6.88% | — | — | -15.38% | |
| C Class | ACGCX | 10.85% | -3.50% | — | -1.02% | 6/28/01 |
| R Class | AICRX | 11.38% | -3.02% | — | 1.24% | 8/29/03 |
| *Sales charges include initial sales charges and contingent deferred sales charges (CDSCs), as applicable. A Class shares have a |
| maximum 5.75% initial sales charge and may be subject to a maximum CDSC of 1.00%. B Class shares redeemed within six years |
| of purchase are subject to a CDSC that declines from 5.00% during the first year after purchase to 0.00% the sixth year after |
| purchase. C Class shares redeemed within 12 months of purchase are subject to a maximum CDSC of 1.00%. The SEC requires that |
| mutual funds provide performance information net of maximum sales charges in all cases where charges could be applied. |
| (1) | Since 12/31/90, the date nearest the Investor Class’s inception for which data are available. | | | |
| (2) | Prior to September 4, 2007, the A Class was referred to as the Advisor Class and did not have a front-end sales charge. Performance prior to that |
| | date has been adjusted to reflect this charge. | | | | | |
Data presented reflect past performance. Past performance is no guarantee of future results. Current performance may be higher or lower than the performance shown. Investment return and principal value will fluctuate, and redemption value may be more or less than original cost. To obtain performance data current to the most recent month end, please call 1-800-345-2021 or visit americancentury.com.
Unless otherwise indicated, performance reflects Investor Class shares; performance for other share classes will vary due to differences in fee structure. For information about other share classes available, please consult the prospectus. Data assumes reinvestment of dividends and capital gains, and none of the charts reflect the deduction of taxes that a shareholder would pay on fund distributions or the redemption of fund shares. Returns for the index are provided for comparison. The fund’s total returns include operating expenses (such as transaction costs and management fees) that reduce returns, while the total returns of the index do not.
4
Income & Growth
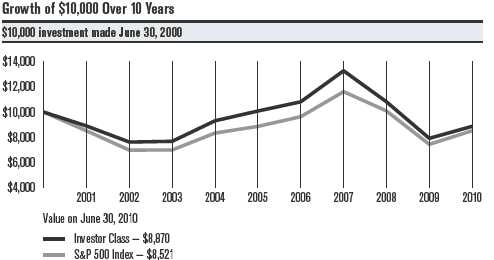
| | | | | |
| | | | | |
| Total Annual Fund Operating Expenses | | | |
| | Institutional | | | | |
| Investor Class | Class | A Class | B Class | C Class | R Class |
| 0.70% | 0.50% | 0.95% | 1.70% | 1.70% | 1.20% |
The total annual fund operating expenses shown is as stated in the fund’s prospectus current as of the date of this report. The prospectus may vary from the expense ratio shown elsewhere in this report because it is based on a different time period, includes acquired fund fees and expenses, and, if applicable, does not include fee waivers or expense reimbursements.
Data presented reflect past performance. Past performance is no guarantee of future results. Current performance may be higher or lower than the performance shown. Investment return and principal value will fluctuate, and redemption value may be more or less than original cost. To obtain performance data current to the most recent month end, please call 1-800-345-2021 or visit americancentury.com.
Unless otherwise indicated, performance reflects Investor Class shares; performance for other share classes will vary due to differences in fee structure. For information about other share classes available, please consult the prospectus. Data assumes reinvestment of dividends and capital gains, and none of the charts reflect the deduction of taxes that a shareholder would pay on fund distributions or the redemption of fund shares. Returns for the index are provided for comparison. The fund’s total returns include operating expenses (such as transaction costs and management fees) that reduce returns, while the total returns of the index do not.
5
Income & Growth
Portfolio Managers: Kurt Borgwardt and Zili Zhang
On March 31, 2010, Income & Growth portfolio manager John Schniedwind, who was also chief investment officer for quantitative equity, retired from American Century Investments after 27 years with the firm. Kurt Borgwardt and Zili Zhang remain as portfolio managers for Income & Growth.
Performance Summary
Income & Growth returned 11.99%* for the 12 months ended June 30, 2010, compared with the 14.43% return of its benchmark, the S&P 500 Index.
The double-digit gain for Income & Growth and the S&P 500 reflected the broad advance in the U.S. equity market. However, Income & Growth lagged the S&P 500 for the 12-month period. The fund’s tilt toward value contributed favorably to performance during the period as value-oriented stocks outperformed, but stock selection was the key factor behind the underperformance, detracting in seven of ten market sectors.
Financials and Energy Detracted
Stock selection in the financials and energy sectors had the biggest negative impact on performance versus the S&P 500. An underweight position in consumer finance companies and stock choices among diversified financial services firms did the most damage in the financials sector. The most significant missed opportunities included credit card companies American Express and Capital One Financial, both of which rallied as credit conditions improved and consumer spending picked up.
In the energy sector, underperformance resulted from an overweight position in oil and gas producers and security selection among energy services and equipment providers. The fund’s largest holding, oil and gas giant Exxon Mobil, detracted the most in the energy sector. Narrowing profit margins in Exxon Mobil’s refining operations led to the overall decline in the stock. Worsening refining margins also resulted in declines for oil and gas producer Murphy Oil and oil refiner Valero Energy.
Utilities and Health Care Also Lagged
The fund’s utilities and health care holdings were also noteworthy contributors to its overall underperformance of the S&P 500. Stock selection among electric utilities was responsible for virtually all of the underperformance in the utilities sector. NextEra Energy, a Florida-based electric utility formerly known as FPL Group, was the main culprit. NextEra faced a rate setback in Florida as the state allowed a substantially smaller rate increase than the company requested, contributing to a decline in earnings. Another significant detractor was electric and gas utility Public Services Enterprise Group, which operates primarily in the mid-Atlantic region. Declining demand for power weighed on the company’s profits during the period.
*All fund returns referenced in this commentary are for Investor Class shares.
6
Income & Growth
Underperformance in the health care sector was driven by health care providers and pharmaceutical firms. Medical supplier Becton, Dickinson & Co. was a major detractor, tumbling as hospital budget cuts took a bite out of the company’s revenue stream. Concerns about the impact of the federal government’s health care reform legislation hurt a number of health care stocks, most notably health services provider Coventry Health Care.
Consumer Staples and Technology Outperformed
Income & Growth’s holdings in the consumer staples sector contributed positively to relative results. Stock selection among beverage makers and tobacco companies contributed the bulk of the outperformance in this sector. Tobacco firm Reynolds American was the big winner, advancing as increasing demand for smokeless tobacco products provided a boost to the company’s revenues and profits. Among beverage makers, Dr Pepper Snapple Group got a lift from improving juice sales, while Coca-Cola Enterprises rallied after agreeing to sell its North American bottling unit to Coca-Cola.
One element of the overall success in individual stock selection is avoiding the worst performers in a particular sector or industry, and that aspect played an important role over the last 12 months. The outperformance in both the information technology and materials sectors of the portfolio was driven primarily by avoiding or minimizing exposure to a significant underperformer. In the technology sector, the portfolio held an underweight position in wireless technology firm QUALCOMM, which slumped after lowering earnings guidance several times during the period. Avoiding agricultural products maker Monsanto was the key in the materials sector; the company faced intense price competition in its Roundup herbicide business and tepid demand for its new enhanced seed products.
Other notable winners in the portfolio during the 12-month period included coal producer Alpha Natural Resources and hotel operator Wyndham Worldwide. Both stocks were beneficiaries of the improving economic environment—Alpha Natural Resources saw increased demand for metallurgical coal used in steelmaking, while Wyndham enjoyed an increase in hotel room occupancy.
A Look Ahead
The market environment has grown increasingly choppy in recent months, reflecting greater uncertainty about the resilience of the economic recovery. Although most businesses weathered the 2008 recession relatively well, stubbornly high unemployment suggests that the corporate sector is not yet confident enough in the strength of the recovery to expand payrolls. This economic uncertainty—and the stock market volatility that often accompanies it—is likely to continue as we move into the second half of 2010.
The quantitative investment process we use to manage Income & Growth has a framework that is objective, disciplined, and systematic—in other words, it avoids getting caught up in the fads and emotions that can drive short-term market movements. We believe this approach will produce superior relative performance over the long term.
7
| | |
| Income & Growth | | |
| |
| Top Ten Holdings | | |
| | | % of net assets as of 6/30/10 |
| Exxon Mobil Corp. | | 3.5% |
| International Business Machines Corp. | | 2.6% |
| Johnson & Johnson | | 2.6% |
| Chevron Corp. | | 2.2% |
| JPMorgan Chase & Co. | | 2.1% |
| AT&T, Inc. | | 2.0% |
| Bank of America Corp. | | 1.9% |
| Intel Corp. | | 1.9% |
| Procter & Gamble Co. (The) | | 1.9% |
| Microsoft Corp. | | 1.9% |
| |
| Five Largest Overweights as of June 30, 2010 | |
| | % of net assets | % of S&P 500 Index |
| Eli Lilly & Co. | 1.39% | 0.36% |
| Amgen, Inc. | 1.46% | 0.54% |
| Constellation Energy Group, Inc. | 0.99% | 0.07% |
| Occidental Petroleum Corp. | 1.57% | 0.67% |
| Prudential Financial, Inc. | 1.16% | 0.27% |
| |
| Five Largest Underweights as of June 30, 2010 | |
| | % of net assets | % of S&P 500 Index |
| Berkshire Hathaway, Inc., Class B | 0.36% | 1.42% |
| Merck & Co., Inc. | 0.11% | 1.17% |
| PepsiCo, Inc. | 0.04% | 1.05% |
| Coca-Cola Co. (The) | 0.23% | 1.24% |
| Apple, Inc. | 1.64% | 2.46% |
| |
| Types of Investments in Portfolio | | |
| | | % of net assets as of 6/30/10 |
| Common Stocks | | 99.4% |
| Temporary Cash Investments | | 0.6% |
| Other Assets and Liabilities | | —* |
| *Category is less than 0.05% of total net assets. | | |
8
|
| Shareholder Fee Example (Unaudited) |
Fund shareholders may incur two types of costs: (1) transaction costs, including sales charges (loads) on purchase payments and redemption/ exchange fees; and (2) ongoing costs, including management fees; distribution and service (12b-1) fees; and other fund expenses. This example is intended to help you understand your ongoing costs (in dollars) of investing in your fund and to compare these costs with the ongoing cost of investing in other mutual funds.
The example is based on an investment of $1,000 made at the beginning of the period and held for the entire period from January 1, 2010 to June 30, 2010.
Actual Expenses
The table provides information about actual account values and actual expenses for each class. You may use the information, together with the amount you invested, to estimate the expenses that you paid over the period. First, identify the share class you own. Then simply divide your account value by $1,000 (for example, an $8,600 account value divided by $1,000 = 8.6), then multiply the result by the number under the heading “Expenses Paid During Period” to estimate the expenses you paid on your account during this period.
If you hold Investor Class shares of any American Century Investments fund, or Institutional Class shares of the American Century Diversified Bond Fund, in an American Century Investments account (i.e., not a financial intermediary or retirement plan account), American Century Investments may charge you a $12.50 semiannual account maintenance fee if the value of those shares is less than $10,000. We will redeem shares automatically in one of your accounts to pay the $12.50 fee. In determining your total eligible investment amount, we will include your investments in all personal accounts (including American Century Investments Brokerage accounts) registered under your Social Security number. Personal accounts include individual accounts, joint accounts, UGMA/UTMA accounts, personal trusts, Coverdell Education Savings Accounts and IRAs (including traditional, Roth, Rollover, SEP-, SARSEP- and SIMPLE-IRAs), and certain other retirement accounts. If you have only business, business retirement, employer-sponsored or American Century Investments Brokerage accounts, you are currently not subject to this fee. We will not charge the fee as long as you choose to manage your accounts exclusively online. If you are subject to the Account Maintenance Fee, your account value could be reduced by the fee amount.
Hypothetical Example for Comparison Purposes
The table also provides information about hypothetical account values and hypothetical expenses based on the actual expense ratio of each class of your fund and an assumed rate of return of 5% per year before expenses, which is not the actual return of a fund’s share class. The hypothetical account values and expenses may not be used to estimate the actual ending account balance or expenses you paid for the period. You may use this information to compare the ongoing costs of investing in your fund and other funds. To do so, compare this 5% hypothetical example with the 5% hypothetical examples that appear in the shareholder reports of the other funds.
9
Please note that the expenses shown in the table are meant to highlight your ongoing costs only and do not reflect any transactional costs, such as sales charges (loads) or redemption/exchange fees. Therefore, the table is useful in comparing ongoing costs only, and will not help you determine the relative total costs of owning different funds. In addition, if these transactional costs were included, your costs would have been higher.
| | | | |
| | Beginning | Ending | Expenses Paid | |
| | Account Value | Account Value | During Period* | Annualized |
| | 1/1/10 | 6/30/10 | 1/1/10 – 6/30/10 | Expense Ratio* |
| Actual | | | | |
| Investor Class | $1,000 | $937.30 | $3.36 | 0.70% |
| Institutional Class | $1,000 | $937.70 | $2.40 | 0.50% |
| A Class | $1,000 | $936.20 | $4.56 | 0.95% |
| B Class | $1,000 | $932.70 | $8.15 | 1.70% |
| C Class | $1,000 | $932.50 | $8.15 | 1.70% |
| R Class | $1,000 | $934.70 | $5.76 | 1.20% |
| Hypothetical | | | | |
| Investor Class | $1,000 | $1,021.32 | $3.51 | 0.70% |
| Institutional Class | $1,000 | $1,022.32 | $2.51 | 0.50% |
| A Class | $1,000 | $1,020.08 | $4.76 | 0.95% |
| B Class | $1,000 | $1,016.36 | $8.50 | 1.70% |
| C Class | $1,000 | $1,016.36 | $8.50 | 1.70% |
| R Class | $1,000 | $1,018.84 | $6.01 | 1.20% |
| *Expenses are equal to the class’s annualized expense ratio listed in the table above, multiplied by the average account value over the period, |
| multiplied by 181, the number of days in the most recent fiscal half-year, divided by 365, to reflect the one-half year period. |
10
| | | | | | |
| Income & Growth | | | | | |
| |
| JUNE 30, 2010 | | | | | | |
| | Shares | Value | | | Shares | Value |
| Common Stocks — 99.4% | | | Investment Technology | | |
| | | | | Group, Inc.(1) | 21,619 | $ 347,201 |
| AEROSPACE & DEFENSE — 1.6% | | | Legg Mason, Inc. | 278,133 | 7,796,068 |
| Cubic Corp. | 18,894 | $ 687,364 | | | | 29,315,847 |
| General Dynamics Corp. | 14,257 | 834,890 | | CHEMICALS — 2.4% | | |
| Honeywell International, Inc. | 85,420 | 3,333,943 | | Ashland, Inc. | 285,256 | 13,241,584 |
| Lockheed Martin Corp. | 16,189 | 1,206,080 | | Cytec Industries, Inc. | 15,352 | 613,926 |
| Northrop Grumman Corp. | 288,094 | 15,683,837 | | E.I. du Pont de | | |
| Raytheon Co. | 74,317 | 3,596,200 | | Nemours & Co. | 406,041 | 14,044,958 |
| | | 25,342,314 | | Huntsman Corp. | 103,066 | 893,582 |
| AIR FREIGHT & LOGISTICS — 0.4% | | | Lubrizol Corp. | 9,538 | 765,997 |
| FedEx Corp. | 35,005 | 2,454,201 | | Minerals Technologies, Inc. | 24,895 | 1,183,508 |
| United Parcel Service, Inc., | | | | OM Group, Inc.(1) | 144,624 | 3,450,729 |
| Class B | 75,023 | 4,268,058 | | Valspar Corp. | 82,159 | 2,474,629 |
| | | 6,722,259 | | | | 36,668,913 |
| AUTO COMPONENTS — 0.2% | | | | COMMERCIAL BANKS — 3.1% | |
| Goodyear Tire & Rubber Co. | | | | | | |
| (The)(1) | 32,414 | 322,195 | | BB&T Corp. | 33,892 | 891,699 |
| TRW Automotive | | | | Canadian Imperial | | |
| Holdings Corp.(1) | 120,245 | 3,315,155 | | Bank of Commerce | 1,901 | 118,299 |
| | | 3,637,350 | | CapitalSource, Inc. | 343,915 | 1,637,036 |
| AUTOMOBILES — 0.2% | | | | Cullen/Frost Bankers, Inc. | 9,960 | 511,944 |
| Ford Motor Co.(1) | 370,914 | 3,738,813 | | Fifth Third Bancorp. | 189,722 | 2,331,683 |
| | | | | First Horizon National Corp.(1) | 621 | 7,116 |
| BEVERAGES — 1.4% | | | | | | |
| Coca-Cola Co. (The) | 69,773 | 3,497,023 | | PNC Financial Services | | |
| | | | | Group, Inc. | 18,676 | 1,055,194 |
| Coca-Cola Enterprises, Inc. | 131,962 | 3,412,537 | | Regions Financial Corp. | 98,958 | 651,144 |
| Dr Pepper Snapple | | | | | | |
| Group, Inc. | 370,330 | 13,846,639 | | SunTrust Banks, Inc. | 19,797 | 461,270 |
| PepsiCo, Inc. | 9,396 | 572,686 | | Toronto-Dominion Bank (The) | 183,818 | 11,931,626 |
| | | 21,328,885 | | U.S. Bancorp. | 520,535 | 11,633,957 |
| BIOTECHNOLOGY — 2.4% | | | | Wells Fargo & Co. | 591,699 | 15,147,494 |
| Amgen, Inc.(1) | 430,061 | 22,621,209 | | Westamerica Bancorp. | 20,565 | 1,080,074 |
| Biogen Idec, Inc.(1) | 44,014 | 2,088,464 | | | | 47,458,536 |
| | | | | COMMERCIAL SERVICES & SUPPLIES — 0.8% |
| Cephalon, Inc.(1) | 154,810 | 8,785,467 | | | | |
| | | | | R.R. Donnelley & Sons Co. | 575,118 | 9,414,681 |
| Cubist Pharmaceuticals, | | | | | | |
| Inc.(1) | 110,285 | 2,271,871 | | Republic Services, Inc. | 73,371 | 2,181,320 |
| Talecris Biotherapeutics | | | | | | 11,596,001 |
| Holdings Corp.(1) | 84,836 | 1,790,040 | | COMMUNICATIONS EQUIPMENT — 0.9% | |
| | | 37,557,051 | | Arris Group, Inc.(1) | 208,979 | 2,129,496 |
| CAPITAL MARKETS — 1.9% | | | | Cisco Systems, Inc.(1) | 411,963 | 8,778,931 |
| Apollo Investment Corp. | 424,399 | 3,959,643 | | CommScope, Inc.(1) | 79,254 | 1,883,868 |
| Bank of New York Mellon | | | | Motorola, Inc.(1) | 94,279 | 614,699 |
| Corp. (The) | 213,312 | 5,266,673 | | | | 13,406,994 |
| BlackRock, Inc. | 11,182 | 1,603,499 | | COMPUTERS & PERIPHERALS — 5.5% | |
| Goldman Sachs | | | | Apple, Inc.(1) | 100,931 | 25,387,174 |
| Group, Inc. (The) | 78,790 | 10,342,763 | | | | |
| | | | | EMC Corp.(1) | 238,987 | 4,373,462 |
11
| | | | | | |
| Income & Growth | | | | | |
| |
| | Shares | Value | | | Shares | Value |
| Hewlett-Packard Co. | 556,575 | $ 24,088,566 | | ELECTRONIC EQUIPMENT, INSTRUMENTS & | |
| SanDisk Corp.(1) | 180,369 | 7,588,124 | | COMPONENTS — 0.9% | | |
| Seagate Technology(1) | 761,694 | 9,932,490 | | Anixter International, Inc.(1) | 50,650 | $ 2,157,690 |
| Synaptics, Inc.(1) | 29,463 | 810,232 | | Celestica, Inc.(1) | 1,059,000 | 8,535,540 |
| Western Digital Corp.(1) | 408,579 | 12,322,743 | | Tech Data Corp.(1) | 95,402 | 3,398,219 |
| | | 84,502,791 | | Tyco Electronics Ltd. | 12,799 | 324,839 |
| CONSTRUCTION & ENGINEERING — 1.3% | | | | | 14,416,288 |
| EMCOR Group, Inc.(1) | 546,150 | 12,654,296 | | ENERGY EQUIPMENT & SERVICES — 0.6% | |
| Shaw Group, Inc. (The)(1) | 195,911 | 6,704,074 | | Complete Production | | |
| | | | | Services, Inc.(1) | 157,477 | 2,251,921 |
| | | 19,358,370 | | National Oilwell Varco, Inc. | 86,872 | 2,872,857 |
| CONSUMER FINANCE — 0.7% | | | Transocean Ltd.(1) | 105,145 | 4,871,368 |
| American Express Co. | 165,354 | 6,564,554 | | | | 9,996,146 |
| AmeriCredit Corp.(1) | 227,929 | 4,152,866 | | | | |
| | | | | FOOD & STAPLES RETAILING — 1.0% | |
| Cash America | | | | | | |
| International, Inc. | 12,091 | 414,359 | | SUPERVALU, INC. | 39,603 | 429,297 |
| | | 11,131,779 | | Wal-Mart Stores, Inc. | 325,949 | 15,668,368 |
| CONTAINERS & PACKAGING — 0.1% | | | | | 16,097,665 |
| Graphic Packaging | | | | FOOD PRODUCTS — 3.7% | | |
| Holding Co.(1) | 517,408 | 1,629,835 | | ConAgra Foods, Inc. | 12,828 | 299,149 |
| DIVERSIFIED CONSUMER SERVICES — 0.1% | | Corn Products | | |
| Apollo Group, Inc., Class A(1) | 6,304 | 267,731 | | International, Inc. | 50,034 | 1,516,030 |
| | | | | Del Monte Foods Co. | 888,739 | 12,788,954 |
| Corinthian Colleges, Inc.(1) | 58,665 | 577,850 | | | | |
| | | | | Dole Food Co., Inc.(1) | 186,566 | 1,945,883 |
| | | 845,581 | | | | |
| | | | | Fresh Del Monte | | |
| DIVERSIFIED FINANCIAL SERVICES — 4.4% | | | Produce, Inc.(1) | 9,800 | 198,352 |
| Bank of America Corp. | 2,089,773 | 30,030,038 | | General Mills, Inc. | 281,152 | 9,986,519 |
| Citigroup, Inc.(1) | 1,227,817 | 4,616,592 | | Hershey Co. (The) | 63,523 | 3,044,658 |
| CME Group, Inc. | 3,945 | 1,110,715 | | Kraft Foods, Inc., Class A | 190,803 | 5,342,484 |
| JPMorgan Chase & Co. | 907,297 | 33,216,143 | | Sara Lee Corp. | 792,322 | 11,171,740 |
| | | 68,973,488 | | Tyson Foods, Inc., Class A | 669,573 | 10,974,302 |
| DIVERSIFIED TELECOMMUNICATION | | | | | 57,268,071 |
| SERVICES — 3.9% | | | | | | |
| | | | | GAS UTILITIES — 0.2% | | |
| AT&T, Inc. | 1,313,075 | 31,763,284 | | | | |
| | | | | Nicor, Inc. | 78,706 | 3,187,593 |
| Qwest Communications | | | | | | |
| International, Inc. | 850,786 | 4,466,627 | | HEALTH CARE EQUIPMENT & SUPPLIES — 1.6% |
| Verizon Communications, Inc. | 878,598 | 24,618,316 | | Becton, Dickinson & Co. | 207,060 | 14,001,397 |
| | | 60,848,227 | | Hill-Rom Holdings, Inc. | 161,332 | 4,909,333 |
| ELECTRIC UTILITIES — 1.0% | | | | Medtronic, Inc. | 157,684 | 5,719,199 |
| Entergy Corp. | 26,891 | 1,925,934 | | | | 24,629,929 |
| Exelon Corp. | 123,521 | 4,690,092 | | HEALTH CARE PROVIDERS & SERVICES — 1.8% |
| NextEra Energy, Inc. | 159,679 | 7,785,948 | | Cardinal Health, Inc. | 24,264 | 815,513 |
| PPL Corp. | 20,315 | 506,859 | | Centene Corp.(1) | 76,392 | 1,642,428 |
| | | 14,908,833 | | Coventry Health Care, Inc.(1) | 288,745 | 5,105,012 |
| ELECTRICAL EQUIPMENT — 0.4% | | | Humana, Inc.(1) | 193,713 | 8,846,873 |
| Brady Corp., Class A | 17,171 | 427,901 | | WellPoint, Inc.(1) | 240,122 | 11,749,169 |
| Emerson Electric Co. | 124,883 | 5,456,138 | | | | 28,158,995 |
| General Cable Corp.(1) | 26,709 | 711,795 | | | | |
| | | 6,595,834 | | | | |
12
| | | | | | | |
| Income & Growth | | | | | | |
| |
| | Shares | Value | | | Shares | | Value |
| HOTELS, RESTAURANTS & LEISURE — 1.2% | | | Sun Life Financial, Inc. | 121,411 | $ 3,194,323 |
| McDonald’s Corp. | 219,281 | $ 14,444,039 | | Transatlantic Holdings, Inc. | 12,693 | | 608,756 |
| Starbucks Corp. | 114,380 | 2,779,434 | | | | | 76,460,620 |
| Wyndham Worldwide Corp. | 47,105 | 948,695 | | INTERNET SOFTWARE & SERVICES — 1.1% | |
| | | 18,172,168 | | AOL, Inc.(1) | 145,038 | | 3,015,340 |
| HOUSEHOLD DURABLES — 0.7% | | | EarthLink, Inc. | 269,339 | | 2,143,938 |
| American Greetings Corp., | | | | Google, Inc., Class A(1) | 26,741 | | 11,898,408 |
| Class A | 115,405 | 2,164,998 | | | | | 17,057,686 |
| Blyth, Inc. | 6,772 | 230,722 | | IT SERVICES — 4.7% | | | |
| Garmin Ltd. | 35,688 | 1,041,376 | | Accenture plc, Class A | 291,165 | | 11,253,527 |
| Whirlpool Corp. | 83,134 | 7,300,828 | | Acxiom Corp.(1) | 59,328 | | 871,528 |
| | | 10,737,924 | | Automatic Data | | | |
| HOUSEHOLD PRODUCTS — 2.9% | | | Processing, Inc. | 244,259 | | 9,833,868 |
| Kimberly-Clark Corp. | 270,276 | 16,386,834 | | Computer Sciences Corp. | 169,188 | | 7,655,757 |
| Procter & Gamble Co. (The) | 488,828 | 29,319,903 | | Convergys Corp.(1) | 352,628 | | 3,459,281 |
| | | 45,706,737 | | International Business | | | |
| INDEPENDENT POWER PRODUCERS & | | | Machines Corp. | 323,771 | | 39,979,243 |
| ENERGY TRADERS — 1.0% | | | | | | | 73,053,204 |
| Constellation Energy | | | | LEISURE EQUIPMENT & PRODUCTS — 0.1% | |
| Group, Inc. | 474,501 | 15,302,657 | | | | | |
| | | | | Eastman Kodak Co.(1) | 300,000 | | 1,302,000 |
| INDUSTRIAL CONGLOMERATES — 1.7% | | | | | | |
| | | | | MACHINERY — 2.6% | | | |
| 3M Co. | 58,470 | 4,618,545 | | | | | |
| | | | | Briggs & Stratton Corp. | 92,215 | | 1,569,499 |
| Carlisle Cos., Inc. | 167,803 | 6,062,723 | | | | | |
| | | | | Caterpillar, Inc. | 137,860 | | 8,281,250 |
| General Electric Co. | 1,063,155 | 15,330,695 | | | | | |
| | | | | Cummins, Inc. | 32,088 | | 2,089,892 |
| | | 26,011,963 | | | | | |
| | | | | Eaton Corp. | 129,480 | | 8,473,171 |
| INSURANCE — 4.9% | | | | | | | |
| | | | | Mueller Industries, Inc. | 41,959 | | 1,032,191 |
| ACE Ltd. | 219,975 | 11,324,313 | | | | | |
| | | | | Oshkosh Corp.(1) | 287,975 | | 8,973,301 |
| Allied World Assurance Co. | | | | | | | |
| Holdings Ltd. | 14,978 | 679,702 | | Parker-Hannifin Corp. | 104,720 | | 5,807,771 |
| Allstate Corp. (The) | 20,801 | 597,613 | | Timken Co. | 154,735 | | 4,021,563 |
| American Financial | | | | | | | 40,248,638 |
| Group, Inc. | 367,064 | 10,028,189 | | MEDIA — 2.6% | | | |
| Arch Capital Group Ltd.(1) | 21,529 | 1,603,911 | | Comcast Corp., Class A | 687,678 | | 11,944,967 |
| Aspen Insurance | | | | Gannett Co., Inc. | 430,480 | | 5,794,261 |
| Holdings Ltd. | 270,876 | 6,701,472 | | Scholastic Corp. | 73,638 | | 1,776,149 |
| Berkshire Hathaway, Inc., | | | | Time Warner, Inc. | 591,453 | | 17,098,906 |
| Class B(1) | 69,215 | 5,515,743 | | | | | |
| | | | | Walt Disney Co. (The) | 106,305 | | 3,348,607 |
| Endurance Specialty | | | | | | | 39,962,890 |
| Holdings Ltd. | 46,672 | 1,751,600 | | | | | |
| Hartford Financial Services | | | | METALS & MINING — 1.2% | | | |
| Group, Inc. (The) | 25,141 | 556,370 | | Freeport-McMoRan | | | |
| Horace Mann Educators Corp. | 49,536 | 757,901 | | Copper & Gold, Inc. | 201,767 | | 11,930,482 |
| | | | | Kinross Gold Corp. | | | |
| Loews Corp. | 17,453 | 581,359 | | New York Shares | 20,089 | | 343,321 |
| MetLife, Inc. | 17,570 | 663,443 | | Reliance Steel & | | | |
| Principal Financial Group, Inc. | 533,274 | 12,499,943 | | Aluminum Co. | 114,199 | | 4,128,294 |
| Protective Life Corp. | 35,140 | 751,645 | | Worthington Industries, Inc. | 150,401 | | 1,934,157 |
| Prudential Financial, Inc. | 336,156 | 18,038,131 | | | | | 18,336,254 |
| Reinsurance Group of | | | | | | | |
| America, Inc. | 13,262 | 606,206 | | | | | |
13
| | | | | | |
| Income & Growth | | | | | |
| |
| | Shares | Value | | | Shares | Value |
| MULTILINE RETAIL — 0.6% | | | | Simon Property Group, Inc. | 52,532 | $ 4,241,959 |
| Big Lots, Inc.(1) | 57,276 | $ 1,837,987 | | Vornado Realty Trust | 2,286 | 166,764 |
| Dillard’s, Inc., Class A | 132,338 | 2,845,267 | | | | 9,615,170 |
| Dollar Tree, Inc.(1) | 35,490 | 1,477,449 | | ROAD & RAIL — 0.5% | | |
| Family Dollar Stores, Inc. | 73,158 | 2,757,325 | | CSX Corp. | 144,809 | 7,186,871 |
| Macy’s, Inc. | 19,684 | 352,343 | | SEMICONDUCTORS & SEMICONDUCTOR | |
| | | 9,270,371 | | EQUIPMENT — 3.5% | | |
| MULTI-UTILITIES — 1.5% | | | | Broadcom Corp., Class A | 36,693 | 1,209,768 |
| DTE Energy Co. | 198,325 | 9,045,603 | | Integrated Device | | |
| | | | | Technology, Inc.(1) | 90,094 | 445,965 |
| Integrys Energy Group, Inc. | 288,654 | 12,625,726 | | Intel Corp. | 1,517,689 | 29,519,051 |
| NiSource, Inc. | 96,208 | 1,395,016 | | | | |
| | | | | LSI Corp.(1) | 975,817 | 4,488,758 |
| | | 23,066,345 | | | | |
| | | | | Maxim Integrated | | |
| OFFICE ELECTRONICS — 0.1% | | | Products, Inc. | 100,205 | 1,676,430 |
| Xerox Corp. | 249,606 | 2,006,832 | | Micron Technology, Inc.(1) | 857,185 | 7,277,501 |
| OIL, GAS & CONSUMABLE FUELS — 9.8% | | | RF Micro Devices, Inc.(1) | 528,066 | 2,064,738 |
| Chevron Corp. | 508,092 | 34,479,123 | | Texas Instruments, Inc. | 357,269 | 8,317,222 |
| ConocoPhillips | 462,073 | 22,683,164 | | | | 54,999,433 |
| Exxon Mobil Corp. | 956,154 | 54,567,709 | | SOFTWARE — 3.3% | | |
| Hess Corp. | 66,335 | 3,339,304 | | ACI Worldwide, Inc.(1) | 71,320 | 1,388,600 |
| Murphy Oil Corp. | 228,340 | 11,314,247 | | Fair Isaac Corp. | 28,819 | 627,966 |
| Occidental Petroleum Corp. | 316,255 | 24,399,073 | | | | |
| | | | | Mentor Graphics Corp.(1) | 14,780 | 130,803 |
| Williams Cos., Inc. (The) | 80,847 | 1,477,883 | | | | |
| | | 152,260,503 | | Microsoft Corp. | 1,263,770 | 29,079,348 |
| PAPER & FOREST PRODUCTS — 0.3% | | | Oracle Corp. | 475,635 | 10,207,127 |
| | | | | Symantec Corp.(1) | 443,302 | 6,153,032 |
| Domtar Corp. | 27,136 | 1,333,734 | | | | |
| | | | | Synopsys, Inc.(1) | 147,343 | 3,075,048 |
| International Paper Co. | 127,320 | 2,881,252 | | | | |
| | | 4,214,986 | | | | 50,661,924 |
| PERSONAL PRODUCTS — 0.4% | | | SPECIALTY RETAIL — 2.5% | | |
| | | | | AnnTaylor Stores Corp.(1) | 37,379 | 608,156 |
| Estee Lauder Cos., Inc. | | | | | | |
| (The), Class A | 114,501 | 6,381,141 | | Barnes & Noble, Inc. | 118,395 | 1,527,296 |
| PHARMACEUTICALS — 7.4% | | | | Gap, Inc. (The) | 719,218 | 13,995,982 |
| Bristol-Myers Squibb Co. | 837,285 | 20,881,888 | | Home Depot, Inc. (The) | 60,702 | 1,703,905 |
| Eli Lilly & Co. | 645,784 | 21,633,764 | | OfficeMax, Inc.(1) | 41,307 | 539,470 |
| Endo Pharmaceuticals | | | | Rent-A-Center, Inc.(1) | 376,024 | 7,618,246 |
| Holdings, Inc.(1) | 108,069 | 2,358,066 | | Ross Stores, Inc. | 161,050 | 8,582,355 |
| Forest Laboratories, Inc.(1) | 74,383 | 2,040,326 | | Williams-Sonoma, Inc. | 179,204 | 4,447,843 |
| Johnson & Johnson | 671,459 | 39,656,368 | | | | 39,023,253 |
| King Pharmaceuticals, Inc.(1) | 182,226 | 1,383,095 | | TEXTILES, APPAREL & LUXURY GOODS — 0.5% |
| Merck & Co., Inc. | 49,899 | 1,744,968 | | Jones Apparel Group, Inc. | 381,342 | 6,044,271 |
| Pfizer, Inc. | 1,780,318 | 25,387,335 | | Timberland Co. (The), | | |
| | | 115,085,810 | | Class A(1) | 59,750 | 964,962 |
| REAL ESTATE INVESTMENT TRUSTS (REITs) — 0.6% | | | | 7,009,233 |
| CBL & Associates | | | | THRIFTS & MORTGAGE FINANCE(2) | |
| Properties, Inc. | 60,412 | 751,525 | | Ocwen Financial Corp.(1) | 63,966 | 651,814 |
| Duke Realty Corp. | 53,737 | 609,915 | | | | |
| Public Storage | 43,738 | 3,845,007 | | | | |
14
| | | | | |
| Income & Growth | | | | |
| |
| | Shares | Value | | Notes to Schedule of Investments |
| TOBACCO — 1.1% | | | | (1) | Non-income producing. |
| Philip Morris International, Inc. | 86,700 | $ 3,974,328 | | (2) | Category is less than 0.05% of total net assets. |
| Reynolds American, Inc. | 239,831 | 12,499,992 | | | |
| | | 16,474,320 | | Industry classifications are unaudited. |
| WIRELESS TELECOMMUNICATION SERVICES — 0.1% | | | |
| Sprint Nextel Corp.(1) | 527,415 | 2,236,240 | | See Notes to Financial Statements. |
| TOTAL COMMON STOCKS | | | | | |
| (Cost $1,457,898,555) | | 1,541,819,375 | | | |
| Temporary Cash Investments — 0.6% | | | |
| Repurchase Agreement, Bank of America | | | | |
| Securities, LLC, (collateralized by various | | | | |
| U.S. Treasury obligations, 1.125%, 6/30/11, | | | | |
| valued at $9,689,369), in a joint trading | | | | |
| account at 0.01%, dated 6/30/10, due | | | | |
| 7/1/10 (Delivery value $9,500,003) | | | | |
| (Cost $9,500,000) | | 9,500,000 | | | |
| TOTAL INVESTMENT | | | | | |
| SECURITIES — 100.0% | | | | | |
| (Cost $1,467,398,555) | | 1,551,319,375 | | | |
| OTHER ASSETS AND LIABILITIES(2) | 312,923 | | | |
| TOTAL NET ASSETS — 100.0% | | $1,551,632,298 | | | |
15
|
| Statement of Assets and Liabilities |
| |
| JUNE 30, 2010 | |
| Assets | |
| Investment securities, at value (cost of $1,467,398,555) | $1,551,319,375 |
| Receivable for capital shares sold | 651,893 |
| Dividends and interest receivable | 1,995,010 |
| | 1,553,966,278 |
| | |
| Liabilities | |
| Disbursements in excess of demand deposit cash | 15,858 |
| Payable for capital shares redeemed | 1,388,257 |
| Accrued management fees | 901,063 |
| Service fees (and distribution fees — A Class and R Class) payable | 28,153 |
| Distribution fees payable | 649 |
| | 2,333,980 |
| | |
| Net Assets | $1,551,632,298 |
| | |
| Net Assets Consist of: | |
| Capital (par value and paid-in surplus) | $2,075,310,930 |
| Undistributed net investment income | 197,010 |
| Accumulated net realized loss on investment transactions | (607,796,462) |
| Net unrealized appreciation on investments | 83,920,820 |
| | $1,551,632,298 |
| | | |
| | Net assets | Shares outstanding | Net asset value per share |
| Investor Class, $0.01 Par Value | $1,227,234,131 | 61,734,581 | $19.88 |
| Institutional Class, $0.01 Par Value | $197,196,134 | 9,912,192 | $19.89 |
| A Class, $0.01 Par Value | $125,980,707 | 6,343,298 | $19.86* |
| B Class, $0.01 Par Value | $79,293 | 3,989 | $19.88 |
| C Class, $0.01 Par Value | $863,188 | 43,519 | $19.83 |
| R Class, $0.01 Par Value | $278,845 | 14,030 | $19.87 |
| *Maximum offering price $21.07 (net asset value divided by 0.9425) | | |
| |
| |
| See Notes to Financial Statements. | | | |
16
| |
| YEAR ENDED JUNE 30, 2010 | |
| Investment Income (Loss) | |
| Income: | |
| Dividends (net of foreign taxes withheld of $94,181) | $ 40,921,634 |
| Interest | 5,750 |
| | 40,927,384 |
| | |
| Expenses: | |
| Management fees | 11,889,041 |
| Distribution fees: | |
| B Class | 474 |
| C Class | 7,412 |
| Service fees: | |
| B Class | 158 |
| C Class | 2,471 |
| Distribution and service fees: | |
| A Class | 408,203 |
| R Class | 1,361 |
| Directors’ fees and expenses | 54,434 |
| Other expenses | 36,571 |
| | 12,400,125 |
| | |
| Net investment income (loss) | 28,527,259 |
| | |
| Realized and Unrealized Gain (Loss) | |
| Net realized gain (loss) on: | |
| Investment transactions | 14,811,390 |
| Futures contract transactions | (4,099,355) |
| | 10,712,035 |
| | |
| Change in net unrealized appreciation (depreciation) on: | |
| Investments | 182,994,830 |
| Futures contracts | 23,348 |
| | 183,018,178 |
| | |
| Net realized and unrealized gain (loss) | 193,730,213 |
| | |
| Net Increase (Decrease) in Net Assets Resulting from Operations | $222,257,472 |
| |
| |
| See Notes to Financial Statements. | |
17
|
| Statement of Changes in Net Assets |
| | |
| YEARS ENDED JUNE 30, 2010 AND JUNE 30, 2009 | | |
| Increase (Decrease) in Net Assets | 2010 | 2009 |
| Operations | | |
| Net investment income (loss) | $ 28,527,259 | $ 47,491,719 |
| Net realized gain (loss) | 10,712,035 | (520,045,136) |
| Change in net unrealized appreciation (depreciation) | 183,018,178 | (303,701,665) |
| Net increase (decrease) in net assets resulting from operations | 222,257,472 | (776,255,082) |
| | | |
| Distributions to Shareholders | | |
| From net investment income: | | |
| Investor Class | (21,903,250) | (39,834,928) |
| Institutional Class | (4,223,655) | (11,724,274) |
| A Class | (2,164,134) | (5,403,315) |
| B Class | (366) | (621) |
| C Class | (5,588) | (12,291) |
| R Class | (3,006) | (5,646) |
| Decrease in net assets from distributions | (28,299,999) | (56,981,075) |
| | | |
| Capital Share Transactions | | |
| Net increase (decrease) in net assets from capital share transactions | (375,460,278) | (413,872,612) |
| | | |
| Net increase (decrease) in net assets | (181,502,805) | (1,247,108,769) |
| | | |
| Net Assets | | |
| Beginning of period | 1,733,135,103 | 2,980,243,872 |
| End of period | $1,551,632,298 | $ 1,733,135,103 |
| | | |
| Undistributed net investment income | $197,010 | — |
| |
| |
| See Notes to Financial Statements. | | |
18
|
| Notes to Financial Statements |
JUNE 30, 2010
1. Organization and Summary of Significant Accounting Policies
Organization — American Century Quantitative Equity Funds, Inc. (the corporation) is registered under the Investment Company Act of 1940 (the 1940 Act) as an open-end management investment company. Income & Growth Fund (the fund) is one fund in a series issued by the corporation. The fund is diversified under the 1940 Act. The fund’s investment objective is to seek capital growth by investing in common stocks. Income is a secondary objective. The following is a summary of the fund’s significant accounting policies.
Multiple Class — The fund is authorized to issue the Investor Class, the Institutional Class, the A Class, the B Class, the C Class and the R Class. The A Class may incur an initial sales charge. The A Class, B Class and C Class may be subject to a contingent deferred sales charge. The share classes differ principally in their respective sales charges and distribution and shareholder servicing expenses and arrangements. All shares of the fund represent an equal pro rata interest in the net assets of the class to which such shares belong, and have identical voting, dividend, liquidation and other rights and the same terms and conditions, except for class specific expenses and exclusive rights to vote on matters affecting only individual classes. Income, non-class specific expenses, and realized and unrealized capital gains and losses of the fund are allocated to each class of shares based on their relative net assets.
Security Valuations — Securities traded primarily on a principal securities exchange are valued at the last reported sales price, or at the mean of the latest bid and asked prices where no last sales price is available. Depending on local convention or regulation, securities traded over-the-counter are valued at the mean of the latest bid and asked prices, the last sales price, or the official close price. Investments in open-end management investment companies are valued at the reported net asset value. Discount notes may be valued through a commercial pricing service or at amortized cost, which approximates fair value. Securities traded on foreign securities exchanges and over-the-counter markets are normally completed before the close of business on days that the New York Stock Exchange (the Exchange) is open and may also take place on days when the Exchange is not open. If an event occurs after the value of a security was established but before the net asset value per share was determined that was likely to materially change the net asset value, that security would be valued as determined in accordance with procedures adopted by the Board of Directors. If the fund determines that the market price of a portfolio security is not readily available, or that the valuation methods mentioned above do not reflect the security’s fair value, such security is valued as determined by the Board of Directors or its designee, in accordance with procedures adopted by the Board of Directors, if such determination would materially impact a fund’s net asset value. Certain other circumstances may cause the fund to use alternative procedures to value a security such as: a security has been declared in default; trading in a security has been halted during the trading day; or there is a foreign market holiday and no trading will commence .
Security Transactions — For financial reporting purposes, security transactions are accounted for as of the trade date. Net realized gains and losses are determined on the identified cost basis, which is also used for federal income tax purposes.
Investment Income — Dividend income less foreign taxes withheld, if any, is recorded as of the ex-dividend date. Interest income is recorded on the accrual basis and includes accretion of discounts and amortization of premiums.
19
Repurchase Agreements — The fund may enter into repurchase agreements with institutions that American Century Investment Management, Inc. (ACIM) (the investment advisor) has determined are creditworthy pursuant to criteria adopted by the Board of Directors. Each repurchase agreement is recorded at cost. The fund requires that the collateral, represented by securities, received in a repurchase transaction be transferred to the custodian in a manner sufficient to enable the fund to obtain those securities in the event of a default under the repurchase agreement. ACIM monitors, on a daily basis, the securities transferred to ensure the value, including accrued interest, of the securities under each repurchase agreement is equal to or greater than amounts owed to the fund under each repurchase agreement.
Joint Trading Account — Pursuant to an Exemptive Order issued by the Securities and Exchange Commission, the fund, along with certain other funds in the American Century Investments family of funds, may transfer uninvested cash balances into a joint trading account. These balances are invested in one or more repurchase agreements that are collateralized by U.S. Treasury or Agency obligations.
Income Tax Status — It is the fund’s policy to distribute substantially all net investment income and net realized gains to shareholders and to otherwise qualify as a regulated investment company under provisions of the Internal Revenue Code. The fund is no longer subject to examination by tax authorities for years prior to 2006. At this time, management believes there are no uncertain tax positions which, based on their technical merit, would not be sustained upon examination and for which it is reasonably possible that the total amounts of unrecognized tax benefits will significantly change in the next twelve months. Accordingly, no provision has been made for federal or state income taxes.
Distributions to Shareholders — Distributions to shareholders are recorded on the ex-dividend date. Distributions from net investment income, if any, are generally declared and paid quarterly. Distributions from net realized gains, if any, are generally declared and paid annually.
Indemnifications — Under the corporation’s organizational documents, its officers and directors are indemnified against certain liabilities arising out of the performance of their duties to the fund. In addition, in the normal course of business, the fund enters into contracts that provide general indemnifications. The maximum exposure under these arrangements is unknown as this would involve future claims that may be made against a fund. The risk of material loss from such claims is considered by management to be remote.
Use of Estimates — The financial statements are prepared in conformity with accounting principles generally accepted in the United States of America, which may require management to make certain estimates and assumptions at the date of the financial statements. Actual results could differ from these estimates.
Subsequent Events — In preparing the financial statements, management evaluated the impact of events or transactions occurring through the date the financial statements were issued that would merit recognition or disclosure.
20
2. Fees and Transactions with Related Parties
Management Fees — The corporation has entered into a Management Agreement with ACIM, under which ACIM provides the fund with investment advisory and management services in exchange for a single, unified management fee (the fee) per class. The Agreement provides that all expenses of managing and operating the fund, except brokerage expenses, taxes, interest, fees and expenses of the independent directors (including legal counsel fees), and extraordinary expenses, will be paid by ACIM. The fee is computed and accrued daily based on the daily net assets of the specific class of shares of the fund and paid monthly in arrears. The fee consists of (1) an Investment Category Fee based on the daily net assets of the fund and certain other accounts managed by the investment advisor that are in the same broad investment category as the fund and (2) a Complex Fee based on the assets of all the funds in the American Century Investments family of funds. The rates for the Investment Category Fee range from 0.3380% to 0.5200%. The rates for the Complex Fee range from 0.2500% to 0.3100% for the Investor Class, A Class, B Class, C Class and R Class. The Institutional Class is 0.2000% less at each point within the Complex Fee range. The effective annual management fee for each class for the year ended June 30, 2010 was 0.69% for the Investor Class, A Class, B Class, C Class and R Class and 0.49% for the Institutional Class.
Distribution and Service Fees — The Board of Directors has adopted a separate Master Distribution and Individual Shareholder Services Plan for each of the A Class, B Class, C Class and R Class (collectively the plans), pursuant to Rule 12b-1 of the 1940 Act. The plans provide that the A Class will pay American Century Investment Services, Inc. (ACIS) an annual distribution and service fee of 0.25%. The plans provide that the B Class and C Class will each pay ACIS an annual distribution fee of 0.75% and service fee of 0.25%. The plans provide that the R Class will pay ACIS an annual distribution and service fee of 0.50%. The fees are computed and accrued daily based on each class’s daily net assets and paid monthly in arrears. The fees are used to pay financial intermediaries for distribution and individual shareholde r services. Fees incurred under the plans during the year ended June 30, 2010, are detailed in the Statement of Operations.
Related Parties — Certain officers and directors of the corporation are also officers and/ or directors of American Century Companies, Inc. (ACC), the parent of the corporation’s investment advisor, ACIM, the distributor of the corporation, ACIS, and the corporation’s transfer agent, American Century Services, LLC.
The fund is eligible to invest in a money market fund for temporary purposes, which is managed by J.P. Morgan Investment Management, Inc. (JPMIM). The fund has a Mutual Funds Services Agreement with J.P. Morgan Investor Services Co. (JPMIS) and a securities lending agreement with JPMorgan Chase Bank (JPMCB). JPMCB is a custodian of the fund. JPMIM, JPMIS and JPMCB are wholly owned subsidiaries of JPMorgan Chase & Co. (JPM). JPM is an equity investor in ACC.
3. Investment Transactions
Purchases and sales of investment securities, excluding short-term investments, for the year ended June 30, 2010, were $792,208,969 and $1,171,596,664, respectively.
21
| | | | |
| 4. Capital Share Transactions | | | | |
| |
| Transactions in shares of the fund were as follows: | | |
| | Year ended June 30, 2010 | Year ended June 30, 2009 |
| | Shares | Amount | Shares | Amount |
| Investor Class/Shares Authorized | 330,000,000 | | 330,000,000 | |
| Sold | 3,838,034 | $ 80,528,593 | 5,725,804 | $ 107,573,044 |
| Issued in reinvestment of distributions | 961,765 | 20,629,225 | 1,984,000 | 37,745,971 |
| Redeemed | (14,141,738) | (297,312,816) | (18,713,803) | (361,624,767) |
| | (9,341,939) | (196,154,998) | (11,003,999) | (216,305,752) |
| Institutional Class/Shares Authorized | 100,000,000 | | 100,000,000 | |
| Sold | 1,668,153 | 34,474,492 | 6,516,634 | 118,653,148 |
| Issued in reinvestment of distributions | 180,995 | 3,883,796 | 590,268 | 11,276,375 |
| Redeemed | (6,810,928) | (140,103,046) | (13,481,166) | (242,902,227) |
| | (4,961,780) | (101,744,758) | (6,374,264) | (112,972,704) |
| A Class/Shares Authorized | 100,000,000 | | 100,000,000 | |
| Sold | 755,867 | 15,695,842 | 1,352,467 | 25,563,806 |
| Issued in reinvestment of distributions | 99,020 | 2,113,901 | 277,285 | 5,289,524 |
| Redeemed | (4,634,554) | (95,453,320) | (5,806,277) | (115,164,742) |
| | (3,779,667) | (77,643,577) | (4,176,525) | (84,311,412) |
| B Class/Shares Authorized | 10,000,000 | | 10,000,000 | |
| Sold | 1,290 | 28,694 | 1,356 | 21,381 |
| Issued in reinvestment of distributions | 17 | 366 | 36 | 621 |
| | 1,307 | 29,060 | 1,392 | 22,002 |
| C Class/Shares Authorized | 10,000,000 | | 10,000,000 | |
| Sold | 18,337 | 389,368 | 22,067 | 398,750 |
| Issued in reinvestment of distributions | 199 | 4,252 | 560 | 10,076 |
| Redeemed | (20,349) | (427,245) | (23,968) | (472,772) |
| | (1,813) | (33,625) | (1,341) | (63,946) |
| R Class/Shares Authorized | 10,000,000 | | 10,000,000 | |
| Sold | 9,468 | 187,989 | 6,597 | 133,954 |
| Issued in reinvestment of distributions | 107 | 2,307 | 189 | 3,523 |
| Redeemed | (5,297) | (102,676) | (18,621) | (378,277) |
| | 4,278 | 87,620 | (11,835) | (240,800) |
| Net increase (decrease) | (18,079,614) | $(375,460,278) | (21,566,572) | $(413,872,612) |
22
5. Fair Value Measurements
The fund’s securities valuation process is based on several considerations and may use multiple inputs to determine the fair value of the positions held by the fund. In conformity with accounting principles generally accepted in the United States of America, the inputs used to determine a valuation are classified into three broad levels as follows:
• Level 1 valuation inputs consist of unadjusted quoted prices in an active market for identical securities;
• Level 2 valuation inputs consist of significant direct or indirect observable market data (including quoted prices for similar securities, evaluations of subsequent market events, interest rates, prepayment speeds, credit risk, etc.); or
• Level 3 valuation inputs consist of significant unobservable inputs (including a fund’s own assumptions).
The level classification is based on the lowest level input that is significant to the fair valuation measurement. The valuation inputs are not an indication of the risks associated with investing in these securities or other financial instruments.
The following is a summary of the valuation inputs used to determine the fair value of the fund’s securities as of June 30, 2010. The Schedule of Investments provides additional details on the fund’s portfolio holdings.
| | | |
| | Level 1 | Level 2 | Level 3 |
| Investment Securities | | | |
| Common Stocks | $1,541,819,375 | — | — |
| Temporary Cash Investments | — | $9,500,000 | — |
| Total Value of Investment Securities | $1,541,819,375 | $9,500,000 | — |
6. Derivative Instruments
Equity Price Risk — The fund is subject to equity price risk in the normal course of pursuing its investment objectives. A fund may enter into futures contracts based on an equity index in order to manage its exposure to changes in market conditions. A fund may purchase futures contracts to gain exposure to increases in market value or sell futures contracts to protect against a decline in market value. Upon entering into a futures contract, a fund is required to deposit either cash or securities in an amount equal to a certain percentage of the contract value (initial margin). Subsequent payments (variation margin) are made or received daily, in cash, by a fund. The variation margin is equal to the daily change in the contract value and is recorded as unrealized gains and losses. A fund recognizes a realized gain or loss whe n the contract is closed or expires. Net realized and unrealized gains or losses occurring during the holding period of futures contracts are a component of net realized gain (loss) on futures contract transactions and change in net unrealized appreciation (depreciation) on futures contracts, respectively. One of the risks of entering into futures contracts is the possibility that the change in value of the contract may not correlate with the changes in value of the underlying securities. During the period, the fund infrequently purchased equity price risk derivative instruments for temporary investment purposes.
At period end, the fund did not have any equity price risk derivative instruments disclosed on the Statement of Assets and Liabilities. For the year ended June 30, 2010, the effect of equity price risk derivative instruments on the Statement of Operations was $(4,099,355) in net realized gain (loss) on futures contract transactions and $23,348 in change in net unrealized appreciation (depreciation) on futures contracts.
23
7. Interfund Lending
The fund, along with certain other funds in the American Century Investments family of funds, may participate in an interfund lending program, pursuant to an Exemptive Order issued by the Securities and Exchange Commission (SEC). This program provides an alternative credit facility allowing the fund to borrow from or lend to other funds in the American Century Investments family of funds that permit such transactions. Interfund lending transactions are subject to each fund’s investment policies and borrowing and lending limits. The interfund loan rate earned/paid on interfund lending transactions is determined daily based on the average of certain current market rates. Interfund lending transactions normally extend only overnight, but can have a maximum duration of seven days. The program is subject to annual approval by the Board of Directors. During the year ended June 30, 2010, the fund did not utilize the program.
8. Federal Tax Information
The tax character of distributions paid during the years ended June 30, 2010 and June 30, 2009 were as follows:
| | |
| | 2010 | 2009 |
| Distributions Paid From | | |
| Ordinary income | $28,299,999 | $56,981,075 |
| Long-term capital gains | — | — |
The book-basis character of distributions made during the year from net investment income or net realized gains may differ from their ultimate characterization for federal income tax purposes. These differences reflect the differing character of certain income items and net realized gains and losses for financial statement and tax purposes, and may result in reclassification among certain capital accounts on the financial statements.
As of June 30, 2010, the federal tax cost of investments and the components of distributable earnings on a tax-basis were as follows:
| | |
| Federal tax cost of investments | $1,498,563,098 |
| Gross tax appreciation of investments | $ 201,569,674 |
| Gross tax depreciation of investments | (148,813,397) |
| Net tax appreciation (depreciation) of investments | $ 52,756,277 |
| Net tax appreciation (depreciation) on derivatives | — |
| Net tax appreciation (depreciation) | $ 52,756,277 |
| Undistributed ordinary income | $197,010 |
| Accumulated capital losses | $(576,631,919) |
The difference between book-basis and tax-basis cost and unrealized appreciation (depreciation) is attributable primarily to the tax deferral of losses on wash sales.
The accumulated capital losses listed above represent net capital loss carryovers that may be used to offset future realized capital gains for federal income tax purposes. Future capital loss carryover utilization in any given year may be subject to Internal Revenue Code limitations. Capital loss carryovers of $(221,057,667) and $(355,574,252) expire in 2017 and 2018, respectively.
24
9. Corporate Event
As part of a long-standing estate and business succession plan established by ACC Co-Chairman James E. Stowers, Jr., the founder of American Century Investments, ACC Co-Chairman Richard W. Brown succeeded Mr. Stowers as trustee of a trust that holds a greater-than-25% voting interest in ACC, the parent corporation of the fund’s advisor. Under the 1940 Act, this is presumed to represent control of ACC even though it is less than a majority interest. The change of trustee may technically be considered a “change of control” of ACC and therefore also a change of control of the fund’s advisor even though there has been no change to its management and none is anticipated. The “change of control” resulted in the assignment of the fund’s investment advisory agreement. Under the 1940 Act, an assignment automatically terminated such agreement, making the approval of a new agreement necessa ry.
On February 18, 2010, the Board of Directors approved an interim investment advisory agreement under which the fund will be managed until a new agreement is approved by fund shareholders. On April 1, 2010, the Board of Directors approved a new investment advisory agreement. The interim agreement and the new agreement are substantially identical to the terminated agreements (with the exception of different effective and termination dates) and will not result in changes in the management of American Century Investments, the fund, its investment objectives, fees or services provided. The new agreement for the fund was approved by shareholders at a Special Meeting of Shareholders on June 16, 2010. The new agreement went into effect on July 16, 2010.
10. Other Tax Information (Unaudited)
The following information is provided pursuant to provisions of the Internal Revenue Code.
The fund hereby designates up to the maximum amount allowable as qualified dividend income for the fiscal year ended June 30, 2010.
For corporate taxpayers, the fund hereby designates $28,299,999, or up to the maximum amount allowable, of ordinary income distributions paid during the fiscal year ended June 30, 2010 as qualified for the corporate dividends received deduction.
25
| | | | | | | |
| Income & Growth | | | | | |
| |
| Investor Class | | | | | | |
| For a Share Outstanding Throughout the Years Ended June 30 (except as noted) | | |
| | | 2010 | 2009 | 2008 | 2007(1) | 2006 | 2005 |
| Per-Share Data | | | | | | |
| Net Asset Value, | | | | | | |
| Beginning of Period | $18.03 | $25.32 | $35.04 | $33.29 | $30.33 | $30.67 |
| Income From | | | | | | |
| Investment Operations | | | | | | |
| Net Investment | | | | | | |
| Income (Loss)(2) | 0.33 | 0.44 | 0.47 | 0.23 | 0.57 | 0.57 |
| Net Realized and | | | | | | |
| Unrealized Gain (Loss) | 1.85 | (7.20) | (6.54) | 2.27 | 4.54 | 0.90 |
| Total From | | | | | | |
| Investment Operations | 2.18 | (6.76) | (6.07) | 2.50 | 5.11 | 1.47 |
| Distributions | | | | | | |
| From Net | | | | | | |
| Investment Income | (0.33) | (0.53) | (0.36) | (0.22) | (0.59) | (0.59) |
| From Net | | | | | | |
| Realized Gains | — | — | (3.29) | (0.53) | (1.56) | (1.22) |
| Total Distributions | (0.33) | (0.53) | (3.65) | (0.75) | (2.15) | (1.81) |
| Net Asset Value, | | | | | | |
| End of Period | $19.88 | $18.03 | $25.32 | $35.04 | $33.29 | $30.33 |
| |
| Total Return(3) | 11.99% | (26.76)% | (18.48)% | 7.67% | 17.17% | 4.79% |
| | | | | | | |
| Ratios/Supplemental Data | | | | | | |
| Ratio of Operating | | | | | | |
| Expenses to | | | | | | |
| Average Net Assets | 0.70% | 0.70% | 0.68% | 0.67%(4) | 0.67% | 0.67% |
| Ratio of Net Investment | | | | | | |
| Income (Loss) to | | | | | | |
| Average Net Assets | 1.58% | 2.27% | 1.53% | 1.37%(4) | 1.81% | 1.86% |
| Portfolio Turnover Rate | 45% | 49% | 57% | 27% | 63% | 70% |
| Net Assets, End of Period | | | | | | |
| (in thousands) | $1,227,234 | $1,281,418 | $2,078,333 | $3,463,508 | $3,578,273 | $3,616,640 |
| (1) | January 1, 2007 through June 30, 2007. The fund’s fiscal year end was changed from December 31 to June 30, resulting in a six-month annual |
| | reporting period. For the years before June 30, 2007, the fund’s fiscal year end was December 31. | | |
| (2) | Computed using average shares outstanding throughout the period. | | | | |
| (3) | Total return assumes reinvestment of net investment income and capital gains distributions, if any. Total returns for periods less than one year |
| | are not annualized. Total returns are calculated based on the net asset value of the last business day. The total return of the classes may not |
| | precisely reflect the class expense differences because of the impact of calculating the net asset values to two decimal places. If net asset |
| | values were calculated to three decimal places, the total return differences would more closely reflect the class expense differences. The |
| | calculation of net asset values to two decimal places is made in accordance with SEC guidelines and does not result in any gain or loss of |
| | value between one class and another. | | | | | |
| (4) | Annualized. | | | | | | |
See Notes to Financial Statements.
26
| | | | | | | |
| Income & Growth | | | | | |
| |
| Institutional Class | | | | | | |
| For a Share Outstanding Throughout the Years Ended June 30 (except as noted) | | |
| | | 2010 | 2009 | 2008 | 2007(1) | 2006 | 2005 |
| Per-Share Data | | | | | | |
| Net Asset Value, | | | | | | |
| Beginning of Period | $18.04 | $25.35 | $35.06 | $33.31 | $30.34 | $30.68 |
| Income From | | | | | | |
| Investment Operations | | | | | | |
| Net Investment | | | | | | |
| Income (Loss)(2) | 0.38 | 0.48 | 0.52 | 0.26 | 0.64 | 0.64 |
| Net Realized and | | | | | | |
| Unrealized Gain (Loss) | 1.85 | (7.21) | (6.53) | 2.28 | 4.54 | 0.89 |
| Total From | | | | | | |
| Investment Operations | 2.23 | (6.73) | (6.01) | 2.54 | 5.18 | 1.53 |
| Distributions | | | | | | |
| From Net | | | | | | |
| Investment Income | (0.38) | (0.58) | (0.41) | (0.26) | (0.65) | (0.65) |
| From Net | | | | | | |
| Realized Gains | — | — | (3.29) | (0.53) | (1.56) | (1.22) |
| Total Distributions | (0.38) | (0.58) | (3.70) | (0.79) | (2.21) | (1.87) |
| Net Asset Value, | | | | | | |
| End of Period | $19.89 | $18.04 | $25.35 | $35.06 | $33.31 | $30.34 |
| |
| Total Return(3) | 12.20% | (26.63)% | (18.32)% | 7.80% | 17.40% | 5.00% |
| | | | | | | |
| Ratios/Supplemental Data | | | | | | |
| Ratio of Operating | | | | | | |
| Expenses to | | | | | | |
| Average Net Assets | 0.50% | 0.50% | 0.48% | 0.47%(4) | 0.47% | 0.47% |
| Ratio of Net Investment | | | | | | |
| Income (Loss) to | | | | | | |
| Average Net Assets | 1.78% | 2.47% | 1.73% | 1.57%(4) | 2.01% | 2.06% |
| Portfolio Turnover Rate | 45% | 49% | 57% | 27% | 63% | 70% |
| Net Assets, End of Period | | | | | | |
| (in thousands) | $197,196 | $268,346 | $538,656 | $442,367 | $487,888 | $477,395 |
| (1) | January 1, 2007 through June 30, 2007. The fund’s fiscal year end was changed from December 31 to June 30, resulting in a six-month annual |
| | reporting period. For the years before June 30, 2007, the fund’s fiscal year end was December 31. | | |
| (2) | Computed using average shares outstanding throughout the period. | | | | |
| (3) | Total return assumes reinvestment of net investment income and capital gains distributions, if any. Total returns for periods less than one year |
| | are not annualized. Total returns are calculated based on the net asset value of the last business day. The total return of the classes may not |
| | precisely reflect the class expense differences because of the impact of calculating the net asset values to two decimal places. If net asset |
| | values were calculated to three decimal places, the total return differences would more closely reflect the class expense differences. The |
| | calculation of net asset values to two decimal places is made in accordance with SEC guidelines and does not result in any gain or loss of |
| | value between one class and another. | | | | | |
| (4) | Annualized. | | | | | | |
See Notes to Financial Statements.
27
| | | | | | | |
| Income & Growth | | | | | |
| |
| A Class(1) | | | | | | |
| For a Share Outstanding Throughout the Years Ended June 30 (except as noted) | | |
| | | 2010 | 2009 | 2008 | 2007(2) | 2006 | 2005 |
| Per-Share Data | | | | | | |
| Net Asset Value, | | | | | | |
| Beginning of Period | $18.01 | $25.28 | $35.01 | $33.27 | $30.31 | $30.65 |
| Income From | | | | | | |
| Investment Operations | | | | | | |
| Net Investment | | | | | | |
| Income (Loss)(3) | 0.28 | 0.40 | 0.39 | 0.19 | 0.49 | 0.49 |
| Net Realized and | | | | | | |
| Unrealized Gain (Loss) | 1.85 | (7.20) | (6.53) | 2.27 | 4.54 | 0.90 |
| Total From | | | | | | |
| Investment Operations | 2.13 | (6.80) | (6.14) | 2.46 | 5.03 | 1.39 |
| Distributions | | | | | | |
| From Net | | | | | | |
| Investment Income | (0.28) | (0.47) | (0.30) | (0.19) | (0.51) | (0.51) |
| From Net | | | | | | |
| Realized Gains | — | — | (3.29) | (0.53) | (1.56) | (1.22) |
| Total Distributions | (0.28) | (0.47) | (3.59) | (0.72) | (2.07) | (1.73) |
| Net Asset Value, | | | | | | |
| End of Period | $19.86 | $18.01 | $25.28 | $35.01 | $33.27 | $30.31 |
| |
| Total Return(4) | 11.72% | (26.95)% | (18.68)% | 7.55% | 16.86% | 4.53% |
| | | | | | | |
| Ratios/Supplemental Data | | | | | | |
| Ratio of Operating | | | | | | |
| Expenses to | | | | | | |
| Average Net Assets | 0.95% | 0.95% | 0.93% | 0.92%(5) | 0.92% | 0.92% |
| Ratio of Net Investment | | | | | | |
| Income (Loss) to | | | | | | |
| Average Net Assets | 1.33% | 2.02% | 1.28% | 1.12%(5) | 1.56% | 1.61% |
| Portfolio Turnover Rate | 45% | 49% | 57% | 27% | 63% | 70% |
| Net Assets, End of Period | | | | | | |
| (in thousands) | $125,981 | $182,331 | $361,500 | $718,533 | $700,335 | $690,379 |
| (1) | Prior to September 4, 2007, the A Class was referred to as the Advisor Class. | | | |
| (2) | January 1, 2007 through June 30, 2007. The fund’s fiscal year end was changed from December 31 to June 30, resulting in a six-month annual |
| | reporting period. For the years before June 30, 2007, the fund’s fiscal year end was December 31. | | |
| (3) | Computed using average shares outstanding throughout the period. | | | | |
| (4) | Total return assumes reinvestment of net investment income and capital gains distributions, if any, and does not reflect applicable sales charges. |
| | Total returns for periods less than one year are not annualized. Total returns are calculated based on the net asset value of the last business day. |
| | The total return of the classes may not precisely reflect the class expense differences because of the impact of calculating the net asset values |
| | to two decimal places. If net asset values were calculated to three decimal places, the total return differences would more closely reflect the |
| | class expense differences. The calculation of net asset values to two decimal places is made in accordance with SEC guidelines and does not |
| | result in any gain or loss of value between one class and another. | | | | |
| (5) | Annualized. | | | | | | |
See Notes to Financial Statements.
28
| | | | |
| Income & Growth | | | |
| |
| B Class | | | |
| For a Share Outstanding Throughout the Years Ended June 30 (except as noted) | | |
| | | 2010 | 2009 | 2008(1) |
| Per-Share Data | | | |
| Net Asset Value, Beginning of Period | $18.03 | $25.26 | $34.36 |
| Income From Investment Operations | | | |
| Net Investment Income (Loss)(2) | 0.12 | 0.24 | 0.12 |
| Net Realized and Unrealized Gain (Loss) | 1.85 | (7.19) | (5.84) |
| Total From Investment Operations | 1.97 | (6.95) | (5.72) |
| Distributions | | | |
| From Net Investment Income | (0.12) | (0.28) | (0.09) |
| From Net Realized Gains | — | — | (3.29) |
| Total Distributions | (0.12) | (0.28) | (3.38) |
| Net Asset Value, End of Period | $19.88 | $18.03 | $25.26 |
| |
| Total Return(3) | 10.88% | (27.49)% | (17.78)% |
| | | | |
| Ratios/Supplemental Data | | | |
| Ratio of Operating Expenses to Average Net Assets | 1.70% | 1.70% | 1.68%(4) |
| Ratio of Net Investment Income (Loss) to Average Net Assets | 0.58% | 1.27% | 0.58%(4) |
| Portfolio Turnover Rate | 45% | 49% | 57%(5) |
| Net Assets, End of Period (in thousands) | $79 | $48 | $33 |
| (1) | September 28, 2007 (commencement of sale) through June 30, 2008. | | | |
| (2) | Computed using average shares outstanding throughout the period. | | | |
| (3) | Total return assumes reinvestment of net investment income and capital gains distributions, if any, and does not reflect applicable sales charges. |
| | Total returns for periods less than one year are not annualized. Total returns are calculated based on the net asset value of the last business day. |
| | The total return of the classes may not precisely reflect the class expense differences because of the impact of calculating the net asset values |
| | to two decimal places. If net asset values were calculated to three decimal places, the total return differences would more closely reflect the |
| | class expense differences. The calculation of net asset values to two decimal places is made in accordance with SEC guidelines and does not |
| | result in any gain or loss of value between one class and another. | | | |
| (4) | Annualized. | | | |
| (5) | Portfolio turnover is calculated at the fund level. Percentage indicated was calculated for the year ended June 30, 2008. | |
See Notes to Financial Statements.
29
| | | | | | | |
| Income & Growth | | | | | |
| |
| C Class | | | | | | |
| For a Share Outstanding Throughout the Years Ended June 30 (except as noted) | | |
| | | 2010 | 2009 | 2008 | 2007(1) | 2006 | 2005 |
| Per-Share Data | | | | | | |
| Net Asset Value, | | | | | | |
| Beginning of Period | $17.99 | $25.20 | $34.98 | $33.25 | $30.29 | $30.64 |
| Income From | | | | | | |
| Investment Operations | | | | | | |
| Net Investment | | | | | | |
| Income (Loss)(2) | 0.12 | 0.24 | 0.16 | 0.06 | 0.26 | 0.27 |
| Net Realized and | | | | | | |
| Unrealized Gain (Loss) | 1.84 | (7.17) | (6.51) | 2.27 | 4.54 | 0.88 |
| Total From | | | | | | |
| Investment Operations | 1.96 | (6.93) | (6.35) | 2.33 | 4.80 | 1.15 |
| Distributions | | | | | | |
| From Net | | | | | | |
| Investment Income | (0.12) | (0.28) | (0.14) | (0.07) | (0.28) | (0.28) |
| From Net | | | | | | |
| Realized Gains | — | — | (3.29) | (0.53) | (1.56) | (1.22) |
| Total Distributions | (0.12) | (0.28) | (3.43) | (0.60) | (1.84) | (1.50) |
| Net Asset Value, | | | | | | |
| End of Period | $19.83 | $17.99 | $25.20 | $34.98 | $33.25 | $30.29 |
| |
| Total Return(3) | 10.85% | (27.48)% | (19.31)% | 7.16% | 16.02% | 3.73% |
| | | | | | | |
| Ratios/Supplemental Data | | | | | | |
| Ratio of Operating | | | | | | |
| Expenses to | | | | | | |
| Average Net Assets | 1.70% | 1.70% | 1.68% | 1.67%(4) | 1.67% | 1.67% |
| Ratio of Net Investment | | | | | | |
| Income (Loss) to | | | | | | |
| Average Net Assets | 0.58% | 1.27% | 0.53% | 0.37%(4) | 0.81% | 0.86% |
| Portfolio Turnover Rate | 45% | 49% | 57% | 27% | 63% | 70% |
| Net Assets, End of Period | | | | | | |
| (in thousands) | $863 | $815 | $1,176 | $1,960 | $1,956 | $2,358 |
| (1) | January 1, 2007 through June 30, 2007. The fund’s fiscal year end was changed from December 31 to June 30, resulting in a six-month annual |
| | reporting period. For the years before June 30, 2007, the fund’s fiscal year end was December 31. | | |
| (2) | Computed using average shares outstanding throughout the period. | | | | |
| (3) | Total return assumes reinvestment of net investment income and capital gains distributions, if any, and does not reflect applicable sales charges. |
| | Total returns for periods less than one year are not annualized. Total returns are calculated based on the net asset value of the last business day. |
| | The total return of the classes may not precisely reflect the class expense differences because of the impact of calculating the net asset values |
| | to two decimal places. If net asset values were calculated to three decimal places, the total return differences would more closely reflect the |
| | class expense differences. The calculation of net asset values to two decimal places is made in accordance with SEC guidelines and does not |
| | result in any gain or loss of value between one class and another. | | | | |
| (4) | Annualized. | | | | | | |
See Notes to Financial Statements.
30
| | | | | | | |
| Income & Growth | | | | | |
| |
| R Class | | | | | | |
| For a Share Outstanding Throughout the Years Ended June 30 (except as noted) | | |
| | | 2010 | 2009 | 2008 | 2007(1) | 2006 | 2005 |
| Per-Share Data | | | | | | |
| Net Asset Value, | | | | | | |
| Beginning of Period | $18.03 | $25.29 | $35.04 | $33.30 | $30.34 | $30.67 |
| Income From | | | | | | |
| Investment Operations | | | | | | |
| Net Investment | | | | | | |
| Income (Loss)(2) | 0.23 | 0.36 | 0.32 | 0.15 | 0.41 | 0.50 |
| Net Realized and | | | | | | |
| Unrealized Gain (Loss) | 1.84 | (7.21) | (6.53) | 2.27 | 4.55 | 0.83 |
| Total From | | | | | | |
| Investment Operations | 2.07 | (6.85) | (6.21) | 2.42 | 4.96 | 1.33 |
| Distributions | | | | | | |
| From Net | | | | | | |
| Investment Income | (0.23) | (0.41) | (0.25) | (0.15) | (0.44) | (0.44) |
| From Net | | | | | | |
| Realized Gains | — | — | (3.29) | (0.53) | (1.56) | (1.22) |
| Total Distributions | (0.23) | (0.41) | (3.54) | (0.68) | (2.00) | (1.66) |
| Net Asset Value, | | | | | | |
| End of Period | $19.87 | $18.03 | $25.29 | $35.04 | $33.30 | $30.34 |
| |
| Total Return(3) | 11.38% | (27.13)% | (18.88)% | 7.42% | 16.56% | 4.31% |
| | | | | | | |
| Ratios/Supplemental Data | | | | | | |
| Ratio of Operating | | | | | | |
| Expenses to | | | | | | |
| Average Net Assets | 1.20% | 1.20% | 1.18% | 1.17%(4) | 1.17% | 1.15%(5) |
| Ratio of Net Investment | | | | | | |
| Income (Loss) to | | | | | | |
| Average Net Assets | 1.08% | 1.77% | 1.03% | 0.87%(4) | 1.31% | 1.38%(5) |
| Portfolio Turnover Rate | 45% | 49% | 57% | 27% | 63% | 70% |
| Net Assets, End of Period | | | | | | |
| (in thousands) | $279 | $176 | $546 | $819 | $660 | $423 |
| (1) | January 1, 2007 through June 30, 2007. The fund’s fiscal year end was changed from December 31 to June 30, resulting in a six-month annual |
| | reporting period. For the years before June 30, 2007, the fund’s fiscal year end was December 31. | | |
| (2) | Computed using average shares outstanding throughout the period. | | | | |
| (3) | Total return assumes reinvestment of net investment income and capital gains distributions, if any. Total returns for periods less than one year |
| | are not annualized. Total returns are calculated based on the net asset value of the last business day. The total return of the classes may not |
| | precisely reflect the class expense differences because of the impact of calculating the net asset values to two decimal places. If net asset |
| | values were calculated to three decimal places, the total return differences would more closely reflect the class expense differences. The |
| | calculation of net asset values to two decimal places is made in accordance with SEC guidelines and does not result in any gain or loss of |
| | value between one class and another. | | | | | |
| (4) | Annualized. | | | | | | |
| (5) | During the year ended December 31, 2005, the class received a partial reimbursement of its distribution and service fee. Had fees not been |
| | reimbursed, the ratio of operating expenses to average net assets and ratio of net investment income (loss) to average net assets would have |
| | been 1.17% and 1.36%, respectively. | | | | | |
See Notes to Financial Statements.
31
|
| Report of Independent Registered Public Accounting Firm |
To the Directors of the American Century Quantitative Equity Funds, Inc.
and Shareholders of the Income & Growth Fund:
In our opinion, the accompanying statement of assets and liabilities, including the schedule of investments, and the related statements of operations and of changes in net assets and the financial highlights present fairly, in all material respects, the financial position of the Income & Growth Fund (one of the eleven funds comprising the American Century Quantitative Equity Funds, Inc., hereafter referred to as the “Fund”) at June 30, 2010, the results of its operations for the year then ended, the changes in its net assets for each of the two years in the period then ended and the financial highlights for each of the periods presented, in conformity with accounting principles generally accepted in the United States of America. These financial statements and financial highlights (hereafter referred to as “financial statements”) are the responsibility of the Fund’s management; our resp onsibility is to express an opinion on these financial statements based on our audits. We conducted our audits of these financial statements in accordance with the standards of the Public Company Accounting Oversight Board (United States). Those standards require that we plan and perform the audit to obtain reasonable assurance about whether the financial statements are free of material misstatement. An audit includes examining, on a test basis, evidence supporting the amounts and disclosures in the financial statements, assessing the accounting principles used and significant estimates made by management, and evaluating the overall financial statement presentation. We believe that our audits, which included confirmation of securities at June 30, 2010 by correspondence with the custodian and brokers, provide a reasonable basis for our opinion.
PricewaterhouseCoopers LLP
Kansas City, Missouri
August 19, 2010
32
A special meeting of shareholders was held on June 16, 2010, to vote on the following proposals. Each proposal received the required number of votes and was adopted. A summary of voting results is listed below each proposal.
Proposal 1:
To elect one Director to the Board of Directors of American Century Quantitative Equity Funds, Inc. (the proposal was voted on by all shareholders of funds issued by American Century Quantitative Equity Funds, Inc.):
| | | |
| Frederick L.A. Grauer | For: | 4,067,909,978 |
| | Withhold: | 174,470,448 |
| | Abstain: | 0 |
| | Broker Non-Vote: | 0 |
The other directors whose term of office continued after the meeting include Jonathan S. Thomas, John Freidenrich, Ronald J. Gilson, Peter F. Pervere, Myron S. Scholes, and John B. Shoven.
Proposal 2:
To approve a management agreement between the fund and American Century Investment Management, Inc.:
| | | |
| Investor, A, B, C and R Classes | For: | 945,860,814 |
| | Against: | 17,666,860 |
| | Abstain: | 25,115,309 |
| | Broker Non-Vote: | 76,890,609 |
| |
| Institutional Class | For: | 177,664,811 |
| | Against: | 2,233,086 |
| | Abstain: | 112,316 |
| | Broker Non-Vote: | 10,940,669 |
33
The Board of Directors
The individuals listed below serve as directors of the fund. Each director will continue to serve in this capacity until death, retirement, resignation or removal from office. The mandatory retirement age for directors who are not “interested persons,” as that term is defined in the Investment Company Act (independent directors), is 73. However, the mandatory retirement age may be extended for a period not to exceed two years with the approval of the remaining independent directors.
Mr. Thomas is the only director who is an “interested person” because he currently serves as President and Chief Executive Officer of American Century Companies, Inc. (ACC), the parent company of American Century Investment Management, Inc. (ACIM or the advisor).
The other directors (more than three-fourths of the total number) are independent; that is, they have never been employees, directors or officers of, and have no financial interest in, ACC or any of its wholly owned, direct or indirect, subsidiaries, including ACIM, American Century Investment Services, Inc. (ACIS) and American Century Services, LLC (ACS). The directors serve in this capacity for eight (in the case of Mr. Thomas, 15) registered investment companies in the American Century Investments family of funds.
The following presents additional information about the directors. The mailing address for each director other than Mr. Thomas is 1665 Charleston Road, Mountain View, California 94043. The mailing address for Mr. Thomas is 4500 Main Street, Kansas City, Missouri 64111.
Independent Directors
John Freidenrich
Year of Birth: 1937
Position(s) with the Fund: Director
Length of Time Served: Since 2005
Principal Occupation(s) During the Past Five Years: Founder, Member and Manager, Regis
Management Company, LLC (investment management firm) (April 2004 to present)
Number of Funds in Fund Complex Overseen by Director: 41
Other Directorships Held by Director During the Past Five Years: None
Education/Other Professional Experience: AB in Economics, Stanford University; LLB,
Stanford Law School; formerly, Partner and Founder, Ware and Freidenrich Law
Firm and Bay Partners; formerly, President, Board of Trustees, Stanford University
Ronald J. Gilson
Year of Birth: 1946
Position(s) with the Fund: Director and Chairman of the Board
Length of Time Served: Since 1995
Principal Occupation(s) During the Past Five Years: Charles J. Meyers Professor of Law and
Business, Stanford Law School (1979 to present); Marc and Eva Stern Professor of
Law and Business, Columbia University School of Law (1992 to present)
Number of Funds in Fund Complex Overseen by Director: 41
Other Directorships Held by Director During the Past Five Years: None
Education/Other Professional Experience: BA, Washington University; JD, Yale Law School;
formerly, Attorney, Steinhart, Goldberg, Feigenbaum & Ladar
34
Frederick L. A. Grauer
Year of Birth: 1946
Position(s) with the Fund: Director
Length of Time Served: Since 2008
Principal Occupation(s) During the Past Five Years: Senior Advisor, BlackRock, Inc. (investment
management firm) (2010 to present); Senior Advisor, Barclays Global Investors
(investment management firm) (2003 to 2009)
Number of Funds in Fund Complex Overseen by Director: 41
Other Directorships Held by Director During the Past Five Years: None
Education/Other Professional Experience: BA in Economics, University of British Columbia;
MA in Economics, University of Chicago; PhD in Business, Stanford University;
formerly, Executive Chairman, Barclays Global Investors; Chairman and Chief
Executive Officer, Wells Fargo Nikko Investment Advisors; and Vice President,
Merrill Lynch Capital Markets Group; formerly, Director, New York Stock Exchange,
Chicago Mercantile Exchange and Columbia University; formerly, Faculty Member,
Graduate School of Business, Columbia University and Alfred P. Sloan School of
Management, Massachusetts Institute of Technology
Peter F. Pervere
Year of Birth: 1947
Position(s) with the Fund: Director
Length of Time Served: Since 2007
Principal Occupation(s) During the Past Five Years: Retired
Number of Funds in Fund Complex Overseen by Director: 41
Other Directorships Held by Director During the Past Five Years: Intraware, Inc. (2003 to 2009);
Digital Impact, Inc. (2003 to 2005)
Education/Other Professional Experience: BA in History, Stanford University; CPA; formerly,
Vice President and Chief Financial Officer, Commerce One, Inc. (software and
services provider); formerly, Vice President and Corporate Controller, Sybase, Inc.;
formerly with accounting firm of Arthur Young & Co.
Myron S. Scholes
Year of Birth: 1941
Position(s) with the Fund: Director
Length of Time Served: Since 1980
Principal Occupation(s) During the Past Five Years: Chairman, Platinum Grove Asset
Management, L.P. (asset manager) (1999 to 2009); Frank E. Buck Professor of
Finance-Emeritus, Stanford Graduate School of Business (1996 to present)
Number of Funds in Fund Complex Overseen by Director: 41
Other Directorships Held by Director During the Past Five Years: Dimensional Fund Advisors
(investment advisor); CME Group, Inc. (futures and options exchange)
Education/Other Professional Experience: BA in Economics, McMaster University (Ontario);
MBA and PhD, University of Chicago; formerly, Senior Research Fellow at the
Hoover Institute; formerly, Edward Eagle Brown Professor of Finance, University of
Chicago; recipient of the Alfred Nobel Memorial Prize in Economic Sciences
35
John B. Shoven
Year of Birth: 1947
Position(s) with the Fund: Director
Length of Time Served: Since 2002
Principal Occupation(s) During the Past Five Years: Professor of Economics, Stanford University
(1973 to present)
Number of Funds in Fund Complex Overseen by Director: 41
Other Directorships Held by Director During the Past Five Years: Cadence Design Systems;
Exponent; Financial Engines; PalmSource, Inc. (2002 to 2005); Watson Wyatt
Worldwide (2002 to 2006)
Education/Other Professional Experience: BA in Physics, University of California; PhD in
Economics, Yale University; Director of the Stanford Institute for Economic Policy
Research (1999 to present); formerly, Chair of Economics and Dean of Humanities
and Sciences, Stanford University
Interested Director
Jonathan S. Thomas
Year of Birth: 1963
Position(s) with the Fund: Director and President
Length of Time Served: Since 2007
Principal Occupation(s) During the Past Five Years: President and Chief Executive Officer,
ACC (March 2007 to present); Chief Administrative Officer, ACC (February 2006 to
February 2007); Executive Vice President, ACC (November 2005 to February 2007);
Global Chief Operating Officer and Managing Director, Morgan Stanley (investment
management) (March 2000 to November 2005). Also serves as: Chief Executive
Officer and Manager, ACS; Executive Vice President, ACIM; Director, ACC, ACIM
and other ACC subsidiaries
Number of Funds in Fund Complex Overseen by Director: 104
Other Directorships Held by Director During the Past Five Years: None
Education/Other Professional Experience: BA in Economics, University of Massachusetts;
MBA, Boston College; formerly held senior leadership roles with Fidelity
Investments, Boston Financial Services and Bank of America; serves on the Board of
Governors of the Investment Company Institute
36
Officers
The following table presents certain information about the executive officers of the fund. Each officer serves as an officer for each of the 15 investment companies in the American Century family of funds, unless otherwise noted. No officer is compensated for his or her service as an officer of the fund. The listed officers are interested persons of the fund and are appointed or re-appointed on an annual basis. The mailing address for each of the officers listed below is 4500 Main Street, Kansas City, Missouri 64111.
| | |
| Name | Offices with | |
| (Year of Birth) | the Fund | Principal Occupation(s) During the Past Five Years |
| Jonathan S. | Director and | President and Chief Executive Officer, ACC (March 2007 to present); Chief |
| Thomas | President | Administrative Officer, ACC (February 2006 to February 2007); Executive Vice |
| (1963) | since 2007 | President, ACC (November 2005 to February 2007); Global Chief Operating |
| | | Officer and Managing Director, Morgan Stanley (March 2000 to November |
| | | 2005). Also serves as: Chief Executive Officer and Manager, ACS; Executive |
| | | Vice President, ACIM; Director, ACC, ACIM and other ACC subsidiaries |
| Barry Fink | Executive Vice | Chief Operating Officer and Executive Vice President, ACC (September 2007 |
| (1955) | President | to present); President, ACS (October 2007 to present); Managing Director, |
| | since 2007 | Morgan Stanley (2000 to 2007); Global General Counsel, Morgan Stanley |
| | | (2000 to 2006). Also serves as: Manager, ACS, and Director, ACC and |
| | | certain ACC subsidiaries |
| Maryanne L. | Chief Compliance | Chief Compliance Officer, American Century funds, ACIM and ACS (August |
| Roepke | Officer since 2006 | 2006 to present); Assistant Treasurer, ACC (January 1995 to August 2006); |
| (1956) | and Senior Vice | and Treasurer and Chief Financial Officer, various American Century funds |
| | President | (July 2000 to August 2006). Also serves as: Senior Vice President, ACS |
| | since 2000 | |
| Charles A. | General Counsel | Attorney, ACC (February 1994 to present); Vice President, ACC (November |
| Etherington | since 2007 and | 2005 to present); General Counsel, ACC (March 2007 to present); Also |
| (1957) | Senior Vice | serves as General Counsel, ACIM, ACS, ACIS and other ACC subsidiaries; |
| | President | and Senior Vice President, ACIM and ACS |
| | since 2006 | |
| Robert J. Leach | Vice President, | Vice President, ACS (February 2000 to present); and Controller, various |
| (1966) | Treasurer and | American Century funds (1997 to September 2006) |
| | Chief Financial | |
| | Officer since 2006 | |
| David H. Reinmiller | Vice President | Attorney, ACC (January 1994 to present); Associate General Counsel, ACC |
| (1963) | since 2001 | (January 2001 to present); Chief Compliance Officer, American Century |
| | | funds and ACIM (January 2001 to February 2005). Also serves as: Vice |
| | | President, ACIM and ACS |
| Ward D. Stauffer | Secretary | Attorney, ACC (June 2003 to Present) |
| (1960) | since 2005 | |
The SAI has additional information about the fund’s directors and is available without charge, upon request, by calling 1-800-345-2021.
37
|
| Board Approval of Management Agreements |
American Century Investment Management, Inc. (“ACIM” or the “Advisor”) currently serves as investment advisor to the Fund under a management agreement (the “Current Management Agreement”) that took effect on July 16, 2010, following approval by the Fund’s Board of Directors (the “Board”) and shareholders. The Advisor previously served as investment advisor to the Fund pursuant to a prior management agreement (the “Prior Management Agreement”) and an interim management agreement (the “Interim Management Agreeement”). The Interim Management Agreement terminated in accordance with its terms on July 16, 2010, upon the effectiveness of the Current Management Agreement. The Prior Management Agreement terminated on February 16, 2010, as a result of a change of control of the Advisor’s parent company, American Century Companies, Inc. (“ACC”). The change in control occurred as the result of a change in the trustee of a trust created by James E. Stowers, Jr., the founder of American Century Investments that holds shares representing a significant interest in ACC stock. Mr. Stowers previously served as the trustee of the trust. On February 16, 2010, Richard W. Brown, Co-Chairman of ACC with Mr. Stowers, became the trustee in accordance with the terms of the trust and Mr. Stowers’ long-standing estate and succession plan.
On February 18, 2010, the Board approved the Interim Management Agreement in accordance with Rule 15a-4 under the Investment Company Act to ensure continued management of the Fund by the Advisor after the termination of the Prior Management Agreement and until shareholder approval of the Current Management Agreement as required under the Act. The Board approved the Current Management Agreement and recommended its approval to shareholders. Fund shareholders approved the Current Management Agreement at a meeting held on June 16, 2010.
The Interim Management Agreement and the Current Management Agreement are substantially identical to the Prior Management Agreement except for their effective dates and the termination provisions of the Interim Management Agreement. Under the Interim and Current Management Agreements, the Advisor will provide the same services to the Fund and receive the same compensation rate as under the Prior Management Agreement.
Basis for Board Approval of Interim Management Agreement
In considering the approval of the Interim Management Agreement, Rule 15a-4 requires the Board to approve the contract within ten business days of the termination of the prior agreement and to determine that the compensation to be received under the interim agreement is no greater than would have been received under the prior agreement. In connection with the approval, the Board noted that it oversees on a continuous basis and evaluates at its quarterly meetings, directly and through the committees of the Board, the nature and quality of significant services provided by the Advisor, the investment performance of the Fund, shareholder services, audit and compliance functions and a variety of other matters relating to the Fund’s operations.
38
In evaluating the Interim Management Agreement, the Board, assisted by the advice of its independent legal counsel, considered a number of factors in addition to those required by the rule with no one factor being determinative to its analysis. Among the factors considered by the Board were the circumstances and effect of the change of control, the fact that the Advisor will provide the same services and receive the same compensation rate as under the Prior Management Agreement, and that the change of control did not result in a change of the personnel managing the Fund. Upon completion of its analysis, the Board approved the Interim Management Agreement, determining that the continued management of the Fund by the Advisor was in the best interests of the Fund and Fund shareholders.
Basis for Board Approval of Current Management Agreement
At a meeting held on April 1, 2010, after considering all information presented, the Board approved, and determined to recommend that shareholders approve, the Current Management Agreement. In connection with that approval, the Board requested and reviewed extensive data and information compiled by the Advisor and certain independent providers of evaluation data concerning the Fund and services provided to the Fund by the Advisor. The Board oversees on a continuous basis and evaluates at its quarterly meetings, directly and through the committees of the Board, the nature and quality of significant services provided by the Advisor, the investment performance of the Fund, shareholder services, audit and compliance functions and a variety of other matters relating to the Fund’s operations. The information considered and the discussions held at the meetings included, but were not limited to:
• the nature, extent and quality of investment management, shareholder services and other services provided to the Fund;
• the wide range of programs and services the Advisor provides to the Fund and its shareholders on a routine and non-routine basis;
• the compliance policies, procedures, and regulatory experience of the Advisor;
• data comparing the cost of owning the Fund to the cost of owning similar funds;
• the fact that there will be no changes to the fees, services, or personnel who provide such services as compared to the Prior Management Agreement;
• data comparing the Fund’s performance to appropriate benchmarks and/or a peer group of other mutual funds with similar investment objectives and strategies;
• financial data showing the profitability of the Fund to the Advisor and the overall profitability of the Advisor;
• data comparing services provided and charges to the Fund with those for other non-fund investment management clients of the Advisor; and
39
• consideration of collateral or “fall-out” benefits derived by the Advisor from the management of the Fund and potential sharing of economies of scale in connection with the management of the Fund.
The Board also considered whether there was any reason for not continuing the existing arrangement with the Advisor. In particular, the Board recognized that shareholders may have invested in the Fund on the strength of the Advisor’s industry standing and reputation and in the expectation that the Advisor will have a continuing role in providing advisory services to the Fund.
The Board considered all of the information provided by the Advisor, the independent data providers, and the Board’s independent legal counsel, and evaluated such information for the Fund. The Board did not identify any single factor as being all-important or controlling, and each Board member may have attributed different levels of importance to different factors. In deciding to approve the Current Management Agreement under the terms ultimately determined by the Board to be appropriate, the Board based its decision on a number of factors, including the following:
Nature, Extent and Quality of Services — Generally. Under the Current Management Agreement, the Advisor is responsible for providing or arranging for all services necessary for the operation of the Fund. The Board noted that under the Current Management Agreement, the Advisor provides or arranges at its own expense a wide variety of services including:
• constructing and designing the Fund
• portfolio research and security selection
• initial capitalization/funding
• securities trading
• Fund administration
• custody of Fund assets
• daily valuation of the Fund’s portfolio
• shareholder servicing and transfer agency, including shareholder
confirmations, recordkeeping and communications
• legal services
• regulatory and portfolio compliance
• financial reporting
• marketing and distribution
40
The Board noted that many of these services have expanded over time both in terms of quantity and complexity in response to shareholder demands, competition in the industry, changing distribution channels and the changing regulatory environment.
Investment Management Services. The investment management services provided to the Fund are complex and provide Fund shareholders access to professional money management, instant diversification of their investments within an asset class, the opportunity to easily diversify among asset classes, and liquidity. As a part of its general oversight and in evaluating investment performance, the Board expects the Advisor to manage the Fund in accordance with its investment objectives and approved strategies. In providing these services, the Advisor utilizes teams of investment professionals who require extensive information technology, research, training, compliance and other systems to conduct their business. The Board, directly and through its Portfolio Committee, regularly reviews investment performance information for the Fund, t ogether with comparative information for appropriate benchmarks and/or peer groups of similarly-managed funds, over different time horizons. If performance concerns are identified, the underperforming Fund receives special reviews until performance improves, during which time the Board discusses with the Advisor the reasons for such underperformance and any efforts being undertaken to improve performance.
Shareholder and Other Services. Under the Current Management Agreement, the Advisor will also provide the Fund with a comprehensive package of transfer agency, shareholder, and other services. The Board, directly and through the various committees of the Board, regularly reviews reports and evaluations of such services. These reports include, but are not limited to, information regarding the operational efficiency and accuracy of the shareholder and transfer agency services provided, staffing levels, shareholder satisfaction (as measured by external as well as internal sources), technology support, new products and services offered to Fund shareholders, securities trading activities, portfolio valuation services, auditing services, and legal and operational compliance activities. Certain aspects of shareholder and transfer age ncy service level efficiency and the quality of securities trading activities are measured by independent third party providers and are presented in comparison to other fund groups not managed by the Advisor.
Costs of Services Provided and Profitability. The Advisor provided detailed information concerning its cost of providing various services to the Fund, its profitability in managing the Fund, its overall profitability, and its financial condition. The Board reviewed with the Advisor the methodology used to prepare this financial information. The Board has also reviewed with the Advisor its methodology for compensating the investment professionals that provide services to the Fund as well as compensation to the five highest paid personnel of the Advisor. This financial information regarding the Advisor is considered in order to evaluate the Advisor’s financial condition, its ability to continue to provide services under the Current Management Agreement, and the reasonableness of the current management fees.
41
Ethics. The Board generally considers the Advisor’s commitment to providing quality services to shareholders and to conducting its business ethically. It noted that the Advisor’s practices generally meet or exceed industry best practices.
Economies of Scale. The Board also reviewed information provided by the Advisor regarding the possible existence of economies of scale in connection with the management of the Fund. The Board concluded that economies of scale are difficult to measure and predict with precision, especially on a fund-by-fund basis. The analysis of economies of scale is further complicated by the additional services and content provided by the Advisor and its reinvestment in its ability to provide and expand those services. Accordingly, the Board seeks to evaluate economies of scale by reviewing information, such as year-over-year profitability of the Advisor generally, the profitability of its management of the Fund specifically, and the expenses incurred by the Advisor in providing various functions to the Fund. The Board believes the Advisor i s appropriately sharing economies of scale through its competitive fee structure, offering competitive fees from fund inception, fee breakpoints as the fund complex and the Fund increases in size, and through reinvestment in its business to provide shareholders additional services and enhancements to existing services. In particular, separate breakpoint schedules based on the size of the entire fund complex and on the size of the Fund reflect the complexity of assessing economies of scale.
Comparison to Fees of Funds not Managed by the Advisor. Both the Prior and Current Management Agreements provide that the Fund pays the Advisor a single, all-inclusive (or unified) management fee for providing all services necessary for the management and operation of the Fund, other than brokerage expenses, taxes, interest, extraordinary expenses, and the fees and expenses of the Fund’s Independent Directors (including their independent legal counsel) and expenses incurred in connection with the provision of shareholder services and distribution services under a plan adopted pursuant to Rule 12b-1 under the 1940 Act. Under the unified fee structure, the Advisor is responsible for providing all investment advisory, custody, audit, administrative, compliance, recordkeeping, marketing and shareholder services, or arranging and supervising third parties that provide such services. By contrast, most other funds are charged a variety of fees, including an investment advisory fee, a transfer agency fee, an administrative fee, distribution charges and other expenses. Other than their investment advisory fees and any applicable Rule 12b-1 distribution fees, the components of the total fees charged by these other funds may be increased without shareholder approval. The Board believes the unified fee structure is a benefit to Fund shareholders because it clearly discloses to shareholders the cost of owning Fund shares, and, since the unified fee cannot be increased without a vote of Fund shareholders, it shifts to the Advisor the risk of increased costs of operating the Fund and provides a direct incentive to minimize administrative inefficiencies. Part of the Board’s analysis of fee levels involves reviewing certain evaluative data compiled by an independent provider comparing the Fund’s unified fee to
42
the total expense ratios of similar funds not managed by the Advisor. The Board concluded that the management fee to be paid by the Fund to the Advisor under the Current Management Agreement is reasonable in light of the services to be provided to the Fund.
Comparison to Fees and Services Provided to Other Clients of the Advisor. The Board also requested and received information from the Advisor concerning the nature and extent of the services, fees, and profitability of its advisory services to advisory clients other than the Fund. They observed that these varying types of client accounts require different services and involve different regulatory and entrepreneurial risks than the management of the Fund. The Board analyzed this information and concluded that the fees charged and services provided to the Fund were reasonable by comparison.
Collateral or “Fall-Out” Benefits Derived by the Advisor. The Board considered the existence of collateral benefits the Advisor may receive as a result of its relationship with the Fund. The Board concluded that the Advisor’s primary business is managing mutual funds and it generally does not use Fund or shareholder information to generate profits in other lines of business, and therefore does not derive any significant collateral benefits from them. The Board noted that the Advisor receives proprietary research from broker-dealers that execute Fund portfolio transactions and concluded that this research is likely to benefit Fund shareholders. The Board also determined that the Advisor is able to provide investment management services to certain clients other than the Fund, at least in part, due to its existing infrastructure built to serve the fund complex. The Board concluded, however, that the assets of those other clients are not material to the analysis and, in any event, are included with the assets of the Fund to determine breakpoints in the Fund’s fee schedule, provided they are managed using the same investment team and strategy.
Conclusion of the Board. As a result of this process, the Board, in the absence of particular circumstances and assisted by the advice of its independent legal counsel, taking into account all of the factors discussed above and the information provided by the Advisor and others, concluded that the Current Management Agreement be approved and recommended its approval to Fund shareholders.
43
Retirement Account Information
As required by law, distributions you receive from certain IRAs, or 403(b), 457 and qualified plans are subject to federal income tax withholding, unless you elect not to have withholding apply. Tax will be withheld on the total amount withdrawn even though you may be receiving amounts that are not subject to withholding, such as nondeductible contributions. In such case, excess amounts of withholding could occur. You may adjust your withholding election so that a greater or lesser amount will be withheld.
If you don’t want us to withhold on this amount, you must notify us to not withhold the federal income tax. You may notify us in writing or in certain situations by telephone or through other electronic means. You have the right to revoke your withholding election at any time and any election you make may remain in effect until revoked by filing a new election.
Remember, even if you elect not to have income tax withheld, you are liable for paying income tax on the taxable portion of your withdrawal. If you elect not to have income tax withheld or you don’t have enough income tax withheld, you may be responsible for payment of estimated tax. You may incur penalties under the estimated tax rules if your withholding and estimated tax payments are not sufficient. You can reduce or defer the income tax on a distribution by directly or indirectly rolling such distribution over to another IRA or eligible plan. You should consult your tax advisor for additional information.
State tax will be withheld if, at the time of your distribution, your address is within one of the mandatory withholding states and you have federal income tax withheld. State taxes will be withheld from your distribution in accordance with the respective state rules.
Proxy Voting Guidelines
American Century Investment Management, Inc., the fund’s investment advisor, is responsible for exercising the voting rights associated with the securities purchased and/or held by the fund. A description of the policies and procedures the advisor uses in fulfilling this responsibility is available without charge, upon request, by calling 1-800-345-2021. It is also available on American Century Investments’ website at americancentury.com and on the Securities and Exchange Commission’s website at sec.gov. Information regarding how the investment advisor voted proxies relating to portfolio securities during the most recent 12-month period ended June 30 is available on the “About Us” page at americancentury.com. It is also available at sec.gov.
Quarterly Portfolio Disclosure
The fund files its complete schedule of portfolio holdings with the Securities and Exchange Commission (SEC) for the first and third quarters of each fiscal year on Form N-Q. The fund’s Forms N-Q are available on the SEC’s website at sec.gov, and may be reviewed and copied at the SEC’s Public Reference Room in Washington, DC. Information on the operation of the Public Reference Room may be obtained by calling 1-800-SEC-0330. The fund also makes its complete schedule of portfolio holdings for the most recent quarter of its fiscal year available on its website at americancentury.com and, upon request, by calling 1-800-345-2021.
44
The following indices are used to illustrate investment market, sector, or style performance or to serve as fund performance comparisons. They are not investment products available for purchase.
The Russell 1000® Index is a market-capitalization weighted, large-cap index created by Frank Russell Company to measure the performance of the 1,000 largest publicly traded U.S. companies, based on total market capitalization.
The Russell 1000® Growth Index measures the performance of those Russell 1000 Index companies (the 1,000 largest publicly traded U.S. companies, based on total market capitalization) with higher price-to-book ratios and higher forecasted growth values.
The Russell 1000® Value Index measures the performance of those Russell 1000 Index companies (the 1,000 largest publicly traded U.S. companies, based on total market capitalization) with lower price-to-book ratios and lower forecasted growth values.
The Russell 2000® Index is a market-capitalization weighted index created by Frank Russell Company to measure the performance of the 2,000 smallest of the 3,000 largest publicly traded U.S. companies, based on total market capitalization.
The Russell 2000® Growth Index measures the performance of those Russell 2000 Index companies (the 2,000 smallest of the 3,000 largest publicly traded U.S. companies, based on total market capitalization) with higher price-to-book ratios and higher forecasted growth values.
The Russell 2000® Value Index measures the performance of those Russell 2000 Index companies (the 2,000 smallest of the 3,000 largest publicly traded U.S. companies, based on total market capitalization) with lower price-to-book ratios and lower forecasted growth values.
The Russell Midcap® Index measures the performance of the 800 smallest of the 1,000 largest publicly traded U.S. companies, based on total market capitalization.
The Russell Midcap® Growth Index measures the performance of those Russell Midcap Index companies (the 800 smallest of the 1,000 largest publicly traded U.S. companies, based on total market capitalization) with higher price-to-book ratios and higher forecasted growth values.
The Russell Midcap® Value Index measures the performance of those Russell Midcap Index companies (the 800 smallest of the 1,000 largest publicly traded U.S. companies, based on total market capitalization) with lower price-to-book ratios and lower forecasted growth values.
The S&P 500 Index is a market value-weighted index of the stocks of 500 publicly traded U.S. companies chosen for market size, liquidity, and industry group representation that are considered to be leading firms in dominant industries. Each stock’s weight in the index is proportionate to its market value. Created by Standard & Poor’s, it is considered to be a broad measure of U.S. stock market performance.
45
46
47
48

| |
| |
| Contact Us | |
| americancentury.com | |
| Automated Information Line | 1-800-345-8765 |
| Investor Services Representative | 1-800-345-2021 or |
| | 816-531-5575 |
| Investors Using Advisors | 1-800-378-9878 |
| Business, Not-For-Profit, Employer-Sponsored | |
| Retirement Plans | 1-800-345-3533 |
| Banks and Trust Companies, Broker-Dealers, | |
| Financial Professionals, Insurance Companies | 1-800-345-6488 |
| Telecommunications Device for the Deaf | 1-800-634-4113 |
| American Century Quantitative Equity Funds, Inc. | |
| Investment Advisor: | |
| American Century Investment Management, Inc. | |
| Kansas City, Missouri | |
This report and the statements it contains are submitted for the general
information of our shareholders. The report is not authorized for distribution to
prospective investors unless preceded or accompanied by an effective prospectus.
American Century Investment Services, Inc., Distributor
©2010 American Century Proprietary Holdings, Inc. All rights reserved.
1008
CL-ANN-69051
|
| Annual Report |
| June 30, 2010 |

|
| American Century Investments® |
Small Company Fund
| |
| President’s Letter | 2 |
| Market Perspective | 3 |
| U.S. Stock Index Returns | 3 |
| |
| Small Company | |
| |
| Performance | 4 |
| Portfolio Commentary | 6 |
| Top Ten Holdings | 8 |
| Five Largest Overweights | 8 |
| Five Largest Underweights. | 8 |
| Types of Investments in Portfolio | 8 |
| |
| Shareholder Fee Example | 9 |
| |
| Financial Statements | |
| |
| Schedule of Investments | 11 |
| Statement of Assets and Liabilities | 19 |
| Statement of Operations | 20 |
| Statement of Changes in Net Assets | 21 |
| Notes to Financial Statements | 22 |
| Financial Highlights | 29 |
| Report of Independent Registered Public Accounting Firm | 34 |
| |
| Other Information | |
| |
| Proxy Voting Results | 35 |
| Management | 36 |
| Board Approval of Management Agreements | 40 |
| Additional Information | 46 |
| Index Definitions | 47 |
Any opinions expressed in this report reflect those of the author as of the date of the report, and do not necessarily represent the opinions of American Century Investments or any other person in the American Century Investments organization. Any such opinions are subject to change at any time based upon market or other conditions and American Century Investments disclaims any responsibility to update such opinions. These opinions may not be relied upon as investment advice and, because investment decisions made by American Century Investments funds are based on numerous factors, may not be relied upon as an indication of trading intent on behalf of any American Century Investments fund. Security examples are used for representational purposes only and are not intended as recommendations to purchase or sell securities. Performance information for comparative indices and securities is provided to American Century Investments by third party vendors. To the best of American Century Investments’ knowledge, such information is accurate at the time of printing.

Dear Investor:
To learn more about the capital markets, your investment, and the portfolio management strategies American Century Investments provides, we encourage you to review this shareholder report for the financial reporting period ended June 30, 2010.
On the following pages, you will find investment performance and portfolio information, presented with the expert perspective and commentary of our portfolio management team. This report remains one of our most important vehicles for conveying the information you need about your investment performance, and about the market factors and strategies that affect fund returns. For additional information on the markets, we encourage you to visit the “Insights & News” tab at our Web site, americancentury.com, for updates and further expert commentary.
The top of our Web site’s home page also provides a link to “Our Story,” which, first and foremost, outlines our commitment—since 1958—to helping clients reach their financial goals. We believe strongly that we will only be successful when our clients are successful. That’s who we are.
Another important, unique facet of our story and who we are is “Profits with a Purpose,” which describes our bond with the Stowers Institute for Medical Research (SIMR). SIMR is a world-class biomedical organization—founded by our company founder James E. Stowers, Jr. and his wife Virginia—that is dedicated to researching the causes, treatment, and prevention of gene-based diseases, including cancer. Through American Century Investments’ private ownership structure, more than 40% of our profits support SIMR.
Mr. Stowers’ example of achieving financial success and using that platform to help humanity motivates our entire American Century Investments team. His story inspires us to help each of our clients achieve success. Thank you for sharing your financial journey with us.
Sincerely,

Jonathan Thomas
President and Chief Executive Officer
American Century Investments
2

By Scott Wittman, Chief Investment Officer, Quantitative Equity and Asset Allocation
Stocks Rallied as Economy Improved
U.S. stocks posted double-digit gains for the 12 months ended June 30, 2010, thanks largely to improving economic conditions and unexpectedly strong corporate earnings. As the period began, the U.S. economy was starting to show early signs of recovery following a sharp downturn in late 2008 and early 2009. Led by improving results in manufacturing activity, housing, and consumer spending, the economy posted positive growth in the third and fourth quarters of 2009 after four consecutive quarters of declining output. By the first quarter of 2010, jobs data turned positive, providing further evidence of a burgeoning economic recovery.
In addition, corporate profits consistently exceeded expectations as many companies implemented stringent cost-management programs that helped boost profit margins. Rising demand for delayed big-ticket purchases, such as cars and appliances, also contributed to stronger earnings. As a result, stocks rose steadily for much of the period, with the major equity indices advancing by more than 30% from the beginning of the period through April 30, 2010.
Growing Uncertainty Led to Late Decline
Market conditions changed abruptly in the last two months of the period as persistent worries about sovereign debt problems in Europe and questions about the sustainability of the domestic economic recovery (validated to some degree by weaker economic data late in the period) weighed on investor confidence. With these headwinds, the equity market peaked in late April and then reversed direction in May and June. In addition, market volatility increased dramatically—the S&P 500 Index moved up or down by more than 1% on nearly half of the trading days in the second quarter of 2010.
Although stocks gave back a notable portion of their gains late in the period, the broad market indices returned approximately 15% overall for the 12 months. Mid- and small-cap stocks posted the best returns (see the table below), outpacing large-cap shares, while value stocks outperformed growth-oriented issues across all market capitalizations.
| | | | |
| U.S. Stock Index Returns | | | | |
| For the 12 months ended June 30, 2010 | | | | |
| Russell 1000 Index (Large-Cap) | 15.24% | | Russell 2000 Index (Small-Cap) | 21.48% |
| Russell 1000 Value Index | 16.92% | | Russell 2000 Value Index | 25.07% |
| Russell 1000 Growth Index | 13.62% | | Russell 2000 Growth Index | 17.96% |
| Russell Midcap Index | 25.13% | | | |
| Russell Midcap Value Index | 28.91% | | | |
| Russell Midcap Growth Index | 21.30% | | | |
3
| | | | | | |
| Small Company | | | | | | |
| |
| Total Returns as of June 30, 2010 | | | | | |
| | | | Average Annual Returns | |
| | Ticker | | | | Since | Inception |
| | Symbol | 1 year | 5 years | 10 years | Inception | Date |
| Investor Class | ASQIX | 23.39% | -4.79% | 4.56% | 5.45% | 7/31/98 |
| S&P SmallCap 600 Index | — | 23.64% | 0.82% | 5.56% | 6.33% | — |
| Institutional Class | ASCQX | 23.87% | -4.57% | 4.79% | 6.72% | 10/1/99 |
| A Class(1) | ASQAX | | | | | 9/7/00 |
| No sales charge* | | 23.40% | -5.01% | — | 3.86% | |
| With sales charge* | | 16.29% | -6.13% | — | 3.23% | |
| C Class | ASQCX | | | | | 3/1/10 |
| No sales charge* | | — | — | — | -4.22%(2) | |
| With sales charge* | | — | — | — | -5.18%(2) | |
| R Class | ASCRX | 22.90% | -5.26% | — | 2.39% | 8/29/03 |
| *Sales charges include initial sales charges and contingent deferred sales charges (CDSCs), as applicable. A Class shares have a |
| maximum 5.75% initial sales charge and may be subject to a maximum CDSC of 1.00%. C Class shares redeemed within 12 months |
| of purchase are subject to a maximum CDSC of 1.00%. The SEC requires that mutual funds provide performance information net of |
| maximum sales charges in all cases where charges could be applied. | | | | |
| |
| (1) | Prior to March 1, 2010, the A Class was referred to as the Advisor Class and did not have a front-end sales charge. Performance prior to that |
| | date has been adjusted to reflect this charge. |
| (2) | Total returns for periods less than one year are not annualized. |
Data presented reflect past performance. Past performance is no guarantee of future results. Current performance may be higher or lower than the performance shown. Investment return and principal value will fluctuate, and redemption value may be more or less than original cost. To obtain performance data current to the most recent month end, please call 1-800-345-2021 or visit americancentury.com. Historically, small company stocks have been more volatile than the stocks of larger, more established companies.
Unless otherwise indicated, performance reflects Investor Class shares; performance for other share classes will vary due to differences in fee structure. For information about other share classes available, please consult the prospectus. Data assumes reinvestment of dividends and capital gains, and none of the charts reflect the deduction of taxes that a shareholder would pay on fund distributions or the redemption of fund shares. Returns for the index are provided for comparison. The fund’s total returns include operating expenses (such as transaction costs and management fees) that reduce returns, while the total returns of the index do not.
4
Small Company
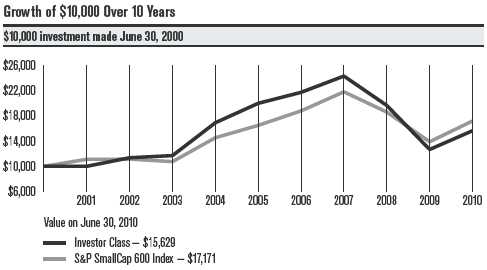
| | | | |
| Total Annual Fund Operating Expenses | | | |
| Investor Class | Institutional Class | A Class | C Class | R Class |
| 0.90% | 0.70% | 1.15% | 1.90% | 1.40% |
The total annual fund operating expenses shown is as stated in the fund’s prospectus current as of the date of this report. The prospectus may vary from the expense ratio shown elsewhere in this report because it is based on a different time period, includes acquired fund fees and expenses, and, if applicable, does not include fee waivers or expense reimbursements.
Data presented reflect past performance. Past performance is no guarantee of future results. Current performance may be higher or lower than the performance shown. Investment return and principal value will fluctuate, and redemption value may be more or less than original cost. To obtain performance data current to the most recent month end, please call 1-800-345-2021 or visit americancentury.com. Historically, small company stocks have been more volatile than the stocks of larger, more established companies.
Unless otherwise indicated, performance reflects Investor Class shares; performance for other share classes will vary due to differences in fee structure. For information about other share classes available, please consult the prospectus. Data assumes reinvestment of dividends and capital gains, and none of the charts reflect the deduction of taxes that a shareholder would pay on fund distributions or the redemption of fund shares. Returns for the index are provided for comparison. The fund’s total returns include operating expenses (such as transaction costs and management fees) that reduce returns, while the total returns of the index do not.
5
Small Company
Portfolio Managers: Brian Garbe and Tal Sansani
In June 2010, portfolio managers Matti Von Türk, Tom Vaiana, and Brian Ertley left American Century Investments to pursue other opportunities. Following their departures, Brian Garbe, a veteran portfolio manager with 22 years of experience, and Tal Sansani, a quantitative analyst who has been with the firm since 2005, became portfolio managers for Small Company.
Performance Summary
Small Company returned 23.39%* for the 12 months ended June 30, 2010, compared with the 23.64% return of its benchmark, the S&P SmallCap 600 Index.
The gain of more than 20% for Small Company and the S&P SmallCap 600 Index reflected the broad advance in the U.S. equity market and the outperformance of small-cap stocks during the 12-month period. Small Company performed roughly in line with its benchmark, narrowly trailing the index’s return. Individual stock selection, which is typically the primary driver of relative performance, was mixed during the period as strong results in the industrials and information technology sectors were offset by weakness in the financials and consumer discretionary sectors.
Financials and Consumer Discretionary Lagged
The fund’s holdings in the financials and consumer discretionary sectors had the biggest negative impact on performance versus the S&P SmallCap 600 Index for the 12 months. An overweight position in capital markets firms and an underweight position in real estate investment trusts contributed the bulk of the underperformance in the financials sector. The most significant individual detractor was asset manager Calamos Asset Management, which was hurt by weak inflows into its stock mutual funds, as well as increased market volatility late in the period. Uncertainty about pending financial reform and regulatory changes for options trading weighed on several of the portfolio’s brokerage holdings, including TradeStation Group, Investment Technology Group, and optionsXpress Holdings.
In the consumer discretionary sector, stock selection among apparel makers and consumer services companies detracted the most. For-profit education firm Corinthian Colleges was adversely affected by growing debt issues among students at private educational institutions, as well as the potential for more stringent regulatory requirements. Aaron’s, a furniture and electronics rental chain, declined as weaker revenues led the company to shutter its office furniture business.
Materials and Energy Were Mixed
Although the portfolio’s materials and energy holdings outperformed their respective counterparts in the benchmark index, several of the most significant individual detractors in the portfolio came from these two sectors. Examples included chemicals producer Koppers Holdings, which was held back by a lagging recovery in its end markets, and energy construction and engineering firm Willbros Group, which posted losses amid low levels of pipeline construction activity in North America.
*All fund returns referenced in this commentary are for Investor Class shares.
6
Small Company
On the positive side, the top performance contributor in the materials sector was specialty chemicals company Solutia, which strengthened its balance sheet and benefited from its exposure to the rebounding automotive and renewable energy markets. In the energy sector, the leading contributor was coal producer Alpha Natural Resources, which enjoyed increased demand for metallurgical coal used in steelmaking.
Industrials and Technology Outperformed
Stock selection was most successful in the industrials and information technology sectors of the portfolio. Virtually all of the outperformance in the industrials sector resulted from strong results among road and rail stocks, and one company in particular—auto rental firm Dollar Thrifty Automotive Group. The company boosted profitability thanks to debt reductions and improved cost management, and its stock price also got a lift late in the period as rivals Hertz Global Holdings and Avis Budget Group began a bidding war to acquire the company.
In the information technology sector, stock choices among software companies and electronic equipment manufacturers added the most value. The best contributors included technology marketing and consulting firm Acxiom, which consistently surpassed earnings expectations as demand increased, and semiconductor manufacturer Skyworks Solutions, which benefited from robust demand resulting from the proliferation of mobile internet devices.
Other top contributors included fabric store chain Jo-Ann Stores and IT staffing firm COMSYS IT Partners. Jo-Ann Stores rallied as same-store sales growth improved and profit margins increased, enabling the company to raise profit guidance for the full year. COMSYS advanced sharply following an agreement to be acquired by employment services provider Manpower.
A Look Ahead
The market environment has grown increasingly choppy in recent months, reflecting greater uncertainty about the resilience of the economic recovery. Although most businesses weathered the 2008 recession relatively well, stubbornly high unemployment suggests that the corporate sector is not yet confident enough in the strength of the recovery to expand payrolls. This economic uncertainty—and the stock market volatility that often accompanies it—is likely to continue as we move into the second half of 2010.
The quantitative investment process we use to manage Small Company has a framework that is objective, disciplined, and systematic—in other words, it avoids getting caught up in the fads and emotions that can drive short-term market movements. We believe this approach will produce superior relative performance over the long term.
7
| | |
| Small Company | | |
| |
| Top Ten Holdings | | |
| | | % of net assets as of 6/30/10 |
| EMCOR Group, Inc. | | 1.1% |
| Jo-Ann Stores, Inc. | | 1.1% |
| Cubist Pharmaceuticals, Inc. | | 1.0% |
| Skyworks Solutions, Inc. | | 1.0% |
| Arris Group, Inc. | | 1.0% |
| CEC Entertainment, Inc. | | 1.0% |
| Dollar Thrifty Automotive Group, Inc. | | 1.0% |
| CSG Systems International, Inc. | | 1.0% |
| Equity LifeStyle Properties, Inc. | | 0.9% |
| TreeHouse Foods, Inc. | | 0.9% |
| |
| Five Largest Overweights as of June 30, 2010 | |
| | % of net assets | % of S&P SmallCap 600 Index |
| Dollar Thrifty Automotive Group, Inc. | 0.96% | — |
| Equity LifeStyle Properties, Inc. | 0.92% | — |
| Jo-Ann Stores, Inc. | 1.10% | 0.26% |
| Cooper Tire & Rubber Co. | 0.82% | — |
| CSG Systems International, Inc. | 0.95% | 0.16% |
| |
| Five Largest Underweights as of June 30, 2010 | |
| | % of net assets | % of S&P SmallCap 600 Index |
| East West Bancorp, Inc. | — | 0.58% |
| Salix Pharmaceuticals Ltd. | — | 0.57% |
| Varian Semiconductor Equipment Associates, Inc. | — | 0.55% |
| Watsco, Inc. | — | 0.48% |
| Concur Technologies, Inc. | — | 0.47% |
| |
| Types of Investments in Portfolio | | |
| | | % of net assets as of 6/30/10 |
| Common Stocks | | 99.7% |
| Other Assets and Liabilities | | 0.3% |
8
|
| Shareholder Fee Example (Unaudited) |
Fund shareholders may incur two types of costs: (1) transaction costs, including sales charges (loads) on purchase payments and redemption/ exchange fees; and (2) ongoing costs, including management fees; distribution and service (12b-1) fees; and other fund expenses. This example is intended to help you understand your ongoing costs (in dollars) of investing in your fund and to compare these costs with the ongoing cost of investing in other mutual funds.
The example is based on an investment of $1,000 made at the beginning of the period and held for the entire period from January 1, 2010 to June 30, 2010 (except as noted).
Actual Expenses
The table provides information about actual account values and actual expenses for each class. You may use the information, together with the amount you invested, to estimate the expenses that you paid over the period. First, identify the share class you own. Then simply divide your account value by $1,000 (for example, an $8,600 account value divided by $1,000 = 8.6), then multiply the result by the number under the heading “Expenses Paid During Period” to estimate the expenses you paid on your account during this period.
If you hold Investor Class shares of any American Century Investments fund, or Institutional Class shares of the American Century Diversified Bond Fund, in an American Century Investments account (i.e., not a financial intermediary or retirement plan account), American Century Investments may charge you a $12.50 semiannual account maintenance fee if the value of those shares is less than $10,000. We will redeem shares automatically in one of your accounts to pay the $12.50 fee. In determining your total eligible investment amount, we will include your investments in all personal accounts (including American Century Investments Brokerage accounts) registered under your Social Security number. Personal accounts include individual accounts, joint accounts, UGMA/UTMA accounts, personal trusts, Coverdell Education Savings Accounts and IRAs (including traditional, Roth, Rollover, SEP-, SARSEP- and SIMPLE-IRAs), and certain other retirement accounts. If you have only business, business retirement, employer-sponsored or American Century Investments Brokerage accounts, you are currently not subject to this fee. We will not charge the fee as long as you choose to manage your accounts exclusively online. If you are subject to the Account Maintenance Fee, your account value could be reduced by the fee amount.
Hypothetical Example for Comparison Purposes
The table also provides information about hypothetical account values and hypothetical expenses based on the actual expense ratio of each class of your fund and an assumed rate of return of 5% per year before expenses, which is not the actual return of a fund’s share class. The hypothetical account values and expenses may not be used to estimate the actual ending account balance or expenses you paid for the period. You may use this information to compare the ongoing costs of investing in your fund and other funds. To do so, compare this 5% hypothetical example with the 5% hypothetical examples that appear in the shareholder reports of the other funds.
9
Please note that the expenses shown in the table are meant to highlight your ongoing costs only and do not reflect any transactional costs, such as sales charges (loads) or redemption/exchange fees. Therefore, the table is useful in comparing ongoing costs only, and will not help you determine the relative total costs of owning different funds. In addition, if these transactional costs were included, your costs would have been higher.
| | | | | |
| | | Beginning | Ending | Expenses Paid | |
| | | Account Value | Account Value | During Period(1) | Annualized |
| | | 1/1/10 | 6/30/10 | 1/1/10 – 6/30/10 | Expense Ratio(1) |
| Actual | | | | |
| Investor Class | $1,000 | $998.40 | $4.46 | 0.90% |
| Institutional Class | $1,000 | $1,000.00 | $3.47 | 0.70% |
| A Class | $1,000 | $998.30 | $5.70 | 1.15% |
| C Class | $1,000 | $957.80(2) | $6.17(3) | 1.90% |
| R Class | $1,000 | $995.00 | $6.93 | 1.40% |
| Hypothetical | | | | |
| Investor Class | $1,000 | $1,020.33 | $4.51 | 0.90% |
| Institutional Class | $1,000 | $1,021.32 | $3.51 | 0.70% |
| A Class | $1,000 | $1,019.09 | $5.76 | 1.15% |
| C Class | $1,000 | $1,015.37(4) | $9.49(4) | 1.90% |
| R Class | $1,000 | $1,017.85 | $7.00 | 1.40% |
| (1) | Expenses are equal to the class’s annualized expense ratio listed in the table above, multiplied by the average account value over the period, |
| | multiplied by 181, the number of days in the most recent fiscal half-year, divided by 365, to reflect the one-half year period. |
| (2) | Ending account value based on actual return from March 1, 2010 (commencement of sale) through June 30, 2010. | |
| (3) | Expenses are equal to the class’s annualized expense ratio listed in the table above, multiplied by the average account value over the period, |
| | multiplied by 121, the number of days in the period from March 1, 2010 (commencement of sale) through June 30, 2010, divided by 365, to |
| | reflect the period. Had the class been available for the full period, the expenses paid during the period would have been higher. |
| (4) | Ending account value and expenses paid during period assumes the class had been available throughout the entire period and are calculated |
| | using the class’s annualized expense ratio listed in the table above. | | |
10
| | | | | | |
| Small Company | | | | | | |
| |
| JUNE 30, 2010 | | | | | | |
| | Shares | Value | | | Shares | Value |
| Common Stocks — 99.7% | | | QLT, Inc.(1) | 30,658 | $ 176,283 |
| AEROSPACE & DEFENSE — 3.0% | | | Vanda Pharmaceuticals, Inc.(1) | 32,187 | 212,756 |
| AAR Corp.(1) | 35,757 | $ 598,572 | | | | 5,740,352 |
| American Science & | | | | BUILDING PRODUCTS — 0.7% | | |
| Engineering, Inc. | 7,665 | 584,150 | | Apogee Enterprises, Inc. | 68,370 | 740,447 |
| Applied Signal Technology, Inc. | 16,262 | 319,548 | | Gibraltar Industries, Inc.(1) | 69,392 | 700,859 |
| Astronics Corp.(1) | 3,344 | 54,708 | | Simpson Manufacturing Co., Inc. | 32,207 | 790,682 |
| Ceradyne, Inc.(1) | 14,384 | 307,386 | | | | 2,231,988 |
| Cubic Corp. | 59,576 | 2,167,375 | | CAPITAL MARKETS — 1.7% | | |
| Curtiss-Wright Corp. | 3,736 | 108,493 | | BGC Partners, Inc., Class A | 77,257 | 394,783 |
| Ducommun, Inc. | 15,803 | 270,231 | | Calamos Asset Management, | | |
| Esterline Technologies Corp.(1) | 20,606 | 977,755 | | Inc., Class A | 129,930 | 1,205,750 |
| | | | | Evercore Partners, Inc., Class A | 9,228 | 215,474 |
| GenCorp, Inc.(1) | 46,261 | 202,623 | | | | |
| | | | | Gladstone Capital Corp. | 8,648 | 93,485 |
| Moog, Inc., Class A(1) | 32,346 | 1,042,512 | | | | |
| | | | | Gladstone Investment Corp. | 11,171 | 65,127 |
| Orbital Sciences Corp.(1) | 72,045 | 1,136,150 | | | | |
| | | | | Hercules Technology Growth | | |
| Teledyne Technologies, Inc.(1) | 4,926 | 190,045 | | Capital, Inc. | 69,114 | 636,540 |
| Triumph Group, Inc. | 23,469 | 1,563,739 | | Investment Technology | | |
| | | 9,523,287 | | Group, Inc.(1) | 65,869 | 1,057,856 |
| AIR FREIGHT & LOGISTICS — 0.6% | | | MCG Capital Corp. | 2,319 | 11,201 |
| Atlas Air Worldwide | | | | NGP Capital Resources Co. | 7,648 | 54,836 |
| Holdings, Inc.(1) | 12,964 | 615,790 | | optionsXpress Holdings, Inc.(1) | 97,201 | 1,529,944 |
| Forward Air Corp. | 2,956 | 80,551 | | TradeStation Group, Inc.(1) | 24,744 | 167,022 |
| Hub Group, Inc., Class A(1) | 43,118 | 1,293,971 | | | | 5,432,018 |
| | | 1,990,312 | | CHEMICALS — 2.2% | | |
| AIRLINES — 0.4% | | | | A. Schulman, Inc. | 68,817 | 1,304,770 |
| Allegiant Travel Co. | 3,442 | 146,939 | | Innophos Holdings, Inc. | 88,862 | 2,317,521 |
| Hawaiian Holdings, Inc.(1) | 70,844 | 366,264 | | Innospec, Inc.(1) | 29,990 | 281,306 |
| Republic Airways Holdings, Inc.(1) | 40,467 | 247,253 | | KMG Chemicals, Inc. | 18,302 | 262,817 |
| SkyWest, Inc. | 36,524 | 446,323 | | Koppers Holdings, Inc. | 61,769 | 1,388,567 |
| | | 1,206,779 | | Minerals Technologies, Inc. | 3,361 | 159,782 |
| AUTO COMPONENTS — 1.6% | | | | OM Group, Inc.(1) | 4,446 | 106,082 |
| Cooper Tire & Rubber Co. | 131,611 | 2,566,415 | | PolyOne Corp.(1) | 29,839 | 251,244 |
| Hawk Corp., Class A(1) | 60,035 | 1,527,891 | | Stepan Co. | 10,126 | 692,922 |
| Spartan Motors, Inc. | 53,086 | 222,961 | | | | 6,765,011 |
| Standard Motor Products, Inc. | 85,963 | 693,721 | | COMMERCIAL BANKS — 6.0% | | |
| | | 5,010,988 | | Bank of Hawaii Corp. | 33,427 | 1,616,196 |
| BIOTECHNOLOGY — 1.8% | | | | Bank of the Ozarks, Inc. | 5,029 | 178,379 |
| Cubist Pharmaceuticals, Inc.(1) | 155,340 | 3,200,004 | | Banner Corp. | 23,596 | 46,720 |
| Emergent Biosolutions, Inc.(1) | 32,406 | 529,514 | | Boston Private Financial | | |
| Infinity Pharmaceuticals, Inc.(1) | 3,634 | 21,477 | | Holdings, Inc. | 74,305 | 477,781 |
| Martek Biosciences Corp.(1) | 60,632 | 1,437,585 | | City Holding Co. | 1,262 | 35,185 |
| OncoGenex Pharmaceutical, Inc.(1) | 6,566 | 88,313 | | City National Corp. | 10,155 | 520,241 |
| Osiris Therapeutics, Inc.(1) | 12,809 | 74,420 | | Columbia Banking System, Inc. | 21,190 | 386,929 |
| | | | | Community Bank System, Inc. | 41,503 | 914,311 |
11
| | | | | | |
| Small Company | | | | | | |
| |
| | Shares | Value | | | Shares | Value |
| CVB Financial Corp. | 64,503 | $ 612,779 | | COMMUNICATIONS EQUIPMENT — 2.5% | |
| Enterprise Financial | | | | Anaren, Inc.(1) | 5,981 | $ 89,356 |
| Services Corp. | 3,347 | 32,265 | | Arris Group, Inc.(1) | 301,580 | 3,073,100 |
| First Bancorp.(1) | 30,408 | 16,116 | | Comtech Telecommunications | | |
| First Financial Bankshares, Inc. | 636 | 30,585 | | Corp.(1) | 29,631 | 886,856 |
| First Midwest Bancorp., Inc. | 72,487 | 881,442 | | Harmonic, Inc.(1) | 110,697 | 602,192 |
| Glacier Bancorp., Inc. | 6,758 | 99,140 | | InterDigital, Inc.(1) | 27,047 | 667,790 |
| Hancock Holding Co. | 26,409 | 881,004 | | Oplink Communications, Inc.(1) | 4,561 | 65,359 |
| Hanmi Financial Corp.(1) | 40,885 | 51,515 | | Opnext, Inc.(1) | 27,161 | 44,816 |
| IBERIABANK Corp. | 4,600 | 236,808 | | PC-Tel, Inc.(1) | 18,301 | 92,237 |
| Independent Bank Corp. | 10,126 | 249,910 | | Powerwave Technologies, Inc.(1) | 76,174 | 117,308 |
| MainSource Financial Group, Inc. | 6,436 | 46,146 | | Seachange International, Inc.(1) | 24,231 | 199,421 |
| Nara Bancorp., Inc.(1) | 28,208 | 237,794 | | | | |
| | | | | Sierra Wireless, Inc.(1) | 101,466 | 674,749 |
| NBT Bancorp., Inc. | 40,233 | 821,558 | | Symmetricom, Inc.(1) | 74,858 | 381,027 |
| Old Second Bancorp., Inc. | 8,396 | 16,792 | | | | |
| | | | | Tekelec(1) | 60,037 | 794,890 |
| Pacific Capital Bancorp. NA(1) | 25,221 | 18,159 | | | | |
| | | | | | | 7,689,101 |
| PacWest Bancorp. | 13,985 | 256,065 | | COMPUTERS & PERIPHERALS — 1.4% | |
| Prosperity Bancshares, Inc. | 33,902 | 1,178,095 | | | | |
| | | | | Cray, Inc.(1) | 20,231 | 112,889 |
| S&T Bancorp., Inc. | 2,405 | 47,523 | | | | |
| | | | | Hypercom Corp.(1) | 19,364 | 89,849 |
| Santander BanCorp(1) | 6,057 | 76,561 | | | | |
| | | | | Novatel Wireless, Inc.(1) | 160,229 | 919,714 |
| Signature Bank(1) | 41,185 | 1,565,442 | | | | |
| | | | | Rimage Corp.(1) | 3,324 | 52,619 |
| Southwest Bancorp., Inc. | 15,421 | 204,945 | | | | |
| | | | | STEC, Inc.(1) | 72,841 | 914,883 |
| Sterling Bancorp. | 39,710 | 357,390 | | | | |
| Sterling Bancshares, Inc. | 95,921 | 451,788 | | Synaptics, Inc.(1) | 79,804 | 2,194,610 |
| SVB Financial Group(1) | 35,010 | 1,443,462 | | | | 4,284,564 |
| Tompkins Financial Corp. | 12,443 | 469,723 | | CONSTRUCTION & ENGINEERING — 2.3% | |
| Trustmark Corp. | 19,209 | 399,931 | | Comfort Systems USA, Inc. | 40,905 | 395,142 |
| UMB Financial Corp. | 41,177 | 1,464,254 | | Dycom Industries, Inc.(1) | 159,119 | 1,360,468 |
| Umpqua Holdings Corp. | 82,732 | 949,763 | | EMCOR Group, Inc.(1) | 151,820 | 3,517,670 |
| United Bankshares, Inc. | 22,248 | 532,617 | | Insituform Technologies, Inc., | | |
| | | | | Class A(1) | 37,856 | 775,291 |
| United Community Banks, Inc.(1) | 17,606 | 69,544 | | | | |
| | | | | Michael Baker Corp.(1) | 24,256 | 846,534 |
| West Bancorp., Inc.(1) | 3,357 | 22,861 | | | | |
| | | | | Sterling Construction Co., Inc.(1) | 15,282 | 197,749 |
| Westamerica Bancorp. | 8,841 | 464,329 | | | | |
| | | | | | | 7,092,854 |
| Western Alliance Bancorp.(1) | 15,826 | 113,472 | | | | |
| | | | | CONSUMER FINANCE — 1.1% | | |
| Wilshire Bancorp., Inc. | 39,199 | 342,991 | | | | |
| | | | | Advance America Cash Advance | | |
| | | 18,818,511 | | Centers, Inc. | 153,836 | 635,343 |
| COMMERCIAL SERVICES & SUPPLIES — 1.1% | | Cash America International, Inc. | 31,862 | 1,091,911 |
| American Reprographics Co.(1) | 31,475 | 274,777 | | First Cash Financial | | |
| APAC Customer Services, Inc.(1) | 52,980 | 301,986 | | Services, Inc.(1) | 30,045 | 654,981 |
| ATC Technology Corp.(1) | 65,009 | 1,047,945 | | First Marblehead Corp. (The)(1) | 34,551 | 81,195 |
| Consolidated Graphics, Inc.(1) | 5,519 | 238,641 | | QC Holdings, Inc. | 2,746 | 10,105 |
| M&F Worldwide Corp.(1) | 6,838 | 185,310 | | Rewards Network, Inc. | 2,993 | 40,914 |
| Tetra Tech, Inc.(1) | 58,323 | 1,143,714 | | World Acceptance Corp.(1) | 21,575 | 826,538 |
| US Ecology, Inc. | 7,031 | 102,442 | | | | 3,340,987 |
| Waste Services, Inc.(1) | 8,182 | 95,402 | | | | |
| | | 3,390,217 | | | | |
12
| | | | | | |
| Small Company | | | | | | |
| |
| | Shares | Value | | | Shares | Value |
| CONTAINERS & PACKAGING — 0.7% | | | CTS Corp. | 39,090 | $ 361,192 |
| Boise, Inc.(1) | 23,769 | $ 130,492 | | Electro Scientific | | |
| Rock-Tenn Co., Class A | 44,538 | 2,212,202 | | Industries, Inc.(1) | 29,716 | 397,006 |
| | | 2,342,694 | | Gerber Scientific, Inc.(1) | 28,641 | 153,229 |
| DISTRIBUTORS — 0.1% | | | | Insight Enterprises, Inc.(1) | 103,943 | 1,367,890 |
| Core-Mark Holding Co., Inc.(1) | 15,784 | 432,482 | | Mercury Computer | | |
| | | | | Systems, Inc.(1) | 18,565 | 217,767 |
| DIVERSIFIED CONSUMER SERVICES — 2.0% | | | | | |
| Capella Education Co.(1) | 20,647 | 1,679,633 | | Methode Electronics, Inc. | 244,063 | 2,377,174 |
| | | | | Multi-Fineline Electronix, Inc.(1) | 1,589 | 39,661 |
| Coinstar, Inc.(1) | 28,096 | 1,207,285 | | | | |
| | | | | Newport Corp.(1) | 40,967 | 371,161 |
| Corinthian Colleges, Inc.(1) | 102,024 | 1,004,936 | | | | |
| | | | | PAR Technology Corp.(1) | 5,035 | 25,880 |
| Hillenbrand, Inc. | 63,863 | 1,366,030 | | | | |
| | | | | Plexus Corp.(1) | 2,841 | 75,968 |
| Mac-Gray Corp. | 3,689 | 41,096 | | | | |
| | | | | Radisys Corp.(1) | 47,669 | 453,809 |
| Pre-Paid Legal Services, Inc.(1) | 9,426 | 428,789 | | | | |
| | | | | Tech Data Corp.(1) | 28,879 | 1,028,670 |
| Universal Technical | | | | | | |
| Institute, Inc.(1) | 22,481 | 531,451 | | Technitrol, Inc. | 74,070 | 234,061 |
| | | 6,259,220 | | Tessco Technologies, Inc. | 1,300 | 21,710 |
| DIVERSIFIED FINANCIAL SERVICES — 0.7% | | | Vishay Intertechnology, Inc.(1) | 3,802 | 29,428 |
| PHH Corp.(1) | 120,743 | 2,298,947 | | | | 10,732,626 |
| DIVERSIFIED TELECOMMUNICATION | | | ENERGY EQUIPMENT & SERVICES — 1.9% | |
| SERVICES — 0.2% | | | | Basic Energy Services, Inc.(1) | 10,586 | 81,512 |
| IDT Corp., Class B(1) | 25,788 | 328,797 | | Cal Dive International, Inc.(1) | 30,880 | 180,648 |
| Neutral Tandem, Inc.(1) | 17,549 | 197,426 | | Dawson Geophysical Co.(1) | 12,003 | 255,304 |
| | | 526,223 | | Dril-Quip, Inc.(1) | 24,076 | 1,059,826 |
| ELECTRIC UTILITIES — 0.8% | | | | ENGlobal Corp.(1) | 23,985 | 49,409 |
| Central Vermont Public | | | | ION Geophysical Corp.(1) | 33,070 | 115,084 |
| Service Corp. | 23,441 | 462,725 | | | | |
| Maine & Maritimes Corp. | 6,295 | 278,931 | | Lufkin Industries, Inc. | 4,556 | 177,638 |
| | | | | Matrix Service Co.(1) | 54,763 | 509,844 |
| UIL Holdings Corp. | 10,218 | 255,757 | | | | |
| | | | | Oil States International, Inc.(1) | 64,975 | 2,571,711 |
| UniSource Energy Corp. | 44,959 | 1,356,863 | | | | |
| | | 2,354,276 | | T-3 Energy Services, Inc.(1) | 16,285 | 454,351 |
| ELECTRICAL EQUIPMENT — 1.0% | | | TGC Industries, Inc.(1) | 10,047 | 30,442 |
| AZZ, Inc. | 22,417 | 824,273 | | Willbros Group, Inc.(1) | 67,170 | 497,058 |
| EnerSys(1) | 28,449 | 607,955 | | | | 5,982,827 |
| General Cable Corp.(1) | 900 | 23,985 | | FOOD & STAPLES RETAILING — 1.2% | |
| GrafTech International Ltd.(1) | 53,327 | 779,641 | | Andersons, Inc. (The) | 66,912 | 2,180,662 |
| II-VI, Inc.(1) | 1,470 | 43,556 | | Casey’s General Stores, Inc. | 10,493 | 366,206 |
| Powell Industries, Inc.(1) | 31,960 | 873,786 | | Nash Finch Co. | 16,584 | 566,509 |
| | | | | United Natural Foods, Inc.(1) | 21,844 | 652,699 |
| Vicor Corp.(1) | 2,293 | 28,640 | | | | |
| | | 3,181,836 | | | | 3,766,076 |
| ELECTRONIC EQUIPMENT, INSTRUMENTS & | | | FOOD PRODUCTS — 2.0% | | |
| COMPONENTS — 3.4% | | | | American Italian Pasta Co., | | |
| | | | | Class A(1) | 21,537 | 1,138,661 |
| Agilysys, Inc. | 15,211 | 101,762 | | | | |
| Anixter International, Inc.(1) | 5,147 | 219,262 | | Diamond Foods, Inc. | 13,425 | 551,768 |
| | | | | Dole Food Co., Inc.(1) | 18,702 | 195,062 |
| Benchmark Electronics, Inc.(1) | 118,362 | 1,876,038 | | | | |
| | | | | J&J Snack Foods Corp. | 23,601 | 993,602 |
| Brightpoint, Inc.(1) | 48,361 | 338,527 | | | | |
| | | | | Overhill Farms, Inc.(1) | 95,118 | 560,245 |
| Celestica, Inc.(1) | 122,891 | 990,501 | | | | |
| | | | | TreeHouse Foods, Inc.(1) | 61,528 | 2,809,368 |
| CPI International, Inc.(1) | 3,331 | 51,930 | | | | |
| | | | | | | 6,248,706 |
13
| | | | | | |
| Small Company | | | | | | |
| |
| | Shares | Value | | | Shares | Value |
| GAS UTILITIES — 1.9% | | | | PSS World Medical, Inc.(1) | 75,521 | $ 1,597,269 |
| Laclede Group, Inc. (The) | 35,414 | $ 1,173,266 | | Res-Care, Inc.(1) | 9,366 | 90,476 |
| New Jersey Resources Corp. | 64,966 | 2,286,803 | | Triple-S Management Corp., | | |
| Northwest Natural Gas Co. | 4,636 | 201,991 | | Class B(1) | 39,528 | 733,244 |
| Piedmont Natural Gas Co., Inc. | 5,269 | 133,306 | | U.S. Physical Therapy, Inc.(1) | 3,082 | 52,024 |
| South Jersey Industries, Inc. | 19,928 | 856,107 | | | | 13,736,390 |
| Southwest Gas Corp. | 39,451 | 1,163,804 | | HEALTH CARE TECHNOLOGY — 0.5% | |
| | | 5,815,277 | | Eclipsys Corp.(1) | 28,818 | 514,113 |
| HEALTH CARE EQUIPMENT & SUPPLIES — 3.9% | | Medidata Solutions, Inc.(1) | 38,329 | 593,716 |
| American Medical Systems | | | | Omnicell, Inc.(1) | 1,919 | 22,433 |
| Holdings, Inc.(1) | 82,856 | 1,832,775 | | | | |
| | | | | Quality Systems, Inc. | 5,508 | 319,409 |
| Cantel Medical Corp. | 11,165 | 186,456 | | | | 1,449,671 |
| Cooper Cos., Inc. (The) | 46,958 | 1,868,459 | | HOTELS, RESTAURANTS & LEISURE — 3.3% | |
| Cyberonics, Inc.(1) | 36,008 | 852,669 | | | | |
| | | | | AFC Enterprises, Inc.(1) | 114,191 | 1,039,138 |
| Exactech, Inc.(1) | 2,490 | 42,529 | | | | |
| | | | | CEC Entertainment, Inc.(1) | 86,515 | 3,050,519 |
| Greatbatch, Inc.(1) | 22,180 | 494,836 | | Cracker Barrel Old Country | | |
| Haemonetics Corp.(1) | 12,931 | 692,067 | | Store, Inc. | 50,076 | 2,331,539 |
| HealthTronics, Inc.(1) | 15,990 | 77,232 | | Einstein Noah Restaurant | | |
| | | | | Group, Inc.(1) | 10,197 | 110,026 |
| ICU Medical, Inc.(1) | 1,235 | 39,730 | | | | |
| Integra LifeSciences | | | | Isle of Capri Casinos, Inc.(1) | 65,478 | 606,326 |
| Holdings Corp.(1) | 35,555 | 1,315,535 | | Multimedia Games, Inc.(1) | 13,971 | 62,870 |
| Invacare Corp. | 118,918 | 2,466,359 | | O’Charleys, Inc.(1) | 18,974 | 100,562 |
| Kensey Nash Corp.(1) | 54,624 | 1,295,135 | | Papa John’s International, Inc.(1) | 579 | 13,386 |
| Medical Action Industries, Inc.(1) | 5,473 | 65,621 | | Peet’s Coffee & Tea, Inc.(1) | 40,782 | 1,601,509 |
| Quidel Corp.(1) | 59,490 | 754,928 | | PF Chang’s China Bistro, Inc. | 32,013 | 1,269,315 |
| Symmetry Medical, Inc.(1) | 22,093 | 232,860 | | Ruby Tuesday, Inc.(1) | 861 | 7,318 |
| Theragenics Corp.(1) | 17,326 | 19,925 | | Ruth’s Hospitality Group, Inc.(1) | 12,525 | 52,355 |
| | | 12,237,116 | | Texas Roadhouse, Inc.(1) | 2,081 | 26,262 |
| HEALTH CARE PROVIDERS & SERVICES — 4.4% | | | | 10,271,125 |
| Amedisys, Inc.(1) | 14,748 | 648,470 | | HOUSEHOLD DURABLES — 0.7% | |
| America Service Group, Inc. | 3,552 | 61,094 | | American Greetings Corp., | | |
| AMN Healthcare Services, Inc.(1) | 45,449 | 339,958 | | Class A | 12,147 | 227,878 |
| Amsurg Corp.(1) | 8,039 | 143,255 | | Blyth, Inc. | 7,930 | 270,175 |
| | | | | Brookfield Homes Corp.(1) | 8,089 | 54,520 |
| Centene Corp.(1) | 120,390 | 2,588,385 | | | | |
| Cross Country Healthcare, Inc.(1) | 12,175 | 109,453 | | Furniture Brands | | |
| | | | | International, Inc.(1) | 46,693 | 243,737 |
| Gentiva Health Services, Inc.(1) | 29,480 | 796,255 | | | | |
| | | | | Kid Brands, Inc.(1) | 8,497 | 59,734 |
| Healthspring, Inc.(1) | 48,753 | 756,159 | | | | |
| | | | | La-Z-Boy, Inc.(1) | 62,678 | 465,697 |
| HMS Holdings Corp.(1) | 19,101 | 1,035,656 | | | | |
| | | | | Meritage Homes Corp.(1) | 35,481 | 577,631 |
| LHC Group, Inc.(1) | 49,525 | 1,374,319 | | | | |
| | | | | Standard Pacific Corp.(1) | 96,721 | 322,081 |
| Magellan Health Services, Inc.(1) | 34,112 | 1,238,948 | | | | |
| | | | | Universal Electronics, Inc.(1) | 7,341 | 122,081 |
| Molina Healthcare, Inc.(1) | 53,235 | 1,533,168 | | | | |
| | | | | | | 2,343,534 |
| Nighthawk Radiology | | | | HOUSEHOLD PRODUCTS — 0.5% | |
| Holdings, Inc.(1) | 10,401 | 26,939 | | | | |
| NovaMed, Inc.(1) | 4,899 | 40,662 | | Central Garden and Pet Co., | | |
| | | | | Class A(1) | 164,063 | 1,471,645 |
| PharMerica Corp.(1) | 32,246 | 472,726 | | | | |
| Providence Service Corp. (The)(1) | 6,995 | 97,930 | | | | |
14
| | | | | | |
| Small Company | | | | | | |
| |
| | Shares | Value | | | Shares | Value |
| INDEPENDENT POWER PRODUCERS & | | | Infospace, Inc.(1) | 2,810 | $ 21,131 |
| ENERGY TRADERS — 0.5% | | | | j2 Global Communications, Inc.(1) | 69,838 | 1,525,262 |
| Mirant Corp.(1) | 134,569 | $ 1,421,049 | | | | |
| | | | | LogMeIn, Inc.(1) | 553 | 14,505 |
| INDUSTRIAL CONGLOMERATES — 0.3% | | | ModusLink Global | | |
| Carlisle Cos., Inc. | 18,069 | 652,833 | | Solutions, Inc.(1) | 3,250 | 19,597 |
| Standex International Corp. | 10,712 | 271,549 | | Openwave Systems, Inc.(1) | 45,493 | 92,351 |
| | | 924,382 | | United Online, Inc. | 96,029 | 553,127 |
| INSURANCE — 3.3% | | | | | | 4,916,403 |
| Allied World Assurance Co. | | | | IT SERVICES — 2.7% | | |
| Holdings Ltd. | 54,410 | 2,469,126 | | Acxiom Corp.(1) | 134,454 | 1,975,129 |
| American Financial Group, Inc. | 62,986 | 1,720,778 | | CACI International, Inc., | | |
| American Physicians Capital, Inc. | 3,852 | 118,834 | | Class A(1) | 17,567 | 746,246 |
| American Safety Insurance | | | | CIBER, Inc.(1) | 168,739 | 467,407 |
| Holdings Ltd.(1) | 18,353 | 288,509 | | | | |
| | | | | CSG Systems International, | | |
| Argo Group International | | | | Inc.(1) | 162,401 | 2,976,811 |
| Holdings Ltd. | 5,405 | 165,339 | | | | |
| | | | | Global Cash Access | | |
| Aspen Insurance Holdings Ltd. | 56,460 | 1,396,820 | | Holdings, Inc.(1) | 113,880 | 821,075 |
| Delphi Financial Group, Inc., | | | | Lionbridge Technologies, Inc.(1) | 23,991 | 109,639 |
| Class A | 11,925 | 291,089 | | | | |
| | | | | PRGX Global, Inc.(1) | 34,048 | 141,299 |
| eHealth, Inc.(1) | 7,930 | 90,164 | | | | |
| | | | | TeleTech Holdings, Inc.(1) | 53,779 | 693,211 |
| FBL Financial Group, Inc., | | | | | | |
| Class A | 7,221 | 151,641 | | VeriFone Systems, Inc.(1) | 34,043 | 644,434 |
| First Mercury Financial Corp. | 57,717 | 610,646 | | | | 8,575,251 |
| Flagstone Reinsurance | | | | LEISURE EQUIPMENT & PRODUCTS — 1.0% | |
| Holdings SA | 13,354 | 144,490 | | Arctic Cat, Inc.(1) | 21,293 | 193,979 |
| Hallmark Financial Services(1) | 20,925 | 208,204 | | Brunswick Corp. | 2,727 | 33,897 |
| Horace Mann Educators Corp. | 43,893 | 671,563 | | JAKKS Pacific, Inc.(1) | 3,585 | 51,552 |
| Maiden Holdings Ltd. | 90,835 | 596,786 | | Nautilus, Inc.(1) | 22,280 | 33,866 |
| Meadowbrook Insurance | | | | Polaris Industries, Inc. | 33,047 | 1,805,027 |
| Group, Inc. | 39,594 | 341,696 | | | | |
| | | | | Smith & Wesson Holding Corp.(1) | 96,502 | 394,693 |
| National Financial | | | | | | |
| Partners Corp.(1) | 6,808 | 66,514 | | Sport Supply Group, Inc. | 25,537 | 343,728 |
| Navigators Group, Inc. (The)(1) | 10,816 | 444,862 | | Sturm, Ruger & Co., Inc. | 24,243 | 347,402 |
| NYMAGIC, Inc. | 1,055 | 20,351 | | | | 3,204,144 |
| Platinum Underwriters | | | | LIFE SCIENCES TOOLS & SERVICES — 0.1% | |
| Holdings Ltd. | 2,468 | 89,564 | | Dionex Corp.(1) | 991 | 73,790 |
| PMA Capital Corp., Class A(1) | 10,647 | 69,738 | | eResearchTechnology, Inc.(1) | 16,601 | 130,816 |
| SeaBright Holdings, Inc. | 7,556 | 71,631 | | PAREXEL International Corp.(1) | 7,915 | 171,597 |
| Universal Insurance | | | | | | 376,203 |
| Holdings, Inc. | 36,270 | 151,609 | | MACHINERY — 3.9% | | |
| | | 10,179,954 | | Alamo Group, Inc. | 14,702 | 319,033 |
| INTERNET & CATALOG RETAIL — 0.3% | | | Altra Holdings, Inc.(1) | 24,103 | 313,821 |
| NutriSystem, Inc. | 23,831 | 546,683 | | American Railcar Industries, Inc.(1) | 21,249 | 256,688 |
| Shutterfly, Inc.(1) | 11,699 | 280,308 | | Briggs & Stratton Corp. | 10,202 | 173,638 |
| | | 826,991 | | Chart Industries, Inc.(1) | 90,376 | 1,408,058 |
| INTERNET SOFTWARE & SERVICES — 1.6% | | | CIRCOR International, Inc. | 3,662 | 93,674 |
| Dice Holdings, Inc.(1) | 12,104 | 83,760 | | | | |
| | | | | EnPro Industries, Inc.(1) | 55,992 | 1,576,175 |
| DivX, Inc.(1) | 30,404 | 232,895 | | | | |
| | | | | Force Protection, Inc.(1) | 96,876 | 397,192 |
| EarthLink, Inc. | 298,213 | 2,373,775 | | Kadant, Inc.(1) | 12,988 | 226,251 |
15
| | | | | | |
| Small Company | | | | | | |
| |
| | Shares | Value | | | Shares | Value |
| Lindsay Corp. | 33,763 | $ 1,069,950 | | SM Energy Co. | 50,026 | $ 2,009,044 |
| Mueller Industries, Inc. | 32,099 | 789,635 | | Stone Energy Corp.(1) | 148,667 | 1,659,124 |
| NACCO Industries, Inc., Class A | 4,396 | 390,189 | | Swift Energy Co.(1) | 28,757 | 773,851 |
| Tecumseh Products Co., | | | | World Fuel Services Corp. | 50,275 | 1,304,133 |
| Class A(1) | 2,299 | 25,565 | | | | |
| | | | | | | 7,201,948 |
| Tennant Co. | 20,977 | 709,442 | | PAPER & FOREST PRODUCTS — 1.0% | |
| Timken Co. | 73,578 | 1,912,292 | | Buckeye Technologies, Inc.(1) | 83,265 | 828,487 |
| Toro Co. (The) | 31,439 | 1,544,284 | | Clearwater Paper Corp.(1) | 18,668 | 1,022,260 |
| Watts Water Technologies, Inc., | | | | | | |
| Class A | 39,826 | 1,141,413 | | KapStone Paper and | | |
| | | | | Packaging Corp.(1) | 87,718 | 977,178 |
| | | 12,347,300 | | Neenah Paper, Inc. | 14,582 | 266,851 |
| MARINE — 0.2% | | | | | | 3,094,776 |
| American Commercial | | | | | | |
| Lines, Inc.(1) | 26,078 | 587,016 | | PERSONAL PRODUCTS — 0.2% | | |
| Horizon Lines, Inc., Class A | 41,139 | 174,018 | | China Sky One Medical, Inc.(1) | 26,056 | 292,869 |
| | | 761,034 | | Nutraceutical International | | |
| | | | | Corp.(1) | 858 | 13,093 |
| MEDIA — 0.2% | | | | | | |
| | | | | Schiff Nutrition International, Inc. | 20,243 | 144,130 |
| Journal Communications, Inc., | | | | | | |
| Class A(1) | 33,010 | 131,050 | | USANA Health Sciences, Inc.(1) | 5,839 | 213,299 |
| LodgeNet Interactive Corp.(1) | 20,395 | 75,665 | | | | 663,391 |
| MDC Partners, Inc., Class A | 14,270 | 152,404 | | PHARMACEUTICALS — 2.2% | | |
| Mediacom Communications | | | | Endo Pharmaceuticals | | |
| Corp., Class A(1) | 29,215 | 196,325 | | Holdings, Inc.(1) | 81,689 | 1,782,454 |
| Scholastic Corp. | 7,426 | 179,115 | | Matrixx Initiatives, Inc.(1) | 19,035 | 87,561 |
| | | 734,559 | | Medicines Co. (The)(1) | 2,216 | 16,864 |
| METALS & MINING — 0.6% | | | | Medicis Pharmaceutical Corp., | | |
| Golden Star Resources Ltd. | | | | Class A | 81,954 | 1,793,153 |
| New York Shares(1) | 168,174 | 736,602 | | Obagi Medical Products, Inc.(1) | 12,079 | 142,774 |
| Haynes International, Inc. | 5,255 | 162,012 | | Questcor Pharmaceuticals, Inc.(1) | 89,072 | 909,425 |
| Hecla Mining Co.(1) | 65,564 | 342,244 | | Santarus, Inc.(1) | 177,543 | 440,307 |
| Olympic Steel, Inc. | 22,945 | 527,047 | | ViroPharma, Inc.(1) | 142,518 | 1,597,627 |
| | | 1,767,905 | | | | 6,770,165 |
| MULTILINE RETAIL — 1.0% | | | | PROFESSIONAL SERVICES — 0.1% | |
| Dillard’s, Inc., Class A | 13,387 | 287,821 | | Administaff, Inc. | 377 | 9,108 |
| Dollar Tree, Inc.(1) | 39,108 | 1,628,066 | | GP Strategies Corp.(1) | 5,396 | 39,175 |
| Fred’s, Inc., Class A | 50,399 | 557,413 | | On Assignment, Inc.(1) | 18,973 | 95,434 |
| Tuesday Morning Corp.(1) | 154,252 | 615,465 | | SFN Group, Inc.(1) | 22,266 | 121,573 |
| | | 3,088,765 | | VSE Corp. | 3,306 | 105,197 |
| MULTI-UTILITIES — 0.5% | | | | | | 370,487 |
| Avista Corp. | 42,711 | 834,146 | | REAL ESTATE INVESTMENT TRUSTS (REITs) — 6.3% |
| CH Energy Group, Inc. | 11,565 | 453,810 | | Agree Realty Corp. | 12,062 | 281,286 |
| NorthWestern Corp. | 16,474 | 431,619 | | American Campus | | |
| | | 1,719,575 | | Communities, Inc. | 44,226 | 1,206,928 |
| OIL, GAS & CONSUMABLE FUELS — 2.3% | | | Ashford Hospitality Trust, Inc.(1) | 3,535 | 25,912 |
| Alon USA Energy, Inc. | 19,719 | 125,413 | | Chesapeake Lodging Trust(1) | 2,442 | 38,632 |
| DHT Holdings, Inc. | 72,983 | 280,985 | | Colonial Properties Trust | 65,973 | 958,588 |
| Penn Virginia Corp. | 31,492 | 633,304 | | Corporate Office Properties Trust | 13,965 | 527,318 |
| Petroleum Development Corp.(1) | 16,241 | 416,094 | | Equity LifeStyle Properties, Inc. | 59,583 | 2,873,688 |
16
| | | | | | |
| Small Company | | | | | | |
| |
| | Shares | Value | | | Shares | Value |
| Extra Space Storage, Inc. | 41,298 | $ 574,042 | | Rudolph Technologies, Inc.(1) | 28,303 | $ 213,688 |
| Getty Realty Corp. | 2,995 | 67,118 | | Sigma Designs, Inc.(1) | 60,674 | 607,347 |
| Government Properties | | | | Skyworks Solutions, Inc.(1) | 185,745 | 3,118,659 |
| Income Trust | 21,155 | 539,876 | | Standard Microsystems Corp.(1) | 75,724 | 1,762,855 |
| Gramercy Capital Corp.(1) | 24,450 | 30,807 | | | | |
| | | | | Tessera Technologies, Inc.(1) | 62,125 | 997,106 |
| Home Properties, Inc. | 37,132 | 1,673,539 | | | | |
| | | | | Volterra Semiconductor Corp.(1) | 49,603 | 1,143,845 |
| Inland Real Estate Corp. | 27,990 | 221,681 | | | | |
| | | | | | | 14,553,957 |
| Kilroy Realty Corp. | 39,860 | 1,185,038 | | | | |
| | | | | SOFTWARE — 3.3% | | |
| LTC Properties, Inc. | 16,809 | 407,954 | | | | |
| | | | | ACI Worldwide, Inc.(1) | 509 | 9,910 |
| Medical Properties Trust, Inc. | 85,043 | 802,806 | | | | |
| | | | | Actuate Corp.(1) | 30,595 | 136,148 |
| Mid-America Apartment | | | | | | |
| Communities, Inc. | 34,247 | 1,762,693 | | Blackboard, Inc.(1) | 19,702 | 735,476 |
| Mission West Properties, Inc. | 12,588 | 85,850 | | Deltek, Inc.(1) | 3,225 | 26,897 |
| National Health Investors, Inc. | 3,597 | 138,700 | | Epicor Software Corp.(1) | 38,106 | 304,467 |
| National Retail Properties, Inc. | 52,353 | 1,122,448 | | EPIQ Systems, Inc.(1) | 12,236 | 158,212 |
| Pebblebrook Hotel Trust(1) | 21,841 | 411,703 | | Interactive Intelligence, Inc.(1) | 9,479 | 155,740 |
| Potlatch Corp. | 9,040 | 322,999 | | Magma Design Automation, Inc.(1) | 54,667 | 155,254 |
| PS Business Parks, Inc. | 30,659 | 1,710,159 | | Manhattan Associates, Inc.(1) | 35,062 | 965,958 |
| Sovran Self Storage, Inc. | 21,229 | 730,915 | | Net 1 UEPS Technologies, Inc.(1) | 11,706 | 156,978 |
| Tanger Factory Outlet Centers | 33,335 | 1,379,402 | | NetScout Systems, Inc.(1) | 32,840 | 466,985 |
| UMH Properties, Inc. | 10,526 | 105,997 | | Opnet Technologies, Inc. | 12,705 | 186,636 |
| Universal Health Realty | | | | Progress Software Corp.(1) | 47,135 | 1,415,464 |
| Income Trust | 11,065 | 355,519 | | | | |
| | | | | QAD, Inc.(1) | 4,788 | 19,774 |
| Weingarten Realty Investors | 4,640 | 88,392 | | | | |
| | | 19,629,990 | | Quest Software, Inc.(1) | 22,009 | 397,042 |
| ROAD & RAIL — 1.0% | | | | Radiant Systems, Inc.(1) | 31,202 | 451,181 |
| Dollar Thrifty Automotive | | | | Rosetta Stone, Inc.(1) | 54,964 | 1,261,973 |
| Group, Inc.(1) | 70,948 | 3,023,094 | | Symyx Technologies, Inc.(1) | 54,298 | 272,033 |
| Heartland Express, Inc. | 16,352 | 237,431 | | TIBCO Software, Inc.(1) | 195,902 | 2,362,578 |
| | | 3,260,525 | | Tyler Technologies, Inc.(1) | 21,973 | 341,021 |
| SEMICONDUCTORS & SEMICONDUCTOR | | | Websense, Inc.(1) | 19,578 | 370,024 |
| EQUIPMENT — 4.6% | | | | | | |
| | | | | | | 10,349,751 |
| Applied Micro Circuits Corp.(1) | 25,202 | 264,117 | | | | |
| | | | | SPECIALTY RETAIL — 3.5% | | |
| ASM International NV | | | | Asbury Automotive Group, Inc.(1) | 7,983 | 84,141 |
| New York Shares(1) | 29,864 | 583,841 | | | | |
| Cypress Semiconductor Corp.(1) | 102,853 | 1,032,644 | | Books-A-Million, Inc. | 12,012 | 72,312 |
| DSP Group, Inc.(1) | 20,508 | 131,046 | | Cato Corp. (The), Class A | 33,286 | 732,958 |
| Exar Corp.(1) | 9,226 | 63,936 | | Children’s Place Retail | | |
| | | | | Stores, Inc. (The)(1) | 21,300 | 937,626 |
| FEI Co.(1) | 44,457 | 876,247 | | | | |
| | | | | Destination Maternity Corp.(1) | 1,184 | 29,955 |
| Integrated Device | | | | Finish Line, Inc. (The), Class A | 64,348 | 896,368 |
| Technology, Inc.(1) | 106,850 | 528,908 | | | | |
| | | | | Genesco, Inc.(1) | 44,864 | 1,180,372 |
| Integrated Silicon Solution, Inc.(1) | 65,421 | 493,274 | | | | |
| | | | | Group 1 Automotive, Inc.(1) | 9,555 | 224,829 |
| Kopin Corp.(1) | 43,371 | 147,028 | | | | |
| | | | | Hot Topic, Inc. | 94,091 | 477,982 |
| Lattice Semiconductor Corp.(1) | 263,865 | 1,145,174 | | | | |
| | | | | Jo-Ann Stores, Inc.(1) | 91,972 | 3,449,870 |
| MEMSIC, Inc.(1) | 2,920 | 6,599 | | | | |
| | | | | MarineMax, Inc.(1) | 20,428 | 141,770 |
| Micrel, Inc. | 28,750 | 292,675 | | | | |
| | | | | Rent-A-Center, Inc.(1) | 80,812 | 1,637,251 |
| MKS Instruments, Inc.(1) | 50,233 | 940,362 | | | | |
| | | | | Sonic Automotive, Inc., Class A(1) | 46,789 | 400,514 |
| RF Micro Devices, Inc.(1) | 52,329 | 204,606 | | | | |
17
| | | | | | | |
| Small Company | | | | | | | |
| |
| | Shares | Value | | | Shares | | Value |
| Stage Stores, Inc. | 49,120 | $ 524,602 | | TRADING COMPANIES & DISTRIBUTORS — 0.3% |
| Stein Mart, Inc.(1) | 33,644 | 209,602 | | Applied Industrial | | | |
| Ulta Salon Cosmetics & | | | | Technologies, Inc. | 5,743 | $ 145,413 |
| Fragrance, Inc.(1) | 3,964 | 93,788 | | DXP Enterprises, Inc.(1) | 5,239 | | 81,990 |
| | | 11,093,940 | | Kaman Corp. | 6,232 | | 137,852 |
| TEXTILES, APPAREL & LUXURY GOODS — 2.3% | | TAL International Group, Inc. | 29,104 | | 653,967 |
| Carter’s, Inc.(1) | 54,093 | 1,419,941 | | | | | 1,019,222 |
| Culp, Inc.(1) | 2,375 | 26,030 | | WIRELESS TELECOMMUNICATION SERVICES — 0.2% |
| Fossil, Inc.(1) | 19,658 | 682,133 | | USA Mobility, Inc. | 43,833 | | 566,322 |
| Lacrosse Footwear, Inc. | 1,504 | 25,327 | | TOTAL INVESTMENT | | | |
| Liz Claiborne, Inc.(1) | 71,513 | 301,785 | | SECURITIES — 99.7% | | | |
| | | | | (Cost $298,918,985) | | 312,257,509 |
| Maidenform Brands, Inc.(1) | 20,525 | 417,889 | | OTHER ASSETS AND | | | |
| Oxford Industries, Inc. | 22,884 | 478,962 | | LIABILITIES — 0.3% | | | 1,044,369 |
| Perry Ellis International, Inc.(1) | 47,474 | 958,975 | | TOTAL NET ASSETS — 100.0% | | $313,301,878 |
| Quiksilver, Inc.(1) | 89,643 | 331,679 | | | | | |
| RG Barry Corp. | 4,417 | 48,720 | | Notes to Schedule of Investments | |
| Skechers U.S.A., Inc., Class A(1) | 752 | 27,463 | | | | | |
| Steven Madden Ltd.(1) | 1,314 | 41,417 | | (1) Non-income producing. | | | |
| Unifirst Corp. | 18,844 | 829,513 | | Industry classifications are unaudited. | | | |
| Volcom, Inc.(1) | 17,557 | 326,033 | | | | | |
| Weyco Group, Inc. | 1,842 | 41,961 | | See Notes to Financial Statements. | | | |
| Wolverine World Wide, Inc. | 46,147 | 1,163,827 | | | | | |
| | | 7,121,655 | | | | | |
| THRIFTS & MORTGAGE FINANCE — 0.6% | | | | | | |
| Bank Mutual Corp. | 21,297 | 120,967 | | | | | |
| Brookline Bancorp., Inc. | 6,571 | 58,350 | | | | | |
| Charter Financial Corp. | 6,942 | 69,767 | | | | | |
| Dime Community Bancshares | 6,484 | 79,948 | | | | | |
| Doral Financial Corp.(1) | 23,286 | 56,818 | | | | | |
| Provident Financial Services, Inc. | 47,958 | 560,629 | | | | | |
| TrustCo Bank Corp. NY | 143,526 | 803,746 | | | | | |
| | | 1,750,225 | | | | | |
18
|
| Statement of Assets and Liabilities |
| |
| JUNE 30, 2010 | |
| Assets | |
| Investment securities, at value (cost of $298,918,985) | $ 312,257,509 |
| Receivable for investments sold | 11,145,915 |
| Receivable for capital shares sold | 89,488 |
| Dividends and interest receivable | 238,234 |
| | 323,731,146 |
| | |
| Liabilities | |
| Disbursements in excess of demand deposit cash | 1,834,970 |
| Payable for investments purchased | 7,557,388 |
| Payable for capital shares redeemed | 792,660 |
| Accrued management fees | 236,303 |
| Service fees (and distribution fees — A Class and R Class) payable | 7,931 |
| Distribution fees payable | 16 |
| | 10,429,268 |
| | |
| Net Assets | $313,301,878 |
| | |
| Net Assets Consist of: | |
| Capital (par value and paid-in surplus) | $ 543,256,159 |
| Undistributed net investment income | 96,967 |
| Accumulated net realized loss on investment transactions | (243,389,772) |
| Net unrealized appreciation on investments | 13,338,524 |
| | $ 313,301,878 |
| | | |
| | Net assets | Shares outstanding | Net asset value per share |
| Investor Class, $0.01 Par Value | $234,726,891 | 38,148,922 | $6.15 |
| Institutional Class, $0.01 Par Value | $42,599,359 | 6,885,310 | $6.19 |
| A Class, $0.01 Par Value | $35,567,326 | 5,882,135 | $6.05* |
| C Class, $0.01 Par Value | $23,951 | 3,906 | $6.13 |
| R Class, $0.01 Par Value | $384,351 | 63,932 | $6.01 |
| *Maximum offering price $6.42 (net asset value divided by 0.9425) | | |
| |
| |
| See Notes to Financial Statements. | | | |
19
| |
| YEAR ENDED JUNE 30, 2010 | |
| Investment Income (Loss) | |
| Income: | |
| Dividends | $ 3,973,650 |
| Interest | 5,291 |
| | 3,978,941 |
| | |
| Expenses: | |
| Management fees | 3,298,338 |
| Distribution fees — C Class | 65 |
| Service fees — C Class | 22 |
| Distribution and service fees: | |
| A Class | 115,028 |
| R Class | 1,989 |
| Directors’ fees and expenses | 12,225 |
| Other expenses | 9,431 |
| | 3,437,098 |
| | |
| Net investment income (loss) | 541,843 |
| | |
| Realized and Unrealized Gain (Loss) | |
| Net realized gain (loss) on: | |
| Investment transactions | 26,125,037 |
| Futures contract transactions | (1,430,241) |
| | 24,694,796 |
| | |
| Change in net unrealized appreciation (depreciation) on investments | 68,949,450 |
| | |
| Net realized and unrealized gain (loss) | 93,644,246 |
| | |
| Net Increase (Decrease) in Net Assets Resulting from Operations | $94,186,089 |
| |
| |
| See Notes to Financial Statements. | |
20
|
| Statement of Changes in Net Assets |
| | |
| YEARS ENDED JUNE 30, 2010 AND JUNE 30, 2009 | | |
| Increase (Decrease) in Net Assets | 2010 | 2009 |
| Operations | | |
| Net investment income (loss) | $ 541,843 | $ 1,889,862 |
| Net realized gain (loss) | 24,694,796 | (210,078,743) |
| Change in net unrealized appreciation (depreciation) | 68,949,450 | (83,665,788) |
| Net increase (decrease) in net assets resulting from operations | 94,186,089 | (291,854,669) |
| | | |
| Distributions to Shareholders | | |
| From net investment income: | | |
| Investor Class | (834,118) | (194,651) |
| Institutional Class | (749,236) | (382,762) |
| A Class | (74,356) | — |
| Decrease in net assets from distributions | (1,657,710) | (577,413) |
| | | |
| Capital Share Transactions | | |
| Net increase (decrease) in net assets from capital share transactions | (201,397,291) | (195,840,928) |
| | | |
| Net increase (decrease) in net assets | (108,868,912) | (488,273,010) |
| | | |
| Net Assets | | |
| Beginning of period | 422,170,790 | 910,443,800 |
| End of period | $ 313,301,878 | $ 422,170,790 |
| | | |
| Undistributed net investment income | $96,967 | $1,312,449 |
| |
| |
| See Notes to Financial Statements. | | |
21
|
| Notes to Financial Statements |
JUNE 30, 2010
1. Organization and Summary of Significant Accounting Policies
Organization — American Century Quantitative Equity Funds, Inc. (the corporation) is registered under the Investment Company Act of 1940 (the 1940 Act) as an open-end management investment company. Small Company Fund (the fund) is one fund in a series issued by the corporation. The fund is diversified under the 1940 Act. The fund seeks long-term capital growth by investing primarily in stocks of small companies. The following is a summary of the fund’s significant accounting policies.
Multiple Class — The fund is authorized to issue the Investor Class, the Institutional Class, the A Class (formerly Advisor Class), the C Class and the R Class. The A Class may incur an initial sales charge. The A Class and C Class may be subject to a contingent deferred sales charge. The share classes differ principally in their respective sales charges and distribution and shareholder servicing expenses and arrangements. All shares of the fund represent an equal pro rata interest in the net assets of the class to which such shares belong, and have identical voting, dividend, liquidation and other rights and the same terms and conditions, except for class specific expenses and exclusive rights to vote on matters affecting only individual classes. Income, non-class specific expenses, and realized and unrealized capital gains and losses of the fund are allocated to each class of shares based on their relative net assets. Sale of the C Class commenced on March 1, 2010.
Security Valuations — Securities traded primarily on a principal securities exchange are valued at the last reported sales price, or at the mean of the latest bid and asked prices where no last sales price is available. Depending on local convention or regulation, securities traded over-the-counter are valued at the mean of the latest bid and asked prices, the last sales price, or the official close price. Investments in open-end management investment companies are valued at the reported net asset value. Discount notes may be valued through a commercial pricing service or at amortized cost, which approximates fair value. Securities traded on foreign securities exchanges and over-the-counter markets are normally completed before the close of business on days that the New York Stock Exchange (the Exchange) is open and may also take place on days when the Exchange is not open. If an event occurs after the value of a security was established but before the net asset value per share was determined that was likely to materially change the net asset value, that security would be valued as determined in accordance with procedures adopted by the Board of Directors. If the fund determines that the market price of a portfolio security is not readily available, or that the valuation methods mentioned above do not reflect the security’s fair value, such security is valued as determined by the Board of Directors or its designee, in accordance with procedures adopted by the Board of Directors, if such determination would materially impact a fund’s net asset value. Certain other circumstances may cause the fund to use alternative procedures to value a security such as: a security has been declared in default; trading in a security has been halted during the trading day; or there is a foreign market holiday and no trading will commence .
Security Transactions — For financial reporting purposes, security transactions are accounted for as of the trade date. Net realized gains and losses are determined on the identified cost basis, which is also used for federal income tax purposes.
Investment Income — Dividend income less foreign taxes withheld, if any, is recorded as of the ex-dividend date. Distributions received on securities that represent a return of capital or capital gain are recorded as a reduction of cost of investments and/or as a realized gain. The fund estimates the components of distributions received that may be considered nontaxable distributions or capital gain distributions for income tax purposes. Interest income is recorded on the accrual basis and includes accretion of discounts and amortization of premiums.
22
Repurchase Agreements — The fund may enter into repurchase agreements with institutions that American Century Investment Management, Inc. (ACIM) (the investment advisor) has determined are creditworthy pursuant to criteria adopted by the Board of Directors. Each repurchase agreement is recorded at cost. The fund requires that the collateral, represented by securities, received in a repurchase transaction be transferred to the custodian in a manner sufficient to enable the fund to obtain those securities in the event of a default under the repurchase agreement. ACIM monitors, on a daily basis, the securities transferred to ensure the value, including accrued interest, of the securities under each repurchase agreement is equal to or greater than amounts owed to the fund under each repurchase agreement.
Joint Trading Account — Pursuant to an Exemptive Order issued by the Securities and Exchange Commission, the fund, along with certain other funds in the American Century Investments family of funds, may transfer uninvested cash balances into a joint trading account. These balances are invested in one or more repurchase agreements that are collateralized by U.S. Treasury or Agency obligations.
Income Tax Status — It is the fund’s policy to distribute substantially all net investment income and net realized gains to shareholders and to otherwise qualify as a regulated investment company under provisions of the Internal Revenue Code. The fund is no longer subject to examination by tax authorities for years prior to 2006. At this time, management believes there are no uncertain tax positions which, based on their technical merit, would not be sustained upon examination and for which it is reasonably possible that the total amounts of unrecognized tax benefits will significantly change in the next twelve months. Accordingly, no provision has been made for federal or state income taxes.
Distributions to Shareholders — Distributions to shareholders are recorded on the ex-dividend date. Distributions from net investment income, if any, are generally declared and paid quarterly. Distributions from net realized gains, if any, are generally declared and paid annually.
Indemnifications — Under the corporation’s organizational documents, its officers and directors are indemnified against certain liabilities arising out of the performance of their duties to the fund. In addition, in the normal course of business, the fund enters into contracts that provide general indemnifications. The maximum exposure under these arrangements is unknown as this would involve future claims that may be made against a fund. The risk of material loss from such claims is considered by management to be remote.
Use of Estimates — The financial statements are prepared in conformity with accounting principles generally accepted in the United States of America, which may require management to make certain estimates and assumptions at the date of the financial statements. Actual results could differ from these estimates.
Subsequent Events — In preparing the financial statements, management evaluated the impact of events or transactions occurring through the date the financial statements were issued that would merit recognition or disclosure.
23
2. Fees and Transactions with Related Parties
Management Fees — The corporation has entered into a Management Agreement with ACIM, under which ACIM provides the fund with investment advisory and management services in exchange for a single, unified management fee (the fee) per class. The Agreement provides that all expenses of managing and operating the fund, except brokerage expenses, taxes, interest, fees and expenses of the independent directors (including legal counsel fees), and extraordinary expenses, will be paid by ACIM. The fee is computed and accrued daily based on the daily net assets of the specific class of shares of the fund and paid monthly in arrears. The fee consists of (1) an Investment Category Fee based on the daily net assets of the fund and certain other accounts managed by the investment advisor that are in the same broad investment category as the fund and (2) a Complex Fee based on the assets of all the funds in the American Century Investments family of funds. The rates for the Investment Category Fee range from 0.5380% to 0.7200%. The rates for the Complex Fee range from 0.2500% to 0.3100% for the Investor Class, A Class, C Class and R Class. The Institutional Class is 0.2000% less at each point within the Complex Fee range. The effective annual management fee for each class for the year ended June 30, 2010 was 0.89% for the Investor Class, A Class, C Class and R Class and 0.69% for the Institutional Class.
Distribution and Service Fees — The Board of Directors has adopted a separate Master Distribution and Individual Shareholder Services Plan for each of the A Class, C Class and R Class (collectively the plans), pursuant to Rule 12b-1 of the 1940 Act. The plans provide that the A Class will pay American Century Investment Services, Inc. (ACIS) an annual distribution and service fee of 0.25%. The plans provide that the C Class will pay ACIS an annual distribution fee of 0.75% and service fee of 0.25%. The plans provide that the R Class will pay ACIS an annual distribution and service fee of 0.50%. The fees are computed and accrued daily based on each class’s daily net assets and paid monthly in arrears. The fees are used to pay financial intermediaries for distribution and individual shareholder services. Fees incurred under the plans during the year ended June 30, 2010, are detailed in the Statement of Operations.
Related Parties — Certain officers and directors of the corporation are also officers and/ or directors of American Century Companies, Inc. (ACC), the parent of the corporation’s investment advisor, ACIM, the distributor of the corporation, ACIS, and the corporation’s transfer agent, American Century Services, LLC.
The fund is eligible to invest in a money market fund for temporary purposes, which is managed by J.P. Morgan Investment Management, Inc. (JPMIM). The fund has a Mutual Funds Services Agreement with J.P. Morgan Investor Services Co. (JPMIS) and a securities lending agreement with JPMorgan Chase Bank (JPMCB). JPMCB is a custodian of the fund. JPMIM, JPMIS and JPMCB are wholly owned subsidiaries of JPMorgan Chase & Co. (JPM). JPM is an equity investor in ACC.
3. Investment Transactions
Purchases and sales of investment securities, excluding short-term investments, for the year ended June 30, 2010, were $169,092,081 and $370,041,301, respectively.
24
| | | | |
| 4. Capital Share Transactions | | | | |
| |
| Transactions in shares of the fund were as follows: | | |
| | Year ended June 30, 2010(1) | Year ended June 30, 2009 |
| | Shares | Amount | Shares | Amount |
| Investor Class/Shares Authorized | 200,000,000 | | 300,000,000 | |
| Sold | 6,026,003 | $ 37,994,445 | 8,140,614 | $ 43,124,091 |
| Issued in reinvestment of distributions | 124,183 | 726,474 | 36,272 | 174,470 |
| Redeemed | (13,958,800) | (85,789,769) | (20,775,835) | (116,216,721) |
| | (7,808,614) | (47,068,850) | (12,598,949) | (72,918,160) |
| Institutional Class/Shares Authorized | 100,000,000 | | 150,000,000 | |
| Sold | 2,248,248 | 13,629,955 | 6,172,373 | 33,468,783 |
| Issued in reinvestment of distributions | 125,008 | 733,796 | 76,048 | 366,551 |
| Redeemed | (23,997,286) | (143,972,848) | (5,812,005) | (31,896,958) |
| | (21,624,030) | (129,609,097) | 436,416 | 1,938,376 |
| A Class/Shares Authorized | 140,000,000 | | 150,000,000 | |
| Sold | 908,317 | 5,484,932 | 3,156,340 | 16,418,219 |
| Issued in reinvestment of distributions | 12,896 | 74,282 | — | — |
| Redeemed | (5,064,490) | (30,286,455) | (24,106,346) | (141,417,268) |
| | (4,143,277) | (24,727,241) | (20,950,006) | (124,999,049) |
| C Class/Shares Authorized | 10,000,000 | | N/A | |
| Sold | 3,906 | 25,000 | | |
| R Class/Shares Authorized | 10,000,000 | | 10,000,000 | |
| Sold | 30,549 | 173,724 | 40,629 | 187,307 |
| Redeemed | (32,215) | (190,827) | (8,292) | (49,402) |
| | (1,666) | (17,103) | 32,337 | 137,905 |
| Net increase (decrease) | (33,573,681) | $(201,397,291) | (33,080,202) | $(195,840,928) |
| (1) March 1, 2010 (commencement of sale) through June 30, 2010 for the C Class. | | |
5. Fair Value Measurements
The fund’s securities valuation process is based on several considerations and may use multiple inputs to determine the fair value of the positions held by the fund. In conformity with accounting principles generally accepted in the United States of America, the inputs used to determine a valuation are classified into three broad levels as follows:
• Level 1 valuation inputs consist of unadjusted quoted prices in an active market for identical securities;
• Level 2 valuation inputs consist of significant direct or indirect observable market data (including quoted prices for similar securities, evaluations of subsequent market events, interest rates, prepayment speeds, credit risk, etc.); or
• Level 3 valuation inputs consist of significant unobservable inputs (including a fund’s own assumptions).
The level classification is based on the lowest level input that is significant to the fair valuation measurement. The valuation inputs are not an indication of the risks associated with investing in these securities or other financial instruments.
As of June 30, 2010, the valuation inputs used to determine the fair value of the investment securities were classified as Level 1. The Schedule of Investments provides additional details on the fund’s portfolio holdings.
25
6. Derivative Instruments
Equity Price Risk — The fund is subject to equity price risk in the normal course of pursuing its investment objectives. A fund may enter into futures contracts based on an equity index in order to manage its exposure to changes in market conditions. A fund may purchase futures contracts to gain exposure to increases in market value or sell futures contracts to protect against a decline in market value. Upon entering into a futures contract, a fund is required to deposit either cash or securities in an amount equal to a certain percentage of the contract value (initial margin). Subsequent payments (variation margin) are made or received daily, in cash, by a fund. The variation margin is equal to the daily change in the contract value and is recorded as unrealized gains and losses. A fund recognizes a realized gain or loss when the contract is closed or expires. Net realized and unrealized gains or losses occurring during the holding period of futures contracts are a component of net realized gain (loss) on futures contract transactions and change in net unrealized appreciation (depreciation) on futures contracts, respectively. One of the risks of entering into futures contracts is the possibility that the change in value of the contract may not correlate with the changes in value of the underlying securities. During the period, the fund infrequently purchased equity price risk derivative instruments for temporary investment purposes.
At period end, the fund did not have any equity price risk derivative instruments on the Statement of Assets and Liabilities. For the year ended June 30, 2010, the effect of equity price risk derivative instruments on the Statement of Operations was $(1,430,241) in net realized gain (loss) on futures contract transactions.
7. Interfund Lending
The fund, along with certain other funds in the American Century Investments family of funds, may participate in an interfund lending program, pursuant to an Exemptive Order issued by the Securities and Exchange Commission (SEC). This program provides an alternative credit facility allowing the fund to borrow from or lend to other funds in the American Century Investments family of funds that permit such transactions. Interfund lending transactions are subject to each fund’s investment policies and borrowing and lending limits. The interfund loan rate earned/paid on interfund lending transactions is determined daily based on the average of certain current market rates. Interfund lending transactions normally extend only overnight, but can have a maximum duration of seven days. The program is subject to annual approval by the Board of Directors. During the year ended June 30, 2010, the fund did not utilize t he program.
8. Risk Factors
The fund concentrates its investments in stocks of small companies. Because of this, the fund may be subject to greater risk and market fluctuations than a fund investing in larger, more established companies.
26
9. Federal Tax Information
The tax character of distributions paid during the years ended June 30, 2010 and June 30, 2009 were as follows:
| | |
| | 2010 | 2009 |
| Distributions Paid From | | |
| Ordinary income | $1,657,710 | $577,413 |
| Long-term capital gains | — | — |
The book-basis character of distributions made during the year from net investment income or net realized gains may differ from their ultimate characterization for federal income tax purposes. These differences reflect the differing character of certain income items and net realized gains and losses for financial statement and tax purposes, and may result in reclassification among certain capital accounts on the financial statements.
As of June 30, 2010, the federal tax cost of investments and the components of distributable earnings on a tax-basis were as follows:
| | |
| Federal tax cost of investments | $299,489,361 |
| Gross tax appreciation of investments | $ 41,966,409 |
| Gross tax depreciation of investments | (29,198,261) |
| Net tax appreciation (depreciation) of investments | $ 12,768,148 |
| Undistributed ordinary income | $145,046 |
| Accumulated capital losses | $(242,867,475) |
The difference between book-basis and tax-basis cost and unrealized appreciation (depreciation) is attributable primarily to the tax deferral of losses on wash sales and the realization to ordinary income for tax purposes of unrealized gains on investments in passive foreign investment companies.
The accumulated capital losses listed above represent net capital loss carryovers that may be used to offset future realized capital gains for federal income tax purposes. Future capital loss carryover utilization in any given year may be subject to Internal Revenue Code limitations. The capital loss carryovers of $(83,736,640) and $(159,130,835) expire in 2017 and 2018, respectively.
27
10. Corporate Event
As part of a long-standing estate and business succession plan established by ACC Co-Chairman James E. Stowers, Jr., the founder of American Century Investments, ACC Co-Chairman Richard W. Brown succeeded Mr. Stowers as trustee of a trust that holds a greater-than-25% voting interest in ACC, the parent corporation of the fund’s advisor. Under the 1940 Act, this is presumed to represent control of ACC even though it is less than a majority interest. The change of trustee may technically be considered a “change of control” of ACC and therefore also a change of control of the fund’s advisor even though there has been no change to its management and none is anticipated. The “change of control” resulted in the assignment of the fund’s investment advisory agreement. Under the 1940 Act, an assignment automatically terminated such agreement, making the approval of a new agreement necessa ry.
On February 18, 2010, the Board of Directors approved an interim investment advisory agreement under which the fund will be managed until a new agreement is approved by fund shareholders. On April 1, 2010, the Board of Directors approved a new investment advisory agreement. The interim agreement and the new agreement are substantially identical to the terminated agreements (with the exception of different effective and termination dates) and will not result in changes in the management of American Century Investments, the fund, its investment objectives, fees or services provided. The new agreement for the fund was approved by shareholders at a Special Meeting of Shareholders on June 16, 2010. The new agreement went into effect on July 16, 2010. Management agreements for new share classes of the fund that were launched after February 16, 20 10 did not terminate, have not been replaced by interim agreements, and do not require approval of new agreements.
11. Other Tax Information (Unaudited)
The following information is provided pursuant to provisions of the Internal Revenue Code.
The fund hereby designates up to the maximum amount allowable as qualified dividend income for the fiscal year ended June 30, 2010.
For corporate taxpayers, the fund hereby designates $1,657,710, or up to the maximum amount allowable, of ordinary income distributions paid during the fiscal year ended June 30, 2010 as qualified for the corporate dividends received deduction.
28
| | | | | | | |
| Small Company | | | | | |
| |
| Investor Class | | | | | | |
| For a Share Outstanding Throughout the Years Ended June 30 (except as noted) | | |
| | | 2010 | 2009 | 2008 | 2007(1) | 2006 | 2005 |
| Per-Share Data | | | | | | |
| Net Asset Value, | | | | | | |
| Beginning of Period | $5.00 | $7.76 | $10.77 | $9.88 | $9.77 | $10.19 |
| Income From | | | | | | |
| Investment Operations | | | | | | |
| Net Investment | | | | | | |
| Income (Loss)(2) | 0.01 | 0.02 | —(3) | 0.01 | —(3) | 0.01 |
| Net Realized and | | | | | | |
| Unrealized Gain (Loss) | 1.16 | (2.78) | (2.01) | 0.88 | 0.61 | 0.71 |
| Total From | | | | | | |
| Investment Operations | 1.17 | (2.76) | (2.01) | 0.89 | 0.61 | 0.72 |
| Distributions | | | | | | |
| From Net | | | | | | |
| Investment Income | (0.02) | —(3) | (0.02) | — | (0.01) | —(3) |
| From Net | | | | | | |
| Realized Gains | — | — | (0.98) | — | (0.49) | (1.14) |
| Total Distributions | (0.02) | —(3) | (1.00) | — | (0.50) | (1.14) |
| Net Asset Value, | | | | | | |
| End of Period | $6.15 | $5.00 | $7.76 | $10.77 | $9.88 | $9.77 |
| |
| Total Return(4) | 23.39% | (35.51)% | (19.13)% | 9.01% | 6.15% | 7.13% |
| | | | | | | |
| Ratios/Supplemental Data | | | | | | |
| Ratio of Operating | | | | | | |
| Expenses to | | | | | | |
| Average Net Assets | 0.90% | 0.90% | 0.87% | 0.87%(5) | 0.87% | 0.87% |
| Ratio of Net Investment | | | | | | |
| Income (Loss) to | | | | | | |
| Average Net Assets | 0.12% | 0.33% | 0.06% | 0.23%(5) | 0.05% | 0.14% |
| Portfolio Turnover Rate | 44% | 92% | 105% | 61% | 122% | 132% |
| Net Assets, End of Period | | | | | | |
| (in thousands) | $234,727 | $229,568 | $454,464 | $910,093 | $924,133 | $1,040,036 |
| (1) | January 1, 2007 through June 30, 2007. The fund’s fiscal year end was changed from December 31 to June 30, resulting in a six-month annual |
| | reporting period. For the years before June 30, 2007, the fund’s fiscal year end was December 31. | | |
| (2) | Computed using average shares outstanding throughout the period. | | | | |
| (3) | Per-share amount was less than $0.005. | | | | | |
| (4) | Total return assumes reinvestment of net investment income and capital gains distributions, if any. Total returns for periods less than one year |
| | are not annualized. Total returns are calculated based on the net asset value of the last business day. The total return of the classes may not |
| | precisely reflect the class expense differences because of the impact of calculating the net asset values to two decimal places. If net asset |
| | values were calculated to three decimal places, the total return differences would more closely reflect the class expense differences. The |
| | calculation of net asset values to two decimal places is made in accordance with SEC guidelines and does not result in any gain or loss of |
| | value between one class and another. | | | | | |
| (5) | Annualized. | | | | | | |
See Notes to Financial Statements.
29
| | | | | | | |
| Small Company | | | | | |
| |
| Institutional Class | | | | | | |
| For a Share Outstanding Throughout the Years Ended June 30 (except as noted) | | |
| | | 2010 | 2009 | 2008 | 2007(1) | 2006 | 2005 |
| Per-Share Data | | | | | | |
| Net Asset Value, | | | | | | |
| Beginning of Period | $5.02 | $7.79 | $10.80 | $9.90 | $9.80 | $10.21 |
| Income From | | | | | | |
| Investment Operations | | | | | | |
| Net Investment | | | | | | |
| Income (Loss)(2) | 0.02 | 0.03 | 0.02 | 0.02 | 0.02 | 0.04 |
| Net Realized and | | | | | | |
| Unrealized Gain (Loss) | 1.18 | (2.79) | (2.02) | 0.88 | 0.61 | 0.71 |
| Total From | | | | | | |
| Investment Operations | 1.20 | (2.76) | (2.00) | 0.90 | 0.63 | 0.75 |
| Distributions | | | | | | |
| From Net | | | | | | |
| Investment Income | (0.03) | (0.01) | (0.03) | — | (0.04) | (0.02) |
| From Net | | | | | | |
| Realized Gains | — | — | (0.98) | — | (0.49) | (1.14) |
| Total Distributions | (0.03) | (0.01) | (1.01) | — | (0.53) | (1.16) |
| Net Asset Value, | | | | | | |
| End of Period | $6.19 | $5.02 | $7.79 | $10.80 | $9.90 | $9.80 |
| |
| Total Return(3) | 23.87% | (35.38)% | (18.99)% | 9.09% | 6.44% | 7.26% |
| | | | | | | |
| Ratios/Supplemental Data | | | | | | |
| Ratio of Operating | | | | | | |
| Expenses to | | | | | | |
| Average Net Assets | 0.70% | 0.70% | 0.67% | 0.67%(4) | 0.67% | 0.67% |
| Ratio of Net Investment | | | | | | |
| Income (Loss) to | | | | | | |
| Average Net Assets | 0.32% | 0.53% | 0.26% | 0.43%(4) | 0.25% | 0.34% |
| Portfolio Turnover Rate | 44% | 92% | 105% | 61% | 122% | 132% |
| Net Assets, End of Period | | | | | | |
| (in thousands) | $42,599 | $143,028 | $218,820 | $386,240 | $383,412 | $426,545 |
| (1) | January 1, 2007 through June 30, 2007. The fund’s fiscal year end was changed from December 31 to June 30, resulting in a six-month annual |
| | reporting period. For the years before June 30, 2007, the fund’s fiscal year end was December 31. | | |
| (2) | Computed using average shares outstanding throughout the period. | | | | |
| (3) | Total return assumes reinvestment of net investment income and capital gains distributions, if any. Total returns for periods less than one year |
| | are not annualized. Total returns are calculated based on the net asset value of the last business day. The total return of the classes may not |
| | precisely reflect the class expense differences because of the impact of calculating the net asset values to two decimal places. If net asset |
| | values were calculated to three decimal places, the total return differences would more closely reflect the class expense differences. The |
| | calculation of net asset values to two decimal places is made in accordance with SEC guidelines and does not result in any gain or loss of |
| | value between one class and another. | | | | | |
| (4) | Annualized. | | | | | | |
See Notes to Financial Statements.
30
| | | | | | | |
| Small Company | | | | | |
| |
| A Class(1) | | | | | | |
| For a Share Outstanding Throughout the Years Ended June 30 (except as noted) | | |
| | | 2010 | 2009 | 2008 | 2007(2) | 2006 | 2005 |
| Per-Share Data | | | | | | |
| Net Asset Value, | | | | | | |
| Beginning of Period | $4.91 | $7.65 | $10.64 | $9.78 | $9.69 | $10.12 |
| Income From | | | | | | |
| Investment Operations | | | | | | |
| Net Investment | | | | | | |
| Income (Loss)(3) | (0.01) | —(4) | (0.02) | —(4) | (0.02) | (0.01) |
| Net Realized and | | | | | | |
| Unrealized Gain (Loss) | 1.16 | (2.74) | (1.98) | 0.86 | 0.60 | 0.70 |
| Total From | | | | | | |
| Investment Operations | 1.15 | (2.74) | (2.00) | 0.86 | 0.58 | 0.69 |
| Distributions | | | | | | |
| From Net | | | | | | |
| Investment Income | (0.01) | — | (0.01) | — | — | — |
| From Net | | | | | | |
| Realized Gains | — | — | (0.98) | — | (0.49) | (1.12) |
| Total Distributions | (0.01) | — | (0.99) | — | (0.49) | (1.12) |
| Net Asset Value, | | | | | | |
| End of Period | $6.05 | $4.91 | $7.65 | $10.64 | $9.78 | $9.69 |
| |
| Total Return(5) | 23.40% | (35.82)% | (19.30)% | 8.79% | 6.02% | 6.74% |
| | | | | | | |
| Ratios/Supplemental Data | | | | | | |
| Ratio of Operating | | | | | | |
| Expenses to | | | | | | |
| Average Net Assets | 1.15% | 1.15% | 1.12% | 1.12%(6) | 1.12% | 1.12% |
| Ratio of Net Investment | | | | | | |
| Income (Loss) to | | | | | | |
| Average Net Assets | (0.13)% | 0.08% | (0.19)% | (0.02)%(6) | (0.20)% | (0.11)% |
| Portfolio Turnover Rate | 44% | 92% | 105% | 61% | 122% | 132% |
| Net Assets, End of Period | | | | | | |
| (in thousands) | $35,567 | $49,253 | $236,906 | $358,347 | $355,778 | $364,400 |
| (1) | Prior to March 1, 2010, the A Class was referred to as the Advisor Class. | | | |
| (2) | January 1, 2007 through June 30, 2007. The fund’s fiscal year end was changed from December 31 to June 30, resulting in a six-month annual |
| | reporting period. For the years before June 30, 2007, the fund’s fiscal year end was December 31. | | |
| (3) | Computed using average shares outstanding throughout the period. | | | | |
| (4) | Per-share amount was less than $0.005. | | | | | |
| (5) | Total return assumes reinvestment of net investment income and capital gains distributions, if any, and does not reflect applicable sales charges. |
| | Total returns for periods less than one year are not annualized. Total returns are calculated based on the net asset value of the last business day. |
| | The total return of the classes may not precisely reflect the class expense differences because of the impact of calculating the net asset values |
| | to two decimal places. If net asset values were calculated to three decimal places, the total return differences would more closely reflect the |
| | class expense differences. The calculation of net asset values to two decimal places is made in accordance with SEC guidelines and does not |
| | result in any gain or loss of value between one class and another. | | | | |
| (6) | Annualized. | | | | | | |
See Notes to Financial Statements.
31
| | |
| Small Company | |
| |
| C Class | |
| For a Share Outstanding Throughout the Years Ended June 30 (except as noted) | |
| | | 2010(1) |
| Per-Share Data | |
| Net Asset Value, Beginning of Period | $6.40 |
| Income From Investment Operations | |
| Net Investment Income (Loss)(2) | (0.02) |
| Net Realized and Unrealized Gain (Loss) | (0.25) |
| Total From Investment Operations | (0.27) |
| Net Asset Value, End of Period | $6.13 |
| |
| Total Return(3) | (4.22)% |
| | |
| Ratios/Supplemental Data | |
| Ratio of Operating Expenses to Average Net Assets | 1.90%(4) |
| Ratio of Net Investment Income (Loss) to Average Net Assets | (0.79)%(4) |
| Portfolio Turnover Rate | 44%(5) |
| Net Assets, End of Period (in thousands) | $24 |
| (1) | March 1, 2010 (commencement of sale) through June 30, 2010. | |
| (2) | Computed using average shares outstanding throughout the period. | |
| (3) | Total return assumes reinvestment of net investment income and capital gains distributions, if any, and does not reflect applicable sales charges. |
| | Total returns for periods less than one year are not annualized. Total returns are calculated based on the net asset value of the last business day. |
| | The total return of the classes may not precisely reflect the class expense differences because of the impact of calculating the net asset values |
| | to two decimal places. If net asset values were calculated to three decimal places, the total return differences would more closely reflect the |
| | class expense differences. The calculation of net asset values to two decimal places is made in accordance with SEC guidelines and does not |
| | result in any gain or loss of value between one class and another. | |
| (4) | Annualized. | |
| (5) | Portfolio turnover is calculated at the fund level. Percentage indicated was calculated for the year ended June 30, 2010. | |
See Notes to Financial Statements.
32
| | | | | | | |
| Small Company | | | | | |
| |
| R Class | | | | | | |
| For a Share Outstanding Throughout the Years Ended June 30 (except as noted) | | |
| | | 2010 | 2009 | 2008 | 2007(1) | 2006 | 2005 |
| Per-Share Data | | | | | | |
| Net Asset Value, | | | | | | |
| Beginning of Period | $4.89 | $7.63 | $10.63 | $9.78 | $9.72 | $10.15 |
| Income From | | | | | | |
| Investment Operations | | | | | | |
| Net Investment | | | | | | |
| Income (Loss)(2) | (0.02) | (0.01) | (0.04) | (0.01) | (0.05) | (0.03) |
| Net Realized and | | | | | | |
| Unrealized Gain (Loss) | 1.14 | (2.73) | (1.98) | 0.86 | 0.60 | 0.71 |
| Total From | | | | | | |
| Investment Operations | 1.12 | (2.74) | (2.02) | 0.85 | 0.55 | 0.68 |
| Distributions | | | | | | |
| From Net | | | | | | |
| Realized Gains | — | — | (0.98) | — | (0.49) | (1.11) |
| Net Asset Value, | | | | | | |
| End of Period | $6.01 | $4.89 | $7.63 | $10.63 | $9.78 | $9.72 |
| |
| Total Return(3) | 22.90% | (35.91)% | (19.51)% | 8.69% | 5.70% | 6.54% |
| | | | | | | |
| Ratios/Supplemental Data | | | | | | |
| Ratio of Operating | | | | | | |
| Expenses to | | | | | | |
| Average Net Assets | 1.40% | 1.40% | 1.37% | 1.37%(4) | 1.37% | 1.34%(5) |
| Ratio of Net Investment | | | | | | |
| Income (Loss) to | | | | | | |
| Average Net Assets | (0.38)% | (0.17)% | (0.44)% | (0.27)%(4) | (0.45)% | (0.33)%(5) |
| Portfolio Turnover Rate | 44% | 92% | 105% | 61% | 122% | 132% |
| Net Assets, End of Period | | | | | | |
| (in thousands) | $384 | $321 | $254 | $395 | $353 | $6,175 |
| (1) | January 1, 2007 through June 30, 2007. The fund’s fiscal year end was changed from December 31 to June 30, resulting in a six-month annual |
| | reporting period. For the years before June 30, 2007, the fund’s fiscal year end was December 31. | | |
| (2) | Computed using average shares outstanding throughout the period. | | | | |
| (3) | Total return assumes reinvestment of net investment income and capital gains distributions, if any. Total returns for periods less than one year |
| | are not annualized. Total returns are calculated based on the net asset value of the last business day. The total return of the classes may not |
| | precisely reflect the class expense differences because of the impact of calculating the net asset values to two decimal places. If net asset |
| | values were calculated to three decimal places, the total return differences would more closely reflect the class expense differences. The |
| | calculation of net asset values to two decimal places is made in accordance with SEC guidelines and does not result in any gain or loss of |
| | value between one class and another. | | | | | |
| (4) | Annualized. | | | | | | |
| (5) | During the year ended December 31, 2005, the class received a partial reimbursement of its distribution and service fees. Had fees not been |
| | reimbursed, the ratio of operating expenses to average net assets and ratio of net investment income (loss) to average net assets would have |
| | been 1.37% and (0.36)%, respectively. | | | | | |
See Notes to Financial Statements.
33
|
| Report of Independent Registered Public Accounting Firm |
To the Directors of the American Century Quantitative Equity Funds, Inc.
and Shareholders of the Small Company Fund:
In our opinion, the accompanying statement of assets and liabilities, including the schedule of investments, and the related statements of operations and of changes in net assets and the financial highlights present fairly, in all material respects, the financial position of the Small Company Fund (one of the eleven funds comprising the American Century Quantitative Equity Funds, Inc., hereafter referred to as the “Fund”) at June 30, 2010, the results of its operations for the year then ended, the changes in its net assets for each of the two years in the period then ended and the financial highlights for each of the periods presented, in conformity with accounting principles generally accepted in the United States of America. These financial statements and financial highlights (hereafter referred to as “financial statements”) are the responsibility of the Fund’s management; our responsibi lity is to express an opinion on these financial statements based on our audits. We conducted our audits of these financial statements in accordance with the standards of the Public Company Accounting Oversight Board (United States). Those standards require that we plan and perform the audit to obtain reasonable assurance about whether the financial statements are free of material misstatement. An audit includes examining, on a test basis, evidence supporting the amounts and disclosures in the financial statements, assessing the accounting principles used and significant estimates made by management, and evaluating the overall financial statement presentation. We believe that our audits, which included confirmation of securities at June 30, 2010 by correspondence with the custodian and brokers, provide a reasonable basis for our opinion.
PricewaterhouseCoopers LLP
Kansas City, Missouri
August 19, 2010
34
A special meeting of shareholders was held on June 16, 2010, to vote on the following proposals. Each proposal received the required number of votes and was adopted. A summary of voting results is listed below each proposal.
Proposal 1:
To elect one Director to the Board of Directors of American Century Quantitative Equity Funds, Inc. (the proposal was voted on by all shareholders of funds issued by American Century Quantitative Equity Funds, Inc.):
| | |
| Frederick L.A. Grauer | For: | 4,067,909,978 |
| | Withhold: | 174,470,448 |
| | Abstain: | 0 |
| | Broker Non-Vote: | 0 |
The other directors whose term of office continued after the meeting include Jonathan S. Thomas, John Freidenrich, Ronald J. Gilson, Peter F. Pervere, Myron S. Scholes, and John B. Shoven.
Proposal 2:
To approve a management agreement between the fund and American Century Investment Management, Inc.:
| | |
| Investor, A and R Classes | For: | 183,593,953 |
| | Against: | 2,874,064 |
| | Abstain: | 3,519,193 |
| | Broker Non-Vote: | 11,050,607 |
| |
| Institutional Class | For: | 24,719,483 |
| | Against: | 142,697 |
| | Abstain: | 403,809 |
| | Broker Non-Vote: | 74,692 |
35
The Board of Directors
The individuals listed below serve as directors of the fund. Each director will continue to serve in this capacity until death, retirement, resignation or removal from office. The mandatory retirement age for directors who are not “interested persons,” as that term is defined in the Investment Company Act (independent directors), is 73. However, the mandatory retirement age may be extended for a period not to exceed two years with the approval of the remaining independent directors.
Mr. Thomas is the only director who is an “interested person” because he currently serves as President and Chief Executive Officer of American Century Companies, Inc. (ACC), the parent company of American Century Investment Management, Inc. (ACIM or the advisor).
The other directors (more than three-fourths of the total number) are independent; that is, they have never been employees, directors or officers of, and have no financial interest in, ACC or any of its wholly owned, direct or indirect, subsidiaries, including ACIM, American Century Investment Services, Inc. (ACIS) and American Century Services, LLC (ACS). The directors serve in this capacity for eight (in the case of Mr. Thomas, 15) registered investment companies in the American Century Investments family of funds.
The following presents additional information about the directors. The mailing address for each director other than Mr. Thomas is 1665 Charleston Road, Mountain View, California 94043. The mailing address for Mr. Thomas is 4500 Main Street, Kansas City, Missouri 64111.
Independent Directors
John Freidenrich
Year of Birth: 1937
Position(s) with the Fund: Director
Length of Time Served: Since 2005
Principal Occupation(s) During the Past Five Years: Founder, Member and Manager, Regis
Management Company, LLC (investment management firm) (April 2004 to present)
Number of Funds in Fund Complex Overseen by Director: 41
Other Directorships Held by Director During the Past Five Years: None
Education/Other Professional Experience: AB in Economics, Stanford University; LLB,
Stanford Law School; formerly, Partner and Founder, Ware and Freidenrich Law
Firm and Bay Partners; formerly, President, Board of Trustees, Stanford University
Ronald J. Gilson
Year of Birth: 1946
Position(s) with the Fund: Director and Chairman of the Board
Length of Time Served: Since 1995
Principal Occupation(s) During the Past Five Years: Charles J. Meyers Professor of Law and
Business, Stanford Law School (1979 to present); Marc and Eva Stern Professor of
Law and Business, Columbia University School of Law (1992 to present)
Number of Funds in Fund Complex Overseen by Director: 41
Other Directorships Held by Director During the Past Five Years: None
Education/Other Professional Experience: BA, Washington University; JD, Yale Law School;
formerly, Attorney, Steinhart, Goldberg, Feigenbaum & Ladar
36
Frederick L. A. Grauer
Year of Birth: 1946
Position(s) with the Fund: Director
Length of Time Served: Since 2008
Principal Occupation(s) During the Past Five Years: Senior Advisor, BlackRock, Inc. (investment
management firm) (2010 to present); Senior Advisor, Barclays Global Investors
(investment management firm) (2003 to 2009)
Number of Funds in Fund Complex Overseen by Director: 41
Other Directorships Held by Director During the Past Five Years: None
Education/Other Professional Experience: BA in Economics, University of British Columbia;
MA in Economics, University of Chicago; PhD in Business, Stanford University;
formerly, Executive Chairman, Barclays Global Investors; Chairman and Chief
Executive Officer, Wells Fargo Nikko Investment Advisors; and Vice President,
Merrill Lynch Capital Markets Group; formerly, Director, New York Stock Exchange,
Chicago Mercantile Exchange and Columbia University; formerly, Faculty Member,
Graduate School of Business, Columbia University and Alfred P. Sloan School of
Management, Massachusetts Institute of Technology
Peter F. Pervere
Year of Birth: 1947
Position(s) with the Fund: Director
Length of Time Served: Since 2007
Principal Occupation(s) During the Past Five Years: Retired
Number of Funds in Fund Complex Overseen by Director: 41
Other Directorships Held by Director During the Past Five Years: Intraware, Inc. (2003 to 2009);
Digital Impact, Inc. (2003 to 2005)
Education/Other Professional Experience: BA in History, Stanford University; CPA; formerly,
Vice President and Chief Financial Officer, Commerce One, Inc. (software and
services provider); formerly, Vice President and Corporate Controller, Sybase, Inc.;
formerly with accounting firm of Arthur Young & Co.
Myron S. Scholes
Year of Birth: 1941
Position(s) with the Fund: Director
Length of Time Served: Since 1980
Principal Occupation(s) During the Past Five Years: Chairman, Platinum Grove Asset
Management, L.P. (asset manager) (1999 to 2009); Frank E. Buck Professor of
Finance-Emeritus, Stanford Graduate School of Business (1996 to present)
Number of Funds in Fund Complex Overseen by Director: 41
Other Directorships Held by Director During the Past Five Years: Dimensional Fund Advisors
(investment advisor); CME Group, Inc. (futures and options exchange)
Education/Other Professional Experience: BA in Economics, McMaster University (Ontario);
MBA and PhD, University of Chicago; formerly, Senior Research Fellow at the
Hoover Institute; formerly, Edward Eagle Brown Professor of Finance, University of
Chicago; recipient of the Alfred Nobel Memorial Prize in Economic Sciences
37
John B. Shoven
Year of Birth: 1947
Position(s) with the Fund: Director
Length of Time Served: Since 2002
Principal Occupation(s) During the Past Five Years: Professor of Economics, Stanford University
(1973 to present)
Number of Funds in Fund Complex Overseen by Director: 41
Other Directorships Held by Director During the Past Five Years: Cadence Design Systems;
Exponent; Financial Engines; PalmSource, Inc. (2002 to 2005); Watson Wyatt
Worldwide (2002 to 2006)
Education/Other Professional Experience: BA in Physics, University of California; PhD in
Economics, Yale University; Director of the Stanford Institute for Economic Policy
Research (1999 to present); formerly, Chair of Economics and Dean of Humanities
and Sciences, Stanford University
Interested Director
Jonathan S. Thomas
Year of Birth: 1963
Position(s) with the Fund: Director and President
Length of Time Served: Since 2007
Principal Occupation(s) During the Past Five Years: President and Chief Executive Officer,
ACC (March 2007 to present); Chief Administrative Officer, ACC (February 2006 to
February 2007); Executive Vice President, ACC (November 2005 to February 2007);
Global Chief Operating Officer and Managing Director, Morgan Stanley (investment
management) (March 2000 to November 2005). Also serves as: Chief Executive
Officer and Manager, ACS; Executive Vice President, ACIM; Director, ACC, ACIM
and other ACC subsidiaries
Number of Funds in Fund Complex Overseen by Director: 104
Other Directorships Held by Director During the Past Five Years: None
Education/Other Professional Experience: BA in Economics, University of Massachusetts;
MBA, Boston College; formerly held senior leadership roles with Fidelity
Investments, Boston Financial Services and Bank of America; serves on the Board of
Governors of the Investment Company Institute
38
Officers
The following table presents certain information about the executive officers of the fund. Each officer serves as an officer for each of the 15 investment companies in the American Century family of funds, unless otherwise noted. No officer is compensated for his or her service as an officer of the fund. The listed officers are interested persons of the fund and are appointed or re-appointed on an annual basis. The mailing address for each of the officers listed below is 4500 Main Street, Kansas City, Missouri 64111.
| | |
| Name | Offices with | |
| (Year of Birth) | the Fund | Principal Occupation(s) During the Past Five Years |
| Jonathan S. | Director and | President and Chief Executive Officer, ACC (March 2007 to present); Chief |
| Thomas | President | Administrative Officer, ACC (February 2006 to February 2007); Executive Vice |
| (1963) | since 2007 | President, ACC (November 2005 to February 2007); Global Chief Operating |
| | | Officer and Managing Director, Morgan Stanley (March 2000 to November |
| | | 2005). Also serves as: Chief Executive Officer and Manager, ACS; Executive |
| | | Vice President, ACIM; Director, ACC, ACIM and other ACC subsidiaries |
| Barry Fink | Executive Vice | Chief Operating Officer and Executive Vice President, ACC (September 2007 |
| (1955) | President | to present); President, ACS (October 2007 to present); Managing Director, |
| | since 2007 | Morgan Stanley (2000 to 2007); Global General Counsel, Morgan Stanley |
| | | (2000 to 2006). Also serves as: Manager, ACS, and Director, ACC and |
| | | certain ACC subsidiaries |
| Maryanne L. | Chief Compliance | Chief Compliance Officer, American Century funds, ACIM and ACS (August |
| Roepke | Officer since 2006 | 2006 to present); Assistant Treasurer, ACC (January 1995 to August 2006); |
| (1956) | and Senior Vice | and Treasurer and Chief Financial Officer, various American Century funds |
| | President | (July 2000 to August 2006). Also serves as: Senior Vice President, ACS |
| | since 2000 | |
| Charles A. | General Counsel | Attorney, ACC (February 1994 to present); Vice President, ACC (November |
| Etherington | since 2007 and | 2005 to present); General Counsel, ACC (March 2007 to present); Also |
| (1957) | Senior Vice | serves as General Counsel, ACIM, ACS, ACIS and other ACC subsidiaries; |
| | President | and Senior Vice President, ACIM and ACS |
| | since 2006 | |
| Robert J. Leach | Vice President, | Vice President, ACS (February 2000 to present); and Controller, various |
| (1966) | Treasurer and | American Century funds (1997 to September 2006) |
| | Chief Financial | |
| | Officer since 2006 | |
| David H. Reinmiller | Vice President | Attorney, ACC (January 1994 to present); Associate General Counsel, ACC |
| (1963) | since 2001 | (January 2001 to present); Chief Compliance Officer, American Century |
| | | funds and ACIM (January 2001 to February 2005). Also serves as: Vice |
| | | President, ACIM and ACS |
| Ward D. Stauffer | Secretary | Attorney, ACC (June 2003 to Present) |
| (1960) | since 2005 | |
The SAI has additional information about the fund’s directors and is available without charge, upon request, by calling 1-800-345-2021.
39
|
| Board Approval of Management Agreements |
American Century Investment Management, Inc. (“ACIM” or the “Advisor”) currently serves as investment advisor to the Fund under a management agreement (the “Current Management Agreement”) that took effect on July 16, 2010, following approval by the Fund’s Board of Directors (the “Board”) and shareholders. The Advisor previously served as investment advisor to the Fund pursuant to a prior management agreement (the “Prior Management Agreement”) and an interim management agreement (the “Interim Management Agreeement”). The Interim Management Agreement terminated in accordance with its terms on July 16, 2010, upon the effectiveness of the Current Management Agreement. The Prior Management Agreement terminated on February 16, 2010, as a result of a change of control of the Advisor’s parent company, American Century Companies, Inc. (“ACC”). The change in control occurred as the result of a change in the trustee of a trust created by James E. Stowers, Jr., the founder of American Century Investments that holds shares representing a significant interest in ACC stock. Mr. Stowers previously served as the trustee of the trust. On February 16, 2010, Richard W. Brown, Co-Chairman of ACC with Mr. Stowers, became the trustee in accordance with the terms of the trust and Mr. Stowers’ long-standing estate and succession plan.
On February 18, 2010, the Board approved the Interim Management Agreement in accordance with Rule 15a-4 under the Investment Company Act to ensure continued management of the Fund by the Advisor after the termination of the Prior Management Agreement and until shareholder approval of the Current Management Agreement as required under the Act. The Board approved the Current Management Agreement and recommended its approval to shareholders. Fund shareholders approved the Current Management Agreement at a meeting held on June 16, 2010.*
The Interim Management Agreement and the Current Management Agreement are substantially identical to the Prior Management Agreement except for their effective dates and the termination provisions of the Interim Management Agreement. Under the Interim and Current Management Agreements, the Advisor will provide the same services to the Fund and receive the same compensation rate as under the Prior Management Agreement.
Basis for Board Approval of Interim Management Agreement
In considering the approval of the Interim Management Agreement, Rule 15a-4 requires the Board to approve the contract within ten business days of the termination of the prior agreement and to determine that the compensation to be received under the interim agreement is no greater than would have been received under the prior agreement. In connection with the approval, the Board noted that it oversees on a continuous basis and evaluates at its quarterly meetings, directly and through the committees of the Board, the nature and quality of significant services provided by the Advisor, the investment performance of the Fund, shareholder services, audit and compliance functions and a variety of other matters relating to the Fund’s operations.
|
| *Management agreements for new share classes of the Fund launched after February 16, 2010, did not terminate, have not been replaced by Interim |
| Management Agreements, and do not require Board or shareholder approval at this time. |
40
In evaluating the Interim Management Agreement, the Board, assisted by the advice of its independent legal counsel, considered a number of factors in addition to those required by the rule with no one factor being determinative to its analysis. Among the factors considered by the Board were the circumstances and effect of the change of control, the fact that the Advisor will provide the same services and receive the same compensation rate as under the Prior Management Agreement, and that the change of control did not result in a change of the personnel managing the Fund. Upon completion of its analysis, the Board approved the Interim Management Agreement, determining that the continued management of the Fund by the Advisor was in the best interests of the Fund and Fund shareholders.
Basis for Board Approval of Current Management Agreement
At a meeting held on April 1, 2010, after considering all information presented, the Board approved, and determined to recommend that shareholders approve, the Current Management Agreement. In connection with that approval, the Board requested and reviewed extensive data and information compiled by the Advisor and certain independent providers of evaluation data concerning the Fund and services provided to the Fund by the Advisor. The Board oversees on a continuous basis and evaluates at its quarterly meetings, directly and through the committees of the Board, the nature and quality of significant services provided by the Advisor, the investment performance of the Fund, shareholder services, audit and compliance functions and a variety of other matters relating to the Fund’s operations. The information considered and the discussions held at the meetings included, but were not limited to:
• the nature, extent and quality of investment management, shareholder services and other services provided to the Fund;
• the wide range of programs and services the Advisor provides to the Fund and its shareholders on a routine and non-routine basis;
• the compliance policies, procedures, and regulatory experience of the Advisor;
• data comparing the cost of owning the Fund to the cost of owning similar funds;
• the fact that there will be no changes to the fees, services, or personnel who provide such services as compared to the Prior Management Agreement;
• data comparing the Fund’s performance to appropriate benchmarks and/or a peer group of other mutual funds with similar investment objectives and strategies;
• financial data showing the profitability of the Fund to the Advisor and the overall profitability of the Advisor;
• data comparing services provided and charges to the Fund with those for other non-fund investment management clients of the Advisor; and
41
• consideration of collateral or “fall-out” benefits derived by the Advisor from the management of the Fund and potential sharing of economies of scale in connection with the management of the Fund.
The Board also considered whether there was any reason for not continuing the existing arrangement with the Advisor. In particular, the Board recognized that shareholders may have invested in the Fund on the strength of the Advisor’s industry standing and reputation and in the expectation that the Advisor will have a continuing role in providing advisory services to the Fund.
The Board considered all of the information provided by the Advisor, the independent data providers, and the Board’s independent legal counsel, and evaluated such information for the Fund. The Board did not identify any single factor as being all-important or controlling, and each Board member may have attributed different levels of importance to different factors. In deciding to approve the Current Management Agreement under the terms ultimately determined by the Board to be appropriate, the Board based its decision on a number of factors, including the following:
Nature, Extent and Quality of Services — Generally. Under the Current Management Agreement, the Advisor is responsible for providing or arranging for all services necessary for the operation of the Fund. The Board noted that under the Current Management Agreement, the Advisor provides or arranges at its own expense a wide variety of services including:
• constructing and designing the Fund
• portfolio research and security selection
• initial capitalization/funding
• securities trading
• Fund administration
• custody of Fund assets
• daily valuation of the Fund’s portfolio
• shareholder servicing and transfer agency, including shareholder
confirmations, recordkeeping and communications
• legal services
• regulatory and portfolio compliance
• financial reporting
• marketing and distribution
42
The Board noted that many of these services have expanded over time both in terms of quantity and complexity in response to shareholder demands, competition in the industry, changing distribution channels and the changing regulatory environment.
Investment Management Services. The investment management services provided to the Fund are complex and provide Fund shareholders access to professional money management, instant diversification of their investments within an asset class, the opportunity to easily diversify among asset classes, and liquidity. As a part of its general oversight and in evaluating investment performance, the Board expects the Advisor to manage the Fund in accordance with its investment objectives and approved strategies. In providing these services, the Advisor utilizes teams of investment professionals who require extensive information technology, research, training, compliance and other systems to conduct their business. The Board, directly and through its Portfolio Committee, regularly reviews investment performance information for the Fund, t ogether with comparative information for appropriate benchmarks and/or peer groups of similarly-managed funds, over different time horizons. If performance concerns are identified, the underperforming Fund receives special reviews until performance improves, during which time the Board discusses with the Advisor the reasons for such underperformance and any efforts being undertaken to improve performance.
Shareholder and Other Services. Under the Current Management Agreement, the Advisor will also provide the Fund with a comprehensive package of transfer agency, shareholder, and other services. The Board, directly and through the various committees of the Board, regularly reviews reports and evaluations of such services. These reports include, but are not limited to, information regarding the operational efficiency and accuracy of the shareholder and transfer agency services provided, staffing levels, shareholder satisfaction (as measured by external as well as internal sources), technology support, new products and services offered to Fund shareholders, securities trading activities, portfolio valuation services, auditing services, and legal and operational compliance activities. Certain aspects of shareholder and transfer age ncy service level efficiency and the quality of securities trading activities are measured by independent third party providers and are presented in comparison to other fund groups not managed by the Advisor.
Costs of Services Provided and Profitability. The Advisor provided detailed information concerning its cost of providing various services to the Fund, its profitability in managing the Fund, its overall profitability, and its financial condition. The Board reviewed with the Advisor the methodology used to prepare this financial information. The Board has also reviewed with the Advisor its methodology for compensating the investment professionals that provide services to the Fund as well as compensation to the five highest paid personnel of the Advisor. This financial information regarding the Advisor is considered in order to evaluate the Advisor’s financial condition, its ability to continue to provide services under the Current Management Agreement, and the reasonableness of the current management fees.
43
Ethics. The Board generally considers the Advisor’s commitment to providing quality services to shareholders and to conducting its business ethically. It noted that the Advisor’s practices generally meet or exceed industry best practices.
Economies of Scale. The Board also reviewed information provided by the Advisor regarding the possible existence of economies of scale in connection with the management of the Fund. The Board concluded that economies of scale are difficult to measure and predict with precision, especially on a fund-by-fund basis. The analysis of economies of scale is further complicated by the additional services and content provided by the Advisor and its reinvestment in its ability to provide and expand those services. Accordingly, the Board seeks to evaluate economies of scale by reviewing information, such as year-over-year profitability of the Advisor generally, the profitability of its management of the Fund specifically, and the expenses incurred by the Advisor in providing various functions to the Fund. The Board believes the Advisor i s appropriately sharing economies of scale through its competitive fee structure, offering competitive fees from fund inception, fee breakpoints as the fund complex and the Fund increases in size, and through reinvestment in its business to provide shareholders additional services and enhancements to existing services. In particular, separate breakpoint schedules based on the size of the entire fund complex and on the size of the Fund reflect the complexity of assessing economies of scale.
Comparison to Fees of Funds not Managed by the Advisor. Both the Prior and Current Management Agreements provide that the Fund pays the Advisor a single, all-inclusive (or unified) management fee for providing all services necessary for the management and operation of the Fund, other than brokerage expenses, taxes, interest, extraordinary expenses, and the fees and expenses of the Fund’s Independent Directors (including their independent legal counsel) and expenses incurred in connection with the provision of shareholder services and distribution services under a plan adopted pursuant to Rule 12b-1 under the 1940 Act. Under the unified fee structure, the Advisor is responsible for providing all investment advisory, custody, audit, administrative, compliance, recordkeeping, marketing and shareholder services, or arranging and supervising third parties that provide such services. By contrast, most other funds are charged a variety of fees, including an investment advisory fee, a transfer agency fee, an administrative fee, distribution charges and other expenses. Other than their investment advisory fees and any applicable Rule 12b-1 distribution fees, the components of the total fees charged by these other funds may be increased without shareholder approval. The Board believes the unified fee structure is a benefit to Fund shareholders because it clearly discloses to shareholders the cost of owning Fund shares, and, since the unified fee cannot be increased without a vote of Fund shareholders, it shifts to the Advisor the risk of increased costs of operating the Fund and provides a direct incentive to minimize administrative inefficiencies. Part of the Board’s analysis of fee levels involves reviewing certain evaluative data compiled by an independent provider comparing the Fund’s unified fee to
44
the total expense ratios of similar funds not managed by the Advisor. The Board concluded that the management fee to be paid by the Fund to the Advisor under the Current Management Agreement is reasonable in light of the services to be provided to the Fund.
Comparison to Fees and Services Provided to Other Clients of the Advisor. The Board also requested and received information from the Advisor concerning the nature and extent of the services, fees, and profitability of its advisory services to advisory clients other than the Fund. They observed that these varying types of client accounts require different services and involve different regulatory and entrepreneurial risks than the management of the Fund. The Board analyzed this information and concluded that the fees charged and services provided to the Fund were reasonable by comparison.
Collateral or “Fall-Out” Benefits Derived by the Advisor. The Board considered the existence of collateral benefits the Advisor may receive as a result of its relationship with the Fund. The Board concluded that the Advisor’s primary business is managing mutual funds and it generally does not use Fund or shareholder information to generate profits in other lines of business, and therefore does not derive any significant collateral benefits from them. The Board noted that the Advisor receives proprietary research from broker-dealers that execute Fund portfolio transactions and concluded that this research is likely to benefit Fund shareholders. The Board also determined that the Advisor is able to provide investment management services to certain clients other than the Fund, at least in part, due to its existing infrastructure built to serve the fund complex. The Board concluded, however, that the assets of those other clients are not material to the analysis and, in any event, are included with the assets of the Fund to determine breakpoints in the Fund’s fee schedule, provided they are managed using the same investment team and strategy.
Conclusion of the Board. As a result of this process, the Board, in the absence of particular circumstances and assisted by the advice of its independent legal counsel, taking into account all of the factors discussed above and the information provided by the Advisor and others, concluded that the Current Management Agreement be approved and recommended its approval to Fund shareholders.
45
Retirement Account Information
As required by law, distributions you receive from certain IRAs, or 403(b), 457 and qualified plans are subject to federal income tax withholding, unless you elect not to have withholding apply. Tax will be withheld on the total amount withdrawn even though you may be receiving amounts that are not subject to withholding, such as nondeductible contributions. In such case, excess amounts of withholding could occur. You may adjust your withholding election so that a greater or lesser amount will be withheld.
If you don’t want us to withhold on this amount, you must notify us to not withhold the federal income tax. You may notify us in writing or in certain situations by telephone or through other electronic means. You have the right to revoke your withholding election at any time and any election you make may remain in effect until revoked by filing a new election.
Remember, even if you elect not to have income tax withheld, you are liable for paying income tax on the taxable portion of your withdrawal. If you elect not to have income tax withheld or you don’t have enough income tax withheld, you may be responsible for payment of estimated tax. You may incur penalties under the estimated tax rules if your withholding and estimated tax payments are not sufficient. You can reduce or defer the income tax on a distribution by directly or indirectly rolling such distribution over to another IRA or eligible plan. You should consult your tax advisor for additional information.
State tax will be withheld if, at the time of your distribution, your address is within one of the mandatory withholding states and you have federal income tax withheld. State taxes will be withheld from your distribution in accordance with the respective state rules.
Proxy Voting Guidelines
American Century Investment Management, Inc., the fund’s investment advisor, is responsible for exercising the voting rights associated with the securities purchased and/or held by the fund. A description of the policies and procedures the advisor uses in fulfilling this responsibility is available without charge, upon request, by calling 1-800-345-2021. It is also available on American Century Investments’ website at americancentury.com and on the Securities and Exchange Commission’s website at sec.gov. Information regarding how the investment advisor voted proxies relating to portfolio securities during the most recent 12-month period ended June 30 is available on the “About Us” page at americancentury.com. It is also available at sec.gov.
Quarterly Portfolio Disclosure
The fund files its complete schedule of portfolio holdings with the Securities and Exchange Commission (SEC) for the first and third quarters of each fiscal year on Form N-Q. The fund’s Forms N-Q are available on the SEC’s website at sec.gov, and may be reviewed and copied at the SEC’s Public Reference Room in Washington, DC. Information on the operation of the Public Reference Room may be obtained by calling 1-800-SEC-0330. The fund also makes its complete schedule of portfolio holdings for the most recent quarter of its fiscal year available on its website at americancentury.com and, upon request, by calling 1-800-345-2021.
46
The following indices are used to illustrate investment market, sector, or style performance or to serve as fund performance comparisons. They are not investment products available for purchase.
The Russell 1000® Index is a market-capitalization weighted, large-cap index created by Frank Russell Company to measure the performance of the 1,000 largest publicly traded U.S. companies, based on total market capitalization.
The Russell 1000® Growth Index measures the performance of those Russell 1000 Index companies (the 1,000 largest publicly traded U.S. companies, based on total market capitalization) with higher price-to-book ratios and higher forecasted growth values.
The Russell 1000® Value Index measures the performance of those Russell 1000 Index companies (the 1,000 largest publicly traded U.S. companies, based on total market capitalization) with lower price-to-book ratios and lower forecasted growth values.
The Russell 2000® Index is a market-capitalization weighted index created by Frank Russell Company to measure the performance of the 2,000 smallest of the 3,000 largest publicly traded U.S. companies, based on total market capitalization.
The Russell 2000® Growth Index measures the performance of those Russell 2000 Index companies (the 2,000 smallest of the 3,000 largest publicly traded U.S. companies, based on total market capitalization) with higher price-to-book ratios and higher forecasted growth values.
The Russell 2000® Value Index measures the performance of those Russell 2000 Index companies (the 2,000 smallest of the 3,000 largest publicly traded U.S. companies, based on total market capitalization) with lower price-to-book ratios and lower forecasted growth values.
The Russell Midcap® Index measures the performance of the 800 smallest of the 1,000 largest publicly traded U.S. companies, based on total market capitalization.
The Russell Midcap® Growth Index measures the performance of those Russell Midcap Index companies (the 800 smallest of the 1,000 largest publicly traded U.S. companies, based on total market capitalization) with higher price-to-book ratios and higher forecasted growth values.
The Russell Midcap® Value Index measures the performance of those Russell Midcap Index companies (the 800 smallest of the 1,000 largest publicly traded U.S. companies, based on total market capitalization) with lower price-to-book ratios and lower forecasted growth values.
47
The S&P 500 Index is a market value-weighted index of the stocks of 500 publicly traded U.S. companies chosen for market size, liquidity, and industry group representation that are considered to be leading firms in dominant industries. Each stock’s weight in the index is proportionate to its market value. Created by Standard & Poor’s, it is considered to be a broad measure of U.S. stock market performance.
The S&P SmallCap 600 Index, a capitalization-weighted index consisting of 600 domestic stocks, measures the small company segment of the U.S. market.
48

| |
| |
| Contact Us | |
| americancentury.com | |
| Automated Information Line | 1-800-345-8765 |
| Investor Services Representative | 1-800-345-2021 or |
| | 816-531-5575 |
| Investors Using Advisors | 1-800-378-9878 |
| Business, Not-For-Profit, Employer-Sponsored | |
| Retirement Plans | 1-800-345-3533 |
| Banks and Trust Companies, Broker-Dealers, | |
| Financial Professionals, Insurance Companies | 1-800-345-6488 |
| Telecommunications Device for the Deaf | 1-800-634-4113 |
| American Century Quantitative Equity Funds, Inc. | |
| Investment Advisor: | |
| American Century Investment Management, Inc. | |
| Kansas City, Missouri | |
This report and the statements it contains are submitted for the general
information of our shareholders. The report is not authorized for distribution to
prospective investors unless preceded or accompanied by an effective prospectus.
American Century Investment Services, Inc., Distributor
©2010 American Century Proprietary Holdings, Inc. All rights reserved.
1008
CL-ANN-69053
|
| Annual Report |
| June 30, 2010 |

|
| American Century Investments® |
NT Small Company Fund
| |
| President’s Letter | 2 |
| Market Perspective | 3 |
| U.S. Stock Index Returns | 3 |
| |
| NT Small Company | |
| |
| Performance | 4 |
| Portfolio Commentary | 6 |
| Top Ten Holdings | 8 |
| Five Largest Overweights | 8 |
| Five Largest Underweights. | 8 |
| Types of Investments in Portfolio | 8 |
| |
| Shareholder Fee Example | 9 |
| |
| Financial Statements | |
| |
| Schedule of Investments | 11 |
| Statement of Assets and Liabilities | 19 |
| Statement of Operations | 20 |
| Statement of Changes in Net Assets | 21 |
| Notes to Financial Statements | 22 |
| Financial Highlights | 27 |
| Report of Independent Registered Public Accounting Firm | 28 |
| |
| Other Information | |
| |
| Proxy Voting Results | 29 |
| Management | 30 |
| Board Approval of Management Agreements | 34 |
| Additional Information | 40 |
| Index Definitions | 41 |
Any opinions expressed in this report reflect those of the author as of the date of the report, and do not necessarily represent the opinions of American Century Investments or any other person in the American Century Investments organization. Any such opinions are subject to change at any time based upon market or other conditions and American Century Investments disclaims any responsibility to update such opinions. These opinions may not be relied upon as investment advice and, because investment decisions made by American Century Investments funds are based on numerous factors, may not be relied upon as an indication of trading intent on behalf of any American Century Investments fund. Security examples are used for representational purposes only and are not intended as recommendations to purchase or sell securities. Performance information for comparative indices and securities is provided to American Century Investments by third party vendors. To the best of American Century Investments’ knowledge, such information is accurate at the time of printing.

Dear Investor:
To learn more about the capital markets, your investment, and the portfolio management strategies American Century Investments provides, we encourage you to review this shareholder report for the financial reporting period ended June 30, 2010.
On the following pages, you will find investment performance and portfolio information, presented with the expert perspective and commentary of our portfolio management team. This report remains one of our most important vehicles for conveying the information you need about your investment performance, and about the market factors and strategies that affect fund returns. For additional information on the markets, we encourage you to visit the “Insights & News” tab at our Web site, americancentury.com, for updates and further expert commentary.
The top of our Web site’s home page also provides a link to “Our Story,” which, first and foremost, outlines our commitment—since 1958—to helping clients reach their financial goals. We believe strongly that we will only be successful when our clients are successful. That’s who we are.
Another important, unique facet of our story and who we are is “Profits with a Purpose,” which describes our bond with the Stowers Institute for Medical Research (SIMR). SIMR is a world-class biomedical organization—founded by our company founder James E. Stowers, Jr. and his wife Virginia—that is dedicated to researching the causes, treatment, and prevention of gene-based diseases, including cancer. Through American Century Investments’ private ownership structure, more than 40% of our profits support SIMR.
Mr. Stowers’ example of achieving financial success and using that platform to help humanity motivates our entire American Century Investments team. His story inspires us to help each of our clients achieve success. Thank you for sharing your financial journey with us.
Sincerely,

Jonathan Thomas
President and Chief Executive Officer
American Century Investments
2

By Scott Wittman, Chief Investment Officer, Quantitative Equity and Asset Allocation
Stocks Rallied as Economy Improved
U.S. stocks posted double-digit gains for the 12 months ended June 30, 2010, thanks largely to improving economic conditions and unexpectedly strong corporate earnings. As the period began, the U.S. economy was starting to show early signs of recovery following a sharp downturn in late 2008 and early 2009. Led by improving results in manufacturing activity, housing, and consumer spending, the economy posted positive growth in the third and fourth quarters of 2009 after four consecutive quarters of declining output. By the first quarter of 2010, jobs data turned positive, providing further evidence of a burgeoning economic recovery.
In addition, corporate profits consistently exceeded expectations as many companies implemented stringent cost-management programs that helped boost profit margins. Rising demand for delayed big-ticket purchases, such as cars and appliances, also contributed to stronger earnings. As a result, stocks rose steadily for much of the period, with the major equity indices advancing by more than 30% from the beginning of the period through April 30, 2010.
Growing Uncertainty Led to Late Decline
Market conditions changed abruptly in the last two months of the period as persistent worries about sovereign debt problems in Europe and questions about the sustainability of the domestic economic recovery (validated to some degree by weaker economic data late in the period) weighed on investor confidence. With these headwinds, the equity market peaked in late April and then reversed direction in May and June. In addition, market volatility increased dramatically—the S&P 500 Index moved up or down by more than 1% on nearly half of the trading days in the second quarter of 2010.
Although stocks gave back a notable portion of their gains late in the period, the broad market indices returned approximately 15% overall for the 12 months. Mid- and small-cap stocks posted the best returns (see the table below), outpacing large-cap shares, while value stocks outperformed growth-oriented issues across all market capitalizations.
| | | | |
| U.S. Stock Index Returns | | | | |
| For the 12 months ended June 30, 2010 | | | | |
| Russell 1000 Index (Large-Cap) | 15.24% | | Russell 2000 Index (Small-Cap) | 21.48% |
| Russell 1000 Value Index | 16.92% | | Russell 2000 Value Index | 25.07% |
| Russell 1000 Growth Index | 13.62% | | Russell 2000 Growth Index | 17.96% |
| Russell Midcap Index | 25.13% | | | |
| Russell Midcap Value Index | 28.91% | | | |
| Russell Midcap Growth Index | 21.30% | | | |
3
| | | | |
| NT Small Company | | | | |
| |
| Total Returns as of June 30, 2010 | | | |
| | | | Average | |
| | | | Annual Returns | |
| | Ticker Symbol | 1 year | Since Inception | Inception Date |
| Institutional Class | ACLOX | 23.50% | -8.71% | 5/12/06 |
| S&P SmallCap 600 Index | — | 23.64% | -2.77% | — |
Data presented reflect past performance. Past performance is no guarantee of future results. Current performance may be higher or lower than the performance shown. Investment return and principal value will fluctuate, and redemption value may be more or less than original cost. To obtain performance data current to the most recent month end, please call 1-800-345-2021 or visit americancentury.com. Historically, small company stocks have been more volatile than the stocks of larger, more established companies.
Data assumes reinvestment of dividends and capital gains, and none of the charts reflect the deduction of taxes that a shareholder would pay on fund distributions or the redemption of fund shares. Returns for the index are provided for comparison. The fund’s total returns include operating expenses (such as transaction costs and management fees) that reduce returns, while the total returns of the index do not.
4
NT Small Company
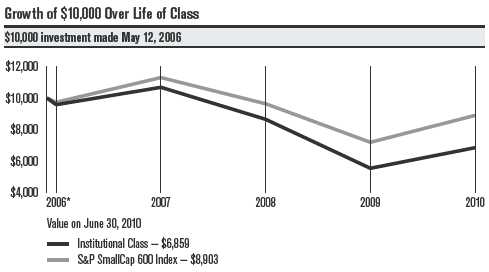
| |
| *From 5/12/06, the Institutional Class’s inception date. Not annualized. |
|
| Total Annual Fund Operating Expenses |
| Institutional Class | 0.70% |
The total annual fund operating expenses shown is as stated in the fund’s prospectus current as of the date of this report. The prospectus may vary from the expense ratio shown elsewhere in this report because it is based on a different time period, includes acquired fund fees and expenses, and, if applicable, does not include fee waivers or expense reimbursements.
Data presented reflect past performance. Past performance is no guarantee of future results. Current performance may be higher or lower than the performance shown. Investment return and principal value will fluctuate, and redemption value may be more or less than original cost. To obtain performance data current to the most recent month end, please call 1-800-345-2021 or visit americancentury.com. Historically, small company stocks have been more volatile than the stocks of larger, more established companies.
Data assumes reinvestment of dividends and capital gains, and none of the charts reflect the deduction of taxes that a shareholder would pay on fund distributions or the redemption of fund shares. Returns for the index are provided for comparison. The fund’s total returns include operating expenses (such as transaction costs and management fees) that reduce returns, while the total returns of the index do not.
5
NT Small Company
Portfolio Managers: Brian Garbe and Tal Sansani
In June 2010, portfolio managers Matti Von Türk, Tom Vaiana, and Brian Ertley left American Century Investments to pursue other opportunities. Following their departures, Brian Garbe, a veteran portfolio manager with 22 years of experience, and Tal Sansani, a quantitative analyst who has been with the firm since 2005, became portfolio managers for NT Small Company.
Performance Summary
NT Small Company returned 23.50% for the 12 months ended June 30, 2010, compared with the 23.64% return of its benchmark, the S&P SmallCap 600 Index.
The gain of more than 20% for NT Small Company and the S&P SmallCap 600 Index reflected the broad advance in the U.S. equity market and the outperformance of small-cap stocks during the 12-month period. NT Small Company performed roughly in line with its benchmark, narrowly trailing the index’s return. Individual stock selection, which is typically the primary driver of relative performance, was mixed during the period as strong results in the industrials and information technology sectors were offset by weakness in the financials and consumer discretionary sectors.
Financials and Consumer Discretionary Lagged
The fund’s holdings in the financials and consumer discretionary sectors had the biggest negative impact on performance versus the S&P SmallCap 600 Index for the 12 months. An overweight position in capital markets firms and an underweight position in real estate investment trusts contributed the bulk of the underperformance in the financials sector. The most significant individual detractor was asset manager Calamos Asset Management, which was hurt by weak inflows into its stock mutual funds, as well as increased market volatility late in the period. Uncertainty about pending financial reform and regulatory changes for options trading weighed on several of the portfolio’s brokerage holdings, including TradeStation Group, Investment Technology Group, and optionsXpress Holdings.
In the consumer discretionary sector, stock selection among apparel makers and consumer services companies detracted the most. For-profit education firm Corinthian Colleges was adversely affected by growing debt issues among students at private educational institutions, as well as the potential for more stringent regulatory requirements. Aaron’s, a furniture and electronics rental chain, declined as weaker revenues led the company to shutter its office furniture business.
Materials and Energy Were Mixed
Although the portfolio’s materials and energy holdings outperformed their respective counterparts in the benchmark index, several of the most significant individual detractors in the portfolio came from these two sectors. Examples included chemicals producer Koppers Holdings, which was held back by a lagging recovery in its end markets, and energy construction and engineering firm Willbros Group, which posted losses amid low levels of pipeline construction activity in North America.
6
NT Small Company
On the positive side, the top performance contributor in the materials sector was specialty chemicals company Solutia, which strengthened its balance sheet and benefited from its exposure to the rebounding automotive and renewable energy markets. In the energy sector, the leading contributor was coal producer Alpha Natural Resources, which enjoyed increased demand for metallurgical coal used in steelmaking.
Industrials and Technology Outperformed
Stock selection was most successful in the industrials and information technology sectors of the portfolio. Virtually all of the outperformance in the industrials sector resulted from strong results among road and rail stocks, and one company in particular—auto rental firm Dollar Thrifty Automotive Group. The company boosted profitability thanks to debt reductions and improved cost management, and its stock price also got a lift late in the period as rivals Hertz Global Holdings and Avis Budget Group began a bidding war to acquire the company.
In the information technology sector, stock choices among software companies and electronic equipment manufacturers added the most value. The best contributors included technology marketing and consulting firm Acxiom, which consistently surpassed earnings expectations as demand increased, and semiconductor manufacturer Skyworks Solutions, which benefited from robust demand resulting from the proliferation of mobile internet devices.
Other top contributors included fabric store chain Jo-Ann Stores and IT staffing firm COMSYS IT Partners. Jo-Ann Stores rallied as same-store sales growth improved and profit margins increased, enabling the company to raise profit guidance for the full year. COMSYS advanced sharply following an agreement to be acquired by employment services provider Manpower.
A Look Ahead
The market environment has grown increasingly choppy in recent months, reflecting greater uncertainty about the resilience of the economic recovery. Although most businesses weathered the 2008 recession relatively well, stubbornly high unemployment suggests that the corporate sector is not yet confident enough in the strength of the recovery to expand payrolls. This economic uncertainty—and the stock market volatility that often accompanies it—is likely to continue as we move into the second half of 2010.
The quantitative investment process we use to manage NT Small Company has a framework that is objective, disciplined, and systematic—in other words, it avoids getting caught up in the fads and emotions that can drive short-term market movements. We believe this approach will produce superior relative performance over the long term.
7
| | |
| NT Small Company | | |
| |
| Top Ten Holdings | | |
| | | % of net assets as of 6/30/10 |
| EMCOR Group, Inc. | | 1.1% |
| Jo-Ann Stores, Inc. | | 1.1% |
| Cubist Pharmaceuticals, Inc. | | 1.0% |
| Skyworks Solutions, Inc. | | 1.0% |
| Arris Group, Inc. | | 1.0% |
| CEC Entertainment, Inc. | | 1.0% |
| Dollar Thrifty Automotive Group, Inc. | | 1.0% |
| CSG Systems International, Inc. | | 1.0% |
| Equity LifeStyle Properties, Inc. | | 0.9% |
| TreeHouse Foods, Inc. | | 0.9% |
| |
| Five Largest Overweights as of June 30, 2010 | |
| | % of net assets | % of S&P SmallCap 600 Index |
| Dollar Thrifty Automotive Group, Inc. | 0.97% | — |
| Equity LifeStyle Properties, Inc. | 0.93% | — |
| Jo-Ann Stores, Inc. | 1.10% | 0.26% |
| Cooper Tire & Rubber Co. | 0.83% | — |
| CSG Systems International, Inc. | 0.96% | 0.16% |
| |
| Five Largest Underweights as of June 30, 2010 | |
| | % of net assets | % of S&P SmallCap 600 Index |
| East West Bancorp, Inc. | — | 0.58% |
| Salix Pharmaceuticals Ltd. | — | 0.57% |
| Varian Semiconductor Equipment Associates, Inc. | — | 0.55% |
| Watsco, Inc. | — | 0.48% |
| Concur Technologies, Inc. | — | 0.47% |
| |
| Types of Investments in Portfolio | | |
| | | % of net assets as of 6/30/10 |
| Common Stocks | | 99.6% |
| Temporary Cash Investments | | 0.6% |
| Other Assets and Liabilities | | (0.2)% |
8
|
| Shareholder Fee Example (Unaudited) |
Fund shareholders may incur two types of costs: (1) transaction costs, including sales charges (loads) on purchase payments and redemption/ exchange fees; and (2) ongoing costs, including management fees; distribution and service (12b-1) fees; and other fund expenses. This example is intended to help you understand your ongoing costs (in dollars) of investing in your fund and to compare these costs with the ongoing cost of investing in other mutual funds.
The example is based on an investment of $1,000 made at the beginning of the period and held for the entire period from January 1, 2010 to June 30, 2010.
Actual Expenses
The table provides information about actual account values and actual expenses for each class. You may use the information, together with the amount you invested, to estimate the expenses that you paid over the period. First, identify the share class you own. Then simply divide your account value by $1,000 (for example, an $8,600 account value divided by $1,000 = 8.6), then multiply the result by the number under the heading “Expenses Paid During Period” to estimate the expenses you paid on your account during this period.
If you hold Investor Class shares of any American Century Investments fund, or Institutional Class shares of the American Century Diversified Bond Fund, in an American Century Investments account (i.e., not a financial intermediary or retirement plan account), American Century Investments may charge you a $12.50 semiannual account maintenance fee if the value of those shares is less than $10,000. We will redeem shares automatically in one of your accounts to pay the $12.50 fee. In determining your total eligible investment amount, we will include your investments in all personal accounts (including American Century Investments Brokerage accounts) registered under your Social Security number. Personal accounts include individual accounts, joint accounts, UGMA/UTMA accounts, personal trusts, Coverdell Education Savings Accounts and IRAs (including traditional, Roth, Rollover, SEP-, SARSEP- and SIMPLE-IRAs), and certain other retirement accounts. If you have only business, business retirement, employer-sponsored or American Century Investments Brokerage accounts, you are currently not subject to this fee. We will not charge the fee as long as you choose to manage your accounts exclusively online. If you are subject to the Account Maintenance Fee, your account value could be reduced by the fee amount.
Hypothetical Example for Comparison Purposes
The table also provides information about hypothetical account values and hypothetical expenses based on the actual expense ratio of each class of your fund and an assumed rate of return of 5% per year before expenses, which is not the actual return of a fund’s share class. The hypothetical account values and expenses may not be used to estimate the actual ending account balance or expenses you paid for the period. You may use this information to compare the ongoing costs of investing in your fund and other funds. To do so, compare this 5% hypothetical example with the 5% hypothetical examples that appear in the shareholder reports of the other funds.
9
Please note that the expenses shown in the table are meant to highlight your ongoing costs only and do not reflect any transactional costs, such as sales charges (loads) or redemption/exchange fees. Therefore, the table is useful in comparing ongoing costs only, and will not help you determine the relative total costs of owning different funds. In addition, if these transactional costs were included, your costs would have been higher.
| | | | |
| | Beginning | Ending | Expenses Paid | |
| | Account Value | Account Value | During Period* | Annualized |
| | 1/1/10 | 6/30/10 | 1/1/10 – 6/30/10 | Expense Ratio* |
| Actual | $1,000 | $998.60 | $3.42 | 0.69% |
| Hypothetical | $1,000 | $1,021.37 | $3.46 | 0.69% |
| *Expenses are equal to the fund’s annualized expense ratio listed in the table above, multiplied by the average account value over the period, |
| multiplied by 181, the number of days in the most recent fiscal half-year, divided by 365, to reflect the one-half year period. |
10
| | | | | | |
| NT Small Company | | | | | |
| |
| JUNE 30, 2010 | | | | | | |
| | Shares | Value | | | Shares | Value |
| Common Stocks — 99.6% | | | QLT, Inc.(1) | 6,652 | $ 38,249 |
| AEROSPACE & DEFENSE — 3.0% | | | | Vanda Pharmaceuticals, Inc.(1) | 8,075 | 53,376 |
| AAR Corp.(1) | 8,686 | $ 145,404 | | | | 1,414,059 |
| American Science & | | | | BUILDING PRODUCTS — 0.7% | | |
| Engineering, Inc. | 1,872 | 142,665 | | Apogee Enterprises, Inc. | 16,947 | 183,536 |
| Applied Signal Technology, Inc. | 3,702 | 72,744 | | Gibraltar Industries, Inc.(1) | 17,210 | 173,821 |
| Astronics Corp.(1) | 822 | 13,448 | | Simpson Manufacturing Co., Inc. | 7,748 | 190,213 |
| Ceradyne, Inc.(1) | 3,516 | 75,137 | | | | 547,570 |
| Cubic Corp. | 14,565 | 529,875 | | CAPITAL MARKETS — 1.7% | | |
| Curtiss-Wright Corp. | 703 | 20,415 | | BGC Partners, Inc., Class A | 18,432 | 94,187 |
| Ducommun, Inc. | 4,214 | 72,059 | | Calamos Asset Management, Inc., | | |
| Esterline Technologies Corp.(1) | 5,015 | 237,962 | | Class A | 32,153 | 298,380 |
| | | | | Evercore Partners, Inc., Class A | 2,253 | 52,608 |
| GenCorp, Inc.(1) | 10,481 | 45,907 | | | | |
| | | | | Gladstone Capital Corp. | 1,863 | 20,139 |
| Moog, Inc., Class A(1) | 7,742 | 249,525 | | | | |
| | | | | Gladstone Investment Corp. | 3,740 | 21,804 |
| Orbital Sciences Corp.(1) | 17,550 | 276,763 | | | | |
| | | | | Hercules Technology Growth | | |
| Teledyne Technologies, Inc.(1) | 1,055 | 40,702 | | Capital, Inc. | 16,900 | 155,649 |
| Triumph Group, Inc. | 5,710 | 380,457 | | Investment Technology | | |
| | | 2,303,063 | | Group, Inc.(1) | 16,161 | 259,546 |
| AIR FREIGHT & LOGISTICS — 0.6% | | | MCG Capital Corp. | 813 | 3,927 |
| Atlas Air Worldwide | | | | NGP Capital Resources Co. | 2,824 | 20,248 |
| Holdings, Inc.(1) | 3,282 | 155,895 | | optionsXpress Holdings, Inc.(1) | 23,749 | 373,809 |
| Forward Air Corp. | 580 | 15,805 | | TradeStation Group, Inc.(1) | 2,923 | 19,730 |
| Hub Group, Inc., Class A(1) | 10,465 | 314,055 | | | | 1,320,027 |
| | | 485,755 | | CHEMICALS — 2.2% | | |
| AIRLINES — 0.4% | | | | A. Schulman, Inc. | 16,623 | 315,172 |
| Allegiant Travel Co. | 944 | 40,300 | | Innophos Holdings, Inc. | 21,707 | 566,118 |
| Hawaiian Holdings, Inc.(1) | 18,648 | 96,410 | | Innospec, Inc.(1) | 8,052 | 75,528 |
| Republic Airways Holdings, Inc.(1) | 9,047 | 55,277 | | KMG Chemicals, Inc. | 4,363 | 62,653 |
| SkyWest, Inc. | 8,460 | 103,381 | | Koppers Holdings, Inc. | 15,045 | 338,212 |
| | | 295,368 | | Minerals Technologies, Inc. | 959 | 45,591 |
| AUTO COMPONENTS — 1.6% | | | | OM Group, Inc.(1) | 1,000 | 23,860 |
| Cooper Tire & Rubber Co. | 32,475 | 633,263 | | PolyOne Corp.(1) | 7,026 | 59,159 |
| Hawk Corp., Class A(1) | 14,487 | 368,694 | | Stepan Co. | 2,431 | 166,353 |
| Spartan Motors, Inc. | 13,823 | 58,057 | | | | 1,652,646 |
| Standard Motor Products, Inc. | 20,976 | 169,276 | | COMMERCIAL BANKS — 6.0% | | |
| | | 1,229,290 | | Bank of Hawaii Corp. | 8,240 | 398,404 |
| BIOTECHNOLOGY — 1.8% | | | | Bank of the Ozarks, Inc. | 1,200 | 42,564 |
| Cubist Pharmaceuticals, Inc.(1) | 38,190 | 786,714 | | Banner Corp. | 4,890 | 9,682 |
| Emergent Biosolutions, Inc.(1) | 8,186 | 133,759 | | Boston Private Financial | | |
| Infinity Pharmaceuticals, Inc.(1) | 1,107 | 6,542 | | Holdings, Inc. | 18,552 | 119,289 |
| Martek Biosciences Corp.(1) | 15,064 | 357,167 | | City Holding Co. | 237 | 6,608 |
| OncoGenex Pharmaceutical, Inc.(1) | 1,704 | 22,919 | | City National Corp. | 2,466 | 126,333 |
| Osiris Therapeutics, Inc.(1) | 2,639 | 15,333 | | Columbia Banking System, Inc. | 4,928 | 89,985 |
| | | | | Community Bank System, Inc. | 10,081 | 222,084 |
11
| | | | | | |
| NT Small Company | | | | | |
| |
| | Shares | Value | | | Shares | Value |
| CVB Financial Corp. | 15,377 | $ 146,082 | | COMMUNICATIONS EQUIPMENT — 2.5% | |
| Enterprise Financial Services Corp. | 781 | 7,529 | | Anaren, Inc.(1) | 1,653 | $ 24,696 |
| First Bancorp.(1) | 7,124 | 3,776 | | Arris Group, Inc.(1) | 74,144 | 755,527 |
| First Financial Bankshares, Inc. | 394 | 18,948 | | Comtech Telecommunications | | |
| First Midwest Bancorp., Inc. | 17,436 | 212,022 | | Corp.(1) | 7,439 | 222,649 |
| Glacier Bancorp., Inc. | 1,664 | 24,411 | | Harmonic, Inc.(1) | 26,570 | 144,541 |
| Hancock Holding Co. | 6,433 | 214,605 | | InterDigital, Inc.(1) | 7,072 | 174,608 |
| Hanmi Financial Corp.(1) | 1,590 | 2,003 | | Oplink Communications, Inc.(1) | 1,067 | 15,290 |
| IBERIABANK Corp. | 677 | 34,852 | | Opnext, Inc.(1) | 7,137 | 11,776 |
| Independent Bank Corp. | 2,530 | 62,440 | | PC-Tel, Inc.(1) | 4,415 | 22,252 |
| MainSource Financial Group, Inc. | 2,347 | 16,828 | | Powerwave Technologies, Inc.(1) | 18,618 | 28,672 |
| Nara Bancorp., Inc.(1) | 6,123 | 51,617 | | Seachange International, Inc.(1) | 5,788 | 47,635 |
| NBT Bancorp., Inc. | 9,862 | 201,382 | | Sierra Wireless, Inc.(1) | 24,963 | 166,004 |
| Old Second Bancorp., Inc. | 1,967 | 3,934 | | Symmetricom, Inc.(1) | 18,032 | 91,783 |
| Pacific Capital Bancorp. NA(1) | 7,103 | 5,114 | | Tekelec(1) | 13,952 | 184,724 |
| PacWest Bancorp. | 3,691 | 67,582 | | | | 1,890,157 |
| Prosperity Bancshares, Inc. | 8,242 | 286,410 | | COMPUTERS & PERIPHERALS — 1.4% | |
| S&T Bancorp., Inc. | 669 | 13,219 | | Cray, Inc.(1) | 4,762 | 26,572 |
| Santander BanCorp(1) | 1,064 | 13,449 | | | | |
| | | | | Hypercom Corp.(1) | 4,646 | 21,557 |
| Signature Bank(1) | 9,885 | 375,729 | | | | |
| | | | | Novatel Wireless, Inc.(1) | 39,592 | 227,258 |
| Southwest Bancorp., Inc. | 3,803 | 50,542 | | Rimage Corp.(1) | 939 | 14,864 |
| Sterling Bancorp. | 9,806 | 88,254 | | STEC, Inc.(1) | 17,939 | 225,314 |
| Sterling Bancshares, Inc. | 22,082 | 104,006 | | Synaptics, Inc.(1) | 19,421 | 534,078 |
| SVB Financial Group(1) | 8,556 | 352,764 | | | | |
| | | | | | | 1,049,643 |
| Tompkins Financial Corp. | 3,118 | 117,705 | | CONSTRUCTION & ENGINEERING — 2.3% | |
| Trustmark Corp. | 4,958 | 103,226 | | Comfort Systems USA, Inc. | 9,781 | 94,484 |
| UMB Financial Corp. | 10,024 | 356,453 | | Dycom Industries, Inc.(1) | 39,327 | 336,246 |
| Umpqua Holdings Corp. | 19,511 | 223,986 | | | | |
| | | | | EMCOR Group, Inc.(1) | 36,971 | 856,618 |
| United Bankshares, Inc. | 5,376 | 128,702 | | | | |
| | | | | Insituform Technologies, Inc., | | |
| United Community Banks, Inc.(1) | 4,576 | 18,075 | | Class A(1) | 9,109 | 186,552 |
| West Bancorp., Inc.(1) | 1,343 | 9,146 | | Michael Baker Corp.(1) | 5,678 | 198,162 |
| Westamerica Bancorp. | 2,529 | 132,823 | | Sterling Construction Co., Inc.(1) | 4,342 | 56,186 |
| Western Alliance Bancorp.(1) | 3,730 | 26,744 | | | | 1,728,248 |
| Wilshire Bancorp., Inc. | 9,659 | 84,516 | | CONSUMER FINANCE — 1.1% | | |
| | | 4,573,823 | | Advance America Cash | | |
| COMMERCIAL SERVICES & SUPPLIES — 1.1% | | Advance Centers, Inc. | 38,010 | 156,981 |
| American Reprographics Co.(1) | 7,066 | 61,686 | | Cash America International, Inc. | 7,821 | 268,026 |
| APAC Customer Services, Inc.(1) | 12,370 | 70,509 | | First Cash Financial | | |
| | | | | Services, Inc.(1) | 7,213 | 157,243 |
| ATC Technology Corp.(1) | 16,362 | 263,755 | | | | |
| | | | | First Marblehead Corp. (The)(1) | 7,885 | 18,530 |
| Consolidated Graphics, Inc.(1) | 1,346 | 58,201 | | | | |
| M&F Worldwide Corp.(1) | 1,591 | 43,116 | | QC Holdings, Inc. | 1,885 | 6,937 |
| Tetra Tech, Inc.(1) | 14,693 | 288,130 | | Rewards Network, Inc. | 448 | 6,124 |
| | | | | World Acceptance Corp.(1) | 5,162 | 197,756 |
| US Ecology, Inc. | 1,290 | 18,795 | | | | |
| Waste Services, Inc.(1) | 1,957 | 22,819 | | | | 811,597 |
| | | 827,011 | | | | |
12
| | | | | | | |
| NT Small Company | | | | | | |
| |
| | Shares | | Value | | | Shares | Value |
| CONTAINERS & PACKAGING — 0.7% | | | | Electro Scientific Industries, Inc.(1) | 6,824 | $ 91,169 |
| Boise, Inc.(1) | 5,734 | $ 31,480 | | Gerber Scientific, Inc.(1) | 6,575 | 35,176 |
| Rock-Tenn Co., Class A | 10,832 | | 538,025 | | Insight Enterprises, Inc.(1) | 25,669 | 337,804 |
| | | | 569,505 | | Mercury Computer Systems, Inc.(1) | 4,703 | 55,166 |
| DISTRIBUTORS — 0.2% | | | | | Methode Electronics, Inc. | 59,102 | 575,653 |
| Core-Mark Holding Co., Inc.(1) | 4,251 | | 116,477 | | Multi-Fineline Electronix, Inc.(1) | 485 | 12,106 |
| DIVERSIFIED CONSUMER SERVICES — 2.0% | | | Newport Corp.(1) | 10,081 | 91,334 |
| Capella Education Co.(1) | 5,065 | | 412,038 | | PAR Technology Corp.(1) | 1,167 | 5,998 |
| Coinstar, Inc.(1) | 6,741 | | 289,661 | | Plexus Corp.(1) | 467 | 12,488 |
| Corinthian Colleges, Inc.(1) | 25,033 | | 246,575 | | Radisys Corp.(1) | 12,149 | 115,658 |
| Hillenbrand, Inc. | 15,639 | | 334,518 | | Tech Data Corp.(1) | 7,114 | 253,401 |
| Mac-Gray Corp. | 698 | | 7,776 | | Technitrol, Inc. | 18,249 | 57,667 |
| Pre-Paid Legal Services, Inc.(1) | 2,222 | | 101,079 | | Tessco Technologies, Inc. | 627 | 10,471 |
| Universal Technical Institute, Inc.(1) | 5,221 | | 123,424 | | Vishay Intertechnology, Inc.(1) | 1,275 | 9,869 |
| | | | 1,515,071 | | | | 2,629,390 |
| DIVERSIFIED FINANCIAL SERVICES — 0.7% | | | ENERGY EQUIPMENT & SERVICES — 1.9% | |
| PHH Corp.(1) | 29,871 | | 568,744 | | Basic Energy Services, Inc.(1) | 2,199 | 16,932 |
| DIVERSIFIED TELECOMMUNICATION | | | | Cal Dive International, Inc.(1) | 8,094 | 47,350 |
| SERVICES — 0.2% | | | | | | | |
| | | | | | Dawson Geophysical Co.(1) | 2,863 | 60,896 |
| IDT Corp., Class B(1) | 7,265 | | 92,629 | | | | |
| | | | | | Dril-Quip, Inc.(1) | 5,826 | 256,460 |
| Neutral Tandem, Inc.(1) | 4,091 | | 46,024 | | | | |
| | | | | | ENGlobal Corp.(1) | 5,826 | 12,002 |
| | | | 138,653 | | | | |
| | | | | | ION Geophysical Corp.(1) | 7,647 | 26,612 |
| ELECTRIC UTILITIES — 0.8% | | | | | | | |
| Central Vermont Public | | | | | Lufkin Industries, Inc. | 930 | 36,261 |
| Service Corp. | 6,007 | | 118,578 | | Matrix Service Co.(1) | 13,516 | 125,834 |
| Maine & Maritimes Corp. | 1,529 | | 67,750 | | Oil States International, Inc.(1) | 15,958 | 631,618 |
| UIL Holdings Corp. | 2,952 | | 73,889 | | T-3 Energy Services, Inc.(1) | 3,938 | 109,870 |
| UniSource Energy Corp. | 11,112 | | 335,360 | | TGC Industries, Inc.(1) | 3,843 | 11,644 |
| | | | 595,577 | | Willbros Group, Inc.(1) | 15,572 | 115,233 |
| ELECTRICAL EQUIPMENT — 1.0% | | | | | | 1,450,712 |
| AZZ, Inc. | 5,468 | | 201,058 | | FOOD & STAPLES RETAILING — 1.2% | |
| EnerSys(1) | 6,957 | | 148,671 | | Andersons, Inc. (The) | 16,384 | 533,955 |
| General Cable Corp.(1) | 302 | | 8,048 | | Casey’s General Stores, Inc. | 2,422 | 84,528 |
| GrafTech International Ltd.(1) | 12,471 | | 182,326 | | Nash Finch Co. | 4,151 | 141,798 |
| II-VI, Inc.(1) | 258 | | 7,645 | | United Natural Foods, Inc.(1) | 5,304 | 158,483 |
| Powell Industries, Inc.(1) | 8,032 | | 219,595 | | | | 918,764 |
| | | | 767,343 | | FOOD PRODUCTS — 2.0% | | |
| ELECTRONIC EQUIPMENT, INSTRUMENTS & | | | American Italian Pasta Co., | | |
| COMPONENTS — 3.4% | | | | | Class A(1) | 5,234 | 276,722 |
| Agilysys, Inc. | 4,567 | | 30,553 | | Diamond Foods, Inc. | 3,151 | 129,506 |
| Anixter International, Inc.(1) | 1,375 | | 58,575 | | Dole Food Co., Inc.(1) | 5,010 | 52,254 |
| Benchmark Electronics, Inc.(1) | 28,370 | | 449,664 | | J&J Snack Foods Corp. | 5,638 | 237,360 |
| Brightpoint, Inc.(1) | 11,554 | | 80,878 | | Overhill Farms, Inc.(1) | 22,822 | 134,421 |
| Celestica, Inc.(1) | 30,192 | | 243,348 | | TreeHouse Foods, Inc.(1) | 14,763 | 674,079 |
| CPI International, Inc.(1) | 775 | | 12,082 | | | | 1,504,342 |
| CTS Corp. | 9,776 | | 90,330 | | | | |
13
| | | | | | |
| NT Small Company | | | | | |
| |
| | Shares | Value | | | Shares | Value |
| GAS UTILITIES — 1.9% | | | | Providence Service Corp. (The)(1) | 1,902 | $ 26,628 |
| Laclede Group, Inc. (The) | 9,313 | $ 308,540 | | PSS World Medical, Inc.(1) | 18,435 | 389,900 |
| New Jersey Resources Corp. | 15,488 | 545,178 | | Res-Care, Inc.(1) | 1,956 | 18,895 |
| Northwest Natural Gas Co. | 807 | 35,161 | | Triple-S Management Corp., | | |
| Piedmont Natural Gas Co., Inc. | 1,670 | 42,251 | | Class B(1) | 9,828 | 182,309 |
| South Jersey Industries, Inc. | 4,365 | 187,520 | | U.S. Physical Therapy, Inc.(1) | 623 | 10,516 |
| Southwest Gas Corp. | 10,041 | 296,209 | | | | 3,345,014 |
| | | 1,414,859 | | HEALTH CARE TECHNOLOGY — 0.4% | | |
| HEALTH CARE EQUIPMENT & SUPPLIES — 3.9% | | | Eclipsys Corp.(1) | 6,744 | 120,313 |
| American Medical Systems | | | | Medidata Solutions, Inc.(1) | 9,753 | 151,074 |
| Holdings, Inc.(1) | 20,292 | 448,859 | | | | |
| | | | | Quality Systems, Inc. | 1,055 | 61,179 |
| Cantel Medical Corp. | 2,817 | 47,044 | | | | 332,566 |
| Cooper Cos., Inc. (The) | 11,545 | 459,375 | | HOTELS, RESTAURANTS & LEISURE — 3.3% | |
| Cyberonics, Inc.(1) | 8,665 | 205,187 | | | | |
| | | | | AFC Enterprises, Inc.(1) | 27,923 | 254,099 |
| Exactech, Inc.(1) | 692 | 11,819 | | | | |
| | | | | CEC Entertainment, Inc.(1) | 21,065 | 742,752 |
| Greatbatch, Inc.(1) | 5,568 | 124,222 | | Cracker Barrel Old Country | | |
| Haemonetics Corp.(1) | 3,182 | 170,301 | | Store, Inc. | 12,162 | 566,263 |
| HealthTronics, Inc.(1) | 3,124 | 15,089 | | Einstein Noah Restaurant | | |
| | | | | Group, Inc.(1) | 2,123 | 22,907 |
| ICU Medical, Inc.(1) | 63 | 2,027 | | | | |
| Integra LifeSciences | | | | Isle of Capri Casinos, Inc.(1) | 15,478 | 143,326 |
| Holdings Corp.(1) | 8,729 | 322,973 | | Multimedia Games, Inc.(1) | 4,319 | 19,436 |
| Invacare Corp. | 29,296 | 607,599 | | O’Charleys, Inc.(1) | 4,334 | 22,970 |
| Kensey Nash Corp.(1) | 13,822 | 327,720 | | Papa John’s International, Inc.(1) | 332 | 7,676 |
| Medical Action Industries, Inc.(1) | 1,210 | 14,508 | | Peet’s Coffee & Tea, Inc.(1) | 9,803 | 384,964 |
| Quidel Corp.(1) | 14,736 | 187,000 | | PF Chang’s China Bistro, Inc. | 8,002 | 317,279 |
| Symmetry Medical, Inc.(1) | 5,105 | 53,807 | | Ruth’s Hospitality Group, Inc.(1) | 2,508 | 10,484 |
| Theragenics Corp.(1) | 5,501 | 6,326 | | Texas Roadhouse, Inc.(1) | 610 | 7,698 |
| | | 3,003,856 | | | | 2,499,854 |
| HEALTH CARE PROVIDERS & SERVICES — 4.4% | | | HOUSEHOLD DURABLES — 0.7% | | |
| Amedisys, Inc.(1) | 3,594 | 158,028 | | American Greetings Corp., Class A | 3,066 | 57,518 |
| America Service Group, Inc. | 1,174 | 20,193 | | Blyth, Inc. | 2,039 | 69,469 |
| AMN Healthcare Services, Inc.(1) | 10,778 | 80,620 | | Brookfield Homes Corp.(1) | 1,300 | 8,762 |
| Amsurg Corp.(1) | 2,181 | 38,866 | | Furniture Brands | | |
| | | | | International, Inc.(1) | 11,263 | 58,793 |
| Centene Corp.(1) | 29,124 | 626,166 | | | | |
| | | | | Kid Brands, Inc.(1) | 1,813 | 12,745 |
| Cross Country Healthcare, Inc.(1) | 3,274 | 29,433 | | | | |
| | | | | La-Z-Boy, Inc.(1) | 15,358 | 114,110 |
| Gentiva Health Services, Inc.(1) | 6,997 | 188,989 | | | | |
| | | | | Meritage Homes Corp.(1) | 8,693 | 141,522 |
| Healthspring, Inc.(1) | 11,948 | 185,314 | | | | |
| | | | | Standard Pacific Corp.(1) | 24,121 | 80,323 |
| HMS Holdings Corp.(1) | 4,578 | 248,219 | | | | |
| | | | | Universal Electronics, Inc.(1) | 1,587 | 26,392 |
| LHC Group, Inc.(1) | 11,961 | 331,918 | | | | |
| Magellan Health Services, Inc.(1) | 8,423 | 305,923 | | | | 569,634 |
| Molina Healthcare, Inc.(1) | 12,883 | 371,030 | | HOUSEHOLD PRODUCTS — 0.5% | | |
| | | | | Central Garden and Pet Co., | | |
| Nighthawk Radiology | | | | Class A(1) | 40,598 | 364,164 |
| Holdings, Inc.(1) | 1,554 | 4,025 | | | | |
| | | | | INDEPENDENT POWER PRODUCERS & | |
| NovaMed, Inc.(1) | 1,634 | 13,562 | | ENERGY TRADERS — 0.5% | | |
| PharMerica Corp.(1) | 7,809 | 114,480 | | Mirant Corp.(1) | 33,098 | 349,515 |
14
| | | | | | |
| NT Small Company | | | | | |
| |
| | Shares | Value | | | Shares | Value |
| INDUSTRIAL CONGLOMERATES — 0.3% | | | Openwave Systems, Inc.(1) | 11,464 | $ 23,272 |
| Carlisle Cos., Inc. | 4,193 | $ 151,493 | | United Online, Inc. | 23,300 | 134,208 |
| Standex International Corp. | 2,581 | 65,429 | | | | 1,210,002 |
| | | 216,922 | | IT SERVICES — 2.8% | | |
| INSURANCE — 3.3% | | | | Acxiom Corp.(1) | 32,549 | 478,145 |
| Allied World Assurance Co. | | | | CACI International, Inc., Class A(1) | 4,410 | 187,337 |
| Holdings Ltd. | 13,675 | 620,572 | | CIBER, Inc.(1) | 41,315 | 114,442 |
| American Financial Group, Inc. | 16,101 | 439,879 | | | | |
| | | | | CSG Systems International, Inc.(1) | 40,108 | 735,180 |
| American Physicians Capital, Inc. | 599 | 18,479 | | | | |
| | | | | Global Cash Access Holdings, Inc.(1) | 27,977 | 201,714 |
| American Safety Insurance | | | | | | |
| Holdings Ltd.(1) | 4,355 | 68,461 | | Lionbridge Technologies, Inc.(1) | 5,480 | 25,043 |
| Argo Group International | | | | PRGX Global, Inc.(1) | 8,104 | 33,632 |
| Holdings Ltd. | 1,512 | 46,252 | | TeleTech Holdings, Inc.(1) | 13,698 | 176,567 |
| Aspen Insurance Holdings Ltd. | 13,446 | 332,654 | | VeriFone Systems, Inc.(1) | 8,573 | 162,287 |
| Delphi Financial Group, Inc., | | | | | | 2,114,347 |
| Class A | 2,367 | 57,778 | | LEISURE EQUIPMENT & PRODUCTS — 1.0% | |
| eHealth, Inc.(1) | 1,917 | 21,796 | | | | |
| | | | | Arctic Cat, Inc.(1) | 5,179 | 47,181 |
| FBL Financial Group, Inc., Class A | 2,028 | 42,588 | | Brunswick Corp. | 599 | 7,446 |
| First Mercury Financial Corp. | 14,529 | 153,717 | | | | |
| | | | | JAKKS Pacific, Inc.(1) | 1,247 | 17,932 |
| Flagstone Reinsurance Holdings SA | 4,457 | 48,225 | | | | |
| | | | | Nautilus, Inc.(1) | 4,999 | 7,598 |
| Hallmark Financial Services(1) | 5,257 | 52,307 | | | | |
| | | | | Polaris Industries, Inc. | 8,097 | 442,258 |
| Horace Mann Educators Corp. | 10,800 | 165,240 | | | | |
| | | | | Smith & Wesson Holding Corp.(1) | 23,421 | 95,792 |
| Maiden Holdings Ltd. | 20,656 | 135,710 | | | | |
| Meadowbrook Insurance | | | | Sport Supply Group, Inc. | 6,193 | 83,358 |
| Group, Inc. | 9,149 | 78,956 | | Sturm, Ruger & Co., Inc. | 5,753 | 82,440 |
| National Financial Partners Corp.(1) | 1,859 | 18,162 | | | | 784,005 |
| Navigators Group, Inc. (The)(1) | 2,624 | 107,925 | | LIFE SCIENCES TOOLS & SERVICES — 0.1% | |
| NYMAGIC, Inc. | 155 | 2,990 | | Dionex Corp.(1) | 102 | 7,595 |
| Platinum Underwriters | | | | eResearchTechnology, Inc.(1) | 3,459 | 27,257 |
| Holdings Ltd. | 600 | 21,774 | | PAREXEL International Corp.(1) | 1,722 | 37,333 |
| PMA Capital Corp., Class A(1) | 2,340 | 15,327 | | | | 72,185 |
| SeaBright Holdings, Inc. | 1,294 | 12,267 | | MACHINERY — 3.9% | | |
| Universal Insurance Holdings, Inc. | 8,092 | 33,825 | | Alamo Group, Inc. | 3,554 | 77,122 |
| | | 2,494,884 | | Altra Holdings, Inc.(1) | 5,960 | 77,599 |
| INTERNET & CATALOG RETAIL — 0.3% | | | American Railcar Industries, Inc.(1) | 5,300 | 64,024 |
| NutriSystem, Inc. | 5,569 | 127,753 | | Briggs & Stratton Corp. | 2,614 | 44,490 |
| Shutterfly, Inc.(1) | 2,818 | 67,519 | | Chart Industries, Inc.(1) | 21,795 | 339,566 |
| | | 195,272 | | CIRCOR International, Inc. | 752 | 19,236 |
| INTERNET SOFTWARE & SERVICES — 1.6% | | | EnPro Industries, Inc.(1) | 13,546 | 381,320 |
| Dice Holdings, Inc.(1) | 3,127 | 21,639 | | Force Protection, Inc.(1) | 23,681 | 97,092 |
| DivX, Inc.(1) | 7,529 | 57,672 | | Kadant, Inc.(1) | 3,241 | 56,458 |
| EarthLink, Inc. | 72,768 | 579,233 | | Lindsay Corp. | 8,322 | 263,724 |
| Infospace, Inc.(1) | 1,238 | 9,310 | | Mueller Industries, Inc. | 7,843 | 192,938 |
| j2 Global Communications, Inc.(1) | 16,987 | 370,996 | | NACCO Industries, Inc., Class A | 1,092 | 96,926 |
| LogMeIn, Inc.(1) | 301 | 7,895 | | Tecumseh Products Co., Class A(1) | 458 | 5,093 |
| ModusLink Global Solutions, Inc.(1) | 958 | 5,777 | | Tennant Co. | 5,141 | 173,869 |
15
| | | | | | |
| NT Small Company | | | | | |
| |
| | Shares | Value | | | Shares | Value |
| Timken Co. | 17,974 | $ 467,144 | | PAPER & FOREST PRODUCTS — 1.0% | |
| Toro Co. (The) | 7,786 | 382,449 | | Buckeye Technologies, Inc.(1) | 20,132 | $ 200,313 |
| Watts Water Technologies, Inc., | | | | Clearwater Paper Corp.(1) | 4,586 | 251,129 |
| Class A | 9,668 | 277,085 | | KapStone Paper and | | |
| | | 3,016,135 | | Packaging Corp.(1) | 21,805 | 242,908 |
| MARINE — 0.2% | | | | Neenah Paper, Inc. | 3,645 | 66,704 |
| American Commercial Lines, Inc.(1) | 6,515 | 146,653 | | | | 761,054 |
| Horizon Lines, Inc., Class A | 9,187 | 38,861 | | PERSONAL PRODUCTS — 0.2% | | |
| | | 185,514 | | China Sky One Medical, Inc.(1) | 6,462 | 72,633 |
| MEDIA — 0.2% | | | | Nutraceutical International Corp.(1) | 147 | 2,243 |
| Journal Communications, Inc., | | | | Schiff Nutrition International, Inc. | 4,252 | 30,274 |
| Class A(1) | 8,938 | 35,484 | | | | |
| | | | | USANA Health Sciences, Inc.(1) | 1,749 | 63,891 |
| LodgeNet Interactive Corp.(1) | 5,094 | 18,899 | | | | |
| | | | | | | 169,041 |
| MDC Partners, Inc., Class A | 3,271 | 34,934 | | PHARMACEUTICALS — 2.2% | | |
| Mediacom Communications Corp., | | | | Endo Pharmaceuticals | | |
| Class A(1) | 6,169 | 41,455 | | | | |
| | | | | Holdings, Inc.(1) | 20,384 | 444,779 |
| Scholastic Corp. | 1,790 | 43,175 | | Matrixx Initiatives, Inc.(1) | 565 | 2,599 |
| | | 173,947 | | | | |
| | | | | Medicines Co. (The)(1) | 810 | 6,164 |
| METALS & MINING — 0.6% | | | | | | |
| | | | | Medicis Pharmaceutical Corp., | | |
| Golden Star Resources Ltd. | | | | Class A | 20,213 | 442,260 |
| New York Shares(1) | 41,273 | 180,776 | | | | |
| | | | | Obagi Medical Products, Inc.(1) | 2,919 | 34,503 |
| Haynes International, Inc. | 1,324 | 40,819 | | | | |
| | | | | Questcor Pharmaceuticals, Inc.(1) | 21,631 | 220,853 |
| Hecla Mining Co.(1) | 16,371 | 85,456 | | | | |
| | | | | Santarus, Inc.(1) | 44,642 | 110,712 |
| Olympic Steel, Inc. | 5,643 | 129,620 | | | | |
| | | | | ViroPharma, Inc.(1) | 34,819 | 390,321 |
| | | 436,671 | | | | |
| MULTILINE RETAIL — 1.0% | | | | | | 1,652,191 |
| Dillard’s, Inc., Class A | 3,438 | 73,917 | | PROFESSIONAL SERVICES — 0.1% | |
| | | | | GP Strategies Corp.(1) | 763 | 5,540 |
| Dollar Tree, Inc.(1) | 9,684 | 403,145 | | | | |
| Fred’s, Inc., Class A | 12,329 | 136,359 | | On Assignment, Inc.(1) | 3,912 | 19,677 |
| Tuesday Morning Corp.(1) | 37,917 | 151,289 | | SFN Group, Inc.(1) | 5,324 | 29,069 |
| | | 764,710 | | VSE Corp. | 751 | 23,897 |
| MULTI-UTILITIES — 0.5% | | | | | | 78,183 |
| Avista Corp. | 10,359 | 202,311 | | REAL ESTATE INVESTMENT TRUSTS (REITs) — 6.2% |
| CH Energy Group, Inc. | 2,254 | 88,447 | | Agree Realty Corp. | 2,567 | 59,862 |
| NorthWestern Corp. | 3,639 | 95,342 | | American Campus | | |
| | | 386,100 | | Communities, Inc. | 11,194 | 305,484 |
| | | | | Ashford Hospitality Trust, Inc.(1) | 974 | 7,139 |
| OIL, GAS & CONSUMABLE FUELS — 2.3% | | | | | |
| | | | | Chesapeake Lodging Trust(1) | 611 | 9,666 |
| Alon USA Energy, Inc. | 2,900 | 18,444 | | | | |
| DHT Holdings, Inc. | 17,531 | 67,494 | | Colonial Properties Trust | 15,791 | 229,443 |
| Penn Virginia Corp. | 7,547 | 151,770 | | Corporate Office Properties Trust | 3,273 | 123,589 |
| Petroleum Development Corp.(1) | 4,122 | 105,606 | | Equity LifeStyle Properties, Inc. | 14,810 | 714,286 |
| SM Energy Co. | 12,172 | 488,828 | | Extra Space Storage, Inc. | 9,659 | 134,260 |
| Stone Energy Corp.(1) | 36,358 | 405,755 | | Getty Realty Corp. | 383 | 8,583 |
| | | | | Government Properties | | |
| Swift Energy Co.(1) | 6,817 | 183,445 | | Income Trust | 4,571 | 116,652 |
| World Fuel Services Corp. | 12,051 | 312,603 | | Gramercy Capital Corp.(1) | 5,414 | 6,822 |
| | | 1,733,945 | | Home Properties, Inc. | 8,992 | 405,269 |
16
| | | | | | |
| NT Small Company | | | | | |
| |
| | Shares | Value | | | Shares | Value |
| Inland Real Estate Corp. | 7,575 | $ 59,994 | | Tessera Technologies, Inc.(1) | 15,450 | $ 247,972 |
| Kilroy Realty Corp. | 9,720 | 288,976 | | Volterra Semiconductor Corp.(1) | 12,075 | 278,449 |
| LTC Properties, Inc. | 4,034 | 97,905 | | | | 3,551,570 |
| Medical Properties Trust, Inc. | 19,329 | 182,466 | | SOFTWARE — 3.3% | | |
| Mid-America Apartment | | | | ACI Worldwide, Inc.(1) | 357 | 6,951 |
| Communities, Inc. | 8,378 | 431,216 | | Actuate Corp.(1) | 7,808 | 34,746 |
| Mission West Properties, Inc. | 2,326 | 15,863 | | | | |
| | | | | Blackboard, Inc.(1) | 4,590 | 171,345 |
| National Health Investors, Inc. | 1,009 | 38,907 | | | | |
| | | | | Deltek, Inc.(1) | 993 | 8,282 |
| National Retail Properties, Inc. | 12,731 | 272,953 | | | | |
| | | | | Epicor Software Corp.(1) | 9,020 | 72,070 |
| Pebblebrook Hotel Trust(1) | 5,484 | 103,373 | | | | |
| | | | | EPIQ Systems, Inc.(1) | 2,258 | 29,196 |
| Potlatch Corp. | 2,180 | 77,891 | | | | |
| | | | | Interactive Intelligence, Inc.(1) | 2,099 | 34,486 |
| PS Business Parks, Inc. | 7,464 | 416,342 | | | | |
| Sovran Self Storage, Inc. | 5,043 | 173,631 | | Magma Design Automation, Inc.(1) | 13,496 | 38,329 |
| Tanger Factory Outlet Centers | 8,173 | 338,199 | | Manhattan Associates, Inc.(1) | 8,505 | 234,313 |
| UMH Properties, Inc. | 2,882 | 29,022 | | Net 1 UEPS Technologies, Inc.(1) | 3,133 | 42,013 |
| Universal Health Realty | | | | NetScout Systems, Inc.(1) | 7,483 | 106,408 |
| Income Trust | 2,654 | 85,273 | | Opnet Technologies, Inc. | 3,690 | 54,206 |
| Weingarten Realty Investors | 1,642 | 31,280 | | Progress Software Corp.(1) | 11,330 | 340,240 |
| | | 4,764,346 | | QAD, Inc.(1) | 2,978 | 12,299 |
| ROAD & RAIL — 1.0% | | | | Quest Software, Inc.(1) | 5,499 | 99,202 |
| Dollar Thrifty Automotive | | | | Radiant Systems, Inc.(1) | 7,578 | 109,578 |
| Group, Inc.(1) | 17,355 | 739,496 | | | | |
| | | | | Rosetta Stone, Inc.(1) | 13,655 | 313,519 |
| Heartland Express, Inc. | 3,455 | 50,167 | | | | |
| | | 789,663 | | Symyx Technologies, Inc.(1) | 13,159 | 65,926 |
| SEMICONDUCTORS & SEMICONDUCTOR | | | TIBCO Software, Inc.(1) | 48,090 | 579,965 |
| EQUIPMENT — 4.6% | | | | Tyler Technologies, Inc.(1) | 5,331 | 82,737 |
| Applied Micro Circuits Corp.(1) | 5,910 | 61,937 | | Websense, Inc.(1) | 5,111 | 96,598 |
| ASM International NV | | | | | | 2,532,409 |
| New York Shares(1) | 6,947 | 135,814 | | SPECIALTY RETAIL — 3.5% | | |
| Cypress Semiconductor Corp.(1) | 24,783 | 248,821 | | Asbury Automotive Group, Inc.(1) | 1,572 | 16,569 |
| DSP Group, Inc.(1) | 5,092 | 32,538 | | Books-A-Million, Inc. | 2,166 | 13,039 |
| Exar Corp.(1) | 2,102 | 14,567 | | Cato Corp. (The), Class A | 8,000 | 176,160 |
| FEI Co.(1) | 10,835 | 213,558 | | Children’s Place Retail | | |
| Integrated Device | | | | Stores, Inc. (The)(1) | 5,229 | 230,181 |
| Technology, Inc.(1) | 26,586 | 131,601 | | Destination Maternity Corp.(1) | 158 | 3,997 |
| Integrated Silicon Solution, Inc.(1) | 16,287 | 122,804 | | Finish Line, Inc. (The), Class A | 15,602 | 217,336 |
| Kopin Corp.(1) | 10,322 | 34,991 | | Genesco, Inc.(1) | 11,147 | 293,278 |
| Lattice Semiconductor Corp.(1) | 65,617 | 284,778 | | Group 1 Automotive, Inc.(1) | 2,320 | 54,590 |
| MEMSIC, Inc.(1) | 2,537 | 5,734 | | Hot Topic, Inc. | 22,850 | 116,078 |
| Micrel, Inc. | 6,777 | 68,990 | | Jo-Ann Stores, Inc.(1) | 22,452 | 842,174 |
| MKS Instruments, Inc.(1) | 12,351 | 231,211 | | MarineMax, Inc.(1) | 4,957 | 34,402 |
| RF Micro Devices, Inc.(1) | 14,345 | 56,089 | | Rent-A-Center, Inc.(1) | 20,099 | 407,206 |
| Rudolph Technologies, Inc.(1) | 6,962 | 52,563 | | Sonic Automotive, Inc., Class A(1) | 11,407 | 97,644 |
| Sigma Designs, Inc.(1) | 14,598 | 146,126 | | Stage Stores, Inc. | 12,389 | 132,314 |
| Skyworks Solutions, Inc.(1) | 45,124 | 757,632 | | Stein Mart, Inc.(1) | 7,663 | 47,740 |
| Standard Microsystems Corp.(1) | 18,273 | 425,395 | | Ulta Salon Cosmetics & | | |
| | | | | Fragrance, Inc.(1) | 758 | 17,934 |
| | | | | | | 2,700,642 |
17
| | | | | | |
| NT Small Company | | | | | |
| |
| | Shares | Value | | | Shares | Value |
| TEXTILES, APPAREL & LUXURY GOODS — 2.3% | | WIRELESS TELECOMMUNICATION SERVICES — 0.2% |
| Carter’s, Inc.(1) | 12,993 | $ 341,066 | | USA Mobility, Inc. | 10,889 | $ 140,686 |
| Culp, Inc.(1) | 616 | 6,751 | | TOTAL COMMON STOCKS | | |
| Fossil, Inc.(1) | 4,846 | 168,156 | | (Cost $69,504,687) | | 76,103,921 |
| Lacrosse Footwear, Inc. | 386 | 6,500 | | Temporary Cash Investments — 0.6% |
| Liz Claiborne, Inc.(1) | 17,004 | 71,757 | | JPMorgan U.S. Treasury Plus | | |
| Maidenform Brands, Inc.(1) | 4,764 | 96,995 | | Money Market Fund Agency Shares | 63,520 | 63,520 |
| Oxford Industries, Inc. | 5,904 | 123,571 | | Repurchase Agreement, Bank of America | |
| | | | | Securities, LLC, (collateralized by various | |
| Perry Ellis International, Inc.(1) | 11,814 | 238,643 | | U.S. Treasury obligations, 1.125%, 6/30/11, | |
| Quiksilver, Inc.(1) | 22,005 | 81,419 | | valued at $407,973), in a joint trading | |
| RG Barry Corp. | 1,363 | 15,034 | | account at 0.01%, dated 6/30/10, due 7/1/10 | |
| | | | | (Delivery value $400,000) | | 400,000 |
| Skechers U.S.A., Inc., Class A(1) | 198 | 7,231 | | | | |
| | | | | TOTAL TEMPORARY | | |
| Steven Madden Ltd.(1) | 178 | 5,611 | | CASH INVESTMENTS | | |
| Unifirst Corp. | 4,563 | 200,863 | | (Cost $463,520) | | 463,520 |
| Volcom, Inc.(1) | 3,997 | 74,224 | | TOTAL INVESTMENT | | |
| Weyco Group, Inc. | 335 | 7,631 | | SECURITIES — 100.2% | | |
| | | | | (Cost $69,968,207) | | 76,567,441 |
| Wolverine World Wide, Inc. | 11,204 | 282,565 | | OTHER ASSETS AND | | |
| | | 1,728,017 | | LIABILITIES — (0.2)% | | (134,549) |
| THRIFTS & MORTGAGE FINANCE — 0.5% | | | TOTAL NET ASSETS — 100.0% | | $76,432,892 |
| Bank Mutual Corp. | 5,295 | 30,076 | | | | |
| Brookline Bancorp., Inc. | 1,716 | 15,238 | | | | |
| Charter Financial Corp. | 1,540 | 15,477 | | Notes to Schedule of Investments |
| Dime Community Bancshares | 1,101 | 13,575 | | (1) Non-income producing. | | |
| Doral Financial Corp.(1) | 5,211 | 12,715 | | | | |
| | | | | Industry classifications are unaudited. | | |
| Provident Financial Services, Inc. | 11,566 | 135,207 | | | | |
| TrustCo Bank Corp. NY | 35,219 | 197,226 | | | | |
| | | 419,514 | | See Notes to Financial Statements. | | |
| TRADING COMPANIES & DISTRIBUTORS — 0.3% | | | | |
| Applied Industrial | | | | | | |
| Technologies, Inc. | 1,585 | 40,132 | | | | |
| DXP Enterprises, Inc.(1) | 1,437 | 22,489 | | | | |
| Kaman Corp. | 1,390 | 30,747 | | | | |
| TAL International Group, Inc. | 6,956 | 156,301 | | | | |
| | | 249,669 | | | | |
18
|
| Statement of Assets and Liabilities |
| |
| JUNE 30, 2010 | |
| Assets | |
| Investment securities, at value (cost of $69,968,207) | $76,567,441 |
| Receivable for investments sold | 2,496,094 |
| Dividends and interest receivable | 55,479 |
| | 79,119,014 |
| | |
| Liabilities | |
| Payable for investments purchased | 2,641,395 |
| Accrued management fees | 44,727 |
| | 2,686,122 |
| | |
| Net Assets | $76,432,892 |
| | |
| Institutional Class Capital Shares, $0.01 Par Value | |
| Authorized | 100,000,000 |
| Shares outstanding | 11,301,720 |
| | |
| Net Asset Value Per Share | $6.76 |
| | |
| Net Assets Consist of: | |
| Capital (par value and paid-in surplus) | $78,503,589 |
| Undistributed net investment income | 29,912 |
| Accumulated net realized loss on investment transactions | (8,699,835) |
| Net unrealized appreciation on investments | 6,599,226 |
| | $76,432,892 |
| |
| |
| See Notes to Financial Statements. | |
19
| |
| YEAR ENDED JUNE 30, 2010 | |
| Investment Income (Loss) | |
| Income: | |
| Dividends | $ 699,045 |
| Interest | 592 |
| | 699,637 |
| | |
| Expenses: | |
| Management fees | 468,903 |
| Directors’ fees and expenses | 1,965 |
| Other expenses | 167 |
| | 471,035 |
| | |
| Net investment income (loss) | 228,602 |
| | |
| Realized and Unrealized Gain (Loss) | |
| Net realized gain (loss) on: | |
| Investment transactions | 7,112,979 |
| Futures contract transactions | 7,340 |
| | 7,120,319 |
| | |
| Change in net unrealized appreciation (depreciation) on investments | 4,418,683 |
| | |
| Net realized and unrealized gain (loss) | 11,539,002 |
| | |
| Net Increase (Decrease) in Net Assets Resulting from Operations | $11,767,604 |
| |
| |
| See Notes to Financial Statements. | |
20
|
| Statement of Changes in Net Assets |
| | |
| YEARS ENDED JUNE 30, 2010 AND JUNE 30, 2009 | | |
| Increase (Decrease) in Net Assets | 2010 | 2009 |
| Operations | | |
| Net investment income (loss) | $ 228,602 | $ 184,628 |
| Net realized gain (loss) | 7,120,319 | (12,115,728) |
| Change in net unrealized appreciation (depreciation) | 4,418,683 | 1,528,757 |
| Net increase (decrease) in net assets resulting from operations | 11,767,604 | (10,402,343) |
| | | |
| Distributions to Shareholders | | |
| From net investment income | (303,365) | (84,064) |
| | | |
| Capital Share Transactions | | |
| Proceeds from shares sold | 23,323,122 | 35,672,084 |
| Proceeds from reinvestment of distributions | 9,999 | — |
| Payments for shares redeemed | (5,405,153) | (6,322,703) |
| Net increase (decrease) in net assets from capital share transactions | 17,927,968 | 29,349,381 |
| | | |
| Net increase (decrease) in net assets | 29,392,207 | 18,862,974 |
| | | |
| Net Assets | | |
| Beginning of period | 47,040,685 | 28,177,711 |
| End of period | $76,432,892 | $ 47,040,685 |
| | | |
| Undistributed net investment income | $29,912 | $111,450 |
| | | |
| Transactions in Shares of the Fund | | |
| Sold | 3,569,218 | 6,404,893 |
| Issued in reinvestment of distributions | 1,370 | — |
| Redeemed | (824,413) | (1,126,952) |
| Net increase (decrease) in shares of the fund | 2,746,175 | 5,277,941 |
| |
| |
| |
| See Notes to Financial Statements. | | |
21
|
| Notes to Financial Statements |
JUNE 30, 2010
1. Organization and Summary of Significant Accounting Policies
Organization — American Century Quantitative Equity Funds, Inc. (the corporation) is registered under the Investment Company Act of 1940 (the 1940 Act) as an open-end management investment company. NT Small Company Fund (the fund) is one fund in a series issued by the corporation. The fund is diversified under the 1940 Act. The fund’s objective is to seek long-term capital growth. The fund pursues its objective by investing primarily in stocks of smaller-capitalization U.S. companies. The fund is not permitted to invest in any securities issued by companies assigned the Global Industry Classification Standard for the tobacco industry. The following is a summary of the fund’s significant accounting policies.
Security Valuations — Securities traded primarily on a principal securities exchange are valued at the last reported sales price, or at the mean of the latest bid and asked prices where no last sales price is available. Depending on local convention or regulation, securities traded over-the-counter are valued at the mean of the latest bid and asked prices, the last sales price, or the official close price. Investments in open-end management investment companies are valued at the reported net asset value. Discount notes may be valued through a commercial pricing service or at amortized cost, which approximates fair value. Securities traded on foreign securities exchanges and over-the-counter markets are normally completed before the close of business on days that the New York Stock Exchange (the Exchange) is open and may also take place on days when the Exchange is not open. If an event occurs after the value of a security was established but before the net asset value per share was determined that was likely to materially change the net asset value, that security would be valued as determined in accordance with procedures adopted by the Board of Directors. If the fund determines that the market price of a portfolio security is not readily available, or that the valuation methods mentioned above do not reflect the security’s fair value, such security is valued as determined by the Board of Directors or its designee, in accordance with procedures adopted by the Board of Directors, if such determination would materially impact a fund���s net asset value. Certain other circumstances may cause the fund to use alternative procedures to value a security such as: a security has been declared in default; trading in a security has been halted during the trading day; or there is a foreign market holiday and no trading will commence .
Security Transactions — For financial reporting purposes, security transactions are accounted for as of the trade date. Net realized gains and losses are determined on the identified cost basis, which is also used for federal income tax purposes.
Investment Income — Dividend income less foreign taxes withheld, if any, is recorded as of the ex-dividend date. Distributions received on securities that represent a return of capital or capital gain are recorded as a reduction of cost of investments and/or as a realized gain. The fund estimates the components of distributions received that may be considered nontaxable distributions or capital gain distributions for income tax purposes. Interest income is recorded on the accrual basis and includes accretion of discounts and amortization of premiums
Repurchase Agreements — The fund may enter into repurchase agreements with institutions that American Century Investment Management, Inc. (ACIM) (the investment advisor) has determined are creditworthy pursuant to criteria adopted by the Board of Directors. Each repurchase agreement is recorded at cost. The fund requires that the collateral, represented by securities, received in a repurchase transaction be transferred to the custodian in a manner sufficient to enable the fund to obtain those securities in the event of a default under the repurchase agreement. ACIM monitors, on a daily basis, the securities transferred to ensure the value, including accrued interest, of the securities under each repurchase agreement is equal to or greater than amounts owed to the fund under each repurchase agreement.
22
Joint Trading Account — Pursuant to an Exemptive Order issued by the Securities and Exchange Commission, the fund, along with certain other funds in the American Century Investments family of funds, may transfer uninvested cash balances into a joint trading account. These balances are invested in one or more repurchase agreements that are collateralized by U.S. Treasury or Agency obligations.
Income Tax Status — It is the fund’s policy to distribute substantially all net investment income and net realized gains to shareholders and to otherwise qualify as a regulated investment company under provisions of the Internal Revenue Code. All tax years remain subject to examination by tax authorities. At this time, management believes there are no uncertain tax positions which, based on their technical merit, would not be sustained upon examination and for which it is reasonably possible that the total amounts of unrecognized tax benefits will significantly change in the next twelve months. Accordingly, no provision has been made for federal or state income taxes.
Distributions to Shareholders — Distributions to shareholders are recorded on the ex-dividend date. Distributions from net investment income, if any, are generally declared and paid quarterly. Distributions from net realized gains, if any, are generally declared and paid annually.
Indemnifications — Under the corporation’s organizational documents, its officers and directors are indemnified against certain liabilities arising out of the performance of their duties to the fund. In addition, in the normal course of business, the fund enters into contracts that provide general indemnifications. The maximum exposure under these arrangements is unknown as this would involve future claims that may be made against a fund. The risk of material loss from such claims is considered by management to be remote.
Use of Estimates — The financial statements are prepared in conformity with accounting principles generally accepted in the United States of America, which may require management to make certain estimates and assumptions at the date of the financial statements. Actual results could differ from these estimates.
Subsequent Events — In preparing the financial statements, management evaluated the impact of events or transactions occurring through the date the financial statements were issued that would merit recognition or disclosure.
2. Fees and Transactions with Related Parties
Management Fees — The corporation has entered into a Management Agreement with ACIM, under which ACIM provides the fund with investment advisory and management services in exchange for a single, unified management fee (the fee). The Agreement provides that all expenses of managing and operating the fund, except brokerage expenses, taxes, interest, fees and expenses of the independent directors (including legal counsel fees), and extraordinary expenses, will be paid by ACIM. The fee is computed and accrued daily based on the daily net assets of the specific class of shares of the fund and paid monthly in arrears. The fee consists of (1) an Investment Category Fee based on the daily net assets of the fund and certain other accounts managed by the investment advisor that are in the same broad investment category as the fund and (2) a Complex Fee based on the assets of all the funds in the American Century Investments family of funds. The rates for the Investment Category Fee range from 0.5380% to 0.7200%. The rates for the Complex Fee range from 0.0500% to 0.1100%. The effective annual management fee for the year ended June 30, 2010, was 0.69%.
Related Parties — Certain officers and directors of the corporation are also officers and/or directors of American Century Companies, Inc. (ACC), the parent of the corporation’s investment advisor, ACIM, the distributor of the corporation, American Century Investment Services, Inc., and the corporation’s transfer agent, American Century Services, LLC. The fund is wholly owned, in aggregate, by various funds in a series issued by American Century Asset Allocation Portfolios, Inc. (ACAAP). ACAAP does not invest in the fund for the purpose of exercising management or control.
23
The fund is eligible to invest in a money market fund for temporary purposes, which is managed by J.P. Morgan Investment Management, Inc. (JPMIM). The fund has a Mutual Funds Services Agreement with J.P. Morgan Investor Services Co. (JPMIS) and a securities lending agreement with JPMorgan Chase Bank (JPMCB). JPMCB is a custodian of the fund. JPMIM, JPMIS and JPMCB are wholly owned subsidiaries of JPMorgan Chase & Co. (JPM). JPM is an equity investor in ACC.
3. Investment Transactions
Purchases and sales of investment securities, excluding short-term investments, for the year ended June 30, 2010, were $69,776,762 and $51,556,614, respectively.
4. Fair Value Measurements
The fund’s securities valuation process is based on several considerations and may use multiple inputs to determine the fair value of the positions held by the fund. In conformity with accounting principles generally accepted in the United States of America, the inputs used to determine a valuation are classified into three broad levels as follows:
• Level 1 valuation inputs consist of unadjusted quoted prices in an active market for identical securities;
• Level 2 valuation inputs consist of significant direct or indirect observable market data (including quoted prices for similar securities, evaluations of subsequent market events, interest rates, prepayment speeds, credit risk, etc.); or
• Level 3 valuation inputs consist of significant unobservable inputs (including a fund’s own assumptions).
The level classification is based on the lowest level input that is significant to the fair valuation measurement. The valuation inputs are not an indication of the risks associated with investing in these securities or other financial instruments.
The following is a summary of the valuation inputs used to determine the fair value of the fund’s securities as of June 30, 2010. The Schedule of Investments provides additional details on the fund’s portfolio holdings.
| | | |
| | Level 1 | Level 2 | Level 3 |
| Investment Securities | | | |
| Domestic Common Stocks | $76,103,921 | — | |
| Temporary Cash Investments | 63,520 | $400,000 | — |
| Total Value of Investment Securities | $76,167,441 | $400,000 | — |
5. Derivative Instruments
Equity Price Risk — The fund is subject to equity price risk in the normal course of pursuing its investment objectives. A fund may enter into futures contracts based on an equity index in order to manage its exposure to changes in market conditions. A fund may purchase futures contracts to gain exposure to increases in market value or sell futures contracts to protect against a decline in market value. Upon entering into a futures contract, a fund is required to deposit either cash or securities in an amount equal to a certain percentage of the contract value (initial margin). Subsequent payments (variation margin) are made or received daily, in cash, by a fund. The variation margin is equal to the daily change in the contract value and is recorded as unrealized gains and losses. A fund recognizes a realized gain or loss whe n the contract is closed or expires. Net realized and unrealized gains or losses occurring during the holding period of futures contracts are a component of net realized gain (loss) on futures contract transactions and change in net unrealized appreciation (depreciation) on futures contracts, respectively. One of the risks of entering
24
into futures contracts is the possibility that the change in value of the contract may not correlate with the changes in value of the underlying securities. During the period, the fund infrequently purchased equity price risk derivative instruments for temporary investment purposes.
At period end, the fund did not have any equity price risk derivative instruments disclosed on the Statement of Assets and Liabilities. For the year ended June 30, 2010, the effect of equity price risk derivative instruments on the Statement of Operations was $7,340 in net realized gain (loss) on futures contract transactions.
6. Interfund Lending
The fund, along with certain other funds in the American Century Investments family of funds, may participate in an interfund lending program, pursuant to an Exemptive Order issued by the Securities and Exchange Commission (SEC). This program provides an alternative credit facility allowing the fund to borrow from or lend to other funds in the American Century Investments family of funds that permit such transactions. Interfund lending transactions are subject to each fund’s investment policies and borrowing and lending limits. The interfund loan rate earned/paid on interfund lending transactions is determined daily based on the average of certain current market rates. Interfund lending transactions normally extend only overnight, but can have a maximum duration of seven days. The program is subject to annual approval by the Board of Directors. During the year ended June 30, 2010, the fund did not utilize the program.
7. Risk Factors
The fund concentrates its investments in stocks of small companies. Because of this, the fund may be subject to greater risk and market fluctuations than a fund investing in larger, more established companies.
8. Federal Tax Information
The tax character of distributions paid during the years ended June 30, 2010 and June 30, 2009 were as follows:
| | |
| | 2010 | 2009 |
| Distributions Paid From | | |
| Ordinary income | $303,365 | $84,064 |
| Long-term capital gains | — | — |
The book-basis character of distributions made during the year from net investment income or net realized gains may differ from their ultimate characterization for federal income tax purposes. These differences reflect the differing character of certain income items and net realized gains and losses for financial statement and tax purposes, and may result in reclassification among certain capital accounts on the financial statements.
As of June 30, 2010, the federal tax cost of investments and the components of distributable earnings on a tax-basis were as follows:
| | |
| Federal tax cost of investments | $72,716,777 |
| Gross tax appreciation of investments | $ 8,267,714 |
| Gross tax depreciation of investments | (4,417,050) |
| Net tax appreciation (depreciation) of investments | $ 3,850,664 |
| Net tax appreciation (depreciation) on derivatives | $ (64) |
| Net tax appreciation (depreciation) | $ 3,850,600 |
| Undistributed ordinary income | $40,112 |
| Accumulated capital losses | $(5,961,409) |
25
The difference between book-basis and tax-basis cost and unrealized appreciation (depreciation) is attributable primarily to the tax deferral of losses on wash sales and the realization to ordinary income for tax purposes of unrealized gains on investments in passive foreign investment companies.
The accumulated capital losses listed on the previous page represent net capital loss carryovers that may be used to offset future realized capital gains for federal income tax purposes. Future capital loss carryover utilization in any given year may be subject to Internal Revenue Code limitations. The capital loss carryovers expire as follows:
| | | | |
| 2014 | 2015 | 2016 | 2017 | 2018 |
| $(652,509) | — | $(396,625) | $(3,161,459) | $(1,750,816) |
9. Corporate Event
As part of a long-standing estate and business succession plan established by ACC Co-Chairman James E. Stowers, Jr., the founder of American Century Investments, ACC Co-Chairman Richard W. Brown succeeded Mr. Stowers as trustee of a trust that holds a greater-than-25% voting interest in ACC, the parent corporation of the fund’s advisor. Under the 1940 Act, this is presumed to represent control of ACC even though it is less than a majority interest. The change of trustee may technically be considered a “change of control” of ACC and therefore also a change of control of the fund’s advisor even though there has been no change to its management and none is anticipated. The “change of control” resulted in the assignment of the fund’s investment advisory agreement. Under the 1940 Act, an assignment automatically terminated such agreement, making the approval of a new agreement necessa ry.
On February 18, 2010, the Board of Directors approved an interim investment advisory agreement under which the fund will be managed until a new agreement is approved by fund shareholders. On April 1, 2010, the Board of Directors approved a new investment advisory agreement. The interim agreement and the new agreement are substantially identical to the terminated agreements (with the exception of different effective and termination dates) and will not result in changes in the management of American Century Investments, the fund, its investment objectives, fees or services provided.
The new agreement for the fund was approved by shareholders at a Special Meeting of Shareholders on June 16, 2010. The new agreement went into effect on July 16, 2010.
10. Other Tax Information (Unaudited)
The following information is provided pursuant to provisions of the Internal Revenue Code.
The fund hereby designates up to the maximum amount allowable as qualified dividend income for the fiscal year ended June 30, 2010.
For corporate taxpayers, the fund hereby designates $303,365, or up to the maximum amount allowable, of ordinary income distributions paid during the fiscal year ended June 30, 2010 as qualified for the corporate dividends received deduction.
26
| | | | | | |
| NT Small Company | | | | | |
| |
| Institutional Class | | | | | |
| For a Share Outstanding Throughout the Years Ended June 30 (except as noted) | | |
| | | 2010 | 2009 | 2008 | 2007(1) | 2006(2) |
| Per-Share Data | | | | | |
| Net Asset Value, Beginning of Period | $5.50 | $8.60 | $10.65 | $9.80 | $10.00 |
| Income From Investment Operations | | | | | |
| Net Investment Income (Loss) | 0.02(3) | 0.03(3) | 0.03 | 0.02 | 0.02 |
| Net Realized and Unrealized Gain (Loss) | 1.27 | (3.11) | (2.05) | 0.84 | (0.20) |
| Total From Investment Operations | 1.29 | (3.08) | (2.02) | 0.86 | (0.18) |
| Distributions | | | | | |
| From Net Investment Income | (0.03) | (0.02) | (0.03) | (0.01) | (0.02) |
| Net Asset Value, End of Period | $6.76 | $5.50 | $8.60 | $10.65 | $9.80 |
| |
| Total Return(4) | 23.50% | (35.83)% | (18.98)% | 8.77% | (1.78)% |
| | | | | | |
| Ratios/Supplemental Data | | | | | |
| Ratio of Operating Expenses | | | | | |
| to Average Net Assets | 0.69% | 0.70% | 0.67% | 0.67%(5) | 0.67%(5) |
| Ratio of Net Investment Income (Loss) | | | | | |
| to Average Net Assets | 0.34% | 0.56% | 0.29% | 0.40%(5) | 0.39%(5) |
| Portfolio Turnover Rate | 78% | 110% | 143% | 73% | 82% |
| Net Assets, End of Period (in thousands) | $76,433 | $47,041 | $28,178 | $23,794 | $18,216 |
| (1) | January 1, 2007 through June 30, 2007. The fund’s fiscal year end was changed from December 31 to June 30, resulting in a six-month annual |
| | reporting period. | | | | | |
| (2) | May 12, 2006 (fund inception) through December 31, 2006. | | | | |
| (3) | Computed using average shares outstanding throughout the period. | | | | |
| (4) | Total return assumes reinvestment of net investment income and capital gains distributions, if any. Total returns for periods less than one year |
| | are not annualized. Total returns are calculated based on the net assets value of the last business day. | | |
| (5) | Annualized. | | | | | |
See Notes to Financial Statements.
27
|
| Report of Independent Registered Public Accounting Firm |
To the Directors of the American Century Quantitative Equity Funds, Inc.
and Shareholders of the NT Small Company Fund:
In our opinion, the accompanying statement of assets and liabilities, including the schedule of investments, and the related statements of operations and of changes in net assets and the financial highlights present fairly, in all material respects, the financial position of the NT Small Company Fund (one of the eleven funds comprising the American Century Quantitative Equity Funds, Inc., hereafter referred to as the “Fund”) at June 30, 2010, the results of its operations for the year then ended, the changes in its net assets for each of the two years in the period then ended and the financial highlights for each of the periods presented, in conformity with accounting principles generally accepted in the United States of America. These financial statements and financial highlights (hereafter referred to as “financial statements”) are the responsibility of the Fund’s management; our respons ibility is to express an opinion on these financial statements based on our audits. We conducted our audits of these financial statements in accordance with the standards of the Public Company Accounting Oversight Board (United States). Those standards require that we plan and perform the audit to obtain reasonable assurance about whether the financial statements are free of material misstatement. An audit includes examining, on a test basis, evidence supporting the amounts and disclosures in the financial statements, assessing the accounting principles used and significant estimates made by management, and evaluating the overall financial statement presentation. We believe that our audits, which included confirmation of securities at June 30, 2010 by correspondence with the custodian and brokers, provide a reasonable basis for our opinion.
PricewaterhouseCoopers LLP
Kansas City, Missouri
August 19, 2010
28
A special meeting of shareholders was held on June 16, 2010, to vote on the following proposals. Each proposal received the required number of votes and was adopted. A summary of voting results is listed below each proposal.
Proposal 1:
To elect one Director to the Board of Directors of American Century Quantitative Equity Funds, Inc. (the proposal was voted on by all shareholders of funds issued by American Century Quantitative Equity Funds, Inc.):
| | |
| Frederick L.A. Grauer | For: | 4,067,909,978 |
| | Withhold: | 174,470,448 |
| | Abstain: | 0 |
| | Broker Non-Vote: | 0 |
The other directors whose term of office continued after the meeting include Jonathan S. Thomas, John Freidenrich, Ronald J. Gilson, Peter F. Pervere, Myron S. Scholes, and John B. Shoven.
Proposal 2:
To approve a management agreement between the fund and American Century Investment Management, Inc.:
| | |
| Institutional Class | For: | 73,708,508 |
| | Against: | 1,027,629 |
| | Abstain: | 3,656,450 |
| | Broker Non-Vote: | 0 |
29
The Board of Directors
The individuals listed below serve as directors of the fund. Each director will continue to serve in this capacity until death, retirement, resignation or removal from office. The mandatory retirement age for directors who are not “interested persons,” as that term is defined in the Investment Company Act (independent directors), is 73. However, the mandatory retirement age may be extended for a period not to exceed two years with the approval of the remaining independent directors.
Mr. Thomas is the only director who is an “interested person” because he currently serves as President and Chief Executive Officer of American Century Companies, Inc. (ACC), the parent company of American Century Investment Management, Inc. (ACIM or the advisor).
The other directors (more than three-fourths of the total number) are independent; that is, they have never been employees, directors or officers of, and have no financial interest in, ACC or any of its wholly owned, direct or indirect, subsidiaries, including ACIM, American Century Investment Services, Inc. (ACIS) and American Century Services, LLC (ACS). The directors serve in this capacity for eight (in the case of Mr. Thomas, 15) registered investment companies in the American Century Investments family of funds.
The following presents additional information about the directors. The mailing address for each director other than Mr. Thomas is 1665 Charleston Road, Mountain View, California 94043. The mailing address for Mr. Thomas is 4500 Main Street, Kansas City, Missouri 64111.
Independent Directors
John Freidenrich
Year of Birth: 1937
Position(s) with the Fund: Director
Length of Time Served: Since 2005
Principal Occupation(s) During the Past Five Years: Founder, Member and Manager, Regis
Management Company, LLC (investment management firm) (April 2004 to present)
Number of Funds in Fund Complex Overseen by Director: 41
Other Directorships Held by Director During the Past Five Years: None
Education/Other Professional Experience: AB in Economics, Stanford University; LLB,
Stanford Law School; formerly, Partner and Founder, Ware and Freidenrich Law
Firm and Bay Partners; formerly, President, Board of Trustees, Stanford University
Ronald J. Gilson
Year of Birth: 1946
Position(s) with the Fund: Director and Chairman of the Board
Length of Time Served: Since 1995
Principal Occupation(s) During the Past Five Years: Charles J. Meyers Professor of Law and
Business, Stanford Law School (1979 to present); Marc and Eva Stern Professor of
Law and Business, Columbia University School of Law (1992 to present)
Number of Funds in Fund Complex Overseen by Director: 41
Other Directorships Held by Director During the Past Five Years: None
Education/Other Professional Experience: BA, Washington University; JD, Yale Law School;
formerly, Attorney, Steinhart, Goldberg, Feigenbaum & Ladar
30
Frederick L. A. Grauer
Year of Birth: 1946
Position(s) with the Fund: Director
Length of Time Served: Since 2008
Principal Occupation(s) During the Past Five Years: Senior Advisor, BlackRock, Inc. (investment
management firm) (2010 to present); Senior Advisor, Barclays Global Investors
(investment management firm) (2003 to 2009)
Number of Funds in Fund Complex Overseen by Director: 41
Other Directorships Held by Director During the Past Five Years: None
Education/Other Professional Experience: BA in Economics, University of British Columbia;
MA in Economics, University of Chicago; PhD in Business, Stanford University;
formerly, Executive Chairman, Barclays Global Investors; Chairman and Chief
Executive Officer, Wells Fargo Nikko Investment Advisors; and Vice President,
Merrill Lynch Capital Markets Group; formerly, Director, New York Stock Exchange,
Chicago Mercantile Exchange and Columbia University; formerly, Faculty Member,
Graduate School of Business, Columbia University and Alfred P. Sloan School of
Management, Massachusetts Institute of Technology
Peter F. Pervere
Year of Birth: 1947
Position(s) with the Fund: Director
Length of Time Served: Since 2007
Principal Occupation(s) During the Past Five Years: Retired
Number of Funds in Fund Complex Overseen by Director: 41
Other Directorships Held by Director During the Past Five Years: Intraware, Inc. (2003 to 2009);
Digital Impact, Inc. (2003 to 2005)
Education/Other Professional Experience: BA in History, Stanford University; CPA; formerly,
Vice President and Chief Financial Officer, Commerce One, Inc. (software and
services provider); formerly, Vice President and Corporate Controller, Sybase, Inc.;
formerly with accounting firm of Arthur Young & Co.
Myron S. Scholes
Year of Birth: 1941
Position(s) with the Fund: Director
Length of Time Served: Since 1980
Principal Occupation(s) During the Past Five Years: Chairman, Platinum Grove Asset
Management, L.P. (asset manager) (1999 to 2009); Frank E. Buck Professor of
Finance-Emeritus, Stanford Graduate School of Business (1996 to present)
Number of Funds in Fund Complex Overseen by Director: 41
Other Directorships Held by Director During the Past Five Years: Dimensional Fund Advisors
(investment advisor); CME Group, Inc. (futures and options exchange)
Education/Other Professional Experience: BA in Economics, McMaster University (Ontario);
MBA and PhD, University of Chicago; formerly, Senior Research Fellow at the
Hoover Institute; formerly, Edward Eagle Brown Professor of Finance, University of
Chicago; recipient of the Alfred Nobel Memorial Prize in Economic Sciences
31
John B. Shoven
Year of Birth: 1947
Position(s) with the Fund: Director
Length of Time Served: Since 2002
Principal Occupation(s) During the Past Five Years: Professor of Economics, Stanford University
(1973 to present)
Number of Funds in Fund Complex Overseen by Director: 41
Other Directorships Held by Director During the Past Five Years: Cadence Design Systems;
Exponent; Financial Engines; PalmSource, Inc. (2002 to 2005); Watson Wyatt
Worldwide (2002 to 2006)
Education/Other Professional Experience: BA in Physics, University of California; PhD in
Economics, Yale University; Director of the Stanford Institute for Economic Policy
Research (1999 to present); formerly, Chair of Economics and Dean of Humanities
and Sciences, Stanford University
Interested Director
Jonathan S. Thomas
Year of Birth: 1963
Position(s) with the Fund: Director and President
Length of Time Served: Since 2007
Principal Occupation(s) During the Past Five Years: President and Chief Executive Officer,
ACC (March 2007 to present); Chief Administrative Officer, ACC (February 2006 to
February 2007); Executive Vice President, ACC (November 2005 to February 2007);
Global Chief Operating Officer and Managing Director, Morgan Stanley (investment
management) (March 2000 to November 2005). Also serves as: Chief Executive
Officer and Manager, ACS; Executive Vice President, ACIM; Director, ACC, ACIM
and other ACC subsidiaries
Number of Funds in Fund Complex Overseen by Director: 104
Other Directorships Held by Director During the Past Five Years: None
Education/Other Professional Experience: BA in Economics, University of Massachusetts;
MBA, Boston College; formerly held senior leadership roles with Fidelity
Investments, Boston Financial Services and Bank of America; serves on the Board of
Governors of the Investment Company Institute
32
Officers
The following table presents certain information about the executive officers of the fund. Each officer serves as an officer for each of the 15 investment companies in the American Century family of funds, unless otherwise noted. No officer is compensated for his or her service as an officer of the fund. The listed officers are interested persons of the fund and are appointed or re-appointed on an annual basis. The mailing address for each of the officers listed below is 4500 Main Street, Kansas City, Missouri 64111.
| | |
| Name | Offices with | |
| (Year of Birth) | the Fund | Principal Occupation(s) During the Past Five Years |
| Jonathan S. | Director and | President and Chief Executive Officer, ACC (March 2007 to present); Chief |
| Thomas | President | Administrative Officer, ACC (February 2006 to February 2007); Executive Vice |
| (1963) | since 2007 | President, ACC (November 2005 to February 2007); Global Chief Operating |
| | | Officer and Managing Director, Morgan Stanley (March 2000 to November |
| | | 2005). Also serves as: Chief Executive Officer and Manager, ACS; Executive |
| | | Vice President, ACIM; Director, ACC, ACIM and other ACC subsidiaries |
| Barry Fink | Executive Vice | Chief Operating Officer and Executive Vice President, ACC (September 2007 |
| (1955) | President | to present); President, ACS (October 2007 to present); Managing Director, |
| | since 2007 | Morgan Stanley (2000 to 2007); Global General Counsel, Morgan Stanley |
| | | (2000 to 2006). Also serves as: Manager, ACS, and Director, ACC and |
| | | certain ACC subsidiaries |
| Maryanne L. | Chief Compliance | Chief Compliance Officer, American Century funds, ACIM and ACS (August |
| Roepke | Officer since 2006 | 2006 to present); Assistant Treasurer, ACC (January 1995 to August 2006); |
| (1956) | and Senior Vice | and Treasurer and Chief Financial Officer, various American Century funds |
| | President | (July 2000 to August 2006). Also serves as: Senior Vice President, ACS |
| | since 2000 | |
| Charles A. | General Counsel | Attorney, ACC (February 1994 to present); Vice President, ACC (November |
| Etherington | since 2007 and | 2005 to present); General Counsel, ACC (March 2007 to present); Also |
| (1957) | Senior Vice | serves as General Counsel, ACIM, ACS, ACIS and other ACC subsidiaries; |
| | President | and Senior Vice President, ACIM and ACS |
| | since 2006 | |
| Robert J. Leach | Vice President, | Vice President, ACS (February 2000 to present); and Controller, various |
| (1966) | Treasurer and | American Century funds (1997 to September 2006) |
| | Chief Financial | |
| | Officer since 2006 | |
| David H. Reinmiller | Vice President | Attorney, ACC (January 1994 to present); Associate General Counsel, ACC |
| (1963) | since 2001 | (January 2001 to present); Chief Compliance Officer, American Century |
| | | funds and ACIM (January 2001 to February 2005). Also serves as: Vice |
| | | President, ACIM and ACS |
| Ward D. Stauffer | Secretary | Attorney, ACC (June 2003 to Present) |
| (1960) | since 2005 | |
The SAI has additional information about the fund’s directors and is available without charge, upon request, by calling 1-800-345-2021.
33
|
| Board Approval of Management Agreements |
American Century Investment Management, Inc. (“ACIM” or the “Advisor”) currently serves as investment advisor to the Fund under a management agreement (the “Current Management Agreement”) that took effect on July 16, 2010, following approval by the Fund’s Board of Directors (the “Board”) and shareholders. The Advisor previously served as investment advisor to the Fund pursuant to a prior management agreement (the “Prior Management Agreement”) and an interim management agreement (the “Interim Management Agreeement”). The Interim Management Agreement terminated in accordance with its terms on July 16, 2010, upon the effectiveness of the Current Management Agreement. The Prior Management Agreement terminated on February 16, 2010, as a result of a change of control of the Advisor’s parent company, American Century Companies, Inc. (“ACC”). The change in control occurred as the result of a change in the trustee of a trust created by James E. Stowers, Jr., the founder of American Century Investments that holds shares representing a significant interest in ACC stock. Mr. Stowers previously served as the trustee of the trust. On February 16, 2010, Richard W. Brown, Co-Chairman of ACC with Mr. Stowers, became the trustee in accordance with the terms of the trust and Mr. Stowers’ long-standing estate and succession plan.
On February 18, 2010, the Board approved the Interim Management Agreement in accordance with Rule 15a-4 under the Investment Company Act to ensure continued management of the Fund by the Advisor after the termination of the Prior Management Agreement and until shareholder approval of the Current Management Agreement as required under the Act. The Board approved the Current Management Agreement and recommended its approval to shareholders. Fund shareholders approved the Current Management Agreement at a meeting held on June 16, 2010.
The Interim Management Agreement and the Current Management Agreement are substantially identical to the Prior Management Agreement except for their effective dates and the termination provisions of the Interim Management Agreement. Under the Interim and Current Management Agreements, the Advisor will provide the same services to the Fund and receive the same compensation rate as under the Prior Management Agreement.
Basis for Board Approval of Interim Management Agreement
In considering the approval of the Interim Management Agreement, Rule 15a-4 requires the Board to approve the contract within ten business days of the termination of the prior agreement and to determine that the compensation to be received under the interim agreement is no greater than would have been received under the prior agreement. In connection with the approval, the Board noted that it oversees on a continuous basis and evaluates at its quarterly meetings, directly and through the committees of the Board, the nature and quality of significant services provided by the Advisor, the investment performance of the Fund, shareholder services, audit and compliance functions and a variety of other matters relating to the Fund’s operations.
34
In evaluating the Interim Management Agreement, the Board, assisted by the advice of its independent legal counsel, considered a number of factors in addition to those required by the rule with no one factor being determinative to its analysis. Among the factors considered by the Board were the circumstances and effect of the change of control, the fact that the Advisor will provide the same services and receive the same compensation rate as under the Prior Management Agreement, and that the change of control did not result in a change of the personnel managing the Fund. Upon completion of its analysis, the Board approved the Interim Management Agreement, determining that the continued management of the Fund by the Advisor was in the best interests of the Fund and Fund shareholders.
Basis for Board Approval of Current Management Agreement
At a meeting held on April 1, 2010, after considering all information presented, the Board approved, and determined to recommend that shareholders approve, the Current Management Agreement. In connection with that approval, the Board requested and reviewed extensive data and information compiled by the Advisor and certain independent providers of evaluation data concerning the Fund and services provided to the Fund by the Advisor. The Board oversees on a continuous basis and evaluates at its quarterly meetings, directly and through the committees of the Board, the nature and quality of significant services provided by the Advisor, the investment performance of the Fund, shareholder services, audit and compliance functions and a variety of other matters relating to the Fund’s operations. The information considered and the discussions held at the meetings included, but were not limited to:
• the nature, extent and quality of investment management, shareholder services and other services provided to the Fund;
• the wide range of programs and services the Advisor provides to the Fund and its shareholders on a routine and non-routine basis;
• the compliance policies, procedures, and regulatory experience of the Advisor;
• data comparing the cost of owning the Fund to the cost of owning similar funds;
• the fact that there will be no changes to the fees, services, or personnel who provide such services as compared to the Prior Management Agreement;
• data comparing the Fund’s performance to appropriate benchmarks and/or a peer group of other mutual funds with similar investment objectives and strategies;
• financial data showing the profitability of the Fund to the Advisor and the overall profitability of the Advisor;
• data comparing services provided and charges to the Fund with those for other non-fund investment management clients of the Advisor; and
35
• consideration of collateral or “fall-out” benefits derived by the Advisor from the management of the Fund and potential sharing of economies of scale in connection with the management of the Fund.
The Board also considered whether there was any reason for not continuing the existing arrangement with the Advisor. In particular, the Board recognized that shareholders may have invested in the Fund on the strength of the Advisor’s industry standing and reputation and in the expectation that the Advisor will have a continuing role in providing advisory services to the Fund.
The Board considered all of the information provided by the Advisor, the independent data providers, and the Board’s independent legal counsel, and evaluated such information for the Fund. The Board did not identify any single factor as being all-important or controlling, and each Board member may have attributed different levels of importance to different factors. In deciding to approve the Current Management Agreement under the terms ultimately determined by the Board to be appropriate, the Board based its decision on a number of factors, including the following:
Nature, Extent and Quality of Services — Generally. Under the Current Management Agreement, the Advisor is responsible for providing or arranging for all services necessary for the operation of the Fund. The Board noted that under the Current Management Agreement, the Advisor provides or arranges at its own expense a wide variety of services including:
• constructing and designing the Fund
• portfolio research and security selection
• initial capitalization/funding
• securities trading
• Fund administration
• custody of Fund assets
• daily valuation of the Fund’s portfolio
• shareholder servicing and transfer agency, including shareholder
confirmations, recordkeeping and communications
• legal services
• regulatory and portfolio compliance
• financial reporting
• marketing and distribution
36
The Board noted that many of these services have expanded over time both in terms of quantity and complexity in response to shareholder demands, competition in the industry, changing distribution channels and the changing regulatory environment.
Investment Management Services. The investment management services provided to the Fund are complex and provide Fund shareholders access to professional money management, instant diversification of their investments within an asset class, the opportunity to easily diversify among asset classes, and liquidity. As a part of its general oversight and in evaluating investment performance, the Board expects the Advisor to manage the Fund in accordance with its investment objectives and approved strategies. In providing these services, the Advisor utilizes teams of investment professionals who require extensive information technology, research, training, compliance and other systems to conduct their business. The Board, directly and through its Portfolio Committee, regularly reviews investment performance information for the Fund, t ogether with comparative information for appropriate benchmarks and/or peer groups of similarly-managed funds, over different time horizons. If performance concerns are identified, the underperforming Fund receives special reviews until performance improves, during which time the Board discusses with the Advisor the reasons for such underperformance and any efforts being undertaken to improve performance.
Shareholder and Other Services. Under the Current Management Agreement, the Advisor will also provide the Fund with a comprehensive package of transfer agency, shareholder, and other services. The Board, directly and through the various committees of the Board, regularly reviews reports and evaluations of such services. These reports include, but are not limited to, information regarding the operational efficiency and accuracy of the shareholder and transfer agency services provided, staffing levels, shareholder satisfaction (as measured by external as well as internal sources), technology support, new products and services offered to Fund shareholders, securities trading activities, portfolio valuation services, auditing services, and legal and operational compliance activities. Certain aspects of shareholder and transfer age ncy service level efficiency and the quality of securities trading activities are measured by independent third party providers and are presented in comparison to other fund groups not managed by the Advisor.
Costs of Services Provided and Profitability. The Advisor provided detailed information concerning its cost of providing various services to the Fund, its profitability in managing the Fund, its overall profitability, and its financial condition. The Board reviewed with the Advisor the methodology used to prepare this financial information. The Board has also reviewed with the Advisor its methodology for compensating the investment professionals that provide services to the Fund as well as compensation to the five highest paid personnel of the Advisor. This financial information regarding the Advisor is considered in order to evaluate the Advisor’s financial condition, its ability to continue to provide services under the Current Management Agreement, and the reasonableness of the current management fees.
37
Ethics. The Board generally considers the Advisor’s commitment to providing quality services to shareholders and to conducting its business ethically. It noted that the Advisor’s practices generally meet or exceed industry best practices.
Economies of Scale. The Board also reviewed information provided by the Advisor regarding the possible existence of economies of scale in connection with the management of the Fund. The Board concluded that economies of scale are difficult to measure and predict with precision, especially on a fund-by-fund basis. The analysis of economies of scale is further complicated by the additional services and content provided by the Advisor and its reinvestment in its ability to provide and expand those services. Accordingly, the Board seeks to evaluate economies of scale by reviewing information, such as year-over-year profitability of the Advisor generally, the profitability of its management of the Fund specifically, and the expenses incurred by the Advisor in providing various functions to the Fund. The Board believes the Advisor i s appropriately sharing economies of scale through its competitive fee structure, offering competitive fees from fund inception, fee breakpoints as the fund complex and the Fund increases in size, and through reinvestment in its business to provide shareholders additional services and enhancements to existing services. In particular, separate breakpoint schedules based on the size of the entire fund complex and on the size of the Fund reflect the complexity of assessing economies of scale.
Comparison to Fees of Funds not Managed by the Advisor. Both the Prior and Current Management Agreements provide that the Fund pays the Advisor a single, all-inclusive (or unified) management fee for providing all services necessary for the management and operation of the Fund, other than brokerage expenses, taxes, interest, extraordinary expenses, and the fees and expenses of the Fund’s Independent Directors (including their independent legal counsel) and expenses incurred in connection with the provision of shareholder services and distribution services under a plan adopted pursuant to Rule 12b-1 under the 1940 Act. Under the unified fee structure, the Advisor is responsible for providing all investment advisory, custody, audit, administrative, compliance, recordkeeping, marketing and shareholder services, or arranging and supervising third parties that provide such services. By contrast, most other funds are charged a variety of fees, including an investment advisory fee, a transfer agency fee, an administrative fee, distribution charges and other expenses. Other than their investment advisory fees and any applicable Rule 12b-1 distribution fees, the components of the total fees charged by these other funds may be increased without shareholder approval. The Board believes the unified fee structure is a benefit to Fund shareholders because it clearly discloses to shareholders the cost of owning Fund shares, and, since the unified fee cannot be increased without a vote of Fund shareholders, it shifts to the Advisor the risk of increased costs of operating the Fund and provides a direct incentive to minimize administrative inefficiencies. Part of the Board’s analysis of fee levels involves reviewing certain evaluative data compiled by an independent provider comparing the Fund’s unified fee to
38
the total expense ratios of similar funds not managed by the Advisor. The Board concluded that the management fee to be paid by the Fund to the Advisor under the Current Management Agreement is reasonable in light of the services to be provided to the Fund.
Comparison to Fees and Services Provided to Other Clients of the Advisor. The Board also requested and received information from the Advisor concerning the nature and extent of the services, fees, and profitability of its advisory services to advisory clients other than the Fund. They observed that these varying types of client accounts require different services and involve different regulatory and entrepreneurial risks than the management of the Fund. The Board analyzed this information and concluded that the fees charged and services provided to the Fund were reasonable by comparison.
Collateral or “Fall-Out” Benefits Derived by the Advisor. The Board considered the existence of collateral benefits the Advisor may receive as a result of its relationship with the Fund. The Board concluded that the Advisor’s primary business is managing mutual funds and it generally does not use Fund or shareholder information to generate profits in other lines of business, and therefore does not derive any significant collateral benefits from them. The Board noted that the Advisor receives proprietary research from broker-dealers that execute Fund portfolio transactions and concluded that this research is likely to benefit Fund shareholders. The Board also determined that the Advisor is able to provide investment management services to certain clients other than the Fund, at least in part, due to its existing infrastructure built to serve the fund complex. The Board concluded, however, that the assets of those other clients are not material to the analysis and, in any event, are included with the assets of the Fund to determine breakpoints in the Fund’s fee schedule, provided they are managed using the same investment team and strategy.
Conclusion of the Board. As a result of this process, the Board, in the absence of particular circumstances and assisted by the advice of its independent legal counsel, taking into account all of the factors discussed above and the information provided by the Advisor and others, concluded that the Current Management Agreement be approved and recommended its approval to Fund shareholders.
39
Retirement Account Information
As required by law, distributions you receive from certain IRAs, or 403(b), 457 and qualified plans are subject to federal income tax withholding, unless you elect not to have withholding apply. Tax will be withheld on the total amount withdrawn even though you may be receiving amounts that are not subject to withholding, such as nondeductible contributions. In such case, excess amounts of withholding could occur. You may adjust your withholding election so that a greater or lesser amount will be withheld.
If you don’t want us to withhold on this amount, you must notify us to not withhold the federal income tax. You may notify us in writing or in certain situations by telephone or through other electronic means. You have the right to revoke your withholding election at any time and any election you make may remain in effect until revoked by filing a new election.
Remember, even if you elect not to have income tax withheld, you are liable for paying income tax on the taxable portion of your withdrawal. If you elect not to have income tax withheld or you don’t have enough income tax withheld, you may be responsible for payment of estimated tax. You may incur penalties under the estimated tax rules if your withholding and estimated tax payments are not sufficient. You can reduce or defer the income tax on a distribution by directly or indirectly rolling such distribution over to another IRA or eligible plan. You should consult your tax advisor for additional information.
State tax will be withheld if, at the time of your distribution, your address is within one of the mandatory withholding states and you have federal income tax withheld. State taxes will be withheld from your distribution in accordance with the respective state rules.
Proxy Voting Guidelines
American Century Investment Management, Inc., the fund’s investment advisor, is responsible for exercising the voting rights associated with the securities purchased and/or held by the fund. A description of the policies and procedures the advisor uses in fulfilling this responsibility is available without charge, upon request, by calling 1-800-345-2021. It is also available on American Century Investments’ website at americancentury.com and on the Securities and Exchange Commission’s website at sec.gov. Information regarding how the investment advisor voted proxies relating to portfolio securities during the most recent 12-month period ended June 30 is available on the “About Us” page at americancentury.com. It is also available at sec.gov.
Quarterly Portfolio Disclosure
The fund files its complete schedule of portfolio holdings with the Securities and Exchange Commission (SEC) for the first and third quarters of each fiscal year on Form N-Q. The fund’s Forms N-Q are available on the SEC’s website at sec.gov, and may be reviewed and copied at the SEC’s Public Reference Room in Washington, DC. Information on the operation of the Public Reference Room may be obtained by calling 1-800-SEC-0330. The fund also makes its complete schedule of portfolio holdings for the most recent quarter of its fiscal year available on its website at americancentury.com and, upon request, by calling 1-800-345-2021.
40
The following indices are used to illustrate investment market, sector, or style performance or to serve as fund performance comparisons. They are not investment products available for purchase.
The Russell 1000® Index is a market-capitalization weighted, large-cap index created by Frank Russell Company to measure the performance of the 1,000 largest publicly traded U.S. companies, based on total market capitalization.
The Russell 1000® Growth Index measures the performance of those Russell 1000 Index companies (the 1,000 largest publicly traded U.S. companies, based on total market capitalization) with higher price-to-book ratios and higher forecasted growth values.
The Russell 1000® Value Index measures the performance of those Russell 1000 Index companies (the 1,000 largest publicly traded U.S. companies, based on total market capitalization) with lower price-to-book ratios and lower forecasted growth values.
The Russell 2000® Index is a market-capitalization weighted index created by Frank Russell Company to measure the performance of the 2,000 smallest of the 3,000 largest publicly traded U.S. companies, based on total market capitalization.
The Russell 2000® Growth Index measures the performance of those Russell 2000 Index companies (the 2,000 smallest of the 3,000 largest publicly traded U.S. companies, based on total market capitalization) with higher price-to-book ratios and higher forecasted growth values.
The Russell 2000® Value Index measures the performance of those Russell 2000 Index companies (the 2,000 smallest of the 3,000 largest publicly traded U.S. companies, based on total market capitalization) with lower price-to-book ratios and lower forecasted growth values.
The Russell Midcap® Index measures the performance of the 800 smallest of the 1,000 largest publicly traded U.S. companies, based on total market capitalization.
The Russell Midcap® Growth Index measures the performance of those Russell Midcap Index companies (the 800 smallest of the 1,000 largest publicly traded U.S. companies, based on total market capitalization) with higher price-to-book ratios and higher forecasted growth values.
The Russell Midcap® Value Index measures the performance of those Russell Midcap Index companies (the 800 smallest of the 1,000 largest publicly traded U.S. companies, based on total market capitalization) with lower price-to-book ratios and lower forecasted growth values.
41
The S&P 500 Index is a market value-weighted index of the stocks of 500 publicly traded U.S. companies chosen for market size, liquidity, and industry group representation that are considered to be leading firms in dominant industries. Each stock’s weight in the index is proportionate to its market value. Created by Standard & Poor’s, it is considered to be a broad measure of U.S. stock market performance.
The S&P SmallCap 600 Index, a capitalization-weighted index consisting of 600 domestic stocks, measures the small company segment of the U.S. market.
42
43
44

| |
| |
| Contact Us | |
| americancentury.com | |
| Automated Information Line | 1-800-345-8765 |
| Investor Services Representative | 1-800-345-2021 or |
| | 816-531-5575 |
| Investors Using Advisors | 1-800-378-9878 |
| Business, Not-For-Profit, Employer-Sponsored | |
| Retirement Plans | 1-800-345-3533 |
| Banks and Trust Companies, Broker-Dealers, | |
| Financial Professionals, Insurance Companies | 1-800-345-6488 |
| Telecommunications Device for the Deaf | 1-800-634-4113 |
| American Century Quantitative Equity Funds, Inc. | |
| Investment Advisor: | |
| American Century Investment Management, Inc. | |
| Kansas City, Missouri | |
This report and the statements it contains are submitted for the general
information of our shareholders. The report is not authorized for distribution to
prospective investors unless preceded or accompanied by an effective prospectus.
American Century Investment Services, Inc., Distributor
©2010 American Century Proprietary Holdings, Inc. All rights reserved.
1008
CL-ANN-69056
|
| Annual Report |
| June 30, 2010 |

|
| American Century Investments® |
Strategic Inflation Opportunities Fund
| |
| President’s Letter | 2 |
| Market Perspective | 3 |
| Two-Month Total Returns | 3 |
| |
| Strategic Inflation Opportunities | |
| |
| Performance | 4 |
| Portfolio Commentary | 5 |
| Types of Investments in Portfolio | 7 |
| Top Ten Stock Holdings | 7 |
| Geographic Composition of Stock Holdings | 7 |
| |
| Shareholder Fee Example | 8 |
| |
| Financial Statements | |
| |
| Schedule of Investments | 10 |
| Statement of Assets and Liabilities | 16 |
| Statement of Operations | 17 |
| Statement of Changes in Net Assets | 18 |
| Notes to Financial Statements | 19 |
| Financial Highlights | 27 |
| Report of Independent Registered Public Accounting Firm | 32 |
| |
| Other Information | |
| |
| Management | 33 |
| Approval of Management Agreements | 37 |
| Additional Information | 39 |
| Index Definitions | 40 |
Any opinions expressed in this report reflect those of the author as of the date of the report, and do not necessarily represent the opinions of American Century Investments or any other person in the American Century Investments organization. Any such opinions are subject to change at any time based upon market or other conditions and American Century Investments disclaims any responsibility to update such opinions. These opinions may not be relied upon as investment advice and, because investment decisions made by American Century Investments funds are based on numerous factors, may not be relied upon as an indication of trading intent on behalf of any American Century Investments fund. Security examples are used for representational purposes only and are not intended as recommendations to purchase or sell securities. Performance information for comparative indices and securities is provided to American Century Investments by third party vendors. To the best of American Century Investments’ knowledge, such information is accurate at the time of printing.

Dear Investor:
To learn more about the capital markets, your investment, and the portfolio management strategies American Century Investments provides, we encourage you to review this shareholder report for the financial reporting period ended June 30, 2010.
On the following pages, you will find investment performance and portfolio information, presented with the expert perspective and commentary of our portfolio management team. This report remains one of our most important vehicles for conveying the information you need about your investment performance, and about the market factors and strategies that affect fund returns. For additional information on the markets, we encourage you to visit the “Insights & News” tab at our Web site, americancentury.com, for updates and further expert commentary.
The top of our Web site’s home page also provides a link to “Our Story,” which, first and foremost, outlines our commitment—since 1958—to helping clients reach their financial goals. We believe strongly that we will only be successful when our clients are successful. That’s who we are.
Another important, unique facet of our story and who we are is “Profits with a Purpose,” which describes our bond with the Stowers Institute for Medical Research (SIMR). SIMR is a world-class biomedical organization—founded by our company founder James E. Stowers, Jr. and his wife Virginia—that is dedicated to researching the causes, treatment, and prevention of gene-based diseases, including cancer. Through American Century Investments’ private ownership structure, more than 40% of our profits support SIMR.
Mr. Stowers’ example of achieving financial success and using that platform to help humanity motivates our entire American Century Investments team. His story inspires us to help each of our clients achieve success. Thank you for sharing your financial journey with us.
Sincerely,

Jonathan Thomas
President and Chief Executive Officer
American Century Investments
2

By Scott Wittman, Chief Investment Officer, Quantitative Equity and Asset Allocation
Economic Worries Triggered Risk Aversion
During the two months ended June 30, 2010, the first annual reporting period since the inception of Strategic Inflation Opportunities Fund, strong economic headwinds gathered strength, evaporating earlier optimism and blowing in fears of a double-dip recession. Sovereign debt problems in Europe, combined with ongoing labor-, housing-, and consumer-related setbacks and a plunging global stock market, sent nervous investors fleeing riskier assets in favor of “safe-haven” investments, including U.S. Treasury securities and gold.
Concerns that the global economic recovery was losing steam sent most commodity prices tumbling during the period. In particular, oil prices fell by more than 12% on slowing demand and uncertainty resulting from the massive oil spill in the Gulf of Mexico. Furthermore, safety-seeking investors pushed up the U.S. dollar’s value, particularly against the euro, which amplified the price declines in the commodities market. On the other hand, gold prices continued to soar, as investors sought to escape widespread market volatility and preserve their wealth with investments in the precious metal.
Weak Growth Tamed Inflation
In this environment of weak global economic fundamentals and falling commodity prices, inflation remained in hiding. For example, headline inflation, as measured by the month-to-month change in the Consumer Price Index (CPI), was -0.1% in June, marking the third-consecutive monthly decline in the index and stirring up concerns about deflation.
At the same time, expectations for future inflation fell significantly during the period, as indicated by the sharp drop in the 10-year TIPS (Treasury inflation-protected securities) breakeven rate. The breakeven rate, which measures the yield difference between 10-year TIPS and traditional Treasuries and indicates the market’s inflation expectations for the next 10 years, fell from 2.40% on April 30, 2010, to 1.84% on June 30, 2010.
Nevertheless, the extraordinary fiscal and monetary stimulus still working through the financial system eventually may lead to higher inflation and a weaker U.S. dollar than are currently reflected in the market. Ultimately, this scenario still argues for long-term inflation-protection investment strategies.
| | |
| Two-Month Total Returns | |
| As of June 30, 2010(1) | |
| Barclays Capital U.S. 1–3 Month Treasury Bill Index | 0.03% |
| Barclays Capital U.S. TIPS Index | 1.42% |
| Citigroup World Government Bond, ex U.S., Index(2) | -0.41% |
| S&P Goldman Sachs Commodities Index | -12.83% |
| London Gold PM Fix, in U.S. dollars | 5.49% |
| U.S. Dollar (Dollar Spot Index) | 5.07% |
| (1) | Total returns for periods less than one year are not annualized. | |
| (2) | Returns do not reflect the receipt of coupons on securities in the index. Had such been included, returns would have been higher. | |
3
| | | | |
| Strategic Inflation Opportunities | | |
| |
| Total Returns as of June 30, 2010 | | | |
| | | Ticker Symbol | Since Inception(1)(2) | Inception Date |
| Investor Class | ASIOX | -4.10% | 4/30/10 |
| Barclays Capital U.S. | | | |
| 1–3 Month Treasury Bill Index | — | 0.03% | — |
| Institutional Class | ASINX | -4.10% | 4/30/10 |
| A Class | ASIDX | | 4/30/10 |
| No sales charge* | | -4.20% | |
| With sales charge* | | -9.71% | |
| C Class | ASIZX | | 4/30/10 |
| No sales charge* | | -4.30% | |
| With sales charge* | | -5.26% | |
| R Class | ASIUX | -4.20% | 4/30/10 |
| *Sales charges include initial sales charges and contingent deferred sales charges (CDSCs), as applicable. A Class shares have a |
| 5.75% maximum initial sales charge and may be subject to a maximum CDSC of 1.00%. C Class shares redeemed within 12 months |
| of purchase are subject to a maximum CDSC of 1.00%. The SEC requires that mutual funds provide performance information net of |
| maximum sales charges in all cases where charges could be applied. | | |
| (1) | Total returns for periods less than one year are not annualized. | | |
| (2) | Class returns would have been lower if American Century Investments had not voluntarily waived a portion of its management fee. |
| | | | |
| Total Annual Fund Operating Expenses | | | |
| Investor Class | Institutional Class | A Class | C Class | R Class |
| 1.09% | 0.89% | 1.34% | 2.09% | 1.59% |
The total annual fund operating expenses shown is as stated in the fund’s prospectus current as of the date of this report. The prospectus may vary from the expense ratio shown elsewhere in this report because it is based on a different time period, includes acquired fund fees and expenses, and, if applicable, does not include fee waivers or expense reimbursements.
Data presented reflect past performance. Past performance is no guarantee of future results. Current performance may be higher or lower than the performance shown. Investment return and principal value will fluctuate, and redemption value may be more or less than original cost. To obtain performance data current to the most recent month end, please call 1-800-345-2021 or visit americancentury.com. As interest rates rise, bond values will decline. International investing involves special risks, such as political instability and currency fluctuations. Investing in emerging markets may accentuate these risks. There are certain risks involved in investing in forward foreign currency exchange contracts; changes in the value of foreign currencies against the U.S. dollar could result in losses to the fund. Commodity investing involves special risks, such as weather, disease, embargoes, tariffs, taxes and economic, po litical and regulatory developments.
Unless otherwise indicated, performance reflects Investor Class shares; performance for other share classes will vary due to differences in fee structure. For information about other share classes available, please consult the prospectus. Data assumes reinvestment of dividends and capital gains, and none of the charts reflect the deduction of taxes that a shareholder would pay on fund distributions or the redemption of fund shares. Returns for the index are provided for comparison. The fund’s total returns include operating expenses (such as transaction costs and management fees) that reduce returns, while the total returns of the index do not.
4
Strategic Inflation Opportunities
Portfolio Managers: Bob Gahagan, Bill Martin, Brian Howell, John Lovito, and Federico Garcia Zamora
Performance Summary
For the two months ended June 30, 2010, the first annual reporting period since the inception of Strategic Inflation Opportunities, the fund declined -4.10%.* The portfolio’s benchmark, the Barclays Capital U.S. 1–3 Month Treasury Bill Index, advanced 0.03% during the same period. Portfolio returns reflect operating expenses, while index returns do not.
Economic nervousness sparked a flight to safety during the period, benefitting U.S. Treasury securities and gold, while hindering “non-safe-haven” assets. Despite the absence of significant inflationary pressures, TIPS (Treasury inflation-protected securities), which represented a significant portion of the portfolio, participated in the overall Treasury rally. The portfolio’s underperformance relative to the benchmark was primarily due to falling stock and commodity prices and a strengthening U.S. dollar, which led to lagging results for the portfolio’s domestic and foreign stock, commodity-linked, and foreign currency holdings.
Falling Prices Tamed Inflation
Falling oil prices, which dropped from $86 a barrel to $76 during the two-month period on subdued economic growth expectations in the developed nations, helped keep downward pressure on inflation. Most other commodity prices also plunged, as indicated by the two-month return of -12.83% for the S&P Goldman Sachs Commodities Index, a measure of price movements in the global commodities markets. Headline inflation, as measured by the month-to-month change in the Consumer Price Index (CPI), declined in April (-0.1%), May (-0.2%), and June (-0.1%). On a 12-month basis as of June 30, 2010, headline inflation increased 1.1% and core inflation (excluding food and energy prices) gained just 0.9%.
Gold rallied during the period, as the precious metal assumed its role as the world’s “alternative currency.” Mounting sovereign debt concerns in Europe led to a weakening euro. At the same time, the U.S. dollar rallied, but primarily due to the euro’s troubles rather than any fundamental improvement in the greenback. Demand for gold remained robust, as investor concerns about the credit quality of sovereign debt and growing economic uncertainties prompted continued enthusiasm for “safe-haven” alternatives.
Low Breakeven Rate Highlighted TIPS Value
The weak economic climate also led to tumbling inflation expectations, as reflected by the 10-year breakeven rate. This difference between the yields of 10-year TIPS and 10-year nominal Treasuries shows the inflation rate required for TIPS to outperform nominal Treasuries in the next 10 years. This breakeven rate declined 0.56 of a percentage point to end the period at 1.84 percentage points. This rate suggests TIPS offer long-term value (it will merely require an inflation rate higher than 1.84% for TIPS to outperform
|
| *All fund returns referenced in this commentary are for Investor Class shares. Total returns for periods less than one year are not annualized. Class |
| returns would have been lower had management fees not been waived. |
5
Strategic Inflation Opportunities
traditional Treasuries), especially given the potential for higher inflation and a weaker U.S. dollar to emerge due to the extraordinary amounts of monetary and fiscal stimulus still working through the financial system.
Portfolio Positioning and Strategy
Approximately 47% of Strategic Inflation Opportunities was invested in inflation-indexed debt. The remainder of the portfolio was primarily invested in foreign currency instruments, commodity-linked investments, and domestic and foreign stock.
Within the portfolio’s TIPS component, the investment management team added conventional Treasury securities to gain duration (interest-rate sensitivity) exposure. In the commodities segment, the team overweighted individual stocks, including gold stocks, versus commodity-linked ETFs (exchange-traded funds). Within the portfolio’s equity allocation, the team also underweighted large oil companies.
Among foreign currencies, the investment team favored commodity-driven, economically sensitive currencies, such as the Canadian dollar, which was the portfolio’s largest foreign currency position as of June 30, 2010. Overall, the portfolio’s position in forward foreign currency exchange contracts detracted from performance, due to the relative strength of the U.S. dollar and concerns about European sovereign debt. Key detractors included the euro, Canadian dollar, and Mexican peso.
Outlook
As Strategic Inflation Opportunities commenced operations, a “perfect storm” for inflation-protection strategies was brewing. Fears of a potential “double-dip” recession and deflation generally dominated the economic landscape, creating challenges for the portfolio’s strategy. But, this environment also increased the long-term appeal of inflation “insurance” in terms of relative pricing. Ultimately, the portfolio’s investment team expects this value to translate to solid performance. The unprecedented fiscal and monetary stimulus still working through the system eventually may lead to significantly higher inflation and a weaker dollar than are currently priced into the market.
6
| |
| Strategic Inflation Opportunities | |
| |
| Types of Investments in Portfolio | |
| | % of net assets as of 6/30/10 |
| U.S. Treasury Securities | 47.3% |
| Domestic Common Stocks | 8.7% |
| Commodity ETFs | 8.2% |
| Foreign Common Stocks | 5.9% |
| Temporary Cash Investments — Segregated for Forward | |
| Foreign Currency Exchange Contracts and Futures Contracts | 29.4% |
| Other Assets and Liabilities | 0.5% |
| |
| Top Ten Stock Holdings | |
| | % of net assets as of 6/30/10 |
| Occidental Petroleum Corp. | 0.7% |
| Chevron Corp. | 0.7% |
| Exxon Mobil Corp. | 0.6% |
| Schlumberger Ltd. | 0.6% |
| ConocoPhillips | 0.6% |
| Suncor Energy, Inc. | 0.5% |
| Barrick Gold Corp. | 0.4% |
| Canadian Natural Resources Ltd. | 0.4% |
| Goldcorp, Inc. | 0.3% |
| Apache Corp. | 0.3% |
| |
| Geographic Composition of Stock Holdings | |
| | % of net assets as of 6/30/10 |
| United States | 8.7% |
| Canada | 3.8% |
| United Kingdom | 0.4% |
| Hong Kong | 0.3% |
| Other Countries | 1.4% |
7
|
| Shareholder Fee Example (Unaudited) |
Fund shareholders may incur two types of costs: (1) transaction costs, including sales charges (loads) on purchase payments and redemption/ exchange fees; and (2) ongoing costs, including management fees; distribution and service (12b-1) fees; and other fund expenses. This example is intended to help you understand your ongoing costs (in dollars) of investing in your fund and to compare these costs with the ongoing cost of investing in other mutual funds.
The example is based on an investment of $1,000 made at the beginning of the period and held for the entire period from January 1, 2010 to June 30, 2010 (except as noted).
Actual Expenses
The table provides information about actual account values and actual expenses for each class. You may use the information, together with the amount you invested, to estimate the expenses that you paid over the period. First, identify the share class you own. Then simply divide your account value by $1,000 (for example, an $8,600 account value divided by $1,000 = 8.6), then multiply the result by the number under the heading “Expenses Paid During Period” to estimate the expenses you paid on your account during this period.
If you hold Investor Class shares of any American Century Investments fund, or Institutional Class shares of the American Century Diversified Bond Fund, in an American Century Investments account (i.e., not a financial intermediary or retirement plan account), American Century Investments may charge you a $12.50 semiannual account maintenance fee if the value of those shares is less than $10,000. We will redeem shares automatically in one of your accounts to pay the $12.50 fee. In determining your total eligible investment amount, we will include your investments in all personal accounts (including American Century Investments Brokerage accounts) registered under your Social Security number. Personal accounts include individual accounts, joint accounts, UGMA/UTMA accounts, personal trusts, Coverdell Education Savings Accounts and IRAs (including traditional, Roth, Rollover, SEP-, SARSEP- and SIMPLE-IRAs), and certain other retirement accounts. If you have only business, business retirement, employer-sponsored or American Century Investments Brokerage accounts, you are currently not subject to this fee. We will not charge the fee as long as you choose to manage your accounts exclusively online. If you are subject to the Account Maintenance Fee, your account value could be reduced by the fee amount.
Hypothetical Example for Comparison Purposes
The table also provides information about hypothetical account values and hypothetical expenses based on the actual expense ratio of each class of your fund and an assumed rate of return of 5% per year before expenses, which is not the actual return of a fund’s share class. The hypothetical account values and expenses may not be used to estimate the actual ending account balance or expenses you paid for the period. You may use this information to compare the ongoing costs of investing in your fund and other funds. To do so, compare this 5% hypothetical example with the 5% hypothetical examples that appear in the shareholder reports of the other funds.
8
Please note that the expenses shown in the table are meant to highlight your ongoing costs only and do not reflect any transactional costs, such as sales charges (loads) or redemption/exchange fees. Therefore, the table is useful in comparing ongoing costs only, and will not help you determine the relative total costs of owning different funds. In addition, if these transactional costs were included, your costs would have been higher.
| | | | | |
| | | Beginning | Ending | Expenses Paid | |
| | | Account Value | Account Value | During Period(1) | Annualized |
| | | 1/1/10 | 6/30/10 | 1/1/10 – 6/30/10 | Expense Ratio(1) |
| Actual | | | | |
| Investor Class (after waiver)(2) | $1,000 | $959.00(3) | $1.56(4) | 0.95% |
| Investor Class (before waiver) | $1,000 | $959.00(3)(5) | $1.78(4) | 1.09% |
| Institutional Class (after waiver)(2) | $1,000 | $959.00(3) | $1.23(4) | 0.75% |
| Institutional Class (before waiver) | $1,000 | $959.00(3)(5) | $1.46(4) | 0.89% |
| A Class (after waiver)(2) | $1,000 | $958.00(3) | $1.96(4) | 1.20% |
| A Class (before waiver) | $1,000 | $958.00(3)(5) | $2.19(4) | 1.34% |
| C Class (after waiver)(2) | $1,000 | $957.00(3) | $3.19(4) | 1.95% |
| C Class (before waiver) | $1,000 | $957.00(3)(5) | $3.42(4) | 2.09% |
| R Class (after waiver)(2) | $1,000 | $958.00(3) | $2.37(4) | 1.45% |
| R Class (before waiver) | $1,000 | $958.00(3)(5) | $2.60(4) | 1.59% |
| Hypothetical | | | | |
| Investor Class (after waiver)(2) | $1,000 | $1,020.08(6) | $4.76(6) | 0.95% |
| Investor Class (before waiver) | $1,000 | $1,019.39(6) | $5.46(6) | 1.09% |
| Institutional Class (after waiver)(2) | $1,000 | $1,021.08(6) | $3.76(6) | 0.75% |
| Institutional Class (before waiver) | $1,000 | $1,020.38(6) | $4.46(6) | 0.89% |
| A Class (after waiver)(2) | $1,000 | $1,018.84(6) | $6.01(6) | 1.20% |
| A Class (before waiver) | $1,000 | $1,018.15(6) | $6.71(6) | 1.34% |
| C Class (after waiver)(2) | $1,000 | $1,015.12(6) | $9.74(6) | 1.95% |
| C Class (before waiver) | $1,000 | $1,014.43(6) | $10.44(6) | 2.09% |
| R Class (after waiver)(2) | $1,000 | $1,017.60(6) | $7.25(6) | 1.45% |
| R Class (before waiver) | $1,000 | $1,016.91(6) | $7.95(6) | 1.59% |
| (1) | Expenses are equal to the class’s annualized expense ratio listed in the table above, multiplied by the average account value over the period, |
| | multiplied by 181, the number of days in the most recent fiscal half-year, divided by 365, to reflect the one-half year period. |
| (2) | During the period ended June 30, 2010, the class received a partial waiver of its management fee. | |
| (3) | Ending account value based on actual return from April 30, 2010 (fund inception) through June 30, 2010. | |
| (4) | Expenses are equal to the class’s annualized expense ratio listed in the table above, multiplied by the average account value over the period, |
| | multiplied by 61, the number of days in the period from April 30, 2010 (fund inception) through June 30, 2010, divided by 365, to reflect the |
| | period. Had the class been available for the full period, the expenses paid during the period would have been higher. | |
| (5) | Ending account value assumes the return earned after waiver. The return would have been lower had fees not been waived and would have |
| | resulted in a lower ending account value. | | | | |
| (6) | Ending account value and expenses paid during period assumes the class had been available throughout the entire period and are calculated |
| | using the class’s annualized expense ratio listed in the table above. | | | |
9
| | | | | | |
| Strategic Inflation Opportunities | | |
| |
| JUNE 30, 2010 | | | | | | |
| | Principal | | | | Principal | |
| | Amount/ | | | | Amount/ | |
| | Shares | Value | | | Shares | Value |
| U.S. Treasury Securities — 47.3% | | | ENERGY EQUIPMENT & SERVICES — 1.9% | |
| U.S. Treasury Inflation | | | | Baker Hughes, Inc. | 398 | $ 16,545 |
| Indexed Notes, | | | | Diamond Offshore | | |
| 2.375%, 4/15/11(1) | $ 477,787 | $ 485,999 | | Drilling, Inc. | 224 | 13,931 |
| U.S. Treasury Inflation | | | | Ensco plc ADR | 483 | 18,972 |
| Indexed Notes, | | | | Halliburton Co. | 610 | 14,975 |
| 3.375%, 1/15/12(1) | 214,860 | 226,627 | | Nabors Industries Ltd.(2) | 500 | 8,810 |
| U.S. Treasury Inflation | | | | Schlumberger Ltd. | 835 | 46,209 |
| Indexed Notes, | | | | | | |
| 2.00%, 4/15/12(1) | 424,368 | 439,984 | | Smith International, Inc. | 530 | 19,954 |
| U.S. Treasury Inflation | | | | Tidewater, Inc. | 240 | 9,293 |
| Indexed Notes, | | | | Weatherford | | |
| 3.00%, 7/15/12(1) | 309,190 | 329,215 | | International Ltd.(2) | 440 | 5,782 |
| U.S. Treasury Inflation | | | | | | 154,471 |
| Indexed Notes, | | | | METALS & MINING — 3.5% | | |
| 0.625%, 4/15/13(1) | 154,715 | 158,038 | | | | |
| | | | | Agnico-Eagle Mines Ltd. | 146 | 8,857 |
| U.S. Treasury Inflation | | | | Andean Resources Ltd.(2) | 2,066 | 5,977 |
| Indexed Notes, | | | | | | |
| 1.875%, 7/15/13(1) | 195,855 | 207,362 | | Anglo Platinum Ltd. ADR(2) | 67 | 6,328 |
| U.S. Treasury Inflation | | | | Barrick Gold Corp. | 744 | 33,785 |
| Indexed Notes, | | | | BHP Billiton Ltd. ADR | 141 | 8,741 |
| 2.00%, 1/15/14(1) | 200,578 | 213,866 | | | | |
| | | | | Compania de Minas | | |
| U.S. Treasury Inflation | | | | Buenaventura SA ADR | 284 | 10,917 |
| Indexed Notes, | | | | Eldorado Gold Corp. | 379 | 6,793 |
| 1.25%, 4/15/14(1) | 236,930 | 247,684 | | | | |
| U.S. Treasury Inflation | | | | Franco-Nevada Corp. | 426 | 12,966 |
| Indexed Notes, | | | | Freeport-McMoRan Copper | | |
| 2.00%, 7/15/14(1) | 346,971 | 372,669 | | & Gold, Inc. | 352 | 20,814 |
| U.S. Treasury Inflation | | | | Goldcorp, Inc. | 635 | 27,845 |
| Indexed Notes, | | | | IAMGOLD Corp. | 520 | 9,194 |
| 1.625%, 1/15/15(1) | 439,570 | 464,605 | | Ivanhoe Mines Ltd.(2) | 677 | 8,770 |
| U.S. Treasury Inflation | | | | Newmont Mining Corp. | 404 | 24,943 |
| Indexed Notes, | | | | | | |
| 0.50%, 4/15/15(1) | 241,435 | 244,962 | | Pan American Silver Corp. | 365 | 9,227 |
| U.S. Treasury Inflation | | | | Randgold Resources Ltd. | | |
| Indexed Notes, | | | | ADR | 77 | 7,296 |
| 2.00%, 1/15/16(1) | 164,762 | 177,942 | | Red Back Mining, Inc.(2) | 248 | 6,269 |
| U.S. Treasury Inflation | | | | Rio Tinto plc ADR | 103 | 4,491 |
| Indexed Notes, | | | | Royal Gold, Inc. | 315 | 15,120 |
| 2.375%, 1/15/17(1) | 216,210 | 238,912 | | | | |
| | | | | Silver Standard | | |
| TOTAL U.S. TREASURY SECURITIES | | | Resources, Inc.(2) | 526 | 9,389 |
| (Cost $3,809,462) | | 3,807,865 | | Silver Wheaton Corp.(2) | 841 | 16,904 |
| Common Stocks — 14.6% | | | Silvercorp Metals, Inc. | 1,170 | 7,745 |
| CHEMICALS — 0.3% | | | | Stillwater Mining Co.(2) | 262 | 3,044 |
| Agrium, Inc. | 143 | 6,999 | | Teck Resources Ltd., Class B | 411 | 12,157 |
| Monsanto Co. | 200 | 9,244 | | Vale SA ADR | 284 | 6,915 |
| Mosaic Co. (The) | 83 | 3,235 | | | | 284,487 |
| Potash Corp. of | | | | | | |
| Saskatchewan, Inc. | 62 | 5,347 | | | | |
| | | 24,825 | | | | |
10
| | | | | | |
| Strategic Inflation Opportunities | | |
| |
| | Principal | | | | Principal | |
| | Amount/ | | | | Amount/ | |
| | Shares | Value | | | Shares | Value |
| OIL, GAS & CONSUMABLE FUELS — 8.4% | | | PAPER & FOREST PRODUCTS — 0.4% | |
| Alpha Natural | | | | Domtar Corp. | 220 | $ 10,813 |
| Resources, Inc.(2) | 275 | $ 9,314 | | International Paper Co. | 325 | 7,354 |
| Anadarko Petroleum Corp. | 130 | 4,692 | | MeadWestvaco Corp. | 214 | 4,751 |
| Apache Corp. | 321 | 27,025 | | Weyerhaeuser Co. | 180 | 6,336 |
| Cabot Oil & Gas Corp. | 385 | 12,058 | | | | 29,254 |
| Cameco Corp. | 250 | 5,320 | | TRADING COMPANIES & DISTRIBUTORS — 0.1% |
| Canadian Natural | | | | Noble Group Ltd. | 6,291 | 7,596 |
| Resources Ltd. | 933 | 31,004 | | TOTAL COMMON STOCKS | | |
| Chesapeake Energy Corp. | 721 | 15,105 | | (Cost $1,299,067) | | 1,179,067 |
| Chevron Corp. | 777 | 52,727 | | | | |
| CNOOC Ltd. ADR | 94 | 15,996 | | Commodity ETFs — 8.2% | |
| ConocoPhillips | 913 | 44,819 | | iShares S&P GSCI | | |
| | | | | Commodity-Indexed Trust(2) | 19,694 | 547,296 |
| CONSOL Energy, Inc. | 354 | 11,951 | | PowerShares DB Commodity | | |
| Devon Energy Corp. | 169 | 10,296 | | Index Tracking Fund(2) | 5,373 | 115,896 |
| EnCana Corp. | 591 | 17,931 | | TOTAL COMMODITY ETFs | | |
| EOG Resources, Inc. | 272 | 26,757 | | (Cost $719,511) | | 663,192 |
| EXCO Resources, Inc. | 816 | 11,922 | | Temporary Cash Investments — | |
| Exxon Mobil Corp. | 839 | 47,882 | | Segregated for Forward Foreign | |
| Forest Oil Corp.(2) | 296 | 8,099 | | | | |
| | | | | Currency Exchange Contracts | |
| Hess Corp. | 250 | 12,585 | | and Futures Contracts — 29.4% | |
| Newfield Exploration Co.(2) | 270 | 13,192 | | | | |
| | | | | JPMorgan U.S. Treasury | | |
| Noble Energy, Inc. | 164 | 9,894 | | Plus Money Market Fund | | |
| Occidental Petroleum Corp. | 731 | 56,397 | | Agency Shares(1) | 645,752 | 645,752 |
| Peabody Energy Corp. | 210 | 8,217 | | U.S. Treasury Bills, | | |
| Petroleo Brasileiro | | | | 0.15%, 7/1/10(1)(3) | $ 500,000 | 500,000 |
| SA-Petrobras ADR | 198 | 6,795 | | U.S. Treasury Bills, | | |
| Pioneer Natural | | | | 0.16%, 7/29/10(1)(3) | 1,225,000 | 1,224,860 |
| Resources Co. | 183 | 10,879 | | TOTAL TEMPORARY CASH | | |
| Range Resources Corp. | 420 | 16,863 | | INVESTMENTS — SEGREGATED | |
| Repsol YPF SA ADR | 730 | 14,673 | | FOR FORWARD FOREIGN CURRENCY | |
| | | | | EXCHANGE CONTRACTS AND | | |
| Royal Dutch Shell plc, | | | | FUTURES CONTRACTS | | |
| Class A ADR | 460 | 23,101 | | (Cost $2,370,603) | | 2,370,612 |
| Southern Union Co. | 440 | 9,618 | | TOTAL INVESTMENT | | |
| Southwestern Energy Co.(2) | 345 | 13,331 | | SECURITIES — 99.5% | | |
| Spectra Energy Corp. | 776 | 15,574 | | (Cost $8,198,643) | | 8,020,736 |
| Suncor Energy, Inc. | 1,337 | 39,361 | | OTHER ASSETS | | |
| Sunoco, Inc. | 358 | 12,448 | | AND LIABILITIES — 0.5% | | 36,463 |
| Talisman Energy, Inc. | 1,369 | 20,782 | | TOTAL NET ASSETS — 100.0% | | $8,057,199 |
| Total SA ADR | 310 | 13,838 | | | | |
| Ultra Petroleum Corp.(2) | 207 | 9,160 | | | | |
| Williams Cos., Inc. (The) | 1,030 | 18,828 | | | | |
| | | 678,434 | | | | |
11
| | | | | |
| Strategic Inflation Opportunities | | |
| |
| Forward Foreign Currency Exchange Contracts | | |
| Contracts to Sell | Counterparty | Settlement Date | Value | Unrealized Gain (Loss) |
| 1,752,094 | JPY for AUD | Westpac Banking Corp. | 7/30/10 | $19,826 | $(544) |
| 23,000 | AUD for JPY | Westpac Banking Corp. | 7/30/10 | 19,296 | 27 |
| 1,500 | CHF for USD | HSBC Holdings plc | 7/30/10 | 1,392 | (93) |
| 4,200 | CHF for USD | HSBC Holdings plc | 7/30/10 | 3,898 | (267) |
| 9,100 | CHF for USD | Barclays Bank plc | 7/30/10 | 8,446 | 20 |
| 929,000 | JPY for USD | HSBC Holdings plc | 7/30/10 | 10,512 | (432) |
| 29,700 | NOK for USD | Westpac Banking Corp. | 7/30/10 | 4,557 | 334 |
| | | | | $67,927 | $(955) |
| (Value on Settlement Date $66,972) | | | | |
| |
| Contracts to Buy | Counterparty | Settlement Date | Value | Unrealized Gain (Loss) |
| 23,000 | AUD for JPY | Westpac Banking Corp. | 7/30/10 | $ 19,296 | $ 14 |
| 1,731,173 | JPY for AUD | Westpac Banking Corp. | 7/30/10 | 19,589 | 266 |
| 1,200 | AUD for USD | HSBC Holdings plc | 7/30/10 | 1,007 | 2 |
| 2,000 | AUD for USD | Westpac Banking Corp. | 7/30/10 | 1,678 | (116) |
| 2,600 | AUD for USD | Westpac Banking Corp. | 7/30/10 | 2,181 | (138) |
| 16,700 | AUD for USD | UBS AG | 7/30/10 | 14,010 | (1,291) |
| 17,600 | AUD for USD | HSBC Holdings plc | 7/30/10 | 14,766 | 207 |
| 7,400 | BRL for USD | Barclays Bank plc | 7/30/10 | 4,076 | (63) |
| 14,400 | BRL for USD | Barclays Bank plc | 7/30/10 | 7,931 | 214 |
| 49,600 | BRL for USD | Barclays Bank plc | 7/30/10 | 27,317 | 679 |
| 2,100 | CAD for USD | HSBC Holdings plc | 7/30/10 | 1,972 | (39) |
| 4,500 | CAD for USD | HSBC Holdings plc | 7/30/10 | 4,226 | (136) |
| 5,200 | CAD for USD | HSBC Holdings plc | 7/30/10 | 4,884 | (40) |
| 7,900 | CAD for USD | HSBC Holdings plc | 7/30/10 | 7,420 | (162) |
| 13,500 | CAD for USD | Westpac Banking Corp. | 7/30/10 | 12,679 | (436) |
| 17,700 | CAD for USD | HSBC Holdings plc | 7/30/10 | 16,624 | (530) |
| 22,900 | CAD for USD | Barclays Bank plc | 7/30/10 | 21,508 | (470) |
| 23,600 | CAD for USD | Westpac Banking Corp. | 7/30/10 | 22,165 | (890) |
| 24,000 | CAD for USD | HSBC Holdings plc | 7/30/10 | 22,541 | (86) |
| 30,800 | CAD for USD | Westpac Banking Corp. | 7/30/10 | 28,927 | (981) |
| 39,600 | CAD for USD | HSBC Holdings plc | 7/30/10 | 37,192 | 186 |
| 40,400 | CAD for USD | HSBC Holdings plc | 7/30/10 | 37,944 | (1,646) |
| 137,200 | CAD for USD | Westpac Banking Corp. | 7/30/10 | 128,858 | (6,188) |
| 2,200 | CHF for USD | Westpac Banking Corp. | 7/30/10 | 2,042 | 62 |
| 870,999 | CLP for USD | Barclays Bank plc | 7/30/10 | 1,596 | (43) |
| 1,776,001 | CLP for USD | Barclays Bank plc | 7/30/10 | 3,254 | (82) |
| 5,710,002 | CLP for USD | Barclays Bank plc | 7/30/10 | 10,463 | (160) |
| 236,000 | CNY for USD | HSBC Holdings plc | 7/30/10 | 34,762 | (41) |
| 615,000 | CNY for USD | HSBC Holdings plc | 7/30/10 | 90,588 | 534 |
| 1,443,000 | CNY for USD | HSBC Holdings plc | 7/30/10 | 212,551 | 842 |
| 2,227,993 | COP for USD | Barclays Bank plc | 7/30/10 | 1,173 | 2 |
| 6,244,001 | COP for USD | Barclays Bank plc | 7/30/10 | 3,287 | 125 |
| 13,168,995 | COP for USD | Barclays Bank plc | 7/30/10 | 6,932 | 271 |
| 1,600 | EUR for USD | HSBC Holdings plc | 7/30/10 | 1,957 | 2 |
| 3,100 | EUR for USD | HSBC Holdings plc | 7/30/10 | 3,791 | 26 |
12
| | | | | |
| Strategic Inflation Opportunities | | |
| |
| Contracts to Buy | Counterparty | Settlement Date | Value | Unrealized Gain (Loss) |
| 3,300 | EUR for USD | HSBC Holdings plc | 7/30/10 | $ 4,036 | $ (52) |
| 3,400 | EUR for USD | HSBC Holdings plc | 7/30/10 | 4,158 | (19) |
| 4,000 | EUR for USD | HSBC Holdings plc | 7/30/10 | 4,892 | 26 |
| 8,000 | EUR for USD | Westpac Banking Corp. | 7/30/10 | 9,784 | (115) |
| 8,000 | EUR for USD | HSBC Holdings plc | 7/30/10 | 9,784 | (48) |
| 8,300 | EUR for USD | HSBC Holdings plc | 7/30/10 | 10,150 | (359) |
| 8,800 | EUR for USD | Westpac Banking Corp. | 7/30/10 | 10,762 | (175) |
| 15,200 | EUR for USD | Barclays Bank plc | 7/30/10 | 18,589 | (739) |
| 16,800 | EUR for USD | Westpac Banking Corp. | 7/30/10 | 20,545 | (161) |
| 20,900 | EUR for USD | HSBC Holdings plc | 7/30/10 | 25,560 | 62 |
| 22,000 | EUR for USD | Westpac Banking Corp. | 7/30/10 | 26,905 | (1,404) |
| 22,700 | EUR for USD | HSBC Holdings plc | 7/30/10 | 27,761 | (1,182) |
| 23,300 | EUR for USD | HSBC Holdings plc | 7/30/10 | 28,495 | (265) |
| 88,500 | EUR for USD | UBS AG | 7/30/10 | 108,230 | (9,617) |
| 600 | GBP for USD | HSBC Holdings plc | 7/30/10 | 896 | 40 |
| 1,100 | GBP for USD | HSBC Holdings plc | 7/30/10 | 1,644 | 26 |
| 1,200 | GBP for USD | HSBC Holdings plc | 7/30/10 | 1,793 | 45 |
| 1,300 | GBP for USD | HSBC Holdings plc | 7/30/10 | 1,942 | 59 |
| 2,200 | GBP for USD | HSBC Holdings plc | 7/30/10 | 3,287 | 72 |
| 2,200 | GBP for USD | Westpac Banking Corp. | 7/30/10 | 3,287 | (16) |
| 2,600 | GBP for USD | HSBC Holdings plc | 7/30/10 | 3,885 | 32 |
| 3,100 | GBP for USD | HSBC Holdings plc | 7/30/10 | 4,632 | 127 |
| 3,100 | GBP for USD | Westpac Banking Corp. | 7/30/10 | 4,632 | 146 |
| 5,300 | GBP for USD | Westpac Banking Corp. | 7/30/10 | 7,919 | 97 |
| 5,400 | GBP for USD | Barclays Bank plc | 7/30/10 | 8,068 | 94 |
| 6,800 | GBP for USD | HSBC Holdings plc | 7/30/10 | 10,160 | 75 |
| 7,400 | GBP for USD | HSBC Holdings plc | 7/30/10 | 11,056 | 406 |
| 7,600 | GBP for USD | Westpac Banking Corp. | 7/30/10 | 11,355 | (129) |
| 28,700 | GBP for USD | Barclays Bank plc | 7/30/10 | 42,881 | (1,019) |
| 198,100 | HKD for USD | Westpac Banking Corp. | 7/30/10 | 25,444 | (2) |
| 15,165,020 | IDR for USD | UBS AG | 7/30/10 | 1,663 | 1 |
| 31,846,982 | IDR for USD | UBS AG | 7/30/10 | 3,493 | 73 |
| 121,600,982 | IDR for USD | UBS AG | 7/30/10 | 13,335 | 440 |
| 8,000 | ILS for USD | UBS AG | 7/30/10 | 2,058 | (36) |
| 15,100 | ILS for USD | UBS AG | 7/30/10 | 3,884 | (30) |
| 61,200 | ILS for USD | UBS AG | 7/30/10 | 15,741 | (94) |
| 124,000 | INR for USD | UBS AG | 7/30/10 | 2,648 | (32) |
| 194,000 | INR for USD | UBS AG | 7/30/10 | 4,143 | 38 |
| 1,044,000 | INR for USD | UBS AG | 7/30/10 | 22,297 | 313 |
| 65,000 | JPY for USD | HSBC Holdings plc | 7/30/10 | 736 | 34 |
| 166,000 | JPY for USD | HSBC Holdings plc | 7/30/10 | 1,878 | 64 |
| 214,000 | JPY for USD | HSBC Holdings plc | 7/30/10 | 2,422 | 77 |
| 223,000 | JPY for USD | Westpac Banking Corp. | 7/30/10 | 2,523 | 131 |
| 423,000 | JPY for USD | Westpac Banking Corp. | 7/30/10 | 4,786 | 226 |
| 450,000 | JPY for USD | Westpac Banking Corp. | 7/30/10 | 5,092 | 56 |
| 459,000 | JPY for USD | Barclays Bank plc | 7/30/10 | 5,194 | 181 |
| 634,000 | JPY for USD | Westpac Banking Corp. | 7/30/10 | 7,174 | 204 |
13
| | | | | |
| Strategic Inflation Opportunities | | |
| |
| Contracts to Buy | Counterparty | Settlement Date | Value | Unrealized Gain (Loss) |
| 765,000 | JPY for USD | HSBC Holdings plc | 7/30/10 | $ 8,656 | $ 364 |
| 1,087,000 | JPY for USD | Westpac Banking Corp. | 7/30/10 | 12,300 | 737 |
| 1,280,000 | JPY for USD | HSBC Holdings plc | 7/30/10 | 14,484 | 270 |
| 1,373,000 | JPY for USD | HSBC Holdings plc | 7/30/10 | 15,536 | 793 |
| 4,503,000 | JPY for USD | Barclays Bank plc | 7/30/10 | 50,953 | 2,974 |
| 8,292,994 | KRW for USD | HSBC Holdings plc | 7/30/10 | 6,743 | (247) |
| 14,355,001 | KRW for USD | HSBC Holdings plc | 7/30/10 | 11,671 | (1,072) |
| 56,640,002 | KRW for USD | HSBC Holdings plc | 7/30/10 | 46,051 | 25 |
| 240,000 | MXN for USD | Barclays Bank plc | 7/30/10 | 18,504 | (560) |
| 332,000 | MXN for USD | Barclays Bank plc | 7/30/10 | 25,597 | 138 |
| 1,748,000 | MXN for USD | Barclays Bank plc | 7/30/10 | 134,769 | 651 |
| 10,200 | MYR for USD | Westpac Banking Corp. | 7/30/10 | 3,150 | 12 |
| 11,700 | MYR for USD | Westpac Banking Corp. | 7/30/10 | 3,613 | 66 |
| 87,000 | MYR for USD | Westpac Banking Corp. | 7/30/10 | 26,865 | 700 |
| 28,100 | NOK for USD | HSBC Holdings plc | 7/30/10 | 4,312 | (19) |
| 56,000 | NOK for USD | HSBC Holdings plc | 7/30/10 | 8,592 | (862) |
| 2,400 | NZD for USD | HSBC Holdings plc | 7/30/10 | 1,643 | 9 |
| 3,400 | NZD for USD | Westpac Banking Corp. | 7/30/10 | 2,328 | (115) |
| 5,100 | NZD for USD | Westpac Banking Corp. | 7/30/10 | 3,491 | (140) |
| 22,200 | NZD for USD | Westpac Banking Corp. | 7/30/10 | 15,198 | (844) |
| 22,900 | NZD for USD | HSBC Holdings plc | 7/30/10 | 15,677 | 228 |
| 91,000 | PHP for USD | Westpac Banking Corp. | 7/30/10 | 1,953 | (30) |
| 424,000 | PHP for USD | Westpac Banking Corp. | 7/30/10 | 9,101 | 47 |
| 79,000 | RUB for USD | UBS AG | 7/30/10 | 2,527 | (18) |
| 257,000 | RUB for USD | UBS AG | 7/30/10 | 8,221 | 21 |
| 502,000 | RUB for USD | UBS AG | 7/30/10 | 16,057 | 80 |
| 800 | SEK for USD | HSBC Holdings plc | 7/30/10 | 103 | 1 |
| 9,200 | SEK for USD | Westpac Banking Corp. | 7/30/10 | 1,180 | (47) |
| 38,000 | SEK for USD | HSBC Holdings plc | 7/30/10 | 4,873 | (375) |
| 39,800 | SEK for USD | HSBC Holdings plc | 7/30/10 | 5,104 | 27 |
| 9,800 | SGD for USD | HSBC Holdings plc | 7/30/10 | 7,004 | (82) |
| 40,500 | SGD for USD | HSBC Holdings plc | 7/30/10 | 28,945 | 183 |
| 78,000 | THB for USD | Westpac Banking Corp. | 7/30/10 | 2,408 | 2 |
| 93,000 | THB for USD | Westpac Banking Corp. | 7/30/10 | 2,871 | 22 |
| 664,000 | THB for USD | Westpac Banking Corp. | 7/30/10 | 20,496 | 102 |
| 162,000 | TWD for USD | HSBC Holdings plc | 7/30/10 | 5,047 | (44) |
| 228,000 | TWD for USD | HSBC Holdings plc | 7/30/10 | 7,103 | 5 |
| 1,089,000 | TWD for USD | HSBC Holdings plc | 7/30/10 | 33,924 | 73 |
| | | | | $1,969,836 | $(19,380) |
| (Value on Settlement Date $1,989,216) | | | | |
14
| | | | |
| Strategic Inflation Opportunities | |
| |
| Futures Contracts | | | |
| | | | Underlying Face | |
| | Contracts Purchased | Expiration Date | Amount at Value | Unrealized Gain (Loss) |
| 1 | U.S. Long Bond | September 2010 | $127,500 | $3,747 |
| |
| | | | Underlying Face | |
| | Contracts Sold | Expiration Date | Amount at Value | Unrealized Gain (Loss) |
| 3 | U.S. Treasury 2-Year Notes | September 2010 | $656,484 | $(2,866) |
| |
| Notes to Schedule of Investments |
| ADR = American Depositary Receipt |
| AUD = Australian Dollar |
| BRL = Brazilian Real |
| CAD = Canadian Dollar |
| CHF = Swiss Franc |
| CLP = Chilean Peso |
| CNY = Chinese Yuan |
| COP = Colombian Peso |
| DB = Deutsche Bank |
| ETF = Exchange-Traded Fund |
| EUR = Euro |
| GBP = British Pound |
| GSCI = Goldman Sachs Commodities Index |
| HKD = Hong Kong Dollar |
| IDR = Indonesian Rupiah |
| ILS = Israeli Shekel |
| INR = Indian Rupee |
| JPY = Japanese Yen |
| KRW = Korea Won |
| MXN = Mexican Peso |
| MYR = Malaysian Ringgit |
| NOK = Norwegian Krone |
| NZD = New Zealand Dollar |
| PHP = Philippine Peso |
| RUB = Russian Rouble |
| SEK = Swedish Krona |
| SGD = Singapore Dollar |
| THB = Thai Baht |
| TWD = Taiwanese Dollar |
| USD = United States Dollar |
| (1) | Security, or a portion thereof, has been segregated for forward foreign currency exchange contracts and futures contracts. At the period end, the |
| | aggregate value of securities pledged was $2,822,000. |
| (2) | Non-income producing. |
| (3) | The rate indicated is the yield to maturity at purchase. |
Industry classifications are unaudited.
See Notes to Financial Statements.
15
|
| Statement of Assets and Liabilities |
| |
| JUNE 30, 2010 | |
| Assets | |
| Investment securities, at value (cost of $8,198,643) | $8,020,736 |
| Receivable for capital shares sold | 154,755 |
| Receivable for forward foreign currency exchange contracts | 14,488 |
| Receivable for variation margin on futures contracts | 516 |
| Dividends and interest receivable | 27,645 |
| | 8,218,140 |
| | |
| Liabilities | |
| Payable for investments purchased | 86,534 |
| Payable for capital shares redeemed | 33,000 |
| Payable for forward foreign currency exchange contracts | 34,823 |
| Accrued management fees | 5,638 |
| Service fees (and distribution fees — A Class and R Class) payable | 729 |
| Distribution fees payable | 217 |
| | 160,941 |
| | |
| Net Assets | $8,057,199 |
| | |
| Net Assets Consist of: | |
| Capital (par value and paid-in surplus) | $8,261,201 |
| Accumulated net investment loss | (5,142) |
| Accumulated net realized loss on investment and foreign currency transactions | (1,498) |
| Net unrealized depreciation on investments and translation of assets and liabilities in foreign currencies | (197,362) |
| | $8,057,199 |
| | | |
| | Net assets | Shares outstanding | Net asset value per share |
| Investor Class, $0.01 Par Value | $4,043,640 | 421,637 | $9.59 |
| Institutional Class, $0.01 Par Value | $143,843 | 15,000 | $9.59 |
| A Class, $0.01 Par Value | $3,369,968 | 351,700 | $9.58* |
| C Class, $0.01 Par Value | $356,067 | 37,204 | $9.57 |
| R Class, $0.01 Par Value | $143,681 | 15,000 | $9.58 |
| *Maximum offering price $10.16 (net asset value divided by 0.9425). | | |
| |
| |
| See Notes to Financial Statements. | | | |
16
| | |
| FOR THE PERIOD ENDED JUNE 30, 2010(1) | |
| Investment Income (Loss) | |
| Income: | |
| Interest | $ 14,816 |
| Dividends (net of foreign taxes withheld of $94) | 3,012 |
| | 17,828 |
| | |
| Expenses: | |
| Management fees | 10,908 |
| Distribution fees — C Class | 408 |
| Service fees — C Class | 136 |
| Distribution and service fees: | |
| A Class | 1,029 |
| R Class | 117 |
| Directors’ fees and expenses | 19 |
| | 12,617 |
| Fees waived | (1,410) |
| | 11,207 |
| | |
| Net investment income (loss) | 6,621 |
| | |
| Realized and Unrealized Gain (Loss) | |
| Net realized gain (loss) on: | |
| Foreign currency transactions | (14,951) |
| | |
| Change in net unrealized appreciation (depreciation) on: | |
| Investments | (177,907) |
| Translation of assets and liabilities in foreign currencies | (20,336) |
| Futures contracts | 881 |
| | (197,362) |
| | | |
| Net realized and unrealized gain (loss) | (212,313) |
| | |
| Net Increase (Decrease) in Net Assets Resulting from Operations | $(205,692) |
| (1) April 30, 2010 (fund inception) through June 30, 2010. | |
| |
| |
| See Notes to Financial Statements. | |
17
|
| Statement of Changes in Net Assets |
| |
| PERIOD ENDED JUNE 30, 2010(1) | |
| Increase (Decrease) in Net Assets | |
| Operations | |
| Net investment income (loss) | $ 6,621 |
| Net realized gain (loss) | (14,951) |
| Change in net unrealized appreciation (depreciation) | (197,362) |
| Net increase (decrease) in net assets resulting from operations | (205,692) |
| | |
| Capital Share Transactions | |
| Net increase (decrease) in net assets from capital share transactions | 8,262,891 |
| | |
| Net increase (decrease) in net assets | 8,057,199 |
| | |
| Net Assets | |
| End of period | $8,057,199 |
| | |
| Accumulated net investment loss | $(5,142) |
| (1) April 30, 2010 (fund inception) through June 30, 2010. | |
| |
| |
| See Notes to Financial Statements. | |
18
|
| Notes to Financial Statements |
JUNE 30, 2010
1. Organization and Summary of Significant Accounting Policies
Organization — American Century Quantitative Equity Funds, Inc. (the corporation) is registered under the Investment Company Act of 1940 (the 1940 Act) as an open-end management investment company. Strategic Inflation Opportunities Fund (the fund) is one fund in a series issued by the corporation. The fund is nondiversified under the 1940 Act. The fund’s investment objective is to seek total real return (total return reduced by the expected impact of inflation). The fund pursues its objective by diversifying investments among U.S. Treasury inflation-indexed securities, commodity-related investments, and non-U.S. dollar investments. The following is a summary of the fund’s significant accounting policies.
Multiple Class — The fund is authorized to issue the Investor Class, the Institutional Class, the A Class, the C Class and the R Class. The A Class may incur an initial sales charge. The A Class and C Class may be subject to a contingent deferred sales charge. The share classes differ principally in their respective sales charges and distribution and shareholder servicing expenses and arrangements. All shares of the fund represent an equal pro rata interest in the net assets of the class to which such shares belong, and have identical voting, dividend, liquidation and other rights and the same terms and conditions, except for class specific expenses and exclusive rights to vote on matters affecting only individual classes. Income, non-class specific expenses, and realized and unrealized capital gains and losses of the fund ar e allocated to each class of shares based on their relative net assets. All classes of the fund commenced sale on April 30, 2010, the fund’s inception date.
Security Valuations — Securities traded primarily on a principal securities exchange are valued at the last reported sales price, or at the mean of the latest bid and asked prices where no last sales price is available. Depending on local convention or regulation, securities traded over-the-counter are valued at the mean of the latest bid and asked prices, the last sales price, or the official close price. Investments in open-end management investment companies are valued at the reported net asset value. Debt securities maturing in greater than 60 days at the time of purchase are valued at current market value as provided by a commercial pricing service or at the mean of the most recent bid and asked prices. Debt securities maturing within 60 days at the time of purchase may be valued at cost, plus or minus any amortized disc ount or premium. Discount notes may be valued through a commercial pricing service or at amortized cost, which approximates fair value. Securities traded on foreign securities exchanges and over-the-counter markets are normally completed before the close of business on days that the New York Stock Exchange (the Exchange) is open and may also take place on days when the Exchange is not open. If an event occurs after the value of a security was established but before the net asset value per share was determined that was likely to materially change the net asset value, that security would be valued as determined in accordance with procedures adopted by the Board of Directors. If the fund determines that the market price of a portfolio security is not readily available, or that the valuation methods mentioned above do not reflect the security’s fair value, such security is valued as determined by the Board of Directors or its designee, in accordance with procedures adopted by the Board of Directors, if such determination would materially impact a fund’s net asset value. Certain other circumstances may cause the fund to use alternative procedures to value a security such as: a security has been declared in default; trading in a security has been halted during the trading day; or there is a foreign market holiday and no trading will commence.
Security Transactions — For financial reporting purposes, security transactions are accounted for as of the trade date. Net realized gains and losses are determined on the identified cost basis, which is also used for federal income tax purposes.
Investment Income — Dividend income less foreign taxes withheld, if any, is recorded as of the ex-dividend date. Interest income is recorded on the accrual basis and includes accretion of discounts and amortization of premiums. Inflation adjustments related to inflation-linked debt securities are reflected as interest income.
19
Foreign Currency Translations — All assets and liabilities initially expressed in foreign currencies are translated into U.S. dollars at prevailing exchange rates at period end. The fund may enter into spot foreign currency exchange contracts to facilitate transactions denominated in a foreign currency. Purchases and sales of investment securities, dividend and interest income, spot foreign currency exchange contracts, and certain expenses are translated at the rates of exchange prevailing on the respective dates of such transactions. For assets and liabilities, other than investments in securities, net realized and unrealized gains and losses from foreign currency translations arise from changes in currency exchange rates.
Net realized and unrealized foreign currency exchange gains or losses occurring during the holding period of investment securities are a component of net realized gain (loss) on investment transactions and net unrealized appreciation (depreciation) on investments, respectively. Certain countries may impose taxes on the contract amount of purchases and sales of foreign currency contracts in their currency. The fund records the foreign tax expense, if any, as a reduction to the net realized gain (loss) on foreign currency transactions.
Commodity Exchange-Traded Funds — The fund may invest in exchange-traded funds of underlying commodities (Commodity ETFs). Commodity ETFs are a type of index fund bought and sold on a securities exchange. A Commodity ETF trades like common stock and represents a portfolio designed to track the performance of a particular index of a physical commodity or group of physical commodities. The fund may purchase a Commodity ETF to gain exposure to the underlying physical commodities. The risks of owning a Commodity ETF generally reflect the risks of owning the underlying commodities they are designed to track, although the lack of liquidity on a Commodity ETF could result in it being more volatile. Commodities markets have historically been extremely volatile. Additionally, Commodity ETFs have fees and expenses that reduce their value.
Repurchase Agreements — The fund may enter into repurchase agreements with institutions that American Century Investment Management, Inc. (ACIM) (the investment advisor) has determined are creditworthy pursuant to criteria adopted by the Board of Directors. Each repurchase agreement is recorded at cost. The fund requires that the collateral, represented by securities, received in a repurchase transaction be transferred to the custodian in a manner sufficient to enable the fund to obtain those securities in the event of a default under the repurchase agreement. ACIM monitors, on a daily basis, the securities transferred to ensure the value, including accrued interest, of the securities under each repurchase agreement is equal to or greater than amounts owed to the fund under each repurchase agreement.
Joint Trading Account — Pursuant to an Exemptive Order issued by the Securities and Exchange Commission, the fund, along with certain other funds in the American Century Investments family of funds, may transfer uninvested cash balances into a joint trading account. These balances are invested in one or more repurchase agreements that are collateralized by U.S. Treasury or Agency obligations.
Income Tax Status — It is the fund’s policy to distribute substantially all net investment income and net realized gains to shareholders and to otherwise qualify as a regulated investment company under provisions of the Internal Revenue Code. All tax years for the fund remain subject to examination by tax authorities. At this time, management believes there are no uncertain tax positions which, based on their technical merit, would not be sustained upon examination and for which it is reasonably possible that the total amounts of unrecognized tax benefits will significantly change in the next twelve months. Accordingly, no provision has been made for federal or state income taxes.
Distributions to Shareholders — Distributions to shareholders are recorded on the ex-dividend date. Distributions from net investment income, if any, are generally declared and paid quarterly. Distributions from net realized gains, if any, are generally declared and paid annually.
20
Indemnifications — Under the corporation’s organizational documents, its officers and directors are indemnified against certain liabilities arising out of the performance of their duties to the fund. In addition, in the normal course of business, the fund enters into contracts that provide general indemnifications. The maximum exposure under these arrangements is unknown as this would involve future claims that may be made against a fund. The risk of material loss from such claims is considered by management to be remote.
Use of Estimates — The financial statements are prepared in conformity with accounting principles generally accepted in the United States of America, which may require management to make certain estimates and assumptions at the date of the financial statements. Actual results could differ from these estimates.
Subsequent Events — In preparing the financial statements, management evaluated the impact of events or transactions occurring through the date the financial statements were issued that would merit recognition or disclosure.
2. Fees and Transactions with Related Parties
Management Fees — The corporation has entered into a Management Agreement (the Agreement) with ACIM, under which ACIM provides the fund with investment advisory and management services in exchange for a single, unified management fee (the fee) per class. The Agreement provides that all expenses of managing and operating the fund, except brokerage expenses, taxes, interest, fees and expenses of the independent directors (including legal counsel fees), and extraordinary expenses, will be paid by ACIM. The fee is computed and accrued daily based on the daily net assets of the specific class of shares of the fund and paid monthly in arrears. The fee consists of (1) an Investment Category Fee based on the daily net assets of the fund and certain other accounts managed by the investment advisor that are in the same broad invest ment category as the fund and (2) a Complex Fee based on the assets of all the funds in the American Century Investments family of funds. The rates for the Investment Category Fee range from 0.7754% to 0.8929%. The rates for the Complex Fee range from 0.2500% to 0.3100% for the Investor Class, A Class, C Class and R Class. The Institutional Class is 0.2000% less at each point within the Complex Fee range. During the period ended June 30, 2010, the investment advisor voluntarily agreed to waive 0.14% of its management fee. The investment advisor expects the fee waiver to continue through July 31, 2011 and cannot terminate it without consulting the Board of Directors. The total amount of the waiver for each class for the period April 30, 2010 (fund inception) through June 30, 2010, was $692, $33, $576, $76 and $33 for the Investor Class, Institutional Class, A Class, C Class and R Class, respectively. The effective annual management fee before waiver for each class for the period April 30, 2010 (fund inception) through June 30, 2010, was 1.09% for the Investor Class, A Class, C Class and R Class and 0.89% for the Institutional Class. The effective annual management fee after waiver for each class for the period April 30, 2010 (fund inception) through June 30, 2010 was 0.95% for the Investor Class, A Class, C Class and R Class and 0.75% for the Institutional Class.
Distribution and Service Fees — The Board of Directors has adopted a separate Master Distribution and Individual Shareholder Services Plan for each of the A Class, C Class and R Class (collectively the plans), pursuant to Rule 12b-1 of the 1940 Act. The plans provide that the A Class will pay American Century Investment Services, Inc. (ACIS) an annual distribution and service fee of 0.25%. The plans provide that the C Class will pay ACIS an annual distribution fee of 0.75% and service fee of 0.25%. The plans provide that the R Class will pay ACIS an annual distribution and service fee of 0.50%. The fees are computed and accrued daily based on each class’s daily net assets and paid monthly in arrears. The fees are used to pay financial intermediaries for distribution and individual shareholder services. Fees incurred under the plans during the period April 30, 2010 (fund inception) through June 30, 2010, are detailed in the Statement of Operations.
Acquired Fund Fees and Expenses — The fund may invest in mutual funds, exchange traded funds, and business development companies (the acquired funds). The fund will indirectly realize its pro rata share of the fees and expenses of the acquired funds in which it invests. These indirect fees and expenses are not paid out of the fund’s assets but are reflected in the return realized by the fund on its investment in the acquired funds.
21
Related Parties — Certain officers and directors of the corporation are also officers and/or directors of American Century Companies, Inc. (ACC), the parent of the corporation’s investment advisor, ACIM, the distributor of the corporation, ACIS, and the corporation’s transfer agent, American Century Services, LLC. ACIM owns 36% of the fund’s outstanding shares.
The fund is eligible to invest in a money market fund for temporary purposes, which is managed by J.P. Morgan Investment Management, Inc. (JPMIM). The fund has a Mutual Funds Services Agreement with J.P. Morgan Investor Services Co. (JPMIS). JPMorgan Chase Bank (JPMCB) is a custodian of the fund. JPMIM, JPMIS and JPMCB are wholly owned subsidiaries of JPMorgan Chase & Co. (JPM). JPM is an equity investor in ACC.
3. Investment Transactions
Purchases of investment securities, excluding short-term investments, for the period April 30, 2010 (fund inception) through June 30, 2010 totaled $5,333,669, of which $3,315,091 represented U.S. Treasury and Government Agency obligations. For the period April 30, 2010 (fund inception) through June 30, 2010, there were no sales of investment securities, excluding short-term investments.
| | |
| 4. Capital Share Transactions | | |
| |
| Transactions in shares of the fund were as follows: | | |
| | Period ended June 30, 2010(1) |
| | Shares | Amount |
| Investor Class/Shares Authorized | 100,000,000 | |
| Sold | 452,024 | $4,422,423 |
| Redeemed | (30,387) | (291,564) |
| | 421,637 | 4,130,859 |
| Institutional Class/Shares Authorized | 50,000,000 | |
| Sold | 15,000 | 150,000 |
| A Class/Shares Authorized | 50,000,000 | |
| Sold | 354,272 | 3,487,032 |
| Redeemed | (2,572) | (25,000) |
| | 351,700 | 3,462,032 |
| C Class/Shares Authorized | 50,000,000 | |
| Sold | 37,204 | 370,000 |
| R Class/Shares Authorized | 50,000,000 | |
| Sold | 15,000 | 150,000 |
| Net increase (decrease) | 840,541 | $8,262,891 |
| (1) April 30, 2010 (fund inception) through June 30, 2010. | | |
22
5. Fair Value Measurements
The fund’s securities valuation process is based on several considerations and may use multiple inputs to determine the fair value of the positions held by the fund. In conformity with accounting principles generally accepted in the United States of America, the inputs used to determine a valuation are classified into three broad levels as follows:
• Level 1 valuation inputs consist of unadjusted quoted prices in an active market for identical securities;
• Level 2 valuation inputs consist of significant direct or indirect observable market data (including quoted prices for similar securities, evaluations of subsequent market events, interest rates, prepayment speeds, credit risk, etc.); or
• Level 3 valuation inputs consist of significant unobservable inputs (including a fund’s own assumptions).
The level classification is based on the lowest level input that is significant to the fair valuation measurement. The valuation inputs are not an indication of the risks associated with investing in these securities or other financial instruments.
The following is a summary of the valuation inputs used to determine the fair value of the fund’s securities and other financial instruments as of June 30, 2010. The Schedule of Investments provides additional details on the fund’s portfolio holdings.
| | | |
| | Level 1 | Level 2 | Level 3 |
| Investment Securities | | | |
| U.S. Treasury Securities | — | $3,807,865 | — |
| Domestic Common Stocks | $ 705,382 | — | — |
| Commodity ETFs | 663,192 | — | — |
| Foreign Common Stocks | 416,457 | 57,228 | — |
| Temporary Cash Investments | 645,752 | 1,724,860 | — |
| Total Value of Investment Securities | $2,430,783 | $5,589,953 | — |
| | | | |
| Other Financial Instruments | | | |
| Forward Foreign Currency Exchange Contracts | — | $(20,335) | — |
| Futures Contracts | $881 | — | — |
| Total Unrealized Gain (Loss) on Other Financial Instruments | $881 | $(20,335) | — |
6. Derivative Instruments
Foreign Currency Risk — The fund is subject to foreign currency exchange rate risk in the normal course of pursuing its investment objectives. The value of foreign investments held by a fund may be significantly affected by changes in foreign currency exchange rates. The dollar value of a foreign security generally decreases when the value of the dollar rises against the foreign currency in which the security is denominated and tends to increase when the value of the dollar declines against such foreign currency. A fund may enter into forward foreign currency exchange contracts to reduce a fund’s exposure to foreign currency exchange rate fluctuations or to shift exposure to the fluctuations in the value of foreign currencies from one foreign currency to another foreign currency. The net U.S. dollar value of foreign curr ency underlying all contractual commitments held by a fund and the resulting unrealized appreciation or depreciation are determined daily using prevailing exchange rates. Realized gain or loss is recorded upon the termination of the contract. Net realized and unrealized gains or losses occurring during the holding period of forward foreign currency exchange contracts are a component of net realized gain (loss) on foreign currency transactions and change in net unrealized appreciation (depreciation) on translation of assets and liabilities in foreign currencies, respectively. A fund bears
23
the risk of an unfavorable change in the foreign currency exchange rate underlying the forward contract. Additionally, losses, up to the fair value, may arise if the counterparties do not perform under the contract terms. The foreign currency risk derivative instruments held at period end as disclosed on the Schedule of Investments are indicative of the fund’s typical volume during the period.
Interest Rate Risk — The fund is subject to interest rate risk in the normal course of pursuing its investment objectives. The value of bonds generally declines as interest rates rise. A fund may enter into futures contracts based on a bond index or a specific underlying security. A fund may purchase futures contracts to gain exposure to increases in market value or sell futures contracts to protect against a decline in market value. Upon entering into a futures contract, a fund will segregate cash, cash equivalents or other appropriate liquid securities on its records in amounts sufficient to meet requirements. Subsequent payments (variation margin) are made or received daily, in cash, by a fund. The variation margin is equal to the daily change in th e contract value and is recorded as unrealized gains and losses. A fund recognizes a realized gain or loss when the futures contract is closed or expires. Net realized and unrealized gains or losses occurring during the holding period of futures contracts are a component of net realized gain (loss) on futures contract transactions and change in net unrealized appreciation (depreciation) on futures contracts, respectively. One of the risks of entering into futures contracts is the possibility that the change in value of the contract may not correlate with the changes in value of the underlying securities. The interest rate risk derivative instruments held at period end as disclosed on the Schedule of Investments are indicative of the fund’s typical volume during the period.
Value of Derivative Instruments as of June 30, 2010
| | | | |
| | Asset Derivatives | | Liability Derivatives | |
| | Location on Statement | | Location on Statement | |
| Type of Derivative | of Assets and Liabilities | Value | of Assets and Liabilities | Value |
| Foreign Currency Risk | Receivable for forward foreign | | Payable for forward foreign | |
| | currency exchange contracts | $14,488 | currency exchange contracts | $34,823 |
| Interest Rate Risk | Receivable for variation margin | | Payable for variation margin | |
| | on futures contracts | 516 | on futures contracts | — |
| | | $15,004 | | $34,823 |
Effect of Derivative Instruments on the Statement of Operations for the Period Ended June 30, 2010
| | | | |
| | | | Change in Net Unrealized |
| | Net Realized Gain (Loss) | Appreciation (Depreciation) |
| | Location on Statement | | Location on Statement | |
| Type of Derivative | of Operations | Value | of Operations | Value |
| Foreign Currency Risk | Net realized gain (loss) on | | Change in net unrealized | |
| | foreign currency transactions | $(14,873) | appreciation (depreciation) | |
| | | | on translation of assets and | |
| | | | liabilities in foreign currencies | $(20,335) |
| Interest Rate Risk | Net realized gain (loss) on | | Change in net unrealized | |
| | futures contract transactions | — | appreciation (depreciation) | |
| | | | on futures contracts | 881 |
| | | $(14,873) | | $(19,454) |
24
7. Interfund Lending
The fund, along with certain other funds in the American Century Investments family of funds, may participate in an interfund lending program, pursuant to an Exemptive Order issued by the Securities and Exchange Commission (SEC). This program provides an alternative credit facility allowing the fund to borrow from or lend to other funds in the American Century Investments family of funds that permit such transactions. Interfund lending transactions are subject to each fund’s investment policies and borrowing and lending limits. The interfund loan rate earned/paid on interfund lending transactions is determined daily based on the average of certain current market rates. Interfund lending transactions normally extend only overnight, but can have a maximum duration of seven days. The program is subject to annual approval by the Board of Directors. During the period April 30, 2010 (fund inception) through June 30, 2010, the fund did not utilize the program.
8. Risk Factors
The fund may concentrate its investments in a narrow segment of the total market. Because of this, the fund may be subject to greater risk and market fluctuations than a portfolio representing a broader range of industries.
There are certain risks involved in investing in foreign securities. These risks include those resulting from future adverse political, social, and economic developments, fluctuations in currency exchange rates, the possible imposition of exchange controls, and other foreign laws or restrictions. Investing in emerging markets may accentuate these risks.
There are certain risks involved with investing in forward foreign currency exchange contracts. Changes in the value of foreign currencies against the U.S. dollar could result in gains or losses to the fund. The value of a share of the fund is determined in U.S. dollars. As a result, the fund could recognize a gain or loss based solely upon a change in the exchange rate between the foreign currency and the U.S. dollar. Changes in exchange rates may increase losses and lower gains from the fund’s investments. The overall impact on the fund may be significant depending on the currencies represented in the portfolio and how each one appreciates or depreciates in relation to the U.S. dollar. Currency trends are unpredictable and exchange rates in foreign currencies may fluctuate significantly over short periods of time for a number of reasons, including changes in interest rates, intervention (or the failure to intervene) by U.S. or foreign governments, central banks or supranational entities, or by the imposition of currency controls or other political developments in the United States or abroad.
The fund’s commodity-related investments may be subject to greater volatility than investments in traditional securities. The value of the fund’s commodity-related investments may be affected by changes in overall market movements, interest rate changes, and volatility in commodity-related indexes. The value of these investments may also be affected by factors affecting a particular commodity, such as weather, disease, embargoes, tariffs, taxes and economic, political and regulatory developments.
25
9. Federal Tax Information
The book-basis character of distributions made during the period from net investment income or net realized gains may differ from their ultimate characterization for federal income tax purposes. These differences reflect the differing character of certain income items and net realized gains and losses for financial statement and tax purposes, and may result in reclassification among certain capital accounts on the financial statements. There were no distributions paid by the fund during the period ended June 30, 2010.
As of June 30, 2010, the federal tax cost of investments and the components of distributable earnings on a tax-basis were as follows:
| | |
| Federal tax cost of investments | $8,198,909 |
| Gross tax appreciation of investments | $ 15,462 |
| Gross tax depreciation of investments | (193,635) |
| Net tax appreciation (depreciation) of investments | $(178,173) |
| Net tax appreciation (depreciation) on derivatives and translation of assets | |
| and liabilities in foreign currencies | $ 1,601 |
| Other book-to-tax adjustments | (2,866) |
| Net tax appreciation (depreciation) | $(179,438) |
| Undistributed ordinary income | — |
| Accumulated long-term gains | $2,249 |
| Currency loss deferral | $(26,813) |
The difference between book-basis and tax-basis cost and unrealized appreciation (depreciation) is attributable primarily to the realization for tax purposes of unrealized gains (losses) on investments in passive foreign investment companies, on certain forward foreign currency exchange contracts and on certain futures contracts. Other book-to-tax adjustments are attributable primarily to the tax deferral of losses on straddle positions.
The currency loss deferral listed above represents net foreign currency losses incurred in the two-month period ended June 30, 2010. The fund has elected to treat such losses as having been incurred in the following fiscal year for federal income tax purposes.
26
| | |
| Strategic Inflation Opportunities | |
| |
| Investor Class | |
| For a Share Outstanding Throughout the Period Indicated | |
| | | 2010(1) |
| Per-Share Data | |
| Net Asset Value, Beginning of Period | $10.00 |
| Income From Investment Operations | |
| Net Investment Income (Loss)(2) | 0.01 |
| Net Realized and Unrealized Gain (Loss) | (0.42) |
| Total From Investment Operations | (0.41) |
| Net Asset Value, End of Period | $9.59 |
| |
| Total Return(3) | (4.10)% |
| | |
| Ratios/Supplemental Data | |
| Ratio of Operating Expenses to Average Net Assets(4) | 0.95%(5)(6) |
| Ratio of Operating Expenses to Average Net Assets (Before Expense Waiver)(4) | 1.09%(6) |
| Ratio of Net Investment Income (Loss) to Average Net Assets | 0.79%(5)(6) |
| Ratio of Net Investment Income (Loss) to Average Net Assets (Before Expense Waiver) | 0.65%(6) |
| Portfolio Turnover Rate | 0% |
| Net Assets, End of Period (in thousands) | $4,044 |
| (1) | April 30, 2010 (fund inception) through June 30, 2010. | |
| (2) | Computed using average shares outstanding throughout the period. | |
| (3) | Total return assumes reinvestment of net investment income and capital gains distributions, if any. Total returns for periods less than one year |
| | are not annualized. Total returns are calculated based on the net asset value of the last business day. The total return of the classes may not |
| | precisely reflect the class expense differences because of the impact of calculating the net asset values to two decimal places. If net asset |
| | values were calculated to three decimal places, the total return differences would more closely reflect the class expense differences. The |
| | calculation of net asset values to two decimal places is made in accordance with SEC guidelines and does not result in any gain or loss of value |
| | between one class and another. | |
| (4) | Ratio of operating expenses to average net assets does not include any fees and expenses of the acquired funds. | |
| (5) | During the period ended June 30, 2010, the investment advisor voluntarily agreed to waive a portion of its management fee. | |
| (6) | Annualized. | |
See Notes to Financial Statements.
27
| | |
| Strategic Inflation Opportunities | |
| |
| Institutional Class | |
| For a Share Outstanding Throughout the Period Indicated | |
| | | 2010(1) |
| Per-Share Data | |
| Net Asset Value, Beginning of Period | $10.00 |
| Income From Investment Operations | |
| Net Investment Income (Loss)(2) | 0.02 |
| Net Realized and Unrealized Gain (Loss) | (0.43) |
| Total From Investment Operations | (0.41) |
| Net Asset Value, End of Period | $9.59 |
| |
| Total Return(3) | (4.10)% |
| | |
| Ratios/Supplemental Data | |
| Ratio of Operating Expenses to Average Net Assets(4) | 0.75%(5)(6) |
| Ratio of Operating Expenses to Average Net Assets (Before Expense Waiver)(4) | 0.89%(6) |
| Ratio of Net Investment Income (Loss) to Average Net Assets | 0.99%(5)(6) |
| Ratio of Net Investment Income (Loss) to Average Net Assets (Before Expense Waiver) | 0.85%(6) |
| Portfolio Turnover Rate | 0% |
| Net Assets, End of Period (in thousands) | $144 |
| (1) | April 30, 2010 (fund inception) through June 30, 2010. | |
| (2) | Computed using average shares outstanding throughout the period. | |
| (3) | Total return assumes reinvestment of net investment income and capital gains distributions, if any. Total returns for periods less than one year |
| | are not annualized. Total returns are calculated based on the net asset value of the last business day. The total return of the classes may not |
| | precisely reflect the class expense differences because of the impact of calculating the net asset values to two decimal places. If net asset |
| | values were calculated to three decimal places, the total return differences would more closely reflect the class expense differences. The |
| | calculation of net asset values to two decimal places is made in accordance with SEC guidelines and does not result in any gain or loss of value |
| | between one class and another. | |
| (4) | Ratio of operating expenses to average net assets does not include any fees and expenses of the acquired funds. | |
| (5) | During the period ended June 30, 2010, the investment advisor voluntarily agreed to waive a portion of its management fee. | |
| (6) | Annualized. | |
See Notes to Financial Statements.
28
| | |
| Strategic Inflation Opportunities | |
| |
| A Class | |
| For a Share Outstanding Throughout the Period Indicated | |
| | | 2010(1) |
| Per-Share Data | |
| Net Asset Value, Beginning of Period | $10.00 |
| Income From Investment Operations | |
| Net Investment Income (Loss)(2) | 0.01 |
| Net Realized and Unrealized Gain (Loss) | (0.43) |
| Total From Investment Operations | (0.42) |
| Net Asset Value, End of Period | $9.58 |
| |
| Total Return(3) | (4.20)% |
| | |
| Ratios/Supplemental Data | |
| Ratio of Operating Expenses to Average Net Assets(4) | 1.20%(5)(6) |
| Ratio of Operating Expenses to Average Net Assets (Before Expense Waiver)(4) | 1.34%(6) |
| Ratio of Net Investment Income (Loss) to Average Net Assets | 0.54%(5)(6) |
| Ratio of Net Investment Income (Loss) to Average Net Assets (Before Expense Waiver) | 0.40%(6) |
| Portfolio Turnover Rate | 0% |
| Net Assets, End of Period (in thousands) | $3,370 |
| (1) | April 30, 2010 (fund inception) through June 30, 2010. | |
| (2) | Computed using average shares outstanding throughout the period. | |
| (3) | Total return assumes reinvestment of net investment income and capital gains distributions, if any, and does not reflect applicable sales charges. |
| | Total returns for periods less than one year are not annualized. Total returns are calculated based on the net asset value of the last business day. |
| | The total return of the classes may not precisely reflect the class expense differences because of the impact of calculating the net asset values |
| | to two decimal places. If net asset values were calculated to three decimal places, the total return differences would more closely reflect the |
| | class expense differences. The calculation of net asset values to two decimal places is made in accordance with SEC guidelines and does not |
| | result in any gain or loss of value between one class and another. | |
| (4) | Ratio of operating expenses to average net assets does not include any fees and expenses of the acquired funds. | |
| (5) | During the period ended June 30, 2010, the investment advisor voluntarily agreed to waive a portion of its management fee. | |
| (6) | Annualized. | |
See Notes to Financial Statements.
29
| | |
| Strategic Inflation Opportunities | |
| |
| C Class | |
| For a Share Outstanding Throughout the Period Indicated | |
| | | 2010(1) |
| Per-Share Data | |
| Net Asset Value, Beginning of Period | $10.00 |
| Income From Investment Operations | |
| Net Investment Income (Loss)(2) | —(3) |
| Net Realized and Unrealized Gain (Loss) | (0.43) |
| Total From Investment Operations | (0.43) |
| Net Asset Value, End of Period | $9.57 |
| |
| Total Return(4) | (4.30)% |
| | |
| Ratios/Supplemental Data | |
| Ratio of Operating Expenses to Average Net Assets(5) | 1.95%(6)(7) |
| Ratio of Operating Expenses to Average Net Assets (Before Expense Waiver)(5) | 2.09%(7) |
| Ratio of Net Investment Income (Loss) to Average Net Assets | (0.21)%(6)(7) |
| Ratio of Net Investment Income (Loss) to Average Net Assets (Before Expense Waiver) | (0.35)%(7) |
| Portfolio Turnover Rate | 0% |
| Net Assets, End of Period (in thousands) | $356 |
| (1) | April 30, 2010 (fund inception) through June 30, 2010. | |
| (2) | Computed using average shares outstanding throughout the period. | |
| (3) | Per-share amount was less than $0.005. | |
| (4) | Total return assumes reinvestment of net investment income and capital gains distributions, if any, and does not reflect applicable sales charges. |
| | Total returns for periods less than one year are not annualized. Total returns are calculated based on the net asset value of the last business day. |
| | The total return of the classes may not precisely reflect the class expense differences because of the impact of calculating the net asset values |
| | to two decimal places. If net asset values were calculated to three decimal places, the total return differences would more closely reflect the |
| | class expense differences. The calculation of net asset values to two decimal places is made in accordance with SEC guidelines and does not |
| | result in any gain or loss of value between one class and another. | |
| (5) | Ratio of operating expenses to average net assets does not include any fees and expenses of the acquired funds. | |
| (6) | During the period ended June 30, 2010, the investment advisor voluntarily agreed to waive a portion of its management fee. |
| (7) | Annualized. | |
See Notes to Financial Statements.
30
| | |
| Strategic Inflation Opportunities | |
| |
| R Class | |
| For a Share Outstanding Throughout the Period Indicated | |
| | | 2010(1) |
| Per-Share Data | |
| Net Asset Value, Beginning of Period | $10.00 |
| Income From Investment Operations | |
| Net Investment Income (Loss)(2) | 0.01 |
| Net Realized and Unrealized Gain (Loss) | (0.43) |
| Total From Investment Operations | (0.42) |
| Net Asset Value, End of Period | $9.58 |
| |
| Total Return(3) | (4.20)% |
| | |
| Ratios/Supplemental Data | |
| Ratio of Operating Expenses to Average Net Assets(4) | 1.45%(5)(6) |
| Ratio of Operating Expenses to Average Net Assets (Before Expense Waiver)(4) | 1.59%(6) |
| Ratio of Net Investment Income (Loss) to Average Net Assets | 0.29%(5)(6) |
| Ratio of Net Investment Income (Loss) to Average Net Assets (Before Expense Waiver) | 0.15%(6) |
| Portfolio Turnover Rate | 0% |
| Net Assets, End of Period (in thousands) | $144 |
| (1) | April 30, 2010 (fund inception) through June 30, 2010. | |
| (2) | Computed using average shares outstanding throughout the period. | |
| (3) | Total return assumes reinvestment of net investment income and capital gains distributions, if any. Total returns for periods less than one year |
| | are not annualized. Total returns are calculated based on the net asset value of the last business day. The total return of the classes may not |
| | precisely reflect the class expense differences because of the impact of calculating the net asset values to two decimal places. If net asset |
| | values were calculated to three decimal places, the total return differences would more closely reflect the class expense differences. The |
| | calculation of net asset values to two decimal places is made in accordance with SEC guidelines and does not result in any gain or loss of value |
| | between one class and another. | |
| (4) | Ratio of operating expenses to average net assets does not include any fees and expenses of the acquired funds. | |
| (5) | During the period ended June 30, 2010, the investment advisor voluntarily agreed to waive a portion of its management fee. | |
| (6) | Annualized. | |
See Notes to Financial Statements.
31
|
| Report of Independent Registered Public Accounting Firm |
To the Directors of the American Century Quantitative Equity Funds, Inc.
and Shareholders of the Strategic Inflation Opportunities Fund:
In our opinion, the accompanying statement of assets and liabilities, including the schedule of investments, and the related statements of operations and of changes in net assets and the financial highlights present fairly, in all material respects, the financial position of the Strategic Inflation Opportunities Fund (one of the eleven funds comprising the American Century Quantitative Equity Funds, Inc., hereafter referred to as the “Fund”) at June 30, 2010, the results of its operations, the changes in its net assets and the financial highlights for the period April 30, 2010 (commencement of operations) through June 30, 2010, in conformity with accounting principles generally accepted in the United States of America. These financial statements and financial highlights (hereafter referred to as “financial statements”) are the responsibility of the Fund’s management; our responsibility is to express an opinion on these financial statements based on our audit. We conducted our audit of these financial statements in accordance with the standards of the Public Company Accounting Oversight Board (United States). Those standards require that we plan and perform the audit to obtain reasonable assurance about whether the financial statements are free of material misstatement. An audit includes examining, on a test basis, evidence supporting the amounts and disclosures in the financial statements, assessing the accounting principles used and significant estimates made by management, and evaluating the overall financial statement presentation. We believe that our audit, which included confirmation of securities at June 30, 2010 by correspondence with the custodian and brokers, provides a reasonable basis for our opinion.
PricewaterhouseCoopers LLP
Kansas City, Missouri
August 19, 2010
32
The Board of Directors
The individuals listed below serve as directors of the fund. Each director will continue to serve in this capacity until death, retirement, resignation or removal from office. The mandatory retirement age for directors who are not “interested persons,” as that term is defined in the Investment Company Act (independent directors), is 73. However, the mandatory retirement age may be extended for a period not to exceed two years with the approval of the remaining independent directors.
Mr. Thomas is the only director who is an “interested person” because he currently serves as President and Chief Executive Officer of American Century Companies, Inc. (ACC), the parent company of American Century Investment Management, Inc. (ACIM or the advisor).
The other directors (more than three-fourths of the total number) are independent; that is, they have never been employees, directors or officers of, and have no financial interest in, ACC or any of its wholly owned, direct or indirect, subsidiaries, including ACIM, American Century Investment Services, Inc. (ACIS) and American Century Services, LLC (ACS). The directors serve in this capacity for eight (in the case of Mr. Thomas, 15) registered investment companies in the American Century Investments family of funds.
The following presents additional information about the directors. The mailing address for each director other than Mr. Thomas is 1665 Charleston Road, Mountain View, California 94043. The mailing address for Mr. Thomas is 4500 Main Street, Kansas City, Missouri 64111.
Independent Directors
John Freidenrich
Year of Birth: 1937
Position(s) with the Fund: Director
Length of Time Served: Since 2005
Principal Occupation(s) During the Past Five Years: Founder, Member and Manager, Regis
Management Company, LLC (investment management firm) (April 2004 to present)
Number of Funds in Fund Complex Overseen by Director: 41
Other Directorships Held by Director During the Past Five Years: None
Education/Other Professional Experience: AB in Economics, Stanford University; LLB,
Stanford Law School; formerly, Partner and Founder, Ware and Freidenrich Law
Firm and Bay Partners; formerly, President, Board of Trustees, Stanford University
33
Ronald J. Gilson
Year of Birth: 1946
Position(s) with the Fund: Director and Chairman of the Board
Length of Time Served: Since 1995
Principal Occupation(s) During the Past Five Years: Charles J. Meyers Professor of Law and
Business, Stanford Law School (1979 to present); Marc and Eva Stern Professor of
Law and Business, Columbia University School of Law (1992 to present)
Number of Funds in Fund Complex Overseen by Director: 41
Other Directorships Held by Director During the Past Five Years: None
Education/Other Professional Experience: BA, Washington University; JD, Yale Law School;
formerly, Attorney, Steinhart, Goldberg, Feigenbaum & Ladar
Frederick L. A. Grauer
Year of Birth: 1946
Position(s) with the Fund: Director
Length of Time Served: Since 2008
Principal Occupation(s) During the Past Five Years: Senior Advisor, BlackRock, Inc. (investment
management firm) (2010 to present); Senior Advisor, Barclays Global Investors
(investment management firm) (2003 to 2009)
Number of Funds in Fund Complex Overseen by Director: 41
Other Directorships Held by Director During the Past Five Years: None
Education/Other Professional Experience: BA in Economics, University of British Columbia;
MA in Economics, University of Chicago; PhD in Business, Stanford University;
formerly, Executive Chairman, Barclays Global Investors; Chairman and Chief
Executive Officer, Wells Fargo Nikko Investment Advisors; and Vice President,
Merrill Lynch Capital Markets Group; formerly, Director, New York Stock Exchange,
Chicago Mercantile Exchange and Columbia University; formerly, Faculty Member,
Graduate School of Business, Columbia University and Alfred P. Sloan School of
Management, Massachusetts Institute of Technology
Peter F. Pervere
Year of Birth: 1947
Position(s) with the Fund: Director
Length of Time Served: Since 2007
Principal Occupation(s) During the Past Five Years: Retired
Number of Funds in Fund Complex Overseen by Director: 41
Other Directorships Held by Director During the Past Five Years: Intraware, Inc. (2003 to 2009);
Digital Impact, Inc. (2003 to 2005)
Education/Other Professional Experience: BA in History, Stanford University; CPA; formerly,
Vice President and Chief Financial Officer, Commerce One, Inc. (software and
services provider); formerly, Vice President and Corporate Controller, Sybase, Inc.;
formerly with accounting firm of Arthur Young & Co.
34
Myron S. Scholes
Year of Birth: 1941
Position(s) with the Fund: Director
Length of Time Served: Since 1980
Principal Occupation(s) During the Past Five Years: Chairman, Platinum Grove Asset
Management, L.P. (asset manager) (1999 to 2009); Frank E. Buck Professor of
Finance-Emeritus, Stanford Graduate School of Business (1996 to present)
Number of Funds in Fund Complex Overseen by Director: 41
Other Directorships Held by Director During the Past Five Years: Dimensional Fund Advisors
(investment advisor); CME Group, Inc. (futures and options exchange)
Education/Other Professional Experience: BA in Economics, McMaster University (Ontario);
MBA and PhD, University of Chicago; formerly, Senior Research Fellow at the
Hoover Institute; formerly, Edward Eagle Brown Professor of Finance, University of
Chicago; recipient of the Alfred Nobel Memorial Prize in Economic Sciences
John B. Shoven
Year of Birth: 1947
Position(s) with the Fund: Director
Length of Time Served: Since 2002
Principal Occupation(s) During the Past Five Years: Professor of Economics, Stanford University
(1973 to present)
Number of Funds in Fund Complex Overseen by Director: 41
Other Directorships Held by Director During the Past Five Years: Cadence Design Systems;
Exponent; Financial Engines; PalmSource, Inc. (2002 to 2005); Watson Wyatt
Worldwide (2002 to 2006)
Education/Other Professional Experience: BA in Physics, University of California; PhD in
Economics, Yale University; Director of the Stanford Institute for Economic Policy
Research (1999 to present); formerly, Chair of Economics and Dean of Humanities
and Sciences, Stanford University
Interested Director
Jonathan S. Thomas
Year of Birth: 1963
Position(s) with the Fund: Director and President
Length of Time Served: Since 2007
Principal Occupation(s) During the Past Five Years: President and Chief Executive Officer,
ACC (March 2007 to present); Chief Administrative Officer, ACC (February 2006 to
February 2007); Executive Vice President, ACC (November 2005 to February 2007);
Global Chief Operating Officer and Managing Director, Morgan Stanley (investment
management) (March 2000 to November 2005). Also serves as: Chief Executive
Officer and Manager, ACS; Executive Vice President, ACIM; Director, ACC, ACIM
and other ACC subsidiaries
Number of Funds in Fund Complex Overseen by Director: 104
Other Directorships Held by Director During the Past Five Years: None
Education/Other Professional Experience: BA in Economics, University of Massachusetts;
MBA, Boston College; formerly held senior leadership roles with Fidelity
Investments, Boston Financial Services and Bank of America; serves on the Board of
Governors of the Investment Company Institute
35
Officers
The following table presents certain information about the executive officers of the fund. Each officer serves as an officer for each of the 15 investment companies in the American Century family of funds, unless otherwise noted. No officer is compensated for his or her service as an officer of the fund. The listed officers are interested persons of the fund and are appointed or re-appointed on an annual basis. The mailing address for each of the officers listed below is 4500 Main Street, Kansas City, Missouri 64111.
| | |
| Name | Offices with | |
| (Year of Birth) | the Fund | Principal Occupation(s) During the Past Five Years |
| Jonathan S. | Director and | President and Chief Executive Officer, ACC (March 2007 to present); Chief |
| Thomas (1963) | President | Administrative Officer, ACC (February 2006 to February 2007); Executive Vice |
| | since 2007 | President, ACC (November 2005 to February 2007); Global Chief Operating |
| | | Officer and Managing Director, Morgan Stanley (March 2000 to November |
| | | 2005) Also serves as: Chief Executive Officer and Manager, ACS; Executive |
| | | Vice President, ACIM; Director, ACC, ACIM and other ACC subsidiaries |
| Barry Fink (1955) | Executive | Chief Operating Officer and Executive Vice President, ACC (September 2007 |
| | Vice President | to present); President, ACS (October 2007 to present); Managing Director, |
| | since 2007 | Morgan Stanley (2000 to 2007); Global General Counsel, Morgan Stanley |
| | | (2000 to 2006). Also serves as: Manager, ACS, and Director, ACC and |
| | | certain ACC subsidiaries |
| Maryanne L. | Chief Compliance | Chief Compliance Officer, American Century funds, ACIM and ACS (August |
| Roepke (1956) | Officer since 2006 | 2006 to present); Assistant Treasurer, ACC (January 1995 to August 2006); |
| | and Senior Vice | and Treasurer and Chief Financial Officer, various American Century funds |
| | President | (July 2000 to August 2006). Also serves as: Senior Vice President, ACS |
| | since 2000 | |
| Charles A. | General Counsel | Attorney, ACC (February 1994 to present); Vice President, ACC (November |
| Etherington | since 2007 and | 2005 to present); General Counsel, ACC (March 2007 to present); Also |
| (1957) | Senior Vice | serves as General Counsel, ACIM, ACS, ACIS and other ACC subsidiaries; |
| | President | and Senior Vice President, ACIM and ACS |
| | since 2006 | |
| Robert J. Leach | Vice President, | Vice President, ACS (February 2000 to present); and Controller, various |
| (1966) | Treasurer and | American Century funds (1997 to September 2006) |
| | Chief Financial | |
| | Officer since 2006 | |
| David H. Reinmiller | Vice President | Attorney, ACC (January 1994 to present); Associate General Counsel, ACC |
| (1963) | since 2001 | (January 2001 to present); Chief Compliance Officer, American Century |
| | | funds and ACIM (January 2001 to February 2005). Also serves as: Vice |
| | | President, ACIM and ACS |
| Ward D. Stauffer | Secretary | Attorney, ACC (June 2003 to Present) |
| (1960) | since 2005 | |
| |
| The Statement of Additional Information has additional information about the fund’s directors and is available without charge, upon request, |
| by calling 1-800-345-2021. | |
36
|
| Approval of Management Agreements |
Under a Securities and Exchange Commission rule, each fund is required to disclose in its annual or semiannual report, as appropriate, the material factors and conclusions that formed the basis for the board of directors’ approval or renewal of the fund’s advisory agreements. At a meeting held December 16, 2009, the directors unanimously approved the initial management agreement for the Strategic Inflation Opportunities Fund (the “fund”).
In advance of the board’s consideration, the advisor provided information concerning the fund. The materials circulated in advance of the meeting and the discussions held at the meeting detailed the investment objective and strategy proposed to be utilized by the advisor, the fund’s characteristics and key attributes, the rationale for launching the fund, the experience of the staff designated to manage the fund, the proposed pricing, and the markets in which the fund would be sold. The information considered and the discussions held at the meeting included, but were not limited to
• the nature, extent, and quality of investment management, shareholder, and other services to be provided to the fund under the management agreement;
• the wide range of programs and services to be provided by the advisor to fund shareholders on a routine and non-routine basis;
• the compliance policies, procedures, and regulatory experience of the advisor; and
• data comparing the cost of owning the fund to the cost of owning similar funds not managed by the advisor.
American Century Investments’ funds utilize a unified management fee structure. Under the unified fee structure, the advisor is responsible for providing all investment advisory, custody, audit, administrative, compliance, recordkeeping, marketing and shareholder services, or arranging and supervising third parties to provide such services. By contrast, most other funds are charged a variety of fees, including an investment advisory fee, a transfer agency fee, an administrative fee, distribution charges and other expenses. Other than their investment advisory fees and Rule 12b-1 distribution fees, all other components of the total fees charged by these other funds may be increased without shareholder approval. The advisor and board believe the unified fee structure is a benefit to fund shareholders because it clearly discloses to shareholders the cost of owning fund shares, and, since the unified fee cannot b e increased without a vote of fund shareholders, it shifts to the advisor the risk of increased costs of operating the fund and provides a direct incentive to minimize administrative inefficiencies.
When considering the approval of the management agreement for the fund, the board considered the entrepreneurial risk that the advisor assumes in launching a new fund. In particular, they considered the effect of the unified management fee structure and the fact that the advisor will assume a substantial part of the start-up costs of the fund and the risk that the fund will grow to a level that will become profitable to the advisor. The board
37
considered the position that the fund would take in the line up of the American Century Investments’ family of funds and the benefits to shareholders of existing funds of the broadened product offering.
Finally, while not specifically discussed, but important in the decision to approve the management agreement, is the directors’ familiarity with the advisor. The board oversees and evaluates on a continuous basis the nature and quality of all services the advisor performs for other funds within the American Century Investments’ complex. As such, the directors have confidence in the advisor’s integrity and competence in providing services to the fund.
In their deliberations, the board did not identify any particular information that was all-important or controlling, and each director attributed different weights to various factors. However, based on their evaluation of all material factors and assisted by the advice of independent legal counsel, the board, including the independent directors, concluded that the overall arrangements between the fund and the advisor, as provided in the management agreement, were fair and reasonable in light of the services to be performed and should be approved.
38
Retirement Account Information
As required by law, distributions you receive from certain IRAs, or 403(b), 457 and qualified plans are subject to federal income tax withholding, unless you elect not to have withholding apply. Tax will be withheld on the total amount withdrawn even though you may be receiving amounts that are not subject to withholding, such as nondeductible contributions. In such case, excess amounts of withholding could occur. You may adjust your withholding election so that a greater or lesser amount will be withheld.
If you don’t want us to withhold on this amount, you must notify us to not withhold the federal income tax. You may notify us in writing or in certain situations by telephone or through other electronic means. You have the right to revoke your withholding election at any time and any election you make may remain in effect until revoked by filing a new election.
Remember, even if you elect not to have income tax withheld, you are liable for paying income tax on the taxable portion of your withdrawal. If you elect not to have income tax withheld or you don’t have enough income tax withheld, you may be responsible for payment of estimated tax. You may incur penalties under the estimated tax rules if your withholding and estimated tax payments are not sufficient. You can reduce or defer the income tax on a distribution by directly or indirectly rolling such distribution over to another IRA or eligible plan. You should consult your tax advisor for additional information.
State tax will be withheld if, at the time of your distribution, your address is within one of the mandatory withholding states and you have federal income tax withheld. State taxes will be withheld from your distribution in accordance with the respective state rules.
Proxy Voting Guidelines
American Century Investment Management, Inc., the fund’s investment advisor, is responsible for exercising the voting rights associated with the securities purchased and/or held by the fund. A description of the policies and procedures the advisor uses in fulfilling this responsibility is available without charge, upon request, by calling 1-800-345-2021. It is also available on American Century Investments’ website at americancentury.com and on the Securities and Exchange Commission’s website at sec.gov. Information regarding how the investment advisor voted proxies relating to portfolio securities during the most recent 12-month period ended June 30 is available on the “About Us” page at americancentury.com. It is also available at sec.gov.
Quarterly Portfolio Disclosure
The fund files its complete schedule of portfolio holdings with the Securities and Exchange Commission (SEC) for the first and third quarters of each fiscal year on Form N-Q. The fund’s Forms N-Q are available on the SEC’s website at sec.gov, and may be reviewed and copied at the SEC’s Public Reference Room in Washington, DC. Information on the operation of the Public Reference Room may be obtained by calling 1-800-SEC-0330. The fund also makes its complete schedule of portfolio holdings for the most recent quarter of its fiscal year available on its website at americancentury.com and, upon request, by calling 1-800-345-2021.
39
The following indices are used to illustrate investment market, sector, or style performance or to serve as fund performance comparisons. They are not investment products available for purchase.
The Barclays Capital U.S. 1–3 Month Treasury Bill Index is a component of the Short Treasury Index, which includes aged U.S. Treasury bills, notes and bonds and excludes zero coupon strips.
The Barclays Capital U.S. Treasury Inflation Protected Securities (TIPS) Index consists of Treasury inflation-protected securities with a remaining maturity of one year or more.
The Citigroup World Government Bond, ex U.S., Index is a capitalization-weighted index comprised of investment-grade government bonds from 22 countries excluding the United States.
The Dollar Spot Index measures the performance of the U.S. dollar against a basket of currencies, including the euro, Japanese yen, Great Britain pound, Canadian dollar, Swiss franc, and Swedish krona.
The London Gold PM Fix, in U.S. dollars measures the daily gold prices, as set by the five-member London gold pool.
The S&P Goldman Sachs Commodities Index is a measure of price movements in the global commodities markets, including the principal physical commodities (energy, industrial metals, precious metals, agriculture, livestock) that are the subject of active, liquid futures markets.
40

| |
| |
| Contact Us | |
| americancentury.com | |
| Automated Information Line | 1-800-345-8765 |
| Investor Services Representative | 1-800-345-2021 or |
| | 816-531-5575 |
| Investors Using Advisors | 1-800-378-9878 |
| Business, Not-For-Profit, Employer-Sponsored | |
| Retirement Plans | 1-800-345-3533 |
| Banks and Trust Companies, Broker-Dealers, | |
| Financial Professionals, Insurance Companies | 1-800-345-6488 |
| Telecommunications Device for the Deaf | 1-800-634-4113 |
| American Century Quantitative Equity Funds, Inc. | |
| Investment Advisor: | |
| American Century Investment Management, Inc. | |
| Kansas City, Missouri | |
This report and the statements it contains are submitted for the general
information of our shareholders. The report is not authorized for distribution to
prospective investors unless preceded or accompanied by an effective prospectus.
American Century Investment Services, Inc., Distributor
©2010 American Century Proprietary Holdings, Inc. All rights reserved.
1008
CL-ANN-69054
|
| Annual Report |
| June 30, 2010 |

|
| American Century Investments® |
NT Equity Growth Fund
| |
| President’s Letter | 2 |
| Market Perspective | 3 |
| U.S. Stock Index Returns | 3 |
| |
| NT Equity Growth | |
| |
| Performance | 4 |
| Portfolio Commentary | 6 |
| Top Ten Holdings | 8 |
| Five Largest Overweights | 8 |
| Five Largest Underweights. | 8 |
| Types of Investments in Portfolio | 8 |
| |
| Shareholder Fee Example | 9 |
| |
| Financial Statements | |
| |
| Schedule of Investments | 11 |
| Statement of Assets and Liabilities | 16 |
| Statement of Operations | 17 |
| Statement of Changes in Net Assets | 18 |
| Notes to Financial Statements | 19 |
| Financial Highlights | 24 |
| Report of Independent Registered Public Accounting Firm | 25 |
| |
| Other Information | |
| |
| Proxy Voting Results | 26 |
| Management | 27 |
| Board Approval of Management Agreements | 31 |
| Additional Information | 37 |
| Index Definitions | 38 |
Any opinions expressed in this report reflect those of the author as of the date of the report, and do not necessarily represent the opinions of American Century Investments or any other person in the American Century Investments organization. Any such opinions are subject to change at any time based upon market or other conditions and American Century Investments disclaims any responsibility to update such opinions. These opinions may not be relied upon as investment advice and, because investment decisions made by American Century Investments funds are based on numerous factors, may not be relied upon as an indication of trading intent on behalf of any American Century Investments fund. Security examples are used for representational purposes only and are not intended as recommendations to purchase or sell securities. Performance information for comparative indices and securities is provided to American Century Investments by third party vendors. To the best of American Century Investments’ knowledge, such information is accurate at the time of printing.

Dear Investor:
To learn more about the capital markets, your investment, and the portfolio management strategies American Century Investments provides, we encourage you to review this shareholder report for the financial reporting period ended June 30, 2010.
On the following pages, you will find investment performance and portfolio information, presented with the expert perspective and commentary of our portfolio management team. This report remains one of our most important vehicles for conveying the information you need about your investment performance, and about the market factors and strategies that affect fund returns. For additional information on the markets, we encourage you to visit the “Insights & News” tab at our Web site, americancentury.com, for updates and further expert commentary.
The top of our Web site’s home page also provides a link to “Our Story,” which, first and foremost, outlines our commitment—since 1958—to helping clients reach their financial goals. We believe strongly that we will only be successful when our clients are successful. That’s who we are.
Another important, unique facet of our story and who we are is “Profits with a Purpose,” which describes our bond with the Stowers Institute for Medical Research (SIMR). SIMR is a world-class biomedical organization—founded by our company founder James E. Stowers, Jr. and his wife Virginia—that is dedicated to researching the causes, treatment, and prevention of gene-based diseases, including cancer. Through American Century Investments’ private ownership structure, more than 40% of our profits support SIMR.
Mr. Stowers’ example of achieving financial success and using that platform to help humanity motivates our entire American Century Investments team. His story inspires us to help each of our clients achieve success. Thank you for sharing your financial journey with us.
Sincerely,

Jonathan Thomas
President and Chief Executive Officer
American Century Investments
2

By Scott Wittman, Chief Investment Officer, Quantitative Equity and Asset Allocation
Stocks Rallied as Economy Improved
U.S. stocks posted double-digit gains for the 12 months ended June 30, 2010, thanks largely to improving economic conditions and unexpectedly strong corporate earnings. As the period began, the U.S. economy was starting to show early signs of recovery following a sharp downturn in late 2008 and early 2009. Led by improving results in manufacturing activity, housing, and consumer spending, the economy posted positive growth in the third and fourth quarters of 2009 after four consecutive quarters of declining output. By the first quarter of 2010, jobs data turned positive, providing further evidence of a burgeoning economic recovery.
In addition, corporate profits consistently exceeded expectations as many companies implemented stringent cost-management programs that helped boost profit margins. Rising demand for delayed big-ticket purchases, such as cars and appliances, also contributed to stronger earnings. As a result, stocks rose steadily for much of the period, with the major equity indices advancing by more than 30% from the beginning of the period through April 30, 2010.
Growing Uncertainty Led to Late Decline
Market conditions changed abruptly in the last two months of the period as persistent worries about sovereign debt problems in Europe and questions about the sustainability of the domestic economic recovery (validated to some degree by weaker economic data late in the period) weighed on investor confidence. With these headwinds, the equity market peaked in late April and then reversed direction in May and June. In addition, market volatility increased dramatically—the S&P 500 Index moved up or down by more than 1% on nearly half of the trading days in the second quarter of 2010.
Although stocks gave back a notable portion of their gains late in the period, the broad market indices returned approximately 15% overall for the 12 months. Mid- and small-cap stocks posted the best returns (see the table below), outpacing large-cap shares, while value stocks outperformed growth-oriented issues across all market capitalizations.
| | | | |
| U.S. Stock Index Returns | | | | |
| For the 12 months ended June 30, 2010 | | | | |
| Russell 1000 Index (Large-Cap) | 15.24% | | Russell 2000 Index (Small-Cap) | 21.48% |
| Russell 1000 Value Index | 16.92% | | Russell 2000 Value Index | 25.07% |
| Russell 1000 Growth Index | 13.62% | | Russell 2000 Growth Index | 17.96% |
| Russell Midcap Index | 25.13% | | | |
| Russell Midcap Value Index | 28.91% | | | |
| Russell Midcap Growth Index | 21.30% | | | |
3
| | | | |
| NT Equity Growth | | | | |
| |
| Total Returns as of June 30, 2010 | | | |
| | | | Average | |
| | | | Annual Returns | |
| | Ticker Symbol | 1 year | Since Inception | Inception Date |
| Institutional Class | ACLEX | 13.53% | -4.02% | 5/12/06 |
| S&P 500 Index | — | 14.43% | -3.25% | — |
Data presented reflect past performance. Past performance is no guarantee of future results. Current performance may be higher or lower than the performance shown. Investment return and principal value will fluctuate, and redemption value may be more or less than original cost. To obtain performance data current to the most recent month end, please call 1-800-345-2021 or visit americancentury.com.
Data assumes reinvestment of dividends and capital gains, and none of the charts reflect the deduction of taxes that a shareholder would pay on fund distributions or the redemption of fund shares. Returns for the index are provided for comparison. The fund’s total returns include operating expenses (such as transaction costs and management fees) that reduce returns, while the total returns of the index do not.
4
NT Equity Growth
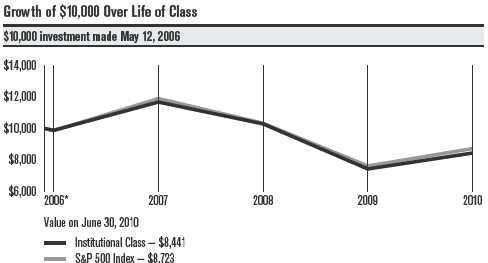
| |
| *From 5/12/06, the Institutional Class’s inception date. Not annualized. |
| Total Annual Fund Operating Expenses |
| Institutional Class | 0.50% |
The total annual fund operating expenses shown is as stated in the fund’s prospectus current as of the date of this report. The prospectus may vary from the expense ratio shown elsewhere in this report because it is based on a different time period, includes acquired fund fees and expenses, and, if applicable, does not include fee waivers or expense reimbursements.
Data presented reflect past performance. Past performance is no guarantee of future results. Current performance may be higher or lower than the performance shown. Investment return and principal value will fluctuate, and redemption value may be more or less than original cost. To obtain performance data current to the most recent month end, please call 1-800-345-2021 or visit americancentury.com.
Data assumes reinvestment of dividends and capital gains, and none of the charts reflect the deduction of taxes that a shareholder would pay on fund distributions or the redemption of fund shares. Returns for the index are provided for comparison. The fund’s total returns include operating expenses (such as transaction costs and management fees) that reduce returns, while the total returns of the index do not.
5
NT Equity Growth
Portfolio Managers: Bill Martin and Claudia Musat
In June 2010, portfolio manager Thomas Vaiana left American Century Investments to pursue other opportunities. With his departure, Claudia Musat, a portfolio manager who has been with the firm since 2005, was named co-portfolio manager of NT Equity Growth with Bill Martin.
Performance Summary
NT Equity Growth returned 13.53% for the 12 months ended June 30, 2010, compared with the 14.43% return of its benchmark, the S&P 500 Index.
The double-digit gain for both NT Equity Growth and the S&P 500 reflected the broad advance in the U.S. equity market. However, NT Equity Growth lagged the S&P 500 for the 12-month period. Although the fund’s smaller average market capitalization contributed favorably to performance during the period, price momentum detracted amid the market’s dramatic ebbs and flows.
Utilities Lagged
Stock selection in three key sectors produced essentially all of the under-performance versus the benchmark, with the utilities sector doing the most damage. An overweight position in independent power producers and stock choices among multi-utilities contributed virtually all of the underperformance in this sector. The three biggest individual detractors in the portfolio were utilities stocks, led by independent power producers NRG Energy and Mirant. NRG Energy, based in New Jersey, failed to meet earnings expectations for three consecutive quarters amid falling power prices and higher operating costs. Atlanta-based Mirant also struggled with higher costs, and the company’s emphasis on coal-fired power plants led to concerns about potential carbon taxes in forthcoming federal energy legislation. Late in the period, Mirant announced a merger agreement with competitor RRI Energy.
The other significant detractor in the utilities sector was electric and gas utility Public Services Enterprise Group, which operates primarily in the mid-Atlantic region. Declining demand for power weighed on the company’s earnings during the period.
Financials and Industrials Also Detracted
The portfolio’s financials and industrials holdings also underperformed their counterparts in the S&P 500. Underweight positions in real estate investment trusts and consumer finance companies, along with stock selection among capital markets firms, had the biggest negative impact on relative results in the financials sector. The most significant missed opportunities included credit card companies American Express and Capital One Financial, both of which rallied as credit conditions improved and consumer spending picked up. Investment bank Goldman Sachs was hurt by uncertainty surrounding the federal government’s regulatory overhaul of the financial industry, as well as a fraud lawsuit brought by the Securities and Exchange Commission.
6
NT Equity Growth
Underperformance in the industrials sector was driven primarily by stock selection among aerospace and defense companies and an overweight position in construction and engineering firms. An underweight position in aircraft maker Boeing hindered results as increased aircraft orders and a successful test flight of its 787 Dreamliner boosted the stock. Construction and engineering firm Fluor was another noteworthy detractor, declining amid a slowdown in revenues from oil and gas projects.
Consumer and Energy Stocks Outperformed
On the positive side, stock selection was most successful in the consumer discretionary, energy, and consumer staples sectors. By far, security selection added the most value in the consumer discretionary sector, led by auto components manufacturers and internet retailers. An overweight position in household durable goods makers also contributed favorably to results in this sector. The top contributors among consumer discretionary stocks were auto parts maker TRW Automotive and online movie rental firm Netflix. TRW Automotive rallied as a recovery in auto sales led to a sharp increase in demand for its products, while Netflix enjoyed strong subscriber growth and generated better-than-expected earnings amid increased customer usage of streaming video.
Industry allocation was the key behind the outperformance in the energy sector, particularly an underweight position in oil and gas producers and an overweight position in energy equipment and services companies. In the consumer staples sector, stock selection among beverage makers and an underweight position in food and staples retailers contributed the most to outperformance. Top individual contributors included energy exploration and production company McMoRan Exploration, which rallied sharply in early 2010 after the company made a substantial oil discovery, and beverage distributor Coca-Cola Enterprises, which was acquired by Coca-Cola.
Stock selection in the chemicals industry also generated noteworthy outperformance, particularly an overweight position in fertilizer producer Terra Industries and an underweight position in agricultural chemicals maker Monsanto. Terra agreed to be acquired by competitor CF Industries Holdings, while Monsanto faced intense price competition in its Roundup herbicide business and tepid demand for its new enhanced seed products.
A Look Ahead
The market environment has grown increasingly choppy in recent months, reflecting greater uncertainty about the resilience of the economic recovery. Although most businesses weathered the 2008 recession relatively well, stubbornly high unemployment suggests that the corporate sector is not yet confident enough in the strength of the recovery to expand payrolls. This economic uncertainty—and the stock market volatility that often accompanies it—is likely to continue as we move into the second half of 2010.
The quantitative investment process we use to manage NT Equity Growth has a framework that is objective, disciplined, and systematic—in other words, it avoids getting caught up in the fads and emotions that can drive short-term market movements. We believe this approach will produce superior relative performance over the long term.
7
| | |
| NT Equity Growth | | |
| |
| Top Ten Holdings | | |
| | | % of net assets as of 6/30/10 |
| Exxon Mobil Corp. | | 3.1% |
| International Business Machines Corp. | | 2.6% |
| Johnson & Johnson | | 2.3% |
| JPMorgan Chase & Co. | | 2.3% |
| Microsoft Corp. | | 2.2% |
| Apple, Inc. | | 2.2% |
| AT&T, Inc. | | 2.1% |
| Chevron Corp. | | 2.1% |
| Intel Corp. | | 1.9% |
| Bank of America Corp. | | 1.8% |
| |
| Five Largest Overweights as of June 30, 2010 | |
| | % of net assets | % of S&P 500 Index |
| Integrys Energy Group, Inc. | 0.96% | 0.04% |
| International Business Machines Corp. | 2.58% | 1.70% |
| Constellation Energy Group, Inc. | 0.95% | 0.07% |
| Eli Lilly & Co. | 1.23% | 0.36% |
| Humana, Inc. | 0.90% | 0.08% |
| |
| Five Largest Underweights as of June 30, 2010 | |
| | % of net assets | % of S&P 500 Index |
| Berkshire Hathaway, Inc., Class B | 0.30% | 1.42% |
| Merck & Co., Inc. | 0.09% | 1.17% |
| PepsiCo, Inc. | 0.06% | 1.05% |
| Pfizer, Inc. | 0.25% | 1.23% |
| Coca-Cola Co. (The) | 0.27% | 1.24% |
| |
| Types of Investments in Portfolio | | |
| | | % of net assets as of 6/30/10 |
| Common Stocks | | 98.6% |
| Temporary Cash Investments | | 1.9% |
| Other Assets and Liabilities | | (0.5)% |
8
|
| Shareholder Fee Example (Unaudited) |
Fund shareholders may incur two types of costs: (1) transaction costs, including sales charges (loads) on purchase payments and redemption/ exchange fees; and (2) ongoing costs, including management fees; distribution and service (12b-1) fees; and other fund expenses. This example is intended to help you understand your ongoing costs (in dollars) of investing in your fund and to compare these costs with the ongoing cost of investing in other mutual funds.
The example is based on an investment of $1,000 made at the beginning of the period and held for the entire period from January 1, 2010 to June 30, 2010.
Actual Expenses
The table provides information about actual account values and actual expenses for each class. You may use the information, together with the amount you invested, to estimate the expenses that you paid over the period. First, identify the share class you own. Then simply divide your account value by $1,000 (for example, an $8,600 account value divided by $1,000 = 8.6), then multiply the result by the number under the heading “Expenses Paid During Period” to estimate the expenses you paid on your account during this period.
If you hold Investor Class shares of any American Century Investments fund, or Institutional Class shares of the American Century Diversified Bond Fund, in an American Century Investments account (i.e., not a financial intermediary or retirement plan account), American Century Investments may charge you a $12.50 semiannual account maintenance fee if the value of those shares is less than $10,000. We will redeem shares automatically in one of your accounts to pay the $12.50 fee. In determining your total eligible investment amount, we will include your investments in all personal accounts (including American Century Investments Brokerage accounts) registered under your Social Security number. Personal accounts include individual accounts, joint accounts, UGMA/UTMA accounts, personal trusts, Coverdell Education Savings Accounts and IRAs (including traditional, Roth, Rollover, SEP-, SARSEP- and SIMPLE-IRAs), and certain other retirement accounts. If you have only business, business retirement, employer-sponsored or American Century Investments Brokerage accounts, you are currently not subject to this fee. We will not charge the fee as long as you choose to manage your accounts exclusively online. If you are subject to the Account Maintenance Fee, your account value could be reduced by the fee amount.
Hypothetical Example for Comparison Purposes
The table also provides information about hypothetical account values and hypothetical expenses based on the actual expense ratio of each class of your fund and an assumed rate of return of 5% per year before expenses, which is not the actual return of a fund’s share class. The hypothetical account values and expenses may not be used to estimate the actual ending account balance or expenses you paid for the period. You may use this information to compare the ongoing costs of investing in your fund and other funds. To do so, compare this 5% hypothetical example with the 5% hypothetical examples that appear in the shareholder reports of the other funds.
9
Please note that the expenses shown in the table are meant to highlight your ongoing costs only and do not reflect any transactional costs, such as sales charges (loads) or redemption/exchange fees. Therefore, the table is useful in comparing ongoing costs only, and will not help you determine the relative total costs of owning different funds. In addition, if these transactional costs were included, your costs would have been higher.
| | | | |
| | Beginning | Ending | Expenses Paid | |
| | Account Value | Account Value | During Period* | Annualized |
| | 1/1/10 | 6/30/10 | 1/1/10 – 6/30/10 | Expense Ratio* |
| Actual | $1,000 | $939.70 | $2.36 | 0.49% |
| Hypothetical | $1,000 | $1,022.36 | $2.46 | 0.49% |
| *Expenses are equal to the class’s annualized expense ratio listed in the table above, multiplied by the average account value over the period, |
| multiplied by 181, the number of days in the most recent fiscal half-year, divided by 365, to reflect the one-half year period. |
10
| | | | | | |
| NT Equity Growth | | | | | |
| |
| JUNE 30, 2010 | | | | | | |
| | Shares | Value | | | Shares | Value |
| Common Stocks — 98.6% | | | Valspar Corp. | 21,450 | $ 646,074 |
| | | | | W.R. Grace & Co.(1) | 7,541 | 158,663 |
| AEROSPACE & DEFENSE — 1.8% | | | | | |
| Boeing Co. (The) | 36,917 | $ 2,316,542 | | | | 4,799,467 |
| L-3 Communications | | | | COMMERCIAL BANKS — 3.1% | | |
| Holdings, Inc. | 8,232 | 583,155 | | BB&T Corp. | 7,630 | 200,745 |
| Northrop Grumman Corp. | 11,087 | 603,576 | | KeyCorp | 33,180 | 255,154 |
| Raytheon Co. | 48,522 | 2,347,979 | | PNC Financial Services | | |
| | | 5,851,252 | | Group, Inc. | 16,330 | 922,645 |
| AIR FREIGHT & LOGISTICS — 0.8% | | | Regions Financial Corp. | 24,591 | 161,809 |
| FedEx Corp. | 9,273 | 650,130 | | Toronto-Dominion Bank (The) | 37,982 | 2,465,412 |
| United Parcel Service, Inc., | | | | U.S. Bancorp. | 47,427 | 1,059,994 |
| Class B | 34,473 | 1,961,169 | | Wells Fargo & Co. | 191,987 | 4,914,867 |
| | | 2,611,299 | | | | 9,980,626 |
| AUTO COMPONENTS — 0.5% | | | | COMMERCIAL SERVICES & SUPPLIES — 0.1% |
| TRW Automotive | | | | R.R. Donnelley & Sons Co. | 12,835 | 210,109 |
| Holdings Corp.(1) | 53,964 | 1,487,787 | | Republic Services, Inc. | 1,666 | 49,530 |
| AUTOMOBILES — 0.2% | | | | Waste Management, Inc. | 3,229 | 101,036 |
| Ford Motor Co.(1) | 73,602 | 741,908 | | | | 360,675 |
| BEVERAGES — 1.5% | | | | COMMUNICATIONS EQUIPMENT — 1.2% | |
| Coca-Cola Co. (The) | 17,249 | 864,520 | | ADC Telecommunications, Inc.(1) | 28,133 | 208,465 |
| Coca-Cola Enterprises, Inc. | 35,161 | 909,264 | | Arris Group, Inc.(1) | 40,914 | 416,914 |
| Dr Pepper Snapple Group, Inc. | 77,678 | 2,904,380 | | Cisco Systems, Inc.(1) | 88,967 | 1,895,887 |
| PepsiCo, Inc. | 3,198 | 194,918 | | CommScope, Inc.(1) | 15,097 | 358,856 |
| | | 4,873,082 | | Harris Corp. | 10,164 | 423,331 |
| BIOTECHNOLOGY — 2.6% | | | | Plantronics, Inc. | 12,390 | 354,354 |
| Amgen, Inc.(1) | 81,122 | 4,267,017 | | Tellabs, Inc. | 36,778 | 235,011 |
| Biogen Idec, Inc.(1) | 38,915 | 1,846,517 | | | | 3,892,818 |
| Cephalon, Inc.(1) | 31,724 | 1,800,337 | | COMPUTERS & PERIPHERALS — 5.2% | |
| Cubist Pharmaceuticals, Inc.(1)�� | 22,402 | 461,481 | | Apple, Inc.(1) | 27,506 | 6,918,584 |
| Gilead Sciences, Inc.(1) | 2,415 | 82,786 | | EMC Corp.(1) | 37,856 | 692,765 |
| | | 8,458,138 | | Hewlett-Packard Co. | 37,074 | 1,604,563 |
| CAPITAL MARKETS — 2.2% | | | | Lexmark International, Inc., | | |
| Bank of New York | | | | Class A(1) | 44,639 | 1,474,426 |
| Mellon Corp. (The) | 61,176 | 1,510,435 | | SanDisk Corp.(1) | 37,522 | 1,578,551 |
| Goldman Sachs | | | | Seagate Technology(1) | 169,561 | 2,211,075 |
| Group, Inc. (The) | 30,566 | 4,012,399 | | Synaptics, Inc.(1) | 11,260 | 309,650 |
| Investment Technology | | | | | | |
| Group, Inc.(1) | 4,591 | 73,731 | | Western Digital Corp.(1) | 61,277 | 1,848,114 |
| Legg Mason, Inc. | 57,423 | 1,609,567 | | | | 16,637,728 |
| | | 7,206,132 | | CONSTRUCTION & ENGINEERING — 0.7% | |
| CHEMICALS — 1.5% | | | | EMCOR Group, Inc.(1) | 53,486 | 1,239,271 |
| Ashland, Inc. | 12,681 | 588,652 | | Shaw Group, Inc. (The)(1) | 21,634 | 740,315 |
| Lubrizol Corp. | 26,645 | 2,139,860 | | URS Corp.(1) | 6,265 | 246,528 |
| OM Group, Inc.(1) | 17,914 | 427,428 | | | | 2,226,114 |
| Sherwin-Williams Co. (The) | 12,123 | 838,790 | | | | |
11
| | | | | | |
| NT Equity Growth | | | | | |
| |
| | Shares | Value | | | Shares | Value |
| CONSUMER FINANCE — 0.6% | | | | FOOD & STAPLES RETAILING — 1.0% | |
| American Express Co. | 16,370 | $ 649,889 | | Safeway, Inc. | 89,522 | $ 1,760,002 |
| AmeriCredit Corp.(1) | 16,799 | 306,078 | | SUPERVALU, INC. | 31,170 | 337,883 |
| Cash America International, Inc. | 27,744 | 950,787 | | Wal-Mart Stores, Inc. | 24,782 | 1,191,271 |
| | | 1,906,754 | | | | 3,289,156 |
| CONTAINERS & PACKAGING — 0.3% | | | FOOD PRODUCTS — 3.7% | | |
| Graphic Packaging Holding Co.(1) | 113,357 | 357,075 | | ConAgra Foods, Inc. | 75,846 | 1,768,729 |
| Rock-Tenn Co., Class A | 13,536 | 672,333 | | Corn Products International, Inc. | 44,518 | 1,348,895 |
| | | 1,029,408 | | Del Monte Foods Co. | 174,085 | 2,505,083 |
| DIVERSIFIED CONSUMER SERVICES — 0.3% | | | Dole Food Co., Inc.(1) | 37,782 | 394,066 |
| Career Education Corp.(1) | 8,936 | 205,707 | | Hershey Co. (The) | 10,759 | 515,679 |
| Corinthian Colleges, Inc.(1) | 11,271 | 111,019 | | Lancaster Colony Corp. | 5,069 | 270,482 |
| ITT Educational Services, Inc.(1) | 5,779 | 479,773 | | Mead Johnson Nutrition Co. | 7,934 | 397,652 |
| | | 796,499 | | Sara Lee Corp. | 165,450 | 2,332,845 |
| DIVERSIFIED FINANCIAL SERVICES — 4.1% | | | Tyson Foods, Inc., Class A | 135,118 | 2,214,584 |
| Bank of America Corp. | 409,701 | 5,887,404 | | | | 11,748,015 |
| JPMorgan Chase & Co. | 199,774 | 7,313,726 | | GAS UTILITIES — 0.3% | | |
| | | 13,201,130 | | Nicor, Inc. | 2,586 | 104,733 |
| DIVERSIFIED TELECOMMUNICATION | | | ONEOK, Inc. | 19,147 | 828,108 |
| SERVICES — 2.7% | | | | UGI Corp. | 3,860 | 98,198 |
| AT&T, Inc. | 280,210 | 6,778,280 | | | | 1,031,039 |
| Verizon Communications, Inc. | 68,428 | 1,917,352 | | HEALTH CARE EQUIPMENT & SUPPLIES — 1.1% |
| | | 8,695,632 | | Becton, Dickinson & Co. | 8,434 | 570,307 |
| ELECTRIC UTILITIES — 1.0% | | | | C.R. Bard, Inc. | 18,187 | 1,410,038 |
| Entergy Corp. | 8,264 | 591,868 | | Hospira, Inc.(1) | 3,002 | 172,465 |
| Exelon Corp. | 25,473 | 967,210 | | Medtronic, Inc. | 20,183 | 732,037 |
| NextEra Energy, Inc. | 30,731 | 1,498,443 | | STERIS Corp. | 22,223 | 690,691 |
| | | 3,057,521 | | | | 3,575,538 |
| ELECTRICAL EQUIPMENT — 0.1% | | | HEALTH CARE PROVIDERS & SERVICES — 3.0% |
| General Cable Corp.(1) | 7,812 | 208,190 | | Cardinal Health, Inc. | 79,635 | 2,676,532 |
| ELECTRONIC EQUIPMENT, INSTRUMENTS & | | | Health Net, Inc.(1) | 8,005 | 195,082 |
| COMPONENTS — 1.1% | | | | Humana, Inc.(1) | 62,944 | 2,874,653 |
| Anixter International, Inc.(1) | 8,263 | 352,004 | | | | |
| | | | | Magellan Health Services, Inc.(1) | 10,592 | 384,701 |
| Celestica, Inc.(1) | 96,062 | 774,260 | | UnitedHealth Group, Inc. | 77,946 | 2,213,666 |
| Tech Data Corp.(1) | 20,878 | 743,674 | | WellPoint, Inc.(1) | 27,205 | 1,331,141 |
| Tyco Electronics Ltd. | 63,577 | 1,613,584 | | | | 9,675,775 |
| Vishay Intertechnology, Inc.(1) | 10,178 | 78,778 | | HOTELS, RESTAURANTS & LEISURE — 0.7% | |
| | | 3,562,300 | | McDonald’s Corp. | 19,475 | 1,282,818 |
| ENERGY EQUIPMENT & SERVICES — 1.4% | | | Panera Bread Co., Class A(1) | 8,334 | 627,467 |
| Complete Production | | | | Starbucks Corp. | 14,093 | 342,460 |
| Services, Inc.(1) | 31,902 | 456,199 | | | | |
| | | | | | | 2,252,745 |
| National Oilwell Varco, Inc. | 48,022 | 1,588,088 | | HOUSEHOLD DURABLES — 0.4% | |
| Oil States International, Inc.(1) | 25,794 | 1,020,926 | | | | |
| | | | | American Greetings Corp., | | |
| Schlumberger Ltd. | 19,622 | 1,085,881 | | Class A | 21,704 | 407,167 |
| Transocean Ltd.(1) | 5,052 | 234,059 | | D.R. Horton, Inc. | 28,202 | 277,226 |
| | | 4,385,153 | | | | |
12
| | | | | | |
| NT Equity Growth | | | | | |
| |
| | Shares | Value | | | Shares | Value |
| Harman International | | | | INTERNET SOFTWARE & SERVICES — 1.6% | |
| Industries, Inc.(1) | 13,816 | $ 412,960 | | AOL, Inc.(1) | 27,746 | $ 576,839 |
| Ryland Group, Inc. | 6,593 | 104,301 | | EarthLink, Inc. | 50,162 | 399,289 |
| | | 1,201,654 | | Google, Inc., Class A(1) | 8,988 | 3,999,211 |
| HOUSEHOLD PRODUCTS — 2.5% | | | | | 4,975,339 |
| Colgate-Palmolive Co. | 9,632 | 758,616 | | IT SERVICES — 4.5% | | |
| Kimberly-Clark Corp. | 24,576 | 1,490,043 | | Acxiom Corp.(1) | 5,034 | 73,950 |
| Procter & Gamble Co. (The) | 93,889 | 5,631,462 | | Automatic Data Processing, Inc. | 57,343 | 2,308,629 |
| | | 7,880,121 | | Computer Sciences Corp. | 43,274 | 1,958,149 |
| INDEPENDENT POWER PRODUCERS & | | | Convergys Corp.(1) | 111,515 | 1,093,962 |
| ENERGY TRADERS — 1.5% | | | | | | |
| Constellation Energy Group, Inc. | 94,909 | 3,060,815 | | International Business | | |
| | | | | Machines Corp. | 67,144 | 8,290,941 |
| Mirant Corp.(1) | 91,867 | 970,116 | | | | |
| | | | | NeuStar, Inc., Class A(1) | 9,491 | 195,704 |
| NRG Energy, Inc.(1) | 43,238 | 917,078 | | | | |
| | | | | Western Union Co. (The) | 42,664 | 636,120 |
| | | 4,948,009 | | | | 14,557,455 |
| INDUSTRIAL CONGLOMERATES — 1.8% | | | LEISURE EQUIPMENT & PRODUCTS — 0.6% | |
| 3M Co. | 25,732 | 2,032,571 | | Polaris Industries, Inc. | 36,546 | 1,996,143 |
| Carlisle Cos., Inc. | 41,211 | 1,488,953 | | LIFE SCIENCES TOOLS & SERVICES — 0.3% | |
| General Electric Co. | 161,440 | 2,327,965 | | Bruker Corp.(1) | 76,997 | 936,284 |
| | | 5,849,489 | | MACHINERY — 2.7% | | |
| INSURANCE — 5.0% | | | | Briggs & Stratton Corp. | 23,528 | 400,447 |
| ACE Ltd. | 12,884 | 663,268 | | Caterpillar, Inc. | 31,178 | 1,872,862 |
| Allied World Assurance Co. | | | | | | |
| Holdings Ltd. | 29,256 | 1,327,637 | | Cummins, Inc. | 17,689 | 1,152,085 |
| American Financial Group, Inc. | 90,418 | 2,470,220 | | Deere & Co. | 30,041 | 1,672,683 |
| Arch Capital Group Ltd.(1) | 1,181 | 87,985 | | Graco, Inc. | 3,154 | 88,911 |
| Aspen Insurance Holdings Ltd. | 6,091 | 150,691 | | Mueller Industries, Inc. | 7,917 | 194,758 |
| | | | | Oshkosh Corp.(1) | 52,173 | 1,625,711 |
| Berkshire Hathaway, Inc., | | | | | | |
| Class B(1) | 12,232 | 974,768 | | Timken Co. | 52,408 | 1,362,084 |
| Chubb Corp. (The) | 17,941 | 897,229 | | WABCO Holdings, Inc.(1) | 12,959 | 407,949 |
| CNA Financial Corp.(1) | 7,971 | 203,739 | | | | 8,777,490 |
| Endurance Specialty | | | | MEDIA — 2.4% | | |
| Holdings Ltd. | 23,327 | 875,462 | | Comcast Corp., Class A | 177,828 | 3,088,872 |
| Hartford Financial Services | | | | DIRECTV, Class A(1) | 8,147 | 276,346 |
| Group, Inc. (The) | 3,519 | 77,876 | | Discovery Communications, | | |
| Horace Mann Educators Corp. | 9,899 | 151,455 | | Inc., Class A(1) | 5,695 | 203,369 |
| Principal Financial Group, Inc. | 107,345 | 2,516,167 | | Gannett Co., Inc. | 8,966 | 120,682 |
| Protective Life Corp. | 5,067 | 108,383 | | Liberty Media Corp. - Starz, | | |
| Prudential Financial, Inc. | 60,497 | 3,246,269 | | Series A(1) | 3,711 | 192,378 |
| Transatlantic Holdings, Inc. | 2,443 | 117,166 | | Scholastic Corp. | 11,518 | 277,814 |
| Travelers Cos., Inc. (The) | 46,362 | 2,283,329 | | Time Warner, Inc. | 111,156 | 3,213,520 |
| | | 16,151,644 | | Walt Disney Co. (The) | 9,269 | 291,974 |
| INTERNET & CATALOG RETAIL — 0.5% | | | | | 7,664,955 |
| Amazon.com, Inc.(1) | 6,526 | 713,031 | | METALS & MINING — 2.0% | | |
| Netflix, Inc.(1) | 6,693 | 727,194 | | Freeport-McMoRan | | |
| | | 1,440,225 | | Copper & Gold, Inc. | 53,761 | 3,178,888 |
| | | | | Newmont Mining Corp. | 32,722 | 2,020,256 |
13
| | | | | | |
| NT Equity Growth | | | | | |
| |
| | Shares | Value | | | Shares | Value |
| Reliance Steel & Aluminum Co. | 29,212 | $ 1,056,014 | | CBL & Associates Properties, Inc. | 1,033 | $ 12,850 |
| Worthington Industries, Inc. | 14,823 | 190,624 | | Equity LifeStyle Properties, Inc. | 6,504 | 313,688 |
| | | 6,445,782 | | Federal Realty Investment Trust | 454 | 31,902 |
| MULTILINE RETAIL — 1.4% | | | | Mid-America Apartment | | |
| Big Lots, Inc.(1) | 3,501 | 112,347 | | Communities, Inc. | 629 | 32,375 |
| Dillard’s, Inc., Class A | 25,814 | 555,001 | | Simon Property Group, Inc. | 2,943 | 237,647 |
| Dollar Tree, Inc.(1) | 19,223 | 800,233 | | | | 1,012,773 |
| Family Dollar Stores, Inc. | 16,204 | 610,729 | | ROAD & RAIL — 0.3% | | |
| Macy’s, Inc. | 25,981 | 465,060 | | CSX Corp. | 11,036 | 547,716 |
| Target Corp. | 36,992 | 1,818,896 | | Norfolk Southern Corp. | 10,174 | 539,731 |
| | | 4,362,266 | | | | 1,087,447 |
| MULTI-UTILITIES — 1.6% | | | | SEMICONDUCTORS & SEMICONDUCTOR | |
| | | | | EQUIPMENT — 3.5% | | |
| DTE Energy Co. | 36,856 | 1,681,002 | | | | |
| | | | | Advanced Micro Devices, Inc.(1) | 65,067 | 476,290 |
| Integrys Energy Group, Inc. | 70,089 | 3,065,693 | | | | |
| | | | | Broadcom Corp., Class A | 45,438 | 1,498,091 |
| NiSource, Inc. | 18,456 | 267,612 | | | | |
| | | | | Intel Corp. | 317,036 | 6,166,350 |
| | | 5,014,307 | | | | |
| | | | | LSI Corp.(1) | 120,241 | 553,109 |
| OFFICE ELECTRONICS — 0.2% | | | | | | |
| | | | | Micron Technology, Inc.(1) | 57,772 | 490,484 |
| Xerox Corp. | 58,059 | 466,794 | | | | |
| | | | | RF Micro Devices, Inc.(1) | 83,095 | 324,902 |
| OIL, GAS & CONSUMABLE FUELS — 9.3% | | | | | |
| Anadarko Petroleum Corp. | 16,184 | 584,080 | | Texas Instruments, Inc. | 71,800 | 1,671,504 |
| Apache Corp. | 16,418 | 1,382,231 | | | | 11,180,730 |
| Canadian Natural Resources Ltd. | 50,359 | 1,673,430 | | SOFTWARE — 4.1% | | |
| Chevron Corp. | 97,823 | 6,638,269 | | ACI Worldwide, Inc.(1) | 6,885 | 134,051 |
| Cimarex Energy Co. | 12,081 | 864,758 | | Fair Isaac Corp. | 12,104 | 263,746 |
| ConocoPhillips | 84,177 | 4,132,249 | | Intuit, Inc.(1) | 81,457 | 2,832,260 |
| Exxon Mobil Corp. | 173,841 | 9,921,106 | | Microsoft Corp. | 307,306 | 7,071,111 |
| Murphy Oil Corp. | 23,671 | 1,172,898 | | Oracle Corp. | 73,379 | 1,574,714 |
| Occidental Petroleum Corp. | 26,800 | 2,067,620 | | Quest Software, Inc.(1) | 11,556 | 208,470 |
| World Fuel Services Corp. | 55,550 | 1,440,967 | | Symantec Corp.(1) | 46,834 | 650,056 |
| | | 29,877,608 | | Synopsys, Inc.(1) | 23,936 | 499,544 |
| PAPER & FOREST PRODUCTS — 0.2% | | | | | 13,233,952 |
| International Paper Co. | 27,973 | 633,029 | | SPECIALTY RETAIL — 2.3% | | |
| PHARMACEUTICALS — 6.6% | | | | AutoZone, Inc.(1) | 1,032 | 199,403 |
| Abbott Laboratories | 49,234 | 2,303,167 | | Gap, Inc. (The) | 79,182 | 1,540,882 |
| Bristol-Myers Squibb Co. | 107,171 | 2,672,845 | | Home Depot, Inc. (The) | 1,925 | 54,035 |
| Eli Lilly & Co. | 117,988 | 3,952,598 | | PetSmart, Inc. | 7,434 | 224,284 |
| Endo Pharmaceuticals | | | | Rent-A-Center, Inc.(1) | 40,363 | 817,754 |
| Holdings, Inc.(1) | 85,440 | 1,864,301 | | | | |
| | | | | Ross Stores, Inc. | 49,885 | 2,658,371 |
| Forest Laboratories, Inc.(1) | 53,727 | 1,473,732 | | Williams-Sonoma, Inc. | 76,796 | 1,906,077 |
| Johnson & Johnson | 123,891 | 7,317,002 | | | | 7,400,806 |
| King Pharmaceuticals, Inc.(1) | 85,651 | 650,091 | | TEXTILES, APPAREL & LUXURY GOODS — 0.2% |
| Merck & Co., Inc. | 7,995 | 279,585 | | Jones Apparel Group, Inc. | 36,296 | 575,292 |
| Pfizer, Inc. | 55,521 | 791,729 | | THRIFTS & MORTGAGE FINANCE(2) | |
| | | 21,305,050 | | Ocwen Financial Corp.(1) | 11,982 | 122,097 |
| REAL ESTATE INVESTMENT TRUSTS (REITs) — 0.3% | | TOTAL COMMON STOCKS | | |
| Annaly Capital Management, Inc. | 8,511 | 145,964 | | (Cost $317,046,486) | | 316,638,622 |
| Boston Properties, Inc. | 3,341 | 238,347 | | | | |
14
| | | | | |
| NT Equity Growth | | | | |
| |
| | Shares | Value | | Notes to Schedule of Investments |
| Temporary Cash Investments — 1.9% | | (1) | Non-income producing. |
| JPMorgan U.S. Treasury | | | | (2) | Industry is less than 0.05% of total net assets. |
| Plus Money Market Fund | | | | | |
| Agency Shares | 7,089 | $ 7,089 | | Industry classifications are unaudited. |
| Repurchase Agreement, Bank of America | | | | |
| Securities, LLC, (collateralized by various | | | | |
| U.S. Treasury obligations, 1.125%, 6/30/11, | | | See Notes to Financial Statements. |
| valued at $6,119,602), in a joint trading | | | | |
| account at 0.01%, dated 6/30/10, due | | | | |
| 7/1/10 (Delivery value $6,000,002) | | 6,000,000 | | | |
| TOTAL TEMPORARY | | | | | |
| CASH INVESTMENTS | | | | | |
| (Cost $6,007,089) | | 6,007,089 | | | |
| TOTAL INVESTMENT | | | | | |
| SECURITIES — 100.5% | | | | | |
| (Cost $323,053,575) | | 322,645,711 | | | |
| OTHER ASSETS AND | | | | | |
| LIABILITIES — (0.5)% | | (1,687,266) | | | |
| TOTAL NET ASSETS — 100.0% | | $320,958,445 | | | |
15
|
| Statement of Assets and Liabilities |
| |
| JUNE 30, 2010 | |
| Assets | |
| Investment securities, at value (cost of $323,053,575) | $322,645,711 |
| Receivable for capital shares sold | 1,531,036 |
| Dividends and interest receivable | 266,279 |
| | 324,443,026 |
| | |
| Liabilities | |
| Payable for investments purchased | 3,351,266 |
| Accrued management fees | 133,315 |
| | 3,484,581 |
| | |
| Net Assets | $320,958,445 |
| | |
| Institutional Class Capital Shares, $0.01 Par Value | |
| Authorized | 100,000,000 |
| Shares outstanding | 40,548,772 |
| | |
| Net Asset Value Per Share | $7.92 |
| | |
| Net Assets Consist of: | |
| Capital (par value and paid-in surplus) | $342,325,870 |
| Undistributed net investment income | 121,481 |
| Accumulated net realized loss on investment transactions | (21,081,042) |
| Net unrealized depreciation on investments | (407,864) |
| | $320,958,445 |
| |
| |
| See Notes to Financial Statements. | |
16
| |
| YEAR ENDED JUNE 30, 2010 | |
| Investment Income (Loss) | |
| Income: | |
| Dividends (net of foreign taxes withheld of $8,732) | $ 4,984,162 |
| Interest | 3,228 |
| | 4,987,390 |
| | |
| Expenses: | |
| Management fees | 1,353,432 |
| Directors’ fees and expenses | 7,925 |
| Other expenses | 297 |
| | 1,361,654 |
| | |
| Net investment income (loss) | 3,625,736 |
| | |
| Realized and Unrealized Gain (Loss) | |
| Net realized gain (loss) on: | |
| Investment transactions | 22,800,414 |
| Futures contract transactions | (597,602) |
| | 22,202,812 |
| | |
| Change in net unrealized appreciation (depreciation) on investments | (4,601,954) |
| | |
| Net realized and unrealized gain (loss) | 17,600,858 |
| | |
| Net Increase (Decrease) in Net Assets Resulting from Operations | $21,226,594 |
| |
| |
| See Notes to Financial Statements. | |
17
|
| Statement of Changes in Net Assets |
| | |
| YEARS ENDED JUNE 30, 2010 AND JUNE 30, 2009 | | |
| Increase (Decrease) in Net Assets | 2010 | 2009 |
| Operations | | |
| Net investment income (loss) | $ 3,625,736 | $ 2,425,566 |
| Net realized gain (loss) | 22,202,812 | (37,802,622) |
| Change in net unrealized appreciation (depreciation) | (4,601,954) | 3,088,081 |
| Net increase (decrease) in net assets resulting from operations | 21,226,594 | (32,288,975) |
| | | |
| Distributions to Shareholders | | |
| From net investment income | (3,438,550) | (2,756,354) |
| | | |
| Capital Share Transactions | | |
| Proceeds from shares sold | 123,776,451 | 138,962,826 |
| Proceeds from reinvestment of distributions | 787,044 | — |
| Payments for shares redeemed | (12,439,437) | (25,288,359) |
| Net increase (decrease) in net assets from capital share transactions | 112,124,058 | 113,674,467 |
| | | |
| Net increase (decrease) in net assets | 129,912,102 | 78,629,138 |
| | | |
| Net Assets | | |
| Beginning of period | 191,046,343 | 112,417,205 |
| End of period | $320,958,445 | $191,046,343 |
| | | |
| Undistributed net investment income | $121,481 | $11,314 |
| | | |
| Transactions in Shares of the Fund | | |
| Sold | 14,919,441 | 19,416,650 |
| Issued in reinvestment of distributions | 91,623 | — |
| Redeemed | (1,525,318) | (3,616,866) |
| Net increase (decrease) in shares of the fund | 13,485,746 | 15,799,784 |
| |
| |
| See Notes to Financial Statements. | | |
18
|
| Notes to Financial Statements |
JUNE 30, 2010
1. Organization and Summary of Significant Accounting Policies
Organization — American Century Quantitative Equity Funds, Inc. (the corporation) is registered under the Investment Company Act of 1940 (the 1940 Act) as an open-end management investment company. NT Equity Growth Fund (the fund) is one fund in a series issued by the corporation. The fund is diversified under the 1940 Act. The fund’s investment objective is to seek long-term capital growth. The fund pursues its objective by investing in common stocks. The fund is not permitted to invest in any securities issued by companies assigned the Global Industry Classification Standard for the tobacco industry. The following is a summary of the fund’s significant accounting policies.
Security Valuations — Securities traded primarily on a principal securities exchange are valued at the last reported sales price, or at the mean of the latest bid and asked prices where no last sales price is available. Depending on local convention or regulation, securities traded over-the-counter are valued at the mean of the latest bid and asked prices, the last sales price, or the official close price. Investments in open-end management investment companies are valued at the reported net asset value. Discount notes may be valued through a commercial pricing service or at amortized cost, which approximates fair value. Securities traded on foreign securities exchanges and over-the-counter markets are normally completed before the close of business on days that the New York Stock Exchange (the Exchange) is open and may also take place on days when the Exchange is not open. If an event occurs after the value of a security was established but before the net asset value per share was determined that was likely to materially change the net asset value, that security would be valued as determined in accordance with procedures adopted by the Board of Directors. If the fund determines that the market price of a portfolio security is not readily available, or that the valuation methods mentioned above do not reflect the security’s fair value, such security is valued as determined by the Board of Directors or its designee, in accordance with procedures adopted by the Board of Directors, if such determination would materially impact a fund’s net asset value. Certain other circumstances may cause the fund to use alternative procedures to value a security such as: a security has been declared in default; trading in a security has been halted during the trading day; or there is a foreign market holiday and no trading will commence .
Security Transactions — For financial reporting purposes, security transactions are accounted for as of the trade date. Net realized gains and losses are determined on the identified cost basis, which is also used for federal income tax purposes.
Investment Income — Dividend income less foreign taxes withheld, if any, is recorded as of the ex-dividend date. Interest income is recorded on the accrual basis and includes accretion of discounts and amortization of premiums.
Repurchase Agreements — The fund may enter into repurchase agreements with institutions that American Century Investment Management, Inc. (ACIM) (the investment advisor) has determined are creditworthy pursuant to criteria adopted by the Board of Directors. Each repurchase agreement is recorded at cost. The fund requires that the collateral, represented by securities, received in a repurchase transaction be transferred to the custodian in a manner sufficient to enable the fund to obtain those securities in the event of a default under the repurchase agreement. ACIM monitors, on a daily basis, the securities transferred to ensure the value, including accrued interest, of the securities under each repurchase agreement is equal to or greater than amounts owed to the fund under each repurchase agreement.
Joint Trading Account — Pursuant to an Exemptive Order issued by the Securities and Exchange Commission, the fund, along with certain other funds in the American Century Investments family of funds, may transfer uninvested cash balances into a joint trading account. These balances are invested in one or more repurchase agreements that are collateralized by U.S. Treasury or Agency obligations.
19
Income Tax Status — It is the fund’s policy to distribute substantially all net investment income and net realized gains to shareholders and to otherwise qualify as a regulated investment company under provisions of the Internal Revenue Code. All tax years for the fund remain subject to examination by tax authorities. At this time, management believes there are no uncertain tax positions which, based on their technical merit, would not be sustained upon examination and for which it is reasonably possible that the total amounts of unrecognized tax benefits will significantly change in the next twelve months. Accordingly, no provision has been made for federal or state income taxes.
Distributions to Shareholders — Distributions to shareholders are recorded on the ex-dividend date. Distributions from net investment income, if any, are generally declared and paid quarterly. Distributions from net realized gains, if any, are generally declared and paid annually.
Indemnifications — Under the corporation’s organizational documents, its officers and directors are indemnified against certain liabilities arising out of the performance of their duties to the fund. In addition, in the normal course of business, the fund enters into contracts that provide general indemnifications. The maximum exposure under these arrangements is unknown as this would involve future claims that may be made against a fund. The risk of material loss from such claims is considered by management to be remote.
Use of Estimates — The financial statements are prepared in conformity with accounting principles generally accepted in the United States of America, which may require management to make certain estimates and assumptions at the date of the financial statements. Actual results could differ from these estimates.
Subsequent Events — In preparing the financial statements, management evaluated the impact of events or transactions occurring through the date the financial statements were issued that would merit recognition or disclosure.
2. Fees and Transactions with Related Parties
Management Fees — The corporation has entered into a Management Agreement with ACIM, under which ACIM provides the fund with investment advisory and management services in exchange for a single, unified management fee (the fee). The Agreement provides that all expenses of managing and operating the fund, except brokerage expenses, taxes, interest, fees and expenses of the independent directors (including legal counsel fees), and extraordinary expenses, will be paid by ACIM. The fee is computed and accrued daily based on the daily net assets of the specific class of shares of the fund and paid monthly in arrears. The fee consists of (1) an Investment Category Fee based on the daily net assets of the fund and certain other accounts managed by the investment advisor that are in the same broad investment category as the fund and (2) a Complex Fee based on the assets of all the funds in the American Century Investments family of funds. The rates for the Investment Category Fee range from 0.3380% to 0.5200%. The rates for the Complex Fee range from 0.0500% to 0.1100%. The effective annual management fee for the year ended June 30, 2010 was 0.49%.
Related Parties — Certain officers and directors of the corporation are also officers and/or directors of American Century Companies, Inc. (ACC), the parent of the corporation’s investment advisor, ACIM, the distributor of the corporation, American Century Investment Services, Inc., and the corporation’s transfer agent, American Century Services, LLC. The fund is wholly owned, in aggregate, by various funds in a series issued by American Century Asset Allocation Portfolios, Inc. (ACAAP). ACAAP does not invest in the fund for the purpose of exercising management or control.
The fund is eligible to invest in a money market fund for temporary purposes, which is managed by J.P. Morgan Investment Management, Inc. (JPMIM). The fund has a Mutual Funds Services Agreement with J.P. Morgan Investor Services Co. (JPMIS) and a securities lending agreement with JPMorgan Chase Bank (JPMCB). JPMCB is a custodian of the fund. JPMIM, JPMIS and JPMCB are wholly owned subsidiaries of JPMorgan Chase & Co. (JPM). JPM is an equity investor in ACC.
20
3. Investment Transactions
Purchases and sales of investment securities, excluding short-term investments, for the year ended June 30, 2010, were $296,290,674 and $186,548,923, respectively.
4. Fair Value Measurements
The fund’s securities valuation process is based on several considerations and may use multiple inputs to determine the fair value of the positions held by the fund. In conformity with accounting principles generally accepted in the United States of America, the inputs used to determine a valuation are classified into three broad levels as follows:
• Level 1 valuation inputs consist of unadjusted quoted prices in an active market for identical securities;
• Level 2 valuation inputs consist of significant direct or indirect observable market data (including quoted prices for similar securities, evaluations of subsequent market events, interest rates, prepayment speeds, credit risk, etc.); or
• Level 3 valuation inputs consist of significant unobservable inputs (including a fund’s own assumptions).
The level classification is based on the lowest level input that is significant to the fair valuation measurement. The valuation inputs are not an indication of the risks associated with investing in these securities or other financial instruments.
The following is a summary of the valuation inputs used to determine the fair value of the fund’s securities as of June 30, 2010. The Schedule of Investments provides additional details on the fund’s portfolio holdings.
| | | |
| | Level 1 | Level 2 | Level 3 |
| Investment Securities | | | |
| Common Stocks | $316,638,622 | — | |
| Temporary Cash Investments | 7,089 | $6,000,000 | — |
| Total Value of Investment Securities | $316,645,711 | $6,000,000 | — |
| |
| 5. Derivative Instruments | | | |
Equity Price Risk — The fund is subject to equity price risk in the normal course of pursuing its investment objectives. A fund may enter into futures contracts based on an equity index in order to manage its exposure to changes in market conditions. A fund may purchase futures contracts to gain exposure to increases in market value or sell futures contracts to protect against a decline in market value. Upon entering into a futures contract, a fund is required to deposit either cash or securities in an amount equal to a certain percentage of the contract value (initial margin). Subsequent payments (variation margin) are made or received daily, in cash, by a fund. The variation margin is equal to the daily change in the contract value and is recorded as unrealized gains and losses. A fund recognizes a realized gain or loss whe n the contract is closed or expires. Net realized and unrealized gains or losses occurring during the holding period of futures contracts are a component of net realized gain (loss) on futures contract transactions and change in net unrealized appreciation (depreciation) on futures contracts, respectively. One of the risks of entering into futures contracts is the possibility that the change in value of the contract may not correlate with the changes in value of the underlying securities. During the period, the fund infrequently purchased equity price risk derivative instruments for temporary investment purposes.
At period end, the fund did not have any equity price risk derivative instruments disclosed on the Statement of Assets and Liabilities. For the year ended June 30, 2010, the effect of equity price risk derivative instruments on the Statement of Operations was $(597,602) in net realized gain (loss) on futures contract transactions.
21
6. Interfund Lending
The fund, along with certain other funds in the American Century Investments family of funds, may participate in an interfund lending program, pursuant to an Exemptive Order issued by the Securities and Exchange Commission (SEC). This program provides an alternative credit facility allowing the fund to borrow from or lend to other funds in the American Century Investments family of funds that permit such transactions. Interfund lending transactions are subject to each fund’s investment policies and borrowing and lending limits. The interfund loan rate earned/paid on interfund lending transactions is determined daily based on the average of certain current market rates. Interfund lending transactions normally extend only overnight, but can have a maximum duration of seven days. The program is subject to annual approval by the Board of Directors. During the year ended June 30, 2010, the fund did not utilize the program.
7. Federal Tax Information
The tax character of distributions paid during the years ended June 30, 2010 and June 30, 2009 were as follows:
| | |
| | 2010 | 2009 |
| Distributions Paid From | | |
| Ordinary income | $3,438,550 | $2,756,354 |
| Long-term capital gains | — | — |
The book-basis character of distributions made during the year from net investment income or net realized gains may differ from their ultimate characterization for federal income tax purposes. These differences reflect the differing character of certain income items and net realized gains and losses for financial statement and tax purposes, and may result in reclassification among certain capital accounts on the financial statements.
As of June 30, 2010, the federal tax cost of investments and the components of distributable earnings on a tax-basis were as follows:
| | |
| Federal tax cost of investments | $330,971,236 |
| Gross tax appreciation of investments | $ 14,468,976 |
| Gross tax depreciation of investments | (22,794,501) |
| Net tax appreciation (depreciation) of investments | $ (8,325,525) |
| Undistributed ordinary income | $121,481 |
| Accumulated capital losses | $(13,163,381) |
The difference between book-basis and tax-basis cost and unrealized appreciation (depreciation) is attributable primarily to the tax deferral of losses on wash sales.
The accumulated capital losses listed above represent net capital loss carryovers that may be used to offset future realized capital gains for federal income tax purposes. Future capital loss carryover utilization in any given year may be subject to Internal Revenue Code limitations. The capital loss carryovers of $(9,087,176) and $(4,076,205) expire in 2017 and 2018, respectively.
22
8. Corporate Event
As part of a long-standing estate and business succession plan established by ACC Co-Chairman James E. Stowers, Jr., the founder of American Century Investments, ACC Co-Chairman Richard W. Brown succeeded Mr. Stowers as trustee of a trust that holds a greater-than-25% voting interest in ACC, the parent corporation of the fund’s advisor. Under the 1940 Act, this is presumed to represent control of ACC even though it is less than a majority interest. The change of trustee may technically be considered a “change of control” of ACC and therefore also a change of control of the fund’s advisor even though there has been no change to its management and none is anticipated. The “change of control” resulted in the assignment of the fund’s investment advisory agreement. Under the 1940 Act, an assignment automatically terminated such agreement, making the approval of a new agreement necessa ry.
On February 18, 2010, the Board of Directors approved an interim investment advisory agreement under which the fund will be managed until a new agreement is approved by fund shareholders. On April 1, 2010, the Board of Directors approved a new investment advisory agreement. The interim agreement and the new agreement are substantially identical to the terminated agreements (with the exception of different effective and termination dates) and will not result in changes in the management of American Century Investments, the fund, its investment objectives, fees or services provided. The new agreement for the fund was approved by shareholders at a Special Meeting of Shareholders on June 16, 2010. The new agreement went into effect on July 16, 2010.
9. Other Tax Information (Unaudited)
The following information is provided pursuant to provisions of the Internal Revenue Code.
The fund hereby designates up to the maximum amount allowable as qualified dividend income for the fiscal year ended June 30, 2010.
For corporate taxpayers, the fund hereby designates $3,438,550, or up to the maximum amount allowable, of ordinary income distributions paid during the fiscal year ended June 30, 2010 as qualified for the corporate dividends received deduction.
23
| | | | | | |
| NT Equity Growth | | | | | |
| |
| Institutional Class | | | | | |
| For a Share Outstanding Throughout the Years Ended June 30 (except as noted) | | |
| | | 2010 | 2009 | 2008 | 2007(1) | 2006(2) |
| Per-Share Data | | | | | |
| Net Asset Value, Beginning of Period | $7.06 | $9.98 | $11.53 | $10.87 | $10.00 |
| Income From Investment Operations | | | | | |
| Net Investment Income (Loss) | 0.11(3) | 0.13(3) | 0.12 | 0.06 | 0.07 |
| Net Realized and Unrealized Gain (Loss) | 0.85 | (2.89) | (1.47) | 0.65 | 0.87 |
| Total From Investment Operations | 0.96 | (2.76) | (1.35) | 0.71 | 0.94 |
| Distributions | | | | | |
| From Net Investment Income | (0.10) | (0.16) | (0.09) | (0.05) | (0.07) |
| From Net Realized Gains | — | — | (0.11) | — | — |
| Total Distributions | (0.10) | (0.16) | (0.20) | (0.05) | (0.07) |
| Net Asset Value, End of Period | $7.92 | $7.06 | $9.98 | $11.53 | $10.87 |
| |
| Total Return(4) | 13.53% | (27.73)% | (11.84)% | 6.59% | 9.47% |
| | | | | | |
| Ratios/Supplemental Data | | | | | |
| Ratio of Operating Expenses | | | | | |
| to Average Net Assets | 0.49% | 0.50% | 0.47% | 0.47%(5) | 0.47%(5) |
| Ratio of Net Investment Income (Loss) | | | | | |
| to Average Net Assets | 1.31% | 1.82% | 1.20% | 1.04%(5) | 1.20%(5) |
| Portfolio Turnover Rate | 69% | 109% | 99% | 54% | 65% |
| Net Assets, End of Period (in thousands) | $320,958 | $191,046 | $112,417 | $91,945 | $71,743 |
| (1) | January 1, 2007 through June 30, 2007. The fund’s fiscal year end was changed from December 31 to June 30, resulting in a six-month annual |
| | reporting period. | | | | | |
| (2) | May 12, 2006 (fund inception) through December 31, 2006. | | | | |
| (3) | Computed using average shares outstanding throughout the period. | | | | |
| (4) | Total return assumes reinvestment of net investment income and capital gains distributions, if any. Total returns for periods less than one year |
| | are not annualized. Total returns are calculated based on the net assets value of the last business day. | | |
| (5) | Annualized. | | | | | |
See Notes to Financial Statements.
24
|
| Report of Independent Registered Public Accounting Firm |
To the Directors of the American Century Quantitative Equity Funds, Inc.
and Shareholders of the NT Equity Growth Fund:
In our opinion, the accompanying statement of assets and liabilities, including the schedule of investments, and the related statements of operations and of changes in net assets and the financial highlights present fairly, in all material respects, the financial position of the NT Equity Growth Fund (one of the eleven funds comprising the American Century Quantitative Equity Funds, Inc., hereafter referred to as the “Fund”) at June 30, 2010, the results of its operations for the year then ended, the changes in its net assets for each of the two years in the period then ended and the financial highlights for each of the periods presented, in conformity with accounting principles generally accepted in the United States of America. These financial statements and financial highlights (hereafter referred to as “financial statements”) are the responsibility of the Fund’s management; our respons ibility is to express an opinion on these financial statements based on our audits. We conducted our audits of these financial statements in accordance with the standards of the Public Company Accounting Oversight Board (United States). Those standards require that we plan and perform the audit to obtain reasonable assurance about whether the financial statements are free of material misstatement. An audit includes examining, on a test basis, evidence supporting the amounts and disclosures in the financial statements, assessing the accounting principles used and significant estimates made by management, and evaluating the overall financial statement presentation. We believe that our audits, which included confirmation of securities at June 30, 2010 by correspondence with the custodian and brokers, provide a reasonable basis for our opinion.
PricewaterhouseCoopers LLP
Kansas City, Missouri
August 19, 2010
25
A special meeting of shareholders was held on June 16, 2010, to vote on the following proposals. Each proposal received the required number of votes and was adopted. A summary of voting results is listed below each proposal.
Proposal 1:
To elect one Director to the Board of Directors of American Century Quantitative Equity Funds, Inc. (the proposal was voted on by all shareholders of funds issued by American Century Quantitative Equity Funds, Inc.):
| | |
| Frederick L.A. Grauer | For: | 4,067,909,978 |
| | Withhold: | 174,470,448 |
| | Abstain: | 0 |
| | Broker Non-Vote: | 0 |
The other directors whose term of office continued after the meeting include Jonathan S. Thomas, John Freidenrich, Ronald J. Gilson, Peter F. Pervere, Myron S. Scholes, and John B. Shoven.
Proposal 2:
To approve a management agreement between the fund and American Century Investment Management, Inc.:
| | |
| Institutional Class | For: | 312,772,256 |
| | Against: | 6,194,410 |
| | Abstain: | 1,759,137 |
| | Broker Non-Vote: | 0 |
26
The Board of Directors
The individuals listed below serve as directors of the fund. Each director will continue to serve in this capacity until death, retirement, resignation or removal from office. The mandatory retirement age for directors who are not “interested persons,” as that term is defined in the Investment Company Act (independent directors), is 73. However, the mandatory retirement age may be extended for a period not to exceed two years with the approval of the remaining independent directors.
Mr. Thomas is the only director who is an “interested person” because he currently serves as President and Chief Executive Officer of American Century Companies, Inc. (ACC), the parent company of American Century Investment Management, Inc. (ACIM or the advisor).
The other directors (more than three-fourths of the total number) are independent; that is, they have never been employees, directors or officers of, and have no financial interest in, ACC or any of its wholly owned, direct or indirect, subsidiaries, including ACIM, American Century Investment Services, Inc. (ACIS) and American Century Services, LLC (ACS). The directors serve in this capacity for eight (in the case of Mr. Thomas, 15) registered investment companies in the American Century Investments family of funds.
The following presents additional information about the directors. The mailing address for each director other than Mr. Thomas is 1665 Charleston Road, Mountain View, California 94043. The mailing address for Mr. Thomas is 4500 Main Street, Kansas City, Missouri 64111.
Independent Directors
John Freidenrich
Year of Birth: 1937
Position(s) with the Fund: Director
Length of Time Served: Since 2005
Principal Occupation(s) During the Past Five Years: Founder, Member and Manager, Regis
Management Company, LLC (investment management firm) (April 2004 to present)
Number of Funds in Fund Complex Overseen by Director: 41
Other Directorships Held by Director During the Past Five Years: None
Education/Other Professional Experience: AB in Economics, Stanford University; LLB,
Stanford Law School; formerly, Partner and Founder, Ware and Freidenrich Law
Firm and Bay Partners; formerly, President, Board of Trustees, Stanford University
Ronald J. Gilson
Year of Birth: 1946
Position(s) with the Fund: Director and Chairman of the Board
Length of Time Served: Since 1995
Principal Occupation(s) During the Past Five Years: Charles J. Meyers Professor of Law and
Business, Stanford Law School (1979 to present); Marc and Eva Stern Professor of
Law and Business, Columbia University School of Law (1992 to present)
Number of Funds in Fund Complex Overseen by Director: 41
Other Directorships Held by Director During the Past Five Years: None
Education/Other Professional Experience: BA, Washington University; JD, Yale Law School;
formerly, Attorney, Steinhart, Goldberg, Feigenbaum & Ladar
27
Frederick L. A. Grauer
Year of Birth: 1946
Position(s) with the Fund: Director
Length of Time Served: Since 2008
Principal Occupation(s) During the Past Five Years: Senior Advisor, BlackRock, Inc. (investment
management firm) (2010 to present); Senior Advisor, Barclays Global Investors
(investment management firm) (2003 to 2009)
Number of Funds in Fund Complex Overseen by Director: 41
Other Directorships Held by Director During the Past Five Years: None
Education/Other Professional Experience: BA in Economics, University of British Columbia;
MA in Economics, University of Chicago; PhD in Business, Stanford University;
formerly, Executive Chairman, Barclays Global Investors; Chairman and Chief
Executive Officer, Wells Fargo Nikko Investment Advisors; and Vice President,
Merrill Lynch Capital Markets Group; formerly, Director, New York Stock Exchange,
Chicago Mercantile Exchange and Columbia University; formerly, Faculty Member,
Graduate School of Business, Columbia University and Alfred P. Sloan School of
Management, Massachusetts Institute of Technology
Peter F. Pervere
Year of Birth: 1947
Position(s) with the Fund: Director
Length of Time Served: Since 2007
Principal Occupation(s) During the Past Five Years: Retired
Number of Funds in Fund Complex Overseen by Director: 41
Other Directorships Held by Director During the Past Five Years: Intraware, Inc. (2003 to 2009);
Digital Impact, Inc. (2003 to 2005)
Education/Other Professional Experience: BA in History, Stanford University; CPA; formerly,
Vice President and Chief Financial Officer, Commerce One, Inc. (software and
services provider); formerly, Vice President and Corporate Controller, Sybase, Inc.;
formerly with accounting firm of Arthur Young & Co.
Myron S. Scholes
Year of Birth: 1941
Position(s) with the Fund: Director
Length of Time Served: Since 1980
Principal Occupation(s) During the Past Five Years: Chairman, Platinum Grove Asset
Management, L.P. (asset manager) (1999 to 2009); Frank E. Buck Professor of
Finance-Emeritus, Stanford Graduate School of Business (1996 to present)
Number of Funds in Fund Complex Overseen by Director: 41
Other Directorships Held by Director During the Past Five Years: Dimensional Fund Advisors
(investment advisor); CME Group, Inc. (futures and options exchange)
Education/Other Professional Experience: BA in Economics, McMaster University (Ontario);
MBA and PhD, University of Chicago; formerly, Senior Research Fellow at the
Hoover Institute; formerly, Edward Eagle Brown Professor of Finance, University of
Chicago; recipient of the Alfred Nobel Memorial Prize in Economic Sciences
28
John B. Shoven
Year of Birth: 1947
Position(s) with the Fund: Director
Length of Time Served: Since 2002
Principal Occupation(s) During the Past Five Years: Professor of Economics, Stanford University
(1973 to present)
Number of Funds in Fund Complex Overseen by Director: 41
Other Directorships Held by Director During the Past Five Years: Cadence Design Systems;
Exponent; Financial Engines; PalmSource, Inc. (2002 to 2005); Watson Wyatt
Worldwide (2002 to 2006)
Education/Other Professional Experience: BA in Physics, University of California; PhD in
Economics, Yale University; Director of the Stanford Institute for Economic Policy
Research (1999 to present); formerly, Chair of Economics and Dean of Humanities
and Sciences, Stanford University
Interested Director
Jonathan S. Thomas
Year of Birth: 1963
Position(s) with the Fund: Director and President
Length of Time Served: Since 2007
Principal Occupation(s) During the Past Five Years: President and Chief Executive Officer,
ACC (March 2007 to present); Chief Administrative Officer, ACC (February 2006 to
February 2007); Executive Vice President, ACC (November 2005 to February 2007);
Global Chief Operating Officer and Managing Director, Morgan Stanley (investment
management) (March 2000 to November 2005). Also serves as: Chief Executive
Officer and Manager, ACS; Executive Vice President, ACIM; Director, ACC, ACIM
and other ACC subsidiaries
Number of Funds in Fund Complex Overseen by Director: 104
Other Directorships Held by Director During the Past Five Years: None
Education/Other Professional Experience: BA in Economics, University of Massachusetts;
MBA, Boston College; formerly held senior leadership roles with Fidelity
Investments, Boston Financial Services and Bank of America; serves on the Board of
Governors of the Investment Company Institute
29
Officers
The following table presents certain information about the executive officers of the fund. Each officer serves as an officer for each of the 15 investment companies in the American Century family of funds, unless otherwise noted. No officer is compensated for his or her service as an officer of the fund. The listed officers are interested persons of the fund and are appointed or re-appointed on an annual basis. The mailing address for each of the officers listed below is 4500 Main Street, Kansas City, Missouri 64111.
| | |
| Name | Offices with | |
| (Year of Birth) | the Fund | Principal Occupation(s) During the Past Five Years |
| Jonathan S. | Director and | President and Chief Executive Officer, ACC (March 2007 to present); Chief |
| Thomas | President | Administrative Officer, ACC (February 2006 to February 2007); Executive Vice |
| (1963) | since 2007 | President, ACC (November 2005 to February 2007); Global Chief Operating |
| | | Officer and Managing Director, Morgan Stanley (March 2000 to November |
| | | 2005). Also serves as: Chief Executive Officer and Manager, ACS; Executive |
| | | Vice President, ACIM; Director, ACC, ACIM and other ACC subsidiaries |
| Barry Fink | Executive Vice | Chief Operating Officer and Executive Vice President, ACC (September 2007 |
| (1955) | President | to present); President, ACS (October 2007 to present); Managing Director, |
| | since 2007 | Morgan Stanley (2000 to 2007); Global General Counsel, Morgan Stanley |
| | | (2000 to 2006). Also serves as: Manager, ACS, and Director, ACC and |
| | | certain ACC subsidiaries |
| Maryanne L. | Chief Compliance | Chief Compliance Officer, American Century funds, ACIM and ACS (August |
| Roepke | Officer since 2006 | 2006 to present); Assistant Treasurer, ACC (January 1995 to August 2006); |
| (1956) | and Senior Vice | and Treasurer and Chief Financial Officer, various American Century funds |
| | President | (July 2000 to August 2006). Also serves as: Senior Vice President, ACS |
| | since 2000 | |
| Charles A. | General Counsel | Attorney, ACC (February 1994 to present); Vice President, ACC (November |
| Etherington | since 2007 and | 2005 to present); General Counsel, ACC (March 2007 to present); Also |
| (1957) | Senior Vice | serves as General Counsel, ACIM, ACS, ACIS and other ACC subsidiaries; |
| | President | and Senior Vice President, ACIM and ACS |
| | since 2006 | |
| Robert J. Leach | Vice President, | Vice President, ACS (February 2000 to present); and Controller, various |
| (1966) | Treasurer and | American Century funds (1997 to September 2006) |
| | Chief Financial | |
| | Officer since 2006 | |
| David H. Reinmiller | Vice President | Attorney, ACC (January 1994 to present); Associate General Counsel, ACC |
| (1963) | since 2001 | (January 2001 to present); Chief Compliance Officer, American Century |
| | | funds and ACIM (January 2001 to February 2005). Also serves as: Vice |
| | | President, ACIM and ACS |
| Ward D. Stauffer | Secretary | Attorney, ACC (June 2003 to Present) |
| (1960) | since 2005 | |
The SAI has additional information about the fund’s directors and is available without charge, upon request, by calling 1-800-345-2021.
30
|
| Board Approval of Management Agreements |
American Century Investment Management, Inc. (“ACIM” or the “Advisor”) currently serves as investment advisor to the Fund under a management agreement (the “Current Management Agreement”) that took effect on July 16, 2010, following approval by the Fund’s Board of Directors (the “Board”) and shareholders. The Advisor previously served as investment advisor to the Fund pursuant to a prior management agreement (the “Prior Management Agreement”) and an interim management agreement (the “Interim Management Agreeement”). The Interim Management Agreement terminated in accordance with its terms on July 16, 2010, upon the effectiveness of the Current Management Agreement. The Prior Management Agreement terminated on February 16, 2010, as a result of a change of control of the Advisor’s parent company, American Century Companies, Inc. (“ACC”). The change in control occurred as the result of a change in the trustee of a trust created by James E. Stowers, Jr., the founder of American Century Investments that holds shares representing a significant interest in ACC stock. Mr. Stowers previously served as the trustee of the trust. On February 16, 2010, Richard W. Brown, Co-Chairman of ACC with Mr. Stowers, became the trustee in accordance with the terms of the trust and Mr. Stowers’ long-standing estate and succession plan.
On February 18, 2010, the Board approved the Interim Management Agreement in accordance with Rule 15a-4 under the Investment Company Act to ensure continued management of the Fund by the Advisor after the termination of the Prior Management Agreement and until shareholder approval of the Current Management Agreement as required under the Act. The Board approved the Current Management Agreement and recommended its approval to shareholders. Fund shareholders approved the Current Management Agreement at a meeting held on June 16, 2010.
The Interim Management Agreement and the Current Management Agreement are substantially identical to the Prior Management Agreement except for their effective dates and the termination provisions of the Interim Management Agreement. Under the Interim and Current Management Agreements, the Advisor will provide the same services to the Fund and receive the same compensation rate as under the Prior Management Agreement.
Basis for Board Approval of Interim Management Agreement
In considering the approval of the Interim Management Agreement, Rule 15a-4 requires the Board to approve the contract within ten business days of the termination of the prior agreement and to determine that the compensation to be received under the interim agreement is no greater than would have been received under the prior agreement. In connection with the approval, the Board noted that it oversees on a continuous basis and evaluates at its quarterly meetings, directly and through the committees of the Board, the nature and quality of significant services provided by the Advisor, the investment performance of the Fund, shareholder services, audit and compliance functions and a variety of other matters relating to the Fund’s operations.
31
In evaluating the Interim Management Agreement, the Board, assisted by the advice of its independent legal counsel, considered a number of factors in addition to those required by the rule with no one factor being determinative to its analysis. Among the factors considered by the Board were the circumstances and effect of the change of control, the fact that the Advisor will provide the same services and receive the same compensation rate as under the Prior Management Agreement, and that the change of control did not result in a change of the personnel managing the Fund. Upon completion of its analysis, the Board approved the Interim Management Agreement, determining that the continued management of the Fund by the Advisor was in the best interests of the Fund and Fund shareholders.
Basis for Board Approval of Current Management Agreement
At a meeting held on April 1, 2010, after considering all information presented, the Board approved, and determined to recommend that shareholders approve, the Current Management Agreement. In connection with that approval, the Board requested and reviewed extensive data and information compiled by the Advisor and certain independent providers of evaluation data concerning the Fund and services provided to the Fund by the Advisor. The Board oversees on a continuous basis and evaluates at its quarterly meetings, directly and through the committees of the Board, the nature and quality of significant services provided by the Advisor, the investment performance of the Fund, shareholder services, audit and compliance functions and a variety of other matters relating to the Fund’s operations. The information considered and the discussions held at the meetings included, but were not limited to:
• the nature, extent and quality of investment management, shareholder services and other services provided to the Fund;
• the wide range of programs and services the Advisor provides to the Fund and its shareholders on a routine and non-routine basis;
• the compliance policies, procedures, and regulatory experience of the Advisor;
• data comparing the cost of owning the Fund to the cost of owning similar funds;
• the fact that there will be no changes to the fees, services, or personnel who provide such services as compared to the Prior Management Agreement;
• data comparing the Fund’s performance to appropriate benchmarks and/or a peer group of other mutual funds with similar investment objectives and strategies;
• financial data showing the profitability of the Fund to the Advisor and the overall profitability of the Advisor;
• data comparing services provided and charges to the Fund with those for other non-fund investment management clients of the Advisor; and
32
• consideration of collateral or “fall-out” benefits derived by the Advisor from the management of the Fund and potential sharing of economies of scale in connection with the management of the Fund.
The Board also considered whether there was any reason for not continuing the existing arrangement with the Advisor. In particular, the Board recognized that shareholders may have invested in the Fund on the strength of the Advisor’s industry standing and reputation and in the expectation that the Advisor will have a continuing role in providing advisory services to the Fund.
The Board considered all of the information provided by the Advisor, the independent data providers, and the Board’s independent legal counsel, and evaluated such information for the Fund. The Board did not identify any single factor as being all-important or controlling, and each Board member may have attributed different levels of importance to different factors. In deciding to approve the Current Management Agreement under the terms ultimately determined by the Board to be appropriate, the Board based its decision on a number of factors, including the following:
Nature, Extent and Quality of Services — Generally. Under the Current Management Agreement, the Advisor is responsible for providing or arranging for all services necessary for the operation of the Fund. The Board noted that under the Current Management Agreement, the Advisor provides or arranges at its own expense a wide variety of services including:
• constructing and designing the Fund
• portfolio research and security selection
• initial capitalization/funding
• securities trading
• Fund administration
• custody of Fund assets
• daily valuation of the Fund’s portfolio
• shareholder servicing and transfer agency, including shareholder
confirmations, recordkeeping and communications
• legal services
• regulatory and portfolio compliance
• financial reporting
• marketing and distribution
33
The Board noted that many of these services have expanded over time both in terms of quantity and complexity in response to shareholder demands, competition in the industry, changing distribution channels and the changing regulatory environment.
Investment Management Services. The investment management services provided to the Fund are complex and provide Fund shareholders access to professional money management, instant diversification of their investments within an asset class, the opportunity to easily diversify among asset classes, and liquidity. As a part of its general oversight and in evaluating investment performance, the Board expects the Advisor to manage the Fund in accordance with its investment objectives and approved strategies. In providing these services, the Advisor utilizes teams of investment professionals who require extensive information technology, research, training, compliance and other systems to conduct their business. The Board, directly and through its Portfolio Committee, regularly reviews investment performance information for the Fund, t ogether with comparative information for appropriate benchmarks and/or peer groups of similarly-managed funds, over different time horizons. If performance concerns are identified, the underperforming Fund receives special reviews until performance improves, during which time the Board discusses with the Advisor the reasons for such underperformance and any efforts being undertaken to improve performance.
Shareholder and Other Services. Under the Current Management Agreement, the Advisor will also provide the Fund with a comprehensive package of transfer agency, shareholder, and other services. The Board, directly and through the various committees of the Board, regularly reviews reports and evaluations of such services. These reports include, but are not limited to, information regarding the operational efficiency and accuracy of the shareholder and transfer agency services provided, staffing levels, shareholder satisfaction (as measured by external as well as internal sources), technology support, new products and services offered to Fund shareholders, securities trading activities, portfolio valuation services, auditing services, and legal and operational compliance activities. Certain aspects of shareholder and transfer age ncy service level efficiency and the quality of securities trading activities are measured by independent third party providers and are presented in comparison to other fund groups not managed by the Advisor.
Costs of Services Provided and Profitability. The Advisor provided detailed information concerning its cost of providing various services to the Fund, its profitability in managing the Fund, its overall profitability, and its financial condition. The Board reviewed with the Advisor the methodology used to prepare this financial information. The Board has also reviewed with the Advisor its methodology for compensating the investment professionals that provide services to the Fund as well as compensation to the five highest paid personnel of the Advisor. This financial information regarding the Advisor is considered in order to evaluate the Advisor’s financial condition, its ability to continue to provide services under the Current Management Agreement, and the reasonableness of the current management fees.
34
Ethics. The Board generally considers the Advisor’s commitment to providing quality services to shareholders and to conducting its business ethically. It noted that the Advisor’s practices generally meet or exceed industry best practices.
Economies of Scale. The Board also reviewed information provided by the Advisor regarding the possible existence of economies of scale in connection with the management of the Fund. The Board concluded that economies of scale are difficult to measure and predict with precision, especially on a fund-by-fund basis. The analysis of economies of scale is further complicated by the additional services and content provided by the Advisor and its reinvestment in its ability to provide and expand those services. Accordingly, the Board seeks to evaluate economies of scale by reviewing information, such as year-over-year profitability of the Advisor generally, the profitability of its management of the Fund specifically, and the expenses incurred by the Advisor in providing various functions to the Fund. The Board believes the Advisor i s appropriately sharing economies of scale through its competitive fee structure, offering competitive fees from fund inception, fee breakpoints as the fund complex and the Fund increases in size, and through reinvestment in its business to provide shareholders additional services and enhancements to existing services. In particular, separate breakpoint schedules based on the size of the entire fund complex and on the size of the Fund reflect the complexity of assessing economies of scale.
Comparison to Fees of Funds not Managed by the Advisor. Both the Prior and Current Management Agreements provide that the Fund pays the Advisor a single, all-inclusive (or unified) management fee for providing all services necessary for the management and operation of the Fund, other than brokerage expenses, taxes, interest, extraordinary expenses, and the fees and expenses of the Fund’s Independent Directors (including their independent legal counsel) and expenses incurred in connection with the provision of shareholder services and distribution services under a plan adopted pursuant to Rule 12b-1 under the 1940 Act. Under the unified fee structure, the Advisor is responsible for providing all investment advisory, custody, audit, administrative, compliance, recordkeeping, marketing and shareholder services, or arranging and supervising third parties that provide such services. By contrast, most other funds are charged a variety of fees, including an investment advisory fee, a transfer agency fee, an administrative fee, distribution charges and other expenses. Other than their investment advisory fees and any applicable Rule 12b-1 distribution fees, the components of the total fees charged by these other funds may be increased without shareholder approval. The Board believes the unified fee structure is a benefit to Fund shareholders because it clearly discloses to shareholders the cost of owning Fund shares, and, since the unified fee cannot be increased without a vote of Fund shareholders, it shifts to the Advisor the risk of increased costs of operating the Fund and provides a direct incentive to minimize administrative inefficiencies. Part of the Board’s analysis of fee levels involves reviewing certain evaluative data compiled by an independent provider comparing the Fund’s unified fee to
35
the total expense ratios of similar funds not managed by the Advisor. The Board concluded that the management fee to be paid by the Fund to the Advisor under the Current Management Agreement is reasonable in light of the services to be provided to the Fund.
Comparison to Fees and Services Provided to Other Clients of the Advisor. The Board also requested and received information from the Advisor concerning the nature and extent of the services, fees, and profitability of its advisory services to advisory clients other than the Fund. They observed that these varying types of client accounts require different services and involve different regulatory and entrepreneurial risks than the management of the Fund. The Board analyzed this information and concluded that the fees charged and services provided to the Fund were reasonable by comparison.
Collateral or “Fall-Out” Benefits Derived by the Advisor. The Board considered the existence of collateral benefits the Advisor may receive as a result of its relationship with the Fund. The Board concluded that the Advisor’s primary business is managing mutual funds and it generally does not use Fund or shareholder information to generate profits in other lines of business, and therefore does not derive any significant collateral benefits from them. The Board noted that the Advisor receives proprietary research from broker-dealers that execute Fund portfolio transactions and concluded that this research is likely to benefit Fund shareholders. The Board also determined that the Advisor is able to provide investment management services to certain clients other than the Fund, at least in part, due to its existing infrastructure built to serve the fund complex. The Board concluded, however, that the assets of those other clients are not material to the analysis and, in any event, are included with the assets of the Fund to determine breakpoints in the Fund’s fee schedule, provided they are managed using the same investment team and strategy.
Conclusion of the Board. As a result of this process, the Board, in the absence of particular circumstances and assisted by the advice of its independent legal counsel, taking into account all of the factors discussed above and the information provided by the Advisor and others, concluded that the Current Management Agreement be approved and recommended its approval to Fund shareholders.
36
Retirement Account Information
As required by law, distributions you receive from certain IRAs, or 403(b), 457 and qualified plans are subject to federal income tax withholding, unless you elect not to have withholding apply. Tax will be withheld on the total amount withdrawn even though you may be receiving amounts that are not subject to withholding, such as nondeductible contributions. In such case, excess amounts of withholding could occur. You may adjust your withholding election so that a greater or lesser amount will be withheld.
If you don’t want us to withhold on this amount, you must notify us to not withhold the federal income tax. You may notify us in writing or in certain situations by telephone or through other electronic means. You have the right to revoke your withholding election at any time and any election you make may remain in effect until revoked by filing a new election.
Remember, even if you elect not to have income tax withheld, you are liable for paying income tax on the taxable portion of your withdrawal. If you elect not to have income tax withheld or you don’t have enough income tax withheld, you may be responsible for payment of estimated tax. You may incur penalties under the estimated tax rules if your withholding and estimated tax payments are not sufficient. You can reduce or defer the income tax on a distribution by directly or indirectly rolling such distribution over to another IRA or eligible plan. You should consult your tax advisor for additional information.
State tax will be withheld if, at the time of your distribution, your address is within one of the mandatory withholding states and you have federal income tax withheld. State taxes will be withheld from your distribution in accordance with the respective state rules.
Proxy Voting Guidelines
American Century Investment Management, Inc., the fund’s investment advisor, is responsible for exercising the voting rights associated with the securities purchased and/or held by the fund. A description of the policies and procedures the advisor uses in fulfilling this responsibility is available without charge, upon request, by calling 1-800-345-2021. It is also available on American Century Investments’ website at americancentury.com and on the Securities and Exchange Commission’s website at sec.gov. Information regarding how the investment advisor voted proxies relating to portfolio securities during the most recent 12-month period ended June 30 is available on the “About Us” page at americancentury.com. It is also available at sec.gov.
Quarterly Portfolio Disclosure
The fund files its complete schedule of portfolio holdings with the Securities and Exchange Commission (SEC) for the first and third quarters of each fiscal year on Form N-Q. The fund’s Forms N-Q are available on the SEC’s website at sec.gov, and may be reviewed and copied at the SEC’s Public Reference Room in Washington, DC. Information on the operation of the Public Reference Room may be obtained by calling 1-800-SEC-0330. The fund also makes its complete schedule of portfolio holdings for the most recent quarter of its fiscal year available on its website at americancentury.com and, upon request, by calling 1-800-345-2021.
37
The following indices are used to illustrate investment market, sector, or style performance or to serve as fund performance comparisons. They are not investment products available for purchase.
The Russell 1000® Index is a market-capitalization weighted, large-cap index created by Frank Russell Company to measure the performance of the 1,000 largest publicly traded U.S. companies, based on total market capitalization.
The Russell 1000® Growth Index measures the performance of those Russell 1000 Index companies (the 1,000 largest publicly traded U.S. companies, based on total market capitalization) with higher price-to-book ratios and higher forecasted growth values.
The Russell 1000® Value Index measures the performance of those Russell 1000 Index companies (the 1,000 largest publicly traded U.S. companies, based on total market capitalization) with lower price-to-book ratios and lower forecasted growth values.
The Russell 2000® Index is a market-capitalization weighted index created by Frank Russell Company to measure the performance of the 2,000 smallest of the 3,000 largest publicly traded U.S. companies, based on total market capitalization.
The Russell 2000® Growth Index measures the performance of those Russell 2000 Index companies (the 2,000 smallest of the 3,000 largest publicly traded U.S. companies, based on total market capitalization) with higher price-to-book ratios and higher forecasted growth values.
The Russell 2000® Value Index measures the performance of those Russell 2000 Index companies (the 2,000 smallest of the 3,000 largest publicly traded U.S. companies, based on total market capitalization) with lower price-to-book ratios and lower forecasted growth values.
The Russell Midcap® Index measures the performance of the 800 smallest of the 1,000 largest publicly traded U.S. companies, based on total market capitalization.
The Russell Midcap® Growth Index measures the performance of those Russell Midcap Index companies (the 800 smallest of the 1,000 largest publicly traded U.S. companies, based on total market capitalization) with higher price-to-book ratios and higher forecasted growth values.
The Russell Midcap® Value Index measures the performance of those Russell Midcap Index companies (the 800 smallest of the 1,000 largest publicly traded U.S. companies, based on total market capitalization) with lower price-to-book ratios and lower forecasted growth values.
The S&P 500 Index is a market value-weighted index of the stocks of 500 publicly traded U.S. companies chosen for market size, liquidity, and industry group representation that are considered to be leading firms in dominant industries. Each stock’s weight in the index is proportionate to its market value. Created by Standard & Poor’s, it is considered to be a broad measure of U.S. stock market performance.
38
39
40

| |
| |
| Contact Us | |
| americancentury.com | |
| Automated Information Line | 1-800-345-8765 |
| Investor Services Representative | 1-800-345-2021 or |
| | 816-531-5575 |
| Investors Using Advisors | 1-800-378-9878 |
| Business, Not-For-Profit, Employer-Sponsored | |
| Retirement Plans | 1-800-345-3533 |
| Banks and Trust Companies, Broker-Dealers, | |
| Financial Professionals, Insurance Companies | 1-800-345-6488 |
| Telecommunications Device for the Deaf | 1-800-634-4113 |
| American Century Quantitative Equity Funds, Inc. | |
| Investment Advisor: | |
| American Century Investment Management, Inc. | |
| Kansas City, Missouri | |
This report and the statements it contains are submitted for the general
information of our shareholders. The report is not authorized for distribution to
prospective investors unless preceded or accompanied by an effective prospectus.
American Century Investment Services, Inc., Distributor
©2010 American Century Proprietary Holdings, Inc. All rights reserved.
1008
CL-ANN-69055
|
| Annual Report |
| June 30, 2010 |

|
| American Century Investments® |
International Core Equity Fund
| |
| President’s Letter | 2 |
| Market Perspective | 3 |
| Foreign Stock Index Returns | 3 |
| |
| International Core Equity | |
| |
| Performance | 4 |
| Portfolio Commentary | 6 |
| Top Ten Holdings | 8 |
| Investments by Country | 8 |
| Types of Investments in Portfolio | 8 |
| |
| Shareholder Fee Example | 9 |
| |
| Financial Statements | |
| |
| Schedule of Investments | 11 |
| Statement of Assets and Liabilities | 15 |
| Statement of Operations | 16 |
| Statement of Changes in Net Assets | 17 |
| Notes to Financial Statements | 18 |
| Financial Highlights | 25 |
| Report of Independent Registered Public Accounting Firm | 31 |
| |
| Other Information | |
| |
| Proxy Voting Results | 32 |
| Management | 33 |
| Board Approval of Management Agreements | 37 |
| Additional Information | 43 |
| Index Definitions | 44 |
Any opinions expressed in this report reflect those of the author as of the date of the report, and do not necessarily represent the opinions of American Century Investments or any other person in the American Century Investments organization. Any such opinions are subject to change at any time based upon market or other conditions and American Century Investments disclaims any responsibility to update such opinions. These opinions may not be relied upon as investment advice and, because investment decisions made by American Century Investments funds are based on numerous factors, may not be relied upon as an indication of trading intent on behalf of any American Century Investments fund. Security examples are used for representational purposes only and are not intended as recommendations to purchase or sell securities. Performance information for comparative indices and securities is provided to American Century Investments by third party vendors. To the best of American Century Investments’ knowledge, such information is accurate at the time of printing.

Dear Investor:
To learn more about the capital markets, your investment, and the portfolio management strategies American Century Investments provides, we encourage you to review this shareholder report for the financial reporting period ended June 30, 2010.
On the following pages, you will find investment performance and portfolio information, presented with the expert perspective and commentary of our portfolio management team. This report remains one of our most important vehicles for conveying the information you need about your investment performance, and about the market factors and strategies that affect fund returns. For additional information on the markets, we encourage you to visit the “Insights & News” tab at our Web site, americancentury.com, for updates and further expert commentary.
The top of our Web site’s home page also provides a link to “Our Story,” which, first and foremost, outlines our commitment—since 1958—to helping clients reach their financial goals. We believe strongly that we will only be successful when our clients are successful. That’s who we are.
Another important, unique facet of our story and who we are is “Profits with a Purpose,” which describes our bond with the Stowers Institute for Medical Research (SIMR). SIMR is a world-class biomedical organization—founded by our company founder James E. Stowers, Jr. and his wife Virginia—that is dedicated to researching the causes, treatment, and prevention of gene-based diseases, including cancer. Through American Century Investments’ private ownership structure, more than 40% of our profits support SIMR.
Mr. Stowers’ example of achieving financial success and using that platform to help humanity motivates our entire American Century Investments team. His story inspires us to help each of our clients achieve success. Thank you for sharing your financial journey with us.
Sincerely,

Jonathan Thomas
President and Chief Executive Officer
American Century Investments
2

By Scott Wittman, Chief Investment Officer, Quantitative Equity and Asset Allocation
Foreign Stocks Advanced as Global Economy Improved
International stocks gained ground for the 12 months ended June 30, 2010, thanks largely to improving economic conditions worldwide. As the period began, the global economy was starting to show early signs of recovery following a severe downturn in late 2008 and early 2009. Led by economic progress in the U.S., the major economies in Europe and Asia delivered positive economic growth in the second half of 2009 as stimulus programs enacted by governments around the world began to bear fruit. Commodity-driven economies, such as those in Australia and Norway, enjoyed the most resilient recoveries.
Optimism about a burgeoning global economic recovery, along with improving profitability at many public companies, led to a solid rally in stock markets worldwide during the last half of 2009 and early 2010. The MSCI EAFE Index, a broad measure of international stock performance, advanced by more than 23% from the beginning of the period through April 30, 2010.
Fiscal Stress in Europe Led to Late Decline
Market conditions changed abruptly in the last two months of the period as a sovereign debt crisis in Greece spread to other countries in Europe with sizable fiscal deficits. The mounting debt issues raised questions about the sustainability of the global economic recovery, and these concerns led to a sharp reversal in equity markets around the world in May and June. Although European bourses led the broad decline, few markets were spared from the sell-off.
Although international stocks lost significant ground late in the period, the MSCI EAFE Index posted a positive return overall for the 12 months (see the table below). Emerging markets were the top performers, gaining more than 20% as a group as these countries were less impacted by the debt turmoil. Among developed markets, countries along the Pacific Rim produced the best returns, with the significant exception of Japan, which ended the period little changed. European markets generally performed in line with the index, though they were hardest hit during the late-period decline.
| | | | |
| Foreign Stock Index Returns | | | | |
| For the 12 months ended June 30, 2010 | | | | |
| MSCI EAFE Index | 5.92% | | MSCI World Free Index | 10.20% |
| MSCI EAFE Growth Index | 8.59% | | MSCI EM Index | 23.15% |
| MSCI EAFE Value Index | 3.21% | | MSCI Pacific Free ex-Japan Index | 18.43% |
| | | | MSCI Europe Index | 5.70% |
| | | | MSCI Japan Index | 0.76% |
3
| | | | |
| International Core Equity | | | |
| |
| Total Returns as of June 30, 2010 | | | |
| | | | Average | |
| | | | Annual Returns | |
| | Ticker Symbol | 1 year | Since Inception | Inception Date |
| Investor Class | ACIMX | 4.68% | -10.27% | 11/30/06 |
| MSCI EAFE Index | — | 5.92% | -7.98% | — |
| Institutional Class | ACIUX | 4.88% | -10.08% | 11/30/06 |
| A Class | ACIQX | | | 11/30/06 |
| No sales charge* | | 4.42% | -10.50% | |
| With sales charge* | | -1.53% | -11.96% | |
| B Class | ACIJX | | | 11/30/06 |
| No sales charge* | | 3.64% | -11.13% | |
| With sales charge* | | -0.36% | -12.29% | |
| C Class | ACIKX | 3.64% | -11.13% | 11/30/06 |
| R Class | ACIRX | 4.16% | -10.72% | 11/30/06 |
| *Sales charges include initial sales charges and contingent deferred sales charges (CDSCs), as applicable. A Class shares have a 5.75% |
| maximum initial sales charge for equity funds and may be subject to a maximum CDSC of 1.00%. B Class shares redeemed within |
| six years of purchase are subject to a CDSC that declines from 5.00% during the first year after purchase to 0.00% the sixth year |
| after purchase. C Class shares redeemed within 12 months of purchase are subject to a maximum CDSC of 1.00%. The SEC requires |
| that mutual funds provide performance information net of maximum sales charges in all cases where charges could be applied. |
Data presented reflect past performance. Past performance is no guarantee of future results. Current performance may be higher or lower than the performance shown. Investment return and principal value will fluctuate, and redemption value may be more or less than original cost. To obtain performance data current to the most recent month end, please call 1-800-345-2021 or visit americancentury.com. International investing involves special risks, such as political instability and currency fluctuations. Investing in emerging markets may accentuate these risks.
Unless otherwise indicated, performance reflects Investor Class shares; performance for other share classes will vary due to differences in fee structure. For information about other share classes available, please consult the prospectus. Data assumes reinvestment of dividends and capital gains, and none of the charts reflect the deduction of taxes that a shareholder would pay on fund distributions or the redemption of fund shares. Returns for the index are provided for comparison. The fund’s total returns include operating expenses (such as transaction costs and management fees) that reduce returns, while the total returns of the index do not.
4
International Core Equity
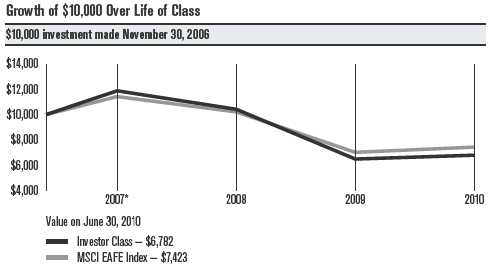
| | | | | |
| *From 11/30/06, the Investor Class’s inception date. Not annualized. | | | |
| |
| Total Annual Fund Operating Expenses | | | |
| | Institutional | | | | |
| Investor Class | Class | A Class | B Class | C Class | R Class |
| 1.18% | 0.98% | 1.43% | 2.18% | 2.18% | 1.68% |
The total annual fund operating expenses shown is as stated in the fund’s prospectus current as of the date of this report. The prospectus may vary from the expense ratio shown elsewhere in this report because it is based on a different time period, includes acquired fund fees and expenses, and, if applicable, does not include fee waivers or expense reimbursements.
Data presented reflect past performance. Past performance is no guarantee of future results. Current performance may be higher or lower than the performance shown. Investment return and principal value will fluctuate, and redemption value may be more or less than original cost. To obtain performance data current to the most recent month end, please call 1-800-345-2021 or visit americancentury.com. International investing involves special risks, such as political instability and currency fluctuations. Investing in emerging markets may accentuate these risks.
Unless otherwise indicated, performance reflects Investor Class shares; performance for other share classes will vary due to differences in fee structure. For information about other share classes available, please consult the prospectus. Data assumes reinvestment of dividends and capital gains, and none of the charts reflect the deduction of taxes that a shareholder would pay on fund distributions or the redemption of fund shares. Returns for the index are provided for comparison. The fund’s total returns include operating expenses (such as transaction costs and management fees) that reduce returns, while the total returns of the index do not.
5
International Core Equity
Portfolio Manager: Zili Zhang
On March 31, 2010, International Core Equity portfolio manager John Schniedwind, who was also chief investment officer for quantitative equity, retired from American Century Investments after 27 years with the firm. Zili Zhang remains as portfolio manager of International Core Equity and will be joined by co-managers Armando Lacayo and Elizabeth Xie, effective August 9, 2010.
Performance Summary
International Core Equity returned 4.68%* for the 12 months ended June 30, 2010, compared with the 5.92% return of the fund’s benchmark, the MSCI EAFE Index.
The positive performance for International Core Equity reflected the broad advance in international equity markets during the 12-month period. However, the fund modestly underperformed its benchmark, the MSCI EAFE Index. The bulk of the underperformance resulted from the portfolio’s European holdings, particularly in the U.K. and Switzerland, which more than offset the positive impact of the fund’s exposure to emerging markets.
Consumer and Energy Stocks Detracted
From a sector perspective, International Core Equity’s consumer discretionary and energy holdings contributed the most to its underperformance versus the MSCI EAFE Index. Stock selection among hotels, restaurants, and leisure companies, as well as apparel makers, generated the bulk of the underperformance in the consumer discretionary sector. The most significant individual detractor in this sector was OPAP, also known as the Greek Organization of Football Prognostics, which is the largest sports betting firm in Europe. The debt crisis and resulting economic downturn in Greece weighed on gambling and lottery revenues for the company. Another notable decliner was British video game retailer Game Group, which struggled with increased competition and a slowdown in game sales.
In the energy sector, virtually all of the underperformance resulted from stock selection among oil and gas producers. TGS Nopec Geophysical, a Norwegian company that produces seismic imaging data for energy companies, detracted the most in this sector. TGS slumped as the oil spill in the Gulf of Mexico put the brakes on new deepwater drilling activity, reducing demand for the company’s services.
The portfolio’s consumer staples stocks also lagged during the 12-month period, resulting from both an underweight in the sector—consumer staples was the best-performing sector in the index—and stock selection among food and staples retailers. Australian supermarket and department store chain Wesfarmers and Japanese convenience store operator FamilyMart were the biggest detractors in this sector. Both companies faced weakness in retail spending that contributed to lower-than-expected earnings.
*All fund returns referenced in this commentary are for Investor Class shares.
6
International Core Equity
Other noteworthy detractors in the portfolio included British bus and train operator Go-Ahead Group, British power generation company Drax Group, and Japanese consumer finance company Aiful. Go-Ahead saw its profit margins squeezed by reduced traffic and lower fuel subsidies, while declining energy demand drove profits down for Drax. Aiful faced new lending legislation in Japan, including a lower cap on consumer lending rates, that contributed to further losses for the company.
Materials and Health Care Outperformed
On the positive side, the portfolio’s materials and health care holdings outperformed their counterparts in the MSCI EAFE Index for the 12-month period. Materials stocks were the best-performing segment of the portfolio, led by metals and mining companies and chemicals producers. The top contributor in this sector was Canadian mining company Eldorado Gold, which benefited from an increase of more than 30% in the price of gold during the period. Australian iron ore miner Mount Gibson Iron was another strong performer thanks to higher production volumes and a takeover offer from a Chinese steelmaker. In the chemicals industry, the leading performer was German chemicals company BASF, which saw a firm recovery across all of its businesses.
Outperformance in the health care sector was driven entirely by stock selection among pharmaceutical firms. The best contributors were drug makers Novo-Nordisk and AstraZeneca. Danish pharmaceutical company Novo-Nordisk, which focuses on treating diabetes, posted solid sales and profit growth as its latest diabetes drug was approved for sale in the U.S. AstraZeneca, based in the U.K., repeatedly boosted its earnings forecasts thanks to strong sales of its blockbuster cholesterol drug.
The best relative performance contributor in the portfolio was German media conglomerate ProSiebenSat.1 Media, which rallied as an improving advertising environment and cost-cutting measures enabled the company to return to profitability. British beverage maker Britvic was another top contributor, reporting better-than-expected earnings amid rising sales and a beneficial acquisition.
A Look Ahead
The market environment for international stocks has grown increasingly choppy in recent months, reflecting greater uncertainty about the resilience of the global economic recovery. Although most businesses weathered the 2008 recession relatively well, stubbornly high unemployment in many countries suggests that the corporate sector is not yet confident enough in the strength of the recovery to expand payrolls. This economic uncertainty—and the stock market volatility that often accompanies it—is likely to continue as we move into the second half of 2010.
The quantitative investment process we use to manage International Core Equity has a framework that is objective, disciplined, and systematic—in other words, it avoids getting caught up in the fads and emotions that can drive short-term market movements. We believe this approach will produce superior relative performance over the long term.
7
| |
| International Core Equity | |
| |
| Top Ten Holdings | |
| | % of net assets |
| | as of 6/30/10 |
| AstraZeneca plc | 2.0% |
| Novartis AG | 1.6% |
| Market Vectors - Gold Miners ETF | 1.3% |
| Vodafone Group plc | 1.1% |
| Commonwealth Bank of Australia | 1.1% |
| BASF SE | 1.1% |
| Banco Santander SA | 1.1% |
| Danisco A/S | 1.1% |
| Novo Nordisk A/S B Shares | 1.0% |
| HSBC Holdings plc | 1.0% |
| |
| Investments by Country | |
| | % of net assets |
| | as of 6/30/10 |
| Japan | 21.1% |
| United Kingdom | 17.4% |
| France | 8.8% |
| Germany | 7.9% |
| Australia | 7.1% |
| Switzerland | 6.7% |
| Netherlands | 4.0% |
| Italy | 3.6% |
| Sweden | 3.1% |
| Spain | 2.9% |
| Hong Kong | 2.6% |
| Denmark | 2.5% |
| Norway | 2.0% |
| Other Countries | 9.1% |
| Other Assets and Liabilities | 1.2% |
| |
| Types of Investments in Portfolio | |
| | % of net assets |
| | as of 6/30/10 |
| Foreign Common Stocks & Warrants | 98.8% |
| Other Assets and Liabilities | 1.2% |
8
|
| Shareholder Fee Example (Unaudited) |
Fund shareholders may incur two types of costs: (1) transaction costs, including sales charges (loads) on purchase payments and redemption/ exchange fees; and (2) ongoing costs, including management fees; distribution and service (12b-1) fees; and other fund expenses. This example is intended to help you understand your ongoing costs (in dollars) of investing in your fund and to compare these costs with the ongoing cost of investing in other mutual funds.
The example is based on an investment of $1,000 made at the beginning of the period and held for the entire period from January 1, 2010 to June 30, 2010.
Actual Expenses
The table provides information about actual account values and actual expenses for each class. You may use the information, together with the amount you invested, to estimate the expenses that you paid over the period. First, identify the share class you own. Then simply divide your account value by $1,000 (for example, an $8,600 account value divided by $1,000 = 8.6), then multiply the result by the number under the heading “Expenses Paid During Period” to estimate the expenses you paid on your account during this period.
If you hold Investor Class shares of any American Century Investments fund, or Institutional Class shares of the American Century Diversified Bond Fund, in an American Century Investments account (i.e., not a financial intermediary or retirement plan account), American Century Investments may charge you a $12.50 semiannual account maintenance fee if the value of those shares is less than $10,000. We will redeem shares automatically in one of your accounts to pay the $12.50 fee. In determining your total eligible investment amount, we will include your investments in all personal accounts (including American Century Investments Brokerage accounts) registered under your Social Security number. Personal accounts include individual accounts, joint accounts, UGMA/UTMA accounts, personal trusts, Coverdell Education Savings Accounts and IRAs (including traditional, Roth, Rollover, SEP-, SARSEP- and SIMPLE-IRAs), and certain other retirement accounts. If you have only business, business retirement, employer-sponsored or American Century Investments Brokerage accounts, you are currently not subject to this fee. We will not charge the fee as long as you choose to manage your accounts exclusively online. If you are subject to the Account Maintenance Fee, your account value could be reduced by the fee amount.
Hypothetical Example for Comparison Purposes
The table also provides information about hypothetical account values and hypothetical expenses based on the actual expense ratio of each class of your fund and an assumed rate of return of 5% per year before expenses, which is not the actual return of a fund’s share class. The hypothetical account values and expenses may not be used to estimate the actual ending account balance or expenses you paid for the period. You may use this information to compare the ongoing costs of investing in your fund and other funds. To do so, compare this 5% hypothetical example with the 5% hypothetical examples that appear in the shareholder reports of the other funds.
9
Please note that the expenses shown in the table are meant to highlight your ongoing costs only and do not reflect any transactional costs, such as sales charges (loads) or redemption/exchange fees. Therefore, the table is useful in comparing ongoing costs only, and will not help you determine the relative total costs of owning different funds. In addition, if these transactional costs were included, your costs would have been higher.
| | | | |
| | Beginning | Ending | Expenses Paid | |
| | Account Value | Account Value | During Period* | Annualized |
| | 1/1/10 | 6/30/10 | 1/1/10 – 6/30/10 | Expense Ratio* |
| Actual | | | | |
| Investor Class | $1,000 | $864.80 | $5.46 | 1.18% |
| Institutional Class | $1,000 | $866.30 | $4.53 | 0.98% |
| A Class | $1,000 | $864.60 | $6.61 | 1.43% |
| B Class | $1,000 | $861.70 | $10.06 | 2.18% |
| C Class | $1,000 | $861.70 | $10.06 | 2.18% |
| R Class | $1,000 | $863.20 | $7.76 | 1.68% |
| Hypothetical | | | | |
| Investor Class | $1,000 | $1,018.94 | $5.91 | 1.18% |
| Institutional Class | $1,000 | $1,019.93 | $4.91 | 0.98% |
| A Class | $1,000 | $1,017.70 | $7.15 | 1.43% |
| B Class | $1,000 | $1,013.98 | $10.89 | 2.18% |
| C Class | $1,000 | $1,013.98 | $10.89 | 2.18% |
| R Class | $1,000 | $1,016.46 | $8.40 | 1.68% |
| *Expenses are equal to the class’s annualized expense ratio listed in the table above, multiplied by the average account value over the period, |
| multiplied by 181, the number of days in the most recent fiscal half-year, divided by 365, to reflect the one-half year period. |
10
| | | | | | |
| International Core Equity | | | | |
| |
| JUNE 30, 2010 | | | | | | |
| | Shares | Value | | | Shares | Value |
| Common Stocks & Warrants — 98.8% | | FRANCE — 8.8% | | |
| AUSTRALIA — 7.1% | | | | AXA SA | 1,181 | $ 17,911 |
| Australia & New Zealand | | | | BNP Paribas | 808 | 43,143 |
| Banking Group Ltd. | 1,635 | $ 29,352 | | Bouygues SA | 244 | 9,346 |
| Bank of Queensland Ltd. | 1,312 | 11,422 | | Carrefour SA | 22 | 869 |
| Bendigo and | | | | Casino Guichard Perrachon SA | 291 | 21,975 |
| Adelaide Bank Ltd. | 1,219 | 8,332 | | Christian Dior SA | 141 | 13,397 |
| BHP Billiton Ltd. | 1,353 | 42,078 | | Cie Generale de | | |
| Caltex Australia Ltd. | 1,757 | 13,721 | | Geophysique-Veritas(1) | 936 | 16,440 |
| Coca-Cola Amatil Ltd. | 486 | 4,867 | | Credit Agricole SA | 1,764 | 18,057 |
| Commonwealth Bank of Australia | 1,359 | 55,081 | | France Telecom SA | 1,124 | 19,396 |
| Fairfax Media Ltd. | 6,746 | 7,404 | | Nexans SA | 535 | 30,933 |
| Harvey Norman Holdings Ltd. | 5,051 | 13,963 | | Rhodia SA | 2,642 | 43,480 |
| Macquarie Group Ltd. | 8 | 246 | | Safran SA | 777 | 21,547 |
| Mount Gibson Iron Ltd.(1) | 25,272 | 32,195 | | Sanofi-Aventis SA | 724 | 43,659 |
| National Australia Bank Ltd. | 1,282 | 24,763 | | Schneider Electric SA | 250 | 25,304 |
| Newcrest Mining Ltd. | 1,025 | 30,146 | | Societe Generale | 280 | 11,390 |
| Rio Tinto Ltd. | 655 | 36,276 | | Total SA | 387 | 17,223 |
| Telstra Corp. Ltd. | 3,905 | 10,626 | | Vallourec SA | 138 | 23,562 |
| Wesfarmers Ltd. | 801 | 19,178 | | Vinci SA | 495 | 20,383 |
| Westpac Banking Corp. | 430 | 7,594 | | Vivendi SA | 1,480 | 29,942 |
| | | 347,244 | | | | 427,957 |
| AUSTRIA — 0.3% | | | | GABON — 0.2% | | |
| Erste Group Bank AG | 392 | 12,471 | | Total Gabon SA | 35 | 10,480 |
| Voestalpine AG | 114 | 3,120 | | GERMANY — 7.9% | | |
| | | 15,591 | | Allianz SE | 403 | 40,016 |
| BELGIUM — 1.5% | | | | Aurubis AG | 535 | 23,287 |
| Delhaize Group SA | 209 | 15,133 | | BASF SE | 980 | 53,465 |
| Dexia SA(1) | 1,580 | 5,505 | | Bayer AG | 350 | 19,528 |
| D’ieteren SA | 113 | 47,994 | | Bayerische Motoren | | |
| | | | | Werke AG | 757 | 36,615 |
| Umicore | 169 | 4,890 | | Deutsche Bank AG | 618 | 34,941 |
| | | 73,522 | | Deutsche Telekom AG | 1,913 | 22,551 |
| CYPRUS — 0.3% | | | | E.ON AG | 314 | 8,453 |
| Bank of Cyprus Public Co. Ltd. | 2,213 | 8,868 | | Hannover Rueckversicherung AG | 444 | 19,126 |
| Marfin Popular | | | | | | |
| Bank Public Co. Ltd. | 4,475 | 7,606 | | Infineon Technologies AG(1) | 2,549 | 14,731 |
| | | 16,474 | | MAN SE | 244 | 20,116 |
| DENMARK — 2.5% | | | | Metro AG | 271 | 13,778 |
| Carlsberg A/S B Shares | 83 | 6,310 | | MTU Aero Engines Holding AG | 253 | 14,078 |
| Coloplast A/S B Shares | 146 | 14,493 | | Muenchener | | |
| | | | | Rueckversicherungs-Gesellschaft | | |
| Danisco A/S | 764 | 51,266 | | AG | 44 | 5,508 |
| Novo Nordisk A/S B Shares | 612 | 49,367 | | ProSiebenSat.1 Media AG | | |
| | | 121,436 | | Preference Shares | 2,532 | 36,905 |
| FINLAND — 0.3% | | | | Siemens AG | 246 | 22,014 |
| Pohjola Bank plc | 1,191 | 12,125 | | | | 385,112 |
11
International Core Equity
| | | | | | |
| | Shares | Value | | | Shares | Value |
| GREECE — 0.7% | | | | Fuji Heavy Industries Ltd.(1) | 3,000 | $ 16,016 |
| Alpha Bank AE(1) | 1,353 | $ 6,613 | | Fuji Oil Co. Ltd. | 1,000 | 14,667 |
| Motor Oil Hellas | | | | FUJIFILM Holdings Corp. | 700 | 20,136 |
| Corinth Refineries SA | 1,505 | 13,144 | | Hitachi Ltd.(1) | 5,000 | 18,132 |
| National Bank of Greece SA(1) | 637 | 6,941 | | Honda Motor Co. Ltd. | 1,400 | 40,658 |
| OPAP SA | 700 | 8,707 | | Hosiden Corp. | 1,400 | 14,685 |
| | | 35,405 | | Idemitsu Kosan Co. Ltd. | 200 | 15,022 |
| HONG KONG — 2.6% | | | | ITOCHU Corp. | 2,000 | 15,594 |
| BOC Hong Kong Holdings Ltd. | 2,500 | 5,683 | | Japan Tobacco, Inc. | 8 | 24,871 |
| Chaoda Modern | | | | Jupiter Telecommunications | | |
| Agriculture Holdings Ltd. | 14,000 | 13,681 | | Co. Ltd. | 14 | 13,342 |
| City Telecom HK Ltd. | 24,000 | 13,791 | | Kawasaki Kisen Kaisha Ltd.(1) | 4,000 | 16,185 |
| Hang Lung Group Ltd. | 1,000 | 5,387 | | Konica Minolta Holdings, Inc. | 3,000 | 28,870 |
| Hopewell Highway | | | | Kyocera Corp. | 200 | 16,151 |
| Infrastructure Ltd. | 200 | 140 | | | | |
| | | | | Leopalace21 Corp.(1) | 2,000 | 6,259 |
| Industrial & Commercial | | | | | | |
| Bank of China (Asia) Ltd. | 6,000 | 15,851 | | Marubeni Corp. | 4,000 | 20,490 |
| Kingboard Laminates | | | | Mineba Co. Ltd. | 5,000 | 27,565 |
| Holdings Ltd. | 36,000 | 30,115 | | Miraca Holdings, Inc. | 800 | 23,967 |
| Lee & Man Paper | | | | Mitsubishi Corp. | 1,800 | 37,508 |
| Manufacturing Ltd. | 18,000 | 13,243 | | Mitsubishi Tanabe Pharma Corp. | 1,000 | 15,229 |
| PCCW Ltd. | 43,000 | 12,482 | | Mitsubishi UFJ Lease | | |
| VTech Holdings Ltd. | 1,000 | 10,659 | | & Finance Co. Ltd. | 190 | 6,396 |
| Yue Yuen Industrial | | | | Mitsui & Co. Ltd. | 900 | 10,581 |
| Holdings Ltd. | 1,500 | 4,660 | | Mitsumi Electric Co. Ltd. | 1,800 | 30,629 |
| | | 125,692 | | Nippon Electric Glass Co. Ltd. | 2,000 | 22,760 |
| IRELAND — 0.6% | | | | Nippon Meat Packers, Inc. | 1,000 | 12,364 |
| Smurfit Kappa Group plc(1) | 3,311 | 26,828 | | Nippon Telegraph | | |
| ITALY — 3.6% | | | | & Telephone Corp. | 1,000 | 40,829 |
| Banca Popolare di Milano Scarl | 1,238 | 5,108 | | Nissan Motor Co. Ltd.(1) | 4,300 | 29,809 |
| Enel SpA | 7,663 | 32,418 | | NTT Data Corp. | 5 | 18,445 |
| ENI SpA | 485 | 8,903 | | NTT DoCoMo, Inc. | 24 | 36,294 |
| Indesit Co. SpA | 4,361 | 48,592 | | Resona Holdings, Inc. | 1,300 | 15,813 |
| Mediaset SpA | 4,069 | 23,168 | | Seino Holdings Corp. | 2,000 | 13,744 |
| Prysmian SpA | 803 | 11,536 | | Seven & I Holdings Co. Ltd. | 1,000 | 22,944 |
| Telecom Italia SpA | 11,483 | 12,657 | | Shinko Electric | | |
| UniCredit SpA | 14,520 | 32,230 | | Industries Co. Ltd. | 1,000 | 12,968 |
| | | 174,612 | | SOFTBANK CORP. | 300 | 7,929 |
| JAPAN — 21.1% | | | | Sojitz Corp. | 6,000 | 9,397 |
| Amada Co. Ltd. | 2,000 | 13,134 | | Sony Financial Holdings, Inc. | 4 | 13,375 |
| Asahi Breweries Ltd. | 600 | 10,142 | | Stanley Electric Co. Ltd. | 1,000 | 16,552 |
| Astellas Pharma, Inc. | 500 | 16,721 | | Sumitomo Heavy Industries Ltd. | 1,000 | 5,890 |
| Brother Industries Ltd. | 2,400 | 24,988 | | Sumitomo Metal Mining Co. Ltd. | 1,000 | 12,547 |
| Canon, Inc. | 600 | 22,370 | | Suruga Bank Ltd. | 1,000 | 9,060 |
| Capcom Co. Ltd. | 900 | 14,437 | | Takata Corp. | 1,100 | 22,236 |
| Central Japan Railway Co. | 2 | 16,471 | | Takeda Pharmaceutical Co. Ltd. | 600 | 25,678 |
| Daito Trust Construction Co. Ltd. | 300 | 16,959 | | Tokyo Gas Co. Ltd. | 2,000 | 9,144 |
| Eisai Co. Ltd. | 500 | 16,541 | | Tokyo Steel | | |
| F.C.C. Co. Ltd. | 1,100 | 20,484 | | Manufacturing Co. Ltd. | 1,400 | 16,206 |
12
| | | | | | |
| International Core Equity | | | | |
| |
| | Shares | Value | | | Shares | Value |
| Toyo Seikan Kaisha Ltd. | 900 | $ 13,060 | | SPAIN — 2.9% | | |
| Toyota Tsusho Corp. | 500 | 7,160 | | Banco Bilbao Vizcaya | | |
| TV Asahi Corp. | 11 | 15,862 | | Argentaria SA | 1,013 | $ 10,451 |
| Yamaguchi Financial Group, Inc. | 1,000 | 9,537 | | Banco Santander SA | 4,994 | 52,477 |
| | | 1,024,803 | | Corp. Financiera Alba | 274 | 10,121 |
| LIECHTENSTEIN — 0.2% | | | | Endesa SA | 756 | 16,057 |
| Verwaltungs- und | | | | Mapfre SA | 4,470 | 12,132 |
| Privat-Bank AG | 65 | 7,645 | | Telefonica SA | 2,125 | 39,241 |
| MEXICO — 0.2% | | | | | | 140,479 |
| Fresnillo plc | 830 | 11,991 | | SWEDEN — 3.1% | | |
| MULTI-NATIONAL — 1.3% | | | | Alfa Laval AB | 1,993 | 25,743 |
| Market Vectors - | | | | Atlas Copco AB, Class B | 1,204 | 15,947 |
| Gold Miners ETF | 1,172 | 60,897 | | JM AB | 182 | 2,438 |
| NETHERLANDS — 4.0% | | | | Nordea Bank AB | 3,039 | 25,065 |
| CSM | 783 | 23,262 | | Saab AB B Shares | 1,853 | 21,035 |
| Heineken Holding NV | 781 | 28,493 | | Scania AB B Shares | 1,002 | 15,275 |
| ING Groep NV CVA(1) | 3,453 | 25,637 | | Svenska Cellulosa AB | | |
| Koninklijke DSM NV | 682 | 27,095 | | B Shares | 2,885 | 33,935 |
| Koninklijke Philips Electronics NV | 654 | 19,494 | | Svenska Handelsbanken AB | | |
| Royal Dutch Shell plc B Shares | 1,694 | 41,014 | | A Shares | 413 | 10,115 |
| Unilever NV CVA | 993 | 27,075 | | | | 149,553 |
| | | 192,070 | | SWITZERLAND — 6.7% | | |
| NORWAY — 2.0% | | | | ABB Ltd.(1) | 1,311 | 22,781 |
| Kongsberg Gruppen AS | 2,030 | 33,912 | | Clariant AG(1) | 2,283 | 28,925 |
| Petroleum Geo-Services ASA(1) | 2,772 | 23,138 | | Credit Suisse Group AG | 1,032 | 38,787 |
| Telenor ASA | 812 | 10,198 | | Nestle SA | 892 | 43,039 |
| TGS Nopec Geophysical Co. ASA | 2,506 | 28,654 | | Novartis AG | 1,557 | 75,540 |
| | | 95,902 | | Roche Holding AG | 331 | 45,454 |
| PEOPLE’S REPUBLIC OF CHINA — 1.7% | | | Swatch Group AG (The) | 244 | 12,478 |
| Anta Sports Products Ltd. | 9,000 | 16,204 | | UBS AG(1) | 1,116 | 14,793 |
| China Merchants Bank Co. Ltd. | | | | Xstrata plc | 9 | 118 |
| H Shares | 8,475 | 20,250 | | Zurich Financial Services AG | 204 | 44,780 |
| Yangzijiang Shipbuilding | | | | | | 326,695 |
| Holdings Ltd. | 23,000 | 21,955 | | UNITED KINGDOM — 17.4% | | |
| Zhaojin Mining Industry Co. Ltd. | | | | Admiral Group plc | 319 | 6,670 |
| H Shares | 11,000 | 25,798 | | | | |
| | | | | Amlin plc | 2,300 | 13,225 |
| | | 84,207 | | | | |
| | | | | AstraZeneca plc | 2,063 | 96,935 |
| PORTUGAL(2) | | | | | | |
| | | | | Balfour Beatty plc | 5,005 | 17,785 |
| Banco Espirito Santo SA | 400 | 1,576 | | Barclays plc | 6,633 | 26,297 |
| SINGAPORE — 1.8% | | | | BHP Billiton plc | 1,528 | 39,540 |
| DBS Group Holdings Ltd. | 1,500 | 14,544 | | BP plc | 8,372 | 40,208 |
| Golden Agri-Resources | | | | | | |
| Ltd. Warrants(1) | 1,224 | 87 | | British American Tobacco plc | 1,393 | 44,109 |
| Jardine Cycle & Carriage Ltd. | 1,000 | 21,225 | | Britvic plc | 4,964 | 35,086 |
| SembCorp Industries Ltd. | 11,000 | 31,788 | | BT Group plc, Class A | 8,647 | 16,513 |
| StarHub Ltd. | 5,000 | 8,025 | | Centrica plc | 1,969 | 8,671 |
| Venture Corp. Ltd. | 2,000 | 12,688 | | Close Brothers Group plc | 779 | 8,009 |
| | | 88,357 | | Compass Group plc | 1,614 | 12,245 |
| | | | | EnQuest plc(1) | 1,299 | 1,905 |
13
International Core Equity
| | | | | | |
| | Shares | Value | | Market Sector Diversification | |
| GlaxoSmithKline plc | 1,779 | $ 30,149 | | (as a % of net assets) | |
| Go-Ahead Group plc | 2,512 | 39,824 | | Financials | 21.0% |
| HSBC Holdings plc | 5,355 | 48,854 | | Industrials | 14.1% |
| Inchcape plc(1) | 1,461 | 5,337 | | Consumer Discretionary | 12.0% |
| International Power plc | 3,790 | 16,791 | | Materials | 11.5% |
| Investec plc | 1,427 | 9,598 | | Health Care | 9.7% |
| Kesa Electricals plc | 11,689 | 21,049 | | Consumer Staples | 9.4% |
| Lloyds Banking Group plc(1) | 21,764 | 17,268 | | Information Technology | 6.4% |
| Next plc | 829 | 24,532 | | Telecommunication Services | 6.3% |
| Pearson plc | 1,547 | 20,244 | | Energy | 5.2% |
| Petrofac Ltd. | 1,299 | 22,841 | | Utilities | 1.9% |
| Randgold Resources Ltd. | 41 | 3,898 | | Diversified | 1.3% |
| Rio Tinto plc | 803 | 35,139 | | Other Assets and Liabilities | 1.2% |
| Songbird Estates plc(1) | 11,957 | 27,361 | | | | |
| Standard Chartered plc | 1,154 | 28,014 | | Notes to Schedule of Investments | |
| Tate & Lyle plc | 2,318 | 15,402 | | CVA = Certificaten Van Aandelen | |
| Tomkins plc | 4,694 | 15,769 | | ETF = Exchange Traded Fund | |
| Tullett Prebon plc | 4,552 | 21,364 | | (1) | Non-income producing. | |
| Unilever plc | 302 | 8,049 | | (2) | Category is less than 0.05% of total net assets. | |
| Vodafone Group plc | 26,691 | 55,310 | | | | |
| Wolseley plc(1) | 649 | 12,688 | | Geographic classifications and market sector diversification are unaudited. |
| | | 846,679 | | | | |
| TOTAL INVESTMENT | | | | | | |
| SECURITIES — 98.8% | | | | See Notes to Financial Statements. | |
| (Cost $5,272,696) | | 4,803,332 | | | | |
| OTHER ASSETS | | | | | | |
| AND LIABILITIES — 1.2% | | 59,475 | | | | |
| TOTAL NET ASSETS — 100.0% | | $4,862,807 | | | | |
14
|
| Statement of Assets and Liabilities |
| |
| JUNE 30, 2010 | |
| Assets | |
| Investment securities, at value (cost of $5,272,696) | $4,803,332 |
| Cash | 41,730 |
| Foreign currency holdings, at value (cost of $2,727) | 2,745 |
| Receivable for investments sold | 14,609 |
| Receivable for capital shares sold | 735 |
| Dividends and interest receivable | 14,011 |
| | 4,877,162 |
| | |
| Liabilities | |
| Payable for investments purchased | 8,078 |
| Accrued management fees | 4,723 |
| Distribution fees payable | 832 |
| Service fees (and distribution fees — A Class and R Class) payable | 722 |
| | 14,355 |
| | |
| Net Assets | $4,862,807 |
| | |
| Net Assets Consist of: | |
| Capital (par value and paid-in surplus) | $ 8,617,390 |
| Undistributed net investment income | 64,736 |
| Accumulated net realized loss on investment and foreign currency transactions | (3,350,095) |
| Net unrealized depreciation on investments and translation of assets and liabilities in foreign currencies | (469,224) |
| | $ 4,862,807 |
| | | |
| | Net assets | Shares outstanding | Net asset value per share |
| Investor Class, $0.01 Par Value | $1,489,995 | 250,380 | $5.95 |
| Institutional Class, $0.01 Par Value | $653,239 | 109,589 | $5.96 |
| A Class, $0.01 Par Value | $730,099 | 122,863 | $5.94* |
| B Class, $0.01 Par Value | $677,137 | 114,469 | $5.92 |
| C Class, $0.01 Par Value | $630,721 | 106,617 | $5.92 |
| R Class, $0.01 Par Value | $681,616 | 114,884 | $5.93 |
| * Maximum offering price $6.30 (net asset value divided by 0.9425) | | |
| |
| |
| See Notes to Financial Statements. | | | |
15
| |
| YEAR ENDED JUNE 30, 2010 | |
| Investment Income (Loss) | |
| Income: | |
| Dividends (net of foreign taxes withheld of $13,429) | $ 162,351 |
| Interest | 22 |
| | 162,373 |
| Expenses: | |
| Management fees | 67,862 |
| Distribution fees: | |
| B Class | 5,647 |
| C Class | 5,841 |
| Service fees: | |
| B Class | 1,882 |
| C Class | 1,947 |
| Distribution and service fees: | |
| A Class | 2,335 |
| R Class | 3,776 |
| Directors’ fees and expenses | 175 |
| Other expenses | 261 |
| | 89,726 |
| | |
| Net investment income (loss) | 72,647 |
| | |
| Realized and Unrealized Gain (Loss) | |
| Net realized gain (loss) on: | |
| Investment transactions | (36,455) |
| Futures contract transactions | 10,794 |
| Foreign currency transactions | 84,871 |
| | 59,210 |
| | |
| Change in net unrealized appreciation (depreciation) on: | |
| Investments | 555,365 |
| Translation of assets and liabilities in foreign currencies | (284,083) |
| | 271,282 |
| | |
| Net realized and unrealized gain (loss) | 330,492 |
| | |
| Net Increase (Decrease) in Net Assets Resulting from Operations | $ 403,139 |
| |
| |
| See Notes to Financial Statements. | |
16
|
| Statement of Changes in Net Assets |
| | |
| YEARS ENDED JUNE 30, 2010 AND JUNE 30, 2009 | | |
| Increase (Decrease) in Net Assets | 2010 | 2009 |
| Operations | | |
| Net investment income (loss) | $ 72,647 | $ 156,960 |
| Net realized gain (loss) | 59,210 | (2,950,723) |
| Change in net unrealized appreciation (depreciation) | 271,282 | (516,085) |
| Net increase (decrease) in net assets resulting from operations | 403,139 | (3,309,848) |
| | | |
| Distributions to Shareholders | | |
| From net investment income: | | |
| Investor Class | (48,536) | (57,258) |
| Institutional Class | (23,300) | (36,330) |
| A Class | (20,255) | (39,459) |
| B Class | (7,830) | (22,215) |
| C Class | (9,392) | (23,521) |
| R Class | (11,766) | (23,733) |
| Decrease in net assets from distributions | (121,079) | (202,516) |
| | | |
| Capital Share Transactions | | |
| Net increase (decrease) in net assets from capital share transactions | (936,519) | 247,737 |
| | | |
| Redemption Fees | | |
| Increase in net assets from redemption fees | 2,962 | 1,686 |
| | | |
| Net increase (decrease) in net assets | (651,497) | (3,262,941) |
| | | |
| Net Assets | | |
| Beginning of period | 5,514,304 | 8,777,245 |
| End of period | $4,862,807 | $ 5,514,304 |
| | | |
| Undistributed net investment income | $64,736 | $95,103 |
| |
| |
| See Notes to Financial Statements. | | |
17
|
| Notes to Financial Statements |
JUNE 30, 2010
1. Organization and Summary of Significant Accounting Policies
Organization — American Century Quantitative Equity Funds, Inc. (the corporation) is registered under the Investment Company Act of 1940 (the 1940 Act) as an open-end management investment company International Core Equity Fund (the fund) is one fund in a series issued by the corporation. The fund is diversified under the 1940 Act. The fund’s investment objective is to seek long-term capital growth. The fund pursues its objective by investing primarily in equity securities of companies located in developed countries, excluding the United States and Canada. The following is a summary of the fund��s significant accounting policies.
Multiple Class — The fund is authorized to issue the Investor Class, the Institutional Class, the A Class, the B Class, the C Class and the R Class. The A Class may incur an initial sales charge. The A Class, B Class and C Class may be subject to a contingent deferred sales charge. The share classes differ principally in their respective sales charges and distribution and shareholder servicing expenses and arrangements. All shares of the fund represent an equal pro rata interest in the net assets of the class to which such shares belong, and have identical voting, dividend, liquidation and other rights and the same terms and conditions, except for class specific expenses and exclusive rights to vote on matters affecting only individual classes. Income, non-class specific expenses, and realized and unrealized capital gains and losses of the fund are allocated to each class of shares based on their relative net assets.
Security Valuations — Securities traded primarily on a principal securities exchange are valued at the last reported sales price, or at the mean of the latest bid and asked prices where no last sales price is available. Depending on local convention or regulation, securities traded over-the-counter are valued at the mean of the latest bid and asked prices, the last sales price, or the official close price. Investments in open-end management investment companies are valued at the reported net asset value. Discount notes may be valued through a commercial pricing service or at amortized cost, which approximates fair value. Securities traded on foreign securities exchanges and over-the-counter markets are normally completed before the close of business on days that the New York Stock Exchange (the Exchange) is open and may also take place on days when the Exchange is not open. If an event occurs after the value of a security was established but before the net asset value per share was determined that was likely to materially change the net asset value, that security would be valued as determined in accordance with procedures adopted by the Board of Directors. If the fund determines that the market price of a portfolio security is not readily available, or that the valuation methods mentioned above do not reflect the security’s fair value, such security is valued as determined by the Board of Directors or its designee, in accordance with procedures adopted by the Board of Directors, if such determination would materially impact a fund’s net asset value. Certain other circumstances may cause the fund to use alternative procedures to value a security such as: a security has been declared in default; trading in a security has been halted during the trading day; or there is a foreign market holiday and no trading will commence .
Security Transactions — For financial reporting purposes, security transactions are accounted for as of the trade date. Net realized gains and losses are determined on the identified cost basis, which is also used for federal income tax purposes.
Investment Income — Dividend income less foreign taxes withheld, if any, is recorded as of the ex-dividend date. Interest income is recorded on the accrual basis and includes accretion of discounts and amortization of premiums.
18
Foreign Currency Translations — All assets and liabilities initially expressed in foreign currencies are translated into U.S. dollars at prevailing exchange rates at period end. The fund may enter into spot foreign currency exchange contracts to facilitate transactions denominated in a foreign currency. Purchases and sales of investment securities, dividend and interest income, spot foreign currency exchange contracts, and certain expenses are translated at the rates of exchange prevailing on the respective dates of such transactions. Realized and unrealized gains and losses from foreign currency translations arise from changes in currency exchange rates.
Net realized and unrealized foreign currency exchange gains or losses occurring during the holding period of investment securities are a component of net realized gain (loss) on foreign currency transactions and net unrealized appreciation (depreciation) on translation of assets and liabilities in foreign currencies, respectively. Certain countries may impose taxes on the contract amount of purchases and sales of foreign currency contracts in their currency. The fund records the foreign tax expense, if any, as a reduction to the net realized gain (loss) on foreign currency transactions.
Exchange Traded Funds — The fund may invest in exchange traded funds (ETFs). ETFs are a type of index fund bought and sold on a securities exchange. An ETF trades like common stock and represents a fixed portfolio of securities designed to track the performance and dividend yield of a particular domestic or foreign market index. A fund may purchase an ETF to temporarily gain exposure to a portion of the U.S. or a foreign market while awaiting purchase of underlying securities. The risks of owning an ETF generally reflect the risks of owning the underlying securities they are designed to track, although the lack of liquidity on an ETF could result in it being more volatile. Additionally, ETFs have fees and expenses that reduce their value.
Repurchase Agreements — The fund may enter into repurchase agreements with institutions that American Century Investment Management, Inc. (ACIM) (the investment advisor) has determined are creditworthy pursuant to criteria adopted by the Board of Directors. Each repurchase agreement is recorded at cost. The fund requires that the collateral, represented by securities, received in a repurchase transaction be transferred to the custodian in a manner sufficient to enable the fund to obtain those securities in the event of a default under the repurchase agreement. ACIM monitors, on a daily basis, the securities transferred to ensure the value, including accrued interest, of the securities under each repurchase agreement is equal to or greater than amounts owed to the fund under each repurchase agreement.
Joint Trading Account — Pursuant to an Exemptive Order issued by the Securities and Exchange Commission, the fund, along with certain other funds in the American Century Investments family of funds, may transfer uninvested cash balances into a joint trading account. These balances are invested in one or more repurchase agreements that are collateralized by U.S. Treasury or Agency obligations.
Income Tax Status — It is the fund’s policy to distribute substantially all net investment income and net realized gains to shareholders and to otherwise qualify as a regulated investment company under provisions of the Internal Revenue Code. All tax years for the fund remain subject to examination by tax authorities. At this time, management believes there are no uncertain tax positions which, based on their technical merit, would not be sustained upon examination and for which it is reasonably possible that the total amounts of unrecognized tax benefits will significantly change in the next twelve months. Accordingly, no provision has been made for federal or state income taxes.
Distributions to Shareholders — Distributions to shareholders are recorded on the ex-dividend date. Distributions from net investment income and net realized gains, if any, are generally declared and paid annually.
Redemption — The fund may impose a 2.00% redemption fee on shares held less than 60 days. The fee may not be applicable to all classes. The redemption fee is retained by the fund and helps cover transaction costs that long-term investors may bear when the fund sells securities to meet investor redemptions.
19
Indemnifications — Under the corporation’s organizational documents, its officers and directors are indemnified against certain liabilities arising out of the performance of their duties to the fund. In addition, in the normal course of business, the fund enters into contracts that provide general indemnifications. The maximum exposure under these arrangements is unknown as this would involve future claims that may be made against a fund. The risk of material loss from such claims is considered by management to be remote.
Use of Estimates — The financial statements are prepared in conformity with accounting principles generally accepted in the United States of America, which may require management to make certain estimates and assumptions at the date of the financial statements. Actual results could differ from these estimates.
Subsequent Events — In preparing the financial statements, management evaluated the impact of events or transactions occurring through the date the financial statements were issued that would merit recognition or disclosure.
2. Fees and Transactions with Related Parties
Management Fees — The corporation has entered into a Management Agreement with ACIM, under which ACIM provides the fund with investment advisory and management services in exchange for a single, unified management fee (the fee) per class. The Agreement provides that all expenses of managing and operating the fund, except brokerage expenses, taxes, interest, fees and expenses of the independent directors (including legal counsel fees), and extraordinary expenses, will be paid by ACIM. The fee is computed and accrued daily based on the daily net assets of the specific class of shares of the fund and paid monthly in arrears. The fee consists of (1) an Investment Category Fee based on the daily net assets of the fund and certain other accounts managed by the investment advisor that are in the same broad investment category as the fund and (2) a Complex Fee based on the assets of all the funds in the American Century Investments family of funds. The rates for the Investment Category Fee range from 0.8180% to 1.0000%. The rates for the Complex Fee range from 0.2500% to 0.3100% for the Investor Class, A Class, B Class, C Class and R Class. The Institutional Class is 0.2000% less at each point within the Complex Fee range. The effective annual management fee for each class for the year ended June 30, 2010, was 1.17% for the Investor Class, A Class, B Class, C Class and R Class and 0.97% for the Institutional Class.
Distribution and Service Fees — The Board of Directors has adopted a separate Master Distribution and Individual Shareholder Services Plan for each of the A Class, B Class, C Class and R Class (collectively the plans), pursuant to Rule 12b-1 of the 1940 Act. The plans provide that the A Class will pay American Century Investment Services, Inc. (ACIS) an annual distribution and service fee of 0.25%. The plans provide that the B Class and C Class will each pay ACIS an annual distribution fee of 0.75% and service fee of 0.25%. The plans provide that the R Class will pay ACIS an annual distribution and service fee of 0.50%. The fees are computed and accrued daily based on each class’s daily net assets and paid monthly in arrears. The fees are used to pay financial intermediaries for distribution and individual shareholde r services. Fees incurred under the plans during the year ended June 30, 2010, are detailed in the Statement of Operations.
Acquired Fund Fees and Expenses — The fund may invest in mutual funds, exchange traded funds, and business development companies (the acquired funds). The fund will indirectly realize its pro rata share of the fees and expenses of the acquired funds in which it invests. These indirect fees and expenses are not paid out of the fund’s assets but are reflected in the return realized by the fund on its investment in the acquired funds.
Related Parties — Certain officers and directors of the corporation are also officers and/ or directors of American Century Companies, Inc. (ACC), the parent of the corporation’s investment advisor, ACIM, the distributor of the corporation, ACIS, and the corporation’s transfer agent, American Century Services, LLC. ACIM owns 52% of the outstanding shares of the fund.
20
The fund has a Mutual Funds Services Agreement with J.P. Morgan Investor Services Co. (JPMIS) and a securities lending agreement with JPMorgan Chase Bank (JPMCB). JPMCB is a custodian of the fund. JPMIS and JPMCB are wholly owned subsidiaries of JPMorgan Chase & Co. (JPM). JPM is an equity investor in ACC.
3. Investment Transactions
Purchases and sales of investment securities, excluding short-term investments, for the year ended June 30, 2010, were $4,793,510 and $5,675,058, respectively.
| | | | |
| 4. Capital Share Transactions | | | | |
| |
| Transactions in shares of the fund were as follows: | | |
| | Year ended June 30, 2010 | Year ended June 30, 2009 |
| | Shares | Amount | Shares | Amount |
| Investor Class/Shares Authorized | 50,000,000 | | 100,000,000 | |
| Sold | 161,834 | $ 1,093,808 | 157,815 | $ 905,189 |
| Issued in reinvestment of distributions | 7,065 | 48,325 | 9,754 | 57,258 |
| Redeemed | (212,201) | (1,452,000) | (139,613) | (919,168) |
| | (43,302) | (309,867) | 27,956 | 43,279 |
| Institutional Class/Shares Authorized | 50,000,000 | | 50,000,000 | |
| Sold | 22,965 | 161,078 | 24,102 | 150,081 |
| Issued in reinvestment of distributions | 3,407 | 23,300 | 6,189 | 36,330 |
| Redeemed | (65,095) | (447,738) | (23,146) | (131,344) |
| | (38,723) | (263,360) | 7,145 | 55,067 |
| A Class/Shares Authorized | 10,000,000 | | 10,000,000 | |
| Sold | 26,832 | 176,278 | 41,302 | 274,950 |
| Issued in reinvestment of distributions | 2,788 | 19,071 | 6,722 | 39,459 |
| Redeemed | (62,627) | (429,133) | (45,138) | (234,179) |
| | (33,007) | (233,784) | 2,886 | 80,230 |
| B Class/Shares Authorized | 10,000,000 | | 10,000,000 | |
| Sold | 902 | 6,156 | 847 | 6,249 |
| Issued in reinvestment of distributions | 1,147 | 7,830 | 3,785 | 22,215 |
| Redeemed | (483) | (3,080) | (8,477) | (39,164) |
| | 1,566 | 10,906 | (3,845) | (10,700) |
| C Class/Shares Authorized | 10,000,000 | | 10,000,000 | |
| Sold | 15,128 | 101,359 | 5,154 | 31,543 |
| Issued in reinvestment of distributions | 1,336 | 9,129 | 4,007 | 23,521 |
| Redeemed | (38,595) | (265,916) | — | — |
| | (22,131) | (155,428) | 9,161 | 55,064 |
| R Class/Shares Authorized | 10,000,000 | | 10,000,000 | |
| Sold | 500 | 3,301 | 165 | 1,064 |
| Issued in reinvestment of distributions | 1,720 | 11,766 | 4,043 | 23,733 |
| Redeemed | (8) | (53) | — | — |
| | 2,212 | 15,014 | 4,208 | 24,797 |
| Net increase (decrease) | (133,385) | $ (936,519) | 47,511 | $ 247,737 |
21
5. Fair Value Measurements
The fund’s securities valuation process is based on several considerations and may use multiple inputs to determine the fair value of the positions held by the fund. In conformity with accounting principles generally accepted in the United States of America, the inputs used to determine a valuation are classified into three broad levels as follows:
• Level 1 valuation inputs consist of unadjusted quoted prices in an active market for identical securities;
• Level 2 valuation inputs consist of significant direct or indirect observable market data (including quoted prices for similar securities, evaluations of subsequent market events, interest rates, prepayment speeds, credit risk, etc.); or
• Level 3 valuation inputs consist of significant unobservable inputs (including a fund’s own assumptions).
The level classification is based on the lowest level input that is significant to the fair valuation measurement. The valuation inputs are not an indication of the risks associated with investing in these securities or other financial instruments.
The following is a summary of the valuation inputs used to determine the fair value of the fund’s securities as of June 30, 2010. The Schedule of Investments provides additional details on the fund’s portfolio holdings.
| | | |
| | Level 1 | Level 2 | Level 3 |
| Investment Securities | | | |
| Total Investment Securities | $60,897 | $4,742,435 | — |
6. Derivative Instruments
Equity Price Risk — The fund is subject to equity price risk in the normal course of pursuing its investment objectives. A fund may enter into futures contracts based on an equity index in order to manage its exposure to changes in market conditions. A fund may purchase futures contracts to gain exposure to increases in market value or sell futures contracts to protect against a decline in market value. Upon entering into a futures contract, a fund is required to deposit either cash or securities in an amount equal to a certain percentage of the contract value (initial margin). Subsequent payments (variation margin) are made or received daily, in cash, by a fund. The variation margin is equal to the daily change in the contract value and is recorded as unrealized gains and losses. A fund recognizes a realized gain or loss whe n the contract is closed or expires. Net realized and unrealized gains or losses occurring during the holding period of futures contracts are a component of net realized gain (loss) on futures contract transactions and change in net unrealized appreciation (depreciation) on futures contracts, respectively. One of the risks of entering into futures contracts is the possibility that the change in value of the contract may not correlate with the changes in value of the underlying securities. During the year, the fund infrequently purchased equity price risk derivative instruments for temporary investment purposes.
At period end, the fund did not have any equity price risk derivative instruments disclosed on the Statement of Assets and Liabilities. For the year ended June 30, 2010, the effect of equity price risk derivative instruments on the Statement of Operations was $10,794 in net realized gain (loss) on futures contract transactions.
22
7. Interfund Lending
The fund, along with certain other funds in the American Century Investments family of funds, may participate in an interfund lending program, pursuant to an Exemptive Order issued by the Securities and Exchange Commission (SEC). This program provides an alternative credit facility allowing the fund to borrow from or lend to other funds in the American Century Investments family of funds that permit such transactions. Interfund lending transactions are subject to each fund’s investment policies and borrowing and lending limits. The interfund loan rate earned/paid on interfund lending transactions is determined daily based on the average of certain current market rates. Interfund lending transactions normally extend only overnight, but can have a maximum duration of seven days. The program is subject to annual approval by the Board of Directors. During the year ended June 30, 2010, the fund did not utilize the program.
8. Risk Factors
There are certain risks involved in investing in foreign securities. These risks include those resulting from future adverse political, social, and economic developments, fluctuations in currency exchange rates, the possible imposition of exchange controls, and other foreign laws or restrictions. Investing in emerging markets may accentuate these risks.
9. Federal Tax Information
The tax character of distributions paid during the years ended June 30, 2010 and June 30, 2009 were as follows:
| | |
| | 2010 | 2009 |
| Distributions Paid From | | |
| Ordinary income | $121,079 | $202,516 |
| Long-term capital gains | — | — |
The book-basis character of distributions made during the year from net investment income or net realized gains may differ from their ultimate characterization for federal income tax purposes. These differences reflect the differing character of certain income items and net realized gains and losses for financial statement and tax purposes, and may result in reclassification among certain capital accounts on the financial statements.
As of June 30, 2010, the federal tax cost of investments and the components of distributable earnings on a tax-basis were as follows:
| | |
| Federal tax cost of investments | $5,321,181 |
| Gross tax appreciation of investments | $ 364,226 |
| Gross tax depreciation of investments | (882,075) |
| Net tax appreciation (depreciation) of investments | $(517,849) |
| Net tax appreciation (depreciation) on derivatives and translation | |
| of assets and liabilities in foreign currencies | $ 145 |
| Net tax appreciation (depreciation) | $(517,704) |
| Undistributed ordinary income | $64,731 |
| Accumulated capital losses | $(3,119,897) |
| Capital loss deferral | $(181,713) |
The difference between book-basis and tax-basis cost and unrealized appreciation (depreciation) is attributable primarily to the tax deferral of losses on wash sales.
23
The accumulated capital losses listed on the previous page represent net capital loss carryovers that may be used to offset future realized capital gains for federal income tax purposes. Future capital loss carryover utilization in any given year may be subject to Internal Revenue Code limitations. The capital loss carryovers of $(1,139,974) and $(1,979,923) expire in 2017 and 2018, respectively.
The capital loss deferral listed on the previous page represents net capital losses incurred in the eight-month period ended June 30, 2010. The fund has elected to treat such losses as having been incurred in the following fiscal year for federal income tax purposes.
10. Corporate Event
As part of a long-standing estate and business succession plan established by ACC Co-Chairman James E. Stowers, Jr., the founder of American Century Investments, ACC Co-Chairman Richard W. Brown succeeded Mr. Stowers as trustee of a trust that holds a greater-than-25% voting interest in ACC, the parent corporation of the fund’s advisor. Under the 1940 Act, this is presumed to represent control of ACC even though it is less than a majority interest. The change of trustee may technically be considered a “change of control” of ACC and therefore also a change of control of the fund’s advisor even though there has been no change to its management and none is anticipated. The “change of control” resulted in the assignment of the fund’s investment advisory agreement. Under the 1940 Act, an assignment automatically terminated such agreement, making the approval of a new agreement necessa ry.
On February 18, 2010, the Board of Directors approved an interim investment advisory agreement under which the fund will be managed until a new agreement is approved by fund shareholders. On April 1, 2010, the Board of Directors approved a new investment advisory agreement. The interim agreement and the new agreement are substantially identical to the terminated agreements (with the exception of different effective and termination dates) and will not result in changes in the management of American Century Investments, the fund, its investment objectives, fees or services provided. The new agreement for the fund was approved by shareholders at a Special Meeting of Shareholders on June 16, 2010. The new agreement went into effect on July 16, 2010.
11. Other Tax Information (Unaudited)
The following information is provided pursuant to provisions of the Internal Revenue Code.
The fund hereby designates up to the maximum amount allowable as qualified dividend income for the fiscal year ended June 30, 2010.
For the fiscal year ended June 30, 2010, the fund intends to pass through to shareholders $13,429, or up to the maximum amount allowable, as a foreign tax credit which represents taxes paid on income derived from sources within foreign countries or possessions of the United States. During the fiscal year ended June 30, 2010, the fund earned $175,650 from income derived from foreign sources. Foreign source income and foreign tax expense per outstanding share on June 30, 2010 are $0.2145 and $0.0164, respectively.
24
| | | | | |
| International Core Equity | | | | |
| |
| Investor Class | | | | |
| For a Share Outstanding Throughout the Years Ended June 30 (except as noted) | | |
| | | 2010 | 2009 | 2008 | 2007(1) |
| Per-Share Data | | | | |
| Net Asset Value, Beginning of Period | $5.80 | $9.72 | $11.88 | $10.00 |
| Income From Investment Operations | | | | |
| Net Investment Income (Loss)(2) | 0.10 | 0.20 | 0.28 | 0.15 |
| Net Realized and Unrealized Gain (Loss) | 0.19 | (3.87) | (1.69) | 1.73 |
| Total From Investment Operations | 0.29 | (3.67) | (1.41) | 1.88 |
| Distributions | | | | |
| From Net Investment Income | (0.14) | (0.25) | (0.21) | — |
| From Net Realized Gains | — | — | (0.54) | — |
| Total Distributions | (0.14) | (0.25) | (0.75) | — |
| Net Asset Value, End of Period | $5.95 | $5.80 | $9.72 | $11.88 |
| |
| Total Return(3) | 4.68% | (37.81)% | (12.30)% | 18.80% |
| | | | | |
| Ratios/Supplemental Data | | | | |
| Ratio of Operating Expenses to Average Net Assets | 1.18% | 1.17% | 1.16% | 1.18%(4) |
| Ratio of Net Investment Income (Loss) to Average Net Assets | 1.55% | 3.09% | 2.50% | 2.30%(4) |
| Portfolio Turnover Rate | 83% | 131% | 108% | 51% |
| Net Assets, End of Period (in thousands) | $1,490 | $1,704 | $2,583 | $1,493 |
| (1) | November 30, 2006 (fund inception) through June 30, 2007. | | | | |
| (2) | Computed using average shares outstanding throughout the period. | | | | |
| (3) | Total return assumes reinvestment of net investment income and capital gains distributions, if any. Total returns for periods less than one year |
| | are not annualized. Total returns are calculated based on the net asset value of the last business day. The total return of the classes may not |
| | precisely reflect the class expense differences because of the impact of calculating the net asset values to two decimal places. If net asset |
| | values were calculated to three decimal places, the total return differences would more closely reflect the class expense differences. The |
| | calculation of net asset values to two decimal places is made in accordance with SEC guidelines and does not result in any gain or loss of value |
| | between one class and another. | | | | |
| (4) | Annualized. | | | | |
See Notes to Financial Statements.
25
| | | | | |
| International Core Equity | | | | |
| |
| Institutional Class | | | | |
| For a Share Outstanding Throughout the Years Ended June 30 (except as noted) | | |
| | | 2010 | 2009 | 2008 | 2007(1) |
| Per-Share Data | | | | |
| Net Asset Value, Beginning of Period | $5.81 | $9.73 | $11.90 | $10.00 |
| Income From Investment Operations | | | | |
| Net Investment Income (Loss)(2) | 0.11 | 0.20 | 0.29 | 0.16 |
| Net Realized and Unrealized Gain (Loss) | 0.19 | (3.86) | (1.69) | 1.74 |
| Total From Investment Operations | 0.30 | (3.66) | (1.40) | 1.90 |
| Distributions | | | | |
| From Net Investment Income | (0.15) | (0.26) | (0.23) | — |
| From Net Realized Gains | — | — | (0.54) | — |
| Total Distributions | (0.15) | (0.26) | (0.77) | — |
| Net Asset Value, End of Period | $5.96 | $5.81 | $9.73 | $11.90 |
| |
| Total Return(3) | 4.88% | (37.65)% | (12.19)% | 19.00% |
| | | | | |
| Ratios/Supplemental Data | | | | |
| Ratio of Operating Expenses to Average Net Assets | 0.98% | 0.97% | 0.96% | 0.98%(4) |
| Ratio of Net Investment Income (Loss) to Average Net Assets | 1.75% | 3.29% | 2.70% | 2.50%(4) |
| Portfolio Turnover Rate | 83% | 131% | 108% | 51% |
| Net Assets, End of Period (in thousands) | $653 | $862 | $1,374 | $1,208 |
| (1) | November 30, 2006 (fund inception) through June 30, 2007. | | | | |
| (2) | Computed using average shares outstanding throughout the period. | | | | |
| (3) | Total return assumes reinvestment of net investment income and capital gains distributions, if any. Total returns for periods less than one year |
| | are not annualized. Total returns are calculated based on the net asset value of the last business day. The total return of the classes may not |
| | precisely reflect the class expense differences because of the impact of calculating the net asset values to two decimal places. If net asset |
| | values were calculated to three decimal places, the total return differences would more closely reflect the class expense differences. The |
| | calculation of net asset values to two decimal places is made in accordance with SEC guidelines and does not result in any gain or loss of value |
| | between one class and another. | | | | |
| (4) | Annualized. | | | | |
See Notes to Financial Statements.
26
| | | | | |
| International Core Equity | | | | |
| |
| A Class | | | | |
| For a Share Outstanding Throughout the Years Ended June 30 (except as noted) | | |
| | | 2010 | 2009 | 2008 | 2007(1) |
| Per-Share Data | | | | |
| Net Asset Value, Beginning of Period | $5.79 | $9.71 | $11.87 | $10.00 |
| Income From Investment Operations | | | | |
| Net Investment Income (Loss)(2) | 0.09 | 0.17 | 0.24 | 0.13 |
| Net Realized and Unrealized Gain (Loss) | 0.18 | (3.86) | (1.68) | 1.74 |
| Total From Investment Operations | 0.27 | (3.69) | (1.44) | 1.87 |
| Distributions | | | | |
| From Net Investment Income | (0.12) | (0.23) | (0.18) | — |
| From Net Realized Gains | — | — | (0.54) | — |
| Total Distributions | (0.12) | (0.23) | (0.72) | — |
| Net Asset Value, End of Period | $5.94 | $5.79 | $9.71 | $11.87 |
| |
| Total Return(3) | 4.42% | (38.00)% | (12.53)% | 18.70% |
| | | | | |
| Ratios/Supplemental Data | | | | |
| Ratio of Operating Expenses to Average Net Assets | 1.43% | 1.42% | 1.41% | 1.43%(4) |
| Ratio of Net Investment Income (Loss) to Average Net Assets | 1.30% | 2.84% | 2.25% | 2.05%(4) |
| Portfolio Turnover Rate | 83% | 131% | 108% | 51% |
| Net Assets, End of Period (in thousands) | $730 | $903 | $1,485 | $1,226 |
| (1) | November 30, 2006 (fund inception) through June 30, 2007. | | | | |
| (2) | Computed using average shares outstanding throughout the period. | | | | |
| (3) | Total return assumes reinvestment of net investment income and capital gains distributions, if any, and does not reflect applicable sales charges. |
| | Total returns for periods less than one year are not annualized. Total returns are calculated based on the net asset value of the last business day. |
| | The total return of the classes may not precisely reflect the class expense differences because of the impact of calculating the net asset values |
| | to two decimal places. If net asset values were calculated to three decimal places, the total return differences would more closely reflect the |
| | class expense differences. The calculation of net asset values to two decimal places is made in accordance with SEC guidelines and does not |
| | result in any gain or loss of value between one class and another. | | | | |
| (4) | Annualized. | | | | |
See Notes to Financial Statements.
27
| | | | | |
| International Core Equity | | | | |
| |
| B Class | | | | |
| For a Share Outstanding Throughout the Years Ended June 30 (except as noted) | | |
| | | 2010 | 2009 | 2008 | 2007(1) |
| Per-Share Data | | | | |
| Net Asset Value, Beginning of Period | $5.77 | $9.66 | $11.81 | $10.00 |
| Income From Investment Operations | | | | |
| Net Investment Income (Loss)(2) | 0.04 | 0.13 | 0.15 | 0.08 |
| Net Realized and Unrealized Gain (Loss) | 0.18 | (3.83) | (1.66) | 1.73 |
| Total From Investment Operations | 0.22 | (3.70) | (1.51) | 1.81 |
| Distributions | | | | |
| From Net Investment Income | (0.07) | (0.19) | (0.10) | — |
| From Net Realized Gains | — | — | (0.54) | — |
| Total Distributions | (0.07) | (0.19) | (0.64) | — |
| Net Asset Value, End of Period | $5.92 | $5.77 | $9.66 | $11.81 |
| |
| Total Return(3) | 3.64% | (38.34)% | (13.26)% | 18.20% |
| | | | | |
| Ratios/Supplemental Data | | | | |
| Ratio of Operating Expenses to Average Net Assets | 2.18% | 2.17% | 2.16% | 2.18%(4) |
| Ratio of Net Investment Income (Loss) to Average Net Assets | 0.55% | 2.09% | 1.50% | 1.30%(4) |
| Portfolio Turnover Rate | 83% | 131% | 108% | 51% |
| Net Assets, End of Period (in thousands) | $677 | $651 | $1,128 | $1,208 |
| (1) | November 30, 2006 (fund inception) through June 30, 2007. | | | | |
| (2) | Computed using average shares outstanding throughout the period. | | | | |
| (3) | Total return assumes reinvestment of net investment income and capital gains distributions, if any, and does not reflect applicable sales charges. |
| | Total returns for periods less than one year are not annualized. Total returns are calculated based on the net asset value of the last business day. |
| | The total return of the classes may not precisely reflect the class expense differences because of the impact of calculating the net asset values |
| | to two decimal places. If net asset values were calculated to three decimal places, the total return differences would more closely reflect the |
| | class expense differences. The calculation of net asset values to two decimal places is made in accordance with SEC guidelines and does not |
| | result in any gain or loss of value between one class and another. | | | | |
| (4) | Annualized. | | | | |
See Notes to Financial Statements.
28
| | | | | |
| International Core Equity | | | | |
| |
| C Class | | | | |
| For a Share Outstanding Throughout the Years Ended June 30 (except as noted) | | |
| | | 2010 | 2009 | 2008 | 2007(1) |
| Per-Share Data | | | | |
| Net Asset Value, Beginning of Period | $5.77 | $9.66 | $11.82 | $10.00 |
| Income From Investment Operations | | | | |
| Net Investment Income (Loss)(2) | 0.04 | 0.13 | 0.15 | 0.08 |
| Net Realized and Unrealized Gain (Loss) | 0.18 | (3.83) | (1.67) | 1.74 |
| Total From Investment Operations | 0.22 | (3.70) | (1.52) | 1.82 |
| Distributions | | | | |
| From Net Investment Income | (0.07) | (0.19) | (0.10) | — |
| From Net Realized Gains | — | — | (0.54) | — |
| Total Distributions | (0.07) | (0.19) | (0.64) | — |
| Net Asset Value, End of Period | $5.92 | $5.77 | $9.66 | $11.82 |
| |
| Total Return(3) | 3.64% | (38.34)% | (13.26)% | 18.20% |
| | | | | |
| Ratios/Supplemental Data | | | | |
| Ratio of Operating Expenses to Average Net Assets | 2.18% | 2.17% | 2.16% | 2.18%(4) |
| Ratio of Net Investment Income (Loss) to Average Net Assets | 0.55% | 2.09% | 1.50% | 1.30%(4) |
| Portfolio Turnover Rate | 83% | 131% | 108% | 51% |
| Net Assets, End of Period (in thousands) | $631 | $742 | $1,156 | $1,231 |
| (1) | November 30, 2006 (fund inception) through June 30, 2007. | | | | |
| (2) | Computed using average shares outstanding throughout the period. | | | | |
| (3) | Total return assumes reinvestment of net investment income and capital gains distributions, if any, and does not reflect applicable sales charges. |
| | Total returns for periods less than one year are not annualized. Total returns are calculated based on the net asset value of the last business day. |
| | The total return of the classes may not precisely reflect the class expense differences because of the impact of calculating the net asset values |
| | to two decimal places. If net asset values were calculated to three decimal places, the total return differences would more closely reflect the |
| | class expense differences. The calculation of net asset values to two decimal places is made in accordance with SEC guidelines and does not |
| | result in any gain or loss of value between one class and another. | | | | |
| (4) | Annualized. | | | | |
See Notes to Financial Statements.
29
| | | | | |
| International Core Equity | | | | |
| |
| R Class | | | | |
| For a Share Outstanding Throughout the Years Ended June 30 (except as noted) | | |
| | | 2010 | 2009 | 2008 | 2007(1) |
| Per-Share Data | | | | |
| Net Asset Value, Beginning of Period | $5.78 | $9.69 | $11.85 | $10.00 |
| Income From Investment Operations | | | | |
| Net Investment Income (Loss)(2) | 0.08 | 0.16 | 0.20 | 0.11 |
| Net Realized and Unrealized Gain (Loss) | 0.17 | (3.85) | (1.67) | 1.74 |
| Total From Investment Operations | 0.25 | (3.69) | (1.47) | 1.85 |
| Distributions | | | | |
| From Net Investment Income | (0.10) | (0.22) | (0.15) | — |
| From Net Realized Gains | — | — | (0.54) | — |
| Total Distributions | (0.10) | (0.22) | (0.69) | — |
| Net Asset Value, End of Period | $5.93 | $5.78 | $9.69 | $11.85 |
| |
| Total Return(3) | 4.16% | (38.13)% | (12.78)% | 18.50% |
| | | | | |
| Ratios/Supplemental Data | | | | |
| Ratio of Operating Expenses to Average Net Assets | 1.68% | 1.67% | 1.66% | 1.68%(4) |
| Ratio of Net Investment Income (Loss) to Average Net Assets | 1.05% | 2.59% | 2.00% | 1.80%(4) |
| Portfolio Turnover Rate | 83% | 131% | 108% | 51% |
| Net Assets, End of Period (in thousands) | $682 | $652 | $1,051 | $1,203 |
| (1) | November 30, 2006 (fund inception) through June 30, 2007. | | | | |
| (2) | Computed using average shares outstanding throughout the period. | | | | |
| (3) | Total return assumes reinvestment of net investment income and capital gains distributions, if any. Total returns for periods less than one year |
| | are not annualized. Total returns are calculated based on the net asset value of the last business day. The total return of the classes may not |
| | precisely reflect the class expense differences because of the impact of calculating the net asset values to two decimal places. If net asset |
| | values were calculated to three decimal places, the total return differences would more closely reflect the class expense differences. The |
| | calculation of net asset values to two decimal places is made in accordance with SEC guidelines and does not result in any gain or loss of value |
| | between one class and another. | | | | |
| (4) | Annualized. | | | | |
See Notes to Financial Statements.
30
|
| Report of Independent Registered Public Accounting Firm |
To the Directors of the American Century Quantitative Equity Funds, Inc.
and Shareholders of the International Core Equity Fund:
In our opinion, the accompanying statement of assets and liabilities, including the schedule of investments, and the related statements of operations and of changes in net assets and the financial highlights present fairly, in all material respects, the financial position of the International Core Equity Fund (one of the eleven funds comprising the American Century Quantitative Equity Funds, Inc., hereafter referred to as the “Fund”) at June 30, 2010, the results of its operations for the year then ended, the changes in its net assets for each of the two years in the period then ended and the financial highlights for each of the periods presented, in conformity with accounting principles generally accepted in the United States of America. These financial statements and financial highlights (hereafter referred to as “financial statements”) are the responsibility of the Fund’s management; ou r responsibility is to express an opinion on these financial statements based on our audits. We conducted our audits of these financial statements in accordance with the standards of the Public Company Accounting Oversight Board (United States). Those standards require that we plan and perform the audit to obtain reasonable assurance about whether the financial statements are free of material misstatement. An audit includes examining, on a test basis, evidence supporting the amounts and disclosures in the financial statements, assessing the accounting principles used and significant estimates made by management, and evaluating the overall financial statement presentation. We believe that our audits, which included confirmation of securities at June 30, 2010 by correspondence with the custodian, provide a reasonable basis for our opinion.
PricewaterhouseCoopers LLP
Kansas City, Missouri
August 19, 2010
31
A special meeting of shareholders was held on June 16, 2010, to vote on the following proposals. Each proposal received the required number of votes and was adopted. A summary of voting results is listed below each proposal.
Proposal 1:
To elect one Director to the Board of Directors of American Century Quantitative Equity Funds, Inc. (the proposal was voted on by all shareholders of funds issued by American Century Quantitative Equity Funds, Inc.):
| | |
| Frederick L.A. Grauer | For: | 4,067,909,978 |
| | Withhold: | 174,470,448 |
| | Abstain: | 0 |
| | Broker Non-Vote: | 0 |
The other directors whose term of office continued after the meeting include Jonathan S. Thomas, John Freidenrich, Ronald J. Gilson, Peter F. Pervere, Myron S. Scholes, and John B. Shoven.
Proposal 2:
To approve a management agreement between the fund and American Century Investment Management, Inc.:
| | |
| Investor, A, B, C and R Classes | For: | 4,032,551 |
| | Against: | 58,861 |
| | Abstain: | 49,039 |
| | Broker Non-Vote: | 434,027 |
| |
| Institutional Class | For: | 669,545 |
| | Against: | 0 |
| | Abstain: | 0 |
| | Broker Non-Vote: | 0 |
32
The Board of Directors
The individuals listed below serve as directors of the fund. Each director will continue to serve in this capacity until death, retirement, resignation or removal from office. The mandatory retirement age for directors who are not “interested persons,” as that term is defined in the Investment Company Act (independent directors), is 73. However, the mandatory retirement age may be extended for a period not to exceed two years with the approval of the remaining independent directors.
Mr. Thomas is the only director who is an “interested person” because he currently serves as President and Chief Executive Officer of American Century Companies, Inc. (ACC), the parent company of American Century Investment Management, Inc. (ACIM or the advisor).
The other directors (more than three-fourths of the total number) are independent; that is, they have never been employees, directors or officers of, and have no financial interest in, ACC or any of its wholly owned, direct or indirect, subsidiaries, including ACIM, American Century Investment Services, Inc. (ACIS) and American Century Services, LLC (ACS). The directors serve in this capacity for eight (in the case of Mr. Thomas, 15) registered investment companies in the American Century Investments family of funds.
The following presents additional information about the directors. The mailing address for each director other than Mr. Thomas is 1665 Charleston Road, Mountain View, California 94043. The mailing address for Mr. Thomas is 4500 Main Street, Kansas City, Missouri 64111.
Independent Directors
John Freidenrich
Year of Birth: 1937
Position(s) with the Fund: Director
Length of Time Served: Since 2005
Principal Occupation(s) During the Past Five Years: Founder, Member and Manager, Regis
Management Company, LLC (investment management firm) (April 2004 to present)
Number of Funds in Fund Complex Overseen by Director: 41
Other Directorships Held by Director During the Past Five Years: None
Education/Other Professional Experience: AB in Economics, Stanford University; LLB,
Stanford Law School; formerly, Partner and Founder, Ware and Freidenrich Law
Firm and Bay Partners; formerly, President, Board of Trustees, Stanford University
Ronald J. Gilson
Year of Birth: 1946
Position(s) with the Fund: Director and Chairman of the Board
Length of Time Served: Since 1995
Principal Occupation(s) During the Past Five Years: Charles J. Meyers Professor of Law and
Business, Stanford Law School (1979 to present); Marc and Eva Stern Professor of
Law and Business, Columbia University School of Law (1992 to present)
Number of Funds in Fund Complex Overseen by Director: 41
Other Directorships Held by Director During the Past Five Years: None
Education/Other Professional Experience: BA, Washington University; JD, Yale Law School;
formerly, Attorney, Steinhart, Goldberg, Feigenbaum & Ladar
33
Frederick L. A. Grauer
Year of Birth: 1946
Position(s) with the Fund: Director
Length of Time Served: Since 2008
Principal Occupation(s) During the Past Five Years: Senior Advisor, BlackRock, Inc. (investment
management firm) (2010 to present); Senior Advisor, Barclays Global Investors
(investment management firm) (2003 to 2009)
Number of Funds in Fund Complex Overseen by Director: 41
Other Directorships Held by Director During the Past Five Years: None
Education/Other Professional Experience: BA in Economics, University of British Columbia;
MA in Economics, University of Chicago; PhD in Business, Stanford University;
formerly, Executive Chairman, Barclays Global Investors; Chairman and Chief
Executive Officer, Wells Fargo Nikko Investment Advisors; and Vice President,
Merrill Lynch Capital Markets Group; formerly, Director, New York Stock Exchange,
Chicago Mercantile Exchange and Columbia University; formerly, Faculty Member,
Graduate School of Business, Columbia University and Alfred P. Sloan School of
Management, Massachusetts Institute of Technology
Peter F. Pervere
Year of Birth: 1947
Position(s) with the Fund: Director
Length of Time Served: Since 2007
Principal Occupation(s) During the Past Five Years: Retired
Number of Funds in Fund Complex Overseen by Director: 41
Other Directorships Held by Director During the Past Five Years: Intraware, Inc. (2003 to 2009);
Digital Impact, Inc. (2003 to 2005)
Education/Other Professional Experience: BA in History, Stanford University; CPA; formerly,
Vice President and Chief Financial Officer, Commerce One, Inc. (software and
services provider); formerly, Vice President and Corporate Controller, Sybase, Inc.;
formerly with accounting firm of Arthur Young & Co.
Myron S. Scholes
Year of Birth: 1941
Position(s) with the Fund: Director
Length of Time Served: Since 1980
Principal Occupation(s) During the Past Five Years: Chairman, Platinum Grove Asset
Management, L.P. (asset manager) (1999 to 2009); Frank E. Buck Professor of
Finance-Emeritus, Stanford Graduate School of Business (1996 to present)
Number of Funds in Fund Complex Overseen by Director: 41
Other Directorships Held by Director During the Past Five Years: Dimensional Fund Advisors
(investment advisor); CME Group, Inc. (futures and options exchange)
Education/Other Professional Experience: BA in Economics, McMaster University (Ontario);
MBA and PhD, University of Chicago; formerly, Senior Research Fellow at the
Hoover Institute; formerly, Edward Eagle Brown Professor of Finance, University
of Chicago; recipient of the Alfred Nobel Memorial Prize in Economic Sciences
34
John B. Shoven
Year of Birth: 1947
Position(s) with the Fund: Director
Length of Time Served: Since 2002
Principal Occupation(s) During the Past Five Years: Professor of Economics, Stanford University
(1973 to present)
Number of Funds in Fund Complex Overseen by Director: 41
Other Directorships Held by Director During the Past Five Years: Cadence Design Systems;
Exponent; Financial Engines; PalmSource, Inc. (2002 to 2005); Watson Wyatt
Worldwide (2002 to 2006)
Education/Other Professional Experience: BA in Physics, University of California; PhD in
Economics, Yale University; Director of the Stanford Institute for Economic Policy
Research (1999 to present); formerly, Chair of Economics and Dean of Humanities
and Sciences, Stanford University
Interested Director
Jonathan S. Thomas
Year of Birth: 1963
Position(s) with the Fund: Director and President
Length of Time Served: Since 2007
Principal Occupation(s) During the Past Five Years: President and Chief Executive Officer,
ACC (March 2007 to present); Chief Administrative Officer, ACC (February 2006 to
February 2007); Executive Vice President, ACC (November 2005 to February 2007);
Global Chief Operating Officer and Managing Director, Morgan Stanley (investment
management) (March 2000 to November 2005). Also serves as: Chief Executive
Officer and Manager, ACS; Executive Vice President, ACIM; Director, ACC, ACIM
and other ACC subsidiaries
Number of Funds in Fund Complex Overseen by Director: 104
Other Directorships Held by Director During the Past Five Years: None
Education/Other Professional Experience: BA in Economics, University of Massachusetts;
MBA, Boston College; formerly held senior leadership roles with Fidelity
Investments, Boston Financial Services and Bank of America; serves on the Board
of Governors of the Investment Company Institute
35
Officers
The following table presents certain information about the executive officers of the fund. Each officer serves as an officer for each of the 15 investment companies in the American Century family of funds, unless otherwise noted. No officer is compensated for his or her service as an officer of the fund. The listed officers are interested persons of the fund and are appointed or re-appointed on an annual basis. The mailing address for each of the officers listed below is 4500 Main Street, Kansas City, Missouri 64111.
| | |
| Name | Offices with | |
| (Year of Birth) | the Fund | Principal Occupation(s) During the Past Five Years |
| Jonathan S. | Director and | President and Chief Executive Officer, ACC (March 2007 to present); |
| Thomas | President | Chief Administrative Officer, ACC (February 2006 to February 2007); |
| (1963) | since 2007 | Executive Vice President, ACC (November 2005 to February 2007); Global |
| | | Chief Operating Officer and Managing Director, Morgan Stanley (March |
| | | 2000 to November 2005). Also serves as: Chief Executive Officer and |
| | | Manager, ACS; Executive Vice President, ACIM; Director, ACC, ACIM and |
| | | other ACC subsidiaries |
| Barry Fink | Executive Vice | Chief Operating Officer and Executive Vice President, ACC (September 2007 |
| (1955) | President | to present); President, ACS (October 2007 to present); Managing Director, |
| | since 2007 | Morgan Stanley (2000 to 2007); Global General Counsel, Morgan Stanley |
| | | (2000 to 2006). Also serves as: Manager, ACS, and Director, ACC and |
| | | certain ACC subsidiaries |
| Maryanne L. | Chief Compliance | Chief Compliance Officer, American Century funds, ACIM and ACS (August |
| Roepke | Officer since 2006 | 2006 to present); Assistant Treasurer, ACC (January 1995 to August 2006); |
| (1956) | and Senior Vice | and Treasurer and Chief Financial Officer, various American Century funds |
| | President | (July 2000 to August 2006). Also serves as: Senior Vice President, ACS |
| | since 2000 | |
| Charles A. | General Counsel | Attorney, ACC (February 1994 to present); Vice President, ACC (November |
| Etherington | since 2007 and | 2005 to present); General Counsel, ACC (March 2007 to present); Also |
| (1957) | Senior Vice | serves as General Counsel, ACIM, ACS, ACIS and other ACC subsidiaries; |
| | President | and Senior Vice President, ACIM and ACS |
| | since 2006 | |
| Robert J. Leach | Vice President, | Vice President, ACS (February 2000 to present); and Controller, various |
| (1966) | Treasurer and | American Century funds (1997 to September 2006) |
| | Chief Financial | |
| | Officer since 2006 | |
| David H. Reinmiller | Vice President | Attorney, ACC (January 1994 to present); Associate General Counsel, ACC |
| (1963) | since 2001 | (January 2001 to present); Chief Compliance Officer, American Century |
| | | funds and ACIM (January 2001 to February 2005). Also serves as: Vice |
| | | President, ACIM and ACS |
| Ward D. Stauffer | Secretary | Attorney, ACC (June 2003 to Present) |
| (1960) | since 2005 | |
The SAI has additional information about the fund’s directors and is available without charge, upon request, by calling 1-800-345-2021.
36
|
| Board Approval of Management Agreements |
American Century Investment Management, Inc. (“ACIM” or the “Advisor”) currently serves as investment advisor to the Fund under a management agreement (the “Current Management Agreement”) that took effect on July 16, 2010, following approval by the Fund’s Board of Directors (the “Board”) and shareholders. The Advisor previously served as investment advisor to the Fund pursuant to a prior management agreement (the “Prior Management Agreement”) and an interim management agreement (the “Interim Management Agreement”). The Interim Management Agreement terminated in accordance with its terms on July 16, 2010, upon the effectiveness of the Current Management Agreement. The Prior Management Agreement terminated on February 16, 2010, as a result of a change of control of the Advisor’s parent company, American Century Companies, Inc. (“ACC”). T he change in control occurred as the result of a change in the trustee of a trust created by James E. Stowers, Jr., the founder of American Century Investments that holds shares representing a significant interest in ACC stock. Mr. Stowers previously served as the trustee of the trust. On February 16, 2010, Richard W. Brown, Co-Chairman of ACC with Mr. Stowers, became the trustee in accordance with the terms of the trust and Mr. Stowers’ long-standing estate and succession plan.
On February 18, 2010, the Board approved the Interim Management Agreement in accordance with Rule 15a-4 under the Investment Company Act to ensure continued management of the Fund by the Advisor after the termination of the Prior Management Agreement and until shareholder approval of the Current Management Agreement as required under the Act. The Board approved the Current Management Agreement and recommended its approval to shareholders. Fund shareholders approved the Current Management Agreement at a meeting held on June 16, 2010.
The Interim Management Agreement and the Current Management Agreement are substantially identical to the Prior Management Agreement except for their effective dates and the termination provisions of the Interim Management Agreement. Under the Interim and Current Management Agreements, the Advisor will provide the same services to the Fund and receive the same compensation rate as under the Prior Management Agreement.
Basis for Board Approval of Interim Management Agreement
In considering the approval of the Interim Management Agreement, Rule 15a-4 requires the Board to approve the contract within ten business days of the termination of the prior agreement and to determine that the compensation to be received under the interim agreement is no greater than would have been received under the prior agreement. In connection with the approval, the Board noted that it oversees on a continuous basis and evaluates at its quarterly meetings, directly and through the committees of the Board, the nature and quality of significant services provided by the Advisor, the investment performance of the Fund, shareholder services, audit and compliance functions and a variety of other matters relating to the Fund’s operations.
37
In evaluating the Interim Management Agreement, the Board, assisted by the advice of its independent legal counsel, considered a number of factors in addition to those required by the rule with no one factor being determinative to its analysis. Among the factors considered by the Board were the circumstances and effect of the change of control, the fact that the Advisor will provide the same services and receive the same compensation rate as under the Prior Management Agreement, and that the change of control did not result in a change of the personnel managing the Fund. Upon completion of its analysis, the Board approved the Interim Management Agreement, determining that the continued management of the Fund by the Advisor was in the best interests of the Fund and Fund shareholders.
Basis for Board Approval of Current Management Agreement
At a meeting held on April 1, 2010, after considering all information presented, the Board approved, and determined to recommend that shareholders approve, the Current Management Agreement. In connection with that approval, the Board requested and reviewed extensive data and information compiled by the Advisor and certain independent providers of evaluation data concerning the Fund and services provided to the Fund by the Advisor. The Board oversees on a continuous basis and evaluates at its quarterly meetings, directly and through the committees of the Board, the nature and quality of significant services provided by the Advisor, the investment performance of the Fund, shareholder services, audit and compliance functions and a variety of other matters relating to the Fund’s operations. The information considered and the discussions held at the meetings included, but were not limited to:
• the nature, extent and quality of investment management, shareholder services and other services provided to the Fund;
• the wide range of programs and services the Advisor provides to the Fund and its shareholders on a routine and non-routine basis;
• the compliance policies, procedures, and regulatory experience of the Advisor;
• data comparing the cost of owning the Fund to the cost of owning similar funds;
• the fact that there will be no changes to the fees, services, or personnel who provide such services as compared to the Prior Management Agreement;
• data comparing the Fund’s performance to appropriate benchmarks and/or a peer group of other mutual funds with similar investment objectives and strategies;
• financial data showing the profitability of the Fund to the Advisor and the overall profitability of the Advisor;
• data comparing services provided and charges to the Fund with those for other non-fund investment management clients of the Advisor; and
38
• consideration of collateral or “fall-out” benefits derived by the Advisor from the management of the Fund and potential sharing of economies of scale in connection with the management of the Fund.
The Board also considered whether there was any reason for not continuing the existing arrangement with the Advisor. In particular, the Board recognized that shareholders may have invested in the Fund on the strength of the Advisor’s industry standing and reputation and in the expectation that the Advisor will have a continuing role in providing advisory services to the Fund.
The Board considered all of the information provided by the Advisor, the independent data providers, and the Board’s independent legal counsel, and evaluated such information for the Fund. The Board did not identify any single factor as being all-important or controlling, and each Board member may have attributed different levels of importance to different factors. In deciding to approve the Current Management Agreement under the terms ultimately determined by the Board to be appropriate, the Board based its decision on a number of factors, including the following:
Nature, Extent and Quality of Services — Generally. Under the Current Management Agreement, the Advisor is responsible for providing or arranging for all services necessary for the operation of the Fund. The Board noted that under the Current Management Agreement, the Advisor provides or arranges at its own expense a wide variety of services including:
• constructing and designing the Fund
• portfolio research and security selection
• initial capitalization/funding
• securities trading
• Fund administration
• custody of Fund assets
• daily valuation of the Fund’s portfolio
• shareholder servicing and transfer agency, including shareholder
confirmations, recordkeeping and communications
• legal services
• regulatory and portfolio compliance
• financial reporting
• marketing and distribution
39
The Board noted that many of these services have expanded over time both in terms of quantity and complexity in response to shareholder demands, competition in the industry, changing distribution channels and the changing regulatory environment.
Investment Management Services. The investment management services provided to the Fund are complex and provide Fund shareholders access to professional money management, instant diversification of their investments within an asset class, the opportunity to easily diversify among asset classes, and liquidity. As a part of its general oversight and in evaluating investment performance, the Board expects the Advisor to manage the Fund in accordance with its investment objectives and approved strategies. In providing these services, the Advisor utilizes teams of investment professionals who require extensive information technology, research, training, compliance and other systems to conduct their business. The Board, directly and through its Portfolio Committee, regularly reviews investment performance information for the Fund, t ogether with comparative information for appropriate benchmarks and/or peer groups of similarly-managed funds, over different time horizons. If performance concerns are identified, the underperforming Fund receives special reviews until performance improves, during which time the Board discusses with the Advisor the reasons for such underperformance and any efforts being undertaken to improve performance.
Shareholder and Other Services. Under the Current Management Agreement, the Advisor will also provide the Fund with a comprehensive package of transfer agency, shareholder, and other services. The Board, directly and through the various committees of the Board, regularly reviews reports and evaluations of such services. These reports include, but are not limited to, information regarding the operational efficiency and accuracy of the shareholder and transfer agency services provided, staffing levels, shareholder satisfaction (as measured by external as well as internal sources), technology support, new products and services offered to Fund shareholders, securities trading activities, portfolio valuation services, auditing services, and legal and operational compliance activities. Certain aspects of shareholder and transfer age ncy service level efficiency and the quality of securities trading activities are measured by independent third party providers and are presented in comparison to other fund groups not managed by the Advisor.
Costs of Services Provided and Profitability. The Advisor provided detailed information concerning its cost of providing various services to the Fund, its profitability in managing the Fund, its overall profitability, and its financial condition. The Board reviewed with the Advisor the methodology used to prepare this financial information. The Board has also reviewed with the Advisor its methodology for compensating the investment professionals that provide services to the Fund as well as compensation to the five highest paid personnel of the Advisor. This financial information regarding the Advisor is considered in order to evaluate the Advisor’s financial condition, its ability to continue to provide services under the Current Management Agreement, and the reasonableness of the current management fees.
40
Ethics. The Board generally considers the Advisor’s commitment to providing quality services to shareholders and to conducting its business ethically. It noted that the Advisor’s practices generally meet or exceed industry best practices.
Economies of Scale. The Board also reviewed information provided by the Advisor regarding the possible existence of economies of scale in connection with the management of the Fund. The Board concluded that economies of scale are difficult to measure and predict with precision, especially on a fund-by-fund basis. The analysis of economies of scale is further complicated by the additional services and content provided by the Advisor and its reinvestment in its ability to provide and expand those services. Accordingly, the Board seeks to evaluate economies of scale by reviewing information, such as year-over-year profitability of the Advisor generally, the profitability of its management of the Fund specifically, and the expenses incurred by the Advisor in providing various functions to the Fund. The Board believes the Advisor i s appropriately sharing economies of scale through its competitive fee structure, offering competitive fees from fund inception, fee breakpoints as the fund complex and the Fund increases in size, and through reinvestment in its business to provide shareholders additional services and enhancements to existing services. In particular, separate breakpoint schedules based on the size of the entire fund complex and on the size of the Fund reflect the complexity of assessing economies of scale.
Comparison to Fees of Funds not Managed by the Advisor. Both the Prior and Current Management Agreements provide that the Fund pays the Advisor a single, all-inclusive (or unified) management fee for providing all services necessary for the management and operation of the Fund, other than brokerage expenses, taxes, interest, extraordinary expenses, and the fees and expenses of the Fund’s Independent Directors (including their independent legal counsel) and expenses incurred in connection with the provision of shareholder services and distribution services under a plan adopted pursuant to Rule 12b-1 under the 1940 Act. Under the unified fee structure, the Advisor is responsible for providing all investment advisory, custody, audit, administrative, compliance, recordkeeping, marketing and shareholder services, or arranging and supervising third parties that provide such services. By contrast, most other funds are charged a variety of fees, including an investment advisory fee, a transfer agency fee, an administrative fee, distribution charges and other expenses. Other than their investment advisory fees and any applicable Rule 12b-1 distribution fees, the components of the total fees charged by these other funds may be increased without shareholder approval. The Board believes the unified fee structure is a benefit to Fund shareholders because it clearly discloses to shareholders the cost of owning Fund shares, and, since the unified fee cannot be increased without a vote of Fund shareholders, it shifts to the Advisor the risk of increased costs of operating the Fund and provides a direct incentive to minimize administrative inefficiencies. Part of the Board’s analysis of fee levels involves reviewing certain evaluative data compiled by an independent provider comparing the Fund’s unified fee to the total expense rat ios of similar funds not managed by the Advisor. The
41
Board concluded that the management fee to be paid by the Fund to the Advisor under the Current Management Agreement is reasonable in light of the services to be provided to the Fund.
Comparison to Fees and Services Provided to Other Clients of the Advisor. The Board also requested and received information from the Advisor concerning the nature and extent of the services, fees, and profitability of its advisory services to advisory clients other than the Fund. They observed that these varying types of client accounts require different services and involve different regulatory and entrepreneurial risks than the management of the Fund. The Board analyzed this information and concluded that the fees charged and services provided to the Fund were reasonable by comparison.
Collateral or “Fall-Out” Benefits Derived by the Advisor. The Board considered the existence of collateral benefits the Advisor may receive as a result of its relationship with the Fund. The Board concluded that the Advisor’s primary business is managing mutual funds and it generally does not use Fund or shareholder information to generate profits in other lines of business, and therefore does not derive any significant collateral benefits from them. The Board noted that the Advisor receives proprietary research from broker-dealers that execute Fund portfolio transactions and concluded that this research is likely to benefit Fund shareholders. The Board also determined that the Advisor is able to provide investment management services to certain clients other than the Fund, at least in part, due to its existing infrastructure built to serve the fund complex. The Board concluded, however, that the assets of those other clients are not material to the analysis and, in any event, are included with the assets of the Fund to determine breakpoints in the Fund’s fee schedule, provided they are managed using the same investment team and strategy.
Conclusion of the Board. As a result of this process, the Board, in the absence of particular circumstances and assisted by the advice of its independent legal counsel, taking into account all of the factors discussed above and the information provided by the Advisor and others, concluded that the Current Management Agreement be approved and recommended its approval to Fund shareholders.
42
Retirement Account Information
As required by law, distributions you receive from certain IRAs, or 403(b), 457 and qualified plans are subject to federal income tax withholding, unless you elect not to have withholding apply. Tax will be withheld on the total amount withdrawn even though you may be receiving amounts that are not subject to withholding, such as nondeductible contributions. In such case, excess amounts of withholding could occur. You may adjust your withholding election so that a greater or lesser amount will be withheld.
If you don’t want us to withhold on this amount, you must notify us to not withhold the federal income tax. You may notify us in writing or in certain situations by telephone or through other electronic means. You have the right to revoke your withholding election at any time and any election you make may remain in effect until revoked by filing a new election.
Remember, even if you elect not to have income tax withheld, you are liable for paying income tax on the taxable portion of your withdrawal. If you elect not to have income tax withheld or you don’t have enough income tax withheld, you may be responsible for payment of estimated tax. You may incur penalties under the estimated tax rules if your withholding and estimated tax payments are not sufficient. You can reduce or defer the income tax on a distribution by directly or indirectly rolling such distribution over to another IRA or eligible plan. You should consult your tax advisor for additional information.
State tax will be withheld if, at the time of your distribution, your address is within one of the mandatory withholding states and you have federal income tax withheld. State taxes will be withheld from your distribution in accordance with the respective state rules.
Proxy Voting Guidelines
American Century Investment Management, Inc., the fund’s investment advisor, is responsible for exercising the voting rights associated with the securities purchased and/or held by the fund. A description of the policies and procedures the advisor uses in fulfilling this responsibility is available without charge, upon request, by calling 1-800-345-2021. It is also available on American Century Investments’ website at americancentury.com and on the Securities and Exchange Commission’s website at sec.gov. Information regarding how the investment advisor voted proxies relating to portfolio securities during the most recent 12-month period ended June 30 is available on the “About Us” page at americancentury.com. It is also available at sec.gov.
Quarterly Portfolio Disclosure
The fund files its complete schedule of portfolio holdings with the Securities and Exchange Commission (SEC) for the first and third quarters of each fiscal year on Form N-Q. The fund’s Forms N-Q are available on the SEC’s website at sec.gov, and may be reviewed and copied at the SEC’s Public Reference Room in Washington, DC. Information on the operation of the Public Reference Room may be obtained by calling 1-800-SEC-0330. The fund also makes its complete schedule of portfolio holdings for the most recent quarter of its fiscal year available on its website at americancentury.com and, upon request, by calling 1-800-345-2021.
43
The following indices are used to illustrate investment market, sector, or style performance or to serve as fund performance comparisons. They are not investment products available for purchase.
Morgan Stanley Capital International (MSCI) has developed several indices that measure the performance of foreign stock markets.
The MSCI EAFE (Europe, Australasia, Far East) Index is designed to measure developed market equity performance, excluding the U.S. and Canada.
The MSCI EAFE Growth Index is a capitalization-weighted index that monitors the performance of growth stocks from Europe, Australasia, and the Far East.
The MSCI EAFE Value Index is a capitalization-weighted index that monitors the performance of value stocks from Europe, Australasia, and the Far East.
The MSCI EM (Emerging Markets) Index represents the performance of stocks in global emerging market countries.
The MSCI Europe Index is designed to measure equity market performance in Europe.
The MSCI Japan Index is designed to measure equity market performance in Japan.
The MSCI Pacific Free ex-Japan Index is a free float-adjusted market capitalization index that is designed to measure equity market performance in the Pacific region, excluding Japan.
The MSCI World Free Index represents the performance of stocks in developed countries (including the United States) that are available for purchase by global investors.
44

| |
| |
| Contact Us | |
| americancentury.com | |
| Automated Information Line | 1-800-345-8765 |
| Investor Services Representative | 1-800-345-2021 or |
| | 816-531-5575 |
| Investors Using Advisors | 1-800-378-9878 |
| Business, Not-For-Profit, Employer-Sponsored | |
| Retirement Plans | 1-800-345-3533 |
| Banks and Trust Companies, Broker-Dealers, | |
| Financial Professionals, Insurance Companies | 1-800-345-6488 |
| Telecommunications Device for the Deaf | 1-800-634-4113 |
| American Century Quantitative Equity Funds, Inc. | |
| Investment Advisor: | |
| American Century Investment Management, Inc. | |
| Kansas City, Missouri | |
This report and the statements it contains are submitted for the general
information of our shareholders. The report is not authorized for distribution to
prospective investors unless preceded or accompanied by an effective prospectus.
American Century Investment Services, Inc., Distributor
©2010 American Century Proprietary Holdings, Inc. All rights reserved.
1008
CL-ANN-69045
| | | |
| ITEM 2. CODE OF ETHICS. |
|
| (a) | | The registrant has adopted a Code of Ethics for Senior Financial Officers that applies to the |
| | | registrant’s principal executive officer, principal financial officer, principal accounting officer, |
| | | and persons performing similar functions. |
| | |
| (b) | | No response required. |
| | |
| (c) | | None. | |
| | | |
| (d) | | None. | |
| | | |
| (e) | | Not applicable. |
| | |
| (f) | | The registrant’s Code of Ethics for Senior Financial Officers was filed as Exhibit 12 (a)(1) to |
| | | American Century Asset Allocation Portfolios, Inc.’s Annual Certified Shareholder Report on |
| | | Form N-CSR, File No. 811-21591, on September 29, 2005, and is incorporated herein by |
| | | reference. | |
|
| ITEM 3. AUDIT COMMITTEE FINANCIAL EXPERT. |
|
| (a) | (1) | The registrant's board has determined that the registrant has at least one audit committee |
| | | financial expert serving on its audit committee. |
| | |
| (a) | (2) | Peter F. Pervere and Ronald J. Gilson are the registrant's designated audit committee financial |
| | | experts. They are "independent" as defined in Item 3 of Form N-CSR. |
| | |
| (a) | (3) | Not applicable. |
| | |
| (b) | | No response required. |
| | |
| (c) | | No response required. |
| | |
| (d) | | No response required. |
|
| ITEM 4. PRINCIPAL ACCOUNTANT FEES AND SERVICES. |
|
| (a) | | Audit Fees. | |
| |
| The aggregate fees billed for each of the last two fiscal years for professional services rendered by the |
| principal accountant for the audit of the registrant’s annual financial statements or services that are |
| normally provided by the accountant in connection with statutory and regulatory filings or engagements |
| for those fiscal years were as follows: |
| |
| | | FY 2009: | $262,760 |
| | | FY 2010: | $276,995 |
| | | |
| (b) | | Audit-Related Fees. |
| | |
| The aggregate fees billed in each of the last two fiscal years for assurance and related services by the |
| principal accountant that are reasonably related to the performance of the audit of the registrant’s |
| financial statements and are not reported under paragraph (a) of this Item were as follows: |
| For services rendered to the registrant: |
| | | | |
| | | FY 2009 : | $0 |
| | | FY 2010 : | $0 |
| |
| | | Fees required to be approved pursuant to paragraph (c)(7)(ii) of Rule 2-01 of Regulation S-X |
| | | (relating to certain engagements for non-audit services with the registrant’s investment adviser |
| | | and its affiliates): |
| |
| | | FY 2009: | $0 |
| | | FY 2010: | $0 |
| |
| (c) | | Tax Fees. | | |
| |
| The aggregate fees billed in each of the last two fiscal years for professional services rendered by the |
| principal accountant for tax compliance, tax advice, and tax planning were as follows: |
| |
| | | For services rendered to the registrant: |
| |
| | | FY 2009: | $0 |
| | | FY 2010: | $0 |
| |
| | | Fees required to be approved pursuant to paragraph (c)(7)(ii) of Rule 2-01 of Regulation S-X |
| | | (relating to certain engagements for non-audit services with the registrant’s investment adviser |
| | | and its affiliates): |
| |
| | | FY 2009: | $0 |
| | | FY 2010: | $0 |
| |
| (d) | | All Other Fees. |
| |
| The aggregate fees billed in each of the last two fiscal years for products and services provided by the |
| principal accountant, other than the services reported in paragraphs (a) through (c) of this Item were as |
| follows: | | | |
| |
| | | For services rendered to the registrant: |
| |
| | | FY 2009: | $0 |
| | | FY 2010: | $0 |
| |
| | | Fees required to be approved pursuant to paragraph (c)(7)(ii) of Rule 2-01 of Regulation S-X |
| | | (relating to certain engagements for non-audit services with the registrant’s investment adviser |
| | | and its affiliates): |
| |
| | | FY 2009: | $0 |
| | | FY 2010: | $0 |
| |
| (e) | (1) | In accordance with paragraph (c)(7)(i)(A) of Rule 2-01 of Regulation S-X, before the |
| | | accountant is engaged by the registrant to render audit or non-audit services, the engagement is |
| | | approved by the registrant’s audit committee. Pursuant to paragraph (c)(7)(ii) of Rule 2-01 of |
| | | Regulation S-X, the registrant’s audit committee also pre-approves its accountant’s |
| | | |
| | | engagements for non-audit services with the registrant’s investment adviser, its parent company, |
| | | and any entity controlled by, or under common control with the investment adviser that |
| | | provides ongoing services to the registrant, if the engagement relates directly to the operations |
| | | and financial reporting of the registrant. |
| |
| (e) | (2) | All services described in each of paragraphs (b) through (d) of this Item were pre-approved |
| | | before the engagement by the registrant’s audit committee pursuant to paragraph (c)(7)(i)(A) of |
| | | Rule 2-01 of Regulation S-X. Consequently, none of such services were required to be |
| | | approved by the audit committee pursuant to paragraph (c)(7)(i)(C). |
| |
| (f) | | The percentage of hours expended on the principal accountant’s engagement to audit the |
| | | registrant’s financial statements for the most recent fiscal year that were attributed to work |
| | | performed by persons other than the principal accountant’s full-time, permanent employees was |
| | | less than 50%. | |
| |
| (g) | | The aggregate non-audit fees billed by the registrant’s accountant for services rendered to the |
| | | registrant, and rendered to the registrant’s investment adviser (not including any sub-adviser |
| | | whose role is primarily portfolio management and is subcontracted with or overseen by another |
| | | investment adviser), and any entity controlling, controlled by, or under common control with |
| | | the adviser that provides ongoing services to the registrant for each of the last two fiscal years |
| | | of the registrant were as follows: |
| |
| | | FY 2009: | $134,350 |
| | | FY 2010: | $178,950 |
| |
| (h) | | The registrant’s investment adviser and accountant have notified the registrant’s audit |
| | | committee of all non-audit services that were rendered by the registrant’s accountant to the |
| | | registrant’s investment adviser, its parent company, and any entity controlled by, or under |
| | | common control with the investment adviser that provides services to the registrant, which |
| | | services were not required to be pre-approved pursuant to paragraph (c)(7)(ii) of Rule 2-01 of |
| | | Regulation S-X. The notification provided to the registrant’s audit committee included |
| | | sufficient details regarding such services to allow the registrant’s audit committee to consider |
| | | the continuing independence of its principal accountant. |
| |
| ITEM 5. AUDIT COMMITTEE OF LISTED REGISTRANTS. |
| |
| Not applicable. | |
| |
| ITEM 6. INVESTMENTS. |
| |
| (a) | | The schedule of investments is included as part of the report to stockholders filed under Item 1 |
| | | of this Form. | |
| |
| (b) | | Not applicable. |
| |
| ITEM 7. DISCLOSURE OF PROXY VOTING POLICIES AND PROCEDURES FOR |
| CLOSED-END MANAGEMENT INVESTMENT COMPANIES. |
| |
| Not applicable. | |
| | |
| ITEM 8. PORTFOLIO MANAGERS OF CLOSED-END MANAGEMENT |
| INVESTMENT COMPANIES. |
| |
| Not applicable. |
| |
| ITEM 9. PURCHASES OF EQUITY SECURITIES BY CLOSED-END MANAGEMENT |
| INVESTMENT COMPANY AND AFFILIATED PURCHASERS. |
| |
| Not applicable. |
| |
| ITEM 10. SUBMISSION OF MATTERS TO A VOTE OF SECURITY HOLDERS. |
| |
| During the reporting period, there were no material changes to the procedures by which shareholders may |
| recommend nominees to the registrant’s board. |
| |
| ITEM 11. CONTROLS AND PROCEDURES. |
| |
| (a) | | The registrant's principal executive officer and principal financial officer have concluded that |
| | | the registrant's disclosure controls and procedures (as defined in Rule 30a-3(c) under the |
| | | Investment Company Act of 1940) are effective based on their evaluation of these controls and |
| | | procedures as of a date within 90 days of the filing date of this report. |
| |
| (b) | | There were no changes in the registrant's internal control over financial reporting (as defined in |
| | | Rule 30a-3(d) under the Investment Company Act of 1940) that occurred during the registrant's |
| | | second fiscal quarter of the period covered by this report that have materially affected, or are |
| | | reasonably likely to materially affect, the registrant's internal control over financial reporting. |
| |
| ITEM 12. EXHIBITS. |
| |
| (a) | (1) | Registrant’s Code of Ethics for Senior Financial Officers, which is the subject of the disclosure |
| | | required by Item 2 of Form N-CSR, was filed as Exhibit 12(a)(1) to American Century Asset |
| | | Allocation Portfolios, Inc.’s Certified Shareholder Report on Form N-CSR, File No. 811-21591, |
| | | on September 29, 2005. |
| |
| (a) | (2) | Separate certifications by the registrant’s principal executive officer and principal financial |
| | | officer, pursuant to Section 302 of the Sarbanes-Oxley Act of 2002 and Rule 30a-2(a) under the |
| | | Investment Company Act of 1940, are filed and attached hereto as EX-99.CERT. |
| |
| (a) | (3) | Not applicable. |
| |
| (b) | | A certification by the registrant’s chief executive officer and chief financial officer, pursuant to |
| | | Section 906 of the Sarbanes-Oxley Act of 2002, is furnished and attached hereto as EX- |
| | | 99.906CERT. |
SIGNATURES
Pursuant to the requirements of the Securities Exchange Act of 1934 and the Investment Company Act of 1940, the registrant has duly caused this report to be signed on its behalf by the undersigned, thereunto duly authorized.
| | |
| Registrant: | American Century Quantitative Equity Funds, Inc. |
| |
| By: | /s/ Jonathan S. Thomas |
| | Name: | Jonathan S. Thomas |
| | Title: | President |
| |
| Date: | August 27, 2010 |
Pursuant to the requirements of the Securities Exchange Act of 1934 and the Investment Company Act of 1940, this report has been signed below by the following persons on behalf of the registrant and in the capacities and on the dates indicated.
| | |
| By: | /s/ Jonathan S. Thomas |
| | Name: | Jonathan S. Thomas |
| | Title: | President |
| | | (principal executive officer) |
| |
| Date: | August 27, 2010 |
| | |
| By: | /s/ Robert J. Leach |
| | Name: | Robert J. Leach |
| | Title: | Vice President, Treasurer, and |
| | | Chief Financial Officer |
| | | (principal financial officer) |
| |
| Date: | August 27, 2010 |