UNITED STATES
SECURITIES AND EXCHANGE COMMISSION
Washington, D.C. 20549
FORM N-CSR
CERTIFIED SHAREHOLDER REPORT OF REGISTERED
MANAGEMENT INVESTMENT COMPANIES
| Investment Company Act file number | 811-05447 |
| | |
| | |
| | |
| AMERICAN CENTURY QUANTITATIVE EQUITY FUNDS, INC. |
| (Exact name of registrant as specified in charter) |
| | |
| | |
| | |
| 4500 MAIN STREET, KANSAS CITY, MISSOURI | 64111 |
| (Address of principal executive offices) | (Zip Code) |
| | |
| | |
| | |
CHARLES A. ETHERINGTON 4500 MAIN STREET, KANSAS CITY, MISSOURI 64111 |
| (Name and address of agent for service) |
| | |
| | |
| Registrant’s telephone number, including area code: | 816-531-5575 |
| | |
| | |
| Date of fiscal year end: | 06-30 |
| | |
| | |
| Date of reporting period: | 06-30-2011 |
ITEM 1. REPORTS TO STOCKHOLDERS.
ANNUAL REPORT JUNE 30, 2011


| President’s Letter | 2 |
| Market Perspective | 3 |
| Performance | 4 |
| Portfolio Commentary | 6 |
| Fund Characteristics | 8 |
| Shareholder Fee Example | 9 |
| Schedule of Investments | 11 |
| Statement of Assets and Liabilities | 14 |
| Statement of Operations | 15 |
| Statement of Changes in Net Assets | 16 |
| Notes to Financial Statements | 17 |
| Financial Highlights | 22 |
| Report of Independent Registered Public Accounting Firm | 28 |
| Management | 29 |
| Approval of Management Agreement | 32 |
| Additional Information | 37 |
Any opinions expressed in this report reflect those of the author as of the date of the report, and do not necessarily represent the opinions of American Century Investments® or any other person in the American Century Investments organization. Any such opinions are subject to change at any time based upon market or other conditions and American Century Investments disclaims any responsibility to update such opinions. These opinions may not be relied upon as investment advice and, because investment decisions made by American Century Investments funds are based on numerous factors, may not be relied upon as an indication of trading intent on behalf of any American Century Investments fund. Security examples are used for representational purposes only and are not intended as recommendations to purchase or sell securities. Performance information for comparative indices and securities is provided to American Century Investments by third party vendors. To the best of American Century Investments’ knowledge, such information is accurate at the time of printing.
Dear Investor:
Thank you for reviewing this annual report for the period ended June 30, 2011. Our report offers investment performance and portfolio information, presented with the expert perspective and commentary of our portfolio management team.
This report remains one of our most important vehicles for conveying information about investment performance and the market factors and strategies that affect fund returns. For additional, updated information on fund performance, portfolio strategy, and the investment markets, we encourage you to visit our website, americancentury.com. Click on the “Fund Performance” and “Insights & News” headings at the top of our Individual Investors site.
Reporting Period Perspective: Highest Broad Fiscal-Year U.S. Stock Returns Since 1997
Benefitting from favorable conditions and expectations, the U.S. stock market produced exceptional returns, the highest for any 12-month period ended June 30 since the fiscal year ended June 30, 1997. Back then, the S&P 500 Index gained 34.71%, compared with 30.69% for the most-recent reporting period. The intervening 14 years help illustrate how infrequently such a high level of performance occurs, requiring an alignment of economic and market conditions that’s difficult to duplicate.
The exceptional returns experienced during the reporting period represent a rebound from previous declines. After experiencing 10–12% declines during the second quarter of 2010—stemming from the European sovereign debt crisis and double-dip recession fears—most broad U.S. stock indices advanced 30% or more during the following 12 months. Monetary and fiscal intervention in 2010 stimulated growth and fueled investor optimism about economic and financial market conditions in 2011 and 2012, encouraging investments in riskier assets.
However, that optimism has diminished in the summer of 2011 as the European debt crisis returned to prominence and other debt and economic challenges emerged. As the reporting period came to a close in June 2011, we saw increasing signs that the U.S. economic recovery had lost momentum. As a result, economic growth forecasts were reduced, and broad U.S. stock indices trended downward beginning in May. As we enter the third quarter of 2011, investor concern over fiscal austerity measures in the U.S. and other developed economies raised fears of a return to recession and accelerated a decline in global equity markets. We appreciate your continued trust in us during these uncertain times.
Sincerely,
Jonathan Thomas
President and Chief Executive Officer
American Century Investments
By Scott Wittman, Chief Investment Officer, Quantitative Equity and Asset Allocation
U.S. Stocks Soared as Economy Improved
The U.S. stock market enjoyed very strong results for the 12 months ended June 30, 2011, with the broad equity indices returning more than 30%. The main catalyst for the sharp rally in stocks was growing investor confidence in a U.S. economic recovery, though that confidence faltered somewhat late in the period.
After a bumpy start resulting from an uncertain economic outlook, the equity market began a steady rise in September 2010 as improving economic data reassured investors that the economy would avoid a “double-dip” recession (a return to recession after a brief period of recovery). Most notably, employment growth turned positive after 2½ years of persistent job losses, and the manufacturing sector showed signs of life. In addition, a renewal of the Federal Reserve’s quantitative easing program and an extension of expiring federal tax breaks further boosted the market’s confidence that a promising economic recovery
was under way.
Stocks continued to advance in early 2011 despite unrest in the Middle East and North Africa, as well as a devastating earthquake and tsunami in Japan. By May, however, evidence of a slowdown in economic activity and renewed concerns about a European sovereign debt crisis weighed on investor confidence. As a result, stocks experienced a modest pullback in the final two months of the period.
Smaller Stocks and Growth-Oriented Issues Outperformed
Despite finishing on a down note, the broad equity indices posted robust returns overall for the 12-month period. As the table below illustrates, mid- and small-cap issues generated the best returns, outpacing large-cap shares. Meanwhile, growth stocks outperformed value across all market capitalizations, most dramatically among smaller companies. Every sector of the market produced double-digit gains for the period, led by energy and materials stocks, which benefited from strong demand and rising commodity prices. Other economically sensitive sectors—such as consumer discretionary and industrials—also fared well. The laggard was the financials sector, which continued to face mortgage-related challenges and regulatory uncertainty.
| U.S. Stock Index Returns |
| For the 12 months ended June 30, 2011 |
| Russell 1000 Index (Large-Cap) | 31.93% | | Russell 2000 Index (Small-Cap) | 37.41% |
| Russell 1000 Growth Index | 35.01% | | Russell 2000 Growth Index | 43.50% |
| Russell 1000 Value Index | 28.94% | | Russell 2000 Value Index | 31.35% |
| Russell Midcap Index | 38.47% | | | |
| Russell Midcap Growth Index | 43.25% | | | |
| Russell Midcap Value Index | 34.28% | | | |
| Total Returns as of June 30, 2011 |
| | | | Average Annual Returns | |
| | Ticker Symbol | 1 year(1) | 5 years | Since Inception | Inception Date |
| Investor Class | ADSIX | 39.00% | 5.03% | 5.61% | 9/30/05 |
| Russell 1000 Growth Index | — | 35.01% | 5.33% | 4.98% | — |
| Institutional Class | ADCIX | 39.26% | 5.24% | 5.81% | 9/30/05 |
A Class(2) No sales charge* With sales charge* | ADCVX | 38.71% 30.78% | 4.76% 3.52% | 5.34% 4.26% | 9/30/05 |
B Class No sales charge* With sales charge* | ADYBX | 37.65% 33.65% | — — | 0.22% -0.58% | 9/28/07 |
| C Class | ADCCX | 37.54% | — | 0.20% | 9/28/07 |
| R Class | ADRRX | 38.28% | 4.50% | 5.07% | 9/30/05 |
*Sales charges include initial sales charges and contingent deferred sales charges (CDSCs), as applicable. A Class shares have a maximum 5.75% initial sales charge and may be subject to a maximum CDSC of 1.00%. B Class shares redeemed within six years of purchase are subject to a CDSC that declines from 5.00% during the first year after purchase to 0.00% the sixth year after purchase. C Class shares redeemed within 12 months of purchase are subject to a maximum CDSC of 1.00%. The SEC requires that mutual funds provide performance information net of maximum sales charges in all cases where charges could be applied.
| (1) | Extraordinary performance is attributable in part to unusually favorable market conditions and may not be repeated or consistently achieved in the future. |
| (2) | Prior to September 4, 2007, the A Class was referred to as the Advisor Class and did not have a front-end sales charge. Performance prior to that date has been adjusted to reflect this charge. |
Data presented reflect past performance. Past performance is no guarantee of future results. Current performance may be higher or lower than the performance shown. Investment return and principal value will fluctuate, and redemption value may be more or less than original cost. To obtain performance data current to the most recent month end, please call 1-800-345-2021 or visit americancentury.com. The fund’s investment process may result in high portfolio turnover, which could mean high transaction costs, affecting both performance and capital gains tax liabilities to investors.
Unless otherwise indicated, performance reflects Investor Class shares; performance for other share classes will vary due to differences in fee structure. For information about other share classes available, please consult the prospectus. Data assumes reinvestment of dividends and capital gains, and none of the charts reflect the deduction of taxes that a shareholder would pay on fund distributions or the redemption of fund shares. Returns for the index are provided for comparison. The fund’s total returns include operating expenses (such as transaction costs and management fees) that reduce returns, while the total returns of the index do not.
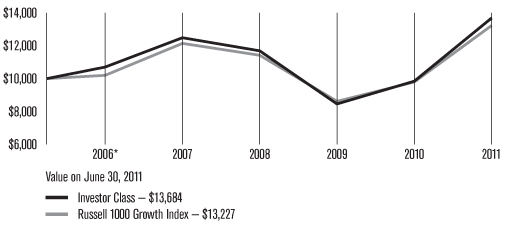
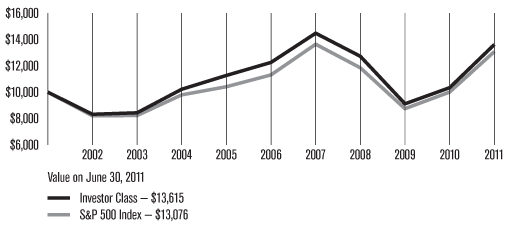
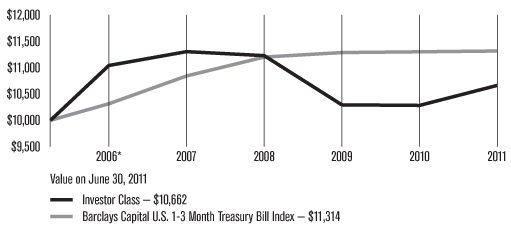
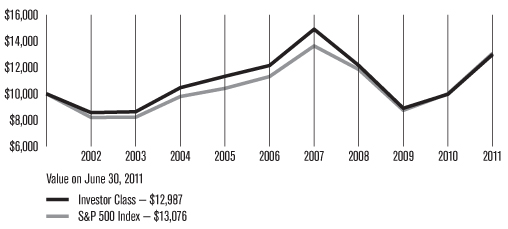
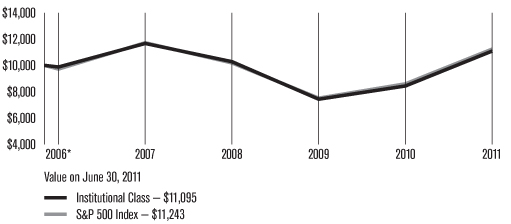
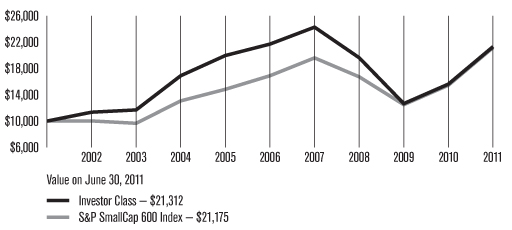
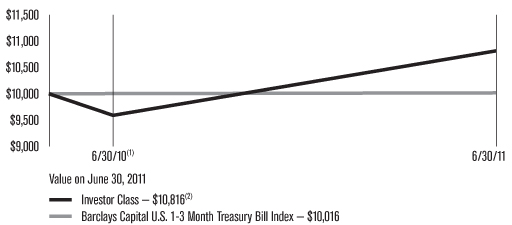
| Growth of $10,000 Over Life of Class |
| $10,000 investment made September 30, 2005 |
*From 9/30/05, the Investor Class’s inception date. Not annualized.
| Total Annual Fund Operating Expenses |
| Investor Class | Institutional Class | A Class | B Class | C Class | R Class |
| 1.05% | 0.85% | 1.30% | 2.05% | 2.05% | 1.55% |
The total annual fund operating expenses shown is as stated in the fund’s prospectus current as of the date of this report. The prospectus may vary from the expense ratio shown elsewhere in this report because it is based on a different time period, includes acquired fund fees and expenses, and, if applicable, does not include fee waivers or expense reimbursements.
Data presented reflect past performance. Past performance is no guarantee of future results. Current performance may be higher or lower than the performance shown. Investment return and principal value will fluctuate, and redemption value may be more or less than original cost. To obtain performance data current to the most recent month end, please call 1-800-345-2021 or visit americancentury.com. The fund’s investment process may result in high portfolio turnover, which could mean high transaction costs, affecting both performance and capital gains tax liabilities to investors.
Unless otherwise indicated, performance reflects Investor Class shares; performance for other share classes will vary due to differences in fee structure. For information about other share classes available, please consult the prospectus. Data assumes reinvestment of dividends and capital gains, and none of the charts reflect the deduction of taxes that a shareholder would pay on fund distributions or the redemption of fund shares. Returns for the index are provided for comparison. The fund’s total returns include operating expenses (such as transaction costs and management fees) that reduce returns, while the total returns of the index do not.
Portfolio Managers: Bill Martin and Lynette Pang
Performance Summary
Disciplined Growth returned 39.00%* for the fiscal year ended June 30, 2011, compared with the 35.01% return of its benchmark, the Russell 1000 Growth Index, and the 30.69%** return of the broad S&P 500 Index.
Disciplined Growth posted a strong absolute return for the 12 months, reflecting a robust rally for stocks in general and growth-oriented stocks in particular during the period (see page 3 for details). The fund also outperformed the Russell 1000 Growth Index as individual stock selection (a key component of
our investment process) added value in seven of ten market sectors.
Consumer Discretionary and Energy Boosted Absolute Results
On an absolute basis, every sector of the Disciplined Growth fund returned more than 30% for the 12 months (except for a small position in telecommunication services that consisted of a single stock). The best-performing sectors in the portfolio were consumer discretionary and energy. The fund’s consumer discretionary stocks returned more than 60% as a group for the 12-month period, while its energy holdings gained approximately 50% overall. The leading performance contributors from these two sectors included oil and gas producer Exxon Mobil (the fund’s top contributor), online movie rental company Netflix, and online retailer Amazon.com.
Disciplined Growth’s information technology holdings, which comprised approximately one-third of the portfolio on average during the 12-month period, also had a meaningful impact on absolute performance. Five of the fund’s top ten absolute performance contributors came from this sector, led by consumer electronics maker Apple, IT services provider International Business Machines, and enterprise software maker Oracle.
On the downside, the biggest individual detractors in the portfolio included pharmacy benefits manager Medco Health Solutions, printer maker Lexmark International, and memory chip maker Micron Technology.
Consumer Discretionary and Technology Outperformed
Looking at relative performance, Disciplined Growth’s holdings in the consumer discretionary and information technology sectors contributed the most to its outperformance of the Russell 1000 Growth Index for the fiscal year. Stock selection among hotels and restaurants and an overweight position in internet retailers generated much of the outperformance in the consumer discretionary sector. The top contributor in this sector was online movie rental firm Netflix, which delivered strong earnings growth as its subscriber base rose and online streaming of movies became increasingly popular. Other top contributors in this sector included casino operator Wynn Resorts, which benefited from improving casino traffic, and off-road vehicle maker Polaris Industries, which enjoyed rising demand for its products.
| * | All fund returns referenced in this commentary are for Investor Class shares. |
| ** | The S&P 500 Index average annual returns were 2.94% for the five-year period ended June 30, 2011, and 3.40% since the fund’s inception on September 30, 2005, through June 30, 2011. |
The bulk of the outperformance in the information technology sector resulted from stock selection among communications equipment makers and IT services providers. The leading contributors in this sector were networking products maker Riverbed Technology and electronic payments provider VeriFone Systems. Riverbed Technology experienced a sharp increase in sales and earnings thanks to the growth of cloud computing, while VeriFone Systems consistently raised its earnings and revenue projections as point-of-sale transactions increased markedly.
Other top individual contributors to relative performance during the 12 months included bearings producer Timken and biotechnology firm Biogen Idec. Growing demand from the auto industry boosted Timken, while Biogen Idec saw earnings expectations rise thanks to robust sales of its multiple sclerosis medications.
Industrials Detracted
The only sector in the Disciplined Growth portfolio to detract meaningfully from performance versus the Russell 1000 Growth Index was the industrials sector. Stock selection among industrial conglomerates and aerospace and defense companies had the biggest negative impact in this sector. The most significant individual detractors included defense contractor Raytheon and heavy-duty vehicle maker Oshkosh, both of which faced potential declines in federal defense spending.
An underweight position in the energy sector—one of the top-performing sectors in the index—also weighed on relative results. In particular, underweight positions in oilfield services companies Halliburton and Schlumberger hurt results as greater drilling activity provided a lift to both stocks.
Other noteworthy detractors from performance versus the index were two health care stocks—robotic surgical equipment maker Intuitive Surgical and pharmacy benefits manager Medco Health Solutions. Intuitive Surgical struggled with declining demand overseas, while Medco faced regulatory uncertainty stemming from new federal health care legislation.
A Look Ahead
The eye-catching turmoil in the headlines over the last six months—democratic change sweeping through the Middle East, a devastating natural disaster in Japan, the possibility of a sovereign debt default in Europe—has led to heightened uncertainty and growing volatility in the equity market. But when you look at the past decade, there have been many other dramatic events that have had a similar impact on the market. When viewed through this lens, change and volatility have become more the rule than the exception.
It is this change dynamic that our investment process seeks to exploit and capitalize upon. Change and volatility leads to market inefficiencies, and within these inefficiencies lie investment opportunities. Rather than base investment decisions on vague financial headlines, we use our disciplined, data-driven, multi-factor investment process to take advantage of inefficiencies at the individual company level. We believe this approach will produce favorable returns over the long term.
| JUNE 30, 2011 |
| Top Ten Holdings | % of net assets |
| Exxon Mobil Corp. | 4.4% |
| Apple, Inc. | 4.3% |
| International Business Machines Corp. | 3.1% |
| Microsoft Corp. | 2.6% |
| Philip Morris International, Inc. | 2.2% |
| Oracle Corp. | 2.1% |
| United Technologies Corp. | 1.7% |
| Caterpillar, Inc. | 1.5% |
| QUALCOMM, Inc. | 1.4% |
| Freeport-McMoRan Copper & Gold, Inc. | 1.4% |
| |
| Top Five Industries | % of net assets |
| Software | 8.2% |
| Oil, Gas & Consumable Fuels | 8.0% |
| IT Services | 6.6% |
| Computers & Peripherals | 5.6% |
| Health Care Equipment & Supplies | 4.5% |
| |
| Types of Investments in Portfolio | % of net assets |
| Common Stocks | 98.9% |
| Temporary Cash Investments | 2.5% |
| Other Assets and Liabilities | (1.4)% |
Fund shareholders may incur two types of costs: (1) transaction costs, including sales charges (loads) on purchase payments and redemption/exchange fees; and (2) ongoing costs, including management fees; distribution and service (12b-1) fees; and other fund expenses. This example is intended to help you understand your ongoing costs (in dollars) of investing in your fund and to compare these costs with the ongoing cost of investing in other mutual funds.
The example is based on an investment of $1,000 made at the beginning of the period and held for the entire period from January 1, 2011 to June 30, 2011.
Actual Expenses
The table provides information about actual account values and actual expenses for each class. You may use the information, together with the amount you invested, to estimate the expenses that you paid over the period. First, identify the share class you own. Then simply divide your account value by $1,000 (for example, an $8,600 account value divided by $1,000 = 8.6), then multiply the result by the number under the heading “Expenses Paid During Period” to estimate the expenses you paid on your account during this period.
If you hold Investor Class shares of any American Century Investments fund, or Institutional Class shares of the American Century Diversified Bond Fund, in an American Century Investments account (i.e., not a financial intermediary or retirement plan account), American Century Investments may charge you a $12.50 semiannual account maintenance fee if the value of those shares is less than $10,000. We will redeem shares automatically in one of your accounts to pay the $12.50 fee. In determining your total eligible investment amount, we will include your investments in all personal accounts (including American Century Investments Brokerage accounts) registered under your Social Security number. Personal accounts include individual accounts, joint accounts, UGMA/UTMA accounts, personal trusts, Coverdell Education Savings Accounts and IRAs (including traditional, Roth, Rollover, SEP-, SARSEP- and SIMPLE-IRAs), and certain other retirement accounts. If you have only business, business retirement, employer-sponsored or American Century Investments Brokerage accounts, you are currently not subject to this fee. We will not charge the fee as long as you choose to manage your accounts exclusively online. If you are subject to the Account Maintenance Fee, your account value could be reduced by the fee amount.
Hypothetical Example for Comparison Purposes
The table also provides information about hypothetical account values and hypothetical expenses based on the actual expense ratio of each class of your fund and an assumed rate of return of 5% per year before expenses, which is not the actual return of a fund’s share class. The hypothetical account values and expenses may not be used to estimate the actual ending account balance or expenses you paid for the period. You may use this information to compare the ongoing costs of investing in your fund and other funds. To do so, compare this 5% hypothetical example with the 5% hypothetical examples that appear in the shareholder reports of the other funds.
Please note that the expenses shown in the table are meant to highlight your ongoing costs only and do not reflect any transactional costs, such as sales charges (loads) or redemption/exchange fees. Therefore, the table is useful in comparing ongoing costs only, and will not help you determine the relative total costs of owning different funds. In addition, if these transactional costs were included, your costs would have been higher.
| | Beginning Account Value 1/1/11 | Ending Account Value 6/30/11 | Expenses Paid During Period* 1/1/11 – 6/30/11 | Annualized Expense Ratio* |
| Actual |
| Investor Class | $1,000 | $1,086.20 | $5.33 | 1.03% |
| Institutional Class | $1,000 | $1,087.80 | $4.30 | 0.83% |
| A Class | $1,000 | $1,084.70 | $6.62 | 1.28% |
| B Class | $1,000 | $1,081.00 | $10.47 | 2.03% |
| C Class | $1,000 | $1,080.20 | $10.47 | 2.03% |
| R Class | $1,000 | $1,083.80 | $7.91 | 1.53% |
| Hypothetical |
| Investor Class | $1,000 | $1,019.69 | $5.16 | 1.03% |
| Institutional Class | $1,000 | $1,020.68 | $4.16 | 0.83% |
| A Class | $1,000 | $1,018.45 | $6.41 | 1.28% |
| B Class | $1,000 | $1,014.73 | $10.14 | 2.03% |
| C Class | $1,000 | $1,014.73 | $10.14 | 2.03% |
| R Class | $1,000 | $1,017.21 | $7.65 | 1.53% |
*Expenses are equal to the class’s annualized expense ratio listed in the table above, multiplied by the average account value over the period, multiplied by 181, the number of days in the most recent fiscal half-year, divided by 365, to reflect the one-half year period.
| | | Shares | | | Value | |
| Common Stocks — 98.9% | |
| AEROSPACE & DEFENSE — 3.4% | |
| Boeing Co. (The) | | | 256 | | | | $18,926 | |
| General Dynamics Corp. | | | 2,478 | | | | 184,660 | |
| Honeywell International, Inc. | | | 3,919 | | | | 233,533 | |
| Northrop Grumman Corp. | | | 2,617 | | | | 181,489 | |
| United Technologies Corp. | | | 7,562 | | | | 669,313 | |
| | | | | | | | 1,287,921 | |
| AIR FREIGHT & LOGISTICS — 0.6% | |
Atlas Air Worldwide Holdings, Inc.(1) | | | 3,173 | | | | 188,825 | |
| United Parcel Service, Inc., Class B | | | 562 | | | | 40,987 | |
| | | | | | | | 229,812 | |
| AIRLINES — 0.6% | |
Alaska Air Group, Inc.(1) | | | 3,271 | | | | 223,933 | |
| AUTO COMPONENTS — 1.4% | |
| Magna International, Inc. | | | 5,085 | | | | 274,793 | |
TRW Automotive Holdings Corp.(1) | | | 4,623 | | | | 272,896 | |
| | | | | | | | 547,689 | |
| AUTOMOBILES — 0.3% | |
Ford Motor Co.(1) | | | 8,993 | | | | 124,014 | |
| BEVERAGES — 3.0% | |
| Coca-Cola Co. (The) | | | 7,364 | | | | 495,523 | |
| Dr Pepper Snapple Group, Inc. | | | 6,358 | | | | 266,591 | |
| PepsiCo, Inc. | | | 5,341 | | | | 376,167 | |
| | | | | | | | 1,138,281 | |
| BIOTECHNOLOGY — 1.5% | |
Biogen Idec, Inc.(1) | | | 3,616 | | | | 386,623 | |
Celgene Corp.(1) | | | 432 | | | | 26,058 | |
Cephalon, Inc.(1) | | | 897 | | | | 71,670 | |
Cubist Pharmaceuticals, Inc.(1) | | | 637 | | | | 22,926 | |
United Therapeutics Corp.(1) | | | 1,404 | | | | 77,360 | |
| | | | | | | | 584,637 | |
| CHEMICALS — 2.8% | |
| CF Industries Holdings, Inc. | | | 799 | | | | 113,194 | |
| Eastman Chemical Co. | | | 1,649 | | | | 168,313 | |
| Monsanto Co. | | | 6,420 | | | | 465,707 | |
| PPG Industries, Inc. | | | 3,616 | | | | 328,297 | |
| | | | | | | | 1,075,511 | |
| COMMUNICATIONS EQUIPMENT — 2.7% | |
| Cisco Systems, Inc. | | | 15,260 | | | | 238,209 | |
Motorola Solutions, Inc.(1) | | | 1,960 | | | | 90,238 | |
| QUALCOMM, Inc. | | | 9,452 | | | | 536,779 | |
Riverbed Technology, Inc.(1) | | | 4,714 | | | | 186,627 | |
| | | | | | | | 1,051,853 | |
| COMPUTERS & PERIPHERALS — 5.6% | |
Apple, Inc.(1) | | | 4,950 | | | | 1,661,566 | |
Dell, Inc.(1) | | | 21,110 | | | | 351,904 | |
EMC Corp.(1) | | | 2,398 | | | | 66,065 | |
| Hewlett-Packard Co. | | | 1,762 | | | | 64,137 | |
| | | | | | | | 2,143,672 | |
| CONSTRUCTION & ENGINEERING — 0.1% | |
| Fluor Corp. | | | 362 | | | | 23,407 | |
| CONSUMER FINANCE — 0.1% | |
| American Express Co. | | | 705 | | | | 36,449 | |
| DIVERSIFIED CONSUMER SERVICES — 1.1% | |
ITT Educational Services, Inc.(1) | | | 2,996 | | | | 234,407 | |
| Weight Watchers International, Inc. | | | 2,622 | | | | 197,882 | |
| | | | | | | | 432,289 | |
| DIVERSIFIED FINANCIAL SERVICES — 1.4% | |
| Interactive Brokers Group, Inc., Class A | | | 14,216 | | | | 222,481 | |
| McGraw-Hill Cos., Inc. (The) | | | 5,569 | | | | 233,397 | |
| Moody’s Corp. | | | 2,338 | | | | 89,662 | |
| | | | | | | | 545,540 | |
| DIVERSIFIED TELECOMMUNICATION SERVICES — 0.5% | |
| Verizon Communications, Inc. | | | 4,861 | | | | 180,975 | |
| ELECTRICAL EQUIPMENT — 0.8% | |
| Emerson Electric Co. | | | 5,380 | | | | 302,625 | |
| ELECTRONIC EQUIPMENT, INSTRUMENTS & COMPONENTS — 1.1% | |
| Corning, Inc. | | | 8,877 | | | | 161,117 | |
| TE Connectivity Ltd. | | | 6,459 | | | | 237,433 | |
Vishay Intertechnology, Inc.(1) | | | 2,619 | | | | 39,390 | |
| | | | | | | | 437,940 | |
| ENERGY EQUIPMENT & SERVICES — 1.9% | |
| Core Laboratories NV | | | 915 | | | | 102,059 | |
| Schlumberger Ltd. | | | 4,621 | | | | 399,255 | |
| SEACOR Holdings, Inc. | | | 2,472 | | | | 247,101 | |
| | | | | | | | 748,415 | |
| FOOD & STAPLES RETAILING — 3.1% | |
| Costco Wholesale Corp. | | | 4,835 | | | | 392,795 | |
| Walgreen Co. | | | 9,205 | | | | 390,844 | |
| Wal-Mart Stores, Inc. | | | 2,525 | | | | 134,179 | |
| Whole Foods Market, Inc. | | | 4,573 | | | | 290,157 | |
| | | | | | | | 1,207,975 | |
| FOOD PRODUCTS — 1.1% | |
| Flowers Foods, Inc. | | | 1,125 | | | | 24,795 | |
| Hershey Co. (The) | | | 4,685 | | | | 266,342 | |
| Mead Johnson Nutrition Co. | | | 1,850 | | | | 124,968 | |
| | | | | | | | 416,105 | |
| | | | Shares | | | | Value | |
| HEALTH CARE EQUIPMENT & SUPPLIES — 4.5% | | | | | | | | |
Align Technology, Inc.(1) | | | 9,810 | | | | $223,668 | |
| Baxter International, Inc. | | | 2,966 | | | | 177,041 | |
| Cooper Cos., Inc. (The) | | | 3,247 | | | | 257,292 | |
| Hill-Rom Holdings, Inc. | | | 4,229 | | | | 194,703 | |
IDEXX Laboratories, Inc.(1) | | | 2,225 | | | | 172,571 | |
Intuitive Surgical, Inc.(1) | | | 816 | | | | 303,642 | |
Varian Medical Systems, Inc.(1) | | | 3,704 | | | | 259,354 | |
Zimmer Holdings, Inc.(1) | | | 2,242 | | | | 141,694 | |
| | | | | | | | 1,729,965 | |
| HEALTH CARE PROVIDERS & SERVICES — 1.4% | |
AMERIGROUP Corp.(1) | | | 3,725 | | | | 262,501 | |
| Humana, Inc. | | | 3,020 | | | | 243,231 | |
| UnitedHealth Group, Inc. | | | 77 | | | | 3,971 | |
WellCare Health Plans, Inc.(1) | | | 219 | | | | 11,259 | |
| | | | | | | | 520,962 | |
| HOTELS, RESTAURANTS & LEISURE — 2.5% | |
| International Game Technology | | | 12,741 | | | | 223,987 | |
| McDonald’s Corp. | | | 2,738 | | | | 230,868 | |
Panera Bread Co., Class A(1) | | | 1,606 | | | | 201,810 | |
| Wynn Resorts Ltd. | | | 2,038 | | | | 292,534 | |
| Yum! Brands, Inc. | | | 86 | | | | 4,751 | |
| | | | | | | | 953,950 | |
| HOUSEHOLD DURABLES — 0.9% | |
| Tupperware Brands Corp. | | | 2,369 | | | | 159,789 | |
| Whirlpool Corp. | | | 2,266 | | | | 184,271 | |
| | | | | | | | 344,060 | |
| INDUSTRIAL CONGLOMERATES — 1.4% | |
| 3M Co. | | | 2,150 | | | | 203,928 | |
| General Electric Co. | | | 17,341 | | | | 327,051 | |
| | | | | | | | 530,979 | |
INSURANCE(2) | |
| Travelers Cos., Inc. (The) | | | 59 | | | | 3,444 | |
| INTERNET & CATALOG RETAIL — 1.7% | |
Amazon.com, Inc.(1) | | | 1,524 | | | | 311,643 | |
Netflix, Inc.(1) | | | 920 | | | | 241,675 | |
priceline.com, Inc.(1) | | | 211 | | | | 108,017 | |
| | | | | | | | 661,335 | |
| INTERNET SOFTWARE & SERVICES — 1.5% | |
Google, Inc., Class A(1) | | | 888 | | | | 449,665 | |
IAC/InterActiveCorp(1) | | | 3,056 | | | | 116,648 | |
Open Text Corp.(1) | | | 102 | | | | 6,530 | |
| | | | | | | | 572,843 | |
| IT SERVICES — 6.6% | |
| Accenture plc, Class A | | | 7,703 | | | | 465,415 | |
Alliance Data Systems Corp.(1) | | | 1,577 | | | | 148,348 | |
| Global Payments, Inc. | | | 5,246 | | | | 267,546 | |
| International Business Machines Corp. | | | 6,961 | | | | 1,194,160 | |
| Visa, Inc., Class A | | | 5,204 | | | | 438,489 | |
| | | | | | | | 2,513,958 | |
| LEISURE EQUIPMENT & PRODUCTS — 0.7% | |
| Polaris Industries, Inc. | | | 2,370 | | | | 263,473 | |
| LIFE SCIENCES TOOLS & SERVICES — 1.6% | |
Agilent Technologies, Inc.(1) | | | 6,573 | | | | 335,946 | |
Illumina, Inc.(1) | | | 3,761 | | | | 282,639 | |
| | | | | | | | 618,585 | |
| MACHINERY — 3.3% | |
| Caterpillar, Inc. | | | 5,446 | | | | 579,781 | |
| Eaton Corp. | | | 3,742 | | | | 192,526 | |
| Gardner Denver, Inc. | | | 381 | | | | 32,023 | |
| Parker-Hannifin Corp. | | | 654 | | | | 58,690 | |
Sauer-Danfoss, Inc.(1) | | | 4,640 | | | | 233,810 | |
| Toro Co. (The) | | | 2,933 | | | | 177,446 | |
| | | | | | | | 1,274,276 | |
| MEDIA — 2.2% | |
DirecTV, Class A(1) | | | 9,087 | | | | 461,801 | |
DISH Network Corp., Class A(1) | | | 4,312 | | | | 132,249 | |
| Interpublic Group of Cos., Inc. (The) | | | 7,345 | | | | 91,813 | |
| Time Warner Cable, Inc. | | | 1,674 | | | | 130,639 | |
| Time Warner, Inc. | | | 740 | | | | 26,914 | |
| | | | | | | | 843,416 | |
| METALS & MINING — 1.9% | |
| Freeport-McMoRan Copper & Gold, Inc. | | | 9,796 | | | | 518,208 | |
| Walter Energy, Inc. | | | 1,832 | | | | 212,146 | |
| | | | | | | | 730,354 | |
| MULTILINE RETAIL — 0.5% | |
| Kohl’s Corp. | | | 3,805 | | | | 190,288 | |
| OIL, GAS & CONSUMABLE FUELS — 8.0% | |
| Chevron Corp. | | | 2,940 | | | | 302,349 | |
| ConocoPhillips | | | 4,420 | | | | 332,340 | |
| Exxon Mobil Corp. | | | 20,813 | | | | 1,693,762 | |
| Marathon Oil Corp. | | | 5,635 | | | | 296,852 | |
| Sunoco, Inc. | | | 422 | | | | 17,602 | |
| Valero Energy Corp. | | | 9,005 | | | | 230,258 | |
| W&T Offshore, Inc. | | | 8,046 | | | | 210,161 | |
| | | | | | | | 3,083,324 | |
| PAPER & FOREST PRODUCTS — 0.6% | |
| Domtar Corp. | | | 2,427 | | | | 229,886 | |
| PERSONAL PRODUCTS — 1.6% | |
| Estee Lauder Cos., Inc. (The), Class A | | | 1,336 | | | | 140,534 | |
| Herbalife Ltd. | | | 5,059 | | | | 291,601 | |
| Nu Skin Enterprises, Inc., Class A | | | 5,021 | | | | $188,538 | |
| | | | | | | | 620,673 | |
| PHARMACEUTICALS — 4.4% | |
| Abbott Laboratories | | | 4,510 | | | | 237,316 | |
| Bristol-Myers Squibb Co. | | | 8,363 | | | | 242,193 | |
| Eli Lilly & Co. | | | 8,342 | | | | 313,075 | |
Forest Laboratories, Inc.(1) | | | 5,753 | | | | 226,323 | |
| Johnson & Johnson | | | 5,754 | | | | 382,756 | |
| Merck & Co., Inc. | | | 6,741 | | | | 237,890 | |
| Pfizer, Inc. | | | 1,412 | | | | 29,087 | |
| | | | | | | | 1,668,640 | |
| PROFESSIONAL SERVICES — 0.7% | |
| Towers Watson & Co., Class A | | | 3,815 | | | | 250,684 | |
Verisk Analytics, Inc., Class A(1) | | | 972 | | | | 33,650 | |
| | | | | | | | 284,334 | |
| REAL ESTATE INVESTMENT TRUSTS (REITs) — 0.7% | |
| Rayonier, Inc. | | | 4,199 | | | | 274,405 | |
| ROAD & RAIL — 0.5% | | | | | | | | |
| Union Pacific Corp. | | | 1,763 | | | | 184,057 | |
| SEMICONDUCTORS & SEMICONDUCTOR EQUIPMENT — 4.4% | |
| Altera Corp. | | | 4,114 | | | | 190,684 | |
| Applied Materials, Inc. | | | 8,343 | | | | 108,542 | |
| Avago Technologies Ltd. | | | 5,154 | | | | 195,852 | |
Cypress Semiconductor Corp.(1) | | | 5,522 | | | | 116,735 | |
| Intel Corp. | | | 10,937 | | | | 242,364 | |
LSI Corp.(1) | | | 33,830 | | | | 240,870 | |
Micron Technology, Inc.(1) | | | 15,420 | | | | 115,342 | |
NVIDIA Corp.(1) | | | 15,324 | | | | 244,188 | |
Teradyne, Inc.(1) | | | 16,478 | | | | 243,874 | |
| | | | | | | | 1,698,451 | |
| SOFTWARE — 8.2% | |
Cadence Design Systems, Inc.(1) | | | 24,743 | | | | 261,286 | |
Cerner Corp.(1) | | | 2,657 | | | | 162,369 | |
Citrix Systems, Inc.(1) | | | 3,432 | | | | 274,560 | |
Electronic Arts, Inc.(1) | | | 12,811 | | | | 302,340 | |
Fortinet, Inc.(1) | | | 1,348 | | | | 36,787 | |
Intuit, Inc.(1) | | | 5,936 | | | | 307,841 | |
| Microsoft Corp. | | | 37,823 | | | | 983,398 | |
| Oracle Corp. | | | 24,231 | | | | 797,442 | |
| | | | | | | | 3,126,023 | |
| SPECIALTY RETAIL — 3.0% | |
AutoZone, Inc.(1) | | | 768 | | | | 226,445 | |
Bed Bath & Beyond, Inc.(1) | | | 4,324 | | | | 252,392 | |
| Express, Inc. | | | 2,024 | | | | 44,123 | |
| Home Depot, Inc. (The) | | | 2,642 | | | | 95,693 | |
| Limited Brands, Inc. | | | 7,482 | | | | 287,683 | |
| PetSmart, Inc. | | | 1,619 | | | | 73,454 | |
| TJX Cos., Inc. (The) | | | 180 | | | | 9,455 | |
| Williams-Sonoma, Inc. | | | 3,952 | | | | 144,209 | |
| | | | | | | | 1,133,454 | |
| TEXTILES, APPAREL & LUXURY GOODS — 0.7% | |
| VF Corp. | | | 2,323 | | | | 252,185 | |
| TOBACCO — 2.3% | |
| Lorillard, Inc. | | | 407 | | | | 44,310 | |
| Philip Morris International, Inc. | | | 12,543 | | | | 837,496 | |
| | | | | | | | 881,806 | |
TOTAL COMMON STOCKS (Cost $32,793,375) | | | | 37,928,169 | |
| Temporary Cash Investments — 2.5% | |
| JPMorgan U.S. Treasury Plus Money Market Fund Agency Shares | | | 222,708 | | | | 222,708 | |
| Repurchase Agreement, Bank of America N.A., (collateralized by various U.S. Treasury obligations, 4.375%, 11/15/39, valued at $266,030), in a joint trading account at 0.00%, dated 6/30/11, due 7/1/11 (Delivery value $260,007) | | | | 260,007 | |
| Repurchase Agreement, Credit Suisse First Boston, Inc., (collateralized by various U.S. Treasury obligations, 3.50%, 5/15/20, valued at $221,072), in a joint trading account at 0.00%, dated 6/30/11, due 7/1/11 (Delivery value $216,672) | | | | 216,672 | |
| Repurchase Agreement, Goldman Sachs Group, Inc., (collateralized by various U.S. Treasury obligations, 1.375%, 9/15/12, valued at $265,235), in a joint trading account at 0.00%, dated 6/30/11, due 7/1/11 (Delivery value $260,007) | | | | 260,007 | |
TOTAL TEMPORARY CASH INVESTMENTS (Cost $959,394) | | | | 959,394 | |
TOTAL INVESTMENT SECURITIES — 101.4% (Cost $33,752,769) | | | | 38,887,563 | |
| OTHER ASSETS AND LIABILITIES — (1.4)% | | | | (549,593 | ) |
| TOTAL NET ASSETS — 100.0% | | | | $38,337,970 | |
Notes to Schedule of Investments
| (2) | Category is less than 0.05% of total net assets. |
See Notes to Financial Statements.
Statement of Assets and Liabilities |
| JUNE 30, 2011 | |
| Assets | |
| Investment securities, at value (cost of $33,752,769) | | | $38,887,563 | |
| Receivable for investments sold | | | 1,310,031 | |
| Receivable for capital shares sold | | | 90,536 | |
| Dividends and interest receivable | | | 37,572 | |
| | | | 40,325,702 | |
| | | | | |
| Liabilities | |
| Payable for investments purchased | | | 1,944,134 | |
| Payable for capital shares redeemed | | | 12,325 | |
| Accrued management fees | | | 30,354 | |
| Distribution and service fees payable | | | 919 | |
| | | | 1,987,732 | |
| | | | | |
| Net Assets | | | $38,337,970 | |
| | | | | |
| Net Assets Consist of: | |
| Capital (par value and paid-in surplus) | | | $34,644,326 | |
| Undistributed net investment income | | | 27,898 | |
| Accumulated net realized loss | | | (1,469,048 | ) |
| Net unrealized appreciation | | | 5,134,794 | |
| | | | $38,337,970 | |
| | Net assets | Shares outstanding | Net asset value per share |
| Investor Class, $0.01 Par Value | $31,450,070 | 2,448,031 | $12.85 |
| Institutional Class, $0.01 Par Value | $3,096,720 | 240,274 | $12.89 |
| A Class, $0.01 Par Value | $3,026,488 | 236,502 | $12.80* |
| B Class, $0.01 Par Value | $105,084 | 8,382 | $12.54 |
| C Class, $0.01 Par Value | $166,940 | 13,318 | $12.53 |
| R Class, $0.01 Par Value | $492,668 | 38,854 | $12.68 |
| *Maximum offering price $13.58 (net asset value divided by 0.9425) |
See Notes to Financial Statements.
| YEAR ENDED JUNE 30, 2011 | |
| Investment Income (Loss) | |
| Income: | | | |
| Dividends (net of foreign taxes withheld of $617) | | | $361,484 | |
| Interest | | | 339 | |
| | | | 361,823 | |
| | | | | |
| Expenses: | | | | |
| Management fees | | | 258,252 | |
| Distribution and service fees: | | | | |
| A Class | | | 3,195 | |
| B Class | | | 861 | |
| C Class | | | 1,228 | |
| R Class | | | 1,727 | |
| Directors’ fees and expenses | | | 1,157 | |
| Other expenses | | | 768 | |
| | | | 267,188 | |
| | | | | |
| Net investment income (loss) | | | 94,635 | |
| | | | | |
| Realized and Unrealized Gain (Loss) | |
| Net realized gain (loss) on investment transactions | | | 2,788,807 | |
| Change in net unrealized appreciation (depreciation) on investments | | | 3,976,993 | |
| | | | | |
| Net realized and unrealized gain (loss) | | | 6,765,800 | |
| | | | | |
| Net Increase (Decrease) in Net Assets Resulting from Operations | | | $6,860,435 | |
See Notes to Financial Statements.
Statement of Changes in Net Assets |
| YEARS ENDED JUNE 30, 2011 AND JUNE 30, 2010 | |
| Increase (Decrease) in Net Assets | | 2011 | | | 2010 | |
| Operations | |
| Net investment income (loss) | | | $94,635 | | | | $74,458 | |
| Net realized gain (loss) | | | 2,788,807 | | | | 571,034 | |
| Change in net unrealized appreciation (depreciation) | | | 3,976,993 | | | | 1,449,372 | |
| Net increase (decrease) in net assets resulting from operations | | | 6,860,435 | | | | 2,094,864 | |
| | | | | | | | | |
| Distributions to Shareholders | |
| From net investment income: | | | | | | | | |
| Investor Class | | | (52,830 | ) | | | (68,774 | ) |
| Institutional Class | | | (12,483 | ) | | | (20,108 | ) |
| A Class | | | (235 | ) | | | (1,108 | ) |
| R Class | | | — | | | | (95 | ) |
| Decrease in net assets from distributions | | | (65,548 | ) | | | (90,085 | ) |
| | | | | | | | | |
| Capital Share Transactions | |
| Net increase (decrease) in net assets from capital share transactions | | | 15,583,236 | | | | 345,348 | |
| | | | | | | | | |
| Net increase (decrease) in net assets | | | 22,378,123 | | | | 2,350,127 | |
| | | | | | | | | |
| Net Assets | |
| Beginning of period | | | 15,959,847 | | | | 13,609,720 | |
| End of period | | | $38,337,970 | | | | $15,959,847 | |
| | | | | | | | | |
| Undistributed net investment income | | | $27,898 | | | | — | |
See Notes to Financial Statements.
Notes to Financial Statements |
JUNE 30, 2011
1. Organization
American Century Quantitative Equity Funds, Inc. (the corporation) is registered under the Investment Company Act of 1940, as amended (the 1940 Act), as an open-end management investment company and is organized as a Maryland corporation. Disciplined Growth Fund (the fund) is one fund in a series issued by the corporation. The fund is diversified as defined under the 1940 Act. The fund’s investment objective is to seek long-term capital growth by investing in common stocks.
The fund is authorized to issue the Investor Class, the Institutional Class, the A Class, the B Class, the C Class and the R Class. The A Class may incur an initial sales charge. The A Class, B Class and C Class may be subject to a contingent deferred sales charge. The share classes differ principally in their respective sales charges and distribution and shareholder servicing expenses and arrangements. The Institutional Class is made available to institutional shareholders or through financial intermediaries whose clients do not require the same level of shareholder and administrative services as shareholders of other classes. As a result, the Institutional Class is charged a lower unified management fee.
2. Significant Accounting Policies
The following is a summary of significant accounting policies consistently followed by the fund in preparation of its financial statements. The financial statements are prepared in conformity with accounting principles generally accepted in the United States of America, which may require management to make certain estimates and assumptions at the date of the financial statements. Actual results could differ from these estimates.
Investment Valuations — The fund determines the fair value of its investments and computes its net asset value per share as of the close of regular trading (usually 4 p.m. Eastern time) on the New York Stock Exchange (NYSE) on each day the NYSE is open.
Equity securities that are listed or traded on a domestic securities exchange are valued at the last reported sales price or at the official closing price as provided by the exchange. Equity securities traded on foreign securities exchanges are typically valued at the closing price on the exchange where primarily traded or as of the close of the NYSE, if that is earlier. If no last sales price is reported, or if local convention or regulation so provides, the mean of the latest bid and asked prices is used. Depending on local convention or regulation, securities traded over-the-counter are valued at the mean of the latest bid and asked prices, the last sales price, or the official closing price. In its determination of fair value, the fund may review several factors including: market information specific to a security; news developments in U.S. and foreign markets; the performance of particular U.S. and foreign securities, indices, comparable securities, American Depositary Receipts, Exchange-Traded Funds, and other relevant market indicators.
Debt securities maturing within 60 days at the time of purchase may be valued at cost, plus or minus any amortized discount or premium or at the evaluated mean as provided by an independent pricing service. Evaluated mean prices are commonly derived through utilization of market models, which may consider, among other factors, trade data, quotations from dealers and active market makers, relevant yield curve and spread data, related sector levels, creditworthiness, and other relevant market information on the same or comparable securities.
Investments in open-end management investment companies are valued at the reported net asset value per share. Repurchase agreements are valued at cost.
If the fund determines that the market price for a portfolio security is not readily available or the valuation methods mentioned above do not reflect a security’s fair value, such security is valued as determined in good faith by the Board of Directors or its designee, in accordance with procedures adopted by the Board of Directors. Circumstances that may cause the fund to use these procedures to value a security include, but are not limited to: a security has been declared in default; trading in a security has been halted during
the trading day; there is a foreign market holiday and no trading occurred; or an event occurred between the close of a foreign exchange and the NYSE that may affect the value of a security.
Security Transactions — Security transactions are accounted for as of the trade date. Net realized gains and losses are determined on the identified cost basis, which is also used for federal income tax purposes.
Investment Income — Dividend income less foreign taxes withheld, if any, is recorded as of the ex-dividend date. Distributions received on securities that represent a return of capital or capital gain are recorded as a reduction of cost of investments and/or as a realized gain. The fund estimates the components of distributions received that may be considered nontaxable distributions or capital gain distributions for income tax purposes. Interest income is recorded on the accrual basis and includes accretion of discounts and amortization of premiums.
Repurchase Agreements — The fund may enter into repurchase agreements with institutions that American Century Investment Management, Inc. (ACIM) (the investment advisor) has determined are creditworthy pursuant to criteria adopted by the Board of Directors. The fund requires that the collateral, represented by securities, received in a repurchase transaction be transferred to the custodian in a manner sufficient to enable the fund to obtain those securities in the event of a default under the repurchase agreement. ACIM monitors, on a daily basis, the securities transferred to ensure the value, including accrued interest, of the securities under each repurchase agreement is equal to or greater than amounts owed to the fund under each repurchase agreement.
Joint Trading Account — Pursuant to an Exemptive Order issued by the Securities and Exchange Commission, the fund, along with certain other funds in the American Century Investments family of funds, may transfer uninvested cash balances into a joint trading account. These balances are invested in one or more repurchase agreements that are collateralized by U.S. Treasury or Agency obligations.
Income Tax Status — It is the fund’s policy to distribute substantially all net investment income and net realized gains to shareholders and to otherwise qualify as a regulated investment company under provisions of the Internal Revenue Code. The fund is no longer subject to examination by tax authorities for years prior to 2008. At this time, management believes there are no uncertain tax positions which, based on their technical merit, would not be sustained upon examination and for which it is reasonably possible that the total amounts of unrecognized tax benefits will significantly change in the next twelve months. Accordingly, no provision has been made for federal or state income taxes.
Multiple Class — All shares of the fund represent an equal pro rata interest in the net assets of the class to which such shares belong, and have identical voting, dividend, liquidation and other rights and the same terms and conditions, except for class specific expenses and exclusive rights to vote on matters affecting only individual classes. Income, non-class specific expenses, and realized and unrealized capital gains and losses of the fund are allocated to each class of shares based on their relative net assets.
Distributions to Shareholders — Distributions from net investment income, if any, are generally declared and paid semiannually. Distributions from net realized gains, if any, are generally declared and paid annually.
Indemnifications — Under the corporation’s organizational documents, its officers and directors are indemnified against certain liabilities arising out of the performance of their duties to the fund. In addition, in the normal course of business, the fund enters into contracts that provide general indemnifications. The maximum exposure under these arrangements is unknown as this would involve future claims that may be made against a fund. The risk of material loss from such claims is considered by management to be remote.
3. Fees and Transactions with Related Parties
Management Fees —The corporation has entered into a management agreement with ACIM, under which ACIM provides the fund with investment advisory and management services in exchange for a single, unified management fee (the fee) per class. The agreement provides that all expenses of managing and operating the fund, except distribution and service fees, brokerage expenses, taxes, interest, fees and expenses of the independent directors (including legal counsel fees), and extraordinary expenses, will be paid by ACIM. The fee is computed and accrued daily based on each class’s daily net assets and paid monthly in arrears. The fee consists of (1) an Investment Category Fee based on the daily net assets of the fund and certain other accounts managed by the investment advisor that are in the same broad investment category as the fund and (2) a Complex Fee based on the assets of all the funds in the American Century Investments family of funds. The rates for the Investment Category Fee range from 0.6880% to 0.8700%. The rates for the Complex Fee range from 0.2500% to 0.3100% for the Investor Class, A Class, B Class, C Class and R Class. The Institutional Class is 0.2000% less at each point within the Complex Fee range. The effective annual management fee for each class for the year ended June 30, 2011 was 1.03% for the Investor Class, A Class, B Class, C Class and R Class and 0.83% for the Institutional Class.
Distribution and Service Fees — The Board of Directors has adopted a separate Master Distribution and Individual Shareholder Services Plan for each of the A Class, B Class, C Class and R Class (collectively the plans), pursuant to Rule 12b-1 of the 1940 Act. The plans provide that the A Class will pay American Century Investment Services, Inc. (ACIS) an annual distribution and service fee of 0.25%. The plans provide that the B Class and C Class will each pay ACIS an annual distribution and service fee of 1.00%, of which 0.25% is paid for individual shareholder services and 0.75% is paid for distribution services. The plans provide that the R Class will pay ACIS an annual distribution and service fee of 0.50%. The fees are computed and accrued daily based on each class’s daily net assets and paid monthly in arrears. The fees are used to pay financial intermediaries for distribution and individual shareholder services. Fees incurred under the plans during the year ended June 30, 2011 are detailed in the Statement of Operations.
Related Parties — Certain officers and directors of the corporation are also officers and/or directors of American Century Companies, Inc. (ACC), the parent of the corporation’s investment advisor, ACIM, the distributor of the corporation, ACIS, and the corporation’s transfer agent, American Century Services, LLC.
The fund is eligible to invest in a money market fund for temporary purposes, which is managed by J.P. Morgan Investment Management, Inc. (JPMIM). The fund has a securities lending agreement with JPMorgan Chase Bank (JPMCB) and a mutual funds services agreement with J.P. Morgan Investor Services Co. (JPMIS). JPMCB is a custodian of the fund. JPMIM, JPMIS and JPMCB are wholly owned subsidiaries of JPMorgan Chase & Co. (JPM). JPM is an equity investor in ACC. The services provided to the fund by JPMIM, JPMIS and JPMCB terminated on July 31, 2011.
4. Investment Transactions
Purchases and sales of investment securities, excluding short-term investments, for the year ended June 30, 2011 were $45,217,615 and $29,880,320, respectively.
5. Capital Share Transactions
Transactions in shares of the fund were as follows:
| | | Year ended June 30, 2011 | | | Year ended June 30, 2010 | |
| | | Shares | | | Amount | | | Shares | | | Amount | |
| Investor Class/Shares Authorized | | | 50,000,000 | | | | | | | 50,000,000 | | | | |
| Sold | | | 1,682,989 | | | | $20,358,748 | | | | 510,456 | | | | $4,912,469 | |
| Issued in reinvestment of distributions | | | 4,156 | | | | 49,256 | | | | 6,537 | | | | 64,129 | |
| Redeemed | | | (618,950 | ) | | | (7,255,643 | ) | | | (440,705 | ) | | | (4,161,868 | ) |
| | | | 1,068,195 | | | | 13,152,361 | | | | 76,288 | | | | 814,730 | |
| Institutional Class/Shares Authorized | | | 10,000,000 | | | | | | | | 10,000,000 | | | | | |
| Sold | | | 98,023 | | | | 1,194,467 | | | | 50,022 | | | | 482,024 | |
| Issued in reinvestment of distributions | | | 1,052 | | | | 12,483 | | | | 2,045 | | | | 20,108 | |
| Redeemed | | | (90,338 | ) | | | (1,049,782 | ) | | | (102,405 | ) | | | (972,968 | ) |
| | | | 8,737 | | | | 157,168 | | | | (50,338 | ) | | | (470,836 | ) |
| A Class/Shares Authorized | | | 10,000,000 | | | | | | | | 10,000,000 | | | | | |
| Sold | | | 191,652 | | | | 2,338,216 | | | | 52,199 | | | | 516,352 | |
| Issued in reinvestment of distributions | | | 19 | | | | 229 | | | | 111 | | | | 1,086 | |
| Redeemed | | | (26,791 | ) | | | (317,714 | ) | | | (31,879 | ) | | | (293,445 | ) |
| | | | 164,880 | | | | 2,020,731 | | | | 20,431 | | | | 223,993 | |
| B Class/Shares Authorized | | | 10,000,000 | | | | | | | | 10,000,000 | | | | | |
| Sold | | | 3,344 | | | | 38,679 | | | | 2,723 | | | | 26,373 | |
| Redeemed | | | (964 | ) | | | (11,820 | ) | | | — | | | | — | |
| | | | 2,380 | | | | 26,859 | | | | 2,723 | | | | 26,373 | |
| C Class/Shares Authorized | | | 10,000,000 | | | | | | | | 10,000,000 | | | | | |
| Sold | | | 17,046 | | | | 199,910 | | | | 1,067 | | | | 9,604 | |
| Redeemed | | | (8,227 | ) | | | (101,818 | ) | | | (3,432 | ) | | | (31,950 | ) |
| | | | 8,819 | | | | 98,092 | | | | (2,365 | ) | | | (22,346 | ) |
| R Class/Shares Authorized | | | 10,000,000 | | | | | | | | 10,000,000 | | | | | |
| Sold | | | 10,440 | | | | 132,524 | | | | 119 | | | | 1,182 | |
| Issued in reinvestment of distributions | | | — | | | | — | | | | 10 | | | | 95 | |
| Redeemed | | | (359 | ) | | | (4,499 | ) | | | (24,009 | ) | | | (227,843 | ) |
| | | | 10,081 | | | | 128,025 | | | | (23,880 | ) | | | (226,566 | ) |
| Net increase (decrease) | | | 1,263,092 | | | | $15,583,236 | | | | 22,859 | | | | $345,348 | |
6. Fair Value Measurements
The fund’s securities valuation process is based on several considerations and may use multiple inputs to determine the fair value of the positions held by the fund. In conformity with accounting principles generally accepted in the United States of America, the inputs used to determine a valuation are classified into three broad levels as follows:
| • | Level 1 valuation inputs consist of unadjusted quoted prices in an active market for identical securities; |
| Level 2 valuation inputs consist of direct or indirect observable market data (including quoted prices for similar securities, evaluations of subsequent market events, interest rates, prepayment speeds, credit risk, etc.); or |
| Level 3 valuation inputs consist of unobservable data (including a fund’s own assumptions). |
The level classification is based on the lowest level input that is significant to the fair valuation measurement. The valuation inputs are not necessarily an indication of the risks associated with investing in these securities or other financial instruments.
The following is a summary of the level classifications as of period end. The Schedule of Investments provides additional information on the fund’s portfolio holdings.
| | | Level 1 | | | Level 2 | | | Level 3 | |
| Investment Securities | |
| Common Stocks | | | $37,928,169 | | | | — | | | | — | |
| Temporary Cash Investments | | | 222,708 | | | | $736,686 | | | | — | |
| Total Value of Investment Securities | | | $38,150,877 | | | | $736,686 | | | | — | |
7. Risk Factors
The fund’s investment process may result in high portfolio turnover, which could mean high transaction costs, affecting both performance and capital gains tax liabilities to investors.
8. Federal Tax Information
The tax character of distributions paid during the years ended June 30, 2011 and June 30, 2010 were as follows:
| | | 2011 | | | 2010 | |
| Distributions Paid From | |
| Ordinary income | | | $65,548 | | | | $90,085 | |
| Long-term capital gains | | | — | | | | — | |
The book-basis character of distributions made during the year from net investment income or net realized gains may differ from their ultimate characterization for federal income tax purposes. These differences reflect the differing character of certain income items and net realized gains and losses for financial statement and tax purposes, and may result in reclassification among certain capital accounts on the financial statements.
As of June 30, 2011, the federal tax cost of investments and the components of distributable earnings on a tax-basis were as follows:
| Federal tax cost of investments | | | $33,873,946 | |
| Gross tax appreciation of investments | | | $5,372,699 | |
| Gross tax depreciation of investments | | | (359,082 | ) |
| Net tax appreciation (depreciation) of investments | | | $5,013,617 | |
| Undistributed ordinary income | | | $27,898 | |
| Accumulated capital losses | | | $(1,347,871 | ) |
The difference between book-basis and tax-basis cost and unrealized appreciation (depreciation) is attributable primarily to the tax deferral of losses on wash sales.
The accumulated capital losses represent net capital loss carryovers that may be used to offset future realized capital gains for federal income tax purposes. Future capital loss carryover utilization in any given year may be subject to Internal Revenue Code limitations. Capital loss carryovers expire in 2018.
On December 22, 2010, the Regulated Investment Company Modernization Act of 2010 (the “Act”) was enacted, which changed various technical rules governing the tax treatment of regulated investment companies. The changes are generally effective for taxable years beginning after the date of enactment. Under the Act, the fund will be permitted to carry forward capital losses incurred in taxable years beginning after the date of enactment for an unlimited period. However, any losses incurred during those future taxable years will be required to be utilized prior to the losses incurred in pre-enactment taxable years, which carry an expiration date. As a result of this ordering rule, pre-enactment capital loss carryforwards may be more likely to expire unused.
| Investor Class | |
| For a Share Outstanding Throughout the Years Ended June 30 (except as noted) | |
| | | 2011 | | | 2010 | | | 2009 | | | 2008 | | | 2007(1) | | | 2006 | |
| Per-Share Data | |
| Net Asset Value, Beginning of Period | | | $9.27 | | | | $8.01 | | | | $11.12 | | | | $12.35 | | | | $11.59 | | | | $10.47 | |
Income From Investment Operations | | | | | | | | | | | | | | | | | | | | | | | | |
Net Investment Income (Loss)(2) | | | 0.04 | | | | 0.04 | | | | 0.04 | | | | (0.01 | ) | | | (0.02 | ) | | | (0.02 | ) |
Net Realized and Unrealized Gain (Loss) | | | 3.57 | | | | 1.27 | | | | (3.12 | ) | | | (0.74 | ) | | | 0.83 | | | | 1.20 | |
Total From Investment Operations | | | 3.61 | | | | 1.31 | | | | (3.08 | ) | | | (0.75 | ) | | | 0.81 | | | | 1.18 | |
| Distributions | | | | | | | | | | | | | | | | | | | | | | | | |
From Net Investment Income | | | (0.03 | ) | | | (0.05 | ) | | | (0.03 | ) | | | — | | | | — | | | | — | |
From Net Realized Gains | | | — | | | | — | | | | — | | | | (0.48 | ) | | | (0.05 | ) | | | (0.06 | ) |
| Total Distributions | | | (0.03 | ) | | | (0.05 | ) | | | (0.03 | ) | | | (0.48 | ) | | | (0.05 | ) | | | (0.06 | ) |
Net Asset Value, End of Period | | | $12.85 | | | | $9.27 | | | | $8.01 | | | | $11.12 | | | | $12.35 | | | | $11.59 | |
| | | | | | | | | | | | | | | | | | | | | | | | | |
Total Return(3) | | | 39.00 | % | | | 16.35 | % | | | (27.63 | )% | | | (6.38 | )% | | | 7.00 | % | | | 11.30 | % |
| | | | | | | | | | | | | | | | | | | | | | | | | |
| Ratios/Supplemental Data | |
Ratio of Operating Expenses to Average Net Assets | | | 1.04 | % | | | 1.05 | % | | | 1.05 | % | | | 1.03 | % | | | 1.02 | %(4) | | | 1.02 | % |
Ratio of Net Investment Income (Loss) to Average Net Assets | | | 0.37 | % | | | 0.46 | % | | | 0.44 | % | | | (0.07 | )% | | | (0.29 | )%(4) | | | (0.21 | )% |
| Portfolio Turnover Rate | | | 117 | % | | | 84 | % | | | 98 | % | | | 134 | % | | | 78 | % | | | 124 | % |
| Net Assets, End of Period (in thousands) | | | $31,450 | | | | $12,787 | | | | $10,440 | | | | $16,093 | | | | $22,775 | | | | $16,709 | |
| (1) | January 1, 2007 through June 30, 2007. The fund’s fiscal year end was changed from December 31 to June 30, resulting in a six-month annual reporting period. For the years before June 30, 2007, the fund’s fiscal year end was December 31. |
| (2) | Computed using average shares outstanding throughout the period. |
| (3) | Total returns are calculated based on the net asset value of the last business day. Total returns for periods less than one year are not annualized. |
See Notes to Financial Statements.
| Institutional Class | |
| For a Share Outstanding Throughout the Years Ended June 30 (except as noted) | |
| | | 2011 | | | 2010 | | | 2009 | | | 2008 | | | 2007(1) | | | 2006 | |
| Per-Share Data | |
| Net Asset Value, Beginning of Period | | | $9.30 | | | | $8.03 | | | | $11.15 | | | | $12.36 | | | | $11.62 | | | | $10.47 | |
Income From Investment Operations | | | | | | | | | | | | | | | | | | | | | | | | |
Net Investment Income (Loss)(2) | | | 0.06 | | | | 0.06 | | | | 0.05 | | | | 0.01 | | | | — | (3) | | | — | (3) |
Net Realized and Unrealized Gain (Loss) | | | 3.59 | | | | 1.28 | | | | (3.12 | ) | | | (0.74 | ) | | | 0.81 | | | | 1.21 | |
Total From Investment Operations | | | 3.65 | | | | 1.34 | | | | (3.07 | ) | | | (0.73 | ) | | | 0.81 | | | | 1.21 | |
| Distributions | | | | | | | | | | | | | | | | | | | | | | | | |
From Net Investment Income | | | (0.06 | ) | | | (0.07 | ) | | | (0.05 | ) | | | — | | | | — | | | | — | |
From Net Realized Gains | | | — | | | | — | | | | — | | | | (0.48 | ) | | | (0.07 | ) | | | (0.06 | ) |
| Total Distributions | | | (0.06 | ) | | | (0.07 | ) | | | (0.05 | ) | | | (0.48 | ) | | | (0.07 | ) | | | (0.06 | ) |
Net Asset Value, End of Period | | | $12.89 | | | | $9.30 | | | | $8.03 | | | | $11.15 | | | | $12.36 | | | | $11.62 | |
| | | | | | | | | | | | | | | | | | | | | | | | | |
Total Return(4) | | | 39.26 | % | | | 16.67 | % | | | (27.50 | )% | | | (6.22 | )% | | | 7.02 | % | | | 11.59 | % |
| | | | | | | | | | | | | | | | | | | | | | | | | |
| Ratios/Supplemental Data | |
Ratio of Operating Expenses to Average Net Assets | | | 0.84 | % | | | 0.85 | % | | | 0.85 | % | | | 0.83 | % | | | 0.82 | %(5) | | | 0.82 | % |
Ratio of Net Investment Income (Loss) to Average Net Assets | | | 0.57 | % | | | 0.66 | % | | | 0.64 | % | | | 0.13 | % | | | (0.09 | )%(5) | | | (0.01 | )% |
| Portfolio Turnover Rate | | | 117 | % | | | 84 | % | | | 98 | % | | | 134 | % | | | 78 | % | | | 124 | % |
| Net Assets, End of Period (in thousands) | | | $3,097 | | | | $2,152 | | | | $2,265 | | | | $4,194 | | | | $6,918 | | | | $3,940 | |
| (1) | January 1, 2007 through June 30, 2007. The fund’s fiscal year end was changed from December 31 to June 30, resulting in a six-month annual reporting period. For the years before June 30, 2007, the fund’s fiscal year end was December 31. |
| (2) | Computed using average shares outstanding throughout the period. |
| (3) | Per-share amount was less than $0.005. |
| (4) | Total returns are calculated based on the net asset value of the last business day. Total returns for periods less than one year are not annualized. |
See Notes to Financial Statements.
A Class(1) | |
| For a Share Outstanding Throughout the Years Ended June 30 (except as noted) | |
| | | 2011 | | | 2010 | | | 2009 | | | 2008 | | | 2007(2) | | | 2006 | |
| Per-Share Data | |
| Net Asset Value, Beginning of Period | | | $9.23 | | | | $7.98 | | | | $11.07 | | | | $12.33 | | | | $11.56 | | | | $10.46 | |
Income From Investment Operations | | | | | | | | | | | | | | | | | | | | | | | | |
Net Investment Income (Loss)(3) | | | 0.02 | | | | 0.02 | | | | 0.02 | | | | (0.04 | ) | | | (0.03 | ) | | | (0.05 | ) |
Net Realized and Unrealized Gain (Loss) | | | 3.55 | | | | 1.26 | | | | (3.09 | ) | | | (0.74 | ) | | | 0.82 | | | | 1.21 | |
Total From Investment Operations | | | 3.57 | | | | 1.28 | | | | (3.07 | ) | | | (0.78 | ) | | | 0.79 | | | | 1.16 | |
| Distributions | | | | | | | | | | | | | | | | | | | | | | | | |
From Net Investment Income | | | — | (4) | | | (0.03 | ) | | | (0.02 | ) | | | — | | | | — | | | | — | |
From Net Realized Gains | | | — | | | | — | | | | — | | | | (0.48 | ) | | | (0.02 | ) | | | (0.06 | ) |
| Total Distributions | | | — | (4) | | | (0.03 | ) | | | (0.02 | ) | | | (0.48 | ) | | | (0.02 | ) | | | (0.06 | ) |
Net Asset Value, End of Period | | | $12.80 | | | | $9.23 | | | | $7.98 | | | | $11.07 | | | | $12.33 | | | | $11.56 | |
| | | | | | | | | | | | | | | | | | | | | | | | | |
Total Return(5) | | | 38.71 | % | | | 16.00 | % | | | (27.76 | )% | | | (6.65 | )% | | | 6.84 | % | | | 11.12 | % |
| | | | | | | | | | | | | | | | | | | | | | | | | |
| Ratios/Supplemental Data | |
Ratio of Operating Expenses to Average Net Assets | | | 1.29 | % | | | 1.30 | % | | | 1.30 | % | | | 1.28 | % | | | 1.27 | %(6) | | | 1.27 | % |
Ratio of Net Investment Income (Loss) to Average Net Assets | | | 0.12 | % | | | 0.21 | % | | | 0.19 | % | | | (0.32 | )% | | | (0.54 | )%(6) | | | (0.46 | )% |
| Portfolio Turnover Rate | | | 117 | % | | | 84 | % | | | 98 | % | | | 134 | % | | | 78 | % | | | 124 | % |
| Net Assets, End of Period (in thousands) | | | $3,026 | | | | $661 | | | | $408 | | | | $571 | | | | $1,248 | | | | $701 | |
| (1) | Prior to September 4, 2007, the A Class was referred to as the Advisor Class. |
| (2) | January 1, 2007 through June 30, 2007. The fund’s fiscal year end was changed from December 31 to June 30, resulting in a six-month annual reporting period. For the years before June 30, 2007, the fund’s fiscal year end was December 31. |
| (3) | Computed using average shares outstanding throughout the period. |
| (4) | Per-share amount was less than $0.005. |
| (5) | Total returns are calculated based on the net asset value of the last business day and do not reflect applicable sales charges. Total returns for periods less than one year are not annualized. |
See Notes to Financial Statements.
| B Class | |
| For a Share Outstanding Throughout the Years Ended June 30 (except as noted) | |
| | | 2011 | | | 2010 | | | 2009 | | | 2008(1) | |
| Per-Share Data | |
| Net Asset Value, Beginning of Period | | | $9.11 | | | | $7.91 | | | | $11.04 | | | | $12.93 | |
| Income From Investment Operations | | | | | | | | | | | | | | | | |
Net Investment Income (Loss)(2) | | | (0.07 | ) | | | (0.06 | ) | | | (0.04 | ) | | | (0.09 | ) |
| Net Realized and Unrealized Gain (Loss) | | | 3.50 | | | | 1.26 | | | | (3.09 | ) | | | (1.32 | ) |
| Total From Investment Operations | | | 3.43 | | | | 1.20 | | | | (3.13 | ) | | | (1.41 | ) |
| Distributions | | | | | | | | | | | | | | | | |
| From Net Realized Gains | | | — | | | | — | | | | — | | | | (0.48 | ) |
| Net Asset Value, End of Period | | | $12.54 | | | | $9.11 | | | | $7.91 | | | | $11.04 | |
| | | | | | | | | | | | | | | | | |
Total Return(3) | | | 37.65 | % | | | 15.17 | % | | | (28.35 | )% | | | (11.22 | )% |
| | | | | | | | | | | | | | | | | |
| Ratios/Supplemental Data | |
| Ratio of Operating Expenses to Average Net Assets | | | 2.04 | % | | | 2.05 | % | | | 2.05 | % | | | 2.03 | %(4) |
| Ratio of Net Investment Income (Loss) to Average Net Assets | | | (0.63 | )% | | | (0.54 | )% | | | (0.56 | )% | | | (1.02 | )%(4) |
| Portfolio Turnover Rate | | | 117 | % | | | 84 | % | | | 98 | % | | | 134 | %(5) |
| Net Assets, End of Period (in thousands) | | | $105 | | | | $55 | | | | $26 | | | | $22 | |
| (1) | September 28, 2007 (commencement of sale) through June 30, 2008. |
| (2) | Computed using average shares outstanding throughout the period. |
| (3) | Total returns are calculated based on the net asset value of the last business day and do not reflect applicable sales charges. Total returns for periods less than one year are not annualized. |
| (5) | Portfolio turnover is calculated at the fund level. Percentage indicated was calculated for the year ended June 30, 2008. |
See Notes to Financial Statements.
| C Class | |
| For a Share Outstanding Throughout the Years Ended June 30 (except as noted) | |
| | | 2011 | | | 2010 | | | 2009 | | | 2008(1) | |
| Per-Share Data | |
| Net Asset Value, Beginning of Period | | | $9.11 | | | | $7.91 | | | | $11.04 | | | | $12.93 | |
| Income From Investment Operations | | | | | | | | | | | | | | | | |
Net Investment Income (Loss)(2) | | | (0.07 | ) | | | (0.05 | ) | | | (0.04 | ) | | | (0.09 | ) |
| Net Realized and Unrealized Gain (Loss) | | | 3.49 | | | | 1.25 | | | | (3.09 | ) | | | (1.32 | ) |
| Total From Investment Operations | | | 3.42 | | | | 1.20 | | | | (3.13 | ) | | | (1.41 | ) |
| Distributions | | | | | | | | | | | | | | | | |
| From Net Realized Gains | | | — | | | | — | | | | — | | | | (0.48 | ) |
| Net Asset Value, End of Period | | | $12.53 | | | | $9.11 | | | | $7.91 | | | | $11.04 | |
| | | | | | | | | | | | | | | | | |
Total Return(3) | | | 37.54 | % | | | 15.17 | % | | | (28.35 | )% | | | (11.22 | )% |
| | | | | | | | | | | | | | | | | |
| Ratios/Supplemental Data | |
| Ratio of Operating Expenses to Average Net Assets | | | 2.04 | % | | | 2.05 | % | | | 2.05 | % | | | 2.03 | %(4) |
| Ratio of Net Investment Income (Loss) to Average Net Assets | | | (0.63 | )% | | | (0.54 | )% | | | (0.56 | )% | | | (1.01 | )%(4) |
| Portfolio Turnover Rate | | | 117 | % | | | 84 | % | | | 98 | % | | | 134 | %(5) |
| Net Assets, End of Period (in thousands) | | | $167 | | | | $41 | | | | $54 | | | | $22 | |
| (1) | September 28, 2007 (commencement of sale) through June 30, 2008. |
| (2) | Computed using average shares outstanding throughout the period. |
| (3) | Total returns are calculated based on the net asset value of the last business day and do not reflect applicable sales charges. Total returns for periods less than one year are not annualized. |
| (5) | Portfolio turnover is calculated at the fund level. Percentage indicated was calculated for the year ended June 30, 2008. |
See Notes to Financial Statements.
| R Class | |
| For a Share Outstanding Throughout the Years Ended June 30 (except as noted) | |
| | | 2011 | | | 2010 | | | 2009 | | | 2008 | | | 2007(1) | | | 2006 | |
| Per-Share Data | |
| Net Asset Value, Beginning of Period | | | $9.17 | | | | $7.92 | | | | $11.00 | | | | $12.28 | | | | $11.53 | | | | $10.46 | |
Income From Investment Operations | | | | | | | | | | | | | | | | | | | | | | | | |
Net Investment Income (Loss)(2) | | | (0.01 | ) | | | — | (3) | | | — | (3) | | | (0.07 | ) | | | (0.05 | ) | | | (0.08 | ) |
Net Realized and Unrealized Gain (Loss) | | | 3.52 | | | | 1.25 | | | | (3.08 | ) | | | (0.73 | ) | | | 0.82 | | | | 1.21 | |
Total From Investment Operations | | | 3.51 | | | | 1.25 | | | | (3.08 | ) | | | (0.80 | ) | | | 0.77 | | | | 1.13 | |
| Distributions | | | | | | | | | | | | | | | | | | | | | | | | |
From Net Investment Income | | | — | | | | — | (3) | | | — | | | | — | | | | — | | | | — | |
From Net Realized Gains | | | — | | | | — | | | | — | | | | (0.48 | ) | | | (0.02 | ) | | | (0.06 | ) |
| Total Distributions | | | — | | | | — | (3) | | | — | | | | (0.48 | ) | | | (0.02 | ) | | | (0.06 | ) |
Net Asset Value, End of Period | | | $12.68 | | | | $9.17 | | | | $7.92 | | | | $11.00 | | | | $12.28 | | | | $11.53 | |
| | | | | | | | | | | | | | | | | | | | | | | | | |
Total Return(4) | | | 38.28 | % | | | 15.82 | % | | | (28.00 | )% | | | (6.84 | )% | | | 6.68 | % | | | 10.83 | % |
| | | | | | | | | | | | | | | | | | | | | | | | | |
| Ratios/Supplemental Data | |
Ratio of Operating Expenses to Average Net Assets | | | 1.54 | % | | | 1.55 | % | | | 1.55 | % | | | 1.53 | % | | | 1.52 | %(5) | | | 1.52 | % |
Ratio of Net Investment Income (Loss) to Average Net Assets | | | (0.13 | )% | | | (0.04 | )% | | | (0.06 | )% | | | (0.57 | )% | | | (0.79 | )%(5) | | | (0.71 | )% |
| Portfolio Turnover Rate | | | 117 | % | | | 84 | % | | | 98 | % | | | 134 | % | | | 78 | % | | | 124 | % |
| Net Assets, End of Period (in thousands) | | | $493 | | | | $264 | | | | $417 | | | | $576 | | | | $619 | | | | $580 | |
| (1) | January 1, 2007 through June 30, 2007. The fund’s fiscal year end was changed from December 31 to June 30, resulting in a six-month annual reporting period. For the years before June 30, 2007, the fund’s fiscal year end was December 31. |
| (2) | Computed using average shares outstanding throughout the period. |
| (3) | Per-share amount was less than $0.005. |
| (4) | Total returns are calculated based on the net asset value of the last business day. Total returns for periods less than one year are not annualized. |
See Notes to Financial Statements.
Report of Independent Registered Public Accounting Firm |
To the Directors of the American Century Quantitative Equity Funds, Inc. and Shareholders of the Disciplined Growth Fund:
In our opinion, the accompanying statement of assets and liabilities, including the schedule of investments, and the related statements of operations and of changes in net assets and the financial highlights present fairly, in all material respects, the financial position of the Disciplined Growth Fund (one of the eleven funds comprising the American Century Quantitative Equity Funds, Inc., hereafter referred to as the “Fund”) at June 30, 2011, the results of its operations for the year then ended, the changes in its net assets for each of the two years in the period then ended and the financial highlights for each of the periods presented, in conformity with accounting principles generally accepted in the United States of America. These financial statements and financial highlights (hereafter referred to as “financial statements”) are the responsibility of the Fund’s management; our responsibility is to express an opinion on these financial statements based on our audits. We conducted our audits of these financial statements in accordance with the standards of the Public Company Accounting Oversight Board (United States). Those standards require that we plan and perform the audit to obtain reasonable assurance about whether the financial statements are free of material misstatement. An audit includes examining, on a test basis, evidence supporting the amounts and disclosures in the financial statements, assessing the accounting principles used and significant estimates made by management, and evaluating the overall financial statement presentation. We believe that our audits, which included confirmation of securities at June 30, 2011 by correspondence with the custodian and brokers, provide a reasonable basis for our opinion.
PricewaterhouseCoopers LLP
Kansas City, Missouri
August 18, 2011
Board of Directors
The individuals listed below serve as directors of the funds. Each director will continue to serve in this capacity until death, retirement, resignation or removal from office. The mandatory retirement age for directors who are not “interested persons,” as that term is defined in the Investment Company Act (independent directors), is 73. However, the mandatory retirement age may be extended for a period not to exceed two years with the approval of the remaining independent directors.
Mr. Thomas is the only director who is an “interested person” because he currently serves as President and Chief Executive Officer of American Century Companies, Inc. (ACC), the parent company of American Century Investment Management, Inc. (ACIM or the advisor).
The other directors (more than three-fourths of the total number) are independent; that is, they have never been employees, directors or officers of, and have no financial interest in, ACC or any of its wholly owned, direct or indirect, subsidiaries, including ACIM, American Century Investment Services, Inc. (ACIS) and American Century Services, LLC (ACS). The directors serve in this capacity for eight (in the case of Mr. Thomas, 15) registered investment companies in the American Century Investments family of funds.
The following presents additional information about the directors. The mailing address for each director other than Mr. Thomas is 1665 Charleston Road, Mountain View, California 94043. The mailing address for Mr. Thomas is
4500 Main Street, Kansas City, Missouri 64111.
Name (Year of Birth) | Position(s) Held with Funds | Length of Time Served | Principal Occupation(s) During Past 5 Years | | Number of American Century Portfolios Overseen by Director | Other Directorships Held During Past 5 Years |
| Independent Directors |
| Tanya S. Beder (1955) | Director | Since 2011 | Chairman, SBCC Group Inc. (investment advisory services) (2006 to present); Fellow in Practice, International Center for Finance, Yale University School of Management (1985 to present); Chief Executive Officer, Tribeca Global Management LLC (asset management firm) (2004 to 2006) | | 40 | None |
| Jeremy I. Bulow (1954) | Director | Since 2011 | Professor of Economics, Stanford University, Graduate School of Business (1979 to present) | | 40 | None |
| John Freidenrich (1937) | Director | Since 2005 | Founder, Member and Manager, Regis Management Company, LLC (investment management firm) (April 2004 to present) | | 40 | None |
Name (Year of Birth) | Position(s) Held with Funds | Length of Time Served | Principal Occupation(s) During Past 5 Years | | Number of American Century Portfolios Overseen by Director | Other Directorships Held During Past 5 Years |
| Independent Directors |
| Ronald J. Gilson (1946) | Director and Chairman of the Board | Since 1995 | Charles J. Meyers Professor of Law and Business, Stanford Law School (1979 to present); Marc and Eva Stern Professor of Law and Business, Columbia University School of Law (1992 to present) | | 40 | None |
Frederick L. A. Grauer (1946) | Director | Since 2008 | Senior Advisor, BlackRock, Inc. (investment management firm) (2010 to 2011); Senior Advisor, Barclays Global Investors (investment management firm) (2003 to 2009) | | 40 | None |
| Peter F. Pervere (1947) | Director | Since 2007 | Retired | | 40 | Intraware, Inc. (2003 to 2009) |
| Myron S. Scholes (1941) | Director | Since 1980 | Chairman, Platinum Grove Asset Management, L.P. (asset manager) (1999 to 2009); Frank E. Buck Professor of Finance-Emeritus, Stanford Graduate School of Business (1996 to present) | | 40 | Dimensional Fund Advisors (investment advisor); CME Group, Inc. (futures and options exchange) |
| John B. Shoven (1947) | Director | Since 2002 | Professor of Economics, Stanford University (1973 to present) | | 40 | Cadence Design Systems; Exponent; Financial Engines; Watson Wyatt Worldwide (2002 to 2006) |
| |
| Interested Director |
Jonathan S. Thomas (1963) | Director and President | Since 2007 | President and Chief Executive Officer, ACC (March 2007 to present); Chief Administrative Officer, ACC (February 2006 to February 2007); Executive Vice President, ACC (November 2005 to February 2007). Also serves as: Chief Executive Officer and Manager, ACS; Executive Vice President, ACIM; Director, ACC, ACIM and other ACC subsidiaries | | 104 | None |
Officers
The following table presents certain information about the executive officers of the funds. Each officer serves as an officer for each of the 15 investment companies in the American Century family of funds, unless otherwise noted. No officer is compensated for his or her service as an officer of the funds. The listed officers are interested persons of the funds and are appointed or re-appointed on an annual basis. The mailing address for each of the officers listed below is 4500 Main Street, Kansas City, Missouri 64111.
Name (Year of Birth) | Offices with the Funds | | Principal Occupation(s) During the Past Five Years |
Jonathan S. Thomas (1963) | Director and President since 2007 | | President and Chief Executive Officer, ACC (March 2007 to present); Chief Administrative Officer, ACC (February 2006 to February 2007); Executive Vice President, ACC (November 2005 to February 2007). Also serves as: Chief Executive Officer and Manager, ACS; Executive Vice President, ACIM; Director, ACC, ACIM and other ACC subsidiaries |
Barry Fink (1955) | Executive Vice President since 2007 | | Chief Operating Officer and Executive Vice President, ACC (September 2007 to present); President, ACS (October 2007 to present); Managing Director, Morgan Stanley (2000 to 2007); Global General Counsel, Morgan Stanley (2000 to 2006). Also serves as: Manager, ACS and Director, ACC and certain ACC subsidiaries |
Maryanne L. Roepke (1956) | Chief Compliance Officer since 2006 and Senior Vice President since 2000 | | Chief Compliance Officer, American Century funds, ACIM and ACS (August 2006 to present); Assistant Treasurer, ACC (January 1995 to August 2006); and Treasurer and Chief Financial Officer, various American Century funds (July 2000 to August 2006). Also serves as: Senior Vice President, ACS |
| Charles A. Etherington (1957) | General Counsel since 2007 and Senior Vice President since 2006 | | Attorney, ACC (February 1994 to present); Vice President, ACC (November 2005 to present), General Counsel, ACC (March 2007 to present); Also serves as General Counsel, ACIM, ACS, ACIS and other ACC subsidiaries; and Senior Vice President, ACIM and ACS |
| Robert J. Leach (1966) | Vice President, Treasurer and Chief Financial Officer since 2006 | | Vice President, ACS (February 2000 to present); and Controller, various American Century funds (1997 to September 2006) |
| David H. Reinmiller (1963) | Vice President since 2001 | | Attorney, ACC (January 1994 to present); Associate General Counsel, ACC (January 2001 to present); Also serves as Vice President, ACIM and ACS |
| Ward D. Stauffer (1960) | Secretary since 2005 | | Attorney, ACC (June 2003 to present) |
The Statement of Additional Information has additional information about the fund’s directors and is available without charge, upon request, by calling 1-800-345-2021.
| Approval of Management Agreement |
At a meeting held on June 28, 2011, the Fund’s Board of Directors/Trustees unanimously approved the renewal of the management agreement pursuant to which American Century Investment Management, Inc. (the “Advisor”) acts as the investment advisor for the Fund. Under Section 15(c) of the Investment Company Act, contracts for investment advisory services are required to be reviewed, evaluated, and approved by a majority of a fund’s independent directors/trustees (the “Directors”) each year.
As a part of the approval process, the Board requested and reviewed extensive data and information compiled by the Advisor and certain independent providers of evaluation data concerning the Fund and the services provided to the Fund by the Advisor. This review was in addition to the oversight and evaluation undertaken by the Board and its committees on a continuous basis throughout the year and included, but was not limited to the following:
| • | the nature, extent, and quality of investment management, shareholder services, and other services provided by the Advisor to the Fund; |
| the wide range of other programs and services the Advisor provides to the Fund and its shareholders on a routine and non-routine basis; |
| the investment performance of the fund, including data comparing the Fund’s performance to appropriate benchmarks and/or a peer group of other mutual funds with similar investment objectives and strategies; |
| data comparing the cost of owning the Fund to the cost of owning similar funds; |
| the Advisor’s compliance policies, procedures, and regulatory experience; |
| financial data showing the cost of services provided to the Fund, the profitability of the Fund to the Advisor, and the overall profitability of the Advisor; |
| data comparing services provided and charges to other investment management clients of the Advisor; and |
| consideration of collateral benefits derived by the Advisor from the management of the Fund and any potential economies of scale relating thereto. |
In keeping with its practice, the Board held two in-person meetings and one telephonic meeting to review and discuss the information provided. The Board also had the benefit of the advice of its independent counsel throughout the period.
Factors Considered
The Directors considered all of the information provided by the Advisor, the independent data providers, and the Board’s independent counsel, and evaluated such information for the Fund. In connection with their review, the Directors did not identify any single factor as being all-important or controlling, and each Director may have attributed different levels of importance to different factors. In deciding to renew the management agreement, the Board based its decision on a number of factors, including the following:
Nature, Extent and Quality of Services — Generally. Under the management agreement, the Advisor is responsible for providing or arranging for all services necessary for the operation of the Fund. The Board noted that under the management agreement, the Advisor provides or arranges at its own expense a wide variety of services including:
| constructing and designing the Fund |
| portfolio research and security selection |
| initial capitalization/funding |
| daily valuation of the Fund’s portfolio |
| shareholder servicing and transfer agency, including shareholder confirmations, recordkeeping, and communications |
| regulatory and portfolio compliance |
| marketing and distribution |
The Board noted that many of these services have expanded over time both in terms of quantity and complexity in response to shareholder demands, competition in the industry, changing distribution channels, and the changing regulatory environment.
Investment Management Services. The nature of the investment management services provided to the Fund is quite complex and allows Fund shareholders access to professional money management, instant diversification of their investments within an asset class, the opportunity to easily diversify among asset classes by investing in or exchanging among various American Century Investments funds, and liquidity. In evaluating investment performance, the Board expects the Advisor to manage the Fund in accordance with its investment objectives and approved strategies. Further, the Directors recognize that the Advisor has an obligation to seek the best execution of fund trades. In providing these services, the Advisor utilizes teams of investment professionals (portfolio managers, analysts, research assistants, and securities traders) who require extensive information technology, research, training, compliance and other systems to conduct their business. The Board, directly and through its Portfolio Committee, regularly reviews investment performance information for the Fund, together with comparative information for appropriate benchmarks and/or peer groups
of similarly-managed funds, over different time horizons. The Directors also review detailed performance information during the management agreement approval process. If performance concerns are identified, the Fund receives special reviews until performance improves, during which the Board discusses with the Advisor the reasons for such results (e.g., market conditions, security selection) and any efforts being undertaken to improve performance. The Board found the investment management services provided by the Advisor to the Fund to meet or exceed industry standards. More detailed information about the Fund’s performance can be found in the Performance and Portfolio Commentary sections of this report.
Shareholder and Other Services. Under the management agreement, the Advisor provides the Fund with a comprehensive package of transfer agency, shareholder, and other services. The Board, directly and through various committees of the Board, regularly reviews reports and evaluations of such services at its regular meetings. These reports include, but are not limited to, information regarding the operational efficiency and accuracy of the shareholder and transfer agency services provided, staffing levels, shareholder satisfaction (as measured by external as well as internal sources), technology support, new products and services offered to Fund shareholders, securities trading activities, portfolio valuation services, auditing services, and legal and operational compliance activities. Certain aspects of shareholder and transfer agency service level efficiency and the quality of securities trading activities are measured by independent third party providers and are presented in comparison to other fund groups not managed by the Advisor. The Board found the services provided by the Advisor to the Fund under the management agreement to be competitive and of high quality.
Costs of Services and Profitability. The Advisor provides detailed information concerning its cost of providing various services to the Fund, its profitability in managing the Fund, its overall profitability, and its financial condition. The Directors have reviewed with the Advisor the methodology used to prepare this financial information. The financial information regarding the Advisor is considered in evaluating the Advisor’s financial condition, ability to continue to provide services under the management agreement, and the reasonableness of the current management fee. The Board concluded that the Advisor’s profits were reasonable in light of the services provided to the Fund.
Ethics. The Board generally considers the Advisor’s commitment to providing quality services to shareholders and to conducting its business ethically. They noted that the Advisor’s practices generally meet or exceed industry best practices.
Economies of Scale. The Board also reviewed information provided by the Advisor regarding the possible existence of economies of scale in connection with the management of the Fund. The Board concluded that economies of scale are difficult to measure and predict with precision, especially on a fund-by-fund basis. The Board concluded that the Advisor is appropriately sharing economies of scale through its competitive fee structure, offering competitive fees from fund inception, and through reinvestment in its business to provide shareholders additional content and services.
Comparison to Other Funds’ Fees. The management agreement provides that the Fund pay the Advisor a single, all-inclusive (or unified) management fee for providing all services necessary for the management and operation of the Fund, other than brokerage expenses, taxes, interest, extraordinary expenses, and the fees and expenses of the Fund’s independent directors (including their independent legal counsel) and expenses incurred in connection with the provision of shareholder services and distribution services under a plan adopted pursuant to Rule 12b-1 under the 1940 Act. Under the unified fee structure, the Advisor is responsible for providing all investment advisory, custody, audit, administrative, compliance, recordkeeping, marketing and shareholder services, or arranging and supervising third parties to provide such services. By contrast, most other funds are charged a variety of fees, including an investment advisory fee, a transfer agency fee, an administrative fee, distribution charges and other expenses. Other than their investment advisory fees and any applicable Rule 12b-1 distribution fees, all other components of the total fees charged by these other funds may be increased without shareholder approval. The Board believes the unified fee structure is a benefit to Fund shareholders because it clearly discloses to shareholders the cost of owning Fund shares, and, since the unified fee cannot be increased without a vote of Fund shareholders, it shifts to the Advisor the risk of increased costs of operating the Fund and provides a direct incentive to minimize administrative inefficiencies. Part of the Board’s analysis of fee levels involves reviewing certain evaluative data compiled by an independent provider and comparing the Fund’s unified fee to the total expense ratio of other funds in the Fund’s peer group. The Board concluded that the management fee paid by the Fund to the Advisor under the management agreement is reasonable in light of the services provided to the Fund.
Comparison to Fees and Services Provided to Other Clients of the Advisor. The Board also requested and received information from the Advisor concerning the nature of the services, fees, costs and profitability of its advisory services to advisory clients other than the Fund. They observed that these varying types of client accounts require different services and involve different regulatory and entrepreneurial risks than the management of the Fund. The Board analyzed this information and concluded that the fees charged and services provided to the Fund were reasonable by comparison.
Collateral or “Fall-Out” Benefits Derived by the Advisor. The Board considered the existence of collateral benefits the Advisor may receive as a result of its relationship with the Fund. They concluded that the Advisor’s primary business is managing mutual funds and it generally does not use fund or shareholder information to generate profits in other lines of business, and therefore does not derive any significant collateral benefits from them. The Board noted that the Advisor receives proprietary research from broker-dealers that execute fund portfolio transactions and concluded that this research is likely to benefit Fund shareholders. The Board also determined that the Advisor is able to provide investment management services to certain clients other than the Fund, at least in part, due to its existing infrastructure built to serve the fund complex. The Board concluded, however, that the assets of those other clients are not material to the analysis and, where applicable, may be included with the assets of the Fund to determine breakpoints in the management fee schedule.
Existing Relationship. The Board also considered whether there was any reason for not continuing the existing arrangement with the Advisor. In this regard, the Board was mindful of the potential disruptions of the Fund’s operations and various risks, uncertainties, and other effects that could occur as a result of a decision not to continue such relationship. In particular, the Board recognized that most shareholders have invested in the Fund on the strength of the Advisor’s industry standing and reputation and in the expectation that the Advisor will have a continuing role in providing advisory services to the Fund.
Conclusion of the Directors. As a result of this process, the Board, including all of the independent directors and assisted by the advice of independent legal counsel, taking into account all of the factors discussed above and the information provided by the Advisor and others, concluded that the management agreement between the Fund and the Advisor is fair and reasonable in light of the services provided and should be renewed.
Retirement Account Information
As required by law, distributions you receive from certain IRAs, or 403(b), 457 and qualified plans are subject to federal income tax withholding, unless you elect not to have withholding apply. Tax will be withheld on the total amount withdrawn even though you may be receiving amounts that are not subject to withholding, such as nondeductible contributions. In such case, excess amounts of withholding could occur. You may adjust your withholding election so that a greater or lesser amount will be withheld.
If you don’t want us to withhold on this amount, you must notify us to not withhold the federal income tax. You may notify us in writing or in certain situations by telephone or through other electronic means. You have the right to revoke your withholding election at any time and any election you make may remain in effect until revoked by filing a new election.
Remember, even if you elect not to have income tax withheld, you are liable for paying income tax on the taxable portion of your withdrawal. If you elect not to have income tax withheld or you don’t have enough income tax withheld, you may be responsible for payment of estimated tax. You may incur penalties under the estimated tax rules if your withholding and estimated tax payments are not sufficient. You can reduce or defer the income tax on a distribution by directly or indirectly rolling such distribution over to another IRA or eligible plan. You should consult your tax advisor for additional information.
State tax will be withheld if, at the time of your distribution, your address is within one of the mandatory withholding states and you have federal income tax withheld. State taxes will be withheld from your distribution in accordance with the respective state rules.
Proxy Voting Guidelines
American Century Investment Management, Inc., the fund’s investment advisor, is responsible for exercising the voting rights associated with the securities purchased and/or held by the fund. A description of the policies and procedures the advisor uses in fulfilling this responsibility is available without charge, upon request, by calling 1-800-345-2021. It is also available on American Century Investments’ website at americancentury.com and on the Securities and Exchange Commission’s website at sec.gov. Information regarding how the investment advisor voted proxies relating to portfolio securities during the most recent 12-month period ended June 30 is available on the “About Us” page at americancentury.com. It is also available at sec.gov.
Quarterly Portfolio Disclosure
The fund files its complete schedule of portfolio holdings with the Securities and Exchange Commission (SEC) for the first and third quarters of each fiscal year on Form N-Q. The fund’s Forms N-Q are available on the SEC’s website at sec.gov, and may be reviewed and copied at the SEC’s Public Reference Room in Washington, DC. Information on the operation of the Public Reference Room may be obtained by calling 1-800-SEC-0330. The fund also makes its complete schedule of portfolio holdings for the most recent quarter of its fiscal year available on its website at americancentury.com and, upon request, by calling 1-800-345-2021.
Other Tax Information
The following information is provided pursuant to provisions of the Internal Revenue Code.
The fund hereby designates up to the maximum amount allowable as qualified dividend income for the fiscal year ended June 30, 2011.
For corporate taxpayers, the fund hereby designates $65,548, or up to the maximum amount allowable, of ordinary income distributions paid during the fiscal year ended June 30, 2011 as qualified for the corporate dividends received deduction.
| Contact Us | americancentury.com |
| Automated Information Line | 1-800-345-8765 |
| Investor Services Representative | 1-800-345-2021 or 816-531-5575 |
| Investors Using Advisors | 1-800-378-9878 |
| Business, Not-For-Profit, Employer-Sponsored Retirement Plans | 1-800-345-3533 |
| Banks and Trust Companies, Broker-Dealers, Financial Professionals, Insurance Companies | 1-800-345-6488 |
| Telecommunications Device for the Deaf | 1-800-634-4113 |
American Century Quantitative Equity Funds, Inc.
Investment Advisor:
American Century Investment Management, Inc.
Kansas City, Missouri
This report and the statements it contains are submitted for the general information of our shareholders. The report is not authorized for distribution to prospective investors unless preceded or accompanied by an effective prospectus.
©2011 American Century Proprietary Holdings, Inc. All rights reserved.
CL-ANN-72456 1108
ANNUAL REPORT JUNE 30, 2011
| President’s Letter | 2 |
| Market Perspective | 3 |
| Performance | 4 |
| Portfolio Commentary | 6 |
| Fund Characteristics | 8 |
| Shareholder Fee Example | 9 |
| Schedule of Investments | 11 |
| Statement of Assets and Liabilities | 15 |
| Statement of Operations | 16 |
| Statement of Changes in Net Assets | 17 |
| Notes to Financial Statements | 18 |
| Financial Highlights | 24 |
| Report of Independent Registered Public Accounting Firm | 30 |
| Management | 31 |
| Approval of Management Agreement | 34 |
| Additional Information | 39 |
Any opinions expressed in this report reflect those of the author as of the date of the report, and do not necessarily represent the opinions of American Century Investments® or any other person in the American Century Investments organization. Any such opinions are subject to change at any time based upon market or other conditions and American Century Investments disclaims any responsibility to update such opinions. These opinions may not be relied upon as investment advice and, because investment decisions made by American Century Investments funds are based on numerous factors, may not be relied upon as an indication of trading intent on behalf of any American Century Investments fund. Security examples are used for representational purposes only and are not intended as recommendations to purchase or sell securities. Performance information for comparative indices and securities is provided to American Century Investments by third party vendors. To the best of American Century Investments’ knowledge, such information is accurate at the time of printing.
Dear Investor:
Thank you for reviewing this annual report for the period ended June 30, 2011. Our report offers investment performance and portfolio information, presented with the expert perspective and commentary of our portfolio management team.
This report remains one of our most important vehicles for conveying information about investment performance and the market factors and strategies that affect fund returns. For additional, updated information on fund performance, portfolio strategy, and the investment markets, we encourage you to visit our website, americancentury.com. Click on the “Fund Performance” and “Insights & News” headings at the top of our Individual Investors site.
Reporting Period Perspective: Highest Broad Fiscal-Year U.S. Stock Returns Since 1997
Benefitting from favorable conditions and expectations, the U.S. stock market produced exceptional returns, the highest for any 12-month period ended June 30 since the fiscal year ended June 30, 1997. Back then, the S&P 500 Index gained 34.71%, compared with 30.69% for the most-recent reporting period. The intervening 14 years help illustrate how infrequently such a high level of performance occurs, requiring an alignment of economic and market conditions that’s difficult to duplicate.
The exceptional returns experienced during the reporting period represent a rebound from previous declines. After experiencing 10–12% declines during the second quarter of 2010—stemming from the European sovereign debt crisis and double-dip recession fears—most broad U.S. stock indices advanced 30% or more during the following 12 months. Monetary and fiscal intervention in 2010 stimulated growth and fueled investor optimism about economic and financial market conditions in 2011 and 2012, encouraging investments in riskier assets.
However, that optimism has diminished in the summer of 2011 as the European debt crisis returned to prominence and other debt and economic challenges emerged. As the reporting period came to a close in June 2011, we saw increasing signs that the U.S. economic recovery had lost momentum. As a result, economic growth forecasts were reduced, and broad U.S. stock indices trended downward beginning in May. As we enter the third quarter of 2011, investor concern over fiscal austerity measures in the U.S. and other developed economies raised fears of a return to recession and accelerated a decline in global equity markets. We appreciate your continued trust in us during these uncertain times.
Sincerely,
Jonathan Thomas
President and Chief Executive Officer
American Century Investments
By Scott Wittman, Chief Investment Officer, Quantitative Equity and Asset Allocation
U.S. Stocks Soared as Economy Improved
The U.S. stock market enjoyed very strong results for the 12 months ended June 30, 2011, with the broad equity indices returning more than 30%. The main catalyst for the sharp rally in stocks was growing investor confidence in a U.S. economic recovery, though that confidence faltered somewhat late in the period.
After a bumpy start resulting from an uncertain economic outlook, the equity market began a steady rise in September 2010 as improving economic data reassured investors that the economy would avoid a “double-dip” recession (a return to recession after a brief period of recovery). Most notably, employment growth turned positive after 2½ years of persistent job losses, and the manufacturing sector showed signs of life. In addition, a renewal of the Federal Reserve’s quantitative easing program and an extension of expiring federal tax breaks further boosted the market’s confidence that a promising economic recovery
was under way.
Stocks continued to advance in early 2011 despite unrest in the Middle East and North Africa, as well as a devastating earthquake and tsunami in Japan. By May, however, evidence of a slowdown in economic activity and renewed concerns about a European sovereign debt crisis weighed on investor confidence. As a result, stocks experienced a modest pullback in the final two months of the period.
Smaller Stocks and Growth-Oriented Issues Outperformed
Despite finishing on a down note, the broad equity indices posted robust returns overall for the 12-month period. As the table below illustrates, mid- and small-cap issues generated the best returns, outpacing large-cap shares. Meanwhile, growth stocks outperformed value across all market capitalizations, most dramatically among smaller companies. Every sector of the market produced double-digit gains for the period, led by energy and materials stocks, which benefited from strong demand and rising commodity prices. Other economically sensitive sectors—such as consumer discretionary and industrials—also fared well. The laggard was the financials sector, which continued to face mortgage-related challenges and regulatory uncertainty.
| U.S. Stock Index Returns |
| For the 12 months ended June 30, 2011 |
| Russell 1000 Index (Large-Cap) | 31.93% | | Russell 2000 Index (Small-Cap) | 37.41% |
| Russell 1000 Growth Index | 35.01% | | Russell 2000 Growth Index | 43.50% |
| Russell 1000 Value Index | 28.94% | | Russell 2000 Value Index | 31.35% |
| Russell Midcap Index | 38.47% | | |
| Russell Midcap Growth Index | 43.25% | | | |
| Russell Midcap Value Index | 34.28% | | | |
| Total Returns as of June 30, 2011 |
| | | | Average Annual Returns | |
| | Ticker Symbol | 1 year(1) | 5 years | 10 years | Since Inception | Inception Date |
| Investor Class | BEQGX | 31.66% | 2.12% | 3.13% | 8.75% | 5/9/91 |
| S&P 500 Index | — | 30.69% | 2.94% | 2.72% | 8.63%(2) | — |
| Institutional Class | AMEIX | 31.91% | 2.32% | 3.34% | 4.26% | 1/2/98 |
A Class(3) No sales charge* With sales charge* | BEQAX | 31.30% 23.74% | 1.87% 0.67% | 2.87% 2.26% | 3.69% 3.25% | 10/9/97 |
B Class No sales charge* With sales charge* | AEYBX | 30.30% 26.30% | — — | — — | -2.82% -3.70% | 9/28/07 |
| C Class | AEYCX | 30.34% | 1.11% | — | 2.29% | 7/18/01 |
| R Class | AEYRX | 30.95% | 1.61% | — | 2.01% | 7/29/05 |
*Sales charges include initial sales charges and contingent deferred sales charges (CDSCs), as applicable. A Class shares have a maximum 5.75% initial sales charge and may be subject to a maximum CDSC of 1.00%. B Class shares redeemed within six years of purchase are subject to a CDSC that declines from 5.00% during the first year after purchase to 0.00% the sixth year after purchase. C Class shares redeemed within 12 months of purchase are subject to a maximum CDSC of 1.00%. The SEC requires that mutual funds provide performance information net of maximum sales charges in all cases where charges could be applied.
| (1) | Extraordinary performance is attributable in part to unusually favorable market conditions and may not be repeated or consistently achieved in the future. |
| (2) | Since 4/30/91, the date nearest the Investor Class’s inception for which data are available. |
| (3) | Prior to September 4, 2007, the A Class was referred to as the Advisor Class and did not have a front-end sales charge. Performance prior to that date has been adjusted to reflect this charge. |
Data presented reflect past performance. Past performance is no guarantee of future results. Current performance may be higher or lower than the performance shown. Investment return and principal value will fluctuate, and redemption value may be more or less than original cost. To obtain performance data current to the most recent month end, please call 1-800-345-2021 or visit americancentury.com.
Unless otherwise indicated, performance reflects Investor Class shares; performance for other share classes will vary due to differences in fee structure. For information about other share classes available, please consult the prospectus. Data assumes reinvestment of dividends and capital gains, and none of the charts reflect the deduction of taxes that a shareholder would pay on fund distributions or the redemption of fund shares. Returns for the index are provided for comparison. The fund’s total returns include operating expenses (such as transaction costs and management fees) that reduce returns, while the total returns of the index do not.
| Growth of $10,000 Over 10 Years |
| $10,000 investment made June 30, 2001 |
| Total Annual Fund Operating Expenses |
| Investor Class | Institutional Class | A Class | B Class | C Class | R Class |
| 0.70% | 0.50% | 0.95% | 1.70% | 1.70% | 1.20% |
The total annual fund operating expenses shown is as stated in the fund’s prospectus current as of the date of this report. The prospectus may vary from the expense ratio shown elsewhere in this report because it is based on a different time period, includes acquired fund fees and expenses, and, if applicable, does not include fee waivers or expense reimbursements.
Data presented reflect past performance. Past performance is no guarantee of future results. Current performance may be higher or lower than the performance shown. Investment return and principal value will fluctuate, and redemption value may be more or less than original cost. To obtain performance data current to the most recent month end, please call 1-800-345-2021 or visit americancentury.com.
Unless otherwise indicated, performance reflects Investor Class shares; performance for other share classes will vary due to differences in fee structure. For information about other share classes available, please consult the prospectus. Data assumes reinvestment of dividends and capital gains, and none of the charts reflect the deduction of taxes that a shareholder would pay on fund distributions or the redemption of fund shares. Returns for the index are provided for comparison. The fund’s total returns include operating expenses (such as transaction costs and management fees) that reduce returns, while the total returns of the index do not.
Portfolio Managers: Bill Martin and Claudia Musat
Performance Summary
Equity Growth returned 31.66%* for the fiscal year ended June 30, 2011, compared with the 30.69% return of its benchmark, the S&P 500 Index.
Equity Growth posted a strong absolute return for the 12 months, reflecting a robust stock market rally during the period (see page 3 for details). The fund also outperformed the S&P 500 as individual stock selection (a critical component of our investment process) added value in six of ten market sectors.
Energy and Consumer Discretionary Boosted Absolute Results
On an absolute basis, Equity Growth’s holdings in the energy and consumer discretionary sectors were the best performers. The fund’s energy stocks returned more than 50% as a group for the 12-month period, and three of the top six performance contributors came from this sector—oil and gas producers Exxon Mobil, Chevron, and ConocoPhillips. In the consumer discretionary sector, the leading performers included auto parts maker TRW Automotive and off-road vehicle manufacturer Polaris Industries, each of which gained more than 100% for the 12 months.
The fund’s health care holdings also performed well during the reporting period. The best contributors in this sector included biotechnology firm Biogen Idec and health care provider UnitedHealth Group.
The only sector within the portfolio to post a single-digit gain for the 12-month period was utilities. The most significant detractors included independent power producer Constellation Energy and electric utility Entergy. The fund’s holdings in the financials sector also lagged, producing the three biggest negative contributors to absolute performance—financial services providers Bank of America and Citigroup, and capital markets firm Morgan Stanley.
Health Care Outperformed
Looking at relative performance, Equity Growth’s holdings in the health care sector contributed the most to the fund’s outperformance of the S&P 500 for the fiscal year. The fund’s health care holdings returned more than 40% as a group, while their counterparts in the index returned just over 28%.
The bulk of the outperformance resulted from stock selection among biotechnology firms and health care providers. Leading contributors included biotech company Biogen Idec, which saw earnings expectations rise thanks to robust sales of its multiple sclerosis medications, and drug maker Endo Pharmaceuticals, which benefited from favorable acquisitions. Health care providers Humana and UnitedHealth Group rallied as subscriber growth increased and costs declined.
Financials and Consumer Discretionary Also Added Value
Stock selection in the financials and consumer discretionary sectors also contributed favorably to relative results. When it comes to stock selection, underweighting stocks that don’t perform well is just as important as overweighting
*All fund returns referenced in this commentary are for Investor Class shares.
stocks that do perform well, and this was a key factor in the outperformance of the fund’s financials holdings. Compared with the index, the fund held an underweight position in insurance giant Berkshire Hathaway, which fell modestly during the 12 months as the company’s chief investment officer resigned abruptly.
In the consumer discretionary sector, the top absolute performance contributors were also the top relative contributors—TRW Automotive and Polaris Industries. TRW continued to benefit from a recovery in the auto industry, while Polaris enjoyed rising demand for its off-road vehicles and motorcycles.
The most important individual investment decision versus the index for the reporting period was an underweight position in network products maker Cisco Systems, which tumbled by more than 25% as the company lowered its growth projections for the coming year amid growing competition in its core markets.
Utilities and Technology Detracted
Equity Growth’s holdings in the utilities and information technology sectors underperformed their counterparts in the S&P 500 for the 12-month period. An overweight position in independent power producers contributed the bulk of the underperformance in the utilities sector. The most notable detractors included energy producers Constellation Energy and NRG Energy, both of which repeatedly failed to meet earnings expectations, leading us to exit the stocks.
Stock choices among computer hardware makers and semiconductor manufacturers were responsible for virtually all of the underperformance in the information technology sector. Printer maker Lexmark International was the fund’s most significant individual detractor; the company reported lower-than-expected earnings as increased competition led to weaker sales and declining prices. Another poor performer was IT services provider Computer Sciences, which tumbled late in the period as a decline in government spending led to an earnings disappointment.
A Look Ahead
The eye-catching turmoil in the headlines over the last six months—democratic change sweeping through the Middle East, a devastating natural disaster in Japan, the possibility of a sovereign debt default in Europe—has led to heightened uncertainty and growing volatility in the equity market. But when you look at the past decade, there have been many other dramatic events that have had a similar impact on the market. When viewed through this lens, change and volatility have become more the rule than the exception.
It is this change dynamic that our investment process seeks to exploit and capitalize upon. Change and volatility leads to market inefficiencies, and within these inefficiencies lie investment opportunities. Rather than base investment decisions on vague financial headlines, we use our disciplined, data-driven, multi-factor investment process to take advantage of inefficiencies at the individual company level. We believe this approach will produce favorable returns over the long term.
| JUNE 30, 2011 |
| Top Ten Holdings | % of net assets |
| Exxon Mobil Corp. | 3.7% |
| Chevron Corp. | 2.4% |
| International Business Machines Corp. | 2.4% |
| Johnson & Johnson | 2.3% |
| Microsoft Corp. | 2.3% |
| General Electric Co. | 2.0% |
| AT&T, Inc. | 1.9% |
| Apple, Inc. | 1.9% |
| Philip Morris International, Inc. | 1.8% |
| Wells Fargo & Co. | 1.8% |
| | |
| Top Five Industries | % of net assets |
| Oil, Gas & Consumable Fuels | 11.4% |
| Pharmaceuticals | 6.0% |
| Insurance | 4.7% |
| IT Services | 4.7% |
| Software | 4.3% |
| | |
| Types of Investments in Portfolio | % of net assets |
| Common Stocks | 98.8% |
| Temporary Cash Investments | 1.0% |
| Other Assets and Liabilities | 0.2% |
Fund shareholders may incur two types of costs: (1) transaction costs, including sales charges (loads) on purchase payments and redemption/exchange fees; and (2) ongoing costs, including management fees; distribution and service (12b-1) fees; and other fund expenses. This example is intended to help you understand your ongoing costs (in dollars) of investing in your fund and to compare these costs with the ongoing cost of investing in other mutual funds.
The example is based on an investment of $1,000 made at the beginning of the period and held for the entire period from January 1, 2011 to June 30, 2011.
Actual Expenses
The table provides information about actual account values and actual expenses for each class. You may use the information, together with the amount you invested, to estimate the expenses that you paid over the period. First, identify the share class you own. Then simply divide your account value by $1,000 (for example, an $8,600 account value divided by $1,000 = 8.6), then multiply the result by the number under the heading “Expenses Paid During Period” to estimate the expenses you paid on your account during this period.
If you hold Investor Class shares of any American Century Investments fund, or Institutional Class shares of the American Century Diversified Bond Fund, in an American Century Investments account (i.e., not a financial intermediary or retirement plan account), American Century Investments may charge you a $12.50 semiannual account maintenance fee if the value of those shares is less than $10,000. We will redeem shares automatically in one of your accounts to pay the $12.50 fee. In determining your total eligible investment amount, we will include your investments in all personal accounts (including American Century Investments Brokerage accounts) registered under your Social Security number. Personal accounts include individual accounts, joint accounts, UGMA/UTMA accounts, personal trusts, Coverdell Education Savings Accounts and IRAs (including traditional, Roth, Rollover, SEP-, SARSEP- and SIMPLE-IRAs), and certain other retirement accounts. If you have only business, business retirement, employer-sponsored or American Century Investments Brokerage accounts, you are currently not subject to this fee. We will not charge the fee as long as you choose to manage your accounts exclusively online. If you are subject to the Account Maintenance Fee, your account value could be reduced by the fee amount.
Hypothetical Example for Comparison Purposes
The table also provides information about hypothetical account values and hypothetical expenses based on the actual expense ratio of each class of your fund and an assumed rate of return of 5% per year before expenses, which is not the actual return of a fund’s share class. The hypothetical account values and expenses may not be used to estimate the actual ending account balance or expenses you paid for the period. You may use this information to compare the ongoing costs of investing in your fund and other funds. To do so, compare this 5% hypothetical example with the 5% hypothetical examples that appear in the shareholder reports of the other funds.
Please note that the expenses shown in the table are meant to highlight your ongoing costs only and do not reflect any transactional costs, such as sales charges (loads) or redemption/exchange fees. Therefore, the table is useful in comparing ongoing costs only, and will not help you determine the relative total costs of owning different funds. In addition, if these transactional costs were included, your costs would have been higher.
| | Beginning Account Value 1/1/11 | Ending Account Value 6/30/11 | Expenses Paid During Period* 1/1/11 – 6/30/11 | Annualized Expense Ratio* |
| Actual |
| Investor Class | $1,000 | $1,076.30 | $3.50 | 0.68% |
| Institutional Class | $1,000 | $1,077.20 | $2.47 | 0.48% |
| A Class | $1,000 | $1,075.10 | $4.78 | 0.93% |
| B Class | $1,000 | $1,070.90 | $8.63 | 1.68% |
| C Class | $1,000 | $1,070.90 | $8.63 | 1.68% |
| R Class | $1,000 | $1,073.40 | $6.07 | 1.18% |
| Hypothetical | | | | |
| Investor Class | $1,000 | $1,021.42 | $3.41 | 0.68% |
| Institutional Class | $1,000 | $1,022.41 | $2.41 | 0.48% |
| A Class | $1,000 | $1,020.18 | $4.66 | 0.93% |
| B Class | $1,000 | $1,016.46 | $8.40 | 1.68% |
| C Class | $1,000 | $1,016.46 | $8.40 | 1.68% |
| R Class | $1,000 | $1,018.94 | $5.91 | 1.18% |
*Expenses are equal to the class’s annualized expense ratio listed in the table above, multiplied by the average account value over the period, multiplied by 181, the number of days in the most recent fiscal half-year, divided by 365, to reflect the one-half year period.
| | | Shares | | | Value | |
| Common Stocks — 98.8% | |
| AEROSPACE & DEFENSE — 3.1% | |
| General Dynamics Corp. | | | 256,409 | | | | $19,107,599 | |
| Northrop Grumman Corp. | | | 247,790 | | | | 17,184,236 | |
| United Technologies Corp. | | | 300,510 | | | | 26,598,140 | |
| | | | | | | | 62,889,975 | |
| AIR FREIGHT & LOGISTICS — 1.4% | |
| United Parcel Service, Inc., Class B | | | 398,817 | | | | 29,085,724 | |
| AUTO COMPONENTS — 1.2% | |
| Magna International, Inc. | | | 167,389 | | | | 9,045,702 | |
TRW Automotive Holdings Corp.(1) | | | 251,410 | | | | 14,840,732 | |
| | | | | | | | 23,886,434 | |
| AUTOMOBILES — 0.3% | |
Ford Motor Co.(1) | | | 472,269 | | | | 6,512,590 | |
| BEVERAGES — 2.6% | |
| Coca-Cola Co. (The) | | | 179,970 | | | | 12,110,181 | |
| Coca-Cola Enterprises, Inc. | | | 325,682 | | | | 9,503,401 | |
Constellation Brands, Inc., Class A(1) | | | 442,806 | | | | 9,219,221 | |
| Dr Pepper Snapple Group, Inc. | | | 390,301 | | | | 16,365,321 | |
| PepsiCo, Inc. | | | 58,041 | | | | 4,087,828 | |
| | | | | | | | 51,285,952 | |
| BIOTECHNOLOGY — 2.2% | |
Amgen, Inc.(1) | | | 217,055 | | | | 12,665,159 | |
Biogen Idec, Inc.(1) | | | 197,749 | | | | 21,143,323 | |
Cephalon, Inc.(1) | | | 119,044 | | | | 9,511,616 | |
Cubist Pharmaceuticals, Inc.(1) | | | 41,295 | | | | 1,486,207 | |
| | | | | | | | 44,806,305 | |
| CAPITAL MARKETS — 1.6% | |
| Ameriprise Financial, Inc. | | | 163,602 | | | | 9,436,563 | |
| Bank of New York Mellon Corp. (The) | | | 273,456 | | | | 7,005,943 | |
| Legg Mason, Inc. | | | 489,215 | | | | 16,026,683 | |
| | | | | | | | 32,469,189 | |
| CHEMICALS — 1.4% | |
| Eastman Chemical Co. | | | 88,618 | | | | 9,045,239 | |
| PPG Industries, Inc. | | | 175,187 | | | | 15,905,228 | |
W.R. Grace & Co.(1) | | | 88,250 | | | | 4,026,847 | |
| | | | | | | | 28,977,314 | |
| COMMERCIAL BANKS — 2.7% | |
| Commerce Bancshares, Inc. | | | 66,028 | | | | 2,839,204 | |
| M&T Bank Corp. | | | 14,136 | | | | 1,243,261 | |
| PNC Financial Services Group, Inc. | | | 133,602 | | | | 7,964,015 | |
| U.S. Bancorp. | | | 259,684 | | | | 6,624,539 | |
| Wells Fargo & Co. | | | 1,288,335 | | | | 36,150,680 | |
| | | | | | | | 54,821,699 | |
| COMMUNICATIONS EQUIPMENT — 0.6% | |
Brocade Communications Systems, Inc.(1) | | | 175,852 | | | | 1,136,004 | |
| Cisco Systems, Inc. | | | 188,218 | | | | 2,938,083 | |
Motorola Solutions, Inc.(1) | | | 160,169 | | | | 7,374,181 | |
Research In Motion Ltd.(1) | | | 48,862 | | | | 1,409,668 | |
| | | | | | | | 12,857,936 | |
| COMPUTERS & PERIPHERALS — 3.4% | |
Apple, Inc.(1) | | | 113,426 | | | | 38,073,705 | |
Dell, Inc.(1) | | | 1,265,004 | | | | 21,087,617 | |
NetApp, Inc.(1) | | | 118,405 | | | | 6,249,416 | |
SanDisk Corp.(1) | | | 61,693 | | | | 2,560,259 | |
| | | | | | | | 67,970,997 | |
| CONSTRUCTION & ENGINEERING — 1.4% | |
| Fluor Corp. | | | 230,120 | | | | 14,879,559 | |
| KBR, Inc. | | | 318,041 | | | | 11,986,966 | |
URS Corp.(1) | | | 38,380 | | | | 1,717,121 | |
| | | | | | | | 28,583,646 | |
| CONSUMER FINANCE — 1.6% | |
| American Express Co. | | | 298,468 | | | | 15,430,796 | |
| Capital One Financial Corp. | | | 148,747 | | | | 7,685,757 | |
| Cash America International, Inc. | | | 159,582 | | | | 9,235,010 | |
| | | | | | | | 32,351,563 | |
| DIVERSIFIED CONSUMER SERVICES — 1.2% | |
Career Education Corp.(1) | | | 17,387 | | | | 367,735 | |
| H&R Block, Inc. | | | 258,268 | | | | 4,142,619 | |
ITT Educational Services, Inc.(1) | | | 185,607 | | | | 14,521,891 | |
| Weight Watchers International, Inc. | | | 74,042 | | | | 5,587,950 | |
| | | | | | | | 24,620,195 | |
| DIVERSIFIED FINANCIAL SERVICES — 2.4% | |
| Bank of America Corp. | | | 503,144 | | | | 5,514,458 | |
| Citigroup, Inc. | | | 277,082 | | | | 11,537,694 | |
| JPMorgan Chase & Co. | | | 345,789 | | | | 14,156,602 | |
| McGraw-Hill Cos., Inc. (The) | | | 414,234 | | | | 17,360,547 | |
| | | | | | | | 48,569,301 | |
| | |
| | | | Shares | | | | Value | |
| DIVERSIFIED TELECOMMUNICATION SERVICES — 3.6% | | | | | | | | |
| AT&T, Inc. | | | 1,241,370 | | | | $38,991,432 | |
| Verizon Communications, Inc. | | | 885,929 | | | | 32,983,136 | |
| | | | | | | | 71,974,568 | |
| ELECTRIC UTILITIES — 0.8% | |
| Entergy Corp. | | | 224,807 | | | | 15,349,822 | |
| FirstEnergy Corp. | | | 27,497 | | | | 1,213,993 | |
| | | | | | | | 16,563,815 | |
| ELECTRICAL EQUIPMENT — 0.3% | |
| Emerson Electric Co. | | | 96,736 | | | | 5,441,400 | |
| ELECTRONIC EQUIPMENT, INSTRUMENTS & COMPONENTS — 0.7% | |
| Anixter International, Inc. | | | 814 | | | | 53,187 | |
| Corning, Inc. | | | 17,544 | | | | 318,423 | |
Vishay Intertechnology, Inc.(1) | | | 849,068 | | | | 12,769,983 | |
| | | | | | | | 13,141,593 | |
| ENERGY EQUIPMENT & SERVICES — 1.7% | |
| Core Laboratories NV | | | 80,631 | | | | 8,993,582 | |
| Diamond Offshore Drilling, Inc. | | | 62,186 | | | | 4,378,516 | |
| Halliburton Co. | | | 8,653 | | | | 441,303 | |
| Schlumberger Ltd. | | | 65,928 | | | | 5,696,179 | |
| SEACOR Holdings, Inc. | | | 133,122 | | | | 13,306,875 | |
| Transocean Ltd. | | | 4,667 | | | | 301,302 | |
| | | | | | | | 33,117,757 | |
| FOOD & STAPLES RETAILING — 1.2% | |
| Walgreen Co. | | | 471,644 | | | | 20,026,004 | |
| Wal-Mart Stores, Inc. | | | 77,075 | | | | 4,095,766 | |
| | | | | | | | 24,121,770 | |
| FOOD PRODUCTS — 2.1% | |
| H.J. Heinz Co. | | | 202,226 | | | | 10,774,601 | |
| Hershey Co. (The) | | | 251,925 | | | | 14,321,936 | |
Smithfield Foods, Inc.(1) | | | 195,654 | | | | 4,278,953 | |
| Tyson Foods, Inc., Class A | | | 670,899 | | | | 13,028,859 | |
| | | | | | | | 42,404,349 | |
| GAS UTILITIES — 0.1% | |
| WGL Holdings, Inc. | | | 36,351 | | | | 1,399,150 | |
| HEALTH CARE EQUIPMENT & SUPPLIES — 1.0% | |
| Baxter International, Inc. | | | 16,766 | | | | 1,000,762 | |
| Hill-Rom Holdings, Inc. | | | 2,964 | | | | 136,462 | |
Kinetic Concepts, Inc.(1) | | | 56,536 | | | | 3,258,170 | |
Zimmer Holdings, Inc.(1) | | | 245,428 | | | | 15,511,050 | |
| | | | | | | | 19,906,444 | |
| HEALTH CARE PROVIDERS & SERVICES — 2.9% | |
AMERIGROUP Corp.(1) | | | 30,815 | | | | 2,171,533 | |
| Humana, Inc. | | | 189,984 | | | | 15,301,312 | |
Magellan Health Services, Inc.(1) | | | 71,768 | | | | 3,928,580 | |
| UnitedHealth Group, Inc. | | | 481,852 | | | | 24,853,926 | |
WellCare Health Plans, Inc.(1) | | | 214,722 | | | | 11,038,858 | |
| | | | | | | | 57,294,209 | |
| HOTELS, RESTAURANTS & LEISURE — 0.3% | |
| Brinker International, Inc. | | | 84,115 | | | | 2,057,453 | |
| McDonald’s Corp. | | | 45,295 | | | | 3,819,274 | |
| Starbucks Corp. | | | 1,220 | | | | 48,178 | |
| | | | | | | | 5,924,905 | |
| HOUSEHOLD PRODUCTS — 0.9% | |
| Colgate-Palmolive Co. | | | 18,584 | | | | 1,624,427 | |
| Procter & Gamble Co. (The) | | | 263,635 | | | | 16,759,277 | |
| | | | | | | | 18,383,704 | |
| INDEPENDENT POWER PRODUCERS & ENERGY TRADERS — 0.4% | |
AES Corp. (The)(1) | | | 547,744 | | | | 6,978,259 | |
| INDUSTRIAL CONGLOMERATES — 2.7% | |
| 3M Co. | | | 157,703 | | | | 14,958,130 | |
| General Electric Co. | | | 2,128,732 | | | | 40,147,885 | |
| | | | | | | | 55,106,015 | |
| INSURANCE — 4.7% | |
| ACE Ltd. | | | 165,224 | | | | 10,875,044 | |
| Allied World Assurance Co. Holdings Ltd. | | | 147,382 | | | | 8,486,256 | |
| American Financial Group, Inc. | | | 304,561 | | | | 10,869,782 | |
Berkshire Hathaway, Inc., Class B(1) | | | 126,157 | | | | 9,763,290 | |
| Chubb Corp. (The) | | | 50,335 | | | | 3,151,474 | |
| Horace Mann Educators Corp. | | | 675 | | | | 10,537 | |
| Principal Financial Group, Inc. | | | 480,441 | | | | 14,615,015 | |
| Prudential Financial, Inc. | | | 362,688 | | | | 23,063,330 | |
| Travelers Cos., Inc. (The) | | | 248,646 | | | | 14,515,953 | |
| | | | | | | | 95,350,681 | |
| INTERNET & CATALOG RETAIL — 0.2% | |
| Expedia, Inc. | | | 58,954 | | | | 1,709,076 | |
priceline.com, Inc.(1) | | | 5,989 | | | | 3,065,949 | |
| | | | | | | | 4,775,025 | |
| INTERNET SOFTWARE & SERVICES — 1.1% | |
AOL, Inc.(1) | | | 124,563 | | | | 2,473,821 | |
eBay, Inc.(1) | | | 3,968 | | | | 128,048 | |
Google, Inc., Class A(1) | | | 37,016 | | | | 18,744,162 | |
| | | | | | | | 21,346,031 | |
| IT SERVICES — 4.7% | |
| Accenture plc, Class A | | | 236,719 | | | | $14,302,562 | |
Alliance Data Systems Corp.(1) | | | 93,964 | | | | 8,839,194 | |
| Global Payments, Inc. | | | 96,004 | | | | 4,896,204 | |
| International Business Machines Corp. | | | 280,813 | | | | 48,173,470 | |
| Visa, Inc., Class A | | | 217,005 | | | | 18,284,841 | |
| | | | | | | | 94,496,271 | |
| LEISURE EQUIPMENT & PRODUCTS — 0.7% | |
| Polaris Industries, Inc. | | | 121,210 | | | | 13,474,916 | |
| LIFE SCIENCES TOOLS & SERVICES — 0.1% | |
Agilent Technologies, Inc.(1) | | | 27,182 | | | | 1,389,272 | |
| MACHINERY — 2.2% | |
| Caterpillar, Inc. | | | 146,874 | | | | 15,636,206 | |
| Dover Corp. | | | 190,811 | | | | 12,936,986 | |
| Eaton Corp. | | | 69,930 | | | | 3,597,898 | |
| Parker-Hannifin Corp. | | | 79,370 | | | | 7,122,664 | |
Sauer-Danfoss, Inc.(1) | | | 94,084 | | | | 4,740,893 | |
| | | | | | | | 44,034,647 | |
| MEDIA — 3.9% | |
| Comcast Corp., Class A | | | 1,017,031 | | | | 25,771,565 | |
DirecTV, Class A(1) | | | 251,974 | | | | 12,805,319 | |
DISH Network Corp., Class A(1) | | | 357,140 | | | | 10,953,484 | |
| Gannett Co., Inc. | | | 277 | | | | 3,967 | |
| Interpublic Group of Cos., Inc. (The) | | | 666,610 | | | | 8,332,625 | |
| Time Warner, Inc. | | | 553,469 | | | | 20,129,667 | |
| | | | | | | | 77,996,627 | |
| METALS & MINING — 2.2% | |
| Freeport-McMoRan Copper & Gold, Inc. | | | 423,835 | | | | 22,420,872 | |
| Newmont Mining Corp. | | | 306,533 | | | | 16,543,586 | |
| Walter Energy, Inc. | | | 43,893 | | | | 5,082,809 | |
| | | | | | | | 44,047,267 | |
| MULTILINE RETAIL — 0.5% | |
| Dillard’s, Inc., Class A | | | 135,196 | | | | 7,049,119 | |
| Kohl’s Corp. | | | 73,158 | | | | 3,658,632 | |
| | | | | | | | 10,707,751 | |
| MULTI-UTILITIES — 1.1% | |
| Ameren Corp. | | | 272,974 | | | | 7,872,570 | |
| Consolidated Edison, Inc. | | | 3,529 | | | | 187,884 | |
| DTE Energy Co. | | | 15,035 | | | | 752,051 | |
| Integrys Energy Group, Inc. | | | 253,597 | | | | 13,146,468 | |
| | | | | | | | 21,958,973 | |
| OIL, GAS & CONSUMABLE FUELS — 11.4% | |
| Chevron Corp. | | | 477,293 | | | | 49,084,812 | |
| ConocoPhillips | | | 429,757 | | | | 32,313,429 | |
| Exxon Mobil Corp. | | | 906,628 | | | | 73,781,387 | |
| Marathon Oil Corp. | | | 363,939 | | | | 19,172,306 | |
| Murphy Oil Corp. | | | 111,383 | | | | 7,313,408 | |
| Occidental Petroleum Corp. | | | 271,271 | | | | 28,223,035 | |
| Valero Energy Corp. | | | 579,139 | | | | 14,808,584 | |
| W&T Offshore, Inc. | | | 183,647 | | | | 4,796,860 | |
| | | | | | | | 229,493,821 | |
| PAPER & FOREST PRODUCTS — 0.7% | |
| Domtar Corp. | | | 155,308 | | | | 14,710,774 | |
| PERSONAL PRODUCTS — 1.0% | |
| Estee Lauder Cos., Inc. (The), Class A | | | 37,360 | | | | 3,929,898 | |
| Herbalife Ltd. | | | 270,854 | | | | 15,612,025 | |
| Nu Skin Enterprises, Inc., Class A | | | 15,120 | | | | 567,756 | |
| | | | | | | | 20,109,679 | |
| PHARMACEUTICALS — 6.0% | |
| Abbott Laboratories | | | 364,099 | | | | 19,158,890 | |
| Bristol-Myers Squibb Co. | | | 225,216 | | | | 6,522,255 | |
| Eli Lilly & Co. | | | 619,916 | | | | 23,265,448 | |
| Johnson & Johnson | | | 707,062 | | | | 47,033,764 | |
| Merck & Co., Inc. | | | 134,870 | | | | 4,759,562 | |
| Pfizer, Inc. | | | 978,493 | | | | 20,156,956 | |
| | | | | | | | 120,896,875 | |
| REAL ESTATE INVESTMENT TRUSTS (REITs) — 0.8% | |
| Rayonier, Inc. | | | 200,626 | | | | 13,110,909 | |
| Simon Property Group, Inc. | | | 19,682 | | | | 2,287,639 | |
| | | | | | | | 15,398,548 | |
| ROAD & RAIL — 0.4% | |
| CSX Corp. | | | 267,845 | | | | 7,022,896 | |
| SEMICONDUCTORS & SEMICONDUCTOR EQUIPMENT — 3.0% | |
| Altera Corp. | | | 52,485 | | | | 2,432,680 | |
| Applied Materials, Inc. | | | 236,417 | | | | 3,075,785 | |
| Intel Corp. | | | 1,576,629 | | | | 34,938,099 | |
LSI Corp.(1) | | | 288,084 | | | | 2,051,158 | |
Micron Technology, Inc.(1) | | | 589,846 | | | | 4,412,048 | |
Teradyne, Inc.(1) | | | 922,356 | | | | 13,650,869 | |
| | | | | | | | 60,560,639 | |
| SOFTWARE — 4.3% | |
Cadence Design Systems, Inc.(1) | | | 665,891 | | | | 7,031,809 | |
Electronic Arts, Inc.(1) | | | 86,712 | | | | 2,046,403 | |
Intuit, Inc.(1) | | | 121,841 | | | | 6,318,674 | |
| Microsoft Corp. | | | 1,766,158 | | | | 45,920,108 | |
| Oracle Corp. | | | 408,201 | | | | 13,433,895 | |
Symantec Corp.(1) | | | 561,263 | | | | 11,068,107 | |
| | | | | | | | 85,818,996 | |
| SPECIALTY RETAIL — 1.4% | |
AutoZone, Inc.(1) | | | 49,601 | | | | $14,624,855 | |
Bed Bath & Beyond, Inc.(1) | | | 187,242 | | | | 10,929,315 | |
| Williams-Sonoma, Inc. | | | 70,436 | | | | 2,570,210 | |
| | | | | | | | 28,124,380 | |
| TEXTILES, APPAREL & LUXURY GOODS — 0.8% | |
| VF Corp. | | | 148,013 | | | | 16,068,291 | |
| TOBACCO — 1.8% | | | | | | | | |
| Philip Morris International, Inc. | | | 543,038 | | | | 36,258,647 | |
TOTAL COMMON STOCKS (Cost $1,641,735,713) | | | | 1,985,487,765 | |
| Temporary Cash Investments — 1.0% | |
| JPMorgan U.S. Treasury Plus Money Market Fund Agency Shares | | | 4,682,455 | | | | 4,682,455 | |
Repurchase Agreement, Bank of America N.A., (collateralized by various U.S. Treasury obligations, 4.375%, 11/15/39, valued at $5,593,293), in a joint trading account at 0.00%, dated 6/30/11, due 7/1/11 (Delivery value $5,466,656) | | | | 5,466,656 | |
| Repurchase Agreement, Credit Suisse First Boston, Inc., (collateralized by various U.S. Treasury obligations, 3.50%, 5/15/20, valued at $4,648,057), in a joint trading account at 0.00%, dated 6/30/11, due 7/1/11 (Delivery value $4,555,547) | | | | 4,555,547 | |
| Repurchase Agreement, Goldman Sachs Group, Inc., (collateralized by various U.S. Treasury obligations, 1.375%, 9/15/12, valued at $5,576,583), in a joint trading account at 0.00%, dated 6/30/11, due 7/1/11 (Delivery value $5,466,657) | | | | 5,466,657 | |
TOTAL TEMPORARY CASH INVESTMENTS (Cost $20,171,315) | | | | 20,171,315 | |
TOTAL INVESTMENT SECURITIES — 99.8% (Cost $1,661,907,028) | | | | 2,005,659,080 | |
| OTHER ASSETS AND LIABILITIES — 0.2% | | | | 4,435,915 | |
| TOTAL NET ASSETS — 100.0% | | | | $2,010,094,995 | |
Notes to Schedule of Investments
See Notes to Financial Statements.
Statement of Assets and Liabilities |
| JUNE 30, 2011 | |
| Assets | |
| Investment securities, at value (cost of $1,661,907,028) | | | $2,005,659,080 | |
| Receivable for capital shares sold | | | 6,472,088 | |
| Dividends and interest receivable | | | 1,801,601 | |
| | | | 2,013,932,769 | |
| | | | | |
| Liabilities | | | | |
| Payable for capital shares redeemed | | | 2,742,778 | |
| Accrued management fees | | | 1,051,260 | |
| Distribution and service fees payable | | | 43,736 | |
| | | | 3,837,774 | |
| | | | | |
| Net Assets | | | $2,010,094,995 | |
| | | | | |
| Net Assets Consist of: | | | | |
| Capital (par value and paid-in surplus) | | | $2,023,065,086 | |
| Undistributed net investment income | | | 1,339,385 | |
| Accumulated net realized loss | | | (358,061,528 | ) |
| Net unrealized appreciation | | | 343,752,052 | |
| | | | $2,010,094,995 | |
| | Net assets | Shares outstanding | Net asset value per share |
| Investor Class, $0.01 Par Value | $1,615,829,161 | 72,243,045 | $22.37 |
| Institutional Class, $0.01 Par Value | $200,190,879 | 8,945,581 | $22.38 |
| A Class, $0.01 Par Value | $182,194,721 | 8,151,746 | $22.35* |
| B Class, $0.01 Par Value | $80,531 | 3,601 | $22.36 |
| C Class, $0.01 Par Value | $6,610,644 | 297,599 | $22.21 |
| R Class, $0.01 Par Value | $5,189,059 | 232,027 | $22.36 |
*Maximum offering price $23.71 (net asset value divided by 0.9425)
See Notes to Financial Statements.
| YEAR ENDED JUNE 30, 2011 | |
| Investment Income (Loss) | |
| Income: | | | |
| Dividends (net of foreign taxes withheld of $44,578) | | | $39,377,216 | |
| Interest | | | 12,181 | |
| | | | 39,389,397 | |
| Expenses: | | | | |
| Management fees | | | 13,183,843 | |
| Distribution and service fees: | | | | |
| A Class | | | 575,765 | |
| B Class | | | 853 | |
| C Class | | | 62,518 | |
| R Class | | | 22,592 | |
| Directors’ fees and expenses | | | 81,821 | |
| Other expenses | | | 36,513 | |
| | | | 13,963,905 | |
| | | | | |
| Net investment income (loss) | | | 25,425,492 | |
| | | | | |
| Realized and Unrealized Gain (Loss) | | | | |
| Net realized gain (loss) on: | | | | |
| Investment transactions | | | 175,701,269 | |
| Futures contract transactions | | | 2,005,995 | |
| | | | 177,707,264 | |
| | | | | |
| Change in net unrealized appreciation (depreciation) on investments | | | 343,999,660 | |
| | | | | |
| Net realized and unrealized gain (loss) | | | 521,706,924 | |
| | | | | |
| Net Increase (Decrease) in Net Assets Resulting from Operations | | | $547,132,416 | |
See Notes to Financial Statements.
Statement of Changes in Net Assets |
| YEARS ENDED JUNE 30, 2011 AND JUNE 30, 2010 | |
| Increase (Decrease) in Net Assets | | 2011 | | | 2010 | |
| Operations | |
| Net investment income (loss) | | | $25,425,492 | | | | $22,239,817 | |
| Net realized gain (loss) | | | 177,707,264 | | | | 170,469,923 | |
| Change in net unrealized appreciation (depreciation) | | | 343,999,660 | | | | 52,924,221 | |
| Net increase (decrease) in net assets resulting from operations | | | 547,132,416 | | | | 245,633,961 | |
| | | | | | | | | |
| Distributions to Shareholders | | | | | | | | |
| From net investment income: | | | | | | | | |
| Investor Class | | | (19,018,126 | ) | | | (16,332,181 | ) |
| Institutional Class | | | (3,152,156 | ) | | | (2,596,043 | ) |
| A Class | | | (2,209,907 | ) | | | (2,255,148 | ) |
| B Class | | | (199 | ) | | | (80 | ) |
| C Class | | | (14,581 | ) | | | (6,146 | ) |
| R Class | | | (33,422 | ) | | | (19,178 | ) |
| Decrease in net assets from distributions | | | (24,428,391 | ) | | | (21,208,776 | ) |
| | | | | | | | | |
| Capital Share Transactions | | | | | | | | |
| Net increase (decrease) in net assets from capital share transactions | | | (334,916,277 | ) | | | (143,558,603 | ) |
| | | | | | | | | |
| Net increase (decrease) in net assets | | | 187,787,748 | | | | 80,866,582 | |
| | | | | | | | | |
| Net Assets | | | | | | | | |
| Beginning of period | | | 1,822,307,247 | | | | 1,741,440,665 | |
| End of period | | | $2,010,094,995 | | | | $1,822,307,247 | |
| | | | | | | | | |
| Undistributed net investment income | | | $1,339,385 | | | | $689,598 | |
See Notes to Financial Statements.
Notes to Financial Statements |
JUNE 30, 2011
1. Organization
American Century Quantitative Equity Funds, Inc. (the corporation) is registered under the Investment Company Act of 1940, as amended (the 1940 Act), as an open-end management investment company and is organized as a Maryland corporation. Equity Growth Fund (the fund) is one fund in a series issued by the corporation. The fund is diversified as defined under the 1940 Act. The fund’s investment objective is to seek long-term capital growth by investing in common stocks.
The fund is authorized to issue the Investor Class, the Institutional Class, the A Class, the B Class, the C Class and the R Class. The A Class may incur an initial sales charge. The A Class, B Class and C Class may be subject to a contingent deferred sales charge. The share classes differ principally in their respective sales charges and distribution and shareholder servicing expenses and arrangements. The Institutional Class is made available to institutional shareholders or through financial intermediaries whose clients do not require the same level of shareholder and administrative services as shareholders of other classes. As a result, the Institutional Class is charged a lower unified management fee.
2. Significant Accounting Policies
The following is a summary of significant accounting policies consistently followed by the fund in preparation of its financial statements. The financial statements are prepared in conformity with accounting principles generally accepted in the United States of America, which may require management to make certain estimates and assumptions at the date of the financial statements. Actual results could differ from these estimates.
Investment Valuations — The fund determines the fair value of its investments and computes its net asset value per share as of the close of regular trading (usually 4 p.m. Eastern time) on the New York Stock Exchange (NYSE) on each day the NYSE is open.
Equity securities that are listed or traded on a domestic securities exchange are valued at the last reported sales price or at the official closing price as provided by the exchange. Equity securities traded on foreign securities exchanges are typically valued at the closing price on the exchange where primarily traded or as of the close of the NYSE, if that is earlier. If no last sales price is reported, or if local convention or regulation so provides, the mean of the latest bid and asked prices is used. Depending on local convention or regulation, securities traded over-the-counter are valued at the mean of the latest bid and asked prices, the last sales price, or the official closing price. In its determination of fair value, the fund may review several factors including: market information specific to a security; news developments in U.S. and foreign markets; the performance of particular U.S. and foreign securities, indices, comparable securities, American Depositary Receipts, Exchange-Traded Funds, and other relevant market indicators.
Debt securities maturing within 60 days at the time of purchase may be valued at cost, plus or minus any amortized discount or premium or at the evaluated mean as provided by an independent pricing service. Evaluated mean prices are commonly derived through utilization of market models, which may consider, among other factors, trade data, quotations from dealers and active market makers, relevant yield curve and spread data, related sector levels, creditworthiness, and other relevant market information on the same or comparable securities.
Investments in open-end management investment companies are valued at the reported net asset value per share. Repurchase agreements are valued at cost. Exchange-traded futures contracts are valued at the settlement price as provided by the appropriate clearing corporation.
If the fund determines that the market price for a portfolio security is not readily available or the valuation methods mentioned above do not reflect a security’s fair value, such security is valued as determined in good faith by the Board of Directors or its designee, in accordance with procedures adopted by the Board of Directors. Circumstances that may cause the fund to use these procedures to value a security include, but are not limited to: a security has been declared in default; trading in a security has been halted during the trading day; there is a foreign market holiday and no trading occurred; or an event occurred between the close of a foreign exchange and the NYSE that may affect the value of a security.
Security Transactions — Security transactions are accounted for as of the trade date. Net realized gains and losses are determined on the identified cost basis, which is also used for federal income tax purposes.
Investment Income — Dividend income less foreign taxes withheld, if any, is recorded as of the ex-dividend date. Interest income is recorded on the accrual basis and includes accretion of discounts and amortization of premiums.
Repurchase Agreements — The fund may enter into repurchase agreements with institutions that American Century Investment Management, Inc. (ACIM) (the investment advisor) has determined are creditworthy pursuant to criteria adopted by the Board of Directors. The fund requires that the collateral, represented by securities, received in a repurchase transaction be transferred to the custodian in a manner sufficient to enable the fund to obtain those securities in the event of a default under the repurchase agreement. ACIM monitors, on a daily basis, the securities transferred to ensure the value, including accrued interest, of the securities under each repurchase agreement is equal to or greater than amounts owed to the fund under each repurchase agreement.
Joint Trading Account — Pursuant to an Exemptive Order issued by the Securities and Exchange Commission, the fund, along with certain other funds in the American Century Investments family of funds, may transfer uninvested cash balances into a joint trading account. These balances are invested in one or more repurchase agreements that are collateralized by U.S. Treasury or Agency obligations.
Income Tax Status — It is the fund’s policy to distribute substantially all net investment income and net realized gains to shareholders and to otherwise qualify as a regulated investment company under provisions of the Internal Revenue Code. The fund is no longer subject to examination by tax authorities for years prior to 2008. At this time, management believes there are no uncertain tax positions which, based on their technical merit, would not be sustained upon examination and for which it is reasonably possible that the total amounts of unrecognized tax benefits will significantly change in the next twelve months. Accordingly, no provision has been made for federal or state income taxes.
Multiple Class — All shares of the fund represent an equal pro rata interest in the net assets of the class to which such shares belong, and have identical voting, dividend, liquidation and other rights and the same terms and conditions, except for class specific expenses and exclusive rights to vote on matters affecting only individual classes. Income, non-class specific expenses, and realized and unrealized capital gains and losses of the fund are allocated to each class of shares based on their relative net assets.
Distributions to Shareholders — Distributions from net investment income, if any, are generally declared and paid quarterly. Distributions from net realized gains, if any, are generally declared and paid annually.
Indemnifications — Under the corporation’s organizational documents, its officers and directors are indemnified against certain liabilities arising out of the performance of their duties to the fund. In addition, in the normal course of business, the fund enters into contracts that provide general indemnifications. The maximum exposure under these arrangements is unknown as this would involve future claims that may be made against a fund. The risk of material loss from such claims is considered by management to be remote.
3. Fees and Transactions with Related Parties
Management Fees — The corporation has entered into a management agreement with ACIM, under which ACIM provides the fund with investment advisory and management services in exchange for a single, unified management fee (the fee) per class. The agreement provides that all expenses of managing and operating the fund, except distribution and service fees, brokerage expenses, taxes, interest, fees and expenses of the independent directors (including legal counsel fees), and extraordinary expenses, will be paid by ACIM. The fee is computed and accrued daily based on each class’s daily net assets and paid monthly in arrears. The fee consists of (1) an Investment Category Fee based on the daily net assets of the fund and certain other accounts managed by the investment advisor that are in the same broad investment category as the fund and (2) a Complex Fee based on the assets of all the funds in the American Century Investments family of funds. The rates for the Investment Category Fee range from 0.3380% to 0.5200%. The rates for the Complex Fee range from 0.2500% to 0.3100% for the Investor Class, A Class, B Class, C Class and R Class. The Institutional Class is 0.2000% less at each point within the Complex Fee range. The effective annual management fee for each class for the year ended June 30, 2011 was 0.68% for the Investor Class, A Class, B Class, C Class and R Class and 0.48% for the Institutional Class.
Distribution and Service Fees — The Board of Directors has adopted a separate Master Distribution and Individual Shareholder Services Plan for each of the A Class, B Class, C Class and R Class (collectively the plans), pursuant to Rule 12b-1 of the 1940 Act. The plans provide that the A Class will pay American Century Investment Services, Inc. (ACIS) an annual distribution and service fee of 0.25%. The plans provide that the B Class and C Class will each pay ACIS an annual distribution and service fee of 1.00%, of which 0.25% is paid for individual shareholder services and 0.75% is paid for distribution services. The plans provide that the R Class will pay ACIS an annual distribution and service fee of 0.50%. The fees are computed and accrued daily based on each class’s daily net assets and paid monthly in arrears. The fees are used to pay financial intermediaries for distribution and individual shareholder services. Fees incurred under the plans during the year ended June 30, 2011 are detailed in the Statement of Operations.
Related Parties — Certain officers and directors of the corporation are also officers and/or directors of American Century Companies, Inc. (ACC), the parent of the corporation’s investment advisor, ACIM, the distributor of the corporation, ACIS, and the corporation’s transfer agent, American Century Services, LLC. Various funds in a series issued by American Century Asset Allocation Portfolios, Inc. (ACAAP) own, in aggregate, 14% of the shares of the fund. ACAAP does not invest in the fund for the purpose of exercising management or control.
The fund is eligible to invest in a money market fund for temporary purposes, which is managed by J.P. Morgan Investment Management, Inc. (JPMIM). The fund has a securities lending agreement with JPMorgan Chase Bank (JPMCB) and a mutual funds services agreement with J.P. Morgan Investor Services Co. (JPMIS). JPMCB is a custodian of the fund. JPMIM, JPMIS and JPMCB are wholly owned subsidiaries of JPMorgan Chase & Co. (JPM). JPM is an equity investor in ACC. The services provided to the fund by JPMIM, JPMIS and JPMCB terminated on July 31, 2011.
4. Investment Transactions
Purchases and sales of investment securities, excluding short-term investments, for the year ended June 30, 2011 were $1,458,349,296 and $1,800,277,167, respectively.
5. Capital Share Transactions
Transactions in shares of the fund were as follows:
| | | Year ended June 30, 2011 | | | Year ended June 30, 2010 | |
| | | Shares | | | Amount | | | Shares | | | Amount | |
| Investor Class/Shares Authorized | | | 400,000,000 | | | | | | | 400,000,000 | | | | |
| Sold | | | 6,844,727 | | | | $139,458,692 | | | | 7,172,629 | | | | $128,083,968 | |
| Issued in reinvestment of distributions | | | 850,097 | | | | 17,568,851 | | | | 704,506 | | | | 13,055,854 | |
| Redeemed | | | (15,216,665 | ) | | | (309,262,629 | ) | | | (15,558,934 | ) | | | (279,380,253 | ) |
| | | | (7,521,841 | ) | | | (152,235,086 | ) | | | (7,681,799 | ) | | | (138,240,431 | ) |
| Institutional Class/Shares Authorized | | | 90,000,000 | | | | | | | | 90,000,000 | | | | | |
| Sold | | | 2,221,773 | | | | 45,534,910 | | | | 4,013,345 | | | | 71,922,013 | |
| Issued in reinvestment of distributions | | | 151,591 | | | | 3,127,220 | | | | 132,081 | | | | 2,451,690 | |
| Redeemed | | | (5,273,463 | ) | | | (110,002,173 | ) | | | (3,267,204 | ) | | | (59,280,380 | ) |
| | | | (2,900,099 | ) | | | (61,340,043 | ) | | | 878,222 | | | | 15,093,323 | |
| A Class/Shares Authorized | | | 80,000,000 | | | | | | | | 80,000,000 | | | | | |
| Sold | | | 2,844,005 | | | | 56,682,136 | | | | 5,303,375 | | | | 94,772,509 | |
| Issued in reinvestment of distributions | | | 80,286 | | | | 1,642,871 | | | | 91,586 | | | | 1,694,836 | |
| Redeemed | | | (8,566,094 | ) | | | (179,415,619 | ) | | | (6,419,652 | ) | | | (118,477,685 | ) |
| | | | (5,641,803 | ) | | | (121,090,612 | ) | | | (1,024,691 | ) | | | (22,010,340 | ) |
| B Class/Shares Authorized | | | 10,000,000 | | | | | | | | 10,000,000 | | | | | |
| Sold | | | — | | | | — | | | | 86 | | | | 1,500 | |
| Issued in reinvestment of distributions | | | 9 | | | | 199 | | | | 4 | | | | 80 | |
| Redeemed | | | (674 | ) | | | (14,693 | ) | | | (23 | ) | | | (429 | ) |
| | | | (665 | ) | | | (14,494 | ) | | | 67 | | | | 1,151 | |
| C Class/Shares Authorized | | | 10,000,000 | | | | | | | | 10,000,000 | | | | | |
| Sold | | | 48,149 | | | | 999,740 | | | | 86,695 | | | | 1,541,988 | |
| Issued in reinvestment of distributions | | | 671 | | | | 13,817 | | | | 317 | | | | 5,851 | |
| Redeemed | | | (75,312 | ) | | | (1,534,551 | ) | | | (98,512 | ) | | | (1,782,489 | ) |
| | | | (26,492 | ) | | | (520,994 | ) | | | (11,500 | ) | | | (234,650 | ) |
| R Class/Shares Authorized | | | 10,000,000 | | | | | | | | 10,000,000 | | | | | |
| Sold | | | 59,588 | | | | 1,213,479 | | | | 157,816 | | | | 2,820,008 | |
| Issued in reinvestment of distributions | | | 1,613 | | | | 33,422 | | | | 1,030 | | | | 19,178 | |
| Redeemed | | | (48,362 | ) | | | (961,949 | ) | | | (54,825 | ) | | | (1,006,842 | ) |
| | | | 12,839 | | | | 284,952 | | | | 104,021 | | | | 1,832,344 | |
| Net increase (decrease) | | | (16,078,061 | ) | | | $(334,916,277 | ) | | | (7,735,680 | ) | | | $(143,558,603 | ) |
6. Fair Value Measurements
The fund’s securities valuation process is based on several considerations and may use multiple inputs to determine the fair value of the positions held by the fund. In conformity with accounting principles generally accepted in the United States of America, the inputs used to determine a valuation are classified into three broad levels as follows:
| Level 1 valuation inputs consist of unadjusted quoted prices in an active market for identical securities; |
| Level 2 valuation inputs consist of direct or indirect observable market data (including quoted prices for similar securities, evaluations of subsequent market events, interest rates, prepayment speeds, credit risk, etc.); or |
| Level 3 valuation inputs consist of unobservable data (including a fund’s own assumptions). |
The level classification is based on the lowest level input that is significant to the fair valuation measurement. The valuation inputs are not necessarily an indication of the risks associated with investing in these securities or other financial instruments.
The following is a summary of the level classifications as of period end. The Schedule of Investments provides additional information on the fund’s portfolio holdings.
| | | Level 1 | | | Level 2 | | | Level 3 | |
| Investment Securities | | | | | | | | | |
| Common Stocks | | | $1,985,487,765 | | | | — | | | | — | |
| Temporary Cash Investments | | | 4,682,455 | | | | $15,488,860 | | | | — | |
| Total Value of Investment Securities | | | $1,990,170,220 | | | | $15,488,860 | | | | — | |
7. Derivative Instruments
Equity Price Risk — The fund is subject to equity price risk in the normal course of pursuing its investment objectives. A fund may enter into futures contracts based on an equity index in order to manage its exposure to changes in market conditions. A fund may purchase futures contracts to gain exposure to increases in market value or sell futures contracts to protect against a decline in market value. Upon entering into a futures contract, a fund is required to deposit either cash or securities in an amount equal to a certain percentage of the contract value (initial margin). Subsequent payments (variation margin) are made or received daily, in cash, by a fund. The variation margin is equal to the daily change in the contract value and is recorded as unrealized gains and losses. A fund recognizes a realized gain or loss when the contract is closed or expires. Net realized and unrealized gains or losses occurring during the holding period of futures contracts are a component of net realized gain (loss) on futures contract transactions and change in net unrealized appreciation (depreciation) on futures contracts, respectively. One of the risks of entering into futures contracts is the possibility that the change in value of the contract may not correlate with the changes in value of the underlying securities. During the period, the fund infrequently purchased equity price risk derivative instruments for temporary investment purposes.
At period end, the fund did not have any equity price risk derivative instruments disclosed on the Statement of Assets and Liabilities. For the year ended June 30, 2011, the effect of equity price risk derivative instruments on the Statement of Operations was $2,005,995 in net realized gain (loss) on futures contract transactions.
8. Federal Tax Information
The tax character of distributions paid during the years ended June 30, 2011 and June 30, 2010 were as follows:
| | | 2011 | | | 2010 | |
| Distributions Paid From | | | | | | |
| Ordinary income | | | $24,428,391 | | | | $21,208,776 | |
| Long-term capital gains | | | — | | | | — | |
The book-basis character of distributions made during the year from net investment income or net realized gains may differ from their ultimate characterization for federal income tax purposes. These differences reflect the differing character of certain income items and net realized gains and losses for financial statement and tax purposes, and may result in reclassification among certain capital accounts on the financial statements.
As of June 30, 2011, the federal tax cost of investments and the components of distributable earnings on a tax-basis were as follows:
| Federal tax cost of investments | | | $1,677,580,778 | |
| Gross tax appreciation of investments | | | $348,015,261 | |
| Gross tax depreciation of investments | | | (19,936,959 | ) |
| Net tax appreciation (depreciation) of investments | | | $328,078,302 | |
| Net tax appreciation (depreciation) on derivatives | | | — | |
| Net tax appreciation (depreciation) | | | $328,078,302 | |
| Undistributed ordinary income | | | $1,339,385 | |
| Accumulated capital losses | | | $(342,387,778 | ) |
The difference between book-basis and tax-basis cost and unrealized appreciation (depreciation) is attributable primarily to the tax deferral of losses on wash sales.
The accumulated capital losses represent net capital loss carryovers that may be used to offset future realized capital gains for federal income tax purposes. Future capital loss carryover utilization in any given year may be subject to Internal Revenue Code limitations. Capital loss carryovers of $(15,173,265) and $(327,214,513) expire in 2017 and 2018, respectively.
On December 22, 2010, the Regulated Investment Company Modernization Act of 2010 (the “Act”) was enacted, which changed various technical rules governing the tax treatment of regulated investment companies. The changes are generally effective for taxable years beginning after the date of enactment. Under the Act, the fund will be permitted to carry forward capital losses incurred in taxable years beginning after the date of enactment for an unlimited period. However, any losses incurred during those future taxable years will be required to be utilized prior to the losses incurred in pre-enactment taxable years, which carry an expiration date. As a result of this ordering rule, pre-enactment capital loss carryforwards may be more likely to expire unused.
| Investor Class | |
| For a Share Outstanding Throughout the Years Ended June 30 (except as noted) | |
| | | 2011 | | | 2010 | | | 2009 | | | 2008 | | | 2007(1) | | | 2006 | |
| Per-Share Data | |
| Net Asset Value, Beginning of Period | | | $17.20 | | | | $15.32 | | | | $21.84 | | | | $26.91 | | | | $25.64 | | | | $23.37 | |
Income From Investment Operations | | | | | | | | | | | | | | | | | | | | | | | | |
Net Investment Income (Loss)(2) | | | 0.26 | | | | 0.21 | | | | 0.27 | | | | 0.25 | | | | 0.11 | | | | 0.22 | |
Net Realized and Unrealized Gain (Loss) | | | 5.16 | | | | 1.87 | | | | (6.45 | ) | | | (3.36 | ) | | | 1.55 | | | | 3.07 | |
Total From Investment Operations | | | 5.42 | | | | 2.08 | | | | (6.18 | ) | | | (3.11 | ) | | | 1.66 | | | | 3.29 | |
| Distributions | | | | | | | | | | | | | | | | | | | | | | | | |
From Net Investment Income | | | (0.25 | ) | | | (0.20 | ) | | | (0.34 | ) | | | (0.18 | ) | | | (0.11 | ) | | | (0.23 | ) |
| From Net Realized Gains | | | — | | | | — | | | | — | | | | (1.78 | ) | | | (0.28 | ) | | | (0.79 | ) |
| Total Distributions | | | (0.25 | ) | | | (0.20 | ) | | | (0.34 | ) | | | (1.96 | ) | | | (0.39 | ) | | | (1.02 | ) |
Net Asset Value, End of Period | | | $22.37 | | | | $17.20 | | | | $15.32 | | | | $21.84 | | | | $26.91 | | | | $25.64 | |
| | | | | | | | | | | | | | | | | | | | | | | | | |
Total Return(3) | | | 31.66 | % | | | 13.47 | % | | | (28.37 | )% | | | (12.12 | )% | | | 6.52 | % | | | 14.14 | % |
| | | | | | | | | | | | | | | | | | | | | | | | | |
| Ratios/Supplemental Data | |
Ratio of Operating Expenses to Average Net Assets | | | 0.69 | % | | | 0.70 | % | | | 0.70 | % | | | 0.67 | % | | | 0.67 | %(4) | | | 0.67 | % |
Ratio of Net Investment Income (Loss) to Average Net Assets | | | 1.28 | % | | | 1.14 | % | | | 1.66 | % | | | 1.01 | % | | | 0.82 | %(4) | | | 0.92 | % |
| Portfolio Turnover Rate | | | 74 | % | | | 64 | % | | | 107 | % | | | 105 | % | | | 52 | % | | | 102 | % |
| Net Assets, End of Period (in thousands) | | | $1,615,829 | | | | $1,371,992 | | | | $1,339,582 | | | | $2,046,107 | | | | $2,675,773 | | | | $2,488,267 | |
| (1) | January 1, 2007 through June 30, 2007. The fund’s fiscal year end was changed from December 31 to June 30, resulting in a six-month annual reporting period. For the years before June 30, 2007, the fund’s fiscal year end was December 31. |
| (2) | Computed using average shares outstanding throughout the period. |
| (3) | Total returns are calculated based on the net asset value of the last business day. Total returns for periods less than one year are not annualized. |
See Notes to Financial Statements.
| Institutional Class | |
| For a Share Outstanding Throughout the Years Ended June 30 (except as noted) | |
| | | 2011 | | | 2010 | | | 2009 | | | 2008 | | | 2007(1) | | | 2006 | |
| Per-Share Data | |
| Net Asset Value, Beginning of Period | | | $17.21 | | | | $15.33 | | | | $21.86 | | | | $26.92 | | | | $25.65 | | | | $23.38 | |
Income From Investment Operations | | | | | | | | | | | | | | | | | | | | | | | | |
Net Investment Income (Loss)(2) | | | 0.30 | | | | 0.24 | | | | 0.31 | | | | 0.29 | | | | 0.13 | | | | 0.27 | |
Net Realized and Unrealized Gain (Loss) | | | 5.17 | | | | 1.87 | | | | (6.46 | ) | | | (3.35 | ) | | | 1.55 | | | | 3.07 | |
Total From Investment Operations | | | 5.47 | | | | 2.11 | | | | (6.15 | ) | | | (3.06 | ) | | | 1.68 | | | | 3.34 | |
| Distributions | | | | | | | | | | | | | | | | | | | | | | | | |
From Net Investment Income | | | (0.30 | ) | | | (0.23 | ) | | | (0.38 | ) | | | (0.22 | ) | | | (0.13 | ) | | | (0.28 | ) |
| From Net Realized Gains | | | — | | | | — | | | | — | | | | (1.78 | ) | | | (0.28 | ) | | | (0.79 | ) |
| Total Distributions | | | (0.30 | ) | | | (0.23 | ) | | | (0.38 | ) | | | (2.00 | ) | | | (0.41 | ) | | | (1.07 | ) |
Net Asset Value, End of Period | | | $22.38 | | | | $17.21 | | | | $15.33 | | | | $21.86 | | | | $26.92 | | | | $25.65 | |
| | | | | | | | | | | | | | | | | | | | | | | | | |
Total Return(3) | | | 31.91 | % | | | 13.69 | % | | | (28.21 | )% | | | (11.95 | )% | | | 6.61 | % | | | 14.36 | % |
| | | | | | | | | | | | | | | | | | | | | | | | | |
| Ratios/Supplemental Data | |
Ratio of Operating Expenses to Average Net Assets | | | 0.49 | % | | | 0.50 | % | | | 0.50 | % | | | 0.47 | % | | | 0.47 | %(4) | | | 0.47 | % |
Ratio of Net Investment Income (Loss) to Average Net Assets | | | 1.48 | % | | | 1.34 | % | | | 1.86 | % | | | 1.21 | % | | | 1.02 | %(4) | | | 1.12 | % |
| Portfolio Turnover Rate | | | 74 | % | | | 64 | % | | | 107 | % | | | 105 | % | | | 52 | % | | | 102 | % |
| Net Assets, End of Period (in thousands) | | | $200,191 | | | | $203,860 | | | | $168,092 | | | | $443,647 | | | | $529,324 | | | | $472,199 | |
| (1) | January 1, 2007 through June 30, 2007. The fund’s fiscal year end was changed from December 31 to June 30, resulting in a six-month annual reporting period. For the years before June 30, 2007, the fund’s fiscal year end was December 31. |
| (2) | Computed using average shares outstanding throughout the period. |
| (3) | Total returns are calculated based on the net asset value of the last business day. Total returns for periods less than one year are not annualized. |
See Notes to Financial Statements.
A Class(1) | |
| For a Share Outstanding Throughout the Years Ended June 30 (except as noted) | |
| | | 2011 | | | 2010 | | | 2009 | | | 2008 | | | 2007(2) | | | 2006 | |
| Per-Share Data | |
| Net Asset Value, Beginning of Period | | | $17.19 | | | | $15.31 | | | | $21.81 | | | | $26.89 | | | | $25.62 | | | | $23.35 | |
Income From Investment Operations | | | | | | | | | | | | | | | | | | | | | | | | |
Net Investment Income (Loss)(3) | | | 0.20 | | | | 0.16 | | | | 0.23 | | | | 0.18 | | | | 0.07 | | | | 0.16 | |
Net Realized and Unrealized Gain (Loss) | | | 5.16 | | | | 1.87 | | | | (6.44 | ) | | | (3.34 | ) | | | 1.56 | | | | 3.07 | |
Total From Investment Operations | | | 5.36 | | | | 2.03 | | | | (6.21 | ) | | | (3.16 | ) | | | 1.63 | | | | 3.23 | |
| Distributions | | | | | | | | | | | | | | | | | | | | | | | | |
From Net Investment Income | | | (0.20 | ) | | | (0.15 | ) | | | (0.29 | ) | | | (0.14 | ) | | | (0.08 | ) | | | (0.17 | ) |
| From Net Realized Gains | | | — | | | | — | | | | — | | | | (1.78 | ) | | | (0.28 | ) | | | (0.79 | ) |
| Total Distributions | | | (0.20 | ) | | | (0.15 | ) | | | (0.29 | ) | | | (1.92 | ) | | | (0.36 | ) | | | (0.96 | ) |
Net Asset Value, End of Period | | | $22.35 | | | | $17.19 | | | | $15.31 | | | | $21.81 | | | | $26.89 | | | | $25.62 | |
| | | | | | | | | | | | | | | | | | | | | | | | | |
Total Return(4) | | | 31.30 | % | | | 13.20 | % | | | (28.54 | )% | | | (12.33 | )% | | | 6.40 | % | | | 13.86 | % |
| | | | | | | | | | | | | | | | | | | | | | | | | |
| Ratios/Supplemental Data | |
Ratio of Operating Expenses to Average Net Assets | | | 0.94 | % | | | 0.95 | % | | | 0.95 | % | | | 0.92 | % | | | 0.92 | %(5) | | | 0.92 | % |
Ratio of Net Investment Income (Loss) to Average Net Assets | | | 1.03 | % | | | 0.89 | % | | | 1.41 | % | | | 0.76 | % | | | 0.57 | %(5) | | | 0.67 | % |
| Portfolio Turnover Rate | | | 74 | % | | | 64 | % | | | 107 | % | | | 105 | % | | | 52 | % | | | 102 | % |
| Net Assets, End of Period (in thousands) | | | $182,195 | | | | $237,076 | | | | $226,830 | | | | $336,939 | | | | $479,540 | | | | $417,950 | |
| (1) | Prior to September 4, 2007, the A Class was referred to as the Advisor Class. |
| (2) | January 1, 2007 through June 30, 2007. The fund’s fiscal year end was changed from December 31 to June 30, resulting in a six-month annual reporting period. For the years before June 30, 2007, the fund’s fiscal year end was December 31. |
| (3) | Computed using average shares outstanding throughout the period. |
| (4) | Total returns are calculated based on the net asset value of the last business day and do not reflect applicable sales charges. Total returns for periods less than one year are not annualized. |
See Notes to Financial Statements.
| B Class | |
| For a Share Outstanding Throughout the Years Ended June 30 (except as noted) | |
| | | 2011 | | | 2010 | | | 2009 | | | 2008(1) | |
| Per-Share Data | |
| Net Asset Value, Beginning of Period | | | $17.20 | | | | $15.32 | | | | $21.78 | | | | $27.09 | |
| Income From Investment Operations | | | | | | | | | | | | | | | | |
Net Investment Income (Loss)(2) | | | 0.06 | | | | 0.03 | | | | 0.11 | | | | — | (3) |
| Net Realized and Unrealized Gain (Loss) | | | 5.15 | | | | 1.87 | | | | (6.44 | ) | | | (3.52 | ) |
| Total From Investment Operations | | | 5.21 | | | | 1.90 | | | | (6.33 | ) | | | (3.52 | ) |
| Distributions | | | | | | | | | | | | | | | | |
| From Net Investment Income | | | (0.05 | ) | | | (0.02 | ) | | | (0.13 | ) | | | (0.01 | ) |
| From Net Realized Gains | | | — | | | | — | | | | — | | | | (1.78 | ) |
| Total Distributions | | | (0.05 | ) | | | (0.02 | ) | | | (0.13 | ) | | | (1.79 | ) |
| Net Asset Value, End of Period | | | $22.36 | | | | $17.20 | | | | $15.32 | | | | $21.78 | |
| | | | | | | | | | | | | | | | | |
Total Return(4) | | | 30.30 | % | | | 12.38 | % | | | (29.05 | )% | | | (13.55 | )% |
| | | | | | | | | | | | | | | | | |
| Ratios/Supplemental Data | |
| Ratio of Operating Expenses to Average Net Assets | | | 1.69 | % | | | 1.70 | % | | | 1.70 | % | | | 1.67 | %(5) |
| Ratio of Net Investment Income (Loss) to Average Net Assets | | | 0.28 | % | | | 0.14 | % | | | 0.66 | % | | | 0.02 | %(5) |
| Portfolio Turnover Rate | | | 74 | % | | | 64 | % | | | 107 | % | | | 105 | %(6) |
| Net Assets, End of Period (in thousands) | | | $81 | | | | $73 | | | | $64 | | | | $46 | |
| (1) | September 28, 2007 (commencement of sale) through June 30, 2008. |
| (2) | Computed using average shares outstanding throughout the period. |
| (3) | Per-share amount was less than $0.005. |
| (4) | Total returns are calculated based on the net asset value of the last business day and do not reflect applicable sales charges. Total returns for periods less than one year are not annualized. |
| (6) | Portfolio turnover is calculated at the fund level. Percentage indicated was calculated for the year ended June 30, 2008. |
See Notes to Financial Statements.
| C Class | |
| For a Share Outstanding Throughout the Years Ended June 30 (except as noted) | |
| | | 2011 | | | 2010 | | | 2009 | | | 2008 | | | 2007(1) | | | 2006 | |
| Per-Share Data | |
| Net Asset Value, Beginning of Period | | | $17.08 | | | | $15.22 | | | | $21.64 | | | | $26.76 | | | | $25.51 | | | | $23.28 | |
Income From Investment Operations | | | | | | | | | | | | | | | | | | | | | | | | |
Net Investment Income (Loss)(2) | | | 0.06 | | | | 0.03 | | | | 0.11 | | | | — | (3) | | | (0.02 | ) | | | (0.02 | ) |
Net Realized and Unrealized Gain (Loss) | | | 5.12 | | | | 1.85 | | | | (6.40 | ) | | | (3.33 | ) | | | 1.55 | | | | 3.04 | |
Total From Investment Operations | | | 5.18 | | | | 1.88 | | | | (6.29 | ) | | | (3.33 | ) | | | 1.53 | | | | 3.02 | |
| Distributions | | | | | | | | | | | | | | | | | | | | | | | | |
From Net Investment Income | | | (0.05 | ) | | | (0.02 | ) | | | (0.13 | ) | | | (0.01 | ) | | | — | | | | — | (3) |
| From Net Realized Gains | | | — | | | | — | | | | — | | | | (1.78 | ) | | | (0.28 | ) | | | (0.79 | ) |
| Total Distributions | | | (0.05 | ) | | | (0.02 | ) | | | (0.13 | ) | | | (1.79 | ) | | | (0.28 | ) | | | (0.79 | ) |
Net Asset Value, End of Period | | | $22.21 | | | | $17.08 | | | | $15.22 | | | | $21.64 | | | | $26.76 | | | | $25.51 | |
| | | | | | | | | | | | | | | | | | | | | | | | | |
Total Return(4) | | | 30.34 | % | | | 12.33 | % | | | (29.06 | )% | | | (13.01 | )% | | | 5.99 | % | | | 13.02 | % |
| | | | | | | | | | | | | | | | | | | | | | | | | |
| Ratios/Supplemental Data | |
Ratio of Operating Expenses to Average Net Assets | | | 1.69 | % | | | 1.70 | % | | | 1.70 | % | | | 1.67 | % | | | 1.67 | %(5) | | | 1.67 | % |
Ratio of Net Investment Income (Loss) to Average Net Assets | | | 0.28 | % | | | 0.14 | % | | | 0.66 | % | | | 0.01 | % | | | (0.18 | )%(5) | | | (0.08 | )% |
| Portfolio Turnover Rate | | | 74 | % | | | 64 | % | | | 107 | % | | | 105 | % | | | 52 | % | | | 102 | % |
| Net Assets, End of Period (in thousands) | | | $6,611 | | | | $5,536 | | | | $5,108 | | | | $7,634 | | | | $12,852 | | | | $10,276 | |
| (1) | January 1, 2007 through June 30, 2007. The fund’s fiscal year end was changed from December 31 to June 30, resulting in a six-month annual reporting period. For the years before June 30, 2007, the fund’s fiscal year end was December 31. |
| (2) | Computed using average shares outstanding throughout the period. |
| (3) | Per-share amount was less than $0.005. |
| (4) | Total returns are calculated based on the net asset value of the last business day and do not reflect applicable sales charges. Total returns for periods less than one year are not annualized. |
See Notes to Financial Statements.
| R Class | |
| For a Share Outstanding Throughout the Years Ended June 30 (except as noted) | |
| | | 2011 | | | 2010 | | | 2009 | | | 2008 | | | 2007(1) | | | 2006 | |
| Per-Share Data | |
| Net Asset Value, Beginning of Period | | | $17.20 | | | | $15.32 | | | | $21.81 | | | | $26.91 | | | | $25.64 | | | | $23.37 | |
Income From Investment Operations | | | | | | | | | | | | | | | | | | | | | | | | |
Net Investment Income (Loss)(2) | | | 0.16 | | | | 0.12 | | | | 0.18 | | | | 0.13 | | | | 0.04 | | | | 0.14 | |
Net Realized and Unrealized Gain (Loss) | | | 5.15 | | | | 1.87 | | | | (6.43 | ) | | | (3.36 | ) | | | 1.56 | | | | 3.03 | |
Total From Investment Operations | | | 5.31 | | | | 1.99 | | | | (6.25 | ) | | | (3.23 | ) | | | 1.60 | | | | 3.17 | |
| Distributions | | | | | | | | | | | | | | | | | | | | | | | | |
From Net Investment Income | | | (0.15 | ) | | | (0.11 | ) | | | (0.24 | ) | | | (0.09 | ) | | | (0.05 | ) | | | (0.11 | ) |
| From Net Realized Gains | | | — | | | | — | | | | — | | | | (1.78 | ) | | | (0.28 | ) | | | (0.79 | ) |
| Total Distributions | | | (0.15 | ) | | | (0.11 | ) | | | (0.24 | ) | | | (1.87 | ) | | | (0.33 | ) | | | (0.90 | ) |
Net Asset Value, End of Period | | | $22.36 | | | | $17.20 | | | | $15.32 | | | | $21.81 | | | | $26.91 | | | | $25.64 | |
| | | | | | | | | | | | | | | | | | | | | | | | | |
Total Return(3) | | | 30.95 | % | | | 12.91 | % | | | (28.71 | )% | | | (12.56 | )% | | | 6.27 | % | | | 13.57 | % |
| | | | | | | | | | | | | | | | | | | | | | | | | |
| Ratios/Supplemental Data | |
Ratio of Operating Expenses to Average Net Assets | | | 1.19 | % | | | 1.20 | % | | | 1.20 | % | | | 1.17 | % | | | 1.17 | %(4) | | | 1.17 | % |
Ratio of Net Investment Income (Loss) to Average Net Assets | | | 0.78 | % | | | 0.64 | % | | | 1.16 | % | | | 0.51 | % | | | 0.32 | %(4) | | | 0.42 | % |
| Portfolio Turnover Rate | | | 74 | % | | | 64 | % | | | 107 | % | | | 105 | % | | | 52 | % | | | 102 | % |
| Net Assets, End of Period (in thousands) | | | $5,189 | | | | $3,770 | | | | $1,764 | | | | $752 | | | | $962 | | | | $741 | |
| (1) | January 1, 2007 through June 30, 2007. The fund’s fiscal year end was changed from December 31 to June 30, resulting in a six-month annual reporting period. For the years before June 30, 2007, the fund’s fiscal year end was December 31. |
| (2) | Computed using average shares outstanding throughout the period. |
| (3) | Total returns are calculated based on the net asset value of the last business day. Total returns for periods less than one year are not annualized. |
See Notes to Financial Statements.
Report of Independent Registered Public Accounting Firm |
To the Directors of the American Century Quantitative Equity Funds, Inc.
and Shareholders of the Equity Growth Fund:
In our opinion, the accompanying statement of assets and liabilities, including the schedule of investments, and the related statements of operations and of changes in net assets and the financial highlights present fairly, in all material respects, the financial position of the Equity Growth Fund (one of the eleven funds comprising the American Century Quantitative Equity Funds, Inc., hereafter referred to as the “Fund”) at June 30, 2011 the results of its operations for the year then ended, the changes in its net assets for each of the two years in the period then ended and the financial highlights for each of the periods presented, in conformity with accounting principles generally accepted in the United States of America. These financial statements and financial highlights (hereafter referred to as “financial statements”) are the responsibility of the Fund’s management; our responsibility is to express an opinion on these financial statements based on our audits. We conducted our audits of these financial statements in accordance with the standards of the Public Company Accounting Oversight Board (United States). Those standards require that we plan and perform the audit to obtain reasonable assurance about whether the financial statements are free of material misstatement. An audit includes examining, on a test basis, evidence supporting the amounts and disclosures in the financial statements, assessing the accounting principles used and significant estimates made by management, and evaluating the overall financial statement presentation. We believe that our audits, which included confirmation of securities at June 30, 2011 by correspondence with the custodian and brokers, provide a reasonable basis for our opinion.
PricewaterhouseCoopers LLP
Kansas City, Missouri
August 18, 2011
The individuals listed below serve as directors of the funds. Each director will continue to serve in this capacity until death, retirement, resignation or removal from office. The mandatory retirement age for directors who are not “interested persons,” as that term is defined in the Investment Company Act (independent directors), is 73. However, the mandatory retirement age may be extended for a period not to exceed two years with the approval of the remaining independent directors.
Mr. Thomas is the only director who is an “interested person” because he currently serves as President and Chief Executive Officer of American Century Companies, Inc. (ACC), the parent company of American Century Investment Management, Inc. (ACIM or the advisor).
The other directors (more than three-fourths of the total number) are independent; that is, they have never been employees, directors or officers of, and have no financial interest in, ACC or any of its wholly owned, direct or indirect, subsidiaries, including ACIM, American Century Investment Services, Inc. (ACIS) and American Century Services, LLC (ACS). The directors serve in this capacity for eight (in the case of Mr. Thomas, 15) registered investment companies in the American Century Investments family of funds.
The following presents additional information about the directors. The mailing address for each director other than Mr. Thomas is 1665 Charleston Road, Mountain View, California 94043. The mailing address for Mr. Thomas is 4500 Main Street, Kansas City, Missouri 64111.
Name (Year of Birth) | Position(s) Held with Funds | Length of Time Served | Principal Occupation(s) During Past 5 Years | | Number of American Century Portfolios Overseen by Director | Other Directorships Held During Past 5 Years |
| Independent Directors |
| Tanya S. Beder (1955) | Director | Since 2011 | Chairman, SBCC Group Inc. (investment advisory services)(2006 to present); Fellow in Practice, International Center for Finance, Yale University School of Management (1985 to present); Chief Executive Officer, Tribeca Global Management LLC (asset management firm) (2004 to 2006) | | 40 | None |
| Jeremy I. Bulow (1954) | Director | Since 2011 | Professor of Economics, Stanford University, Graduate School of Business (1979 to present) | | 40 | None |
| John Freidenrich (1937) | Director | Since 2005 | Founder, Member and Manager, Regis Management Company, LLC (investment management firm) (April 2004 to present) | | 40 | None |
Name (Year of Birth) | Position(s) Held with Funds | Length of Time Served | Principal Occupation(s) During Past 5 Years | | Number of American Century Portfolios Overseen by Director | Other Directorships Held During Past 5 Years |
| Independent Directors |
| Ronald J. Gilson (1946) | Director and Chairman of the Board | Since 1995 | Charles J. Meyers Professor of Law and Business, Stanford Law School (1979 to present); Marc and Eva Stern Professor of Law and Business, Columbia University School of Law (1992 to present) | | 40 | None |
Frederick L. A. Grauer (1946) | Director | Since 2008 | Senior Advisor, BlackRock, Inc. (investment management firm) (2010 to 2011); Senior Advisor, Barclays Global Investors (investment management firm) (2003 to 2009) | | 40 | None |
| Peter F. Pervere (1947) | Director | Since 2007 | Retired | | 40 | Intraware, Inc. (2003 to 2009) |
| Myron S. Scholes (1941) | Director | Since 1980 | Chairman, Platinum Grove Asset Management, L.P. (asset manager) (1999 to 2009); Frank E. Buck Professor of Finance-Emeritus, Stanford Graduate School of Business (1996 to present) | | 40 | Dimensional Fund Advisors (investment advisor); CME Group, Inc. (futures and options exchange) |
| John B. Shoven (1947) | Director | Since 2002 | Professor of Economics, Stanford University (1973 to present) | | 40 | Cadence Design Systems; Exponent; Financial Engines; Watson Wyatt Worldwide (2002 to 2006) |
| |
| Interested Director |
Jonathan S. Thomas (1963) | Director and President | Since 2007 | President and Chief Executive Officer, ACC (March 2007 to present); Chief Administrative Officer, ACC (February 2006 to February 2007); Executive Vice President, ACC (November 2005 to February 2007). Also serves as: Chief Executive Officer and Manager, ACS; Executive Vice President, ACIM; Director, ACC, ACIM and other ACC subsidiaries | | 104 | None |
Officers
The following table presents certain information about the executive officers of the funds. Each officer serves as an officer for each of the 15 investment companies in the American Century family of funds, unless otherwise noted. No officer is compensated for his or her service as an officer of the funds. The listed officers are interested persons of the funds and are appointed or re-appointed on an annual basis. The mailing address for each of the officers listed below is 4500 Main Street, Kansas City, Missouri 64111.
Name (Year of Birth) | Offices with the Funds | | Principal Occupation(s) During the Past Five Years |
Jonathan S. Thomas (1963) | Director and President since 2007 | | President and Chief Executive Officer, ACC (March 2007 to present); Chief Administrative Officer, ACC (February 2006 to February 2007); Executive Vice President, ACC (November 2005 to February 2007). Also serves as: Chief Executive Officer and Manager, ACS; Executive Vice President, ACIM; Director, ACC, ACIM and other ACC subsidiaries |
Barry Fink (1955) | Executive Vice President since 2007 | | Chief Operating Officer and Executive Vice President, ACC (September 2007 to present); President, ACS (October 2007 to present); Managing Director, Morgan Stanley (2000 to 2007); Global General Counsel, Morgan Stanley (2000 to 2006). Also serves as: Manager, ACS and Director, ACC and certain ACC subsidiaries |
Maryanne L. Roepke (1956) | Chief Compliance Officer since 2006 and Senior Vice President since 2000 | | Chief Compliance Officer, American Century funds, ACIM and ACS (August 2006 to present); Assistant Treasurer, ACC (January 1995 to August 2006); and Treasurer and Chief Financial Officer, various American Century funds (July 2000 to August 2006). Also serves as: Senior Vice President, ACS |
| Charles A. Etherington (1957) | General Counsel since 2007 and Senior Vice President since 2006 | | Attorney, ACC (February 1994 to present); Vice President, ACC (November 2005 to present), General Counsel, ACC (March 2007 to present); Also serves as General Counsel, ACIM, ACS, ACIS and other ACC subsidiaries; and Senior Vice President, ACIM and ACS |
| Robert J. Leach (1966) | Vice President, Treasurer and Chief Financial Officer since 2006 | | Vice President, ACS (February 2000 to present); and Controller, various American Century funds (1997 to September 2006) |
| David H. Reinmiller (1963) | Vice President since 2001 | | Attorney, ACC (January 1994 to present); Associate General Counsel, ACC (January 2001 to present); Also serves as Vice President, ACIM and ACS |
| Ward D. Stauffer (1960) | Secretary since 2005 | | Attorney, ACC (June 2003 to present) |
The Statement of Additional Information has additional information about the fund’s directors and is available without charge, upon request, by calling 1-800-345-2021.
| Approval of Management Agreement |
At a meeting held on June 28, 2011, the Fund’s Board of Directors/Trustees unanimously approved the renewal of the management agreement pursuant to which American Century Investment Management, Inc. (the “Advisor”) acts as the investment advisor for the Fund. Under Section 15(c) of the Investment Company Act, contracts for investment advisory services are required to be reviewed, evaluated, and approved by a majority of a fund’s independent
directors/trustees (the “Directors”) each year.
As a part of the approval process, the Board requested and reviewed extensive data and information compiled by the Advisor and certain independent providers of evaluation data concerning the Fund and the services provided to the Fund by the Advisor. This review was in addition to the oversight and evaluation undertaken by the Board and its committees on a continuous basis throughout the year and included, but was not limited to the following:
| the nature, extent, and quality of investment management, shareholder services, and other services provided by the Advisor to the Fund; |
| the wide range of other programs and services the Advisor provides to the Fund and its shareholders on a routine and non-routine basis; |
| the investment performance of the fund, including data comparing the Fund’s performance to appropriate benchmarks and/or a peer group of other mutual funds with similar investment objectives and strategies; |
| data comparing the cost of owning the Fund to the cost of owning similar funds; |
| the Advisor’s compliance policies, procedures, and regulatory experience; |
| financial data showing the cost of services provided to the Fund, the profitability of the Fund to the Advisor, and the overall profitability of the Advisor; |
| data comparing services provided and charges to other investment management clients of the Advisor; and |
| consideration of collateral benefits derived by the Advisor from the management of the Fund and any potential economies of scale relating thereto. |
In keeping with its practice, the Board held two in-person meetings and one telephonic meeting to review and discuss the information provided. The Board also had the benefit of the advice of its independent counsel throughout the period.
Factors Considered
The Directors considered all of the information provided by the Advisor, the independent data providers, and the Board’s independent counsel, and evaluated such information for the Fund. In connection with their review, the Directors did not identify any single factor as being all-important or controlling, and each Director may have attributed different levels of importance to different factors. In deciding to renew the management agreement, the Board based its decision on a number of factors, including the following:
Nature, Extent and Quality of Services — Generally. Under the management agreement, the Advisor is responsible for providing or arranging for all services necessary for the operation of the Fund. The Board noted that under the management agreement, the Advisor provides or arranges at its own expense a wide variety of services including:
| constructing and designing the Fund |
| portfolio research and security selection |
| initial capitalization/funding |
| daily valuation of the Fund’s portfolio |
| shareholder servicing and transfer agency, including shareholder confirmations, recordkeeping, and communications |
| regulatory and portfolio compliance |
| marketing and distribution |
The Board noted that many of these services have expanded over time both in terms of quantity and complexity in response to shareholder demands, competition in the industry, changing distribution channels, and the changing regulatory environment.
Investment Management Services. The nature of the investment management services provided to the Fund is quite complex and allows Fund shareholders access to professional money management, instant diversification of their investments within an asset class, the opportunity to easily diversify among asset classes by investing in or exchanging among various American Century Investments funds, and liquidity. In evaluating investment performance, the Board expects the Advisor to manage the Fund in accordance with its investment objectives and approved strategies. Further, the Directors recognize that the Advisor has an obligation to seek the best execution of fund trades. In providing these services, the Advisor utilizes teams of investment professionals (portfolio managers, analysts, research assistants, and securities traders) who require extensive information technology, research, training, compliance and other systems to conduct their business. The Board, directly and through its Portfolio Committee, regularly reviews investment performance information for the Fund, together with comparative information for appropriate benchmarks and/or peer groups of similarly-managed funds, over different time horizons. The Directors also review detailed performance information during the management agreement approval
process. If performance concerns are identified, the Fund receives special reviews until performance improves, during which the Board discusses with the Advisor the reasons for such results (e.g., market conditions, security selection) and any efforts being undertaken to improve performance. The Board found the investment management services provided by the Advisor to the Fund to meet or exceed industry standards. More detailed information about the Fund’s performance can be found in the Performance and Portfolio Commentary sections of this report.
Shareholder and Other Services. Under the management agreement, the Advisor provides the Fund with a comprehensive package of transfer agency, shareholder, and other services. The Board, directly and through various committees of the Board, regularly reviews reports and evaluations of such services at its regular meetings. These reports include, but are not limited to, information regarding the operational efficiency and accuracy of the shareholder and transfer agency services provided, staffing levels, shareholder satisfaction (as measured by external as well as internal sources), technology support, new products and services offered to Fund shareholders, securities trading activities, portfolio valuation services, auditing services, and legal and operational compliance activities. Certain aspects of shareholder and transfer agency service level efficiency and the quality of securities trading activities are measured by independent third party providers and are presented in comparison to other fund groups not managed by the Advisor. The Board found the services provided by the Advisor to the Fund under the management agreement to be competitive and of high quality.
Costs of Services and Profitability. The Advisor provides detailed information concerning its cost of providing various services to the Fund, its profitability in managing the Fund, its overall profitability, and its financial condition. The Directors have reviewed with the Advisor the methodology used to prepare this financial information. The financial information regarding the Advisor is considered in evaluating the Advisor’s financial condition, ability to continue to provide services under the management agreement, and the reasonableness of the current management fee. The Board concluded that the Advisor’s profits were reasonable in light of the services provided to the Fund.
Ethics. The Board generally considers the Advisor’s commitment to providing quality services to shareholders and to conducting its business ethically. They noted that the Advisor’s practices generally meet or exceed industry best practices.
Economies of Scale. The Board also reviewed information provided by the Advisor regarding the possible existence of economies of scale in connection with the management of the Fund. The Board concluded that economies of scale are difficult to measure and predict with precision, especially on a fund-by-fund basis. The Board concluded that the Advisor is appropriately sharing economies of scale through its competitive fee structure, offering competitive fees from fund inception, and through reinvestment in its business to provide shareholders additional content and services.
Comparison to Other Funds’ Fees. The management agreement provides that the Fund pay the Advisor a single, all-inclusive (or unified) management fee for providing all services necessary for the management and operation of the Fund, other than brokerage expenses, taxes, interest, extraordinary expenses, and the fees and expenses of the Fund’s independent directors (including their independent legal counsel) and expenses incurred in connection with the provision of shareholder services and distribution services under a plan adopted pursuant to Rule 12b-1 under the 1940 Act. Under the unified fee structure, the Advisor is responsible for providing all investment advisory, custody, audit, administrative, compliance, recordkeeping, marketing and shareholder services, or arranging and supervising third parties to provide such services. By contrast, most other funds are charged a variety of fees, including an investment advisory fee, a transfer agency fee, an administrative fee, distribution charges and other expenses. Other than their investment advisory fees and any applicable Rule 12b-1 distribution fees, all other components of the total fees charged by these other funds may be increased without shareholder approval. The Board believes the unified fee structure is a benefit to Fund shareholders because it clearly discloses to shareholders the cost of owning Fund shares, and, since the unified fee cannot be increased without a vote of Fund shareholders, it shifts to the Advisor the risk of increased costs of operating the Fund and provides a direct incentive to minimize administrative inefficiencies. Part of the Board’s analysis of fee levels involves reviewing certain evaluative data compiled by an independent provider and comparing the Fund’s unified fee to the total expense ratio of other funds in the Fund’s peer group. The Board concluded that the management fee paid by the Fund to the Advisor under the management agreement is reasonable in light of the services provided to the Fund.
Comparison to Fees and Services Provided to Other Clients of the Advisor. The Board also requested and received information from the Advisor concerning the nature of the services, fees, costs and profitability of its advisory services to advisory clients other than the Fund. They observed that these varying types of client accounts require different services and involve different regulatory and entrepreneurial risks than the management of the Fund. The Board analyzed this information and concluded that the fees charged and services provided to the Fund were reasonable by comparison.
Collateral or “Fall-Out” Benefits Derived by the Advisor. The Board considered the existence of collateral benefits the Advisor may receive as a result of its relationship with the Fund. They concluded that the Advisor’s primary business is managing mutual funds and it generally does not use fund or shareholder information to generate profits in other lines of business, and therefore does not derive any significant collateral benefits from them. The Board noted that the Advisor receives proprietary research from broker-dealers that execute fund portfolio transactions and concluded that this research is likely to benefit Fund shareholders. The Board also determined that the Advisor is able to provide investment management services to certain clients other than the Fund, at least in part, due to its existing infrastructure built to serve the fund complex. The Board concluded, however, that the assets of those other clients are not material to the analysis and, where applicable, may be included with the assets of the Fund to determine breakpoints in the management fee schedule.
Existing Relationship. The Board also considered whether there was any reason for not continuing the existing arrangement with the Advisor. In this regard, the Board was mindful of the potential disruptions of the Fund’s operations and various risks, uncertainties, and other effects that could occur as a result of a decision not to continue such relationship. In particular, the Board recognized that most shareholders have invested in the Fund on the strength of the Advisor’s industry standing and reputation and in the expectation that the Advisor will have a continuing role in providing advisory services to the Fund.
Conclusion of the Directors. As a result of this process, the Board, including all of the independent directors and assisted by the advice of independent legal counsel, taking into account all of the factors discussed above and the information provided by the Advisor and others, concluded that the management agreement between the Fund and the Advisor is fair and reasonable in light of the services provided and should be renewed.
Retirement Account Information
As required by law, distributions you receive from certain IRAs, or 403(b), 457 and qualified plans are subject to federal income tax withholding, unless you elect not to have withholding apply. Tax will be withheld on the total amount withdrawn even though you may be receiving amounts that are not subject to withholding, such as nondeductible contributions. In such case, excess amounts of withholding could occur. You may adjust your withholding election so that a greater or lesser amount will be withheld.
If you don’t want us to withhold on this amount, you must notify us to not withhold the federal income tax. You may notify us in writing or in certain situations by telephone or through other electronic means. You have the right to revoke your withholding election at any time and any election you make may remain in effect until revoked by filing a new election.
Remember, even if you elect not to have income tax withheld, you are liable for paying income tax on the taxable portion of your withdrawal. If you elect not to have income tax withheld or you don’t have enough income tax withheld, you may be responsible for payment of estimated tax. You may incur penalties under the estimated tax rules if your withholding and estimated tax payments are not sufficient. You can reduce or defer the income tax on a distribution by directly or indirectly rolling such distribution over to another IRA or eligible plan. You should consult your tax advisor for additional information.
State tax will be withheld if, at the time of your distribution, your address is within one of the mandatory withholding states and you have federal income tax withheld. State taxes will be withheld from your distribution in accordance with the respective state rules.
Proxy Voting Guidelines
American Century Investment Management, Inc., the fund’s investment advisor, is responsible for exercising the voting rights associated with the securities purchased and/or held by the fund. A description of the policies and procedures the advisor uses in fulfilling this responsibility is available without charge, upon request, by calling 1-800-345-2021. It is also available on American Century Investments’ website at americancentury.com and on the Securities and Exchange Commission’s website at sec.gov. Information regarding how the investment advisor voted proxies relating to portfolio securities during the most recent 12-month period ended June 30 is available on the “About Us” page at americancentury.com. It is also available at sec.gov.
Quarterly Portfolio Disclosure
The fund files its complete schedule of portfolio holdings with the Securities and Exchange Commission (SEC) for the first and third quarters of each fiscal year on Form N-Q. The fund’s Forms N-Q are available on the SEC’s website at sec.gov, and may be reviewed and copied at the SEC’s Public Reference Room in Washington, DC. Information on the operation of the Public Reference Room may be obtained by calling 1-800-SEC-0330. The fund also makes its complete schedule of portfolio holdings for the most recent quarter of its fiscal year available on its website at americancentury.com and, upon request, by calling 1-800-345-2021.
Other Tax Information
The following information is provided pursuant to provisions of the Internal Revenue Code.
The fund hereby designates up to the maximum amount allowable as qualified dividend income for the fiscal year ended June 30, 2011.
For corporate taxpayers, the fund hereby designates $22,025,512, or up to the maximum amount allowable, of ordinary income distributions paid during the fiscal year ended June 30, 2011 as qualified for the corporate dividends received deduction.
| Contact Us | americancentury.com |
| Automated Information Line | 1-800-345-8765 |
| Investor Services Representative | 1-800-345-2021 or 816-531-5575 |
| Investors Using Advisors | 1-800-378-9878 |
| Business, Not-For-Profit, Employer-Sponsored Retirement Plans | 1-800-345-3533 |
| Banks and Trust Companies, Broker-Dealers, Financial Professionals, Insurance Companies | 1-800-345-6488 |
| Telecommunications Device for the Deaf | 1-800-634-4113 |
American Century Quantitative Equity Funds, Inc.
Investment Advisor:
American Century Investment Management, Inc.
Kansas City, Missouri
This report and the statements it contains are submitted for the general information of our shareholders. The report is not authorized for distribution to prospective investors unless preceded or accompanied by an effective prospectus.
©2011 American Century Proprietary Holdings, Inc. All rights reserved.
CL-ANN-72457 1108
ANNUAL REPORT JUNE 30, 2011
| | Equity Market Neutral Fund |
| President’s Letter | 2 |
| Market Perspective | 3 |
| Performance | 4 |
| Portfolio Commentary | 6 |
| Fund Characteristics | 8 |
| Shareholder Fee Example | 9 |
| Schedule of Investments | 11 |
| Statement of Assets and Liabilities | 20 |
| Statement of Operations | 21 |
| Statement of Changes in Net Assets | 22 |
| Notes to Financial Statements | 23 |
| Financial Highlights | 29 |
| Report of Independent Registered Public Accounting Firm | 35 |
| Management | 36 |
| Approval of Management Agreement | 39 |
| Additional Information | 44 |
Any opinions expressed in this report reflect those of the author as of the date of the report, and do not necessarily represent the opinions of American Century Investments® or any other person in the American Century Investments organization. Any such opinions are subject to change at any time based upon market or other conditions and American Century Investments disclaims any responsibility to update such opinions. These opinions may not be relied upon as investment advice and, because investment decisions made by American Century Investments funds are based on numerous factors, may not be relied upon as an indication of trading intent on behalf of any American Century Investments fund. Security examples are used for representational purposes only and are not intended as recommendations to purchase or sell securities. Performance information for comparative indices and securities is provided to American Century Investments by third party vendors. To the best of American Century Investments’ knowledge, such information is accurate at the time of printing.
Dear Investor:
Thank you for reviewing this annual report for the period ended June 30, 2011. Our report offers investment performance and portfolio information, presented with the expert perspective and commentary of our portfolio management team.
This report remains one of our most important vehicles for conveying information about investment performance and the market factors and strategies that affect fund returns. For additional, updated information on fund performance, portfolio strategy, and the investment markets, we encourage you to visit our website, americancentury.com. Click on the “Fund Performance” and “Insights & News” headings at the top of our Individual Investors site.
Reporting Period Perspective: Highest Broad Fiscal-Year U.S. Stock Returns Since 1997
Benefitting from favorable conditions and expectations, the U.S. stock market produced exceptional returns, the highest for any 12-month period ended June 30 since the fiscal year ended June 30, 1997. Back then, the S&P 500 Index gained 34.71%, compared with 30.69% for the most-recent reporting period. The intervening 14 years help illustrate how infrequently such a high level of performance occurs, requiring an alignment of economic and market conditions that’s difficult to duplicate.
The exceptional returns experienced during the reporting period represent a rebound from previous declines. After experiencing 10–12% declines during the second quarter of 2010—stemming from the European sovereign debt crisis and double-dip recession fears—most broad U.S. stock indices advanced 30% or more during the following 12 months. Monetary and fiscal intervention in 2010 stimulated growth and fueled investor optimism about economic and financial market conditions in 2011 and 2012, encouraging investments in riskier assets.
However, that optimism has diminished in the summer of 2011 as the European debt crisis returned to prominence and other debt and economic challenges emerged. As the reporting period came to a close in June 2011, we saw increasing signs that the U.S. economic recovery had lost momentum. As a result, economic growth forecasts were reduced, and broad U.S. stock indices trended downward beginning in May. As we enter the third quarter of 2011, investor concern over fiscal austerity measures in the U.S. and other developed economies raised fears of a return to recession and accelerated a decline in global equity markets. We appreciate your continued trust in us during these uncertain times.
Sincerely,
Jonathan Thomas
President and Chief Executive Officer
American Century Investments
By Scott Wittman, Chief Investment Officer, Quantitative Equity and Asset Allocation
U.S. Stocks Soared as Economy Improved
The U.S. stock market enjoyed very strong results for the 12 months ended June 30, 2011, with the broad equity indices returning more than 30%. The main catalyst for the sharp rally in stocks was growing investor confidence in a U.S. economic recovery, though that confidence faltered somewhat late in the period.
After a bumpy start resulting from an uncertain economic outlook, the equity market began a steady rise in September 2010 as improving economic data reassured investors that the economy would avoid a “double-dip” recession (a return to recession after a brief period of recovery). Most notably, employment growth turned positive after 2½ years of persistent job losses, and the manufacturing sector showed signs of life. In addition, a renewal of the Federal Reserve’s quantitative easing program and an extension of expiring federal tax breaks further boosted the market’s confidence that a promising economic recovery was under way.
Stocks continued to advance in early 2011 despite unrest in the Middle East and North Africa, as well as a devastating earthquake and tsunami in Japan. By May, however, evidence of a slowdown in economic activity and renewed concerns about a European sovereign debt crisis weighed on investor confidence. As a result, stocks experienced a modest pullback in the final two months of the period.
Smaller Stocks and Growth-Oriented Issues Outperformed
Despite finishing on a down note, the broad equity indices posted robust returns overall for the 12-month period. As the table below illustrates, mid- and small-cap issues generated the best returns, outpacing large-cap shares. Meanwhile, growth stocks outperformed value across all market capitalizations, most dramatically among smaller companies. Every sector of the market produced double-digit gains for the period, led by energy and materials stocks, which benefited from strong demand and rising commodity prices. Other economically sensitive sectors—such as consumer discretionary and industrials—also fared well. The laggard was the financials sector, which continued to face mortgage-related challenges and regulatory uncertainty.
| U.S. Stock Index Returns |
| For the 12 months ended June 30, 2011 |
| Russell 1000 Index (Large-Cap) | 31.93% | | Russell 2000 Index (Small-Cap) | 37.41% |
| Russell 1000 Growth Index | 35.01% | | Russell 2000 Growth Index | 43.50% |
| Russell 1000 Value Index | 28.94% | | Russell 2000 Value Index | 31.35% |
| Russell Midcap Index | 38.47% | | |
| Russell Midcap Growth Index | 43.25% | | | |
| Russell Midcap Value Index | 34.28% | | | |
| Total Returns as of June 30, 2011 |
| | | | Average Annual Returns | |
| | Ticker Symbol | 1 year | 5 years | Since Inception | Inception Date |
| Investor Class | ALHIX | 3.70% | -0.69% | 1.12% | 9/30/05 |
Barclays Capital U.S. 1-3 Month Treasury Bill Index | — | 0.14% | 1.87% | 2.17% | — |
| Institutional Class | ALISX | 3.87% | -0.48% | 1.32% | 9/30/05 |
A Class No sales charge* With sales charge* | ALIAX | 3.42% -2.56% | -0.91% -2.07% | 0.89% -0.15% | 9/30/05 |
B Class No sales charge* With sales charge* | ALIBX | 2.59% -1.41% | -1.67% -1.88% | 0.11% -0.06% | 9/30/05 |
| C Class | ALICX | 2.69% | -1.67% | 0.11% | 9/30/05 |
| R Class | ALIRX | 3.15% | -1.17% | 0.62% | 9/30/05 |
*Sales charges include initial sales charges and contingent deferred sales charges (CDSCs), as applicable. A Class shares have a 5.75% maximum initial sales charge and may be subject to a maximum CDSC of 1.00%. B Class shares redeemed within six years of purchase are subject to a CDSC that declines from 5.00% during the first year after purchase to 0.00% the sixth year after purchase. C Class shares redeemed within 12 months of purchase are subject to a maximum CDSC of 1.00%. The SEC requires that mutual funds provide performance information net of maximum sales charges in all cases where charges could be applied.
Data presented reflect past performance. Past performance is no guarantee of future results. Current performance may be higher or lower than the performance shown. Investment return and principal value will fluctuate, and redemption value may be more or less than original cost. To obtain performance data current to the most recent month end, please call 1-800-345-2021 or visit americancentury.com. The fund’s investment process may result in high portfolio turnover, which could mean high transaction costs, affecting both performance and capital gains tax liabilities to investors. In addition, its investment approach may involve higher volatility, short sales risk and overweighting risk. International investing involves special risks, such as political instability and currency fluctuations.
Unless otherwise indicated, performance reflects Investor Class shares; performance for other share classes will vary due to differences in fee structure. For information about other share classes available, please consult the prospectus. Data assumes reinvestment of dividends and capital gains, and none of the charts reflect the deduction of taxes that a shareholder would pay on fund distributions or the redemption of fund shares. Returns for the index are provided for comparison. The fund’s total returns include operating expenses (such as transaction costs and management fees) that reduce returns, while the total returns of the index do not.
| Growth of $10,000 Over Life of Class |
| $10,000 investment made September 30, 2005 |
*From 9/30/05, the Investor Class’s inception date. Not annualized.
| Total Annual Fund Operating Expenses |
| Investor Class | Institutional Class | A Class | B Class | C Class | R Class |
| 3.09% | 2.89% | 3.34% | 4.09% | 4.09% | 3.59% |
The total annual fund operating expenses shown is as stated in the fund’s prospectus current as of the date of this report. The prospectus may vary from the expense ratio shown elsewhere in this report because it is based on a different time period, includes acquired fund fees and expenses, and, if applicable, does not include fee waivers or expense reimbursements.
Data presented reflect past performance. Past performance is no guarantee of future results. Current performance may be higher or lower than the performance shown. Investment return and principal value will fluctuate, and redemption value may be more or less than original cost. To obtain performance data current to the most recent month end, please call 1-800-345-2021 or visit americancentury.com. The fund’s investment process may result in high portfolio turnover, which could mean high transaction costs, affecting both performance and capital gains tax liabilities to investors. In addition, its investment approach may involve higher volatility, short sales risk and overweighting risk. International investing involves special risks, such as political instability and currency fluctuations.
Unless otherwise indicated, performance reflects Investor Class shares; performance for other share classes will vary due to differences in fee structure. For information about other share classes available, please consult the prospectus. Data assumes reinvestment of dividends and capital gains, and none of the charts reflect the deduction of taxes that a shareholder would pay on fund distributions or the redemption of fund shares. Returns for the index are provided for comparison. The fund’s total returns include operating expenses (such as transaction costs and management fees) that reduce returns, while the total returns of the index do not.
Portfolio Managers: Brian Garbe and Claudia Musat
Performance Summary
Equity Market Neutral returned 3.70%* for the fiscal year ended June 30, 2011, compared with the 0.14% return of its benchmark, the Barclays Capital U.S.
1–3 Month Treasury Bill Index.
Equity Market Neutral is designed to generate positive returns in all market environments, regardless of general stock market performance, so the fund uses a cash—equivalent investment—a short-term Treasury bill index—as its benchmark. Amid a robust stock market rally (see page 3 for details), the fund posted a positive return and outperformed its benchmark for the 12 months. The outperformance was driven primarily by the fund’s long positions, which more than offset the decline in the fund’s short positions.
Long Positions Outperformed
The long portion of the Equity Market Neutral portfolio gained more than 40% in aggregate for the 12-month period. One factor contributing to this strong performance was holding overweight positions in materials and consumer discretionary stocks, which were among the best-performing segments in the stock market for the reporting period. The leading contributors in these two sectors included metals producer Hecla Mining, auto parts maker TRW Automotive, and footwear maker Timberland. A sharp rise in commodity prices drove the rally in Hecla Mining’s stock price; TRW continued to benefit from a recovery in the auto industry; and Timberland agreed to an acquisition offer from apparel maker VF Corporation.
Stock selection on the long side was most successful in the information technology sector. The top contributors included electronic components maker Vishay Intertechnology and digital network operator DG FastChannel, which links advertisers and broadcasters. Vishay benefited from healthy sales volumes, lower costs, and a favorable pricing environment, while DG FastChannel reported earnings far above expectations as consumer demand for high-definition content increased.
The top three individual contributors among the fund’s long positions came from the energy sector. Offshore drilling company W&T Offshore, oil and gas producer Stone Energy, and energy equipment and services provider Complete Production Services all benefited from higher energy prices, growing demand, and increased drilling activity.
On the downside, the fund’s consumer staples and financials holdings detracted from results in the long portion of the portfolio. Grocery store chain SUPERVALU stumbled as declining sales and lower profit margins weighed on the stock. Regional bank Flagstar Bancorp continued to report lending-related losses and sold assets to raise capital. Other notable individual detractors on the long side included gold miner Golden Star Resources, which reported a string of losses amid production declines, and for-profit education firm Corinthian Colleges, which struggled with regulatory uncertainty surrounding federal student lending.
*All fund returns referenced in this commentary are for Investor Class shares.
Short Positions Declined
Reflecting the broad stock market rally, Equity Market Neutral’s short positions—which are designed to profit when a stock’s price declines—posted negative returns for the 12-month period. By far, the fund’s short positions in the materials sector had the biggest negative impact on performance. The most notable underperformers included short positions in specialty chemicals producer Valhi and its subsidiary, NL Industries. Both stocks soared as the improving economic environment boosted demand for their products, and Valhi also won a new contract for its hazardous waste removal unit.
Other meaningful detractors from performance among the fund’s short positions included coffee maker Green Mountain Coffee Roasters and energy exploration and production company SandRidge Energy. Green Mountain enjoyed a substantial increase in demand and successfully implemented price increases, while SandRidge made several beneficial acquisitions to boost the company’s
oil production.
On the positive side, the portfolio’s short positions were most successful in the telecommunication services and consumer discretionary sectors. In particular, the fund’s short positions in the telecom services sector delivered a double-digit gain for the 12-month period, due largely to one key holding—mobile broadband network provider Clearwire. Clearwire reported a steady stream of operating losses and an increasingly troubled balance sheet.
In the consumer discretionary sector, the top short positions included apparel retailer Coldwater Creek and consumer electronics retailer HHGregg. Coldwater Creek reported a series of losses as profit margins continued to erode, while HHGregg faced an increasingly challenging competitive environment that weighed on profitability.
A Look Ahead
The eye-catching turmoil in the headlines over the last six months—democratic change sweeping through the Middle East, a devastating natural disaster in Japan, the possibility of a sovereign debt default in Europe—has led to heightened uncertainty and growing volatility in the equity market. But when you look at the past decade, there have been many other dramatic events that have had a similar impact on the market. When viewed through this lens, change and volatility have become more the rule than the exception.
It is this change dynamic that our investment process seeks to exploit and capitalize upon, both in the long and short portions of the portfolio. Change and volatility leads to market inefficiencies, and within these inefficiencies lie investment opportunities. Rather than base investment decisions on vague financial headlines, we use our disciplined, data-driven, multi-factor investment process to take advantage of inefficiencies at the individual company level. We believe this approach will produce favorable returns over the long term.
| JUNE 30, 2011 | |
| Top Ten Long Holdings | % of net assets |
| W&T Offshore, Inc. | 0.78% |
| GT Solar International, Inc. | 0.76% |
| Polaris Industries, Inc. | 0.75% |
| Accenture plc, Class A | 0.74% |
| UGI Corp. | 0.72% |
| Herbalife Ltd. | 0.70% |
| Cash America International, Inc. | 0.70% |
| Dillard’s, Inc., Class A | 0.69% |
| Cheesecake Factory, Inc. (The) | 0.69% |
| Equity LifeStyle Properties, Inc. | 0.69% |
| | |
| Top Ten Short Holdings | % of net assets |
| Green Mountain Coffee Roasters, Inc. | (0.77)% |
| Pegasystems, Inc. | (0.75)% |
| SLM Corp. | (0.73)% |
| Salix Pharmaceuticals Ltd. | (0.69)% |
| Tesla Motors, Inc. | (0.68)% |
| Temple-Inland, Inc. | (0.67)% |
| AK Steel Holding Corp. | (0.67)% |
| Cavium, Inc. | (0.66)% |
| Valhi, Inc. | (0.65)% |
| Volcano Corp. | (0.65)% |
| | |
| Types of Investments in Portfolio | % of net assets |
| Common Stocks | 99.1% |
| Securities Sold Short | (99.2)% |
| Temporary Cash Investments | 0.2% |
Fund shareholders may incur two types of costs: (1) transaction costs, including sales charges (loads) on purchase payments and redemption/exchange fees; and (2) ongoing costs, including management fees; distribution and service (12b-1) fees; and other fund expenses. This example is intended to help you understand your ongoing costs (in dollars) of investing in your fund and to compare these costs with the ongoing cost of investing in other mutual funds.
The example is based on an investment of $1,000 made at the beginning of the period and held for the entire period from January 1, 2011 to June 30, 2011.
Actual Expenses
The table provides information about actual account values and actual expenses for each class. You may use the information, together with the amount you invested, to estimate the expenses that you paid over the period. First, identify the share class you own. Then simply divide your account value by $1,000 (for example, an $8,600 account value divided by $1,000 = 8.6), then multiply the result by the number under the heading “Expenses Paid During Period” to estimate the expenses you paid on your account during this period.
If you hold Investor Class shares of any American Century Investments fund, or Institutional Class shares of the American Century Diversified Bond Fund, in an American Century Investments account (i.e., not a financial intermediary or retirement plan account), American Century Investments may charge you a $12.50 semiannual account maintenance fee if the value of those shares is less than $10,000. We will redeem shares automatically in one of your accounts to pay the $12.50 fee. In determining your total eligible investment amount, we will include your investments in all personal accounts (including American Century Investments Brokerage accounts) registered under your Social Security number. Personal accounts include individual accounts, joint accounts, UGMA/UTMA accounts, personal trusts, Coverdell Education Savings Accounts and IRAs (including traditional, Roth, Rollover, SEP-, SARSEP- and SIMPLE-IRAs), and certain other retirement accounts. If you have only business, business retirement, employer-sponsored or American Century Investments Brokerage accounts, you are currently not subject to this fee. We will not charge the fee as long as you choose to manage your accounts exclusively online. If you are subject to the Account Maintenance Fee, your account value could be reduced by the fee amount.
Hypothetical Example for Comparison Purposes
The table also provides information about hypothetical account values and hypothetical expenses based on the actual expense ratio of each class of your fund and an assumed rate of return of 5% per year before expenses, which is not the actual return of a fund’s share class. The hypothetical account values and expenses may not be used to estimate the actual ending account balance or expenses you paid for the period. You may use this information to compare the ongoing costs of investing in your fund and other funds. To do so, compare this 5% hypothetical example with the 5% hypothetical examples that appear in the shareholder reports of the other funds.
Please note that the expenses shown in the table are meant to highlight your ongoing costs only and do not reflect any transactional costs, such as sales charges (loads) or redemption/exchange fees. Therefore, the table is useful in comparing ongoing costs only, and will not help you determine the relative total costs of owning different funds. In addition, if these transactional costs were included, your costs would have been higher.
| | Beginning Account Value 1/1/11 | Ending Account Value 6/30/11 | Expenses Paid During Period* 1/1/11 – 6/30/11 | Annualized Expense Ratio* |
| Actual | | | | |
| Investor Class | $1,000 | $1,031.80 | $14.26 | 2.83% |
| Institutional Class | $1,000 | $1,033.60 | $13.26 | 2.63% |
| A Class | $1,000 | $1,031.10 | $15.51 | 3.08% |
| B Class | $1,000 | $1,026.90 | $19.25 | 3.83% |
| C Class | $1,000 | $1,026.90 | $19.25 | 3.83% |
| R Class | $1,000 | $1,029.40 | $16.76 | 3.33% |
| Hypothetical | | | | |
| Investor Class | $1,000 | $1,010.76 | $14.11 | 2.83% |
| Institutional Class | $1,000 | $1,011.75 | $13.12 | 2.63% |
| A Class | $1,000 | $1,009.52 | $15.35 | 3.08% |
| B Class | $1,000 | $1,005.80 | $19.05 | 3.83% |
| C Class | $1,000 | $1,005.80 | $19.05 | 3.83% |
| R Class | $1,000 | $1,008.28 | $16.58 | 3.33% |
*Expenses are equal to the class’s annualized expense ratio listed in the table above, multiplied by the average account value over the period, multiplied by 181, the number of days in the most recent fiscal half-year, divided by 365, to reflect the one-half year period.
| | | Shares | | | Value | |
Common Stocks(1) — 99.1% | |
| AEROSPACE & DEFENSE — 0.1% | |
| General Dynamics Corp. | | | 556 | | | | $41,433 | |
| AIR FREIGHT & LOGISTICS — 0.6% | |
Atlas Air Worldwide Holdings, Inc.(2) | | | 6,735 | | | | 400,800 | |
| AIRLINES — 0.2% | |
US Airways Group, Inc.(2) | | | 11,082 | | | | 98,741 | |
| AUTO COMPONENTS — 1.6% | |
American Axle & Manufacturing Holdings, Inc.(2) | | | 31,730 | | | | 361,088 | |
Dana Holding Corp.(2) | | | 4,927 | | | | 90,164 | |
Federal-Mogul Corp.(2) | | | 6,299 | | | | 143,806 | |
| Lear Corp. | | | 1,038 | | | | 55,512 | |
TRW Automotive Holdings Corp.(2) | | | 6,070 | | | | 358,312 | |
| | | | | | | | 1,008,882 | |
| AUTOMOBILES — 0.6% | |
Ford Motor Co.(2) | | | 25,623 | | | | 353,341 | |
| BEVERAGES — 1.7% | |
Boston Beer Co., Inc., Class A(2) | | | 3,762 | | | | 337,075 | |
Constellation Brands, Inc., Class A(2) | | | 14,045 | | | | 292,417 | |
| Dr Pepper Snapple Group, Inc. | | | 10,267 | | | | 430,495 | |
| | | | | | | | 1,059,987 | |
| BIOTECHNOLOGY — 1.3% | |
Amgen, Inc.(2) | | | 2,676 | | | | 156,144 | |
Biogen Idec, Inc.(2) | | | 1,530 | | | | 163,587 | |
Cubist Pharmaceuticals, Inc.(2) | | | 4,304 | | | | 154,901 | |
Emergent Biosolutions, Inc.(2) | | | 6,772 | | | | 152,709 | |
Myriad Genetics, Inc.(2) | | | 6,408 | | | | 145,526 | |
United Therapeutics Corp.(2) | | | 1,540 | | | | 84,854 | |
| | | | | | | | 857,721 | |
| CAPITAL MARKETS — 2.2% | |
| Bank of New York Mellon Corp. (The) | | | 6,099 | | | | 156,256 | |
Investment Technology Group, Inc.(2) | | | 23,809 | | | | 333,802 | |
| Janus Capital Group, Inc. | | | 25,717 | | | | 242,769 | |
| Legg Mason, Inc. | | | 9,800 | | | | 321,048 | |
| optionsXpress Holdings, Inc. | | | 23,129 | | | | 385,793 | |
| | | | | | | | 1,439,668 | |
| CHEMICALS — 3.9% | |
| Eastman Chemical Co. | | | 2,598 | | | | 265,178 | |
Ferro Corp.(2) | | | 25,351 | | | | 340,717 | |
Georgia Gulf Corp.(2) | | | 13,884 | | | | 335,160 | |
| Minerals Technologies, Inc. | | | 5,453 | | | | 361,479 | |
OM Group, Inc.(2) | | | 6,593 | | | | 267,940 | |
| PPG Industries, Inc. | | | 4,409 | | | | 400,293 | |
W.R. Grace & Co.(2) | | | 9,578 | | | | 437,044 | |
| Westlake Chemical Corp. | | | 1,505 | | | | 78,110 | |
| | | | | | | | 2,485,921 | |
| COMMERCIAL BANKS — 1.0% | |
| CapitalSource, Inc. | | | 35,228 | | | | 227,221 | |
| East West Bancorp., Inc. | | | 14,680 | | | | 296,682 | |
| PacWest Bancorp. | | | 5,270 | | | | 108,404 | |
| | | | | | | | 632,307 | |
| COMMERCIAL SERVICES & SUPPLIES — 0.5% | |
M&F Worldwide Corp.(2) | | | 11,505 | | | | 297,289 | |
| COMMUNICATIONS EQUIPMENT — 1.5% | |
Arris Group, Inc.(2) | | | 14,184 | | | | 164,676 | |
Brocade Communications Systems, Inc.(2) | | | 39,364 | | | | 254,291 | |
DG FastChannel, Inc.(2) | | | 12,150 | | | | 389,409 | |
| Plantronics, Inc. | | | 761 | | | | 27,799 | |
Research In Motion Ltd.(2) | | | 878 | | | | 25,330 | |
| Tellabs, Inc. | | | 18,828 | | | | 86,797 | |
| | | | | | | | 948,302 | |
| COMPUTERS & PERIPHERALS — 0.5% | |
Dell, Inc.(2) | | | 20,414 | | | | 340,301 | |
| CONSTRUCTION & ENGINEERING — 2.5% | |
| Chicago Bridge & Iron Co. NV New York Shares | | | 9,274 | | | | 360,759 | |
| Fluor Corp. | | | 2,103 | | | | 135,980 | |
| KBR, Inc. | | | 11,237 | | | | 423,522 | |
MasTec, Inc.(2) | | | 16,881 | | | | 332,893 | |
URS Corp.(2) | | | 7,717 | | | | 345,259 | |
| | | | | | | | 1,598,413 | |
| CONSUMER FINANCE — 0.8% | |
| Cash America International, Inc. | | | 7,700 | | | | 445,599 | |
Credit Acceptance Corp.(2) | | | 1,071 | | | | 90,467 | |
| | | | | | | | 536,066 | |
| CONTAINERS & PACKAGING — 1.3% | |
Crown Holdings, Inc.(2) | | | 3,071 | | | | 119,216 | |
Graphic Packaging Holding Co.(2) | | | 65,455 | | | | 356,076 | |
| Sealed Air Corp. | | | 14,480 | | | | 344,479 | |
| | | | | | | | 819,771 | |
| | |
| | | | Shares | | | | Value | |
| DIVERSIFIED CONSUMER SERVICES — 2.1% | | | | | | | | |
Apollo Group, Inc., Class A(2) | | | 6,702 | | | | $292,743 | |
Bridgepoint Education, Inc.(2) | | | 14,197 | | | | 354,926 | |
Career Education Corp.(2) | | | 1,146 | | | | 24,238 | |
ITT Educational Services, Inc.(2) | | | 4,447 | | | | 347,933 | |
| Weight Watchers International, Inc. | | | 4,526 | | | | 341,577 | |
| | | | | | | | 1,361,417 | |
| DIVERSIFIED FINANCIAL SERVICES — 1.7% | |
| Interactive Brokers Group, Inc., Class A | | | 20,778 | | | | 325,176 | |
| McGraw-Hill Cos., Inc. (The) | | | 1,181 | | | | 49,496 | |
| Moody’s Corp. | | | 8,538 | | | | 327,432 | |
NASDAQ OMX Group, Inc. (The)(2) | | | 14,130 | | | | 357,489 | |
| | | | | | | | 1,059,593 | |
| ELECTRIC UTILITIES — 0.1% | |
| Entergy Corp. | | | 996 | | | | 68,007 | |
| ELECTRICAL EQUIPMENT — 0.4% | |
Thomas & Betts Corp.(2) | | | 4,863 | | | | 261,873 | |
| ELECTRONIC EQUIPMENT, INSTRUMENTS & COMPONENTS — 2.5% | |
| Anixter International, Inc. | | | 4,233 | | | | 276,584 | |
Coherent, Inc.(2) | | | 5,605 | | | | 309,788 | |
| Littelfuse, Inc. | | | 5,517 | | | | 323,958 | |
Power-One, Inc.(2) | | | 40,879 | | | | 331,120 | |
Vishay Intertechnology, Inc.(2) | | | 23,309 | | | | 350,568 | |
| | | | | | | | 1,592,018 | |
| ENERGY EQUIPMENT & SERVICES — 2.9% | |
Complete Production Services, Inc.(2) | | | 946 | | | | 31,559 | |
| Core Laboratories NV | | | 3,317 | | | | 369,978 | |
Exterran Holdings, Inc.(2) | | | 8,062 | | | | 159,869 | |
Helix Energy Solutions Group, Inc.(2) | | | 21,674 | | | | 358,921 | |
ION Geophysical Corp.(2) | | | 3,235 | | | | 30,603 | |
| Oceaneering International, Inc. | | | 5,246 | | | | 212,463 | |
| SEACOR Holdings, Inc. | | | 3,546 | | | | 354,458 | |
Tetra Technologies, Inc.(2) | | | 29,128 | | | | 370,800 | |
| | | | | | | | 1,888,651 | |
| FOOD & STAPLES RETAILING — 0.6% | |
| SUPERVALU, INC. | | | 37,159 | | | | 349,666 | |
| Walgreen Co. | | | 575 | | | | 24,415 | |
| | | | | | | | 374,081 | |
| FOOD PRODUCTS — 2.3% | |
| Fresh Del Monte Produce, Inc. | | | 12,214 | | | | 325,747 | |
| Hershey Co. (The) | | | 6,789 | | | | 385,956 | |
| Hormel Foods Corp. | | | 1,827 | | | | 54,463 | |
Smithfield Foods, Inc.(2) | | | 15,783 | | | | 345,174 | |
| Tyson Foods, Inc., Class A | | | 18,282 | | | | 355,036 | |
| | | | | | | | 1,466,376 | |
| GAS UTILITIES — 0.8% | |
| Southwest Gas Corp. | | | 1,405 | | | | 54,247 | |
| UGI Corp. | | | 14,373 | | | | 458,355 | |
| | | | | | | | 512,602 | |
| HEALTH CARE EQUIPMENT & SUPPLIES — 3.1% | |
Align Technology, Inc.(2) | | | 14,545 | | | | 331,626 | |
| Cooper Cos., Inc. (The) | | | 4,887 | | | | 387,246 | |
| Hill-Rom Holdings, Inc. | | | 7,203 | | | | 331,626 | |
Hologic, Inc.(2) | | | 16,095 | | | | 324,636 | |
Immucor, Inc.(2) | | | 4,122 | | | | 84,171 | |
Kinetic Concepts, Inc.(2) | | | 5,812 | | | | 334,946 | |
Sirona Dental Systems, Inc.(2) | | | 4,200 | | | | 223,020 | |
| | | | | | | | 2,017,271 | |
| HEALTH CARE PROVIDERS & SERVICES — 3.4% | |
| Humana, Inc. | | | 5,183 | | | | 417,439 | |
Kindred Healthcare, Inc.(2) | | | 12,253 | | | | 263,072 | |
Magellan Health Services, Inc.(2) | | | 6,601 | | | | 361,339 | |
Molina Healthcare, Inc.(2) | | | 12,585 | | | | 341,305 | |
Team Health Holdings, Inc.(2) | | | 19,205 | | | | 432,304 | |
WellCare Health Plans, Inc.(2) | | | 6,699 | | | | 344,396 | |
| | | | | | | | 2,159,855 | |
| HOTELS, RESTAURANTS & LEISURE — 2.8% | |
| Ameristar Casinos, Inc. | | | 14,863 | | | | 352,402 | |
| Bob Evans Farms, Inc. | | | 6,815 | | | | 238,321 | |
Cheesecake Factory, Inc. (The)(2) | | | 14,046 | | | | 440,622 | |
| International Game Technology | | | 11,176 | | | | 196,474 | |
Penn National Gaming, Inc.(2) | | | 675 | | | | 27,230 | |
| PF Chang’s China Bistro, Inc. | | | 7,236 | | | | 291,177 | |
| Wyndham Worldwide Corp. | | | 7,805 | | | | 262,638 | |
| | | | | | | | 1,808,864 | |
| HOUSEHOLD DURABLES — 1.5% | |
| D.R. Horton, Inc. | | | 26,568 | | | | 306,063 | |
| Garmin Ltd. | | | 9,936 | | | | 328,187 | |
| Harman International Industries, Inc. | | | 6,658 | | | | 303,405 | |
| | | | | | | | 937,655 | |
| INDEPENDENT POWER PRODUCERS & ENERGY TRADERS — 1.2% | |
AES Corp. (The)(2) | | | 26,534 | | | | $338,043 | |
NRG Energy, Inc.(2) | | | 17,446 | | | | 428,823 | |
| | | | | | | | 766,866 | |
| INSURANCE — 4.5% | |
| Allied World Assurance Co. Holdings Ltd. | | | 5,528 | | | | 318,302 | |
| American Financial Group, Inc. | | | 10,647 | | | | 379,991 | |
| Aspen Insurance Holdings Ltd. | | | 11,134 | | | | 286,478 | |
| Axis Capital Holdings Ltd. | | | 1,844 | | | | 57,090 | |
| Endurance Specialty Holdings Ltd. | | | 7,839 | | | | 323,986 | |
| Erie Indemnity Co., Class A | | | 1,007 | | | | 71,215 | |
| Horace Mann Educators Corp. | | | 19,534 | | | | 304,926 | |
| Montpelier Re Holdings Ltd. | | | 23,680 | | | | 426,239 | |
| Principal Financial Group, Inc. | | | 10,935 | | | | 332,643 | |
| Prudential Financial, Inc. | | | 6,171 | | | | 392,414 | |
| | | | | | | | 2,893,284 | |
| INTERNET SOFTWARE & SERVICES — 2.4% | |
Ancestry.com, Inc.(2) | | | 8,926 | | | | 369,447 | |
AOL, Inc.(2) | | | 16,909 | | | | 335,813 | |
IAC/InterActiveCorp(2) | | | 5,726 | | | | 218,561 | |
| United Online, Inc. | | | 53,853 | | | | 324,734 | |
ValueClick, Inc.(2) | | | 17,049 | | | | 283,013 | |
| | | | | | | | 1,531,568 | |
| IT SERVICES — 3.0% | |
| Accenture plc, Class A | | | 7,849 | | | | 474,236 | |
Alliance Data Systems Corp.(2) | | | 3,647 | | | | 343,073 | |
Convergys Corp.(2) | | | 28,429 | | | | 387,772 | |
| Global Payments, Inc. | | | 1,254 | | | | 63,954 | |
MoneyGram International, Inc.(2) | | | 99,822 | | | | 331,409 | |
TeleTech Holdings, Inc.(2) | | | 15,037 | | | | 316,980 | |
| Visa, Inc., Class A | | | 265 | | | | 22,329 | |
| | | | | | | | 1,939,753 | |
| LEISURE EQUIPMENT & PRODUCTS — 0.8% | |
| Polaris Industries, Inc. | | | 4,328 | | | | 481,144 | |
LIFE SCIENCES TOOLS & SERVICES(3) | |
Agilent Technologies, Inc.(2) | | | 393 | | | | 20,086 | |
| MACHINERY — 2.0% | |
AGCO Corp.(2) | | | 6,326 | | | | 312,251 | |
| Briggs & Stratton Corp. | | | 13,393 | | | | 265,985 | |
| Gardner Denver, Inc. | | | 3,966 | | | | 333,342 | |
Sauer-Danfoss, Inc.(2) | | | 7,751 | | | | 390,574 | |
| | | | | | | | 1,302,152 | |
| MEDIA — 2.6% | |
| CBS Corp., Class B | | | 13,950 | | | | 397,435 | |
DISH Network Corp., Class A(2) | | | 8,216 | | | | 251,985 | |
| Gannett Co., Inc. | | | 16,758 | | | | 239,975 | |
| Interpublic Group of Cos., Inc. (The) | | | 28,893 | | | | 361,162 | |
Sirius XM Radio, Inc.(2) | | | 28,927 | | | | 63,350 | |
| Time Warner, Inc. | | | 9,210 | | | | 334,968 | |
| | | | | | | | 1,648,875 | |
| METALS & MINING — 4.1% | |
| Alcoa, Inc. | | | 2,769 | | | | 43,916 | |
Century Aluminum Co.(2) | | | 17,867 | | | | 279,619 | |
| Cliffs Natural Resources, Inc. | | | 3,392 | | | | 313,590 | |
| Freeport-McMoRan Copper & Gold, Inc. | | | 6,916 | | | | 365,856 | |
Golden Star Resources Ltd. New York Shares(2) | | | 18,317 | | | | 40,297 | |
Hecla Mining Co.(2) | | | 49,681 | | | | 382,047 | |
| Newmont Mining Corp. | | | 6,143 | | | | 331,538 | |
Noranda Aluminum Holding Corp.(2) | | | 23,505 | | | | 355,866 | |
| Pan American Silver Corp. | | | 11,500 | | | | 355,235 | |
| Walter Energy, Inc. | | | 1,146 | | | | 132,707 | |
| | | | | | | | 2,600,671 | |
| MULTILINE RETAIL — 1.0% | |
| Dillard’s, Inc., Class A | | | 8,455 | | | | 440,844 | |
| Macy’s, Inc. | | | 6,604 | | | | 193,101 | |
| | | | | | | | 633,945 | |
| MULTI-UTILITIES — 0.3% | |
| DTE Energy Co. | | | 3,172 | | | | 158,663 | |
| Integrys Energy Group, Inc. | | | 1,084 | | | | 56,195 | |
| | | | | | | | 214,858 | |
| OIL, GAS & CONSUMABLE FUELS — 7.6% | |
| Anadarko Petroleum Corp. | | | 4,530 | | | | 347,723 | |
| Arch Coal, Inc. | | | 8,172 | | | | 217,866 | |
Bill Barrett Corp.(2) | | | 9,141 | | | | 423,685 | |
| Canadian Natural Resources Ltd. | | | 4,308 | | | | 180,333 | |
| Chevron Corp. | | | 3,505 | | | | 360,454 | |
| Cimarex Energy Co. | | | 1,715 | | | | 154,213 | |
Cloud Peak Energy, Inc.(2) | | | 7,801 | | | | 166,161 | |
| ConocoPhillips | | | 5,110 | | | | 384,221 | |
CVR Energy, Inc.(2) | | | 13,463 | | | | 331,459 | |
Denbury Resources, Inc.(2) | | | 5,800 | | | | 116,000 | |
| Frontier Oil Corp. | | | 12,550 | | | | $405,491 | |
| Marathon Oil Corp. | | | 4,925 | | | | 259,449 | |
Stone Energy Corp.(2) | | | 11,183 | | | | 339,851 | |
Tesoro Corp.(2) | | | 13,415 | | | | 307,338 | |
| Valero Energy Corp. | | | 12,321 | | | | 315,048 | |
| W&T Offshore, Inc. | | | 19,067 | | | | 498,029 | |
| Williams Cos., Inc. (The) | | | 3,241 | | | | 98,040 | |
| | | | | | | | 4,905,361 | |
| PAPER & FOREST PRODUCTS — 0.7% | |
| Domtar Corp. | | | 3,784 | | | | 358,420 | |
| International Paper Co. | | | 2,924 | | | | 87,194 | |
| | | | | | | | 445,614 | |
| PERSONAL PRODUCTS — 1.4% | |
| Herbalife Ltd. | | | 7,829 | | | | 451,264 | |
| Nu Skin Enterprises, Inc., Class A | | | 11,368 | | | | 426,868 | |
| | | | | | | | 878,132 | |
| PHARMACEUTICALS — 1.9% | |
| Eli Lilly & Co. | | | 9,622 | | | | 361,114 | |
Impax Laboratories, Inc.(2) | | | 15,779 | | | | 343,824 | |
Jazz Pharmaceuticals, Inc.(2) | | | 1,771 | | | | 59,063 | |
Par Pharmaceutical Cos., Inc.(2) | | | 9,683 | | | | 319,345 | |
ViroPharma, Inc.(2) | | | 8,353 | | | | 154,531 | |
| | | | | | | | 1,237,877 | |
| PROFESSIONAL SERVICES — 0.9% | |
| Corporate Executive Board Co. (The) | | | 4,745 | | | | 207,119 | |
| Towers Watson & Co., Class A | | | 5,240 | | | | 344,321 | |
| | | | | | | | 551,440 | |
| REAL ESTATE INVESTMENT TRUSTS (REITs) — 2.3% | |
| CBL & Associates Properties, Inc. | | | 21,707 | | | | 393,548 | |
| Equity LifeStyle Properties, Inc. | | | 7,028 | | | | 438,827 | |
| Rayonier, Inc. | | | 5,150 | | | | 336,553 | |
Strategic Hotels & Resorts, Inc.(2) | | | 43,372 | | | | 307,074 | |
| | | | | | | | 1,476,002 | |
| REAL ESTATE MANAGEMENT & DEVELOPMENT — 0.7% | |
CB Richard Ellis Group, Inc., Class A(2) | | | 6,834 | | | | 171,602 | |
| Jones Lang LaSalle, Inc. | | | 3,075 | | | | 289,972 | |
| | | | | | | | 461,574 | |
| ROAD & RAIL — 1.0% | |
AMERCO, Inc.(2) | | | 2,999 | | | | 288,354 | |
Old Dominion Freight Line, Inc.(2) | | | 9,257 | | | | 345,286 | |
| | | | | | | | 633,640 | |
| SEMICONDUCTORS & SEMICONDUCTOR EQUIPMENT — 7.0% | |
Cypress Semiconductor Corp.(2) | | | 15,927 | | | | 336,697 | |
Entegris, Inc.(2) | | | 40,178 | | | | 406,601 | |
Fairchild Semiconductor International, Inc.(2) | | | 21,103 | | | | 352,631 | |
FEI Co.(2) | | | 10,322 | | | | 394,197 | |
GT Solar International, Inc.(2) | | | 30,035 | | | | 486,567 | |
Integrated Device Technology, Inc.(2) | | | 50,461 | | | | 396,623 | |
| Intel Corp. | | | 15,162 | | | | 335,990 | |
LSI Corp.(2) | | | 57,450 | | | | 409,044 | |
Marvell Technology Group Ltd.(2) | | | 24,332 | | | | 359,262 | |
Micron Technology, Inc.(2) | | | 35,086 | | | | 262,443 | |
| MKS Instruments, Inc. | | | 9,500 | | | | 250,990 | |
NVIDIA Corp.(2) | | | 12,939 | | | | 206,183 | |
Teradyne, Inc.(2) | | | 23,326 | | | | 345,225 | |
| | | | | | | | 4,542,453 | |
| SOFTWARE — 3.8% | |
ACI Worldwide, Inc.(2) | | | 10,655 | | | | 359,819 | |
Aspen Technology, Inc.(2) | | | 7,840 | | | | 134,691 | |
Cadence Design Systems, Inc.(2) | | | 35,504 | | | | 374,922 | |
Electronic Arts, Inc.(2) | | | 14,746 | | | | 348,006 | |
Intuit, Inc.(2) | | | 4,432 | | | | 229,844 | |
| Microsoft Corp. | | | 14,275 | | | | 371,150 | |
Synopsys, Inc.(2) | | | 15,882 | | | | 408,327 | |
Take-Two Interactive Software, Inc.(2) | | | 13,480 | | | | 205,974 | |
| | | | | | | | 2,432,733 | |
| SPECIALTY RETAIL — 1.9% | |
| Foot Locker, Inc. | | | 4,197 | | | | 99,721 | |
GameStop Corp., Class A(2) | | | 12,413 | | | | 331,055 | |
| PetSmart, Inc. | | | 7,355 | | | | 333,696 | |
Pier 1 Imports, Inc.(2) | | | 15,874 | | | | 183,662 | |
| Williams-Sonoma, Inc. | | | 7,532 | | | | 274,843 | |
| | | | | | | | 1,222,977 | |
| TEXTILES, APPAREL & LUXURY GOODS — 1.0% | |
Iconix Brand Group, Inc.(2) | | | 10,613 | | | | 256,835 | |
| VF Corp. | | | 3,505 | | | | 380,502 | |
| | | | | | | | 637,337 | |
| THRIFTS & MORTGAGE FINANCE — 0.3% | |
| Northwest Bancshares, Inc. | | | 6,503 | | | | 81,808 | |
| Washington Federal, Inc. | | | 7,577 | | | | 124,490 | |
| | | | | | | | 206,298 | |
| TRADING COMPANIES & DISTRIBUTORS — 0.5% | |
United Rentals, Inc.(2) | | | 7,985 | | | | $202,819 | |
| W.W. Grainger, Inc. | | | 577 | | | | 88,656 | |
| | | | | | | | 291,475 | |
| WIRELESS TELECOMMUNICATION SERVICES — 1.7% | |
Sprint Nextel Corp.(2) | | | 79,596 | | | | 429,022 | |
| Telephone & Data Systems, Inc. | | | 10,619 | | | | 330,039 | |
United States Cellular Corp.(2) | | | 6,800 | | | | 329,256 | |
| | | | | | | | 1,088,317 | |
TOTAL COMMON STOCKS (Cost $51,637,475) | | | | 63,471,638 | |
| Temporary Cash Investments — 0.2% | |
| JPMorgan U.S. Treasury Plus Money Market Fund Agency Shares | | | 36,416 | | | | 36,416 | |
| Repurchase Agreement, Bank of America N.A., (collateralized by various U.S. Treasury obligations, 4.375%, 11/15/39, valued at $36,978), in a joint trading account at 0.00%, dated 6/30/11, due 7/1/11 (Delivery value $36,140) | | | | 36,140 | |
| Repurchase Agreement, Credit Suisse First Boston, Inc., (collateralized by various U.S. Treasury obligations, 3.50%, 5/15/20, valued at $30,729), in a joint trading account at 0.00%, dated 6/30/11, due 7/1/11 (Delivery value $30,117) | | | | 30,117 | |
| Repurchase Agreement, Goldman Sachs Group, Inc., (collateralized by various U.S. Treasury obligations, 1.375%, 9/15/12, valued at $36,867), in a joint trading account at 0.00%, dated 6/30/11, due 7/1/11 (Delivery value $36,140) | | | | 36,140 | |
TOTAL TEMPORARY CASH INVESTMENTS (Cost $138,813) | | | | 138,813 | |
TOTAL INVESTMENT SECURITIES — 99.3% (Cost $51,776,288) | | | | 63,610,451 | |
| TOTAL SECURITIES SOLD SHORT — (99.2)% | | | | (63,560,461 | ) |
| OTHER ASSETS AND LIABILITIES — 99.9% | | | | 63,992,774 | |
| TOTAL NET ASSETS — 100.0% | | | | $64,042,764 | |
| Securities Sold Short — (99.2)% | |
| AEROSPACE & DEFENSE — (1.0)% | |
| CAE, Inc. | | | (21,741 | ) | | | $(292,634 | ) |
| Spirit Aerosystems Holdings, Inc., Class A | | | (15,657 | ) | | | (344,454 | ) |
| | | | | | | | (637,088 | ) |
| AIRLINES — (0.6)% | |
| AMR Corp. | | | (57,679 | ) | | | (311,467 | ) |
| Copa Holdings SA, Class A | | | (1,200 | ) | | | (80,088 | ) |
| | | | | | | | (391,555 | ) |
| AUTO COMPONENTS — (0.6)% | |
| Johnson Controls, Inc. | | | (8,490 | ) | | | (353,693 | ) |
| AUTOMOBILES — (1.1)% | |
| Tesla Motors, Inc. | | | (14,886 | ) | | | (433,629 | ) |
| Thor Industries, Inc. | | | (10,224 | ) | | | (294,860 | ) |
| | | | | | | | (728,489 | ) |
| BEVERAGES — (0.7)% | |
| Coca-Cola Co. (The) | | | (392 | ) | | | (26,378 | ) |
| PepsiCo, Inc. | | | (5,547 | ) | | | (390,675 | ) |
| | | | | | | | (417,053 | ) |
| BIOTECHNOLOGY — (2.4)% | |
| Acorda Therapeutics, Inc. | | | (4,808 | ) | | | (155,346 | ) |
| BioMarin Pharmaceutical, Inc. | | | (2,486 | ) | | | (67,644 | ) |
| Dendreon Corp. | | | (3,795 | ) | | | (149,675 | ) |
| Human Genome Sciences, Inc. | | | (6,478 | ) | | | (158,970 | ) |
| Ironwood Pharmaceuticals, Inc. | | | (9,726 | ) | | | (152,893 | ) |
| Myrexis, Inc. | | | (26,010 | ) | | | (93,116 | ) |
| OPKO Health, Inc. | | | (43,807 | ) | | | (161,648 | ) |
| Pharmasset, Inc. | | | (1,439 | ) | | | (161,456 | ) |
| Savient Pharmaceuticals, Inc. | | | (19,628 | ) | | | (147,014 | ) |
| Theravance, Inc. | | | (5,866 | ) | | | (130,284 | ) |
| Vertex Pharmaceuticals, Inc. | | | (3,571 | ) | | | (185,655 | ) |
| | | | | | | | (1,563,701 | ) |
| BUILDING PRODUCTS — (0.9)% | |
| Armstrong World Industries, Inc. | | | (6,031 | ) | | | (274,772 | ) |
| Lennox International, Inc. | | | (7,411 | ) | | | (319,192 | ) |
| | | | | | | | (593,964 | ) |
| CAPITAL MARKETS — (3.2)% | |
| Apollo Investment Corp. | | | (32,207 | ) | | | (328,833 | ) |
| Ares Capital Corp. | | | (21,778 | ) | | | (349,973 | ) |
| Greenhill & Co., Inc. | | | (5,876 | ) | | | (316,246 | ) |
| Invesco Ltd. | | | (1,070 | ) | | | (25,038 | ) |
| Jefferies Group, Inc. | | | (8,965 | ) | | | (182,886 | ) |
| Knight Capital Group, Inc., Class A | | | (28,983 | ) | | | (319,393 | ) |
| MF Global Holdings Ltd. | | | (29,742 | ) | | | (230,203 | ) |
| Prospect Capital Corp. | | | (31,806 | ) | | | (321,559 | ) |
| Teton Advisors, Inc., Class B | | | (20 | ) | | | (8 | ) |
| | | | | | | | (2,074,139 | ) |
| CHEMICALS — (3.8)% | |
| Agrium, Inc. | | | (2,745 | ) | | | $(240,901 | ) |
| Airgas, Inc. | | | (4,809 | ) | | | (336,822 | ) |
| Balchem Corp. | | | (2,030 | ) | | | (88,873 | ) |
| Ecolab, Inc. | | | (3,431 | ) | | | (193,440 | ) |
| Intrepid Potash, Inc. | | | (11,080 | ) | | | (360,100 | ) |
| Methanex Corp. | | | (11,382 | ) | | | (357,167 | ) |
| Nalco Holding Co. | | | (1,111 | ) | | | (30,897 | ) |
| NL Industries, Inc. | | | (20,350 | ) | | | (373,626 | ) |
| Praxair, Inc. | | | (306 | ) | | | (33,167 | ) |
| Valhi, Inc. | | | (8,443 | ) | | | (419,365 | ) |
| | | | | | | | (2,434,358 | ) |
| COMMERCIAL BANKS — (0.4)% | |
| Bank of Nova Scotia | | | (2,727 | ) | | | (164,084 | ) |
| Hancock Holding Co. | | | (3,492 | ) | | | (108,182 | ) |
| | | | | | | | (272,266 | ) |
| COMMERCIAL SERVICES & SUPPLIES — (0.9)% | |
| Geo Group, Inc. (The) | | | (6,898 | ) | | | (158,861 | ) |
| Mine Safety Appliances Co. | | | (577 | ) | | | (21,545 | ) |
| Ritchie Bros. Auctioneers, Inc. | | | (14,024 | ) | | | (385,520 | ) |
| | | | | | | | (565,926 | ) |
| COMMUNICATIONS EQUIPMENT — (2.5)% | |
| Acme Packet, Inc. | | | (5,135 | ) | | | (360,118 | ) |
| Ciena Corp. | | | (19,201 | ) | | | (352,914 | ) |
| Juniper Networks, Inc. | | | (6,482 | ) | | | (204,183 | ) |
| Loral Space & Communications, Inc. | | | (5,018 | ) | | | (348,600 | ) |
| Viasat, Inc. | | | (7,680 | ) | | | (332,314 | ) |
| | | | | | | | (1,598,129 | ) |
| CONSTRUCTION & ENGINEERING — (1.3)% | |
| AECOM Technology Corp. | | | (6,877 | ) | | | (188,017 | ) |
| Quanta Services, Inc. | | | (17,088 | ) | | | (345,177 | ) |
| Shaw Group, Inc. (The) | | | (10,131 | ) | | | (306,058 | ) |
| | | | | | | | (839,252 | ) |
| CONSUMER FINANCE — (0.7)% | |
| SLM Corp. | | | (27,920 | ) | | | (469,335 | ) |
| CONTAINERS & PACKAGING — (0.7)% | |
| Temple-Inland, Inc. | | | (14,512 | ) | | | (431,587 | ) |
| DIVERSIFIED CONSUMER SERVICES — (1.2)% | |
| Grand Canyon Education, Inc. | | | (25,014 | ) | | | (354,699 | ) |
| Hillenbrand, Inc. | | | (15,700 | ) | | | (371,305 | ) |
| K12, Inc. | | | (608 | ) | | | (20,149 | ) |
| | | | | | | | (746,153 | ) |
| DIVERSIFIED FINANCIAL SERVICES — (0.9)% | |
| MSCI, Inc., Class A | | | (5,991 | ) | | | (225,741 | ) |
| PHH Corp. | | | (15,580 | ) | | | (319,701 | ) |
| | | | | | | | (545,442 | ) |
| DIVERSIFIED TELECOMMUNICATION SERVICES — (0.5)% | |
| Frontier Communications Corp. | | | (41,471 | ) | | | (334,671 | ) |
| ELECTRIC UTILITIES — (1.1)% | |
| PPL Corp. | | | (11,869 | ) | | | (330,314 | ) |
| UIL Holdings Corp. | | | (11,192 | ) | | | (362,061 | ) |
| | | | | | | | (692,375 | ) |
| ELECTRICAL EQUIPMENT — (0.5)% | |
| GrafTech International Ltd. | | | (17,346 | ) | | | (351,603 | ) |
| ELECTRONIC EQUIPMENT, INSTRUMENTS & COMPONENTS — (2.6)% | |
| Amphenol Corp., Class A | | | (2,692 | ) | | | (145,341 | ) |
| Avnet, Inc. | | | (11,461 | ) | | | (365,376 | ) |
| Benchmark Electronics, Inc. | | | (2,401 | ) | | | (39,617 | ) |
| Ingram Micro, Inc., Class A | | | (18,841 | ) | | | (341,776 | ) |
| SYNNEX Corp. | | | (7,125 | ) | | | (225,863 | ) |
| Trimble Navigation Ltd. | | | (4,853 | ) | | | (192,373 | ) |
| Universal Display Corp. | | | (10,127 | ) | | | (355,356 | ) |
| | | | | | | | (1,665,702 | ) |
| ENERGY EQUIPMENT & SERVICES — (3.0)% | |
| Baker Hughes, Inc. | | | (2,550 | ) | | | (185,028 | ) |
| Cameron International Corp. | | | (6,908 | ) | | | (347,403 | ) |
| Dril-Quip, Inc. | | | (2,506 | ) | | | (169,982 | ) |
| Global Industries Ltd. | | | (34,939 | ) | | | (191,466 | ) |
| Noble Corp. | | | (8,549 | ) | | | (336,916 | ) |
| Patterson-UTI Energy, Inc. | | | (787 | ) | | | (24,877 | ) |
| Rowan Cos., Inc. | | | (8,203 | ) | | | (318,358 | ) |
| Tidewater, Inc. | | | (6,344 | ) | | | (341,371 | ) |
| Weatherford International Ltd. | | | (1,858 | ) | | | (34,838 | ) |
| | | | | | | | (1,950,239 | ) |
| FOOD & STAPLES RETAILING — (0.4)% | |
| United Natural Foods, Inc. | | | (5,528 | ) | | | (235,880 | ) |
| FOOD PRODUCTS — (3.4)% | |
| Archer-Daniels-Midland Co. | | | (10,518 | ) | | | (317,118 | ) |
| Bunge Ltd. | | | (5,715 | ) | | | (394,049 | ) |
| Green Mountain Coffee Roasters, Inc. | | | (5,520 | ) | | | (492,716 | ) |
| Kraft Foods, Inc., Class A | | | (11,232 | ) | | | (395,703 | ) |
| Pilgrim’s Pride Corp. | | | (71,428 | ) | | | (386,425 | ) |
| Snyder’s-Lance, Inc. | | | (8,108 | ) | | | (175,376 | ) |
| | | | | | | | (2,161,387 | ) |
| GAS UTILITIES — (0.5)% | |
| Northwest Natural Gas Co. | | | (6,930 | ) | | | (312,751 | ) |
| HEALTH CARE EQUIPMENT & SUPPLIES — (2.1)% | |
| Edwards Lifesciences Corp. | | | (2,894 | ) | | | (252,299 | ) |
| MAKO Surgical Corp. | | | (11,843 | ) | | | (352,092 | ) |
| Meridian Bioscience, Inc. | | | (5,387 | ) | | | (129,881 | ) |
| ResMed, Inc. | | | (7,050 | ) | | | $(218,198 | ) |
| Volcano Corp. | | | (12,980 | ) | | | (419,124 | ) |
| | | | | | | | (1,371,594 | ) |
| HEALTH CARE PROVIDERS & SERVICES — (3.0)% | |
| Accretive Health, Inc. | | | (13,963 | ) | | | (401,996 | ) |
| Catalyst Health Solutions, Inc. | | | (6,228 | ) | | | (347,647 | ) |
| Coventry Health Care, Inc. | | | (6,771 | ) | | | (246,938 | ) |
| Health Net, Inc. | | | (10,903 | ) | | | (349,877 | ) |
| Healthspring, Inc. | | | (4,512 | ) | | | (208,048 | ) |
| Landauer, Inc. | | | (4,088 | ) | | | (251,780 | ) |
| Quest Diagnostics, Inc. | | | (354 | ) | | | (20,921 | ) |
| VCA Antech, Inc. | | | (5,306 | ) | | | (112,487 | ) |
| | | | | | | | (1,939,694 | ) |
| HEALTH CARE TECHNOLOGY — (0.6)% | |
| Quality Systems, Inc. | | | (4,401 | ) | | | (384,207 | ) |
| HOTELS, RESTAURANTS & LEISURE — (1.8)% | |
| Gaylord Entertainment Co. | | | (11,278 | ) | | | (338,340 | ) |
| International Speedway Corp., Class A | | | (1,109 | ) | | | (31,507 | ) |
| Jack in the Box, Inc. | | | (15,413 | ) | | | (351,108 | ) |
| Las Vegas Sands Corp. | | | (1,052 | ) | | | (44,405 | ) |
| Life Time Fitness, Inc. | | | (1,412 | ) | | | (56,353 | ) |
| Orient-Express Hotels Ltd., Class A | | | (28,135 | ) | | | (302,451 | ) |
| Royal Caribbean Cruises Ltd. | | | (1,138 | ) | | | (42,834 | ) |
| | | | | | | | (1,166,998 | ) |
| HOUSEHOLD DURABLES — (1.4)% | |
| KB Home | | | (28,808 | ) | | | (281,742 | ) |
| M.D.C. Holdings, Inc. | | | (16,489 | ) | | | (406,289 | ) |
| Ryland Group, Inc. | | | (11,154 | ) | | | (184,376 | ) |
| | | | | | | | (872,407 | ) |
| INDEPENDENT POWER PRODUCERS & ENERGY TRADERS — (0.9)% | |
| GenOn Energy, Inc. | | | (69,707 | ) | | | (269,069 | ) |
| Ormat Technologies, Inc. | | | (13,161 | ) | | | (289,674 | ) |
| | | | | | | | (558,743 | ) |
| INDUSTRIAL CONGLOMERATES — (0.6)% | |
| Carlisle Cos., Inc. | | | (8,059 | ) | | | (396,745 | ) |
| INSURANCE — (5.3)% | |
| American International Group, Inc. | | | (11,561 | ) | | | (338,969 | ) |
| Aon Corp. | | | (6,508 | ) | | | (333,860 | ) |
| Argo Group International Holdings Ltd. | | | (10,731 | ) | | | (318,925 | ) |
| Enstar Group Ltd. | | | (3,587 | ) | | | (374,805 | ) |
| Fairfax Financial Holdings Ltd. | | | (913 | ) | | | (366,241 | ) |
| Genworth Financial, Inc., Class A | | | (27,170 | ) | | | (279,308 | ) |
| MBIA, Inc. | | | (40,178 | ) | | | (349,147 | ) |
| Mercury General Corp. | | | (1,468 | ) | | | (57,971 | ) |
| MetLife, Inc. | | | (2,457 | ) | | | (107,789 | ) |
| Old Republic International Corp. | | | (27,601 | ) | | | (324,312 | ) |
| Primerica, Inc. | | | (15,662 | ) | | | (344,094 | ) |
| RenaissanceRe Holdings Ltd. | | | (2,886 | ) | | | (201,876 | ) |
| | | | | | | | (3,397,297 | ) |
| INTERNET SOFTWARE & SERVICES — (2.8)% | |
| Akamai Technologies, Inc. | | | (9,134 | ) | | | (287,447 | ) |
| Digital River, Inc. | | | (9,405 | ) | | | (302,465 | ) |
| Equinix, Inc. | | | (3,880 | ) | | | (391,957 | ) |
| MercadoLibre, Inc. | | | (2,302 | ) | | | (182,641 | ) |
| OpenTable, Inc. | | | (4,299 | ) | | | (357,332 | ) |
| WebMD Health Corp. | | | (6,463 | ) | | | (294,584 | ) |
| | | | | | | | (1,816,426 | ) |
| IT SERVICES — (2.0)% | |
| Cognizant Technology Solutions Corp., Class A | | | (355 | ) | | | (26,036 | ) |
| CoreLogic, Inc. | | | (18,575 | ) | | | (310,388 | ) |
| Genpact Ltd. | | | (8,154 | ) | | | (140,575 | ) |
| Sapient Corp. | | | (22,850 | ) | | | (343,436 | ) |
| Syntel, Inc. | | | (812 | ) | | | (48,005 | ) |
| Teradata Corp. | | | (842 | ) | | | (50,688 | ) |
| Wright Express Corp. | | | (7,170 | ) | | | (373,342 | ) |
| | | | | | | | (1,292,470 | ) |
| LEISURE EQUIPMENT & PRODUCTS — (0.6)% | |
| Eastman Kodak Co. | | | (93,332 | ) | | | (334,129 | ) |
| Hasbro, Inc. | | | (597 | ) | | | (26,226 | ) |
| | | | | | | | (360,355 | ) |
| LIFE SCIENCES TOOLS & SERVICES — (1.1)% | |
| Nordion, Inc. | | | (30,075 | ) | | | (329,321 | ) |
| PAREXEL International Corp. | | | (14,889 | ) | | | (350,785 | ) |
| | | | | | | | (680,106 | ) |
| MACHINERY — (1.8)% | |
| Flowserve Corp. | | | (935 | ) | | | (102,747 | ) |
| Meritor, Inc. | | | (4,003 | ) | | | (64,208 | ) |
| Robbins & Myers, Inc. | | | (1,404 | ) | | | (74,201 | ) |
| Terex Corp. | | | (12,194 | ) | | | (346,919 | ) |
| WABCO Holdings, Inc. | | | (2,627 | ) | | | (181,421 | ) |
| Westport Innovations, Inc. | | | (16,217 | ) | | | (389,533 | ) |
| | | | | | | | (1,159,029 | ) |
| MARINE — (0.2)% | |
| Seaspan Corp. | | | (7,301 | ) | | | (106,668 | ) |
| MEDIA — (2.6)% | |
| DreamWorks Animation SKG, Inc., Class A | | | (15,943 | ) | | | (320,454 | ) |
| Imax Corp. | | | (2,864 | ) | | | (92,880 | ) |
| Liberty Media Corp. – Capital, Series A | | | (3,831 | ) | | | (328,508 | ) |
| Morningstar, Inc. | | | (6,637 | ) | | | (403,397 | ) |
| New York Times Co. (The), Class A | | | (18,613 | ) | | | $(162,305 | ) |
| Thomson Reuters Corp. | | | (4,946 | ) | | | (185,772 | ) |
| Valassis Communications, Inc. | | | (6,467 | ) | | | (195,950 | ) |
| | | | | | | | (1,689,266 | ) |
| METALS & MINING — (5.1)% | |
| AK Steel Holding Corp. | | | (27,362 | ) | | | (431,224 | ) |
| Allegheny Technologies, Inc. | | | (1,737 | ) | | | (110,247 | ) |
| Allied Nevada Gold Corp. | | | (4,089 | ) | | | (144,628 | ) |
| Carpenter Technology Corp. | | | (2,247 | ) | | | (129,607 | ) |
| Globe Specialty Metals, Inc. | | | (15,891 | ) | | | (356,276 | ) |
| Molycorp, Inc. | | | (366 | ) | | | (22,348 | ) |
| Nevsun Resources Ltd. | | | (58,548 | ) | | | (355,972 | ) |
| North American Palladium Ltd. | | | (42,059 | ) | | | (172,442 | ) |
| Northern Dynasty Minerals Ltd. | | | (37,419 | ) | | | (377,932 | ) |
| Royal Gold, Inc. | | | (6,633 | ) | | | (388,495 | ) |
| Rubicon Minerals Corp. | | | (34,955 | ) | | | (123,042 | ) |
| Silver Standard Resources, Inc. | | | (3,804 | ) | | | (101,529 | ) |
| Thompson Creek Metals Co., Inc. | | | (22,898 | ) | | | (228,522 | ) |
| United States Steel Corp. | | | (7,689 | ) | | | (354,002 | ) |
| | | | | | | | (3,296,266 | ) |
| MULTI-UTILITIES — (1.0)% | |
| Black Hills Corp. | | | (10,675 | ) | | | (321,211 | ) |
| Dominion Resources, Inc. | | | (6,965 | ) | | | (336,200 | ) |
| | | | | | | | (657,411 | ) |
| OIL, GAS & CONSUMABLE FUELS — (7.6)% | |
| Brigham Exploration Co. | | | (4,128 | ) | | | (123,551 | ) |
| Clean Energy Fuels Corp. | | | (22,447 | ) | | | (295,178 | ) |
| Concho Resources, Inc. | | | (3,791 | ) | | | (348,203 | ) |
| CONSOL Energy, Inc. | | | (7,893 | ) | | | (382,652 | ) |
| Continental Resources, Inc. | | | (5,045 | ) | | | (327,471 | ) |
| Enbridge, Inc. | | | (10,204 | ) | | | (331,222 | ) |
| EOG Resources, Inc. | | | (2,909 | ) | | | (304,136 | ) |
| Imperial Oil Ltd. | | | (7,248 | ) | | | (337,684 | ) |
| Kodiak Oil & Gas Corp. | | | (57,915 | ) | | | (334,170 | ) |
| McMoRan Exploration Co. | | | (19,841 | ) | | | (366,661 | ) |
| Nordic American Tanker Shipping Ltd. | | | (3,575 | ) | | | (81,296 | ) |
| Northern Oil & Gas, Inc. | | | (17,788 | ) | | | (394,003 | ) |
| Ship Finance International Ltd. | | | (18,601 | ) | | | (335,190 | ) |
| Sunoco, Inc. | | | (603 | ) | | | (25,151 | ) |
| TransAtlantic Petroleum Ltd. | | | (136,151 | ) | | | (231,457 | ) |
| Ultra Petroleum Corp. | | | (6,902 | ) | | | (316,112 | ) |
| World Fuel Services Corp. | | | (9,259 | ) | | | (332,676 | ) |
| | | | | | | | (4,866,813 | ) |
| PERSONAL PRODUCTS — (0.3)% | |
| Avon Products, Inc. | | | (7,593 | ) | | | (212,604 | ) |
| PHARMACEUTICALS — (2.8)% | |
| Auxilium Pharmaceuticals, Inc. | | | (18,792 | ) | | | (368,323 | ) |
| Hospira, Inc. | | | (2,948 | ) | | | (167,034 | ) |
| Mylan, Inc. | | | (1,159 | ) | | | (28,593 | ) |
| Nektar Therapeutics | | | (38,177 | ) | | | (277,547 | ) |
| Salix Pharmaceuticals Ltd. | | | (11,131 | ) | | | (443,347 | ) |
| Valeant Pharmaceuticals International, Inc. | | | (6,602 | ) | | | (343,040 | ) |
| VIVUS, Inc. | | | (19,306 | ) | | | (157,151 | ) |
| | | | | | | | (1,785,035 | ) |
| PROFESSIONAL SERVICES — (0.2)% | |
| CoStar Group, Inc. | | | (2,192 | ) | | | (129,942 | ) |
| REAL ESTATE INVESTMENT TRUSTS (REITs) — (1.6)% | |
| DuPont Fabros Technology, Inc. | | | (12,506 | ) | | | (315,151 | ) |
| Franklin Street Properties Corp. | | | (25,612 | ) | | | (330,651 | ) |
| Healthcare Realty Trust, Inc. | | | (15,641 | ) | | | (322,674 | ) |
| ProLogis, Inc. | | | (2,406 | ) | | | (86,231 | ) |
| | | | | | | | (1,054,707 | ) |
| REAL ESTATE MANAGEMENT & DEVELOPMENT — (0.8)% | |
| Brookfield Office Properties, Inc. | | | (17,459 | ) | | | (336,610 | ) |
| Howard Hughes Corp. (The) | | | (2,210 | ) | | | (143,738 | ) |
| | | | | | | | (480,348 | ) |
| ROAD & RAIL — (0.6)% | |
| Hertz Global Holdings, Inc. | | | (22,340 | ) | | | (354,759 | ) |
| SEMICONDUCTORS & SEMICONDUCTOR EQUIPMENT — (6.0)% | |
| Broadcom Corp., Class A | | | (2,246 | ) | | | (75,555 | ) |
| Cavium, Inc. | | | (9,680 | ) | | | (421,951 | ) |
| Cirrus Logic, Inc. | | | (1,962 | ) | | | (31,196 | ) |
| Cree, Inc. | | | (9,379 | ) | | | (315,041 | ) |
| Cymer, Inc. | | | (5,372 | ) | | | (265,968 | ) |
| Formfactor, Inc. | | | (31,517 | ) | | | (285,544 | ) |
| Hittite Microwave Corp. | | | (5,158 | ) | | | (319,332 | ) |
| Intersil Corp., Class A | | | (12,092 | ) | | | (155,382 | ) |
| MEMC Electronic Materials, Inc. | | | (39,817 | ) | | | (339,639 | ) |
| Microchip Technology, Inc. | | | (995 | ) | | | (37,720 | ) |
| Microsemi Corp. | | | (1,265 | ) | | | (25,933 | ) |
| Power Integrations, Inc. | | | (9,118 | ) | | | (350,405 | ) |
| Silicon Laboratories, Inc. | | | (6,909 | ) | | | $(285,065 | ) |
| Spansion, Inc., Class A | | | (16,218 | ) | | | (312,521 | ) |
| TriQuint Semiconductor, Inc. | | | (29,928 | ) | | | (304,966 | ) |
| Varian Semiconductor Equipment Associates, Inc. | | | (5,319 | ) | | | (326,799 | ) |
| | | | | | | | (3,853,017 | ) |
| SOFTWARE — (2.8)% | |
| Concur Technologies, Inc. | | | (6,774 | ) | | | (339,174 | ) |
| Pegasystems, Inc. | | | (10,326 | ) | | | (480,676 | ) |
| salesforce.com, inc. | | | (2,707 | ) | | | (403,289 | ) |
| SuccessFactors, Inc. | | | (6,353 | ) | | | (186,778 | ) |
| TiVo, Inc. | | | (34,597 | ) | | | (356,003 | ) |
| | | | | | | | (1,765,920 | ) |
| SPECIALTY RETAIL — (3.0)% | |
| AutoNation, Inc. | | | (7,867 | ) | | | (288,011 | ) |
| Cabela’s, Inc. | | | (10,438 | ) | | | (283,392 | ) |
| CarMax, Inc. | | | (11,280 | ) | | | (373,029 | ) |
| Coldwater Creek, Inc. | | | (185,804 | ) | | | (260,126 | ) |
| OfficeMax, Inc. | | | (45,208 | ) | | | (354,883 | ) |
| Urban Outfitters, Inc. | | | (11,741 | ) | | | (330,509 | ) |
| | | | | | | | (1,889,950 | ) |
| TEXTILES, APPAREL & LUXURY GOODS — (1.5)% | |
| Fossil, Inc. | | | (1,581 | ) | | | (186,115 | ) |
| Hanesbrands, Inc. | | | (2,219 | ) | | | (63,352 | ) |
| Skechers U.S.A., Inc., Class A | | | (23,064 | ) | | | (333,967 | ) |
| Under Armour, Inc., Class A | | | (4,802 | ) | | | (371,243 | ) |
| | | | | | | | (954,677 | ) |
| THRIFTS & MORTGAGE FINANCE — (1.2)% | |
| MGIC Investment Corp. | | | (55,675 | ) | | | (331,266 | ) |
| Radian Group, Inc. | | | (82,417 | ) | | | (348,624 | ) |
| Tree.com, Inc. | | | (12,916 | ) | | | (66,130 | ) |
| | | | | | | | (746,020 | ) |
| TRADING COMPANIES & DISTRIBUTORS — (1.5)% | |
| Fastenal Co. | | | (9,740 | ) | | | (350,543 | ) |
| GATX Corp. | | | (963 | ) | | | (35,747 | ) |
| TAL International Group, Inc. | | | (10,328 | ) | | | (356,625 | ) |
| Textainer Group Holdings, Ltd. | | | (7,158 | ) | | | (220,037 | ) |
| | | | | | | | (962,952 | ) |
| WATER UTILITIES — (0.3)% | |
| Aqua America, Inc. | | | (8,997 | ) | | | (197,754 | ) |
| WIRELESS TELECOMMUNICATION SERVICES — (1.2)% | |
| Clearwire Corp., Class A | | | (80,669 | ) | | | (304,929 | ) |
| SBA Communications Corp., Class A | | | (4,586 | ) | | | (175,139 | ) |
| Shenandoah Telecommunications Co. | | | (18,418 | ) | | | (313,475 | ) |
| | | | | | | | (793,543 | ) |
TOTAL SECURITIES SOLD SHORT — (99.2)% (Proceeds $61,661,952) | | | | $(63,560,461 | ) |
Notes to Schedule of Investments
| (1) | Securities are pledged with brokers as collateral for securities sold short. At the period end, the value of securities pledged was $63,471,638. |
| (3) | Category is less than 0.05% of total net assets. |
| See Notes to Financial Statements. |
Statement of Assets and Liabilities |
| JUNE 30, 2011 | |
| Assets | |
| Investment securities, at value (cost of $51,776,288) | | | $63,610,451 | |
| Deposits with broker for securities sold short | | | 61,732,698 | |
| Cash | | | 2,256,755 | |
| Receivable for investments sold | | | 3,660,798 | |
| Receivable for capital shares sold | | | 23,482 | |
| Dividends and interest receivable | | | 32,475 | |
| | | | 131,316,659 | |
| | | | | |
| Liabilities | | | | |
| Securities sold short, at value (proceeds of $61,661,952) | | | 63,560,461 | |
| Payable for investments purchased | | | 3,546,501 | |
| Payable for capital shares redeemed | | | 17,224 | |
| Accrued management fees | | | 72,294 | |
| Distribution and service fees payable | | | 13,190 | |
| Dividend and interest expense payable on securities sold short | | | 64,225 | |
| | | | 67,273,895 | |
| | | | | |
| Net Assets | | | $64,042,764 | |
| | | | | |
| Net Assets Consist of: | | | | |
| Capital (par value and paid-in surplus) | | | $73,687,252 | |
| Accumulated net investment loss | | | (56 | ) |
| Accumulated net realized loss | | | (19,579,938 | ) |
| Net unrealized appreciation | | | 9,935,506 | |
| | | | $64,042,764 | |
| | Net assets | Shares outstanding | Net asset value per share |
| Investor Class, $0.01 Par Value | $21,866,403 | 2,107,904 | $10.37 |
| Institutional Class, $0.01 Par Value | $4,193,634 | 400,755 | $10.46 |
| A Class, $0.01 Par Value | $28,691,411 | 2,793,856 | $10.27* |
| B Class, $0.01 Par Value | $1,608,913 | 162,298 | $9.91 |
| C Class, $0.01 Par Value | $6,845,479 | 690,633 | $9.91 |
| R Class, $0.01 Par Value | $836,924 | 82,433 | $10.15 |
*Maximum offering price $10.90 (net asset value divided by 0.9425)
See Notes to Financial Statements.
| YEAR ENDED JUNE 30, 2011 | |
| Investment Income (Loss) | |
| Income: | | | |
| Dividends (net of foreign taxes withheld of $2,232) | | | $983,748 | |
| Interest | | | 1,708 | |
| | | | 985,456 | |
| | | | | |
| Expenses: | | | | |
| Dividend expense on securities sold short | | | 1,558,458 | |
| Interest expense on securities sold short | | | 217,703 | |
| Management fees | | | 1,173,108 | |
| Distribution and service fees: | | | | |
| A Class | | | 122,038 | |
| B Class | | | 19,383 | |
| C Class | | | 84,314 | |
| R Class | | | 3,723 | |
| Directors’ fees and expenses | | | 3,146 | |
| Other expenses | | | 22,005 | |
| | | | 3,203,878 | |
| | | | | |
| Net investment income (loss) | | | (2,218,422 | ) |
| | | | | |
| Realized and Unrealized Gain (Loss) | | | | |
| Net realized gain (loss) on: | | | | |
| Investment transactions | | | 36,725,997 | |
| Securities sold short transactions | | | (17,676,417 | ) |
| | | | 19,049,580 | |
| | | | | |
| Change in net unrealized appreciation (depreciation) on: | | | | |
| Investments | | | (4,582,384 | ) |
| Securities sold short | | | (9,740,142 | ) |
| | | | (14,322,526 | ) |
| | | | | |
| Net realized and unrealized gain (loss) | | | 4,727,054 | |
| | | | | |
| Net Increase (Decrease) in Net Assets Resulting from Operations | | | $2,508,632 | |
See Notes to Financial Statements.
Statement of Changes in Net Assets |
| YEARS ENDED JUNE 30, 2011 AND JUNE 30, 2010 | |
| Increase (Decrease) in Net Assets | | 2011 | | | 2010 | |
| Operations | |
| Net investment income (loss) | | | $(2,218,422 | ) | | | $(2,824,016 | ) |
| Net realized gain (loss) | | | 19,049,580 | | | | 6,506,490 | |
| Change in net unrealized appreciation (depreciation) | | | (14,322,526 | ) | | | (4,283,052 | ) |
| Net increase (decrease) in net assets resulting from operations | | | 2,508,632 | | | | (600,578 | ) |
| | | | | | | | | |
| Capital Share Transactions | | | | | | | | |
| Net increase (decrease) in net assets from capital share transactions | | | (53,103,549 | ) | | | (56,599,782 | ) |
| | | | | | | | | |
| Net increase (decrease) in net assets | | | (50,594,917 | ) | | | (57,200,360 | ) |
| | | | | | | | | |
| Net Assets | | | | | | | | |
| Beginning of period | | | 114,637,681 | | | | 171,838,041 | |
| End of period | | | $64,042,764 | | | | $114,637,681 | |
| | | | | | | | | |
| Accumulated net investment loss | | | $(56 | ) | | | — | |
See Notes to Financial Statements.
Notes to Financial Statements |
JUNE 30, 2011
1. Organization
American Century Quantitative Equity Funds, Inc. (the corporation) is registered under the Investment Company Act of 1940, as amended (the 1940 Act), as an open-end management investment company and is organized as a Maryland corporation. Equity Market Neutral Fund (formerly Long-Short Market Neutral Fund) (the fund) is one fund in a series issued by the corporation. The fund is diversified as defined under the 1940 Act. The fund’s investment objective is to seek capital appreciation independent of equity market conditions. The fund buys, or takes long positions in, equity securities that have been identified as undervalued. The fund takes short positions in equity securities that have been identified as overvalued. The fund’s investment process is designed to maintain approximately equal dollar amounts invested in long and short positions at all times.
The fund is authorized to issue the Investor Class, the Institutional Class, the A Class, the B Class, the C Class and the R Class. The A Class may incur an initial sales charge. The A Class, B Class and C Class may be subject to a contingent deferred sales charge. The share classes differ principally in their respective sales charges and distribution and shareholder servicing expenses and arrangements. The Institutional Class is made available to institutional shareholders or through financial intermediaries whose clients do not require the same level of shareholder and administrative services as shareholders of other classes. As a result, the Institutional Class is charged a lower unified management fee.
2. Significant Accounting Policies
The following is a summary of significant accounting policies consistently followed by the fund in preparation of its financial statements. The financial statements are prepared in conformity with accounting principles generally accepted in the United States of America, which may require management to make certain estimates and assumptions at the date of the financial statements. Actual results could differ from these estimates.
Investment Valuations — The fund determines the fair value of its investments and computes its net asset value per share as of the close of regular trading (usually 4 p.m. Eastern time) on the New York Stock Exchange (NYSE) on each day the NYSE is open.
Equity securities that are listed or traded on a domestic securities exchange are valued at the last reported sales price or at the official closing price as provided by the exchange. Equity securities traded on foreign securities exchanges are typically valued at the closing price on the exchange where primarily traded or as of the close of the NYSE, if that is earlier. If no last sales price is reported, or if local convention or regulation so provides, the mean of the latest bid and asked prices is used. Depending on local convention or regulation, securities traded over-the-counter are valued at the mean of the latest bid and asked prices, the last sales price, or the official closing price. In its determination of fair value, the fund may review several factors including: market information specific to a security; news developments in U.S. and foreign markets; the performance of particular U.S. and foreign securities, indices, comparable securities, American Depositary Receipts, Exchange-Traded Funds, and other relevant market indicators.
Debt securities maturing within 60 days at the time of purchase may be valued at cost, plus or minus any amortized discount or premium or at the evaluated mean as provided by an independent pricing service. Evaluated mean prices are commonly derived through utilization of market models, which may consider, among other factors, trade data, quotations from dealers and active market makers, relevant yield curve and spread data, related sector levels, creditworthiness, and other relevant market information on the same or comparable securities.
Investments in open-end management investment companies are valued at the reported net asset value per share. Repurchase agreements are valued at cost.
If the fund determines that the market price for a portfolio security is not readily available or the valuation methods mentioned above do not reflect a security’s fair value, such security is valued as determined in good faith by the Board of Directors or its designee, in accordance with procedures adopted by the Board of Directors. Circumstances that may cause the fund to use these procedures to value a security include, but are not limited to: a security has been declared in default; trading in a security has been halted during the trading day; there is a foreign market holiday and no trading occurred; or an event occurred between the close of a foreign exchange and the NYSE that may affect the value of a security.
Security Transactions — Security transactions are accounted for as of the trade date. Net realized gains and losses are determined on the identified cost basis, which is also used for federal income tax purposes.
Investment Income — Dividend income less foreign taxes withheld, if any, is recorded as of the ex-dividend date. Distributions received on securities that represent a return of capital or capital gain are recorded as a reduction of cost of investments and/or as a realized gain. The fund estimates the components of distributions received that may be considered nontaxable distributions or capital gain distributions for income tax purposes. Interest income is recorded on the accrual basis and includes accretion of discounts and amortization of premiums.
Securities Sold Short — The fund may enter into a short sale, which is selling a security it does not own, as part of its normal investment activities. Upon selling a security short, the fund will segregate cash, cash equivalents or other appropriate liquid securities in at least an amount equal to the current market value of the securities sold short until the fund replaces the borrowed security. Interest earned or paid on segregated cash for securities sold short is reflected as interest income or interest expense. The fund is required to pay any dividends or interest due on securities sold short. Such dividends and interest are recorded as an expense. Liabilities for securities sold short are valued daily and changes in value are recorded as unrealized appreciation (depreciation) on securities sold short. The fund records realized gain (loss) on a security sold short when it is terminated by the fund and includes as a component of realized gain (loss) on securities sold short transactions. The fund’s risks in selling securities short include the possibility that the future increases in market value may exceed the liability recorded or that the lender of the security may terminate the loan at a disadvantageous price or time to the fund. In addition, while the realized gains on securities sold short are limited to the price at which it sold the security short, the losses may be unlimited.
Repurchase Agreements — The fund may enter into repurchase agreements with institutions that American Century Investment Management, Inc. (ACIM) (the investment advisor) has determined are creditworthy pursuant to criteria adopted by the Board of Directors. The fund requires that the collateral, represented by securities, received in a repurchase transaction be transferred to the custodian in a manner sufficient to enable the fund to obtain those securities in the event of a default under the repurchase agreement. ACIM monitors, on a daily basis, the securities transferred to ensure the value, including accrued interest, of the securities under each repurchase agreement is equal to or greater than amounts owed to the fund under each repurchase agreement.
Joint Trading Account — Pursuant to an Exemptive Order issued by the Securities and Exchange Commission, the fund, along with certain other funds in the American Century Investments family of funds, may transfer uninvested cash balances into a joint trading account. These balances are invested in one or more repurchase agreements that are collateralized by U.S. Treasury or Agency obligations.
Income Tax Status — It is the fund’s policy to distribute substantially all net investment income and net realized gains to shareholders and to otherwise qualify as a regulated investment company under provisions of the Internal Revenue Code. The fund is no longer subject to examination by tax authorities for years prior to 2008. At this time, management believes there are no uncertain tax positions which, based on their technical merit, would not be sustained upon examination and for which it is reasonably possible that the total amounts of unrecognized tax benefits will significantly change in the next twelve months. Accordingly, no provision has been made for federal or state income taxes.
Multiple Class — All shares of the fund represent an equal pro rata interest in the net assets of the class to which such shares belong, and have identical voting, dividend, liquidation and other rights and the same terms and conditions, except for class specific expenses and exclusive rights to vote on matters affecting only individual classes. Income, non-class specific expenses, and realized and unrealized capital gains and losses of the fund are allocated to each class of shares based on their relative net assets.
Distributions to Shareholders — Distributions from net investment income, if any, are generally declared and paid semiannually. Distributions from net realized gains, if any, are generally declared and paid annually.
Indemnifications — Under the corporation’s organizational documents, its officers and directors are indemnified against certain liabilities arising out of the performance of their duties to the fund. In addition, in the normal course of business, the fund enters into contracts that provide general indemnifications. The maximum exposure under these arrangements is unknown as this would involve future claims that may be made against a fund. The risk of material loss from such claims is considered by management to be remote.
3. Fees and Transactions with Related Parties
Management Fees —The corporation has entered into a management agreement with ACIM, under which ACIM provides the fund with investment advisory and management services in exchange for a single, unified management fee (the fee) per class. The agreement provides that all expenses of managing and operating the fund, except distribution and service fees, brokerage expenses, taxes, interest, fees and expenses of the independent directors (including legal counsel fees), and extraordinary expenses, will be paid by ACIM. The fee is computed and accrued daily based on each class’s daily net assets and paid monthly in arrears. The fee consists of (1) an Investment Category Fee based on the daily net assets of the fund and certain other accounts managed by the investment advisor that are in the same broad investment category as the fund and (2) a Complex Fee based on the assets of all the funds in the American Century Investments family of funds. The rates for the Investment Category Fee range from 1.0480% to 1.2300%. The rates for the Complex Fee range from 0.2500% to 0.3100% for the Investor Class, A Class, B Class, C Class and R Class. The Institutional Class is 0.2000% less at each point within the Complex Fee range. The effective annual management fee for each class for the year ended June 30, 2011 was 1.39% for the Investor Class, A Class, B Class, C Class and R Class and 1.19% for the Institutional Class.
Distribution and Service Fees — The Board of Directors has adopted a separate Master Distribution and Individual Shareholder Services Plan for each of the A Class, B Class, C Class and R Class (collectively the plans), pursuant to Rule 12b-1 of the 1940 Act. The plans provide that the A Class will pay American Century Investment Services, Inc. (ACIS) an annual distribution and service fee of 0.25%. The plans provide that the B Class and C Class will each pay ACIS an annual distribution and service fee of 1.00%, of which 0.25% is paid for individual shareholder services and 0.75% is paid for distribution services. The plans provide that the R Class will pay ACIS an annual distribution and service fee of 0.50%. The fees are computed and accrued daily based on each class’s daily net assets and paid monthly in arrears. The fees are used to pay financial intermediaries for distribution and individual shareholder services. Fees incurred under the plans during the year ended June 30, 2011 are detailed in the Statement of Operations.
Other Expenses — The fund’s total other expenses include the fees and expenses of the fund’s independent directors and their legal counsel and other miscellaneous expenses. A portion of these expenses was due to nonrecurring expenses paid by the fund. The impact of total other expenses to the ratio of operating expenses to average net assets was 0.03%.
Related Parties — Certain officers and directors of the corporation are also officers and/or directors of American Century Companies, Inc. (ACC), the parent of the corporation’s investment advisor, ACIM, the distributor of the corporation, ACIS, and the corporation’s transfer agent, American Century Services, LLC.
The fund is eligible to invest in a money market fund for temporary purposes, which is managed by J.P. Morgan Investment Management, Inc. (JPMIM). The fund has a mutual funds services agreement with J.P. Morgan Investor Services Co. (JPMIS). JPMorgan Chase Bank (JPMCB) is a custodian of the fund. JPMIM, JPMIS and JPMCB are wholly owned subsidiaries of JPMorgan Chase & Co. (JPM). JPM is an equity investor in ACC. The services provided to the fund by JPMIM, JPMIS and JPMCB terminated on July 31, 2011.
4. Investment Transactions
Purchases and sales of investment securities and securities sold short, excluding short-term investments, for the year ended June 30, 2011 were $214,520,452 and $220,028,085, respectively.
5. Capital Share Transactions
Transactions in shares of the fund were as follows:
| | | Year ended June 30, 2011 | | | Year ended June 30, 2010 | |
| | | Shares | | | Amount | | | Shares | | | Amount | |
| Investor Class/Shares Authorized | | | 50,000,000 | | | | | | | 50,000,000 | | | | |
| Sold | | | 1,195,601 | | | | $11,968,740 | | | | 1,036,424 | | | | $10,346,661 | |
| Redeemed | | | (744,261 | ) | | | (7,468,960 | ) | | | (1,673,493 | ) | | | (16,727,635 | ) |
| | | | 451,340 | | | | 4,499,780 | | | | (637,069 | ) | | | (6,380,974 | ) |
| Institutional Class/Shares Authorized | | | 50,000,000 | | | | | | | | 50,000,000 | | | | | |
| Sold | | | 108,261 | | | | 1,094,820 | | | | 554,504 | | | | 5,580,433 | |
| Redeemed | | | (887,343 | ) | | | (8,807,772 | ) | | | (1,597,249 | ) | | | (16,029,185 | ) |
| | | | (779,082 | ) | | | (7,712,952 | ) | | | (1,042,745 | ) | | | (10,448,752 | ) |
| A Class/Shares Authorized | | | 70,000,000 | | | | | | | | 70,000,000 | | | | | |
| Sold | | | 1,305,940 | | | | 12,973,766 | | | | 7,169,067 | | | | 71,213,377 | |
| Redeemed | | | (5,844,746 | ) | | | (58,522,465 | ) | | | (10,345,618 | ) | | | (102,705,155 | ) |
| | | | (4,538,806 | ) | | | (45,548,699 | ) | | | (3,176,551 | ) | | | (31,491,778 | ) |
| B Class/Shares Authorized | | | 10,000,000 | | | | | | | | 10,000,000 | | | | | |
| Sold | | | 412 | | | | 4,000 | | | | 11,278 | | | | 110,108 | |
| Redeemed | | | (73,864 | ) | | | (713,531 | ) | | | (90,003 | ) | | | (869,608 | ) |
| | | | (73,452 | ) | | | (709,531 | ) | | | (78,725 | ) | | | (759,500 | ) |
| C Class/Shares Authorized | | | 10,000,000 | | | | | | | | 10,000,000 | | | | | |
| Sold | | | 85,170 | | | | 825,574 | | | | 344,797 | | | | 3,352,577 | |
| Redeemed | | | (486,684 | ) | | | (4,684,340 | ) | | | (1,079,003 | ) | | | (10,457,305 | ) |
| | | | (401,514 | ) | | | (3,858,766 | ) | | | (734,206 | ) | | | (7,104,728 | ) |
| R Class/Shares Authorized | | | 10,000,000 | | | | | | | | 10,000,000 | | | | | |
| Sold | | | 48,738 | | | | 480,644 | | | | 30,411 | | | | 299,610 | |
| Redeemed | | | (25,826 | ) | | | (254,025 | ) | | | (72,376 | ) | | | (713,660 | ) |
| | | | 22,912 | | | | 226,619 | | | | (41,965 | ) | | | (414,050 | ) |
| Net increase (decrease) | | | (5,318,602 | ) | | | $(53,103,549 | ) | | | (5,711,261 | ) | | | $(56,599,782 | ) |
6. Fair Value Measurements
The fund’s securities valuation process is based on several considerations and may use multiple inputs to determine the fair value of the positions held by the fund. In conformity with accounting principles generally accepted in the United States of America, the inputs used to determine a valuation are classified into three broad levels as follows:
| • | Level 1 valuation inputs consist of unadjusted quoted prices in an active market for identical securities; |
| Level 2 valuation inputs consist of direct or indirect observable market data (including quoted prices for similar securities, evaluations of subsequent market events, interest rates, prepayment speeds, credit risk, etc.); or |
| Level 3 valuation inputs consist of unobservable data (including a fund’s own assumptions). |
The level classification is based on the lowest level input that is significant to the fair valuation measurement. The valuation inputs are not necessarily an indication of the risks associated with investing in these securities or other financial instruments.
The following is a summary of the level classifications as of period end. The Schedule of Investments provides additional information on the fund’s portfolio holdings.
| | | Level 1 | | | Level 2 | | | Level 3 | |
| Investment Securities | | | | | | | | | |
| Domestic Common Stocks | | | $58,756,242 | | | | — | | | | — | |
| Foreign Common Stocks | | | 4,715,396 | | | | — | | | | — | |
| Temporary Cash Investments | | | 36,416 | | | | $102,397 | | | | — | |
| Total Value of Investment Securities | | | $63,508,054 | | | | $102,397 | | | | — | |
| | | | | | | | | | | | | |
| Securities Sold Short | | | | | | | | | | | | |
| Domestic Common Stocks | | | $(55,843,069 | ) | | | — | | | | — | |
| Foreign Common Stocks | | | (7,717,392 | ) | | | — | | | | — | |
| Total Value of Securities Sold Short | | | $(63,560,461 | ) | | | — | | | | — | |
7. Risk Factors
The fund’s investment process may result in high portfolio turnover, which could mean high transaction costs, affecting both performance and capital gains tax liabilities to investors. In addition, its investment approach may involve higher volatility, short sales risk and overweighting risk.
The fund may suffer losses when taking long positions in market sectors or industries that are not offset by corresponding short positions, resulting in an over- or underweighted sector or industry.
There are certain risks involved in investing in foreign securities. These risks include those resulting from future adverse political, social, and economic developments, fluctuations in currency exchange rates, the possible imposition of exchange controls, and other foreign laws or restrictions.
8. Federal Tax Information
The book-basis character of distributions made during the year from net investment income or net realized gains may differ from their ultimate characterization for federal income tax purposes. These differences reflect the differing character of certain income items and net realized gains and losses for financial statement and tax purposes, and may result in reclassification among certain capital accounts on the financial statements. There were no distributions paid by the fund during the years ended June 30, 2011 and June 30, 2010.
As of June 30, 2011, the federal tax cost of investments and the components of distributable earnings on a tax-basis were as follows:
| Federal tax cost of investments | | | $51,962,042 | |
| Gross tax appreciation of investments | | | $13,091,503 | |
| Gross tax depreciation of investments | | | (1,443,094 | ) |
| Net tax appreciation (depreciation) of investments | | | $11,648,409 | |
| Net tax appreciation (depreciation) on securities sold short | | | $(2,155,382 | ) |
| Net tax appreciation (depreciation) | | | $9,493,027 | |
| Undistributed ordinary income | | | — | |
| Accumulated capital losses | | | $(19,137,515 | ) |
The difference between book-basis and tax-basis cost and unrealized appreciation (depreciation) is attributable primarily to the tax deferral of losses on wash sales.
The accumulated capital losses represent net capital loss carryovers that may be used to offset future realized capital gains for federal income tax purposes. Future capital loss carryover utilization in any given year may be subject to Internal Revenue Code limitations. Capital loss carryovers expire as follows:
| 2016 | 2017 | 2018 |
| $(2,584,990) | $(7,401,476) | $(9,151,049) |
On December 22, 2010, the Regulated Investment Company Modernization Act of 2010 (the “Act”) was enacted, which changed various technical rules governing the tax treatment of regulated investment companies. The changes are generally effective for taxable years beginning after the date of enactment. Under the Act, the fund will be permitted to carry forward capital losses incurred in taxable years beginning after the date of enactment for an unlimited period. However, any losses incurred during those future taxable years will be required to be utilized prior to the losses incurred in pre-enactment taxable years, which carry an expiration date. As a result of this ordering rule, pre-enactment capital loss carryforwards may be more likely to expire unused.
| Investor Class | |
| For a Share Outstanding Throughout the Years Ended June 30 (except as noted) | |
| | | 2011 | | | 2010 | | | 2009 | | | 2008 | | | 2007(1) | | | 2006 | |
| Per-Share Data | |
| Net Asset Value, Beginning of Period | | | $10.00 | | | | $10.01 | | | | $10.92 | | | | $11.22 | | | | $10.40 | | | | $9.97 | |
Income From Investment Operations | | | | | | | | | | | | | | | | | | | | | | | | |
Net Investment Income (Loss)(2) | | | (0.22 | ) | | | (0.17 | ) | | | (0.16 | ) | | | 0.08 | | | | 0.14 | | | | 0.24 | |
Net Realized and Unrealized Gain (Loss) | | | 0.59 | | | | 0.16 | | | | (0.75 | ) | | | (0.15 | ) | | | 0.68 | | | | 0.27 | |
Total From Investment Operations | | | 0.37 | | | | (0.01 | ) | | | (0.91 | ) | | | (0.07 | ) | | | 0.82 | | | | 0.51 | |
| Distributions | | | | | | | | | | | | | | | | | | | | | | | | |
From Net Investment Income | | | — | | | | — | | | | — | | | | (0.23 | ) | | | — | | | | (0.08 | ) |
Net Asset Value, End of Period | | | $10.37 | | | | $10.00 | | | | $10.01 | | | | $10.92 | | | | $11.22 | | | | $10.40 | |
| | | | | | | | | | | | | | | | | | | | | | | | | |
Total Return(3) | | | 3.70 | % | | | (0.10 | )% | | | (8.33 | )% | | | (0.67 | )% | | | 7.88 | % | | | 5.08 | % |
| | | | | | | | | | | | | | | | | | | | | | | | | |
| Ratios/Supplemental Data | |
Ratio of Operating Expenses to Average Net Assets | | | 3.50 | % | | | 3.09 | % | | | 3.34 | % | | | 2.89 | % | | | 2.71 | %(4) | | | 3.45 | % |
Ratio of Net Investment Income (Loss) to Average Net Assets | | | (2.34 | )% | | | (1.68 | )% | | | (1.56 | )% | | | 0.90 | % | | | 2.61 | %(4) | | | 2.17 | % |
| Portfolio Turnover Rate | | | 261 | % | | | 140 | % | | | 330 | % | | | 356 | % | | | 181 | % | | | 428 | % |
| Portfolio Turnover Rate Excluding Short Sales | | | 85 | % | | | 35 | % | | | 151 | % | | | 137 | % | | | 38 | % | | | 50 | % |
| Net Assets, End of Period (in thousands) | | | $21,866 | | | | $16,570 | | | | $22,956 | | | | $28,939 | | | | $20,732 | | | | $12,781 | |
Ratio of Operating Expenses (excluding expenses on securities sold short) to Average Net Assets | | | 1.42 | % | | | 1.42 | % | | | 1.41 | % | | | 1.39 | % | | | 1.39 | %(4) | | | 1.38 | % |
| (1) | January 1, 2007 through June 30, 2007. The fund’s fiscal year end was changed from December 31 to June 30, resulting in a six-month annual reporting period. For the years before June 30, 2007, the fund’s fiscal year end was December 31. |
| (2) | Computed using average shares outstanding throughout the period. |
| (3) | Total returns are calculated based on the net asset value of the last business day. Total returns for periods less than one year are not annualized. |
See Notes to Financial Statements.
| Institutional Class | |
| For a Share Outstanding Throughout the Years Ended June 30 (except as noted) | |
| | | 2011 | | | 2010 | | | 2009 | | | 2008 | | | 2007(1) | | | 2006 | |
| Per-Share Data | |
| Net Asset Value, Beginning of Period | | | $10.07 | | | | $10.06 | | | | $10.95 | | | | $11.24 | | | | $10.40 | | | | $9.97 | |
Income From Investment Operations | | | | | | | | | | | | | | | | | | | | | | | | |
Net Investment Income (Loss)(2) | | | (0.26 | ) | | | (0.16 | ) | | | (0.15 | ) | | | 0.17 | | | | 0.15 | | | | 0.25 | |
Net Realized and Unrealized Gain (Loss) | | | 0.65 | | | | 0.17 | | | | (0.74 | ) | | | (0.22 | ) | | | 0.69 | | | | 0.28 | |
Total From Investment Operations | | | 0.39 | | | | 0.01 | | | | (0.89 | ) | | | (0.05 | ) | | | 0.84 | | | | 0.53 | |
| Distributions | | | | | | | | | | | | | | | | | | | | | | | | |
From Net Investment Income | | | — | | | | — | | | | — | | | | (0.24 | ) | | | — | | | | (0.10 | ) |
Net Asset Value, End of Period | | | $10.46 | | | | $10.07 | | | | $10.06 | | | | $10.95 | | | | $11.24 | | | | $10.40 | |
| | | | | | | | | | | | | | | | | | | | | | | | | |
Total Return(3) | | | 3.87 | % | | | 0.10 | % | | | (8.13 | )% | | | (0.48 | )% | | | 8.08 | % | | | 5.30 | % |
| | | | | | | | | | | | | | | | | | | | | | | | | |
| Ratios/Supplemental Data | |
Ratio of Operating Expenses to Average Net Assets | | | 3.30 | % | | | 2.89 | % | | | 3.14 | % | | | 2.69 | % | | | 2.51 | %(4) | | | 3.25 | % |
Ratio of Net Investment Income (Loss) to Average Net Assets | | | (2.14 | )% | | | (1.48 | )% | | | (1.36 | )% | | | 1.10 | % | | | 2.81 | %(4) | | | 2.37 | % |
| Portfolio Turnover Rate | | | 261 | % | | | 140 | % | | | 330 | % | | | 356 | % | | | 181 | % | | | 428 | % |
| Portfolio Turnover Rate Excluding Short Sales | | | 85 | % | | | 35 | % | | | 151 | % | | | 137 | % | | | 38 | % | | | 50 | % |
| Net Assets, End of Period (in thousands) | | | $4,194 | | | | $11,882 | | | | $22,354 | | | | $12,989 | | | | $19,559 | | | | $14,412 | |
Ratio of Operating Expenses (excluding expenses on securities sold short) to Average Net Assets | | | 1.22 | % | | | 1.22 | % | | | 1.21 | % | | | 1.19 | % | | | 1.19 | %(4) | | | 1.18 | % |
| (1) | January 1, 2007 through June 30, 2007. The fund’s fiscal year end was changed from December 31 to June 30, resulting in a six-month annual reporting period. For the years before June 30, 2007, the fund’s fiscal year end was December 31. |
| (2) | Computed using average shares outstanding throughout the period. |
| (3) | Total returns are calculated based on the net asset value of the last business day. Total returns for periods less than one year are not annualized. |
| A Class | |
| For a Share Outstanding Throughout the Years Ended June 30 (except as noted) | |
| | | 2011 | | | 2010 | | | 2009 | | | 2008 | | | 2007(1) | | | 2006 | |
| Per-Share Data | |
| Net Asset Value, Beginning of Period | | | $9.93 | | | | $9.96 | | | | $10.89 | | | | $11.21 | | | | $10.40 | | | | $9.96 | |
Income From Investment Operations | | | | | | | | | | | | | | | | | | | | | | | | |
Net Investment Income (Loss)(2) | | | (0.26 | ) | | | (0.19 | ) | | | (0.18 | ) | | | 0.07 | | | | 0.13 | | | | 0.20 | |
Net Realized and Unrealized Gain (Loss) | | | 0.60 | | | | 0.16 | | | | (0.75 | ) | | | (0.18 | ) | | | 0.68 | | | | 0.29 | |
Total From Investment Operations | | | 0.34 | | | | (0.03 | ) | | | (0.93 | ) | | | (0.11 | ) | | | 0.81 | | | | 0.49 | |
| Distributions | | | | | | | | | | | | | | | | | | | | | | | | |
From Net Investment Income | | | — | | | | — | | | | — | | | | (0.21 | ) | | | — | | | | (0.05 | ) |
Net Asset Value, End of Period | | | $10.27 | | | | $9.93 | | | | $9.96 | | | | $10.89 | | | | $11.21 | | | | $10.40 | |
| | | | | | | | | | | | | | | | | | | | | | | | | |
Total Return(3) | | | 3.42 | % | | | (0.30 | )% | | | (8.54 | )% | | | (0.98 | )% | | | 7.79 | % | | | 4.93 | % |
| | | | | | | | | | | | | | | | | | | | | | | | | |
| Ratios/Supplemental Data | |
Ratio of Operating Expenses to Average Net Assets | | | 3.75 | % | | | 3.34 | % | | | 3.59 | % | | | 3.14 | % | | | 2.96 | %(4) | | | 3.70 | % |
Ratio of Net Investment Income (Loss) to Average Net Assets | | | (2.59 | )% | | | (1.93 | )% | | | (1.81 | )% | | | 0.65 | % | | | 2.36 | %(4) | | | 1.92 | % |
| Portfolio Turnover Rate | | | 261 | % | | | 140 | % | | | 330 | % | | | 356 | % | | | 181 | % | | | 428 | % |
| Portfolio Turnover Rate Excluding Short Sales | | | 85 | % | | | 35 | % | | | 151 | % | | | 137 | % | | | 38 | % | | | 50 | % |
| Net Assets, End of Period (in thousands) | | | $28,691 | | | | $72,781 | | | | $104,634 | | | | $145,265 | | | | $110,065 | | | | $56,219 | |
Ratio of Operating Expenses (excluding expenses on securities sold short) to Average Net Assets | | | 1.67 | % | | | 1.67 | % | | | 1.66 | % | | | 1.64 | % | | | 1.64 | %(4) | | | 1.63 | % |
| (1) | January 1, 2007 through June 30, 2007. The fund’s fiscal year end was changed from December 31 to June 30, resulting in a six-month annual reporting period. For the years before June 30, 2007, the fund’s fiscal year end was December 31. |
| (2) | Computed using average shares outstanding throughout the period. |
| (3) | Total returns are calculated based on the net asset value of the last business day and do not reflect applicable sales charges. Total returns for periods less than one year are not annualized. |
See Notes to Financial Statements.
| B Class | |
| For a Share Outstanding Throughout the Years Ended June 30 (except as noted) | |
| | | 2011 | | | 2010 | | | 2009 | | | 2008 | | | 2007(1) | | | 2006 | |
| Per-Share Data | |
| Net Asset Value, Beginning of Period | | | $9.66 | | | | $9.76 | | | | $10.76 | | | | $11.11 | | | | $10.35 | | | | $9.94 | |
Income From Investment Operations | | | | | | | | | | | | | | | | | | | | | | | | |
Net Investment Income (Loss)(2) | | | (0.32 | ) | | | (0.26 | ) | | | (0.26 | ) | | | — | (3) | | | 0.09 | | | | 0.12 | |
Net Realized and Unrealized Gain (Loss) | | | 0.57 | | | | 0.16 | | | | (0.74 | ) | | | (0.18 | ) | | | 0.67 | | | | 0.29 | |
Total From Investment Operations | | | 0.25 | | | | (0.10 | ) | | | (1.00 | ) | | | (0.18 | ) | | | 0.76 | | | | 0.41 | |
| Distributions | | | | | | | | | | | | | | | | | | | | | | | | |
From Net Investment Income | | | — | | | | — | | | | — | | | | (0.17 | ) | | | — | | | | — | |
Net Asset Value, End of Period | | | $9.91 | | | | $9.66 | | | | $9.76 | | | | $10.76 | | | | $11.11 | | | | $10.35 | |
| | | | | | | | | | | | | | | | | | | | | | | | | |
Total Return(4) | | | 2.59 | % | | | (1.02 | )% | | | (9.29 | )% | | | (1.63 | )% | | | 7.34 | % | | | 4.12 | % |
| | | | | | | | | | | | | | | | | | | | | | | | | |
| Ratios/Supplemental Data | |
Ratio of Operating Expenses to Average Net Assets | | | 4.50 | % | | | 4.09 | % | | | 4.34 | % | | | 3.89 | % | | | 3.71 | %(5) | | | 4.45 | % |
Ratio of Net Investment Income (Loss) to Average Net Assets | | | (3.34 | )% | | | (2.68 | )% | | | (2.56 | )% | | | (0.10 | )% | | | 1.61 | %(5) | | | 1.17 | % |
| Portfolio Turnover Rate | | | 261 | % | | | 140 | % | | | 330 | % | | | 356 | % | | | 181 | % | | | 428 | % |
| Portfolio Turnover Rate Excluding Short Sales | | | 85 | % | | | 35 | % | | | 151 | % | | | 137 | % | | | 38 | % | | | 50 | % |
| Net Assets, End of Period (in thousands) | | | $1,609 | | | | $2,276 | | | | $3,069 | | | | $3,071 | | | | $3,020 | | | | $1,505 | |
Ratio of Operating Expenses (excluding expenses on securities sold short) to Average Net Assets | | | 2.42 | % | | | 2.42 | % | | | 2.41 | % | | | 2.39 | % | | | 2.39 | %(5) | | | 2.38 | % |
| (1) | January 1, 2007 through June 30, 2007. The fund’s fiscal year end was changed from December 31 to June 30, resulting in a six-month annual reporting period. For the years before June 30, 2007, the fund’s fiscal year end was December 31. |
| (2) | Computed using average shares outstanding throughout the period. |
| (3) | Per-share amount was less than $0.005. |
| (4) | Total returns are calculated based on the net asset value of the last business day and do not reflect applicable sales charges. Total returns for periods less than one year are not annualized. |
See Notes to Financial Statements.
| C Class | |
| For a Share Outstanding Throughout the Years Ended June 30 (except as noted) | |
| | | 2011 | | | 2010 | | | 2009 | | | 2008 | | | 2007(1) | | | 2006 | |
| Per-Share Data | |
| Net Asset Value, Beginning of Period | | | $9.65 | | | | $9.76 | | | | $10.75 | | | | $11.11 | | | | $10.35 | | | | $9.94 | |
Income From Investment Operations | | | | | | | | | | | | | | | | | | | | | | | | |
Net Investment Income (Loss)(2) | | | (0.32 | ) | | | (0.26 | ) | | | (0.26 | ) | | | — | (3) | | | 0.09 | | | | 0.12 | |
Net Realized and Unrealized Gain (Loss) | | | 0.58 | | | | 0.15 | | | | (0.73 | ) | | | (0.19 | ) | | | 0.67 | | | | 0.29 | |
Total From Investment Operations | | | 0.26 | | | | (0.11 | ) | | | (0.99 | ) | | | (0.19 | ) | | | 0.76 | | | | 0.41 | |
| Distributions | | | | | | | | | | | | | | | | | | | | | | | | |
From Net Investment Income | | | — | | | | — | | | | — | | | | (0.17 | ) | | | — | | | | — | |
Net Asset Value, End of Period | | | $9.91 | | | | $9.65 | | | | $9.76 | | | | $10.75 | | | | $11.11 | | | | $10.35 | |
| | | | | | | | | | | | | | | | | | | | | | | | | |
Total Return(4) | | | 2.69 | % | | | (1.13 | )% | | | (9.21 | )% | | | (1.72 | )% | | | 7.34 | % | | | 4.12 | % |
| | | | | | | | | | | | | | | | | | | | | | | | | |
| Ratios/Supplemental Data | |
Ratio of Operating Expenses to Average Net Assets | | | 4.50 | % | | | 4.09 | % | | | 4.34 | % | | | 3.89 | % | | | 3.71 | %(5) | | | 4.45 | % |
Ratio of Net Investment Income (Loss) to Average Net Assets | | | (3.34 | )% | | | (2.68 | )% | | | (2.56 | )% | | | (0.10 | )% | | | 1.61 | %(5) | | | 1.17 | % |
| Portfolio Turnover Rate | | | 261 | % | | | 140 | % | | | 330 | % | | | 356 | % | | | 181 | % | | | 428 | % |
| Portfolio Turnover Rate Excluding Short Sales | | | 85 | % | | | 35 | % | | | 151 | % | | | 137 | % | | | 38 | % | | | 50 | % |
| Net Assets, End of Period (in thousands) | | | $6,845 | | | | $10,543 | | | | $17,821 | | | | $20,673 | | | | $19,690 | | | | $8,393 | |
Ratio of Operating Expenses (excluding expenses on securities sold short) to Average Net Assets | | | 2.42 | % | | | 2.42 | % | | | 2.41 | % | | | 2.39 | % | | | 2.39 | %(5) | | | 2.38 | % |
| (1) | January 1, 2007 through June 30, 2007. The fund’s fiscal year end was changed from December 31 to June 30, resulting in a six-month annual reporting period. For the years before June 30, 2007, the fund’s fiscal year end was December 31. |
| (2) | Computed using average shares outstanding throughout the period. |
| (3) | Per-share amount was less than $0.005. |
| (4) | Total returns are calculated based on the net asset value of the last business day and do not reflect applicable sales charges. Total returns for periods less than one year are not annualized. |
See Notes to Financial Statements.
| R Class | |
| For a Share Outstanding Throughout the Years Ended June 30 (except as noted) | |
| | | 2011 | | | 2010 | | | 2009 | | | 2008 | | | 2007(1) | | | 2006 | |
| Per-Share Data | |
| Net Asset Value, Beginning of Period | | | $9.84 | | | | $9.89 | | | | $10.85 | | | | $11.18 | | | | $10.39 | | | | $9.96 | |
Income From Investment Operations | | | | | | | | | | | | | | | | | | | | | | | | |
Net Investment Income (Loss)(2) | | | (0.26 | ) | | | (0.21 | ) | | | (0.22 | ) | | | 0.04 | | | | 0.11 | | | | 0.17 | |
Net Realized and Unrealized Gain (Loss) | | | 0.57 | | | | 0.16 | | | | (0.74 | ) | | | (0.17 | ) | | | 0.68 | | | | 0.29 | |
Total From Investment Operations | | | 0.31 | | | | (0.05 | ) | | | (0.96 | ) | | | (0.13 | ) | | | 0.79 | | | | 0.46 | |
| Distributions | | | | | | | | | | | | | | | | | | | | | | | | |
From Net Investment Income | | | — | | | | — | | | | — | | | | (0.20 | ) | | | — | | | | (0.03 | ) |
Net Asset Value, End of Period | | | $10.15 | | | | $9.84 | | | | $9.89 | | | | $10.85 | | | | $11.18 | | | | $10.39 | |
| | | | | | | | | | | | | | | | | | | | | | | | | |
Total Return(3) | | | 3.15 | % | | | (0.51 | )% | | | (8.85 | )% | | | (1.19 | )% | | | 7.60 | % | | | 4.57 | % |
| | | | | | | | | | | | | | | | | | | | | | | | | |
| Ratios/Supplemental Data | |
Ratio of Operating Expenses to Average Net Assets | | | 4.00 | % | | | 3.59 | % | | | 3.84 | % | | | 3.39 | % | | | 3.21 | %(4) | | | 3.95 | % |
Ratio of Net Investment Income (Loss) to Average Net Assets | | | (2.84 | )% | | | (2.18 | )% | | | (2.06 | )% | | | 0.40 | % | | | 2.11 | %(4) | | | 1.67 | % |
| Portfolio Turnover Rate | | | 261 | % | | | 140 | % | | | 330 | % | | | 356 | % | | | 181 | % | | | 428 | % |
| Portfolio Turnover Rate Excluding Short Sales | | | 85 | % | | | 35 | % | | | 151 | % | | | 137 | % | | | 38 | % | | | 50 | % |
| Net Assets, End of Period (in thousands) | | | $837 | | | | $586 | | | | $1,004 | | | | $694 | | | | $561 | | | | $521 | |
Ratio of Operating Expenses (excluding expenses on securities sold short) to Average Net Assets | | | 1.92 | % | | | 1.92 | % | | | 1.91 | % | | | 1.89 | % | | | 1.89 | %(4) | | | 1.88 | % |
| (1) | January 1, 2007 through June 30, 2007. The fund’s fiscal year end was changed from December 31 to June 30, resulting in a six-month annual reporting period. For the years before June 30, 2007, the fund’s fiscal year end was December 31. |
| (2) | Computed using average shares outstanding throughout the period. |
| (3) | Total returns are calculated based on the net asset value of the last business day. Total returns for periods less than one year are not annualized. |
See Notes to Financial Statements.
To the Directors of the American Century Quantitative Equity Funds, Inc.
and Shareholders of the Equity Market Neutral Fund:
In our opinion, the accompanying statement of assets and liabilities, including the schedule of investments, and the related statements of operations and of changes in net assets and the financial highlights present fairly, in all material respects, the financial position of the Equity Market Neutral Fund (one of the eleven funds comprising the American Century Quantitative Equity Funds, Inc., hereafter referred to as the “Fund”) at June 30, 2011, the results of its operations for the year then ended, the changes in its net assets for each of the two years in the period then ended and the financial highlights for each of the periods presented, in conformity with accounting principles generally accepted in the United States of America. These financial statements and financial highlights (hereafter referred to as “financial statements”) are the responsibility of the Fund’s management; our responsibility is to express an opinion on these financial statements based on our audits. We conducted our audits of these financial statements in accordance with the standards of the Public Company Accounting Oversight Board (United States). Those standards require that we plan and perform the audit to obtain reasonable assurance about whether the financial statements are free of material misstatement. An audit includes examining, on a test basis, evidence supporting the amounts and disclosures in the financial statements, assessing the accounting principles used and significant estimates made by management, and evaluating the overall financial statement presentation. We believe that our audits, which included confirmation of securities at June 30, 2011 by correspondence with the custodian and brokers, provide a reasonable basis for our opinion.
PricewaterhouseCoopers LLP
Kansas City, Missouri
August 18, 2011
The individuals listed below serve as directors of the funds. Each director will continue to serve in this capacity until death, retirement, resignation or removal from office. The mandatory retirement age for directors who are not “interested persons,” as that term is defined in the Investment Company Act (independent directors), is 73. However, the mandatory retirement age may be extended for a period not to exceed two years with the approval of the remaining independent directors.
Mr. Thomas is the only director who is an “interested person” because he currently serves as President and Chief Executive Officer of American Century Companies, Inc. (ACC), the parent company of American Century Investment Management, Inc. (ACIM or the advisor).
The other directors (more than three-fourths of the total number) are independent; that is, they have never been employees, directors or officers of, and have no financial interest in, ACC or any of its wholly owned, direct or indirect, subsidiaries, including ACIM, American Century Investment Services, Inc. (ACIS) and American Century Services, LLC (ACS). The directors serve in this capacity for eight (in the case of Mr. Thomas, 15) registered investment companies in the American Century Investments family of funds.
The following presents additional information about the directors. The mailing address for each director other than Mr. Thomas is 1665 Charleston Road, Mountain View, California 94043. The mailing address for Mr. Thomas is 4500 Main Street, Kansas City, Missouri 64111.
Name (Year of Birth) | Position(s) Held with Funds | | Length of Time Served | Principal Occupation(s) During Past 5 Years | | Number of American Century Portfolios Overseen by Director | Other Directorships Held During Past 5 Years |
| Independent Directors |
| Tanya S. Beder (1955) | Director | | Since 2011 | Chairman, SBCC Group Inc. (investment advisory services)(2006 to present); Fellow in Practice, International Center for Finance, Yale University School of Management (1985 to present); Chief Executive Officer, Tribeca Global Management LLC (asset management firm) (2004 to 2006) | | 40 | None |
| Jeremy I. Bulow (1954) | Director | | Since 2011 | Professor of Economics, Stanford University, Graduate School of Business (1979 to present) | | 40 | None |
| John Freidenrich (1937) | Director | | Since 2005 | Founder, Member and Manager, Regis Management Company, LLC (investment management firm) (April 2004 to present) | | 40 | None |
Name (Year of Birth) | Position(s) Held with Funds | | Length of Time Served | Principal Occupation(s) During Past 5 Years | | Number of American Century Portfolios Overseen by Director | Other Directorships Held During Past 5 Years |
| Independent Directors |
| Ronald J. Gilson (1946) | Director and Chairman of the Board | | Since 1995 | Charles J. Meyers Professor of Law and Business, Stanford Law School (1979 to present); Marc and Eva Stern Professor of Law and Business, Columbia University School of Law (1992 to present) | | 40 | None |
| Frederick L. A. Grauer (1946) | Director | | Since 2008 | Senior Advisor, BlackRock, Inc. (investment management firm) (2010 to 2011); Senior Advisor, Barclays Global Investors (investment management firm) (2003 to 2009) | | 40 | None |
| Peter F. Pervere (1947) | Director | | Since 2007 | Retired | | 40 | Intraware, Inc. (2003 to 2009) |
| Myron S. Scholes (1941) | Director | | Since 1980 | Chairman, Platinum Grove Asset Management, L.P. (asset manager) (1999 to 2009); Frank E. Buck Professor of Finance-Emeritus, Stanford Graduate School of Business (1996 to present) | | 40 | Dimensional Fund Advisors (investment advisor); CME Group, Inc. (futures and options exchange) |
| John B. Shoven (1947) | Director | | Since 2002 | Professor of Economics, Stanford University (1973 to present) | | 40 | Cadence Design Systems; Exponent; Financial Engines; Watson Wyatt Worldwide (2002 to 2006) |
| |
| Interested Director |
| Jonathan S. Thomas (1963) | Director and President | | Since 2007 | President and Chief Executive Officer, ACC (March 2007 to present); Chief Administrative Officer, ACC (February 2006 to February 2007); Executive Vice President, ACC (November 2005 to February 2007). Also serves as: Chief Executive Officer and Manager, ACS; Executive Vice President, ACIM; Director, ACC, ACIM and other ACC subsidiaries | | 104 | None |
Officers
The following table presents certain information about the executive officers of the funds. Each officer serves as an officer for each of the 15 investment companies in the American Century family of funds, unless otherwise noted. No officer is compensated for his or her service as an officer of the funds. The listed officers are interested persons of the funds and are appointed or re-appointed on an annual basis. The mailing address for each of the officers listed below is 4500 Main Street, Kansas City, Missouri 64111.
Name (Year of Birth) | Offices with the Funds | | Principal Occupation(s) During the Past Five Years |
Jonathan S. Thomas (1963) | Director and President since 2007 | | President and Chief Executive Officer, ACC (March 2007 to present); Chief Administrative Officer, ACC (February 2006 to February 2007); Executive Vice President, ACC (November 2005 to February 2007). Also serves as: Chief Executive Officer and Manager, ACS; Executive Vice President, ACIM; Director, ACC, ACIM and other ACC subsidiaries |
Barry Fink (1955) | Executive Vice President since 2007 | | Chief Operating Officer and Executive Vice President, ACC (September 2007 to present); President, ACS (October 2007 to present); Managing Director, Morgan Stanley (2000 to 2007); Global General Counsel, Morgan Stanley (2000 to 2006). Also serves as: Manager, ACS and Director, ACC and certain ACC subsidiaries |
Maryanne L. Roepke (1956) | Chief Compliance Officer since 2006 and Senior Vice President since 2000 | | Chief Compliance Officer, American Century funds, ACIM and ACS (August 2006 to present); Assistant Treasurer, ACC (January 1995 to August 2006); and Treasurer and Chief Financial Officer, various American Century funds (July 2000 to August 2006). Also serves as: Senior Vice President, ACS |
| Charles A. Etherington (1957) | General Counsel since 2007 and Senior Vice President since 2006 | | Attorney, ACC (February 1994 to present); Vice President, ACC (November 2005 to present), General Counsel, ACC (March 2007 to present); Also serves as General Counsel, ACIM, ACS, ACIS and other ACC subsidiaries; and Senior Vice President, ACIM and ACS |
| Robert J. Leach (1966) | Vice President, Treasurer and Chief Financial Officer since 2006 | | Vice President, ACS (February 2000 to present); and Controller, various American Century funds (1997 to September 2006) |
| David H. Reinmiller (1963) | Vice President since 2001 | | Attorney, ACC (January 1994 to present); Associate General Counsel, ACC (January 2001 to present); Also serves as Vice President, ACIM and ACS |
| Ward D. Stauffer (1960) | Secretary since 2005 | | Attorney, ACC (June 2003 to present) |
The Statement of Additional Information has additional information about the fund’s directors and is available without charge, upon request, by calling 1-800-345-2021.
| Approval of Management Agreement |
At a meeting held on June 28, 2011, the Fund’s Board of Directors/Trustees unanimously approved the renewal of the management agreement pursuant to which American Century Investment Management, Inc. (the “Advisor”) acts as the investment advisor for the Fund. Under Section 15(c) of the Investment Company Act, contracts for investment advisory services are required to be reviewed, evaluated, and approved by a majority of a fund’s independent
directors/trustees (the “Directors”) each year.
As a part of the approval process, the Board requested and reviewed extensive data and information compiled by the Advisor and certain independent providers of evaluation data concerning the Fund and the services provided to the Fund by the Advisor. This review was in addition to the oversight and evaluation undertaken by the Board and its committees on a continuous basis throughout the year and included, but was not limited to the following:
| • | the nature, extent, and quality of investment management, shareholder services, and other services provided by the Advisor to the Fund; |
| the wide range of other programs and services the Advisor provides to the Fund and its shareholders on a routine and non-routine basis; |
| the investment performance of the fund, including data comparing the Fund’s performance to appropriate benchmarks and/or a peer group of other mutual funds with similar investment objectives and strategies; |
| data comparing the cost of owning the Fund to the cost of owning similar funds; |
| the Advisor’s compliance policies, procedures, and regulatory experience; |
| financial data showing the cost of services provided to the Fund, the profitability of the Fund to the Advisor, and the overall profitability of the Advisor; |
| data comparing services provided and charges to other investment management clients of the Advisor; and |
| consideration of collateral benefits derived by the Advisor from the management of the Fund and any potential economies of scale relating thereto. |
In keeping with its practice, the Board held two in-person meetings and one telephonic meeting to review and discuss the information provided. The Board also had the benefit of the advice of its independent counsel throughout the period.
Factors Considered
The Directors considered all of the information provided by the Advisor, the independent data providers, and the Board’s independent counsel, and evaluated such information for the Fund. In connection with their review, the Directors did not identify any single factor as being all-important or controlling, and each Director may have attributed different levels of importance to different factors. In deciding to renew the management agreement, the Board based its decision on a number of factors, including the following:
Nature, Extent and Quality of Services — Generally. Under the management agreement, the Advisor is responsible for providing or arranging for all services necessary for the operation of the Fund. The Board noted that under the management agreement, the Advisor provides or arranges at its own expense a wide variety of services including:
| constructing and designing the Fund |
| portfolio research and security selection |
| initial capitalization/funding |
| daily valuation of the Fund’s portfolio |
| shareholder servicing and transfer agency, including shareholder confirmations, recordkeeping, and communications |
| regulatory and portfolio compliance |
| marketing and distribution |
The Board noted that many of these services have expanded over time both in terms of quantity and complexity in response to shareholder demands, competition in the industry, changing distribution channels, and the changing regulatory environment.
Investment Management Services. The nature of the investment management services provided to the Fund is quite complex and allows Fund shareholders access to professional money management, instant diversification of their investments within an asset class, the opportunity to easily diversify among asset classes by investing in or exchanging among various American Century Investments funds, and liquidity. In evaluating investment performance, the Board expects the Advisor to manage the Fund in accordance with its investment objectives and approved strategies. Further, the Directors recognize that the Advisor has an obligation to seek the best execution of fund trades. In providing these services, the Advisor utilizes teams of investment professionals (portfolio managers, analysts, research assistants, and securities traders) who require extensive information technology, research, training, compliance and other systems to conduct their business. The Board, directly and through its Portfolio Committee, regularly reviews investment performance information for the Fund, together with comparative information for appropriate benchmarks and/or peer groups of similarly-managed funds, over different time horizons. The Directors also review detailed performance information during the management agreement approval
process. If performance concerns are identified, the Fund receives special reviews until performance improves, during which the Board discusses with the Advisor the reasons for such results (e.g., market conditions, security selection) and any efforts being undertaken to improve performance. The Board found the investment management services provided by the Advisor to the Fund to meet or exceed industry standards. More detailed information about the Fund’s performance can be found in the Performance and Portfolio Commentary sections of this report.
Shareholder and Other Services. Under the management agreement, the Advisor provides the Fund with a comprehensive package of transfer agency, shareholder, and other services. The Board, directly and through various committees of the Board, regularly reviews reports and evaluations of such services at its regular meetings. These reports include, but are not limited to, information regarding the operational efficiency and accuracy of the shareholder and transfer agency services provided, staffing levels, shareholder satisfaction (as measured by external as well as internal sources), technology support, new products and services offered to Fund shareholders, securities trading activities, portfolio valuation services, auditing services, and legal and operational compliance activities. Certain aspects of shareholder and transfer agency service level efficiency and the quality of securities trading activities are measured by independent third party providers and are presented in comparison to other fund groups not managed by the Advisor. The Board found the services provided by the Advisor to the Fund under the management agreement to be competitive and of high quality.
Costs of Services and Profitability. The Advisor provides detailed information concerning its cost of providing various services to the Fund, its profitability in managing the Fund, its overall profitability, and its financial condition. The Directors have reviewed with the Advisor the methodology used to prepare this financial information. The financial information regarding the Advisor is considered in evaluating the Advisor’s financial condition, ability to continue to provide services under the management agreement, and the reasonableness of the current management fee. The Board concluded that the Advisor’s profits were reasonable in light of the services provided to the Fund.
Ethics. The Board generally considers the Advisor’s commitment to providing quality services to shareholders and to conducting its business ethically. They noted that the Advisor’s practices generally meet or exceed industry best practices.
Economies of Scale. The Board also reviewed information provided by the Advisor regarding the possible existence of economies of scale in connection with the management of the Fund. The Board concluded that economies of scale are difficult to measure and predict with precision, especially on a fund-by-fund basis. The Board concluded that the Advisor is appropriately sharing economies of scale through its competitive fee structure, offering competitive fees from fund inception, and through reinvestment in its business to provide shareholders additional content and services.
Comparison to Other Funds’ Fees. The management agreement provides that the Fund pay the Advisor a single, all-inclusive (or unified) management fee for providing all services necessary for the management and operation of the Fund, other than brokerage expenses, taxes, interest, extraordinary expenses, and the fees and expenses of the Fund’s independent directors (including their independent legal counsel) and expenses incurred in connection with the provision of shareholder services and distribution services under a plan adopted pursuant to Rule 12b-1 under the 1940 Act. Under the unified fee structure, the Advisor is responsible for providing all investment advisory, custody, audit, administrative, compliance, recordkeeping, marketing and shareholder services, or arranging and supervising third parties to provide such services. By contrast, most other funds are charged a variety of fees, including an investment advisory fee, a transfer agency fee, an administrative fee, distribution charges and other expenses. Other than their investment advisory fees and any applicable Rule 12b-1 distribution fees, all other components of the total fees charged by these other funds may be increased without shareholder approval. The Board believes the unified fee structure is a benefit to Fund shareholders because it clearly discloses to shareholders the cost of owning Fund shares, and, since the unified fee cannot be increased without a vote of Fund shareholders, it shifts to the Advisor the risk of increased costs of operating the Fund and provides a direct incentive to minimize administrative inefficiencies. Part of the Board’s analysis of fee levels involves reviewing certain evaluative data compiled by an independent provider and comparing the Fund’s unified fee to the total expense ratio of other funds in the Fund’s peer group. The Board concluded that the management fee paid by the Fund to the Advisor under the management agreement is reasonable in light of the services provided to the Fund.
Comparison to Fees and Services Provided to Other Clients of the Advisor. The Board also requested and received information from the Advisor concerning the nature of the services, fees, costs and profitability of its advisory services to advisory clients other than the Fund. They observed that these varying types of client accounts require different services and involve different regulatory and entrepreneurial risks than the management of the Fund. The Board analyzed this information and concluded that the fees charged and services provided to the Fund were reasonable by comparison.
Collateral or “Fall-Out” Benefits Derived by the Advisor. The Board considered the existence of collateral benefits the Advisor may receive as a result of its relationship with the Fund. They concluded that the Advisor’s primary business is managing mutual funds and it generally does not use fund or shareholder information to generate profits in other lines of business, and therefore does not derive any significant collateral benefits from them. The Board noted that the Advisor receives proprietary research from broker-dealers that execute fund portfolio transactions and concluded that this research is likely to benefit Fund shareholders. The Board also determined that the Advisor is able to provide investment management services to certain clients other than the Fund, at least in part, due to its existing infrastructure built to serve the fund complex. The Board concluded, however, that the assets of those other clients are not material to the analysis and, where applicable, may be included with the assets of the Fund to determine breakpoints in the management fee schedule.
Existing Relationship. The Board also considered whether there was any reason for not continuing the existing arrangement with the Advisor. In this regard, the Board was mindful of the potential disruptions of the Fund’s operations and various risks, uncertainties, and other effects that could occur as a result of a decision not to continue such relationship. In particular, the Board recognized that most shareholders have invested in the Fund on the strength of the Advisor’s industry standing and reputation and in the expectation that the Advisor will have a continuing role in providing advisory services to the Fund.
Conclusion of the Directors. As a result of this process, the Board, including all of the independent directors and assisted by the advice of independent legal counsel, taking into account all of the factors discussed above and the information provided by the Advisor and others, concluded that the management agreement between the Fund and the Advisor is fair and reasonable in light of the services provided and should be renewed.
Retirement Account Information
As required by law, distributions you receive from certain IRAs, or 403(b), 457 and qualified plans are subject to federal income tax withholding, unless you elect not to have withholding apply. Tax will be withheld on the total amount withdrawn even though you may be receiving amounts that are not subject to withholding, such as nondeductible contributions. In such case, excess amounts of withholding could occur. You may adjust your withholding election so that a greater or lesser amount will be withheld.
If you don’t want us to withhold on this amount, you must notify us to not withhold the federal income tax. You may notify us in writing or in certain situations by telephone or through other electronic means. You have the right to revoke your withholding election at any time and any election you make may remain in effect until revoked by filing a new election.
Remember, even if you elect not to have income tax withheld, you are liable for paying income tax on the taxable portion of your withdrawal. If you elect not to have income tax withheld or you don’t have enough income tax withheld, you may be responsible for payment of estimated tax. You may incur penalties under the estimated tax rules if your withholding and estimated tax payments are not sufficient. You can reduce or defer the income tax on a distribution by directly or indirectly rolling such distribution over to another IRA or eligible plan. You should consult your tax advisor for additional information.
State tax will be withheld if, at the time of your distribution, your address is within one of the mandatory withholding states and you have federal income tax withheld. State taxes will be withheld from your distribution in accordance with the respective state rules.
Proxy Voting Guidelines
American Century Investment Management, Inc., the fund’s investment advisor, is responsible for exercising the voting rights associated with the securities purchased and/or held by the fund. A description of the policies and procedures the advisor uses in fulfilling this responsibility is available without charge, upon request, by calling 1-800-345-2021. It is also available on American Century Investments’ website at americancentury.com and on the Securities and Exchange Commission’s website at sec.gov. Information regarding how the investment advisor voted proxies relating to portfolio securities during the most recent 12-month period ended June 30 is available on the “About Us” page at americancentury.com. It is also available at sec.gov.
Quarterly Portfolio Disclosure
The fund files its complete schedule of portfolio holdings with the Securities and Exchange Commission (SEC) for the first and third quarters of each fiscal year on Form N-Q. The fund’s Forms N-Q are available on the SEC’s website at sec.gov, and may be reviewed and copied at the SEC’s Public Reference Room in Washington, DC. Information on the operation of the Public Reference Room may be obtained by calling 1-800-SEC-0330. The fund also makes its complete schedule of portfolio holdings for the most recent quarter of its fiscal year available on its website at americancentury.com and, upon request, by calling 1-800-345-2021.
| Contact Us | americancentury.com |
| Automated Information Line | 1-800-345-8765 |
| Investor Services Representative | 1-800-345-2021 or 816-531-5575 |
| Investors Using Advisors | 1-800-378-9878 |
| Business, Not-For-Profit, Employer-Sponsored Retirement Plans | 1-800-345-3533 |
| Banks and Trust Companies, Broker-Dealers, Financial Professionals, Insurance Companies | 1-800-345-6488 |
| Telecommunications Device for the Deaf | 1-800-634-4113 |
American Century Quantitative Equity Funds, Inc.
Investment Advisor:
American Century Investment Management, Inc.
Kansas City, Missouri
This report and the statements it contains are submitted for the general information of our shareholders. The report is not authorized for distribution to prospective investors unless preceded or accompanied by an effective prospectus.
©2011 American Century Proprietary Holdings, Inc. All rights reserved.
CL-ANN-72454 1108
ANNUAL REPORT JUNE 30, 2011
| President’s Letter | 2 |
| Market Perspective | 3 |
| Performance | 4 |
| Portfolio Commentary | 6 |
| Fund Characteristics | 8 |
| Shareholder Fee Example | 9 |
| Schedule of Investments | 11 |
| Statement of Assets and Liabilities | 15 |
| Statement of Operations | 16 |
| Statement of Changes in Net Assets | 17 |
| Notes to Financial Statements | 18 |
| Financial Highlights | 24 |
| Report of Independent Registered Public Accounting Firm | 30 |
| Management | 31 |
| Approval of Management Agreement | 34 |
| Additional Information | 39 |
Any opinions expressed in this report reflect those of the author as of the date of the report, and do not necessarily represent the opinions of American Century Investments® or any other person in the American Century Investments organization. Any such opinions are subject to change at any time based upon market or other conditions and American Century Investments disclaims any responsibility to update such opinions. These opinions may not be relied upon as investment advice and, because investment decisions made by American Century Investments funds are based on numerous factors, may not be relied upon as an indication of trading intent on behalf of any American Century Investments fund. Security examples are used for representational purposes only and are not intended as recommendations to purchase or sell securities. Performance information for comparative indices and securities is provided to American Century Investments by third party vendors. To the best of American Century Investments’ knowledge, such information is accurate at the time of printing.
Dear Investor:
Thank you for reviewing this annual report for the period ended June 30, 2011. Our report offers investment performance and portfolio information, presented with the expert perspective and commentary of our portfolio management team.
This report remains one of our most important vehicles for conveying information about investment performance and the market factors and strategies that affect fund returns. For additional, updated information on fund performance, portfolio strategy, and the investment markets, we encourage you to visit our website, americancentury.com. Click on the “Fund Performance” and “Insights & News” headings at the top of our Individual Investors site.
Reporting Period Perspective: Highest Broad Fiscal-Year U.S. Stock Returns Since 1997
Benefitting from favorable conditions and expectations, the U.S. stock market produced exceptional returns, the highest for any 12-month period ended June 30 since the fiscal year ended June 30, 1997. Back then, the S&P 500 Index gained 34.71%, compared with 30.69% for the most-recent reporting period. The intervening 14 years help illustrate how infrequently such a high level of performance occurs, requiring an alignment of economic and market conditions that’s difficult to duplicate.
The exceptional returns experienced during the reporting period represent a rebound from previous declines. After experiencing 10–12% declines during the second quarter of 2010—stemming from the European sovereign debt crisis and double-dip recession fears—most broad U.S. stock indices advanced 30% or more during the following 12 months. Monetary and fiscal intervention in 2010 stimulated growth and fueled investor optimism about economic and financial market conditions in 2011 and 2012, encouraging investments in riskier assets.
However, that optimism has diminished in the summer of 2011 as the European debt crisis returned to prominence and other debt and economic challenges emerged. As the reporting period came to a close in June 2011, we saw increasing signs that the U.S. economic recovery had lost momentum. As a result, economic growth forecasts were reduced, and broad U.S. stock indices trended downward beginning in May. As we enter the third quarter of 2011, investor concern over fiscal austerity measures in the U.S. and other developed economies raised fears of a return to recession and accelerated a decline in global equity markets. We appreciate your continued trust in us during these uncertain times.
Sincerely,
Jonathan Thomas
President and Chief Executive Officer
American Century Investments
By Scott Wittman, Chief Investment Officer, Quantitative Equity and Asset Allocation
U.S. Stocks Soared as Economy Improved
The U.S. stock market enjoyed very strong results for the 12 months ended June 30, 2011, with the broad equity indices returning more than 30%. The main catalyst for the sharp rally in stocks was growing investor confidence in a U.S. economic recovery, though that confidence faltered somewhat late in the period.
After a bumpy start resulting from an uncertain economic outlook, the equity market began a steady rise in September 2010 as improving economic data reassured investors that the economy would avoid a “double-dip” recession (a return to recession after a brief period of recovery). Most notably, employment growth turned positive after 2½ years of persistent job losses, and the manufacturing sector showed signs of life. In addition, a renewal of the Federal Reserve’s quantitative easing program and an extension of expiring federal tax breaks further boosted the market’s confidence that a promising economic recovery
was under way.
Stocks continued to advance in early 2011 despite unrest in the Middle East and North Africa, as well as a devastating earthquake and tsunami in Japan. By May, however, evidence of a slowdown in economic activity and renewed concerns about a European sovereign debt crisis weighed on investor confidence. As a result, stocks experienced a modest pullback in the final two months of the period.
Smaller Stocks and Growth-Oriented Issues Outperformed
Despite finishing on a down note, the broad equity indices posted robust returns overall for the 12-month period. As the table below illustrates, mid- and small-cap issues generated the best returns, outpacing large-cap shares. Meanwhile, growth stocks outperformed value across all market capitalizations, most dramatically among smaller companies. Every sector of the market produced double-digit gains for the period, led by energy and materials stocks, which benefited from strong demand and rising commodity prices. Other economically sensitive sectors—such as consumer discretionary and industrials—also fared well. The laggard was the financials sector, which continued to face mortgage-related challenges and regulatory uncertainty.
| U.S. Stock Index Returns |
| For the 12 months ended June 30, 2011 |
| Russell 1000 Index (Large-Cap) | 31.93% | | Russell 2000 Index (Small-Cap) | 37.41% |
| Russell 1000 Growth Index | 35.01% | | Russell 2000 Growth Index | 43.50% |
| Russell 1000 Value Index | 28.94% | | Russell 2000 Value Index | 31.35% |
| Russell Midcap Index | 38.47% | | | |
| Russell Midcap Growth Index | 43.25% | | | |
| Russell Midcap Value Index | 34.28% | | | |
| Total Returns as of June 30, 2011 |
| | | | Average Annual Returns | |
| | Ticker Symbol | 1 year | 5 years | 10 years | Since Inception | Inception Date |
| Investor Class | BIGRX | 30.31%(1) | 1.34% | 2.65% | 9.50% | 12/17/90 |
| S&P 500 Index | — | 30.69% | 2.94% | 2.72% | 9.22%(2) | — |
| Institutional Class | AMGIX | 30.61%(1) | 1.55% | 2.85% | 4.15% | 1/28/98 |
A Class(3) No sales charge* With sales charge* | AMADX | 30.02%(1) 22.55% | 1.10% -0.09% | 2.39% 1.78% | 3.74% 3.28% | 12/15/97 |
B Class No sales charge* With sales charge* | AIGBX | 29.02% 25.02% | — — | — — | -4.15% -5.06% | 9/28/07 |
| C Class | ACGCX | 29.04% | 0.34% | 1.62% | 1.64% | 6/28/01 |
| R Class | AICRX | 29.73% | 0.84% | — | 4.50% | 8/29/03 |
*Sales charges include initial sales charges and contingent deferred sales charges (CDSCs), as applicable. A Class shares have a maximum 5.75% initial sales charge and may be subject to a maximum CDSC of 1.00%. B Class shares redeemed within six years of purchase are subject to a CDSC that declines from 5.00% during the first year after purchase to 0.00% the sixth year after purchase. C Class shares redeemed within 12 months of purchase are subject to a maximum CDSC of 1.00%. The SEC requires that mutual funds provide performance information net of maximum sales charges in all cases where charges could be applied.
| (1) | Extraordinary performance is attributable in part to unusually favorable market conditions and may not be repeated or consistently achieved in the future. |
| (2) | Since 12/31/90, the date nearest the Investor Class’s inception for which data are available. |
| (3) | Prior to September 4, 2007, the A Class was referred to as the Advisor Class and did not have a front-end sales charge. Performance prior to that date has been adjusted to reflect this charge. |
Data presented reflect past performance. Past performance is no guarantee of future results. Current performance may be higher or lower than the performance shown. Investment return and principal value will fluctuate, and redemption value may be more or less than original cost. To obtain performance data current to the most recent month end, please call 1-800-345-2021 or visit americancentury.com. International investing involves special risks, such as political instability and currency fluctuations.
Unless otherwise indicated, performance reflects Investor Class shares; performance for other share classes will vary due to differences in fee structure. For information about other share classes available, please consult the prospectus. Data assumes reinvestment of dividends and capital gains, and none of the charts reflect the deduction of taxes that a shareholder would pay on fund distributions or the redemption of fund shares. Returns for the index are provided for comparison. The fund’s total returns include operating expenses (such as transaction costs and management fees) that reduce returns, while the total returns of the index do not.
| Growth of $10,000 Over 10 Years |
| $10,000 investment made June 30, 2001 |
| Total Annual Fund Operating Expenses |
| Investor Class | Institutional Class | A Class | B Class | C Class | R Class |
| 0.70% | 0.50% | 0.95% | 1.70% | 1.70% | 1.20% |
The total annual fund operating expenses shown is as stated in the fund’s prospectus current as of the date of this report. The prospectus may vary from the expense ratio shown elsewhere in this report because it is based on a different time period, includes acquired fund fees and expenses, and, if applicable, does not include fee waivers or expense reimbursements.
Data presented reflect past performance. Past performance is no guarantee of future results. Current performance may be higher or lower than the performance shown. Investment return and principal value will fluctuate, and redemption value may be more or less than original cost. To obtain performance data current to the most recent month end, please call 1-800-345-2021 or visit americancentury.com. International investing involves special risks, such as political instability and currency fluctuations.
Unless otherwise indicated, performance reflects Investor Class shares; performance for other share classes will vary due to differences in fee structure. For information about other share classes available, please consult the prospectus. Data assumes reinvestment of dividends and capital gains, and none of the charts reflect the deduction of taxes that a shareholder would pay on fund distributions or the redemption of fund shares. Returns for the index are provided for comparison. The fund’s total returns include operating expenses (such as transaction costs and management fees) that reduce returns, while the total returns of the index do not.
Portfolio Managers: Brian Garbe and Claudia Musat
Performance Summary
Income & Growth returned 30.31%* for the fiscal year ended June 30, 2011, compared with the 30.69% return of its benchmark, the S&P 500 Index.
Income & Growth posted a strong absolute return for the 12 months, reflecting a robust stock market rally during the period (see page 3 for details). The fund’s return narrowly trailed that of the S&P 500 for the reporting period, though it outperformed the index over the last six months. It’s worth noting that Income & Growth nearly kept pace with the S&P 500 for the 12-month period despite the fund’s tilt toward value, as value-oriented stocks underperformed by a wide margin.
Materials and Energy Boosted Absolute Results
On an absolute basis, every sector of the Income & Growth fund posted double-digit gains for the 12 months. The best-performing sectors in the portfolio were materials and energy, both of which returned more than 50% for the reporting period. Together, these two sectors accounted for five of the fund’s top eight performance contributors, led by oil and gas producers Exxon Mobil and Chevron. Other leading contributors included metals producer Freeport-McMoRan Copper & Gold, energy producer ConocoPhillips, and chemicals company E.I. du Pont de Nemours.
The fund’s telecommunication services holdings also performed well during the reporting period. The best contributors in this sector were diversified telecom services providers AT&T and Verizon Communications.
The fund’s holdings in the utilities and financials sectors posted the lowest returns for the 12 months. The most significant decliners from these sectors included independent power producer Constellation Energy and financial services provider Bank of America. Other notable detractors from absolute performance included consumer electronics retailer Best Buy, printer maker Lexmark International, and metals producer Newmont Mining.
Health Care and Financials Outperformed
Looking at relative performance, Income & Growth’s holdings in the health care and financials sectors had the biggest positive impact on performance versus the S&P 500 for the fiscal year. The bulk of the outperformance in the health care sector resulted from stock selection among biotechnology firms and health care providers. The leading contributor was biotech company Biogen Idec, which saw earnings expectations rise thanks to robust sales of its multiple sclerosis medications. Health care providers Humana and UnitedHealth Group rallied as subscriber growth increased and costs declined.
| * | All fund returns referenced in this commentary are for Investor Class shares. |
When it comes to stock selection, underweighting stocks that don’t perform well is just as important as overweighting stocks that do perform well, and this was a key factor in the outperformance of the fund’s financials holdings. Compared with the index, the fund held an underweight position in insurance giant Berkshire Hathaway, which fell modestly during the 12 months as the company’s chief investment officer resigned abruptly.
Other top contributors to performance versus the S&P 500 included metals producer Freeport-McMoRan Copper & Gold, which benefited from a sharp rise in commodity prices, and auto parts maker TRW Automotive, which continued to benefit from a recovery in the auto industry. Another favorable decision was an underweight position in network products maker Cisco Systems, which tumbled by more than 25% as the company lowered its growth projections for the coming year amid growing competition in its core markets.
Technology and Consumer Discretionary Detracted
Income & Growth’s holdings in the information technology and consumer discretionary sectors underperformed their counterparts in the S&P 500 for the reporting period. Stock selection among computer hardware makers, software companies, and internet services providers detracted the most in the information technology sector. The most significant detractors in this sector included IT services provider Computer Sciences and internet provider AOL. Computer Sciences tumbled late in the period as a decline in government spending led to an earnings disappointment, while AOL faced investor concerns about declining advertising revenues and the company’s purchase of online media firm Huffington Post.
In the consumer discretionary sector, stock choices among specialty retailers and an underweight position in internet retailers had the biggest negative impact. Consumer electronics retailer Best Buy was the largest individual detractor in the portfolio; the company reported declining same-store sales, higher operating costs, and market share declines that weighed on the stock.
A Look Ahead
The eye-catching turmoil in the headlines over the last six months—democratic change sweeping through the Middle East, a devastating natural disaster in Japan, the possibility of a sovereign debt default in Europe—has led to heightened uncertainty and growing volatility in the equity market. But when you look at the past decade, there have been many other dramatic events that have had a similar impact on the market. When viewed through this lens, change and volatility have become more the rule than the exception.
It is this change dynamic that our investment process seeks to exploit and capitalize upon. Change and volatility leads to market inefficiencies, and within these inefficiencies lie investment opportunities. Rather than base investment decisions on vague financial headlines, we use our disciplined, data-driven, multi-factor investment process to take advantage of inefficiencies at the individual company level. We believe this approach will produce favorable returns over the long term.
| JUNE 30, 2011 |
| Top Ten Holdings | % of net assets |
| Exxon Mobil Corp. | 3.3% |
| International Business Machines Corp. | 2.4% |
| Microsoft Corp. | 2.4% |
| Chevron Corp. | 2.4% |
| Johnson & Johnson | 2.1% |
| AT&T, Inc. | 2.0% |
| Apple, Inc. | 1.9% |
| Procter & Gamble Co. (The) | 1.8% |
| General Electric Co. | 1.7% |
| Intel Corp. | 1.7% |
| |
| Top Five Industries | % of net assets |
| Oil, Gas & Consumable Fuels | 11.1% |
| Pharmaceuticals | 6.8% |
| Insurance | 5.1% |
| Computers & Peripherals | 4.1% |
| IT Services | 3.9% |
| | |
| Types of Investments in Portfolio | % of net assets |
| Domestic Common Stocks | 92.4% |
| Foreign Common Stocks* | 5.4% |
| Total Common Stocks | 97.8% |
| Temporary Cash Investments | 1.6% |
| Other Assets and Liabilities | 0.6% |
| *Includes depositary shares, dual listed securities and foreign ordinary shares. |
Fund shareholders may incur two types of costs: (1) transaction costs, including sales charges (loads) on purchase payments and redemption/exchange fees; and (2) ongoing costs, including management fees; distribution and service (12b-1) fees; and other fund expenses. This example is intended to help you understand your ongoing costs (in dollars) of investing in your fund and to compare these costs with the ongoing cost of investing in other mutual funds.
The example is based on an investment of $1,000 made at the beginning of the period and held for the entire period from January 1, 2011 to June 30, 2011.
Actual Expenses
The table provides information about actual account values and actual expenses for each class. You may use the information, together with the amount you invested, to estimate the expenses that you paid over the period. First, identify the share class you own. Then simply divide your account value by $1,000 (for example, an $8,600 account value divided by $1,000 = 8.6), then multiply the result by the number under the heading “Expenses Paid During Period” to estimate the expenses you paid on your account during this period.
If you hold Investor Class shares of any American Century Investments fund, or Institutional Class shares of the American Century Diversified Bond Fund, in an American Century Investments account (i.e., not a financial intermediary or retirement plan account), American Century Investments may charge you a $12.50 semiannual account maintenance fee if the value of those shares is less than $10,000. We will redeem shares automatically in one of your accounts to pay the $12.50 fee. In determining your total eligible investment amount, we will include your investments in all personal accounts (including American Century Investments Brokerage accounts) registered under your Social Security number. Personal accounts include individual accounts, joint accounts, UGMA/UTMA accounts, personal trusts, Coverdell Education Savings Accounts and IRAs (including traditional, Roth, Rollover, SEP-, SARSEP- and SIMPLE-IRAs), and certain other retirement accounts. If you have only business, business retirement, employer-sponsored or American Century Investments Brokerage accounts, you are currently not subject to this fee. We will not charge the fee as long as you choose to manage your accounts exclusively online. If you are subject to the Account Maintenance Fee, your account value could be reduced by the fee amount.
Hypothetical Example for Comparison Purposes
The table also provides information about hypothetical account values and hypothetical expenses based on the actual expense ratio of each class of your fund and an assumed rate of return of 5% per year before expenses, which is not the actual return of a fund’s share class. The hypothetical account values and expenses may not be used to estimate the actual ending account balance or expenses you paid for the period. You may use this information to compare the ongoing costs of investing in your fund and other funds. To do so, compare this 5% hypothetical example with the 5% hypothetical examples that appear in the shareholder reports of the other funds.
Please note that the expenses shown in the table are meant to highlight your ongoing costs only and do not reflect any transactional costs, such as sales charges (loads) or redemption/exchange fees. Therefore, the table is useful in comparing ongoing costs only, and will not help you determine the relative total costs of owning different funds. In addition, if these transactional costs were included, your costs would have been higher.
| | Beginning Account Value 1/1/11 | Ending Account Value 6/30/11 | Expenses Paid During Period* 1/1/11 – 6/30/11 | Annualized Expense Ratio* |
| Actual |
| Investor Class | $1,000 | $1,070.50 | $3.49 | 0.68% |
| Institutional Class | $1,000 | $1,071.80 | $2.47 | 0.48% |
| A Class | $1,000 | $1,069.30 | $4.77 | 0.93% |
| B Class | $1,000 | $1,065.60 | $8.60 | 1.68% |
| C Class | $1,000 | $1,065.40 | $8.60 | 1.68% |
| R Class | $1,000 | $1,068.00 | $6.05 | 1.18% |
| Hypothetical |
| Investor Class | $1,000 | $1,021.42 | $3.41 | 0.68% |
| Institutional Class | $1,000 | $1,022.41 | $2.41 | 0.48% |
| A Class | $1,000 | $1,020.18 | $4.66 | 0.93% |
| B Class | $1,000 | $1,016.46 | $8.40 | 1.68% |
| C Class | $1,000 | $1,016.46 | $8.40 | 1.68% |
| R Class | $1,000 | $1,018.94 | $5.91 | 1.18% |
*Expenses are equal to the class’s annualized expense ratio listed in the table above, multiplied by the average account value over the period, multiplied by 181, the number of days in the most recent fiscal half-year, divided by 365, to reflect the one-half year period.
| | | Shares | | | Value | |
| Common Stocks — 97.8% | |
| AEROSPACE & DEFENSE — 3.2% | |
| General Dynamics Corp. | | | 208,698 | | | | $15,552,175 | |
| Honeywell International, Inc. | | | 85,420 | | | | 5,090,178 | |
| Lockheed Martin Corp. | | | 6,981 | | | | 565,252 | |
| Northrop Grumman Corp. | | | 209,184 | | | | 14,506,910 | |
| Raytheon Co. | | | 74,317 | | | | 3,704,702 | |
| United Technologies Corp. | | | 132,841 | | | | 11,757,757 | |
| | | | | | | | 51,176,974 | |
| AIR FREIGHT & LOGISTICS — 1.1% | |
| United Parcel Service, Inc., Class B | | | 247,011 | | | | 18,014,512 | |
| AUTO COMPONENTS — 1.0% | |
| Magna International, Inc. | | | 87,497 | | | | 4,728,338 | |
TRW Automotive Holdings Corp.(1) | | | 188,755 | | | | 11,142,208 | |
| | | | | | | | 15,870,546 | |
| AUTOMOBILES — 0.6% | |
Ford Motor Co.(1) | | | 729,561 | | | | 10,060,646 | |
| BEVERAGES — 1.8% | |
| Coca-Cola Co. (The) | | | 144,839 | | | | 9,746,216 | |
| Coca-Cola Enterprises, Inc. | | | 131,962 | | | | 3,850,651 | |
| Dr Pepper Snapple Group, Inc. | | | 335,658 | | | | 14,074,140 | |
| PepsiCo, Inc. | | | 21,362 | | | | 1,504,526 | |
| | | | | | | | 29,175,533 | |
| BIOTECHNOLOGY — 2.1% | |
Amgen, Inc.(1) | | | 204,627 | | | | 11,939,985 | |
Biogen Idec, Inc.(1) | | | 138,266 | | | | 14,783,401 | |
Cephalon, Inc.(1) | | | 81,180 | | | | 6,486,282 | |
| | | | | | | | 33,209,668 | |
| CAPITAL MARKETS — 1.4% | |
| Ameriprise Financial, Inc. | | | 6,044 | | | | 348,618 | |
| Bank of New York Mellon Corp. (The) | | | 428,928 | | | | 10,989,135 | |
| Legg Mason, Inc. | | | 346,770 | | | | 11,360,185 | |
| | | | | | | | 22,697,938 | |
| CHEMICALS — 2.2% | |
| E.I. du Pont de Nemours & Co. | | | 299,830 | | | | 16,205,811 | |
| Minerals Technologies, Inc. | | | 11,788 | | | | 781,427 | |
| Monsanto Co. | | | 59,555 | | | | 4,320,120 | |
OM Group, Inc.(1) | | | 57,120 | | | | 2,321,357 | |
| PPG Industries, Inc. | | | 137,975 | | | | 12,526,750 | |
| | | | | | | | 36,155,465 | |
| COMMERCIAL BANKS — 2.2% | |
| CapitalSource, Inc. | | | 36,242 | | | | 233,761 | |
| U.S. Bancorp. | | | 545,781 | | | | 13,922,873 | |
| Wells Fargo & Co. | | | 778,945 | | | | 21,857,197 | |
| | | | | | | | 36,013,831 | |
| COMMUNICATIONS EQUIPMENT — 0.2% | |
| Cisco Systems, Inc. | | | 124,785 | | | | 1,947,894 | |
Motorola Solutions, Inc.(1) | | | 13,468 | | | | 620,066 | |
Research In Motion Ltd.(1) | | | 23,695 | | | | 683,601 | |
| | | | | | | | 3,251,561 | |
| COMPUTERS & PERIPHERALS — 4.1% | |
Apple, Inc.(1) | | | 91,049 | | | | 30,562,418 | |
Dell, Inc.(1) | | | 938,496 | | | | 15,644,728 | |
EMC Corp.(1) | | | 126,352 | | | | 3,480,998 | |
| Hewlett-Packard Co. | | | 85,658 | | | | 3,117,951 | |
Lexmark International, Inc., Class A(1) | | | 193,557 | | | | 5,663,478 | |
Western Digital Corp.(1) | | | 225,309 | | | | 8,196,741 | |
| | | | | | | | 66,666,314 | |
| CONSTRUCTION & ENGINEERING — 1.3% | |
| Fluor Corp. | | | 88,297 | | | | 5,709,284 | |
| KBR, Inc. | | | 154,012 | | | | 5,804,712 | |
URS Corp.(1) | | | 202,994 | | | | 9,081,952 | |
| | | | | | | | 20,595,948 | |
| CONSUMER FINANCE — 1.1% | |
| American Express Co. | | | 165,354 | | | | 8,548,802 | |
| Cash America International, Inc. | | | 153,370 | | | | 8,875,522 | |
| | | | | | | | 17,424,324 | |
| DIVERSIFIED CONSUMER SERVICES — 1.4% | |
| H&R Block, Inc. | | | 654,574 | | | | 10,499,367 | |
ITT Educational Services, Inc.(1) | | | 149,939 | | | | 11,731,227 | |
| | | | | | | | 22,230,594 | |
| DIVERSIFIED FINANCIAL SERVICES — 2.6% | |
| Bank of America Corp. | | | 418,966 | | | | 4,591,867 | |
| Citigroup, Inc. | | | 249,929 | | | | 10,407,043 | |
| JPMorgan Chase & Co. | | | 555,624 | | | | 22,747,247 | |
| McGraw-Hill Cos., Inc. (The) | | | 76,123 | | | | 3,190,315 | |
NASDAQ OMX Group, Inc. (The)(1) | | | 65,469 | | | | 1,656,366 | |
| | | | | | | | 42,592,838 | |
| DIVERSIFIED TELECOMMUNICATION SERVICES — 3.7% | |
| AT&T, Inc. | | | 1,041,946 | | | | 32,727,524 | |
| Verizon Communications, Inc. | | | 714,944 | | | | 26,617,365 | |
| | | | | | | | 59,344,889 | |
| | |
| | | | Shares | | | | Value | |
| ELECTRIC UTILITIES — 1.6% | | | | | | | | |
| Entergy Corp. | | | 143,689 | | | | $9,811,085 | |
| Exelon Corp. | | | 59,429 | | | | 2,545,938 | |
| FirstEnergy Corp. | | | 308,912 | | | | 13,638,465 | |
| | | | | | | | 25,995,488 | |
| ELECTRICAL EQUIPMENT — 0.3% | |
| Emerson Electric Co. | | | 97,668 | | | | 5,493,825 | |
| ELECTRONIC EQUIPMENT, INSTRUMENTS & COMPONENTS — 1.4% | |
| Corning, Inc. | | | 30,034 | | | | 545,117 | |
| TE Connectivity Ltd. | | | 325,116 | | | | 11,951,264 | |
Vishay Intertechnology, Inc.(1) | | | 645,250 | | | | 9,704,560 | |
| | | | | | | | 22,200,941 | |
| ENERGY EQUIPMENT & SERVICES — 1.6% | |
Complete Production Services, Inc.(1) | | | 54,626 | | | | 1,822,323 | |
| National Oilwell Varco, Inc. | | | 39,030 | | | | 3,052,536 | |
| Schlumberger Ltd. | | | 51,559 | | | | 4,454,698 | |
| SEACOR Holdings, Inc. | | | 103,172 | | | | 10,313,073 | |
| Transocean Ltd. | | | 106,449 | | | | 6,872,348 | |
| | | | | | | | 26,514,978 | |
| FOOD & STAPLES RETAILING — 1.2% | |
| Walgreen Co. | | | 365,763 | | | | 15,530,297 | |
| Wal-Mart Stores, Inc. | | | 69,412 | | | | 3,688,554 | |
| | | | | | | | 19,218,851 | |
| FOOD PRODUCTS — 1.7% | |
| H.J. Heinz Co. | | | 22,074 | | | | 1,176,103 | |
| Hershey Co. (The) | | | 214,835 | | | | 12,213,370 | |
| Sara Lee Corp. | | | 157,332 | | | | 2,987,734 | |
| Tyson Foods, Inc., Class A | | | 574,948 | | | | 11,165,490 | |
| | | | | | | | 27,542,697 | |
| HEALTH CARE EQUIPMENT & SUPPLIES — 1.2% | |
| Becton, Dickinson & Co. | | | 137,086 | | | | 11,812,701 | |
Zimmer Holdings, Inc.(1) | | | 118,682 | | | | 7,500,702 | |
| | | | | | | | 19,313,403 | |
| HEALTH CARE PROVIDERS & SERVICES — 2.8% | |
| Cardinal Health, Inc. | | | 6,854 | | | | 311,309 | |
| Humana, Inc. | | | 192,097 | | | | 15,471,492 | |
Magellan Health Services, Inc.(1) | | | 154,225 | | | | 8,442,277 | |
| UnitedHealth Group, Inc. | | | 377,075 | | | | 19,449,528 | |
WellCare Health Plans, Inc.(1) | | | 14,455 | | | | 743,132 | |
| | | | | | | | 44,417,738 | |
| HOTELS, RESTAURANTS & LEISURE — 0.7% | |
| McDonald’s Corp. | | | 106,821 | | | | 9,007,147 | |
| Wyndham Worldwide Corp. | | | 47,105 | | | | 1,585,083 | |
| | | | | | | | 10,592,230 | |
| HOUSEHOLD DURABLES — 0.1% | |
| American Greetings Corp., Class A | | | 22,155 | | | | 532,606 | |
| Whirlpool Corp. | | | 9,138 | | | | 743,102 | |
| | | | | | | | 1,275,708 | |
| HOUSEHOLD PRODUCTS — 2.7% | |
| Kimberly-Clark Corp. | | | 202,168 | | | | 13,456,302 | |
| Procter & Gamble Co. (The) | | | 468,708 | | | | 29,795,768 | |
| | | | | | | | 43,252,070 | |
INDEPENDENT POWER PRODUCERS & ENERGY TRADERS(2) | |
NRG Energy, Inc.(1) | | | 11,638 | | | | 286,062 | |
| INDUSTRIAL CONGLOMERATES — 1.7% | |
| 3M Co. | | | 3,716 | | | | 352,463 | |
| General Electric Co. | | | 1,462,219 | | | | 27,577,450 | |
| | | | | | | | 27,929,913 | |
| INSURANCE — 5.1% | |
| ACE Ltd. | | | 193,955 | | | | 12,766,118 | |
| Allied World Assurance Co. Holdings Ltd. | | | 78,503 | | | | 4,520,203 | |
| American Financial Group, Inc. | | | 291,070 | | | | 10,388,288 | |
| Aspen Insurance Holdings Ltd. | | | 185,195 | | | | 4,765,067 | |
Berkshire Hathaway, Inc., Class B(1) | | | 76,560 | | | | 5,924,978 | |
| Hartford Financial Services Group, Inc. (The) | | | 16,588 | | | | 437,426 | |
| Principal Financial Group, Inc. | | | 381,106 | | | | 11,593,245 | |
| Prudential Financial, Inc. | | | 254,063 | | | | 16,155,866 | |
| Sun Life Financial, Inc. | | | 255,208 | | | | 7,676,657 | |
| Willis Group Holdings plc | | | 202,771 | | | | 8,335,916 | |
| | | | | | | | 82,563,764 | |
| INTERNET & CATALOG RETAIL — 0.2% | |
| Expedia, Inc. | | | 113,151 | | | | 3,280,247 | |
| INTERNET SOFTWARE & SERVICES — 1.1% | |
AOL, Inc.(1) | | | 276,506 | | | | 5,491,409 | |
| EarthLink, Inc. | | | 6,690 | | | | 51,480 | |
eBay, Inc.(1) | | | 9,768 | | | | 315,213 | |
Google, Inc., Class A(1) | | | 22,269 | | | | 11,276,576 | |
IAC/InterActiveCorp(1) | | | 1,861 | | | | 71,035 | |
| | | | | | | | 17,205,713 | |
| IT SERVICES — 3.9% | |
| Accenture plc, Class A | | | 217,385 | | | | 13,134,402 | |
| Computer Sciences Corp. | | | 169,188 | | | | 6,422,376 | |
Convergys Corp.(1) | | | 285,601 | | | | 3,895,598 | |
| Global Payments, Inc. | | | 15,121 | | | | 771,171 | |
| International Business Machines Corp. | | | 224,855 | | | | 38,573,875 | |
| | | | | | | | 62,797,422 | |
| LEISURE EQUIPMENT & PRODUCTS — 0.2% | |
| Polaris Industries, Inc. | | | 31,639 | | | | $3,517,308 | |
| MACHINERY — 2.7% | |
| Caterpillar, Inc. | | | 139,710 | | | | 14,873,527 | |
| Eaton Corp. | | | 262,304 | | | | 13,495,541 | |
| Parker-Hannifin Corp. | | | 139,769 | | | | 12,542,870 | |
Sauer-Danfoss, Inc.(1) | | | 50,909 | | | | 2,565,304 | |
| | | | | | | | 43,477,242 | |
| MEDIA — 3.1% | |
| CBS Corp., Class B | | | 235,967 | | | | 6,722,700 | |
| Comcast Corp., Class A | | | 700,649 | | | | 17,754,446 | |
DirecTV, Class A(1) | | | 172,349 | | | | 8,758,776 | |
| Interpublic Group of Cos., Inc. (The) | | | 9,038 | | | | 112,975 | |
| Time Warner, Inc. | | | 454,389 | | | | 16,526,128 | |
| | | | | | | | 49,875,025 | |
| METALS & MINING — 1.9% | |
| Freeport-McMoRan Copper & Gold, Inc. | | | 338,469 | | | | 17,905,010 | |
| Newmont Mining Corp. | | | 231,969 | | | | 12,519,367 | |
| Teck Resources Ltd., Class B | | | 12,193 | | | | 618,673 | |
| | | | | | | | 31,043,050 | |
| MULTILINE RETAIL — 0.5% | |
| Dillard’s, Inc., Class A | | | 127,042 | | | | 6,623,970 | |
| Target Corp. | | | 38,535 | | | | 1,807,677 | |
| | | | | | | | 8,431,647 | |
| MULTI-UTILITIES — 0.7% | |
| Ameren Corp. | | | 27,258 | | | | 786,121 | |
| Integrys Energy Group, Inc. | | | 205,451 | | | | 10,650,580 | |
| | | | | | | | 11,436,701 | |
| OIL, GAS & CONSUMABLE FUELS — 11.1% | |
| Arch Coal, Inc. | | | 13,912 | | | | 370,894 | |
| Chevron Corp. | | | 369,957 | | | | 38,046,378 | |
| ConocoPhillips | | | 327,913 | | | | 24,655,779 | |
| Exxon Mobil Corp. | | | 646,764 | | | | 52,633,654 | |
| Marathon Oil Corp. | | | 293,908 | | | | 15,483,073 | |
| Murphy Oil Corp. | | | 189,702 | | | | 12,455,833 | |
| Occidental Petroleum Corp. | | | 227,356 | | | | 23,654,118 | |
| Valero Energy Corp. | | | 423,480 | | | | 10,828,384 | |
| | | | | | | | 178,128,113 | |
| PAPER & FOREST PRODUCTS — 0.6% | |
| Domtar Corp. | | | 105,440 | | | | 9,987,277 | |
| PHARMACEUTICALS — 6.8% | |
| Abbott Laboratories | | | 305,382 | | | | 16,069,201 | |
| Bristol-Myers Squibb Co. | | | 450,168 | | | | 13,036,865 | |
| Eli Lilly & Co. | | | 463,790 | | | | 17,406,039 | |
Forest Laboratories, Inc.(1) | | | 17,594 | | | | 692,148 | |
| Johnson & Johnson | | | 507,740 | | | | 33,774,865 | |
| Merck & Co., Inc. | | | 293,939 | | | | 10,373,107 | |
| Pfizer, Inc. | | | 887,878 | | | | 18,290,287 | |
| | | | | | | | 109,642,512 | |
| REAL ESTATE INVESTMENT TRUSTS (REITs) — 1.1% | |
| Public Storage | | | 22,720 | | | | 2,590,307 | |
| Rayonier, Inc. | | | 133,445 | | | | 8,720,631 | |
| Simon Property Group, Inc. | | | 52,532 | | | | 6,105,794 | |
| | | | | | | | 17,416,732 | |
| ROAD & RAIL — 0.9% | |
| CSX Corp. | | | 539,556 | | | | 14,147,158 | |
| SEMICONDUCTORS & SEMICONDUCTOR EQUIPMENT — 3.3% | |
| Intel Corp. | | | 1,223,401 | | | | 27,110,566 | |
LSI Corp.(1) | | | 1,653,918 | | | | 11,775,896 | |
Micron Technology, Inc.(1) | | | 563,219 | | | | 4,212,878 | |
Teradyne, Inc.(1) | | | 623,456 | | | | 9,227,149 | |
| | | | | | | | 52,326,489 | |
| SOFTWARE — 3.7% | |
| Activision Blizzard, Inc. | | | 106,776 | | | | 1,247,144 | |
Electronic Arts, Inc.(1) | | | 13,377 | | | | 315,697 | |
Intuit, Inc.(1) | | | 56,848 | | | | 2,948,137 | |
| Microsoft Corp. | | | 1,483,597 | | | | 38,573,522 | |
| Oracle Corp. | | | 475,635 | | | | 15,653,148 | |
| | | | | | | | 58,737,648 | |
| SPECIALTY RETAIL — 1.4% | |
GameStop Corp., Class A(1) | | | 148,911 | | | | 3,971,456 | |
| Lowe’s Cos., Inc. | | | 257,560 | | | | 6,003,724 | |
| PetSmart, Inc. | | | 6,802 | | | | 308,607 | |
| Williams-Sonoma, Inc. | | | 323,412 | | | | 11,801,304 | |
| | | | | | | | 22,085,091 | |
| TEXTILES, APPAREL & LUXURY GOODS — 0.8% | |
| VF Corp. | | | 118,697 | | | | 12,885,746 | |
| TOBACCO — 1.7% | |
| Philip Morris International, Inc. | | | 202,909 | | | | 13,548,234 | |
| Reynolds American, Inc. | | | 354,592 | | | | 13,137,633 | |
| | | | | | | | 26,685,867 | |
WIRELESS TELECOMMUNICATION SERVICES(2) | |
Sprint Nextel Corp.(1) | | | 53,177 | | | | 286,624 | |
TOTAL COMMON STOCKS (Cost $1,203,295,345) | | | | 1,574,472,861 | |
| Temporary Cash Investments — 1.6% | |
| JPMorgan U.S. Treasury Plus Money Market Fund Agency Shares | | | 6,139,642 | | | | $6,139,642 | |
| Repurchase Agreement, Bank of America N.A., (collateralized by various U.S. Treasury obligations, 4.375%, 11/15/39, valued at $7,330,752), in a joint trading account at 0.00%, dated 6/30/11, due 7/1/11 (Delivery value $7,164,777) | | | | 7,164,777 | |
| Repurchase Agreement, Credit Suisse First Boston, Inc., (collateralized by various U.S. Treasury obligations, 3.50%, 5/15/20, valued at $6,091,895), in a joint trading account at 0.00%, dated 6/30/11, due 7/1/11 (Delivery value $5,970,648) | | | | 5,970,648 | |
| Repurchase Agreement, Goldman Sachs Group, Inc., (collateralized by various U.S. Treasury obligations, 1.375%, 9/15/12, valued at $7,308,851), in a joint trading account at 0.00%, dated 6/30/11, due 7/1/11 (Delivery value $7,164,778) | | | | 7,164,778 | |
TOTAL TEMPORARY CASH INVESTMENTS (Cost $26,439,845) | | | | 26,439,845 | |
TOTAL INVESTMENT SECURITIES — 99.4% (Cost $1,229,735,190) | | | | 1,600,912,706 | |
| OTHER ASSETS AND LIABILITIES — 0.6% | | | | 9,942,931 | |
| TOTAL NET ASSETS — 100.0% | | | | $1,610,855,637 | |
Notes to Schedule of Investments
| (2) | Category is less than 0.05% of total net assets. |
See Notes to Financial Statements.
Statement of Assets and Liabilities |
| JUNE 30, 2011 | |
| Assets | |
| Investment securities, at value (cost of $1,229,735,190) | | | $1,600,912,706 | |
| Receivable for investments sold | | | 682,262 | |
| Receivable for capital shares sold | | | 8,915,170 | |
| Dividends and interest receivable | | | 1,883,061 | |
| | | | 1,612,393,199 | |
| | | | | |
| Liabilities | | | | |
| Disbursements in excess of demand deposit cash | | | 941 | |
| Payable for capital shares redeemed | | | 671,855 | |
| Accrued management fees | | | 837,897 | |
| Distribution and service fees payable | | | 26,869 | |
| | | | 1,537,562 | |
| | | | | |
| Net Assets | | | $1,610,855,637 | |
| | | | | |
| Net Assets Consist of: | | | | |
| Capital (par value and paid-in surplus) | | | $1,725,145,685 | |
| Undistributed net investment income | | | 1,379,089 | |
| Accumulated net realized loss | | | (486,846,653 | ) |
| Net unrealized appreciation | | | 371,177,516 | |
| | | | $1,610,855,637 | |
| | Net assets | Shares outstanding | Net asset value per share |
| Investor Class, $0.01 Par Value | $1,351,935,788 | 52,932,440 | $25.54 |
| Institutional Class, $0.01 Par Value | $128,467,947 | 5,026,172 | $25.56 |
| A Class, $0.01 Par Value | $128,919,510 | 5,052,429 | $25.52* |
| B Class, $0.01 Par Value | $93,045 | 3,643 | $25.54 |
| C Class, $0.01 Par Value | $932,986 | 36,612 | $25.48 |
| R Class, $0.01 Par Value | $506,361 | 19,829 | $25.54 |
| *Maximum offering price $27.08 (net asset value divided by 0.9425) |
See Notes to Financial Statements.
| YEAR ENDED JUNE 30, 2011 | |
| Investment Income (Loss) | |
| Income: | | | |
| Dividends (net of foreign taxes withheld of $84,892) | | | $35,973,005 | |
| Interest | | | 6,848 | |
| | | | 35,979,853 | |
| | | | | |
| Expenses: | | | | |
| Management fees | | | 10,748,580 | |
| Distribution and service fees: | | | | |
| A Class | | | 329,346 | |
| B Class | | | 956 | |
| C Class | | | 9,553 | |
| R Class | | | 2,035 | |
| Directors’ fees and expenses | | | 66,434 | |
| Other expenses | | | 26,393 | |
| | | | 11,183,297 | |
| | | | | |
| Net investment income (loss) | | | 24,796,556 | |
| | | | | |
| Realized and Unrealized Gain (Loss) | |
| Net realized gain (loss) on: | | | | |
| Investment transactions | | | 119,498,847 | |
| Futures contract transactions | | | 880,781 | |
| | | | 120,379,628 | |
| | | | | |
| Change in net unrealized appreciation (depreciation) on investments | | | 287,256,696 | |
| | | | | |
| Net realized and unrealized gain (loss) | | | 407,636,324 | |
| | | | | |
| Net Increase (Decrease) in Net Assets Resulting from Operations | | | $432,432,880 | |
See Notes to Financial Statements.
Statement of Changes in Net Assets |
| YEARS ENDED JUNE 30, 2011 AND JUNE 30, 2010 | |
| Increase (Decrease) in Net Assets | | 2011 | | | 2010 | |
| Operations | |
| Net investment income (loss) | | | $24,796,556 | | | | $28,527,259 | |
| Net realized gain (loss) | | | 120,379,628 | | | | 10,712,035 | |
| Change in net unrealized appreciation (depreciation) | | | 287,256,696 | | | | 183,018,178 | |
| Net increase (decrease) in net assets resulting from operations | | | 432,432,880 | | | | 222,257,472 | |
| | | | | | | | | |
| Distributions to Shareholders | |
| From net investment income: | | | | | | | | |
| Investor Class | | | (18,759,820 | ) | | | (21,903,250 | ) |
| Institutional Class | | | (2,729,719 | ) | | | (4,223,655 | ) |
| A Class | | | (1,546,359 | ) | | | (2,164,134 | ) |
| B Class | | | (416 | ) | | | (366 | ) |
| C Class | | | (4,216 | ) | | | (5,588 | ) |
| R Class | | | (3,766 | ) | | | (3,006 | ) |
| Decrease in net assets from distributions | | | (23,044,296 | ) | | | (28,299,999 | ) |
| | | | | | | | | |
| Capital Share Transactions | |
| Net increase (decrease) in net assets from capital share transactions | | | (350,165,245 | ) | | | (375,460,278 | ) |
| | | | | | | | | |
| Net increase (decrease) in net assets | | | 59,223,339 | | | | (181,502,805 | ) |
| | | | | | | | | |
| Net Assets | |
| Beginning of period | | | 1,551,632,298 | | | | 1,733,135,103 | |
| End of period | | | $1,610,855,637 | | | | $1,551,632,298 | |
| | | | | | | | | |
| Undistributed net investment income | | | $1,379,089 | | | | $197,010 | |
See Notes to Financial Statements.
Notes to Financial Statements |
JUNE 30, 2011
1. Organization
American Century Quantitative Equity Funds, Inc. (the corporation) is registered under the Investment Company Act of 1940, as amended (the 1940 Act), as an open-end management investment company and is organized as a Maryland corporation. Income & Growth Fund (the fund) is one fund in a series issued by the corporation. The fund is diversified as defined under the 1940 Act. The fund’s investment objective is to seek long-term capital growth by investing in common stocks. Income is a secondary objective.
The fund is authorized to issue the Investor Class, the Institutional Class, the A Class, the B Class, the C Class and the R Class. The A Class may incur an initial sales charge. The A Class, B Class and C Class may be subject to a contingent deferred sales charge. The share classes differ principally in their respective sales charges and distribution and shareholder servicing expenses and arrangements. The Institutional Class is made available to institutional shareholders or through financial intermediaries whose clients do not require the same level of shareholder and administrative services as shareholders of other classes. As a result, the Institutional Class is charged a lower unified management fee.
2. Significant Accounting Policies
The following is a summary of significant accounting policies consistently followed by the fund in preparation of its financial statements. The financial statements are prepared in conformity with accounting principles generally accepted in the United States of America, which may require management to make certain estimates and assumptions at the date of the financial statements. Actual results could differ from these estimates.
Investment Valuations — The fund determines the fair value of its investments and computes its net asset value per share as of the close of regular trading (usually 4 p.m. Eastern time) on the New York Stock Exchange (NYSE) on each day the NYSE is open.
Equity securities that are listed or traded on a domestic securities exchange are valued at the last reported sales price or at the official closing price as provided by the exchange. Equity securities traded on foreign securities exchanges are typically valued at the closing price on the exchange where primarily traded or as of the close of the NYSE, if that is earlier. If no last sales price is reported, or if local convention or regulation so provides, the mean of the latest bid and asked prices is used. Depending on local convention or regulation, securities traded over-the-counter are valued at the mean of the latest bid and asked prices, the last sales price, or the official closing price. In its determination of fair value, the fund may review several factors including: market information specific to a security; news developments in U.S. and foreign markets; the performance of particular U.S. and foreign securities, indices, comparable securities, American Depositary Receipts, Exchange-Traded Funds, and other relevant market indicators.
Debt securities maturing within 60 days at the time of purchase may be valued at cost, plus or minus any amortized discount or premium or at the evaluated mean as provided by an independent pricing service. Evaluated mean prices are commonly derived through utilization of market models, which may consider, among other factors, trade data, quotations from dealers and active market makers, relevant yield curve and spread data, related sector levels, creditworthiness, and other relevant market information on the same or comparable securities.
Investments in open-end management investment companies are valued at the reported net asset value per share. Repurchase agreements are valued at cost. Exchange-traded futures contracts are valued at the settlement price as provided by the appropriate clearing corporation.
If the fund determines that the market price for a portfolio security is not readily available or the valuation methods mentioned above do not reflect a security’s fair value, such security is valued as determined in good faith by the Board of Directors or its designee, in accordance with procedures adopted by the Board of Directors. Circumstances that may cause the fund to use these procedures to value a security include, but are not limited to: a security has been declared in default; trading in a security has been halted during the trading day; there is a foreign market holiday and no trading occurred; or an event occurred between the close of a foreign exchange and the NYSE that may affect the value of a security.
Security Transactions — Security transactions are accounted for as of the trade date. Net realized gains and losses are determined on the identified cost basis, which is also used
for federal income tax purposes.
Investment Income — Dividend income less foreign taxes withheld, if any, is recorded as of the ex-dividend date. Interest income is recorded on the accrual basis and includes accretion of discounts and amortization of premiums.
Repurchase Agreements — The fund may enter into repurchase agreements with institutions that American Century Investment Management, Inc. (ACIM) (the investment advisor) has determined are creditworthy pursuant to criteria adopted by the Board of Directors. The fund requires that the collateral, represented by securities, received in a repurchase transaction be transferred to the custodian in a manner sufficient to enable the fund to obtain those securities in the event of a default under the repurchase agreement. ACIM monitors, on a daily basis, the securities transferred to ensure the value, including accrued interest, of the securities under each repurchase agreement is equal to or greater than amounts owed to the fund under each repurchase agreement.
Joint Trading Account — Pursuant to an Exemptive Order issued by the Securities and Exchange Commission, the fund, along with certain other funds in the American Century Investments family of funds, may transfer uninvested cash balances into a joint trading account. These balances are invested in one or more repurchase agreements that are collateralized by U.S. Treasury or Agency obligations.
Income Tax Status — It is the fund’s policy to distribute substantially all net investment income and net realized gains to shareholders and to otherwise qualify as a regulated investment company under provisions of the Internal Revenue Code. The fund is no longer subject to examination by tax authorities for years prior to 2008. At this time, management believes there are no uncertain tax positions which, based on their technical merit, would not be sustained upon examination and for which it is reasonably possible that the total amounts of unrecognized tax benefits will significantly change in the next twelve months. Accordingly, no provision has been made for federal or state income taxes.
Multiple Class — All shares of the fund represent an equal pro rata interest in the net assets of the class to which such shares belong, and have identical voting, dividend, liquidation and other rights and the same terms and conditions, except for class specific expenses and exclusive rights to vote on matters affecting only individual classes. Income, non-class specific expenses, and realized and unrealized capital gains and losses of the fund are allocated to each class of shares based on their relative net assets.
Distributions to Shareholders — Distributions from net investment income, if any, are generally declared and paid quarterly. Distributions from net realized gains, if any, are generally declared and paid annually.
Indemnifications — Under the corporation’s organizational documents, its officers and directors are indemnified against certain liabilities arising out of the performance of their duties to the fund. In addition, in the normal course of business, the fund enters into contracts that provide general indemnifications. The maximum exposure under these arrangements is unknown as this would involve future claims that may be made against a fund. The risk of material loss from such claims is considered by management to be remote.
3. Fees and Transactions with Related Parties
Management Fees —The corporation has entered into a management agreement with ACIM, under which ACIM provides the fund with investment advisory and management services in exchange for a single, unified management fee (the fee) per class. The agreement provides that all expenses of managing and operating the fund, except distribution and service fees, brokerage expenses, taxes, interest, fees and expenses of the independent directors (including legal counsel fees), and extraordinary expenses, will be paid by ACIM. The fee is computed and accrued daily based on each class’s daily net assets and paid monthly in arrears. The fee consists of (1) an Investment Category Fee based on the daily net assets of the fund and certain other accounts managed by the investment advisor that are in the same broad investment category as the fund and (2) a Complex Fee based on the assets of all the funds in the American Century Investments family of funds. The rates for the Investment Category Fee range from 0.3380% to 0.5200%. The rates for the Complex Fee range from 0.2500% to 0.3100% for the Investor Class, A Class, B Class, C Class and R Class. The Institutional Class is 0.2000% less at each point within the Complex Fee range. The effective annual management fee for each class for the year ended June 30, 2011 was 0.68% for the Investor Class, A Class, B Class, C Class and R Class and 0.48% for the Institutional Class.
Distribution and Service Fees — The Board of Directors has adopted a separate Master Distribution and Individual Shareholder Services Plan for each of the A Class, B Class, C Class and R Class (collectively the plans), pursuant to Rule 12b-1 of the 1940 Act. The plans provide that the A Class will pay American Century Investment Services, Inc. (ACIS) an annual distribution and service fee of 0.25%. The plans provide that the B Class and C Class will each pay ACIS an annual distribution and service fee of 1.00%, of which 0.25% is paid for individual shareholder services and 0.75% is paid for distribution services. The plans provide that the R Class will pay ACIS an annual distribution and service fee of 0.50%. The fees are computed and accrued daily based on each class’s daily net assets and paid monthly in arrears. The fees are used to pay financial intermediaries for distribution and individual shareholder services. Fees incurred under the plans during the year ended June 30, 2011 are detailed in the Statement of Operations.
Related Parties — Certain officers and directors of the corporation are also officers and/or directors of American Century Companies, Inc. (ACC), the parent of the corporation’s investment advisor, ACIM, the distributor of the corporation, ACIS, and the corporation’s transfer agent, American Century Services, LLC.
The fund is eligible to invest in a money market fund for temporary purposes, which is managed by J.P. Morgan Investment Management, Inc. (JPMIM). The fund has a securities lending agreement with JPMorgan Chase Bank (JPMCB) and a mutual funds services agreement with J.P. Morgan Investor Services Co. (JPMIS). JPMCB is a custodian of the fund. JPMIM, JPMIS and JPMCB are wholly owned subsidiaries of JPMorgan Chase & Co. (JPM). JPM is an equity investor in ACC. The services provided to the fund by JPMIM, JPMIS and JPMCB terminated on July 31, 2011.
4. Investment Transactions
Purchases and sales of investment securities, excluding short-term investments, for the year ended June 30, 2011 were $675,468,445 and $1,048,181,247, respectively.
5. Capital Share Transactions
Transactions in shares of the fund were as follows:
| | | Year ended June 30, 2011 | | | Year ended June 30, 2010 | |
| | | Shares | | | Amount | | | Shares | | | Amount | |
| Investor Class/Shares Authorized | | | 330,000,000 | | | | | | | 330,000,000 | | | | |
| Sold | | | 4,055,282 | | | | $97,373,445 | | | | 3,838,034 | | | | $80,528,593 | |
| Issued in reinvestment of distributions | | | 744,626 | | | | 17,595,330 | | | | 961,765 | | | | 20,629,225 | |
| Redeemed | | | (13,602,049 | ) | | | (318,927,646 | ) | | | (14,141,738 | ) | | | (297,312,816 | ) |
| | | | (8,802,141 | ) | | | (203,958,871 | ) | | | (9,341,939 | ) | | | (196,154,998 | ) |
| Institutional Class/Shares Authorized | | | 100,000,000 | | | | | | | | 100,000,000 | | | | | |
| Sold | | | 1,035,106 | | | | 23,919,025 | | | | 1,668,153 | | | | 34,474,492 | |
| Issued in reinvestment of distributions | | | 106,317 | | | | 2,484,050 | | | | 180,995 | | | | 3,883,796 | |
| Redeemed | | | (6,027,443 | ) | | | (142,584,805 | ) | | | (6,810,928 | ) | | | (140,103,046 | ) |
| | | | (4,886,020 | ) | | | (116,181,730 | ) | | | (4,961,780 | ) | | | (101,744,758 | ) |
| A Class/Shares Authorized | | | 100,000,000 | | | | | | | | 100,000,000 | | | | | |
| Sold | | | 651,825 | | | | 15,543,996 | | | | 755,867 | | | | 15,695,842 | |
| Issued in reinvestment of distributions | | | 64,037 | | | | 1,510,238 | | | | 99,020 | | | | 2,113,901 | |
| Redeemed | | | (2,006,731 | ) | | | (47,042,494 | ) | | | (4,634,554 | ) | | | (95,453,320 | ) |
| | | | (1,290,869 | ) | | | (29,988,260 | ) | | | (3,779,667 | ) | | | (77,643,577 | ) |
| B Class/Shares Authorized | | | 10,000,000 | | | | | | | | 10,000,000 | | | | | |
| Sold | | | 590 | | | | 13,970 | | | | 1,290 | | | | 28,694 | |
| Issued in reinvestment of distributions | | | 17 | | | | 399 | | | | 17 | | | | 366 | |
| Redeemed | | | (953 | ) | | | (23,596 | ) | | | — | | | | — | |
| | | | (346 | ) | | | (9,227 | ) | | | 1,307 | | | | 29,060 | |
| C Class/Shares Authorized | | | 10,000,000 | | | | | | | | 10,000,000 | | | | | |
| Sold | | | 13,080 | | | | 312,515 | | | | 18,337 | | | | 389,368 | |
| Issued in reinvestment of distributions | | | 137 | | | | 3,243 | | | | 199 | | | | 4,252 | |
| Redeemed | | | (20,124 | ) | | | (482,602 | ) | | | (20,349 | ) | | | (427,245 | ) |
| | | | (6,907 | ) | | | (166,844 | ) | | | (1,813 | ) | | | (33,625 | ) |
| R Class/Shares Authorized | | | 10,000,000 | | | | | | | | 10,000,000 | | | | | |
| Sold | | | 14,111 | | | | 338,455 | | | | 9,468 | | | | 187,989 | |
| Issued in reinvestment of distributions | | | 91 | | | | 2,158 | | | | 107 | | | | 2,307 | |
| Redeemed | | | (8,403 | ) | | | (200,926 | ) | | | (5,297 | ) | | | (102,676 | ) |
| | | | 5,799 | | | | 139,687 | | | | 4,278 | | | | 87,620 | |
| Net increase (decrease) | | | (14,980,484 | ) | | | $(350,165,245 | ) | | | (18,079,614 | ) | | | $(375,460,278 | ) |
6. Fair Value Measurements
The fund’s securities valuation process is based on several considerations and may use multiple inputs to determine the fair value of the positions held by the fund. In conformity with accounting principles generally accepted in the United States of America, the inputs used to determine a valuation are classified into three broad levels as follows:
| • | Level 1 valuation inputs consist of unadjusted quoted prices in an active market for identical securities; |
| Level 2 valuation inputs consist of direct or indirect observable market data (including quoted prices for similar securities, evaluations of subsequent market events, interest rates, prepayment speeds, credit risk, etc.); or |
| Level 3 valuation inputs consist of unobservable data (including a fund’s own assumptions). |
The level classification is based on the lowest level input that is significant to the fair valuation measurement. The valuation inputs are not necessarily an indication of the risks associated with investing in these securities or other financial instruments.
The following is a summary of the level classifications as of period end. The Schedule of Investments provides additional information on the fund’s portfolio holdings.
| | | Level 1 | | | Level 2 | | | Level 3 | |
| Investment Securities | |
| Domestic Common Stocks | | | $1,488,432,997 | | | | — | | | | — | |
| Foreign Common Stocks | | | 86,039,864 | | | | — | | | | — | |
| Temporary Cash Investments | | | 6,139,642 | | | | $20,300,203 | | | | — | |
| Total Value of Investment Securities | | | $1,580,612,503 | | | | $20,300,203 | | | | — | |
7. Derivative Instruments
Equity Price Risk — The fund is subject to equity price risk in the normal course of pursuing its investment objectives. A fund may enter into futures contracts based on an equity index in order to manage its exposure to changes in market conditions. A fund may purchase futures contracts to gain exposure to increases in market value or sell futures contracts to protect against a decline in market value. Upon entering into a futures contract, a fund is required to deposit either cash or securities in an amount equal to a certain percentage of the contract value (initial margin). Subsequent payments (variation margin) are made or received daily, in cash, by a fund. The variation margin is equal to the daily change in the contract value and is recorded as unrealized gains and losses. A fund recognizes a realized gain or loss when the contract is closed or expires. Net realized and unrealized gains or losses occurring during the holding period of futures contracts are a component of net realized gain (loss) on futures contract transactions and change in net unrealized appreciation (depreciation) on futures contracts, respectively. One of the risks of entering into futures contracts is the possibility that the change in value of the contract may not correlate with the changes in value of the underlying securities. During the period, the fund infrequently purchased equity price risk derivative instruments for temporary investment purposes.
At period end, the fund did not have any equity price risk derivative instruments disclosed on the Statement of Assets and Liabilities. For the year ended June 30, 2011, the effect of equity price risk derivative instruments on the Statement of Operations was $880,781 in net realized gain (loss) on futures contract transactions.
8. Risk Factors
There are certain risks involved in investing in foreign securities. These risks include those resulting from future adverse political, social, and economic developments, fluctuations in currency exchange rates, the possible imposition of exchange controls, and other foreign laws or restrictions.
9. Federal Tax Information
The tax character of distributions paid during the years ended June 30, 2011 and June 30, 2010 were as follows:
| | | 2011 | | | 2010 | |
| Distributions Paid From | |
| Ordinary income | | | $23,044,296 | | | | $28,299,999 | |
| Long-term capital gains | | | — | | | | — | |
The book-basis character of distributions made during the year from net investment income or net realized gains may differ from their ultimate characterization for federal income tax purposes. These differences reflect the differing character of certain income items and net realized gains and losses for financial statement and tax purposes, and may result in reclassification among certain capital accounts on the financial statements.
As of June 30, 2011, the federal tax cost of investments and the components of distributable earnings on a tax-basis were as follows:
| Federal tax cost of investments | | | $1,255,150,510 | |
| Gross tax appreciation of investments | | | $380,346,299 | |
| Gross tax depreciation of investments | | | (34,584,103 | ) |
| Net tax appreciation (depreciation) of investments | | | $345,762,196 | |
| Undistributed ordinary income | | | $1,379,089 | |
| Accumulated capital losses | | | $(461,431,333 | ) |
The difference between book-basis and tax-basis cost and unrealized appreciation (depreciation) is attributable primarily to the tax deferral of losses on wash sales.
The accumulated capital losses represent net capital loss carryovers that may be used to offset future realized capital gains for federal income tax purposes. Future capital loss carryover utilization in any given year may be subject to Internal Revenue Code limitations. Capital loss carryovers of $(105,857,081) and $(355,574,252) expire in 2017 and 2018, respectively.
On December 22, 2010, the Regulated Investment Company Modernization Act of 2010 (the “Act”) was enacted, which changed various technical rules governing the tax treatment of regulated investment companies. The changes are generally effective for taxable years beginning after the date of enactment. Under the Act, the fund will be permitted to carry forward capital losses incurred in taxable years beginning after the date of enactment for an unlimited period. However, any losses incurred during those future taxable years will be required to be utilized prior to the losses incurred in pre-enactment taxable years, which carry an expiration date. As a result of this ordering rule, pre-enactment capital loss carryforwards may be more likely to expire unused.
| Investor Class | |
| For a Share Outstanding Throughout the Years Ended June 30 (except as noted) | |
| | | 2011 | | | 2010 | | | 2009 | | | 2008 | | | 2007(1) | | | 2006 | |
| Per-Share Data | |
| Net Asset Value, Beginning of Period | | | $19.88 | | | | $18.03 | | | | $25.32 | | | | $35.04 | | | | $33.29 | | | | $30.33 | |
Income From Investment Operations | | | | | | | | | | | | | | | | | | | | | | | | |
Net Investment Income (Loss)(2) | | | 0.36 | | | | 0.33 | | | | 0.44 | | | | 0.47 | | | | 0.23 | | | | 0.57 | |
Net Realized and Unrealized Gain (Loss) | | | 5.64 | | | | 1.85 | | | | (7.20 | ) | | | (6.54 | ) | | | 2.27 | | | | 4.54 | |
Total From Investment Operations | | | 6.00 | | | | 2.18 | | | | (6.76 | ) | | | (6.07 | ) | | | 2.50 | | | | 5.11 | |
| Distributions | | | | | | | | | | | | | | | | | | | | | | | | |
From Net Investment Income | | | (0.34 | ) | | | (0.33 | ) | | | (0.53 | ) | | | (0.36 | ) | | | (0.22 | ) | | | (0.59 | ) |
From Net Realized Gains | | | — | | | | — | | | | — | | | | (3.29 | ) | | | (0.53 | ) | | | (1.56 | ) |
| Total Distributions | | | (0.34 | ) | | | (0.33 | ) | | | (0.53 | ) | | | (3.65 | ) | | | (0.75 | ) | | | (2.15 | ) |
Net Asset Value, End of Period | | | $25.54 | | | | $19.88 | | | | $18.03 | | | | $25.32 | | | | $35.04 | | | | $33.29 | |
| | | | | | | | | | | | | | | | | | | | | | | | | |
Total Return(3) | | | 30.31 | % | | | 11.99 | % | | | (26.76 | )% | | | (18.48 | )% | | | 7.67 | % | | | 17.17 | % |
| | | | | | | | | | | | | | | | | | | | | | | | | |
| Ratios/Supplemental Data | |
Ratio of Operating Expenses to Average Net Assets | | | 0.69 | % | | | 0.70 | % | | | 0.70 | % | | | 0.68 | % | | | 0.67 | %(4) | | | 0.67 | % |
Ratio of Net Investment Income (Loss) to Average Net Assets | | | 1.52 | % | | | 1.58 | % | | | 2.27 | % | | | 1.53 | % | | | 1.37 | %(4) | | | 1.81 | % |
| Portfolio Turnover Rate | | | 42 | % | | | 45 | % | | | 49 | % | | | 57 | % | | | 27 | % | | | 63 | % |
| Net Assets, End of Period (in thousands) | | | $1,351,936 | | | | $1,227,234 | | | | $1,281,418 | | | | $2,078,333 | | | | $3,463,508 | | | | $3,578,273 | |
| (1) | January 1, 2007 through June 30, 2007. The fund’s fiscal year end was changed from December 31 to June 30, resulting in a six-month annual reporting period. For the years before June 30, 2007, the fund’s fiscal year end was December 31. |
| (2) | Computed using average shares outstanding throughout the period. |
| (3) | Total returns are calculated based on the net asset value of the last business day. Total returns for periods less than one year are not annualized. |
See Notes to Financial Statements.
| Institutional Class | |
| For a Share Outstanding Throughout the Years Ended June 30 (except as noted) | |
| | | 2011 | | | 2010 | | | 2009 | | | 2008 | | | 2007(1) | | | 2006 | |
| Per-Share Data | |
| Net Asset Value, Beginning of Period | | | $19.89 | | | | $18.04 | | | | $25.35 | | | | $35.06 | | | | $33.31 | | | | $30.34 | |
Income From Investment Operations | | | | | | | | | | | | | | | | | | | | | | | | |
Net Investment Income (Loss)(2) | | | 0.40 | | | | 0.38 | | | | 0.48 | | | | 0.52 | | | | 0.26 | | | | 0.64 | |
Net Realized and Unrealized Gain (Loss) | | | 5.66 | | | | 1.85 | | | | (7.21 | ) | | | (6.53 | ) | | | 2.28 | | | | 4.54 | |
Total From Investment Operations | | | 6.06 | | | | 2.23 | | | | (6.73 | ) | | | (6.01 | ) | | | 2.54 | | | | 5.18 | |
| Distributions | | | | | | | | | | | | | | | | | | | | | | | | |
From Net Investment Income | | | (0.39 | ) | | | (0.38 | ) | | | (0.58 | ) | | | (0.41 | ) | | | (0.26 | ) | | | (0.65 | ) |
From Net Realized Gains | | | — | | | | — | | | | — | | | | (3.29 | ) | | | (0.53 | ) | | | (1.56 | ) |
| Total Distributions | | | (0.39 | ) | | | (0.38 | ) | | | (0.58 | ) | | | (3.70 | ) | | | (0.79 | ) | | | (2.21 | ) |
Net Asset Value, End of Period | | | $25.56 | | | | $19.89 | | | | $18.04 | | | | $25.35 | | | | $35.06 | | | | $33.31 | |
| | | | | | | | | | | | | | | | | | | | | | | | | |
Total Return(3) | | | 30.61 | % | | | 12.20 | % | | | (26.63 | )% | | | (18.32 | )% | | | 7.80 | % | | | 17.40 | % |
| | | | | | | | | | | | | | | | | | | | | | | | | |
| Ratios/Supplemental Data | |
Ratio of Operating Expenses to Average Net Assets | | | 0.49 | % | | | 0.50 | % | | | 0.50 | % | | | 0.48 | % | | | 0.47 | %(4) | | | 0.47 | % |
Ratio of Net Investment Income (Loss) to Average Net Assets | | | 1.72 | % | | | 1.78 | % | | | 2.47 | % | | | 1.73 | % | | | 1.57 | %(4) | | | 2.01 | % |
| Portfolio Turnover Rate | | | 42 | % | | | 45 | % | | | 49 | % | | | 57 | % | | | 27 | % | | | 63 | % |
| Net Assets, End of Period (in thousands) | | | $128,468 | | | | $197,196 | | | | $268,346 | | | | $538,656 | | | | $442,367 | | | | $487,888 | |
| (1) | January 1, 2007 through June 30, 2007. The fund’s fiscal year end was changed from December 31 to June 30, resulting in a six-month annual reporting period. For the years before June 30, 2007, the fund’s fiscal year end was December 31. |
| (2) | Computed using average shares outstanding throughout the period. |
| (3) | Total returns are calculated based on the net asset value of the last business day. Total returns for periods less than one year are not annualized. |
See Notes to Financial Statements.
A Class(1) | |
| For a Share Outstanding Throughout the Years Ended June 30 (except as noted) | |
| | | 2011 | | | 2010 | | | 2009 | | | 2008 | | | 2007(2) | | | 2006 | |
| Per-Share Data | |
| Net Asset Value, Beginning of Period | | | $19.86 | | | | $18.01 | | | | $25.28 | | | | $35.01 | | | | $33.27 | | | | $30.31 | |
Income From Investment Operations | | | | | | | | | | | | | | | | | | | | | | | | |
Net Investment Income (Loss)(3) | | | 0.30 | | | | 0.28 | | | | 0.40 | | | | 0.39 | | | | 0.19 | | | | 0.49 | |
Net Realized and Unrealized Gain (Loss) | | | 5.64 | | | | 1.85 | | | | (7.20 | ) | | | (6.53 | ) | | | 2.27 | | | | 4.54 | |
Total From Investment Operations | | | 5.94 | | | | 2.13 | | | | (6.80 | ) | | | (6.14 | ) | | | 2.46 | | | | 5.03 | |
| Distributions | | | | | | | | | | | | | | | | | | | | | | | | |
From Net Investment Income | | | (0.28 | ) | | | (0.28 | ) | | | (0.47 | ) | | | (0.30 | ) | | | (0.19 | ) | | | (0.51 | ) |
From Net Realized Gains | | | — | | | | — | | | | — | | | | (3.29 | ) | | | (0.53 | ) | | | (1.56 | ) |
| Total Distributions | | | (0.28 | ) | | | (0.28 | ) | | | (0.47 | ) | | | (3.59 | ) | | | (0.72 | ) | | | (2.07 | ) |
Net Asset Value, End of Period | | | $25.52 | | | | $19.86 | | | | $18.01 | | | | $25.28 | | | | $35.01 | | | | $33.27 | |
| | | | | | | | | | | | | | | | | | | | | | | | | |
Total Return(4) | | | 30.02 | % | | | 11.72 | % | | | (26.95 | )% | | | (18.68 | )% | | | 7.55 | % | | | 16.86 | % |
| | | | | | | | | | | | | | | | | | | | | | | | | |
| Ratios/Supplemental Data | |
Ratio of Operating Expenses to Average Net Assets | | | 0.94 | % | | | 0.95 | % | | | 0.95 | % | | | 0.93 | % | | | 0.92 | %(5) | | | 0.92 | % |
Ratio of Net Investment Income (Loss) to Average Net Assets | | | 1.27 | % | | | 1.33 | % | | | 2.02 | % | | | 1.28 | % | | | 1.12 | %(5) | | | 1.56 | % |
| Portfolio Turnover Rate | | | 42 | % | | | 45 | % | | | 49 | % | | | 57 | % | | | 27 | % | | | 63 | % |
| Net Assets, End of Period (in thousands) | | | $128,920 | | | | $125,981 | | | | $182,331 | | | | $361,500 | | | | $718,533 | | | | $700,335 | |
| (1) | Prior to September 4, 2007, the A Class was referred to as the Advisor Class. |
| (2) | January 1, 2007 through June 30, 2007. The fund’s fiscal year end was changed from December 31 to June 30, resulting in a six-month annual reporting period. For the years before June 30, 2007, the fund’s fiscal year end was December 31. |
| (3) | Computed using average shares outstanding throughout the period. |
| (4) | Total returns are calculated based on the net asset value of the last business day and do not reflect applicable sales charges. Total returns for periods less than one year are not annualized. |
See Notes to Financial Statements.
| B Class | |
| For a Share Outstanding Throughout the Years Ended June 30 (except as noted) | |
| | | 2011 | | | 2010 | | | 2009 | | | 2008(1) | |
| Per-Share Data | |
| Net Asset Value, Beginning of Period | | | $19.88 | | | | $18.03 | | | | $25.26 | | | | $34.36 | |
| Income From Investment Operations | | | | | | | | | | | | | | | | |
Net Investment Income (Loss)(2) | | | 0.12 | | | | 0.12 | | | | 0.24 | | | | 0.12 | |
| Net Realized and Unrealized Gain (Loss) | | | 5.64 | | | | 1.85 | | | | (7.19 | ) | | | (5.84 | ) |
| Total From Investment Operations | | | 5.76 | | | | 1.97 | | | | (6.95 | ) | | | (5.72 | ) |
| Distributions | | | | | | | | | | | | | | | | |
| From Net Investment Income | | | (0.10 | ) | | | (0.12 | ) | | | (0.28 | ) | | | (0.09 | ) |
| From Net Realized Gains | | | — | | | | — | | | | — | | | | (3.29 | ) |
| Total Distributions | | | (0.10 | ) | | | (0.12 | ) | | | (0.28 | ) | | | (3.38 | ) |
| Net Asset Value, End of Period | | | $25.54 | | | | $19.88 | | | | $18.03 | | | | $25.26 | |
| | | | | | | | | | | | | | | | | |
Total Return(3) | | | 29.02 | % | | | 10.88 | % | | | (27.49 | )% | | | (17.78 | )% |
| | | | | | | | | | | | | | | | | |
| Ratios/Supplemental Data | |
| Ratio of Operating Expenses to Average Net Assets | | | 1.69 | % | | | 1.70 | % | | | 1.70 | % | | | 1.68 | %(4) |
| Ratio of Net Investment Income (Loss) to Average Net Assets | | | 0.52 | % | | | 0.58 | % | | | 1.27 | % | | | 0.58 | %(4) |
| Portfolio Turnover Rate | | | 42 | % | | | 45 | % | | | 49 | % | | | 57 | %(5) |
| Net Assets, End of Period (in thousands) | | | $93 | | | | $79 | | | | $48 | | | | $33 | |
| (1) | September 28, 2007 (commencement of sale) through June 30, 2008. |
| (2) | Computed using average shares outstanding throughout the period. |
| (3) | Total returns are calculated based on the net asset value of the last business day and do not reflect applicable sales charges. Total returns for periods less than one year are not annualized. |
| (5) | Portfolio turnover is calculated at the fund level. Percentage indicated was calculated for the year ended June 30, 2008. |
See Notes to Financial Statements.
| C Class | |
| For a Share Outstanding Throughout the Years Ended June 30 (except as noted) | |
| | | 2011 | | | 2010 | | | 2009 | | | 2008 | | | 2007(1) | | | 2006 | |
| Per-Share Data | |
| Net Asset Value, Beginning of Period | | | $19.83 | | | | $17.99 | | | | $25.20 | | | | $34.98 | | | | $33.25 | | | | $30.29 | |
Income From Investment Operations | | | | | | | | | | | | | | | | | | | | | | | | |
Net Investment Income (Loss)(2) | | | 0.12 | | | | 0.12 | | | | 0.24 | | | | 0.16 | | | | 0.06 | | | | 0.26 | |
Net Realized and Unrealized Gain (Loss) | | | 5.63 | | | | 1.84 | | | | (7.17 | ) | | | (6.51 | ) | | | 2.27 | | | | 4.54 | |
Total From Investment Operations | | | 5.75 | | | | 1.96 | | | | (6.93 | ) | | | (6.35 | ) | | | 2.33 | | | | 4.80 | |
| Distributions | | | | | | | | | | | | | | | | | | | | | | | | |
From Net Investment Income | | | (0.10 | ) | | | (0.12 | ) | | | (0.28 | ) | | | (0.14 | ) | | | (0.07 | ) | | | (0.28 | ) |
From Net Realized Gains | | | — | | | | — | | | | — | | | | (3.29 | ) | | | (0.53 | ) | | | (1.56 | ) |
| Total Distributions | | | (0.10 | ) | | | (0.12 | ) | | | (0.28 | ) | | | (3.43 | ) | | | (0.60 | ) | | | (1.84 | ) |
Net Asset Value, End of Period | | | $25.48 | | | | $19.83 | | | | $17.99 | | | | $25.20 | | | | $34.98 | | | | $33.25 | |
| | | | | | | | | | | | | | | | | | | | | | | | | |
Total Return(3) | | | 29.04 | % | | | 10.85 | % | | | (27.48 | )% | | | (19.31 | )% | | | 7.16 | % | | | 16.02 | % |
| | | | | | | | | | | | | | | | | | | | | | | | | |
| Ratios/Supplemental Data | |
Ratio of Operating Expenses to Average Net Assets | | | 1.69 | % | | | 1.70 | % | | | 1.70 | % | | | 1.68 | % | | | 1.67 | %(4) | | | 1.67 | % |
Ratio of Net Investment Income (Loss) to Average Net Assets | | | 0.52 | % | | | 0.58 | % | | | 1.27 | % | | | 0.53 | % | | | 0.37 | %(4) | | | 0.81 | % |
| Portfolio Turnover Rate | | | 42 | % | | | 45 | % | | | 49 | % | | | 57 | % | | | 27 | % | | | 63 | % |
| Net Assets, End of Period (in thousands) | | | $933 | | | | $863 | | | | $815 | | | | $1,176 | | | | $1,960 | | | | $1,956 | |
| (1) | January 1, 2007 through June 30, 2007. The fund’s fiscal year end was changed from December 31 to June 30, resulting in a six-month annual reporting period. For the years before June 30, 2007, the fund’s fiscal year end was December 31. |
| (2) | Computed using average shares outstanding throughout the period. |
| (3) | Total returns are calculated based on the net asset value of the last business day and do not reflect applicable sales charges. Total returns for periods less than one year are not annualized. |
See Notes to Financial Statements.
| R Class | |
| For a Share Outstanding Throughout the Years Ended June 30 (except as noted) | |
| | | 2011 | | | 2010 | | | 2009 | | | 2008 | | | 2007(1) | | | 2006 | |
| Per-Share Data | |
| Net Asset Value, Beginning of Period | | | $19.87 | | | | $18.03 | | | | $25.29 | | | | $35.04 | | | | $33.30 | | | | $30.34 | |
Income From Investment Operations | | | | | | | | | | | | | | | | | | | | | | | | |
Net Investment Income (Loss)(2) | | | 0.24 | | | | 0.23 | | | | 0.36 | | | | 0.32 | | | | 0.15 | | | | 0.41 | |
Net Realized and Unrealized Gain (Loss) | | | 5.65 | | | | 1.84 | | | | (7.21 | ) | | | (6.53 | ) | | | 2.27 | | | | 4.55 | |
Total From Investment Operations | | | 5.89 | | | | 2.07 | | | | (6.85 | ) | | | (6.21 | ) | | | 2.42 | | | | 4.96 | |
| Distributions | | | | | | | | | | | | | | | | | | | | | | | | |
From Net Investment Income | | | (0.22 | ) | | | (0.23 | ) | | | (0.41 | ) | | | (0.25 | ) | | | (0.15 | ) | | | (0.44 | ) |
From Net Realized Gains | | | — | | | | — | | | | — | | | | (3.29 | ) | | | (0.53 | ) | | | (1.56 | ) |
| Total Distributions | | | (0.22 | ) | | | (0.23 | ) | | | (0.41 | ) | | | (3.54 | ) | | | (0.68 | ) | | | (2.00 | ) |
Net Asset Value, End of Period | | | $25.54 | | | | $19.87 | | | | $18.03 | | | | $25.29 | | | | $35.04 | | | | $33.30 | |
| | | | | | | | | | | | | | | | | | | | | | | | | |
Total Return(3) | | | 29.73 | % | | | 11.38 | % | | | (27.13 | )% | | | (18.88 | )% | | | 7.42 | % | | | 16.56 | % |
| | | | | | | | | | | | | | | | | | | | | | | | | |
| Ratios/Supplemental Data | |
Ratio of Operating Expenses to Average Net Assets | | | 1.19 | % | | | 1.20 | % | | | 1.20 | % | | | 1.18 | % | | | 1.17 | %(4) | | | 1.17 | % |
Ratio of Net Investment Income (Loss) to Average Net Assets | | | 1.02 | % | | | 1.08 | % | | | 1.77 | % | | | 1.03 | % | | | 0.87 | %(4) | | | 1.31 | % |
| Portfolio Turnover Rate | | | 42 | % | | | 45 | % | | | 49 | % | | | 57 | % | | | 27 | % | | | 63 | % |
| Net Assets, End of Period (in thousands) | | | $506 | | | | $279 | | | | $176 | | | | $546 | | | | $819 | | | | $660 | |
| (1) | January 1, 2007 through June 30, 2007. The fund’s fiscal year end was changed from December 31 to June 30, resulting in a six-month annual reporting period. For the years before June 30, 2007, the fund’s fiscal year end was December 31. |
| (2) | Computed using average shares outstanding throughout the period. |
| (3) | Total returns are calculated based on the net asset value of the last business day. Total returns for periods less than one year are not annualized. |
See Notes to Financial Statements.
Report of Independent Registered Public Accounting Firm |
To the Directors of the American Century Quantitative Equity Funds, Inc. and Shareholders of the Income & Growth Fund:
In our opinion, the accompanying statement of assets and liabilities, including the schedule of investments, and the related statements of operations and of changes in net assets and the financial highlights present fairly, in all material respects, the financial position of the Income & Growth Fund (one of the eleven funds comprising the American Century Quantitative Equity Funds, Inc., hereafter referred to as the “Fund”) at June 30, 2011, the results of its operations for the year then ended, the changes in its net assets for each of the two years in the period then ended and the financial highlights for each of the periods presented, in conformity with accounting principles generally accepted in the United States of America. These financial statements and financial highlights (hereafter referred to as “financial statements”) are the responsibility of the Fund’s management; our responsibility is to express an opinion on these financial statements based on our audits. We conducted our audits of these financial statements in accordance with the standards of the Public Company Accounting Oversight Board (United States). Those standards require that we plan and perform the audit to obtain reasonable assurance about whether the financial statements are free of material misstatement. An audit includes examining, on a test basis, evidence supporting the amounts and disclosures in the financial statements, assessing the accounting principles used and significant estimates made by management, and evaluating the overall financial statement presentation. We believe that our audits, which included confirmation of securities at June 30, 2011 by correspondence with the custodian and brokers, provide a reasonable basis for our opinion.
PricewaterhouseCoopers LLP
Kansas City, Missouri
August 18, 2011
The individuals listed below serve as directors of the funds. Each director will continue to serve in this capacity until death, retirement, resignation or removal from office. The mandatory retirement age for directors who are not “interested persons,” as that term is defined in the Investment Company Act (independent directors), is 73. However, the mandatory retirement age may be extended for a period not to exceed two years with the approval of the remaining independent directors.
Mr. Thomas is the only director who is an “interested person” because he currently serves as President and Chief Executive Officer of American Century Companies, Inc. (ACC), the parent company of American Century Investment Management, Inc. (ACIM or the advisor).
The other directors (more than three-fourths of the total number) are independent; that is, they have never been employees, directors or officers of, and have no financial interest in, ACC or any of its wholly owned, direct or indirect, subsidiaries, including ACIM, American Century Investment Services, Inc. (ACIS) and American Century Services, LLC (ACS). The directors serve in this capacity for eight (in the case of Mr. Thomas, 15) registered investment companies in the American Century Investments family of funds.
The following presents additional information about the directors. The mailing address for each director other than Mr. Thomas is 1665 Charleston Road, Mountain View, California 94043. The mailing address for Mr. Thomas is 4500 Main Street, Kansas City, Missouri 64111.
Name (Year of Birth) | Position(s) Held with Funds | Length of Time Served | Principal Occupation(s) During Past 5 Years | | Number of American Century Portfolios Overseen by Director | Other Directorships Held During Past 5 Years |
| Independent Directors |
| Tanya S. Beder (1955) | Director | Since 2011 | Chairman, SBCC Group Inc. (investment advisory services) (2006 to present); Fellow in Practice, International Center for Finance, Yale University School of Management (1985 to present); Chief Executive Officer, Tribeca Global Management LLC (asset management firm) (2004 to 2006) | | 40 | None |
| Jeremy I. Bulow (1954) | Director | Since 2011 | Professor of Economics, Stanford University, Graduate School of Business (1979 to present) | | 40 | None |
| John Freidenrich (1937) | Director | Since 2005 | Founder, Member and Manager, Regis Management Company, LLC (investment management firm) (April 2004 to present) | | 40 | None |
Name (Year of Birth) | Position(s) Held with Funds | Length of Time Served | Principal Occupation(s) During Past 5 Years | | Number of American Century Portfolios Overseen by Director | Other Directorships Held During Past 5 Years |
| Independent Directors |
| Ronald J. Gilson (1946) | Director and Chairman of the Board | Since 1995 | Charles J. Meyers Professor of Law and Business, Stanford Law School (1979 to present); Marc and Eva Stern Professor of Law and Business, Columbia University School of Law (1992 to present) | | 40 | None |
Frederick L. A. Grauer (1946) | Director | Since 2008 | Senior Advisor, BlackRock, Inc. (investment management firm) (2010 to 2011); Senior Advisor, Barclays Global Investors (investment management firm) (2003 to 2009) | | 40 | None |
| Peter F. Pervere (1947) | Director | Since 2007 | Retired | | 40 | Intraware, Inc. (2003 to 2009) |
| Myron S. Scholes (1941) | Director | Since 1980 | Chairman, Platinum Grove Asset Management, L.P. (asset manager) (1999 to 2009); Frank E. Buck Professor of Finance-Emeritus, Stanford Graduate School of Business (1996 to present) | | 40 | Dimensional Fund Advisors (investment advisor); CME Group, Inc. (futures and options exchange) |
| John B. Shoven (1947) | Director | Since 2002 | Professor of Economics, Stanford University (1973 to present) | | 40 | Cadence Design Systems; Exponent; Financial Engines; Watson Wyatt Worldwide (2002 to 2006) |
| |
| Interested Director |
Jonathan S. Thomas (1963) | Director and President | Since 2007 | President and Chief Executive Officer, ACC (March 2007 to present); Chief Administrative Officer, ACC (February 2006 to February 2007); Executive Vice President, ACC (November 2005 to February 2007). Also serves as: Chief Executive Officer and Manager, ACS; Executive Vice President, ACIM; Director, ACC, ACIM and other ACC subsidiaries | | 104 | None |
Officers
The following table presents certain information about the executive officers of the funds. Each officer serves as an officer for each of the 15 investment companies
in the American Century family of funds, unless otherwise noted. No officer is compensated for his or her service as an officer of the funds. The listed officers are interested persons of the funds and are appointed or re-appointed on an annual basis. The mailing address for each of the officers listed below is 4500 Main Street, Kansas City, Missouri 64111.
Name (Year of Birth) | Offices with the Funds | | Principal Occupation(s) During the Past Five Years |
Jonathan S. Thomas (1963) | Director and President since 2007 | | President and Chief Executive Officer, ACC (March 2007 to present); Chief Administrative Officer, ACC (February 2006 to February 2007); Executive Vice President, ACC (November 2005 to February 2007). Also serves as: Chief Executive Officer and Manager, ACS; Executive Vice President, ACIM; Director, ACC, ACIM and other ACC subsidiaries |
Barry Fink (1955) | Executive Vice President since 2007 | | Chief Operating Officer and Executive Vice President, ACC (September 2007 to present); President, ACS (October 2007 to present); Managing Director, Morgan Stanley (2000 to 2007); Global General Counsel, Morgan Stanley (2000 to 2006). Also serves as: Manager, ACS and Director, ACC and certain ACC subsidiaries |
Maryanne L. Roepke (1956) | Chief Compliance Officer since 2006 and Senior Vice President since 2000 | | Chief Compliance Officer, American Century funds, ACIM and ACS (August 2006 to present); Assistant Treasurer, ACC (January 1995 to August 2006); and Treasurer and Chief Financial Officer, various American Century funds (July 2000 to August 2006). Also serves as: Senior Vice President, ACS |
| Charles A. Etherington (1957) | General Counsel since 2007 and Senior Vice President since 2006 | | Attorney, ACC (February 1994 to present); Vice President, ACC (November 2005 to present), General Counsel, ACC (March 2007 to present); Also serves as General Counsel, ACIM, ACS, ACIS and other ACC subsidiaries; and Senior Vice President, ACIM and ACS |
| Robert J. Leach (1966) | Vice President, Treasurer and Chief Financial Officer since 2006 | | Vice President, ACS (February 2000 to present); and Controller, various American Century funds (1997 to September 2006) |
| David H. Reinmiller (1963) | Vice President since 2001 | | Attorney, ACC (January 1994 to present); Associate General Counsel, ACC (January 2001 to present); Also serves as Vice President, ACIM and ACS |
| Ward D. Stauffer (1960) | Secretary since 2005 | | Attorney, ACC (June 2003 to present) |
The Statement of Additional Information has additional information about the fund’s directors and is available without charge, upon request, by calling 1-800-345-2021.
| Approval of Management Agreement |
At a meeting held on June 28, 2011, the Fund’s Board of Directors/Trustees unanimously approved the renewal of the management agreement pursuant to which American Century Investment Management, Inc. (the “Advisor”) acts as the investment advisor for the Fund. Under Section 15(c) of the Investment Company Act, contracts for investment advisory services are required to be reviewed, evaluated, and approved by a majority of a fund’s independent directors/trustees (the “Directors”) each year.
As a part of the approval process, the Board requested and reviewed extensive data and information compiled by the Advisor and certain independent providers of evaluation data concerning the Fund and the services provided to the Fund by the Advisor. This review was in addition to the oversight and evaluation undertaken by the Board and its committees on a continuous basis throughout the year and included, but was not limited to the following:
| • | the nature, extent, and quality of investment management, shareholder services, and other services provided by the Advisor to the Fund; |
| the wide range of other programs and services the Advisor provides to the Fund and its shareholders on a routine and non-routine basis; |
| the investment performance of the fund, including data comparing the Fund’s performance to appropriate benchmarks and/or a peer group of other mutual funds with similar investment objectives and strategies; |
| data comparing the cost of owning the Fund to the cost of owning similar funds; |
| the Advisor’s compliance policies, procedures, and regulatory experience; |
| financial data showing the cost of services provided to the Fund, the profitability of the Fund to the Advisor, and the overall profitability of the Advisor; |
| data comparing services provided and charges to other investment management clients of the Advisor; and |
| consideration of collateral benefits derived by the Advisor from the management of the Fund and any potential economies of scale relating thereto. |
In keeping with its practice, the Board held two in-person meetings and one telephonic meeting to review and discuss the information provided. The Board also had the benefit of the advice of its independent counsel throughout the period.
Factors Considered
The Directors considered all of the information provided by the Advisor, the independent data providers, and the Board’s independent counsel, and evaluated such information for the Fund. In connection with their review, the Directors did not identify any single factor as being all-important or controlling, and each Director may have attributed different levels of importance to different factors. In deciding to renew the management agreement, the Board based its decision on a number of factors, including the following:
Nature, Extent and Quality of Services — Generally. Under the management agreement, the Advisor is responsible for providing or arranging for all services necessary for the operation of the Fund. The Board noted that under the management agreement, the Advisor provides or arranges at its own expense a wide variety of services including:
| constructing and designing the Fund |
| portfolio research and security selection |
| initial capitalization/funding |
| daily valuation of the Fund’s portfolio |
| shareholder servicing and transfer agency, including shareholder confirmations, recordkeeping, and communications |
| regulatory and portfolio compliance |
| marketing and distribution |
The Board noted that many of these services have expanded over time both in terms of quantity and complexity in response to shareholder demands, competition in the industry, changing distribution channels, and the changing regulatory environment.
Investment Management Services. The nature of the investment management services provided to the Fund is quite complex and allows Fund shareholders access to professional money management, instant diversification of their investments within an asset class, the opportunity to easily diversify among asset classes by investing in or exchanging among various American Century Investments funds, and liquidity. In evaluating investment performance, the Board expects the Advisor to manage the Fund in accordance with its investment objectives and approved strategies. Further, the Directors recognize that the Advisor has an obligation to seek the best execution of fund trades. In providing these services, the Advisor utilizes teams of investment professionals (portfolio managers, analysts, research assistants, and securities traders) who require extensive information technology, research, training, compliance and other systems to conduct their business. The Board, directly and through its Portfolio Committee, regularly reviews investment performance information for the Fund, together with comparative information for appropriate benchmarks and/or peer groups
of similarly-managed funds, over different time horizons. The Directors also review detailed performance information during the management agreement approval process. If performance concerns are identified, the Fund receives special reviews until performance improves, during which the Board discusses with the Advisor the reasons for such results (e.g., market conditions, security selection) and any efforts being undertaken to improve performance. The Board found the investment management services provided by the Advisor to the Fund to meet or exceed industry standards. More detailed information about the Fund’s performance can be found in the Performance and Portfolio Commentary sections of this report.
Shareholder and Other Services. Under the management agreement, the Advisor provides the Fund with a comprehensive package of transfer agency, shareholder, and other services. The Board, directly and through various committees of the Board, regularly reviews reports and evaluations of such services at its regular meetings. These reports include, but are not limited to, information regarding the operational efficiency and accuracy of the shareholder and transfer agency services provided, staffing levels, shareholder satisfaction (as measured by external as well as internal sources), technology support, new products and services offered to Fund shareholders, securities trading activities, portfolio valuation services, auditing services, and legal and operational compliance activities. Certain aspects of shareholder and transfer agency service level efficiency and the quality of securities trading activities are measured by independent third party providers and are presented in comparison to other fund groups not managed by the Advisor. The Board found the services provided by the Advisor to the Fund under the management agreement to be competitive and of high quality.
Costs of Services and Profitability. The Advisor provides detailed information concerning its cost of providing various services to the Fund, its profitability in managing the Fund, its overall profitability, and its financial condition. The Directors have reviewed with the Advisor the methodology used to prepare this financial information. The financial information regarding the Advisor is considered in evaluating the Advisor’s financial condition, ability to continue to provide services under the management agreement, and the reasonableness of the current management fee. The Board concluded that the Advisor’s profits were reasonable in light of the services provided to the Fund.
Ethics. The Board generally considers the Advisor’s commitment to providing quality services to shareholders and to conducting its business ethically. They noted that the Advisor’s practices generally meet or exceed industry best practices.
Economies of Scale. The Board also reviewed information provided by the Advisor regarding the possible existence of economies of scale in connection with the management of the Fund. The Board concluded that economies of scale are difficult to measure and predict with precision, especially on a fund-by-fund basis. The Board concluded that the Advisor is appropriately sharing economies of scale through its competitive fee structure, offering competitive fees from fund inception, and through reinvestment in its business to provide shareholders additional content and services.
Comparison to Other Funds’ Fees. The management agreement provides that the Fund pay the Advisor a single, all-inclusive (or unified) management fee for providing all services necessary for the management and operation of the Fund, other than brokerage expenses, taxes, interest, extraordinary expenses, and the fees and expenses of the Fund’s independent directors (including their independent legal counsel) and expenses incurred in connection with the provision of shareholder services and distribution services under a plan adopted pursuant to Rule 12b-1 under the 1940 Act. Under the unified fee structure, the Advisor is responsible for providing all investment advisory, custody, audit, administrative, compliance, recordkeeping, marketing and shareholder services, or arranging and supervising third parties to provide such services. By contrast, most other funds are charged a variety of fees, including an investment advisory fee, a transfer agency fee, an administrative fee, distribution charges and other expenses. Other than their investment advisory fees and any applicable Rule 12b-1 distribution fees, all other components of the total fees charged by these other funds may be increased without shareholder approval. The Board believes the unified fee structure is a benefit to Fund shareholders because it clearly discloses to shareholders the cost of owning Fund shares, and, since the unified fee cannot be increased without a vote of Fund shareholders, it shifts to the Advisor the risk of increased costs of operating the Fund and provides a direct incentive to minimize administrative inefficiencies. Part of the Board’s analysis of fee levels involves reviewing certain evaluative data compiled by an independent provider and comparing the Fund’s unified fee to the total expense ratio of other funds in the Fund’s peer group. The Board concluded that the management fee paid by the Fund to the Advisor under the management agreement is reasonable in light of the services provided to the Fund.
Comparison to Fees and Services Provided to Other Clients of the Advisor. The Board also requested and received information from the Advisor concerning the nature of the services, fees, costs and profitability of its advisory services to advisory clients other than the Fund. They observed that these varying types of client accounts require different services and involve different regulatory and entrepreneurial risks than the management of the Fund. The Board analyzed this information and concluded that the fees charged and services provided to the Fund were reasonable by comparison.
Collateral or “Fall-Out” Benefits Derived by the Advisor. The Board considered the existence of collateral benefits the Advisor may receive as a result of its relationship with the Fund. They concluded that the Advisor’s primary business is managing mutual funds and it generally does not use fund or shareholder information to generate profits in other lines of business, and therefore does not derive any significant collateral benefits from them. The Board noted that the Advisor receives proprietary research from broker-dealers that execute fund portfolio transactions and concluded that this research is likely to benefit Fund shareholders. The Board also determined that the Advisor is able to provide investment management services to certain clients other than the Fund, at least in part, due to its existing infrastructure built to serve the fund complex. The Board concluded, however, that the assets of those other clients are not material to the analysis and, where applicable, may be included with the assets of the Fund to determine breakpoints in the management fee schedule.
Existing Relationship. The Board also considered whether there was any reason for not continuing the existing arrangement with the Advisor. In this regard, the Board was mindful of the potential disruptions of the Fund’s operations and various risks, uncertainties, and other effects that could occur as a result of a decision not to continue such relationship. In particular, the Board recognized that most shareholders have invested in the Fund on the strength of the Advisor’s industry standing and reputation and in the expectation that the Advisor will have a continuing role in providing advisory services to the Fund.
Conclusion of the Directors. As a result of this process, the Board, including all of the independent directors and assisted by the advice of independent legal counsel, taking into account all of the factors discussed above and the information provided by the Advisor and others, concluded that the management agreement between the Fund and the Advisor is fair and reasonable in light of the services provided and should be renewed.
Retirement Account Information
As required by law, distributions you receive from certain IRAs, or 403(b), 457 and qualified plans are subject to federal income tax withholding, unless you elect not to have withholding apply. Tax will be withheld on the total amount withdrawn even though you may be receiving amounts that are not subject to withholding, such as nondeductible contributions. In such case, excess amounts of withholding could occur. You may adjust your withholding election so that a greater or lesser amount will be withheld.
If you don’t want us to withhold on this amount, you must notify us to not withhold the federal income tax. You may notify us in writing or in certain situations by telephone or through other electronic means. You have the right to revoke your withholding election at any time and any election you make may remain in effect until revoked by filing a new election.
Remember, even if you elect not to have income tax withheld, you are liable for paying income tax on the taxable portion of your withdrawal. If you elect not to have income tax withheld or you don’t have enough income tax withheld, you may be responsible for payment of estimated tax. You may incur penalties under the estimated tax rules if your withholding and estimated tax payments are not sufficient. You can reduce or defer the income tax on a distribution by directly or indirectly rolling such distribution over to another IRA or eligible plan. You should consult your tax advisor for additional information.
State tax will be withheld if, at the time of your distribution, your address is within one of the mandatory withholding states and you have federal income tax withheld. State taxes will be withheld from your distribution in accordance with the respective state rules.
Proxy Voting Guidelines
American Century Investment Management, Inc., the fund’s investment advisor, is responsible for exercising the voting rights associated with the securities purchased and/or held by the fund. A description of the policies and procedures the advisor uses in fulfilling this responsibility is available without charge, upon request, by calling 1-800-345-2021. It is also available on American Century Investments’ website at americancentury.com and on the Securities and Exchange Commission’s website at sec.gov. Information regarding how the investment advisor voted proxies relating to portfolio securities during the most recent 12-month period ended June 30 is available on the “About Us” page at americancentury.com. It is also available at sec.gov.
Quarterly Portfolio Disclosure
The fund files its complete schedule of portfolio holdings with the Securities and Exchange Commission (SEC) for the first and third quarters of each fiscal year on Form N-Q. The fund’s Forms N-Q are available on the SEC’s website at sec.gov, and may be reviewed and copied at the SEC’s Public Reference Room in Washington, DC. Information on the operation of the Public Reference Room may be obtained by calling 1-800-SEC-0330. The fund also makes its complete schedule of portfolio holdings for the most recent quarter of its fiscal year available on its website at americancentury.com and, upon request, by calling 1-800-345-2021.
Other Tax Information
The following information is provided pursuant to provisions of the Internal Revenue Code.
The fund hereby designates up to the maximum amount allowable as qualified dividend income for the fiscal year ended June 30, 2011.
For corporate taxpayers, the fund hereby designates $23,044,296, or up to the maximum amount allowable, of ordinary income distributions paid during the fiscal year ended June 30, 2011 as qualified for the corporate dividends received deduction.
| Contact Us | americancentury.com |
| Automated Information Line | 1-800-345-8765 |
| Investor Services Representative | 1-800-345-2021 or 816-531-5575 |
| Investors Using Advisors | 1-800-378-9878 |
| Business, Not-For-Profit, Employer-Sponsored Retirement Plans | 1-800-345-3533 |
| Banks and Trust Companies, Broker-Dealers, Financial Professionals, Insurance Companies | 1-800-345-6488 |
| Telecommunications Device for the Deaf | 1-800-634-4113 |
American Century Quantitative Equity Funds, Inc.
Investment Advisor:
American Century Investment Management, Inc.
Kansas City, Missouri
This report and the statements it contains are submitted for the general information of our shareholders. The report is not authorized for distribution to prospective investors unless preceded or accompanied by an effective prospectus.
©2011 American Century Proprietary Holdings, Inc. All rights reserved.
CL-ANN-72458 1108
ANNUAL REPORT JUNE 30, 2011
| President’s Letter | 2 |
| Market Perspective | 3 |
| Performance | 4 |
| Portfolio Commentary | 6 |
| Fund Characteristics | 8 |
| Shareholder Fee Example | 9 |
| Schedule of Investments | 11 |
| Statement of Assets and Liabilities | 13 |
| Statement of Operations | 14 |
| Statement of Changes in Net Assets | 15 |
| Notes to Financial Statements | 16 |
| Financial Highlights | 22 |
| Report of Independent Registered Public Accounting Firm | 28 |
| Management | 29 |
| Approval of Management Agreement | 32 |
| Additional Information | 37 |
Any opinions expressed in this report reflect those of the author as of the date of the report, and do not necessarily represent the opinions of American Century Investments® or any other person in the American Century Investments organization. Any such opinions are subject to change at any time based upon market or other conditions and American Century Investments disclaims any responsibility to update such opinions. These opinions may not be relied upon as investment advice and, because investment decisions made by American Century Investments funds are based on numerous factors, may not be relied upon as an indication of trading intent on behalf of any American Century Investments fund. Security examples are used for representational purposes only and are not intended as recommendations to purchase or sell securities. Performance information for comparative indices and securities is provided to American Century Investments by third party vendors. To the best of American Century Investments’ knowledge, such information is accurate at the time of printing.
Dear Investor:
Thank you for reviewing this annual report for the period ended June 30, 2011. Our report offers investment performance and portfolio information, presented with the expert perspective and commentary of our portfolio management team.
This report remains one of our most important vehicles for conveying information about investment performance and the market factors and strategies that affect fund returns. For additional, updated information on fund performance, portfolio strategy, and the investment markets, we encourage you to visit our website, americancentury.com. Click on the “Fund Performance” and “Insights & News” headings at the top of our Individual Investors site.
Reporting Period Perspective: Highest Broad Fiscal-Year U.S. Stock Returns Since 1997
Benefitting from favorable conditions and expectations, the U.S. stock market produced exceptional returns, the highest for any 12-month period ended June 30 since the fiscal year ended June 30, 1997. Back then, the S&P 500 Index gained 34.71%, compared with 30.69% for the most-recent reporting period. The intervening 14 years help illustrate how infrequently such a high level of performance occurs, requiring an alignment of economic and market conditions that’s difficult to duplicate.
The exceptional returns experienced during the reporting period represent a rebound from previous declines. After experiencing 10–12% declines during the second quarter of 2010—stemming from the European sovereign debt crisis and double-dip recession fears—most broad U.S. stock indices advanced 30% or more during the following 12 months. Monetary and fiscal intervention in 2010 stimulated growth and fueled investor optimism about economic and financial market conditions in 2011 and 2012, encouraging investments in riskier assets.
However, that optimism has diminished in the summer of 2011 as the European debt crisis returned to prominence and other debt and economic challenges emerged. As the reporting period came to a close in June 2011, we saw increasing signs that the U.S. economic recovery had lost momentum. As a result, economic growth forecasts were reduced, and broad U.S. stock indices trended downward beginning in May. As we enter the third quarter of 2011, investor concern over fiscal austerity measures in the U.S. and other developed economies raised fears of a return to recession and accelerated a decline in global equity markets. We appreciate your continued trust in us during these uncertain times.
Sincerely,
Jonathan Thomas
President and Chief Executive Officer
American Century Investments
By Scott Wittman, Chief Investment Officer, Quantitative Equity and Asset Allocation
Despite Concerns, Market Rally Prevailed
Market sentiment resembled a barbell during the 12-month period, with a negative tone characterizing both ends of the period and optimism flowing through the middle. Nervousness took hold early on, as sovereign debt problems in Europe and concerns about a “double-dip” recession in the United States rattled the markets and sent investors seeking safe-haven investments, including U.S. Treasuries and gold.
Optimism emerged for most of the period’s middle months, as generally upbeat economic data, the launch of the Federal Reserve’s (the Fed’s) second round of quantitative easing (QE2), and the extension of prevailing U.S. federal income tax rates sparked a global stock market rally. Late in the period, sovereign debt and economic growth concerns resurfaced, fueling another flight to safety. At the same time, inflationary pressures began brewing, primarily due to soaring prices for oil and other commodities. U.S. inflation, as measured by the year-to-year change in the Consumer Price Index, ended the period at 3.6%, compared with 1.1% a year earlier.
Overall, the rally months were strong enough to offset the pessimistic periods, and global stocks posted sharp gains for the 12-month period. Similarly, commodity prices soared on growing global demand combined with supply concerns.
Gold Reached New Highs
Gold prices continued to surge, benefitting from the sovereign-debt woes plaguing Europe and the accommodative fiscal and monetary policies in the United States. Strong demand pushed the price of an ounce of gold bullion from $1,244.00 on June 30, 2010, to $1,505.50 on June 30, 2011, just shy of its record high of $1,552.50 recorded on June 22, 2011.
Gold prices gathered support from the sagging U.S. dollar, which continued to tumble versus the euro. European Central Bank tightening and the passage of an austerity plan for Greece helped bolster the euro, while QE2 and the soaring U.S. federal debt punished the greenback. Expecting these factors eventually may lead to higher inflation and a weaker U.S. dollar than are currently reflected in the market, investors drove gold prices higher during the 12-month period.
| 12-Month Total Returns |
| As of June 30, 2011 |
| London Gold PM Fix, in U.S. dollars | 21.02% |
| U.S. Dollar vs. Euro (Calculated on the basis of euro per one U.S. dollar) | -15.60% |
| S&P Goldman Sachs Commodities Index (total returns) | 26.11% |
| Total Returns as of June 30, 2011 |
| | | | Average Annual Returns | |
| | Ticker Symbol | 1 year | 5 years | 10 years | Since Inception | Inception Date |
| Investor Class | BGEIX | 11.44% | 9.97% | 20.44% | 5.79% | 8/17/88 |
NYSE Arca Gold Miners Index | — | 6.33% | 8.29% | N/A(1) | N/A(1) | — |
| MSCI World Index | — | 30.51% | 2.28% | 3.99% | 6.89%(2) | — |
| FTSE Gold Mines Index | — | 5.19% | 8.58% | 17.50% | N/A(3) | — |
| Institutional Class | AGGNX | 11.64% | — | — | 9.03% | 9/28/07 |
A Class(4) No sales charge* With sales charge* | ACGGX | 11.15% 4.76% | 9.69% 8.41% | 20.16% 19.46% | 11.63% 11.13% | 5/6/98 |
B Class No sales charge* With sales charge* | AGYBX | 10.31% 6.31% | — — | — — | 7.73% 7.07% | 9/28/07 |
| C Class | AGYCX | 10.31% | — | — | 7.74% | 9/28/07 |
| R Class | AGGWX | 10.87% | — | — | 8.27% | 9/28/07 |
*Sales charges include initial sales charges and contingent deferred sales charges (CDSCs), as applicable. A Class shares have a 5.75% maximum initial sales charge and may be subject to a maximum CDSC of 1.00%. B Class shares redeemed within six years of purchase are subject to a CDSC that declines from 5.00% during the first year after purchase to 0.00% the sixth year after purchase. C Class shares redeemed within 12 months of purchase are subject to a maximum CDSC of 1.00%. The SEC requires that mutual funds provide performance information net of maximum sales charges in all cases where charges could be applied.
| (1) | Benchmark total return data first available 2/1/05. |
| (2) | Since 8/31/88, the date nearest the Investor Class’s inception for which data are available. |
| (3) | Benchmark data first available 9/22/98. |
| (4) | Prior to September 4, 2007, the A Class was referred to as the Advisor Class and did not have a front-end sales charge. Performance prior to that date has been adjusted to reflect this charge. |
Data presented reflect past performance. Past performance is no guarantee of future results. Current performance may be higher or lower than the performance shown. Investment return and principal value will fluctuate, and redemption value may be more or less than original cost. To obtain performance data current to the most recent month end, please call 1-800-345-2021 or visit americancentury.com. The fund concentrates its investments in a narrow segment of the total market and is therefore subject to greater risks and market fluctuations than a portfolio representing a broader range of industries. International investing involves special risks, such as political instability and currency fluctuations. Investing in emerging markets may accentuate these risks.
Unless otherwise indicated, performance reflects Investor Class shares; performance for other share classes will vary due to differences in fee structure. For information about other share classes available, please consult the prospectus. Data assumes reinvestment of dividends and capital gains, and none of the charts reflect the deduction of taxes that a shareholder would pay on fund distributions or the redemption of fund shares. Returns for the indices are provided for comparison. The fund’s total returns include operating expenses (such as transaction costs and management fees) that reduce returns, while the total returns of the indices do not.
| Growth of $10,000 Over 10 Years* |
| $10,000 investment made June 30, 2001 |
| * | Since NYSE Arca Gold Miners Index data is only available from 2/1/05, it is not included in the line chart. |
| Total Annual Fund Operating Expenses |
| Investor Class | Institutional Class | A Class | B Class | C Class | R Class |
| 0.69% | 0.49% | 0.94% | 1.69% | 1.69% | 1.19% |
The total annual fund operating expenses shown is as stated in the fund’s prospectus current as of the date of this report. The prospectus may vary from the expense ratio shown elsewhere in this report because it is based on a different time period, includes acquired fund fees and expenses, and, if applicable, does not include fee waivers or expense reimbursements.
Data presented reflect past performance. Past performance is no guarantee of future results. Current performance may be higher or lower than the performance shown. Investment return and principal value will fluctuate, and redemption value may be more or less than original cost. To obtain performance data current to the most recent month end, please call 1-800-345-2021 or visit americancentury.com. The fund concentrates its investments in a narrow segment of the total market and is therefore subject to greater risks and market fluctuations than a portfolio representing a broader range of industries. International investing involves special risks, such as political instability and currency fluctuations. Investing in emerging markets may accentuate these risks.
Unless otherwise indicated, performance reflects Investor Class shares; performance for other share classes will vary due to differences in fee structure. For information about other share classes available, please consult the prospectus. Data assumes reinvestment of dividends and capital gains, and none of the charts reflect the deduction of taxes that a shareholder would pay on fund distributions or the redemption of fund shares. Returns for the indices are provided for comparison. The fund’s total returns include operating expenses (such as transaction costs and management fees) that reduce returns, while the total returns of the indices do not.
Portfolio Managers: Bill Martin and Lynette Pang
Performance Summary
Global Gold advanced 11.44%* for the 12 months ended June 30, 2011. The portfolio’s benchmark, the NYSE Arca Gold Miners Index, gained 6.33% for the same period. The portfolio’s return reflects operating expenses, while the benchmark’s return does not.
Gold continued to rally during the 12-month period, maintaining its “alternative currency” role and posting gains in all major markets. At the same time, the U.S. dollar continued to weaken, as the U.S. Federal Reserve’s (the Fed’s) second government-securities purchase program (quantitative easing, or QE2) sent the greenback tumbling against the euro and other major currencies. Investors feared QE2, combined with other fiscal and monetary stimulus measures still working through the financial system, would lead to a weaker dollar and rising inflation. Investors looking to hedge against these threats favored gold. (Usually, gold prices rise when the U.S. dollar falls, and vice versa.) Additionally, investor concerns about potential sovereign-debt defaults in Greece and other European countries drove investors to the “safe-haven” investment.
Despite the sharp rise in gold prices, gold-related stocks generally lagged the overall robust performance of global stocks during the 12-month period. The portfolio’s outperformance relative to the benchmark primarily was due
to our strong stock selection, particularly among smaller-capitalization,
non-benchmark companies.
“Core” and “Explore” Strategy Lifted Performance
Our strategy of investing the bulk of the portfolio in larger-capitalization “core” mining companies and smaller-capitalization, non-benchmark (companies represented in the portfolio but not in the benchmark) exploration, or “explore,” companies was effective during the period. The allocation to core gold producers makes the portfolio’s share price more responsive to changes in the value of gold bullion, while the exposure to smaller, exploration-oriented companies offers significant upside growth potential.
In particular, our out-of-benchmark position in Canada’s Silver Wheaton Corp., a royalty holding company, was a top contributor to relative performance. The company, which takes a venture capitalist approach to silver mining by funding the development of silver mines in exchange for shares of the mines’ outputs, benefited from rising silver prices. Similar to gold, silver prices typically advance in times of economic uncertainty, but unlike gold, silver has many industrial uses, and industrial demand, particularly in India and China, has been rising. At the end of the period, Silver Wheaton was among the portfolio’s 10 largest holdings.
*All fund returns referenced in this commentary are for Investor Class shares.
The portfolio’s performance also benefited from our position in Andean Resources, an Australia-based company engaged in gold and silver exploration in Argentina. Canada’s Goldcorp, the world’s largest gold mining company, purchased Andean in late 2010 for a significant premium to Andean’s average stock price. In addition, our position in Goldcorp also was among the top contributors to performance, as the company reported record earnings in the first quarter of 2011 and record production increases of gold, zinc, lead, and silver. Goldcorp was the portfolio’s second-largest holding at the end of the period.
Peru Underweight Detracted
Overall, an underweight in Peru and an out-of-benchmark allocation to the United Kingdom detracted from the portfolio’s relative performance. In terms of individual holdings, our underweight position in U.S.-based Coeur d’Alene Mines Corp., a silver-mining company, detracted the most from relative performance. The company reported a 126% jump in sales during the first quarter of 2011, and its stock advanced sharply during the period. Similarly, an underweight in Hecla Mining, a U.S.-based miner of silver, gold, lead and zinc, hurt relative performance, as the company’s stock advanced sharply during the period.
In addition, our portfolio-only position in United Kingdom-based Randgold Resources, which has mining operations in West and Central Africa, detracted from performance. The company reported disappointing earnings in the first quarter of 2011. More than 31,000 ounces of gold went unsold from one of Randgold’s Ivory Coast mines due to the ongoing political instability in the region.
Outlook
Looking ahead, we remain focused on gold mining companies that can continue to grow their reserve base while replacing production. We continue to favor the royalty business, where several companies remain favorably positioned to benefit from rising gold prices or rising production, without the negative exposure associated with cost overruns or mine construction problems.
We will continue to invest in securities of companies engaged in the mining, processing, fabricating, or distributing of gold or other precious metals throughout the world. Regardless of macro developments, including the direction of gold prices and the strength of the U.S. dollar, we follow a disciplined investment approach. Shunning momentum-driven areas of the market, we strive to add value through tactical allocations in specific mining companies we believe are well-positioned to generate above-average returns.
| Market Returns |
| For the year ended June 30, 2011 |
Background Influences(1) | | | Regional Components of FTSE Gold Mines Index(2) |
| U.S. Dollar vs. South African Rand | -11.75% | | FTSE Gold Mines Americas Index | 1.86% |
| U.S. Dollar vs. Australian Dollar | -21.58% | | FTSE Gold Mines Asia Pacific Index | 33.69% |
| Broad Gold Stock Market | | | FTSE Gold Mines Europe Middle East Africa Index | 1.89% |
| Lipper Precious Metals Fund Index | 19.83% | |
| FTSE Gold Mines Index(2) | 5.19% | |
| | | | (1) All percentage changes in foreign exchange rates are calculated on the basis of that currency per 1 U.S. dollar. (2) Source: FactSet |
| | | |
| June 30, 2011 | |
| Top Ten Holdings | % of net assets |
| Barrick Gold Corp. | 12.2% |
Goldcorp, Inc.(1) | 11.1% |
| Newmont Mining Corp. | 6.8% |
| Silver Wheaton Corp. | 4.6% |
| Randgold Resources Ltd. | 4.0% |
Kinross Gold Corp.(1) | 3.7% |
AngloGold Ashanti Ltd.(1) | 3.6% |
Yamana Gold, Inc.(1) | 3.6% |
| Eldorado Gold Corp. | 3.2% |
| Compania de Minas Buenaventura SA | 3.2% |
(1)Includes shares traded on all exchanges. |
| | |
| Geographic Composition | % of net assets |
| Canada | 70.3% |
| United States | 12.5% |
| South Africa | 6.6% |
| United Kingdom | 4.0% |
| Peru | 3.2% |
| Australia | 1.5% |
| Mexico | 0.9% |
Cash and Equivalents(2) | 1.0% |
(2)Includes temporary cash investments and other assets and liabilities. |
| | |
| Types of Investments in Portfolio | % of net assets |
| Foreign Common Stocks & Warrants | 86.5% |
| Domestic Common Stocks | 12.5% |
| Total Equity Exposure | 99.0% |
| Temporary Cash Investments | 1.5% |
| Other Assets and Liabilities | (0.5)% |
Fund shareholders may incur two types of costs: (1) transaction costs, including sales charges (loads) on purchase payments and redemption/exchange fees; and (2) ongoing costs, including management fees; distribution and service (12b-1) fees; and other fund expenses. This example is intended to help you understand your ongoing costs (in dollars) of investing in your fund and to compare these costs with the ongoing cost of investing in other mutual funds.
The example is based on an investment of $1,000 made at the beginning of the period and held for the entire period from January 1, 2011 to June 30, 2011.
Actual Expenses
The table provides information about actual account values and actual expenses for each class. You may use the information, together with the amount you invested, to estimate the expenses that you paid over the period. First, identify the share class you own. Then simply divide your account value by $1,000 (for example, an $8,600 account value divided by $1,000 = 8.6), then multiply the result by the number under the heading “Expenses Paid During Period” to estimate the expenses you paid on your account during this period.
If you hold Investor Class shares of any American Century Investments fund, or Institutional Class shares of the American Century Diversified Bond Fund, in an American Century Investments account (i.e., not a financial intermediary or retirement plan account), American Century Investments may charge you a $12.50 semiannual account maintenance fee if the value of those shares is less than $10,000. We will redeem shares automatically in one of your accounts to pay the $12.50 fee. In determining your total eligible investment amount, we will include your investments in all personal accounts (including American Century Investments Brokerage accounts) registered under your Social Security number. Personal accounts include individual accounts, joint accounts, UGMA/UTMA accounts, personal trusts, Coverdell Education Savings Accounts and IRAs (including traditional, Roth, Rollover, SEP-, SARSEP- and SIMPLE-IRAs), and certain other retirement accounts. If you have only business, business retirement, employer-sponsored or American Century Investments Brokerage accounts, you are currently not subject to this fee. We will not charge the fee as long as you choose to manage your accounts exclusively online. If you are subject to the Account Maintenance Fee, your account value could be reduced by the fee amount.
Hypothetical Example for Comparison Purposes
The table also provides information about hypothetical account values and hypothetical expenses based on the actual expense ratio of each class of your fund and an assumed rate of return of 5% per year before expenses, which is not the actual return of a fund’s share class. The hypothetical account values and expenses may not be used to estimate the actual ending account balance or expenses you paid for the period. You may use this information to compare the ongoing costs of investing in your fund and other funds. To do so, compare this 5% hypothetical example with the 5% hypothetical examples that appear in the shareholder reports of the other funds.
Please note that the expenses shown in the table are meant to highlight your ongoing costs only and do not reflect any transactional costs, such as sales charges (loads) or redemption/exchange fees. Therefore, the table is useful in comparing ongoing costs only, and will not help you determine the relative total costs of owning different funds. In addition, if these transactional costs were included, your costs would have been higher.
| | Beginning Account Value 1/1/11 | Ending Account Value 6/30/11 | Expenses Paid During Period* 1/1/11 – 6/30/11 | Annualized Expense Ratio* |
| Actual | | | | |
| Investor Class | $1,000 | $878.10 | $3.17 | 0.68% |
| Institutional Class | $1,000 | $879.20 | $2.24 | 0.48% |
| A Class | $1,000 | $876.90 | $4.33 | 0.93% |
| B Class | $1,000 | $873.90 | $7.81 | 1.68% |
| C Class | $1,000 | $873.90 | $7.81 | 1.68% |
| R Class | $1,000 | $875.90 | $5.49 | 1.18% |
| Hypothetical | | | | |
| Investor Class | $1,000 | $1,021.42 | $3.41 | 0.68% |
| Institutional Class | $1,000 | $1,022.41 | $2.41 | 0.48% |
| A Class | $1,000 | $1,020.18 | $4.66 | 0.93% |
| B Class | $1,000 | $1,016.46 | $8.40 | 1.68% |
| C Class | $1,000 | $1,016.46 | $8.40 | 1.68% |
| R Class | $1,000 | $1,018.94 | $5.91 | 1.18% |
*Expenses are equal to the class’s annualized expense ratio listed in the table above, multiplied by the average account value over the period, multiplied by 181, the number of days in the most recent fiscal half-year, divided by 365, to reflect the one-half year period.
| | | Shares | | | Value | |
| Common Stocks & Warrants — 99.0% | |
| AUSTRALIA — 1.5% | |
Centamin Egypt Ltd.(1) | | | 1,666,900 | | | | $3,352,984 | |
CGA Mining Ltd.(1) | | | 2,379,741 | | | | 7,377,703 | |
| Newcrest Mining Ltd. | | | 150,055 | | | | 6,090,813 | |
| | | | | | | | 16,821,500 | |
| CANADA — 70.3% | |
| Agnico-Eagle Mines Ltd. | | | 227,035 | | | | 14,354,911 | |
| Agnico-Eagle Mines Ltd. New York Shares | | | 322,400 | | | | 20,353,112 | |
| Alamos Gold, Inc. | | | 162,300 | | | | 2,687,471 | |
ATAC Resources Ltd.(1) | | | 974,300 | | | | 7,374,555 | |
AuRico Gold, Inc.(1) | | | 695,300 | | | | 7,641,848 | |
Aurizon Mines Ltd.(1) | | | 887,400 | | | | 4,968,593 | |
B2Gold Corp.(1) | | | 1,046,700 | | | | 3,538,019 | |
| Barrick Gold Corp. | | | 3,032,312 | | | | 137,333,410 | |
Bear Creek Mining Corp.(1) | | | 748,000 | | | | 2,985,950 | |
Belo Sun Mining Corp.(1) | | | 4,915,100 | | | | 5,300,123 | |
Canaco Resources, Inc.(1) | | | 4,595,400 | | | | 15,866,745 | |
| Centerra Gold, Inc. | | | 387,200 | | | | 6,423,557 | |
Clifton Star Resources, Inc.(1) | | | 1,190,200 | | | | 3,122,200 | |
Continental Gold Ltd.(1) | | | 427,000 | | | | 3,249,707 | |
Detour Gold Corp.(1) | | | 411,001 | | | | 11,910,911 | |
Dundee Precious Metals, Inc.(1) | | | 1,048,400 | | | | 8,489,817 | |
| Eldorado Gold Corp. | | | 2,469,700 | | | | 36,439,246 | |
First Majestic Silver Corp.(1) | | | 244,400 | | | | 4,520,811 | |
| Franco-Nevada Corp. | | | 195,500 | | | | 7,297,423 | |
GBS Gold International, Inc.(1) | | | 347,300 | | | | 1,800 | |
| Goldcorp, Inc. | | | 2,523,276 | | | | 122,049,692 | |
| Goldcorp, Inc. New York Shares | | | 64,300 | | | | 3,103,761 | |
Golden Star Resources Ltd.(1) | | | 965,100 | | | | 2,121,429 | |
Great Basin Gold Ltd.(1) | | | 4,306,200 | | | | 8,840,558 | |
Guyana Goldfields, Inc.(1) | | | 547,700 | | | | 3,890,036 | |
| IAMGOLD Corp. | | | 1,793,019 | | | | 33,724,262 | |
International Tower Hill Mines Ltd.(1) | | | 318,300 | | | | 2,402,638 | |
Ivanhoe Mines Ltd.(1) | | | 477,900 | | | | 12,075,715 | |
| Kinross Gold Corp. | | | 2,019,452 | | | | 31,889,945 | |
| Kinross Gold Corp. New York Shares | | | 614,857 | | | | 9,714,741 | |
Kirkland Lake Gold, Inc.(1) | | | 235,600 | | | | 3,713,121 | |
Lake Shore Gold Corp.(1) | | | 1,334,915 | | | | 3,889,379 | |
Midas Gold Corp.(1) | | | 1,567,250 | | | | 5,281,313 | |
Minefinders Corp. Ltd.(1) | | | 130,900 | | | | 1,699,277 | |
| Nevsun Resources Ltd. | | | 1,093,300 | | | | 6,620,221 | |
New Gold, Inc.(1) | | | 2,981,600 | | | | 30,760,454 | |
Northgate Minerals Corp.(1) | | | 1,179,100 | | | | 3,056,405 | |
Osisko Mining Corp.(1) | | | 2,079,400 | | | | 32,319,152 | |
| Pan American Silver Corp. | | | 498,300 | | | | 15,392,487 | |
Premier Gold Mines Ltd.(1) | | | 784,000 | | | | 4,609,135 | |
Rio Novo Gold, Inc.(1) | | | 1,327,300 | | | | 1,926,715 | |
Romarco Minerals, Inc.(1) | | | 1,703,100 | | | | 2,896,038 | |
Sabina Gold & Silver Corp.(1) | | | 642,400 | | | | 3,929,867 | |
Seabridge Gold, Inc.(1) | | | 107,400 | | | | 3,029,754 | |
SEMAFO, Inc.(1) | | | 638,700 | | | | 4,893,974 | |
Silver Standard Resources, Inc.(1) | | | 336,000 | | | | 8,967,840 | |
| Silver Wheaton Corp. | | | 1,558,000 | | | | 51,414,000 | |
| Silvercorp Metals, Inc. | | | 348,000 | | | | 3,269,096 | |
Tahoe Resources, Inc.(1) | | | 714,600 | | | | 13,336,928 | |
Torex Gold Resources, Inc.(1) | | | 8,334,590 | | | | 15,036,743 | |
Torex Gold Resources, Inc. Warrants(1) | | | 1,321,547 | | | | 609,766 | |
| Wesdome Gold Mines Ltd. | | | 1,357,200 | | | | 3,377,345 | |
| Yamana Gold, Inc. | | | 2,558,042 | | | | 29,865,263 | |
| Yamana Gold, Inc. New York Shares | | | 926,381 | | | | 10,773,811 | |
| | | | | | | | 794,341,070 | |
| MEXICO — 0.9% | |
| Fresnillo plc | | | 472,403 | | | | 10,647,672 | |
| PERU — 3.2% | |
| Compania de Minas Buenaventura SA ADR | | | 952,300 | | | | 36,168,354 | |
| SOUTH AFRICA — 6.6% | |
| AngloGold Ashanti Ltd. | | | 465,502 | | | | 19,606,674 | |
| AngloGold Ashanti Ltd. ADR | | | 511,676 | | | | 21,536,443 | |
| Gold Fields Ltd. | | | 1,462,510 | | | | 21,399,810 | |
| Harmony Gold Mining Co. Ltd. | | | 867,150 | | | | 11,498,071 | |
| | | | | | | | 74,040,998 | |
| UNITED KINGDOM — 4.0% | |
| Randgold Resources Ltd. ADR | | | 537,200 | | | | 45,151,660 | |
| UNITED STATES — 12.5% | |
Allied Nevada Gold Corp.(1) | | | 630,900 | | | | 22,247,819 | |
Coeur d’Alene Mines Corp.(1) | | | 365,759 | | | | 8,873,313 | |
Hecla Mining Co.(1) | | | 814,300 | | | | 6,261,967 | |
| | | | | | | |
| | | Shares | | | Value | |
| | | | | | | | | |
| Newmont Mining Corp. | | | 1,428,614 | | | | $77,102,298 | |
| Royal Gold, Inc. | | | 462,921 | | | | 27,113,283 | |
| | | | | | | | 141,598,680 | |
TOTAL COMMON STOCKS & WARRANTS (Cost $512,671,948) | | | | 1,118,769,934 | |
| Temporary Cash Investments — 1.5% | |
| JPMorgan U.S. Treasury Plus Money Market Fund Agency Shares | | | 4,022,031 | | | | 4,022,031 | |
Repurchase Agreement, Bank of America N.A., (collateralized by various U.S. Treasury obligations, 4.375%, 11/15/39, valued at $4,766,006), in a joint trading account at 0.00%, dated 6/30/11, due 7/1/11 (Delivery value $4,658,099) | | | | 4,658,099 | |
| Repurchase Agreement, Credit Suisse First Boston, Inc., (collateralized by various U.S. Treasury obligations, 3.50%, 5/15/20, valued at $3,960,577), in a joint trading account at 0.00%, dated 6/30/11, due 7/1/11 (Delivery value $3,881,750) | | | | 3,881,750 | |
| Repurchase Agreement, Goldman Sachs Group, Inc., (collateralized by various U.S. Treasury obligations, 1.375%, 9/15/12, valued at $4,751,767), in a joint trading account at 0.00%, dated 6/30/11, due 7/1/11 (Delivery value $4,658,099) | | | | 4,658,099 | |
TOTAL TEMPORARY CASH INVESTMENTS (Cost $17,219,979) | | | | 17,219,979 | |
TOTAL INVESTMENT SECURITIES — 100.5% (Cost $529,891,927) | | | | 1,135,989,913 | |
| OTHER ASSETS AND LIABILITIES — (0.5)% | | | | (5,911,382 | ) |
| TOTAL NET ASSETS — 100.0% | | | | $1,130,078,531 | |
Notes to Schedule of Investments
ADR = American Depositary Receipt
See Notes to Financial Statements.
Statement of Assets and Liabilities |
| JUNE 30, 2011 | |
| Assets | |
| Investment securities, at value (cost of $529,891,927) | | | $1,135,989,913 | |
| Foreign currency holdings, at value (cost of $146,796) | | | 145,278 | |
| Receivable for investments sold | | | 2,592,089 | |
| Receivable for capital shares sold | | | 159,892 | |
| Dividends and interest receivable | | | 327,197 | |
| | | | 1,139,214,369 | |
| | | | | |
| Liabilities | | | | |
| Payable for investments purchased | | | 7,746,755 | |
| Payable for capital shares redeemed | | | 760,639 | |
| Accrued management fees | | | 618,936 | |
| Distribution and service fees payable | | | 9,508 | |
| | | | 9,135,838 | |
| | | | | |
| Net Assets | | | $1,130,078,531 | |
| | | | | |
| Net Assets Consist of: | | | | |
| Capital (par value and paid-in surplus) | | | $522,400,089 | |
| Accumulated net investment loss | | | (48,407,336 | ) |
| Undistributed net realized gain | | | 49,985,818 | |
| Net unrealized appreciation | | | 606,099,960 | |
| | | | $1,130,078,531 | |
| | Net assets | Shares outstanding | Net asset value per share |
| Investor Class, $0.01 Par Value | $1,081,257,780 | 47,220,247 | $22.90 |
| Institutional Class, $0.01 Par Value | $19,853,546 | 866,196 | $22.92 |
| A Class, $0.01 Par Value | $21,291,977 | 936,980 | $22.72* |
| B Class, $0.01 Par Value | $1,515,461 | 67,503 | $22.45 |
| C Class, $0.01 Par Value | $3,592,840 | 159,964 | $22.46 |
| R Class, $0.01 Par Value | $2,566,927 | 112,929 | $22.73 |
*Maximum offering price $24.11 (net asset value divided by 0.9425)
See Notes to Financial Statements.
| YEAR ENDED JUNE 30, 2011 | |
| Investment Income (Loss) | |
| Income: | | | |
| Dividends (net of foreign taxes withheld of $623,318) | | | $6,173,713 | |
| Interest | | | 14,910 | |
| | | | 6,188,623 | |
| | | | | |
| Expenses: | | | | |
| Management fees | | | 8,157,573 | |
| Distribution and service fees: | | | | |
| A Class | | | 59,417 | |
| B Class | | | 16,628 | |
| C Class | | | 33,721 | |
| R Class | | | 10,923 | |
| Directors’ fees and expenses | | | 50,112 | |
| Other expenses | | | 14,898 | |
| | | | 8,343,272 | |
| | | | | |
| Net investment income (loss) | | | (2,154,649 | ) |
| | | | | |
| Realized and Unrealized Gain (Loss) | | | | |
| Net realized gain (loss) on: | | | | |
| Investment transactions | | | 156,817,147 | |
| Foreign currency transactions | | | 14,468,006 | |
| | | | 171,285,153 | |
| | | | | |
| Change in net unrealized appreciation (depreciation) on: | | | | |
| Investments | | | (60,216,500 | ) |
| Translation of assets and liabilities in foreign currencies | | | 16,108,428 | |
| | | | (44,108,072 | ) |
| | | | | |
| Net realized and unrealized gain (loss) | | | 127,177,081 | |
| | | | | |
| Net Increase (Decrease) in Net Assets Resulting from Operations | | | $125,022,432 | |
See Notes to Financial Statements.
Statement of Changes in Net Assets |
| YEARS ENDED JUNE 30, 2011 AND JUNE 30, 2010 | |
| Increase (Decrease) in Net Assets | | 2011 | | | 2010 | |
| Operations | |
| Net investment income (loss) | | | $(2,154,649 | ) | | | $(1,596,974 | ) |
| Net realized gain (loss) | | | 171,285,153 | | | | 121,615,784 | |
| Change in net unrealized appreciation (depreciation) | | | (44,108,072 | ) | | | 220,307,557 | |
| Net increase (decrease) in net assets resulting from operations | | | 125,022,432 | | | | 340,326,367 | |
| | | | | | | | | |
| Distributions to Shareholders | | | | | | | | |
| From net investment income: | | | | | | | | |
| Investor Class | | | (74,345,381 | ) | | | (5,817,616 | ) |
| Institutional Class | | | (1,350,244 | ) | | | (102,540 | ) |
| A Class | | | (1,509,611 | ) | | | (65,994 | ) |
| B Class | | | (87,903 | ) | | | — | |
| C Class | | | (198,002 | ) | | | — | |
| R Class | | | (135,833 | ) | | | (625 | ) |
| From net realized gains: | | | | | | | | |
| Investor Class | | | (72,322,529 | ) | | | — | |
| Institutional Class | | | (1,263,890 | ) | | | — | |
| A Class | | | (1,535,236 | ) | | | — | |
| B Class | | | (102,609 | ) | | | — | |
| C Class | | | (222,320 | ) | | | — | |
| R Class | | | (142,583 | ) | | | — | |
| Decrease in net assets from distributions | | | (153,216,141 | ) | | | (5,986,775 | ) |
| | | | | | | | | |
| Capital Share Transactions | | | | | | | | |
| Net increase (decrease) in net assets from capital share transactions | | | 84,068,886 | | | | (81,449,142 | ) |
| | | | | | | | | |
| Redemption Fees | | | | | | | | |
| Increase in net assets from redemption fees | | | 174,977 | | | | 153,362 | |
| | | | | | | | | |
| Net increase (decrease) in net assets | | | 56,050,154 | | | | 253,043,812 | |
| | | | | | | | | |
| Net Assets | | | | | | | | |
| Beginning of period | | | 1,074,028,377 | | | | 820,984,565 | |
| End of period | | | $1,130,078,531 | | | | $1,074,028,377 | |
| | | | | | | | | |
| Accumulated net investment loss | | | $(48,407,336 | ) | | | $(4,148,509 | ) |
See Notes to Financial Statements.
Notes to Financial Statements |
JUNE 30, 2011
1. Organization
American Century Quantitative Equity Funds, Inc. (the corporation) is registered under the Investment Company Act of 1940, as amended (the 1940 Act), as an open-end management investment company and is organized as a Maryland corporation. Global Gold Fund (the fund) is one fund in a series issued by the corporation. The fund is nondiversified as defined under the 1940 Act. The fund’s investment objective is to seek to realize a total return (capital growth and dividends) consistent with investment in securities of companies that are engaged in mining, processing, fabricating or distributing gold or other metals throughout the world. The fund invests primarily in equity securities.
The fund is authorized to issue the Investor Class, the Institutional Class, the A Class, the B Class, the C Class and the R Class. The A Class may incur an initial sales charge. The A Class, B Class and C Class may be subject to a contingent deferred sales charge. The share classes differ principally in their respective sales charges and distribution and shareholder servicing expenses and arrangements. The Institutional Class is made available to institutional shareholders or through financial intermediaries whose clients do not require the same level of shareholder and administrative services as shareholders of other classes. As a result, the Institutional Class is charged a lower unified management fee.
2. Significant Accounting Policies
The following is a summary of significant accounting policies consistently followed by the fund in preparation of its financial statements. The financial statements are prepared in conformity with accounting principles generally accepted in the United States of America, which may require management to make certain estimates and assumptions at the date of the financial statements. Actual results could differ from these estimates.
Investment Valuations — The fund determines the fair value of its investments and computes its net asset value per share as of the close of regular trading (usually 4 p.m. Eastern time) on the New York Stock Exchange (NYSE) on each day the NYSE is open.
Equity securities that are listed or traded on a domestic securities exchange are valued at the last reported sales price or at the official closing price as provided by the exchange. Equity securities traded on foreign securities exchanges are typically valued at the closing price on the exchange where primarily traded or as of the close of the NYSE, if that is earlier. If no last sales price is reported, or if local convention or regulation so provides, the mean of the latest bid and asked prices is used. Depending on local convention or regulation, securities traded over-the-counter are valued at the mean of the latest bid and asked prices, the last sales price, or the official closing price. In its determination of fair value, the fund may review several factors including: market information specific to a security; news developments in U.S. and foreign markets; the performance of particular U.S. and foreign securities, indices, comparable securities, American Depositary Receipts, Exchange-Traded Funds, and other relevant market indicators.
Debt securities maturing within 60 days at the time of purchase may be valued at cost, plus or minus any amortized discount or premium or at the evaluated mean as provided by an independent pricing service. Evaluated mean prices are commonly derived through utilization of market models, which may consider, among other factors, trade data, quotations from dealers and active market makers, relevant yield curve and spread data, related sector levels, creditworthiness, and other relevant market information on the same or comparable securities.
Investments in open-end management investment companies are valued at the reported net asset value per share. Repurchase agreements are valued at cost.
The value of investments initially expressed in foreign currencies is translated into U.S. dollars at prevailing exchange rates.
If the fund determines that the market price for a portfolio security is not readily available or the valuation methods mentioned above do not reflect a security’s fair value, such security is valued as determined in good faith by the Board of Directors or its designee, in accordance with procedures adopted by the Board of Directors. Circumstances that may cause the fund to use these procedures to value a security include, but are not limited to: a security has been declared in default; trading in a security has been halted during the trading day; there is a foreign market holiday and no trading occurred; or an event occurred between the close of a foreign exchange and the NYSE that may affect the value of a security.
Security Transactions — Security transactions are accounted for as of the trade date. Net realized gains and losses are determined on the identified cost basis, which is also used for federal income tax purposes.
Investment Income — Dividend income less foreign taxes withheld, if any, is recorded as of the ex-dividend date. Interest income is recorded on the accrual basis and includes accretion of discounts and amortization of premiums.
Foreign Currency Translations — All assets and liabilities initially expressed in foreign currencies are translated into U.S. dollars at prevailing exchange rates at period end. The fund may enter into spot foreign currency exchange contracts to facilitate transactions denominated in a foreign currency. Purchases and sales of investment securities, dividend and interest income, spot foreign currency exchange contracts, and expenses are translated at the rates of exchange prevailing on the respective dates of such transactions. Net realized and unrealized foreign currency exchange gains or losses related to investment securities are a component of net realized gain (loss) on foreign currency transactions and change in net unrealized appreciation (depreciation) on translation of assets and liabilities in foreign currencies, respectively.
Repurchase Agreements — The fund may enter into repurchase agreements with institutions that American Century Investment Management, Inc. (ACIM) (the investment advisor) has determined are creditworthy pursuant to criteria adopted by the Board of Directors. The fund requires that the collateral, represented by securities, received in a repurchase transaction be transferred to the custodian in a manner sufficient to enable the fund to obtain those securities in the event of a default under the repurchase agreement. ACIM monitors, on a daily basis, the securities transferred to ensure the value, including accrued interest, of the securities under each repurchase agreement is equal to or greater than amounts owed to the fund under each repurchase agreement.
Joint Trading Account — Pursuant to an Exemptive Order issued by the Securities and Exchange Commission, the fund, along with certain other funds in the American Century Investments family of funds, may transfer uninvested cash balances into a joint trading account. These balances are invested in one or more repurchase agreements that are collateralized by U.S. Treasury or Agency obligations.
Income Tax Status — It is the fund’s policy to distribute substantially all net investment income and net realized gains to shareholders and to otherwise qualify as a regulated investment company under provisions of the Internal Revenue Code. The fund is no longer subject to examination by tax authorities for years prior to 2008. At this time, management believes there are no uncertain tax positions which, based on their technical merit, would not be sustained upon examination and for which it is reasonably possible that the total amounts of unrecognized tax benefits will significantly change in the next twelve months. Accordingly, no provision has been made for federal or state income taxes.
Multiple Class — All shares of the fund represent an equal pro rata interest in the net assets of the class to which such shares belong, and have identical voting, dividend, liquidation and other rights and the same terms and conditions, except for class specific expenses and exclusive rights to vote on matters affecting only individual classes. Income, non-class specific expenses, and realized and unrealized capital gains and losses of the fund are allocated to each class of shares based on their relative net assets.
Distributions to Shareholders — Distributions from net investment income, if any, are generally declared and paid semiannually. Distributions from net realized gains, if any, are generally declared and paid annually.
Redemption — The fund may impose a 1.00% redemption fee on shares held less than 60 days. The fee may not be applicable to all classes. The redemption fee is retained by the fund and helps cover transaction costs that long-term investors may bear when the fund sells securities to meet investor redemptions.
Indemnifications — Under the corporation’s organizational documents, its officers and directors are indemnified against certain liabilities arising out of the performance of their duties to the fund. In addition, in the normal course of business, the fund enters into contracts that provide general indemnifications. The maximum exposure under these arrangements is unknown as this would involve future claims that may be made against a fund. The risk of material loss from such claims is considered by management to be remote.
3. Fees and Transactions with Related Parties
Management Fees — The corporation has entered into a management agreement with ACIM, under which ACIM provides the fund with investment advisory and management services in exchange for a single, unified management fee (the fee) per class. The agreement provides that all expenses of managing and operating the fund, except distribution and service fees, brokerage expenses, taxes, interest, fees and expenses of the independent directors (including legal counsel fees), and extraordinary expenses, will be paid by ACIM. The fee is computed and accrued daily based on each class’s daily net assets and paid monthly in arrears. The fee consists of (1) an Investment Category Fee based on the daily net assets of the fund and certain other accounts managed by the investment advisor that are in the same broad investment category as the fund and (2) a Complex Fee based on the assets of all the funds in the American Century Investments family of funds. The rates for the Investment Category Fee range from 0.3380% to 0.5200%. The rates for the Complex Fee range from 0.2500% to 0.3100% for the Investor Class, A Class, B Class, C Class and R Class. The Institutional Class is 0.2000% less at each point within the Complex Fee range. The effective annual management fee for each class for the year ended June 30, 2011 was 0.68% for the Investor Class, A Class, B Class, C Class and R Class and 0.48% for the Institutional Class.
Distribution and Service Fees — The Board of Directors has adopted a separate Master Distribution and Individual Shareholder Services Plan for each of the A Class, B Class, C Class and R Class (collectively the plans), pursuant to Rule 12b-1 of the 1940 Act. The plans provide that the A Class will pay American Century Investment Services, Inc. (ACIS) an annual distribution and service fee of 0.25%. The plans provide that the B Class and C Class will each pay ACIS an annual distribution and service fee of 1.00%, of which 0.25% is paid for individual shareholder services and 0.75% is paid for distribution services. The plans provide that the R Class will pay ACIS an annual distribution and service fee of 0.50%. The fees are computed and accrued daily based on each class’s daily net assets and paid monthly in arrears. The fees are used to pay financial intermediaries for distribution and individual shareholder services. Fees incurred under the plans during the year ended June 30, 2011 are detailed in the Statement of Operations.
Related Parties — Certain officers and directors of the corporation are also officers and/or directors of American Century Companies, Inc. (ACC), the parent of the corporation’s investment advisor, ACIM, the distributor of the corporation, ACIS, and the corporation’s transfer agent, American Century Services, LLC.
The fund is eligible to invest in a money market fund for temporary purposes, which is managed by J.P. Morgan Investment Management, Inc. (JPMIM). The fund has a securities lending agreement with JPMorgan Chase Bank (JPMCB) and a mutual funds services agreement with J.P. Morgan Investor Services Co. (JPMIS). JPMCB is a custodian of the fund. JPMIM, JPMIS and JPMCB are wholly owned subsidiaries of JPMorgan Chase & Co. (JPM). JPM is an equity investor in ACC. The services provided to the fund by JPMIM, JPMIS and JPMCB terminated on July 31, 2011.
4. Investment Transactions
Purchases and sales of investment securities, excluding short-term investments, for the year ended June 30, 2011 were $389,044,844 and $467,459,574, respectively.
5. Capital Share Transactions
Transactions in shares of the fund were as follows:
| | | Year ended June 30, 2011 | | | Year ended June 30, 2010 | |
| | | Shares | | | Amount | | | Shares | | | Amount | |
| Investor Class/Shares Authorized | | | 200,000,000 | | | | | | | 200,000,000 | | | | |
| Sold | | | 8,972,049 | | | | $225,635,610 | | | | 7,567,069 | | | | $154,310,795 | |
| Issued in reinvestment of distributions | | | 5,119,136 | | | | 136,524,838 | | | | 268,781 | | | | 5,445,498 | |
| Redeemed | | | (11,539,226 | ) | | | (286,921,826 | ) | | | (11,990,931 | ) | | | (243,553,721 | ) |
| | | | 2,551,959 | | | | 75,238,622 | | | | (4,155,081 | ) | | | (83,797,428 | ) |
| Institutional Class/Shares Authorized | | | 10,000,000 | | | | | | | | 10,000,000 | | | | | |
| Sold | | | 363,533 | | | | 9,132,218 | | | | 306,887 | | | | 6,186,758 | |
| Issued in reinvestment of distributions | | | 98,002 | | | | 2,614,134 | | | | 5,061 | | | | 102,540 | |
| Redeemed | | | (276,395 | ) | | | (6,803,179 | ) | | | (189,413 | ) | | | (3,778,037 | ) |
| | | | 185,140 | | | | 4,943,173 | | | | 122,535 | | | | 2,511,261 | |
| A Class/Shares Authorized | | | 20,000,000 | | | | | | | | 20,000,000 | | | | | |
| Sold | | | 601,435 | | | | 14,958,572 | | | | 618,293 | | | | 12,476,471 | |
| Issued in reinvestment of distributions | | | 97,614 | | | | 2,586,084 | | | | 2,704 | | | | 54,488 | |
| Redeemed | | | (671,729 | ) | | | (16,648,701 | ) | | | (757,121 | ) | | | (14,337,028 | ) |
| | | | 27,320 | | | | 895,955 | | | | (136,124 | ) | | | (1,806,069 | ) |
| B Class/Shares Authorized | | | 10,000,000 | | | | | | | | 10,000,000 | | | | | |
| Sold | | | 4,430 | | | | 110,080 | | | | 21,272 | | | | 366,451 | |
| Issued in reinvestment of distributions | | | 6,752 | | | | 177,233 | | | | — | | | | — | |
| Redeemed | | | (16,528 | ) | | | (399,359 | ) | | | (5,176 | ) | | | (104,738 | ) |
| | | | (5,346 | ) | | | (112,046 | ) | | | 16,096 | | | | 261,713 | |
| C Class/Shares Authorized | | | 10,000,000 | | | | | | | | 10,000,000 | | | | | |
| Sold | | | 74,941 | | | | 1,859,020 | | | | 62,106 | | | | 1,246,949 | |
| Issued in reinvestment of distributions | | | 10,909 | | | | 286,073 | | | | — | | | | — | |
| Redeemed | | | (27,908 | ) | | | (668,753 | ) | | | (22,862 | ) | | | (453,638 | ) |
| | | | 57,942 | | | | 1,476,340 | | | | 39,244 | | | | 793,311 | |
| R Class/Shares Authorized | | | 10,000,000 | | | | | | | | 10,000,000 | | | | | |
| Sold | | | 93,224 | | | | 2,283,666 | | | | 45,887 | | | | 892,013 | |
| Issued in reinvestment of distributions | | | 10,498 | | | | 278,416 | | | | 31 | | | | 625 | |
| Redeemed | | | (39,432 | ) | | | (935,240 | ) | | | (16,681 | ) | | | (304,568 | ) |
| | | | 64,290 | | | | 1,626,842 | | | | 29,237 | | | | 588,070 | |
| Net increase (decrease) | | | 2,881,305 | | | | $84,068,886 | | | | (4,084,093 | ) | | | $(81,449,142 | ) |
6. Affiliated Company Transactions
If a fund’s holding represents ownership of 5% or more of the voting securities of a company, the company is affiliated as defined in the 1940 Act. A summary of transactions for each company which is or was an affiliate at or during the year ended June 30, 2011 follows:
| | June 30, 2010 | | | | | June 30, 2011 |
| Company | Share Balance | Purchase Cost | Sales Cost | Realized Gain (Loss) | Dividend Income | Share Balance | Market Value |
Clifton Star Resources, Inc.(1)(2) | 329,700 | $5,049,040 | $1,941,170 | $(1,034,194) | — | 1,190,200 | (2) |
| (2) | Company was not an affiliate at June 30, 2011. |
7. Fair Value Measurements
The fund’s securities valuation process is based on several considerations and may use multiple inputs to determine the fair value of the positions held by the fund. In conformity with accounting principles generally accepted in the United States of America, the inputs used to determine a valuation are classified into three broad levels as follows:
| Level 1 valuation inputs consist of unadjusted quoted prices in an active market for identical securities; |
| Level 2 valuation inputs consist of direct or indirect observable market data (including quoted prices for similar securities, evaluations of subsequent market events, interest rates, prepayment speeds, credit risk, etc.); or |
| Level 3 valuation inputs consist of unobservable data (including a fund’s own assumptions). |
The level classification is based on the lowest level input that is significant to the fair valuation measurement. The valuation inputs are not necessarily an indication of the risks associated with investing in these securities or other financial instruments.
The following is a summary of the level classifications as of period end. The Schedule of Investments provides additional information on the fund’s portfolio holdings.
| | | Level 1 | | | Level 2 | | | Level 3 | |
| Investment Securities | | | | | | | | | |
| Foreign Common Stocks & Warrants | | | $362,939,373 | | | | $614,231,881 | | | | — | |
| Domestic Common Stocks | | | 119,350,861 | | | | 22,247,819 | | | | — | |
| Temporary Cash Investments | | | 4,022,031 | | | | 13,197,948 | | | | — | |
| Total Value of Investment Securities | | | $486,312,265 | | | | $649,677,648 | | | | — | |
8. Risk Factors
There are certain risks involved in investing in foreign securities. These risks include those resulting from future adverse political, social, and economic developments, fluctuations in currency exchange rates, the possible imposition of exchange controls, and other foreign laws or restrictions. Investing in emerging markets may accentuate these risks.
The fund concentrates its investments in a narrow segment of the total market. Because of this, the fund may be subject to greater risk and market fluctuations than a portfolio representing a broader range of industries.
9. Federal Tax Information
The tax character of distributions paid during the years ended June 30, 2011 and June 30, 2010 were as follows:
| | | 2011 | | | 2010 | |
| Distributions Paid From | | | | | | |
| Ordinary income | | | $80,549,110 | | | | $5,986,775 | |
| Long-term capital gains | | | $72,667,031 | | | | — | |
The book-basis character of distributions made during the year from net investment income or net realized gains may differ from their ultimate characterization for federal income tax purposes. These differences reflect the differing character of certain income items and net realized gains and losses for financial statement and tax purposes, and may result in reclassification among certain capital accounts on the financial statements. The ordinary income distributions reflect the realization of unrealized gains on passive foreign investment companies for federal income tax purposes.
As of June 30, 2011, the federal tax cost of investments and the components of distributable earnings on a tax-basis were as follows:
| Federal tax cost of investments | | | $588,054,208 | |
| Gross tax appreciation of investments | | | $563,980,068 | |
| Gross tax depreciation of investments | | | (16,044,363 | ) |
| Net tax appreciation (depreciation) of investments | | | $547,935,705 | |
Net tax appreciation (depreciation) on derivatives and translation of assets and liabilities in foreign currencies | | | $(114,127 | ) |
| Net tax appreciation (depreciation) | | | $547,821,578 | |
| Undistributed ordinary income | | | — | |
| Accumulated long-term gains | | | $59,856,864 | |
The difference between book-basis and tax-basis cost and unrealized appreciation (depreciation) is attributable primarily to the tax deferral of losses on wash sales and the realization to ordinary income for tax purposes of unrealized gains on investments in passive foreign investment companies.
On December 22, 2010, the Regulated Investment Company Modernization Act of 2010 (the “Act”) was enacted, which changed various technical rules governing the tax treatment of regulated investment companies. The changes are generally effective for taxable years beginning after the date of enactment. Under the Act, the fund will be permitted to carry forward capital losses incurred in taxable years beginning after the date of enactment for an unlimited period.
| Investor Class | |
| For a Share Outstanding Throughout the Years Ended June 30 (except as noted) | |
| | | 2011 | | | 2010 | | | 2009 | | | 2008 | | | 2007(1) | | | 2006 | |
| Per-Share Data | |
| Net Asset Value, Beginning of Period | | | $23.11 | | | | $16.24 | | | | $23.54 | | | | $18.26 | | | | $19.63 | | | | $15.50 | |
Income From Investment Operations | | | | | | | | | | | | | | | | | | | | | | | | |
Net Investment Income (Loss)(2) | | | (0.04 | ) | | | (0.03 | ) | | | (0.01 | ) | | | (0.04 | ) | | | (0.01 | ) | | | (0.01 | ) |
Net Realized and Unrealized Gain (Loss) | | | 3.06 | | | | 7.03 | | | | (5.35 | ) | | | 5.42 | | | | (1.24 | ) | | | 4.18 | |
Total From Investment Operations | | | 3.02 | | | | 7.00 | | | | (5.36 | ) | | | 5.38 | | | | (1.25 | ) | | | 4.17 | |
| Distributions | | | | | | | | | | | | | | | | | | | | | | | | |
From Net Investment Income | | | (1.60 | ) | | | (0.13 | ) | | | — | (3) | | | (0.11 | ) | | | (0.12 | ) | | | (0.05 | ) |
From Net Realized Gains | | | (1.63 | ) | | | — | | | | (1.94 | ) | | | — | | | | — | | | | — | |
| Total Distributions | | | (3.23 | ) | | | (0.13 | ) | | | (1.94 | ) | | | (0.11 | ) | | | (0.12 | ) | | | (0.05 | ) |
Redemption Fees(2) | | | — | (3) | | | — | (3) | | | — | (3) | | | 0.01 | | | | — | (3) | | | 0.01 | |
Net Asset Value, End of Period | | | $22.90 | | | | $23.11 | | | | $16.24 | | | | $23.54 | | | | $18.26 | | | | $19.63 | |
| | | | | | | | | | | | | | | | | | | | | | | | | |
Total Return(4) | | | 11.44 | % | | | 43.18 | % | | | (21.19 | )% | | | 29.61 | % | | | (6.36 | )% | | | 27.03 | % |
| | | | | | | | | | | | | | | | | | | | | | | | | |
| Ratios/Supplemental Data | |
Ratio of Operating Expenses to Average Net Assets | | | 0.69 | % | | | 0.69 | % | | | 0.70 | % | | | 0.68 | % | | | 0.67 | %(5) | | | 0.67 | % |
Ratio of Net Investment Income (Loss) to Average Net Assets | | | (0.18 | )% | | | (0.16 | )% | | | (0.09 | )% | | | (0.17 | )% | | | (0.12 | )%(5) | | | (0.03 | )% |
| Portfolio Turnover Rate | | | 32 | % | | | 24 | % | | | 20 | % | | | 17 | % | | | 3 | % | | | 18 | % |
| Net Assets, End of Period (in thousands) | | | $1,081,258 | | | | $1,032,309 | | | | $792,814 | | | | $1,136,741 | | | | $949,426 | | | | $1,071,545 | |
| (1) | January 1, 2007 through June 30, 2007. The fund’s fiscal year end was changed from December 31 to June 30, resulting in a six-month annual reporting period. For the years before June 30, 2007, the fund’s fiscal year end was December 31. |
| (2) | Computed using average shares outstanding throughout the period. |
| (3) | Per-share amount was less than $0.005. |
| (4) | Total returns are calculated based on the net asset value of the last business day. Total returns for periods less than one year are not annualized. |
See Notes to Financial Statements.
| Institutional Class | |
| For a Share Outstanding Throughout the Years Ended June 30 (except as noted) | |
| | | 2011 | | | 2010 | | | 2009 | | | 2008(1) | |
| Per-Share Data | |
| Net Asset Value, Beginning of Period | | | $23.13 | | | | $16.25 | | | | $23.55 | | | | $21.67 | |
| Income From Investment Operations | | | | | | | | | | | | | | | | |
Net Investment Income (Loss)(2) | | | 0.01 | | | | 0.01 | | | | 0.01 | | | | 0.01 | |
| Net Realized and Unrealized Gain (Loss) | | | 3.06 | | | | 7.04 | | | | (5.34 | ) | | | 1.99 | |
| Total From Investment Operations | | | 3.07 | | | | 7.05 | | | | (5.33 | ) | | | 2.00 | |
| Distributions | | | | | | | | | | | | | | | | |
| From Net Investment Income | | | (1.65 | ) | | | (0.17 | ) | | | (0.03 | ) | | | (0.13 | ) |
| From Net Realized Gains | | | (1.63 | ) | | | — | | | | (1.94 | ) | | | — | |
| Total Distributions | | | (3.28 | ) | | | (0.17 | ) | | | (1.97 | ) | | | (0.13 | ) |
Redemption Fees(2) | | | — | (3) | | | — | (3) | | | — | (3) | | | 0.01 | |
| Net Asset Value, End of Period | | | $22.92 | | | | $23.13 | | | | $16.25 | | | | $23.55 | |
| | | | | | | | | | | | | | | | | |
Total Return(4) | | | 11.64 | % | | | 43.51 | % | | | (21.04 | )% | | | 9.37 | % |
| | | | | | | | | | | | | | | | | |
| Ratios/Supplemental Data | |
| Ratio of Operating Expenses to Average Net Assets | | | 0.49 | % | | | 0.49 | % | | | 0.50 | % | | | 0.48 | %(5) |
| Ratio of Net Investment Income (Loss) to Average Net Assets | | | 0.02 | % | | | 0.04 | % | | | 0.11 | % | | | 0.05 | %(5) |
| Portfolio Turnover Rate | | | 32 | % | | | 24 | % | | | 20 | % | | | 17 | %(6) |
| Net Assets, End of Period (in thousands) | | | $19,854 | | | | $15,751 | | | | $9,076 | | | | $10,353 | |
| (1) | September 28, 2007 (commencement of sale) through June 30, 2008. |
| (2) | Computed using average shares outstanding throughout the period. |
| (3) | Per-share amount was less than $0.005. |
| (4) | Total returns are calculated based on the net asset value of the last business day. Total returns for periods less than one year are not annualized. |
| (6) | Portfolio turnover is calculated at the fund level. Percentage indicated was calculated for the year ended June 30, 2008. |
See Notes to Financial Statements.
A Class(1) | |
| For a Share Outstanding Throughout the Years Ended June 30 (except as noted) | |
| | | 2011 | | | 2010 | | | 2009 | | | 2008 | | | 2007(2) | | | 2006 | |
| Per-Share Data | |
| Net Asset Value, Beginning of Period | | | $22.95 | | | | $16.13 | | | | $23.46 | | | | $18.22 | | | | $19.59 | | | | $15.46 | |
Income From Investment Operations | | | | | | | | | | | | | | | | | | | | | | | | |
Net Investment Income (Loss)(3) | | | (0.10 | ) | | | (0.08 | ) | | | (0.06 | ) | | | (0.09 | ) | | | (0.04 | ) | | | (0.05 | ) |
Net Realized and Unrealized Gain (Loss) | | | 3.03 | | | | 6.97 | | | | (5.33 | ) | | | 5.40 | | | | (1.23 | ) | | | 4.18 | |
Total From Investment Operations | | | 2.93 | | | | 6.89 | | | | (5.39 | ) | | | 5.31 | | | | (1.27 | ) | | | 4.13 | |
| Distributions | | | | | | | | | | | | | | | | | | | | | | | | |
From Net Investment Income | | | (1.53 | ) | | | (0.07 | ) | | | — | | | | (0.08 | ) | | | (0.10 | ) | | | (0.01 | ) |
From Net Realized Gains | | | (1.63 | ) | | | — | | | | (1.94 | ) | | | — | | | | — | | | | — | |
| Total Distributions | | | (3.16 | ) | | | (0.07 | ) | | | (1.94 | ) | | | (0.08 | ) | | | (0.10 | ) | | | (0.01 | ) |
Redemption Fees(3) | | | — | (4) | | | — | (4) | | | — | (4) | | | 0.01 | | | | — | (4) | | | 0.01 | |
Net Asset Value, End of Period | | | $22.72 | | | | $22.95 | | | | $16.13 | | | | $23.46 | | | | $18.22 | | | | $19.59 | |
| | | | | | | | | | | | | | | | | | | | | | | | | |
Total Return(5) | | | 11.15 | % | | | 42.80 | % | | | (21.40 | )% | | | 29.28 | % | | | (6.48 | )% | | | 26.77 | % |
| | | | | | | | | | | | | | | | | | | | | | | | | |
| Ratios/Supplemental Data | |
Ratio of Operating Expenses to Average Net Assets | | | 0.94 | % | | | 0.94 | % | | | 0.95 | % | | | 0.93 | % | | | 0.92 | %(6) | | | 0.92 | % |
Ratio of Net Investment Income (Loss) to Average Net Assets | | | (0.43 | )% | | | (0.41 | )% | | | (0.34 | )% | | | (0.42 | )% | | | (0.37 | )%(6) | | | (0.28 | )% |
| Portfolio Turnover Rate | | | 32 | % | | | 24 | % | | | 20 | % | | | 17 | % | | | 3 | % | | | 18 | % |
| Net Assets, End of Period (in thousands) | | | $21,292 | | | | $20,879 | | | | $16,866 | | | | $8,506 | | | | $5,442 | | | | $6,206 | |
| (1) | Prior to September 4, 2007, the A Class was referred to as the Advisor Class. |
| (2) | January 1, 2007 through June 30, 2007. The fund’s fiscal year end was changed from December 31 to June 30, resulting in a six-month annual reporting period. For the years before June 30, 2007, the fund’s fiscal year end was December 31. |
| (3) | Computed using average shares outstanding throughout the period. |
| (4) | Per-share amount was less than $0.005. |
| (5) | Total returns are calculated based on the net asset value of the last business day and do not reflect applicable sales charges. Total returns for periods less than one year are not annualized. |
See Notes to Financial Statements.
| B Class | |
| For a Share Outstanding Throughout the Years Ended June 30 (except as noted) | |
| | | 2011 | | | 2010 | | | 2009 | | | 2008(1) | |
| Per-Share Data | |
| Net Asset Value, Beginning of Period | | | $22.71 | | | | $16.02 | | | | $23.48 | | | | $21.67 | |
| Income From Investment Operations | | | | | | | | | | | | | | | | |
Net Investment Income (Loss)(2) | | | (0.29 | ) | | | (0.23 | ) | | | (0.18 | ) | | | (0.20 | ) |
| Net Realized and Unrealized Gain (Loss) | | | 2.99 | | | | 6.92 | | | | (5.34 | ) | | | 2.00 | |
| Total From Investment Operations | | | 2.70 | | | | 6.69 | | | | (5.52 | ) | | | 1.80 | |
| Distributions | | | | | | | | | | | | | | | | |
| From Net Investment Income | | | (1.33 | ) | | | — | | | | — | | | | — | |
| From Net Realized Gains | | | (1.63 | ) | | | — | | | | (1.94 | ) | | | — | |
| Total Distributions | | | (2.96 | ) | | | — | | | | (1.94 | ) | | | — | |
Redemption Fees(2) | | | — | (3) | | | — | (3) | | | — | (3) | | | 0.01 | |
| Net Asset Value, End of Period | | | $22.45 | | | | $22.71 | | | | $16.02 | | | | $23.48 | |
| | | | | | | | | | | | | | | | | |
Total Return(4) | | | 10.31 | % | | | 41.76 | % | | | (21.98 | )% | | | 8.40 | % |
| | | | | | | | | | | | | | | | | |
| Ratios/Supplemental Data | |
| Ratio of Operating Expenses to Average Net Assets | | | 1.69 | % | | | 1.69 | % | | | 1.70 | % | | | 1.68 | %(5) |
| Ratio of Net Investment Income (Loss) to Average Net Assets | | | (1.18 | )% | | | (1.16 | )% | | | (1.09 | )% | | | (1.16 | )%(5) |
| Portfolio Turnover Rate | | | 32 | % | | | 24 | % | | | 20 | % | | | 17 | %(6) |
| Net Assets, End of Period (in thousands) | | | $1,515 | | | | $1,654 | | | | $909 | | | | $124 | |
| (1) | September 28, 2007 (commencement of sale) through June 30, 2008. |
| (2) | Computed using average shares outstanding throughout the period. |
| (3) | Per-share amount was less than $0.005. |
| (4) | Total returns are calculated based on the net asset value of the last business day and do not reflect applicable sales charges. Total returns for periods less than one year are not annualized. |
| (6) | Portfolio turnover is calculated at the fund level. Percentage indicated was calculated for the year ended June 30, 2008. |
See Notes to Financial Statements.
| C Class | |
| For a Share Outstanding Throughout the Years Ended June 30 (except as noted) | |
| | | 2011 | | | 2010 | | | 2009 | | | 2008(1) | |
| Per-Share Data | |
| Net Asset Value, Beginning of Period | | | $22.72 | | | | $16.02 | | | | $23.48 | | | | $21.67 | |
| Income From Investment Operations | | | | | | | | | | | | | | | | |
Net Investment Income (Loss)(2) | | | (0.29 | ) | | | (0.23 | ) | | | (0.18 | ) | | | (0.20 | ) |
| Net Realized and Unrealized Gain (Loss) | | | 2.99 | | | | 6.93 | | | | (5.34 | ) | | | 2.00 | |
| Total From Investment Operations | | | 2.70 | | | | 6.70 | | | | (5.52 | ) | | | 1.80 | |
| Distributions | | | | | | | | | | | | | | | | |
| From Net Investment Income | | | (1.33 | ) | | | — | | | | — | | | | — | |
| From Net Realized Gains | | | (1.63 | ) | | | — | | | | (1.94 | ) | | | — | |
| Total Distributions | | | (2.96 | ) | | | — | | | | (1.94 | ) | | | — | |
Redemption Fees(2) | | | — | (3) | | | — | (3) | | | — | (3) | | | 0.01 | |
| Net Asset Value, End of Period | | | $22.46 | | | | $22.72 | | | | $16.02 | | | | $23.48 | |
| | | | | | | | | | | | | | | | | |
Total Return(4) | | | 10.31 | % | | | 41.82 | % | | | (21.98 | )% | | | 8.40 | % |
| | | | | | | | | | | | | | | | | |
| Ratios/Supplemental Data | |
| Ratio of Operating Expenses to Average Net Assets | | | 1.69 | % | | | 1.69 | % | | | 1.70 | % | | | 1.68 | %(5) |
| Ratio of Net Investment Income (Loss) to Average Net Assets | | | (1.18 | )% | | | (1.16 | )% | | | (1.09 | )% | | | (1.17 | )%(5) |
| Portfolio Turnover Rate | | | 32 | % | | | 24 | % | | | 20 | % | | | 17 | %(6) |
| Net Assets, End of Period (in thousands) | | | $3,593 | | | | $2,318 | | | | $1,006 | | | | $151 | |
| (1) | September 28, 2007 (commencement of sale) through June 30, 2008. |
| (2) | Computed using average shares outstanding throughout the period. |
| (3) | Per-share amount was less than $0.005. |
| (4) | Total returns are calculated based on the net asset value of the last business day and do not reflect applicable sales charges. Total returns for periods less than one year are not annualized. |
| (6) | Portfolio turnover is calculated at the fund level. Percentage indicated was calculated for the year ended June 30, 2008. |
See Notes to Financial Statements.
| R Class | |
| For a Share Outstanding Throughout the Years Ended June 30 (except as noted) | |
| | | 2011 | | | 2010 | | | 2009 | | | 2008(1) | |
| Per-Share Data | |
| Net Asset Value, Beginning of Period | | | $22.96 | | | | $16.13 | | | | $23.52 | | | | $21.67 | |
| Income From Investment Operations | | | | | | | | | | | | | | | | |
Net Investment Income (Loss)(2) | | | (0.16 | ) | | | (0.13 | ) | | | (0.11 | ) | | | (0.12 | ) |
| Net Realized and Unrealized Gain (Loss) | | | 3.02 | | | | 6.98 | | | | (5.34 | ) | | | 2.01 | |
| Total From Investment Operations | | | 2.86 | | | | 6.85 | | | | (5.45 | ) | | | 1.89 | |
| Distributions | | | | | | | | | | | | | | | | |
| From Net Investment Income | | | (1.46 | ) | | | (0.02 | ) | | | — | | | | (0.05 | ) |
| From Net Realized Gains | | | (1.63 | ) | | | — | | | | (1.94 | ) | | | — | |
| Total Distributions | | | (3.09 | ) | | | (0.02 | ) | | | (1.94 | ) | | | (0.05 | ) |
Redemption Fees(2) | | | — | (3) | | | — | (3) | | | — | (3) | | | 0.01 | |
| Net Asset Value, End of Period | | | $22.73 | | | | $22.96 | | | | $16.13 | | | | $23.52 | |
| | | | | | | | | | | | | | | | | |
Total Return(4) | | | 10.87 | % | | | 42.50 | % | | | (21.62 | )% | | | 8.83 | % |
| | | | | | | | | | | | | | | | | |
| Ratios/Supplemental Data | |
| Ratio of Operating Expenses to Average Net Assets | | | 1.19 | % | | | 1.19 | % | | | 1.20 | % | | | 1.18 | %(5) |
| Ratio of Net Investment Income (Loss) to Average Net Assets | | | (0.68 | )% | | | (0.66 | )% | | | (0.59 | )% | | | (0.71 | )%(5) |
| Portfolio Turnover Rate | | | 32 | % | | | 24 | % | | | 20 | % | | | 17 | %(6) |
| Net Assets, End of Period (in thousands) | | | $2,567 | | | | $1,117 | | | | $313 | | | | $27 | |
| (1) | September 28, 2007 (commencement of sale) through June 30, 2008. |
| (2) | Computed using average shares outstanding throughout the period. |
| (3) | Per-share amount was less than $0.005. |
| (4) | Total returns are calculated based on the net asset value of the last business day. Total returns for periods less than one year are not annualized. |
| (6) | Portfolio turnover is calculated at the fund level. Percentage indicated was calculated for the year ended June 30, 2008. |
See Notes to Financial Statements.
Report of Independent Registered Public Accounting Firm |
To the Directors of the American Century Quantitative Equity Funds, Inc.
and Shareholders of the Global Gold Fund:
In our opinion, the accompanying statement of assets and liabilities, including the schedule of investments, and the related statements of operations and of changes in net assets and the financial highlights present fairly, in all material respects, the financial position of the Global Gold Fund (one of the eleven funds comprising the American Century Quantitative Equity Funds, Inc., hereafter referred to as the “Fund”) at June 30, 2011, the results of its operations for the year then ended, the changes in its net assets for each of the two years in the period then ended and the financial highlights for each of the periods presented, in conformity with accounting principles generally accepted in the United States of America. These financial statements and financial highlights (hereafter referred to as “financial statements”) are the responsibility of the Fund’s management; our responsibility is to express an opinion on these financial statements based on our audits. We conducted our audits of these financial statements in accordance with the standards of the Public Company Accounting Oversight Board (United States). Those standards require that we plan and perform the audit to obtain reasonable assurance about whether the financial statements are free of material misstatement. An audit includes examining, on a test basis, evidence supporting the amounts and disclosures in the financial statements, assessing the accounting principles used and significant estimates made by management, and evaluating the overall financial statement presentation. We believe that our audits, which included confirmation of securities at June 30, 2011 by correspondence with the custodian and brokers, provide a reasonable basis for our opinion.
PricewaterhouseCoopers LLP
Kansas City, Missouri
August 18, 2011
The individuals listed below serve as directors of the funds. Each director will continue to serve in this capacity until death, retirement, resignation or removal from office. The mandatory retirement age for directors who are not “interested persons,” as that term is defined in the Investment Company Act (independent directors), is 73. However, the mandatory retirement age may be extended for a period not to exceed two years with the approval of the remaining independent directors.
Mr. Thomas is the only director who is an “interested person” because he currently serves as President and Chief Executive Officer of American Century Companies, Inc. (ACC), the parent company of American Century Investment Management, Inc. (ACIM or the advisor).
The other directors (more than three-fourths of the total number) are independent; that is, they have never been employees, directors or officers of, and have no financial interest in, ACC or any of its wholly owned, direct or indirect, subsidiaries, including ACIM, American Century Investment Services, Inc. (ACIS) and American Century Services, LLC (ACS). The directors serve in this capacity for eight (in the case of Mr. Thomas, 15) registered investment companies in the American Century Investments family of funds.
The following presents additional information about the directors. The mailing address for each director other than Mr. Thomas is 1665 Charleston Road, Mountain View, California 94043. The mailing address for Mr. Thomas is 4500 Main Street, Kansas City, Missouri 64111.
Name (Year of Birth) | Position(s) Held with Funds | Length of Time Served | Principal Occupation(s) During Past 5 Years | | Number of American Century Portfolios Overseen by Director | Other Directorships Held During Past 5 Years |
| Independent Directors |
| Tanya S. Beder (1955) | Director | Since 2011 | Chairman, SBCC Group Inc. (investment advisory services)(2006 to present); Fellow in Practice, International Center for Finance, Yale University School of Management (1985 to present); Chief Executive Officer, Tribeca Global Management LLC (asset management firm) (2004 to 2006) | | 40 | None |
| Jeremy I. Bulow (1954) | Director | Since 2011 | Professor of Economics, Stanford University, Graduate School of Business (1979 to present) | | 40 | None |
| John Freidenrich (1937) | Director | Since 2005 | Founder, Member and Manager, Regis Management Company, LLC (investment management firm) (April 2004 to present) | | 40 | None |
| | | | | | | |
Name (Year of Birth) | Position(s) Held with Funds | Length of Time Served | Principal Occupation(s) During Past 5 Years | | Number of American Century Portfolios Overseen by Director | Other Directorships Held During Past 5 Years |
| Independent Directors | | | | |
| Ronald J. Gilson (1946) | Director and Chairman of the Board | Since 1995 | Charles J. Meyers Professor of Law and Business, Stanford Law School (1979 to present); Marc and Eva Stern Professor of Law and Business, Columbia University School of Law (1992 to present) | | 40 | None |
| Frederick L. A. Grauer (1946) | Director | Since 2008 | Senior Advisor, BlackRock, Inc. (investment management firm) (2010 to 2011); Senior Advisor, Barclays Global Investors (investment management firm) (2003 to 2009) | | 40 | None |
| Peter F. Pervere (1947) | Director | Since 2007 | Retired | | 40 | Intraware, Inc. (2003 to 2009) |
| Myron S. Scholes (1941) | Director | Since 1980 | Chairman, Platinum Grove Asset Management, L.P. (asset manager) (1999 to 2009); Frank E. Buck Professor of Finance-Emeritus, Stanford Graduate School of Business (1996 to present) | | 40 | Dimensional Fund Advisors (investment advisor); CME Group, Inc. (futures and options exchange) |
| John B. Shoven (1947) | Director | Since 2002 | Professor of Economics, Stanford University (1973 to present) | | 40 | Cadence Design Systems; Exponent; Financial Engines; Watson Wyatt Worldwide (2002 to 2006) |
| |
| Interested Director |
| Jonathan S. Thomas (1963) | Director and President | Since 2007 | President and Chief Executive Officer, ACC (March 2007 to present); Chief Administrative Officer, ACC (February 2006 to February 2007); Executive Vice President, ACC (November 2005 to February 2007). Also serves as: Chief Executive Officer and Manager, ACS; Executive Vice President, ACIM; Director, ACC, ACIM and other ACC subsidiaries | | 104 | None |
Officers
The following table presents certain information about the executive officers of the funds. Each officer serves as an officer for each of the 15 investment companies in the American Century family of funds, unless otherwise noted. No officer is compensated for his or her service as an officer of the funds. The listed officers are interested persons of the funds and are appointed or re-appointed on an annual basis. The mailing address for each of the officers listed below is 4500 Main Street, Kansas City, Missouri 64111.
Name (Year of Birth) | Offices with the Funds | | Principal Occupation(s) During the Past Five Years |
Jonathan S. Thomas (1963) | Director and President since 2007 | | President and Chief Executive Officer, ACC (March 2007 to present); Chief Administrative Officer, ACC (February 2006 to February 2007); Executive Vice President, ACC (November 2005 to February 2007). Also serves as: Chief Executive Officer and Manager, ACS; Executive Vice President, ACIM; Director, ACC, ACIM and other ACC subsidiaries |
Barry Fink (1955) | Executive Vice President since 2007 | | Chief Operating Officer and Executive Vice President, ACC (September 2007 to present); President, ACS (October 2007 to present); Managing Director, Morgan Stanley (2000 to 2007); Global General Counsel, Morgan Stanley (2000 to 2006). Also serves as: Manager, ACS and Director, ACC and certain ACC subsidiaries |
Maryanne L. Roepke (1956) | Chief Compliance Officer since 2006 and Senior Vice President since 2000 | | Chief Compliance Officer, American Century funds, ACIM and ACS (August 2006 to present); Assistant Treasurer, ACC (January 1995 to August 2006); and Treasurer and Chief Financial Officer, various American Century funds (July 2000 to August 2006). Also serves as: Senior Vice President, ACS |
| Charles A. Etherington (1957) | General Counsel since 2007 and Senior Vice President since 2006 | | Attorney, ACC (February 1994 to present); Vice President, ACC (November 2005 to present), General Counsel, ACC (March 2007 to present); Also serves as General Counsel, ACIM, ACS, ACIS and other ACC subsidiaries; and Senior Vice President, ACIM and ACS |
| Robert J. Leach (1966) | Vice President, Treasurer and Chief Financial Officer since 2006 | | Vice President, ACS (February 2000 to present); and Controller, various American Century funds (1997 to September 2006) |
| David H. Reinmiller (1963) | Vice President since 2001 | | Attorney, ACC (January 1994 to present); Associate General Counsel, ACC (January 2001 to present); Also serves as Vice President, ACIM and ACS |
| Ward D. Stauffer (1960) | Secretary since 2005 | | Attorney, ACC (June 2003 to present) |
The Statement of Additional Information has additional information about the fund’s directors and is available without charge, upon request, by calling 1-800-345-2021.
| Approval of Management Agreement |
At a meeting held on June 28, 2011, the Fund’s Board of Directors/Trustees unanimously approved the renewal of the management agreement pursuant to which American Century Investment Management, Inc. (the “Advisor”) acts as the investment advisor for the Fund. Under Section 15(c) of the Investment Company Act, contracts for investment advisory services are required to be reviewed, evaluated, and approved by a majority of a fund’s independent
directors/trustees (the “Directors”) each year.
As a part of the approval process, the Board requested and reviewed extensive data and information compiled by the Advisor and certain independent providers of evaluation data concerning the Fund and the services provided to the Fund by the Advisor. This review was in addition to the oversight and evaluation undertaken by the Board and its committees on a continuous basis throughout the year and included, but was not limited to the following:
| the nature, extent, and quality of investment management, shareholder services, and other services provided by the Advisor to the Fund; |
| ▪ | the wide range of other programs and services the Advisor provides to the Fund and its shareholders on a routine and non-routine basis; |
| ▪ | the investment performance of the fund, including data comparing the Fund’s performance to appropriate benchmarks and/or a peer group of other mutual funds with similar investment objectives and strategies; |
| ▪ | data comparing the cost of owning the Fund to the cost of owning similar funds; |
| ▪ | the Advisor’s compliance policies, procedures, and regulatory experience; |
| ▪ | financial data showing the cost of services provided to the Fund, the profitability of the Fund to the Advisor, and the overall profitability of the Advisor; |
| ▪ | data comparing services provided and charges to other investment management clients of the Advisor; and |
| ▪ | consideration of collateral benefits derived by the Advisor from the management of the Fund and any potential economies of scale relating thereto. |
In keeping with its practice, the Board held two in-person meetings and one telephonic meeting to review and discuss the information provided. The Board also had the benefit of the advice of its independent counsel throughout the period.
Factors Considered
The Directors considered all of the information provided by the Advisor, the independent data providers, and the Board’s independent counsel, and evaluated such information for the Fund. In connection with their review, the Directors did not identify any single factor as being all-important or controlling, and each Director may have attributed different levels of importance to different factors. In deciding to renew the management agreement, the Board based its decision on a number of factors, including the following:
Nature, Extent and Quality of Services — Generally. Under the management agreement, the Advisor is responsible for providing or arranging for all services necessary for the operation of the Fund. The Board noted that under the management agreement, the Advisor provides or arranges at its own expense a wide variety of services including:
| ▪ | constructing and designing the Fund |
| ▪ | portfolio research and security selection |
| ▪ | initial capitalization/funding |
| ▪ | daily valuation of the Fund’s portfolio |
| ▪ | shareholder servicing and transfer agency, including shareholder confirmations, recordkeeping, and communications |
| ▪ | regulatory and portfolio compliance |
| ▪ | marketing and distribution |
The Board noted that many of these services have expanded over time both in terms of quantity and complexity in response to shareholder demands, competition in the industry, changing distribution channels, and the changing regulatory environment.
Investment Management Services. The nature of the investment management services provided to the Fund is quite complex and allows Fund shareholders access to professional money management, instant diversification of their investments within an asset class, the opportunity to easily diversify among asset classes by investing in or exchanging among various American Century Investments funds, and liquidity. In evaluating investment performance, the Board expects the Advisor to manage the Fund in accordance with its investment objectives and approved strategies. Further, the Directors recognize that the Advisor has an obligation to seek the best execution of fund trades. In providing these services, the Advisor utilizes teams of investment professionals (portfolio managers, analysts, research assistants, and securities traders) who require extensive information technology, research, training, compliance and other systems to conduct their business. The Board, directly and through its Portfolio Committee, regularly reviews investment performance information for the Fund, together with comparative information for appropriate benchmarks and/or peer groups of similarly-managed funds, over different time horizons. The Directors also review detailed performance information during the management agreement approval
process. If performance concerns are identified, the Fund receives special reviews until performance improves, during which the Board discusses with the Advisor the reasons for such results (e.g., market conditions, security selection) and any efforts being undertaken to improve performance. The Board found the investment management services provided by the Advisor to the Fund to meet or exceed industry standards. More detailed information about the Fund’s performance can be found in the Performance and Portfolio Commentary sections of this report.
Shareholder and Other Services. Under the management agreement, the Advisor provides the Fund with a comprehensive package of transfer agency, shareholder, and other services. The Board, directly and through various committees of the Board, regularly reviews reports and evaluations of such services at its regular meetings. These reports include, but are not limited to, information regarding the operational efficiency and accuracy of the shareholder and transfer agency services provided, staffing levels, shareholder satisfaction (as measured by external as well as internal sources), technology support, new products and services offered to Fund shareholders, securities trading activities, portfolio valuation services, auditing services, and legal and operational compliance activities. Certain aspects of shareholder and transfer agency service level efficiency and the quality of securities trading activities are measured by independent third party providers and are presented in comparison to other fund groups not managed by the Advisor. The Board found the services provided by the Advisor to the Fund under the management agreement to be competitive and of high quality.
Costs of Services and Profitability. The Advisor provides detailed information concerning its cost of providing various services to the Fund, its profitability in managing the Fund, its overall profitability, and its financial condition. The Directors have reviewed with the Advisor the methodology used to prepare this financial information. The financial information regarding the Advisor is considered in evaluating the Advisor’s financial condition, ability to continue to provide services under the management agreement, and the reasonableness of the current management fee. The Board concluded that the Advisor’s profits were reasonable in light of the services provided to the Fund.
Ethics. The Board generally considers the Advisor’s commitment to providing quality services to shareholders and to conducting its business ethically. They noted that the Advisor’s practices generally meet or exceed industry best practices.
Economies of Scale. The Board also reviewed information provided by the Advisor regarding the possible existence of economies of scale in connection with the management of the Fund. The Board concluded that economies of scale are difficult to measure and predict with precision, especially on a fund-by-fund basis. The Board concluded that the Advisor is appropriately sharing economies of scale through its competitive fee structure, offering competitive fees from fund inception, and through reinvestment in its business to provide shareholders additional content and services.
Comparison to Other Funds’ Fees. The management agreement provides that the Fund pay the Advisor a single, all-inclusive (or unified) management fee for providing all services necessary for the management and operation of the Fund, other than brokerage expenses, taxes, interest, extraordinary expenses, and the fees and expenses of the Fund’s independent directors (including their independent legal counsel) and expenses incurred in connection with the provision of shareholder services and distribution services under a plan adopted pursuant to Rule 12b-1 under the 1940 Act. Under the unified fee structure, the Advisor is responsible for providing all investment advisory, custody, audit, administrative, compliance, recordkeeping, marketing and shareholder services, or arranging and supervising third parties to provide such services. By contrast, most other funds are charged a variety of fees, including an investment advisory fee, a transfer agency fee, an administrative fee, distribution charges and other expenses. Other than their investment advisory fees and any applicable Rule 12b-1 distribution fees, all other components of the total fees charged by these other funds may be increased without shareholder approval. The Board believes the unified fee structure is a benefit to Fund shareholders because it clearly discloses to shareholders the cost of owning Fund shares, and, since the unified fee cannot be increased without a vote of Fund shareholders, it shifts to the Advisor the risk of increased costs of operating the Fund and provides a direct incentive to minimize administrative inefficiencies. Part of the Board’s analysis of fee levels involves reviewing certain evaluative data compiled by an independent provider and comparing the Fund’s unified fee to the total expense ratio of other funds in the Fund’s peer group. The Board concluded that the management fee paid by the Fund to the Advisor under the management agreement is reasonable in light of the services provided to the Fund.
Comparison to Fees and Services Provided to Other Clients of the Advisor. The Board also requested and received information from the Advisor concerning the nature of the services, fees, costs and profitability of its advisory services to advisory clients other than the Fund. They observed that these varying types of client accounts require different services and involve different regulatory and entrepreneurial risks than the management of the Fund. The Board analyzed this information and concluded that the fees charged and services provided to the Fund were reasonable by comparison.
Collateral or “Fall-Out” Benefits Derived by the Advisor. The Board considered the existence of collateral benefits the Advisor may receive as a result of its relationship with the Fund. They concluded that the Advisor’s primary business is managing mutual funds and it generally does not use fund or shareholder information to generate profits in other lines of business, and therefore does not derive any significant collateral benefits from them. The Board noted that the Advisor receives proprietary research from broker-dealers that execute fund portfolio transactions and concluded that this research is likely to benefit Fund shareholders. The Board also determined that the Advisor is able to provide investment management services to certain clients other than the Fund, at least in part, due to its existing infrastructure built to serve the fund complex. The Board concluded, however, that the assets of those other clients are not material to the analysis and, where applicable, may be included with the assets of the Fund to determine breakpoints in the management fee schedule.
Existing Relationship. The Board also considered whether there was any reason for not continuing the existing arrangement with the Advisor. In this regard, the Board was mindful of the potential disruptions of the Fund’s operations and various risks, uncertainties, and other effects that could occur as a result of a decision not to continue such relationship. In particular, the Board recognized that most shareholders have invested in the Fund on the strength of the Advisor’s industry standing and reputation and in the expectation that the Advisor will have a continuing role in providing advisory services to the Fund.
Conclusion of the Directors. As a result of this process, the Board, including all of the independent directors and assisted by the advice of independent legal counsel, taking into account all of the factors discussed above and the information provided by the Advisor and others, concluded that the management agreement between the Fund and the Advisor is fair and reasonable in light of the services provided and should be renewed.
Retirement Account Information
As required by law, distributions you receive from certain IRAs, or 403(b), 457 and qualified plans are subject to federal income tax withholding, unless you elect not to have withholding apply. Tax will be withheld on the total amount withdrawn even though you may be receiving amounts that are not subject to withholding, such as nondeductible contributions. In such case, excess amounts of withholding could occur. You may adjust your withholding election so that a greater or lesser amount will be withheld.
If you don’t want us to withhold on this amount, you must notify us to not withhold the federal income tax. You may notify us in writing or in certain situations by telephone or through other electronic means. You have the right to revoke your withholding election at any time and any election you make may remain in effect until revoked by filing a new election.
Remember, even if you elect not to have income tax withheld, you are liable for paying income tax on the taxable portion of your withdrawal. If you elect not to have income tax withheld or you don’t have enough income tax withheld, you may be responsible for payment of estimated tax. You may incur penalties under the estimated tax rules if your withholding and estimated tax payments are not sufficient. You can reduce or defer the income tax on a distribution by directly or indirectly rolling such distribution over to another IRA or eligible plan. You should consult your tax advisor for additional information.
State tax will be withheld if, at the time of your distribution, your address is within one of the mandatory withholding states and you have federal income tax withheld. State taxes will be withheld from your distribution in accordance with the respective state rules.
Proxy Voting Guidelines
American Century Investment Management, Inc., the fund’s investment advisor, is responsible for exercising the voting rights associated with the securities purchased and/or held by the fund. A description of the policies and procedures the advisor uses in fulfilling this responsibility is available without charge, upon request, by calling 1-800-345-2021. It is also available on American Century Investments’ website at americancentury.com and on the Securities and Exchange Commission’s website at sec.gov. Information regarding how the investment advisor voted proxies relating to portfolio securities during the most recent 12-month period ended June 30 is available on the “About Us” page at americancentury.com. It is also available at sec.gov.
Quarterly Portfolio Disclosure
The fund files its complete schedule of portfolio holdings with the Securities and Exchange Commission (SEC) for the first and third quarters of each fiscal year on Form N-Q. The fund’s Forms N-Q are available on the SEC’s website at sec.gov, and may be reviewed and copied at the SEC’s Public Reference Room in Washington, DC. Information on the operation of the Public Reference Room may be obtained by calling 1-800-SEC-0330. The fund also makes its complete schedule of portfolio holdings for the most recent quarter of its fiscal year available on its website at americancentury.com and, upon request, by calling 1-800-345-2021.
Other Tax Information
The following information is provided pursuant to provisions of the Internal Revenue Code.
The fund hereby designates up to the maximum amount allowable as qualified dividend income for the fiscal year ended June 30, 2011.
For corporate taxpayers, the fund hereby designates $1,773,927, or up to the maximum amount allowable, of ordinary income distributions paid during the fiscal year ended June 30, 2011 as qualified for the corporate dividends received deduction.
The fund hereby designates $72,667,031, or up to the maximum amount allowable, as long-term capital gain distributions for the fiscal year ended June 30, 2011.
The fund hereby designates $4,229,406 as qualified short-term capital gain distributions for purposes of Internal Revenue Code Section 871.
For the fiscal year ended June 30, 2011, the fund intends to pass through to shareholders $623,318, or up to the maximum amount allowable, as a foreign tax credit which represents taxes paid on income derived from sources within foreign countries or possessions of the United States. During the fiscal year ended June 30, 2011, the fund earned $5,688,124 from income derived from foreign sources. Foreign source income and foreign tax expense per outstanding share on June 30, 2011 are $0.1152 and $0.0126, respectively.
| Contact Us | americancentury.com |
| Automated Information Line | 1-800-345-8765 |
| Investor Services Representative | 1-800-345-2021 or 816-531-5575 |
| Investors Using Advisors | 1-800-378-9878 |
| Business, Not-For-Profit, Employer-Sponsored Retirement Plans | 1-800-345-3533 |
| Banks and Trust Companies, Broker-Dealers, Financial Professionals, Insurance Companies | 1-800-345-6488 |
| Telecommunications Device for the Deaf | 1-800-634-4113 |
American Century Quantitative Equity Funds, Inc.
Investment Advisor:
American Century Investment Management, Inc.
Kansas City, Missouri
This report and the statements it contains are submitted for the general information of our shareholders. The report is not authorized for distribution to prospective investors unless preceded or accompanied by an effective prospectus.
©2011 American Century Proprietary Holdings, Inc. All rights reserved.
CL-ANN-72455 1108
ANNUAL REPORT JUNE 30, 2011
| | International Core Equity Fund |
| President’s Letter | 2 |
| Market Perspective | 3 |
| Performance | 4 |
| Portfolio Commentary | 6 |
| Fund Characteristics | 8 |
| Shareholder Fee Example | 9 |
| Schedule of Investments | 11 |
| Statement of Assets and Liabilities | 14 |
| Statement of Operations | 15 |
| Statement of Changes in Net Assets | 16 |
| Notes to Financial Statements | 17 |
| Financial Highlights | 23 |
| Report of Independent Registered Public Accounting Firm | 29 |
| Management | 30 |
| Approval of Management Agreement | 33 |
| Additional Information | 38 |
Any opinions expressed in this report reflect those of the author as of the date of the report, and do not necessarily represent the opinions of American Century Investments® or any other person in the American Century Investments organization. Any such opinions are subject to change at any time based upon market or other conditions and American Century Investments disclaims any responsibility to update such opinions. These opinions may not be relied upon as investment advice and, because investment decisions made by American Century Investments funds are based on numerous factors, may not be relied upon as an indication of trading intent on behalf of any American Century Investments fund. Security examples are used for representational purposes only and are not intended as recommendations to purchase or sell securities. Performance information for comparative indices and securities is provided to American Century Investments by third party vendors. To the best of American Century Investments’ knowledge, such information is accurate at the time of printing.
Dear Investor:
Thank you for reviewing this annual report for the period ended June 30, 2011. Our report offers investment performance and portfolio information, presented with the expert perspective and commentary of our portfolio management team.
This report remains one of our most important vehicles for conveying information about investment performance and the market factors and strategies that affect fund returns. For additional, updated information on fund performance, portfolio strategy, and the investment markets, we encourage you to visit our website, americancentury.com. Click on the “Fund Performance” and “Insights & News” headings at the top of our Individual Investors site.
Reporting Period Perspective: Highest Broad Fiscal-Year U.S. Stock Returns Since 1997
Benefitting from favorable conditions and expectations, the U.S. stock market produced exceptional returns, the highest for any 12-month period ended June 30 since the fiscal year ended June 30, 1997. Back then, the S&P 500 Index gained 34.71%, compared with 30.69% for the most-recent reporting period. The intervening 14 years help illustrate how infrequently such a high level of performance occurs, requiring an alignment of economic and market conditions that’s difficult to duplicate.
The exceptional returns experienced during the reporting period represent a rebound from previous declines. After experiencing 10–12% declines during the second quarter of 2010—stemming from the European sovereign debt crisis and double-dip recession fears—most broad U.S. stock indices advanced 30% or more during the following 12 months. Monetary and fiscal intervention in 2010 stimulated growth and fueled investor optimism about economic and financial market conditions in 2011 and 2012, encouraging investments in riskier assets.
However, that optimism has diminished in the summer of 2011 as the European debt crisis returned to prominence and other debt and economic challenges emerged. As the reporting period came to a close in June 2011, we saw increasing signs that the U.S. economic recovery had lost momentum. As a result, economic growth forecasts were reduced, and broad U.S. stock indices trended downward beginning in May. As we enter the third quarter of 2011, investor concern over fiscal austerity measures in the U.S. and other developed economies raised fears of a return to recession and accelerated a decline in global equity markets. We appreciate your continued trust in us during these uncertain times.
Sincerely,
Jonathan Thomas
President and Chief Executive Officer
American Century Investments
By Scott Wittman, Chief Investment Officer, Quantitative Equity and Asset Allocation
International Stocks Generated Strong Returns
International equity markets enjoyed strong results for the 12 months ended June 30, 2011, with the broad international stock indices returning more than 30% (see the table below). Despite a host of external challenges, international stocks rallied sharply as investors grew confident about a global economic recovery.
After some economic uncertainty early in the period, many regions of the world began to show signs of improving economic activity in the fall of 2010, and this continued into the first half of 2011. Better economic conditions and rising commodity prices led the European Central Bank to raise short-term interest rates in April 2011—its first rate hike in nearly four years.
International stocks remained on an upward trajectory throughout much of the reporting period despite a series of dramatic global events—unrest in North Africa and the Middle East, a devastating earthquake and tsunami in Japan, and a growing debt crisis in Europe that led to bailouts for Greece, Ireland, and Portugal.
Another factor that boosted international stock returns for U.S. investors was a broad decline in the U.S. dollar. The dollar fell by 15% against the euro, 9% versus the Japanese yen, and 6% against the British pound for the reporting period. The dollar weakened as U.S. interest rates remained near historic lows and fiscal deficit concerns intensified.
Europe and Pacific Rim Outperformed
Across the board, small-company stocks generated better returns than large-cap issues, growth stocks modestly outpaced value shares, and developed countries outperformed emerging markets.
As the table below shows, stock markets in Europe and the Pacific Rim (excluding Japan) posted the best returns. Europe benefited from the strong performance of several economically robust countries—particularly Austria, Norway, and Sweden—as well as the core markets of France and Germany. The Pacific Rim was led by Australia and New Zealand, whose economies benefited from growing demand for commodities. The most notable laggards were Greece, which faced a crippling debt crisis, and Japan, whose economy was hurt by the devastating earthquake and tsunami.
| Foreign Stock Index Returns |
| For the 12 months ended June 30, 2011 |
| MSCI EAFE Index | 30.36% | | MSCI World Index | 30.51% |
| MSCI EAFE Growth Index | 31.25% | | MSCI Europe Index | 36.02% |
| MSCI EAFE Value Index | 29.35% | | MSCI Pacific ex-Japan Index | 35.57% |
| | | | MSCI Emerging Markets (Net) Index | 27.80% |
| | | MSCI Japan Index | 13.01% |
| Total Returns as of June 30, 2011 |
| | | | Average Annual Returns | |
| | Ticker Symbol | 1 year(1) | Since Inception | Inception Date |
| Investor Class | ACIMX | 38.09% | -1.42% | 11/30/06 |
| MSCI EAFE Index | — | 30.36% | -0.71% | — |
| Institutional Class | ACIUX | 38.47% | -1.20% | 11/30/06 |
A Class No sales charge* With sales charge* | ACIQX | 37.80% 29.93% | -1.66% -2.92% | 11/30/06 |
B Class No sales charge* With sales charge* | ACIJX | 36.72% 32.72% | -2.37% -2.85% | 11/30/06 |
| C Class | ACIKX | 36.72% | -2.37% | 11/30/06 |
| R Class | ACIRX | 37.52% | -1.90% | 11/30/06 |
| * | Sales charges include initial sales charges and contingent deferred sales charges (CDSCs), as applicable. A Class shares have a 5.75% maximum initial sales charge and may be subject to a maximum CDSC of 1.00%. B Class shares redeemed within six years of purchase are subject to a CDSC that declines from 5.00% during the first year after purchase to 0.00% the sixth year after purchase. C Class shares redeemed within 12 months of purchase are subject to a maximum CDSC of 1.00%. The SEC requires that mutual funds provide performance information net of maximum sales charges in all cases where charges could be applied. |
| (1) | Extraordinary performance is attributable in part to unusually favorable market conditions and may not be repeated or consistently achieved in the future. |
Data presented reflect past performance. Past performance is no guarantee of future results. Current performance may be higher or lower than the performance shown. Investment return and principal value will fluctuate, and redemption value may be more or less than original cost. To obtain performance data current to the most recent month end, please call 1-800-345-2021 or visit americancentury.com. International investing involves special risks, such as political instability and currency fluctuations. Investing in emerging markets may accentuate these risks.
Unless otherwise indicated, performance reflects Investor Class shares; performance for other share classes will vary due to differences in fee structure. For information about other share classes available, please consult the prospectus. Data assumes reinvestment of dividends and capital gains, and none of the charts reflect the deduction of taxes that a shareholder would pay on fund distributions or the redemption of fund shares. Returns for the index are provided for comparison. The fund’s total returns include operating expenses (such as transaction costs and management fees) that reduce returns, while the total returns of the index do not.
| Growth of $10,000 Over Life of Class |
| $10,000 investment made November 30, 2006 |
*From 11/30/06, the Investor Class’s inception date. Not annualized.
| Total Annual Fund Operating Expenses |
| Investor Class | Institutional Class | A Class | B Class | C Class | R Class |
| 1.19% | 0.99% | 1.44% | 2.19% | 2.19% | 1.69% |
The total annual fund operating expenses shown is as stated in the fund’s prospectus current as of the date of this report. The prospectus may vary from the expense ratio shown elsewhere in this report because it is based on a different time period, includes acquired fund fees and expenses, and, if applicable, does not include fee waivers or expense reimbursements.
Data presented reflect past performance. Past performance is no guarantee of future results. Current performance may be higher or lower than the performance shown. Investment return and principal value will fluctuate, and redemption value may be more or less than original cost. To obtain performance data current to the most recent month end, please call 1-800-345-2021 or visit americancentury.com. International investing involves special risks, such as political instability and currency fluctuations. Investing in emerging markets may accentuate these risks.
Unless otherwise indicated, performance reflects Investor Class shares; performance for other share classes will vary due to differences in fee structure. For information about other share classes available, please consult the prospectus. Data assumes reinvestment of dividends and capital gains, and none of the charts reflect the deduction of taxes that a shareholder would pay on fund distributions or the redemption of fund shares. Returns for the index are provided for comparison. The fund’s total returns include operating expenses (such as transaction costs and management fees) that reduce returns, while the total returns of the index do not.
Portfolio Managers: Armando Lacayo and Elizabeth Xie
Performance Summary
International Core Equity returned 38.09%* for the fiscal year ended June 30, 2011, compared with the 30.36% return of the fund’s benchmark, the MSCI EAFE Index.
International Core Equity posted a strong absolute return for the 12 months, reflecting a robust rally in international stock markets during the period (see page 3 for details). The fund also outperformed the MSCI EAFE Index as individual stock selection (a critical component of our investment process) added value across nearly all geographic regions and market sectors.
Energy and Materials Boosted Absolute Performance
On an absolute basis, every sector of the International Core Equity fund posted double-digit gains for the 12 months. The best-performing sectors in the portfolio were energy and materials, both of which returned more than 60% for the reporting period. Together, these two sectors accounted for five of the fund’s top six performance contributors, led by chemicals producers Rhodia of France and BASF of Germany. The other leading contributors were energy producers—Caltex Australia, BP, and Royal Dutch Shell.
International Core Equity’s largest sector weighting during the reporting period was in financials, and this sector also contributed meaningfully to absolute performance. The best contributors from the financials sector included Dutch financial services company ING Groep and two Australian banks, National Australia Bank and Commonwealth Bank of Australia.
The weakest-performing sector in the portfolio was information technology. The most significant detractors from absolute performance in this sector were Finnish telecom equipment company Nokia and Dutch semiconductor manufacturer ASML Holding. Other notable individual decliners in the portfolio included Japanese financial services firm Resona Holdings, Hong Kong–based shipping company Orient Overseas International, and Hong Kong airline operator Cathay Pacific Airways.
Financials and Materials Outperformed
Looking at relative performance, International Core Equity’s holdings in the financials and materials sectors contributed the most to its outperformance versus the MSCI EAFE Index for the fiscal year. The bulk of the outperformance in the financials sector resulted from stock selection among commercial banks. Top contributors included National Australia Bank, which reported better-than-expected earnings amid improving business credit conditions in Australia, and ING Groep, which generated solid profit growth and strengthened its balance sheet.
In the materials sector, stock choices among chemicals producers and metals and mining companies produced much of the outperformance. The leading contributor in this sector, and the portfolio as a whole, was French specialty chemicals
*All fund returns referenced in this commentary are for Investor Class shares.
company Rhodia, which agreed to be acquired by Belgian chemicals producer Solvay in April 2011. German chemicals firm BASF and Chinese gold producer Zhaojin Mining were also strong contributors in the materials sector.
Other noteworthy individual contributors to the fund’s outperformance of its benchmark included German broadcasting company ProSiebenSat.1 Media, Australian oil refiner Caltex Australia, and Danish drug maker H. Lundbeck. ProSiebenSat.1 Media benefited from a recovery in the German advertising market; Caltex saw profit margins rise as premium fuel sales increased; and H. Lundbeck rallied as sales of its flagship antidepressant medication rebounded.
Technology Lagged
The only sector in the portfolio to underperform its counterparts in the MSCI EAFE Index was information technology. Stock selection among communications equipment manufacturers and electronic equipment makers was responsible for virtually all of the underperformance in this sector. The biggest detractors in this sector were Finnish telecom equipment maker Nokia, which lost market share in the smartphone segment, and Japanese computer maker Fujitsu, which lowered its earnings outlook and suffered severe damage to many of its production facilities in the March earthquake/tsunami.
Elsewhere, the most significant detractors from absolute performance were also the most significant detractors from relative performance—Resona Holdings, Orient Overseas International, and Cathay Pacific Airways. Resona issued new equity to repay bailout funds to the Japanese government; Orient Overseas struggled with higher fuel costs and an anti-trust probe in Europe; and Cathay Pacific faced labor strife, the loss of its CEO, and price-fixing allegations in Europe.
A Look Ahead
The eye-catching turmoil in the headlines over the last six months—democratic change sweeping through the Middle East, a devastating natural disaster in Japan, the possibility of a sovereign debt default in Europe—has led to heightened uncertainty and growing volatility in international equity markets. But when you look at the past decade, there have been many other dramatic events that have had a similar impact on global stocks. When viewed through this lens, change and volatility have become more the rule than the exception.
It is this change dynamic that our investment process seeks to exploit and capitalize upon. Change and volatility leads to market inefficiencies, and within these inefficiencies lie investment opportunities. Rather than base investment decisions on vague financial headlines, we use our disciplined, data-driven, multi-factor investment process to take advantage of inefficiencies at the individual company level. We believe this approach will produce favorable returns over the long term.
| JUNE 30, 2011 |
| Top Ten Holdings | % of net assets |
| GlaxoSmithKline plc | 1.9% |
| BASF SE | 1.7% |
| National Australia Bank Ltd. | 1.6% |
| AstraZeneca plc | 1.6% |
| HSBC Holdings plc | 1.6% |
| Royal Dutch Shell plc B Shares | 1.4% |
| ING Groep NV CVA | 1.4% |
| BHP Billiton Ltd. | 1.4% |
| Australia & New Zealand Banking Group Ltd. | 1.3% |
| KDDI Corp. | 1.3% |
| | |
| Investments by Country | % of net assets |
| Japan | 20.1% |
| United Kingdom | 18.4% |
| France | 9.4% |
| Germany | 8.0% |
| Australia | 7.7% |
| Switzerland | 7.4% |
| Netherlands | 4.9% |
| Sweden | 3.4% |
| Spain | 3.1% |
| Hong Kong | 2.9% |
| Singapore | 2.8% |
| Other Countries | 11.4% |
| Cash and Equivalents* | 0.5% |
| *Includes temporary cash investments and other assets and liabilities. | |
| | |
| Types of Investments in Portfolio | % of net assets |
| Foreign Common Stocks & Warrants | 99.5% |
| Temporary Cash Investments | 0.4% |
| Other Assets and Liabilities | 0.1% |
Fund shareholders may incur two types of costs: (1) transaction costs, including sales charges (loads) on purchase payments and redemption/exchange fees; and (2) ongoing costs, including management fees; distribution and service (12b-1) fees; and other fund expenses. This example is intended to help you understand your ongoing costs (in dollars) of investing in your fund and to compare these costs with the ongoing cost of investing in other mutual funds.
The example is based on an investment of $1,000 made at the beginning of the period and held for the entire period from January 1, 2011 to June 30, 2011.
Actual Expenses
The table provides information about actual account values and actual expenses for each class. You may use the information, together with the amount you invested, to estimate the expenses that you paid over the period. First, identify the share class you own. Then simply divide your account value by $1,000 (for example, an $8,600 account value divided by $1,000 = 8.6), then multiply the result by the number under the heading “Expenses Paid During Period” to estimate the expenses you paid on your account during this period.
If you hold Investor Class shares of any American Century Investments fund, or Institutional Class shares of the American Century Diversified Bond Fund, in an American Century Investments account (i.e., not a financial intermediary or retirement plan account), American Century Investments may charge you a $12.50 semiannual account maintenance fee if the value of those shares is less than $10,000. We will redeem shares automatically in one of your accounts to pay the $12.50 fee. In determining your total eligible investment amount, we will include your investments in all personal accounts (including American Century Investments Brokerage accounts) registered under your Social Security number. Personal accounts include individual accounts, joint accounts, UGMA/UTMA accounts, personal trusts, Coverdell Education Savings Accounts and IRAs (including traditional, Roth, Rollover, SEP-, SARSEP- and SIMPLE-IRAs), and certain other retirement accounts. If you have only business, business retirement, employer-sponsored or American Century Investments Brokerage accounts, you are currently not subject to this fee. We will not charge the fee as long as you choose to manage your accounts exclusively online. If you are subject to the Account Maintenance Fee, your account value could be reduced by the fee amount.
Hypothetical Example for Comparison Purposes
The table also provides information about hypothetical account values and hypothetical expenses based on the actual expense ratio of each class of your fund and an assumed rate of return of 5% per year before expenses, which is not the actual return of a fund’s share class. The hypothetical account values and expenses may not be used to estimate the actual ending account balance or expenses you paid for the period. You may use this information to compare the ongoing costs of investing in your fund and other funds. To do so, compare this 5% hypothetical example with the 5% hypothetical examples that appear in the shareholder reports of the other funds.
Please note that the expenses shown in the table are meant to highlight your ongoing costs only and do not reflect any transactional costs, such as sales charges (loads) or redemption/exchange fees. Therefore, the table is useful in comparing ongoing costs only, and will not help you determine the relative total costs of owning different funds. In addition, if these transactional costs were included, your costs would have been higher.
| | | | | |
| | Beginning Account Value 1/1/11 | Ending Account Value 6/30/11 | Expenses Paid During Period* 1/1/11 - 6/30/11 | Annualized Expense Ratio* |
| Actual | | | | |
| Investor Class | $1,000 | $1,084.60 | $6.00 | 1.16% |
| Institutional Class | $1,000 | $1,087.20 | $4.97 | 0.96% |
| A Class | $1,000 | $1,083.20 | $7.28 | 1.41% |
| B Class | $1,000 | $1,080.60 | $11.14 | 2.16% |
| C Class | $1,000 | $1,080.60 | $11.14 | 2.16% |
| R Class | $1,000 | $1,083.30 | $8.57 | 1.66% |
| Hypothetical |
| Investor Class | $1,000 | $1,019.04 | $5.81 | 1.16% |
| Institutional Class | $1,000 | $1,020.03 | $4.81 | 0.96% |
| A Class | $1,000 | $1,017.80 | $7.05 | 1.41% |
| B Class | $1,000 | $1,014.08 | $10.79 | 2.16% |
| C Class | $1,000 | $1,014.08 | $10.79 | 2.16% |
| R Class | $1,000 | $1,016.56 | $8.30 | 1.66% |
| * | Expenses are equal to the class’s annualized expense ratio listed in the table above, multiplied by the average account value over the period, multiplied by 181, the number of days in the most recent fiscal half-year, divided by 365, to reflect the one-half year period. |
| | | |
| | Shares | Value |
| Common Stocks & Warrants — 99.5% |
| AUSTRALIA — 7.7% |
| Australia & New Zealand Banking Group Ltd. | 4,331 | $102,283 |
| Bendigo and Adelaide Bank Ltd. | 5,999 | 57,155 |
| BHP Billiton Ltd. | 2,284 | 107,949 |
| Commonwealth Bank of Australia | 1,359 | 76,487 |
| National Australia Bank Ltd. | 4,533 | 125,067 |
| Rio Tinto Ltd. | 955 | 85,383 |
| Telstra Corp. Ltd. | 11,384 | 35,350 |
| Westpac Banking Corp. | 430 | 10,315 |
| | | 599,989 |
| AUSTRIA — 1.0% |
| Andritz AG | 750 | 77,225 |
| BELGIUM — 0.7% | | |
| Delhaize Group SA | 311 | 23,317 |
| KBC Groep NV | 760 | 29,854 |
| | | 53,171 |
| BERMUDA — 0.3% |
| Hiscox Ltd. | 3,000 | 20,170 |
| CYPRUS — 0.1% |
| Bank of Cyprus Public Co. Ltd. | 3,683 | 10,868 |
| DENMARK — 1.8% |
| H. Lundbeck A/S | 3,503 | 92,205 |
| Novo Nordisk A/S B Shares | 385 | 48,269 |
| | | 140,474 |
| FINLAND — 1.6% |
| KONE Oyj B Shares | 500 | 31,394 |
| Nokia Oyj | 10,201 | 65,884 |
| Wartsila Oyj | 858 | 28,951 |
| | | 126,229 |
| FRANCE — 9.4% |
| AXA SA | 1,181 | 26,813 |
| BNP Paribas SA | 808 | 62,317 |
| Bouygues SA | 244 | 10,727 |
| Christian Dior SA | 141 | 22,186 |
| Compagnie Plastic Omnium SA | 700 | 22,791 |
Derichebourg SA(1) | 860 | 6,689 |
| Faurecia | 1,487 | 63,695 |
| France Telecom SA | 1,374 | 29,230 |
| Rallye SA | 339 | 14,085 |
| Safran SA | 177 | 7,560 |
| Sanofi | 724 | 58,191 |
| Societe Generale SA | 1,696 | 100,525 |
| Total Gabon SA | 149 | 76,449 |
| Total SA | 1,724 | 99,709 |
| Valeo SA | 303 | 20,688 |
| Vinci SA | 495 | 31,709 |
| Vivendi SA | 2,730 | 75,917 |
| | | 729,281 |
| GERMANY — 8.0% |
| Allianz SE | 403 | 56,306 |
| BASF SE | 1,342 | 131,329 |
| Bayer AG | 350 | 28,139 |
| Deutsche Lufthansa AG | 3,150 | 68,606 |
| Hannover Rueckversicherung AG | 1,312 | 68,434 |
| Henkel AG & Co. KGaA Preference Shares | 1,200 | 83,196 |
| Infineon Technologies AG | 2,549 | 28,603 |
| Metro AG | 271 | 16,405 |
| Muenchener Rueckversicherungs AG | 44 | 6,717 |
ProSiebenSat.1 Media AG Preference Shares(1) | 1,985 | 56,272 |
| Siemens AG | 304 | 41,741 |
| Volkswagen AG | 60 | 11,024 |
| Wacker Chemie AG | 100 | 21,621 |
| | | 618,393 |
| GREECE — 1.0% |
| OPAP SA | 4,779 | 74,672 |
| HONG KONG — 2.9% |
| BOC Hong Kong Holdings Ltd. | 4,500 | 13,096 |
| Guangdong Investment Ltd. | 22,000 | 11,779 |
| Hang Lung Group Ltd. | 9,000 | 57,478 |
| Orient Overseas International Ltd. | 10,500 | 68,011 |
| Wheelock & Co. Ltd. | 19,000 | 76,873 |
| | | 227,237 |
| IRELAND — 0.1% |
| Experian plc | 770 | 9,807 |
| ITALY — 1.7% |
| Enel SpA | 7,663 | 50,053 |
| ENI SpA | 2,713 | 64,316 |
| Mediaset SpA | 4,069 | 19,131 |
| | | 133,500 |
| JAPAN — 20.1% |
| Aisin Seiki Co. Ltd. | 1,000 | $38,722 |
| Asahi Glass Co. Ltd. | 2,000 | 23,353 |
| Canon, Inc. | 600 | 28,612 |
| Capcom Co. Ltd. | 3,600 | 83,284 |
| Central Japan Railway Co. | 2 | 15,720 |
| Daicel Chemical Industries, Ltd. | 3,000 | 19,869 |
| Daiichikosho Co. Ltd. | 2,000 | 32,384 |
| Dainippon Screen Manufacturing Co. Ltd. | 7,000 | 59,659 |
| Dainippon Sumitomo Pharma Co. Ltd. | 1,000 | 9,511 |
| Daito Trust Construction Co. Ltd. | 300 | 25,478 |
Elpida Memory, Inc.(1) | 600 | 7,064 |
| Fuji Heavy Industries Ltd. | 7,000 | 54,390 |
| Hitachi Ltd. | 5,000 | 29,556 |
| INPEX Corp. | 9 | 66,445 |
| ITOCHU Corp. | 5,400 | 56,172 |
| Kao Corp. | 2,000 | 52,562 |
| KDDI Corp. | 14 | 100,731 |
| K’s Holdings Corp. | 800 | 34,701 |
| Kuraray Co. Ltd. | 3,000 | 44,033 |
| Marubeni Corp. | 4,000 | 26,585 |
| Mitsubishi Electric Corp. | 8,000 | 92,909 |
| Mitsui & Co. Ltd. | 900 | 15,564 |
| Nippon Electric Glass Co. Ltd. | 2,000 | 25,621 |
| Nippon Meat Packers, Inc. | 1,000 | 14,338 |
| Nippon Telegraph & Telephone Corp. | 1,900 | 92,388 |
| Nitto Denko Corp. | 1,400 | 71,114 |
| NTT Data Corp. | 21 | 69,787 |
| NTT DoCoMo, Inc. | 24 | 42,815 |
| Saizeriya Co. Ltd. | 900 | 17,101 |
| Sega Sammy Holdings, Inc. | 4,200 | 81,348 |
| Seven & I Holdings Co. Ltd. | 1,000 | 26,902 |
| SOFTBANK CORP. | 300 | 11,362 |
| Sumitomo Mitsui Financial Group, Inc. | 258 | 7,940 |
| Takeda Pharmaceutical Co. Ltd. | 600 | 27,751 |
| Teijin Ltd. | 13,000 | 57,364 |
| TS Tech Co. Ltd. | 4,500 | 85,717 |
| Yamaguchi Financial Group, Inc. | 1,000 | 9,338 |
| | | 1,558,190 |
| NETHERLANDS — 4.9% |
| ASM International NV | 198 | 7,814 |
| ASML Holding NV | 1,166 | 42,958 |
| Delta Lloyd NV | 947 | 22,490 |
| Heineken Holding NV | 974 | 49,843 |
ING Groep NV CVA(1) | 8,868 | 109,389 |
| Koninklijke Ahold NV | 700 | 9,406 |
| Royal Dutch Shell plc B Shares | 3,076 | 109,802 |
| Unilever NV CVA | 1,001 | 32,793 |
| | | 384,495 |
| NEW ZEALAND — 0.3% |
| Telecom Corp. of New Zealand Ltd. | 10,100 | 20,491 |
| NORWAY — 1.8% |
| Austevoll Seafood ASA | 1,389 | 8,003 |
Cermaq ASA(1) | 2,722 | 43,506 |
| Statoil ASA | 400 | 10,128 |
| TGS Nopec Geophysical Co. ASA | 2,900 | 81,334 |
| | | 142,971 |
| PEOPLE’S REPUBLIC OF CHINA — 1.0% |
| Dongfeng Motor Group Co. Ltd. H Shares | 42,000 | 80,059 |
| SINGAPORE — 2.8% |
Golden Agri-Resources Ltd. Warrants(1) | 1,224 | 159 |
| SembCorp Industries Ltd. | 11,000 | 44,854 |
| SembCorp Marine Ltd. | 18,000 | 77,988 |
| United Overseas Bank Ltd. | 6,000 | 96,399 |
| | | 219,400 |
| SPAIN — 3.1% |
| Banco Santander SA | 77 | 888 |
| Corp. Financiera Alba | 274 | 15,477 |
| Endesa SA | 2,303 | 76,685 |
Gamesa Corp Tecnologica SA(1) | 2,210 | 17,903 |
| Mapfre SA | 20,170 | 74,812 |
| Telefonica SA | 2,125 | 51,965 |
| | | 237,730 |
| SWEDEN — 3.4% |
| Billerud AB | 6,554 | 68,648 |
| Boliden AB | 384 | 7,098 |
| Intrum Justitia AB | 2,800 | 41,160 |
| Investor AB B Shares | 3,100 | 71,031 |
| Saab AB B Shares | 3,169 | 72,499 |
| | | 260,436 |
| SWITZERLAND — 7.4% |
ABB Ltd.(1) | 485 | $12,577 |
Clariant AG(1) | 2,623 | 50,139 |
| Emmi AG | 25 | 6,359 |
| Lindt & Spruengli AG | 3 | 9,349 |
Meyer Burger Technology AG(1) | 1,669 | 73,722 |
| Nestle SA | 1,334 | 82,907 |
| Novartis AG | 1,444 | 88,456 |
| Roche Holding AG | 331 | 55,376 |
| Swatch Group AG (The) | 768 | 68,971 |
Swiss Life Holding AG(1) | 285 | 46,727 |
| Swisscom AG | 15 | 6,874 |
UBS AG(1) | 1,116 | 20,350 |
Zurich Financial Services AG(1) | 204 | 51,560 |
| | | 573,367 |
| UNITED KINGDOM — 18.4% |
| AstraZeneca plc | 2,475 | 123,581 |
| Aviva plc | 11,900 | 83,789 |
| BHP Billiton plc | 1,408 | 55,187 |
| BP plc | 10,395 | 76,590 |
| British American Tobacco plc | 2,122 | 93,014 |
| BT Group plc | 30,111 | 97,670 |
| Centrica plc | 15,842 | 82,205 |
| Drax Group plc | 10,405 | 84,054 |
| GlaxoSmithKline plc | 7,013 | 150,153 |
| Go-Ahead Group plc | 3,408 | 86,501 |
| HSBC Holdings plc | 12,456 | 123,570 |
| Imperial Tobacco Group plc | 712 | 23,673 |
| Investec plc | 3,027 | 24,511 |
| Next plc | 1,050 | 39,214 |
| Old Mutual plc | 6,043 | 12,939 |
| Reckitt Benckiser Group plc | 260 | 14,355 |
| Rio Tinto plc | 1,017 | 73,437 |
| Standard Chartered plc | 2,958 | 77,729 |
| Tate & Lyle plc | 8,018 | 79,274 |
| Unilever plc | 302 | 9,746 |
| Vodafone Group plc | 6,721 | 17,862 |
| | | 1,429,054 |
TOTAL COMMON STOCKS & WARRANTS(Cost $6,961,137) | 7,727,209 |
| | |
| | Value |
| Temporary Cash Investments — 0.4% |
Repurchase Agreement, Bank of America N.A., (collateralized by various U.S. Treasury obligations, 4.375%, 11/15/39, valued at $11,243), in a joint trading account at 0.00%, dated 6/30/11, due 7/1/11 (Delivery value $10,989) | $10,989 |
Repurchase Agreement, Credit Suisse First Boston, Inc., (collateralized by various U.S. Treasury obligations, 3.50%, 5/15/20, valued at $9,343), in a joint trading account at 0.00%, dated 6/30/11, due 7/1/11 (Delivery value $9,157) | 9,157 |
Repurchase Agreement, Goldman Sachs Group, Inc., (collateralized by various U.S. Treasury obligations, 1.375%, 9/15/12, valued at $11,210), in a joint trading account at 0.00%, dated 6/30/11, due 7/1/11 (Delivery value $10,988) | 10,988 |
TOTAL TEMPORARY CASH INVESTMENTS(Cost $31,134) | 31,134 |
TOTAL INVESTMENT SECURITIES — 99.9%(Cost $6,992,271) | 7,758,343 |
| OTHER ASSETS AND LIABILITIES — 0.1% | 9,974 |
| TOTAL NET ASSETS — 100.0% | $7,768,317 |
| Market Sector Diversification |
| (as a % of net assets) |
| Financials | 23.0% |
| Industrials | 13.4% |
| Consumer Discretionary | 11.5% |
| Materials | 10.2% |
| Consumer Staples | 8.9% |
| Health Care | 8.8% |
| Energy | 7.5% |
| Telecommunication Services | 6.5% |
| Information Technology | 5.8% |
| Utilities | 3.9% |
| Cash and Equivalents* | 0.5% |
*Includes temporary cash investments and other assets and liabilities.
Notes to Schedule of Investments
CVA = Certificaten Van Aandelen
(1) Non-income producing.
See Notes to Financial Statements.
Statement of Assets and Liabilities |
| JUNE 30, 2011 | |
| Assets | |
| Investment securities, at value (cost of $6,992,271) | | | $7,758,343 | |
| Cash | | | 9,412 | |
| Foreign currency holdings, at value (cost of $9,805) | | | 9,852 | |
| Receivable for capital shares sold | | | 4,642 | |
| Dividends and interest receivable | | | 24,167 | |
| | | | 7,806,416 | |
| | | | | |
| Liabilities | |
| Payable for capital shares redeemed | | | 28,932 | |
| Accrued management fees | | | 7,056 | |
| Distribution and service fees payable | | | 2,111 | |
| | | | 38,099 | |
| | | | | |
| Net Assets | | | $7,768,317 | |
| | | | | |
| Net Assets Consist of: | |
| Capital (par value and paid-in surplus) | | | $9,718,607 | |
| Undistributed net investment income | | | 125,170 | |
| Accumulated net realized loss | | | (2,842,384 | ) |
| Net unrealized appreciation | | | 766,924 | |
| | | | $7,768,317 | |
| | | | |
| | Net assets | Shares outstanding | Net asset value per share |
| Investor Class, $0.01 Par Value | $2,754,890 | 340,792 | $8.08 |
| Institutional Class, $0.01 Par Value | $1,115,642 | 137,766 | $8.10 |
| A Class, $0.01 Par Value | $1,018,620 | 126,178 | $8.07* |
| B Class, $0.01 Par Value | $935,617 | 116,418 | $8.04 |
| C Class, $0.01 Par Value | $955,836 | 118,958 | $8.04 |
| R Class, $0.01 Par Value | $987,712 | 122,539 | $8.06 |
*Maximum offering price $8.56 (net asset value divided by 0.9425)
See Notes to Financial Statements.
| YEAR ENDED JUNE 30, 2011 | |
| Investment Income (Loss) | |
| Income: | |
| Dividends (net of foreign taxes withheld of $18,345) | | | $241,831 | |
| Interest | | | 40 | |
| | | | 241,871 | |
| Expenses: | | | | |
| Management fees | | | 73,722 | |
| Distribution and service fees: | | | | |
| A Class | | | 2,218 | |
| B Class | | | 8,517 | |
| C Class | | | 8,177 | |
| R Class | | | 4,387 | |
| Directors’ fees and expenses | | | 273 | |
| Other expenses | | | 767 | |
| | | | 98,061 | |
| | | | | |
| Net investment income (loss) | | | 143,810 | |
| | | | | |
| Realized and Unrealized Gain (Loss) | |
| Net realized gain (loss) on: | | | | |
| Investment transactions | | | 385,435 | |
| Foreign currency transactions | | | 123,989 | |
| | | | 509,424 | |
| | | | | |
| Change in net unrealized appreciation (depreciation) on: | | | | |
| Investments | | | 570,670 | |
| Translation of assets and liabilities in foreign currencies | | | 665,478 | |
| | | | 1,236,148 | |
| | | | | |
| Net realized and unrealized gain (loss) | | | 1,745,572 | |
| | | | | |
| Net Increase (Decrease) in Net Assets Resulting from Operations | | | $1,889,382 | |
See Notes to Financial Statements.
Statement of Changes in Net Assets |
| YEARS ENDED JUNE 30, 2011 AND JUNE 30, 2010 | |
| Increase (Decrease) in Net Assets | | 2011 | | | 2010 | |
| Operations | |
| Net investment income (loss) | | | $143,810 | | | | $72,647 | |
| Net realized gain (loss) | | | 509,424 | | | | 59,210 | |
| Change in net unrealized appreciation (depreciation) | | | 1,236,148 | | | | 271,282 | |
| Net increase (decrease) in net assets resulting from operations | | | 1,889,382 | | | | 403,139 | |
| | | | | | | | | |
| Distributions to Shareholders | |
| From net investment income: | | | | | | | | |
| Investor Class | | | (33,781 | ) | | | (48,536 | ) |
| Institutional Class | | | (17,082 | ) | | | (23,300 | ) |
| A Class | | | (13,012 | ) | | | (20,255 | ) |
| B Class | | | (5,748 | ) | | | (7,830 | ) |
| C Class | | | (5,426 | ) | | | (9,392 | ) |
| R Class | | | (10,040 | ) | | | (11,766 | ) |
| Decrease in net assets from distributions | | | (85,089 | ) | | | (121,079 | ) |
| | | | | | | | | |
| Capital Share Transactions | |
| Net increase (decrease) in net assets from capital share transactions | | | 1,100,849 | | | | (936,519 | ) |
| | | | | | | | | |
| Redemption Fees | |
| Increase in net assets from redemption fees | | | 368 | | | | 2,962 | |
| | | | | | | | | |
| Net increase (decrease) in net assets | | | 2,905,510 | | | | (651,497 | ) |
| | | | | | | | | |
| Net Assets | |
| Beginning of period | | | 4,862,807 | | | | 5,514,304 | |
| End of period | | | $7,768,317 | | | | $4,862,807 | |
| | | | | | | | | |
| Undistributed net investment income | | | $125,170 | | | | $64,736 | |
See Notes to Financial Statements.
Notes to Financial Statements |
JUNE 30, 2011
1. Organization
American Century Quantitative Equity Funds, Inc. (the corporation) is registered under the Investment Company Act of 1940, as amended (the 1940 Act), as an open-end management investment company and is organized as a Maryland corporation. International Core Equity Fund (the fund) is one fund in a series issued by the corporation. The fund is diversified as defined under the 1940 Act. The fund’s investment objective is to seek long-term capital growth. The fund pursues its objective by investing primarily in equity securities of companies located in developed countries, excluding the United States and Canada.
The fund is authorized to issue the Investor Class, the Institutional Class, the A Class, the B Class, the C Class and the R Class. The A Class may incur an initial sales charge. The A Class, B Class and C Class may be subject to a contingent deferred sales charge. The share classes differ principally in their respective sales charges and distribution and shareholder servicing expenses and arrangements. The Institutional Class is made available to institutional shareholders or through financial intermediaries whose clients do not require the same level of shareholder and administrative services as shareholders of other classes. As a result, the Institutional Class is charged a lower unified management fee.
2. Significant Accounting Policies
The following is a summary of significant accounting policies consistently followed by the fund in preparation of its financial statements. The financial statements are prepared in conformity with accounting principles generally accepted in the United States of America, which may require management to make certain estimates and assumptions at the date of the financial statements. Actual results could differ from these estimates.
Investment Valuations — The fund determines the fair value of its investments and computes its net asset value per share as of the close of regular trading (usually 4 p.m. Eastern time) on the New York Stock Exchange (NYSE) on each day the NYSE is open.
Equity securities that are listed or traded on a domestic securities exchange are valued at the last reported sales price or at the official closing price as provided by the exchange. Equity securities traded on foreign securities exchanges are typically valued at the closing price on the exchange where primarily traded or as of the close of the NYSE, if that is earlier. If no last sales price is reported, or if local convention or regulation so provides, the mean of the latest bid and asked prices is used. Depending on local convention or regulation, securities traded over-the-counter are valued at the mean of the latest bid and asked prices, the last sales price, or the official closing price. In its determination of fair value, the fund may review several factors including: market information specific to a security; news developments in U.S. and foreign markets; the performance of particular U.S. and foreign securities, indices, comparable securities, American Depositary Receipts, Exchange-Traded Funds, and other relevant market indicators.
Debt securities maturing within 60 days at the time of purchase may be valued at cost, plus or minus any amortized discount or premium or at the evaluated mean as provided by an independent pricing service. Evaluated mean prices are commonly derived through utilization of market models, which may consider, among other factors, trade data, quotations from dealers and active market makers, relevant yield curve and spread data, related sector levels, creditworthiness, and other relevant market information on the same or comparable securities.
Repurchase agreements are valued at cost. The value of investments initially expressed in foreign currencies is translated into U.S. dollars at prevailing exchange rates.
If the fund determines that the market price for a portfolio security is not readily available or the valuation methods mentioned above do not reflect a security’s fair value, such security is valued as determined in good faith by the Board of Directors or its designee, in accordance with procedures adopted by the Board of Directors. Circumstances that may cause the fund to use these procedures to value a security include, but are not limited
to: a security has been declared in default; trading in a security has been halted during the trading day; there is a foreign market holiday and no trading occurred; or an event occurred between the close of a foreign exchange and the NYSE that may affect the value of a security.
Security Transactions — Security transactions are accounted for as of the trade date. Net realized gains and losses are determined on the identified cost basis, which is also used for federal income tax purposes.
Investment Income — Dividend income less foreign taxes withheld, if any, is recorded as of the ex-dividend date. Interest income is recorded on the accrual basis and includes accretion of discounts and amortization of premiums.
Foreign Currency Translations — All assets and liabilities initially expressed in foreign currencies are translated into U.S. dollars at prevailing exchange rates at period end. The fund may enter into spot foreign currency exchange contracts to facilitate transactions denominated in a foreign currency. Purchases and sales of investment securities, dividend and interest income, spot foreign currency exchange contracts, and expenses are translated at the rates of exchange prevailing on the respective dates of such transactions. Net realized and unrealized foreign currency exchange gains or losses related to investment securities are a component of net realized gain (loss) on foreign currency transactions and change in net unrealized appreciation (depreciation) on translation of assets and liabilities in foreign currencies, respectively.
Repurchase Agreements — The fund may enter into repurchase agreements with institutions that American Century Investment Management, Inc. (ACIM) (the investment advisor) has determined are creditworthy pursuant to criteria adopted by the Board of Directors. The fund requires that the collateral, represented by securities, received in a repurchase transaction be transferred to the custodian in a manner sufficient to enable the fund to obtain those securities in the event of a default under the repurchase agreement. ACIM monitors, on a daily basis, the securities transferred to ensure the value, including accrued interest, of the securities under each repurchase agreement is equal to or greater than amounts owed to the fund under each repurchase agreement.
Joint Trading Account — Pursuant to an Exemptive Order issued by the Securities and Exchange Commission, the fund, along with certain other funds in the American Century Investments family of funds, may transfer uninvested cash balances into a joint trading account. These balances are invested in one or more repurchase agreements that are collateralized by U.S. Treasury or Agency obligations.
Income Tax Status — It is the fund’s policy to distribute substantially all net investment income and net realized gains to shareholders and to otherwise qualify as a regulated investment company under provisions of the Internal Revenue Code. The fund is no longer subject to examination by tax authorities for years prior to 2008. At this time, management believes there are no uncertain tax positions which, based on their technical merit, would not be sustained upon examination and for which it is reasonably possible that the total amounts of unrecognized tax benefits will significantly change in the next twelve months. Accordingly, no provision has been made for federal or state income taxes.
Multiple Class — All shares of the fund represent an equal pro rata interest in the net assets of the class to which such shares belong, and have identical voting, dividend, liquidation and other rights and the same terms and conditions, except for class specific expenses and exclusive rights to vote on matters affecting only individual classes. Income, non-class specific expenses, and realized and unrealized capital gains and losses of the fund are allocated to each class of shares based on their relative net assets.
Distributions to Shareholders — Distributions from net investment income and net realized gains, if any, are generally declared and paid annually.
Redemption — The fund may impose a 2.00% redemption fee on shares held less than 60 days. The fee may not be applicable to all classes. The redemption fee is retained by the fund and helps cover transaction costs that long-term investors may bear when the fund sells securities to meet investor redemptions.
Indemnifications — Under the corporation’s organizational documents, its officers and directors are indemnified against certain liabilities arising out of the performance of their duties to the fund. In addition, in the normal course of business, the fund enters into contracts that provide general indemnifications. The maximum exposure under these arrangements is unknown as this would involve future claims that may be made against a fund. The risk of material loss from such claims is considered by management to be remote.
3. Fees and Transactions with Related Parties
Management Fees —The corporation has entered into a management agreement with ACIM, under which ACIM provides the fund with investment advisory and management services in exchange for a single, unified management fee (the fee) per class. The agreement provides that all expenses of managing and operating the fund, except distribution and service fees, brokerage expenses, taxes, interest, fees and expenses of the independent directors (including legal counsel fees), and extraordinary expenses, will be paid by ACIM. The fee is computed and accrued daily based on each class’s daily net assets and paid monthly in arrears. The fee consists of (1) an Investment Category Fee based on the daily net assets of the fund and certain other accounts managed by the investment advisor that are in the same broad investment category as the fund and (2) a Complex Fee based on the assets of all the funds in the American Century Investments family of funds. The rates for the Investment Category Fee range from 0.8180% to 1.0000%. The rates for the Complex Fee range from 0.2500% to 0.3100% for the Investor Class, A Class, B Class, C Class and R Class. The Institutional Class is 0.2000% less at each point within the Complex Fee range. The effective annual management fee for each class for the year ended June 30, 2011 was 1.16% for the Investor Class, A Class, B Class, C Class and R Class and 0.96% for the Institutional Class.
Distribution and Service Fees — The Board of Directors has adopted a separate Master Distribution and Individual Shareholder Services Plan for each of the A Class, B Class, C Class and R Class (collectively the plans), pursuant to Rule 12b-1 of the 1940 Act. The plans provide that the A Class will pay American Century Investment Services, Inc. (ACIS) an annual distribution and service fee of 0.25%. The plans provide that the B Class and C Class will each pay ACIS an annual distribution and service fee of 1.00%, of which 0.25% is paid for individual shareholder services and 0.75% is paid for distribution services. The plans provide that the R Class will pay ACIS an annual distribution and service fee of 0.50%. The fees are computed and accrued daily based on each class’s daily net assets and paid monthly in arrears. The fees are used to pay financial intermediaries for distribution and individual shareholder services. Fees incurred under the plans during the year ended June 30, 2011 are detailed in the Statement of Operations.
Acquired Fund Fees and Expenses — The fund may invest in mutual funds, exchange-traded funds, and business development companies (the acquired funds). The fund will indirectly realize its pro rata share of the fees and expenses of the acquired funds in which it invests. These indirect fees and expenses are not paid out of the fund’s assets but are reflected in the return realized by the fund on its investment in the acquired funds.
Other Expenses — The fund’s total other expenses include the fees and expenses of the fund’s independent directors and their legal counsel, interest, and other miscellaneous expenses. A portion of these expenses was due to nonrecurring expenses paid by the fund. The impact of total other expenses to the ratio of operating expenses to average net assets was 0.02% for the year ended June 30, 2011.
Related Parties — Certain officers and directors of the corporation are also officers and/or directors of American Century Companies, Inc. (ACC), the parent of the corporation’s investment advisor, ACIM, the distributor of the corporation, ACIS, and the corporation’s transfer agent, American Century Services, LLC. ACIM owns 44% of the outstanding shares of the fund.
The fund has a securities lending agreement with JPMorgan Chase Bank (JPMCB) and a mutual funds services agreement with J.P. Morgan Investor Services Co. (JPMIS). JPMCB is a custodian of the fund. JPMIS and JPMCB are wholly owned subsidiaries of JPMorgan Chase & Co. (JPM). JPM is an equity investor in ACC. The services provided to the fund by JPMIS and JPMCB terminated on July 31, 2011.
4. Investment Transactions
Purchases and sales of investment securities, excluding short-term investments, for the year ended June 30, 2011 were $6,111,191 and $4,932,643, respectively.
5. Capital Share Transactions
Transactions in shares of the fund were as follows:
| | | | | | | |
| | | Year ended June 30, 2011 | | | Year ended June 30, 2010 | |
| | | Shares | | | Amount | | | Shares | | | Amount | |
| Investor Class/Shares Authorized | | | 50,000,000 | | | | | | | 50,000,000 | | | | |
| Sold | | | 188,693 | | | | $1,437,705 | | | | 161,834 | | | | $1,093,808 | |
| Issued in reinvestment of distributions | | | 4,553 | | | | 33,738 | | | | 7,065 | | | | 48,325 | |
| Redeemed | | | (102,834 | ) | | | (772,539 | ) | | | (212,201 | ) | | | (1,452,000 | ) |
| | | | 90,412 | | | | 698,904 | | | | (43,302 | ) | | | (309,867 | ) |
| Institutional Class/Shares Authorized | | | 50,000,000 | | | | | | | | 50,000,000 | | | | | |
| Sold | | | 51,117 | | | | 384,243 | | | | 22,965 | | | | 161,078 | |
| Issued in reinvestment of distributions | | | 2,305 | | | | 17,082 | | | | 3,407 | | | | 23,300 | |
| Redeemed | | | (25,245 | ) | | | (192,070 | ) | | | (65,095 | ) | | | (447,738 | ) |
| | | | 28,177 | | | | 209,255 | | | | (38,723 | ) | | | (263,360 | ) |
| A Class/Shares Authorized | | | 10,000,000 | | | | | | | | 10,000,000 | | | | | |
| Sold | | | 25,487 | | | | 190,990 | | | | 26,832 | | | | 176,278 | |
| Issued in reinvestment of distributions | | | 1,651 | | | | 12,233 | | | | 2,788 | | | | 19,071 | |
| Redeemed | | | (23,823 | ) | | | (174,529 | ) | | | (62,627 | ) | | | (429,133 | ) |
| | | | 3,315 | | | | 28,694 | | | | (33,007 | ) | | | (233,784 | ) |
| B Class/Shares Authorized | | | 10,000,000 | | | | | | | | 10,000,000 | | | | | |
| Sold | | | 1,180 | | | | 8,641 | | | | 902 | | | | 6,156 | |
| Issued in reinvestment of distributions | | | 777 | | | | 5,748 | | | | 1,147 | | | | 7,830 | |
| Redeemed | | | (8 | ) | | | (58 | ) | | | (483 | ) | | | (3,080 | ) |
| | | | 1,949 | | | | 14,331 | | | | 1,566 | | | | 10,906 | |
| C Class/Shares Authorized | | | 10,000,000 | | | | | | | | 10,000,000 | | | | | |
| Sold | | | 19,079 | | | | 147,616 | | | | 15,128 | | | | 101,359 | |
| Issued in reinvestment of distributions | | | 708 | | | | 5,236 | | | | 1,336 | | | | 9,129 | |
| Redeemed | | | (7,446 | ) | | | (59,124 | ) | | | (38,595 | ) | | | (265,916 | ) |
| | | | 12,341 | | | | 93,728 | | | | (22,131 | ) | | | (155,428 | ) |
| R Class/Shares Authorized | | | 10,000,000 | | | | | | | | 10,000,000 | | | | | |
| Sold | | | 10,541 | | | | 76,313 | | | | 500 | | | | 3,301 | |
| Issued in reinvestment of distributions | | | 1,357 | | | | 10,040 | | | | 1,720 | | | | 11,766 | |
| Redeemed | | | (4,243 | ) | | | (30,416 | ) | | | (8 | ) | | | (53 | ) |
| | | | 7,655 | | | | 55,937 | | | | 2,212 | | | | 15,014 | |
| Net increase (decrease) | | | 143,849 | | | | $1,100,849 | | | | (133,385 | ) | | | $(936,519 | ) |
6. Fair Value Measurements
The fund’s securities valuation process is based on several considerations and may use multiple inputs to determine the fair value of the positions held by the fund. In conformity with accounting principles generally accepted in the United States of America, the inputs used to determine a valuation are classified into three broad levels as follows:
| • | Level 1 valuation inputs consist of unadjusted quoted prices in an active market for identical securities; |
| • | Level 2 valuation inputs consist of direct or indirect observable market data (including quoted prices for similar securities, evaluations of subsequent market events, interest rates, prepayment speeds, credit risk, etc.); or |
| • | Level 3 valuation inputs consist of unobservable data (including a fund’s own assumptions). |
The level classification is based on the lowest level input that is significant to the fair valuation measurement. The valuation inputs are not necessarily an indication of the risks associated with investing in these securities or other financial instruments.
As of period end, the fund’s investment securities were classified as Level 2. The Schedule of Investments provides additional information on the fund’s portfolio holdings.
7. Risk Factors
There are certain risks involved in investing in foreign securities. These risks include those resulting from future adverse political, social, and economic developments, fluctuations in currency exchange rates, the possible imposition of exchange controls, and other foreign laws or restrictions. Investing in emerging markets may accentuate these risks.
8. Federal Tax Information
The tax character of distributions paid during the years ended June 30, 2011 and June 30, 2010 were as follows:
| | | | | | | |
| | | 2011 | | | 2010 | |
| Distributions Paid From | | | | | | |
| Ordinary income | | | $85,089 | | | | $121,079 | |
| Long-term capital gains | | | — | | | | — | |
The book-basis character of distributions made during the year from net investment income or net realized gains may differ from their ultimate characterization for federal income tax purposes. These differences reflect the differing character of certain income items and net realized gains and losses for financial statement and tax purposes, and may result in reclassification among certain capital accounts on the financial statements.
As of June 30, 2011, the federal tax cost of investments and the components of distributable earnings on a tax-basis were as follows:
| | | | | |
| Federal tax cost of investments | | | $7,046,583 | |
| Gross tax appreciation of investments | | | $970,966 | |
| Gross tax depreciation of investments | | | (259,206 | ) |
| Net tax appreciation (depreciation) of investments | | | $711,760 | |
Net tax appreciation (depreciation) on derivatives and translation of assets and liabilities in foreign currencies | | | $852 | |
| Net tax appreciation (depreciation) | | | $712,612 | |
| Undistributed ordinary income | | | $133,114 | |
| Accumulated capital losses | | | $(2,796,016 | ) |
The difference between book-basis and tax-basis cost and unrealized appreciation (depreciation) is attributable primarily to the tax deferral of losses on wash sales and the realization to ordinary income for tax purposes of unrealized gains on investments in passive foreign investment companies.
The accumulated capital losses represent net capital loss carryovers that may be used to offset future realized capital gains for federal income tax purposes. Future capital loss carryover utilization in any given year may be subject to Internal Revenue Code limitations. Capital loss carryovers of $(816,093) and $(1,979,923) expire in 2017 and 2018, respectively.
On December 22, 2010, the Regulated Investment Company Modernization Act of 2010 (the “Act”) was enacted, which changed various technical rules governing the tax treatment of regulated investment companies. The changes are generally effective for taxable years beginning after the date of enactment. Under the Act, the fund will be permitted to carry forward capital losses incurred in taxable years beginning after the date of enactment for an unlimited period. However, any losses incurred during those future taxable years will be required to be utilized prior to the losses incurred in pre-enactment taxable years, which carry an expiration date. As a result of this ordering rule, pre-enactment capital loss carryforwards may be more likely to expire unused.
| Investor Class | |
| For a Share Outstanding Throughout the Years Ended June 30 (except as noted) | |
| | | 2011 | | | 2010 | | | 2009 | | | 2008 | | | 2007(1) | |
| Per-Share Data | |
| Net Asset Value, Beginning of Period | | | $5.95 | | | | $5.80 | | | | $9.72 | | | | $11.88 | | | | $10.00 | |
| Income From Investment Operations | | | | | | | | | | | | | | | | | | | | |
Net Investment Income (Loss)(2) | | | 0.20 | | | | 0.10 | | | | 0.20 | | | | 0.28 | | | | 0.15 | |
| Net Realized and Unrealized Gain (Loss) | | | 2.05 | | | | 0.19 | | | | (3.87 | ) | | | (1.69 | ) | | | 1.73 | |
| Total From Investment Operations | | | 2.25 | | | | 0.29 | | | | (3.67 | ) | | | (1.41 | ) | | | 1.88 | |
| Distributions | | | | | | | | | | | | | | | | | | | | |
| From Net Investment Income | | | (0.12 | ) | | | (0.14 | ) | | | (0.25 | ) | | | (0.21 | ) | | | — | |
| From Net Realized Gains | | | — | | | | — | | | | — | | | | (0.54 | ) | | | — | |
| Total Distributions | | | (0.12 | ) | | | (0.14 | ) | | | (0.25 | ) | | | (0.75 | ) | | | — | |
| Net Asset Value, End of Period | | | $8.08 | | | | $5.95 | | | | $5.80 | | | | $9.72 | | | | $11.88 | |
| | | | | | | | | | | | | | | | | | | | | |
Total Return(3) | | | 38.09 | % | | | 4.68 | % | | | (37.81 | )% | | | (12.30 | )% | | | 18.80 | % |
| | | | | | | | | | | | | | | | | | | | | |
| Ratios/Supplemental Data | |
Ratio of Operating Expenses to Average Net Assets | | | 1.18 | % | | | 1.18 | % | | | 1.17 | % | | | 1.16 | % | | | 1.18 | %(4) |
Ratio of Net Investment Income (Loss) to Average Net Assets | | | 2.53 | % | | | 1.55 | % | | | 3.09 | % | | | 2.50 | % | | | 2.30 | %(4) |
| Portfolio Turnover Rate | | | 77 | % | | | 83 | % | | | 131 | % | | | 108 | % | | | 51 | % |
| Net Assets, End of Period (in thousands) | | | $2,755 | | | | $1,490 | | | | $1,704 | | | | $2,583 | | | | $1,493 | |
| (1) | November 30, 2006 (fund inception) through June 30, 2007. |
| (2) | Computed using average shares outstanding throughout the period. |
| (3) | Total returns are calculated based on the net asset value of the last business day. Total returns for periods less than one year are not annualized. |
See Notes to Financial Statements.
| Institutional Class | |
| For a Share Outstanding Throughout the Years Ended June 30 (except as noted) | |
| | | 2011 | | | 2010 | | | 2009 | | | 2008 | | | 2007(1) | |
| Per-Share Data | |
| Net Asset Value, Beginning of Period | | | $5.96 | | | | $5.81 | | | | $9.73 | | | | $11.90 | | | | $10.00 | |
| Income From Investment Operations | | | | | | | | | | | | | | | | | | | | |
Net Investment Income (Loss)(2) | | | 0.21 | | | | 0.11 | | | | 0.20 | | | | 0.29 | | | | 0.16 | |
| Net Realized and Unrealized Gain (Loss) | | | 2.07 | | | | 0.19 | | | | (3.86 | ) | | | (1.69 | ) | | | 1.74 | |
| Total From Investment Operations | | | 2.28 | | | | 0.30 | | | | (3.66 | ) | | | (1.40 | ) | | | 1.90 | |
| Distributions | | | | | | | | | | | | | | | | | | | | |
| From Net Investment Income | | | (0.14 | ) | | | (0.15 | ) | | | (0.26 | ) | | | (0.23 | ) | | | — | |
| From Net Realized Gains | | | — | | | | — | | | | — | | | | (0.54 | ) | | | — | |
| Total Distributions | | | (0.14 | ) | | | (0.15 | ) | | | (0.26 | ) | | | (0.77 | ) | | | — | |
| Net Asset Value, End of Period | | | $8.10 | | | | $5.96 | | | | $5.81 | | | | $9.73 | | | | $11.90 | |
| | | | | | | | | | | | | | | | | | | | | |
Total Return(3) | | | 38.47 | % | | | 4.88 | % | | | (37.65 | )% | | | (12.19 | )% | | | 19.00 | % |
| | | | | | | | | | | | | | | | | | | | | |
| Ratios/Supplemental Data | |
Ratio of Operating Expenses to Average Net Assets | | | 0.98 | % | | | 0.98 | % | | | 0.97 | % | | | 0.96 | % | | | 0.98 | %(4) |
Ratio of Net Investment Income (Loss) to Average Net Assets | | | 2.73 | % | | | 1.75 | % | | | 3.29 | % | | | 2.70 | % | | | 2.50 | %(4) |
| Portfolio Turnover Rate | | | 77 | % | | | 83 | % | | | 131 | % | | | 108 | % | | | 51 | % |
| Net Assets, End of Period (in thousands) | | | $1,116 | | | | $653 | | | | $862 | | | | $1,374 | | | | $1,208 | |
| (1) | November 30, 2006 (fund inception) through June 30, 2007. |
| (2) | Computed using average shares outstanding throughout the period. |
| (3) | Total returns are calculated based on the net asset value of the last business day. Total returns for periods less than one year are not annualized. |
See Notes to Financial Statements.
| A Class | |
| For a Share Outstanding Throughout the Years Ended June 30 (except as noted) | |
| | | 2011 | | | 2010 | | | 2009 | | | 2008 | | | 2007(1) | |
| Per-Share Data | |
| Net Asset Value, Beginning of Period | | | $5.94 | | | | $5.79 | | | | $9.71 | | | | $11.87 | | | | $10.00 | |
| Income From Investment Operations | | | | | | | | | | | | | | | | | | | | |
Net Investment Income (Loss)(2) | | | 0.16 | | | | 0.09 | | | | 0.17 | | | | 0.24 | | | | 0.13 | |
| Net Realized and Unrealized Gain (Loss) | | | 2.08 | | | | 0.18 | | | | (3.86 | ) | | | (1.68 | ) | | | 1.74 | |
| Total From Investment Operations | | | 2.24 | | | | 0.27 | | | | (3.69 | ) | | | (1.44 | ) | | | 1.87 | |
| Distributions | | | | | | | | | | | | | | | | | | | | |
| From Net Investment Income | | | (0.11 | ) | | | (0.12 | ) | | | (0.23 | ) | | | (0.18 | ) | | | — | |
| From Net Realized Gains | | | — | | | | — | | | | — | | | | (0.54 | ) | | | — | |
| Total Distributions | | | (0.11 | ) | | | (0.12 | ) | | | (0.23 | ) | | | (0.72 | ) | | | — | |
| Net Asset Value, End of Period | | | $8.07 | | | | $5.94 | | | | $5.79 | | | | $9.71 | | | | $11.87 | |
| | | | | | | | | | | | | | | | | | | | | |
Total Return(3) | | | 37.80 | % | | | 4.42 | % | | | (38.00 | )% | | | (12.53 | )% | | | 18.70 | % |
| | | | | | | | | | | | | | | | | | | | | |
| Ratios/Supplemental Data | |
Ratio of Operating Expenses to Average Net Assets | | | 1.43 | % | | | 1.43 | % | | | 1.42 | % | | | 1.41 | % | | | 1.43 | %(4) |
Ratio of Net Investment Income (Loss) to Average Net Assets | | | 2.28 | % | | | 1.30 | % | | | 2.84 | % | | | 2.25 | % | | | 2.05 | %(4) |
| Portfolio Turnover Rate | | | 77 | % | | | 83 | % | | | 131 | % | | | 108 | % | | | 51 | % |
| Net Assets, End of Period (in thousands) | | | $1,019 | | | | $730 | | | | $903 | | | | $1,485 | | | | $1,226 | |
| (1) | November 30, 2006 (fund inception) through June 30, 2007. |
| (2) | Computed using average shares outstanding throughout the period. |
| (3) | Total returns are calculated based on the net asset value of the last business day and do not reflect applicable sales charges. Total returns for periods less than one year are not annualized. |
See Notes to Financial Statements.
| B Class | |
| For a Share Outstanding Throughout the Years Ended June 30 (except as noted) | |
| | | 2011 | | | 2010 | | | 2009 | | | 2008 | | | 2007(1) | |
| Per-Share Data | |
| Net Asset Value, Beginning of Period | | | $5.92 | | | | $5.77 | | | | $9.66 | | | | $11.81 | | | | $10.00 | |
| Income From Investment Operations | | | | | | | | | | | | | | | | | | | | |
Net Investment Income (Loss)(2) | | | 0.11 | | | | 0.04 | | | | 0.13 | | | | 0.15 | | | | 0.08 | |
| Net Realized and Unrealized Gain (Loss) | | | 2.06 | | | | 0.18 | | | | (3.83 | ) | | | (1.66 | ) | | | 1.73 | |
| Total From Investment Operations | | | 2.17 | | | | 0.22 | | | | (3.70 | ) | | | (1.51 | ) | | | 1.81 | |
| Distributions | | | | | | | | | | | | | | | | | | | | |
| From Net Investment Income | | | (0.05 | ) | | | (0.07 | ) | | | (0.19 | ) | | | (0.10 | ) | | | — | |
| From Net Realized Gains | | | — | | | | — | | | | — | | | | (0.54 | ) | | | — | |
| Total Distributions | | | (0.05 | ) | | | (0.07 | ) | | | (0.19 | ) | | | (0.64 | ) | | | — | |
| Net Asset Value, End of Period | | | $8.04 | | | | $5.92 | | | | $5.77 | | | | $9.66 | | | | $11.81 | |
| | | | | | | | | | | | | | | | | | | | | |
Total Return(3) | | | 36.72 | % | | | 3.64 | % | | | (38.34 | )% | | | (13.26 | )% | | | 18.20 | % |
| | | | | | | | | | | | | | | | | | | | | |
| Ratios/Supplemental Data | |
Ratio of Operating Expenses to Average Net Assets | | | 2.18 | % | | | 2.18 | % | | | 2.17 | % | | | 2.16 | % | | | 2.18 | %(4) |
Ratio of Net Investment Income (Loss) to Average Net Assets | | | 1.53 | % | | | 0.55 | % | | | 2.09 | % | | | 1.50 | % | | | 1.30 | %(4) |
| Portfolio Turnover Rate | | | 77 | % | | | 83 | % | | | 131 | % | | | 108 | % | | | 51 | % |
| Net Assets, End of Period (in thousands) | | | $936 | | | | $677 | | | | $651 | | | | $1,128 | | | | $1,208 | |
| (1) | November 30, 2006 (fund inception) through June 30, 2007. |
| (2) | Computed using average shares outstanding throughout the period. |
| (3) | Total returns are calculated based on the net asset value of the last business day and do not reflect applicable sales charges. Total returns for periods less than one year are not annualized. |
See Notes to Financial Statements.
| C Class | |
| For a Share Outstanding Throughout the Years Ended June 30 (except as noted) | |
| | | 2011 | | | 2010 | | | 2009 | | | 2008 | | | 2007(1) | |
| Per-Share Data | |
| Net Asset Value, Beginning of Period | | | $5.92 | | | | $5.77 | | | | $9.66 | | | | $11.82 | | | | $10.00 | |
| Income From Investment Operations | | | | | | | | | | | | | | | | | | | | |
Net Investment Income (Loss)(2) | | | 0.11 | | | | 0.04 | | | | 0.13 | | | | 0.15 | | | | 0.08 | |
| Net Realized and Unrealized Gain (Loss) | | | 2.06 | | | | 0.18 | | | | (3.83 | ) | | | (1.67 | ) | | | 1.74 | |
| Total From Investment Operations | | | 2.17 | | | | 0.22 | | | | (3.70 | ) | | | (1.52 | ) | | | 1.82 | |
| Distributions | | | | | | | | | | | | | | | | | | | | |
| From Net Investment Income | | | (0.05 | ) | | | (0.07 | ) | | | (0.19 | ) | | | (0.10 | ) | | | — | |
| From Net Realized Gains | | | — | | | | — | | | | — | | | | (0.54 | ) | | | — | |
| Total Distributions | | | (0.05 | ) | | | (0.07 | ) | | | (0.19 | ) | | | (0.64 | ) | | | — | |
| Net Asset Value, End of Period | | | $8.04 | | | | $5.92 | | | | $5.77 | | | | $9.66 | | | | $11.82 | |
| | | | | | | | | | | | | | | | | | | | | |
Total Return(3) | | | 36.72 | % | | | 3.64 | % | | | (38.34 | )% | | | (13.26 | )% | | | 18.20 | % |
| | | | | | | | | | | | | | | | | | | | | |
| Ratios/Supplemental Data | |
Ratio of Operating Expenses to Average Net Assets | | | 2.18 | % | | | 2.18 | % | | | 2.17 | % | | | 2.16 | % | | | 2.18 | %(4) |
Ratio of Net Investment Income (Loss) to Average Net Assets | | | 1.53 | % | | | 0.55 | % | | | 2.09 | % | | | 1.50 | % | | | 1.30 | %(4) |
| Portfolio Turnover Rate | | | 77 | % | | | 83 | % | | | 131 | % | | | 108 | % | | | 51 | % |
| Net Assets, End of Period (in thousands) | | | $956 | | | | $631 | | | | $742 | | | | $1,156 | | | | $1,231 | |
| (1) | November 30, 2006 (fund inception) through June 30, 2007. |
| (2) | Computed using average shares outstanding throughout the period. |
| (3) | Total returns are calculated based on the net asset value of the last business day and do not reflect applicable sales charges. Total returns for periods less than one year are not annualized. |
See Notes to Financial Statements.
| R Class | |
| For a Share Outstanding Throughout the Years Ended June 30 (except as noted) | |
| | | 2011 | | | 2010 | | | 2009 | | | 2008 | | | 2007(1) | |
| Per-Share Data | |
| Net Asset Value, Beginning of Period | | | $5.93 | | | | $5.78 | | | | $9.69 | | | | $11.85 | | | | $10.00 | |
| Income From Investment Operations | | | | | | | | | | | | | | | | | | | | |
Net Investment Income (Loss)(2) | | | 0.15 | | | | 0.08 | | | | 0.16 | | | | 0.20 | | | | 0.11 | |
| Net Realized and Unrealized Gain (Loss) | | | 2.07 | | | | 0.17 | | | | (3.85 | ) | | | (1.67 | ) | | | 1.74 | |
| Total From Investment Operations | | | 2.22 | | | | 0.25 | | | | (3.69 | ) | | | (1.47 | ) | | | 1.85 | |
| Distributions | | | | | | | | | | | | | | | | | | | | |
| From Net Investment Income | | | (0.09 | ) | | | (0.10 | ) | | | (0.22 | ) | | | (0.15 | ) | | | — | |
| From Net Realized Gains | | | — | | | | — | | | | — | | | | (0.54 | ) | | | — | |
| Total Distributions | | | (0.09 | ) | | | (0.10 | ) | | | (0.22 | ) | | | (0.69 | ) | | | — | |
| Net Asset Value, End of Period | | | $8.06 | | | | $5.93 | | | | $5.78 | | | | $9.69 | | | | $11.85 | |
| | | | | | | | | | | | | | | | | | | | | |
Total Return(3) | | | 37.52 | % | | | 4.16 | % | | | (38.13 | )% | | | (12.78 | )% | | | 18.50 | % |
| | | | | | | | | | | | | | | | | | | | | |
| Ratios/Supplemental Data | |
Ratio of Operating Expenses to Average Net Assets | | | 1.68 | % | | | 1.68 | % | | | 1.67 | % | | | 1.66 | % | | | 1.68 | %(4) |
Ratio of Net Investment Income (Loss) to Average Net Assets | | | 2.03 | % | | | 1.05 | % | | | 2.59 | % | | | 2.00 | % | | | 1.80 | %(4) |
| Portfolio Turnover Rate | | | 77 | % | | | 83 | % | | | 131 | % | | | 108 | % | | | 51 | % |
| Net Assets, End of Period (in thousands) | | | $988 | | | | $682 | | | | $652 | | | | $1,051 | | | | $1,203 | |
| (1) | November 30, 2006 (fund inception) through June 30, 2007. |
| (2) | Computed using average shares outstanding throughout the period. |
| (3) | Total returns are calculated based on the net asset value of the last business day. Total returns for periods less than one year are not annualized. |
See Notes to Financial Statements.
Report of Independent Registered Public Accounting Firm |
To the Directors of the American Century Quantitative Equity Funds, Inc. and Shareholders of the International Core Equity Fund:
In our opinion, the accompanying statement of assets and liabilities, including the schedule of investments, and the related statements of operations and of changes in net assets and the financial highlights present fairly, in all material respects, the financial position of the International Core Equity Fund (one of the eleven funds comprising the American Century Quantitative Equity Funds, Inc., hereafter referred to as the “Fund”) at June 30, 2011, the results of its operations for the year then ended, the changes in its net assets for each of the two years in the period then ended and the financial highlights for each of the periods presented, in conformity with accounting principles generally accepted in the United States of America. These financial statements and financial highlights (hereafter referred to as “financial statements”) are the responsibility of the Fund’s management; our responsibility is to express an opinion on these financial statements based on our audits. We conducted our audits of these financial statements in accordance with the standards of the Public Company Accounting Oversight Board (United States). Those standards require that we plan and perform the audit to obtain reasonable assurance about whether the financial statements are free of material misstatement. An audit includes examining, on a test basis, evidence supporting the amounts and disclosures in the financial statements, assessing the accounting principles used and significant estimates made by management, and evaluating the overall financial statement presentation. We believe that our audits, which included confirmation of securities at June 30, 2011 by correspondence with the custodian, provide a reasonable basis for our opinion.
PricewaterhouseCoopers LLP
Kansas City, Missouri
August 18, 2011
Board of Directors
The individuals listed below serve as directors of the funds. Each director will continue to serve in this capacity until death, retirement, resignation or removal from office. The mandatory retirement age for directors who are not “interested persons,” as that term is defined in the Investment Company Act (independent directors), is 73. However, the mandatory retirement age may be extended for a period not to exceed two years with the approval of the remaining independent directors.
Mr. Thomas is the only director who is an “interested person” because he currently serves as President and Chief Executive Officer of American Century Companies, Inc. (ACC), the parent company of American Century Investment Management, Inc. (ACIM or the advisor).
The other directors (more than three-fourths of the total number) are independent; that is, they have never been employees, directors or officers of, and have no financial interest in, ACC or any of its wholly owned, direct or indirect, subsidiaries, including ACIM, American Century Investment Services, Inc. (ACIS) and American Century Services, LLC (ACS). The directors serve in this capacity for eight (in the case of Mr. Thomas, 15) registered investment companies in the American Century Investments family of funds.
The following presents additional information about the directors. The mailing address for each director other than Mr. Thomas is 1665 Charleston Road, Mountain View, California 94043. The mailing address for Mr. Thomas is 4500 Main Street, Kansas City, Missouri 64111.
| | | | | | |
Name (Year of Birth) | Position(s) Held with Funds | Length of Time Served | Principal Occupation(s) During Past 5 Years | Number of American Century Portfolios Overseen by Director | Other Directorships Held During Past 5 Years |
| Independent Directors |
Tanya S. Beder (1955) | Director | Since 2011 | Chairman, SBCC Group Inc. (investment advisory services) (2006 to present); Fellow in Practice, International Center for Finance, Yale University School of Management (1985 to present); Chief Executive Officer, Tribeca Global Management LLC (asset management firm) (2004 to 2006) | 40 | None |
Jeremy I. Bulow (1954) | Director | Since 2011 | Professor of Economics, Stanford University, Graduate School of Business (1979 to present) | 40 | None |
John Freidenrich (1937) | Director | Since 2005 | Founder, Member and Manager, Regis Management Company, LLC (investment management firm) (April 2004 to present) | 40 | None |
| | | | | | |
Name (Year of Birth) | Position(s) Held with Funds | Length of Time Served | Principal Occupation(s) During Past 5 Years | Number of American Century Portfolios Overseen by Director | Other Directorships Held During Past 5 Years |
| Independent Directors |
Ronald J. Gilson (1946) | Director and Chairman of the Board | Since 1995 | Charles J. Meyers Professor of Law and Business, Stanford Law School (1979 to present); Marc and Eva Stern Professor of Law and Business, Columbia University School of Law (1992 to present) | 40 | None |
Frederick L. A. Grauer (1946) | Director | Since 2008 | Senior Advisor, BlackRock, Inc. (investment management firm) (2010 to 2011); Senior Advisor, Barclays Global Investors (investment management firm) (2003 to 2009) | 40 | None |
Peter F. Pervere (1947) | Director | Since 2007 | Retired | 40 | Intraware, Inc. (2003 to 2009) |
Myron S. Scholes (1941) | Director | Since 1980 | Chairman, Platinum Grove Asset Management, L.P. (asset manager) (1999 to 2009); Frank E. Buck Professor of Finance-Emeritus, Stanford Graduate School of Business (1996 to present) | 40 | Dimensional Fund Advisors (investment advisor); CME Group, Inc. (futures and options exchange) |
John B. Shoven (1947) | Director | Since 2002 | Professor of Economics, Stanford University (1973 to present) | 40 | Cadence Design Systems; Exponent; Financial Engines; Watson Wyatt Worldwide (2002 to 2006) |
| |
| Interested Director |
Jonathan S. Thomas (1963) | Director and President | Since 2007 | President and Chief Executive Officer, ACC (March 2007 to present); Chief Administrative Officer, ACC (February 2006 to February 2007); Executive Vice President, ACC (November 2005 to February 2007). Also serves as: Chief Executive Officer and Manager, ACS; Executive Vice President, ACIM; Director, ACC, ACIM and other ACC subsidiaries | 104 | None |
Officers
The following table presents certain information about the executive officers of the funds. Each officer serves as an officer for each of the 15 investment companies in the American Century family of funds, unless otherwise noted. No officer is compensated for his or her service as an officer of the funds. The listed officers are interested persons of the funds and are appointed or re-appointed on an annual basis. The mailing address for each of the officers listed below is 4500 Main Street, Kansas City, Missouri 64111.
| | | |
Name (Year of Birth) | Offices with the Funds | Principal Occupation(s) During the Past Five Years |
Jonathan S. Thomas (1963) | Director and President since 2007 | President and Chief Executive Officer, ACC (March 2007 to present); Chief Administrative Officer, ACC (February 2006 to February 2007); Executive Vice President, ACC (November 2005 to February 2007). Also serves as: Chief Executive Officer and Manager, ACS; Executive Vice President, ACIM; Director, ACC, ACIM and other ACC subsidiaries |
Barry Fink (1955) | Executive Vice President since 2007 | Chief Operating Officer and Executive Vice President, ACC (September 2007 to present); President, ACS (October 2007 to present); Managing Director, Morgan Stanley (2000 to 2007); Global General Counsel, Morgan Stanley (2000 to 2006). Also serves as: Manager, ACS and Director, ACC and certain ACC subsidiaries |
Maryanne L. Roepke (1956) | Chief Compliance Officer since 2006 and Senior Vice President since 2000 | Chief Compliance Officer, American Century funds, ACIM and ACS (August 2006 to present); Assistant Treasurer, ACC (January 1995 to August 2006); and Treasurer and Chief Financial Officer, various American Century funds (July 2000 to August 2006). Also serves as: Senior Vice President, ACS |
Charles A. Etherington (1957) | General Counsel since 2007 and Senior Vice President since 2006 | Attorney, ACC (February 1994 to present); Vice President, ACC (November 2005 to present), General Counsel, ACC (March 2007 to present); Also serves as General Counsel, ACIM, ACS, ACIS and other ACC subsidiaries; and Senior Vice President, ACIM and ACS |
Robert J. Leach (1966) | Vice President, Treasurer and Chief Financial Officer since 2006 | Vice President, ACS (February 2000 to present); and Controller, various American Century funds (1997 to September 2006) |
David H. Reinmiller (1963) | Vice President since 2001 | Attorney, ACC (January 1994 to present); Associate General Counsel, ACC (January 2001 to present); Also serves as Vice President, ACIM and ACS |
Ward D. Stauffer (1960) | Secretary since 2005 | Attorney, ACC (June 2003 to present) |
The Statement of Additional Information has additional information about the fund’s directors and is available without charge, upon request, by calling 1-800-345-2021.
| Approval of Management Agreement |
At a meeting held on June 28, 2011, the Fund’s Board of Directors/Trustees unanimously approved the renewal of the management agreement pursuant to which American Century Investment Management, Inc. (the “Advisor”) acts as the investment advisor for the Fund. Under Section 15(c) of the Investment Company Act, contracts for investment advisory services are required to be reviewed, evaluated, and approved by a majority of a fund’s independent directors/trustees (the “Directors”) each year.
As a part of the approval process, the Board requested and reviewed extensive data and information compiled by the Advisor and certain independent providers of evaluation data concerning the Fund and the services provided to the Fund by the Advisor. This review was in addition to the oversight and evaluation undertaken by the Board and its committees on a continuous basis throughout the year and included, but was not limited to the following:
| • | the nature, extent, and quality of investment management, shareholder services, and other services provided by the Advisor to the Fund; |
| • | the wide range of other programs and services the Advisor provides to the Fund and its shareholders on a routine and non-routine basis; |
| • | the investment performance of the fund, including data comparing the Fund’s performance to appropriate benchmarks and/or a peer group of other mutual funds with similar investment objectives and strategies; |
| • | data comparing the cost of owning the Fund to the cost of owning similar funds; |
| • | the Advisor’s compliance policies, procedures, and regulatory experience; |
| • | financial data showing the cost of services provided to the Fund, the profitability of the Fund to the Advisor, and the overall profitability of the Advisor; |
| • | data comparing services provided and charges to other investment management clients of the Advisor; and |
| • | consideration of collateral benefits derived by the Advisor from the management of the Fund and any potential economies of scale relating thereto. |
In keeping with its practice, the Board held two in-person meetings and one telephonic meeting to review and discuss the information provided. The Board also had the benefit of the advice of its independent counsel throughout the period.
Factors Considered
The Directors considered all of the information provided by the Advisor, the independent data providers, and the Board’s independent counsel, and evaluated such information for the Fund. In connection with their review, the Directors did not identify any single factor as being all-important or controlling, and each
Director may have attributed different levels of importance to different factors. In deciding to renew the management agreement, the Board based its decision on a number of factors, including the following:
Nature, Extent and Quality of Services - Generally. Under the management agreement, the Advisor is responsible for providing or arranging for all services necessary for the operation of the Fund. The Board noted that under the management agreement, the Advisor provides or arranges at its own expense a wide variety of services including:
| • | constructing and designing the Fund |
| • | portfolio research and security selection |
| • | initial capitalization/funding |
| • | daily valuation of the Fund’s portfolio |
| • | shareholder servicing and transfer agency, including shareholder confirmations, recordkeeping, and communications |
| • | regulatory and portfolio compliance |
| • | marketing and distribution |
The Board noted that many of these services have expanded over time both in terms of quantity and complexity in response to shareholder demands, competition in the industry, changing distribution channels, and the changing regulatory environment.
Investment Management Services. The nature of the investment management services provided to the Fund is quite complex and allows Fund shareholders access to professional money management, instant diversification of their investments within an asset class, the opportunity to easily diversify among asset classes by investing in or exchanging among various American Century Investments funds, and liquidity. In evaluating investment performance, the Board expects the Advisor to manage the Fund in accordance with its investment objectives and approved strategies. Further, the Directors recognize that the Advisor has an obligation to seek the best execution of fund trades. In providing these services,
the Advisor utilizes teams of investment professionals (portfolio managers, analysts, research assistants, and securities traders) who require extensive information technology, research, training, compliance and other systems to conduct their business. The Board, directly and through its Portfolio Committee, regularly reviews investment performance information for the Fund, together with comparative information for appropriate benchmarks and/or peer groups of similarly-managed funds, over different time horizons. The Directors also review detailed performance information during the management agreement approval process. If performance concerns are identified, the Fund receives special reviews until performance improves, during which the Board discusses with the Advisor the reasons for such results (e.g., market conditions, security selection) and any efforts being undertaken to improve performance. The Board found the investment management services provided by the Advisor to the Fund to meet or exceed industry standards. More detailed information about the Fund’s performance can be found in the Performance and Portfolio Commentary sections of this report.
Shareholder and Other Services. Under the management agreement, the Advisor provides the Fund with a comprehensive package of transfer agency, shareholder, and other services. The Board, directly and through various committees of the Board, regularly reviews reports and evaluations of such services at its regular meetings. These reports include, but are not limited to, information regarding the operational efficiency and accuracy of the shareholder and transfer agency services provided, staffing levels, shareholder satisfaction (as measured by external as well as internal sources), technology support, new products and services offered to Fund shareholders, securities trading activities, portfolio valuation services, auditing services, and legal and operational compliance activities. Certain aspects of shareholder and transfer agency service level efficiency and the quality of securities trading activities are measured by independent third party providers and are presented in comparison to other fund groups not managed by the Advisor. The Board found the services provided by the Advisor to the Fund under the management agreement to be competitive and of high quality.
Costs of Services and Profitability. The Advisor provides detailed information concerning its cost of providing various services to the Fund, its profitability in managing the Fund, its overall profitability, and its financial condition. The Directors have reviewed with the Advisor the methodology used to prepare this financial information. The financial information regarding the Advisor is considered in evaluating the Advisor’s financial condition, ability to continue to provide services under the management agreement, and the reasonableness of the current management fee. The Board concluded that the Advisor’s profits were reasonable in light of the services provided to the Fund.
Ethics. The Board generally considers the Advisor’s commitment to providing quality services to shareholders and to conducting its business ethically. They noted that the Advisor’s practices generally meet or exceed industry best practices.
Economies of Scale. The Board also reviewed information provided by the Advisor regarding the possible existence of economies of scale in connection with the management of the Fund. The Board concluded that economies of scale are
difficult to measure and predict with precision, especially on a fund-by-fund basis. The Board concluded that the Advisor is appropriately sharing economies of scale through its competitive fee structure, offering competitive fees from fund inception, and through reinvestment in its business to provide shareholders additional content and services.
Comparison to Other Funds’ Fees. The management agreement provides that the Fund pay the Advisor a single, all-inclusive (or unified) management fee for providing all services necessary for the management and operation of the Fund, other than brokerage expenses, taxes, interest, extraordinary expenses, and the fees and expenses of the Fund’s independent directors (including their independent legal counsel) and expenses incurred in connection with the provision of shareholder services and distribution services under a plan adopted pursuant to Rule 12b-1 under the 1940 Act. Under the unified fee structure, the Advisor is responsible for providing all investment advisory, custody, audit, administrative, compliance, recordkeeping, marketing and shareholder services, or arranging and supervising third parties to provide such services. By contrast, most other funds are charged a variety of fees, including an investment advisory fee, a transfer agency fee, an administrative fee, distribution charges and other expenses. Other than their investment advisory fees and any applicable Rule 12b-1 distribution fees, all other components of the total fees charged by these other funds may be increased without shareholder approval. The Board believes the unified fee structure is a benefit to Fund shareholders because it clearly discloses to shareholders the cost of owning Fund shares, and, since the unified fee cannot be increased without a vote of Fund shareholders, it shifts to the Advisor the risk of increased costs of operating the Fund and provides a direct incentive to minimize administrative inefficiencies. Part of the Board’s analysis of fee levels involves reviewing certain evaluative data compiled by an independent provider and comparing the Fund’s unified fee to the total expense ratio of other funds in the Fund’s peer group. The Board concluded that the management fee paid by the Fund to the Advisor under the management agreement is reasonable in light of the services provided to the Fund.
Comparison to Fees and Services Provided to Other Clients of the Advisor. The Board also requested and received information from the Advisor concerning the nature of the services, fees, costs and profitability of its advisory services to advisory clients other than the Fund. They observed that these varying types of client accounts require different services and involve different regulatory and entrepreneurial risks than the management of the Fund. The Board analyzed this information and concluded that the fees charged and services provided to the Fund were reasonable by comparison.
Collateral or “Fall-Out” Benefits Derived by the Advisor. The Board considered the existence of collateral benefits the Advisor may receive as a result of its relationship with the Fund. They concluded that the Advisor’s primary business is managing mutual funds and it generally does not use fund or shareholder information to generate profits in other lines of business, and therefore does not derive any significant collateral benefits from them. The Board noted that the Advisor receives proprietary research from broker-dealers that execute fund
portfolio transactions and concluded that this research is likely to benefit Fund shareholders. The Board also determined that the Advisor is able to provide investment management services to certain clients other than the Fund, at least in part, due to its existing infrastructure built to serve the fund complex. The Board concluded, however, that the assets of those other clients are not material to the analysis and, where applicable, may be included with the assets of the Fund to determine breakpoints in the management fee schedule.
Existing Relationship. The Board also considered whether there was any reason for not continuing the existing arrangement with the Advisor. In this regard, the Board was mindful of the potential disruptions of the Fund’s operations and various risks, uncertainties, and other effects that could occur as a result of a decision not to continue such relationship. In particular, the Board recognized that most shareholders have invested in the Fund on the strength of the Advisor’s industry standing and reputation and in the expectation that the Advisor will have a continuing role in providing advisory services to the Fund.
Conclusion of the Directors. As a result of this process, the Board, including all of the independent directors and assisted by the advice of independent legal counsel, taking into account all of the factors discussed above and the information provided by the Advisor and others, concluded that the management agreement between the Fund and the Advisor is fair and reasonable in light of the services provided and should be renewed.
Retirement Account Information
As required by law, distributions you receive from certain IRAs, or 403(b), 457 and qualified plans are subject to federal income tax withholding, unless you elect not to have withholding apply. Tax will be withheld on the total amount withdrawn even though you may be receiving amounts that are not subject to withholding, such as nondeductible contributions. In such case, excess amounts of withholding could occur. You may adjust your withholding election so that a greater or lesser amount will be withheld.
If you don’t want us to withhold on this amount, you must notify us to not withhold the federal income tax. You may notify us in writing or in certain situations by telephone or through other electronic means. You have the right to revoke your withholding election at any time and any election you make may remain in effect until revoked by filing a new election.
Remember, even if you elect not to have income tax withheld, you are liable for paying income tax on the taxable portion of your withdrawal. If you elect not to have income tax withheld or you don’t have enough income tax withheld, you may be responsible for payment of estimated tax. You may incur penalties under the estimated tax rules if your withholding and estimated tax payments are not sufficient. You can reduce or defer the income tax on a distribution by directly or indirectly rolling such distribution over to another IRA or eligible plan. You should consult your tax advisor for additional information.
State tax will be withheld if, at the time of your distribution, your address is within one of the mandatory withholding states and you have federal income tax withheld. State taxes will be withheld from your distribution in accordance with the respective state rules.
Proxy Voting Guidelines
American Century Investment Management, Inc., the fund’s investment advisor, is responsible for exercising the voting rights associated with the securities purchased and/or held by the fund. A description of the policies and procedures the advisor uses in fulfilling this responsibility is available without charge, upon request, by calling 1-800-345-2021. It is also available on American Century Investments’ website at americancentury.com and on the Securities and Exchange Commission’s website at sec.gov. Information regarding how the investment advisor voted proxies relating to portfolio securities during the most recent 12-month period ended June 30 is available on the “About Us” page at americancentury.com. It is also available at sec.gov.
Quarterly Portfolio Disclosure
The fund files its complete schedule of portfolio holdings with the Securities and Exchange Commission (SEC) for the first and third quarters of each fiscal year on Form N-Q. The fund’s Forms N-Q are available on the SEC’s website at sec.gov, and may be reviewed and copied at the SEC’s Public Reference Room in Washington, DC. Information on the operation of the Public Reference Room may be obtained by calling 1-800-SEC-0330. The fund also makes its complete schedule of portfolio holdings for the most recent quarter of its fiscal year available on its website at americancentury.com and, upon request, by calling 1-800-345-2021.
Other Tax Information
The following information is provided pursuant to provisions of the Internal Revenue Code.
The fund hereby designates up to the maximum amount allowable as qualified dividend income for the fiscal year ended June 30, 2011.
For the fiscal year ended June 30, 2011, the fund intends to pass through to shareholders $18,345, or up to the maximum amount allowable, as a foreign tax credit which represents taxes paid on income derived from sources within foreign countries or possessions of the United States. During the fiscal year ended June 30, 2011, the fund earned $259,938 from income derived from foreign sources. Foreign source income and foreign tax expense per outstanding share on June 30, 2011 are $0.2700 and $0.0191, respectively.
| Contact Us | americancentury.com |
| Automated Information Line | 1-800-345-8765 |
| Investor Services Representative | 1-800-345-2021 or 816-531-5575 |
| Investors Using Advisors | 1-800-378-9878 |
| Business, Not-For-Profit, Employer-Sponsored Retirement Plans | 1-800-345-3533 |
| Banks and Trust Companies, Broker-Dealers, Financial Professionals, Insurance Companies | 1-800-345-6488 |
| Telecommunications Device for the Deaf | 1-800-634-4113 |
American Century Quantitative Equity Funds, Inc.
Investment Advisor:
American Century Investment Management, Inc.
Kansas City, Missouri
This report and the statements it contains are submitted for the general information of our shareholders. The report is not authorized for distribution to prospective investors unless preceded or accompanied by an effective prospectus.
©2011 American Century Proprietary Holdings, Inc. All rights reserved.
CL-ANN-72452 1108
ANNUAL REPORT JUNE 30, 2011
| President’s Letter | 2 |
| Market Perspective | 3 |
| Performance | 4 |
| Portfolio Commentary | 5 |
| Fund Characteristics | 7 |
| Shareholder Fee Example | 8 |
| Schedule of Investments | 10 |
| Statement of Assets and Liabilities | 14 |
| Statement of Operations | 15 |
| Statement of Changes in Net Assets | 16 |
| Notes to Financial Statements | 17 |
| Financial Highlights | 21 |
| Report of Independent Registered Public Accounting Firm | 22 |
| Management | 23 |
| Approval of Management Agreement | 26 |
| Additional Information | 31 |
Any opinions expressed in this report reflect those of the author as of the date of the report, and do not necessarily represent the opinions of American Century Investments® or any other person in the American Century Investments organization. Any such opinions are subject to change at any time based upon market or other conditions and American Century Investments disclaims any responsibility to update such opinions. These opinions may not be relied upon as investment advice and, because investment decisions made by American Century Investments funds are based on numerous factors, may not be relied upon as an indication of trading intent on behalf of any American Century Investments fund. Security examples are used for representational purposes only and are not intended as recommendations to purchase or sell securities. Performance information for comparative indices and securities is provided to American Century Investments by third party vendors. To the best of American Century Investments’ knowledge, such information is accurate at the time of printing.
Dear Investor:
Thank you for reviewing this annual report for the period ended June 30, 2011. Our report offers investment performance and portfolio information, presented with the expert perspective and commentary of our portfolio management team.
This report remains one of our most important vehicles for conveying information about investment performance and the market factors and strategies that affect fund returns. For additional, updated information on fund performance, portfolio strategy, and the investment markets, we encourage you to visit our website, americancentury.com. Click on the “Fund Performance” and “Insights & News” headings at the top of our Individual Investors site.
Reporting Period Perspective: Highest Broad Fiscal-Year U.S. Stock Returns Since 1997
Benefitting from favorable conditions and expectations, the U.S. stock market produced exceptional returns, the highest for any 12-month period ended June 30 since the fiscal year ended June 30, 1997. Back then, the S&P 500 Index gained 34.71%, compared with 30.69% for the most-recent reporting period. The intervening 14 years help illustrate how infrequently such a high level of performance occurs, requiring an alignment of economic and market conditions that’s difficult to duplicate.
The exceptional returns experienced during the reporting period represent a rebound from previous declines. After experiencing 10–12% declines during the second quarter of 2010—stemming from the European sovereign debt crisis and double-dip recession fears—most broad U.S. stock indices advanced 30% or more during the following 12 months. Monetary and fiscal intervention in 2010 stimulated growth and fueled investor optimism about economic and financial market conditions in 2011 and 2012, encouraging investments in riskier assets.
However, that optimism has diminished in the summer of 2011 as the European debt crisis returned to prominence and other debt and economic challenges emerged. As the reporting period came to a close in June 2011, we saw increasing signs that the U.S. economic recovery had lost momentum. As a result, economic growth forecasts were reduced, and broad U.S. stock indices trended downward beginning in May. As we enter the third quarter of 2011, investor concern over fiscal austerity measures in the U.S. and other developed economies raised fears of a return to recession and accelerated a decline in global equity markets. We appreciate your continued trust in us during these uncertain times.
Sincerely,
Jonathan Thomas
President and Chief Executive Officer
American Century Investments
By Scott Wittman, Chief Investment Officer, Quantitative Equity and Asset Allocation
U.S. Stocks Soared as Economy Improved
The U.S. stock market enjoyed very strong results for the 12 months ended June 30, 2011, with the broad equity indices returning more than 30%. The main catalyst for the sharp rally in stocks was growing investor confidence in a U.S. economic recovery, though that confidence faltered somewhat late in the period.
After a bumpy start resulting from an uncertain economic outlook, the equity market began a steady rise in September 2010 as improving economic data reassured investors that the economy would avoid a “double-dip” recession (a return to recession after a brief period of recovery). Most notably, employment growth turned positive after 2½ years of persistent job losses, and the manufacturing sector showed signs of life. In addition, a renewal of the Federal Reserve’s quantitative easing program and an extension of expiring federal tax breaks further boosted the market’s confidence that a promising economic recovery
was under way.
Stocks continued to advance in early 2011 despite unrest in the Middle East and North Africa, as well as a devastating earthquake and tsunami in Japan. By May, however, evidence of a slowdown in economic activity and renewed concerns about a European sovereign debt crisis weighed on investor confidence. As a result, stocks experienced a modest pullback in the final two months of the period.
Smaller Stocks and Growth-Oriented Issues Outperformed
Despite finishing on a down note, the broad equity indices posted robust returns overall for the 12-month period. As the table below illustrates, mid- and small-cap issues generated the best returns, outpacing large-cap shares. Meanwhile, growth stocks outperformed value across all market capitalizations, most dramatically among smaller companies. Every sector of the market produced double-digit gains for the period, led by energy and materials stocks, which benefited from strong demand and rising commodity prices. Other economically sensitive sectors—such as consumer discretionary and industrials—also fared well. The laggard was the financials sector, which continued to face mortgage-related challenges and regulatory uncertainty.
| U.S. Stock Index Returns |
| For the 12 months ended June 30, 2011 |
| Russell 1000 Index (Large-Cap) | 31.93% | | Russell 2000 Index (Small-Cap) | 37.41% |
| Russell 1000 Growth Index | 35.01% | | Russell 2000 Growth Index | 43.50% |
| Russell 1000 Value Index | 28.94% | | Russell 2000 Value Index | 31.35% |
| Russell Midcap Index | 38.47% | | |
| Russell Midcap Growth Index | 43.25% | | | |
| Russell Midcap Value Index | 34.28% | | | |
| Total Returns as of June 30, 2011 |
| | | | Average Annual Returns | |
| | Ticker Symbol | 1 year(1) | 5 years | Since Inception | Inception Date |
| Institutional Class | ACLEX | 31.45% | 2.34% | 2.04% | 5/12/06 |
| S&P 500 Index | — | 30.69% | 2.94% | 2.29%(2) | — |
| (1) | Extraordinary performance is attributable in part to unusually favorable market conditions and may not be repeated or consistently achieved in the future. |
| (2) | Since 4/30/06, the date nearest the Institutional Class’s inception for which data are available. |
| Growth of $10,000 Over Life of Class |
| $10,000 investment made May 12, 2006 |
| * | From 5/12/06, the Institutional Class’s inception date. Index data from 4/30/06, the date nearest the Institutional Class’s inception for which data are available. Not annualized. |
| Total Annual Fund Operating Expenses |
Institutional Class 0.50% |
The total annual fund operating expenses shown is as stated in the fund’s prospectus current as of the date of this report. The prospectus may vary from the expense ratio shown elsewhere in this report because it is based on a different time period, includes acquired fund fees and expenses, and, if applicable, does not include fee waivers or expense reimbursements.
Data presented reflect past performance. Past performance is no guarantee of future results. Current performance may be higher or lower than the performance shown. Investment return and principal value will fluctuate, and redemption value may be more or less than original cost. To obtain performance data current to the most recent month end, please call 1-800-345-2021 or visit americancentury.com.
Data assumes reinvestment of dividends and capital gains, and none of the charts reflect the deduction of taxes that a shareholder would pay on fund distributions or the redemption of fund shares. Returns for the index are provided for comparison. The fund’s total returns include operating expenses (such as transaction costs and management fees) that reduce returns, while the total returns of the index do not.
Portfolio Managers: Bill Martin and Claudia Musat
Performance Summary
NT Equity Growth returned 31.45% for the fiscal year ended June 30, 2011, compared with the 30.69% return of its benchmark, the S&P 500 Index.
NT Equity Growth posted a strong absolute return for the 12 months, reflecting a robust stock market rally during the period (see page 3 for details). The fund also outperformed the S&P 500 thanks to individual stock selection, a critical component of our investment process.
Energy and Consumer Discretionary Boosted Absolute Results
On an absolute basis, NT Equity Growth’s holdings in the energy and consumer discretionary sectors were the best performers. The fund’s energy stocks returned more than 50% as a group for the 12-month period, and three of the top six performance contributors came from this sector—oil and gas producers Exxon Mobil, Chevron, and ConocoPhillips. In the consumer discretionary sector, the leading performers included auto parts maker TRW Automotive and off-road vehicle manufacturer Polaris Industries, each of which gained more than 100% for the 12 months.
The fund’s health care holdings also performed well during the reporting period. The best contributors in this sector included biotechnology firm Biogen Idec and health care provider UnitedHealth Group.
The only sector within the portfolio to post a single-digit gain for the 12-month period was utilities. The most significant detractors included independent power producer Constellation Energy and electric utility Entergy. The fund’s holdings in the financials sector also lagged, producing the three biggest negative contributors to absolute performance—financial services providers Bank of America and Citigroup, and capital markets firm Morgan Stanley.
Health Care Outperformed
Looking at relative performance, NT Equity Growth’s holdings in the health care sector contributed the most to the fund’s outperformance of the S&P 500 for the fiscal year. The fund’s health care holdings returned more than 40% as a group, while their counterparts in the index returned just over 28%.
The bulk of the outperformance resulted from stock selection among biotechnology firms and health care providers. Leading contributors included biotech company Biogen Idec, which saw earnings expectations rise thanks to robust sales of its multiple sclerosis medications, and drug maker Endo Pharmaceuticals, which benefited from favorable acquisitions. Health care providers Humana and UnitedHealth Group rallied as subscriber growth increased and costs declined.
Financials and Consumer Discretionary Also Added Value
Stock selection in the financials and consumer discretionary sectors also contributed favorably to relative results. When it comes to stock selection, underweighting stocks that don’t perform well is just as important as overweighting stocks that do perform well, and this was a key factor in the outperformance of the fund’s financials holdings. Compared with the index, the fund held
an underweight position in insurance giant Berkshire Hathaway, which fell modestly during the 12 months as the company’s chief investment officer resigned abruptly.
In the consumer discretionary sector, the top absolute performance contributors were also the top relative contributors—TRW Automotive and Polaris Industries. TRW continued to benefit from a recovery in the auto industry, while Polaris enjoyed rising demand for its off-road vehicles and motorcycles.
The most important individual investment decision versus the index for the reporting period was an underweight position in network products maker Cisco Systems, which tumbled by more than 25% as the company lowered its growth projections for the coming year amid growing competition in its core markets.
Utilities and Industrials Detracted
NT Equity Growth’s holdings in the utilities and information technology sectors underperformed their counterparts in the S&P 500 for the 12-month period. An overweight position in independent power producers contributed the bulk of the underperformance in the utilities sector. The most notable detractors included energy producers Constellation Energy and NRG Energy, both of which repeatedly failed to meet earnings expectations, leading us to exit the stocks.
Stock choices among computer hardware makers and semiconductor manufacturers were responsible for virtually all of the underperformance in the information technology sector. Printer maker Lexmark International was the fund’s most significant individual detractor; the company reported lower-than-expected earnings as increased competition led to weaker sales and declining prices. Another poor performer was IT services provider Computer Sciences, which tumbled late in the period as a decline in government spending led to an earnings disappointment.
A Look Ahead
The eye-catching turmoil in the headlines over the last six months—democratic change sweeping through the Middle East, a devastating natural disaster in Japan, the possibility of a sovereign debt default in Europe—has led to heightened uncertainty and growing volatility in the equity market. But when you look at the past decade, there have been many other dramatic events that have had a similar impact on the market. When viewed through this lens, change and volatility have become more the rule than the exception.
It is this change dynamic that our investment process seeks to exploit and capitalize upon. Change and volatility leads to market inefficiencies, and within these inefficiencies lie investment opportunities. Rather than base investment decisions on vague financial headlines, we use our disciplined, data-driven, multi-factor investment process to take advantage of inefficiencies at the individual company level. We believe this approach will produce favorable returns over the long term.
| JUNE 30, 2011 |
| Top Ten Holdings | % of net assets |
| Exxon Mobil Corp. | 3.8% |
| International Business Machines Corp. | 2.5% |
| Chevron Corp. | 2.5% |
| Johnson & Johnson | 2.5% |
| Microsoft Corp. | 2.3% |
| General Electric Co. | 2.0% |
| Apple, Inc. | 2.0% |
| AT&T, Inc. | 1.9% |
| Wells Fargo & Co. | 1.8% |
| Intel Corp. | 1.8% |
| | |
| Top Five Industries | % of net assets |
| Oil, Gas & Consumable Fuels | 11.6% |
| Pharmaceuticals | 6.3% |
| IT Services | 4.9% |
| Insurance | 4.8% |
| Software | 4.5% |
| | |
| Types of Investments in Portfolio | % of net assets |
| Common Stocks | 99.5% |
| Temporary Cash Investments | 0.6% |
| Other Assets and Liabilities | (0.1)% |
Fund shareholders may incur two types of costs: (1) transaction costs, including sales charges (loads) on purchase payments and redemption/exchange fees; and (2) ongoing costs, including management fees; distribution and service (12b-1) fees; and other fund expenses. This example is intended to help you understand your ongoing costs (in dollars) of investing in your fund and to compare these costs with the ongoing cost of investing in other mutual funds.
The example is based on an investment of $1,000 made at the beginning of the period and held for the entire period from January 1, 2011 to June 30, 2011.
Actual Expenses
The table provides information about actual account values and actual expenses for each class. You may use the information, together with the amount you invested, to estimate the expenses that you paid over the period. First, identify the share class you own. Then simply divide your account value by $1,000 (for example, an $8,600 account value divided by $1,000 = 8.6), then multiply the result by the number under the heading “Expenses Paid During Period” to estimate the expenses you paid on your account during this period.
If you hold Investor Class shares of any American Century Investments fund, or Institutional Class shares of the American Century Diversified Bond Fund, in an American Century Investments account (i.e., not a financial intermediary or retirement plan account), American Century Investments may charge you a $12.50 semiannual account maintenance fee if the value of those shares is less than $10,000. We will redeem shares automatically in one of your accounts to pay the $12.50 fee. In determining your total eligible investment amount, we will include your investments in all personal accounts (including American Century Investments Brokerage accounts) registered under your Social Security number. Personal accounts include individual accounts, joint accounts, UGMA/UTMA accounts, personal trusts, Coverdell Education Savings Accounts and IRAs (including traditional, Roth, Rollover, SEP-, SARSEP- and SIMPLE-IRAs), and certain other retirement accounts. If you have only business, business retirement, employer-sponsored or American Century Investments Brokerage accounts, you are currently not subject to this fee. We will not charge the fee as long as you choose to manage your accounts exclusively online. If you are subject to the Account Maintenance Fee, your account value could be reduced by the fee amount.
Hypothetical Example for Comparison Purposes
The table also provides information about hypothetical account values and hypothetical expenses based on the actual expense ratio of each class of your fund and an assumed rate of return of 5% per year before expenses, which is not the actual return of a fund’s share class. The hypothetical account values and expenses may not be used to estimate the actual ending account balance or expenses you paid for the period. You may use this information to compare the ongoing costs of investing in your fund and other funds. To do so, compare this 5% hypothetical example with the 5% hypothetical examples that appear in the shareholder reports of the other funds.
Please note that the expenses shown in the table are meant to highlight your ongoing costs only and do not reflect any transactional costs, such as sales charges (loads) or redemption/exchange fees. Therefore, the table is useful in comparing ongoing costs only, and will not help you determine the relative total costs of owning different funds. In addition, if these transactional costs were included, your costs would have been higher.
| | | | | |
| | Beginning Account Value 1/1/11 | Ending Account Value 6/30/11 | Expenses Paid During Period* 1/1/11 – 6/30/11 | Annualized Expense Ratio* |
| Actual | | | | |
| Institutional Class | $1,000 | $1,076.40 | $2.47 | 0.48% |
| Hypothetical | | | | |
| Institutional Class | $1,000 | $1,022.41 | $2.41 | 0.48% |
| * | Expenses are equal to the class’s annualized expense ratio listed in the table above, multiplied by the average account value over the period, multiplied by 181, the number of days in the most recent fiscal half-year, divided by 365, to reflect the one-half year period. |
| | | |
| | Shares | Value |
| Common Stocks — 99.5% |
| AEROSPACE & DEFENSE — 3.0% |
| General Dynamics Corp. | 66,470 | $ 4,953,344 |
| Northrop Grumman Corp. | 63,003 | 4,369,258 |
| United Technologies Corp. | 81,215 | 7,188,340 |
| | | 16,510,942 |
| AIR FREIGHT & LOGISTICS — 1.5% |
| United Parcel Service, Inc., Class B | 110,912 | 8,088,812 |
| AUTO COMPONENTS — 1.2% |
| Magna International, Inc. | 43,617 | 2,357,063 |
TRW Automotive Holdings Corp.(1) | 68,789 | 4,060,614 |
| | | 6,417,677 |
| AUTOMOBILES — 0.3% |
Ford Motor Co.(1) | 132,095 | 1,821,590 |
| BEVERAGES — 2.8% | | |
| Coca-Cola Co. (The) | 56,618 | 3,809,825 |
| Coca-Cola Enterprises, Inc. | 102,083 | 2,978,782 |
Constellation Brands, Inc., Class A(1) | 107,135 | 2,230,551 |
| Dr Pepper Snapple Group, Inc. | 115,466 | 4,841,489 |
| PepsiCo, Inc. | 22,894 | 1,612,425 |
| | | 15,473,072 |
| BIOTECHNOLOGY — 2.3% |
Amgen, Inc.(1) | 60,828 | 3,549,314 |
Biogen Idec, Inc.(1) | 56,843 | 6,077,653 |
Cephalon, Inc.(1) | 32,543 | 2,600,186 |
Cubist Pharmaceuticals, Inc.(1) | 13,494 | 485,649 |
| | | 12,712,802 |
| CAPITAL MARKETS — 1.6% |
| Ameriprise Financial, Inc. | 44,024 | 2,539,304 |
| Bank of New York Mellon Corp. (The) | 73,625 | 1,886,273 |
| Legg Mason, Inc. | 131,492 | 4,307,678 |
| | | 8,733,255 |
| CHEMICALS — 1.6% |
| Eastman Chemical Co. | 27,762 | 2,833,667 |
| PPG Industries, Inc. | 53,064 | 4,817,681 |
W.R. Grace & Co.(1) | 26,723 | 1,219,370 |
| | | 8,870,718 |
| COMMERCIAL BANKS — 2.9% |
| Commerce Bancshares, Inc. | 28,850 | 1,240,550 |
| M&T Bank Corp. | 7,848 | 690,232 |
| PNC Financial Services Group, Inc. | 35,582 | 2,121,043 |
| U.S. Bancorp. | 76,268 | 1,945,597 |
| Wells Fargo & Co. | 356,290 | 9,997,497 |
| | | 15,994,919 |
| COMMUNICATIONS EQUIPMENT — 0.6% |
Brocade Communications Systems, Inc.(1) | 47,850 | 309,111 |
| Cisco Systems, Inc. | 52,568 | 820,587 |
Motorola Solutions, Inc.(1) | 45,024 | 2,072,905 |
Research In Motion Ltd.(1) | 9,385 | 270,757 |
| | | 3,473,360 |
| COMPUTERS & PERIPHERALS — 3.5% |
Apple, Inc.(1) | 32,239 | 10,821,665 |
Dell, Inc.(1) | 350,709 | 5,846,319 |
NetApp, Inc.(1) | 35,956 | 1,897,758 |
SanDisk Corp.(1) | 18,450 | 765,675 |
| | | 19,331,417 |
| CONSTRUCTION & ENGINEERING — 1.4% |
| Fluor Corp. | 62,436 | 4,037,112 |
| KBR, Inc. | 86,535 | 3,261,504 |
URS Corp.(1) | 4,849 | 216,944 |
| | | 7,515,560 |
| CONSUMER FINANCE — 1.6% |
| American Express Co. | 84,309 | 4,358,775 |
| Capital One Financial Corp. | 39,564 | 2,044,272 |
| Cash America International, Inc. | 45,207 | 2,616,129 |
| | | 9,019,176 |
| DIVERSIFIED CONSUMER SERVICES — 1.2% |
Career Education Corp.(1) | 1,713 | 36,230 |
| H&R Block, Inc. | 70,918 | 1,137,525 |
ITT Educational Services, Inc.(1) | 49,060 | 3,838,454 |
| Weight Watchers International, Inc. | 21,083 | 1,591,134 |
| | | 6,603,343 |
| DIVERSIFIED FINANCIAL SERVICES — 2.3% |
| Bank of America Corp. | 121,527 | 1,331,936 |
| Citigroup, Inc. | 73,504 | 3,060,706 |
| JPMorgan Chase & Co. | 90,680 | 3,712,439 |
| McGraw-Hill Cos., Inc. (The) | 113,237 | 4,745,763 |
| | | 12,850,844 |
| DIVERSIFIED TELECOMMUNICATION SERVICES — 3.6% |
| AT&T, Inc. | 335,631 | $ 10,542,170 |
| Verizon Communications, Inc. | 251,610 | 9,367,440 |
| | | 19,909,610 |
| ELECTRIC UTILITIES — 0.9% |
| Entergy Corp. | 61,221 | 4,180,170 |
| FirstEnergy Corp. | 16,649 | 735,053 |
| | | 4,915,223 |
| ELECTRICAL EQUIPMENT — 0.2% |
| Emerson Electric Co. | 20,044 | 1,127,475 |
| ELECTRONIC EQUIPMENT, INSTRUMENTS & COMPONENTS — 0.7% |
| Anixter International, Inc. | 206 | 13,460 |
Vishay Intertechnology, Inc.(1) | 235,570 | 3,542,973 |
| | | 3,556,433 |
| ENERGY EQUIPMENT & SERVICES — 1.8% |
| Core Laboratories NV | 24,234 | 2,703,060 |
| Diamond Offshore Drilling, Inc. | 17,809 | 1,253,932 |
| Halliburton Co. | 5,590 | 285,090 |
| Schlumberger Ltd. | 18,827 | 1,626,653 |
| SEACOR Holdings, Inc. | 37,783 | 3,776,789 |
| Transocean Ltd. | 1,481 | 95,613 |
| | | 9,741,137 |
| FOOD & STAPLES RETAILING — 1.3% |
| Walgreen Co. | 129,350 | 5,492,201 |
| Wal-Mart Stores, Inc. | 25,584 | 1,359,534 |
| | | 6,851,735 |
| FOOD PRODUCTS — 2.3% |
| H.J. Heinz Co. | 67,416 | 3,591,924 |
| Hershey Co. (The) | 76,270 | 4,335,950 |
Smithfield Foods, Inc.(1) | 52,423 | 1,146,491 |
| Tyson Foods, Inc., Class A | 183,763 | 3,568,677 |
| | | 12,643,042 |
| GAS UTILITIES — 0.1% |
| WGL Holdings, Inc. | 16,088 | 619,227 |
| HEALTH CARE EQUIPMENT & SUPPLIES — 1.1% |
| Baxter International, Inc. | 9,348 | 557,982 |
| Hill-Rom Holdings, Inc. | 5,893 | 271,314 |
Kinetic Concepts, Inc.(1) | 16,597 | 956,485 |
Zimmer Holdings, Inc.(1) | 70,067 | 4,428,234 |
| | | 6,214,015 |
| HEALTH CARE PROVIDERS & SERVICES — 2.9% |
AMERIGROUP Corp.(1) | 9,911 | 698,428 |
| Humana, Inc. | 52,656 | 4,240,914 |
Magellan Health Services, Inc.(1) | 19,760 | 1,081,662 |
| UnitedHealth Group, Inc. | 133,603 | 6,891,243 |
WellCare Health Plans, Inc.(1) | 60,360 | 3,103,108 |
| | | 16,015,355 |
| HOTELS, RESTAURANTS & LEISURE — 0.4% |
| Brinker International, Inc. | 26,874 | 657,338 |
| McDonald’s Corp. | 18,653 | 1,572,821 |
| Starbucks Corp. | 4,227 | 166,924 |
| | | 2,397,083 |
| HOUSEHOLD PRODUCTS — 1.0% |
| Colgate-Palmolive Co. | 9,286 | 811,689 |
| Procter & Gamble Co. (The) | 77,499 | 4,926,612 |
| | | 5,738,301 |
| INDEPENDENT POWER PRODUCERS & ENERGY TRADERS — 0.3% |
AES Corp. (The)(1) | 145,148 | 1,849,186 |
| INDUSTRIAL CONGLOMERATES — 2.8% |
| 3M Co. | 45,615 | 4,326,583 |
| General Electric Co. | 578,308 | 10,906,889 |
| | | 15,233,472 |
| INSURANCE — 4.8% |
| ACE Ltd. | 46,856 | 3,084,062 |
| Allied World Assurance Co. Holdings Ltd. | 39,629 | 2,281,838 |
| American Financial Group, Inc. | 72,969 | 2,604,264 |
Berkshire Hathaway, Inc., Class B(1) | 35,591 | 2,754,388 |
| Chubb Corp. (The) | 17,720 | 1,109,449 |
| Principal Financial Group, Inc. | 131,198 | 3,991,043 |
| Prudential Financial, Inc. | 98,191 | 6,243,966 |
| Travelers Cos., Inc. (The) | 71,210 | 4,157,240 |
| | | 26,226,250 |
| INTERNET & CATALOG RETAIL — 0.2% |
| Expedia, Inc. | 13,848 | 401,454 |
priceline.com, Inc.(1) | 1,785 | 913,795 |
| | | 1,315,249 |
| INTERNET SOFTWARE & SERVICES — 1.0% |
AOL, Inc.(1) | 30,453 | 604,797 |
Google, Inc., Class A(1) | 9,814 | 4,969,613 |
| | | 5,574,410 |
| IT SERVICES — 4.9% |
| Accenture plc, Class A | 70,745 | $ 4,274,413 |
Alliance Data Systems Corp.(1) | 26,078 | 2,453,158 |
| Global Payments, Inc. | 28,418 | 1,449,318 |
| International Business Machines Corp. | 80,497 | 13,809,260 |
| Visa, Inc., Class A | 60,355 | 5,085,512 |
| | | 27,071,661 |
| LEISURE EQUIPMENT & PRODUCTS — 0.7% |
| Polaris Industries, Inc. | 31,933 | 3,549,992 |
| LIFE SCIENCES TOOLS & SERVICES — 0.1% |
Agilent Technologies, Inc.(1) | 9,289 | 474,761 |
| MACHINERY — 2.0% |
| Caterpillar, Inc. | 40,901 | 4,354,321 |
| Dover Corp. | 48,797 | 3,308,437 |
| Eaton Corp. | 16,835 | 866,161 |
| Parker-Hannifin Corp. | 15,987 | 1,434,673 |
Sauer-Danfoss, Inc.(1) | 24,965 | 1,257,986 |
| | | 11,221,578 |
| MEDIA — 3.9% |
| Comcast Corp., Class A | 274,482 | 6,955,374 |
DirecTV, Class A(1) | 67,472 | 3,428,927 |
DISH Network Corp., Class A(1) | 92,722 | 2,843,784 |
| Interpublic Group of Cos., Inc. (The) | 185,984 | 2,324,800 |
| Time Warner, Inc. | 158,036 | 5,747,769 |
| | | 21,300,654 |
| METALS & MINING — 2.2% |
| Freeport-McMoRan Copper & Gold, Inc. | 116,920 | 6,185,068 |
| Newmont Mining Corp. | 83,109 | 4,485,393 |
| Walter Energy, Inc. | 11,833 | 1,370,261 |
| | | 12,040,722 |
| MULTILINE RETAIL — 0.5% |
| Dillard’s, Inc., Class A | 36,063 | 1,880,325 |
| Kohl’s Corp. | 15,321 | 766,203 |
| | | 2,646,528 |
| MULTI-UTILITIES — 1.4% |
| Ameren Corp. | 89,970 | 2,594,735 |
| Consolidated Edison, Inc. | 9,621 | 512,222 |
| DTE Energy Co. | 10,872 | 543,817 |
| Integrys Energy Group, Inc. | 78,569 | 4,073,017 |
| | | 7,723,791 |
| OIL, GAS & CONSUMABLE FUELS — 11.6% |
| Chevron Corp. | 134,105 | 13,791,358 |
| ConocoPhillips | 118,458 | 8,906,857 |
| Exxon Mobil Corp. | 255,043 | 20,755,399 |
| Marathon Oil Corp. | 103,025 | 5,427,357 |
| Murphy Oil Corp. | 29,741 | 1,952,794 |
| Occidental Petroleum Corp. | 71,295 | 7,417,532 |
| Valero Energy Corp. | 171,984 | 4,397,631 |
| W&T Offshore, Inc. | 47,448 | 1,239,342 |
| | | 63,888,270 |
| PAPER & FOREST PRODUCTS — 0.7% |
| Domtar Corp. | 42,815 | 4,055,437 |
| PERSONAL PRODUCTS — 1.1% |
| Estee Lauder Cos., Inc. (The), Class A | 13,564 | 1,426,797 |
| Herbalife Ltd. | 76,201 | 4,392,226 |
| Nu Skin Enterprises, Inc., Class A | 6,148 | 230,857 |
| | | 6,049,880 |
| PHARMACEUTICALS — 6.3% |
| Abbott Laboratories | 105,508 | 5,551,831 |
| Bristol-Myers Squibb Co. | 72,299 | 2,093,779 |
| Eli Lilly & Co. | 174,681 | 6,555,778 |
| Johnson & Johnson | 203,338 | 13,526,044 |
| Merck & Co., Inc. | 38,485 | 1,358,135 |
| Pfizer, Inc. | 276,553 | 5,696,992 |
| | | 34,782,559 |
| REAL ESTATE INVESTMENT TRUSTS (REITs) — 0.8% |
| Rayonier, Inc. | 57,119 | 3,732,727 |
| Simon Property Group, Inc. | 4,756 | 552,790 |
| | | 4,285,517 |
| ROAD & RAIL — 0.3% |
| CSX Corp. | 63,588 | 1,667,277 |
| SEMICONDUCTORS & SEMICONDUCTOR EQUIPMENT — 3.1% |
| Altera Corp. | 18,923 | 877,081 |
| Applied Materials, Inc. | 57,032 | 741,986 |
| Intel Corp. | 442,266 | 9,800,615 |
LSI Corp.(1) | 79,926 | 569,073 |
Micron Technology, Inc.(1) | 151,382 | 1,132,337 |
Teradyne, Inc.(1) | 250,227 | 3,703,360 |
| | | 16,824,452 |
| SOFTWARE — 4.5% |
Cadence Design Systems, Inc.(1) | 195,265 | 2,061,998 |
Electronic Arts, Inc.(1) | 27,392 | 646,451 |
Intuit, Inc.(1) | 37,114 | 1,924,732 |
| Microsoft Corp. | 494,014 | 12,844,364 |
| Oracle Corp. | 120,281 | 3,958,448 |
Symantec Corp.(1) | 165,841 | 3,270,385 |
| | | 24,706,378 |
| SPECIALTY RETAIL — 1.4% |
AutoZone, Inc.(1) | 13,588 | $ 4,006,422 |
Bed Bath & Beyond, Inc.(1) | 50,275 | 2,934,551 |
| Williams-Sonoma, Inc. | 17,369 | 633,795 |
| | | 7,574,768 |
| TEXTILES, APPAREL & LUXURY GOODS — 0.8% |
| VF Corp. | 38,565 | 4,186,616 |
TOTAL COMMON STOCKS(Cost $470,993,630) | 547,395,531 |
| Temporary Cash Investments — 0.6% |
| JPMorgan U.S. Treasury Plus Money Market Fund Agency Shares | 785,082 | 785,082 |
Repurchase Agreement, Bank of America N.A., (collateralized by various U.S. Treasury obligations, 4.375%, 11/15/39, valued at $937,798), in a joint trading account at 0.00%, dated 6/30/11, due 7/1/11 (Delivery value $916,565) | 916,565 |
Repurchase Agreement, Credit Suisse First Boston, Inc., (collateralized by various U.S. Treasury obligations, 3.50%, 5/15/20, valued at $779,315), in a joint trading account at 0.00%, dated 6/30/11, due 7/1/11 (Delivery value $763,804) | 763,804 |
Repurchase Agreement, Goldman Sachs Group, Inc., (collateralized by various U.S. Treasury obligations, 1.375%, 9/15/12, valued at $934,996), in a joint trading account at 0.00%, dated 6/30/11, due 7/1/11 (Delivery value $916,565) | 916,565 |
TOTAL TEMPORARY CASH INVESTMENTS (Cost $3,382,016) | 3,382,016 |
TOTAL INVESTMENT SECURITIES — 100.1%(Cost $474,375,646) | 550,777,547 |
| OTHER ASSETS AND LIABILITIES — (0.1)% | (575,922) |
| TOTAL NET ASSETS — 100.0% | $550,201,625 |
Notes to Schedule of Investments
See Notes to Financial Statements.
Statement of Assets and Liabilities |
| JUNE 30, 2011 | |
| Assets | |
| Investment securities, at value (cost of $474,375,646) | | | $550,777,547 | |
| Receivable for capital shares sold | | | 6,328 | |
| Dividends and interest receivable | | | 416,068 | |
| | | | 551,199,943 | |
| | | | | |
| Liabilities | | | | |
| Payable for capital shares redeemed | | | 790,476 | |
| Accrued management fees | | | 207,842 | |
| | | | 998,318 | |
| | | | | |
| Net Assets | | | $550,201,625 | |
| | | | | |
| Institutional Class Capital Shares, $0.01 Par Value | | | | |
| Shares authorized | | | 100,000,000 | |
| Shares outstanding | | | 53,598,742 | |
| | | | | |
| Net Asset Value Per Share | | | $10.27 | |
| | | | | |
| Net Assets Consist of: | | | | |
| Capital (par value and paid-in surplus) | | | $462,843,759 | |
| Undistributed net investment income | | | 357,034 | |
| Undistributed net realized gain | | | 10,598,931 | |
| Net unrealized appreciation | | | 76,401,901 | |
| | | | $550,201,625 | |
See Notes to Financial Statements.
| YEAR ENDED JUNE 30, 2011 | |
| Investment Income (Loss) | |
| Income: | | | |
| Dividends (net of foreign taxes withheld of $9,334) | | | $8,742,195 | |
| Interest | | | 4,561 | |
| | | | 8,746,756 | |
| Expenses: | | | | |
| Management fees | | | 2,157,298 | |
| Directors’ fees and expenses | | | 18,965 | |
| Other expenses | | | 749 | |
| | | | 2,177,012 | |
| | | | | |
| Net investment income (loss) | | | 6,569,744 | |
| | | | | |
| Realized and Unrealized Gain (Loss) | | | | |
| Net realized gain (loss) on: | | | | |
| Investment transactions | | | 31,510,125 | |
| Futures contract transactions | | | 89,830 | |
| | | | 31,599,955 | |
| | | | | |
| Change in net unrealized appreciation (depreciation) on investments | | | 76,809,765 | |
| | | | | |
| Net realized and unrealized gain (loss) | | | 108,409,720 | |
| | | | | |
| Net Increase (Decrease) in Net Assets Resulting from Operations | | | $114,979,464 | |
See Notes to Financial Statements.
Statement of Changes in Net Assets |
| YEARS ENDED JUNE 30, 2011 AND JUNE 30, 2010 | |
| Increase (Decrease) in Net Assets | | 2011 | | | 2010 | |
| Operations | |
| Net investment income (loss) | | | $6,569,744 | | | | $3,625,736 | |
| Net realized gain (loss) | | | 31,599,955 | | | | 22,202,812 | |
| Change in net unrealized appreciation (depreciation) | | | 76,809,765 | | | | (4,601,954 | ) |
| Net increase (decrease) in net assets resulting from operations | | | 114,979,464 | | | | 21,226,594 | |
| | | | | | | | | |
| Distributions to Shareholders | | | | | | | | |
| From net investment income | | | (6,254,173 | ) | | | (3,438,550 | ) |
| | | | | | | | | |
| Capital Share Transactions | | | | | | | | |
| Proceeds from shares sold | | | 130,602,354 | | | | 123,776,451 | |
| Proceeds from reinvestment of distributions | | | 6,254,173 | | | | 787,044 | |
| Payments for shares redeemed | | | (16,338,638 | ) | | | (12,439,437 | ) |
| Net increase (decrease) in net assets from capital share transactions | | | 120,517,889 | | | | 112,124,058 | |
| | | | | | | | | |
| Net increase (decrease) in net assets | | | 229,243,180 | | | | 129,912,102 | |
| | | | | | | | | |
| Net Assets | | | | | | | | |
| Beginning of period | | | 320,958,445 | | | | 191,046,343 | |
| End of period | | | $550,201,625 | | | | $320,958,445 | |
| | | | | | | | | |
| Undistributed net investment income | | | $357,034 | | | | $121,481 | |
| | | | | | | | | |
| Transactions in Shares of the Fund | | | | | | | | |
| Sold | | | 14,195,659 | | | | 14,919,441 | |
| Issued in reinvestment of distributions | | | 656,770 | | | | 91,623 | |
| Redeemed | | | (1,802,459 | ) | | | (1,525,318 | ) |
| Net increase (decrease) in shares of the fund | | | 13,049,970 | | | | 13,485,746 | |
See Notes to Financial Statements.
Notes to Financial Statements |
JUNE 30, 2011
1. Organization
American Century Quantitative Equity Funds, Inc. (the corporation) is registered under the Investment Company Act of 1940, as amended (the 1940 Act), as an open-end management investment company and is organized as a Maryland corporation. NT Equity Growth Fund (the fund) is one fund in a series issued by the corporation. The fund is diversified as defined under the 1940 Act. The fund’s investment objective is to seek long-term capital growth. The fund pursues its objective by investing in common stocks. The fund is not permitted to invest in any securities issued by companies assigned the Global Industry Classification Standard for the tobacco industry.
2. Significant Accounting Policies
The following is a summary of significant accounting policies consistently followed by the fund in preparation of its financial statements. The financial statements are prepared in conformity with accounting principles generally accepted in the United States of America, which may require management to make certain estimates and assumptions at the date of the financial statements. Actual results could differ from these estimates.
Investment Valuations — The fund determines the fair value of its investments and computes its net asset value per share as of the close of regular trading (usually 4 p.m. Eastern time) on the New York Stock Exchange (NYSE) on each day the NYSE is open.
Equity securities that are listed or traded on a domestic securities exchange are valued at the last reported sales price or at the official closing price as provided by the exchange. Equity securities traded on foreign securities exchanges are typically valued at the closing price on the exchange where primarily traded or as of the close of the NYSE, if that is earlier. If no last sales price is reported, or if local convention or regulation so provides, the mean of the latest bid and asked prices is used. Depending on local convention or regulation, securities traded over-the-counter are valued at the mean of the latest bid and asked prices, the last sales price, or the official closing price. In its determination of fair value, the fund may review several factors including: market information specific to a security; news developments in U.S. and foreign markets; the performance of particular U.S. and foreign securities, indices, comparable securities, American Depositary Receipts, Exchange-Traded Funds, and other relevant market indicators.
Debt securities maturing within 60 days at the time of purchase may be valued at cost, plus or minus any amortized discount or premium or at the evaluated mean as provided by an independent pricing service. Evaluated mean prices are commonly derived through utilization of market models, which may consider, among other factors, trade data, quotations from dealers and active market makers, relevant yield curve and spread data, related sector levels, creditworthiness, and other relevant market information on the same or comparable securities.
Investments in open-end management investment companies are valued at the reported net asset value per share. Repurchase agreements are valued at cost. Exchange-traded futures contracts are valued at the settlement price as provided by the appropriate clearing corporation.
If the fund determines that the market price for a portfolio security is not readily available or the valuation methods mentioned above do not reflect a security’s fair value, such security is valued as determined in good faith by the Board of Directors or its designee, in accordance with procedures adopted by the Board of Directors. Circumstances that may cause the fund to use these procedures to value a security include, but are not limited to: a security has been declared in default; trading in a security has been halted during the trading day; there is a foreign market holiday and no trading occurred; or an event occurred between the close of a foreign exchange and the NYSE that may affect the value of a security.
Security Transactions — Security transactions are accounted for as of the trade date. Net realized gains and losses are determined on the identified cost basis, which is also used for federal income tax purposes.
Investment Income — Dividend income less foreign taxes withheld, if any, is recorded as of the ex-dividend date. Interest income is recorded on the accrual basis and includes accretion of discounts and amortization of premiums.
Repurchase Agreements — The fund may enter into repurchase agreements with institutions that American Century Investment Management, Inc. (ACIM) (the investment advisor) has determined are creditworthy pursuant to criteria adopted by the Board of Directors. The fund requires that the collateral, represented by securities, received in a repurchase transaction be transferred to the custodian in a manner sufficient to enable the fund to obtain those securities in the event of a default under the repurchase agreement. ACIM monitors, on a daily basis, the securities transferred to ensure the value, including accrued interest, of the securities under each repurchase agreement is equal to or greater than amounts owed to the fund under each repurchase agreement.
Joint Trading Account — Pursuant to an Exemptive Order issued by the Securities and Exchange Commission, the fund, along with certain other funds in the American Century Investments family of funds, may transfer uninvested cash balances into a joint trading account. These balances are invested in one or more repurchase agreements that are collateralized by U.S. Treasury or Agency obligations.
Income Tax Status — It is the fund’s policy to distribute substantially all net investment income and net realized gains to shareholders and to otherwise qualify as a regulated investment company under provisions of the Internal Revenue Code. The fund is no longer subject to examination by tax authorities for years prior to 2008. At this time, management believes there are no uncertain tax positions which, based on their technical merit, would not be sustained upon examination and for which it is reasonably possible that the total amounts of unrecognized tax benefits will significantly change in the next twelve months. Accordingly, no provision has been made for federal or state income taxes.
Distributions to Shareholders — Distributions from net investment income, if any, are generally declared and paid quarterly. Distributions from net realized gains, if any, are generally declared and paid annually.
Indemnifications — Under the corporation’s organizational documents, its officers and directors are indemnified against certain liabilities arising out of the performance of their duties to the fund. In addition, in the normal course of business, the fund enters into contracts that provide general indemnifications. The maximum exposure under these arrangements is unknown as this would involve future claims that may be made against a fund. The risk of material loss from such claims is considered by management to be remote.
3. Fees and Transactions with Related Parties
Management Fees —The corporation has entered into a management agreement with ACIM, under which ACIM provides the fund with investment advisory and management services in exchange for a single, unified management fee (the fee). The agreement provides that all expenses of managing and operating the fund, except distribution and service fees, brokerage expenses, taxes, interest, fees and expenses of the independent directors (including legal counsel fees), and extraordinary expenses, will be paid by ACIM. The fee is computed and accrued daily based on the daily net assets of the fund and paid monthly in arrears. The fee consists of (1) an Investment Category Fee based on the daily net assets of the fund and certain other accounts managed by the investment advisor that are in the same broad investment category as the fund and (2) a Complex Fee based on the assets of all the funds in the American Century Investments family of funds. The rates for the Investment Category Fee range from 0.3380% to 0.5200%. The rates for the Complex Fee range from 0.0500% to 0.1100%. The effective annual management fee for the year ended June 30, 2011 was 0.48%.
Related Parties — Certain officers and directors of the corporation are also officers and/or directors of American Century Companies, Inc. (ACC), the parent of the corporation’s investment advisor, ACIM, the distributor of the corporation, American Century Investment Services, Inc., and the corporation’s transfer agent, American Century Services, LLC. The fund is wholly owned, in aggregate, by various funds in a series issued by American Century Asset Allocation Portfolios, Inc. (ACAAP). ACAAP does not invest in the fund for the purpose of exercising management or control.
The fund is eligible to invest in a money market fund for temporary purposes, which is managed by J.P. Morgan Investment Management, Inc. (JPMIM). The fund has a securities lending agreement with JPMorgan Chase Bank (JPMCB) and a mutual funds services agreement with J.P. Morgan Investor Services Co. (JPMIS). JPMCB is a custodian of the fund. JPMIM, JPMIS and JPMCB are wholly owned subsidiaries of JPMorgan Chase & Co. (JPM). JPM is an equity investor in ACC. The services provided to the fund by JPMIM, JPMIS and JPMCB terminated on July 31, 2011.
4. Investment Transactions
Purchases and sales of investment securities, excluding short-term investments, for the year ended June 30, 2011 were $495,693,247 and $373,246,598, respectively.
5. Fair Value Measurements
The fund’s securities valuation process is based on several considerations and may use multiple inputs to determine the fair value of the positions held by the fund. In conformity with accounting principles generally accepted in the United States of America, the inputs used to determine a valuation are classified into three broad levels as follows:
| • | Level 1 valuation inputs consist of unadjusted quoted prices in an active market for identical securities; |
| • | Level 2 valuation inputs consist of direct or indirect observable market data (including quoted prices for similar securities, evaluations of subsequent market events, interest rates, prepayment speeds, credit risk, etc.); or |
| • | Level 3 valuation inputs consist of unobservable data (including a fund’s own assumptions). |
The level classification is based on the lowest level input that is significant to the fair valuation measurement. The valuation inputs are not necessarily an indication of the risks associated with investing in these securities or other financial instruments.
The following is a summary of the level classifications as of period end. The Schedule of Investments provides additional information on the fund’s portfolio holdings.
| | | | | | | | | | |
| | | Level 1 | | | Level 2 | | | Level 3 | |
| Investment Securities | | | | | | | | | |
| Common Stocks | | | $547,395,531 | | | | — | | | | — | |
| Temporary Cash Investments | | | 785,082 | | | | $2,596,934 | | | | — | |
| Total Value of Investment Securities | | | $548,180,613 | | | | $2,596,934 | | | | — | |
6. Derivative Instruments
Equity Price Risk — The fund is subject to equity price risk in the normal course of pursuing its investment objectives. A fund may enter into futures contracts based on an equity index in order to manage its exposure to changes in market conditions. A fund may purchase futures contracts to gain exposure to increases in market value or sell futures contracts to protect against a decline in market value. Upon entering into a futures contract, a fund is required to deposit either cash or securities in an amount equal to a certain percentage of the contract value (initial margin). Subsequent payments (variation margin) are made or received daily, in cash, by a fund. The variation margin is equal to the daily change
in the contract value and is recorded as unrealized gains and losses. A fund recognizes a realized gain or loss when the contract is closed or expires. Net realized and unrealized gains or losses occurring during the holding period of futures contracts are a component of net realized gain (loss) on futures contract transactions and change in net unrealized appreciation (depreciation) on futures contracts, respectively. One of the risks of entering into futures contracts is the possibility that the change in value of the contract may not correlate with the changes in value of the underlying securities. During the period, the fund infrequently purchased equity price risk derivative instruments for temporary investment purposes.
At period end, the fund did not have any equity price risk derivative instruments disclosed on the Statement of Assets and Liabilities. For the year ended June 30, 2011, the effect of equity price risk derivative instruments on the Statement of Operations was $89,830 in net realized gain (loss) on futures contract transactions.
7. Federal Tax Information
The tax character of distributions paid during the years ended June 30, 2011 and June 30, 2010 were as follows:
| | | | | | | |
| | | 2011 | | | 2010 | |
| Distributions Paid From | | | | | | |
| Ordinary income | | | $6,254,173 | | | | $3,438,550 | |
| Long-term capital gains | | | — | | | | — | |
The book-basis character of distributions made during the year from net investment income or net realized gains may differ from their ultimate characterization for federal income tax purposes. These differences reflect the differing character of certain income items and net realized gains and losses for financial statement and tax purposes, and may result in reclassification among certain capital accounts on the financial statements.
As of June 30, 2011, the federal tax cost of investments and the components of distributable earnings on a tax-basis were as follows:
| | | | |
| Federal tax cost of investments | | | $481,705,431 | |
| Gross tax appreciation of investments | | | $72,121,405 | |
| Gross tax depreciation of investments | | | (3,049,289 | ) |
| Net tax appreciation (depreciation) of investments | | | $69,072,116 | |
| Net tax appreciation (depreciation) on derivatives | | | — | |
| Net tax appreciation (depreciation) | | | $69,072,116 | |
| Undistributed ordinary income | | | $1,002,320 | |
| Accumulated long-term gains | | | $17,283,430 | |
The difference between book-basis and tax-basis cost and unrealized appreciation (depreciation) is attributable primarily to the tax deferral of losses on wash sales.
On December 22, 2010, the Regulated Investment Company Modernization Act of 2010 (the “Act”) was enacted, which changed various technical rules governing the tax treatment of regulated investment companies. The changes are generally effective for taxable years beginning after the date of enactment. Under the Act, the fund will be permitted to carry forward capital losses incurred in taxable years beginning after the date of enactment for an unlimited period.
| Institutional Class | |
| For a Share Outstanding Throughout the Years Ended June 30 (except as noted) | |
| | | 2011 | | | 2010 | | | 2009 | | | 2008 | | | 2007(1) | | | 2006(2) | |
| Per-Share Data | |
Net Asset Value, Beginning of Period | | | $7.92 | | | | $7.06 | | | | $9.98 | | | | $11.53 | | | | $10.87 | | | | $10.00 | |
Income From Investment Operations | | | | | | | | | | | | | | | | | | | | | | | | |
Net Investment Income (Loss) | | | 0.14 | (3) | | | 0.11 | (3) | | | 0.13 | (3) | | | 0.12 | | | | 0.06 | | | | 0.07 | |
Net Realized and Unrealized Gain (Loss) | | | 2.34 | | | | 0.85 | | | | (2.89 | ) | | | (1.47 | ) | | | 0.65 | | | | 0.87 | |
Total From Investment Operations | | | 2.48 | | | | 0.96 | | | | (2.76 | ) | | | (1.35 | ) | | | 0.71 | | | | 0.94 | |
| Distributions | | | | | | | | | | | | | | | | | | | | | | | | |
From Net Investment Income | | | (0.13 | ) | | | (0.10 | ) | | | (0.16 | ) | | | (0.09 | ) | | | (0.05 | ) | | | (0.07 | ) |
| From Net Realized Gains | | | — | | | | — | | | | — | | | | (0.11 | ) | | | — | | | | — | |
| Total Distributions | | | (0.13 | ) | | | (0.10 | ) | | | (0.16 | ) | | | (0.20 | ) | | | (0.05 | ) | | | (0.07 | ) |
Net Asset Value, End of Period | | | $10.27 | | | | $7.92 | | | | $7.06 | | | | $9.98 | | | | $11.53 | | | | $10.87 | |
| | | | | | | | | | | | | | | | | | | | | | | | | |
Total Return(4) | | | 31.45 | % | | | 13.53 | % | | | (27.73 | )% | | | (11.84 | )% | | | 6.59 | % | | | 9.47 | % |
| | | | | | | | | | | | | | | | | | | | | | | | | |
| Ratios/Supplemental Data | |
Ratio of Operating Expenses to Average Net Assets | | | 0.49 | % | | | 0.49 | % | | | 0.50 | % | | | 0.47 | % | | | 0.47 | %(5) | | | 0.47 | %(5) |
Ratio of Net Investment Income (Loss) to Average Net Assets | | | 1.46 | % | | | 1.31 | % | | | 1.82 | % | | | 1.20 | % | | | 1.04 | %(5) | | | 1.20 | %(5) |
| Portfolio Turnover Rate | | | 84 | % | | | 69 | % | | | 109 | % | | | 99 | % | | | 54 | % | | | 65 | % |
Net Assets, End of Period (in thousands) | | | $550,202 | | | | $320,958 | | | | $191,046 | | | | $112,417 | | | | $91,945 | | | | $71,743 | |
| (1) | January 1, 2007 through June 30, 2007. The fund’s fiscal year end was changed from December 31 to June 30, resulting in a six-month annual reporting period. |
| (2) | May 12, 2006 (fund inception) through December 31, 2006. |
| (3) | Computed using average shares outstanding throughout the period. |
| (4) | Total returns are calculated based on the net asset value of the last business day. Total returns for periods less than one year are not annualized. |
See Notes to Financial Statements.
Report of Independent Registered Public Accounting Firm |
To the Directors of the American Century Quantitative Equity Funds, Inc.
and Shareholders of the NT Equity Growth Fund:
In our opinion, the accompanying statement of assets and liabilities, including the schedule of investments, and the related statements of operations and of changes in net assets and the financial highlights present fairly, in all material respects, the financial position of the NT Equity Growth Fund(one of the eleven funds comprising the American Century Quantitative Equity Funds, Inc., hereafter referred to as the “Fund”) at June 30, 2011, the results of its operations for the year then ended, the changes in its net assets for each of the two years in the period then ended and the financial highlights for each of the periods presented, in conformity with accounting principles generally accepted in the United States of America. These financial statements and financial highlights (hereafter referred to as “financial statements”) are the responsibility of the Fund’s management; our responsibility is to express an opinion on these financial statements based on our audits. We conducted our audits of these financial statements in accordance with the standards of the Public Company Accounting Oversight Board (United States). Those standards require that we plan and perform the audit to obtain reasonable assurance about whether the financial statements are free of material misstatement. An audit includes examining, on a test basis, evidence supporting the amounts and disclosures in the financial statements, assessing the accounting principles used and significant estimates made by management, and evaluating the overall financial statement presentation. We believe that our audits, which included confirmation of securities at June 30, 2011 by correspondence with the custodian and brokers, provide a reasonable basis for our opinion.
PricewaterhouseCoopers LLP
Kansas City, Missouri
August 18, 2011
Board of Directors
The individuals listed below serve as directors of the funds. Each director will continue to serve in this capacity until death, retirement, resignation or removal from office. The mandatory retirement age for directors who are not “interested persons,” as that term is defined in the Investment Company Act (independent directors), is 73. However, the mandatory retirement age may be extended for a period not to exceed two years with the approval of the remaining independent directors.
Mr. Thomas is the only director who is an “interested person” because he currently serves as President and Chief Executive Officer of American Century Companies, Inc. (ACC), the parent company of American Century Investment Management, Inc. (ACIM or the advisor).
The other directors (more than three-fourths of the total number) are independent; that is, they have never been employees, directors or officers of, and have no financial interest in, ACC or any of its wholly owned, direct or indirect, subsidiaries, including ACIM, American Century Investment Services, Inc. (ACIS) and American Century Services, LLC (ACS). The directors serve in this capacity for eight (in the case of Mr. Thomas, 15) registered investment companies in the American Century Investments family of funds.
The following presents additional information about the directors. The mailing address for each director other than Mr. Thomas is 1665 Charleston Road, Mountain View, California 94043. The mailing address for Mr. Thomas is 4500 Main Street, Kansas City, Missouri 64111.
| | | | | | |
Name (Year of Birth) | Position(s) Held with Funds | Length of Time Served | Principal Occupation(s) During Past 5 Years | Number of American Century Portfolios Overseen by Director | Other Directorships Held During Past 5 Years |
| Independent Directors |
Tanya S. Beder (1955) | Director | Since 2011 | Chairman, SBCC Group Inc. (investment advisory services) (2006 to present); Fellow in Practice, International Center for Finance, Yale University School of Management (1985 to present); Chief Executive Officer, Tribeca Global Management LLC (asset management firm) (2004 to 2006) | 40 | None |
Jeremy I. Bulow (1954) | Director | Since 2011 | Professor of Economics, Stanford University, Graduate School of Business (1979 to present) | 40 | None |
John Freidenrich (1937) | Director | Since 2005 | Founder, Member and Manager, Regis Management Company, LLC (investment management firm) (April 2004 to present) | 40 | None |
| | | | | | |
Name (Year of Birth) | Position(s) Held with Funds | Length of Time Served | Principal Occupation(s) During Past 5 Years | Number of American Century Portfolios Overseen by Director | Other Directorships Held During Past 5 Years |
| Independent Directors |
Ronald J. Gilson (1946) | Director and Chairman of the Board | Since 1995 | Charles J. Meyers Professor of Law and Business, Stanford Law School (1979 to present); Marc and Eva Stern Professor of Law and Business, Columbia University School of Law (1992 to present) | 40 | None |
Frederick L. A. Grauer (1946) | Director | Since 2008 | Senior Advisor, BlackRock, Inc. (investment management firm) (2010 to 2011); Senior Advisor, Barclays Global Investors (investment management firm) (2003 to 2009) | 40 | None |
Peter F. Pervere (1947) | Director | Since 2007 | Retired | 40 | Intraware, Inc. (2003 to 2009) |
Myron S. Scholes (1941) | Director | Since 1980 | Chairman, Platinum Grove Asset Management, L.P. (asset manager) (1999 to 2009); Frank E. Buck Professor of Finance-Emeritus, Stanford Graduate School of Business (1996 to present) | 40 | Dimensional Fund Advisors (investment advisor); CME Group, Inc. (futures and options exchange) |
John B. Shoven (1947) | Director | Since 2002 | Professor of Economics, Stanford University (1973 to present) | 40 | Cadence Design Systems; Exponent; Financial Engines; Watson Wyatt Worldwide (2002 to 2006) |
| |
| Interested Director |
Jonathan S. Thomas (1963) | Director and President | Since 2007 | President and Chief Executive Officer, ACC (March 2007 to present); Chief Administrative Officer, ACC (February 2006 to February 2007); Executive Vice President, ACC (November 2005 to February 2007). Also serves as: Chief Executive Officer and Manager, ACS; Executive Vice President, ACIM; Director, ACC, ACIM and other ACC subsidiaries | 104 | None |
Officers
The following table presents certain information about the executive officers of the funds. Each officer serves as an officer for each of the 15 investment companies in the American Century family of funds, unless otherwise noted. No officer is compensated for his or her service as an officer of the funds. The listed officers are interested persons of the funds and are appointed or re-appointed on an annual basis. The mailing address for each of the officers listed below is 4500 Main Street, Kansas City, Missouri 64111.
| | | |
Name (Year of Birth) | Offices with the Funds | Principal Occupation(s) During the Past Five Years |
Jonathan S. Thomas (1963) | Director and President since 2007 | President and Chief Executive Officer, ACC (March 2007 to present); Chief Administrative Officer, ACC (February 2006 to February 2007); Executive Vice President, ACC (November 2005 to February 2007). Also serves as: Chief Executive Officer and Manager, ACS; Executive Vice President, ACIM; Director, ACC, ACIM and other ACC subsidiaries |
Barry Fink (1955) | Executive Vice President since 2007 | Chief Operating Officer and Executive Vice President, ACC (September 2007 to present); President, ACS (October 2007 to present); Managing Director, Morgan Stanley (2000 to 2007); Global General Counsel, Morgan Stanley (2000 to 2006). Also serves as: Manager, ACS and Director, ACC and certain ACC subsidiaries |
Maryanne L. Roepke (1956) | Chief Compliance Officer since 2006 and Senior Vice President since 2000 | Chief Compliance Officer, American Century funds, ACIM and ACS (August 2006 to present); Assistant Treasurer, ACC (January 1995 to August 2006); and Treasurer and Chief Financial Officer, various American Century funds (July 2000 to August 2006). Also serves as: Senior Vice President, ACS |
Charles A. Etherington (1957) | General Counsel since 2007 and Senior Vice President since 2006 | Attorney, ACC (February 1994 to present); Vice President, ACC (November 2005 to present), General Counsel, ACC (March 2007 to present); Also serves as General Counsel, ACIM, ACS, ACIS and other ACC subsidiaries; and Senior Vice President, ACIM and ACS |
Robert J. Leach (1966) | Vice President, Treasurer and Chief Financial Officer since 2006 | Vice President, ACS (February 2000 to present); and Controller, various American Century funds (1997 to September 2006) |
David H. Reinmiller (1963) | Vice President since 2001 | Attorney, ACC (January 1994 to present); Associate General Counsel, ACC (January 2001 to present); Also serves as Vice President, ACIM and ACS |
Ward D. Stauffer (1960) | Secretary since 2005 | Attorney, ACC (June 2003 to present) |
The Statement of Additional Information has additional information about the fund’s directors and is available without charge, upon request, by calling 1-800-345-2021.
| Approval of Management Agreement |
At a meeting held on June 28, 2011, the Fund’s Board of Directors/Trustees unanimously approved the renewal of the management agreement pursuant to which American Century Investment Management, Inc. (the “Advisor”) acts as the investment advisor for the Fund. Under Section 15(c) of the Investment Company Act, contracts for investment advisory services are required to be reviewed, evaluated, and approved by a majority of a fund’s independent
directors/trustees (the “Directors”) each year.
As a part of the approval process, the Board requested and reviewed extensive data and information compiled by the Advisor and certain independent providers of evaluation data concerning the Fund and the services provided to the Fund by the Advisor. This review was in addition to the oversight and evaluation undertaken by the Board and its committees on a continuous basis throughout the year and included, but was not limited to the following:
| • | the nature, extent, and quality of investment management, shareholder services, and other services provided by the Advisor to the Fund; |
| • | the wide range of other programs and services the Advisor provides to the Fund and its shareholders on a routine and non-routine basis; |
| • | the investment performance of the fund, including data comparing the Fund’s performance to appropriate benchmarks and/or a peer group of other mutual funds with similar investment objectives and strategies; |
| • | data comparing the cost of owning the Fund to the cost of owning similar funds; |
| • | the Advisor’s compliance policies, procedures, and regulatory experience; |
| • | financial data showing the cost of services provided to the Fund, the profitability of the Fund to the Advisor, and the overall profitability of the Advisor; |
| • | data comparing services provided and charges to other investment management clients of the Advisor; and |
| • | consideration of collateral benefits derived by the Advisor from the management of the Fund and any potential economies of scale relating thereto. |
In keeping with its practice, the Board held two in-person meetings and one telephonic meeting to review and discuss the information provided. The Board also had the benefit of the advice of its independent counsel throughout the period.
Factors Considered
The Directors considered all of the information provided by the Advisor, the independent data providers, and the Board’s independent counsel, and evaluated such information for the Fund. In connection with their review, the Directors did not identify any single factor as being all-important or controlling, and each Director may have attributed different levels of importance to different factors. In deciding to renew the management agreement, the Board based its decision on a number of factors, including the following:
Nature, Extent and Quality of Services — Generally. Under the management agreement, the Advisor is responsible for providing or arranging for all services necessary for the operation of the Fund. The Board noted that under the management agreement, the Advisor provides or arranges at its own expense a wide variety
of services including:
| • | constructing and designing the Fund |
| • | portfolio research and security selection |
| • | initial capitalization/funding |
| • | daily valuation of the Fund’s portfolio |
| • | shareholder servicing and transfer agency, including shareholder confirmations, recordkeeping, and communications |
| • | regulatory and portfolio compliance |
| • | marketing and distribution |
The Board noted that many of these services have expanded over time both in terms of quantity and complexity in response to shareholder demands, competition in the industry, changing distribution channels, and the changing regulatory environment.
Investment Management Services. The nature of the investment management services provided to the Fund is quite complex and allows Fund shareholders access to professional money management, instant diversification of their investments within an asset class, the opportunity to easily diversify among asset classes by investing in or exchanging among various American Century Investments funds, and liquidity. In evaluating investment performance, the Board expects the Advisor to manage the Fund in accordance with its investment objectives and approved strategies. Further, the Directors recognize that the Advisor has an obligation to seek the best execution of fund trades. In providing these services, the Advisor utilizes teams of investment professionals (portfolio managers, analysts, research assistants, and securities traders) who require extensive information technology, research, training, compliance and other systems to conduct their business. The Board, directly and through its Portfolio Committee, regularly reviews investment performance information for the Fund, together with comparative information for appropriate benchmarks and/or peer groups of similarly-managed funds, over different time horizons. The Directors also review detailed performance information during the management agreement approval
process. If performance concerns are identified, the Fund receives special reviews until performance improves, during which the Board discusses with the Advisor the reasons for such results (e.g., market conditions, security selection) and any efforts being undertaken to improve performance. The Board found the investment management services provided by the Advisor to the Fund to meet or exceed industry standards. More detailed information about the Fund’s performance can be found in the Performance and Portfolio Commentary sections of this report.
Shareholder and Other Services. Under the management agreement, the Advisor provides the Fund with a comprehensive package of transfer agency, shareholder, and other services. The Board, directly and through various committees of the Board, regularly reviews reports and evaluations of such services at its regular meetings. These reports include, but are not limited to, information regarding the operational efficiency and accuracy of the shareholder and transfer agency services provided, staffing levels, shareholder satisfaction (as measured by external as well as internal sources), technology support, new products and services offered to Fund shareholders, securities trading activities, portfolio valuation services, auditing services, and legal and operational compliance activities. Certain aspects of shareholder and transfer agency service level efficiency and the quality of securities trading activities are measured by independent third party providers and are presented in comparison to other fund groups not managed by the Advisor. The Board found the services provided by the Advisor to the Fund under the management agreement to be competitive and of high quality.
Costs of Services and Profitability. The Advisor provides detailed information concerning its cost of providing various services to the Fund, its profitability in managing the Fund, its overall profitability, and its financial condition. The Directors have reviewed with the Advisor the methodology used to prepare this financial information. The financial information regarding the Advisor is considered in evaluating the Advisor’s financial condition, ability to continue to provide services under the management agreement, and the reasonableness of the current management fee. The Board concluded that the Advisor’s profits were reasonable in light of the services provided to the Fund.
Ethics. The Board generally considers the Advisor’s commitment to providing quality services to shareholders and to conducting its business ethically. They noted that the Advisor’s practices generally meet or exceed industry best practices.
Economies of Scale. The Board also reviewed information provided by the Advisor regarding the possible existence of economies of scale in connection with the management of the Fund. The Board concluded that economies of scale are difficult to measure and predict with precision, especially on a fund-by-fund basis. The Board concluded that the Advisor is appropriately sharing economies of scale through its competitive fee structure, offering competitive fees from fund inception, and through reinvestment in its business to provide shareholders additional content and services.
Comparison to Other Funds’ Fees. The management agreement provides that the Fund pay the Advisor a single, all-inclusive (or unified) management fee for providing all services necessary for the management and operation of the Fund, other than brokerage expenses, taxes, interest, extraordinary expenses, and the fees and expenses of the Fund’s independent directors (including their independent legal counsel) and expenses incurred in connection with the provision of shareholder services and distribution services under a plan adopted pursuant to Rule 12b-1 under the 1940 Act. Under the unified fee structure, the Advisor is responsible for providing all investment advisory, custody, audit, administrative, compliance, recordkeeping, marketing and shareholder services, or arranging and supervising third parties to provide such services. By contrast, most other funds are charged a variety of fees, including an investment advisory fee, a transfer agency fee, an administrative fee, distribution charges and other expenses. Other than their investment advisory fees and any applicable Rule 12b-1 distribution fees, all other components of the total fees charged by these other funds may be increased without shareholder approval. The Board believes the unified fee structure is a benefit to Fund shareholders because it clearly discloses to shareholders the cost of owning Fund shares, and, since the unified fee cannot be increased without a vote of Fund shareholders, it shifts to the Advisor the risk of increased costs of operating the Fund and provides a direct incentive to minimize administrative inefficiencies. Part of the Board’s analysis of fee levels involves reviewing certain evaluative data compiled by an independent provider and comparing the Fund’s unified fee to the total expense ratio of other funds in the Fund’s peer group. The Board concluded that the management fee paid by the Fund to the Advisor under the management agreement is reasonable in light of the services provided to the Fund.
Comparison to Fees and Services Provided to Other Clients of the Advisor. The Board also requested and received information from the Advisor concerning the nature of the services, fees, costs and profitability of its advisory services to advisory clients other than the Fund. They observed that these varying types of client accounts require different services and involve different regulatory and entrepreneurial risks than the management of the Fund. The Board analyzed this information and concluded that the fees charged and services provided to the Fund were reasonable by comparison.
Collateral or “Fall-Out” Benefits Derived by the Advisor. The Board considered the existence of collateral benefits the Advisor may receive as a result of its relationship with the Fund. They concluded that the Advisor’s primary business is managing mutual funds and it generally does not use fund or shareholder information to generate profits in other lines of business, and therefore does not derive any significant collateral benefits from them. The Board noted that the Advisor receives proprietary research from broker-dealers that execute fund portfolio transactions and concluded that this research is likely to benefit Fund shareholders. The Board also determined that the Advisor is able to provide investment management services to certain clients other than the Fund, at least in part, due to its existing infrastructure built to serve the fund complex. The Board concluded, however, that the assets of those other clients are not material to the analysis and, where applicable, may be included with the assets of the Fund to determine breakpoints in the management fee schedule.
Existing Relationship. The Board also considered whether there was any reason for not continuing the existing arrangement with the Advisor. In this regard, the Board was mindful of the potential disruptions of the Fund’s operations and various risks, uncertainties, and other effects that could occur as a result of a decision not to continue such relationship. In particular, the Board recognized that most shareholders have invested in the Fund on the strength of the Advisor’s industry standing and reputation and in the expectation that the Advisor will have a continuing role in providing advisory services to the Fund.
Conclusion of the Directors. As a result of this process, the Board, including all of the independent directors and assisted by the advice of independent legal counsel, taking into account all of the factors discussed above and the information provided by the Advisor and others, concluded that the management agreement between the Fund and the Advisor is fair and reasonable in light of the services provided and should be renewed.
Retirement Account Information
As required by law, distributions you receive from certain IRAs, or 403(b), 457 and qualified plans are subject to federal income tax withholding, unless you elect not to have withholding apply. Tax will be withheld on the total amount withdrawn even though you may be receiving amounts that are not subject to withholding, such as nondeductible contributions. In such case, excess amounts of withholding could occur. You may adjust your withholding election so that a greater or lesser amount will be withheld.
If you don’t want us to withhold on this amount, you must notify us to not withhold the federal income tax. You may notify us in writing or in certain situations by telephone or through other electronic means. You have the right to revoke your withholding election at any time and any election you make may remain in effect until revoked by filing a new election.
Remember, even if you elect not to have income tax withheld, you are liable for paying income tax on the taxable portion of your withdrawal. If you elect not to have income tax withheld or you don’t have enough income tax withheld, you may be responsible for payment of estimated tax. You may incur penalties under the estimated tax rules if your withholding and estimated tax payments are not sufficient. You can reduce or defer the income tax on a distribution by directly or indirectly rolling such distribution over to another IRA or eligible plan. You should consult your tax advisor for additional information.
State tax will be withheld if, at the time of your distribution, your address is within one of the mandatory withholding states and you have federal income tax withheld. State taxes will be withheld from your distribution in accordance with the respective state rules.
Proxy Voting Guidelines
American Century Investment Management, Inc., the fund’s investment advisor, is responsible for exercising the voting rights associated with the securities purchased and/or held by the fund. A description of the policies and procedures the advisor uses in fulfilling this responsibility is available without charge, upon request, by calling 1-800-345-2021. It is also available on American Century Investments’ website at americancentury.com and on the Securities and Exchange Commission’s website at sec.gov. Information regarding how the investment advisor voted proxies relating to portfolio securities during the most recent 12-month period ended June 30 is available on the “About Us” page at americancentury.com. It is also available at sec.gov.
Quarterly Portfolio Disclosure
The fund files its complete schedule of portfolio holdings with the Securities and Exchange Commission (SEC) for the first and third quarters of each fiscal year on Form N-Q. The fund’s Forms N-Q are available on the SEC’s website at sec.gov, and may be reviewed and copied at the SEC’s Public Reference Room in Washington, DC. Information on the operation of the Public Reference Room may be obtained by calling 1-800-SEC-0330. The fund also makes its complete schedule of portfolio holdings for the most recent quarter of its fiscal year available on its website at americancentury.com and, upon request, by calling 1-800-345-2021.
Other Tax Information
The following information is provided pursuant to provisions of the Internal Revenue Code.
The fund hereby designates up to the maximum amount allowable as qualified dividend income for the fiscal year ended June 30, 2011.
For corporate taxpayers, the fund hereby designates $6,254,173, or up to the maximum amount allowable, of ordinary income distributions paid during the fiscal year ended June 30, 2011 as qualified for the corporate dividends received deduction.
| Contact Us | americancentury.com |
| Automated Information Line | 1-800-345-8765 |
| Investor Services Representative | 1-800-345-2021 or 816-531-5575 |
| Investors Using Advisors | 1-800-378-9878 |
| Business, Not-For-Profit, Employer-Sponsored Retirement Plans | 1-800-345-3533 |
| Banks and Trust Companies, Broker-Dealers, Financial Professionals, Insurance Companies | 1-800-345-6488 |
| Telecommunications Device for the Deaf | 1-800-634-4113 |
American Century Quantitative Equity Funds, Inc.
Investment Advisor:
American Century Investment Management, Inc.
Kansas City, Missouri
This report and the statements it contains are submitted for the general information of our shareholders. The report is not authorized for distribution to prospective investors unless preceded or accompanied by an effective prospectus.
©2011 American Century Proprietary Holdings, Inc. All rights reserved.
CL-ANN-72462 1108
ANNUAL REPORT JUNE 30, 2011
| President’s Letter | 2 |
| Market Perspective | 3 |
| Performance | 4 |
| Portfolio Commentary | 5 |
| Fund Characteristics | 7 |
| Shareholder Fee Example | 8 |
| Schedule of Investments | 10 |
| Statement of Assets and Liabilities | 17 |
| Statement of Operations | 18 |
| Statement of Changes in Net Assets | 19 |
| Notes to Financial Statements | 20 |
| Financial Highlights | 25 |
| Report of Independent Registered Public Accounting Firm | 26 |
| Management | 27 |
| Approval of Management Agreement | 30 |
| Additional Information | 35 |
Any opinions expressed in this report reflect those of the author as of the date of the report, and do not necessarily represent the opinions of American Century Investments® or any other person in the American Century Investments organization. Any such opinions are subject to change at any time based upon market or other conditions and American Century Investments disclaims any responsibility to update such opinions. These opinions may not be relied upon as investment advice and, because investment decisions made by American Century Investments funds are based on numerous factors, may not be relied upon as an indication of trading intent on behalf of any American Century Investments fund. Security examples are used for representational purposes only and are not intended as recommendations to purchase or sell securities. Performance information for comparative indices and securities is provided to American Century Investments by third party vendors. To the best of American Century Investments’ knowledge, such information is accurate at the time of printing.
Dear Investor:
Thank you for reviewing this annual report for the period ended June 30, 2011. Our report offers investment performance and portfolio information, presented with the expert perspective and commentary of our portfolio management team.
This report remains one of our most important vehicles for conveying information about investment performance and the market factors and strategies that affect fund returns. For additional, updated information on fund performance, portfolio strategy, and the investment markets, we encourage you to visit our website, americancentury.com. Click on the “Fund Performance” and “Insights & News” headings at the top of our Individual Investors site.
Reporting Period Perspective: Highest Broad Fiscal-Year U.S. Stock Returns Since 1997
Benefitting from favorable conditions and expectations, the U.S. stock market produced exceptional returns, the highest for any 12-month period ended June 30 since the fiscal year ended June 30, 1997. Back then, the S&P 500 Index gained 34.71%, compared with 30.69% for the most-recent reporting period. The intervening 14 years help illustrate how infrequently such a high level of performance occurs, requiring an alignment of economic and market conditions that’s difficult to duplicate.
The exceptional returns experienced during the reporting period represent a rebound from previous declines. After experiencing 10–12% declines during the second quarter of 2010—stemming from the European sovereign debt crisis and double-dip recession fears—most broad U.S. stock indices advanced 30% or more during the following 12 months. Monetary and fiscal intervention in 2010 stimulated growth and fueled investor optimism about economic and financial market conditions in 2011 and 2012, encouraging investments in riskier assets.
However, that optimism has diminished in the summer of 2011 as the European debt crisis returned to prominence and other debt and economic challenges emerged. As the reporting period came to a close in June 2011, we saw increasing signs that the U.S. economic recovery had lost momentum. As a result, economic growth forecasts were reduced, and broad U.S. stock indices trended downward beginning in May. As we enter the third quarter of 2011, investor concern over fiscal austerity measures in the U.S. and other developed economies raised fears of a return to recession and accelerated a decline in global equity markets. We appreciate your continued trust in us during these uncertain times.
Sincerely,
Jonathan Thomas
President and Chief Executive Officer
American Century Investments
By Scott Wittman, Chief Investment Officer, Quantitative Equity and Asset Allocation
U.S. Stocks Soared as Economy Improved
The U.S. stock market enjoyed very strong results for the 12 months ended June 30, 2011, with the broad equity indices returning more than 30%. The main catalyst for the sharp rally in stocks was growing investor confidence in a U.S. economic recovery, though that confidence faltered somewhat late in the period.
After a bumpy start resulting from an uncertain economic outlook, the equity market began a steady rise in September 2010 as improving economic data reassured investors that the economy would avoid a “double-dip” recession (a return to recession after a brief period of recovery). Most notably, employment growth turned positive after 2½ years of persistent job losses, and the manufacturing sector showed signs of life. In addition, a renewal of the Federal Reserve’s quantitative easing program and an extension of expiring federal tax breaks further boosted the market’s confidence that a promising economic recovery
was under way.
Stocks continued to advance in early 2011 despite unrest in the Middle East and North Africa, as well as a devastating earthquake and tsunami in Japan. By May, however, evidence of a slowdown in economic activity and renewed concerns about a European sovereign debt crisis weighed on investor confidence. As a result, stocks experienced a modest pullback in the final two months of the period.
Smaller Stocks and Growth-Oriented Issues Outperformed
Despite finishing on a down note, the broad equity indices posted robust returns overall for the 12-month period. As the table below illustrates, mid- and small-cap issues generated the best returns, outpacing large-cap shares. Meanwhile, growth stocks outperformed value across all market capitalizations, most dramatically among smaller companies. Every sector of the market produced double-digit gains for the period, led by energy and materials stocks, which benefited from strong demand and rising commodity prices. Other economically sensitive sectors—such as consumer discretionary and industrials—also fared well. The laggard was the financials sector, which continued to face mortgage-related challenges and regulatory uncertainty.
| U.S. Stock Index Returns |
| For the 12 months ended June 30, 2011 |
| Russell 1000 Index (Large-Cap) | 31.93% | | Russell 2000 Index (Small-Cap) | 37.41% |
| Russell 1000 Growth Index | 35.01% | | Russell 2000 Growth Index | 43.50% |
| Russell 1000 Value Index | 28.94% | | Russell 2000 Value Index | 31.35% |
| Russell Midcap Index | 38.47% | | | |
| Russell Midcap Growth Index | 43.25% | | | |
| Russell Midcap Value Index | 34.28% | | | |
| Total Returns as of June 30, 2011 |
| | | | Average Annual Returns | |
| | Ticker Symbol | 1 year(1) | 5 years | Since Inception | Inception Date |
| Institutional Class | ACLOX | 36.29% | -0.49% | -1.30% | 5/12/06 |
| S&P SmallCap 600 Index | — | 37.03% | 4.61% | 3.52%(2) | — |
| (1) | Extraordinary performance is attributable in part to unusually favorable market conditions and may not be repeated or consistently achieved in the future. |
| (2) | Since 4/30/06, the date nearest Institutional Class’s inception for which data are available. |
| Growth of $10,000 Life of Class |
| $10,000 investment made May 12, 2006 |
| * | From 5/12/06, the Institutional Class’s inception date. Index data from 4/30/06, the date nearest the Institutional Class’s inception for which data are available. Not annualized. |
| Total Annual Fund Operating Expenses |
Institutional Class 0.70% |
The total annual fund operating expenses shown is as stated in the fund’s prospectus current as of the date of this report. The prospectus may vary from the expense ratio shown elsewhere in this report because it is based on a different time period, includes acquired fund fees and expenses, and, if applicable, does not include fee waivers or expense reimbursements.
Data presented reflect past performance. Past performance is no guarantee of future results. Current performance may be higher or lower than the performance shown. Investment return and principal value will fluctuate, and redemption value may be more or less than original cost. To obtain performance data current to the most recent month end, please call 1-800-345-2021 or visit americancentury.com. Historically, small company stocks have been more volatile than the stocks of larger, more established companies.
Data assumes reinvestment of dividends and capital gains, and none of the charts reflect the deduction of taxes that a shareholder would pay on fund distributions or the redemption of fund shares. Returns for the index are provided for comparison. The fund’s total returns include operating expenses (such as transaction costs and management fees) that reduce returns, while the total returns of the index do not.
Portfolio Managers: Brian Garbe and Tal Sansani
Performance Summary
NT Small Company returned 36.29% for the fiscal year ended June 30, 2011, compared with the 37.03% return of its benchmark, the S&P SmallCap 600 Index.
NT Small Company posted a strong absolute return for the 12 months, reflecting a robust stock market rally led by smaller-cap stocks during the period (see page 3 for details). The fund’s return narrowly trailed that of the S&P SmallCap 600 Index for the reporting period.
Energy and Industrials Boosted Absolute Results
On an absolute basis, every sector in the NT Small Company portfolio posted gains of more than 20% for the 12 months. The fund’s energy and industrials stocks generated the best results. In particular, the fund’s energy holdings returned more than 70% as a group for the reporting period, led by the top two performance contributors in the portfolio—energy services and equipment provider Oil States International and oil and gas producer Stone Energy. In the industrials sector, the leading contributors were bearings manufacturer Timken and braking systems maker Hawk.
NT Small Company’s holdings in the health care sector also performed well during the reporting period. The best contributors in this sector included health care provider HealthSpring and medical equipment makers Cooper and Invacare.
The fund’s consumer staples and financials stocks lagged during the 12-month period. The biggest individual detractors were for-profit education firm Corinthian Colleges, wireless wholesaler Brightpoint, and electronic payment provider Global Cash Access Holdings.
Industrials and Financials Outperformed
Looking at relative performance, stock selection was most successful in the industrials and financials sectors of the portfolio compared with the S&P SmallCap 600 Index. Machinery manufacturers and aerospace and defense companies generated the bulk of the outperformance in the industrials sector. The top relative performance contributors were also the top absolute contributors—Timken and Hawk. Timken, which makes bearings for a variety of equipment and vehicles, consistently exceeded earnings expectations as demand picked up along with the economy. Hawk, a manufacturer of brakes, clutches, and transmissions, rallied after being acquired by industrial conglomerate Carlisle.
In the financials sector, stock choices among capital markets firms and an overweight in consumer finance companies added the most value. Top contributors included asset manager Calamos Asset Management and Cash America International, which runs pawn shops and payday lenders. Calamos benefited from the broad rise in the financial markets during the period, while growing demand for pawn services and an increase in online lending activity provided a boost to Cash America.
The best relative performance contributor in the portfolio for the 12 months was business software maker TIBCO Software, which rallied thanks to robust sales, higher profit margins, and takeover speculation. Other top contributors included oil and gas producer Stone Energy, which benefited from increased production and higher energy prices, and fabric store chain Jo-Ann Stores, which was acquired by a private equity firm.
Technology and Energy Lagged
The fund’s holdings in the information technology and energy sectors underperformed their counterparts in the S&P SmallCap 600 Index for the reporting period. The underperformance in the information technology sector was driven by stock choices among electronic equipment manufacturers and computer hardware makers. The biggest detractors in this sector were billing outsourcing firm CSG Systems International and touch screen maker Synaptics. CSG, which provides billing services for cable companies, took on a significant increase in debt to fund an acquisition, while Synaptics lost market share in the notebook computer space.
In the energy sector, the underperformance resulted primarily from an underweight position in energy equipment and services companies. The main detractors were missed opportunities—the fund’s limited exposure to oilfield services company Lufkin Industries and avoidance of oil refiner HollyFrontier hurt results as both stocks returned more than 100% for the 12-month period.
Other noteworthy detractors in the portfolio included language software purveyor Rosetta Stone and for-profit education firm Corinthian Colleges. Rosetta Stone lowered its earnings projections as sales in the U.S. declined, while Corinthian Colleges faced an uncertain regulatory environment. An underweight position in biotechnology firm Regeneron Pharmaceuticals also weighed on relative results; the stock rallied sharply as the company’s flagship drug showed strong results in a clinical trial for a new and expanded indication.
A Look Ahead
The eye-catching turmoil in the headlines over the last six months—democratic change sweeping through the Middle East, a devastating natural disaster in Japan, the possibility of a sovereign debt default in Europe—has led to heightened uncertainty and growing volatility in the equity market. But when you look at the past decade, there have been many other dramatic events that have had a similar impact on the market. When viewed through this lens, change and volatility have become more the rule than the exception.
It is this change dynamic that our investment process seeks to exploit and capitalize upon. Change and volatility leads to market inefficiencies, and within these inefficiencies lie investment opportunities. Rather than base investment decisions on vague financial headlines, we use our disciplined, data-driven, multi-factor investment process to take advantage of inefficiencies at the individual company level. We believe this approach will produce favorable returns over the long term.
| JUNE 30, 2011 |
| Top Ten Holdings | % of net assets |
| AMERIGROUP Corp. | 1.0% |
| Signature Bank | 0.8% |
| SEACOR Holdings, Inc. | 0.7% |
| Coinstar, Inc. | 0.7% |
| Cubist Pharmaceuticals, Inc. | 0.7% |
| Magellan Health Services, Inc. | 0.7% |
| CACI International, Inc., Class A | 0.7% |
| Southwest Gas Corp. | 0.6% |
| Veeco Instruments, Inc. | 0.6% |
| Toro Co. (The) | 0.6% |
| |
| Top Five Industries | % of net assets |
| Real Estate Investment Trusts (REITs) | 6.6% |
| Semiconductors & Semiconductor Equipment | 5.9% |
| Health Care Providers & Services | 4.8% |
| Commercial Banks | 4.7% |
| Specialty Retail | 4.4% |
| |
| Types of Investments in Portfolio | % of net assets |
| Common Stocks | 98.9% |
| Temporary Cash Investments | 1.1% |
| Other Assets and Liabilities | —* |
| *Category is less than 0.05% of total net assets. |
Fund shareholders may incur two types of costs: (1) transaction costs, including sales charges (loads) on purchase payments and redemption/exchange fees; and (2) ongoing costs, including management fees; distribution and service (12b-1) fees; and other fund expenses. This example is intended to help you understand your ongoing costs (in dollars) of investing in your fund and to compare these costs with the ongoing cost of investing in other mutual funds.
The example is based on an investment of $1,000 made at the beginning of the period and held for the entire period from January 1, 2011 to June 30, 2011.
Actual Expenses
The table provides information about actual account values and actual expenses for each class. You may use the information, together with the amount you invested, to estimate the expenses that you paid over the period. First, identify the share class you own. Then simply divide your account value by $1,000 (for example, an $8,600 account value divided by $1,000 = 8.6), then multiply the result by the number under the heading “Expenses Paid During Period” to estimate the expenses you paid on your account during this period.
If you hold Investor Class shares of any American Century Investments fund, or Institutional Class shares of the American Century Diversified Bond Fund, in an American Century Investments account (i.e., not a financial intermediary or retirement plan account), American Century Investments may charge you a $12.50 semiannual account maintenance fee if the value of those shares is less than $10,000. We will redeem shares automatically in one of your accounts to pay the $12.50 fee. In determining your total eligible investment amount, we will include your investments in all personal accounts (including American Century Investments Brokerage accounts) registered under your Social Security number. Personal accounts include individual accounts, joint accounts, UGMA/UTMA accounts, personal trusts, Coverdell Education Savings Accounts and IRAs (including traditional, Roth, Rollover, SEP-, SARSEP- and SIMPLE-IRAs), and certain other retirement accounts. If you have only business, business retirement, employer-sponsored or American Century Investments Brokerage accounts, you are currently not subject to this fee. We will not charge the fee as long as you choose to manage your accounts exclusively online. If you are subject to the Account Maintenance Fee, your account value could be reduced by the fee amount.
Hypothetical Example for Comparison Purposes
The table also provides information about hypothetical account values and hypothetical expenses based on the actual expense ratio of each class of your fund and an assumed rate of return of 5% per year before expenses, which is not the actual return of a fund’s share class. The hypothetical account values and expenses may not be used to estimate the actual ending account balance or expenses you paid for the period. You may use this information to compare the ongoing costs of investing in your fund and other funds. To do so, compare this 5% hypothetical example with the 5% hypothetical examples that appear in the shareholder reports of the other funds.
Please note that the expenses shown in the table are meant to highlight your ongoing costs only and do not reflect any transactional costs, such as sales charges (loads) or redemption/exchange fees. Therefore, the table is useful in comparing ongoing costs only, and will not help you determine the relative total costs of owning different funds. In addition, if these transactional costs were included, your costs would have been higher.
| | | | | |
| | Beginning Account Value 1/1/11 | Ending Account Value 6/30/11 | Expenses Paid During Period* 1/1/11 – 6/30/11 | Annualized Expense Ratio* |
| Actual |
| Institutional Class | $1,000 | $1,067.50 | $3.49 | 0.68% |
| Hypothetical |
| Institutional Class | $1,000 | $1,021.42 | $3.41 | 0.68% |
| * | Expenses are equal to the class’s annualized expense ratio listed in the table above, multiplied by the average account value over the period, multiplied by 181, the number of days in the most recent fiscal half-year, divided by 365, to reflect the one-half year period. |
| | | |
| | Shares | Value |
| Common Stocks — 98.9% |
| AEROSPACE & DEFENSE — 2.9% |
| AAR Corp. | 15,228 | $ 412,527 |
AeroVironment, Inc.(1) | 16,449 | 581,472 |
Astronics Corp.(1) | 10,195 | 314,006 |
| Cubic Corp. | 10,981 | 559,921 |
| Curtiss-Wright Corp. | 1,339 | 43,343 |
Esterline Technologies Corp.(1) | 8,994 | 687,142 |
GenCorp, Inc.(1) | 70,913 | 455,262 |
Moog, Inc., Class A(1) | 14,070 | 612,326 |
Teledyne Technologies, Inc.(1) | 1,880 | 94,677 |
| | | 3,760,676 |
| AIR FREIGHT & LOGISTICS — 1.1% |
Atlas Air Worldwide Holdings, Inc.(1) | 6,397 | 380,686 |
| Forward Air Corp. | 1,636 | 55,280 |
Hub Group, Inc., Class A(1) | 18,312 | 689,630 |
Park-Ohio Holdings Corp.(1) | 17,936 | 379,167 |
| | | 1,504,763 |
| AIRLINES — 0.3% |
Alaska Air Group, Inc.(1) | 5,858 | 401,039 |
| AUTO COMPONENTS — 0.3% |
| Spartan Motors, Inc. | 63,739 | 344,191 |
| BEVERAGES — 0.3% |
| Coca-Cola Bottling Co. Consolidated | 4,296 | 290,668 |
| National Beverage Corp. | 8,079 | 118,357 |
| | | 409,025 |
| BIOTECHNOLOGY — 2.8% |
AVEO Pharmaceuticals, Inc.(1) | 12,653 | 260,778 |
Cubist Pharmaceuticals, Inc.(1) | 24,323 | 875,385 |
Emergent Biosolutions, Inc.(1) | 19,226 | 433,546 |
Genomic Health, Inc.(1) | 8,621 | 240,612 |
Infinity Pharmaceuticals, Inc.(1) | 3,390 | 28,002 |
Nabi Biopharmaceuticals(1) | 42,253 | 227,321 |
Neurocrine Biosciences, Inc.(1) | 27,661 | 222,671 |
| PDL BioPharma, Inc. | 71,309 | 418,584 |
Regeneron Pharmaceuticals, Inc.(1) | 6,954 | 394,362 |
Rigel Pharmaceuticals, Inc.(1) | 17,560 | 161,025 |
SciClone Pharmaceuticals, Inc.(1) | 48,420 | 292,457 |
Targacept, Inc.(1) | 3,776 | 79,560 |
| | | 3,634,303 |
| BUILDING PRODUCTS — 0.6% |
Gibraltar Industries, Inc.(1) | 23,892 | 270,457 |
| Quanex Building Products Corp. | 18,058 | 295,971 |
Trex Co., Inc.(1) | 11,446 | 280,198 |
| | | 846,626 |
| CAPITAL MARKETS — 1.5% |
| Artio Global Investors, Inc. | 3,808 | 43,030 |
| Calamos Asset Management, Inc., Class A | 26,961 | 391,474 |
| Diamond Hill Investment Group, Inc. | 1,768 | 143,721 |
| Gladstone Capital Corp. | 13,781 | 127,336 |
INTL FCStone, Inc.(1) | 2,401 | 58,128 |
Investment Technology Group, Inc.(1) | 25,001 | 350,514 |
| optionsXpress Holdings, Inc. | 27,798 | 463,671 |
| Pzena Investment Management, Inc., Class A | 29,697 | 168,679 |
Virtus Investment Partners, Inc.(1) | 3,974 | 241,222 |
| | | 1,987,775 |
| CHEMICALS — 2.2% |
Ferro Corp.(1) | 27,236 | 366,052 |
Georgia Gulf Corp.(1) | 10,332 | 249,414 |
| Innophos Holdings, Inc. | 8,561 | 417,777 |
Innospec, Inc.(1) | 10,074 | 338,587 |
| Minerals Technologies, Inc. | 2,412 | 159,891 |
OM Group, Inc.(1) | 17,130 | 696,163 |
| PolyOne Corp. | 15,805 | 244,503 |
Senomyx, Inc.(1) | 7,018 | 36,073 |
| Sensient Technologies Corp. | 1,395 | 51,713 |
TPC Group, Inc.(1) | 8,421 | 330,272 |
| | | 2,890,445 |
| COMMERCIAL BANKS — 4.7% |
| Bank of Hawaii Corp. | 1,028 | 47,823 |
| Bank of the Ozarks, Inc. | 2,350 | 122,341 |
| City Holding Co. | 521 | 17,209 |
| City National Corp. | 4,559 | 247,326 |
| Columbia Banking System, Inc. | 10,482 | 180,500 |
| Community Bank System, Inc. | 18,287 | 453,335 |
| Enterprise Financial Services Corp. | 9,689 | 131,092 |
| F.N.B. Corp. | 5,190 | 53,716 |
| First Financial Bancorp | 28,562 | 476,700 |
| First Financial Bankshares, Inc. | 2,112 | 72,758 |
| First Midwest Bancorp., Inc. | 27,581 | 338,970 |
| Independent Bank Corp. | 4,846 | 127,208 |
| MainSource Financial Group, Inc. | 803 | $ 6,665 |
| NBT Bancorp., Inc. | 17,761 | 393,051 |
| Old National Bancorp. | 4,130 | 44,604 |
| PacWest Bancorp. | 14,833 | 305,115 |
| Prosperity Bancshares, Inc. | 7,161 | 313,795 |
Signature Bank(1) | 18,126 | 1,036,807 |
Sterling Financial Corp.(1) | 4,219 | 67,799 |
| Tompkins Financial Corp. | 5,535 | 217,193 |
| Trustmark Corp. | 9,246 | 216,449 |
| UMB Financial Corp. | 13,711 | 574,217 |
| Umpqua Holdings Corp. | 28,238 | 326,714 |
| United Bankshares, Inc. | 9,778 | 239,365 |
| Westamerica Bancorp. | 3,753 | 184,835 |
| | | 6,195,587 |
| COMMERCIAL SERVICES & SUPPLIES — 1.4% |
APAC Customer Services, Inc.(1) | 13,308 | 70,932 |
Consolidated Graphics, Inc.(1) | 6,636 | 364,648 |
| G&K Services, Inc., Class A | 606 | 20,519 |
| Knoll, Inc. | 15,749 | 316,082 |
Team, Inc.(1) | 1,115 | 26,905 |
Tetra Tech, Inc.(1) | 33,943 | 763,718 |
TRC Cos., Inc.(1) | 3,713 | 23,206 |
| Unifirst Corp. | 2,188 | 122,944 |
| Viad Corp. | 3,792 | 84,524 |
| | | 1,793,478 |
| COMMUNICATIONS EQUIPMENT — 1.0% |
Arris Group, Inc.(1) | 8,659 | 100,531 |
| Comtech Telecommunications Corp. | 20,306 | 569,380 |
DG FastChannel, Inc.(1) | 12,213 | 391,427 |
PC-Tel, Inc.(1) | 4,291 | 27,806 |
Symmetricom, Inc.(1) | 34,768 | 202,697 |
| | | 1,291,841 |
| COMPUTERS & PERIPHERALS — 0.7% |
QLogic Corp.(1) | 19,688 | 313,433 |
| Rimage Corp. | 1,792 | 24,067 |
Synaptics, Inc.(1) | 24,602 | 633,255 |
| | | 970,755 |
| CONSTRUCTION & ENGINEERING — 1.7% |
EMCOR Group, Inc.(1) | 27,977 | 820,006 |
| Great Lakes Dredge & Dock Corp. | 47,780 | 266,612 |
MasTec, Inc.(1) | 17,903 | 353,047 |
Michael Baker Corp.(1) | 1,647 | 34,785 |
| Primoris Services Corp. | 20,422 | 263,444 |
Sterling Construction Co., Inc.(1) | 16,134 | 222,165 |
URS Corp.(1) | 7,687 | 343,916 |
| | | 2,303,975 |
| CONSUMER FINANCE — 1.9% |
| Advance America Cash Advance Centers, Inc. | 59,527 | 410,141 |
| Cash America International, Inc. | 13,726 | 794,324 |
First Cash Financial Services, Inc.(1) | 13,985 | 587,230 |
| QC Holdings, Inc. | 2,991 | 11,964 |
World Acceptance Corp.(1) | 9,707 | 636,488 |
| | | 2,440,147 |
| CONTAINERS & PACKAGING — 0.2% |
| Boise, Inc. | 40,858 | 318,284 |
| DISTRIBUTORS — 0.3% |
Core-Mark Holding Co., Inc.(1) | 9,828 | 350,859 |
| Pool Corp. | 2,038 | 60,753 |
| | | 411,612 |
| DIVERSIFIED CONSUMER SERVICES — 1.9% |
Bridgepoint Education, Inc.(1) | 13,254 | 331,350 |
Coinstar, Inc.(1) | 16,186 | 882,784 |
| CPI Corp. | 12,665 | 166,545 |
ITT Educational Services, Inc.(1) | 4,765 | 372,814 |
| Lincoln Educational Services Corp. | 15,810 | 271,142 |
| Mac-Gray Corp. | 1,432 | 22,124 |
| Sotheby’s | 7,078 | 307,893 |
Steiner Leisure, Ltd.(1) | 2,243 | 102,460 |
| | | 2,457,112 |
| DIVERSIFIED FINANCIAL SERVICES — 0.7% |
| Asta Funding, Inc. | 2,843 | 23,853 |
| Compass Diversified Holdings | 19,972 | 329,338 |
GAIN Capital Holdings, Inc.(1) | 1,722 | 11,727 |
| Interactive Brokers Group, Inc., Class A | 32,911 | 515,057 |
| | | 879,975 |
DIVERSIFIED TELECOMMUNICATION SERVICES(2) |
Vonage Holdings Corp.(1) | 3,063 | 13,508 |
| ELECTRIC UTILITIES — 1.4% |
| Central Vermont Public Service Corp. | 7,791 | 281,645 |
| DPL, Inc. | 12,365 | 372,928 |
| Hawaiian Electric Industries, Inc. | 6,053 | 145,635 |
| MGE Energy, Inc. | 6,358 | 257,690 |
| UniSource Energy Corp. | 20,960 | 782,437 |
| | | 1,840,335 |
| ELECTRICAL EQUIPMENT — 0.3% |
II-VI, Inc.(1) | 908 | 23,245 |
Powell Industries, Inc.(1) | 6,958 | 253,967 |
Ultralife Corp.(1) | 18,582 | 87,149 |
| | | 364,361 |
| ELECTRONIC EQUIPMENT, INSTRUMENTS & COMPONENTS — 2.9% |
| Anixter International, Inc. | 2,068 | $ 135,123 |
Brightpoint, Inc.(1) | 13,735 | 111,391 |
Coherent, Inc.(1) | 55 | 3,040 |
Electro Scientific Industries, Inc.(1) | 7,310 | 141,083 |
Gerber Scientific, Inc.(1) | 12,131 | 135,018 |
Insight Enterprises, Inc.(1) | 31,438 | 556,767 |
| Littelfuse, Inc. | 8,886 | 521,786 |
LoJack Corp.(1) | 59,238 | 258,278 |
| Methode Electronics, Inc. | 44,323 | 514,590 |
Newport Corp.(1) | 28,792 | 523,151 |
PC Mall, Inc.(1) | 3,199 | 24,888 |
Power-One, Inc.(1) | 20,814 | 168,594 |
| Pulse Electronics Corp. | 54,296 | 239,988 |
Radisys Corp.(1) | 23,456 | 170,994 |
Vishay Intertechnology, Inc.(1) | 21,959 | 330,263 |
| | | 3,834,954 |
| ENERGY EQUIPMENT & SERVICES — 2.7% |
Complete Production Services, Inc.(1) | 1,151 | 38,397 |
ENGlobal Corp.(1) | 3,648 | 11,053 |
| Gulf Island Fabrication, Inc. | 14,525 | 468,867 |
Helix Energy Solutions Group, Inc.(1) | 21,020 | 348,091 |
ION Geophysical Corp.(1) | 66,691 | 630,897 |
OYO Geospace Corp.(1) | 3,520 | 352,000 |
| SEACOR Holdings, Inc. | 9,661 | 965,714 |
Tesco Corp.(1) | 2,470 | 47,943 |
Tetra Technologies, Inc.(1) | 46,002 | 585,606 |
TGC Industries, Inc.(1) | 10,290 | 65,753 |
| | | 3,514,321 |
| FOOD & STAPLES RETAILING — 0.7% |
| Nash Finch Co. | 1,185 | 42,435 |
| Ruddick Corp. | 10,111 | 440,233 |
| Spartan Stores, Inc. | 23,888 | 466,532 |
| | | 949,200 |
| FOOD PRODUCTS — 2.4% |
| B&G Foods, Inc. | 36,804 | 758,899 |
| Cal-Maine Foods, Inc. | 11,216 | 358,463 |
Dole Food Co., Inc.(1) | 8,520 | 115,190 |
| Flowers Foods, Inc. | 19,115 | 421,284 |
| Fresh Del Monte Produce, Inc. | 13,232 | 352,898 |
| J&J Snack Foods Corp. | 7,624 | 380,056 |
Omega Protein Corp.(1) | 23,903 | 329,861 |
Overhill Farms, Inc.(1) | 46,983 | 260,756 |
TreeHouse Foods, Inc.(1) | 3,087 | 168,581 |
| | | 3,145,988 |
| GAS UTILITIES — 1.7% |
| Chesapeake Utilities Corp. | 5,205 | 208,356 |
| Laclede Group, Inc. (The) | 17,204 | 650,827 |
| Piedmont Natural Gas Co., Inc. | 498 | 15,070 |
| South Jersey Industries, Inc. | 1,872 | 101,668 |
| Southwest Gas Corp. | 21,777 | 840,810 |
| WGL Holdings, Inc. | 10,440 | 401,836 |
| | | 2,218,567 |
| HEALTH CARE EQUIPMENT & SUPPLIES — 2.6% |
Align Technology, Inc.(1) | 24,837 | 566,284 |
| Cooper Cos., Inc. (The) | 4,764 | 377,499 |
Cyberonics, Inc.(1) | 2,054 | 57,409 |
Cynosure, Inc., Class A(1) | 8,094 | 97,937 |
Greatbatch, Inc.(1) | 21,127 | 566,626 |
Haemonetics Corp.(1) | 4,670 | 300,608 |
Integra LifeSciences Holdings Corp.(1) | 7,544 | 360,679 |
| Invacare Corp. | 19,399 | 643,853 |
Kensey Nash Corp.(1) | 19,862 | 501,118 |
| | | 3,472,013 |
| HEALTH CARE PROVIDERS & SERVICES — 4.8% |
American Dental Partners, Inc.(1) | 5,305 | 68,753 |
AMERIGROUP Corp.(1) | 18,510 | 1,304,400 |
Amsurg Corp.(1) | 5,743 | 150,065 |
Cross Country Healthcare, Inc.(1) | 1,554 | 11,810 |
Five Star Quality Care, Inc.(1) | 48,633 | 282,558 |
HealthSpring, Inc.(1) | 2,862 | 131,967 |
HMS Holdings Corp.(1) | 7,574 | 582,213 |
Magellan Health Services, Inc.(1) | 15,974 | 874,417 |
Molina Healthcare, Inc.(1) | 20,155 | 546,604 |
| Owens & Minor, Inc. | 10,286 | 354,764 |
PDI, Inc.(1) | 10,924 | 77,451 |
Providence Service Corp. (The)(1) | 21,545 | 272,544 |
PSS World Medical, Inc.(1) | 26,329 | 737,475 |
Team Health Holdings, Inc.(1) | 19,848 | 446,778 |
WellCare Health Plans, Inc.(1) | 8,342 | 428,862 |
| | | 6,270,661 |
| HEALTH CARE TECHNOLOGY — 1.2% |
| Computer Programs & Systems, Inc. | 7,913 | 502,317 |
HealthStream, Inc.(1) | 19,615 | 260,291 |
Omnicell, Inc.(1) | 3,231 | 50,371 |
| Quality Systems, Inc. | 9,033 | 788,581 |
| | | 1,601,560 |
| HOTELS, RESTAURANTS & LEISURE — 1.8% |
AFC Enterprises, Inc.(1) | 19,229 | $ 316,317 |
| Ameristar Casinos, Inc. | 17,770 | 421,327 |
| Cracker Barrel Old Country Store, Inc. | 10,193 | 502,617 |
Isle of Capri Casinos, Inc.(1) | 1,307 | 11,567 |
Multimedia Games Holding Co., Inc.(1) | 45,822 | 208,490 |
Papa John’s International, Inc.(1) | 4,045 | 134,537 |
| PF Chang’s China Bistro, Inc. | 15,581 | 626,979 |
Ruth’s Hospitality Group, Inc.(1) | 27,196 | 152,569 |
| | | 2,374,403 |
| HOUSEHOLD DURABLES — 0.4% |
| American Greetings Corp., Class A | 5,300 | 127,412 |
| CSS Industries, Inc. | 2,054 | 42,990 |
iRobot Corp.(1) | 10,811 | 381,520 |
| | | 551,922 |
| HOUSEHOLD PRODUCTS — 0.3% |
Central Garden and Pet Co., Class A(1) | 35,896 | 364,344 |
| INDUSTRIAL CONGLOMERATES — 0.3% |
| Seaboard Corp. | 152 | 367,536 |
| INSURANCE — 3.1% |
| Allied World Assurance Co. Holdings Ltd. | 4,695 | 270,338 |
| American Financial Group, Inc. | 8,989 | 320,817 |
American Safety Insurance Holdings Ltd.(1) | 17,074 | 326,796 |
| Aspen Insurance Holdings Ltd. | 14,318 | 368,402 |
| FBL Financial Group, Inc., Class A | 4,910 | 157,856 |
| Flagstone Reinsurance Holdings SA | 6,495 | 54,753 |
Hallmark Financial Services(1) | 897 | 7,059 |
| Horace Mann Educators Corp. | 19,042 | 297,246 |
| Maiden Holdings Ltd. | 46,555 | 423,650 |
| Meadowbrook Insurance Group, Inc. | 49,961 | 495,114 |
| Montpelier Re Holdings Ltd. | 19,441 | 349,938 |
National Financial Partners Corp.(1) | 37,103 | 428,169 |
| Selective Insurance Group, Inc. | 3,629 | 59,044 |
| State Auto Financial Corp. | 5,962 | 103,918 |
| United Fire & Casualty Co. | 9,761 | 169,549 |
| Universal Insurance Holdings, Inc. | 52,688 | 246,053 |
| | | 4,078,702 |
| INTERNET & CATALOG RETAIL — 0.3% |
Shutterfly, Inc.(1) | 7,289 | 418,534 |
| INTERNET SOFTWARE & SERVICES — 1.6% |
Ancestry.com, Inc.(1) | 10,951 | 453,262 |
Dice Holdings, Inc.(1) | 1,015 | 13,723 |
IAC/InterActiveCorp(1) | 11,224 | 428,420 |
Infospace, Inc.(1) | 19,383 | 176,773 |
j2 Global Communications, Inc.(1) | 22,059 | 622,725 |
| United Online, Inc. | 69,323 | 418,018 |
| | | 2,112,921 |
| IT SERVICES — 2.9% |
Acxiom Corp.(1) | 23,721 | 310,982 |
CACI International, Inc., Class A(1) | 13,837 | 872,838 |
Cardtronics, Inc.(1) | 25,344 | 594,317 |
Convergys Corp.(1) | 10,403 | 141,897 |
CSG Systems International, Inc.(1) | 25,112 | 464,070 |
Dynamics Research Corp.(1) | 11,460 | 156,314 |
| MAXIMUS, Inc. | 9,441 | 781,054 |
TeleTech Holdings, Inc.(1) | 24,620 | 518,990 |
| | | 3,840,462 |
| LEISURE EQUIPMENT & PRODUCTS — 1.2% |
Arctic Cat, Inc.(1) | 18,960 | 254,633 |
| Brunswick Corp. | 18,403 | 375,421 |
JAKKS Pacific, Inc.(1) | 24,003 | 441,895 |
| Polaris Industries, Inc. | 4,132 | 459,355 |
| | | 1,531,304 |
| MACHINERY — 4.1% |
| Alamo Group, Inc. | 12,235 | 289,970 |
| Albany International Corp., Class A | 20,598 | 543,581 |
Altra Holdings, Inc.(1) | 6,440 | 154,496 |
| Briggs & Stratton Corp. | 22,151 | 439,919 |
| Hardinge, Inc. | 2,695 | 29,402 |
Hurco Cos., Inc.(1) | 8,545 | 275,234 |
Kadant, Inc.(1) | 3,897 | 122,794 |
| L.B. Foster Co., Class A | 9,089 | 299,119 |
| Mueller Industries, Inc. | 11,506 | 436,192 |
| NACCO Industries, Inc., Class A | 3,538 | 342,549 |
Sauer-Danfoss, Inc.(1) | 7,454 | 375,607 |
| Timken Co. | 7,082 | 356,933 |
| Toro Co. (The) | 13,833 | 836,897 |
Trimas Corp.(1) | 6,431 | 159,167 |
| Twin Disc, Inc. | 10,747 | 415,157 |
| Wabtec Corp. | 4,212 | 276,813 |
| | | 5,353,830 |
| MEDIA — 0.8% |
| Arbitron, Inc. | 931 | 38,478 |
| John Wiley & Sons, Inc., Class A | 1,007 | 52,374 |
Journal Communications, Inc., Class A(1) | 13,366 | $ 69,102 |
LodgeNet Interactive Corp.(1) | 59,563 | 180,476 |
Madison Square Garden Co. (The), Class A(1) | 7,573 | 208,485 |
| Sinclair Broadcast Group, Inc., Class A | 34,672 | 380,699 |
SuperMedia, Inc.(1) | 35,443 | 132,911 |
| | | 1,062,525 |
| METALS & MINING — 0.7% |
Hecla Mining Co.(1) | 42,666 | 328,102 |
Noranda Aluminum Holding Corp.(1) | 23,685 | 358,591 |
| Silvercorp Metals, Inc. | 21,754 | 204,052 |
| | | 890,745 |
| MULTILINE RETAIL — 0.6% |
| Dillard’s, Inc., Class A | 6,893 | 359,401 |
Dollar Tree, Inc.(1) | 5,867 | 390,860 |
| | | 750,261 |
| MULTI-UTILITIES — 0.4% |
| Avista Corp. | 19,000 | 488,110 |
| OIL, GAS & CONSUMABLE FUELS — 2.2% |
Callon Petroleum Co.(1) | 42,075 | 295,366 |
Cloud Peak Energy, Inc.(1) | 17,004 | 362,185 |
CVR Energy, Inc.(1) | 18,366 | 452,171 |
| Delek US Holdings, Inc. | 22,349 | 350,879 |
| Panhandle Oil and Gas, Inc., Class A | 6,385 | 188,294 |
REX American Resources Corp.(1) | 20,107 | 333,776 |
Stone Energy Corp.(1) | 11,771 | 357,721 |
Toreador Resources Corp.(1) | 30,925 | 114,732 |
Vaalco Energy, Inc.(1) | 7,307 | 43,988 |
| W&T Offshore, Inc. | 13,966 | 364,792 |
| | | 2,863,904 |
| PAPER & FOREST PRODUCTS — 1.9% |
| Buckeye Technologies, Inc. | 23,337 | 629,632 |
Clearwater Paper Corp.(1) | 7,370 | 503,224 |
KapStone Paper and Packaging Corp.(1) | 35,124 | 582,005 |
| Neenah Paper, Inc. | 20,938 | 445,561 |
| P.H. Glatfelter Co. | 22,901 | 352,217 |
| | | 2,512,639 |
| PERSONAL PRODUCTS — 0.4% |
| Inter Parfums, Inc. | 1,058 | 24,366 |
Medifast, Inc.(1) | 4,810 | 114,141 |
Nature’s Sunshine Products, Inc.(1) | 1,470 | 28,635 |
USANA Health Sciences, Inc.(1) | 11,249 | 351,869 |
| | | 519,011 |
| PHARMACEUTICALS — 2.7% |
Cornerstone Therapeutics, Inc.(1) | 3,311 | 29,667 |
Depomed, Inc.(1) | 37,850 | 309,613 |
Endo Pharmaceuticals Holdings, Inc.(1) | 7,683 | 308,626 |
Impax Laboratories, Inc.(1) | 15,120 | 329,465 |
ISTA Pharmaceuticals, Inc.(1) | 7,514 | 57,444 |
Jazz Pharmaceuticals, Inc.(1) | 11,206 | 373,720 |
Medicines Co. (The)(1) | 20,954 | 345,951 |
| Medicis Pharmaceutical Corp., Class A | 10,700 | 408,419 |
Par Pharmaceutical Cos., Inc.(1) | 19,233 | 634,304 |
ViroPharma, Inc.(1) | 39,062 | 722,647 |
| | | 3,519,856 |
| PROFESSIONAL SERVICES — 1.7% |
| Barrett Business Services, Inc. | 1,210 | 17,327 |
| Corporate Executive Board Co. (The) | 8,136 | 355,136 |
Exponent, Inc.(1) | 7,513 | 326,891 |
GP Strategies Corp.(1) | 24,188 | 330,408 |
ICF International, Inc.(1) | 12,961 | 328,950 |
| Insperity, Inc. | 18,681 | 553,144 |
Mistras Group, Inc.(1) | 19,108 | 309,550 |
On Assignment, Inc.(1) | 3,901 | 38,347 |
| | | 2,259,753 |
| REAL ESTATE INVESTMENT TRUSTS (REITs) — 6.6% |
| Agree Realty Corp. | 1,807 | 40,350 |
| Ashford Hospitality Trust, Inc. | 13,674 | 170,241 |
| BioMed Realty Trust, Inc. | 849 | 16,335 |
| CBL & Associates Properties, Inc. | 8,926 | 161,828 |
| Colonial Properties Trust | 23,606 | 481,562 |
| Entertainment Properties Trust | 4,020 | 187,734 |
| Equity LifeStyle Properties, Inc. | 5,056 | 315,697 |
| Extra Space Storage, Inc. | 17,920 | 382,234 |
| Home Properties, Inc. | 13,678 | 832,717 |
| Kilroy Realty Corp. | 7,016 | 277,062 |
| Lexington Realty Trust | 74,259 | 677,985 |
| LTC Properties, Inc. | 5,891 | 163,888 |
| Medical Properties Trust, Inc. | 36,932 | 424,718 |
| Mid-America Apartment Communities, Inc. | 11,392 | 768,618 |
| Mission West Properties, Inc. | 30,086 | 264,155 |
| National Retail Properties, Inc. | 23,016 | 564,122 |
| Post Properties, Inc. | 13,915 | 567,175 |
| Potlatch Corp. | 10,046 | 354,323 |
| PS Business Parks, Inc. | 12,370 | 681,587 |
| Sovran Self Storage, Inc. | 9,179 | 376,339 |
| Tanger Factory Outlet Centers | 29,612 | 792,713 |
| Universal Health Realty Income Trust | 4,434 | $ 177,271 |
| U-Store-It Trust | 4,814 | 50,643 |
| | | 8,729,297 |
| REAL ESTATE MANAGEMENT & DEVELOPMENT — 0.2% |
FirstService Corp.(1) | 7,682 | 265,336 |
| ROAD & RAIL — 0.6% |
AMERCO, Inc.(1) | 3,559 | 342,198 |
| Heartland Express, Inc. | 7,115 | 117,824 |
Quality Distribution, Inc.(1) | 5,240 | 68,225 |
RailAmerica, Inc.(1) | 20,059 | 300,885 |
| | | 829,132 |
| SEMICONDUCTORS & SEMICONDUCTOR EQUIPMENT — 5.9% |
| ASM International NV New York Shares | 8,333 | 329,570 |
Cabot Microelectronics Corp.(1) | 7,767 | 360,932 |
Cypress Semiconductor Corp.(1) | 15,541 | 328,537 |
Entegris, Inc.(1) | 45,217 | 457,596 |
FEI Co.(1) | 21,674 | 827,730 |
Integrated Device Technology, Inc.(1) | 31,776 | 249,759 |
Kulicke & Soffa Industries, Inc.(1) | 46,839 | 521,786 |
Lattice Semiconductor Corp.(1) | 46,917 | 305,899 |
LTX-Credence Corp.(1) | 44,862 | 401,066 |
| Micrel, Inc. | 27,426 | 290,167 |
| MKS Instruments, Inc. | 22,545 | 595,639 |
OmniVision Technologies, Inc.(1) | 10,263 | 357,255 |
Photronics, Inc.(1) | 41,199 | 348,956 |
RF Micro Devices, Inc.(1) | 33,268 | 203,600 |
Rudolph Technologies, Inc.(1) | 17,219 | 184,416 |
Standard Microsystems Corp.(1) | 18,567 | 501,123 |
Teradyne, Inc.(1) | 9,931 | 146,979 |
Tessera Technologies, Inc.(1) | 27,225 | 466,637 |
Veeco Instruments, Inc.(1) | 17,319 | 838,413 |
| | | 7,716,060 |
| SOFTWARE — 3.6% |
ACI Worldwide, Inc.(1) | 11,636 | 392,948 |
| Blackbaud, Inc. | 3,837 | 106,362 |
BroadSoft, Inc.(1) | 7,833 | 298,672 |
Cadence Design Systems, Inc.(1) | 12,539 | 132,412 |
Magma Design Automation, Inc.(1) | 39,857 | 318,457 |
Manhattan Associates, Inc.(1) | 15,254 | 525,348 |
Monotype Imaging Holdings, Inc.(1) | 7,914 | 111,825 |
NetScout Systems, Inc.(1) | 14,355 | 299,876 |
| Opnet Technologies, Inc. | 5,699 | 233,317 |
Progress Software Corp.(1) | 30,855 | 744,531 |
QAD, Inc., Class A(1) | 4,004 | 40,921 |
QAD, Inc., Class B(1) | 1,562 | 14,527 |
Radiant Systems, Inc.(1) | 5,268 | 110,101 |
| Renaissance Learning, Inc. | 4,904 | 61,496 |
TeleNav, Inc.(1) | 21,592 | 382,826 |
TIBCO Software, Inc.(1) | 6,467 | 187,672 |
Websense, Inc.(1) | 28,614 | 743,106 |
| | | 4,704,397 |
| SPECIALTY RETAIL — 4.4% |
| Books-A-Million, Inc. | 1,636 | 5,677 |
| Cato Corp. (The), Class A | 16,887 | 486,346 |
Children’s Place Retail Stores, Inc. (The)(1) | 12,843 | 571,385 |
| Destination Maternity Corp. | 11,031 | 220,399 |
| Express, Inc. | 16,785 | 365,913 |
| Finish Line, Inc. (The), Class A | 30,002 | 642,043 |
GameStop Corp., Class A(1) | 15,127 | 403,437 |
Genesco, Inc.(1) | 14,799 | 771,028 |
Hibbett Sports, Inc.(1) | 15,313 | 623,392 |
| Monro Muffler Brake, Inc. | 2,377 | 88,638 |
| PEP Boys-Manny Moe & Jack | 17,092 | 186,816 |
Pier 1 Imports, Inc.(1) | 34,969 | 404,591 |
Select Comfort Corp.(1) | 35,908 | 645,626 |
| Stage Stores, Inc. | 17,098 | 287,247 |
Ulta Salon Cosmetics & Fragrance, Inc.(1) | 2,142 | 138,330 |
| | | 5,840,868 |
| TEXTILES, APPAREL & LUXURY GOODS — 1.4% |
Crocs, Inc.(1) | 1,135 | 29,226 |
Delta Apparel, Inc.(1) | 1,118 | 19,006 |
Iconix Brand Group, Inc.(1) | 33,993 | 822,631 |
| Oxford Industries, Inc. | 3,573 | 120,624 |
Perry Ellis International, Inc.(1) | 12,766 | 322,341 |
Quiksilver, Inc.(1) | 51,837 | 243,634 |
Warnaco Group, Inc. (The)(1) | 6,116 | 319,561 |
| Wolverine World Wide, Inc. | 549 | 22,921 |
| | | 1,899,944 |
| THRIFTS & MORTGAGE FINANCE — 0.4% |
| Brookline Bancorp., Inc. | 2,439 | 22,609 |
| Charter Financial Corp. | 1,749 | 17,315 |
| Provident Financial Services, Inc. | 16,465 | 235,779 |
| TrustCo Bank Corp. NY | 63,984 | 313,522 |
| | | 589,225 |
| TRADING COMPANIES & DISTRIBUTORS — 1.0% |
| Applied Industrial Technologies, Inc. | 16,336 | $ 581,725 |
Beacon Roofing Supply, Inc.(1) | 16,533 | 377,283 |
DXP Enterprises, Inc.(1) | 13,414 | 340,045 |
| | | 1,299,053 |
| WIRELESS TELECOMMUNICATION SERVICES — 0.2% |
| USA Mobility, Inc. | 20,640 | 314,966 |
TOTAL COMMON STOCKS(Cost $109,695,991) | 130,116,117 |
| Temporary Cash Investments — 1.1% |
| JPMorgan U.S. Treasury Plus Money Market Fund Agency Shares | 346,444 | 346,444 |
Repurchase Agreement, Bank of America N.A., (collateralized by various U.S. Treasury obligations, 4.375%, 11/15/39, valued at $413,835), in a joint trading account at 0.00%, dated 6/30/11, due 7/1/11 (Delivery value $404,465) | 404,465 |
Repurchase Agreement, Credit Suisse First Boston, Inc., (collateralized by various U.S. Treasury obligations, 3.50%, 5/15/20, valued at $343,899), in a joint trading account at 0.00%, dated 6/30/11, due 7/1/11 (Delivery value $337,054) | 337,054 |
Repurchase Agreement, Goldman Sachs Group, Inc., (collateralized by various U.S. Treasury obligations, 1.375%, 9/15/12, valued at $412,598), in a joint trading account at 0.00%, dated 6/30/11, due 7/1/11 (Delivery value $404,465) | 404,465 |
TOTAL TEMPORARY CASH INVESTMENTS(Cost $1,492,428) | 1,492,428 |
TOTAL INVESTMENT SECURITIES — 100.0%(Cost $111,188,419) | 131,608,545 |
OTHER ASSETS AND LIABILITIES(2) | (36,336) |
| TOTAL NET ASSETS — 100.0% | $131,572,209 |
Notes to Schedule of Investments
| (2) | Category is less than 0.05% of total net assets. |
See Notes to Financial Statements.
Statement of Assets and Liabilities |
| JUNE 30, 2011 | |
| Assets | |
| Investment securities, at value (cost of $111,188,419) | | | $131,608,545 | |
| Receivable for investments sold | | | 1,399 | |
| Receivable for capital shares sold | | | 1,892 | |
| Dividends and interest receivable | | | 94,265 | |
| | | | 131,706,101 | |
| | | | | |
| Liabilities | |
| Payable for capital shares redeemed | | | 63,764 | |
| Accrued management fees | | | 70,128 | |
| | | | 133,892 | |
| | | | | |
| Net Assets | | | $131,572,209 | |
| | | | | |
| Institutional Class Capital Shares, $0.01 Par Value | |
| Shares authorized | | | 100,000,000 | |
| Shares outstanding | | | 14,348,282 | |
| | | | | |
| Net Asset Value Per Share | | | $9.17 | |
| | | | | |
| Net Assets Consist of: | |
| Capital (par value and paid-in surplus) | | | $102,267,038 | |
| Undistributed net realized gain | | | 8,885,045 | |
| Net unrealized appreciation | | | 20,420,126 | |
| | | | $131,572,209 | |
See Notes to Financial Statements.
| YEAR ENDED JUNE 30, 2011 | |
| Investment Income (Loss) | |
| Income: | | | |
| Dividends (net of foreign taxes withheld of $349) | | | $1,156,999 | |
| Interest | | | 1,093 | |
| | | | 1,158,092 | |
| | | | | |
| Expenses: | | | | |
| Management fees | | | 741,328 | |
| Directors’ fees and expenses | | | 4,602 | |
| Other expenses | | | 788 | |
| | | | 746,718 | |
| | | | | |
| Net investment income (loss) | | | 411,374 | |
| | | | | |
| Realized and Unrealized Gain (Loss) | |
| Net realized gain (loss) on: | | | | |
| Investment transactions | | | 17,534,851 | |
| Futures contract transactions | | | 102,805 | |
| | | | 17,637,656 | |
| | | | | |
| Change in net unrealized appreciation (depreciation) on investments | | | 13,820,900 | |
| | | | | |
| Net realized and unrealized gain (loss) | | | 31,458,556 | |
| | | | | |
| Net Increase (Decrease) in Net Assets Resulting from Operations | | | $31,869,930 | |
See Notes to Financial Statements.
Statement of Changes in Net Assets |
| YEARS ENDED JUNE 30, 2011 AND JUNE 30, 2010 | |
| Increase (Decrease) in Net Assets | | 2011 | | | 2010 | |
| Operations | |
| Net investment income (loss) | | | $411,374 | | | | $228,602 | |
| Net realized gain (loss) | | | 17,637,656 | | | | 7,120,319 | |
| Change in net unrealized appreciation (depreciation) | | | 13,820,900 | | | | 4,418,683 | |
| Net increase (decrease) in net assets resulting from operations | | | 31,869,930 | | | | 11,767,604 | |
| | | | | | | | | |
| Distributions to Shareholders | |
| From net investment income | | | (494,062 | ) | | | (303,365 | ) |
| | | | | | | | | |
| Capital Share Transactions | |
| Proceeds from shares sold | | | 31,205,113 | | | | 23,323,122 | |
| Proceeds from reinvestment of distributions | | | 494,062 | | | | 9,999 | |
| Payments for shares redeemed | | | (7,935,726 | ) | | | (5,405,153 | ) |
| Net increase (decrease) in net assets from capital share transactions | | | 23,763,449 | | | | 17,927,968 | |
| | | | | | | | | |
| Net increase (decrease) in net assets | | | 55,139,317 | | | | 29,392,207 | |
| | | | | | | | | |
| Net Assets | |
| Beginning of period | | | 76,432,892 | | | | 47,040,685 | |
| End of period | | | $131,572,209 | | | | $76,432,892 | |
| | | | | | | | | |
| Undistributed net investment income | | | — | | | | $29,912 | |
| | | | | | | | | |
| Transactions in Shares of the Fund | |
| Sold | | | 3,982,369 | | | | 3,569,218 | |
| Issued in reinvestment of distributions | | | 59,864 | | | | 1,370 | |
| Redeemed | | | (995,671 | ) | | | (824,413 | ) |
| Net increase (decrease) in shares of the fund | | | 3,046,562 | | | | 2,746,175 | |
See Notes to Financial Statements.
Notes to Financial Statements |
JUNE 30, 2011
1. Organization
American Century Quantitative Equity Funds, Inc. (the corporation) is registered under the Investment Company Act of 1940, as amended (the 1940 Act), as an open-end management investment company and is organized as a Maryland corporation. NT Small Company Fund (the fund) is one fund in a series issued by the corporation. The fund is diversified as defined under the 1940 Act. The fund’s investment objective is to seek long-term capital growth. The fund pursues its objective by investing primarily in stocks of smaller-capitalization U.S. companies. The fund is not permitted to invest in any securities issued by companies assigned the Global Industry Classification Standard for the tobacco industry.
2. Significant Accounting Policies
The following is a summary of significant accounting policies consistently followed by the fund in preparation of its financial statements. The financial statements are prepared in conformity with accounting principles generally accepted in the United States of America, which may require management to make certain estimates and assumptions at the date of the financial statements. Actual results could differ from these estimates.
Investment Valuations — The fund determines the fair value of its investments and computes its net asset value per share as of the close of regular trading (usually 4 p.m. Eastern time) on the New York Stock Exchange (NYSE) on each day the NYSE is open.
Equity securities that are listed or traded on a domestic securities exchange are valued at the last reported sales price or at the official closing price as provided by the exchange. Equity securities traded on foreign securities exchanges are typically valued at the closing price on the exchange where primarily traded or as of the close of the NYSE, if that is earlier. If no last sales price is reported, or if local convention or regulation so provides, the mean of the latest bid and asked prices is used. Depending on local convention or regulation, securities traded over-the-counter are valued at the mean of the latest bid and asked prices, the last sales price, or the official closing price. In its determination of fair value, the fund may review several factors including: market information specific to a security; news developments in U.S. and foreign markets; the performance of particular U.S. and foreign securities, indices, comparable securities, American Depositary Receipts, Exchange-Traded Funds, and other relevant market indicators.
Debt securities maturing within 60 days at the time of purchase may be valued at cost, plus or minus any amortized discount or premium or at the evaluated mean as provided by an independent pricing service. Evaluated mean prices are commonly derived through utilization of market models, which may consider, among other factors, trade data, quotations from dealers and active market makers, relevant yield curve and spread data, related sector levels, creditworthiness, and other relevant market information on the same or comparable securities.
Investments in open-end management investment companies are valued at the reported net asset value per share. Repurchase agreements are valued at cost. Exchange-traded futures contracts are valued at the settlement price as provided by the appropriate clearing corporation.
If the fund determines that the market price for a portfolio security is not readily available or the valuation methods mentioned above do not reflect a security’s fair value, such security is valued as determined in good faith by the Board of Directors or its designee, in accordance with procedures adopted by the Board of Directors. Circumstances that may cause the fund to use these procedures to value a security include, but are not limited to: a security has been declared in default; trading in a security has been halted during the trading day; there is a foreign market holiday and no trading occurred; or an event occurred between the close of a foreign exchange and the NYSE that may affect the value of a security.
Security Transactions — Security transactions are accounted for as of the trade date. Net realized gains and losses are determined on the identified cost basis, which is also used for federal income tax purposes.
Investment Income — Dividend income less foreign taxes withheld, if any, is recorded as of the ex-dividend date. Distributions received on securities that represent a return of capital or capital gain are recorded as a reduction of cost of investments and/or as a realized gain. The fund estimates the components of distributions received that may be considered nontaxable distributions or capital gain distributions for income tax purposes. Interest income is recorded on the accrual basis and includes accretion of discounts and amortization of premiums.
Business Development Companies — The fund may invest in securities of closed-end investment companies that have elected to be treated as a business development company under the 1940 Act. A business development company operates similar to an exchange-traded fund and represents a portfolio of securities. The fund may purchase a business development company to gain exposure to the securities in the underlying portfolio. The risks of owning a business development company generally reflect the risks of owning the underlying securities. Business development companies have expenses that reduce their value.
Repurchase Agreements — The fund may enter into repurchase agreements with institutions that American Century Investment Management, Inc. (ACIM) (the investment advisor) has determined are creditworthy pursuant to criteria adopted by the Board of Directors. The fund requires that the collateral, represented by securities, received in a repurchase transaction be transferred to the custodian in a manner sufficient to enable the fund to obtain those securities in the event of a default under the repurchase agreement. ACIM monitors, on a daily basis, the securities transferred to ensure the value, including accrued interest, of the securities under each repurchase agreement is equal to or greater than amounts owed to the fund under each repurchase agreement.
Joint Trading Account — Pursuant to an Exemptive Order issued by the Securities and Exchange Commission, the fund, along with certain other funds in the American Century Investments family of funds, may transfer uninvested cash balances into a joint trading account. These balances are invested in one or more repurchase agreements that are collateralized by U.S. Treasury or Agency obligations.
Income Tax Status — It is the fund’s policy to distribute substantially all net investment income and net realized gains to shareholders and to otherwise qualify as a regulated investment company under provisions of the Internal Revenue Code. The fund is no longer subject to examination by tax authorities for years prior to 2008. At this time, management believes there are no uncertain tax positions which, based on their technical merit, would not be sustained upon examination and for which it is reasonably possible that the total amounts of unrecognized tax benefits will significantly change in the next twelve months. Accordingly, no provision has been made for federal or state income taxes.
Distributions to Shareholders — Distributions from net investment income, if any, are generally declared and paid quarterly. Distributions from net realized gains, if any, are generally declared and paid annually.
Indemnifications — Under the corporation’s organizational documents, its officers and directors are indemnified against certain liabilities arising out of the performance of their duties to the fund. In addition, in the normal course of business, the fund enters into contracts that provide general indemnifications. The maximum exposure under these arrangements is unknown as this would involve future claims that may be made against a fund. The risk of material loss from such claims is considered by management to be remote.
3. Fees and Transactions with Related Parties
Management Fees — The corporation has entered into a management agreement with ACIM, under which ACIM provides the fund with investment advisory and management services in exchange for a single, unified management fee (the fee). The agreement provides that all expenses of managing and operating the fund, except distribution and service fees, brokerage expenses, taxes, interest, fees and expenses of the independent directors (including legal counsel fees), and extraordinary expenses, will be paid by ACIM. The fee is computed and accrued daily based on the daily net assets of the fund and paid monthly in arrears. The fee consists of (1) an Investment Category Fee based on the daily net assets of the fund and certain other accounts managed by the investment advisor that are in the same broad investment category as the fund and (2) a Complex Fee based on the assets of all the funds in the American Century Investments family of funds. The rates for the Investment Category Fee range from 0.5380% to 0.7200%. The rates for the Complex Fee range from 0.0500% to 0.1100%. The effective annual management fee for the year ended June 30, 2011 was 0.68%.
Acquired Fund Fees and Expenses — The fund may invest in mutual funds, exchange-traded funds, and business development companies (the acquired funds). The fund will indirectly realize its pro rata share of the fees and expenses of the acquired funds in which it invests. These indirect fees and expenses are not paid out of the fund’s assets but are reflected in the return realized by the fund on its investment in the acquired funds.
Related Parties — Certain officers and directors of the corporation are also officers and/or directors of American Century Companies, Inc. (ACC), the parent of the corporation’s investment advisor, ACIM, the distributor of the corporation, American Century Investment Services, Inc., and the corporation’s transfer agent, American Century Services, LLC. The fund is wholly owned, in aggregate, by various funds in a series issued by American Century Asset Allocation Portfolios, Inc. (ACAAP). ACAAP does not invest in the fund for the purpose of exercising management or control.
The fund is eligible to invest in a money market fund for temporary purposes, which is managed by J.P. Morgan Investment Management, Inc. (JPMIM). The fund has a securities lending agreement with JPMorgan Chase Bank (JPMCB) and a mutual funds services agreement with J.P. Morgan Investor Services Co. (JPMIS). JPMCB is a custodian of the fund. JPMIM, JPMIS and JPMCB are wholly owned subsidiaries of JPMorgan Chase & Co. (JPM). JPM is an equity investor in ACC. The services provided to the fund by JPMIM, JPMIS and JPMCB terminated on July 31, 2011.
4. Investment Transactions
Purchases and sales of investment securities, excluding short-term investments, for the year ended June 30, 2011 were $122,983,615 and $100,041,767, respectively.
5. Fair Value Measurements
The fund’s securities valuation process is based on several considerations and may use multiple inputs to determine the fair value of the positions held by the fund. In conformity with accounting principles generally accepted in the United States of America, the inputs used to determine a valuation are classified into three broad levels as follows:
| • | Level 1 valuation inputs consist of unadjusted quoted prices in an active market for identical securities; |
| • | Level 2 valuation inputs consist of direct or indirect observable market data (including quoted prices for similar securities, evaluations of subsequent market events, interest rates, prepayment speeds, credit risk, etc.); or |
| • | Level 3 valuation inputs consist of unobservable data (including a fund’s own assumptions). |
The level classification is based on the lowest level input that is significant to the fair valuation measurement. The valuation inputs are not necessarily an indication of the risks associated with investing in these securities or other financial instruments.
The following is a summary of the level classifications as of period end. The Schedule of Investments provides additional information on the fund’s portfolio holdings.
| | | | | | | | | | |
| | | Level 1 | | | Level 2 | | | Level 3 | |
| Investment Securities | |
| Common Stocks | | | $130,116,117 | | | | — | | | | — | |
| Temporary Cash Investments | | | 346,444 | | | | $1,145,984 | | | | — | |
| Total Value of Investment Securities | | | $130,462,561 | | | | $1,145,984 | | | | — | |
6. Derivative Instruments
Equity Price Risk — The fund is subject to equity price risk in the normal course of pursuing its investment objectives. A fund may enter into futures contracts based on an equity index in order to manage its exposure to changes in market conditions. A fund may purchase futures contracts to gain exposure to increases in market value or sell futures contracts to protect against a decline in market value. Upon entering into a futures contract, a fund is required to deposit either cash or securities in an amount equal to a certain percentage of the contract value (initial margin). Subsequent payments (variation margin) are made or received daily, in cash, by a fund. The variation margin is equal to the daily change in the contract value and is recorded as unrealized gains and losses. A fund recognizes a realized gain or loss when the contract is closed or expires. Net realized and unrealized gains or losses occurring during the holding period of futures contracts are a component of net realized gain (loss) on futures contract transactions and change in net unrealized appreciation (depreciation) on futures contracts, respectively. One of the risks of entering into futures contracts is the possibility that the change in value of the contract may not correlate with the changes in value of the underlying securities. During the period, the fund infrequently purchased equity price risk derivative instruments for temporary investment purposes.
At period end, the fund did not have any equity price risk derivative instruments disclosed on the Statement of Assets and Liabilities. For the year ended June 30, 2011, the effect of equity price risk derivative instruments on the Statement of Operations was $102,805 in net realized gain (loss) on futures contract transactions.
7. Risk Factors
The fund concentrates its investments in stocks of small companies. Because of this, the fund may be subject to greater risk and market fluctuations than a fund investing in larger, more established companies.
8. Federal Tax Information
The tax character of distributions paid during the years ended June 30, 2011 and June 30, 2010 were as follows:
| | | | | | | |
| | | 2011 | | | 2010 | |
| Distributions Paid From | |
| Ordinary income | | | $442,084 | | | | $303,365 | |
| Long-term capital gains | | | $51,978 | | | | — | |
The book-basis character of distributions made during the year from net investment income or net realized gains may differ from their ultimate characterization for federal income tax purposes. These differences reflect the differing character of certain income items and net realized gains and losses for financial statement and tax purposes, and may result in reclassification among certain capital accounts on the financial statements.
As of June 30, 2011, the federal tax cost of investments and the components of distributable earnings on a tax-basis were as follows:
| | | | |
| Federal tax cost of investments | | | $112,440,317 | |
| Gross tax appreciation of investments | | | $21,864,356 | |
| Gross tax depreciation of investments | | | (2,696,128 | ) |
| Net tax appreciation (depreciation) of investments | | | $19,168,228 | |
| Undistributed ordinary income | | | — | |
| Accumulated long-term gains | | | $10,136,943 | |
The difference between book-basis and tax-basis cost and unrealized appreciation (depreciation) is attributable primarily to the tax deferral of losses on wash sales.
On December 22, 2010, the Regulated Investment Company Modernization Act of 2010 (the “Act”) was enacted, which changed various technical rules governing the tax treatment of regulated investment companies. The changes are generally effective for taxable years beginning after the date of enactment. Under the Act, the fund will be permitted to carry forward capital losses incurred in taxable years beginning after the date of enactment for an unlimited period.
| Institutional Class | |
| For a Share Outstanding Throughout the Years Ended June 30 (except as noted) | |
| | | 2011 | | | 2010 | | | 2009 | | | 2008 | | | 2007(1) | | | 2006(2) | |
| Per-Share Data | |
| Net Asset Value, Beginning of Period | | | $6.76 | | | | $5.50 | | | | $8.60 | | | | $10.65 | | | | $9.80 | | | | $10.00 | |
Income From Investment Operations | | | | | | | | | | | | | | | | | | | | | | | | |
Net Investment Income (Loss) | | | 0.03 | (3) | | | 0.02 | (3) | | | 0.03 | (3) | | | 0.03 | | | | 0.02 | | | | 0.02 | |
Net Realized and Unrealized Gain (Loss) | | | 2.42 | | | | 1.27 | | | | (3.11 | ) | | | (2.05 | ) | | | 0.84 | | | | (0.20 | ) |
Total From Investment Operations | | | 2.45 | | | | 1.29 | | | | (3.08 | ) | | | (2.02 | ) | | | 0.86 | | | | (0.18 | ) |
| Distributions | | | | | | | | | | | | | | | | | | | | | | | | |
From Net Investment Income | | | (0.04 | ) | | | (0.03 | ) | | | (0.02 | ) | | | (0.03 | ) | | | (0.01 | ) | | | (0.02 | ) |
Net Asset Value, End of Period | | | $9.17 | | | | $6.76 | | | | $5.50 | | | | $8.60 | | | | $10.65 | | | | $9.80 | |
| | | | | | | | | | | | | | | | | | | | | | | | | |
Total Return(4) | | | 36.29 | % | | | 23.50 | % | | | (35.83 | )% | | | (18.98 | )% | | | 8.77 | % | | | (1.78 | )% |
| | | | | | | | | | | | | | | | | | | | | | | | | |
| Ratios/Supplemental Data | |
Ratio of Operating Expenses to Average Net Assets | | | 0.69 | % | | | 0.69 | % | | | 0.70 | % | | | 0.67 | % | | | 0.67 | %(5) | | | 0.67 | %(5) |
Ratio of Net Investment Income (Loss) to Average Net Assets | | | 0.38 | % | | | 0.34 | % | | | 0.56 | % | | | 0.29 | % | | | 0.40 | %(5) | | | 0.39 | %(5) |
| Portfolio Turnover Rate | | | 93 | % | | | 78 | % | | | 110 | % | | | 143 | % | | | 73 | % | | | 82 | % |
| Net Assets, End of Period (in thousands) | | | $131,572 | | | | $76,433 | | | | $47,041 | | | | $28,178 | | | | $23,794 | | | | $18,216 | |
| (1) | January 1, 2007 through June 30, 2007. The fund’s fiscal year end was changed from December 31 to June 30, resulting in a six-month annual reporting period. For the years before June 30, 2007, the fund’s fiscal year end was December 31. |
| (2) | May 12, 2006 (fund inception) through December 31, 2006. |
| (3) | Computed using average shares outstanding throughout the period. |
| (4) | Total returns are calculated based on the net asset value of the last business day. Total returns for periods less than one year are not annualized. |
See Notes to Financial Statements.
Report of Independent Registered Public Accounting Firm |
To the Directors of the American Century Quantitative Equity Funds, Inc. and Shareholders of the NT Small Company Fund:
In our opinion, the accompanying statement of assets and liabilities, including the schedule of investments, and the related statements of operations and of changes in net assets and the financial highlights present fairly, in all material respects, the financial position of the NT Small Company Fund (one of the eleven funds comprising the American Century Quantitative Equity Funds, Inc., hereafter referred to as the “Fund”) at June 30, 2011, the results of its operations for the year then ended, the changes in its net assets for each of the two years in the period then ended and the financial highlights for each of the periods presented, in conformity with accounting principles generally accepted in the United States of America. These financial statements and financial highlights (hereafter referred to as “financial statements”) are the responsibility of the Fund’s management; our responsibility is to express an opinion on these financial statements based on our audits. We conducted our audits of these financial statements in accordance with the standards of the Public Company Accounting Oversight Board (United States). Those standards require that we plan and perform the audit to obtain reasonable assurance about whether the financial statements are free of material misstatement. An audit includes examining, on a test basis, evidence supporting the amounts and disclosures in the financial statements, assessing the accounting principles used and significant estimates made by management, and evaluating the overall financial statement presentation. We believe that our audits, which included confirmation of securities at June 30, 2011 by correspondence with the custodian and brokers, provide a reasonable basis for our opinion.
PricewaterhouseCoopers LLP
Kansas City, Missouri
August 18, 2011
Board of Directors
The individuals listed below serve as directors of the funds. Each director will continue to serve in this capacity until death, retirement, resignation or removal from office. The mandatory retirement age for directors who are not “interested persons,” as that term is defined in the Investment Company Act (independent directors), is 73. However, the mandatory retirement age may be extended for a period not to exceed two years with the approval of the remaining independent directors.
Mr. Thomas is the only director who is an “interested person” because he currently serves as President and Chief Executive Officer of American Century Companies, Inc. (ACC), the parent company of American Century Investment Management, Inc. (ACIM or the advisor).
The other directors (more than three-fourths of the total number) are independent; that is, they have never been employees, directors or officers of, and have no financial interest in, ACC or any of its wholly owned, direct or indirect, subsidiaries, including ACIM, American Century Investment Services, Inc. (ACIS) and American Century Services, LLC (ACS). The directors serve in this capacity for eight (in the case of Mr. Thomas, 15) registered investment companies in the American Century Investments family of funds.
The following presents additional information about the directors. The mailing address for each director other than Mr. Thomas is 1665 Charleston Road, Mountain View, California 94043. The mailing address for Mr. Thomas is 4500 Main Street, Kansas City, Missouri 64111.
| | | | | | |
Name (Year of Birth) | Position(s) Held with Funds | Length of Time Served | Principal Occupation(s) During Past 5 Years | Number of American Century Portfolios Overseen by Director | Other Directorships Held During Past 5 Years |
| Independent Directors |
Tanya S. Beder (1955) | Director | Since 2011 | Chairman, SBCC Group Inc. (investment advisory services) (2006 to present); Fellow in Practice, International Center for Finance, Yale University School of Management (1985 to present); Chief Executive Officer, Tribeca Global Management LLC (asset management firm) (2004 to 2006) | 40 | None |
Jeremy I. Bulow (1954) | Director | Since 2011 | Professor of Economics, Stanford University, Graduate School of Business (1979 to present) | 40 | None |
John Freidenrich (1937) | Director | Since 2005 | Founder, Member and Manager, Regis Management Company, LLC (investment management firm) (April 2004 to present) | 40 | None |
| | | | | | |
Name (Year of Birth) | Position(s) Held with Funds | Length of Time Served | Principal Occupation(s) During Past 5 Years | Number of American Century Portfolios Overseen by Director | Other Directorships Held During Past 5 Years |
| Independent Directors |
Ronald J. Gilson (1946) | Director and Chairman of the Board | Since 1995 | Charles J. Meyers Professor of Law and Business, Stanford Law School (1979 to present); Marc and Eva Stern Professor of Law and Business, Columbia University School of Law (1992 to present) | 40 | None |
Frederick L. A. Grauer (1946) | Director | Since 2008 | Senior Advisor, BlackRock, Inc. (investment management firm) (2010 to 2011); Senior Advisor, Barclays Global Investors (investment management firm) (2003 to 2009) | 40 | None |
Peter F. Pervere (1947) | Director | Since 2007 | Retired | 40 | Intraware, Inc. (2003 to 2009) |
Myron S. Scholes (1941) | Director | Since 1980 | Chairman, Platinum Grove Asset Management, L.P. (asset manager) (1999 to 2009); Frank E. Buck Professor of Finance-Emeritus, Stanford Graduate School of Business (1996 to present) | 40 | Dimensional Fund Advisors (investment advisor); CME Group, Inc. (futures and options exchange) |
John B. Shoven (1947) | Director | Since 2002 | Professor of Economics, Stanford University (1973 to present) | 40 | Cadence Design Systems; Exponent; Financial Engines; Watson Wyatt Worldwide (2002 to 2006) |
| |
| Interested Director |
Jonathan S. Thomas (1963) | Director and President | Since 2007 | President and Chief Executive Officer, ACC (March 2007 to present); Chief Administrative Officer, ACC (February 2006 to February 2007); Executive Vice President, ACC (November 2005 to February 2007). Also serves as: Chief Executive Officer and Manager, ACS; Executive Vice President, ACIM; Director, ACC, ACIM and other ACC subsidiaries | 104 | None |
Officers
The following table presents certain information about the executive officers of the funds. Each officer serves as an officer for each of the 15 investment companies in the American Century family of funds, unless otherwise noted. No officer is compensated for his or her service as an officer of the funds. The listed officers are interested persons of the funds and are appointed or re-appointed on an annual basis. The mailing address for each of the officers listed below is 4500 Main Street, Kansas City, Missouri 64111.
| | | |
Name (Year of Birth) | Offices with the Funds | Principal Occupation(s) During the Past Five Years |
Jonathan S. Thomas (1963) | Director and President since 2007 | President and Chief Executive Officer, ACC (March 2007 to present); Chief Administrative Officer, ACC (February 2006 to February 2007); Executive Vice President, ACC (November 2005 to February 2007). Also serves as: Chief Executive Officer and Manager, ACS; Executive Vice President, ACIM; Director, ACC, ACIM and other ACC subsidiaries |
Barry Fink (1955) | Executive Vice President since 2007 | Chief Operating Officer and Executive Vice President, ACC (September 2007 to present); President, ACS (October 2007 to present); Managing Director, Morgan Stanley (2000 to 2007); Global General Counsel, Morgan Stanley (2000 to 2006). Also serves as: Manager, ACS and Director, ACC and certain ACC subsidiaries |
Maryanne L. Roepke (1956) | Chief Compliance Officer since 2006 and Senior Vice President since 2000 | Chief Compliance Officer, American Century funds, ACIM and ACS (August 2006 to present); Assistant Treasurer, ACC (January 1995 to August 2006); and Treasurer and Chief Financial Officer, various American Century funds (July 2000 to August 2006). Also serves as: Senior Vice President, ACS |
Charles A. Etherington (1957) | General Counsel since 2007 and Senior Vice President since 2006 | Attorney, ACC (February 1994 to present); Vice President, ACC (November 2005 to present), General Counsel, ACC (March 2007 to present); Also serves as General Counsel, ACIM, ACS, ACIS and other ACC subsidiaries; and Senior Vice President, ACIM and ACS |
Robert J. Leach (1966) | Vice President, Treasurer and Chief Financial Officer since 2006 | Vice President, ACS (February 2000 to present); and Controller, various American Century funds (1997 to September 2006) |
David H. Reinmiller (1963) | Vice President since 2001 | Attorney, ACC (January 1994 to present); Associate General Counsel, ACC (January 2001 to present); Also serves as Vice President, ACIM and ACS |
Ward D. Stauffer (1960) | Secretary since 2005 | Attorney, ACC (June 2003 to present) |
The Statement of Additional Information has additional information about the fund’s directors and is available without charge, upon request, by calling 1-800-345-2021.
| Approval of Management Agreement |
At a meeting held on June 28, 2011, the Fund’s Board of Directors/Trustees unanimously approved the renewal of the management agreement pursuant to which American Century Investment Management, Inc. (the “Advisor”) acts as the investment advisor for the Fund. Under Section 15(c) of the Investment Company Act, contracts for investment advisory services are required to be reviewed, evaluated, and approved by a majority of a fund’s independent directors/trustees (the “Directors”) each year.
As a part of the approval process, the Board requested and reviewed extensive data and information compiled by the Advisor and certain independent providers of evaluation data concerning the Fund and the services provided to the Fund by the Advisor. This review was in addition to the oversight and evaluation undertaken by the Board and its committees on a continuous basis throughout the year and included, but was not limited to the following:
| • | the nature, extent, and quality of investment management, shareholder services, and other services provided by the Advisor to the Fund; |
| • | the wide range of other programs and services the Advisor provides to the Fund and its shareholders on a routine and non-routine basis; |
| • | the investment performance of the fund, including data comparing the Fund’s performance to appropriate benchmarks and/or a peer group of other mutual funds with similar investment objectives and strategies; |
| • | data comparing the cost of owning the Fund to the cost of owning similar funds; |
| • | the Advisor’s compliance policies, procedures, and regulatory experience; |
| • | financial data showing the cost of services provided to the Fund, the profitability of the Fund to the Advisor, and the overall profitability of the Advisor; |
| • | data comparing services provided and charges to other investment management clients of the Advisor; and |
| consideration of collateral benefits derived by the Advisor from the management of the Fund and any potential economies of scale relating thereto. |
In keeping with its practice, the Board held two in-person meetings and one telephonic meeting to review and discuss the information provided. The Board also had the benefit of the advice of its independent counsel throughout the period.
Factors Considered
The Directors considered all of the information provided by the Advisor, the independent data providers, and the Board’s independent counsel, and evaluated such information for the Fund. In connection with their review, the Directors did not identify any single factor as being all-important or controlling, and each Director may have attributed different levels of importance to different factors. In deciding to renew the management agreement, the Board based its decision on a number of factors, including the following:
Nature, Extent and Quality of Services — Generally. Under the management agreement, the Advisor is responsible for providing or arranging for all services necessary for the operation of the Fund. The Board noted that under the management agreement, the Advisor provides or arranges at its own expense a wide variety of services including:
| • | constructing and designing the Fund |
| • | portfolio research and security selection |
| • | initial capitalization/funding |
| • | daily valuation of the Fund’s portfolio |
| • | shareholder servicing and transfer agency, including shareholder confirmations, recordkeeping, and communications |
| • | regulatory and portfolio compliance |
| • | marketing and distribution |
The Board noted that many of these services have expanded over time both in terms of quantity and complexity in response to shareholder demands, competition in the industry, changing distribution channels, and the changing regulatory environment.
Investment Management Services. The nature of the investment management services provided to the Fund is quite complex and allows Fund shareholders access to professional money management, instant diversification of their investments within an asset class, the opportunity to easily diversify among asset classes by investing in or exchanging among various American Century Investments funds, and liquidity. In evaluating investment performance, the Board expects the Advisor to manage the Fund in accordance with its investment objectives and approved strategies. Further, the Directors recognize that the Advisor has an obligation to seek the best execution of fund trades. In providing these services, the Advisor utilizes teams of investment professionals (portfolio managers, analysts, research assistants, and securities traders) who require extensive information technology, research, training, compliance and other systems to conduct their business. The Board, directly and through its Portfolio Committee, regularly reviews investment performance information for the Fund, together with comparative information for appropriate benchmarks and/or peer groups
of similarly-managed funds, over different time horizons. The Directors also review detailed performance information during the management agreement approval process. If performance concerns are identified, the Fund receives special reviews until performance improves, during which the Board discusses with the Advisor the reasons for such results (e.g., market conditions, security selection) and any efforts being undertaken to improve performance. The Board found the investment management services provided by the Advisor to the Fund to meet or exceed industry standards. More detailed information about the Fund’s performance can be found in the Performance and Portfolio Commentary sections of this report.
Shareholder and Other Services. Under the management agreement, the Advisor provides the Fund with a comprehensive package of transfer agency, shareholder, and other services. The Board, directly and through various committees of the Board, regularly reviews reports and evaluations of such services at its regular meetings. These reports include, but are not limited to, information regarding the operational efficiency and accuracy of the shareholder and transfer agency services provided, staffing levels, shareholder satisfaction (as measured by external as well as internal sources), technology support, new products and services offered to Fund shareholders, securities trading activities, portfolio valuation services, auditing services, and legal and operational compliance activities. Certain aspects of shareholder and transfer agency service level efficiency and the quality of securities trading activities are measured by independent third party providers and are presented in comparison to other fund groups not managed by the Advisor. The Board found the services provided by the Advisor to the Fund under the management agreement to be competitive and of high quality.
Costs of Services and Profitability. The Advisor provides detailed information concerning its cost of providing various services to the Fund, its profitability in managing the Fund, its overall profitability, and its financial condition. The Directors have reviewed with the Advisor the methodology used to prepare this financial information. The financial information regarding the Advisor is considered in evaluating the Advisor’s financial condition, ability to continue to provide services under the management agreement, and the reasonableness of the current management fee. The Board concluded that the Advisor’s profits were reasonable in light of the services provided to the Fund.
Ethics. The Board generally considers the Advisor’s commitment to providing quality services to shareholders and to conducting its business ethically. They noted that the Advisor’s practices generally meet or exceed industry best practices.
Economies of Scale. The Board also reviewed information provided by the Advisor regarding the possible existence of economies of scale in connection with the management of the Fund. The Board concluded that economies of scale are difficult to measure and predict with precision, especially on a fund-by-fund basis. The Board concluded that the Advisor is appropriately sharing economies of scale through its competitive fee structure, offering competitive fees from fund inception, and through reinvestment in its business to provide shareholders additional content and services.
Comparison to Other Funds’ Fees. The management agreement provides that the Fund pay the Advisor a single, all-inclusive (or unified) management fee for providing all services necessary for the management and operation of the Fund, other than brokerage expenses, taxes, interest, extraordinary expenses, and the fees and expenses of the Fund’s independent directors (including their independent legal counsel) and expenses incurred in connection with the provision of shareholder services and distribution services under a plan adopted pursuant to Rule 12b-1 under the 1940 Act. Under the unified fee structure, the Advisor is responsible for providing all investment advisory, custody, audit, administrative, compliance, recordkeeping, marketing and shareholder services, or arranging and supervising third parties to provide such services. By contrast, most other funds are charged a variety of fees, including an investment advisory fee, a transfer agency fee, an administrative fee, distribution charges and other expenses. Other than their investment advisory fees and any applicable Rule 12b-1 distribution fees, all other components of the total fees charged by these other funds may be increased without shareholder approval. The Board believes the unified fee structure is a benefit to Fund shareholders because it clearly discloses to shareholders the cost of owning Fund shares, and, since the unified fee cannot be increased without a vote of Fund shareholders, it shifts to the Advisor the risk of increased costs of operating the Fund and provides a direct incentive to minimize administrative inefficiencies. Part of the Board’s analysis of fee levels involves reviewing certain evaluative data compiled by an independent provider and comparing the Fund’s unified fee to the total expense ratio of other funds in the Fund’s peer group. The Board concluded that the management fee paid by the Fund to the Advisor under the management agreement is reasonable in light of the services provided to the Fund.
Comparison to Fees and Services Provided to Other Clients of the Advisor. The Board also requested and received information from the Advisor concerning the nature of the services, fees, costs and profitability of its advisory services to advisory clients other than the Fund. They observed that these varying types of client accounts require different services and involve different regulatory and entrepreneurial risks than the management of the Fund. The Board analyzed this information and concluded that the fees charged and services provided to the Fund were reasonable by comparison.
Collateral or “Fall-Out” Benefits Derived by the Advisor. The Board considered the existence of collateral benefits the Advisor may receive as a result of its relationship with the Fund. They concluded that the Advisor’s primary business is managing mutual funds and it generally does not use fund or shareholder information to generate profits in other lines of business, and therefore does not derive any significant collateral benefits from them. The Board noted that the Advisor receives proprietary research from broker-dealers that execute fund portfolio transactions and concluded that this research is likely to benefit Fund shareholders. The Board also determined that the Advisor is able to provide investment management services to certain clients other than the Fund, at least in part, due to its existing infrastructure built to serve the fund complex. The Board concluded, however, that the assets of those other clients are not material to the analysis and, where applicable, may be included with the assets of the Fund to determine breakpoints in the management fee schedule.
Existing Relationship. The Board also considered whether there was any reason for not continuing the existing arrangement with the Advisor. In this regard, the Board was mindful of the potential disruptions of the Fund’s operations and various risks, uncertainties, and other effects that could occur as a result of a decision not to continue such relationship. In particular, the Board recognized that most shareholders have invested in the Fund on the strength of the Advisor’s industry standing and reputation and in the expectation that the Advisor will have a continuing role in providing advisory services to the Fund.
Conclusion of the Directors. As a result of this process, the Board, including all of the independent directors and assisted by the advice of independent legal counsel, taking into account all of the factors discussed above and the information provided by the Advisor and others, concluded that the management agreement between the Fund and the Advisor is fair and reasonable in light of the services provided and should be renewed.
Retirement Account Information
As required by law, distributions you receive from certain IRAs, or 403(b), 457 and qualified plans are subject to federal income tax withholding, unless you elect not to have withholding apply. Tax will be withheld on the total amount withdrawn even though you may be receiving amounts that are not subject to withholding, such as nondeductible contributions. In such case, excess amounts of withholding could occur. You may adjust your withholding election so that a greater or lesser amount will be withheld.
If you don’t want us to withhold on this amount, you must notify us to not withhold the federal income tax. You may notify us in writing or in certain situations by telephone or through other electronic means. You have the right to revoke your withholding election at any time and any election you make may remain in effect until revoked by filing a new election.
Remember, even if you elect not to have income tax withheld, you are liable for paying income tax on the taxable portion of your withdrawal. If you elect not to have income tax withheld or you don’t have enough income tax withheld, you may be responsible for payment of estimated tax. You may incur penalties under the estimated tax rules if your withholding and estimated tax payments are not sufficient. You can reduce or defer the income tax on a distribution by directly or indirectly rolling such distribution over to another IRA or eligible plan. You should consult your tax advisor for additional information.
State tax will be withheld if, at the time of your distribution, your address is within one of the mandatory withholding states and you have federal income tax withheld. State taxes will be withheld from your distribution in accordance with the respective state rules.
Proxy Voting Guidelines
American Century Investment Management, Inc., the fund’s investment advisor, is responsible for exercising the voting rights associated with the securities purchased and/or held by the fund. A description of the policies and procedures the advisor uses in fulfilling this responsibility is available without charge, upon request, by calling 1-800-345-2021. It is also available on American Century Investments’ website at americancentury.com and on the Securities and Exchange Commission’s website at sec.gov. Information regarding how the investment advisor voted proxies relating to portfolio securities during the most recent 12-month period ended June 30 is available on the “About Us” page at americancentury.com. It is also available at sec.gov.
Quarterly Portfolio Disclosure
The fund files its complete schedule of portfolio holdings with the Securities and Exchange Commission (SEC) for the first and third quarters of each fiscal year on Form N-Q. The fund’s Forms N-Q are available on the SEC’s website at sec.gov, and may be reviewed and copied at the SEC’s Public Reference Room in Washington, DC. Information on the operation of the Public Reference Room may be obtained by calling 1-800-SEC-0330. The fund also makes its complete schedule of portfolio holdings for the most recent quarter of its fiscal year available on its website at americancentury.com and, upon request, by calling 1-800-345-2021.
Other Tax Information
The following information is provided pursuant to provisions of the Internal Revenue Code.
The fund hereby designates up to the maximum amount allowable as qualified dividend income for the fiscal year ended June 30, 2011.
For corporate taxpayers, the fund hereby designates $442,084, or up to the maximum amount allowable, of ordinary income distributions paid during the fiscal year ended June 30, 2011 as qualified for the corporate dividends received deduction.
The fund hereby designates $51,978, or up to the maximum amount allowable, as long-term capital gain distributions for the fiscal year ended June 30, 2011.
| Contact Us | americancentury.com |
| Automated Information Line | 1-800-345-8765 |
| Investor Services Representative | 1-800-345-2021 or 816-531-5575 |
| Investors Using Advisors | 1-800-378-9878 |
| Business, Not-For-Profit, Employer-Sponsored Retirement Plans | 1-800-345-3533 |
| Banks and Trust Companies, Broker-Dealers, Financial Professionals, Insurance Companies | 1-800-345-6488 |
| Telecommunications Device for the Deaf | 1-800-634-4113 |
American Century Quantitative Equity Funds, Inc.
Investment Advisor:
American Century Investment Management, Inc.
Kansas City, Missouri
This report and the statements it contains are submitted for the general information of our shareholders. The report is not authorized for distribution to prospective investors unless preceded or accompanied by an effective prospectus.
©2011 American Century Proprietary Holdings, Inc. All rights reserved.
CL-ANN-72463 1108
ANNUAL REPORT JUNE 30, 2011
| President’s Letter | 2 |
| Market Perspective | 3 |
| Performance | 4 |
| Portfolio Commentary | 6 |
| Fund Characteristics | 8 |
| Shareholder Fee Example | 9 |
| Schedule of Investments | 11 |
| Statement of Assets and Liabilities | 18 |
| Statement of Operations | 19 |
| Statement of Changes in Net Assets | 20 |
| Notes to Financial Statements | 21 |
| Financial Highlights | 27 |
| Report of Independent Registered Public Accounting Firm | 32 |
| Management | 33 |
| Approval of Management Agreement | 36 |
| Additional Information | 41 |
Any opinions expressed in this report reflect those of the author as of the date of the report, and do not necessarily represent the opinions of American Century Investments® or any other person in the American Century Investments organization. Any such opinions are subject to change at any time based upon market or other conditions and American Century Investments disclaims any responsibility to update such opinions. These opinions may not be relied upon as investment advice and, because investment decisions made by American Century Investments funds are based on numerous factors, may not be relied upon as an indication of trading intent on behalf of any American Century Investments fund. Security examples are used for representational purposes only and are not intended as recommendations to purchase or sell securities. Performance information for comparative indices and securities is provided to American Century Investments by third party vendors. To the best of American Century Investments’ knowledge, such information is accurate at the time of printing.
Dear Investor:
Thank you for reviewing this annual report for the period ended June 30, 2011. Our report offers investment performance and portfolio information, presented with the expert perspective and commentary of our portfolio management team.
This report remains one of our most important vehicles for conveying information about investment performance and the market factors and strategies that affect fund returns. For additional, updated information on fund performance, portfolio strategy, and the investment markets, we encourage you to visit our website, americancentury.com. Click on the “Fund Performance” and “Insights & News” headings at the top of our Individual Investors site.
Reporting Period Perspective: Highest Broad Fiscal-Year U.S. Stock Returns Since 1997
Benefitting from favorable conditions and expectations, the U.S. stock market produced exceptional returns, the highest for any 12-month period ended June 30 since the fiscal year ended June 30, 1997. Back then, the S&P 500 Index gained 34.71%, compared with 30.69% for the most-recent reporting period. The intervening 14 years help illustrate how infrequently such a high level of performance occurs, requiring an alignment of economic and market conditions that’s difficult to duplicate.
The exceptional returns experienced during the reporting period represent a rebound from previous declines. After experiencing 10–12% declines during the second quarter of 2010—stemming from the European sovereign debt crisis and double-dip recession fears—most broad U.S. stock indices advanced 30% or more during the following 12 months. Monetary and fiscal intervention in 2010 stimulated growth and fueled investor optimism about economic and financial market conditions in 2011 and 2012, encouraging investments in riskier assets.
However, that optimism has diminished in the summer of 2011 as the European debt crisis returned to prominence and other debt and economic challenges emerged. As the reporting period came to a close in June 2011, we saw increasing signs that the U.S. economic recovery had lost momentum. As a result, economic growth forecasts were reduced, and broad U.S. stock indices trended downward beginning in May. As we enter the third quarter of 2011, investor concern over fiscal austerity measures in the U.S. and other developed economies raised fears of a return to recession and accelerated a decline in global equity markets. We appreciate your continued trust in us during these uncertain times.
Sincerely,
Jonathan Thomas
President and Chief Executive Officer
American Century Investments
By Scott Wittman, Chief Investment Officer, Quantitative Equity and Asset Allocation
U.S. Stocks Soared as Economy Improved
The U.S. stock market enjoyed very strong results for the 12 months ended June 30, 2011, with the broad equity indices returning more than 30%. The main catalyst for the sharp rally in stocks was growing investor confidence in a U.S. economic recovery, though that confidence faltered somewhat late in the period.
After a bumpy start resulting from an uncertain economic outlook, the equity market began a steady rise in September 2010 as improving economic data reassured investors that the economy would avoid a “double-dip” recession (a return to recession after a brief period of recovery). Most notably, employment growth turned positive after 2½ years of persistent job losses, and the manufacturing sector showed signs of life. In addition, a renewal of the Federal Reserve’s quantitative easing program and an extension of expiring federal tax breaks further boosted the market’s confidence that a promising economic recovery was under way.
Stocks continued to advance in early 2011 despite unrest in the Middle East and North Africa, as well as a devastating earthquake and tsunami in Japan. By May, however, evidence of a slowdown in economic activity and renewed concerns about a European sovereign debt crisis weighed on investor confidence. As a result, stocks experienced a modest pullback in the final two months of the period.
Smaller Stocks and Growth-Oriented Issues Outperformed
Despite finishing on a down note, the broad equity indices posted robust returns overall for the 12-month period. As the table below illustrates, mid- and small-cap issues generated the best returns, outpacing large-cap shares. Meanwhile, growth stocks outperformed value across all market capitalizations, most dramatically among smaller companies. Every sector of the market produced double-digit gains for the period, led by energy and materials stocks, which benefited from strong demand and rising commodity prices. Other economically sensitive sectors—such as consumer discretionary and industrials—also fared well. The laggard was the financials sector, which continued to face mortgage-related challenges and regulatory uncertainty.
| U.S. Stock Index Returns |
| For the 12 months ended June 30, 2011 |
| Russell 1000 Index (Large-Cap) | 31.93% | | Russell 2000 Index (Small-Cap) | 37.41% |
| Russell 1000 Growth Index | 35.01% | | Russell 2000 Growth Index | 43.50% |
| Russell 1000 Value Index | 28.94% | | Russell 2000 Value Index | 31.35% |
| Russell Midcap Index | 38.47% | | | |
| Russell Midcap Growth Index | 43.25% | | | |
| Russell Midcap Value Index | 34.28% | | | |
| Total Returns as of June 30, 2011 |
| | | | Average Annual Returns | |
| | Ticker Symbol | 1 year(1) | 5 years | 10 years | Since Inception | Inception Date |
| Investor Class | ASQIX | 36.39% | -0.37% | 7.86% | 7.57% | 7/31/98 |
| S&P SmallCap 600 Index | — | 37.03% | 4.61% | 7.79% | 8.44% | — |
| Institutional Class | ASCQX | 36.43% | -0.18% | 8.06% | 8.97% | 10/1/99 |
A Class(2) No sales charge* With sales charge* | ASQAX | 35.87% 28.04% | -0.64% -1.81% | 7.60% 6.97% | 6.47% 5.89% | 9/7/00 |
| C Class | ASQCX | 34.91% | — | — | 21.23% | 3/1/10 |
| R Class | ASCRX | 35.61% | -0.88% | — | 6.13% | 8/29/03 |
*Sales charges include initial sales charges and contingent deferred sales charges (CDSCs), as applicable. A Class shares have a maximum 5.75% initial sales charge and may be subject to a maximum CDSC of 1.00%. C Class shares redeemed within 12 months of purchase are subject to a maximum CDSC of 1.00%. The SEC requires that mutual funds provide performance information net of maximum sales charges in all cases where charges could be applied.
| (1) | Extraordinary performance is attributable in part to unusually favorable market conditions and may not be repeated or consistently achieved in the future. |
| (2) | Prior to March 1, 2010, the A Class was referred to as the Advisor Class and did not have a front-end sales charge. Performance prior to that date has been adjusted to reflect this charge. |
Data presented reflect past performance. Past performance is no guarantee of future results. Current performance may be higher or lower than the performance shown. Investment return and principal value will fluctuate, and redemption value may be more or less than original cost. To obtain performance data current to the most recent month end, please call 1-800-345-2021 or visit americancentury.com. Historically, small company stocks have been more volatile than the stocks of larger, more established companies.
Unless otherwise indicated, performance reflects Investor Class shares; performance for other share classes will vary due to differences in fee structure. For information about other share classes available, please consult the prospectus. Data assumes reinvestment of dividends and capital gains, and none of the charts reflect the deduction of taxes that a shareholder would pay on fund distributions or the redemption of fund shares. Returns for the index are provided for comparison. The fund’s total returns include operating expenses (such as transaction costs and management fees) that reduce returns, while the total returns of the index do not.
| Growth of $10,000 Over 10 Years |
| $10,000 investment made June 30, 2001 |
| Total Annual Fund Operating Expenses |
| Investor Class | Institutional Class | A Class | C Class | R Class |
| 0.90% | 0.70% | 1.15% | 1.90% | 1.40% |
The total annual fund operating expenses shown is as stated in the fund’s prospectus current as of the date of this report. The prospectus may vary from the expense ratio shown elsewhere in this report because it is based on a different time period, includes acquired fund fees and expenses, and, if applicable, does not include fee waivers or expense reimbursements.
Data presented reflect past performance. Past performance is no guarantee of future results. Current performance may be higher or lower than the performance shown. Investment return and principal value will fluctuate, and redemption value may be more or less than original cost. To obtain performance data current to the most recent month end, please call 1-800-345-2021 or visit americancentury.com. Historically, small company stocks have been more volatile than the stocks of larger, more established companies.
Unless otherwise indicated, performance reflects Investor Class shares; performance for other share classes will vary due to differences in fee structure. For information about other share classes available, please consult the prospectus. Data assumes reinvestment of dividends and capital gains, and none of the charts reflect the deduction of taxes that a shareholder would pay on fund distributions or the redemption of fund shares. Returns for the index are provided for comparison. The fund’s total returns include operating expenses (such as transaction costs and management fees) that reduce returns, while the total returns of the index do not.
Portfolio Managers: Brian Garbe and Tal Sansani
Performance Summary
Small Company returned 36.39%* for the fiscal year ended June 30, 2011, compared with the 37.03% return of its benchmark, the S&P SmallCap 600 Index.
Small Company posted a strong absolute return for the 12 months, reflecting a robust stock market rally led by smaller-cap stocks during the period (see page 3 for details). The fund’s return narrowly trailed that of the S&P SmallCap 600 Index for the reporting period.
Energy and Industrials Boosted Absolute Results
On an absolute basis, every sector in the Small Company portfolio posted gains of more than 20% for the 12 months. The fund’s energy and industrials stocks generated the best results. In particular, the fund’s energy holdings returned more than 70% as a group for the reporting period, led by the top two performance contributors in the portfolio—energy services and equipment provider Oil States International and oil and gas producer Stone Energy. In the industrials sector, the leading contributors were bearings manufacturer Timken and braking systems maker Hawk.
Small Company’s holdings in the health care sector also performed well during the reporting period. The best contributors in this sector included health care provider HealthSpring and medical equipment makers Cooper and Invacare.
The fund’s consumer staples and financials stocks lagged during the 12-month period. The biggest individual detractors were for-profit education firm Corinthian Colleges, wireless wholesaler Brightpoint, and electronic payment provider Global Cash Access Holdings.
Industrials and Financials Outperformed
Looking at relative performance, stock selection was most successful in the industrials and financials sectors of the portfolio compared with the S&P SmallCap 600 Index. Machinery manufacturers and aerospace and defense companies generated the bulk of the outperformance in the industrials sector. The top relative performance contributors were also the top absolute contributors—Timken and Hawk. Timken, which makes bearings for a variety of equipment and vehicles, consistently exceeded earnings expectations as demand picked up along with the economy. Hawk, a manufacturer of brakes, clutches, and transmissions, rallied after being acquired by industrial conglomerate Carlisle.
In the financials sector, an underweight position in commercial banks and stock choices among capital markets firms added the most value. Top contributors included asset manager Calamos Asset Management and Cash America International, which runs pawn shops and payday lenders. Calamos benefited from the broad rise in the financial markets during the period, while growing demand for pawn services and an increase in online lending activity provided a boost to Cash America.
| * | All fund returns referenced in this commentary are for Investor Class shares. |
The best relative performance contributor in the portfolio for the 12 months was oil and gas producer Stone Energy, which benefited from increased production and higher energy prices. Other top contributors included fabric store chain Jo-Ann Stores, which was acquired by a private equity firm, and business software maker TIBCO Software, which rallied thanks to robust sales, higher profit margins, and takeover speculation.
Technology and Energy Lagged
The fund’s holdings in the information technology and energy sectors underperformed their counterparts in the S&P SmallCap 600 Index for the reporting period. The underperformance in the information technology sector was driven by stock choices among electronic equipment manufacturers and computer hardware makers. The biggest detractors in this sector were billing outsourcing firm CSG Systems International and touch screen maker Synaptics. CSG, which provides billing services for cable companies, took on a significant increase in debt to fund an acquisition, while Synaptics lost market share in the notebook computer space.
In the energy sector, the underperformance resulted primarily from an underweight position in energy equipment and services companies. The main detractors were missed opportunities—the fund’s limited exposure to oilfield services company Lufkin Industries and avoidance of oil refiner HollyFrontier hurt results as both stocks returned more than 100% for the 12-month period.
Other noteworthy detractors in the portfolio included language software purveyor Rosetta Stone and for-profit education firm Corinthian Colleges. Rosetta Stone lowered its earnings projections as sales in the U.S. declined, while Corinthian Colleges faced an uncertain regulatory environment. An underweight position in biotechnology firm Regeneron Pharmaceuticals also weighed on relative results; the stock rallied sharply as the company’s flagship drug showed strong results in a clinical trial for a new and expanded indication.
A Look Ahead
The eye-catching turmoil in the headlines over the last six months—democratic change sweeping through the Middle East, a devastating natural disaster in Japan, the possibility of a sovereign debt default in Europe—has led to heightened uncertainty and growing volatility in the equity market. But when you look at the past decade, there have been many other dramatic events that have had a similar impact on the market. When viewed through this lens, change and volatility have become more the rule than the exception.
It is this change dynamic that our investment process seeks to exploit and capitalize upon. Change and volatility leads to market inefficiencies, and within these inefficiencies lie investment opportunities. Rather than base investment decisions on vague financial headlines, we use our disciplined, data-driven, multi-factor investment process to take advantage of inefficiencies at the individual company level. We believe this approach will produce favorable returns over the long term.
| JUNE 30, 2011 |
| Top Ten Holdings | % of net assets |
| AMERIGROUP Corp. | 1.0% |
| Signature Bank | 0.8% |
| SEACOR Holdings, Inc. | 0.7% |
| Magellan Health Services, Inc. | 0.7% |
| Cubist Pharmaceuticals, Inc. | 0.7% |
| Coinstar, Inc. | 0.7% |
| CACI International, Inc., Class A | 0.7% |
| Veeco Instruments, Inc. | 0.6% |
| Toro Co. (The) | 0.6% |
| Southwest Gas Corp. | 0.6% |
| |
| Top Five Industries | % of net assets |
| Real Estate Investment Trusts (REITs) | 6.7% |
| Semiconductors & Semiconductor Equipment | 5.9% |
| Health Care Providers & Services | 4.8% |
| Commercial Banks | 4.7% |
| Specialty Retail | 4.5% |
| |
| Types of Investments in Portfolio | % of net assets |
| Common Stocks | 99.7% |
| Temporary Cash Investments | 0.3% |
| Other Assets and Liabilities | —* |
| *Category is less than 0.05% of total net assets. |
Fund shareholders may incur two types of costs: (1) transaction costs, including sales charges (loads) on purchase payments and redemption/exchange fees; and (2) ongoing costs, including management fees; distribution and service (12b-1) fees; and other fund expenses. This example is intended to help you understand your ongoing costs (in dollars) of investing in your fund and to compare these costs with the ongoing cost of investing in other mutual funds.
The example is based on an investment of $1,000 made at the beginning of the period and held for the entire period from January 1, 2011 to June 30, 2011.
Actual Expenses
The table provides information about actual account values and actual expenses for each class. You may use the information, together with the amount you invested, to estimate the expenses that you paid over the period. First, identify the share class you own. Then simply divide your account value by $1,000 (for example, an $8,600 account value divided by $1,000 = 8.6), then multiply the result by the number under the heading “Expenses Paid During Period” to estimate the expenses you paid on your account during this period.
If you hold Investor Class shares of any American Century Investments fund, or Institutional Class shares of the American Century Diversified Bond Fund, in an American Century Investments account (i.e., not a financial intermediary or retirement plan account), American Century Investments may charge you a $12.50 semiannual account maintenance fee if the value of those shares is less than $10,000. We will redeem shares automatically in one of your accounts to pay the $12.50 fee. In determining your total eligible investment amount, we will include your investments in all personal accounts (including American Century Investments Brokerage accounts) registered under your Social Security number. Personal accounts include individual accounts, joint accounts, UGMA/UTMA accounts, personal trusts, Coverdell Education Savings Accounts and IRAs (including traditional, Roth, Rollover, SEP-, SARSEP- and SIMPLE-IRAs), and certain other retirement accounts. If you have only business, business retirement, employer-sponsored or American Century Investments Brokerage accounts, you are currently not subject to this fee. We will not charge the fee as long as you choose to manage your accounts exclusively online. If you are subject to the Account Maintenance Fee, your account value could be reduced by the fee amount.
Hypothetical Example for Comparison Purposes
The table also provides information about hypothetical account values and hypothetical expenses based on the actual expense ratio of each class of your fund and an assumed rate of return of 5% per year before expenses, which is not the actual return of a fund’s share class. The hypothetical account values and expenses may not be used to estimate the actual ending account balance or expenses you paid for the period. You may use this information to compare the ongoing costs of investing in your fund and other funds. To do so, compare this 5% hypothetical example with the 5% hypothetical examples that appear in the shareholder reports of the other funds.
Please note that the expenses shown in the table are meant to highlight your ongoing costs only and do not reflect any transactional costs, such as sales charges (loads) or redemption/exchange fees. Therefore, the table is useful in comparing ongoing costs only, and will not help you determine the relative total costs of owning different funds. In addition, if these transactional costs were included, your costs would have been higher.
| | Beginning Account Value 1/1/11 | Ending Account Value 6/30/11 | Expenses Paid During Period* 1/1/11 – 6/30/11 | Annualized Expense Ratio* |
| Actual |
| Investor Class | $1,000 | $1,071.60 | $4.52 | 0.88% |
| Institutional Class | $1,000 | $1,071.20 | $3.49 | 0.68% |
| A Class | $1,000 | $1,068.90 | $5.80 | 1.13% |
| C Class | $1,000 | $1,065.70 | $9.63 | 1.88% |
| R Class | $1,000 | $1,068.20 | $7.08 | 1.38% |
| Hypothetical |
| Investor Class | $1,000 | $1,020.43 | $4.41 | 0.88% |
| Institutional Class | $1,000 | $1,021.42 | $3.41 | 0.68% |
| A Class | $1,000 | $1,019.19 | $5.66 | 1.13% |
| C Class | $1,000 | $1,015.47 | $9.39 | 1.88% |
| R Class | $1,000 | $1,017.95 | $6.90 | 1.38% |
*Expenses are equal to the class’s annualized expense ratio listed in the table above, multiplied by the average account value over the period, multiplied by 181, the number of days in the most recent fiscal half-year, divided by 365, to reflect the one-half year period.
| | | Shares | | | Value | |
| Common Stocks — 99.7% | |
| AEROSPACE & DEFENSE — 2.9% | |
| AAR Corp. | | | 35,757 | | | | $968,657 | |
AeroVironment, Inc.(1) | | | 36,563 | | | | 1,292,502 | |
Astronics Corp.(1) | | | 22,697 | | | | 699,068 | |
| Cubic Corp. | | | 24,166 | | | | 1,232,224 | |
| Curtiss-Wright Corp. | | | 3,736 | | | | 120,934 | |
Esterline Technologies Corp.(1) | | | 20,606 | | | | 1,574,299 | |
GenCorp, Inc.(1) | | | 157,587 | | | | 1,011,709 | |
Moog, Inc., Class A(1) | | | 32,346 | | | | 1,407,698 | |
Teledyne Technologies, Inc.(1) | | | 4,926 | | | | 248,073 | |
| | | | | | | | 8,555,164 | |
| AIR FREIGHT & LOGISTICS — 1.2% | |
Atlas Air Worldwide Holdings, Inc.(1) | | | 14,389 | | | | 856,290 | |
| Forward Air Corp. | | | 2,956 | | | | 99,883 | |
Hub Group, Inc., Class A(1) | | | 43,118 | | | | 1,623,824 | |
Park-Ohio Holdings Corp.(1) | | | 39,181 | | | | 828,286 | |
| | | | | | | | 3,408,283 | |
| AIRLINES — 0.3% | |
Alaska Air Group, Inc.(1) | | | 12,756 | | | | 873,276 | |
| AUTO COMPONENTS — 0.3% | |
| Spartan Motors, Inc. | | | 145,047 | | | | 783,254 | |
| BEVERAGES — 0.3% | |
| Coca-Cola Bottling Co. Consolidated | | | 9,259 | | | | 626,464 | |
| National Beverage Corp. | | | 15,820 | | | | 231,763 | |
| | | | | | | | 858,227 | |
| BIOTECHNOLOGY — 2.8% | |
AVEO Pharmaceuticals, Inc.(1) | | | 27,707 | | | | 571,041 | |
Cubist Pharmaceuticals, Inc.(1) | | | 54,608 | | | | 1,965,342 | |
Emergent Biosolutions, Inc.(1) | | | 43,024 | | | | 970,191 | |
Genomic Health, Inc.(1) | | | 19,045 | | | | 531,546 | |
Infinity Pharmaceuticals, Inc.(1) | | | 3,121 | | | | 25,779 | |
Nabi Biopharmaceuticals(1) | | | 102,857 | | | | 553,371 | |
Neurocrine Biosciences, Inc.(1) | | | 60,492 | | | | 486,961 | |
| PDL BioPharma, Inc. | | | 152,283 | | | | 893,901 | |
Regeneron Pharmaceuticals, Inc.(1) | | | 16,066 | | | | 911,103 | |
Rigel Pharmaceuticals, Inc.(1) | | | 41,246 | | | | 378,226 | |
SciClone Pharmaceuticals, Inc.(1) | | | 108,766 | | | | 656,947 | |
Targacept, Inc.(1) | | | 9,333 | | | | 196,646 | |
| | | | | | | | 8,141,054 | |
| BUILDING PRODUCTS — 0.7% | |
Gibraltar Industries, Inc.(1) | | | 54,141 | | | | 612,876 | |
| Quanex Building Products Corp. | | | 42,970 | | | | 704,278 | |
Trex Co., Inc.(1) | | | 25,497 | | | | 624,167 | |
| | | | | | | | 1,941,321 | |
| CAPITAL MARKETS — 1.5% | |
| Artio Global Investors, Inc. | | | 9,273 | | | | 104,785 | |
| Calamos Asset Management, Inc., Class A | | | 61,681 | | | | 895,608 | |
| Diamond Hill Investment Group, Inc. | | | 3,892 | | | | 316,380 | |
| Gladstone Capital Corp. | | | 31,853 | | | | 294,322 | |
INTL FCStone, Inc.(1) | | | 4,694 | | | | 113,642 | |
Investment Technology Group, Inc.(1) | | | 59,015 | | | | 827,390 | |
| optionsXpress Holdings, Inc. | | | 65,516 | | | | 1,092,807 | |
| Pzena Investment Management, Inc., Class A | | | 63,394 | | | | 360,078 | |
Virtus Investment Partners, Inc.(1) | | | 9,256 | | | | 561,839 | |
| | | | | | | | 4,566,851 | |
| CHEMICALS — 2.2% | |
Ferro Corp.(1) | | | 60,334 | | | | 810,889 | |
Georgia Gulf Corp.(1) | | | 23,650 | | | | 570,911 | |
| Innophos Holdings, Inc. | | | 18,568 | | | | 906,118 | |
Innospec, Inc.(1) | | | 22,998 | | | | 772,963 | |
| Minerals Technologies, Inc. | | | 4,977 | | | | 329,925 | |
OM Group, Inc.(1) | | | 39,118 | | | | 1,589,756 | |
| PolyOne Corp. | | | 36,379 | | | | 562,783 | |
Senomyx, Inc.(1) | | | 17,366 | | | | 89,261 | |
| Sensient Technologies Corp. | | | 2,112 | | | | 78,292 | |
TPC Group, Inc.(1) | | | 19,207 | | | | 753,299 | |
| | | | | | | | 6,464,197 | |
| COMMERCIAL BANKS — 4.7% | |
| Bank of Hawaii Corp. | | | 3,890 | | | | 180,963 | |
| Bank of the Ozarks, Inc. | | | 5,029 | | | | 261,810 | |
| City Holding Co. | | | 1,262 | | | | 41,684 | |
| City National Corp. | | | 10,155 | | | | 550,909 | |
| Columbia Banking System, Inc. | | | 25,399 | | | | 437,371 | |
| Community Bank System, Inc. | | | 41,503 | | | | 1,028,859 | |
| Enterprise Financial Services Corp. | | | 22,797 | | | | 308,443 | |
| F.N.B. Corp. | | | 10,644 | | | | 110,165 | |
| First Financial Bancorp | | | 60,273 | | | | 1,005,956 | |
| First Financial Bankshares, Inc. | | | 4,296 | | | | 147,997 | |
| First Midwest Bancorp., Inc. | | | 63,127 | | | | 775,831 | |
| Independent Bank Corp. | | | 10,126 | | | | 265,808 | |
| | | | Shares | | | | Value | |
| MainSource Financial Group, Inc. | | | 3,980 | | | | $33,034 | |
| NBT Bancorp., Inc. | | | 40,233 | | | | 890,356 | |
| Old National Bancorp. | | | 9,116 | | | | 98,453 | |
| PacWest Bancorp. | | | 33,170 | | | | 682,307 | |
| Prosperity Bancshares, Inc. | | | 16,805 | | | | 736,395 | |
Signature Bank(1) | | | 41,185 | | | | 2,355,782 | |
Sterling Financial Corp.(1) | | | 8,728 | | | | 140,259 | |
| Tompkins Financial Corp. | | | 12,443 | | | | 488,263 | |
| Trustmark Corp. | | | 21,226 | | | | 496,901 | |
| UMB Financial Corp. | | | 29,808 | | | | 1,248,359 | |
| Umpqua Holdings Corp. | | | 64,052 | | | | 741,082 | |
| United Bankshares, Inc. | | | 22,248 | | | | 544,631 | |
| Westamerica Bancorp. | | | 8,841 | | | | 435,419 | |
| | | | | | | | 14,007,037 | |
| COMMERCIAL SERVICES & SUPPLIES — 1.4% | |
APAC Customer Services, Inc.(1) | | | 31,757 | | | | 169,265 | |
Consolidated Graphics, Inc.(1) | | | 14,754 | | | | 810,732 | |
| G&K Services, Inc., Class A | | | 1,866 | | | | 63,183 | |
| Knoll, Inc. | | | 36,214 | | | | 726,815 | |
Team, Inc.(1) | | | 2,928 | | | | 70,653 | |
Tetra Tech, Inc.(1) | | | 78,024 | | | | 1,755,540 | |
TRC Cos., Inc.(1) | | | 7,288 | | | | 45,550 | |
| Unifirst Corp. | | | 5,786 | | | | 325,115 | |
| Viad Corp. | | | 8,246 | | | | 183,803 | |
| | | | | | | | 4,150,656 | |
| COMMUNICATIONS EQUIPMENT — 1.0% | |
Arris Group, Inc.(1) | | | 21,431 | | | | 248,814 | |
| Comtech Telecommunications Corp. | | | 45,191 | | | | 1,267,155 | |
DG FastChannel, Inc.(1) | | | 27,254 | | | | 873,491 | |
PC-Tel, Inc.(1) | | | 14,864 | | | | 96,319 | |
Symmetricom, Inc.(1) | | | 79,775 | | | | 465,088 | |
| | | | | | | | 2,950,867 | |
| COMPUTERS & PERIPHERALS — 0.7% | |
QLogic Corp.(1) | | | 43,615 | | | | 694,351 | |
| Rimage Corp. | | | 2,473 | | | | 33,212 | |
Synaptics, Inc.(1) | | | 54,630 | | | | 1,406,176 | |
| | | | | | | | 2,133,739 | |
| CONSTRUCTION & ENGINEERING — 1.7% | |
EMCOR Group, Inc.(1) | | | 63,228 | | | | 1,853,213 | |
| Great Lakes Dredge & Dock Corp. | | | 107,554 | | | | 600,151 | |
MasTec, Inc.(1) | | | 39,207 | | | | 773,162 | |
Michael Baker Corp.(1) | | | 3,711 | | | | 78,376 | |
| Primoris Services Corp. | | | 45,173 | | | | 582,732 | |
Sterling Construction Co., Inc.(1) | | | 37,513 | | | | 516,554 | |
URS Corp.(1) | | | 16,494 | | | | 737,942 | |
| | | | | | | | 5,142,130 | |
| CONSUMER FINANCE — 1.9% | |
| Advance America Cash Advance Centers, Inc. | | | 133,435 | | | | 919,367 | |
| Cash America International, Inc. | | | 30,803 | | | | 1,782,570 | |
First Cash Financial Services, Inc.(1) | | | 31,887 | | | | 1,338,935 | |
| QC Holdings, Inc. | | | 2,746 | | | | 10,984 | |
World Acceptance Corp.(1) | | | 21,769 | | | | 1,427,393 | |
| | | | | | | | 5,479,249 | |
| CONTAINERS & PACKAGING — 0.2% | |
| Boise, Inc. | | | 91,618 | | | | 713,704 | |
| DISTRIBUTORS — 0.3% | |
Core-Mark Holding Co., Inc.(1) | | | 22,885 | | | | 816,995 | |
| Pool Corp. | | | 4,289 | | | | 127,855 | |
| | | | | | | | 944,850 | |
| DIVERSIFIED CONSUMER SERVICES — 1.9% | |
Bridgepoint Education, Inc.(1) | | | 29,705 | | | | 742,625 | |
Coinstar, Inc.(1) | | | 35,968 | | | | 1,961,695 | |
| CPI Corp. | | | 29,176 | | | | 383,664 | |
ITT Educational Services, Inc.(1) | | | 10,612 | | | | 830,283 | |
| Lincoln Educational Services Corp. | | | 36,815 | | | | 631,377 | |
| Mac-Gray Corp. | | | 3,689 | | | | 56,995 | |
| Sotheby’s | | | 16,630 | | | | 723,405 | |
Steiner Leisure, Ltd.(1) | | | 5,015 | | | | 229,085 | |
| | | | | | | | 5,559,129 | |
| DIVERSIFIED FINANCIAL SERVICES — 0.6% | |
| Asta Funding, Inc. | | | 4,427 | | | | 37,143 | |
| Compass Diversified Holdings | | | 42,459 | | | | 700,149 | |
GAIN Capital Holdings, Inc.(1) | | | 6,161 | | | | 41,956 | |
| Interactive Brokers Group, Inc., Class A | | | 71,666 | | | | 1,121,573 | |
| | | | | | | | 1,900,821 | |
DIVERSIFIED TELECOMMUNICATION SERVICES(2) | |
Vonage Holdings Corp.(1) | | | 4,188 | | | | 18,469 | |
| ELECTRIC UTILITIES — 1.3% | |
| Central Vermont Public Service Corp. | | | 18,198 | | | | 657,858 | |
| DPL, Inc. | | | 28,340 | | | | 854,734 | |
| Hawaiian Electric Industries, Inc. | | | 13,174 | | | | 316,966 | |
| MGE Energy, Inc. | | | 11,270 | | | | 456,773 | |
| UniSource Energy Corp. | | | 44,959 | | | | 1,678,320 | |
| | | | | | | | 3,964,651 | |
| ELECTRICAL EQUIPMENT — 0.3% | |
II-VI, Inc.(1) | | | 2,940 | | | | 75,264 | |
Powell Industries, Inc.(1) | | | 17,510 | | | | 639,115 | |
Ultralife Corp.(1) | | | 45,638 | | | | 214,042 | |
| | | | | | | | 928,421 | |
| ELECTRONIC EQUIPMENT, INSTRUMENTS & COMPONENTS — 3.0% | |
| Anixter International, Inc. | | | 5,147 | | | | $336,305 | |
Brightpoint, Inc.(1) | | | 32,852 | | | | 266,430 | |
Coherent, Inc.(1) | | | 474 | | | | 26,198 | |
Electro Scientific Industries, Inc.(1) | | | 16,646 | | | | 321,268 | |
Gerber Scientific, Inc.(1) | | | 28,641 | | | | 318,774 | |
Insight Enterprises, Inc.(1) | | | 71,601 | | | | 1,268,054 | |
| Littelfuse, Inc. | | | 19,980 | | | | 1,173,226 | |
LoJack Corp.(1) | | | 132,046 | | | | 575,721 | |
| Methode Electronics, Inc. | | | 101,276 | | | | 1,175,814 | |
Newport Corp.(1) | | | 64,346 | | | | 1,169,167 | |
PC Mall, Inc.(1) | | | 11,535 | | | | 89,742 | |
Power-One, Inc.(1) | | | 47,081 | | | | 381,356 | |
| Pulse Electronics Corp. | | | 122,577 | | | | 541,790 | |
Radisys Corp.(1) | | | 51,828 | | | | 377,826 | |
Vishay Intertechnology, Inc.(1) | | | 49,681 | | | | 747,202 | |
| | | | | | | | 8,768,873 | |
| ENERGY EQUIPMENT & SERVICES — 2.7% | |
Complete Production Services, Inc.(1) | | | 2,828 | | | | 94,342 | |
ENGlobal Corp.(1) | | | 6,847 | | | | 20,746 | |
| Gulf Island Fabrication, Inc. | | | 32,439 | | | | 1,047,131 | |
Helix Energy Solutions Group, Inc.(1) | | | 46,099 | | | | 763,399 | |
ION Geophysical Corp.(1) | | | 152,406 | | | | 1,441,761 | |
OYO Geospace Corp.(1) | | | 7,978 | | | | 797,800 | |
| SEACOR Holdings, Inc. | | | 21,035 | | | | 2,102,659 | |
Tesco Corp.(1) | | | 5,262 | | | | 102,135 | |
Tetra Technologies, Inc.(1) | | | 104,327 | | | | 1,328,083 | |
TGC Industries, Inc.(1) | | | 25,253 | | | | 161,367 | |
| | | | | | | | 7,859,423 | |
| FOOD & STAPLES RETAILING — 0.7% | |
| Nash Finch Co. | | | 3,643 | | | | 130,456 | |
| Ruddick Corp. | | | 22,221 | | | | 967,502 | |
| Spartan Stores, Inc. | | | 51,949 | | | | 1,014,564 | |
| | | | | | | | 2,112,522 | |
| FOOD PRODUCTS — 2.3% | |
| B&G Foods, Inc. | | | 81,918 | | | | 1,689,149 | |
| Cal-Maine Foods, Inc. | | | 24,332 | | | | 777,651 | |
Dole Food Co., Inc.(1) | | | 18,702 | | | | 252,851 | |
| Flowers Foods, Inc. | | | 39,465 | | | | 869,809 | |
| Fresh Del Monte Produce, Inc. | | | 28,378 | | | | 756,841 | |
| J&J Snack Foods Corp. | | | 17,549 | | | | 874,818 | |
Omega Protein Corp.(1) | | | 53,800 | | | | 742,440 | |
Overhill Farms, Inc.(1) | | | 104,354 | | | | 579,165 | |
TreeHouse Foods, Inc.(1) | | | 7,096 | | | | 387,512 | |
| | | | | | | | 6,930,236 | |
| GAS UTILITIES — 1.7% | |
| Chesapeake Utilities Corp. | | | 14,805 | | | | 592,644 | |
| Laclede Group, Inc. (The) | | | 35,414 | | | | 1,339,712 | |
| Piedmont Natural Gas Co., Inc. | | | 5,269 | | | | 159,440 | |
| South Jersey Industries, Inc. | | | 6,768 | | | | 367,570 | |
| Southwest Gas Corp. | | | 48,323 | | | | 1,865,751 | |
| WGL Holdings, Inc. | | | 19,799 | | | | 762,063 | |
| | | | | | | | 5,087,180 | |
| HEALTH CARE EQUIPMENT & SUPPLIES — 2.6% | |
Align Technology, Inc.(1) | | | 55,349 | | | | 1,261,957 | |
| Cooper Cos., Inc. (The) | | | 10,537 | | | | 834,952 | |
Cyberonics, Inc.(1) | | | 4,738 | | | | 132,427 | |
Cynosure, Inc., Class A(1) | | | 18,807 | | | | 227,565 | |
Greatbatch, Inc.(1) | | | 45,187 | | | | 1,211,915 | |
Haemonetics Corp.(1) | | | 10,811 | | | | 695,904 | |
Integra LifeSciences Holdings Corp.(1) | | | 17,240 | | | | 824,245 | |
| Invacare Corp. | | | 43,260 | | | | 1,435,799 | |
Kensey Nash Corp.(1) | | | 43,978 | | | | 1,109,565 | |
| | | | | | | | 7,734,329 | |
| HEALTH CARE PROVIDERS & SERVICES — 4.8% | |
American Dental Partners, Inc.(1) | | | 11,328 | | | | 146,811 | |
AMERIGROUP Corp.(1) | | | 41,604 | | | | 2,931,834 | |
Amsurg Corp.(1) | | | 14,305 | | | | 373,790 | |
Cross Country Healthcare, Inc.(1) | | | 6,569 | | | | 49,924 | |
Five Star Quality Care, Inc.(1) | | | 109,206 | | | | 634,487 | |
HealthSpring, Inc.(1) | | | 7,069 | | | | 325,952 | |
HMS Holdings Corp.(1) | | | 17,771 | | | | 1,366,057 | |
Magellan Health Services, Inc.(1) | | | 36,410 | | | | 1,993,083 | |
Molina Healthcare, Inc.(1) | | | 44,688 | | | | 1,211,939 | |
| Owens & Minor, Inc. | | | 23,052 | | | | 795,063 | |
PDI, Inc.(1) | | | 19,951 | | | | 141,453 | |
Providence Service Corp. (The)(1) | | | 49,296 | | | | 623,594 | |
PSS World Medical, Inc.(1) | | | 58,833 | | | | 1,647,912 | |
Team Health Holdings, Inc.(1) | | | 43,059 | | | | 969,258 | |
WellCare Health Plans, Inc.(1) | | | 18,457 | | | | 948,874 | |
| | | | | | | | 14,160,031 | |
| HEALTH CARE TECHNOLOGY — 1.2% | |
| Computer Programs & Systems, Inc. | | | 17,301 | | | | 1,098,268 | |
HealthStream, Inc.(1) | | | 43,771 | | | | 580,841 | |
Omnicell, Inc.(1) | | | 7,775 | | | | 121,212 | |
| Quality Systems, Inc. | | | 20,226 | | | | 1,765,730 | |
| | | | | | | | 3,566,051 | |
| HOTELS, RESTAURANTS & LEISURE — 1.8% | |
AFC Enterprises, Inc.(1) | | | 43,825 | | | | $720,921 | |
| Ameristar Casinos, Inc. | | | 39,539 | | | | 937,470 | |
| Cracker Barrel Old Country Store, Inc. | | | 23,572 | | | | 1,162,335 | |
Isle of Capri Casinos, Inc.(1) | | | 5,034 | | | | 44,551 | |
Multimedia Games Holding Co., Inc.(1) | | | 105,030 | | | | 477,887 | |
Papa John’s International, Inc.(1) | | | 8,264 | | | | 274,861 | |
| PF Chang’s China Bistro, Inc. | | | 34,384 | | | | 1,383,612 | |
Ruth’s Hospitality Group, Inc.(1) | | | 62,861 | | | | 352,650 | |
| | | | | | | | 5,354,287 | |
| HOUSEHOLD DURABLES — 0.4% | |
| American Greetings Corp., Class A | | | 12,147 | | | | 292,014 | |
| CSS Industries, Inc. | | | 3,248 | | | | 67,981 | |
iRobot Corp.(1) | | | 25,118 | | | | 886,414 | |
| | | | | | | | 1,246,409 | |
| HOUSEHOLD PRODUCTS — 0.3% | |
Central Garden and Pet Co., Class A(1) | | | 83,428 | | | | 846,794 | |
| INDUSTRIAL CONGLOMERATES — 0.3% | |
| Seaboard Corp. | | | 351 | | | | 848,718 | |
| INSURANCE — 3.1% | |
| Allied World Assurance Co. Holdings Ltd. | | | 11,538 | | | | 664,358 | |
| American Financial Group, Inc. | | | 21,067 | | | | 751,881 | |
American Safety Insurance Holdings Ltd.(1) | | | 37,553 | | | | 718,764 | |
| Aspen Insurance Holdings Ltd. | | | 32,222 | | | | 829,072 | |
| FBL Financial Group, Inc., Class A | | | 11,751 | | | | 377,795 | |
| Flagstone Reinsurance Holdings SA | | | 13,354 | | | | 112,574 | |
Hallmark Financial Services(1) | | | 5,532 | | | | 43,537 | |
| Horace Mann Educators Corp. | | | 43,893 | | | | 685,170 | |
| Maiden Holdings Ltd. | | | 103,718 | | | | 943,834 | |
| Meadowbrook Insurance Group, Inc. | | | 109,716 | | | | 1,087,285 | |
| Montpelier Re Holdings Ltd. | | | 43,611 | | | | 784,998 | |
National Financial Partners Corp.(1) | | | 84,571 | | | | 975,949 | |
| Selective Insurance Group, Inc. | | | 5,371 | | | | 87,386 | |
| State Auto Financial Corp. | | | 12,323 | | | | 214,790 | |
| United Fire & Casualty Co. | | | 22,932 | | | | 398,329 | |
| Universal Insurance Holdings, Inc. | | | 113,889 | | | | 531,862 | |
| | | | | | | | 9,207,584 | |
| INTERNET & CATALOG RETAIL — 0.3% | |
Shutterfly, Inc.(1) | | | 17,067 | | | | 979,987 | |
| INTERNET SOFTWARE & SERVICES — 1.6% | |
Ancestry.com, Inc.(1) | | | 24,310 | | | | 1,006,191 | |
Dice Holdings, Inc.(1) | | | 3,399 | | | | 45,954 | |
IAC/InterActiveCorp(1) | | | 25,020 | | | | 955,013 | |
Infospace, Inc.(1) | | | 44,066 | | | | 401,882 | |
j2 Global Communications, Inc.(1) | | | 51,930 | | | | 1,465,984 | |
| United Online, Inc. | | | 154,885 | | | | 933,957 | |
| | | | | | | | 4,808,981 | |
| IT SERVICES — 3.0% | |
Acxiom Corp.(1) | | | 53,770 | | | | 704,925 | |
CACI International, Inc., Class A(1) | | | 30,724 | | | | 1,938,070 | |
Cardtronics, Inc.(1) | | | 57,185 | | | | 1,340,988 | |
Convergys Corp.(1) | | | 24,820 | | | | 338,545 | |
CSG Systems International, Inc.(1) | | | 57,798 | | | | 1,068,107 | |
Dynamics Research Corp.(1) | | | 28,435 | | | | 387,854 | |
| MAXIMUS, Inc. | | | 21,243 | | | | 1,757,433 | |
TeleTech Holdings, Inc.(1) | | | 56,454 | | | | 1,190,050 | |
| | | | | | | | 8,725,972 | |
| LEISURE EQUIPMENT & PRODUCTS — 1.2% | |
Arctic Cat, Inc.(1) | | | 46,438 | | | | 623,662 | |
| Brunswick Corp. | | | 41,753 | | | | 851,761 | |
JAKKS Pacific, Inc.(1) | | | 56,306 | | | | 1,036,594 | |
| Polaris Industries, Inc. | | | 8,934 | | | | 993,193 | |
| | | | | | | | 3,505,210 | |
| MACHINERY — 4.1% | |
| Alamo Group, Inc. | | | 28,211 | | | | 668,601 | |
| Albany International Corp., Class A | | | 44,963 | | | | 1,186,574 | |
Altra Holdings, Inc.(1) | | | 16,741 | | | | 401,617 | |
| Briggs & Stratton Corp. | | | 49,856 | | | | 990,140 | |
| Hardinge, Inc. | | | 6,164 | | | | 67,249 | |
Hurco Cos., Inc.(1) | | | 19,404 | | | | 625,003 | |
Kadant, Inc.(1) | | | 9,321 | | | | 293,705 | |
| L.B. Foster Co., Class A | | | 20,394 | | | | 671,166 | |
| Mueller Industries, Inc. | | | 27,022 | | | | 1,024,404 | |
| NACCO Industries, Inc., Class A | | | 7,940 | | | | 768,751 | |
Sauer-Danfoss, Inc.(1) | | | 16,494 | | | | 831,133 | |
| Timken Co. | | | 17,375 | | | | 875,700 | |
| Toro Co. (The) | | | 31,213 | | | | 1,888,386 | |
Trimas Corp.(1) | | | 14,607 | | | | 361,523 | |
| Twin Disc, Inc. | | | 24,792 | | | | 957,715 | |
| Wabtec Corp. | | | 9,338 | | | | 613,693 | |
| | | | | | | | 12,225,360 | |
| MEDIA — 0.8% | |
| Arbitron, Inc. | | | 2,573 | | | | 106,342 | |
| John Wiley & Sons, Inc., Class A | | | 2,028 | | | | 105,476 | |
Journal Communications, Inc., Class A(1) | | | 33,074 | | | | $170,993 | |
LodgeNet Interactive Corp.(1) | | | 133,658 | | | | 404,984 | |
Madison Square Garden Co. (The), Class A(1) | | | 16,955 | | | | 466,771 | |
| Sinclair Broadcast Group, Inc., Class A | | | 78,727 | | | | 864,423 | |
SuperMedia, Inc.(1) | | | 80,627 | | | | 302,351 | |
| | | | | | | | 2,421,340 | |
| METALS & MINING — 0.7% | |
Hecla Mining Co.(1) | | | 96,033 | | | | 738,494 | |
Noranda Aluminum Holding Corp.(1) | | | 52,887 | | | | 800,709 | |
| Silvercorp Metals, Inc. | | | 49,938 | | | | 468,418 | |
| | | | | | | | 2,007,621 | |
| MULTILINE RETAIL — 0.6% | |
| Dillard’s, Inc., Class A | | | 15,781 | | | | 822,821 | |
Dollar Tree, Inc.(1) | | | 13,056 | | | | 869,791 | |
| | | | | | | | 1,692,612 | |
| MULTI-UTILITIES — 0.4% | |
| Avista Corp. | | | 41,404 | | | | 1,063,669 | |
| OIL, GAS & CONSUMABLE FUELS — 2.2% | |
Callon Petroleum Co.(1) | | | 95,930 | | | | 673,429 | |
Cloud Peak Energy, Inc.(1) | | | 36,939 | | | | 786,801 | |
CVR Energy, Inc.(1) | | | 41,240 | | | | 1,015,329 | |
| Delek US Holdings, Inc. | | | 48,453 | | | | 760,712 | |
| Panhandle Oil and Gas, Inc., Class A | | | 13,966 | | | | 411,857 | |
REX American Resources Corp.(1) | | | 43,629 | | | | 724,241 | |
Stone Energy Corp.(1) | | | 27,252 | | | | 828,188 | |
Toreador Resources Corp.(1) | | | 69,558 | | | | 258,060 | |
Vaalco Energy, Inc.(1) | | | 18,732 | | | | 112,767 | |
| W&T Offshore, Inc. | | | 30,502 | | | | 796,712 | |
| | | | | | | | 6,368,096 | |
| PAPER & FOREST PRODUCTS — 1.9% | |
| Buckeye Technologies, Inc. | | | 52,479 | | | | 1,415,883 | |
Clearwater Paper Corp.(1) | | | 17,517 | | | | 1,196,061 | |
KapStone Paper and Packaging Corp.(1) | | | 80,560 | | | | 1,334,879 | |
| Neenah Paper, Inc. | | | 47,927 | | | | 1,019,886 | |
| P.H. Glatfelter Co. | | | 49,970 | | | | 768,539 | |
| | | | | | | | 5,735,248 | |
| PERSONAL PRODUCTS — 0.4% | |
| Inter Parfums, Inc. | | | 2,230 | | | | 51,357 | |
Medifast, Inc.(1) | | | 10,668 | | | | 253,152 | |
Nature’s Sunshine Products, Inc.(1) | | | 2,325 | | | | 45,291 | |
USANA Health Sciences, Inc.(1) | | | 25,359 | | | | 793,229 | |
| | | | | | | | 1,143,029 | |
| PHARMACEUTICALS — 2.7% | |
Cornerstone Therapeutics, Inc.(1) | | | 4,400 | | | | 39,424 | |
Depomed, Inc.(1) | | | 84,749 | | | | 693,247 | |
Endo Pharmaceuticals Holdings, Inc.(1) | | | 17,899 | | | | 719,003 | |
Impax Laboratories, Inc.(1) | | | 33,449 | | | | 728,854 | |
ISTA Pharmaceuticals, Inc.(1) | | | 16,114 | | | | 123,191 | |
Jazz Pharmaceuticals, Inc.(1) | | | 25,084 | | | | 836,551 | |
Medicines Co. (The)(1) | | | 48,112 | | | | 794,329 | |
| Medicis Pharmaceutical Corp., Class A | | | 24,003 | | | | 916,194 | |
Par Pharmaceutical Cos., Inc.(1) | | | 42,421 | | | | 1,399,045 | |
ViroPharma, Inc.(1) | | | 88,564 | | | | 1,638,434 | |
| | | | | | | | 7,888,272 | |
| PROFESSIONAL SERVICES — 1.7% | |
| Barrett Business Services, Inc. | | | 1,791 | | | | 25,647 | |
| Corporate Executive Board Co. (The) | | | 17,745 | | | | 774,569 | |
Exponent, Inc.(1) | | | 17,326 | | | | 753,854 | |
GP Strategies Corp.(1) | | | 55,574 | | | | 759,141 | |
ICF International, Inc.(1) | | | 29,203 | | | | 741,172 | |
| Insperity, Inc. | | | 39,782 | | | | 1,177,945 | |
Mistras Group, Inc.(1) | | | 43,782 | | | | 709,269 | |
On Assignment, Inc.(1) | | | 10,818 | | | | 106,341 | |
| | | | | | | | 5,047,938 | |
| REAL ESTATE INVESTMENT TRUSTS (REITs) — 6.7% | |
| Agree Realty Corp. | | | 3,153 | | | | 70,406 | |
| Ashford Hospitality Trust, Inc. | | | 30,771 | | | | 383,099 | |
| BioMed Realty Trust, Inc. | | | 3,512 | | | | 67,571 | |
| CBL & Associates Properties, Inc. | | | 19,997 | | | | 362,546 | |
| Colonial Properties Trust | | | 54,849 | | | | 1,118,920 | |
| Entertainment Properties Trust | | | 9,147 | | | | 427,165 | |
| Equity LifeStyle Properties, Inc. | | | 11,118 | | | | 694,208 | |
| Extra Space Storage, Inc. | | | 41,298 | | | | 880,886 | |
| Home Properties, Inc. | | | 30,471 | | | | 1,855,074 | |
| Kilroy Realty Corp. | | | 17,125 | | | | 676,266 | |
| Lexington Realty Trust | | | 169,047 | | | | 1,543,399 | |
| LTC Properties, Inc. | | | 14,487 | | | | 403,028 | |
| Medical Properties Trust, Inc. | | | 85,043 | | | | 977,995 | |
| Mid-America Apartment Communities, Inc. | | | 25,816 | | | | 1,741,806 | |
| Mission West Properties, Inc. | | | 59,193 | | | | 519,715 | |
| National Retail Properties, Inc. | | | 52,353 | | | | 1,283,172 | |
| Post Properties, Inc. | | | 32,337 | | | | 1,318,056 | |
| Potlatch Corp. | | | 20,275 | | | | 715,099 | |
| PS Business Parks, Inc. | | | 27,825 | | | | 1,533,157 | |
| Sovran Self Storage, Inc. | | | 21,229 | | | | 870,389 | |
| Tanger Factory Outlet Centers | | | 66,670 | | | | 1,784,756 | |
| Universal Health Realty Income Trust | | | 11,065 | | | | $442,379 | |
| U-Store-It Trust | | | 11,465 | | | | 120,612 | |
| | | | | | | | 19,789,704 | |
| REAL ESTATE MANAGEMENT & DEVELOPMENT — 0.2% | |
FirstService Corp.(1) | | | 18,050 | | | | 623,447 | |
| ROAD & RAIL — 0.6% | |
AMERCO, Inc.(1) | | | 8,268 | | | | 794,968 | |
| Heartland Express, Inc. | | | 16,352 | | | | 270,789 | |
Quality Distribution, Inc.(1) | | | 10,416 | | | | 135,617 | |
RailAmerica, Inc.(1) | | | 45,059 | | | | 675,885 | |
| | | | | | | | 1,877,259 | |
| SEMICONDUCTORS & SEMICONDUCTOR EQUIPMENT — 5.9% | |
| ASM International NV New York Shares | | | 18,440 | | | | 729,302 | |
Cabot Microelectronics Corp.(1) | | | 18,169 | | | | 844,314 | |
Cypress Semiconductor Corp.(1) | | | 35,707 | | | | 754,846 | |
Entegris, Inc.(1) | | | 102,693 | | | | 1,039,253 | |
FEI Co.(1) | | | 48,486 | | | | 1,851,680 | |
Integrated Device Technology, Inc.(1) | | | 74,133 | | | | 582,685 | |
Kulicke & Soffa Industries, Inc.(1) | | | 106,140 | | | | 1,182,400 | |
Lattice Semiconductor Corp.(1) | | | 109,196 | | | | 711,958 | |
LTX-Credence Corp.(1) | | | 101,577 | | | | 908,098 | |
| Micrel, Inc. | | | 63,598 | | | | 672,867 | |
| MKS Instruments, Inc. | | | 50,233 | | | | 1,327,156 | |
OmniVision Technologies, Inc.(1) | | | 23,126 | | | | 805,016 | |
Photronics, Inc.(1) | | | 94,020 | | | | 796,349 | |
RF Micro Devices, Inc.(1) | | | 74,479 | | | | 455,812 | |
Rudolph Technologies, Inc.(1) | | | 40,861 | | | | 437,621 | |
Standard Microsystems Corp.(1) | | | 42,015 | | | | 1,133,985 | |
Teradyne, Inc.(1) | | | 21,539 | | | | 318,777 | |
Tessera Technologies, Inc.(1) | | | 62,125 | | | | 1,064,823 | |
Veeco Instruments, Inc.(1) | | | 39,239 | | | | 1,899,560 | |
| | | | | | | | 17,516,502 | |
| SOFTWARE — 3.6% | |
ACI Worldwide, Inc.(1) | | | 24,649 | | | | 832,397 | |
| Blackbaud, Inc. | | | 7,714 | | | | 213,832 | |
BroadSoft, Inc.(1) | | | 17,593 | | | | 670,821 | |
Cadence Design Systems, Inc.(1) | | | 26,359 | | | | 278,351 | |
Magma Design Automation, Inc.(1) | | | 90,513 | | | | 723,199 | |
Manhattan Associates, Inc.(1) | | | 35,175 | | | | 1,211,427 | |
Monotype Imaging Holdings, Inc.(1) | | | 17,469 | | | | 246,837 | |
NetScout Systems, Inc.(1) | | | 32,840 | | | | 686,028 | |
| Opnet Technologies, Inc. | | | 13,216 | | | | 541,063 | |
Progress Software Corp.(1) | | | 70,702 | | | | 1,706,039 | |
QAD, Inc., Class A(1) | | | 7,967 | | | | 81,423 | |
QAD, Inc., Class B(1) | | | 1,035 | | | | 9,625 | |
Radiant Systems, Inc.(1) | | | 12,224 | | | | 255,482 | |
| Renaissance Learning, Inc. | | | 9,794 | | | | 122,817 | |
TeleNav, Inc.(1) | | | 48,217 | | | | 854,887 | |
TIBCO Software, Inc.(1) | | | 15,822 | | | | 459,154 | |
Websense, Inc.(1) | | | 64,021 | | | | 1,662,625 | |
| | | | | | | | 10,556,007 | |
| SPECIALTY RETAIL — 4.5% | |
| Books-A-Million, Inc. | | | 6,378 | | | | 22,132 | |
| Cato Corp. (The), Class A | | | 37,284 | | | | 1,073,779 | |
Children’s Place Retail Stores, Inc. (The)(1) | | | 29,746 | | | | 1,323,399 | |
| Destination Maternity Corp. | | | 25,821 | | | | 515,904 | |
| Express, Inc. | | | 37,385 | | | | 814,993 | |
| Finish Line, Inc. (The), Class A | | | 68,302 | | | | 1,461,663 | |
GameStop Corp., Class A(1) | | | 33,799 | | | | 901,419 | |
Genesco, Inc.(1) | | | 33,173 | | | | 1,728,313 | |
Hibbett Sports, Inc.(1) | | | 34,382 | | | | 1,399,691 | |
| Monro Muffler Brake, Inc. | | | 6,342 | | | | 236,493 | |
| PEP Boys-Manny Moe & Jack | | | 38,756 | | | | 423,603 | |
Pier 1 Imports, Inc.(1) | | | 80,149 | | | | 927,324 | |
Select Comfort Corp.(1) | | | 80,813 | | | | 1,453,018 | |
| Stage Stores, Inc. | | | 38,261 | | | | 642,785 | |
Ulta Salon Cosmetics & Fragrance, Inc.(1) | | | 4,800 | | | | 309,984 | |
| | | | | | | | 13,234,500 | |
| TEXTILES, APPAREL & LUXURY GOODS — 1.5% | |
Crocs, Inc.(1) | | | 2,795 | | | | 71,971 | |
Delta Apparel, Inc.(1) | | | 2,996 | | | | 50,932 | |
Iconix Brand Group, Inc.(1) | | | 75,534 | | | | 1,827,923 | |
| Oxford Industries, Inc. | | | 7,796 | | | | 263,193 | |
Perry Ellis International, Inc.(1) | | | 28,794 | | | | 727,049 | |
Quiksilver, Inc.(1) | | | 118,232 | | | | 555,690 | |
Warnaco Group, Inc. (The)(1) | | | 14,447 | | | | 754,856 | |
| Wolverine World Wide, Inc. | | | 2,631 | | | | 109,844 | |
| | | | | | | | 4,361,458 | |
| THRIFTS & MORTGAGE FINANCE — 0.5% | |
| Brookline Bancorp., Inc. | | | 6,571 | | | | 60,913 | |
| Charter Financial Corp. | | | 6,566 | | | | 65,003 | |
| Provident Financial Services, Inc. | | | 39,791 | | | | 569,807 | |
| TrustCo Bank Corp. NY | | | 143,526 | | | | 703,278 | |
| | | | | | | | 1,399,001 | |
| TOBACCO — 0.3% | |
| Vector Group Ltd. | | | 46,491 | | | | 827,075 | |
| TRADING COMPANIES & DISTRIBUTORS — 1.0% | |
| Applied Industrial Technologies, Inc. | | | 37,465 | | | | $1,334,129 | |
Beacon Roofing Supply, Inc.(1) | | | 36,635 | | | | 836,011 | |
DXP Enterprises, Inc.(1) | | | 30,824 | | | | 781,388 | |
| | | | | | | | 2,951,528 | |
| WIRELESS TELECOMMUNICATION SERVICES — 0.2% | |
| USA Mobility, Inc. | | | 46,876 | | | | 715,328 | |
TOTAL COMMON STOCKS (Cost $243,318,306) | | | | 294,672,931 | |
| Temporary Cash Investments — 0.3% | |
| JPMorgan U.S. Treasury Plus Money Market Fund Agency Shares | | | 252,196 | | | | 252,196 | |
| Repurchase Agreement, Bank of America N.A., (collateralized by various U.S. Treasury obligations, 4.375%, 11/15/39, valued at $301,254), in a joint trading account at 0.00%, dated 6/30/11, due 7/1/11 (Delivery value $294,433) | | | | 294,433 | |
| Repurchase Agreement, Credit Suisse First Boston, Inc., (collateralized by various U.S. Treasury obligations, 3.50%, 5/15/20, valued at $250,343), in a joint trading account at 0.00%, dated 6/30/11, due 7/1/11 (Delivery value $245,361) | | | | 245,361 | |
| Repurchase Agreement, Goldman Sachs Group, Inc., (collateralized by various U.S. Treasury obligations, 1.375%, 9/15/12, valued at $300,354), in a joint trading account at 0.00%, dated 6/30/11, due 7/1/11 (Delivery value $294,433) | | | | 294,433 | |
TOTAL TEMPORARY CASH INVESTMENTS (Cost $1,086,423) | | | | 1,086,423 | |
TOTAL INVESTMENT SECURITIES — 100.0% (Cost $244,404,729) | | | | 295,759,354 | |
OTHER ASSETS AND LIABILITIES(2) | | | | (105,011 | ) |
| TOTAL NET ASSETS — 100.0% | | | | $295,654,343 | |
Notes to Schedule of Investments
| (2) | Category is less than 0.05% of total net assets. |
See Notes to Financial Statements.
Statement of Assets and Liabilities |
| JUNE 30, 2011 | |
| Assets | |
| Investment securities, at value (cost of $244,404,729) | | | $295,759,354 | |
| Receivable for investments sold | | | 3,214 | |
| Receivable for capital shares sold | | | 131,616 | |
| Dividends and interest receivable | | | 213,872 | |
| | | | 296,108,056 | |
| | | | | |
| Liabilities | |
| Disbursements in excess of demand deposit cash | | | 1,973 | |
| Payable for capital shares redeemed | | | 244,242 | |
| Accrued management fees | | | 200,278 | |
| Distribution and service fees payable | | | 7,220 | |
| | | | 453,713 | |
| | | | | |
| Net Assets | | | $295,654,343 | |
| | | | | |
| Net Assets Consist of: | |
| Capital (par value and paid-in surplus) | | | $437,600,980 | |
| Undistributed net investment income | | | 282,320 | |
| Accumulated net realized loss | | | (193,583,582 | ) |
| Net unrealized appreciation | | | 51,354,625 | |
| | | | $295,654,343 | |
| | Net assets | Shares outstanding | Net asset value per share |
| Investor Class, $0.01 Par Value | $218,642,268 | 26,106,360 | $8.38 |
| Institutional Class, $0.01 Par Value | $42,541,202 | 5,052,809 | $8.42 |
| A Class, $0.01 Par Value | $33,452,108 | 4,070,797 | $8.22* |
| C Class, $0.01 Par Value | $74,237 | 8,978 | $8.27 |
| R Class, $0.01 Par Value | $944,528 | 115,863 | $8.15 |
| *Maximum offering price $8.72 (net asset value divided by 0.9425) |
See Notes to Financial Statements.
| YEAR ENDED JUNE 30, 2011 | |
| Investment Income (Loss) | |
| Income: | | | |
| Dividends (net of foreign taxes withheld of $997) | | | $3,145,648 | |
| Interest | | | 3,211 | |
| | | | 3,148,859 | |
| | | | | |
| Expenses: | | | | |
| Management fees | | | 2,536,830 | |
| Distribution and service fees: | | | | |
| A Class | | | 89,719 | |
| C Class | | | 439 | |
| R Class | | | 3,348 | |
| Directors’ fees and expenses | | | 12,346 | |
| Other expenses | | | 10,849 | |
| | | | 2,653,531 | |
| | | | | |
| Net investment income (loss) | | | 495,328 | |
| | | | | |
| Realized and Unrealized Gain (Loss) | |
| Net realized gain (loss) on: | | | | |
| Investment transactions | | | 48,667,493 | |
| Futures contract transactions | | | 1,130,876 | |
| | | | 49,798,369 | |
| | | | | |
| Change in net unrealized appreciation (depreciation) on investments | | | 38,016,101 | |
| | | | | |
| Net realized and unrealized gain (loss) | | | 87,814,470 | |
| | | | | |
| Net Increase (Decrease) in Net Assets Resulting from Operations | | | $88,309,798 | |
See Notes to Financial Statements.
Statement of Changes in Net Assets |
| YEARS ENDED JUNE 30, 2011 AND JUNE 30, 2010 | |
| Increase (Decrease) in Net Assets | | 2011 | | | 2010 | |
| Operations | |
| Net investment income (loss) | | | $495,328 | | | | $541,843 | |
| Net realized gain (loss) | | | 49,798,369 | | | | 24,694,796 | |
| Change in net unrealized appreciation (depreciation) | | | 38,016,101 | | | | 68,949,450 | |
| Net increase (decrease) in net assets resulting from operations | | | 88,309,798 | | | | 94,186,089 | |
| | | | | | | | | |
| Distributions to Shareholders | |
| From net investment income: | | | | | | | | |
| Investor Class | | | (193,801 | ) | | | (834,118 | ) |
| Institutional Class | | | (108,353 | ) | | | (749,236 | ) |
| A Class | | | — | | | | (74,356 | ) |
| Decrease in net assets from distributions | | | (302,154 | ) | | | (1,657,710 | ) |
| | | | | | | | | |
| Capital Share Transactions | |
| Net increase (decrease) in net assets from capital share transactions | | | (105,655,179 | ) | | | (201,397,291 | ) |
| | | | | | | | | |
| Net increase (decrease) in net assets | | | (17,647,535 | ) | | | (108,868,912 | ) |
| | | | | | | | | |
| Net Assets | |
| Beginning of period | | | 313,301,878 | | | | 422,170,790 | |
| End of period | | | $295,654,343 | | | | $313,301,878 | |
| | | | | | | | | |
| Undistributed net investment income | | | $282,320 | | | | $96,967 | |
See Notes to Financial Statements.
Notes to Financial Statements |
JUNE 30, 2011
1. Organization
American Century Quantitative Equity Funds, Inc. (the corporation) is registered under the Investment Company Act of 1940, as amended (the 1940 Act), as an open-end management investment company and is organized as a Maryland corporation. Small Company Fund (the fund) is one fund in a series issued by the corporation. The fund is diversified as defined under the 1940 Act. The fund’s objective is to seek long-term capital growth by investing primarily in stocks of small companies.
The fund is authorized to issue the Investor Class, the Institutional Class, the A Class, the C Class and the R Class. The A Class may incur an initial sales charge. The A Class and C Class may be subject to a contingent deferred sales charge. The share classes differ principally in their respective sales charges and distribution and shareholder servicing expenses and arrangements. The Institutional Class is made available to institutional shareholders or through financial intermediaries whose clients do not require the same level of shareholder and administrative services as shareholders of other classes. As a result, the Institutional Class is charged a lower unified management fee. Sale of the
C Class commenced on March 1, 2010.
2. Significant Accounting Policies
The following is a summary of significant accounting policies consistently followed by the fund in preparation of its financial statements. The financial statements are prepared in conformity with accounting principles generally accepted in the United States of America, which may require management to make certain estimates and assumptions at the date of the financial statements. Actual results could differ from these estimates.
Investment Valuations — The fund determines the fair value of its investments and computes its net asset value per share as of the close of regular trading (usually 4 p.m. Eastern time) on the New York Stock Exchange (NYSE) on each day the NYSE is open.
Equity securities that are listed or traded on a domestic securities exchange are valued at the last reported sales price or at the official closing price as provided by the exchange. Equity securities traded on foreign securities exchanges are typically valued at the closing price on the exchange where primarily traded or as of the close of the NYSE, if that is earlier. If no last sales price is reported, or if local convention or regulation so provides, the mean of the latest bid and asked prices is used. Depending on local convention or regulation, securities traded over-the-counter are valued at the mean of the latest bid and asked prices, the last sales price, or the official closing price. In its determination of fair value, the fund may review several factors including: market information specific to a security; news developments in U.S. and foreign markets; the performance of particular U.S. and foreign securities, indices, comparable securities, American Depositary Receipts, Exchange-Traded Funds, and other relevant market indicators.
Debt securities maturing within 60 days at the time of purchase may be valued at cost, plus or minus any amortized discount or premium or at the evaluated mean as provided by an independent pricing service. Evaluated mean prices are commonly derived through utilization of market models, which may consider, among other factors, trade data, quotations from dealers and active market makers, relevant yield curve and spread data, related sector levels, creditworthiness, and other relevant market information on the same or comparable securities.
Investments in open-end management investment companies are valued at the reported net asset value per share. Repurchase agreements are valued at cost. Exchange-traded futures contracts are valued at the settlement price as provided by the appropriate clearing corporation.
If the fund determines that the market price for a portfolio security is not readily available or the valuation methods mentioned above do not reflect a security’s fair value, such security is valued as determined in good faith by the Board of Directors or its designee, in accordance with procedures adopted by the Board of Directors. Circumstances that may
cause the fund to use these procedures to value a security include, but are not limited to: a security has been declared in default; trading in a security has been halted during the trading day; there is a foreign market holiday and no trading occurred; or an event occurred between the close of a foreign exchange and the NYSE that may affect the value of a security.
Security Transactions — Security transactions are accounted for as of the trade date. Net realized gains and losses are determined on the identified cost basis, which is also used for federal income tax purposes.
Investment Income — Dividend income less foreign taxes withheld, if any, is recorded as of the ex-dividend date. Distributions received on securities that represent a return of capital or capital gain are recorded as a reduction of cost of investments and/or as a realized gain. The fund estimates the components of distributions received that may be considered nontaxable distributions or capital gain distributions for income tax purposes. Interest income is recorded on the accrual basis and includes accretion of discounts and amortization of premiums.
Business Development Companies — The fund may invest in securities of closed-end investment companies that have elected to be treated as a business development company under the 1940 Act. A business development company operates similar to an exchange-traded fund and represents a portfolio of securities. The fund may purchase a business development company to gain exposure to the securities in the underlying portfolio. The risks of owning a business development company generally reflect the risks of owning the underlying securities. Business development companies have expenses that reduce their value.
Repurchase Agreements — The fund may enter into repurchase agreements with institutions that American Century Investment Management, Inc. (ACIM) (the investment advisor) has determined are creditworthy pursuant to criteria adopted by the Board of Directors. The fund requires that the collateral, represented by securities, received in a repurchase transaction be transferred to the custodian in a manner sufficient to enable the fund to obtain those securities in the event of a default under the repurchase agreement. ACIM monitors, on a daily basis, the securities transferred to ensure the value, including accrued interest, of the securities under each repurchase agreement is equal to or greater than amounts owed to the fund under each repurchase agreement.
Joint Trading Account — Pursuant to an Exemptive Order issued by the Securities and Exchange Commission, the fund, along with certain other funds in the American Century Investments family of funds, may transfer uninvested cash balances into a joint trading account. These balances are invested in one or more repurchase agreements that are collateralized by U.S. Treasury or Agency obligations.
Income Tax Status — It is the fund’s policy to distribute substantially all net investment income and net realized gains to shareholders and to otherwise qualify as a regulated investment company under provisions of the Internal Revenue Code. The fund is no longer subject to examination by tax authorities for years prior to 2008. At this time, management believes there are no uncertain tax positions which, based on their technical merit, would not be sustained upon examination and for which it is reasonably possible that the total amounts of unrecognized tax benefits will significantly change in the next twelve months. Accordingly, no provision has been made for federal or state income taxes.
Multiple Class — All shares of the fund represent an equal pro rata interest in the net assets of the class to which such shares belong, and have identical voting, dividend, liquidation and other rights and the same terms and conditions, except for class specific expenses and exclusive rights to vote on matters affecting only individual classes. Income, non-class specific expenses, and realized and unrealized capital gains and losses of the fund are allocated to each class of shares based on their relative net assets.
Distributions to Shareholders — Distributions from net investment income, if any, are generally declared and paid quarterly. Distributions from net realized gains, if any, are generally declared and paid annually.
Indemnifications — Under the corporation’s organizational documents, its officers and directors are indemnified against certain liabilities arising out of the performance of their duties to the fund. In addition, in the normal course of business, the fund enters into contracts that provide general indemnifications. The maximum exposure under these arrangements is unknown as this would involve future claims that may be made against a fund. The risk of material loss from such claims is considered by management to be remote.
3. Fees and Transactions with Related Parties
Management Fees —The corporation has entered into a management agreement with ACIM, under which ACIM provides the fund with investment advisory and management services in exchange for a single, unified management fee (the fee) per class. The agreement provides that all expenses of managing and operating the fund, except distribution and service fees, brokerage expenses, taxes, interest, fees and expenses of the independent directors (including legal counsel fees), and extraordinary expenses, will be paid by ACIM. The fee is computed and accrued daily based on each class’s daily net assets and paid monthly in arrears. The fee consists of (1) an Investment Category Fee based on the daily net assets of the fund and certain other accounts managed by the investment advisor that are in the same broad investment category as the fund and (2) a Complex Fee based on the assets of all the funds in the American Century Investments family of funds. The rates for the Investment Category Fee range from 0.5380% to 0.7200%. The rates for the Complex Fee range from 0.2500% to 0.3100% for the Investor Class, A Class, C Class and R Class. The Institutional Class is 0.2000% less at each point within the Complex Fee range. The effective annual management fee for each class for the year ended June 30, 2011 was 0.88% for the Investor Class, A Class, C Class and R Class and 0.68% for the Institutional Class.
Distribution and Service Fees — The Board of Directors has adopted a separate Master Distribution and Individual Shareholder Services Plan for each of the A Class, C Class and R Class (collectively the plans), pursuant to Rule 12b-1 of the 1940 Act. The plans provide that the A Class will pay American Century Investment Services, Inc. (ACIS) an annual distribution and service fee of 0.25%. The plans provide that the C Class will pay ACIS an annual distribution and service fee of 1.00%, of which 0.25% is paid for individual shareholder services and 0.75% is paid for distribution services. The plans provide that the R Class will pay ACIS an annual distribution and service fee of 0.50%. The fees are computed and accrued daily based on each class’s daily net assets and paid monthly in arrears. The fees are used to pay financial intermediaries for distribution and individual shareholder services. Fees incurred under the plans during the year ended June 30, 2011 are detailed in the Statement of Operations.
Acquired Fund Fees and Expenses — The fund may invest in mutual funds, exchange-traded funds, and business development companies (the acquired funds). The fund will indirectly realize its pro rata share of the fees and expenses of the acquired funds in which it invests. These indirect fees and expenses are not paid out of the fund’s assets but are reflected in the return realized by the fund on its investment in the acquired funds.
Related Parties — Certain officers and directors of the corporation are also officers and/or directors of American Century Companies, Inc. (ACC), the parent of the corporation’s investment advisor, ACIM, the distributor of the corporation, ACIS, and the corporation’s transfer agent, American Century Services, LLC. Various funds in a series issued by American Century Asset Allocation Portfolios, Inc. (ACAAP) own, in aggregate, 14% of the shares of the fund. ACAAP does not invest in the fund for the purpose of exercising management or control.
The fund is eligible to invest in a money market fund for temporary purposes, which is managed by J.P. Morgan Investment Management, Inc. (JPMIM). The fund has a securities lending agreement with JPMorgan Chase Bank (JPMCB) and a mutual funds services agreement with J.P. Morgan Investor Services Co. (JPMIS). JPMCB is a custodian of the fund. JPMIM, JPMIS and JPMCB are wholly owned subsidiaries of JPMorgan Chase & Co. (JPM). JPM is an equity investor in ACC. The services provided to the fund by JPMIM, JPMIS and JPMCB terminated on July 31, 2011.
4. Investment Transactions
Purchases and sales of investment securities, excluding short-term investments, for the year ended June 30, 2011 were $178,790,928 and $281,220,993, respectively.
5. Capital Share Transactions
Transactions in shares of the fund were as follows:
| | | Year ended June 30, 2011 | | | Year ended June 30, 2010(1) | |
| | | Shares | | | Amount | | | Shares | | | Amount | |
| Investor Class/Shares Authorized | | | 200,000,000 | | | | | | | 200,000,000 | | | | |
| Sold | | | 3,748,866 | | | | $28,194,868 | | | | 6,026,003 | | | | $37,994,445 | |
| Issued in reinvestment of distributions | | | 28,390 | | | | 189,365 | | | | 124,183 | | | | 726,474 | |
| Redeemed | | | (15,819,818 | ) | | | (109,003,394 | ) | | | (13,958,800 | ) | | | (85,789,769 | ) |
| | | | (12,042,562 | ) | | | (80,619,161 | ) | | | (7,808,614 | ) | | | (47,068,850 | ) |
| Institutional Class/Shares Authorized | | | 100,000,000 | | | | | | | | 100,000,000 | | | | | |
| Sold | | | 1,362,748 | | | | 10,489,197 | | | | 2,248,248 | | | | 13,629,955 | |
| Issued in reinvestment of distributions | | | 16,095 | | | | 107,839 | | | | 125,008 | | | | 733,796 | |
| Redeemed | | | (3,211,344 | ) | | | (22,848,871 | ) | | | (23,997,286 | ) | | | (143,972,848 | ) |
| | | | (1,832,501 | ) | | | (12,251,835 | ) | | | (21,624,030 | ) | | | (129,609,097 | ) |
| A Class/Shares Authorized | | | 140,000,000 | | | | | | | | 140,000,000 | | | | | |
| Sold | | | 662,917 | | | | 4,941,713 | | | | 908,317 | | | | 5,484,932 | |
| Issued in reinvestment of distributions | | | — | | | | — | | | | 12,896 | | | | 74,282 | |
| Redeemed | | | (2,474,255 | ) | | | (18,176,255 | ) | | | (5,064,490 | ) | | | (30,286,455 | ) |
| | | | (1,811,338 | ) | | | (13,234,542 | ) | | | (4,143,277 | ) | | | (24,727,241 | ) |
| C Class/Shares Authorized | | | 10,000,000 | | | | | | | | 10,000,000 | | | | | |
| Sold | | | 5,072 | | | | 38,642 | | | | 3,906 | | | | 25,000 | |
| R Class/Shares Authorized | | | 10,000,000 | | | | | | | | 10,000,000 | | | | | |
| Sold | | | 102,397 | | | | 803,580 | | | | 30,549 | | | | 173,724 | |
| Redeemed | | | (50,466 | ) | | | (391,863 | ) | | | (32,215 | ) | | | (190,827 | ) |
| | | | 51,931 | | | | 411,717 | | | | (1,666 | ) | | | (17,103 | ) |
| Net increase (decrease) | | | (15,629,398 | ) | | | $(105,655,179 | ) | | | (33,573,681 | ) | | | $(201,397,291 | ) |
| (1) | March 1, 2010 (commencement of sale) through June 30, 2010 for the C Class. |
6. Fair Value Measurements
The fund’s securities valuation process is based on several considerations and may use multiple inputs to determine the fair value of the positions held by the fund. In conformity with accounting principles generally accepted in the United States of America, the inputs used to determine a valuation are classified into three broad levels as follows:
| Level 1 valuation inputs consist of unadjusted quoted prices in an active market for identical securities; |
| Level 2 valuation inputs consist of direct or indirect observable market data (including quoted prices for similar securities, evaluations of subsequent market events, interest rates, prepayment speeds, credit risk, etc.); or |
| • | Level 3 valuation inputs consist of unobservable data (including a fund’s own assumptions). |
The level classification is based on the lowest level input that is significant to the fair valuation measurement. The valuation inputs are not necessarily an indication of the risks associated with investing in these securities or other financial instruments.
The following is a summary of the level classifications as of period end. The Schedule of Investments provides additional information on the fund’s portfolio holdings.
| | | Level 1 | | | Level 2 | | | Level 3 | |
| Investment Securities | |
| Common Stocks | | | $294,672,931 | | | | — | | | | — | |
| Temporary Cash Investments | | | 252,196 | | | | $834,227 | | | | — | |
| Total Value of Investment Securities | | | $294,925,127 | | | | $834,227 | | | | — | |
7. Derivative Instruments
Equity Price Risk — The fund is subject to equity price risk in the normal course of pursuing its investment objectives. A fund may enter into futures contracts based on an equity index in order to manage its exposure to changes in market conditions. A fund may purchase futures contracts to gain exposure to increases in market value or sell futures contracts to protect against a decline in market value. Upon entering into a futures contract, a fund is required to deposit either cash or securities in an amount equal to a certain percentage of the contract value (initial margin). Subsequent payments (variation margin) are made or received daily, in cash, by a fund. The variation margin is equal to the daily change in the contract value and is recorded as unrealized gains and losses. A fund recognizes a realized gain or loss when the contract is closed or expires. Net realized and unrealized gains or losses occurring during the holding period of futures contracts are a component of net realized gain (loss) on futures contract transactions and change in net unrealized appreciation (depreciation) on futures contracts, respectively. One of the risks of entering into futures contracts is the possibility that the change in value of the contract may not correlate with the changes in value of the underlying securities. During the period, the fund infrequently purchased equity price risk derivative instruments for temporary investment purposes.
At period end, the fund did not have any equity price risk derivative instruments disclosed on the Statement of Assets and Liabilities. For the year ended June 30, 2011, the effect of equity price risk derivative instruments on the Statement of Operations was $1,130,876 in net realized gain (loss) on futures contract transactions.
8. Risk Factors
The fund concentrates its investments in stocks of small companies. Because of this, the fund may be subject to greater risk and market fluctuations than a fund investing in larger, more established companies.
9. Federal Tax Information
The tax character of distributions paid during the years ended June 30, 2011 and June 30, 2010 were as follows:
| | | 2011 | | | 2010 | |
| Distributions Paid From | | | | | | |
| Ordinary income | | | $302,154 | | | | $1,657,710 | |
| Long-term capital gains | | | — | | | | — | |
The book-basis character of distributions made during the year from net investment income or net realized gains may differ from their ultimate characterization for federal income tax purposes. These differences reflect the differing character of certain income items and net realized gains and losses for financial statement and tax purposes, and may result in reclassification among certain capital accounts on the financial statements.
As of June 30, 2011, the federal tax cost of investments and the components of distributable earnings on a tax-basis were as follows:
| Federal tax cost of investments | | | $244,139,893 | |
| Gross tax appreciation of investments | | | $61,386,335 | |
| Gross tax depreciation of investments | | | (9,766,874 | ) |
| Net tax appreciation (depreciation) of investments | | | $51,619,461 | |
| Undistributed ordinary income | | | $282,320 | |
| Accumulated capital losses | | | $(193,848,418 | ) |
The difference between book-basis and tax-basis cost and unrealized appreciation (depreciation) is attributable primarily to the tax deferral of losses on wash sales.
The accumulated capital losses represent net capital loss carryovers that may be used to offset future realized capital gains for federal income tax purposes. Future capital loss carryover utilization in any given year may be subject to Internal Revenue Code limitations. Capital loss carryovers of $(34,717,583) and $(159,130,835) expire in 2017 and 2018, respectively.
On December 22, 2010, the Regulated Investment Company Modernization Act of 2010 (the “Act”) was enacted, which changed various technical rules governing the tax treatment of regulated investment companies. The changes are generally effective for taxable years beginning after the date of enactment. Under the Act, the fund will be permitted to carry forward capital losses incurred in taxable years beginning after the date of enactment for an unlimited period. However, any losses incurred during those future taxable years will be required to be utilized prior to the losses incurred in pre-enactment taxable years, which carry an expiration date. As a result of this ordering rule, pre-enactment capital loss carryforwards may be more likely to expire unused.
| Investor Class | |
| For a Share Outstanding Throughout the Years Ended June 30 (except as noted) | |
| | | 2011 | | | 2010 | | | 2009 | | | 2008 | | | 2007(1) | | | 2006 | |
| Per-Share Data | |
| Net Asset Value, Beginning of Period | | | $6.15 | | | | $5.00 | | | | $7.76 | | | | $10.77 | | | | $9.88 | | | | $9.77 | |
Income From Investment Operations | | | | | | | | | | | | | | | | | | | | | | | | |
Net Investment Income (Loss)(2) | | | 0.01 | | | | 0.01 | | | | 0.02 | | | | — | (3) | | | 0.01 | | | | — | (3) |
Net Realized and Unrealized Gain (Loss) | | | 2.23 | | | | 1.16 | | | | (2.78 | ) | | | (2.01 | ) | | | 0.88 | | | | 0.61 | |
Total From Investment Operations | | | 2.24 | | | | 1.17 | | | | (2.76 | ) | | | (2.01 | ) | | | 0.89 | | | | 0.61 | |
| Distributions | | | | | | | | | | | | | | | | | | | | | | | | |
From Net Investment Income | | | (0.01 | ) | | | (0.02 | ) | | | — | (3) | | | (0.02 | ) | | | — | | | | (0.01 | ) |
From Net Realized Gains | | | — | | | | — | | | | — | | | | (0.98 | ) | | | — | | | | (0.49 | ) |
| Total Distributions | | | (0.01 | ) | | | (0.02 | ) | | | — | (3) | | | (1.00 | ) | | | — | | | | (0.50 | ) |
Net Asset Value, End of Period | | | $8.38 | | | | $6.15 | | | | $5.00 | | | | $7.76 | | | | $10.77 | | | | $9.88 | |
| | | | | | | | | | | | | | | | | | | | | | | | | |
Total Return(4) | | | 36.39 | % | | | 23.39 | % | | | (35.51 | )% | | | (19.13 | )% | | | 9.01 | % | | | 6.15 | % |
| | | | | | | | | | | | | | | | | | | | | | | | | |
| Ratios/Supplemental Data | |
Ratio of Operating Expenses to Average Net Assets | | | 0.89 | % | | | 0.90 | % | | | 0.90 | % | | | 0.87 | % | | | 0.87 | %(5) | | | 0.87 | % |
Ratio of Net Investment Income (Loss) to Average Net Assets | | | 0.17 | % | | | 0.12 | % | | | 0.33 | % | | | 0.06 | % | | | 0.23 | %(5) | | | 0.05 | % |
| Portfolio Turnover Rate | | | 61 | % | | | 44 | % | | | 92 | % | | | 105 | % | | | 61 | % | | | 122 | % |
| Net Assets, End of Period (in thousands) | | | $218,642 | | | | $234,727 | | | | $229,568 | | | | $454,464 | | | | $910,093 | | | | $924,133 | |
| (1) | January 1, 2007 through June 30, 2007. The fund’s fiscal year end was changed from December 31 to June 30, resulting in a six-month annual reporting period. For the years before June 30, 2007, the fund’s fiscal year end was December 31. |
| (2) | Computed using average shares outstanding throughout the period. |
| (3) | Per-share amount was less than $0.005. |
| (4) | Total returns are calculated based on the net asset value of the last business day. Total returns for periods less than one year are not annualized. |
See Notes to Financial Statements.
| Institutional Class | |
| For a Share Outstanding Throughout the Years Ended June 30 (except as noted) | |
| | | 2011 | | | 2010 | | | 2009 | | | 2008 | | | 2007(1) | | | 2006 | |
| Per-Share Data | |
| Net Asset Value, Beginning of Period | | | $6.19 | | | | $5.02 | | | | $7.79 | | | | $10.80 | | | | $9.90 | | | | $9.80 | |
Income From Investment Operations | | | | | | | | | | | | | | | | | | | | | | | | |
Net Investment Income (Loss)(2) | | | 0.03 | | | | 0.02 | | | | 0.03 | | | | 0.02 | | | | 0.02 | | | | 0.02 | |
Net Realized and Unrealized Gain (Loss) | | | 2.22 | | | | 1.18 | | | | (2.79 | ) | | | (2.02 | ) | | | 0.88 | | | | 0.61 | |
Total From Investment Operations | | | 2.25 | | | | 1.20 | | | | (2.76 | ) | | | (2.00 | ) | | | 0.90 | | | | 0.63 | |
| Distributions | | | | | | | | | | | | | | | | | | | | | | | | |
From Net Investment Income | | | (0.02 | ) | | | (0.03 | ) | | | (0.01 | ) | | | (0.03 | ) | | | — | | | | (0.04 | ) |
From Net Realized Gains | | | — | | | | — | | | | — | | | | (0.98 | ) | | | — | | | | (0.49 | ) |
| Total Distributions | | | (0.02 | ) | | | (0.03 | ) | | | (0.01 | ) | | | (1.01 | ) | | | — | | | | (0.53 | ) |
Net Asset Value, End of Period | | | $8.42 | | | | $6.19 | | | | $5.02 | | | | $7.79 | | | | $10.80 | | | | $9.90 | |
| | | | | | | | | | | | | | | | | | | | | | | | | |
Total Return(3) | | | 36.43 | % | | | 23.87 | % | | | (35.38 | )% | | | (18.99 | )% | | | 9.09 | % | | | 6.44 | % |
| | | | | | | | | | | | | | | | | | | | | | | | | |
| Ratios/Supplemental Data | |
Ratio of Operating Expenses to Average Net Assets | | | 0.69 | % | | | 0.70 | % | | | 0.70 | % | | | 0.67 | % | | | 0.67 | %(4) | | | 0.67 | % |
Ratio of Net Investment Income (Loss) to Average Net Assets | | | 0.37 | % | | | 0.32 | % | | | 0.53 | % | | | 0.26 | % | | | 0.43 | %(4) | | | 0.25 | % |
| Portfolio Turnover Rate | | | 61 | % | | | 44 | % | | | 92 | % | | | 105 | % | | | 61 | % | | | 122 | % |
| Net Assets, End of Period (in thousands) | | | $42,541 | | | | $42,599 | | | | $143,028 | | | | $218,820 | | | | $386,240 | | | | $383,412 | |
| (1) | January 1, 2007 through June 30, 2007. The fund’s fiscal year end was changed from December 31 to June 30, resulting in a six-month annual reporting period. For the years before June 30, 2007, the fund’s fiscal year end was December 31. |
| (2) | Computed using average shares outstanding throughout the period. |
| (3) | Total returns are calculated based on the net asset value of the last business day. Total returns for periods less than one year are not annualized. |
See Notes to Financial Statements.
A Class(1) | |
| For a Share Outstanding Throughout the Years Ended June 30 (except as noted) | |
| | | 2011 | | | 2010 | | | 2009 | | | 2008 | | | 2007(2) | | | 2006 | |
| Per-Share Data | |
| Net Asset Value, Beginning of Period | | | $6.05 | | | | $4.91 | | | | $7.65 | | | | $10.64 | | | | $9.78 | | | | $9.69 | |
Income From Investment Operations | | | | | | | | | | | | | | | | | | | | | | | | |
Net Investment Income (Loss)(3) | | | (0.01 | ) | | | (0.01 | ) | | | — | (4) | | | (0.02 | ) | | | — | (4) | | | (0.02 | ) |
Net Realized and Unrealized Gain (Loss) | | | 2.18 | | | | 1.16 | | | | (2.74 | ) | | | (1.98 | ) | | | 0.86 | | | | 0.60 | |
Total From Investment Operations | | | 2.17 | | | | 1.15 | | | | (2.74 | ) | | | (2.00 | ) | | | 0.86 | | | | 0.58 | |
| Distributions | | | | | | | | | | | | | | | | | | | | | | | | |
From Net Investment Income | | | — | | | | (0.01 | ) | | | — | | | | (0.01 | ) | | | — | | | | — | |
From Net Realized Gains | | | — | | | | — | | | | — | | | | (0.98 | ) | | | — | | | | (0.49 | ) |
| Total Distributions | | | — | | | | (0.01 | ) | | | — | | | | (0.99 | ) | | | — | | | | (0.49 | ) |
Net Asset Value, End of Period | | | $8.22 | | | | $6.05 | | | | $4.91 | | | | $7.65 | | | | $10.64 | | | | $9.78 | |
| | | | | | | | | | | | | | | | | | | | | | | | | |
Total Return(5) | | | 35.87 | % | | | 23.40 | % | | | (35.82 | )% | | | (19.30 | )% | | | 8.79 | % | | | 6.02 | % |
| | | | | | | | | | | | | | | | | | | | | | | | | |
| Ratios/Supplemental Data | |
Ratio of Operating Expenses to Average Net Assets | | | 1.14 | % | | | 1.15 | % | | | 1.15 | % | | | 1.12 | % | | | 1.12 | %(6) | | | 1.12 | % |
Ratio of Net Investment Income (Loss) to Average Net Assets | | | (0.08 | )% | | | (0.13 | )% | | | 0.08 | % | | | (0.19 | )% | | | (0.02 | )%(6) | | | (0.20 | )% |
| Portfolio Turnover Rate | | | 61 | % | | | 44 | % | | | 92 | % | | | 105 | % | | | 61 | % | | | 122 | % |
| Net Assets, End of Period (in thousands) | | | $33,452 | | | | $35,567 | | | | $49,253 | | | | $236,906 | | | | $358,347 | | | | $355,778 | |
| (1) | Prior to March 1, 2010, the A Class was referred to as the Advisor Class. |
| (2) | January 1, 2007 through June 30, 2007. The fund’s fiscal year end was changed from December 31 to June 30, resulting in a six-month annual reporting period. For the years before June 30, 2007, the fund’s fiscal year end was December 31. |
| (3) | Computed using average shares outstanding throughout the period. |
| (4) | Per-share amount was less than $0.005. |
| (5) | Total returns are calculated based on the net asset value of the last business day and do not reflect applicable sales charges. Total returns for periods less than one year are not annualized. |
See Notes to Financial Statements.
| C Class | |
| For a Share Outstanding Throughout the Years Ended June 30 (except as noted) | |
| | | 2011 | | | 2010(1) | |
| Per-Share Data | |
| Net Asset Value, Beginning of Period | | | $6.13 | | | | $6.40 | |
| Income From Investment Operations | | | | | | | | |
Net Investment Income (Loss)(2) | | | (0.06 | ) | | | (0.02 | ) |
| Net Realized and Unrealized Gain (Loss) | | | 2.20 | | | | (0.25 | ) |
| Total From Investment Operations | | | 2.14 | | | | (0.27 | ) |
| Net Asset Value, End of Period | | | $8.27 | | | | $6.13 | |
| | | | | | | | | |
Total Return(3) | | | 34.91 | % | | | (4.22 | )% |
| | | | | | | | | |
| Ratios/Supplemental Data | |
| Ratio of Operating Expenses to Average Net Assets | | | 1.89 | % | | | 1.90 | %(4) |
| Ratio of Net Investment Income (Loss) to Average Net Assets | | | (0.83 | )% | | | (0.79 | )%(4) |
| Portfolio Turnover Rate | | | 61 | % | | | 44 | %(5) |
| Net Assets, End of Period (in thousands) | | | $74 | | | | $24 | |
| (1) | March 1, 2010 (commencement of sale) through June 30, 2010. |
| (2) | Computed using average shares outstanding throughout the period. |
| (3) | Total returns are calculated based on the net asset value of the last business day and do not reflect applicable sales charges. Total returns for periods less than one year are not annualized. |
| (5) | Portfolio turnover is calculated at the fund level. Percentage indicated was calculated for the year ended June 30, 2010. |
See Notes to Financial Statements.
| R Class | |
| For a Share Outstanding Throughout the Years Ended June 30 (except as noted) | |
| | | 2011 | | | 2010 | | | 2009 | | | 2008 | | | 2007(1) | | | 2006 | |
| Per-Share Data | |
| Net Asset Value, Beginning of Period | | | $6.01 | | | | $4.89 | | | | $7.63 | | | | $10.63 | | | | $9.78 | | | | $9.72 | |
Income From Investment Operations | | | | | | | | | | | | | | | | | | | | | | | | |
Net Investment Income (Loss)(2) | | | (0.02 | ) | | | (0.02 | ) | | | (0.01 | ) | | | (0.04 | ) | | | (0.01 | ) | | | (0.05 | ) |
Net Realized and Unrealized Gain (Loss) | | | 2.16 | | | | 1.14 | | | | (2.73 | ) | | | (1.98 | ) | | | 0.86 | | | | 0.60 | |
Total From Investment Operations | | | 2.14 | | | | 1.12 | | | | (2.74 | ) | | | (2.02 | ) | | | 0.85 | | | | 0.55 | |
| Distributions | | | | | | | | | | | | | | | | | | | | | | | | |
From Net Realized Gains | | | — | | | | — | | | | — | | | | (0.98 | ) | | | — | | | | (0.49 | ) |
Net Asset Value, End of Period | | | $8.15 | | | | $6.01 | | | | $4.89 | | | | $7.63 | | | | $10.63 | | | | $9.78 | |
| | | | | | | | | | | | | | | | | | | | | | | | | |
Total Return(3) | | | 35.61 | % | | | 22.90 | % | | | (35.91 | )% | | | (19.51 | )% | | | 8.69 | % | | | 5.70 | % |
| | | | | | | | | | | | | | | | | | | | | | | | | |
| Ratios/Supplemental Data | |
Ratio of Operating Expenses to Average Net Assets | | | 1.39 | % | | | 1.40 | % | | | 1.40 | % | | | 1.37 | % | | | 1.37 | %(4) | | | 1.37 | % |
Ratio of Net Investment Income (Loss) to Average Net Assets | | | (0.33 | )% | | | (0.38 | )% | | | (0.17 | )% | | | (0.44 | )% | | | (0.27 | )%(4) | | | (0.45 | )% |
| Portfolio Turnover Rate | | | 61 | % | | | 44 | % | | | 92 | % | | | 105 | % | | | 61 | % | | | 122 | % |
| Net Assets, End of Period (in thousands) | | | $945 | | | | $384 | | | | $321 | | | | $254 | | | | $395 | | | | $353 | |
| (1) | January 1, 2007 through June 30, 2007. The fund’s fiscal year end was changed from December 31 to June 30, resulting in a six-month annual reporting period. For the years before June 30, 2007, the fund’s fiscal year end was December 31. |
| (2) | Computed using average shares outstanding throughout the period. |
| (3) | Total returns are calculated based on the net asset value of the last business day. Total returns for periods less than one year are not annualized. |
See Notes to Financial Statements.
Report of Independent Registered Public Accounting Firm |
To the Directors of the American Century Quantitative Equity Funds, Inc. and Shareholders of the Small Company Fund:
In our opinion, the accompanying statement of assets and liabilities, including the schedule of investments, and the related statements of operations and of changes in net assets and the financial highlights present fairly, in all material respects, the financial position of the Small Company Fund (one of the eleven funds comprising the American Century Quantitative Equity Funds, Inc., hereafter referred to as the “Fund”) at June 30, 2011, the results of its operations for the year then ended, the changes in its net assets for each of the two years in the period then ended and the financial highlights for each of the periods presented, in conformity with accounting principles generally accepted in the United States of America. These financial statements and financial highlights (hereafter referred to as “financial statements”) are the responsibility of the Fund’s management; our responsibility is to express an opinion on these financial statements based on our audits. We conducted our audits of these financial statements in accordance with the standards of the Public Company Accounting Oversight Board (United States). Those standards require that we plan and perform the audit to obtain reasonable assurance about whether the financial statements are free of material misstatement. An audit includes examining, on a test basis, evidence supporting the amounts and disclosures in the financial statements, assessing the accounting principles used and significant estimates made by management, and evaluating the overall financial statement presentation. We believe that our audits, which included confirmation of securities at June 30, 2011 by correspondence with the custodian and brokers, provide a reasonable basis for our opinion.
PricewaterhouseCoopers LLP
Kansas City, Missouri
August 18, 2011
The individuals listed below serve as directors of the funds. Each director will continue to serve in this capacity until death, retirement, resignation or removal from office. The mandatory retirement age for directors who are not “interested persons,” as that term is defined in the Investment Company Act (independent directors), is 73. However, the mandatory retirement age may be extended for a period not to exceed two years with the approval of the remaining independent directors.
Mr. Thomas is the only director who is an “interested person” because he currently serves as President and Chief Executive Officer of American Century Companies, Inc. (ACC), the parent company of American Century Investment Management, Inc. (ACIM or the advisor).
The other directors (more than three-fourths of the total number) are independent; that is, they have never been employees, directors or officers of, and have no financial interest in, ACC or any of its wholly owned, direct or indirect, subsidiaries, including ACIM, American Century Investment Services, Inc. (ACIS) and American Century Services, LLC (ACS). The directors serve in this capacity for eight (in the case of Mr. Thomas, 15) registered investment companies in the American Century Investments family of funds.
The following presents additional information about the directors. The mailing address for each director other than Mr. Thomas is 1665 Charleston Road, Mountain View, California 94043. The mailing address for Mr. Thomas is
4500 Main Street, Kansas City, Missouri 64111.
Name (Year of Birth) | Position(s) Held with Funds | Length of Time Served | Principal Occupation(s) During Past 5 Years | | Number of American Century Portfolios Overseen by Director | Other Directorships Held During Past 5 Years |
| Independent Directors |
| Tanya S. Beder (1955) | Director | Since 2011 | Chairman, SBCC Group Inc. (investment advisory services) (2006 to present); Fellow in Practice, International Center for Finance, Yale University School of Management (1985 to present); Chief Executive Officer, Tribeca Global Management LLC (asset management firm) (2004 to 2006) | | 40 | None |
| Jeremy I. Bulow (1954) | Director | Since 2011 | Professor of Economics, Stanford University, Graduate School of Business (1979 to present) | | 40 | None |
| John Freidenrich (1937) | Director | Since 2005 | Founder, Member and Manager, Regis Management Company, LLC (investment management firm) (April 2004 to present) | | 40 | None |
Name (Year of Birth) | Position(s) Held with Funds | Length of Time Served | Principal Occupation(s) During Past 5 Years | | Number of American Century Portfolios Overseen by Director | Other Directorships Held During Past 5 Years |
| Independent Directors |
| Ronald J. Gilson (1946) | Director and Chairman of the Board | Since 1995 | Charles J. Meyers Professor of Law and Business, Stanford Law School (1979 to present); Marc and Eva Stern Professor of Law and Business, Columbia University School of Law (1992 to present) | | 40 | None |
Frederick L. A. Grauer (1946) | Director | Since 2008 | Senior Advisor, BlackRock, Inc. (investment management firm) (2010 to 2011); Senior Advisor, Barclays Global Investors (investment management firm) (2003 to 2009) | | 40 | None |
| Peter F. Pervere (1947) | Director | Since 2007 | Retired | | 40 | Intraware, Inc. (2003 to 2009) |
| Myron S. Scholes (1941) | Director | Since 1980 | Chairman, Platinum Grove Asset Management, L.P. (asset manager) (1999 to 2009); Frank E. Buck Professor of Finance-Emeritus, Stanford Graduate School of Business (1996 to present) | | 40 | Dimensional Fund Advisors (investment advisor); CME Group, Inc. (futures and options exchange) |
| John B. Shoven (1947) | Director | Since 2002 | Professor of Economics, Stanford University (1973 to present) | | 40 | Cadence Design Systems; Exponent; Financial Engines; Watson Wyatt Worldwide (2002 to 2006) |
| |
| Interested Director |
Jonathan S. Thomas (1963) | Director and President | Since 2007 | President and Chief Executive Officer, ACC (March 2007 to present); Chief Administrative Officer, ACC (February 2006 to February 2007); Executive Vice President, ACC (November 2005 to February 2007). Also serves as: Chief Executive Officer and Manager, ACS; Executive Vice President, ACIM; Director, ACC, ACIM and other ACC subsidiaries | | 104 | None |
Officers
The following table presents certain information about the executive officers of the funds. Each officer serves as an officer for each of the 15 investment companies in the American Century family of funds, unless otherwise noted. No officer is compensated for his or her service as an officer of the funds. The listed officers are interested persons of the funds and are appointed or re-appointed on an annual basis. The mailing address for each of the officers listed below is 4500 Main Street, Kansas City, Missouri 64111.
Name (Year of Birth) | Offices with the Funds | | Principal Occupation(s) During the Past Five Years |
Jonathan S. Thomas (1963) | Director and President since 2007 | | President and Chief Executive Officer, ACC (March 2007 to present); Chief Administrative Officer, ACC (February 2006 to February 2007); Executive Vice President, ACC (November 2005 to February 2007). Also serves as: Chief Executive Officer and Manager, ACS; Executive Vice President, ACIM; Director, ACC, ACIM and other ACC subsidiaries |
Barry Fink (1955) | Executive Vice President since 2007 | | Chief Operating Officer and Executive Vice President, ACC (September 2007 to present); President, ACS (October 2007 to present); Managing Director, Morgan Stanley (2000 to 2007); Global General Counsel, Morgan Stanley (2000 to 2006). Also serves as: Manager, ACS and Director, ACC and certain ACC subsidiaries |
Maryanne L. Roepke (1956) | Chief Compliance Officer since 2006 and Senior Vice President since 2000 | | Chief Compliance Officer, American Century funds, ACIM and ACS (August 2006 to present); Assistant Treasurer, ACC (January 1995 to August 2006); and Treasurer and Chief Financial Officer, various American Century funds (July 2000 to August 2006). Also serves as: Senior Vice President, ACS |
| Charles A. Etherington (1957) | General Counsel since 2007 and Senior Vice President since 2006 | | Attorney, ACC (February 1994 to present); Vice President, ACC (November 2005 to present), General Counsel, ACC (March 2007 to present); Also serves as General Counsel, ACIM, ACS, ACIS and other ACC subsidiaries; and Senior Vice President, ACIM and ACS |
| Robert J. Leach (1966) | Vice President, Treasurer and Chief Financial Officer since 2006 | | Vice President, ACS (February 2000 to present); and Controller, various American Century funds (1997 to September 2006) |
| David H. Reinmiller (1963) | Vice President since 2001 | | Attorney, ACC (January 1994 to present); Associate General Counsel, ACC (January 2001 to present); Also serves as Vice President, ACIM and ACS |
| Ward D. Stauffer (1960) | Secretary since 2005 | | Attorney, ACC (June 2003 to present) |
The Statement of Additional Information has additional information about the fund’s directors and is available without charge, upon request, by calling 1-800-345-2021.
| Approval of Management Agreement |
At a meeting held on June 28, 2011, the Fund’s Board of Directors/Trustees unanimously approved the renewal of the management agreement pursuant to which American Century Investment Management, Inc. (the “Advisor”) acts as the investment advisor for the Fund. Under Section 15(c) of the Investment Company Act, contracts for investment advisory services are required to be reviewed, evaluated, and approved by a majority of a fund’s independent directors/trustees (the “Directors”) each year.
As a part of the approval process, the Board requested and reviewed extensive data and information compiled by the Advisor and certain independent providers of evaluation data concerning the Fund and the services provided to the Fund by the Advisor. This review was in addition to the oversight and evaluation undertaken by the Board and its committees on a continuous basis throughout the year and included, but was not limited to the following:
| the nature, extent, and quality of investment management, shareholder services, and other services provided by the Advisor to the Fund; |
| the wide range of other programs and services the Advisor provides to the Fund and its shareholders on a routine and non-routine basis; |
| the investment performance of the fund, including data comparing the Fund’s performance to appropriate benchmarks and/or a peer group of other mutual funds with similar investment objectives and strategies; |
| data comparing the cost of owning the Fund to the cost of owning similar funds; |
| the Advisor’s compliance policies, procedures, and regulatory experience; |
| financial data showing the cost of services provided to the Fund, the profitability of the Fund to the Advisor, and the overall profitability of the Advisor; |
| data comparing services provided and charges to other investment management clients of the Advisor; and |
| consideration of collateral benefits derived by the Advisor from the management of the Fund and any potential economies of scale relating thereto. |
In keeping with its practice, the Board held two in-person meetings and one telephonic meeting to review and discuss the information provided. The Board also had the benefit of the advice of its independent counsel throughout the period.
Factors Considered
The Directors considered all of the information provided by the Advisor, the independent data providers, and the Board’s independent counsel, and evaluated such information for the Fund. In connection with their review, the Directors did not identify any single factor as being all-important or controlling, and each Director may have attributed different levels of importance to different factors. In deciding to renew the management agreement, the Board based its decision on a number of factors, including the following:
Nature, Extent and Quality of Services — Generally. Under the management agreement, the Advisor is responsible for providing or arranging for all services necessary for the operation of the Fund. The Board noted that under the management agreement, the Advisor provides or arranges at its own expense a wide variety
of services including:
| constructing and designing the Fund |
| portfolio research and security selection |
| initial capitalization/funding |
| daily valuation of the Fund’s portfolio |
| shareholder servicing and transfer agency, including shareholder confirmations, recordkeeping, and communications |
| regulatory and portfolio compliance |
| marketing and distribution |
The Board noted that many of these services have expanded over time both in terms of quantity and complexity in response to shareholder demands, competition in the industry, changing distribution channels, and the changing regulatory environment.
Investment Management Services. The nature of the investment management services provided to the Fund is quite complex and allows Fund shareholders access to professional money management, instant diversification of their investments within an asset class, the opportunity to easily diversify among asset classes by investing in or exchanging among various American Century Investments funds, and liquidity. In evaluating investment performance, the Board expects the Advisor to manage the Fund in accordance with its investment objectives and approved strategies. Further, the Directors recognize that the Advisor has an obligation to seek the best execution of fund trades. In providing these services, the Advisor utilizes teams of investment professionals (portfolio managers, analysts, research assistants, and securities traders) who require extensive information technology, research, training, compliance and other systems to conduct their business. The Board, directly and through its Portfolio Committee, regularly reviews investment performance information for the Fund, together with comparative information for appropriate benchmarks and/or peer groups
of similarly-managed funds, over different time horizons. The Directors also review detailed performance information during the management agreement approval process. If performance concerns are identified, the Fund receives special reviews until performance improves, during which the Board discusses with the Advisor the reasons for such results (e.g., market conditions, security selection) and any efforts being undertaken to improve performance. The Board found the investment management services provided by the Advisor to the Fund to meet or exceed industry standards. More detailed information about the Fund’s performance can be found in the Performance and Portfolio Commentary sections of this report.
Shareholder and Other Services. Under the management agreement, the Advisor provides the Fund with a comprehensive package of transfer agency, shareholder, and other services. The Board, directly and through various committees of the Board, regularly reviews reports and evaluations of such services at its regular meetings. These reports include, but are not limited to, information regarding the operational efficiency and accuracy of the shareholder and transfer agency services provided, staffing levels, shareholder satisfaction (as measured by external as well as internal sources), technology support, new products and services offered to Fund shareholders, securities trading activities, portfolio valuation services, auditing services, and legal and operational compliance activities. Certain aspects of shareholder and transfer agency service level efficiency and the quality of securities trading activities are measured by independent third party providers and are presented in comparison to other fund groups not managed by the Advisor. The Board found the services provided by the Advisor to the Fund under the management agreement to be competitive and of high quality.
Costs of Services and Profitability. The Advisor provides detailed information concerning its cost of providing various services to the Fund, its profitability in managing the Fund, its overall profitability, and its financial condition. The Directors have reviewed with the Advisor the methodology used to prepare this financial information. The financial information regarding the Advisor is considered in evaluating the Advisor’s financial condition, ability to continue to provide services under the management agreement, and the reasonableness of the current management fee. The Board concluded that the Advisor’s profits were reasonable in light of the services provided to the Fund.
Ethics. The Board generally considers the Advisor’s commitment to providing quality services to shareholders and to conducting its business ethically. They noted that the Advisor’s practices generally meet or exceed industry best practices.
Economies of Scale. The Board also reviewed information provided by the Advisor regarding the possible existence of economies of scale in connection with the management of the Fund. The Board concluded that economies of scale are difficult to measure and predict with precision, especially on a fund-by-fund basis. The Board concluded that the Advisor is appropriately sharing economies of scale through its competitive fee structure, offering competitive fees from fund inception, and through reinvestment in its business to provide shareholders additional content and services.
Comparison to Other Funds’ Fees. The management agreement provides that the Fund pay the Advisor a single, all-inclusive (or unified) management fee for providing all services necessary for the management and operation of the Fund, other than brokerage expenses, taxes, interest, extraordinary expenses, and the fees and expenses of the Fund’s independent directors (including their independent legal counsel) and expenses incurred in connection with the provision of shareholder services and distribution services under a plan adopted pursuant to Rule 12b-1 under the 1940 Act. Under the unified fee structure, the Advisor is responsible for providing all investment advisory, custody, audit, administrative, compliance, recordkeeping, marketing and shareholder services, or arranging and supervising third parties to provide such services. By contrast, most other funds are charged a variety of fees, including an investment advisory fee, a transfer agency fee, an administrative fee, distribution charges and other expenses. Other than their investment advisory fees and any applicable Rule 12b-1 distribution fees, all other components of the total fees charged by these other funds may be increased without shareholder approval. The Board believes the unified fee structure is a benefit to Fund shareholders because it clearly discloses to shareholders the cost of owning Fund shares, and, since the unified fee cannot be increased without a vote of Fund shareholders, it shifts to the Advisor the risk of increased costs of operating the Fund and provides a direct incentive to minimize administrative inefficiencies. Part of the Board’s analysis of fee levels involves reviewing certain evaluative data compiled by an independent provider and comparing the Fund’s unified fee to the total expense ratio of other funds in the Fund’s peer group. The Board concluded that the management fee paid by the Fund to the Advisor under the management agreement is reasonable in light of the services provided to the Fund.
Comparison to Fees and Services Provided to Other Clients of the Advisor. The Board also requested and received information from the Advisor concerning the nature of the services, fees, costs and profitability of its advisory services to advisory clients other than the Fund. They observed that these varying types of client accounts require different services and involve different regulatory and entrepreneurial risks than the management of the Fund. The Board analyzed this information and concluded that the fees charged and services provided to the Fund were reasonable by comparison.
Collateral or “Fall-Out” Benefits Derived by the Advisor. The Board considered the existence of collateral benefits the Advisor may receive as a result of its relationship with the Fund. They concluded that the Advisor’s primary business is managing mutual funds and it generally does not use fund or shareholder information to generate profits in other lines of business, and therefore does not derive any significant collateral benefits from them. The Board noted that the Advisor receives proprietary research from broker-dealers that execute fund portfolio transactions and concluded that this research is likely to benefit Fund shareholders. The Board also determined that the Advisor is able to provide investment management services to certain clients other than the Fund, at least in part, due to its existing infrastructure built to serve the fund complex. The Board concluded, however, that the assets of those other clients are not material to the analysis and, where applicable, may be included with the assets of the Fund to determine breakpoints in the management fee schedule.
Existing Relationship. The Board also considered whether there was any reason for not continuing the existing arrangement with the Advisor. In this regard, the Board was mindful of the potential disruptions of the Fund’s operations and various risks, uncertainties, and other effects that could occur as a result of a decision not to continue such relationship. In particular, the Board recognized that most shareholders have invested in the Fund on the strength of the Advisor’s industry standing and reputation and in the expectation that the Advisor will have a continuing role in providing advisory services to the Fund.
Conclusion of the Directors. As a result of this process, the Board, including all of the independent directors and assisted by the advice of independent legal counsel, taking into account all of the factors discussed above and the information provided by the Advisor and others, concluded that the management agreement between the Fund and the Advisor is fair and reasonable in light of the services provided and should be renewed.
Retirement Account Information
As required by law, distributions you receive from certain IRAs, or 403(b), 457 and qualified plans are subject to federal income tax withholding, unless you elect not to have withholding apply. Tax will be withheld on the total amount withdrawn even though you may be receiving amounts that are not subject to withholding, such as nondeductible contributions. In such case, excess amounts of withholding could occur. You may adjust your withholding election so that a greater or lesser amount will be withheld.
If you don’t want us to withhold on this amount, you must notify us to not withhold the federal income tax. You may notify us in writing or in certain situations by telephone or through other electronic means. You have the right to revoke your withholding election at any time and any election you make may remain in effect until revoked by filing a new election.
Remember, even if you elect not to have income tax withheld, you are liable for paying income tax on the taxable portion of your withdrawal. If you elect not to have income tax withheld or you don’t have enough income tax withheld, you may be responsible for payment of estimated tax. You may incur penalties under the estimated tax rules if your withholding and estimated tax payments are not sufficient. You can reduce or defer the income tax on a distribution by directly or indirectly rolling such distribution over to another IRA or eligible plan. You should consult your tax advisor for additional information.
State tax will be withheld if, at the time of your distribution, your address is within one of the mandatory withholding states and you have federal income tax withheld. State taxes will be withheld from your distribution in accordance with the respective state rules.
Proxy Voting Guidelines
American Century Investment Management, Inc., the fund’s investment advisor, is responsible for exercising the voting rights associated with the securities purchased and/or held by the fund. A description of the policies and procedures the advisor uses in fulfilling this responsibility is available without charge, upon request, by calling 1-800-345-2021. It is also available on American Century Investments’ website at americancentury.com and on the Securities and Exchange Commission’s website at sec.gov. Information regarding how the investment advisor voted proxies relating to portfolio securities during the most recent 12-month period ended June 30 is available on the “About Us” page at americancentury.com. It is also available at sec.gov.
Quarterly Portfolio Disclosure
The fund files its complete schedule of portfolio holdings with the Securities and Exchange Commission (SEC) for the first and third quarters of each fiscal year on Form N-Q. The fund’s Forms N-Q are available on the SEC’s website at sec.gov, and may be reviewed and copied at the SEC’s Public Reference Room in Washington, DC. Information on the operation of the Public Reference Room may be obtained by calling 1-800-SEC-0330. The fund also makes its complete schedule of portfolio holdings for the most recent quarter of its fiscal year available on its website at americancentury.com and, upon request, by calling 1-800-345-2021.
Other Tax Information
The following information is provided pursuant to provisions of the Internal Revenue Code.
The fund hereby designates up to the maximum amount allowable as qualified dividend income for the fiscal year ended June 30, 2011.
For corporate taxpayers, the fund hereby designates $302,154, or up to the maximum amount allowable, of ordinary income distributions paid during the fiscal year ended June 30, 2011 as qualified for the corporate dividends received deduction.
| Contact Us | americancentury.com |
| Automated Information Line | 1-800-345-8765 |
| Investor Services Representative | 1-800-345-2021 or 816-531-5575 |
| Investors Using Advisors | 1-800-378-9878 |
| Business, Not-For-Profit, Employer-Sponsored Retirement Plans | 1-800-345-3533 |
| Banks and Trust Companies, Broker-Dealers, Financial Professionals, Insurance Companies | 1-800-345-6488 |
| Telecommunications Device for the Deaf | 1-800-634-4113 |
American Century Quantitative Equity Funds, Inc.
Investment Advisor:
American Century Investment Management, Inc.
Kansas City, Missouri
This report and the statements it contains are submitted for the general information of our shareholders. The report is not authorized for distribution to prospective investors unless preceded or accompanied by an effective prospectus.
©2011 American Century Proprietary Holdings, Inc. All rights reserved.
CL-ANN-72460 1108
ANNUAL REPORT JUNE 30, 2011
| | Strategic Inflation Opportunities Fund |
| President’s Letter | 2 |
| Market Perspective | 3 |
| Performance | 4 |
| Portfolio Commentary | 6 |
| Fund Characteristics | 8 |
| Shareholder Fee Example | 9 |
| Schedule of Investments | 11 |
| Statement of Assets and Liabilities | 24 |
| Statement of Operations | 25 |
| Statement of Changes in Net Assets | 26 |
| Notes to Financial Statements | 27 |
| Financial Highlights | 35 |
| Report of Independent Registered Public Accounting Firm | 40 |
| Management | 41 |
| Approval of Management Agreement | 44 |
| Additional Information | 49 |
Any opinions expressed in this report reflect those of the author as of the date of the report, and do not necessarily represent the opinions of American Century Investments® or any other person in the American Century Investments organization. Any such opinions are subject to change at any time based upon market or other conditions and American Century Investments disclaims any responsibility to update such opinions. These opinions may not be relied upon as investment advice and, because investment decisions made by American Century Investments funds are based on numerous factors, may not be relied upon as an indication of trading intent on behalf of any American Century Investments fund. Security examples are used for representational purposes only and are not intended as recommendations to purchase or sell securities. Performance information for comparative indices and securities is provided to American Century Investments by third party vendors. To the best of American Century Investments’ knowledge, such information is accurate at the time of printing.
Dear Investor:
Thank you for reviewing this annual report for the period ended June 30, 2011. Our report offers investment performance and portfolio information, presented with the expert perspective and commentary of our portfolio management team.
This report remains one of our most important vehicles for conveying information about investment performance and the market factors and strategies that affect fund returns. For additional, updated information on fund performance, portfolio strategy, and the investment markets, we encourage you to visit our website, americancentury.com. Click on the “Fund Performance” and “Insights & News” headings at the top of our Individual Investors site.
Reporting Period Perspective: Highest Broad Fiscal-Year U.S. Stock Returns Since 1997
Benefitting from favorable conditions and expectations, the U.S. stock market produced exceptional returns, the highest for any 12-month period ended June 30 since the fiscal year ended June 30, 1997. Back then, the S&P 500 Index gained 34.71%, compared with 30.69% for the most-recent reporting period. The intervening 14 years help illustrate how infrequently such a high level of performance occurs, requiring an alignment of economic and market conditions that’s difficult to duplicate.
The exceptional returns experienced during the reporting period represent a rebound from previous declines. After experiencing 10–12% declines during the second quarter of 2010—stemming from the European sovereign debt crisis and double-dip recession fears—most broad U.S. stock indices advanced 30% or more during the following 12 months. Monetary and fiscal intervention in 2010 stimulated growth and fueled investor optimism about economic and financial market conditions in 2011 and 2012, encouraging investments in riskier assets.
However, that optimism has diminished in the summer of 2011 as the European debt crisis returned to prominence and other debt and economic challenges emerged. As the reporting period came to a close in June 2011, we saw increasing signs that the U.S. economic recovery had lost momentum. As a result, economic growth forecasts were reduced, and broad U.S. stock indices trended downward beginning in May. As we enter the third quarter of 2011, investor concern over fiscal austerity measures in the U.S. and other developed economies raised fears of a return to recession and accelerated a decline in global equity markets. We appreciate your continued trust in us during these uncertain times.
Sincerely,
Jonathan Thomas
President and Chief Executive Officer
American Century Investments
By Scott Wittman, Chief Investment Officer, Quantitative Equity and Asset Allocation
Markets Showed Faith in Recovery
While economic data were mixed, investors generally displayed confidence in the sustainability of the U.S. economic recovery during the 12-months ended June 30, 2011. Unemployment and housing data remained disappointing, but the manufacturing sector posted gains, and corporate earnings remained robust. Europe’s sovereign-debt woes challenged the financial markets at the beginning and end of the period, but by late June 2011, the passage of an austerity plan for Greece helped restore some confidence.
Overall, the financial markets shook off the periodic uneasiness to drive stocks and other “riskier” assets sharply higher and the Treasury yield curve steeper. In particular, investors found support from the Federal Reserve (the Fed). The central bank’s second round of quantitative easing (QE2), a government-securities purchase program, helped bolster market liquidity and encourage risk-taking. Similarly, the extension of prevailing U.S. federal income tax rates boosted investor optimism.
Rising Commodity Prices Push Inflation Higher
In early 2011, political unrest erupted in the Middle East and North Africa, sending oil prices soaring. Concerns about supply disruptions in the wake of growing global demand caused Brent crude prices to increase 50% during the 12-month reporting period and WTI crude futures to jump more than 26%. Prices for other commodities also skyrocketed, pushing the return on the S&P Goldman Sachs Commodities Index up 26%.
In this environment of rising commodity prices and improving economic outlooks, inflationary pressures began brewing. U.S. inflation, as measured by the year-to-year change in the Consumer Price Index, ended the period at 3.6%, compared with 1.1% as of June 30, 2010. Furthermore, year-over-year core inflation (minus food and energy prices) was 1.6% as of June 30, 2011, its highest level since January 2010.
At the same time, rising U.S. federal budget deficits and few signs that the Fed would budge any time soon from its historically low short-term interest rate target helped cause the U.S. dollar to tumble versus the euro and other major world currencies. The dollar’s decline also magnified the sharp rise in commodity prices and fueled demand for gold.
| 12-Month Total Returns |
| As of June 30, 2011 |
| S&P Goldman Sachs Commodities Index (total returns) | 26.11% |
| London Gold PM Fix, in U.S. dollars | 21.02% |
| Barclays Capital Global Treasury Bond Index, ex-U.S. | 14.09% |
| Barclays Capital U.S. Treasury Inflation Protected |
| Securities (TIPS) Index | 7.74% |
| Barclays Capital U.S. 1-3 Month Treasury Bill Index | 0.14% |
| U.S. Dollar (Dollar Spot Index) | -13.62% |
| Total Returns as of June 30, 2011 |
| | | | Average Annual Returns | |
| | Ticker Symbol | 1 year | Since Inception | Inception Date |
Investor Class(1) | ASIOX | 12.78% | 6.95% | 4/30/10 |
Barclays Capital U.S. 1-3 Month Treasury Bill Index | — | 0.14% | 0.14% | — |
Institutional Class(1) | ASINX | 12.93% | 7.07% | 4/30/10 |
A Class(1) No sales charge* With sales charge* | ASIDX | 12.50% 6.08% | 6.63% 1.35% | 4/30/10 |
C Class(1) | ASIZX | 11.64% | 5.83% | 4/30/10 |
R Class(1) | ASIUX | 12.10% | 6.30% | 4/30/10 |
*Sales charges include initial sales charges and contingent deferred sales charges (CDSCs), as applicable. A Class shares have a 5.75% maximum initial sales charge and may be subject to a maximum CDSC of 1.00%. C Class shares redeemed within 12 months of purchase are subject to a maximum CDSC of 1.00%. The SEC requires that mutual funds provide performance information net of maximum sales charges in all cases where charges could be applied.
| (1) | Returns would have been lower if a portion of the management fee had not been waived. |
Data presented reflect past performance. Past performance is no guarantee of future results. Current performance may be higher or lower than the performance shown. Investment return and principal value will fluctuate, and redemption value may be more or less than original cost. To obtain performance data current to the most recent month end, please call 1-800-345-2021 or visit americancentury.com. As interest rates rise, bond values will decline. International investing involves special risks, such as political instability and currency fluctuations. Investing in emerging markets may accentuate these risks. There are certain risks involved in investing in forward foreign currency exchange contracts; changes in the value of foreign currencies against the U.S. dollar could result in losses to the fund. Commodity investing involves special risks, such as weather, disease, embargoes, tariffs, taxes and economic, political and regulatory developments.
Unless otherwise indicated, performance reflects Investor Class shares; performance for other share classes will vary due to differences in fee structure. For information about other share classes available, please consult the prospectus. Data assumes reinvestment of dividends and capital gains, and none of the charts reflect the deduction of taxes that a shareholder would pay on fund distributions or the redemption of fund shares. Returns for the index are provided for comparison. The fund’s total returns include operating expenses (such as transaction costs and management fees) that reduce returns, while the total returns of the index do not.
| Growth of $10,000 Over Life of Class |
| $10,000 investment made April 30, 2010 |
| (1) | From 4/30/10, the Investor Class’s inception date. Not annualized. |
| (2) | Ending value would have been lower if a portion of the management fee had not been waived. |
| Total Annual Fund Operating Expenses |
| Investor Class | Institutional Class | A Class | C Class | R Class |
| 1.17% | 0.97% | 1.42% | 2.17% | 1.67% |
The total annual fund operating expenses shown is as stated in the fund’s prospectus current as of the date of this report. The prospectus may vary from the expense ratio shown elsewhere in this report because it is based on a different time period, includes acquired fund fees and expenses, and, if applicable, does not include fee waivers or expense reimbursements.
Data presented reflect past performance. Past performance is no guarantee of future results. Current performance may be higher or lower than the performance shown. Investment return and principal value will fluctuate, and redemption value may be more or less than original cost. To obtain performance data current to the most recent month end, please call 1-800-345-2021 or visit americancentury.com. As interest rates rise, bond values will decline. International investing involves special risks, such as political instability and currency fluctuations. Investing in emerging markets may accentuate these risks. There are certain risks involved in investing in forward foreign currency exchange contracts; changes in the value of foreign currencies against the U.S. dollar could result in losses to the fund. Commodity investing involves special risks, such as weather, disease, embargoes, tariffs, taxes and economic, political and regulatory developments.
Unless otherwise indicated, performance reflects Investor Class shares; performance for other share classes will vary due to differences in fee structure. For information about other share classes available, please consult the prospectus. Data assumes reinvestment of dividends and capital gains, and none of the charts reflect the deduction of taxes that a shareholder would pay on fund distributions or the redemption of fund shares. Returns for the index are provided for comparison. The fund’s total returns include operating expenses (such as transaction costs and management fees) that reduce returns, while the total returns of the index do not.
Portfolio Managers: Bob Gahagan, Bill Martin, Brian Howell, John Lovito, and Federico Garcia Zamora
Performance Summary
For the 12 months ended June 30, 2011, the fund gained 12.78%.* The portfolio’s benchmark, the Barclays Capital U.S. 1-3 Month Treasury Bill Index, advanced 0.14% during the same period.
In general, optimism regarding the sustainability of the global economic recovery, combined with healthy corporate earnings, helped drive sharp gains among global stocks and other “risk” assets during the 12-month period. In this environment, nominal U.S. Treasury returns were lackluster, with the 30-year Treasury bond scuffling to a –4% total return for the period.
On the other hand, TIPS (Treasury inflation-protected securities) benefited from mounting inflationary pressures and significantly outperformed their nominal counterparts. The Federal Reserve’s (the Fed’s) effort to increase the nation’s money supply with a second round of quantitative easing (QE2), along with other fiscal and monetary stimulus measures and the soaring federal debt, triggered concerns about long-term inflation, which drove down the U.S. dollar’s value versus other major currencies. The dollar’s slide, combined with strong global demand for raw materials and other physical goods, pushed commodity prices sharply higher during the 12-month period.
The portfolio’s outperformance relative to the benchmark was primarily due to strong results from commodity-linked holdings, the better relative performance of TIPS compared with nominal Treasuries, and solid returns from the portfolio’s domestic and foreign stock and foreign currency holdings.
CPI Headed Upward
Current inflation, as measured by the Consumer Price Index (CPI), increased during the 12-month period, primarily due to soaring energy prices. In particular, oil prices advanced sharply throughout most of the period, before retreating slightly in the final two months. In response, the energy component of CPI increased at an annual rate of 20.1% as of June 30, 2011, while CPI’s gasoline segment advanced 35.6%.
Gold also rallied during the period, as the precious metal retained its role as the world’s “alternative currency.” An ounce of gold bullion increased from $1,244.00 at the beginning of the period to $1,505.50 at the end of June 2011. Ongoing sovereign debt concerns in Europe combined with a weaker U.S. dollar, mounting federal debt, and rising long-term inflation expectations helped fuel demand for gold.
Breakevens Suggested Inflation on the Rise
In addition to current inflation increasing, the long-term inflation outlook shifted higher. The 10-year TIPS breakeven rate, which represents the difference between the yields of 10-year TIPS and 10-year nominal Treasuries, is a measure of the
*All fund returns referenced in this commentary are for Investor Class shares. Returns would have been lower if a portion of the management fee had not been waived.
market’s anticipated inflation rate for the next 10 years. The 10-year breakeven rate increased from 1.84 percentage points at the end of June 2010 to 2.38 percentage points at the end of June 2011, suggesting the market believes inflationary pressures are building.
Portfolio Positioning and Strategy
As of June 30, 2011, approximately 39% of Strategic Inflation Opportunities was invested in TIPS, plus an additional small percentage of inflation-linked fixed income exposure in the form of inflation “swaps” (synthetic inflation-linked overlays for corporate and mortgage securities). Commodity-linked investments, domestic and foreign stocks, and foreign currency instruments generally comprised the remainder of the portfolio. Relative to the benchmark, these components all outperformed.
TIPS contributed favorably to the portfolio’s relative performance, as rising inflation helped TIPS outperform traditional Treasuries. Also within the fixed income allocation, the inflation swaps and the portfolio’s yield-curve flattening bias hindered performance slightly. The corporate and mortgage securities used as counterparts for the swap agreements lagged TIPS, and the yield curve did not flatten.
Within the commodities component, the team overweighted commodity-related stocks and ETFs (exchange-traded funds) versus commodity futures, which contributed positively to performance. Within the portfolio’s equity allocation, overweights to gold and silver stocks and security selection within the energy sector were positive influences on performance. Late in the period, the team added a small weighting to global REITs (real estate investment trusts) with inflation-sensitive characteristics, such as short-term leases or leases tied to CPI increases. These positions contributed positively to performance.
Within the portfolio’s foreign-currency allocation, underweight positions in the euro, U.S. dollar, and British pound contributed positively to performance, while an underweight to the Swiss franc detracted slightly. In addition, the investment team favored the commodity-related currencies of Canada, Australia, and the Scandinavian countries, which benefited the portfolio as commodity prices rallied.
Outlook
Rising commodity prices, a relatively weak U.S. dollar, and the extraordinary monetary and fiscal stimulus measures still working through the economy suggest the recent uptick in domestic inflation may continue. This potential scenario underscores the importance of securing “inflation insurance” through investments in TIPS, commodity-linked securities, and foreign currencies.
| JUNE 30, 2011 | |
| Types of Investments in Portfolio | % of net assets |
| U.S. Treasury Securities | 38.8% |
| Domestic Common Stocks | 11.6% |
| Commodity ETFs | 9.3% |
| Foreign Common Stocks | 8.7% |
| Commercial Paper | 3.1% |
| Corporate Bonds | 2.4% |
| Collateralized Mortgage Obligations | 1.6% |
| Commercial Mortgage-Backed Securities | 1.3% |
| Temporary Cash Investments — Segregated for Forward Foreign Currency Exchange Contracts and Futures Contracts | 22.2% |
| Other Assets and Liabilities | 1.0% |
| | |
| Top Ten Stock Holdings | % of net assets |
| Exxon Mobil Corp. | 1.2% |
| Chevron Corp. | 1.1% |
| Schlumberger Ltd. | 1.0% |
| Occidental Petroleum Corp. | 0.8% |
| ConocoPhillips | 0.7% |
| Halliburton Co. | 0.7% |
| Suncor Energy, Inc. | 0.4% |
| Apache Corp. | 0.4% |
| Freeport-McMoRan Copper & Gold, Inc. | 0.4% |
| Molycorp, Inc. | 0.4% |
| | |
| Geographic Composition of Stock Holdings | % of net assets |
| United States | 11.6% |
| Canada | 5.0% |
| Hong Kong | 0.8% |
| Japan | 0.6% |
| Other Countries | 2.3% |
Fund shareholders may incur two types of costs: (1) transaction costs, including sales charges (loads) on purchase payments and redemption/exchange fees; and (2) ongoing costs, including management fees; distribution and service (12b-1) fees; and other fund expenses. This example is intended to help you understand your ongoing costs (in dollars) of investing in your fund and to compare these costs with the ongoing cost of investing in other mutual funds.
The example is based on an investment of $1,000 made at the beginning of the period and held for the entire period from January 1, 2011 to June 30, 2011.
Actual Expenses
The table provides information about actual account values and actual expenses for each class. You may use the information, together with the amount you invested, to estimate the expenses that you paid over the period. First, identify the share class you own. Then simply divide your account value by $1,000 (for example, an $8,600 account value divided by $1,000 = 8.6), then multiply the result by the number under the heading “Expenses Paid During Period” to estimate the expenses you paid on your account during this period.
If you hold Investor Class shares of any American Century Investments fund, or Institutional Class shares of the American Century Diversified Bond Fund, in an American Century Investments account (i.e., not a financial intermediary or retirement plan account), American Century Investments may charge you a $12.50 semiannual account maintenance fee if the value of those shares is less than $10,000. We will redeem shares automatically in one of your accounts to pay the $12.50 fee. In determining your total eligible investment amount, we will include your investments in all personal accounts (including American Century Investments Brokerage accounts) registered under your Social Security number. Personal accounts include individual accounts, joint accounts, UGMA/UTMA accounts, personal trusts, Coverdell Education Savings Accounts and IRAs (including traditional, Roth, Rollover, SEP-, SARSEP- and SIMPLE-IRAs), and certain other retirement accounts. If you have only business, business retirement, employer-sponsored or American Century Investments Brokerage accounts, you are currently not subject to this fee. We will not charge the fee as long as you choose to manage your accounts exclusively online. If you are subject to the Account Maintenance Fee, your account value could be reduced by the fee amount.
Hypothetical Example for Comparison Purposes
The table also provides information about hypothetical account values and hypothetical expenses based on the actual expense ratio of each class of your fund and an assumed rate of return of 5% per year before expenses, which is not the actual return of a fund’s share class. The hypothetical account values and expenses may not be used to estimate the actual ending account balance or expenses you paid for the period. You may use this information to compare the ongoing costs of investing in your fund and other funds. To do so, compare this 5% hypothetical example with the 5% hypothetical examples that appear in the shareholder reports of the other funds.
Please note that the expenses shown in the table are meant to highlight your ongoing costs only and do not reflect any transactional costs, such as sales charges (loads) or redemption/exchange fees. Therefore, the table is useful in comparing ongoing costs only, and will not help you determine the relative total costs of owning different funds. In addition, if these transactional costs were included, your costs would have been higher.
| | Beginning Account Value 1/1/11 | Ending Account Value 6/30/11 | Expenses Paid During Period(1) 1/1/11 – 6/30/11 | Annualized Expense Ratio(1) |
| Actual | | | | |
| Investor Class (after waiver) | $1,000 | $1,029.80 | $4.78 | 0.95% |
| Investor Class (before waiver) | $1,000 | $1,029.80(2) | $5.49 | 1.09% |
| Institutional Class (after waiver) | $1,000 | $1,030.80 | $3.78 | 0.75% |
| Institutional Class (before waiver) | $1,000 | $1,030.80(2) | $4.48 | 0.89% |
| A Class (after waiver) | $1,000 | $1,028.90 | $6.04 | 1.20% |
| A Class (before waiver) | $1,000 | $1,028.90(2) | $6.74 | 1.34% |
| C Class (after waiver) | $1,000 | $1,025.00 | $9.79 | 1.95% |
| C Class (before waiver) | $1,000 | $1,025.00(2) | $10.49 | 2.09% |
| R Class (after waiver) | $1,000 | $1,026.90 | $7.29 | 1.45% |
| R Class (before waiver) | $1,000 | $1,026.90(2) | $7.99 | 1.59% |
| Hypothetical | | | | |
| Investor Class (after waiver) | $1,000 | $1,020.08 | $4.76 | 0.95% |
| Investor Class (before waiver) | $1,000 | $1,019.39 | $5.46 | 1.09% |
| Institutional Class (after waiver) | $1,000 | $1,021.08 | $3.76 | 0.75% |
| Institutional Class (before waiver) | $1,000 | $1,020.38 | $4.46 | 0.89% |
| A Class (after waiver) | $1,000 | $1,018.84 | $6.01 | 1.20% |
| A Class (before waiver) | $1,000 | $1,018.15 | $6.71 | 1.34% |
| C Class (after waiver) | $1,000 | $1,015.12 | $9.74 | 1.95% |
| C Class (before waiver) | $1,000 | $1,014.43 | $10.44 | 2.09% |
| R Class (after waiver) | $1,000 | $1,017.60 | $7.25 | 1.45% |
| R Class (before waiver) | $1,000 | $1,016.91 | $7.95 | 1.59% |
| (1) | Expenses are equal to the class’s annualized expense ratio listed in the table above, multiplied by the average account value over the period, multiplied by 181, the number of days in the most recent fiscal half-year, divided by 365, to reflect the on the one-half year period. |
| (2) | Ending account value assumes the return earned after waiver and would have been lower if a portion of the management fee had not been waived. |
| | | Principal Amount/Shares | | | Value | |
| U.S. Treasury Securities — 38.8% | |
U.S. Treasury Inflation Indexed Notes, 3.375%, 1/15/12(1) | | | $316,655 | | | | $323,656 | |
U.S. Treasury Inflation Indexed Notes, 2.00%, 4/15/12(1) | | | 1,335,550 | | | | 1,365,077 | |
U.S. Treasury Inflation Indexed Notes, 3.00%, 7/15/12(1) | | | 3,446,147 | | | | 3,596,916 | |
U.S. Treasury Inflation Indexed Notes, 0.625%, 4/15/13(1) | | | 3,091,094 | | | | 3,183,827 | |
U.S. Treasury Inflation Indexed Notes, 1.875%, 7/15/13(1) | | | 3,349,144 | | | | 3,559,775 | |
U.S. Treasury Inflation Indexed Notes, 2.00%, 1/15/14(1) | | | 3,602,882 | | | | 3,883,515 | |
U.S. Treasury Inflation Indexed Notes, 1.25%, 4/15/14(1) | | | 3,166,906 | | | | 3,360,632 | |
U.S. Treasury Inflation Indexed Notes, 2.00%, 7/15/14(1) | | | 3,221,532 | | | | 3,514,994 | |
U.S. Treasury Inflation Indexed Notes, 1.625%, 1/15/15(1) | | | 2,043,587 | | | | 2,216,814 | |
U.S. Treasury Inflation Indexed Notes, 0.50%, 4/15/15(1) | | | 2,843,599 | | | | 2,966,673 | |
U.S. Treasury Inflation Indexed Notes, 1.875%, 7/15/15(1) | | | 2,405,042 | | | | 2,652,499 | |
U.S. Treasury Inflation Indexed Notes, 2.00%, 1/15/16(1) | | | 3,400,613 | | | | 3,779,727 | |
U.S. Treasury Inflation Indexed Notes, 0.125%, 4/15/16(1) | | | 2,700,138 | | | | 2,760,891 | |
TOTAL U.S. TREASURY SECURITIES (Cost $36,981,269) | | | | 37,164,996 | |
| Common Stocks — 20.3% | |
| CHEMICALS — 0.7% | |
| Agrium, Inc. | | | 1,787 | | | | 156,827 | |
| CF Industries Holdings, Inc. | | | 201 | | | | 28,476 | |
| Monsanto Co. | | | 1,373 | | | | 99,597 | |
| Mosaic Co. (The) | | | 2,530 | | | | 171,357 | |
| Potash Corp. of Saskatchewan, Inc. | | | 4,323 | | | | 246,368 | |
| | | | | | | | 702,625 | |
| ENERGY EQUIPMENT & SERVICES — 2.7% | |
| Baker Hughes, Inc. | | | 3,340 | | | | 242,350 | |
| Diamond Offshore Drilling, Inc. | | | 644 | | | | 45,344 | |
| Ensco plc ADR | | | 3,332 | | | | 177,596 | |
GasFrac Energy Services, Inc.(2) | | | 26,899 | | | | 245,437 | |
| Halliburton Co. | | | 12,948 | | | | 660,348 | |
Nabors Industries Ltd.(2) | | | 2,039 | | | | 50,241 | |
| National Oilwell Varco, Inc. | | | 977 | | | | 76,411 | |
| Patterson-UTI Energy, Inc. | | | 1,879 | | | | 59,395 | |
| Schlumberger Ltd. | | | 11,023 | | | | 952,387 | |
| Tidewater, Inc. | | | 799 | | | | 42,994 | |
Weatherford International Ltd.(2) | | | 3,272 | | | | 61,350 | |
| | | | | | | | 2,613,853 | |
| FOOD PRODUCTS — 0.1% | |
BioExx Specialty Proteins Ltd.(2) | | | 46,568 | | | | 48,285 | |
Origin Agritech Ltd.(2) | | | 6,132 | | | | 24,405 | |
| | | | | | | | 72,690 | |
| HOTELS, RESTAURANTS & LEISURE — 0.2% | |
| Marriott International, Inc., Class A | | | 2,712 | | | | 96,249 | |
| Wyndham Worldwide Corp. | | | 2,729 | | | | 91,831 | |
| | | | | | | | 188,080 | |
| METALS & MINING — 3.2% | |
Allied Nevada Gold Corp.(2) | | | 2,598 | | | | 91,615 | |
| Aquarius Platinum Ltd. | | | 8,144 | | | | 41,569 | |
| Barrick Gold Corp. | | | 3,664 | | | | 165,943 | |
Bear Creek Mining Corp.(2) | | | 2,262 | | | | 9,030 | |
| BHP Billiton Ltd. ADR | | | 680 | | | | 64,348 | |
Canaco Resources, Inc.(2) | | | 23,844 | | | | 82,327 | |
Detour Gold Corp.(2) | | | 1,685 | | | | 48,832 | |
Dundee Precious Metals, Inc.(2) | | | 5,784 | | | | 46,838 | |
| Fortescue Metals Group Ltd. | | | 23,318 | | | | 159,941 | |
| Freeport-McMoRan Copper & Gold, Inc. | | | 7,018 | | | | 371,252 | |
| Fresnillo plc | | | 3,622 | | | | 81,638 | |
| Goldcorp, Inc. New York Shares | | | 4,433 | | | | 213,981 | |
Ivanhoe Mines Ltd.(2) | | | 3,260 | | | | 82,375 | |
Midas Gold Corp.(2) | | | 32,750 | | | | 110,361 | |
Molycorp, Inc.(2) | | | 5,921 | | | | 361,536 | |
| Newmont Mining Corp. | | | 2,658 | | | | 143,452 | |
| | | | Principal Amount/Shares | | | | Value | |
Osisko Mining Corp.(2) | | | 21,938 | | | | $340,972 | |
| Pan American Silver Corp. | | | 631 | | | | 19,492 | |
Rare Element Resources Ltd.(2) | | | 7,699 | | | | 85,382 | |
Sabina Gold & Silver Corp.(2) | | | 5,186 | | | | 31,725 | |
| Silver Wheaton Corp. | | | 2,989 | | | | 98,637 | |
| Silvercorp Metals, Inc. | | | 2,755 | | | | 25,842 | |
Tahoe Resources, Inc.(2) | | | 4,128 | | | | 77,043 | |
| Teck Resources Ltd., Class B | | | 975 | | | | 49,471 | |
| Vale SA ADR | | | 2,621 | | | | 83,741 | |
Wildcat Silver Corp.(2) | | | 123,011 | | | | 206,623 | |
| | | | | | | | 3,093,966 | |
| OIL, GAS & CONSUMABLE FUELS — 8.5% | |
Alpha Natural Resources, Inc.(2) | | | 942 | | | | 42,804 | |
| Anadarko Petroleum Corp. | | | 1,936 | | | | 148,607 | |
| Apache Corp. | | | 3,042 | | | | 375,352 | |
| Bonterra Energy Corp. | | | 1,373 | | | | 80,833 | |
| Cabot Oil & Gas Corp. | | | 513 | | | | 34,017 | |
| Cameco Corp. | | | 917 | | | | 24,163 | |
| Canadian Natural Resources Ltd. | | | 7,202 | | | | 301,476 | |
| Canadian Oil Sands Ltd. | | | 7,080 | | | | 204,299 | |
Celtic Exploration Ltd.(2) | | | 7,252 | | | | 160,387 | |
| Chesapeake Energy Corp. | | | 3,950 | | | | 117,275 | |
| Chevron Corp. | | | 9,893 | | | | 1,017,396 | |
| CNOOC Ltd. ADR | | | 419 | | | | 98,855 | |
| ConocoPhillips | | | 9,346 | | | | 702,726 | |
| Devon Energy Corp. | | | 2,271 | | | | 178,978 | |
| EnCana Corp. | | | 7,059 | | | | 217,347 | |
| EOG Resources, Inc. | | | 1,828 | | | | 191,117 | |
| Exxon Mobil Corp. | | | 13,564 | | | | 1,103,838 | |
Forest Oil Corp.(2) | | | 488 | | | | 13,034 | |
| Hess Corp. | | | 3,289 | | | | 245,886 | |
| Marathon Oil Corp. | | | 4,655 | | | | 245,225 | |
Newfield Exploration Co.(2) | | | 425 | | | | 28,908 | |
| Noble Energy, Inc. | | | 579 | | | | 51,896 | |
| Occidental Petroleum Corp. | | | 7,751 | | | | 806,414 | |
OGX Petroleo e Gas Participacoes SA(2) | | | 3,269 | | | | 30,477 | |
| Pacific Rubiales Energy Corp. | | | 2,988 | | | | 80,087 | |
| Peabody Energy Corp. | | | 768 | | | | 45,243 | |
Petrobank Energy & Resources Ltd.(2) | | | 3,840 | | | | 56,379 | |
Petrodorado Energy Ltd.(2) | | | 147,687 | | | | 46,705 | |
| Petroleo Brasileiro SA-Petrobras ADR | | | 1,298 | | | | 43,950 | |
| Peyto Exploration & Development Corp. | | | 4,892 | | | | 109,055 | |
Pinecrest Energy, Inc.(2) | | | 36,838 | | | | 92,816 | |
| Pioneer Natural Resources Co. | | | 231 | | | | 20,691 | |
| Range Resources Corp. | | | 1,074 | | | | 59,607 | |
| Southern Union Co. | | | 879 | | | | 35,292 | |
| SouthGobi Resources Ltd. | | | 3,217 | | | | 35,557 | |
Southwestern Energy Co.(2) | | | 1,166 | | | | 49,998 | |
| Spectra Energy Corp. | | | 1,358 | | | | 37,223 | |
| Suncor Energy, Inc. | | | 10,120 | | | | 395,692 | |
| Sunoco, Inc. | | | 1,230 | | | | 51,303 | |
| Talisman Energy, Inc., New York shares | | | 2,373 | | | | 48,623 | |
| Talisman Energy, Inc. | | | 1,430 | | | | 29,372 | |
| TransCanada Corp. | | | 862 | | | | 37,851 | |
| Valero Energy Corp. | | | 2,261 | | | | 57,814 | |
| Williams Cos., Inc. (The) | | | 2,794 | | | | 84,519 | |
Zodiac Exploration, Inc.(2) | | | 399,689 | | | | 323,249 | |
| | | | | | | | 8,162,336 | |
| PAPER & FOREST PRODUCTS — 0.1% | |
| Domtar Corp. | | | 414 | | | | 39,214 | |
| REAL ESTATE INVESTMENT TRUSTS (REITs) — 3.2% | |
| American Campus Communities, Inc. | | | 2,987 | | | | 106,098 | |
| American Capital Agency Corp. | | | 4,266 | | | | 124,183 | |
| Boston Properties, Inc. | | | 1,498 | | | | 159,028 | |
| British Land Co. plc | | | 9,926 | | | | 96,958 | |
| Camden Property Trust | | | 1,676 | | | | 106,627 | |
| CapitaCommercial Trust | | | 96,000 | | | | 113,613 | |
| CDL Hospitality Trusts | | | 67,000 | | | | 112,478 | |
| Digital Realty Trust, Inc. | | | 1,840 | | | | 113,675 | |
| Equity LifeStyle Properties, Inc. | | | 1,719 | | | | 107,334 | |
| Essex Property Trust, Inc. | | | 822 | | | | 111,208 | |
| Extra Space Storage, Inc. | | | 5,014 | | | | 106,949 | |
| Gecina SA | | | 522 | | | | 72,925 | |
| General Growth Properties, Inc. | | | 7,801 | | | | 130,199 | |
| Goodman Group | | | 93,443 | | | | 70,717 | |
| GPT Group | | | 21,517 | | | | 73,100 | |
| Klepierre | | | 2,003 | | | | 82,657 | |
| Land Securities Group plc | | | 7,911 | | | | 108,170 | |
| Link Real Estate Investment Trust (The) | | | 26,500 | | | | 90,475 | |
| Nippon Building Fund, Inc. | | | 12 | | | | 117,122 | |
| ProLogis, Inc. | | | 4,574 | | | | 163,932 | |
| Simon Property Group, Inc. | | | 2,087 | | | | 242,572 | |
| | | | Principal Amount/Shares | | | | Value | |
| SL Green Realty Corp. | | | 1,460 | | | | $120,990 | |
| Taubman Centers, Inc. | | | 1,888 | | | | 111,770 | |
| Unibail-Rodamco SE | | | 664 | | | | 153,447 | |
| Ventas, Inc. | | | 2,597 | | | | 136,888 | |
| Westfield Group | | | 14,866 | | | | 138,533 | |
| Weyerhaeuser Co. | | | 891 | | | | 19,477 | |
| | | | | | | | 3,091,125 | |
| REAL ESTATE MANAGEMENT & DEVELOPMENT — 1.5% | |
| BR Malls Participacoes SA | | | 6,400 | | | | 72,052 | |
| Brookfield Office Properties, Inc. | | | 3,472 | | | | 67,067 | |
| China Overseas Land & Investment Ltd. | | | 48,000 | | | | 103,856 | |
| Country Garden Holdings Co. | | | 141,000 | | | | 62,419 | |
Global Logistic Properties Ltd.(2) | | | 31,000 | | | | 52,072 | |
GSW Immobilien AG(2) | | | 1,402 | | | | 48,082 | |
| Hongkong Land Holdings Ltd. | | | 7,000 | | | | 49,896 | |
| Hysan Development Co. Ltd. | | | 17,000 | | | | 84,161 | |
| Mitsubishi Estate Co. Ltd. | | | 12,000 | | | | 210,658 | |
| Mitsui Fudosan Co. Ltd. | | | 4,000 | | | | 68,962 | |
| S P Setia Bhd Group | | | 18,000 | | | | 24,934 | |
| Sumitomo Realty & Development Co. Ltd. | | | 8,000 | | | | 178,857 | |
| Sun Hung Kai Properties Ltd. | | | 10,000 | | | | 145,940 | |
| Swire Pacific Ltd. A Shares | | | 9,500 | | | | 140,082 | |
Swiss Prime Site AG(2) | | | 943 | | | | 80,918 | |
UEM Land Holdings Bhd(2) | | | 26,900 | | | | 25,072 | |
| | | | | | | | 1,415,028 | |
| TRADING COMPANIES & DISTRIBUTORS — 0.1% | |
| Noble Group Ltd. | | | 65,290 | | | | 105,115 | |
TOTAL COMMON STOCKS (Cost $18,722,165) | | | | 19,484,032 | |
| Commodity ETFs — 9.3% | |
iShares S&P GSCI Commodity-Indexed Trust(2) | | | 114,935 | | | | 3,920,433 | |
PowerShares DB Commodity Agriculture Fund(2) | | | 33,302 | | | | 1,057,005 | |
PowerShares DB Commodity Index Tracking Fund(2) | | | 135,279 | | | | 3,917,680 | |
TOTAL COMMODITY ETFs (Cost $8,707,950) | | | | 8,895,118 | |
Commercial Paper(3) — 3.1% | |
Crown Point Capital Co. LLC, 0.27%, 7/11/11(1)(4) | | | $1,000,000 | | | | 999,950 | |
Govco LLC, 0.20%, 8/11/11(1)(4) | | | 1,000,000 | | | | 999,770 | |
Lexington Parker Capital, 0.27%, 7/11/11(4) | | | 1,000,000 | | | | 999,940 | |
TOTAL COMMERCIAL PAPER (Cost $2,999,622) | | | | 2,999,660 | |
| Corporate Bonds — 2.4% | |
BEVERAGES(5) | |
Anheuser-Busch InBev Worldwide, Inc., 5.375%, 1/15/20(1) | | | 30,000 | | | | 33,085 | |
| CAPITAL MARKETS — 0.1% | |
Credit Suisse (New York), 5.50%, 5/1/14(1) | | | 20,000 | | | | 21,975 | |
Goldman Sachs Group, Inc. (The), 3.625%, 2/7/16(1) | | | 45,000 | | | | 45,515 | |
Morgan Stanley, 5.625%, 9/23/19(1) | | | 20,000 | | | | 20,545 | |
UBS AG (Stamford Branch), 2.25%, 8/12/13(1) | | | 40,000 | | | | 40,701 | |
| | | | | | | | 128,736 | |
| CHEMICALS — 0.1% | |
| CF Industries, Inc., 6.875%, 5/1/18 | | | 25,000 | | | | 28,406 | |
Dow Chemical Co. (The), 5.90%, 2/15/15(1) | | | 50,000 | | | | 56,192 | |
| | | | | | | | 84,598 | |
| COMMERCIAL BANKS — 0.1% | |
Bank of Nova Scotia, 2.375%, 12/17/13(1) | | | 40,000 | | | | 41,159 | |
| CONSUMER FINANCE — 0.2% | |
Daimler Finance N.A. LLC, 6.50%, 11/15/13(1) | | | 80,000 | | | | 89,028 | |
Ford Motor Credit Co. LLC, 5.00%, 5/15/18(1) | | | 100,000 | | | | 99,857 | |
| | | | | | | | 188,885 | |
| DIVERSIFIED FINANCIAL SERVICES — 0.2% | |
Citigroup, Inc., 6.00%, 12/13/13(1) | | | 80,000 | | | | 87,012 | |
General Electric Capital Corp., 2.10%, 1/7/14(1) | | | 50,000 | | | | 50,727 | |
HSBC Finance Corp., 6.375%, 11/27/12(1) | | | 40,000 | | | | 42,801 | |
| | | | | | | | 180,540 | |
| DIVERSIFIED TELECOMMUNICATION SERVICES — 0.2% | |
AT&T, Inc., 4.85%, 2/15/14(1) | | | 100,000 | | | | 108,654 | |
CenturyLink, Inc., 7.875%, 8/15/12(1) | | | 30,000 | | | | 31,894 | |
Qwest Corp., 8.875%, 3/15/12(1) | | | 40,000 | | | | 42,200 | |
| | | | Principal Amount/Shares | | | | Value | |
Windstream Corp., 7.875%, 11/1/17(1) | | | $30,000 | | | | $31,988 | |
| | | | | | | | 214,736 | |
ELECTRIC UTILITIES(5) | |
Commonwealth Edison Co., 1.625%, 1/15/14(1) | | | 40,000 | | | | 40,296 | |
FOOD PRODUCTS(5) | |
Tyson Foods, Inc., 6.85%, 4/1/16(1) | | | 20,000 | | | | 22,200 | |
| HEALTH CARE PROVIDERS & SERVICES — 0.1% | |
DaVita, Inc., 6.375%, 11/1/18(1) | | | 25,000 | | | | 25,375 | |
Express Scripts, Inc., 6.25%, 6/15/14(1) | | | 80,000 | | | | 90,124 | |
| | | | | | | | 115,499 | |
HOTELS, RESTAURANTS & LEISURE(5) | |
Wyndham Worldwide Corp., 6.00%, 12/1/16(1) | | | 20,000 | | | | 21,253 | |
| MEDIA — 0.3% | |
Comcast Corp., 5.30%, 1/15/14(1) | | | 80,000 | | | | 87,764 | |
DISH DBS Corp., 7.00%, 10/1/13(1) | | | 50,000 | | | | 53,938 | |
NBCUniversal Media LLC, 2.10%, 4/1/14(1)(4) | | | 80,000 | | | | 81,091 | |
Virgin Media Finance plc, 9.125%, 8/15/16(1) | | | 30,000 | | | | 31,650 | |
| | | | | | | | 254,443 | |
| METALS & MINING — 0.2% | |
ArcelorMittal, 5.375%, 6/1/13(1) | | | 50,000 | | | | 53,250 | |
Barrick Gold Corp., 2.90%, 5/30/16(4) | | | 30,000 | | | | 29,996 | |
Freeport-McMoRan Copper & Gold, Inc., 8.375%, 4/1/17(1) | | | 80,000 | | | | 87,500 | |
| | | | | | | | 170,746 | |
| MULTI-UTILITIES — 0.1% | |
| CMS Energy Corp., 4.25%, 9/30/15 | | | 30,000 | | | | 30,993 | |
CMS Energy Corp., 8.75%, 6/15/19(1) | | | 25,000 | | | | 30,625 | |
DTE Energy Co., 0.96%, 9/6/11(1) | | | 40,000 | | | | 40,130 | |
| | | | | | | | 101,748 | |
| OIL, GAS & CONSUMABLE FUELS — 0.3% | |
Anadarko Petroleum Corp., 5.95%, 9/15/16(1) | | | 20,000 | | | | 22,526 | |
Canadian Natural Resources Ltd., 5.15%, 2/1/13(1) | | | 80,000 | | | | 85,182 | |
Newfield Exploration Co., 6.875%, 2/1/20(1) | | | 50,000 | | | | 53,375 | |
Peabody Energy Corp., 6.50%, 9/15/20(1) | | | 30,000 | | | | 32,400 | |
Plains All American Pipeline LP/PAA Finance Corp., 4.25%, 9/1/12(1) | | | 40,000 | | | | 41,365 | |
Valero Energy Corp., 4.50%, 2/1/15(1) | | | 20,000 | | | | 21,360 | |
| | | | | | | | 256,208 | |
| REAL ESTATE INVESTMENT TRUSTS (REITs) — 0.2% | |
Developers Diversified Realty Corp., 5.375%, 10/15/12(1) | | | 40,000 | | | | 41,183 | |
ERP Operating LP, 5.20%, 4/1/13(1) | | | 25,000 | | | | 26,634 | |
| Reckson Operating Partnership LP, 6.00%, 3/31/16 | | | 50,000 | | | | 53,600 | |
Ventas Realty LP/Ventas Capital Corp., 6.75%, 4/1/17(1) | | | 30,000 | | | | 31,621 | |
| | | | | | | | 153,038 | |
| ROAD & RAIL — 0.1% | |
Norfolk Southern Corp., 5.26%, 9/17/14(1) | | | 100,000 | | | | 110,935 | |
| SOFTWARE — 0.1% | |
Oracle Corp., 3.75%, 7/8/14(1) | | | 100,000 | | | | 107,250 | |
SPECIALTY RETAIL(5) | |
Gap, Inc. (The), 5.95%, 4/12/21(1) | | | 10,000 | | | | 9,618 | |
| WIRELESS TELECOMMUNICATION SERVICES — 0.1% | |
Rogers Communications, Inc., 6.25%, 6/15/13(1) | | | 89,000 | | | | 97,636 | |
TOTAL CORPORATE BONDS (Cost $2,308,319) | | | | 2,332,609 | |
Collateralized Mortgage Obligations(6) — 1.6% | |
| PRIVATE SPONSOR COLLATERALIZED MORTGAGE OBLIGATIONS — 1.4% | |
| ABN Amro Mortgage Corp., Series 2003-6, Class 1A4, 5.50%, 5/25/33 | | | 30,373 | | | | 31,691 | |
Banc of America Mortgage Securities, Inc., Series 2004-7, Class 7A1, 5.00%, 8/25/19(1) | | | 34,811 | | | | 35,095 | |
| Citicorp Mortgage Securities, Inc., Series 2006-4, Class 1A7 SEQ, 6.00%, 8/25/36 | | | 17,484 | | | | 17,268 | |
| | | | Principal Amount/Shares | | | | Value | |
Citigroup Mortgage Loan Trust, Inc., Series 2005-4, Class A, VRN, 5.34%, 7/1/11(1) | | | $42,988 | | | | $41,605 | |
Countrywide Home Loan Mortgage Pass-Through Trust, Series 2003-35, Class 1A3 SEQ, 5.00%, 9/25/18(1) | | | 26,994 | | | | 27,888 | |
| Countrywide Home Loan Mortgage Pass-Through Trust, Series 2004-5, Class 2A4, 5.50%, 5/25/34 | | | 24,632 | | | | 25,974 | |
J.P. Morgan Mortgage Trust, Series 2005 A6, Class 7A1, VRN, 3.08%, 7/1/11(1) | | | 39,799 | | | | 32,424 | |
MASTR Asset Securitization Trust, Series 2003-10, Class 3A1, 5.50%, 11/25/33(1) | | | 87,609 | | | | 91,495 | |
| PHHMC Mortgage Pass Through Certificates, Series 2007-6, Class A1, VRN, 6.14%, 7/1/11 | | | 62,134 | | | | 64,957 | |
Residential Funding Mortgage Securities I, Series 2006 S10, Class 2A1 SEQ, 5.50%, 10/25/21(1) | | | 35,635 | | | | 34,156 | |
Wamu Mortgage Pass-Through Certificates, Series 2003 S11, Class 3A5, 5.95%, 11/25/33(1) | | | 40,300 | | | | 42,606 | |
Wells Fargo Mortgage-Backed Securities Trust, Series 2004-1, Class A10, 5.50%, 2/25/34(1) | | | 35,619 | | | | 37,571 | |
Wells Fargo Mortgage-Backed Securities Trust, Series 2005 AR14, Class A1, VRN, 5.36%, 7/1/11(1) | | | 58,837 | | | | 58,401 | |
| Wells Fargo Mortgage-Backed Securities Trust, Series 2005 AR2, Class 2A2, VRN, 2.74%, 7/1/11 | | | 39,351 | | | | 34,886 | |
| Wells Fargo Mortgage-Backed Securities Trust, Series 2005-2, Class 1A1, SEQ, 5.50%, 4/25/35 | | | 65,864 | | | | 66,314 | |
| Wells Fargo Mortgage-Backed Securities Trust, Series 2005-5, Class 1A1, 5.00%, 5/25/20 | | | 67,369 | | | | 67,554 | |
| Wells Fargo Mortgage-Backed Securities Trust, Series 2005-6, Class A1, SEQ, 5.25%, 8/25/35 | | | 96,195 | | | | 96,725 | |
| Wells Fargo Mortgage-Backed Securities Trust, Series 2005-17, Class 1A1, 5.50%, 1/25/36 | | | 41,730 | | | | 39,208 | |
Wells Fargo Mortgage-Backed Securities Trust, Series 2006 AR1, Class 2A2 SEQ, VRN, 5.40%, 7/1/11(1) | | | 7,850 | | | | 7,881 | |
Wells Fargo Mortgage-Backed Securities Trust, Series 2006 AR19, Class A1, VRN, 5.45%, 7/1/11(1) | | | 43,706 | | | | 40,264 | |
| Wells Fargo Mortgage-Backed Securities Trust, Series 2006-3, Class A9 SEQ, 5.50%, 3/25/36 | | | 37,159 | | | | 37,272 | |
Wells Fargo Mortgage-Backed Securities Trust, Series 2006-9, Class 1A15 SEQ, 6.00%, 8/25/36(1) | | | 100,523 | | | | 100,256 | |
Wells Fargo Mortgage-Backed Securities Trust, Series 2006-9, Class 1A9, SEQ, 6.00%, 8/25/36(1) | | | 49,200 | | | | 47,239 | |
| Wells Fargo Mortgage-Backed Securities Trust, Series 2006-10, Class A4 SEQ, 6.00%, 8/25/36 | | | 100,000 | | | | 97,768 | |
| Wells Fargo Mortgage-Backed Securities Trust, Series 2007 AR10, Class 1A1, VRN, 6.08%, 7/1/11 | | | 17,207 | | | | 17,007 | |
| Wells Fargo Mortgage-Backed Securities Trust, Series 2007-3, Class 3A1, 5.50%, 4/25/22 | | | 63,394 | | | | 66,038 | |
Wells Fargo Mortgage-Backed Securities Trust, Series 2007-13, Class A1, 6.00%, 9/25/37(1) | | | 86,471 | | | | 84,221 | |
| | | | | | | | 1,343,764 | |
| U.S. GOVERNMENT AGENCY COLLATERALIZED MORTGAGE OBLIGATIONS — 0.2% | |
| FHLMC, Series 2824, Class LB, 4.50%, 7/15/24 | | | 148,000 | | | | 159,635 | |
| NCUA Guaranteed Notes, Series 2010 C1, Class A2 SEQ, 2.90%, 10/29/20 | | | 25,000 | | | | 24,973 | |
| | | | | | | | 184,608 | |
TOTAL COLLATERALIZED MORTGAGE OBLIGATIONS (Cost $1,530,564) | | | | 1,528,372 | |
| | | | Principal Amount/Shares | | | | Value | |
Commercial Mortgage-Backed Securities(6) — 1.3% | |
Banc of America Commercial Mortgage, Inc., Series 2004-1, Class A4 SEQ, 4.76%, 11/10/39(1) | | | $50,000 | | | | $53,033 | |
Banc of America Commercial Mortgage, Inc., Series 2004-6, Class A3 SEQ, 4.51%, 12/10/42(1) | | | 74,000 | | | | 74,794 | |
Greenwich Capital Commercial Funding Corp., Series 2004 GG1, Class B, VRN, 5.43%, 7/1/11(1) | | | 25,000 | | | | 26,315 | |
Greenwich Capital Commercial Funding Corp., Series 2005 GG3, Class A3 SEQ, 4.57%, 8/10/42(1) | | | 100,000 | | | | 101,240 | |
Greenwich Capital Commercial Funding Corp., Series 2005 GG3, Class A4, VRN, 4.80%, 7/1/11(1) | | | 100,000 | | | | 106,880 | |
GS Mortgage Securities Corp. II, Series 2004 GG2, Class A6 SEQ, VRN, 5.40%, 7/1/11(1) | | | 50,000 | | | | 54,106 | |
GS Mortgage Securities Corp. II, Series 2005 GG4, Class A4A SEQ, 4.75%, 7/10/39(1) | | | 125,000 | | | | 133,299 | |
LB-UBS Commercial Mortgage Trust, Series 2004 C1, Class A4 SEQ, 4.57%, 1/15/31(1) | | | 160,000 | | | | 168,798 | |
LB-UBS Commercial Mortgage Trust, Series 2004 C2, Class A4 SEQ, 4.37%, 3/15/36(1) | | | 105,000 | | | | 111,327 | |
LB-UBS Commercial Mortgage Trust, Series 2004 C4, Class A4, VRN, 5.32%, 7/11/11(1) | | | 50,000 | | | | 53,872 | |
LB-UBS Commercial Mortgage Trust, Series 2004 C8, Class AJ, VRN, 4.86%, 7/11/11(1) | | | 25,000 | | | | 25,510 | |
LB-UBS Commercial Mortgage Trust, Series 2005 C3, Class AJ SEQ, 4.84%, 7/15/40(1) | | | 44,000 | | | | 42,395 | |
LB-UBS Commercial Mortgage Trust, Series 2005 C5, Class AM, VRN, 5.02%, 7/11/11(1) | | | 25,000 | | | | 25,834 | |
LB-UBS Commercial Mortgage Trust, Series 2005 C7, Class AM SEQ, VRN, 5.26%, 7/11/11(1) | | | 75,000 | | | | 78,081 | |
Morgan Stanley Capital I, Series 2001 T5, Class A4 SEQ, 6.39%, 10/15/35(1) | | | 28,380 | | | | 28,717 | |
Wachovia Bank Commercial Mortgage Trust, Series 2003 C3, Class A2 SEQ, 4.87%, 2/15/35(1) | | | 50,000 | | | | 52,036 | |
Wachovia Bank Commercial Mortgage Trust, Series 2004 C15, Class A3 SEQ, 4.50%, 10/15/41(1) | | | 50,000 | | | | 51,343 | |
Wachovia Bank Commercial Mortgage Trust, Series 2005 C20, Class A6A, VRN, 5.11%, 7/1/11(1) | | | 50,000 | | | | 51,409 | |
TOTAL COMMERCIAL MORTGAGE-BACKED SECURITIES (Cost $1,239,949) | | | | 1,238,989 | |
| Temporary Cash Investments — Segregated For Forward Foreign Currency Exchange Contracts and Futures Contracts — 22.2% | |
JPMorgan U.S. Treasury Plus Money Market Fund Agency Shares(1) | | | 15,748,572 | | | | 15,748,572 | |
U.S. Treasury Bills, 0.07%, 7/14/11(1)(3) | | | $5,500,000 | | | | 5,499,995 | |
TOTAL TEMPORARY CASH INVESTMENTS — SEGREGATED FOR FORWARD FOREIGN CURRENCY EXCHANGE CONTRACTS AND FUTURES CONTRACTS (Cost $21,248,431) | | | | 21,248,567 | |
TOTAL INVESTMENT SECURITIES — 99.0% (Cost $93,738,269) | | | | 94,892,343 | |
| OTHER ASSETS AND LIABILITIES — 1.0% | | | | 938,566 | |
| TOTAL NET ASSETS — 100.0% | | | | $95,830,909 | |
| Futures Contracts |
| Contracts Purchased | Expiration Date | Underlying Face Amount at Value | Unrealized Gain (Loss) |
| 10 | U.S. Long Bond | September 2011 | $1,230,313 | $(6,116) |
| Contracts Sold | Expiration Date | Underlying Face Amount at Value | Unrealized Gain (Loss) |
| 31 | U.S. Treasury 2-Year Notes | September 2011 | $6,799,656 | $(17,507) |
| Forward Foreign Currency Exchange Contracts | |
| Contracts to Sell | Counterparty | Settlement Date | | Value | | | Unrealized Gain (Loss) | |
| | 433,933 | | CHF for SEK | Barclays Bank plc | 7/29/11 | | | $516,176 | | | | $(19,364 | ) |
| | 476,626 | | EUR for SEK | UBS AG | 7/29/11 | | | 690,722 | | | | (5,865 | ) |
| | 33,500 | | BRL for USD | Barclays Bank plc | 7/29/11 | | | 21,341 | | | | (227 | ) |
| | 179,300 | | CAD for USD | HSBC Bank plc | 7/29/11 | | | 185,801 | | | | 2,860 | |
| | 15,100 | | CHF for USD | HSBC Bank plc | 7/29/11 | | | 17,962 | | | | (475 | ) |
| | 672,900 | | CHF for USD | UBS AG | 7/29/11 | | | 800,433 | | | | (12,245 | ) |
| | 819,000 | | CHF for USD | HSBC Bank plc | 7/29/11 | | | 974,223 | | | | (40,224 | ) |
| | 1,003,000 | | CZK for USD | Deutsche Bank AG | 7/29/11 | | | 59,798 | | | | 970 | |
| | 291,300 | | EUR for USD | Westpac Banking Corp. | 7/29/11 | | | 422,149 | | | | 2,893 | |
| | 368,600 | | EUR for USD | UBS AG | 7/29/11 | | | 534,171 | | | | (4,493 | ) |
| | 212,100 | | GBP for USD | HSBC Bank plc | 7/29/11 | | | 340,308 | | | | 13,799 | |
| | 6,821,000 | | HUF for USD | Deutsche Bank AG | 7/29/11 | | | 37,112 | | | | (128 | ) |
| | 4,524,000 | | JPY for USD | UBS AG | 7/29/11 | | | 56,202 | | | | (728 | ) |
| | 13,210,921 | | JPY for USD | Westpac Banking Corp. | 7/29/11 | | | 164,120 | | | | (2,436 | ) |
| | 23,527,000 | | JPY for USD | HSBC Bank plc | 7/29/11 | | | 292,277 | | | | (1,921 | ) |
| | 194,000 | | PEN for USD | Barclays Bank plc | 7/29/11 | | | 70,405 | | | | (2,227 | ) |
| | 1,807,000 | | RUB for USD | UBS AG | 7/29/11 | | | 64,630 | | | | 824 | |
| | 147,000 | | TWD for USD | HSBC Bank plc | 7/29/11 | | | 5,132 | | | | 59 | |
| | 176,000 | | ZAR for USD | Deutsche Bank AG | 7/29/11 | | | 25,937 | | | | (144 | ) |
| | | | | | | | | $5,278,899 | | | | $(69,072 | ) |
(Value on Settlement Date $5,209,827)
| Contracts to Buy | Counterparty | Settlement Date | | Value | | | Unrealized Gain (Loss) | |
| | 3,110,000 | | SEK for CHF | Barclays Bank plc | 7/29/11 | | | $490,983 | | | | $(5,829 | ) |
| | 4,364,500 | | SEK for EUR | UBS AG | 7/29/11 | | | 689,033 | | | | 4,176 | |
| | 21,900 | | AUD for USD | Barclays Bank plc | 7/29/11 | | | 23,415 | | | | (168 | ) |
| | 64,300 | | AUD for USD | Westpac Banking Corp. | 7/29/11 | | | 68,749 | | | | (929 | ) |
| | 71,100 | | AUD for USD | Barclays Bank plc | 7/29/11 | | | 76,019 | | | | 1,531 | |
| | 75,500 | | AUD for USD | Barclays Bank plc | 7/29/11 | | | 80,724 | | | | 322 | |
| | 190,900 | | AUD for USD | HSBC Bank plc | 7/29/11 | | | 204,108 | | | | (3,671 | ) |
| | 605,300 | | AUD for USD | UBS AG | 7/29/11 | | | 647,181 | | | | 3,565 | |
| | 11,100 | | BRL for USD | Barclays Bank plc | 7/29/11 | | | 7,071 | | | | 103 | |
| | 13,900 | | BRL for USD | Barclays Bank plc | 7/29/11 | | | 8,855 | | | | 171 | |
| | 18,300 | | BRL for USD | Barclays Bank plc | 7/29/11 | | | 11,658 | | | | 227 | |
| | 20,400 | | BRL for USD | Barclays Bank plc | 7/29/11 | | | 12,996 | | | | 539 | |
| | 22,900 | | BRL for USD | Barclays Bank plc | 7/29/11 | | | 14,588 | | | | 366 | |
| | 23,800 | | BRL for USD | Barclays Bank plc | 7/29/11 | | | 15,162 | | | | 598 | |
| | 26,000 | | BRL for USD | Barclays Bank plc | 7/29/11 | | | 16,563 | | | | 203 | |
| | 31,700 | | BRL for USD | Barclays Bank plc | 7/29/11 | | | 20,194 | | | | 880 | |
| Contracts to Buy | Counterparty | Settlement Date | | Value | | | Unrealized Gain (Loss) | |
| | 634,900 | | BRL for USD | Barclays Bank plc | 7/29/11 | | | $404,458 | | | | $4,823 | |
| | 9,400 | | CAD for USD | HSBC Bank plc | 7/29/11 | | | 9,741 | | | | 95 | |
| | 17,500 | | CAD for USD | Barclays Bank plc | 7/29/11 | | | 18,135 | | | | 80 | |
| | 28,600 | | CAD for USD | Barclays Bank plc | 7/29/11 | | | 29,637 | | | | (409 | ) |
| | 42,200 | | CAD for USD | Barclays Bank plc | 7/29/11 | | | 43,730 | | | | 339 | |
| | 54,800 | | CAD for USD | Barclays Bank plc | 7/29/11 | | | 56,787 | | | | (571 | ) |
| | 61,200 | | CAD for USD | Barclays Bank plc | 7/29/11 | | | 63,419 | | | | (682 | ) |
| | 86,300 | | CAD for USD | Barclays Bank plc | 7/29/11 | | | 89,429 | | | | 1,424 | |
| | 86,500 | | CAD for USD | UBS AG | 7/29/11 | | | 89,636 | | | | 791 | |
| | 99,800 | | CAD for USD | Barclays Bank plc | 7/29/11 | | | 103,419 | | | | 328 | |
| | 110,000 | | CAD for USD | Barclays Bank plc | 7/29/11 | | | 113,988 | | | | 1,399 | |
| | 110,900 | | CAD for USD | Westpac Banking Corp. | 7/29/11 | | | 114,921 | | | | 2,132 | |
| | 144,100 | | CAD for USD | Barclays Bank plc | 7/29/11 | | | 149,325 | | | | (1,376 | ) |
| | 184,700 | | CAD for USD | Barclays Bank plc | 7/29/11 | | | 191,397 | | | | 2,745 | |
| | 184,700 | | CAD for USD | Barclays Bank plc | 7/29/11 | | | 191,397 | | | | 2,740 | |
| | 3,411,300 | | CAD for USD | UBS AG | 7/29/11 | | | 3,534,990 | | | | (34,810 | ) |
| | 10,087,002 | | CLP for USD | Barclays Bank plc | 7/29/11 | | | 21,515 | | | | (15 | ) |
| | 20,646,001 | | CLP for USD | Barclays Bank plc | 7/29/11 | | | 44,037 | | | | 342 | |
| | 67,399,000 | | CLP for USD | Barclays Bank plc | 7/29/11 | | | 143,760 | | | | 1,057 | |
| | 139,000 | | CNY for USD | HSBC Bank plc | 7/29/11 | | | 21,501 | | | | (111 | ) |
| | 168,000 | | CNY for USD | HSBC Bank plc | 7/29/11 | | | 25,987 | | | | 55 | |
| | 202,000 | | CNY for USD | HSBC Bank plc | 7/29/11 | | | 31,246 | | | | (64 | ) |
| | 250,000 | | CNY for USD | HSBC Bank plc | 7/29/11 | | | 38,671 | | | | (128 | ) |
| | 258,000 | | CNY for USD | HSBC Bank plc | 7/29/11 | | | 39,908 | | | | (92 | ) |
| | 260,000 | | CNY for USD | HSBC Bank plc | 7/29/11 | | | 40,218 | | | | 66 | |
| | 271,000 | | CNY for USD | HSBC Bank plc | 7/29/11 | | | 41,919 | | | | 63 | |
| | 296,000 | | CNY for USD | HSBC Bank plc | 7/29/11 | | | 45,786 | | | | 64 | |
| | 322,000 | | CNY for USD | HSBC Bank plc | 7/29/11 | | | 49,808 | | | | (138 | ) |
| | 399,000 | | CNY for USD | HSBC Bank plc | 7/29/11 | | | 61,719 | | | | (291 | ) |
| | 405,000 | | CNY for USD | HSBC Bank plc | 7/29/11 | | | 62,647 | | | | (275 | ) |
| | 491,000 | | CNY for USD | HSBC Bank plc | 7/29/11 | | | 75,950 | | | | (101 | ) |
| | 502,000 | | CNY for USD | HSBC Bank plc | 7/29/11 | | | 77,651 | | | | 68 | |
| | 515,000 | | CNY for USD | HSBC Bank plc | 7/29/11 | | | 79,662 | | | | 138 | |
| | 578,000 | | CNY for USD | HSBC Bank plc | 7/29/11 | | | 89,407 | | | | (82 | ) |
| | 617,000 | | CNY for USD | HSBC Bank plc | 7/29/11 | | | 95,440 | | | | 180 | |
| | 623,000 | | CNY for USD | HSBC Bank plc | 7/29/11 | | | 96,368 | | | | (672 | ) |
| | 738,000 | | CNY for USD | HSBC Bank plc | 7/29/11 | | | 114,157 | | | | 285 | |
| | 763,000 | | CNY for USD | HSBC Bank plc | 7/29/11 | | | 118,024 | | | | 504 | |
| | 783,000 | | CNY for USD | HSBC Bank plc | 7/29/11 | | | 121,117 | | | | (9 | ) |
| | 2,832,000 | | CNY for USD | HSBC Bank plc | 7/29/11 | | | 438,065 | | | | (3,057 | ) |
| | 19,345,000 | | CNY for USD | HSBC Bank plc | 7/29/11 | | | 2,992,359 | | | | (13,110 | ) |
| | 23,593,003 | | COP for USD | Barclays Bank plc | 7/29/11 | | | 13,328 | | | | (2 | ) |
| | 119,308,999 | | COP for USD | Barclays Bank plc | 7/29/11 | | | 67,399 | | | | 446 | |
| | 21,000 | | EUR for USD | Westpac Banking Corp. | 7/29/11 | | | 30,433 | | | | 293 | |
| | 33,800 | | EUR for USD | HSBC Bank plc | 7/29/11 | | | 48,983 | | | | 601 | |
| | 48,900 | | EUR for USD | HSBC Bank plc | 7/29/11 | | | 70,865 | | | | 611 | |
| | 65,200 | | EUR for USD | HSBC Bank plc | 7/29/11 | | | 94,487 | | | | (1,886 | ) |
| | 82,800 | | EUR for USD | HSBC Bank plc | 7/29/11 | | | 119,993 | | | | 3,348 | |
| | 83,700 | | EUR for USD | Westpac Banking Corp. | 7/29/11 | | | 121,297 | | | | (858 | ) |
| Contracts to Buy | Counterparty | Settlement Date | | Value | | | Unrealized Gain (Loss) | |
| | 94,200 | | EUR for USD | HSBC Bank plc | 7/29/11 | | | $136,514 | | | | $(298 | ) |
| | 94,200 | | EUR for USD | HSBC Bank plc | 7/29/11 | | | 136,514 | | | | (1,237 | ) |
| | 95,700 | | EUR for USD | UBS AG | 7/29/11 | | | 138,687 | | | | 3,206 | |
| | 133,800 | | EUR for USD | HSBC Bank plc | 7/29/11 | | | 193,902 | | | | 3,143 | |
| | 182,000 | | EUR for USD | HSBC Bank plc | 7/29/11 | | | 263,753 | | | | 5,313 | |
| | 909,600 | | EUR for USD | HSBC Bank plc | 7/29/11 | | | 1,318,183 | | | | (33,164 | ) |
| | 2,368,694 | | EUR for USD | Barclays Bank plc | 7/29/11 | | | 3,432,688 | | | | (25,369 | ) |
| | 13,400 | | GBP for USD | Westpac Banking Corp. | 7/29/11 | | | 21,500 | | | | (789 | ) |
| | 111,800 | | GBP for USD | HSBC Bank plc | 7/29/11 | | | 179,380 | | | | (4,470 | ) |
| | 14,700 | | HKD for USD | Westpac Banking Corp. | 7/29/11 | | | 1,889 | | | | (1 | ) |
| | 43,700 | | HKD for USD | Westpac Banking Corp. | 7/29/11 | | | 5,617 | | | | (10 | ) |
| | 48,800 | | HKD for USD | Westpac Banking Corp. | 7/29/11 | | | 6,272 | | | | (15 | ) |
| | 56,200 | | HKD for USD | Westpac Banking Corp. | 7/29/11 | | | 7,223 | | | | (3 | ) |
| | 56,700 | | HKD for USD | Westpac Banking Corp. | 7/29/11 | | | 7,287 | | | | (11 | ) |
| | 61,700 | | HKD for USD | Westpac Banking Corp. | 7/29/11 | | | 7,930 | | | | (1 | ) |
| | 63,100 | | HKD for USD | Westpac Banking Corp. | 7/29/11 | | | 8,110 | | | | 3 | |
| | 63,400 | | HKD for USD | Westpac Banking Corp. | 7/29/11 | | | 8,149 | | | | (17 | ) |
| | 73,700 | | HKD for USD | Westpac Banking Corp. | 7/29/11 | | | 9,472 | | | | (15 | ) |
| | 77,200 | | HKD for USD | Westpac Banking Corp. | 7/29/11 | | | 9,922 | | | | 1 | |
| | 109,900 | | HKD for USD | Westpac Banking Corp. | 7/29/11 | | | 14,125 | | | | 13 | |
| | 160,000 | | HKD for USD | Westpac Banking Corp. | 7/29/11 | | | 20,564 | | | | (47 | ) |
| | 1,661,200 | | HKD for USD | Westpac Banking Corp. | 7/29/11 | | | 213,508 | | | | (412 | ) |
| | 61,788,037 | | IDR for USD | UBS AG | 7/29/11 | | | 7,204 | | | | 99 | |
| | 63,360,965 | | IDR for USD | UBS AG | 7/29/11 | | | 7,388 | | | | 20 | |
| | 66,617,025 | | IDR for USD | UBS AG | 7/29/11 | | | 7,767 | | | | 47 | |
| | 67,661,990 | | IDR for USD | UBS AG | 7/29/11 | | | 7,889 | | | | 85 | |
| | 72,461,968 | | IDR for USD | UBS AG | 7/29/11 | | | 8,449 | | | | (9 | ) |
| | 72,553,040 | | IDR for USD | UBS AG | 7/29/11 | | | 8,459 | | | | 17 | |
| | 83,207,039 | | IDR for USD | UBS AG | 7/29/11 | | | 9,702 | | | | (39 | ) |
| | 84,721,973 | | IDR for USD | UBS AG | 7/29/11 | | | 9,878 | | | | 58 | |
| | 90,370,004 | | IDR for USD | UBS AG | 7/29/11 | | | 10,537 | | | | 29 | |
| | 102,328,038 | | IDR for USD | UBS AG | 7/29/11 | | | 11,931 | | | | (1 | ) |
| | 109,966,982 | | IDR for USD | UBS AG | 7/29/11 | | | 12,822 | | | | 67 | |
| | 1,842,136,015 | | IDR for USD | UBS AG | 7/29/11 | | | 214,784 | | | | 2,262 | |
| | 18,000 | | ILS for USD | UBS AG | 7/29/11 | | | 5,284 | | | | (34 | ) |
| | 20,500 | | ILS for USD | UBS AG | 7/29/11 | | | 6,018 | | | | 35 | |
| | 21,100 | | ILS for USD | UBS AG | 7/29/11 | | | 6,194 | | | | 174 | |
| | 21,700 | | ILS for USD | UBS AG | 7/29/11 | | | 6,370 | | | | 167 | |
| | 24,000 | | ILS for USD | UBS AG | 7/29/11 | | | 7,045 | | | | (16 | ) |
| | 27,200 | | ILS for USD | UBS AG | 7/29/11 | | | 7,984 | | | | 178 | |
| | 27,200 | | ILS for USD | UBS AG | 7/29/11 | | | 7,984 | | | | 73 | |
| | 29,100 | | ILS for USD | UBS AG | 7/29/11 | | | 8,542 | | | | (12 | ) |
| | 38,800 | | ILS for USD | UBS AG | 7/29/11 | | | 11,389 | | | | 97 | |
| | 41,600 | | ILS for USD | UBS AG | 7/29/11 | | | 12,211 | | | | 79 | |
| | 678,500 | | ILS for USD | UBS AG | 7/29/11 | | | 199,165 | | | | 1,057 | |
| | 418,000 | | INR for USD | UBS AG | 7/29/11 | | | 9,336 | | | | 75 | |
| | 504,000 | | INR for USD | UBS AG | 7/29/11 | | | 11,257 | | | | 173 | |
| | 539,000 | | INR for USD | UBS AG | 7/29/11 | | | 12,039 | | | | 268 | |
| | 596,000 | | INR for USD | UBS AG | 7/29/11 | | | 13,312 | | | | 81 | |
| Contracts to Buy | Counterparty | Settlement Date | | Value | | | Unrealized Gain (Loss) | |
| | 602,000 | | INR for USD | UBS AG | 7/29/11 | | | $13,446 | | | | $233 | |
| | 647,000 | | INR for USD | UBS AG | 7/29/11 | | | 14,451 | | | | 106 | |
| | 695,000 | | INR for USD | UBS AG | 7/29/11 | | | 15,523 | | | | 167 | |
| | 698,000 | | INR for USD | UBS AG | 7/29/11 | | | 15,590 | | | | 165 | |
| | 738,000 | | INR for USD | UBS AG | 7/29/11 | | | 16,483 | | | | 105 | |
| | 798,000 | | INR for USD | UBS AG | 7/29/11 | | | 17,823 | | | | 31 | |
| | 933,000 | | INR for USD | UBS AG | 7/29/11 | | | 20,839 | | | | 92 | |
| | 1,363,000 | | INR for USD | UBS AG | 7/29/11 | | | 30,443 | | | | 94 | |
| | 15,657,000 | | INR for USD | UBS AG | 7/29/11 | | | 349,701 | | | | 3,690 | |
| | 837,000 | | JPY for USD | HSBC Bank plc | 7/29/11 | | | 10,398 | | | | (36 | ) |
| | 4,716,999 | | KRW for USD | HSBC Bank plc | 7/29/11 | | | 4,414 | | | | 41 | |
| | 7,721,004 | | KRW for USD | HSBC Bank plc | 7/29/11 | | | 7,224 | | | | 115 | |
| | 9,619,995 | | KRW for USD | HSBC Bank plc | 7/29/11 | | | 9,001 | | | | 73 | |
| | 14,155,000 | | KRW for USD | HSBC Bank plc | 7/29/11 | | | 13,245 | | | | 214 | |
| | 14,638,997 | | KRW for USD | HSBC Bank plc | 7/29/11 | | | 13,698 | | | | 254 | |
| | 15,092,998 | | KRW for USD | HSBC Bank plc | 7/29/11 | | | 14,122 | | | | 134 | |
| | 15,155,996 | | KRW for USD | HSBC Bank plc | 7/29/11 | | | 14,181 | | | | 180 | |
| | 18,158,004 | | KRW for USD | HSBC Bank plc | 7/29/11 | | | 16,990 | | | | 85 | |
| | 18,932,004 | | KRW for USD | HSBC Bank plc | 7/29/11 | | | 17,715 | | | | 186 | |
| | 19,247,004 | | KRW for USD | HSBC Bank plc | 7/29/11 | | | 18,009 | | | | 153 | |
| | 20,768,997 | | KRW for USD | HSBC Bank plc | 7/29/11 | | | 19,433 | | | | 587 | |
| | 20,966,000 | | KRW for USD | HSBC Bank plc | 7/29/11 | | | 19,618 | | | | 286 | |
| | 21,286,000 | | KRW for USD | HSBC Bank plc | 7/29/11 | | | 19,917 | | | | 389 | |
| | 21,568,005 | | KRW for USD | HSBC Bank plc | 7/29/11 | | | 20,181 | | | | 389 | |
| | 25,396,004 | | KRW for USD | HSBC Bank plc | 7/29/11 | | | 23,763 | | | | 517 | |
| | 26,044,005 | | KRW for USD | HSBC Bank plc | 7/29/11 | | | 24,369 | | | | 421 | |
| | 46,392,999 | | KRW for USD | HSBC Bank plc | 7/29/11 | | | 43,410 | | | | 84 | |
| | 637,738,003 | | KRW for USD | HSBC Bank plc | 7/29/11 | | | 596,726 | | | | 11,161 | |
| | 143,000 | | MXN for USD | Barclays Bank plc | 7/29/11 | | | 12,187 | | | | 13 | |
| | 149,000 | | MXN for USD | Barclays Bank plc | 7/29/11 | | | 12,698 | | | | (109 | ) |
| | 221,000 | | MXN for USD | Barclays Bank plc | 7/29/11 | | | 18,835 | | | | (66 | ) |
| | 336,000 | | MXN for USD | Barclays Bank plc | 7/29/11 | | | 28,636 | | | | (192 | ) |
| | 403,000 | | MXN for USD | Barclays Bank plc | 7/29/11 | | | 34,346 | | | | (262 | ) |
| | 416,000 | | MXN for USD | Barclays Bank plc | 7/29/11 | | | 35,453 | | | | 491 | |
| | 455,000 | | MXN for USD | Barclays Bank plc | 7/29/11 | | | 38,777 | | | | (250 | ) |
| | 508,000 | | MXN for USD | Barclays Bank plc | 7/29/11 | | �� | 43,294 | | | | 723 | |
| | 537,000 | | MXN for USD | Barclays Bank plc | 7/29/11 | | | 45,766 | | | | 781 | |
| | 581,000 | | MXN for USD | Barclays Bank plc | 7/29/11 | | | 49,516 | | | | (477 | ) |
| | 626,000 | | MXN for USD | Barclays Bank plc | 7/29/11 | | | 53,351 | | | | 554 | |
| | 637,000 | | MXN for USD | Barclays Bank plc | 7/29/11 | | | 54,288 | | | | (43 | ) |
| | 669,000 | | MXN for USD | Barclays Bank plc | 7/29/11 | | | 57,015 | | | | (135 | ) |
| | 692,000 | | MXN for USD | Barclays Bank plc | 7/29/11 | | | 58,975 | | | | 446 | |
| | 714,000 | | MXN for USD | Barclays Bank plc | 7/29/11 | | | 60,850 | | | | 393 | |
| | 1,110,000 | | MXN for USD | Barclays Bank plc | 7/29/11 | | | 94,599 | | | | (138 | ) |
| | 1,672,000 | | MXN for USD | Barclays Bank plc | 7/29/11 | | | 142,496 | | | | (1,804 | ) |
| | 18,774,000 | | MXN for USD | Barclays Bank plc | 7/29/11 | | | 1,600,008 | | | | (5,005 | ) |
| | 28,000 | | MYR for USD | Westpac Banking Corp. | 7/29/11 | | | 9,284 | | | | (14 | ) |
| | 28,100 | | MYR for USD | Westpac Banking Corp. | 7/29/11 | | | 9,317 | | | | (87 | ) |
| | 33,500 | | MYR for USD | Westpac Banking Corp. | 7/29/11 | | | 11,108 | | | | 84 | |
| Contracts to Buy | Counterparty | Settlement Date | | Value | | | Unrealized Gain (Loss) | |
| | 33,700 | | MYR for USD | Westpac Banking Corp. | 7/29/11 | | | $11,174 | | | | $65 | |
| | 34,300 | | MYR for USD | Westpac Banking Corp. | 7/29/11 | | | 11,373 | | | | 191 | |
| | 36,900 | | MYR for USD | Westpac Banking Corp. | 7/29/11 | | | 12,235 | | | | (160 | ) |
| | 37,900 | | MYR for USD | Westpac Banking Corp. | 7/29/11 | | | 12,567 | | | | 65 | |
| | 38,000 | | MYR for USD | Westpac Banking Corp. | 7/29/11 | | | 12,600 | | | | (216 | ) |
| | 44,600 | | MYR for USD | Westpac Banking Corp. | 7/29/11 | | | 14,788 | | | | (86 | ) |
| | 46,800 | | MYR for USD | Westpac Banking Corp. | 7/29/11 | | | 15,518 | | | | 52 | |
| | 63,900 | | MYR for USD | Westpac Banking Corp. | 7/29/11 | | | 21,188 | | | | 220 | |
| | 1,054,600 | | MYR for USD | Westpac Banking Corp. | 7/29/11 | | | 349,680 | | | | (1,736 | ) |
| | 39,700 | | NOK for USD | HSBC Bank plc | 7/29/11 | | | 7,347 | | | | (216 | ) |
| | 303,700 | | NOK for USD | Westpac Banking Corp. | 7/29/11 | | | 56,206 | | | | (1,414 | ) |
| | 469,100 | | NOK for USD | HSBC Bank plc | 7/29/11 | | | 86,817 | | | | 1,013 | |
| | 3,856,200 | | NOK for USD | UBS AG | 7/29/11 | | | 713,674 | | | | 669 | |
| | 4,294,600 | | NOK for USD | Deutsche Bank AG | 7/29/11 | | | 794,809 | | | | (7,783 | ) |
| | 3,300 | | NZD for USD | HSBC Bank plc | 7/29/11 | | | 2,730 | | | | 70 | |
| | 16,300 | | NZD for USD | Barclays Bank plc | 7/29/11 | | | 13,482 | | | | 470 | |
| | 80,200 | | NZD for USD | Westpac Banking Corp. | 7/29/11 | | | 66,337 | | | | 2,222 | |
| | 169,000 | | PHP for USD | Westpac Banking Corp. | 7/29/11 | | | 3,898 | | | | (73 | ) |
| | 185,000 | | PHP for USD | Westpac Banking Corp. | 7/29/11 | | | 4,267 | | | | (19 | ) |
| | 212,000 | | PHP for USD | Westpac Banking Corp. | 7/29/11 | | | 4,889 | | | | 26 | |
| | 222,000 | | PHP for USD | Westpac Banking Corp. | 7/29/11 | | | 5,120 | | | | (19 | ) |
| | 243,000 | | PHP for USD | Westpac Banking Corp. | 7/29/11 | | | 5,604 | | | | 18 | |
| | 244,000 | | PHP for USD | Westpac Banking Corp. | 7/29/11 | | | 5,627 | | | | (76 | ) |
| | 249,000 | | PHP for USD | Westpac Banking Corp. | 7/29/11 | | | 5,743 | | | | (68 | ) |
| | 287,000 | | PHP for USD | Westpac Banking Corp. | 7/29/11 | | | 6,619 | | | | (3 | ) |
| | 343,000 | | PHP for USD | Westpac Banking Corp. | 7/29/11 | | | 7,911 | | | | (36 | ) |
| | 388,000 | | PHP for USD | Westpac Banking Corp. | 7/29/11 | | | 8,949 | | | | 37 | |
| | 6,440,000 | | PHP for USD | Westpac Banking Corp. | 7/29/11 | | | 148,526 | | | | (547 | ) |
| | 30,000 | | PLN for USD | Deutsche Bank AG | 7/29/11 | | | 10,910 | | | | (48 | ) |
| | 156,000 | | RUB for USD | UBS AG | 7/29/11 | | | 5,580 | | | | 130 | |
| | 159,000 | | RUB for USD | UBS AG | 7/29/11 | | | 5,687 | | | | (121 | ) |
| | 160,000 | | RUB for USD | UBS AG | 7/29/11 | | | 5,723 | | | | 48 | |
| | 204,000 | | RUB for USD | UBS AG | 7/29/11 | | | 7,296 | | | | 48 | |
| | 205,000 | | RUB for USD | UBS AG | 7/29/11 | | | 7,332 | | | | (25 | ) |
| | 211,000 | | RUB for USD | UBS AG | 7/29/11 | | | 7,547 | | | | (7 | ) |
| | 236,000 | | RUB for USD | UBS AG | 7/29/11 | | | 8,441 | | | | 15 | |
| | 279,000 | | RUB for USD | UBS AG | 7/29/11 | | | 9,979 | | | | 38 | |
| | 334,000 | | RUB for USD | UBS AG | 7/29/11 | | | 11,945 | | | | 39 | |
| | 6,955,000 | | RUB for USD | UBS AG | 7/29/11 | | | 248,756 | | | | 1,999 | |
| | 918,200 | | SEK for USD | UBS AG | 7/29/11 | | | 144,958 | | | | (3,440 | ) |
| | 1,255,400 | | SEK for USD | HSBC Bank plc | 7/29/11 | | | 198,193 | | | | (10,658 | ) |
| | 2,434,100 | | SEK for USD | Deutsche Bank AG | 7/29/11 | | | 384,277 | | | | (12,466 | ) |
| | 5,500 | | SGD for USD | HSBC Bank plc | 7/29/11 | | | 4,478 | | | | (8 | ) |
| | 5,900 | | SGD for USD | HSBC Bank plc | 7/29/11 | | | 4,803 | | | | — | |
| | 6,500 | | SGD for USD | HSBC Bank plc | 7/29/11 | | | 5,292 | | | | (10 | ) |
| | 7,300 | | SGD for USD | HSBC Bank plc | 7/29/11 | | | 5,943 | | | | 42 | |
| | 7,400 | | SGD for USD | HSBC Bank plc | 7/29/11 | | | 6,025 | | | | 13 | |
| | 8,200 | | SGD for USD | HSBC Bank plc | 7/29/11 | | | 6,676 | | | | 30 | |
| | 8,600 | | SGD for USD | HSBC Bank plc | 7/29/11 | | | 7,002 | | | | 45 | |
| Contracts to Buy | Counterparty | Settlement Date | | Value | | | Unrealized Gain (Loss) | |
| | 9,600 | | SGD for USD | HSBC Bank plc | 7/29/11 | | | $7,816 | | | | $(23 | ) |
| | 9,900 | | SGD for USD | HSBC Bank plc | 7/29/11 | | | 8,060 | | | | 42 | |
| | 9,900 | | SGD for USD | HSBC Bank plc | 7/29/11 | | | 8,060 | | | | 5 | |
| | 11,400 | | SGD for USD | HSBC Bank plc | 7/29/11 | | | 9,281 | | | | 54 | |
| | 11,900 | | SGD for USD | HSBC Bank plc | 7/29/11 | | | 9,688 | | | | 124 | |
| | 11,900 | | SGD for USD | HSBC Bank plc | 7/29/11 | | | 9,688 | | | | 43 | |
| | 12,000 | | SGD for USD | HSBC Bank plc | 7/29/11 | | | 9,770 | | | | 72 | |
| | 13,300 | | SGD for USD | HSBC Bank plc | 7/29/11 | | | 10,828 | | | | 172 | |
| | 39,900 | | SGD for USD | HSBC Bank plc | 7/29/11 | | | 32,484 | | | | (162 | ) |
| | 305,600 | | SGD for USD | HSBC Bank plc | 7/29/11 | | | 248,799 | | | | 1,275 | |
| | 47,000 | | THB for USD | Westpac Banking Corp. | 7/29/11 | | | 1,527 | | | | (45 | ) |
| | 233,000 | | THB for USD | Westpac Banking Corp. | 7/29/11 | | | 7,570 | | | | (112 | ) |
| | 247,000 | | THB for USD | Westpac Banking Corp. | 7/29/11 | | | 8,025 | | | | (204 | ) |
| | 287,000 | | THB for USD | Westpac Banking Corp. | 7/29/11 | | | 9,325 | | | | (71 | ) |
| | 291,000 | | THB for USD | Westpac Banking Corp. | 7/29/11 | | | 9,455 | | | | (129 | ) |
| | 312,000 | | THB for USD | Westpac Banking Corp. | 7/29/11 | | | 10,137 | | | | (115 | ) |
| | 322,000 | | THB for USD | Westpac Banking Corp. | 7/29/11 | | | 10,462 | | | | 24 | |
| | 330,000 | | THB for USD | Westpac Banking Corp. | 7/29/11 | | | 10,722 | | | | (276 | ) |
| | 360,000 | | THB for USD | Westpac Banking Corp. | 7/29/11 | | | 11,696 | | | | (7 | ) |
| | 399,000 | | THB for USD | Westpac Banking Corp. | 7/29/11 | | | 12,963 | | | | (123 | ) |
| | 558,000 | | THB for USD | Westpac Banking Corp. | 7/29/11 | | | 18,129 | | | | (23 | ) |
| | 800,000 | | THB for USD | Westpac Banking Corp. | 7/29/11 | | | 25,992 | | | | (773 | ) |
| | 8,486,000 | | THB for USD | Westpac Banking Corp. | 7/29/11 | | | 275,708 | | | | (7,489 | ) |
| | 67,000 | | TRY for USD | Deutsche Bank AG | 7/29/11 | | | 41,093 | | | | (2,124 | ) |
| | 72,000 | | TWD for USD | HSBC Bank plc | 7/29/11 | | | 2,514 | | | | (20 | ) |
| | 154,000 | | TWD for USD | HSBC Bank plc | 7/29/11 | | | 5,376 | | | | (18 | ) |
| | 195,000 | | TWD for USD | HSBC Bank plc | 7/29/11 | | | 6,808 | | | | (78 | ) |
| | 228,000 | | TWD for USD | HSBC Bank plc | 7/29/11 | | | 7,960 | | | | 7 | |
| | 259,000 | | TWD for USD | HSBC Bank plc | 7/29/11 | | | 9,042 | | | | 17 | |
| | 266,000 | | TWD for USD | HSBC Bank plc | 7/29/11 | | | 9,286 | | | | (16 | ) |
| | 266,000 | | TWD for USD | HSBC Bank plc | 7/29/11 | | | 9,286 | | | | (87 | ) |
| | 280,000 | | TWD for USD | HSBC Bank plc | 7/29/11 | | | 9,775 | | | | 48 | |
| | 290,000 | | TWD for USD | HSBC Bank plc | 7/29/11 | | | 10,124 | | | | 72 | |
| | 331,000 | | TWD for USD | HSBC Bank plc | 7/29/11 | | | 11,555 | | | | 80 | |
| | 382,000 | | TWD for USD | HSBC Bank plc | 7/29/11 | | | 13,336 | | | | (162 | ) |
| | 387,000 | | TWD for USD | HSBC Bank plc | 7/29/11 | | | 13,510 | | | | (88 | ) |
| | 398,000 | | TWD for USD | HSBC Bank plc | 7/29/11 | | | 13,894 | | | | 46 | |
| | 413,000 | | TWD for USD | HSBC Bank plc | 7/29/11 | | | 14,418 | | | | 90 | |
| | 460,000 | | TWD for USD | HSBC Bank plc | 7/29/11 | | | 16,059 | | | | 64 | |
| | 463,000 | | TWD for USD | HSBC Bank plc | 7/29/11 | | | 16,164 | | | | 115 | |
| | 12,257,000 | | TWD for USD | HSBC Bank plc | 7/29/11 | | | 427,898 | | | | 80 | |
| | | | | | | | | $28,689,860 | | | | $(107,354 | ) |
(Value on Settlement Date $28,797,214)
| Swap Agreements | |
| Notional Amount | | Description of Agreement | | Premiums Paid (Received) | | | Value | |
| TOTAL RETURN | | | | | | | | |
| $900,000 | | Pay a fixed rate equal to 0.12 multiplied by the notional amount and receive the return of the U.S. CPI Urban Consumers NSA Index upon the termination date with Barclays Bank plc. Expires January 2016. | | | — | | | | $13,343 | |
| 925,000 | | Pay a fixed rate equal to 0.12 multiplied by the notional amount and receive the return of the U.S. CPI Urban Consumers NSA Index upon the termination date with Bank of America N.A. Expires January 2016. | | | — | | | | 14,738 | |
| 2,100,000 | | Pay a fixed rate equal to 0.13 multiplied by the notional amount and receive the return of the U.S. CPI Urban Consumers NSA Index upon the termination date with Barclays Bank plc. Expires May 2016. | | | — | | | | (4,644 | ) |
| | | | | | — | | | | $23,437 | |
Notes to Schedule of Investments
ADR = American Depositary Receipt
AUD = Australian Dollar
BRL = Brazilian Real
CAD = Canadian Dollar
CHF = Swiss Franc
CLP = Chilean Peso
CNY = Chinese Yuan
COP = Colombian Peso
CZK = Czech Koruna
ETF = Exchange-Traded Fund
EUR = Euro
FHLMC = Federal Home Loan Mortgage Corporation
GBP = British Pound
HKD = Hong Kong Dollar
HUF = Hungarian Forint
IDR = Indonesian Rupiah
ILS = Israeli Shekel
INR = Indian Rupee
JPY = Japanese Yen
KRW = Korea Won
LB-UBS = Lehman Brothers, Inc. — UBS AG
MASTR = Mortgage Asset Securitization Transactions, Inc.
MXN = Mexican Peso
MYR = Malaysian Ringgit
NCUA = National Credit Union Administration
NOK = Norwegian Krone
NSA = Not Seasonally Adjusted
NZD = New Zealand Dollar
PEN = Peruvian Nuevo Sol
PHP = Philippine Peso
PLN = Polish Zloty
RUB = Russian Rouble
SEK = Swedish Krona
SEQ = Sequential Payer
SGD = Singapore Dollar
THB = Thai Baht
TRY = Turkish Lira
TWD = Taiwanese Dollar
USD = United States Dollar
VRN = Variable Rate Note. Interest reset date is indicated. Rate shown is effective at the period end.
ZAR = South African Rand
| (1) | Security, or a portion thereof, has been segregated for forward foreign currency exchange contracts, futures contracts and/or swap agreements. At the period end, the aggregate value of securities pledged was $42,023,000. |
| (3) | The rate indicated is the yield to maturity at purchase. |
| (4) | Security was purchased under Rule 144A or Section 4(2) of the Securities Act of 1933 or is a private placement and, unless registered under the Act or exempted from registration, may only be sold to qualified institutional investors. The aggregate value of these securities at the period end was $3,110,747, which represented 3.2% of total net assets. |
| (5) | Category is less than 0.05% of total net assets. |
| (6) | Final maturity date indicated, unless otherwise noted. |
See Notes to Financial Statements.
Statement of Assets and Liabilities |
| JUNE 30, 2011 | |
| Assets | |
| Investment securities, at value (cost of $93,738,269) | | | $94,892,343 | |
| Foreign currency holdings, at value (cost of $4,962) | | | 4,965 | |
| Receivable for investments sold | | | 228,184 | |
| Receivable for capital shares sold | | | 2,036,154 | |
| Unrealized gain on forward foreign currency exchange contracts | | | 109,355 | |
| Receivable for variation margin on futures contracts | | | 484 | |
| Swap agreements, at value | | | 28,081 | |
| Dividends and interest receivable | | | 298,309 | |
| | | | 97,597,875 | |
| | | | | |
| Liabilities | | | | |
| Disbursements in excess of demand deposit cash | | | 358,999 | |
| Payable for investments purchased | | | 1,019,207 | |
| Payable for capital shares redeemed | | | 15,219 | |
| Payable for variation margin on futures contracts | | | 5,313 | |
| Unrealized loss on forward foreign currency exchange contracts | | | 285,781 | |
| Accrued management fees | | | 68,060 | |
| Distribution and service fees payable | | | 9,743 | |
| Swap agreements, at value | | | 4,644 | |
| | | | 1,766,966 | |
| | | | | |
| Net Assets | | | $95,830,909 | |
| | | | | |
| Net Assets Consist of: | | | | |
| Capital (par value and paid-in surplus) | | | $93,549,221 | |
| Undistributed net investment income | | | 1,149,729 | |
| Undistributed net realized gain | | | 154,456 | |
| Net unrealized appreciation | | | 977,503 | |
| | | | $95,830,909 | |
| | Net assets | Shares outstanding | Net asset value per share |
| Investor Class, $0.01 Par Value | $53,696,037 | 5,015,633 | $10.71 |
| Institutional Class, $0.01 Par Value | $5,428,071 | 506,738 | $10.71 |
| A Class, $0.01 Par Value | $30,415,513 | 2,845,294 | $10.69* |
| C Class, $0.01 Par Value | $6,167,089 | 579,305 | $10.65 |
| R Class, $0.01 Par Value | $124,199 | 11,636 | $10.67 |
*Maximum offering price $11.34 (net asset value divided by 0.9425)
See Notes to Financial Statements.
| YEAR ENDED JUNE 30, 2011 | |
| Investment Income (Loss) | |
| Income: | | | |
| Dividends (net of foreign taxes withheld of $4,723) | | | $146,265 | |
| Interest | | | 788,907 | |
| | | | 935,172 | |
| | | | | |
| Expenses: | | | | |
| Management fees | | | 451,168 | |
| Distribution and service fees: | | | | |
| A Class | | | 21,726 | |
| C Class | | | 15,060 | |
| R Class | | | 647 | |
| Directors’ fees and expenses | | | 1,925 | |
| Other expenses | | | 630 | |
| | | | 491,156 | |
| Fees waived | | | (58,917 | ) |
| | | | 432,239 | |
| | | | | |
| Net investment income (loss) | | | 502,933 | |
| | | | | |
| Realized and Unrealized Gain (Loss) | | | | |
| Net realized gain (loss) on: | | | | |
| Investment transactions | | | 220,379 | |
| Futures contract transactions | | | (41,558 | ) |
| Foreign currency transactions (net of foreign tax expenses paid of $3,664) | | | 962,791 | |
| | | | 1,141,612 | |
| | | | | |
| Change in net unrealized appreciation (depreciation) on: | | | | |
| Investments | | | 1,331,981 | |
| Futures contracts | | | (24,504 | ) |
| Swap agreements | | | 23,437 | |
| Translation of assets and liabilities in foreign currencies | | | (156,049 | ) |
| | | | 1,174,865 | |
| | | | | |
| Net realized and unrealized gain (loss) | | | 2,316,477 | |
| | | | | |
| Net Increase (Decrease) in Net Assets Resulting from Operations | | | $2,819,410 | |
See Notes to Financial Statements.
Statement of Changes in Net Assets |
| YEAR ENDED JUNE 30, 2011 AND PERIOD ENDED JUNE 30, 2010 | |
| Increase (Decrease) in Net Assets | | 2011 | | | 2010(1) | |
| Operations | |
| Net investment income (loss) | | | $502,933 | | | | $6,621 | |
| Net realized gain (loss) | | | 1,141,612 | | | | (14,951 | ) |
| Change in net unrealized appreciation (depreciation) | | | 1,174,865 | | | | (197,362 | ) |
| Net increase (decrease) in net assets resulting from operations | | | 2,819,410 | | | | (205,692 | ) |
| | | | | | | | | |
| Distributions to Shareholders | | | | | | | | |
| From net investment income: | | | | | | | | |
| Investor Class | | | (262,159 | ) | | | — | |
| Institutional Class | | | (27,223 | ) | | | — | |
| A Class | | | (40,461 | ) | | | — | |
| C Class | | | (2,042 | ) | | | — | |
| R Class | | | (682 | ) | | | — | |
| From net realized gains: | | | | | | | | |
| Investor Class | | | (1,772 | ) | | | — | |
| Institutional Class | | | (176 | ) | | | — | |
| A Class | | | (301 | ) | | | — | |
| C Class | | | (65 | ) | | | — | |
| R Class | | | (11 | ) | | | — | |
| Decrease in net assets from distributions | | | (334,892 | ) | | | — | |
| | | | | | | | | |
| Capital Share Transactions | | | | | | | | |
| Net increase (decrease) in net assets from capital share transactions | | | 85,289,192 | | | | 8,262,891 | |
| | | | | | | | | |
| Net increase (decrease) in net assets | | | 87,773,710 | | | | 8,057,199 | |
| | | | | | | | | |
| Net Assets | | | | | | | | |
| Beginning of period | | | 8,057,199 | | | | — | |
| End of period | | | $95,830,909 | | | | $8,057,199 | |
| | | | | | | | | |
| Accumulated undistributed net investment income (loss) | | | $1,149,729 | | | | $(5,142 | ) |
| (1) | April 30, 2010 (fund inception) through June 30, 2010. |
See Notes to Financial Statements.
Notes to Financial Statements |
JUNE 30, 2011
1. Organization
American Century Quantitative Equity Funds, Inc. (the corporation) is registered under the Investment Company Act of 1940, as amended (the 1940 Act), as an open-end management investment company and is organized as a Maryland corporation. Strategic Inflation Opportunities Fund (the fund) is one fund in a series issued by the corporation. The fund is nondiversified as defined under the 1940 Act. The fund’s investment objective is to seek total real return (total return reduced by the expected impact of inflation). The fund pursues its objective by diversifying investments among U.S. Treasury inflation-indexed and other U.S. fixed-income securities, commodity-related investments, and non-U.S. dollar investments.
The fund is authorized to issue the Investor Class, the Institutional Class, the A Class, the C Class and the R Class. The A Class may incur an initial sales charge. The A Class and C Class may be subject to a contingent deferred sales charge. The share classes differ principally in their respective sales charges and distribution and shareholder servicing expenses and arrangements. The Institutional Class is made available to institutional shareholders or through financial intermediaries whose clients do not require the same level of shareholder and administrative services as shareholders of other classes. As a result, the Institutional Class is charged a lower unified management fee. All classes of the fund commenced sale on April 30, 2010, the fund’s inception date.
2. Significant Accounting Policies
The following is a summary of significant accounting policies consistently followed by the fund in preparation of its financial statements. The financial statements are prepared in conformity with accounting principles generally accepted in the United States of America, which may require management to make certain estimates and assumptions at the date of the financial statements. Actual results could differ from these estimates.
Investment Valuations — The fund determines the fair value of its investments and computes its net asset value per share as of the close of regular trading (usually 4 p.m. Eastern time) on the New York Stock Exchange (NYSE) on each day the NYSE is open.
Debt securities maturing in greater than 60 days at the time of purchase are valued at the evaluated mean as provided by independent pricing services or at the mean of the most recent bid and asked prices as provided by investment dealers. Debt securities maturing within 60 days at the time of purchase may be valued at cost, plus or minus any amortized discount or premium or at the evaluated mean as provided by an independent pricing service. Evaluated mean prices are commonly derived through utilization of market models, which may consider, among other factors, trade data, quotations from dealers and active market makers, relevant yield curve and spread data, related sector levels, creditworthiness, and other relevant market information on the same or comparable securities.
Equity securities that are listed or traded on a domestic securities exchange are valued at the last reported sales price or at the official closing price as provided by the exchange. Equity securities traded on foreign securities exchanges are typically valued at the closing price on the exchange where primarily traded or as of the close of the NYSE, if that is earlier. If no last sales price is reported, or if local convention or regulation so provides, the mean of the latest bid and asked prices is used. Depending on local convention or regulation, securities traded over-the-counter are valued at the mean of the latest bid and asked prices, the last sales price, or the official closing price. In its determination of fair value, the fund may review several factors including: market information specific to a security; news developments in U.S. and foreign markets; the performance of particular U.S. and foreign securities, indices, comparable securities, American Depositary Receipts, Exchange-Traded Funds, and other relevant market indicators.
Investments in open-end management investment companies are valued at the reported net asset value per share. Exchange-traded futures contracts are valued at the settlement price as provided by the appropriate clearing corporation. Forward foreign currency exchange contracts are valued at the mean of the latest bid and asked prices of the forward currency rates as provided by an independent pricing service. Swap agreements are valued at an evaluated price as provided by independent pricing services or investment dealers.
The value of investments initially expressed in foreign currencies is translated into U.S. dollars at prevailing exchange rates.
If the fund determines that the market price for a portfolio security is not readily available or the valuation methods mentioned above do not reflect a security’s fair value, such security is valued as determined in good faith by the Board of Directors or its designee, in accordance with procedures adopted by the Board of Directors. Circumstances that may cause the fund to use these procedures to value a security include, but are not limited to: a security has been declared in default; trading in a security has been halted during the trading day; there is a foreign market holiday and no trading occurred; or an event occurred between the close of a foreign exchange and the NYSE that may affect the value of a security.
Security Transactions — Security transactions are accounted for as of the trade date. Net realized gains and losses are determined on the identified cost basis, which is also used for federal income tax purposes.
Investment Income — Dividend income less foreign taxes withheld, if any, is recorded as of the ex-dividend date. Interest income is recorded on the accrual basis and includes paydown gain (loss) and accretion of discounts and amortization of premiums. Inflation adjustments related to inflation-linked debt securities are reflected as interest income.
Foreign Currency Translations — All assets and liabilities initially expressed in foreign currencies are translated into U.S. dollars at prevailing exchange rates at period end. The fund may enter into spot foreign currency exchange contracts to facilitate transactions denominated in a foreign currency. Purchases and sales of investment securities, dividend and interest income, spot foreign currency exchange contracts, and expenses are translated at the rates of exchange prevailing on the respective dates of such transactions. Net realized and unrealized foreign currency exchange gains or losses related to investment securities are a component of net realized gain (loss) on investment transactions and change in net unrealized appreciation (depreciation) on investments, respectively. Certain countries impose taxes on the contract amount of purchases and sales of foreign currency contracts in their currency. The fund records the foreign tax expense, if any, as a reduction to the net realized gain (loss) on foreign currency transactions.
Commodity Exchange-Traded Funds — The fund may invest in exchange-traded funds of underlying commodities (Commodity ETFs). Commodity ETFs are a type of index fund bought and sold on a securities exchange. A Commodity ETF trades like common stock and represents a portfolio designed to track the performance of a particular index of a physical commodity or group of physical commodities. The fund may purchase a Commodity ETF to gain exposure to the underlying physical commodities. The risks of owning a Commodity ETF generally reflect the risks of owning the underlying commodities they are designed to track, although a lack of liquidity on a Commodity ETF could result in it being more volatile. Commodities markets have historically been extremely volatile. Additionally, Commodity ETFs have fees and expenses that reduce their value.
Income Tax Status — It is the fund’s policy to distribute substantially all net investment income and net realized gains to shareholders and to otherwise qualify as a regulated investment company under provisions of the Internal Revenue Code. All tax years for the fund remain subject to examination by tax authorities. At this time, management believes there are no uncertain tax positions which, based on their technical merit, would not be sustained upon examination and for which it is reasonably possible that the total amounts of unrecognized tax benefits will significantly change in the next twelve months. Accordingly, no provision has been made for federal or state income taxes.
Multiple Class — All shares of the fund represent an equal pro rata interest in the net assets of the class to which such shares belong, and have identical voting, dividend, liquidation and other rights and the same terms and conditions, except for class specific expenses and exclusive rights to vote on matters affecting only individual classes. Income, non-class specific expenses, and realized and unrealized capital gains and losses of the fund are allocated to each class of shares based on their relative net assets.
Distributions to Shareholders — Distributions from net investment income, if any, are generally declared and paid quarterly. Distributions from net realized gains, if any, are generally declared and paid annually.
Indemnifications — Under the corporation’s organizational documents, its officers and directors are indemnified against certain liabilities arising out of the performance of their duties to the fund. In addition, in the normal course of business, the fund enters into contracts that provide general indemnifications. The maximum exposure under these arrangements is unknown as this would involve future claims that may be made against a fund. The risk of material loss from such claims is considered by management to be remote.
3. Fees and Transactions with Related Parties
Management Fees — The corporation has entered into a management agreement with American Century Investment Management, Inc. (ACIM) (the investment advisor), under which ACIM provides the fund with investment advisory and management services in exchange for a single, unified management fee (the fee) per class. The agreement provides that all expenses of managing and operating the fund, except distribution and service fees, brokerage expenses, taxes, interest, fees and expenses of the independent directors (including legal counsel fees), and extraordinary expenses, will be paid by ACIM. The fee is computed and accrued daily based on each class’s daily net assets and paid monthly in arrears. The fee consists of (1) an Investment Category Fee based on the daily net assets of the fund and certain other accounts managed by the investment advisor that are in the same broad investment category as the fund and (2) a Complex Fee based on the assets of all the funds in the American Century Investments family of funds. The rates for the Investment Category Fee range from 0.7754% to 0.8929%. The rates for the Complex Fee range from 0.2500% to 0.3100% for the Investor Class, A Class, C Class and R Class. The Institutional Class is 0.2000% less at each point within the Complex Fee range. During the year ended June 30, 2011, the investment advisor voluntarily agreed to waive 0.14% of its management fee. The fee waiver expired July 31, 2011. The total amount of the waiver for each class for the year ended June 30, 2011 was $40,932, $3,529, $12,166, $2,109 and $181 for the Investor Class, Institutional Class, A Class, C Class and R Class, respectively. The effective annual management fee before waiver for each class for the year ended June 30, 2011 was 1.08% for the Investor Class, A Class, C Class and R Class and 0.88% for the Institutional Class. The effective annual management fee after waiver for each class for the year ended June 30, 2011 was 0.94% for the Investor Class, A Class, C Class and R Class and 0.74% for the Institutional Class.
Distribution and Service Fees — The Board of Directors has adopted a separate Master Distribution and Individual Shareholder Services Plan for each of the A Class, C Class and R Class (collectively the plans), pursuant to Rule 12b-1 of the 1940 Act. The plans provide that the A Class will pay American Century Investment Services, Inc. (ACIS) an annual distribution and service fee of 0.25%. The plans provide that the C Class will pay ACIS an annual distribution and service fee of 1.00%, of which 0.25% is paid for individual shareholder services and 0.75% is paid for distribution services. The plans provide that the R Class will pay ACIS an annual distribution and service fee of 0.50%. The fees are computed and accrued daily based on each class’s daily net assets and paid monthly in arrears. The fees are used to pay financial intermediaries for distribution and individual shareholder services. Fees incurred under the plans during the year ended June 30, 2011 are detailed in the Statement of Operations.
Acquired Fund Fees and Expenses — The fund may invest in mutual funds, exchange-traded funds, and business development companies (the acquired funds). The fund will indirectly realize its pro rata share of the fees and expenses of the acquired funds in which it invests. These indirect fees and expenses are not paid out of the fund’s assets but are reflected in the return realized by the fund on its investment in the acquired funds.
Related Parties — Certain officers and directors of the corporation are also officers and/or directors of American Century Companies, Inc. (ACC), the parent of the corporation’s investment advisor, ACIM, the distributor of the corporation, ACIS, and the corporation’s transfer agent, American Century Services, LLC.
The fund is eligible to invest in a money market fund for temporary purposes, which is managed by J.P. Morgan Investment Management, Inc. (JPMIM). The fund has a mutual funds services agreement with J.P. Morgan Investor Services Co. (JPMIS). JPMorgan Chase Bank (JPMCB) is a custodian of the fund. JPMIM, JPMIS and JPMCB are wholly owned subsidiaries of JPMorgan Chase & Co. (JPM). JPM is an equity investor in ACC. The services provided to the fund by JPMIM, JPMIS and JPMCB terminated on July 31, 2011.
4. Investment Transactions
Purchases of investment securities, excluding short-term investments, for the year ended June 30, 2011 totaled $78,864,609, of which $41,442,108 represented U.S. Treasury and Government Agency obligations.
Sales of investment securities, excluding short-term investments, for the year ended June 30, 2011 totaled $16,050,613 of which $8,113,152 represented U.S. Treasury and Government Agency obligations.
5. Capital Share Transactions
Transactions in shares of the fund were as follows:
| | | Year ended June 30, 2011 | | | Period ended June 30, 2010(1) | |
| | | Shares | | | Amount | | | Shares | | | Amount | |
| Investor Class/Shares Authorized | | | 100,000,000 | | | | | | | 100,000,000 | | | | |
| Sold | | | 5,132,386 | | | | $53,442,644 | | | | 452,024 | | | | $4,422,423 | |
| Issued in reinvestment of distributions | | | 20,247 | | | | 208,747 | | | | — | | | | — | |
| Redeemed | | | (558,637 | ) | | | (5,883,794 | ) | | | (30,387 | ) | | | (291,564 | ) |
| | | | 4,593,996 | | | | 47,767,597 | | | | 421,637 | | | | 4,130,859 | |
| Institutional Class/Shares Authorized | | | 50,000,000 | | | | | | | | 50,000,000 | | | | | |
| Sold | | | 507,900 | | | | 5,293,580 | | | | 15,000 | | | | 150,000 | |
| Issued in reinvestment of distributions | | | 2,657 | | | | 27,389 | | | | — | | | | — | |
| Redeemed | | | (18,819 | ) | | | (194,968 | ) | | | — | | | | — | |
| | | | 491,738 | | | | 5,126,001 | | | | 15,000 | | | | 150,000 | |
| A Class/Shares Authorized | | | 50,000,000 | | | | | | | | 50,000,000 | | | | | |
| Sold | | | 2,808,724 | | | | 29,927,433 | | | | 354,272 | | | | 3,487,032 | |
| Issued in reinvestment of distributions | | | 3,820 | | | | 39,392 | | | | — | | | | — | |
| Redeemed | | | (318,950 | ) | | | (3,325,657 | ) | | | (2,572 | ) | | | (25,000 | ) |
| | | | 2,493,594 | | | | 26,641,168 | | | | 351,700 | | | | 3,462,032 | |
| C Class/Shares Authorized | | | 50,000,000 | | | | | | | | 50,000,000 | | | | | |
| Sold | | | 581,308 | | | | 6,194,946 | | | | 37,204 | | | | 370,000 | |
| Issued in reinvestment of distributions | | | 191 | | | | 1,964 | | | | — | | | | — | |
| Redeemed | | | (39,398 | ) | | | (408,295 | ) | | | — | | | | — | |
| | | | 542,101 | | | | 5,788,615 | | | | 37,204 | | | | 370,000 | |
| R Class/Shares Authorized | | | 50,000,000 | | | | | | | | 50,000,000 | | | | | |
| Sold | | | 1,569 | | | | 16,618 | | | | 15,000 | | | | 150,000 | |
| Issued in reinvestment of distributions | | | 67 | | | | 693 | | | | — | | | | — | |
| Redeemed | | | (5,000 | ) | | | (51,500 | ) | | | — | | | | — | |
| | | | (3,364 | ) | | | (34,189 | ) | | | 15,000 | | | | 150,000 | |
| Net increase (decrease) | | | 8,118,065 | | | | $85,289,192 | | | | 840,541 | | | | $8,262,891 | |
| (1) | April 30, 2010 (fund inception) through June 30, 2010. |
6. Fair Value Measurements
The fund’s securities valuation process is based on several considerations and may use multiple inputs to determine the fair value of the positions held by the fund. In conformity with accounting principles generally accepted in the United States of America, the inputs used to determine a valuation are classified into three broad levels as follows:
| • | Level 1 valuation inputs consist of unadjusted quoted prices in an active market for identical securities; |
| Level 2 valuation inputs consist of direct or indirect observable market data (including quoted prices for similar securities, evaluations of subsequent market events, interest rates, prepayment speeds, credit risk, etc.); or |
| Level 3 valuation inputs consist of unobservable data (including a fund’s own assumptions). |
The level classification is based on the lowest level input that is significant to the fair valuation measurement. The valuation inputs are not necessarily an indication of the risks associated with investing in these securities or other financial instruments.
The following is a summary of the level classifications as of period end. The Schedule of Investments provides additional information on the fund’s portfolio holdings.
| | | Level 1 | | | Level 2 | | | Level 3 | |
| Investment Securities | | | | | | | | | |
| U.S. Treasury Securities | | | — | | | | $37,164,996 | | | | — | |
| Domestic Common Stocks | | | $11,049,072 | | | | 91,615 | | | | — | |
| Foreign Common Stocks | | | 2,692,944 | | | | 5,650,401 | | | | — | |
| Commodity ETFs | | | 8,895,118 | | | | — | | | | — | |
| Commercial Paper | | | — | | | | 2,999,660 | | | | — | |
| Corporate Bonds | | | — | | | | 2,332,609 | | | | — | |
| Collateralized Mortgage Obligations | | | — | | | | 1,528,372 | | | | — | |
| Commercial Mortgage-Backed Securities | | | — | | | | 1,238,989 | | | | — | |
| Temporary Cash Investments | | | 15,748,572 | | | | 5,499,995 | | | | — | |
| Total Value of Investment Securities | | | $38,385,706 | | | | $56,506,637 | | | | — | |
| | | | | | | | | | | | | |
| Other Financial Instruments | | | | | | | | | | | | |
| Forward Foreign Currency Exchange Contracts | | | — | | | | $(176,426 | ) | | | — | |
| Futures Contracts | | | $(23,623 | ) | | | — | | | | — | |
| Swap Agreements | | | — | | | | 23,437 | | | | | |
| Total Unrealized Gain (Loss) on Other Financial Instruments | | | $(23,623 | ) | | | $(152,989 | ) | | | — | |
7. Derivative Instruments
Foreign Currency Risk — The fund is subject to foreign currency exchange rate risk in the normal course of pursuing its investment objectives. The value of foreign investments held by a fund may be significantly affected by changes in foreign currency exchange rates. The dollar value of a foreign security generally decreases when the value of the dollar rises against the foreign currency in which the security is denominated and tends to increase when the value of the dollar declines against such foreign currency. A fund may enter into forward foreign currency exchange contracts to reduce a fund’s exposure to foreign currency exchange rate fluctuations, or to shift exposure to the fluctuations in the value of foreign currencies from one foreign currency to another foreign currency. The net U.S. dollar value of foreign currency underlying all contractual commitments held by a fund and the resulting unrealized appreciation or depreciation are determined daily. Realized gain or loss is recorded upon the termination of the contract. Net realized and unrealized
gains or losses occurring during the holding period of forward foreign currency exchange contracts are a component of net realized gain (loss) on foreign currency transactions and change in net unrealized appreciation (depreciation) on translation of assets and liabilities in foreign currencies, respectively. A fund bears the risk of an unfavorable change in the foreign currency exchange rate underlying the forward contract. Additionally, losses, up to the fair value, may arise if the counterparties do not perform under the contract terms. The foreign currency risk derivative instruments held at period end as disclosed on the Schedule of Investments are indicative of the fund’s typical volume during the period.
Interest Rate Risk — The fund is subject to interest rate risk in the normal course of pursuing its investment objectives. The value of bonds generally declines as interest rates rise. A fund may enter into futures contracts based on a bond index or a specific underlying security. A fund may purchase futures contracts to gain exposure to increases in market value or sell futures contracts to protect against a decline in market value. Upon entering into a futures contract, a fund will segregate cash, cash equivalents or other appropriate liquid securities on its records in amounts sufficient to meet requirements. Subsequent payments (variation margin) are made or received daily, in cash, by a fund. The variation margin is equal to the daily change in the contract value and is recorded as unrealized gains and losses. A fund recognizes a realized gain or loss when the futures contract is closed or expires. Net realized and unrealized gains or losses occurring during the holding period of futures contracts are a component of net realized gain (loss) on futures contract transactions and change in net unrealized appreciation (depreciation) on futures contracts, respectively. One of the risks of entering into futures contracts is the possibility that the change in value of the contract may not correlate with the changes in value of the underlying securities. The interest rate risk derivative instruments held at period end as disclosed on the Schedule of Investments are indicative of the fund’s typical volume during the period.
Other Contracts — A fund may enter into total return swap agreements in order to attempt to obtain or preserve a particular return or spread at a lower cost than obtaining a return or spread through purchases and/or sales of instruments in other markets or gain exposure to certain markets in the most economical way possible. A fund will segregate cash, cash equivalents or other appropriate liquid securities on its records in amounts sufficient to meet requirements. Changes in value, including the periodic amounts of interest to be paid or received on swap agreements, are recorded as unrealized appreciation (depreciation) on swap agreements. Realized gain or loss is recorded upon receipt or payment of a periodic settlement or termination of swap agreements. Net realized and unrealized gains or losses occurring during the holding period of swap agreements are a component of net realized gain (loss) on swap agreement transactions and change in net unrealized appreciation (depreciation) on swap agreements, respectively. The risks of entering into swap agreements include the possible lack of liquidity, failure of the counterparty to meet its obligations, and that there may be unfavorable changes in the underlying investments or instruments. The fund began investing in other contracts derivative instruments in January 2011. The other contracts derivative instruments held at period end as disclosed on the Schedule of Investments are indicative of the fund’s typical volume since January 2011.
Value of Derivative Instruments as of June 30, 2011 | |
| | Asset Derivatives | | | Liability Derivatives | |
Type of Risk Exposure | Location on Statement of Assets and Liabilities | | Value | | | Location on Statement of Assets and Liabilities | | Value | |
| Foreign Currency Risk | Unrealized gain on forward foreign currency exchange contracts | | | $109,355 | | | Unrealized loss on forward foreign currency exchange contracts | | | $285,781 | |
| Interest Rate Risk | Receivable for variation margin on futures contracts | | | 484 | | | Payable for variation margin on futures contracts | | | 5,313 | |
| Other Contracts | Swap agreements | | | 28,081 | | | Swap agreements | | | 4,644 | |
| | | | | $137,920 | | | | | | $295,738 | |
Effect of Derivative Instruments on the Statement of Operations for the Year Ended June 30, 2011 | |
| | Net Realized Gain (Loss) | | | Change in Net Unrealized Appreciation (Depreciation) | |
Type of Risk Exposure | Location on Statement of Operations | | Value | | | Location on Statement of Operations | | Value | |
| Foreign Currency Risk | Net realized gain (loss) on foreign currency transactions | | | $970,073 | | | Change in net unrealized appreciation (depreciation) on translation of assets and liabilities in foreign currencies | | | $(156,091 | ) |
| Interest Rate Risk | Net realized gain (loss) on futures contract transactions | | | (41,558 | ) | | Change in net unrealized appreciation (depreciation) on futures contracts | | | (24,504 | ) |
| Other Contracts | Net realized gain (loss) on swap agreement transactions | | | — | | | Change in net unrealized appreciation (depreciation) on swap agreements | | | 23,437 | |
| | | | | $928,515 | | | | | | $(157,158 | ) |
8. Risk Factors
The fund may concentrate its investments in a narrow segment of the total market. Because of this, the fund may be subject to greater risk and market fluctuations than a portfolio representing a broader range of industries.
There are certain risks involved in investing in foreign securities. These risks include those resulting from future adverse political, social, and economic developments, fluctuations in currency exchange rates, the possible imposition of exchange controls, and other foreign laws or restrictions. Investing in emerging markets may accentuate these risks.
There are certain risks involved with investing in forward foreign currency exchange contracts. Changes in the value of foreign currencies against the U.S. dollar could result in gains or losses to the fund. The value of a share of the fund is determined in U.S. dollars. As a result, the fund could recognize a gain or loss based solely upon a change in the exchange rate between the foreign currency and the U.S. dollar. Changes in exchange rates may increase losses and lower gains from the fund’s investments. The overall impact on the fund may be significant depending on the currencies represented in the portfolio and how each one appreciates or depreciates in relation to the U.S. dollar. Currency trends are unpredictable and exchange rates in foreign currencies may fluctuate significantly over short periods of time for a number of reasons, including changes in interest rates, intervention (or the failure to intervene) by U.S. or foreign governments, central banks or supranational entities, or by the imposition of currency controls or other political developments in the United States or abroad.
The fund’s commodity-related investments may be subject to greater volatility than investments in traditional securities. The value of the fund’s commodity-related investments may be affected by changes in overall market movements, interest rate changes, and volatility in commodity-related indices. The value of these investments may also be affected by factors affecting a particular commodity, such as weather, disease, embargoes, tariffs, taxes and economic, political and regulatory developments.
9. Federal Tax Information
The tax character of distributions paid during the year ended June 30, 2011 and the period April 30, 2010 (fund inception) through June 30, 2010 were as follows:
| | | 2011 | | | 2010 | |
| Distributions Paid From | | | | | | |
| Ordinary income | | | $332,567 | | | | — | |
| Long-term capital gains | | | $2,325 | | | | — | |
The book-basis character of distributions made during the year from net investment income or net realized gains may differ from their ultimate characterization for federal income tax purposes. These differences reflect the differing character of certain income items and net realized gains and losses for financial statement and tax purposes, and may result in reclassification among certain capital accounts on the financial statements.
As of June 30, 2011, the federal tax cost of investments and the components of distributable earnings on a tax-basis were as follows:
| Federal tax cost of investments | | | $94,025,851 | |
| Gross tax appreciation of investments | | | $1,562,934 | |
| Gross tax depreciation of investments | | | (696,442 | ) |
| Net tax appreciation (depreciation) of investments | | | $866,492 | |
| Net tax appreciation (depreciation) on derivatives and translation of assets and liabilities in foreign currencies | | | $17,523 | |
| Other book-to-tax adjustments | | | $(17,780 | ) |
| Net tax appreciation (depreciation) | | | $866,235 | |
| Undistributed ordinary income | | | $1,337,976 | |
| Accumulated long-term gains | | | $77,477 | |
The difference between book-basis and tax-basis cost and unrealized appreciation (depreciation) is attributable primarily to the tax deferral of losses on wash sales and the realization for tax purposes of unrealized gains (losses) on certain forward foreign currency exchange contracts, futures contracts and investments in passive foreign investment companies. Other book-to-tax adjustments are attributable primarily to the tax deferral of losses on straddle positions.
On December 22, 2010, the Regulated Investment Company Modernization Act of 2010 (the “Act”) was enacted, which changed various technical rules governing the tax treatment of regulated investment companies. The changes are generally effective for taxable years beginning after the date of enactment. Under the Act, the fund will be permitted to carry forward capital losses incurred in taxable years beginning after the date of enactment for an unlimited period.
| Investor Class | |
| For a Share Outstanding Throughout the Years Ended June 30 (except as noted) | |
| | | 2011 | | | 2010(1) | |
| Per-Share Data | |
| Net Asset Value, Beginning of Period | | | $9.59 | | | | $10.00 | |
| Income From Investment Operations | | | | | | | | |
Net Investment Income (Loss)(2) | | | 0.12 | | | | 0.01 | |
| Net Realized and Unrealized Gain (Loss) | | | 1.10 | | | | (0.42 | ) |
| Total From Investment Operations | | | 1.22 | | | | (0.41 | ) |
| Distributions | | | | | | | | |
| From Net Investment Income | | | (0.10 | ) | | | — | |
| From Net Realized Gains | | | — | (3) | | | — | |
| Total Distributions | | | (0.10 | ) | | | — | |
| Net Asset Value, End of Period | | | $10.71 | | | | $9.59 | |
| | | | | | | | | |
Total Return(4) | | | 12.78 | % | | | (4.10 | )% |
| | | | | | | | | |
| Ratios/Supplemental Data | |
Ratio of Operating Expenses to Average Net Assets(5) | | | 0.95 | % | | | 0.95 | %(6) |
Ratio of Operating Expenses to Average Net Assets (Before Expense Waiver)(5) | | | 1.09 | % | | | 1.09 | %(6) |
| Ratio of Net Investment Income (Loss) to Average Net Assets | | | 1.27 | % | | | 0.79 | %(6) |
Ratio of Net Investment Income (Loss) to Average Net Assets (Before Expense Waiver) | | | 1.13 | % | | | 0.65 | %(6) |
| Portfolio Turnover Rate | | | 52 | % | | | 0 | % |
| Net Assets, End of Period (in thousands) | | | $53,696 | | | | $4,044 | |
| (1) | April 30, 2010 (fund inception) through June 30, 2010. |
| (2) | Computed using average shares outstanding throughout the period. |
| (3) | Per-share amount was less than $0.005. |
| (4) | Total returns are calculated based on the net asset value of the last business day. Total returns for periods less than one year are not annualized. |
| (5) | Ratio of operating expenses to average net assets does not include any fees and expenses of the acquired funds. |
See Notes to Financial Statements.
| Institutional Class | |
| For a Share Outstanding Throughout the Years Ended June 30 (except as noted) | |
| | | 2011 | | | 2010(1) | |
| Per-Share Data | |
| Net Asset Value, Beginning of Period | | | $9.59 | | | | $10.00 | |
| Income From Investment Operations | | | | | | | | |
Net Investment Income (Loss)(2) | | | 0.15 | | | | 0.02 | |
| Net Realized and Unrealized Gain (Loss) | | | 1.09 | | | | (0.43 | ) |
| Total From Investment Operations | | | 1.24 | | | | (0.41 | ) |
| Distributions | | | | | | | | |
| From Net Investment Income | | | (0.12 | ) | | | — | |
| From Net Realized Gains | | | — | (3) | | | — | |
| Total Distributions | | | (0.12 | ) | | | — | |
| Net Asset Value, End of Period | | | $10.71 | | | | $9.59 | |
| | | | | | | | | |
Total Return(4) | | | 12.93 | % | | | (4.10 | )% |
| | | | | | | | | |
| Ratios/Supplemental Data | |
Ratio of Operating Expenses to Average Net Assets(5) | | | 0.75 | % | | | 0.75 | %(6) |
Ratio of Operating Expenses to Average Net Assets (Before Expense Waiver)(5) | | | 0.89 | % | | | 0.89 | %(6) |
| Ratio of Net Investment Income (Loss) to Average Net Assets | | | 1.47 | % | | | 0.99 | %(6) |
Ratio of Net Investment Income (Loss) to Average Net Assets (Before Expense Waiver) | | | 1.33 | % | | | 0.85 | %(6) |
| Portfolio Turnover Rate | | | 52 | % | | | 0 | % |
| Net Assets, End of Period (in thousands) | | | $5,428 | | | | $144 | |
| (1) | April 30, 2010 (fund inception) through June 30, 2010. |
| (2) | Computed using average shares outstanding throughout the period. |
| (3) | Per-share amount was less than $0.005. |
| (4) | Total returns are calculated based on the net asset value of the last business day. Total returns for periods less than one year are not annualized. |
| (5) | Ratio of operating expenses to average net assets does not include any fees and expenses of the acquired funds. |
See Notes to Financial Statements.
| A Class | |
| For a Share Outstanding Throughout the Years Ended June 30 (except as noted) | |
| | | 2011 | | | 2010(1) | |
| Per-Share Data | |
| Net Asset Value, Beginning of Period | | | $9.58 | | | | $10.00 | |
| Income From Investment Operations | | | | | | | | |
Net Investment Income (Loss)(2) | | | 0.13 | | | | 0.01 | |
| Net Realized and Unrealized Gain (Loss) | | | 1.06 | | | | (0.43 | ) |
| Total From Investment Operations | | | 1.19 | | | | (0.42 | ) |
| Distributions | | | | | | | | |
| From Net Investment Income | | | (0.08 | ) | | | — | |
| From Net Realized Gains | | | — | (3) | | | — | |
| Total Distributions | | | (0.08 | ) | | | — | |
| Net Asset Value, End of Period | | | $10.69 | | | | $9.58 | |
| | | | | | | | | |
Total Return(4) | | | 12.50 | % | | | (4.20 | )% |
| | | | | | | | | |
| Ratios/Supplemental Data | |
Ratio of Operating Expenses to Average Net Assets(5) | | | 1.20 | % | | | 1.20 | %(6) |
Ratio of Operating Expenses to Average Net Assets (Before Expense Waiver)(5) | | | 1.34 | % | | | 1.34 | %(6) |
| Ratio of Net Investment Income (Loss) to Average Net Assets | | | 1.02 | % | | | 0.54 | %(6) |
Ratio of Net Investment Income (Loss) to Average Net Assets (Before Expense Waiver) | | | 0.88 | % | | | 0.40 | %(6) |
| Portfolio Turnover Rate | | | 52 | % | | | 0 | % |
| Net Assets, End of Period (in thousands) | | | $30,416 | | | | $3,370 | |
| (1) | April 30, 2010 (fund inception) through June 30, 2010. |
| (2) | Computed using average shares outstanding throughout the period. |
| (3) | Per-share amount was less than $0.005. |
| (4) | Total returns are calculated based on the net asset value of the last business day and do not reflect applicable sales charges. Total returns for periods less than one year are not annualized. |
| (5) | Ratio of operating expenses to average net assets does not include any fees and expenses of the acquired funds. |
See Notes to Financial Statements.
| C Class | |
| For a Share Outstanding Throughout the Years Ended June 30 (except as noted) | |
| | | 2011 | | | 2010(1) | |
| Per-Share Data | |
| Net Asset Value, Beginning of Period | | | $9.57 | | | | $10.00 | |
| Income From Investment Operations | | | | | | | | |
Net Investment Income (Loss)(2) | | | 0.08 | | | | — | (3) |
| Net Realized and Unrealized Gain (Loss) | | | 1.03 | | | | (0.43 | ) |
| Total From Investment Operations | | | 1.11 | | | | (0.43 | ) |
| Distributions | | | | | | | | |
| From Net Investment Income | | | (0.03 | ) | | | — | |
| From Net Realized Gains | | | — | (3) | | | — | |
| Total Distributions | | | (0.03 | ) | | | — | |
| Net Asset Value, End of Period | | | $10.65 | | | | $9.57 | |
| | | | | | | | | |
Total Return(4) | | | 11.64 | % | | | (4.30 | )% |
| | | | | | | | | |
| Ratios/Supplemental Data | |
Ratio of Operating Expenses to Average Net Assets(5) | | | 1.95 | % | | | 1.95 | %(6) |
Ratio of Operating Expenses to Average Net Assets (Before Expense Waiver)(5) | | | 2.09 | % | | | 2.09 | %(6) |
| Ratio of Net Investment Income (Loss) to Average Net Assets | | | 0.27 | % | | | (0.21 | )%(6) |
Ratio of Net Investment Income (Loss) to Average Net Assets (Before Expense Waiver) | | | 0.13 | % | | | (0.35 | )%(6) |
| Portfolio Turnover Rate | | | 52 | % | | | 0 | % |
| Net Assets, End of Period (in thousands) | | | $6,167 | | | | $356 | |
| (1) | April 30, 2010 (fund inception) through June 30, 2010. |
| (2) | Computed using average shares outstanding throughout the period. |
| (3) | Per-share amount was less than $0.005. |
| (4) | Total returns are calculated based on the net asset value of the last business day and do not reflect applicable sales charges. Total returns for periods less than one year are not annualized. |
| (5) | Ratio of operating expenses to average net assets does not include any fees and expenses of the acquired funds. |
See Notes to Financial Statements.
| R Class | |
| For a Share Outstanding Throughout the Years Ended June 30 (except as noted) | |
| | | 2011 | | | 2010(1) | |
| Per-Share Data | |
| Net Asset Value, Beginning of Period | | | $9.58 | | | | $10.00 | |
| Income From Investment Operations | | | | | | | | |
Net Investment Income (Loss)(2) | | | 0.01 | | | | 0.01 | |
| Net Realized and Unrealized Gain (Loss) | | | 1.15 | | | | (0.43 | ) |
| Total From Investment Operations | | | 1.16 | | | | (0.42 | ) |
| Distributions | | | | | | | | |
| From Net Investment Income | | | (0.07 | ) | | | — | |
| From Net Realized Gains | | | — | (3) | | | — | |
| Total Distributions | | | (0.07 | ) | | | — | |
| Net Asset Value, End of Period | | | $10.67 | | | | $9.58 | |
| | | | | | | | | |
Total Return(4) | | | 12.10 | % | | | (4.20 | )% |
| | | | | | | | | |
| Ratios/Supplemental Data | |
Ratio of Operating Expenses to Average Net Assets(5) | | | 1.45 | % | | | 1.45 | %(6) |
Ratio of Operating Expenses to Average Net Assets (Before Expense Waiver)(5) | | | 1.59 | % | | | 1.59 | %(6) |
| Ratio of Net Investment Income (Loss) to Average Net Assets | | | 0.77 | % | | | 0.29 | %(6) |
Ratio of Net Investment Income (Loss) to Average Net Assets (Before Expense Waiver) | | | 0.63 | % | | | 0.15 | %(6) |
| Portfolio Turnover Rate | | | 52 | % | | | 0 | % |
| Net Assets, End of Period (in thousands) | | | $124 | | | | $144 | |
| (1) | April 30, 2010 (fund inception) through June 30, 2010. |
| (2) | Computed using average shares outstanding throughout the period. |
| (3) | Per-share amount was less than $0.005. |
| (4) | Total returns are calculated based on the net asset value of the last business day. Total returns for periods less than one year are not annualized. |
| (5) | Ratio of operating expenses to average net assets does not include any fees and expenses of the acquired funds. |
See Notes to Financial Statements.
Report of Independent Registered Public Accounting Firm |
To the Directors of the American Century Quantitative Equity Funds, Inc.
and Shareholders of the Strategic Inflation Opportunities Fund:
In our opinion, the accompanying statement of assets and liabilities, including the schedule of investments, and the related statements of operations and of changes in net assets and the financial highlights present fairly, in all material respects, the financial position of the Strategic Inflation Opportunities Fund (one of the eleven funds comprising the American Century Quantitative Equity Funds, Inc., hereafter referred to as the “Fund”) at June 30, 2011, the results of its operations for the year then ended, and the changes in its net assets and the financial highlights for the year then ended and for the period April 30, 2010 (commencement of operations) through June 30, 2010, in conformity with accounting principles generally accepted in the United States of America. These financial statements and financial highlights (hereafter referred to as “financial statements”) are the responsibility of the Fund’s management; our responsibility is to express an opinion on these financial statements based on our audits. We conducted our audits of these financial statements in accordance with the standards of the Public Company Accounting Oversight Board (United States). Those standards require that we plan and perform the audit to obtain reasonable assurance about whether the financial statements are free of material misstatement. An audit includes examining, on a test basis, evidence supporting the amounts and disclosures in the financial statements, assessing the accounting principles used and significant estimates made by management, and evaluating the overall financial statement presentation. We believe that our audits, which included confirmation of securities at June 30, 2011 by correspondence with the custodian and brokers, provide a reasonable basis for our opinion.
PricewaterhouseCoopers LLP
Kansas City, Missouri
August 18, 2011
The individuals listed below serve as directors of the funds. Each director will continue to serve in this capacity until death, retirement, resignation or removal from office. The mandatory retirement age for directors who are not “interested persons,” as that term is defined in the Investment Company Act (independent directors), is 73. However, the mandatory retirement age may be extended for a period not to exceed two years with the approval of the remaining independent directors.
Mr. Thomas is the only director who is an “interested person” because he currently serves as President and Chief Executive Officer of American Century Companies, Inc. (ACC), the parent company of American Century Investment Management, Inc. (ACIM or the advisor).
The other directors (more than three-fourths of the total number) are independent; that is, they have never been employees, directors or officers of, and have no financial interest in, ACC or any of its wholly owned, direct or indirect, subsidiaries, including ACIM, American Century Investment Services, Inc. (ACIS) and American Century Services, LLC (ACS). The directors serve in this capacity for eight (in the case of Mr. Thomas, 15) registered investment companies in the American Century Investments family of funds.
The following presents additional information about the directors. The mailing address for each director other than Mr. Thomas is 1665 Charleston Road, Mountain View, California 94043. The mailing address for Mr. Thomas is 4500 Main Street, Kansas City, Missouri 64111.
Name (Year of Birth) | Position(s) Held with Funds | Length of Time Served | Principal Occupation(s) During Past 5 Years | | Number of American Century Portfolios Overseen by Director | Other Directorships Held During Past 5 Years |
| Independent Directors |
| Tanya S. Beder (1955) | Director | Since 2011 | Chairman, SBCC Group Inc. (investment advisory services)(2006 to present); Fellow in Practice, International Center for Finance, Yale University School of Management (1985 to present); Chief Executive Officer, Tribeca Global Management LLC (asset management firm) (2004 to 2006) | | 40 | None |
| Jeremy I. Bulow (1954) | Director | Since 2011 | Professor of Economics, Stanford University, Graduate School of Business (1979 to present) | | 40 | None |
| John Freidenrich (1937) | Director | Since 2005 | Founder, Member and Manager, Regis Management Company, LLC (investment management firm) (April 2004 to present) | | 40 | None |
Name (Year of Birth) | Position(s) Held with Funds | Length of Time Served | Principal Occupation(s) During Past 5 Years | | Number of American Century Portfolios Overseen by Director | Other Directorships Held During Past 5 Years |
| Independent Directors |
| Ronald J. Gilson (1946) | Director and Chairman of the Board | Since 1995 | Charles J. Meyers Professor of Law and Business, Stanford Law School (1979 to present); Marc and Eva Stern Professor of Law and Business, Columbia University School of Law (1992 to present) | | 40 | None |
| Frederick L. A. Grauer (1946) | Director | Since 2008 | Senior Advisor, BlackRock, Inc. (investment management firm) (2010 to 2011); Senior Advisor, Barclays Global Investors (investment management firm) (2003 to 2009) | | 40 | None |
| Peter F. Pervere (1947) | Director | Since 2007 | Retired | | 40 | Intraware, Inc. (2003 to 2009) |
| Myron S. Scholes (1941) | Director | Since 1980 | Chairman, Platinum Grove Asset Management, L.P. (asset manager) (1999 to 2009); Frank E. Buck Professor of Finance-Emeritus, Stanford Graduate School of Business (1996 to present) | | 40 | Dimensional Fund Advisors (investment advisor); CME Group, Inc. (futures and options exchange) |
| John B. Shoven (1947) | Director | Since 2002 | Professor of Economics, Stanford University (1973 to present) | | 40 | Cadence Design Systems; Exponent; Financial Engines; Watson Wyatt Worldwide (2002 to 2006) |
| |
| Interested Director |
| Jonathan S. Thomas (1963) | Director and President | Since 2007 | President and Chief Executive Officer, ACC (March 2007 to present); Chief Administrative Officer, ACC (February 2006 to February 2007); Executive Vice President, ACC (November 2005 to February 2007). Also serves as: Chief Executive Officer and Manager, ACS; Executive Vice President, ACIM; Director, ACC, ACIM and other ACC subsidiaries | | 104 | None |
Officers
The following table presents certain information about the executive officers of the funds. Each officer serves as an officer for each of the 15 investment companies in the American Century family of funds, unless otherwise noted. No officer is compensated for his or her service as an officer of the funds. The listed officers are interested persons of the funds and are appointed or re-appointed on an annual basis. The mailing address for each of the officers listed below is 4500 Main Street, Kansas City, Missouri 64111.
Name (Year of Birth) | Offices with the Funds | | Principal Occupation(s) During the Past Five Years |
Jonathan S. Thomas (1963) | Director and President since 2007 | | President and Chief Executive Officer, ACC (March 2007 to present); Chief Administrative Officer, ACC (February 2006 to February 2007); Executive Vice President, ACC (November 2005 to February 2007). Also serves as: Chief Executive Officer and Manager, ACS; Executive Vice President, ACIM; Director, ACC, ACIM and other ACC subsidiaries |
Barry Fink (1955) | Executive Vice President since 2007 | | Chief Operating Officer and Executive Vice President, ACC (September 2007 to present); President, ACS (October 2007 to present); Managing Director, Morgan Stanley (2000 to 2007); Global General Counsel, Morgan Stanley (2000 to 2006). Also serves as: Manager, ACS and Director, ACC and certain ACC subsidiaries |
Maryanne L. Roepke (1956) | Chief Compliance Officer since 2006 and Senior Vice President since 2000 | | Chief Compliance Officer, American Century funds, ACIM and ACS (August 2006 to present); Assistant Treasurer, ACC (January 1995 to August 2006); and Treasurer and Chief Financial Officer, various American Century funds (July 2000 to August 2006). Also serves as: Senior Vice President, ACS |
| Charles A. Etherington (1957) | General Counsel since 2007 and Senior Vice President since 2006 | | Attorney, ACC (February 1994 to present); Vice President, ACC (November 2005 to present), General Counsel, ACC (March 2007 to present); Also serves as General Counsel, ACIM, ACS, ACIS and other ACC subsidiaries; and Senior Vice President, ACIM and ACS |
| Robert J. Leach (1966) | Vice President, Treasurer and Chief Financial Officer since 2006 | | Vice President, ACS (February 2000 to present); and Controller, various American Century funds (1997 to September 2006) |
| David H. Reinmiller (1963) | Vice President since 2001 | | Attorney, ACC (January 1994 to present); Associate General Counsel, ACC (January 2001 to present); Also serves as Vice President, ACIM and ACS |
| Ward D. Stauffer (1960) | Secretary since 2005 | | Attorney, ACC (June 2003 to present) |
The Statement of Additional Information has additional information about the fund’s directors and is available without charge, upon request, by calling 1-800-345-2021.
| Approval of Management Agreement |
At a meeting held on June 28, 2011, the Fund’s Board of Directors/Trustees unanimously approved the renewal of the management agreement pursuant to which American Century Investment Management, Inc. (the “Advisor”) acts as the investment advisor for the Fund. Under Section 15(c) of the Investment Company Act, contracts for investment advisory services are required to be reviewed, evaluated, and approved by a majority of a fund’s independent
directors/trustees (the “Directors”) each year.
As a part of the approval process, the Board requested and reviewed extensive data and information compiled by the Advisor and certain independent providers of evaluation data concerning the Fund and the services provided to the Fund by the Advisor. This review was in addition to the oversight and evaluation undertaken by the Board and its committees on a continuous basis throughout the year and included, but was not limited to the following:
| the nature, extent, and quality of investment management, shareholder services, and other services provided by the Advisor to the Fund; |
| the wide range of other programs and services the Advisor provides to the Fund and its shareholders on a routine and non-routine basis; |
| the investment performance of the fund, including data comparing the Fund’s performance to appropriate benchmarks and/or a peer group of other mutual funds with similar investment objectives and strategies; |
| data comparing the cost of owning the Fund to the cost of owning similar funds; |
| the Advisor’s compliance policies, procedures, and regulatory experience; |
| financial data showing the cost of services provided to the Fund, the profitability of the Fund to the Advisor, and the overall profitability of the Advisor; |
| data comparing services provided and charges to other investment management clients of the Advisor; and |
| consideration of collateral benefits derived by the Advisor from the management of the Fund and any potential economies of scale relating thereto. |
In keeping with its practice, the Board held two in-person meetings and one telephonic meeting to review and discuss the information provided. The Board also had the benefit of the advice of its independent counsel throughout the period.
Factors Considered
The Directors considered all of the information provided by the Advisor, the independent data providers, and the Board’s independent counsel, and evaluated such information for the Fund. In connection with their review, the Directors did not identify any single factor as being all-important or controlling, and each Director may have attributed different levels of importance to different factors. In deciding to renew the management agreement, the Board based its decision on a number of factors, including the following:
Nature, Extent and Quality of Services — Generally. Under the management agreement, the Advisor is responsible for providing or arranging for all services necessary for the operation of the Fund. The Board noted that under the management agreement, the Advisor provides or arranges at its own expense a wide variety of services including:
| constructing and designing the Fund |
| portfolio research and security selection |
| initial capitalization/funding |
| daily valuation of the Fund’s portfolio |
| shareholder servicing and transfer agency, including shareholder confirmations, recordkeeping, and communications |
| regulatory and portfolio compliance |
| marketing and distribution |
The Board noted that many of these services have expanded over time both in terms of quantity and complexity in response to shareholder demands, competition in the industry, changing distribution channels, and the changing regulatory environment.
Investment Management Services. The nature of the investment management services provided to the Fund is quite complex and allows Fund shareholders access to professional money management, instant diversification of their investments within an asset class, the opportunity to easily diversify among asset classes by investing in or exchanging among various American Century Investments funds, and liquidity. In evaluating investment performance, the Board expects the Advisor to manage the Fund in accordance with its investment objectives and approved strategies. Further, the Directors recognize that the Advisor has an obligation to seek the best execution of fund trades. In providing these services, the Advisor utilizes teams of investment professionals (portfolio managers, analysts, research assistants, and securities traders) who require extensive information technology, research, training, compliance and other systems to conduct their business. The Board, directly and through its Portfolio Committee, regularly reviews investment performance information for the Fund, together with comparative information for appropriate benchmarks and/or peer groups of similarly-managed funds, over different time horizons. The Directors also review detailed performance information during the management agreement approval
process. If performance concerns are identified, the Fund receives special reviews until performance improves, during which the Board discusses with the Advisor the reasons for such results (e.g., market conditions, security selection) and any efforts being undertaken to improve performance. The Board found the investment management services provided by the Advisor to the Fund to meet or exceed industry standards. More detailed information about the Fund’s performance can be found in the Performance and Portfolio Commentary sections of this report.
Shareholder and Other Services. Under the management agreement, the Advisor provides the Fund with a comprehensive package of transfer agency, shareholder, and other services. The Board, directly and through various committees of the Board, regularly reviews reports and evaluations of such services at its regular meetings. These reports include, but are not limited to, information regarding the operational efficiency and accuracy of the shareholder and transfer agency services provided, staffing levels, shareholder satisfaction (as measured by external as well as internal sources), technology support, new products and services offered to Fund shareholders, securities trading activities, portfolio valuation services, auditing services, and legal and operational compliance activities. Certain aspects of shareholder and transfer agency service level efficiency and the quality of securities trading activities are measured by independent third party providers and are presented in comparison to other fund groups not managed by the Advisor. The Board found the services provided by the Advisor to the Fund under the management agreement to be competitive and of high quality.
Costs of Services and Profitability. The Advisor provides detailed information concerning its cost of providing various services to the Fund, its profitability in managing the Fund, its overall profitability, and its financial condition. The Directors have reviewed with the Advisor the methodology used to prepare this financial information. The financial information regarding the Advisor is considered in evaluating the Advisor’s financial condition, ability to continue to provide services under the management agreement, and the reasonableness of the current management fee. The Board concluded that the Advisor’s profits were reasonable in light of the services provided to the Fund.
Ethics. The Board generally considers the Advisor’s commitment to providing quality services to shareholders and to conducting its business ethically. They noted that the Advisor’s practices generally meet or exceed industry best practices.
Economies of Scale. The Board also reviewed information provided by the Advisor regarding the possible existence of economies of scale in connection with the management of the Fund. The Board concluded that economies of scale are difficult to measure and predict with precision, especially on a fund-by-fund basis. The Board concluded that the Advisor is appropriately sharing economies of scale through its competitive fee structure, offering competitive fees from fund inception, and through reinvestment in its business to provide shareholders additional content and services.
Comparison to Other Funds’ Fees. The management agreement provides that the Fund pay the Advisor a single, all-inclusive (or unified) management fee for providing all services necessary for the management and operation of the Fund, other than brokerage expenses, taxes, interest, extraordinary expenses, and the fees and expenses of the Fund’s independent directors (including their independent legal counsel) and expenses incurred in connection with the provision of shareholder services and distribution services under a plan adopted pursuant to Rule 12b-1 under the 1940 Act. Under the unified fee structure, the Advisor is responsible for providing all investment advisory, custody, audit, administrative, compliance, recordkeeping, marketing and shareholder services, or arranging and supervising third parties to provide such services. By contrast, most other funds are charged a variety of fees, including an investment advisory fee, a transfer agency fee, an administrative fee, distribution charges and other expenses. Other than their investment advisory fees and any applicable Rule 12b-1 distribution fees, all other components of the total fees charged by these other funds may be increased without shareholder approval. The Board believes the unified fee structure is a benefit to Fund shareholders because it clearly discloses to shareholders the cost of owning Fund shares, and, since the unified fee cannot be increased without a vote of Fund shareholders, it shifts to the Advisor the risk of increased costs of operating the Fund and provides a direct incentive to minimize administrative inefficiencies. Part of the Board’s analysis of fee levels involves reviewing certain evaluative data compiled by an independent provider and comparing the Fund’s unified fee to the total expense ratio of other funds in the Fund’s peer group. The Board concluded that the management fee paid by the Fund to the Advisor under the management agreement is reasonable in light of the services provided to the Fund.
Comparison to Fees and Services Provided to Other Clients of the Advisor. The Board also requested and received information from the Advisor concerning the nature of the services, fees, costs and profitability of its advisory services to advisory clients other than the Fund. They observed that these varying types of client accounts require different services and involve different regulatory and entrepreneurial risks than the management of the Fund. The Board analyzed this information and concluded that the fees charged and services provided to the Fund were reasonable by comparison.
Collateral or “Fall-Out” Benefits Derived by the Advisor. The Board considered the existence of collateral benefits the Advisor may receive as a result of its relationship with the Fund. They concluded that the Advisor’s primary business is managing mutual funds and it generally does not use fund or shareholder information to generate profits in other lines of business, and therefore does not derive any significant collateral benefits from them. The Board noted that the Advisor receives proprietary research from broker-dealers that execute fund portfolio transactions and concluded that this research is likely to benefit Fund shareholders. The Board also determined that the Advisor is able to provide investment management services to certain clients other than the Fund, at least in part, due to its existing infrastructure built to serve the fund complex. The Board concluded, however, that the assets of those other clients are not material to the analysis and, where applicable, may be included with the assets of the Fund to determine breakpoints in the management fee schedule.
Existing Relationship. The Board also considered whether there was any reason for not continuing the existing arrangement with the Advisor. In this regard, the Board was mindful of the potential disruptions of the Fund’s operations and various risks, uncertainties, and other effects that could occur as a result of a decision not to continue such relationship. In particular, the Board recognized that most shareholders have invested in the Fund on the strength of the Advisor’s industry standing and reputation and in the expectation that the Advisor will have a continuing role in providing advisory services to the Fund.
Conclusion of the Directors. As a result of this process, the Board, including all of the independent directors and assisted by the advice of independent legal counsel, taking into account all of the factors discussed above and the information provided by the Advisor and others, concluded that the management agreement between the Fund and the Advisor is fair and reasonable in light of the services provided and should be renewed.
Retirement Account Information
As required by law, distributions you receive from certain IRAs, or 403(b), 457 and qualified plans are subject to federal income tax withholding, unless you elect not to have withholding apply. Tax will be withheld on the total amount withdrawn even though you may be receiving amounts that are not subject to withholding, such as nondeductible contributions. In such case, excess amounts of withholding could occur. You may adjust your withholding election so that a greater or lesser amount will be withheld.
If you don’t want us to withhold on this amount, you must notify us to not withhold the federal income tax. You may notify us in writing or in certain situations by telephone or through other electronic means. You have the right to revoke your withholding election at any time and any election you make may remain in effect until revoked by filing a new election.
Remember, even if you elect not to have income tax withheld, you are liable for paying income tax on the taxable portion of your withdrawal. If you elect not to have income tax withheld or you don’t have enough income tax withheld, you may be responsible for payment of estimated tax. You may incur penalties under the estimated tax rules if your withholding and estimated tax payments are not sufficient. You can reduce or defer the income tax on a distribution by directly or indirectly rolling such distribution over to another IRA or eligible plan. You should consult your tax advisor for additional information.
State tax will be withheld if, at the time of your distribution, your address is within one of the mandatory withholding states and you have federal income tax withheld. State taxes will be withheld from your distribution in accordance with the respective state rules.
Proxy Voting Guidelines
American Century Investment Management, Inc., the fund’s investment advisor, is responsible for exercising the voting rights associated with the securities purchased and/or held by the fund. A description of the policies and procedures the advisor uses in fulfilling this responsibility is available without charge, upon request, by calling 1-800-345-2021. It is also available on American Century Investments’ website at americancentury.com and on the Securities and Exchange Commission’s website at sec.gov. Information regarding how the investment advisor voted proxies relating to portfolio securities during the most recent 12-month period ended June 30 is available on the “About Us” page at americancentury.com. It is also available at sec.gov.
Quarterly Portfolio Disclosure
The fund files its complete schedule of portfolio holdings with the Securities and Exchange Commission (SEC) for the first and third quarters of each fiscal year on Form N-Q. The fund’s Forms N-Q are available on the SEC’s website at sec.gov, and may be reviewed and copied at the SEC’s Public Reference Room in Washington, DC. Information on the operation of the Public Reference Room may be obtained by calling 1-800-SEC-0330. The fund also makes its complete schedule of portfolio holdings for the most recent quarter of its fiscal year available on its website at americancentury.com and, upon request, by calling 1-800-345-2021.
Other Tax Information
The following information is provided pursuant to provisions of the Internal Revenue Code.
The fund hereby designates up to the maximum amount allowable as qualified dividend income for the fiscal year ended June 30, 2011.
For corporate taxpayers, the fund hereby designates $63,638, or up to the maximum amount allowable, of ordinary income distributions paid during the fiscal year ended June 30, 2011 as qualified for the corporate dividends received deduction.
The fund hereby designates $2,325, or up to the maximum amount allowable, as long-term capital gain distributions for the fiscal year ended June 30, 2011.
| Contact Us | americancentury.com |
| Automated Information Line | 1-800-345-8765 |
| Investor Services Representative | 1-800-345-2021 or 816-531-5575 |
| Investors Using Advisors | 1-800-378-9878 |
| Business, Not-For-Profit, Employer-Sponsored Retirement Plans | 1-800-345-3533 |
| Banks and Trust Companies, Broker-Dealers, Financial Professionals, Insurance Companies | 1-800-345-6488 |
| Telecommunications Device for the Deaf | 1-800-634-4113 |
American Century Quantitative Equity Funds, Inc.
Investment Advisor:
American Century Investment Management, Inc.
Kansas City, Missouri
This report and the statements it contains are submitted for the general information of our shareholders. The report is not authorized for distribution to prospective investors unless preceded or accompanied by an effective prospectus.
©2011 American Century Proprietary Holdings, Inc. All rights reserved.
CL-ANN-72461 1108
ANNUAL REPORT JUNE 30, 2011
| President’s Letter | 2 |
| Market Perspective | 3 |
| Performance | 4 |
| Portfolio Commentary | 5 |
| Fund Characteristics | 7 |
| Shareholder Fee Example | 8 |
| Schedule of Investments | 10 |
| Statement of Assets and Liabilities | 12 |
| Statement of Operations | 13 |
| Statement of Changes in Net Assets | 14 |
| Notes to Financial Statements | 15 |
| Financial Highlights | 19 |
| Report of Independent Registered Public Accounting Firm | 20 |
| Management | 21 |
| Approval of Management Agreement | 24 |
| Additional Information | 29 |
Any opinions expressed in this report reflect those of the author as of the date of the report, and do not necessarily represent the opinions of American Century Investments® or any other person in the American Century Investments organization. Any such opinions are subject to change at any time based upon market or other conditions and American Century Investments disclaims any responsibility to update such opinions. These opinions may not be relied upon as investment advice and, because investment decisions made by American Century Investments funds are based on numerous factors, may not be relied upon as an indication of trading intent on behalf of any American Century Investments fund. Security examples are used for representational purposes only and are not intended as recommendations to purchase or sell securities. Performance information for comparative indices and securities is provided to American Century Investments by third party vendors. To the best of American Century Investments’ knowledge, such information is accurate at the time of printing.
Dear Investor:
Thank you for reviewing this annual report for the period ended June 30, 2011. Our report offers investment performance and portfolio information, presented with the expert perspective and commentary of our portfolio management team.
This report remains one of our most important vehicles for conveying information about investment performance and the market factors and strategies that affect fund returns. For additional, updated information on fund performance, portfolio strategy, and the investment markets, we encourage you to visit our website, americancentury.com. Click on the “Fund Performance” and “Insights & News” headings at the top of our Individual Investors site.
Reporting Period Perspective: Highest Broad Fiscal-Year U.S. Stock Returns Since 1997
Benefitting from favorable conditions and expectations, the U.S. stock market produced exceptional returns, the highest for any 12-month period ended June 30 since the fiscal year ended June 30, 1997. Back then, the S&P 500 Index gained 34.71%, compared with 30.69% for the most-recent reporting period. The intervening 14 years help illustrate how infrequently such a high level of performance occurs, requiring an alignment of economic and market conditions that’s difficult to duplicate.
The exceptional returns experienced during the reporting period represent a rebound from previous declines. After experiencing 10–12% declines during the second quarter of 2010—stemming from the European sovereign debt crisis and double-dip recession fears—most broad U.S. stock indices advanced 30% or more during the following 12 months. Monetary and fiscal intervention in 2010 stimulated growth and fueled investor optimism about economic and financial market conditions in 2011 and 2012, encouraging investments in riskier assets.
However, that optimism has diminished in the summer of 2011 as the European debt crisis returned to prominence and other debt and economic challenges emerged. As the reporting period came to a close in June 2011, we saw increasing signs that the U.S. economic recovery had lost momentum. As a result, economic growth forecasts were reduced, and broad U.S. stock indices trended downward beginning in May. As we enter the third quarter of 2011, investor concern over fiscal austerity measures in the U.S. and other developed economies raised fears of a return to recession and accelerated a decline in global equity markets. We appreciate your continued trust in us during these uncertain times.
Sincerely,
Jonathan Thomas
President and Chief Executive Officer
American Century Investments
By Scott Wittman, Chief Investment Officer, Quantitative Equity and Asset Allocation
U.S. Stocks Soared as Economy Improved
The U.S. stock market enjoyed very strong results for the 12 months ended June 30, 2011, with the broad equity indices returning more than 30%. The main catalyst for the sharp rally in stocks was growing investor confidence in a U.S. economic recovery, though that confidence faltered somewhat late in the period.
After a bumpy start resulting from an uncertain economic outlook, the equity market began a steady rise in September 2010 as improving economic data reassured investors that the economy would avoid a “double-dip” recession (a return to recession after a brief period of recovery). Most notably, employment growth turned positive after 2½ years of persistent job losses, and the manufacturing sector showed signs of life. In addition, a renewal of the Federal Reserve’s quantitative easing program and an extension of expiring federal tax breaks further boosted the market’s confidence that a promising economic recovery was under way.
Stocks continued to advance in early 2011 despite unrest in the Middle East and North Africa, as well as a devastating earthquake and tsunami in Japan. By May, however, evidence of a slowdown in economic activity and renewed concerns about a European sovereign debt crisis weighed on investor confidence. As a result, stocks experienced a modest pullback in the final two months of the period.
Smaller Stocks and Growth-Oriented Issues Outperformed
Despite finishing on a down note, the broad equity indices posted robust returns overall for the 12-month period. As the table below illustrates, mid- and small-cap issues generated the best returns, outpacing large-cap shares. Meanwhile, growth stocks outperformed value across all market capitalizations, most dramatically among smaller companies. Every sector of the market produced double-digit gains for the period, led by energy and materials stocks, which benefited from strong demand and rising commodity prices. Other economically sensitive sectors—such as consumer discretionary and industrials—also fared well. The laggard was the financials sector, which continued to face mortgage-related challenges and regulatory uncertainty.
| U.S. Stock Index Returns |
| For the 12 months ended June 30, 2011 |
| Russell 1000 Index (Large-Cap) | 31.93% | | Russell 2000 Index (Small-Cap) | 37.41% |
| Russell 1000 Growth Index | 35.01% | | Russell 2000 Growth Index | 43.50% |
| Russell 1000 Value Index | 28.94% | | Russell 2000 Value Index | 31.35% |
| Russell Midcap Index | 38.47% | | |
| Russell Midcap Growth Index | 43.25% | | | |
| Russell Midcap Value Index | 34.28% | | | |
| Total Returns as of June 30, 2011 |
| | | | Average Annual Returns | |
| | Ticker Symbol | 1 year(1) | 5 years | 10 years | Since Inception | Inception Date |
| Investor Class | BULIX | 30.50% | 5.78% | 4.54% | 7.65% | 3/1/93 |
Russell 3000 Utilities Index | — | 31.43% | 4.52% | 2.76% | N/A(2) | — |
| S&P 500 Index | — | 30.69% | 2.94% | 2.72% | 8.21%(3) | — |
| (1) | Extraordinary performance is attributable in part to unusually favorable market conditions and may not be repeated or consistently achieved in the future. |
| (2) | Index data first available 7/1/96. |
| (3) | Since 2/28/93, the date nearest the fund’s inception for which data are available. |
| Growth of $10,000 Over 10 Years |
| $10,000 investment made June 30, 2001 |
| Total Annual Fund Operating Expenses |
Investor Class 0.70% |
The total annual fund operating expenses shown is as stated in the fund’s prospectus current as of the date of this report. The prospectus may vary from the expense ratio shown elsewhere in this report because it is based on a different time period, includes acquired fund fees and expenses, and, if applicable, does not include fee waivers or expense reimbursements.
Data presented reflect past performance. Past performance is no guarantee of future results. Current performance may be higher or lower than the performance shown. Investment return and principal value will fluctuate, and redemption value may be more or less than original cost. To obtain performance data current to the most recent month end, please call 1-800-345-2021 or visit americancentury.com. The fund concentrates its investments in a narrow segment of the total market and is therefore subject to greater risks and market fluctuations than a portfolio representing a broader range of industries.
Data assumes reinvestment of dividends and capital gains, and none of the charts reflect the deduction of taxes that a shareholder would pay on fund distributions or the redemption of fund shares. Returns for the indices are provided for comparison. The fund’s total returns include operating expenses (such as transaction costs and management fees) that reduce returns, while the total returns of the indices do not.
Portfolio Managers: Bill Martin and Lynette Pang
Performance Summary
Utilities returned 30.50% for the 12 months ended June 30, 2011, lagging the 31.43% return of its benchmark, the Russell 3000 Utilities Index. The S&P 500 Index, a broad market measure, returned 30.69%.
As described on page 3, the U.S. stock market delivered gains for the 12-month period, reflecting economic recovery and improving corporate earnings. Against this backdrop, the Utilities Fund delivered gains on an absolute basis, and modestly underperformed its benchmark.
From a broad sector perspective, an underweight allocation to the telecommunications services sector represented the bulk of the portfolio’s underperformance relative to its benchmark. Partially offsetting that relative loss, effective stock selection in the traditional utilities sector, as well as an overweight allocation to the energy and information technology sectors, contributed to relative gains. Within the utilities sector, stock decisions in the gas utilities industry made a key contribution to absolute and relative gains. An underweight stake in the electric utilities industry also helped relative returns. The portfolio’s underweight allocation to the independent power producer group contributed to relative performance, but poor stock selection within the group trimmed those gains. An overweight allocation to multi-utilities detracted from relative performance.
Telecommunications Services Detracted
Within the telecommunications services sector, the portfolio’s underweight allocation to the diversified telecommunications group resulted in underperformance relative to the benchmark. In particular, the portfolio maintained an underweight position in telecommunications provider Verizon. This decision had proven advantageous in previous periods, as the company’s share price declined due to charges associated with workforce reductions and a decline in contract customers. During the current reporting period, however, Verizon produced earnings levels that exceeded analysts’ forecasts, as overall revenues increased due to improved wireless customer retention, new subscriber growth, and higher data revenues. Sales for iPhones, which became available in the first quarter of 2011, contributed substantially to earnings. An underweight position in AT&T also hurt relative performance, as the company benefited from strong growth in iPhone activations despite the Verizon iPhone launch.
Utilities Contributed
The utilities sector, which represented almost 67% of the portfolio, was a source of positive relative returns for the reporting period. Within the sector, overweight positions in select gas utilities helped absolute and relative performance. The portfolio was rewarded for a significantly overweight position in ONEOK Inc., which represented the largest individual contribution to relative performance as the company’s share price gained 77%. The diversified energy company delivered solid earnings that were above analysts’ expectations for the first quarter of 2011.
An underweight allocation to the electric utilities industry contributed to absolute and relative performance. Effective stock selection within the industry added further to gains.
An underweight allocation to the independent power producer industry also helped relative returns, although the gains were nearly erased by poor stock selection within the group.
Energy, Information Technology Helped
The energy sector contributed to absolute and relative returns. Within the sector, the portfolio held select positions within the oil, gas, and consumable fuels industry that were not benchmark members, including El Paso Corporation and Williams Companies. The natural gas companies’ share prices gained during the reporting period in an environment of high energy prices.
The information technology sector also was a source of gains relative to the benchmark. In the communications equipment industry group, the portfolio held a position in QUALCOMM, which is not a benchmark constituent. The company experienced solid share price gains during the period.
Outlook
Utilities employs a structured, disciplined investment approach. The management team incorporates both growth and value measures into its stock selection process and attempts to balance the portfolio’s risk and expected return.
The team has continued to avoid water utilities in the portfolio. The portfolio has maintained overweight positions in gas utilities and multi-utilities, as our quantitative process has identified opportunities in these areas.
| Utilities Market Returns |
| For the 12 months ended June 30, 2011 |
| Broad U.S. Stock Market | | Primary Utilities Industries in Fund Benchmark |
| S&P 500 Index | 30.69% | | Oil, Gas & Consumable Fuels | 55.82% |
| Nasdaq Composite Index* | 31.49% | | Diversified Telecommunication Services | 41.25% |
| Broad Utilities Market | | Gas Utilities | 38.12% |
| Lipper Utility Funds Index | 29.98% | | Water Utilities | 30.76% |
| Russell 3000 Utilities Index | 31.43% | | Internet Software & Services | 29.26% |
| | | | Wireless Telecommunication Services | 27.41% |
*Return does not reflect the reinvestment of dividends on securities in the index. Had such reinvestments been included, returns would have been higher.
| JUNE 30, 2011 |
| Top Ten Holdings | % of net assets |
| AT&T, Inc. | 10.4% |
| Verizon Communications, Inc. | 10.0% |
| CenturyLink, Inc. | 3.9% |
| Southern Co. | 3.1% |
| Public Service Enterprise Group, Inc. | 2.9% |
| ONEOK, Inc. | 2.8% |
| CenterPoint Energy, Inc. | 2.8% |
| Edison International | 2.8% |
| NextEra Energy, Inc. | 2.7% |
| Dominion Resources, Inc. | 2.7% |
| | |
| Industry Breakdown | % of net assets |
| Integrated Telecommunication Services | 28.1% |
| Multi-Utilities | 23.5% |
| Electric Utilities | 21.5% |
| Gas Utilities | 15.2% |
| Wireless Telecommunication Services | 3.2% |
| Oil & Gas Exploration & Production | 2.6% |
| Oil & Gas Storage & Transportation | 1.7% |
| Independent Power Producers & Energy Traders | 1.5% |
| Communications Equipment | 0.8% |
| Alternative Carriers | 0.2% |
| Cash and Equivalents* | 1.7% |
| *Includes temporary cash investments and other assets and liabilities. |
| | |
| Types of Investments in Portfolio | % of net assets |
| Common Stocks | 98.3% |
| Temporary Cash Investments | 1.9% |
| Other Assets and Liabilities | (0.2)% |
Fund shareholders may incur two types of costs: (1) transaction costs, including sales charges (loads) on purchase payments and redemption/exchange fees; and (2) ongoing costs, including management fees; distribution and service (12b-1) fees; and other fund expenses. This example is intended to help you understand your ongoing costs (in dollars) of investing in your fund and to compare these costs with the ongoing cost of investing in other mutual funds.
The example is based on an investment of $1,000 made at the beginning of the period and held for the entire period from January 1, 2011 to June 30, 2011.
Actual Expenses
The table provides information about actual account values and actual expenses for each class. You may use the information, together with the amount you invested, to estimate the expenses that you paid over the period. First, identify the share class you own. Then simply divide your account value by $1,000 (for example, an $8,600 account value divided by $1,000 = 8.6), then multiply the result by the number under the heading “Expenses Paid During Period” to estimate the expenses you paid on your account during this period.
If you hold Investor Class shares of any American Century Investments fund, or Institutional Class shares of the American Century Diversified Bond Fund, in an American Century Investments account (i.e., not a financial intermediary or retirement plan account), American Century Investments may charge you a $12.50 semiannual account maintenance fee if the value of those shares is less than $10,000. We will redeem shares automatically in one of your accounts to pay the $12.50 fee. In determining your total eligible investment amount, we will include your investments in all personal accounts (including American Century Investments Brokerage accounts) registered under your Social Security number. Personal accounts include individual accounts, joint accounts, UGMA/UTMA accounts, personal trusts, Coverdell Education Savings Accounts and IRAs (including traditional, Roth, Rollover, SEP-, SARSEP- and SIMPLE-IRAs), and certain other retirement accounts. If you have only business, business retirement, employer-sponsored or American Century Investments Brokerage accounts, you are currently not subject to this fee. We will not charge the fee as long as you choose to manage your accounts exclusively online. If you are subject to the Account Maintenance Fee, your account value could be reduced by the fee amount.
Hypothetical Example for Comparison Purposes
The table also provides information about hypothetical account values and hypothetical expenses based on the actual expense ratio of each class of your fund and an assumed rate of return of 5% per year before expenses, which is not the actual return of a fund’s share class. The hypothetical account values and expenses may not be used to estimate the actual ending account balance or expenses you paid for the period. You may use this information to compare the ongoing costs of investing in your fund and other funds. To do so, compare this 5% hypothetical example with the 5% hypothetical examples that appear in the shareholder reports of the other funds.
Please note that the expenses shown in the table are meant to highlight your ongoing costs only and do not reflect any transactional costs, such as sales charges (loads) or redemption/exchange fees. Therefore, the table is useful in comparing ongoing costs only, and will not help you determine the relative total costs of owning different funds. In addition, if these transactional costs were included, your costs would have been higher.
| | Beginning Account Value 1/1/11 | Ending Account Value 6/30/11 | Expenses Paid During Period* 1/1/11 – 6/30/11 | Annualized Expense Ratio* |
| Actual | | | | |
| Investor Class | $1,000 | $1,087.90 | $3.52 | 0.68% |
| Hypothetical | | | | |
| Investor Class | $1,000 | $1,021.42 | $3.41 | 0.68% |
*Expenses are equal to the class’s annualized expense ratio listed in the table above, multiplied by the average account value over the period, multiplied by 181, the number of days in the most recent fiscal half-year, divided by 365, to reflect the one-half year period.
| | | Shares | | | Value | |
| Common Stocks — 98.3% | |
| ALTERNATIVE CARRIERS—0.2% | |
Level 3 Communications, Inc.(1) | | | 244,457 | | | | $596,475 | |
| COMMUNICATIONS EQUIPMENT—0.8% | |
| QUALCOMM, Inc. | | | 40,092 | | | | 2,276,825 | |
| ELECTRIC UTILITIES—21.5% | |
| American Electric Power Co., Inc. | | | 184,440 | | | | 6,949,699 | |
| Duke Energy Corp. | | | 209,604 | | | | 3,946,843 | |
| Edison International | | | 205,400 | | | | 7,959,250 | |
| Entergy Corp. | | | 65,500 | | | | 4,472,340 | |
| Exelon Corp. | | | 130,592 | | | | 5,594,561 | |
| FirstEnergy Corp. | | | 88,450 | | | | 3,905,068 | |
| NextEra Energy, Inc. | | | 135,900 | | | | 7,808,814 | |
| PPL Corp. | | | 189,400 | | | | 5,271,002 | |
| Progress Energy, Inc. | | | 88,000 | | | | 4,224,880 | |
| Southern Co. | | | 216,811 | | | | 8,754,828 | |
| UniSource Energy Corp. | | | 57,300 | | | | 2,139,009 | |
| | | | | | | | 61,026,294 | |
| GAS UTILITIES—15.2% | |
| AGL Resources, Inc. | | | 124,700 | | | | 5,076,537 | |
| Atmos Energy Corp. | | | 67,400 | | | | 2,241,050 | |
| Laclede Group, Inc. (The) | | | 81,800 | | | | 3,094,494 | |
| National Fuel Gas Co. | | | 93,890 | | | | 6,835,192 | |
| Nicor, Inc. | | | 108,100 | | | | 5,917,394 | |
| Northwest Natural Gas Co. | | | 58,100 | | | | 2,622,053 | |
| ONEOK, Inc. | | | 108,696 | | | | 8,044,591 | |
| Questar Corp. | | | 82,000 | | | | 1,452,220 | |
| Southwest Gas Corp. | | | 48,700 | | | | 1,880,307 | |
| UGI Corp. | | | 185,500 | | | | 5,915,595 | |
| | | | | | | | 43,079,433 | |
| INDEPENDENT POWER PRODUCERS & ENERGY TRADERS—1.5% | |
AES Corp. (The)(1) | | | 46,803 | | | | 596,270 | |
| Constellation Energy Group, Inc. | | | 83,100 | | | | 3,154,476 | |
NRG Energy, Inc.(1) | | | 17,203 | | | | 422,850 | |
| | | | | | | | 4,173,596 | |
| INTEGRATED TELECOMMUNICATION SERVICES—28.1% | |
| AT&T, Inc. | | | 942,174 | | | | 29,593,685 | |
| BCE, Inc. | | | 44,587 | | | | 1,751,823 | |
| CenturyLink, Inc. | | | 275,069 | | | | 11,121,040 | |
| France Telecom SA ADR | | | 77,552 | | | | 1,651,082 | |
| Frontier Communications Corp. | | | 94,297 | | | | 760,977 | |
| Telefonica SA ADR | | | 41,215 | | | | 1,009,356 | |
| Verizon Communications, Inc. | | | 766,836 | | | | 28,549,304 | |
| Windstream Corp. | | | 420,875 | | | | 5,454,540 | |
| | | | | | | | 79,891,807 | |
| MULTI-UTILITIES—23.5% | |
| Alliant Energy Corp. | | | 35,400 | | | | 1,439,364 | |
| Ameren Corp. | | | 14,758 | | | | 425,621 | |
| CenterPoint Energy, Inc. | | | 414,373 | | | | 8,018,117 | |
| CMS Energy Corp. | | | 179,100 | | | | 3,526,479 | |
| Consolidated Edison, Inc. | | | 115,600 | | | | 6,154,544 | |
| Dominion Resources, Inc. | | | 156,275 | | | | 7,543,394 | |
| DTE Energy Co. | | | 97,200 | | | | 4,861,944 | |
| MDU Resources Group, Inc. | | | 121,000 | | | | 2,722,500 | |
| NiSource, Inc. | | | 82,900 | | | | 1,678,725 | |
| NSTAR | | | 108,797 | | | | 5,002,486 | |
| PG&E Corp. | | | 166,200 | | | | 6,985,386 | |
| Public Service Enterprise Group, Inc. | | | 253,400 | | | | 8,270,976 | |
| SCANA Corp. | | | 50,200 | | | | 1,976,374 | |
| Sempra Energy | | | 49,100 | | | | 2,596,408 | |
| Wisconsin Energy Corp. | | | 42,600 | | | | 1,335,510 | |
| Xcel Energy, Inc. | | | 180,400 | | | | 4,383,720 | |
| | | | | | | | 66,921,548 | |
| OIL & GAS EXPLORATION & PRODUCTION—2.6% | |
| Energen Corp. | | | 98,000 | | | | 5,537,000 | |
| QEP Resources, Inc. | | | 46,629 | | | | 1,950,491 | |
| | | | | | | | 7,487,491 | |
| OIL & GAS STORAGE & TRANSPORTATION—1.7% | |
| El Paso Corp. | | | 127,522 | | | | 2,575,945 | |
| Williams Cos., Inc. (The) | | | 73,617 | | | | 2,226,914 | |
| | | | | | | | 4,802,859 | |
| WIRELESS TELECOMMUNICATION SERVICES—3.2% | |
| America Movil SAB de CV, Series L ADR | | | 28,577 | | | | 1,539,729 | |
MetroPCS Communications, Inc.(1) | | | 39,691 | | | | 683,082 | |
NII Holdings, Inc.(1) | | | 14,432 | | | | 611,628 | |
Sprint Nextel Corp.(1) | | | 903,042 | | | | 4,867,396 | |
| Vodafone Group plc ADR | | | 50,119 | | | | 1,339,180 | |
| | | | | | | | 9,041,015 | |
TOTAL COMMON STOCKS (Cost $221,504,415) | | | | 279,297,343 | |
| | |
| | | | Shares | | | | Value | |
| Temporary Cash Investments — 1.9% | | | | | | | | |
| JPMorgan U.S. Treasury Plus Money Market Fund Agency Shares | | | 1,249,700 | | | | $1,249,700 | |
| Repurchase Agreement, Bank of America N.A., (collateralized by various U.S. Treasury obligations, 4.375%, 11/15/39, valued at $1,492,793), in a joint trading account at 0.00%, dated 6/30/11, due 7/1/11 (Delivery value $1,458,994) | | | | 1,458,994 | |
| Repurchase Agreement, Credit Suisse First Boston, Inc., (collateralized by various U.S. Treasury obligations, 3.50%, 5/15/20, valued at $1,240,519), in a joint trading account at 0.00%, dated 6/30/11, due 7/1/11 (Delivery value $1,215,829) | | | | 1,215,829 | |
| Repurchase Agreement, Goldman Sachs Group, Inc., (collateralized by various U.S. Treasury obligations, 1.375%, 9/15/12, valued at $1,488,333), in a joint trading account at 0.00%, dated 6/30/11, due 7/1/11 (Delivery value $1,458,994) | | | | 1,458,994 | |
TOTAL TEMPORARY CASH INVESTMENTS (Cost $5,383,517) | | | | 5,383,517 | |
TOTAL INVESTMENT SECURITIES — 100.2% (Cost $226,887,932) | | | | 284,680,860 | |
| OTHER ASSETS AND LIABILITIES — (0.2)% | | | | (503,758 | ) |
| TOTAL NET ASSETS — 100.0% | | | | $284,177,102 | |
Notes to Schedule of Investments
ADR = American Depositary Receipt
See Notes to Financial Statements.
Statement of Assets and Liabilities |
| JUNE 30, 2011 | |
| Assets | |
| Investment securities, at value (cost of $226,887,932) | | | $284,680,860 | |
| Receivable for capital shares sold | | | 141,228 | |
| Dividends and interest receivable | | | 848,288 | |
| | | | 285,670,376 | |
| | | | | |
| Liabilities | | | | |
| Payable for investments purchased | | | 1,244,470 | |
| Payable for capital shares redeemed | | | 94,118 | |
| Accrued management fees | | | 154,686 | |
| | | | 1,493,274 | |
| | | | | |
| Net Assets | | | $284,177,102 | |
| | | | | |
| Investor Class Capital Shares, $0.01 Par Value | | | | |
| Shares authorized | | | 80,000,000 | |
| Shares outstanding | | | 17,836,139 | |
| | | | | |
| Net Asset Value Per Share | | | $15.93 | |
| | | | | |
| Net Assets Consist of: | | | | |
| Capital (par value and paid-in surplus) | | | $234,897,614 | |
| Undistributed net investment income | | | 469,486 | |
| Accumulated net realized loss | | | (8,984,107 | ) |
| Net unrealized appreciation | | | 57,794,109 | |
| | | | $284,177,102 | |
See Notes to Financial Statements.
| YEAR ENDED JUNE 30, 2011 | |
| Investment Income (Loss) | |
| Income: | | | |
| Dividends (net of foreign taxes withheld of $20,759) | | | $10,793,959 | |
| Interest | | | 1,587 | |
| | | | 10,795,546 | |
| Expenses: | | | | |
| Management fees | | | 1,767,204 | |
| Directors’ fees and expenses | | | 10,699 | |
| Other expenses | | | 8,850 | |
| | | | 1,786,753 | |
| | | | | |
| Net investment income (loss) | | | 9,008,793 | |
| | | | | |
| Realized and Unrealized Gain (Loss) | | | | |
| Net realized gain (loss) on investment and foreign currency transactions | | | 8,674,327 | |
Change in net unrealized appreciation (depreciation) on investments and translation of assets and liabilities in foreign currencies | | | 49,540,081 | |
| | | | | |
| Net realized and unrealized gain (loss) | | | 58,214,408 | |
| | | | | |
| Net Increase (Decrease) in Net Assets Resulting from Operations | | | $67,223,201 | |
See Notes to Financial Statements.
Statement of Changes in Net Assets |
| YEARS ENDED JUNE 30, 2011 AND JUNE 30, 2010 | |
| Increase (Decrease) in Net Assets | | 2011 | | | 2010 | |
| Operations | |
| Net investment income (loss) | | | $9,008,793 | | | | $9,187,273 | |
| Net realized gain (loss) | | | 8,674,327 | | | | (6,893,889 | ) |
| Change in net unrealized appreciation (depreciation) | | | 49,540,081 | | | | 10,462,991 | |
| Net increase (decrease) in net assets resulting from operations | | | 67,223,201 | | | | 12,756,375 | |
| | | | | | | | | |
| Distributions to Shareholders | | | | | | | | |
| From net investment income | | | (8,638,698 | ) | | | (8,908,274 | ) |
| | | | | | | | | |
| Capital Share Transactions | | | | | | | | |
| Proceeds from shares sold | | | 34,807,857 | | | | 38,240,653 | |
| Proceeds from reinvestment of distributions | | | 8,094,997 | | | | 8,390,010 | |
| Payments for shares redeemed | | | (45,411,469 | ) | | | (59,111,698 | ) |
| Net increase (decrease) in net assets from capital share transactions | | | (2,508,615 | ) | | | (12,481,035 | ) |
| | | | | | | | | |
| Net increase (decrease) in net assets | | | 56,075,888 | | | | (8,632,934 | ) |
| | | | | | | | | |
| Net Assets | | | | | | | | |
| Beginning of period | | | 228,101,214 | | | | 236,734,148 | |
| End of period | | | $284,177,102 | | | | $228,101,214 | |
| | | | | | | | | |
| Undistributed net investment income | | | $469,486 | | | | $471,590 | |
| | | | | | | | | |
| Transactions in Shares of the Fund | | | | | | | | |
| Sold | | | 2,310,663 | | | | 2,863,153 | |
| Issued in reinvestment of distributions | | | 545,910 | | | | 622,364 | |
| Redeemed | | | (3,099,743 | ) | | | (4,462,805 | ) |
| Net increase (decrease) in shares of the fund | | | (243,170 | ) | | | (977,288 | ) |
See Notes to Financial Statements.
Notes to Financial Statements |
JUNE 30, 2011
1. Organization
American Century Quantitative Equity Funds, Inc. (the corporation) is registered under the Investment Company Act of 1940, as amended (the 1940 Act), as an open-end management investment company and is organized as a Maryland corporation. Utilities Fund (the fund) is one fund in a series issued by the corporation. The fund is diversified as defined under the 1940 Act. The fund’s investment objective is to seek current income and long-term growth of capital and income. The fund invests at least 80% of its assets in equity securities of companies engaged in the utilities industry.
2. Significant Accounting Policies
The following is a summary of significant accounting policies consistently followed by the fund in preparation of its financial statements. The financial statements are prepared in conformity with accounting principles generally accepted in the United States of America, which may require management to make certain estimates and assumptions at the date of the financial statements. Actual results could differ from these estimates.
Investment Valuations — The fund determines the fair value of its investments and computes its net asset value per share as of the close of regular trading (usually 4 p.m. Eastern time) on the New York Stock Exchange (NYSE) on each day the NYSE is open.
Equity securities that are listed or traded on a domestic securities exchange are valued at the last reported sales price or at the official closing price as provided by the exchange. Equity securities traded on foreign securities exchanges are typically valued at the closing price on the exchange where primarily traded or as of the close of the NYSE, if that is earlier. If no last sales price is reported, or if local convention or regulation so provides, the mean of the latest bid and asked prices is used. Depending on local convention or regulation, securities traded over-the-counter are valued at the mean of the latest bid and asked prices, the last sales price, or the official closing price. In its determination of fair value, the fund may review several factors including: market information specific to a security; news developments in U.S. and foreign markets; the performance of particular U.S. and foreign securities, indices, comparable securities, American Depositary Receipts, Exchange-Traded Funds, and other relevant market indicators.
Debt securities maturing within 60 days at the time of purchase may be valued at cost, plus or minus any amortized discount or premium or at the evaluated mean as provided by an independent pricing service. Evaluated mean prices are commonly derived through utilization of market models, which may consider, among other factors, trade data, quotations from dealers and active market makers, relevant yield curve and spread data, related sector levels, creditworthiness, and other relevant market information on the same or comparable securities.
Investments in open-end management investment companies are valued at the reported net asset value per share. Repurchase agreements are valued at cost.
The value of investments initially expressed in foreign currencies is translated into U.S. dollars at prevailing exchange rates.
If the fund determines that the market price for a portfolio security is not readily available or the valuation methods mentioned above do not reflect a security’s fair value, such security is valued as determined in good faith by the Board of Directors or its designee, in accordance with procedures adopted by the Board of Directors. Circumstances that may cause the fund to use these procedures to value a security include, but are not limited to: a security has been declared in default; trading in a security has been halted during the trading day; there is a foreign market holiday and no trading occurred; or an event occurred between the close of a foreign exchange and the NYSE that may affect the value of a security.
Security Transactions — Security transactions are accounted for as of the trade date. Net realized gains and losses are determined on the identified cost basis, which is also used for federal income tax purposes.
Investment Income — Dividend income less foreign taxes withheld, if any, is recorded as of the ex-dividend date. Interest income is recorded on the accrual basis and includes accretion of discounts and amortization of premiums.
Foreign Currency Translations — All assets and liabilities initially expressed in foreign currencies are translated into U.S. dollars at prevailing exchange rates at period end. The fund may enter into spot foreign currency exchange contracts to facilitate transactions denominated in a foreign currency. Purchases and sales of investment securities, dividend and interest income, spot foreign currency exchange contracts, and expenses are translated at the rates of exchange prevailing on the respective dates of such transactions. Net realized and unrealized foreign currency exchange gains or losses related to investment securities are a component of net realized gain (loss) on investment transactions and change in net unrealized appreciation (depreciation) on investments, respectively.
Repurchase Agreements — The fund may enter into repurchase agreements with institutions that American Century Investment Management, Inc. (ACIM) (the investment advisor) has determined are creditworthy pursuant to criteria adopted by the Board of Directors. The fund requires that the collateral, represented by securities, received in a repurchase transaction be transferred to the custodian in a manner sufficient to enable the fund to obtain those securities in the event of a default under the repurchase agreement. ACIM monitors, on a daily basis, the securities transferred to ensure the value, including accrued interest, of the securities under each repurchase agreement is equal to or greater than amounts owed to the fund under each repurchase agreement.
Joint Trading Account — Pursuant to an Exemptive Order issued by the Securities and Exchange Commission, the fund, along with certain other funds in the American Century Investments family of funds, may transfer uninvested cash balances into a joint trading account. These balances are invested in one or more repurchase agreements that are collateralized by U.S. Treasury or Agency obligations.
Income Tax Status — It is the fund’s policy to distribute substantially all net investment income and net realized gains to shareholders and to otherwise qualify as a regulated investment company under provisions of the Internal Revenue Code. The fund is no longer subject to examination by tax authorities for years prior to 2008. At this time, management believes there are no uncertain tax positions which, based on their technical merit, would not be sustained upon examination and for which it is reasonably possible that the total amounts of unrecognized tax benefits will significantly change in the next twelve months. Accordingly, no provision has been made for federal or state income taxes.
Distributions to Shareholders — Distributions from net investment income, if any, are generally declared and paid quarterly. Distributions from net realized gains, if any, are generally declared and paid annually.
Indemnifications — Under the corporation’s organizational documents, its officers and directors are indemnified against certain liabilities arising out of the performance of their duties to the fund. In addition, in the normal course of business, the fund enters into contracts that provide general indemnifications. The maximum exposure under these arrangements is unknown as this would involve future claims that may be made against a fund. The risk of material loss from such claims is considered by management to be remote.
3. Fees and Transactions with Related Parties
Management Fees —The corporation has entered into a management agreement with ACIM, under which ACIM provides the fund with investment advisory and management services in exchange for a single, unified management fee (the fee). The agreement provides that all expenses of managing and operating the fund, except distribution and service fees, brokerage expenses, taxes, interest, fees and expenses of the independent directors (including legal counsel fees), and extraordinary expenses, will be paid by ACIM. The fee is computed and accrued daily based on the daily net assets of the fund and paid monthly in arrears. The fee consists of (1) an Investment Category Fee based on the daily net assets of the fund and certain other accounts managed by the investment advisor that are in the same broad investment category as the fund and (2) a Complex Fee based on the assets of all the funds in the American Century Investments family of funds.
The rates for the Investment Category Fee range from 0.3380% to 0.5200%. The rates for the Complex Fee range from 0.2500% to 0.3100%. The effective annual management fee for the year ended June 30, 2011 was 0.68%.
Related Parties — Certain officers and directors of the corporation are also officers and/or directors of American Century Companies, Inc. (ACC), the parent of the corporation’s investment advisor, ACIM, the distributor of the corporation, American Century Investment Services, Inc., and the corporation’s transfer agent, American Century Services, LLC.
The fund is eligible to invest in a money market fund for temporary purposes, which is managed by J.P. Morgan Investment Management, Inc. (JPMIM). The fund has a securities lending agreement with JPMorgan Chase Bank (JPMCB) and a mutual funds services agreement with J.P. Morgan Investor Services Co. (JPMIS). JPMCB is a custodian of the fund. JPMIM, JPMIS and JPMCB are wholly owned subsidiaries of JPMorgan Chase & Co. (JPM). JPM is an equity investor in ACC. The services provided to the fund by JPMIM, JPMIS and JPMCB terminated on July 31, 2011.
4. Investment Transactions
Purchases and sales of investment securities, excluding short-term investments, for the year ended June 30, 2011 were $43,562,150 and $47,144,801, respectively.
5. Fair Value Measurements
The fund’s securities valuation process is based on several considerations and may use multiple inputs to determine the fair value of the positions held by the fund. In conformity with accounting principles generally accepted in the United States of America, the inputs used to determine a valuation are classified into three broad levels as follows:
| Level 1 valuation inputs consist of unadjusted quoted prices in an active market for identical securities; |
| Level 2 valuation inputs consist of direct or indirect observable market data (including quoted prices for similar securities, evaluations of subsequent market events, interest rates, prepayment speeds, credit risk, etc.); or |
| Level 3 valuation inputs consist of unobservable data (including a fund’s own assumptions). |
The level classification is based on the lowest level input that is significant to the fair valuation measurement. The valuation inputs are not necessarily an indication of the risks associated with investing in these securities or other financial instruments.
The following is a summary of the level classifications as of period end. The Schedule of Investments provides additional information on the fund’s portfolio holdings.
| | | Level 1 | | | Level 2 | | | Level 3 | |
| Investment Securities | | | | | | | | | |
| Common Stocks | | | $279,297,343 | | | | — | | | | — | |
| Temporary Cash Investments | | | 1,249,700 | | | | $4,133,817 | | | | — | |
| Total Value of Investment Securities | | | $280,547,043 | | | | $4,133,817 | | | | — | |
6. Risk Factors
The fund concentrates its investments in a narrow segment of the total market. Because of this, the fund may be subject to greater risk and market fluctuations than a portfolio representing a broader range of industries.
7. Federal Tax Information
The tax character of distributions paid during the years ended June 30, 2011 and June 30, 2010 were as follows:
| | | 2011 | | | 2010 | |
| Distributions Paid From | | | | | | |
| Ordinary income | | | $8,638,698 | | | | $8,908,274 | |
| Long-term capital gains | | | — | | | | — | |
The book-basis character of distributions made during the year from net investment income or net realized gains may differ from their ultimate characterization for federal income tax purposes. These differences reflect the differing character of certain income items and net realized gains and losses for financial statement and tax purposes, and may result in reclassification among certain capital accounts on the financial statements.
As of June 30, 2011, the federal tax cost of investments and the components of distributable earnings on a tax-basis were as follows:
| Federal tax cost of investments | | | $226,959,230 | |
| Gross tax appreciation of investments | | | $60,634,509 | |
| Gross tax depreciation of investments | | | (2,912,879 | ) |
| Net tax appreciation (depreciation) of investments | | | $57,721,630 | |
Net tax appreciation (depreciation) on derivatives and translation of assets and liabilities in foreign currencies | | | $1,181 | |
| Net tax appreciation (depreciation) | | | $57,722,811 | |
| Undistributed ordinary income | | | $469,486 | |
| Accumulated capital losses | | | $(8,912,809 | ) |
The difference between book-basis and tax-basis cost and unrealized appreciation (depreciation) is attributable primarily to the tax deferral of losses on wash sales.
The accumulated capital losses represent net capital loss carryovers that may be used to offset future realized capital gains for federal income tax purposes. Future capital loss carryover utilization in any given year may be subject to Internal Revenue Code limitations. Capital loss carryovers expire in 2018.
On December 22, 2010, the Regulated Investment Company Modernization Act of 2010 (the “Act”) was enacted, which changed various technical rules governing the tax treatment of regulated investment companies. The changes are generally effective for taxable years beginning after the date of enactment. Under the Act, the fund will be permitted to carry forward capital losses incurred in taxable years beginning after the date of enactment for an unlimited period. However, any losses incurred during those future taxable years will be required to be utilized prior to the losses incurred in pre-enactment taxable years, which carry an expiration date. As a result of this ordering rule, pre-enactment capital loss carryforwards may be more likely to expire unused.
| Investor Class | |
| For a Share Outstanding Throughout the Years Ended June 30 (except as noted) | |
| | | 2011 | | | 2010 | | | 2009 | | | 2008 | | | 2007(1) | | | 2006 | |
| Per-Share Data | |
| Net Asset Value, Beginning of Period | | | $12.62 | | | | $12.42 | | | | $17.46 | | | | $18.04 | | | | $16.30 | | | | $13.40 | |
| Income From Investment Operations | | | | | | | | | | | | | | | | | | | | | | | | |
Net Investment Income (Loss)(2) | | | 0.51 | | | | 0.49 | | | | 0.46 | | | | 0.39 | | | | 0.20 | | | | 0.38 | |
Net Realized and Unrealized Gain (Loss) | | | 3.30 | | | | 0.19 | | | | (4.98 | ) | | | (0.61 | ) | | | 1.70 | | | | 2.92 | |
Total From Investment Operations | | | 3.81 | | | | 0.68 | | | | (4.52 | ) | | | (0.22 | ) | | | 1.90 | | | | 3.30 | |
| Distributions | | | | | | | | | | | | | | | | | | | | | | | | |
From Net Investment Income | | | (0.50 | ) | | | (0.48 | ) | | | (0.52 | ) | | | (0.36 | ) | | | (0.16 | ) | | | (0.40 | ) |
Net Asset Value, End of Period | | | $15.93 | | | | $12.62 | | | | $12.42 | | | | $17.46 | | | | $18.04 | | | | $16.30 | |
| | | | | | | | | | | | | | | | | | | | | | | | | |
Total Return(3) | | | 30.50 | % | | | 5.30 | % | | | (25.89 | )% | | | (1.26 | )% | | | 11.71 | % | | | 24.99 | % |
| | | | | | | | | | | | | | | | | | | | | | | | | |
| Ratios/Supplemental Data | |
Ratio of Operating Expenses to Average Net Assets | | | 0.69 | % | | | 0.70 | % | | | 0.70 | % | | | 0.68 | % | | | 0.67 | %(4) | | | 0.68 | % |
Ratio of Net Investment Income (Loss) to Average Net Assets | | | 3.47 | % | | | 3.75 | % | | | 3.54 | % | | | 2.16 | % | | | 2.30 | %(4) | | | 2.62 | % |
| Portfolio Turnover Rate | | | 17 | % | | | 11 | % | | | 14 | % | | | 19 | % | | | 20 | % | | | 45 | % |
| Net Assets, End of Period (in thousands) | | | $284,177 | | | | $228,101 | | | | $236,734 | | | | $387,070 | | | | $502,099 | | | | $336,672 | |
| (1) | January 1, 2007 through June 30, 2007. The fund’s fiscal year end was changed from December 31 to June 30, resulting in a six-month annual reporting period. For the years before June 30, 2007, the fund’s fiscal year end was December 31. |
| (2) | Computed using average shares outstanding throughout the period. |
| (3) | Total returns are calculated based on the net asset value of the last business day. Total returns for periods less than one year are not annualized. |
See Notes to Financial Statements.
Report of Independent Registered Public Accounting Firm |
To the Directors of the American Century Quantitative Equity Funds, Inc.
and Shareholders of the Utilities Fund:
In our opinion, the accompanying statement of assets and liabilities, including the schedule of investments, and the related statements of operations and of changes in net assets and the financial highlights present fairly, in all material respects, the financial position of the Utilities Fund (one of the eleven funds comprising the American Century Quantitative Equity Funds, Inc., hereafter referred to as the “Fund”) at June 30, 2011, the results of its operations for the year then ended, the changes in its net assets for each of the two years in the period then ended and the financial highlights for each of the periods presented, in conformity with accounting principles generally accepted in the United States of America. These financial statements and financial highlights (hereafter referred to as “financial statements”) are the responsibility of the Fund’s management; our responsibility is to express an opinion on these financial statements based on our audits. We conducted our audits of these financial statements in accordance with the standards of the Public Company Accounting Oversight Board (United States). Those standards require that we plan and perform the audit to obtain reasonable assurance about whether the financial statements are free of material misstatement. An audit includes examining, on a test basis, evidence supporting the amounts and disclosures in the financial statements, assessing the accounting principles used and significant estimates made by management, and evaluating the overall financial statement presentation. We believe that our audits, which included confirmation of securities at June 30, 2011 by correspondence with the custodian and brokers, provide a reasonable basis for our opinion.
PricewaterhouseCoopers LLP
Kansas City, Missouri
August 18, 2011
The individuals listed below serve as directors of the funds. Each director will continue to serve in this capacity until death, retirement, resignation or removal from office. The mandatory retirement age for directors who are not “interested persons,” as that term is defined in the Investment Company Act (independent directors), is 73. However, the mandatory retirement age may be extended for a period not to exceed two years with the approval of the remaining independent directors.
Mr. Thomas is the only director who is an “interested person” because he currently serves as President and Chief Executive Officer of American Century Companies, Inc. (ACC), the parent company of American Century Investment Management, Inc. (ACIM or the advisor).
The other directors (more than three-fourths of the total number) are independent; that is, they have never been employees, directors or officers of, and have no financial interest in, ACC or any of its wholly owned, direct or indirect, subsidiaries, including ACIM, American Century Investment Services, Inc. (ACIS) and American Century Services, LLC (ACS). The directors serve in this capacity for eight (in the case of Mr. Thomas, 15) registered investment companies in the American Century Investments family of funds.
The following presents additional information about the directors. The mailing address for each director other than Mr. Thomas is 1665 Charleston Road, Mountain View, California 94043. The mailing address for Mr. Thomas is 4500 Main Street, Kansas City, Missouri 64111.
Name (Year of Birth) | Position(s) Held with Funds | Length of Time Served | Principal Occupation(s) During Past 5 Years | | Number of American Century Portfolios Overseen by Director | Other Directorships Held During Past 5 Years |
| Independent Directors |
| Tanya S. Beder (1955) | Director | Since 2011 | Chairman, SBCC Group Inc. (investment advisory services)(2006 to present); Fellow in Practice, International Center for Finance, Yale University School of Management (1985 to present); Chief Executive Officer, Tribeca Global Management LLC (asset management firm) (2004 to 2006) | | 40 | None |
| Jeremy I. Bulow (1954) | Director | Since 2011 | Professor of Economics, Stanford University, Graduate School of Business (1979 to present) | | 40 | None |
| John Freidenrich (1937) | Director | Since 2005 | Founder, Member and Manager, Regis Management Company, LLC (investment management firm) (April 2004 to present) | | 40 | None |
Name (Year of Birth) | Position(s) Held with Funds | Length of Time Served | Principal Occupation(s) During Past 5 Years | | Number of American Century Portfolios Overseen by Director | Other Directorships Held During Past 5 Years |
| Independent Directors |
| Ronald J. Gilson (1946) | Director and Chairman of the Board | Since 1995 | Charles J. Meyers Professor of Law and Business, Stanford Law School (1979 to present); Marc and Eva Stern Professor of Law and Business, Columbia University School of Law (1992 to present) | | 40 | None |
Frederick L. A. Grauer (1946) | Director | Since 2008 | Senior Advisor, BlackRock, Inc. (investment management firm) (2010 to 2011); Senior Advisor, Barclays Global Investors (investment management firm) (2003 to 2009) | | 40 | None |
| Peter F. Pervere (1947) | Director | Since 2007 | Retired | | 40 | Intraware, Inc. (2003 to 2009) |
| Myron S. Scholes (1941) | Director | Since 1980 | Chairman, Platinum Grove Asset Management, L.P. (asset manager) (1999 to 2009); Frank E. Buck Professor of Finance-Emeritus, Stanford Graduate School of Business (1996 to present) | | 40 | Dimensional Fund Advisors (investment advisor); CME Group, Inc. (futures and options exchange) |
| John B. Shoven (1947) | Director | Since 2002 | Professor of Economics, Stanford University (1973 to present) | | 40 | Cadence Design Systems; Exponent; Financial Engines; Watson Wyatt Worldwide (2002 to 2006) |
| |
| Interested Director |
Jonathan S. Thomas (1963) | Director and President | Since 2007 | President and Chief Executive Officer, ACC (March 2007 to present); Chief Administrative Officer, ACC (February 2006 to February 2007); Executive Vice President, ACC (November 2005 to February 2007). Also serves as: Chief Executive Officer and Manager, ACS; Executive Vice President, ACIM; Director, ACC, ACIM and other ACC subsidiaries | | 104 | None |
Officers
The following table presents certain information about the executive officers of the funds. Each officer serves as an officer for each of the 15 investment companies in the American Century family of funds, unless otherwise noted. No officer is compensated for his or her service as an officer of the funds. The listed officers are interested persons of the funds and are appointed or re-appointed on an annual basis. The mailing address for each of the officers listed below is 4500 Main Street, Kansas City, Missouri 64111.
Name (Year of Birth) | Offices with the Funds | | Principal Occupation(s) During the Past Five Years |
Jonathan S. Thomas (1963) | Director and President since 2007 | | President and Chief Executive Officer, ACC (March 2007 to present); Chief Administrative Officer, ACC (February 2006 to February 2007); Executive Vice President, ACC (November 2005 to February 2007). Also serves as: Chief Executive Officer and Manager, ACS; Executive Vice President, ACIM; Director, ACC, ACIM and other ACC subsidiaries |
Barry Fink (1955) | Executive Vice President since 2007 | | Chief Operating Officer and Executive Vice President, ACC (September 2007 to present); President, ACS (October 2007 to present); Managing Director, Morgan Stanley (2000 to 2007); Global General Counsel, Morgan Stanley (2000 to 2006). Also serves as: Manager, ACS and Director, ACC and certain ACC subsidiaries |
Maryanne L. Roepke (1956) | Chief Compliance Officer since 2006 and Senior Vice President since 2000 | | Chief Compliance Officer, American Century funds, ACIM and ACS (August 2006 to present); Assistant Treasurer, ACC (January 1995 to August 2006); and Treasurer and Chief Financial Officer, various American Century funds (July 2000 to August 2006). Also serves as: Senior Vice President, ACS |
| Charles A. Etherington (1957) | General Counsel since 2007 and Senior Vice President since 2006 | | Attorney, ACC (February 1994 to present); Vice President, ACC (November 2005 to present), General Counsel, ACC (March 2007 to present); Also serves as General Counsel, ACIM, ACS, ACIS and other ACC subsidiaries; and Senior Vice President, ACIM and ACS |
| Robert J. Leach (1966) | Vice President, Treasurer and Chief Financial Officer since 2006 | | Vice President, ACS (February 2000 to present); and Controller, various American Century funds (1997 to September 2006) |
| David H. Reinmiller (1963) | Vice President since 2001 | | Attorney, ACC (January 1994 to present); Associate General Counsel, ACC (January 2001 to present); Also serves as Vice President, ACIM and ACS |
| Ward D. Stauffer (1960) | Secretary since 2005 | | Attorney, ACC (June 2003 to present) |
The Statement of Additional Information has additional information about the fund’s directors and is available without charge, upon request, by calling 1-800-345-2021.
| Approval of Management Agreement |
At a meeting held on June 28, 2011, the Fund’s Board of Directors/Trustees unanimously approved the renewal of the management agreement pursuant to which American Century Investment Management, Inc. (the “Advisor”) acts as the investment advisor for the Fund. Under Section 15(c) of the Investment Company Act, contracts for investment advisory services are required to be reviewed, evaluated, and approved by a majority of a fund’s independent
directors/trustees (the “Directors”) each year.
As a part of the approval process, the Board requested and reviewed extensive data and information compiled by the Advisor and certain independent providers of evaluation data concerning the Fund and the services provided to the Fund by the Advisor. This review was in addition to the oversight and evaluation undertaken by the Board and its committees on a continuous basis throughout the year and included, but was not limited to the following:
| the nature, extent, and quality of investment management, shareholder services, and other services provided by the Advisor to the Fund; |
| the wide range of other programs and services the Advisor provides to the Fund and its shareholders on a routine and non-routine basis; |
| the investment performance of the fund, including data comparing the Fund’s performance to appropriate benchmarks and/or a peer group of other mutual funds with similar investment objectives and strategies; |
| data comparing the cost of owning the Fund to the cost of owning similar funds; |
| the Advisor’s compliance policies, procedures, and regulatory experience; |
| financial data showing the cost of services provided to the Fund, the profitability of the Fund to the Advisor, and the overall profitability of the Advisor; |
| data comparing services provided and charges to other investment management clients of the Advisor; and |
| consideration of collateral benefits derived by the Advisor from the management of the Fund and any potential economies of scale relating thereto. |
In keeping with its practice, the Board held two in-person meetings and one telephonic meeting to review and discuss the information provided. The Board also had the benefit of the advice of its independent counsel throughout the period.
Factors Considered
The Directors considered all of the information provided by the Advisor, the independent data providers, and the Board’s independent counsel, and evaluated such information for the Fund. In connection with their review, the Directors did not identify any single factor as being all-important or controlling, and each Director may have attributed different levels of importance to different factors. In deciding to renew the management agreement, the Board based its decision on a number of factors, including the following:
Nature, Extent and Quality of Services — Generally. Under the management agreement, the Advisor is responsible for providing or arranging for all services necessary for the operation of the Fund. The Board noted that under the management agreement, the Advisor provides or arranges at its own expense a wide variety of services including:
| constructing and designing the Fund |
| portfolio research and security selection |
| initial capitalization/funding |
| daily valuation of the Fund’s portfolio |
| shareholder servicing and transfer agency, including shareholder confirmations, recordkeeping, and communications |
| regulatory and portfolio compliance |
| • | marketing and distribution |
The Board noted that many of these services have expanded over time both in terms of quantity and complexity in response to shareholder demands, competition in the industry, changing distribution channels, and the changing regulatory environment.
Investment Management Services. The nature of the investment management services provided to the Fund is quite complex and allows Fund shareholders access to professional money management, instant diversification of their investments within an asset class, the opportunity to easily diversify among asset classes by investing in or exchanging among various American Century Investments funds, and liquidity. In evaluating investment performance, the Board expects the Advisor to manage the Fund in accordance with its investment objectives and approved strategies. Further, the Directors recognize that the Advisor has an obligation to seek the best execution of fund trades. In providing these services, the Advisor utilizes teams of investment professionals (portfolio managers, analysts, research assistants, and securities traders) who require extensive information technology, research, training, compliance and other systems to conduct their business. The Board, directly and through its Portfolio Committee, regularly reviews investment performance information for the Fund, together with comparative information for appropriate benchmarks and/or peer groups of similarly-managed funds, over different time horizons. The Directors also review detailed performance information during the management agreement approval
process. If performance concerns are identified, the Fund receives special reviews until performance improves, during which the Board discusses with the Advisor the reasons for such results (e.g., market conditions, security selection) and any efforts being undertaken to improve performance. The Board found the investment management services provided by the Advisor to the Fund to meet or exceed industry standards. More detailed information about the Fund’s performance can be found in the Performance and Portfolio Commentary sections of this report.
Shareholder and Other Services. Under the management agreement, the Advisor provides the Fund with a comprehensive package of transfer agency, shareholder, and other services. The Board, directly and through various committees of the Board, regularly reviews reports and evaluations of such services at its regular meetings. These reports include, but are not limited to, information regarding the operational efficiency and accuracy of the shareholder and transfer agency services provided, staffing levels, shareholder satisfaction (as measured by external as well as internal sources), technology support, new products and services offered to Fund shareholders, securities trading activities, portfolio valuation services, auditing services, and legal and operational compliance activities. Certain aspects of shareholder and transfer agency service level efficiency and the quality of securities trading activities are measured by independent third party providers and are presented in comparison to other fund groups not managed by the Advisor. The Board found the services provided by the Advisor to the Fund under the management agreement to be competitive and of high quality.
Costs of Services and Profitability. The Advisor provides detailed information concerning its cost of providing various services to the Fund, its profitability in managing the Fund, its overall profitability, and its financial condition. The Directors have reviewed with the Advisor the methodology used to prepare this financial information. The financial information regarding the Advisor is considered in evaluating the Advisor’s financial condition, ability to continue to provide services under the management agreement, and the reasonableness of the current management fee. The Board concluded that the Advisor’s profits were reasonable in light of the services provided to the Fund.
Ethics. The Board generally considers the Advisor’s commitment to providing quality services to shareholders and to conducting its business ethically. They noted that the Advisor’s practices generally meet or exceed industry best practices.
Economies of Scale. The Board also reviewed information provided by the Advisor regarding the possible existence of economies of scale in connection with the management of the Fund. The Board concluded that economies of scale are difficult to measure and predict with precision, especially on a fund-by-fund basis. The Board concluded that the Advisor is appropriately sharing economies of scale through its competitive fee structure, offering competitive fees from fund inception, and through reinvestment in its business to provide shareholders additional content and services.
Comparison to Other Funds’ Fees. The management agreement provides that the Fund pay the Advisor a single, all-inclusive (or unified) management fee for providing all services necessary for the management and operation of the Fund, other than brokerage expenses, taxes, interest, extraordinary expenses, and the fees and expenses of the Fund’s independent directors (including their independent legal counsel) and expenses incurred in connection with the provision of shareholder services and distribution services under a plan adopted pursuant to Rule 12b-1 under the 1940 Act. Under the unified fee structure, the Advisor is responsible for providing all investment advisory, custody, audit, administrative, compliance, recordkeeping, marketing and shareholder services, or arranging and supervising third parties to provide such services. By contrast, most other funds are charged a variety of fees, including an investment advisory fee, a transfer agency fee, an administrative fee, distribution charges and other expenses. Other than their investment advisory fees and any applicable Rule 12b-1 distribution fees, all other components of the total fees charged by these other funds may be increased without shareholder approval. The Board believes the unified fee structure is a benefit to Fund shareholders because it clearly discloses to shareholders the cost of owning Fund shares, and, since the unified fee cannot be increased without a vote of Fund shareholders, it shifts to the Advisor the risk of increased costs of operating the Fund and provides a direct incentive to minimize administrative inefficiencies. Part of the Board’s analysis of fee levels involves reviewing certain evaluative data compiled by an independent provider and comparing the Fund’s unified fee to the total expense ratio of other funds in the Fund’s peer group. The Board concluded that the management fee paid by the Fund to the Advisor under the management agreement is reasonable in light of the services provided to the Fund.
Comparison to Fees and Services Provided to Other Clients of the Advisor. The Board also requested and received information from the Advisor concerning the nature of the services, fees, costs and profitability of its advisory services to advisory clients other than the Fund. They observed that these varying types of client accounts require different services and involve different regulatory and entrepreneurial risks than the management of the Fund. The Board analyzed this information and concluded that the fees charged and services provided to the Fund were reasonable by comparison.
Collateral or “Fall-Out” Benefits Derived by the Advisor. The Board considered the existence of collateral benefits the Advisor may receive as a result of its relationship with the Fund. They concluded that the Advisor’s primary business is managing mutual funds and it generally does not use fund or shareholder information to generate profits in other lines of business, and therefore does not derive any significant collateral benefits from them. The Board noted that the Advisor receives proprietary research from broker-dealers that execute fund portfolio transactions and concluded that this research is likely to benefit Fund shareholders. The Board also determined that the Advisor is able to provide investment management services to certain clients other than the Fund, at least in part, due to its existing infrastructure built to serve the fund complex. The Board concluded, however, that the assets of those other clients are not material to the analysis and, where applicable, may be included with the assets of the Fund to determine breakpoints in the management fee schedule.
Existing Relationship. The Board also considered whether there was any reason for not continuing the existing arrangement with the Advisor. In this regard, the Board was mindful of the potential disruptions of the Fund’s operations and various risks, uncertainties, and other effects that could occur as a result of a decision not to continue such relationship. In particular, the Board recognized that most shareholders have invested in the Fund on the strength of the Advisor’s industry standing and reputation and in the expectation that the Advisor will have a continuing role in providing advisory services to the Fund.
Conclusion of the Directors. As a result of this process, the Board, including all of the independent directors and assisted by the advice of independent legal counsel, taking into account all of the factors discussed above and the information provided by the Advisor and others, concluded that the management agreement between the Fund and the Advisor is fair and reasonable in light of the services provided and should be renewed.
Retirement Account Information
As required by law, distributions you receive from certain IRAs, or 403(b), 457 and qualified plans are subject to federal income tax withholding, unless you elect not to have withholding apply. Tax will be withheld on the total amount withdrawn even though you may be receiving amounts that are not subject to withholding, such as nondeductible contributions. In such case, excess amounts of withholding could occur. You may adjust your withholding election so that a greater or lesser amount will be withheld.
If you don’t want us to withhold on this amount, you must notify us to not withhold the federal income tax. You may notify us in writing or in certain situations by telephone or through other electronic means. You have the right to revoke your withholding election at any time and any election you make may remain in effect until revoked by filing a new election.
Remember, even if you elect not to have income tax withheld, you are liable for paying income tax on the taxable portion of your withdrawal. If you elect not to have income tax withheld or you don’t have enough income tax withheld, you may be responsible for payment of estimated tax. You may incur penalties under the estimated tax rules if your withholding and estimated tax payments are not sufficient. You can reduce or defer the income tax on a distribution by directly or indirectly rolling such distribution over to another IRA or eligible plan. You should consult your tax advisor for additional information.
State tax will be withheld if, at the time of your distribution, your address is within one of the mandatory withholding states and you have federal income tax withheld. State taxes will be withheld from your distribution in accordance with the respective state rules.
Proxy Voting Guidelines
American Century Investment Management, Inc., the fund’s investment advisor, is responsible for exercising the voting rights associated with the securities purchased and/or held by the fund. A description of the policies and procedures the advisor uses in fulfilling this responsibility is available without charge, upon request, by calling 1-800-345-2021. It is also available on American Century Investments’ website at americancentury.com and on the Securities and Exchange Commission’s website at sec.gov. Information regarding how the investment advisor voted proxies relating to portfolio securities during the most recent 12-month period ended June 30 is available on the “About Us” page at americancentury.com. It is also available at sec.gov.
Quarterly Portfolio Disclosure
The fund files its complete schedule of portfolio holdings with the Securities and Exchange Commission (SEC) for the first and third quarters of each fiscal year on Form N-Q. The fund’s Forms N-Q are available on the SEC’s website at sec.gov, and may be reviewed and copied at the SEC’s Public Reference Room in Washington, DC. Information on the operation of the Public Reference Room may be obtained by calling 1-800-SEC-0330. The fund also makes its complete schedule of portfolio holdings for the most recent quarter of its fiscal year available on its website at americancentury.com and, upon request, by calling 1-800-345-2021.
Other Tax Information
The following information is provided pursuant to provisions of the Internal Revenue Code.
The fund hereby designates up to the maximum amount allowable as qualified dividend income for the fiscal year ended June 30, 2011.
For corporate taxpayers, the fund hereby designates $8,638,698, or up to the maximum amount allowable, of ordinary income distributions paid during the fiscal year ended June 30, 2011 as qualified for the corporate dividends received deduction.
| Contact Us | americancentury.com |
| Automated Information Line | 1-800-345-8765 |
| Investor Services Representative | 1-800-345-2021 or 816-531-5575 |
| Investors Using Advisors | 1-800-378-9878 |
| Business, Not-For-Profit, Employer-Sponsored Retirement Plans | 1-800-345-3533 |
| Banks and Trust Companies, Broker-Dealers, Financial Professionals, Insurance Companies | 1-800-345-6488 |
| Telecommunications Device for the Deaf | 1-800-634-4113 |
American Century Quantitative Equity Funds, Inc.
Investment Advisor:
American Century Investment Management, Inc.
Kansas City, Missouri
This report and the statements it contains are submitted for the general information of our shareholders. The report is not authorized for distribution to prospective investors unless preceded or accompanied by an effective prospectus.
©2011 American Century Proprietary Holdings, Inc. All rights reserved.
CL-ANN-72453 1108
ITEM 2. CODE OF ETHICS.
| (a) | The registrant has adopted a Code of Ethics for Senior Financial Officers that applies to the registrant’s principal executive officer, principal financial officer, principal accounting officer, and persons performing similar functions. |
| (f) | The registrant’s Code of Ethics for Senior Financial Officers was filed as Exhibit 12 (a)(1) to American Century Asset Allocation Portfolios, Inc.’s Annual Certified Shareholder Report on Form N-CSR, File No. 811-21591, on September 29, 2005, and is incorporated herein by reference. |
ITEM 3. AUDIT COMMITTEE FINANCIAL EXPERT.
| (a)(1) | The registrant's board has determined that the registrant has at least one audit committee financial expert serving on its audit committee. |
| (a)(2) | Tanya S. Beder, Peter F. Pervere and Ronald J. Gilson are the registrant's designated audit committee financial experts. They are "independent" as defined in Item 3 of Form N-CSR. |
ITEM 4. PRINCIPAL ACCOUNTANT FEES AND SERVICES.
The aggregate fees billed for each of the last two fiscal years for professional services rendered by the principal accountant for the audit of the registrant’s annual financial statements or services that are normally provided by the accountant in connection with statutory and regulatory filings or engagements for those fiscal years were as follows:
FY 2010: $ 276,995
FY 2011: $ 277,689
The aggregate fees billed in each of the last two fiscal years for assurance and related services by the principal accountant that are reasonably related to the performance of the audit of the registrant’s financial statements and are not reported under paragraph (a) of this Item were as follows:
| | For services rendered to the registrant: |
Fees required to be approved pursuant to paragraph (c)(7)(ii) of Rule 2-01 of Regulation S-X (relating to certain engagements for non-audit services with the registrant’s investment adviser and its affiliates):
The aggregate fees billed in each of the last two fiscal years for professional services rendered by the principal accountant for tax compliance, tax advice, and tax planning were as follows:
| | For services rendered to the registrant: |
FY 2010: $ 0
FY 2011: $ 0
Fees required to be approved pursuant to paragraph (c)(7)(ii) of Rule 2-01 of Regulation S-X (relating to certain engagements for non-audit services with the registrant’s investment adviser and its affiliates):
FY 2010: $ 0
FY 2011: $ 0
The aggregate fees billed in each of the last two fiscal years for products and services provided by the principal accountant, other than the services reported in paragraphs (a) through (c) of this Item were as follows:
| | For services rendered to the registrant: |
Fees required to be approved pursuant to paragraph (c)(7)(ii) of Rule 2-01 of Regulation S-X (relating to certain engagements for non-audit services with the registrant’s investment adviser and its affiliates):
| (e)(1) | In accordance with paragraph (c)(7)(i)(A) of Rule 2-01 of Regulation S-X, before the accountant is engaged by the registrant to render audit or non-audit services, the engagement is approved by the registrant’s audit committee. Pursuant to paragraph (c)(7)(ii) of Rule 2-01 of Regulation S-X, the registrant’s audit committee also pre-approves its accountant’s engagements for non-audit services with the registrant’s investment adviser, its parent company, and any entity controlled by, or under common control with the investment adviser that provides ongoing services to the registrant, if the engagement relates directly to the operations and financial reporting of the registrant. |
| (e)(2) | All services described in each of paragraphs (b) through (d) of this Item were pre-approved before the engagement by the registrant’s audit committee pursuant to paragraph (c)(7)(i)(A) of Rule 2-01 of Regulation S-X. Consequently, none of such services were required to be approved by the audit committee pursuant to paragraph (c)(7)(i)(C). |
| (f) | The percentage of hours expended on the principal accountant’s engagement to audit the registrant’s financial statements for the most recent fiscal year that were attributed to work performed by persons other than the principal accountant’s full-time, permanent employees was less than 50%. |
| (g) | The aggregate non-audit fees billed by the registrant’s accountant for services rendered to the registrant, and rendered to the registrant’s investment adviser (not including any sub-adviser whose role is primarily portfolio management and is subcontracted with or overseen by another investment adviser), and any entity controlling, controlled by, or under common control with the adviser that provides ongoing services to the registrant for each of the last two fiscal years of the registrant were as follows: |
FY 2010: $ 178,950
FY 2011: $ 187,038
| (h) | The registrant’s investment adviser and accountant have notified the registrant’s audit committee of all non-audit services that were rendered by the registrant’s accountant to the registrant’s investment adviser, its parent company, and any entity controlled by, or under common control with the investment adviser that provides services to the registrant, which services were not required to be pre-approved pursuant to paragraph (c)(7)(ii) of Rule 2-01 of Regulation S-X. The notification provided to the registrant’s audit committee included sufficient details regarding such services to allow the registrant’s audit committee to consider the continuing independence of its principal accountant. |
ITEM 5. AUDIT COMMITTEE OF LISTED REGISTRANTS.
Not applicable.
ITEM 6. INVESTMENTS.
| (a) | The schedule of investments is included as part of the report to stockholders filed under Item 1 of this Form. |
ITEM 7. DISCLOSURE OF PROXY VOTING POLICIES AND PROCEDURES FOR CLOSED-END MANAGEMENT INVESTMENT COMPANIES.
Not applicable.
ITEM 8. PORTFOLIO MANAGERS OF CLOSED-END MANAGEMENT INVESTMENT COMPANIES.
Not applicable.
ITEM 9. PURCHASES OF EQUITY SECURITIES BY CLOSED-END MANAGEMENT INVESTMENT COMPANY AND AFFILIATED PURCHASERS.
Not applicable.
ITEM 10. SUBMISSION OF MATTERS TO A VOTE OF SECURITY HOLDERS.
During the reporting period, there were no material changes to the procedures by which shareholders may recommend nominees to the registrant’s board.
ITEM 11. CONTROLS AND PROCEDURES.
| (a) | The registrant's principal executive officer and principal financial officer have concluded that the registrant's disclosure controls and procedures (as defined in Rule 30a-3(c) under the Investment Company Act of 1940) are effective based on their evaluation of these controls and procedures as of a date within 90 days of the filing date of this report. |
| (b) | There were no changes in the registrant's internal control over financial reporting (as defined in Rule 30a-3(d) under the Investment Company Act of 1940) that occurred during the registrant's second fiscal quarter of the period covered by this report that have materially affected, or are reasonably likely to materially affect, the registrant's internal control over financial reporting. |
ITEM 12. EXHIBITS.
| (a)(1) | Registrant’s Code of Ethics for Senior Financial Officers, which is the subject of the disclosure required by Item 2 of Form N-CSR, was filed as Exhibit 12(a)(1) to American Century Asset Allocation Portfolios, Inc.’s Certified Shareholder Report on Form N-CSR, File No. 811-21591, on September 29, 2005. |
| (a)(2) | Separate certifications by the registrant’s principal executive officer and principal financial officer, pursuant to Section 302 of the Sarbanes-Oxley Act of 2002 and Rule 30a-2(a) under the Investment Company Act of 1940, are filed and attached hereto as EX-99.CERT. |
| (b) | A certification by the registrant’s chief executive officer and chief financial officer, pursuant to Section 906 of the Sarbanes-Oxley Act of 2002, is furnished and attached hereto as EX-99.906CERT. |
Pursuant to the requirements of the Securities Exchange Act of 1934 and the Investment Company Act of 1940, the registrant has duly caused this report to be signed on its behalf by the undersigned, thereunto duly authorized.
| Registrant: | AMERICAN CENTURY QUANTITATIVE EQUITY FUNDS, INC. | |
| | | | |
| | | | |
| By: | /s/ Jonathan S. Thomas | |
| | Name: | Jonathan S. Thomas | |
| | Title: | President | |
| | | | |
| Date: | August 29, 2011 | |
| | | |
Pursuant to the requirements of the Securities Exchange Act of 1934 and the Investment Company Act of 1940, this report has been signed below by the following persons on behalf of the registrant and in the capacities and on the dates indicated.
| By: | /s/ Jonathan S. Thomas | |
| | Name: | Jonathan S. Thomas | |
| | Title: | President | |
| | | (principal executive officer) | |
| | | | |
| | | | |
| Date: | August 29, 2011 | |
| By: | /s/ Robert J. Leach | |
| | Name: | Robert J. Leach | |
| | Title: | Vice President, Treasurer, and | |
| | | Chief Financial Officer | |
| | | (principal financial officer) | |
| | | | |
| Date: | August 29, 2011 | |