UNITED STATES
SECURITIES AND EXCHANGE COMMISSION
Washington, D.C. 20549
FORM N-CSR
CERTIFIED SHAREHOLDER REPORT OF REGISTERED
MANAGEMENT INVESTMENT COMPANIES
|
| | | | | | |
| Investment Company Act file number | 811-05447 |
| | |
| AMERICAN CENTURY QUANTITATIVE EQUITY FUNDS, INC. |
| (Exact name of registrant as specified in charter) |
| | |
| 4500 MAIN STREET, KANSAS CITY, MISSOURI | 64111 |
| (Address of principal executive offices) | (Zip Code) |
| | |
CHARLES A. ETHERINGTON 4500 MAIN STREET, KANSAS CITY, MISSOURI 64111 |
| (Name and address of agent for service) |
| | |
| Registrant’s telephone number, including area code: | 816-531-5575 |
| | |
| Date of fiscal year end: | 06-30 |
| | |
| Date of reporting period: | 06-30-2014 |
ITEM 1. REPORTS TO STOCKHOLDERS.
|
| |
ANNUAL REPORT | JUNE 30, 2014 |
Core Equity Plus Fund
|
| |
| President's Letter | |
| Performance | |
| Portfolio Commentary | |
| Fund Characteristics | |
| Shareholder Fee Example | |
| Schedule of Investments | |
| Statement of Assets and Liabilities | |
| Statement of Operations | |
| Statement of Changes in Net Assets | |
| Statement of Cash Flows | |
| Notes to Financial Statements | |
| Financial Highlights | |
| Report of Independent Registered Public Accounting Firm | |
| Management | |
| Approval of Management Agreement | |
| Additional Information | |
Any opinions expressed in this report reflect those of the author as of the date of the report, and do not necessarily represent the opinions of American Century Investments® or any other person in the American Century Investments organization. Any such opinions are subject to change at any time based upon market or other conditions and American Century Investments disclaims any responsibility to update such opinions. These opinions may not be relied upon as investment advice and, because investment decisions made by American Century Investments funds are based on numerous factors, may not be relied upon as an indication of trading intent on behalf of any American Century Investments fund. Security examples are used for representational purposes only and are not intended as recommendations to purchase or sell securities. Performance information for comparative indices and securities is provided to American Century Investments by third party vendors. To the best of American Century Investments’ knowledge, such information is accurate at the time of printing.
|
| |
| Dear Investor:
Thank you for reviewing this annual report for the 12 months ended June 30, 2014. It provides investment performance and portfolio information for the reporting period, plus longer-term historical performance data.
Annual reports remain important vehicles for conveying information about fund returns, including market and economic factors that affected performance during the reporting period. For additional, updated investment and market insights, we encourage you to visit our website, americancentury.com.
|
| Jonathan Thomas |
Aggressive Monetary Policies Boosted Stock and Bond Returns
Stimulative monetary policies and expectations of economic improvement, interspersed with concerns about weaker-than-expected economic data and geopolitical conflicts, helped drive financial market returns during the reporting period. We believe the combination of longer-term optimism about global economic growth, low costs of capital, and central bank purchases of fixed income securities helped persuade investors to seek risk and yield, especially in the U.S. and Europe. Stock index returns were strong in these markets, particularly at the smaller capitalization end of the company size spectrum. The MSCI Europe and S&P 500® indices advanced 29.28% and 24.61%, respectively.
Remarkably, for a period in which stock market performance was so strong, government bond performance was also generally positive. Not surprisingly, U.S. corporate high-yield bonds posted double-digit returns, but the 30-year U.S. Treasury bond also outperformed most broader bond market measures. In addition, a generally weaker U.S. dollar during the reporting period meant that international bond returns for U.S. investors with currency exposure were generally higher than U.S. bonds returns. The Barclays Global Aggregate Bond and Barclays U.S. Aggregate Bond indices returned 7.39% and 4.37%, respectively.
Looking ahead, we see signs of sustained moderate economic growth in the second half of 2014, but headwinds persist. In the U.S., which was supposed to be an economic growth leader this year, housing market momentum has slowed, interest rates could rise, and economic growth and U.S. employment levels remain subpar compared with past post-recession periods. In this environment, we continue to believe in a disciplined, diversified, long-term investment approach, using professionally managed stock and bond portfolios—as appropriate—for meeting financial goals. We appreciate your continued trust in us.
Sincerely,
Jonathan Thomas
President and Chief Executive Officer
American Century Investments
|
| | | | |
| Total Returns as of June 30, 2014 | | |
| | Average Annual Returns | |
| | Ticker Symbol | 1 year | Since Inception | Inception Date |
| Investor Class | ACPVX | 26.86% | 21.36% | 10/31/11 |
| S&P 500 Index | — | 24.61% | 20.90% | — |
| Institutional Class | ACPKX | 27.19% | 21.62% | 10/31/11 |
| A Class | ACPQX | | | 10/31/11 |
| No sales charge* | | 26.55% | 21.06% | |
| With sales charge* | | 19.31% | 18.40% | |
| C Class | ACPHX | 25.66% | 20.15% | 10/31/11 |
| R Class | ACPWX | 26.27% | 20.76% | 10/31/11 |
| |
| * | Sales charges include initial sales charges and contingent deferred sales charges (CDSCs), as applicable. A Class shares have a 5.75% maximum initial sales charge and may be subject to a maximum CDSC of 1.00%. C Class shares redeemed within 12 months of purchase are subject to a maximum CDSC of 1.00%. The SEC requires that mutual funds provide performance information net of maximum sales charges in all cases where charges could be applied. |
Data presented reflect past performance. Past performance is no guarantee of future results. Current performance may be higher or lower than the performance shown. Investment return and principal value will fluctuate, and redemption value may be more or less than original cost. To obtain performance data current to the most recent month end, please call 1-800-345-2021 or visit americancentury.com. The fund’s investment process may result in high portfolio turnover, which could mean high transaction costs, affecting both performance and capital gains tax liabilities to investors. In addition, its investment approach may involve higher price volatility, short sales risk, leverage risk and overweighting risk.
Unless otherwise indicated, performance reflects Investor Class shares; performance for other share classes will vary due to differences in fee structure. For information about other share classes available, please consult the prospectus. Data assumes reinvestment of dividends and capital gains, and none of the charts reflect the deduction of taxes that a shareholder would pay on fund distributions or the redemption of fund shares. Returns for the index are provided for comparison. The fund’s total returns include operating expenses (such as transaction costs and management fees) that reduce returns, while the total returns of the index do not.
|
|
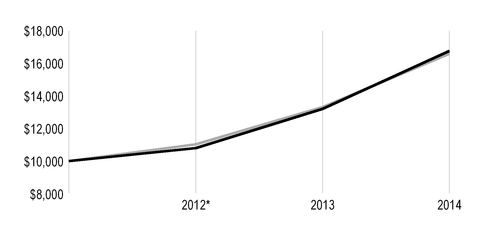
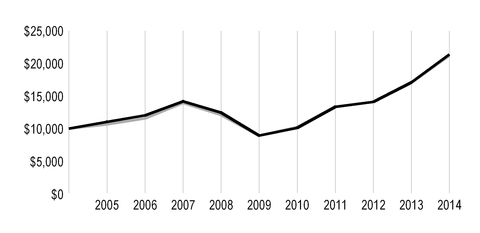
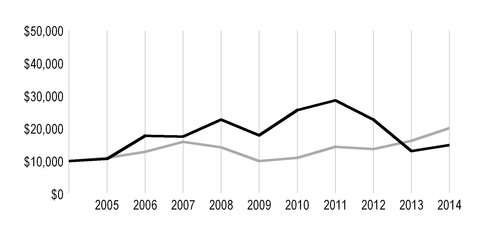
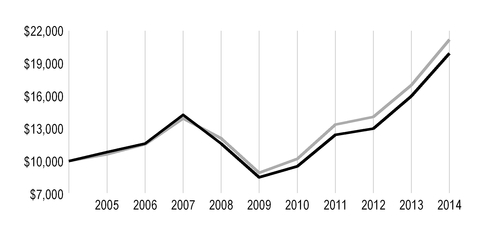
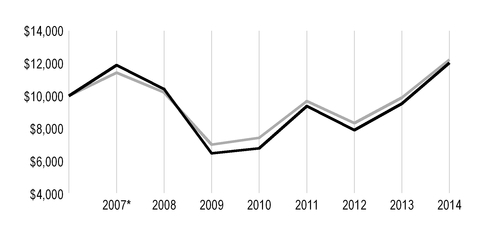
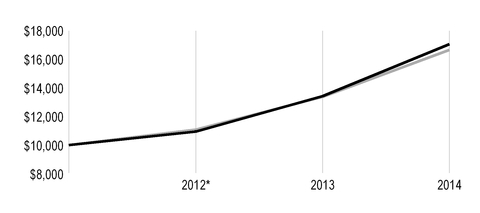
| Growth of $10,000 Over Life of Class |
| $10,000 investment made October 31, 2011 |
|
| |
| Value on June 30, 2014 |
| | Investor Class — $16,753 |
| |
| | S&P 500 Index — $16,585 |
| |
*From October 31, 2011, the Investor Class’s inception date. Not annualized.
|
| | | | |
| Total Annual Fund Operating Expenses |
| Investor Class | Institutional Class | A Class | C Class | R Class |
| 1.87% | 1.67% | 2.12% | 2.87% | 2.37% |
The total annual fund operating expenses shown is as stated in the fund’s prospectus current as of the date of this report. The prospectus may vary from the expense ratio shown elsewhere in this report because it is based on a different time period, includes acquired fund fees and expenses, and, if applicable, does not include fee waivers or expense reimbursements.
Data presented reflect past performance. Past performance is no guarantee of future results. Current performance may be higher or lower than the performance shown. Investment return and principal value will fluctuate, and redemption value may be more or less than original cost. To obtain performance data current to the most recent month end, please call 1-800-345-2021 or visit americancentury.com. The fund’s investment process may result in high portfolio turnover, which could mean high transaction costs, affecting both performance and capital gains tax liabilities to investors. In addition, its investment approach may involve higher price volatility, short sales risk, leverage risk and overweighting risk.
Unless otherwise indicated, performance reflects Investor Class shares; performance for other share classes will vary due to differences in fee structure. For information about other share classes available, please consult the prospectus. Data assumes reinvestment of dividends and capital gains, and none of the charts reflect the deduction of taxes that a shareholder would pay on fund distributions or the redemption of fund shares. Returns for the index are provided for comparison. The fund’s total returns include operating expenses (such as transaction costs and management fees) that reduce returns, while the total returns of the index do not.
Portfolio Managers: Scott Wittman, Bill Martin and Claudia Musat
Performance Summary
Core Equity Plus returned 26.86%* for the fiscal year ended June 30, 2014, compared with the 24.61% return of its benchmark, the S&P 500 Index.
As U.S. equity markets continued their robust appreciation, Core Equity Plus posted a solid gain for the 12-month period, outperforming the S&P 500 Index. The fund is managed to have a 100% net exposure to the equity market by investing approximately 130% of its net assets in long positions, while 30% of its net assets are sold short. The proceeds from the securities sold short are used to fund the purchase of the additional 30% of long positions. The portfolio’s stock selection process incorporates factors of valuation, quality, growth, and momentum (sentiment) while striving to minimize unintended risks along industries and other risk characteristics. Security selection in the consumer staples and industrials sectors contributed the most to fund results, while information technology holdings weighed on relative performance.
Consumer Staples and Industrials Outperformed
The consumer staples and industrials sectors were among the leading contributors to the fund’s returns relative to the S&P 500. Stock choices in the consumer staples sector, particularly among food products manufacturers and food and staples retailers, were especially effective, driving the sector's substantial outperformance relative to the index. Among the top sector contributors was a portfolio-only position in chain drug store Rite Aid, which rose on revenue growth and efficiency and distribution chain improvements, bolstering the sector’s return. Significant contribution also came from supermarket chain store operator Safeway, which appreciated on speculation of being acquired by private equity firm Cerberus Capital Management, owner of the Albertson’s chain of grocery stores. Following its appreciation, we took profits in Safeway and exited the position.
Several chicken processors helped boost the fund’s performance including a portfolio-only position in Pilgrim’s Pride, which rallied following management’s decision to bow out of the race with Tyson Foods to acquire Hillshire Brands.
Industrials sector outperformance was primarily due to successful stock selection and positioning in the strongly appreciating aerospace and defense industry. A number of defense contractors were key contributors, benefiting from an overall pickup in activity amid an improving economic landscape. Strong contributions came from Alliant Techsystems, which we sold to lock in gains,
as well as Northrop Grumman, which appreciated nearly 50% largely on new government contracts. A short position—which is designed to profit when a stock’s price declines—in DigitalGlobe, a provider of satellite imagery technology, also helped returns as the company’s stock declined during the period.
Significant contribution also came from several long positions among energy equipment manufacturers, including drilling and rig services provider Nabors Industries. The company, with robust quality and sentiment profiles, rallied over 70% during the period on solid earnings and merger news. Elsewhere, apparel manufacturer Hanesbrands’ earnings growth and announced intent to purchase French clothing manufacturer DBApparel, thereby increasing exposure in Europe, helped to drive its stock price higher.
* All fund returns referenced in this commentary are for Investor Class shares. Performance for other share classes will vary due to differences in fee structure; when Investor Class performance exceeds that of the fund's benchmark, other share classes may not. See page 3 for returns for all share classes.
Information Technology Was Leading Detractor
Security selection in the information technology sector was the principal detractor from the fund’s 12-month results. Semiconductor manufacturers were leading drivers of sector underperformance including a short position in solar power semiconductor manufacturer SunEdison, which benefited from several analyst upgrades based on a continued rise in solar power demand. Despite its climbing share value, we believe that the company is unappealing across valuation, quality, and growth measures, which justify the short position.
A number of long positions in the consumer discretionary sector, particularly in retail industries, declined during the period, negatively impacting the fund’s performance. These included office products superstore Staples, which was down nearly 30% on disappointing revenues and profits and an announcement of 225 store closings. Electronics retailer Best Buy reported weaker-than-expected holiday sales amid a promotional sales environment that failed to drive higher industry demand. Likewise, toy manufacturer Mattel diminished fund returns after disappointing holiday sales impacted the company’s earnings, and was subsequently sold. Other sector detractors included casino game equipment maker International Game Technology, which fell on disappointing earnings stemming from declining slot machine sales. We ultimately exited our position in the holding.
A Look Ahead
Economic recovery in the U.S. appears to be progressing, albeit at a slower pace than during prior post-recessionary periods, and is expected to stay the course through the remainder of 2014. Recent indicators such as improvements in small business and consumer confidence point to a sustainable rebound, and economic growth is likely to further benefit from the recovering labor and housing markets. Though a continuation of political instability in non-U.S. markets as well as the potential for rising inflation and interest rates could lead to heightened market volatility, our disciplined, objective, and systematic investment strategy is designed to take advantage of opportunities at the individual company level in both the long and short portions of the portfolio. We believe this approach is the most powerful way to capitalize on market inefficiencies that lead to the mispricing of individual stocks. The portfolio’s current holdings exhibit the highest exposure to quality insights, followed by value and growth, and we maintain positive exposure to sentiment. The fund's largest overweights, relative to the benchmark, are in health care and information technology, while the underweights are led by the financials and energy sectors.
|
| |
| JUNE 30, 2014 |
| Top Ten Long Holdings | % of net assets |
| Apple, Inc. | 4.03% |
| Johnson & Johnson | 2.41% |
| AT&T, Inc. | 1.78% |
| Verizon Communications, Inc. | 1.75% |
| Pfizer, Inc. | 1.75% |
| Intel Corp. | 1.73% |
| Merck & Co., Inc. | 1.71% |
| Exxon Mobil Corp. | 1.70% |
| Oracle Corp. | 1.55% |
| Cisco Systems, Inc. | 1.51% |
| | |
| Top Five Short Holdings | % of net assets |
| New Gold, Inc. | (0.90)% |
| Conn's, Inc. | (0.86)% |
| SunEdison, Inc. | (0.84)% |
| Iron Mountain, Inc. | (0.81)% |
| Chart Industries, Inc. | (0.79)% |
| | |
| Types of Investments in Portfolio | % of net assets |
| Common Stocks | 128.7% |
| Common Stocks Sold Short | (30.2)% |
| Temporary Cash Investments | 1.5% |
| Other Assets and Liabilities | —* |
*Category is less than 0.05% of total net assets.
Fund shareholders may incur two types of costs: (1) transaction costs, including sales charges (loads) on purchase payments and redemption/exchange fees; and (2) ongoing costs, including management fees; distribution and service (12b-1) fees; and other fund expenses. This example is intended to help you understand your ongoing costs (in dollars) of investing in your fund and to compare these costs with the ongoing cost of investing in other mutual funds.
The example is based on an investment of $1,000 made at the beginning of the period and held for the entire period from January 1, 2014 to June 30, 2014.
Actual Expenses
The table provides information about actual account values and actual expenses for each class. You may use the information, together with the amount you invested, to estimate the expenses that you paid over the period. First, identify the share class you own. Then simply divide your account value by $1,000 (for example, an $8,600 account value divided by $1,000 = 8.6), then multiply the result by the number under the heading “Expenses Paid During Period” to estimate the expenses you paid on your account during this period.
If you hold Investor Class shares of any American Century Investments fund, or Institutional Class shares of the American Century Diversified Bond Fund, in an American Century Investments account (i.e., not a financial intermediary or retirement plan account), American Century Investments may charge you a $12.50 semiannual account maintenance fee if the value of those shares is less than $10,000. We will redeem shares automatically in one of your accounts to pay the $12.50 fee. In determining your total eligible investment amount, we will include your investments in all personal accounts (including American Century Investments Brokerage accounts) registered under your Social Security number. Personal accounts include individual accounts, joint accounts, UGMA/UTMA accounts, personal trusts, Coverdell Education Savings Accounts and IRAs (including traditional, Roth, Rollover, SEP-, SARSEP- and SIMPLE-IRAs), and certain other retirement accounts. If you have only business, business retirement, employer-sponsored or American Century Investments Brokerage accounts, you are currently not subject to this fee. If you are subject to the Account Maintenance Fee, your account value could be reduced by the fee amount.
Hypothetical Example for Comparison Purposes
The table also provides information about hypothetical account values and hypothetical expenses based on the actual expense ratio of each class of your fund and an assumed rate of return of 5% per year before expenses, which is not the actual return of a fund’s share class. The hypothetical account values and expenses may not be used to estimate the actual ending account balance or expenses you paid for the period. You may use this information to compare the ongoing costs of investing in your fund and other funds. To do so, compare this 5% hypothetical example with the 5% hypothetical examples that appear in the shareholder reports of the other funds.
Please note that the expenses shown in the table are meant to highlight your ongoing costs only and do not reflect any transactional costs, such as sales charges (loads) or redemption/exchange fees. Therefore, the table is useful in comparing ongoing costs only, and will not help you determine the relative total costs of owning different funds. In addition, if these transactional costs were included, your costs would have been higher.
|
| | | | |
| | Beginning Account Value 1/1/14 | Ending Account Value 6/30/14 | Expenses Paid During Period(1) 1/1/14 – 6/30/14 | Annualized Expense Ratio(1) |
| Actual |
| Investor Class | $1,000 | $1,071.60 | $8.73 | 1.70% |
| Institutional Class | $1,000 | $1,073.20 | $7.71 | 1.50% |
| A Class | $1,000 | $1,070.40 | $10.01 | 1.95% |
| C Class | $1,000 | $1,066.80 | $13.84 | 2.70% |
| R Class | $1,000 | $1,069.30 | $11.29 | 2.20% |
| Hypothetical |
| Investor Class | $1,000 | $1,016.36 | $8.50 | 1.70% |
| Institutional Class | $1,000 | $1,017.36 | $7.50 | 1.50% |
| A Class | $1,000 | $1,015.13 | $9.74 | 1.95% |
| C Class | $1,000 | $1,011.41 | $13.47 | 2.70% |
| R Class | $1,000 | $1,013.89 | $10.99 | 2.20% |
| |
| (1) | Expenses are equal to the class’s annualized expense ratio listed in the table above, multiplied by the average account value over the period, multiplied by 181, the number of days in the most recent fiscal half-year, divided by 365, to reflect the one-half year period. |
JUNE 30, 2014
|
| | | | | |
| | Shares | Value |
| COMMON STOCKS — 128.7% | | |
| AEROSPACE AND DEFENSE — 5.4% | | |
Boeing Co. (The)(1) | 14,574 |
| $ | 1,854,250 |
|
Esterline Technologies Corp.(1)(2) | 2,823 |
| 324,984 |
|
General Dynamics Corp.(1) | 2,372 |
| 276,457 |
|
Honeywell International, Inc.(1) | 16,729 |
| 1,554,960 |
|
| Lockheed Martin Corp. | 9,445 |
| 1,518,095 |
|
Moog, Inc., Class A(2) | 3,890 |
| 283,542 |
|
Northrop Grumman Corp.(1) | 10,945 |
| 1,309,350 |
|
Raytheon Co.(1) | 15,040 |
| 1,387,440 |
|
| | | 8,509,078 |
|
| AIR FREIGHT AND LOGISTICS — 0.6% | | |
United Parcel Service, Inc., Class B(1) | 9,613 |
| 986,871 |
|
| AIRLINES — 1.8% | | |
JetBlue Airways Corp.(1)(2) | 128,540 |
| 1,394,659 |
|
Southwest Airlines Co.(1) | 53,473 |
| 1,436,285 |
|
| | | 2,830,944 |
|
| AUTO COMPONENTS — 2.8% | | |
Gentex Corp.(1) | 34,879 |
| 1,014,630 |
|
Johnson Controls, Inc.(1) | 30,121 |
| 1,503,942 |
|
Magna International, Inc.(1) | 10,959 |
| 1,180,832 |
|
Tenneco, Inc.(2) | 11,247 |
| 738,928 |
|
| | | 4,438,332 |
|
| BANKS — 3.6% | | |
Bank of America Corp.(1) | 147,974 |
| 2,274,361 |
|
Citigroup, Inc.(1) | 34,143 |
| 1,608,135 |
|
JPMorgan Chase & Co.(1) | 14,066 |
| 810,483 |
|
Wells Fargo & Co.(1) | 17,829 |
| 937,092 |
|
| | | 5,630,071 |
|
| BEVERAGES — 1.0% | | |
Coca-Cola Co. (The)(1) | 4,501 |
| 190,662 |
|
| Dr Pepper Snapple Group, Inc. | 21,533 |
| 1,261,403 |
|
PepsiCo, Inc.(1) | 1,194 |
| 106,672 |
|
| | | 1,558,737 |
|
| BIOTECHNOLOGY — 3.1% | | |
Alexion Pharmaceuticals, Inc.(1)(2) | 559 |
| 87,344 |
|
Amgen, Inc.(1) | 9,727 |
| 1,151,385 |
|
Biogen Idec, Inc.(1)(2) | 3,299 |
| 1,040,208 |
|
Celgene Corp.(1)(2) | 10,828 |
| 929,909 |
|
Gilead Sciences, Inc.(1)(2) | 9,310 |
| 771,892 |
|
Isis Pharmaceuticals, Inc.(2) | 6,159 |
| 212,177 |
|
Myriad Genetics, Inc.(1)(2) | 8,811 |
| 342,924 |
|
United Therapeutics Corp.(1)(2) | 4,168 |
| 368,826 |
|
| | | 4,904,665 |
|
|
| | | | | |
| | Shares | Value |
| CAPITAL MARKETS — 2.5% | | |
Affiliated Managers Group, Inc.(2) | 3,825 |
| $ | 785,655 |
|
Franklin Resources, Inc.(1) | 22,331 |
| 1,291,625 |
|
| Janus Capital Group, Inc. | 29,190 |
| 364,291 |
|
SEI Investments Co.(1) | 22,576 |
| 739,816 |
|
Stifel Financial Corp.(2) | 14,123 |
| 668,724 |
|
| | | 3,850,111 |
|
| CHEMICALS — 5.3% | | |
| Ashland, Inc. | 10,978 |
| 1,193,748 |
|
Cabot Corp.(1) | 15,395 |
| 892,756 |
|
Dow Chemical Co. (The)(1) | 35,622 |
| 1,833,108 |
|
| Eastman Chemical Co. | 10,287 |
| 898,570 |
|
Olin Corp.(1) | 28,945 |
| 779,199 |
|
PPG Industries, Inc.(1) | 7,561 |
| 1,588,944 |
|
Scotts Miracle-Gro Co. (The), Class A(1) | 18,334 |
| 1,042,471 |
|
| | | 8,228,796 |
|
| COMMERCIAL SERVICES AND SUPPLIES — 1.4% | | |
Deluxe Corp.(1) | 17,495 |
| 1,024,857 |
|
RR Donnelley & Sons Co.(1) | 61,155 |
| 1,037,189 |
|
| Steelcase, Inc., Class A | 8,529 |
| 129,044 |
|
| | | 2,191,090 |
|
| COMMUNICATIONS EQUIPMENT — 3.7% | | |
Brocade Communications Systems, Inc.(1) | 119,948 |
| 1,103,522 |
|
Cisco Systems, Inc.(1) | 94,966 |
| 2,359,905 |
|
QUALCOMM, Inc.(1) | 29,572 |
| 2,342,102 |
|
| | | 5,805,529 |
|
| CONSTRUCTION AND ENGINEERING — 0.7% | | |
AECOM Technology Corp.(1)(2) | 35,122 |
| 1,130,928 |
|
| CONSUMER FINANCE — 1.4% | | |
Cash America International, Inc.(1) | 27,621 |
| 1,227,201 |
|
Credit Acceptance Corp.(1)(2) | 8,117 |
| 999,203 |
|
| | | 2,226,404 |
|
| CONTAINERS AND PACKAGING — 1.4% | | |
| Ball Corp. | 16,395 |
| 1,027,639 |
|
Sonoco Products Co.(1) | 26,330 |
| 1,156,677 |
|
| | | 2,184,316 |
|
| DIVERSIFIED CONSUMER SERVICES — 0.1% | | |
Apollo Education Group, Inc., Class A(1)(2) | 4,563 |
| 142,594 |
|
| DIVERSIFIED FINANCIAL SERVICES — 0.7% | | |
Berkshire Hathaway, Inc., Class B(1)(2) | 6,295 |
| 796,695 |
|
| Voya Financial, Inc. | 6,453 |
| 234,502 |
|
| | | 1,031,197 |
|
| DIVERSIFIED TELECOMMUNICATION SERVICES — 3.5% | | |
AT&T, Inc.(1) | 78,519 |
| 2,776,432 |
|
Verizon Communications, Inc.(1) | 55,883 |
| 2,734,355 |
|
| | | 5,510,787 |
|
|
| | | | | |
| | Shares | Value |
| ELECTRICAL EQUIPMENT — 1.8% | | |
Emerson Electric Co.(1) | 21,673 |
| $ | 1,438,220 |
|
Rockwell Automation, Inc.(1) | 11,248 |
| 1,407,800 |
|
| | | 2,846,020 |
|
| ELECTRONIC EQUIPMENT, INSTRUMENTS AND COMPONENTS — 1.0% | |
Dolby Laboratories, Inc., Class A(1)(2) | 17,982 |
| 776,822 |
|
TE Connectivity Ltd.(1) | 12,982 |
| 802,807 |
|
| | | 1,579,629 |
|
| ENERGY EQUIPMENT AND SERVICES — 3.7% | | |
Baker Hughes, Inc.(1) | 23,792 |
| 1,771,314 |
|
Nabors Industries Ltd.(1) | 37,298 |
| 1,095,442 |
|
| National Oilwell Varco, Inc. | 2,125 |
| 174,994 |
|
RPC, Inc.(1) | 49,603 |
| 1,165,175 |
|
| Schlumberger Ltd. | 13,674 |
| 1,612,848 |
|
| | | 5,819,773 |
|
| FOOD AND STAPLES RETAILING — 0.7% | | |
Rite Aid Corp.(1)(2) | 157,479 |
| 1,129,124 |
|
| FOOD PRODUCTS — 3.7% | | |
Archer-Daniels-Midland Co.(1) | 31,804 |
| 1,402,874 |
|
Kellogg Co.(1) | 19,446 |
| 1,277,602 |
|
Keurig Green Mountain, Inc.(1) | 1,698 |
| 211,588 |
|
Pilgrim's Pride Corp.(1)(2) | 55,950 |
| 1,530,792 |
|
Tyson Foods, Inc., Class A(1) | 34,383 |
| 1,290,738 |
|
| | | 5,713,594 |
|
| HEALTH CARE EQUIPMENT AND SUPPLIES — 4.6% | | |
Align Technology, Inc.(1)(2) | 1,824 |
| 102,217 |
|
| Becton Dickinson and Co. | 4,659 |
| 551,160 |
|
Boston Scientific Corp.(1)(2) | 76,314 |
| 974,530 |
|
| C.R. Bard, Inc. | 5,083 |
| 726,920 |
|
| Covidien plc | 1,137 |
| 102,534 |
|
DexCom, Inc.(2) | 3,687 |
| 146,226 |
|
| Hill-Rom Holdings, Inc. | 18,747 |
| 778,188 |
|
Medtronic, Inc.(1) | 27,558 |
| 1,757,098 |
|
St. Jude Medical, Inc.(1) | 19,951 |
| 1,381,607 |
|
Stryker Corp.(1) | 8,394 |
| 707,782 |
|
| | | 7,228,262 |
|
| HEALTH CARE PROVIDERS AND SERVICES — 1.5% | | |
Cardinal Health, Inc.(1) | 19,586 |
| 1,342,816 |
|
Centene Corp.(2) | 2,842 |
| 214,884 |
|
Express Scripts Holding Co.(1)(2) | 10,954 |
| 759,441 |
|
| | | 2,317,141 |
|
| HOTELS, RESTAURANTS AND LEISURE — 2.2% | | |
Bally Technologies, Inc.(1)(2) | 16,810 |
| 1,104,753 |
|
| Las Vegas Sands Corp. | 10,115 |
| 770,966 |
|
| Royal Caribbean Cruises Ltd. | 12,542 |
| 697,335 |
|
| Wyndham Worldwide Corp. | 11,450 |
| 866,994 |
|
| | | 3,440,048 |
|
|
| | | | | |
| | Shares | Value |
| HOUSEHOLD DURABLES — 2.2% | | |
Newell Rubbermaid, Inc.(1) | 37,158 |
| $ | 1,151,526 |
|
NVR, Inc.(1)(2) | 90 |
| 103,554 |
|
PulteGroup, Inc.(1) | 52,847 |
| 1,065,396 |
|
Whirlpool Corp.(1) | 7,500 |
| 1,044,150 |
|
| | | 3,364,626 |
|
| HOUSEHOLD PRODUCTS — 2.3% | | |
Energizer Holdings, Inc.(1) | 11,310 |
| 1,380,159 |
|
Kimberly-Clark Corp.(1) | 13,755 |
| 1,529,831 |
|
Procter & Gamble Co. (The)(1) | 8,993 |
| 706,760 |
|
| | | 3,616,750 |
|
| INDEPENDENT POWER AND RENEWABLE ELECTRICITY PRODUCERS — 0.8% |
AES Corp. (The)(1) | 83,579 |
| 1,299,653 |
|
| INDUSTRIAL CONGLOMERATES — 1.9% | | |
3M Co.(1) | 2,637 |
| 377,724 |
|
Danaher Corp.(1) | 20,032 |
| 1,577,119 |
|
General Electric Co.(1) | 40,621 |
| 1,067,520 |
|
| | | 3,022,363 |
|
| INSURANCE — 4.0% | | |
Allstate Corp. (The)(1) | 4,788 |
| 281,151 |
|
American International Group, Inc.(1) | 34,776 |
| 1,898,074 |
|
Amtrust Financial Services, Inc.(1) | 25,911 |
| 1,083,339 |
|
Aspen Insurance Holdings Ltd.(1) | 17,013 |
| 772,730 |
|
| Hanover Insurance Group, Inc. (The) | 5,170 |
| 326,486 |
|
Old Republic International Corp.(1) | 40,925 |
| 676,900 |
|
RenaissanceRe Holdings Ltd.(1) | 10,909 |
| 1,167,263 |
|
| | | 6,205,943 |
|
| INTERNET AND CATALOG RETAIL — 2.0% | | |
Amazon.com, Inc.(2) | 2,299 |
| 746,669 |
|
Expedia, Inc.(1) | 16,335 |
| 1,286,545 |
|
HSN, Inc.(1) | 18,497 |
| 1,095,762 |
|
| | | 3,128,976 |
|
| INTERNET SOFTWARE AND SERVICES — 2.4% | | |
Conversant, Inc.(2) | 3,095 |
| 78,613 |
|
eBay, Inc.(1)(2) | 25,988 |
| 1,300,959 |
|
Google, Inc., Class A(1)(2) | 1,479 |
| 864,727 |
|
Google, Inc., Class C(1)(2) | 2,495 |
| 1,435,324 |
|
| | | 3,679,623 |
|
| IT SERVICES — 1.9% | | |
Accenture plc, Class A(1) | 1,639 |
| 132,497 |
|
| Amdocs Ltd. | 2,654 |
| 122,960 |
|
Euronet Worldwide, Inc.(2) | 11,192 |
| 539,902 |
|
Genpact Ltd.(2) | 6,354 |
| 111,386 |
|
International Business Machines Corp.(1) | 10,755 |
| 1,949,559 |
|
Teradata Corp.(1)(2) | 2,568 |
| 103,233 |
|
| | | 2,959,537 |
|
|
| | | | | |
| | Shares | Value |
| LEISURE PRODUCTS — 0.7% | | |
Hasbro, Inc.(1) | 21,518 |
| $ | 1,141,530 |
|
| LIFE SCIENCES TOOLS AND SERVICES — 0.4% | | |
Charles River Laboratories International, Inc.(2) | 7,058 |
| 377,744 |
|
Illumina, Inc.(2) | 1,539 |
| 274,773 |
|
| | | 652,517 |
|
| MACHINERY — 4.0% | | |
AGCO Corp.(1) | 8,328 |
| 468,200 |
|
Caterpillar, Inc.(1) | 16,487 |
| 1,791,642 |
|
Dover Corp.(1) | 12,598 |
| 1,145,788 |
|
| IDEX Corp. | 1,029 |
| 83,082 |
|
| Lincoln Electric Holdings, Inc. | 4,223 |
| 295,103 |
|
Oshkosh Corp.(1) | 9,726 |
| 540,085 |
|
Snap-On, Inc.(1) | 10,234 |
| 1,212,934 |
|
Toro Co. (The)(1) | 3,347 |
| 212,869 |
|
WABCO Holdings, Inc.(2) | 5,266 |
| 562,514 |
|
| | | 6,312,217 |
|
| MARINE — 0.6% | | |
Matson, Inc.(1) | 34,842 |
| 935,159 |
|
| MEDIA — 2.3% | | |
Comcast Corp., Class A(1) | 2,030 |
| 108,970 |
|
John Wiley & Sons, Inc., Class A(1) | 20,624 |
| 1,249,608 |
|
Live Nation Entertainment, Inc.(2) | 35,768 |
| 883,112 |
|
| Time Warner, Inc. | 6,707 |
| 471,167 |
|
Viacom, Inc., Class B(1) | 1,117 |
| 96,878 |
|
| Walt Disney Co. (The) | 9,814 |
| 841,452 |
|
| | | 3,651,187 |
|
| METALS AND MINING — 1.4% | | |
| Compass Minerals International, Inc. | 8,697 |
| 832,651 |
|
| United States Steel Corp. | 49,855 |
| 1,298,224 |
|
| | | 2,130,875 |
|
| MULTI-UTILITIES — 0.8% | | |
Wisconsin Energy Corp.(1) | 26,913 |
| 1,262,758 |
|
| MULTILINE RETAIL — 1.5% | | |
Dillard's, Inc., Class A(1) | 8,654 |
| 1,009,143 |
|
Macy's, Inc.(1) | 22,705 |
| 1,317,344 |
|
| | | 2,326,487 |
|
| OIL, GAS AND CONSUMABLE FUELS — 6.9% | | |
| Chesapeake Energy Corp. | 3,787 |
| 117,700 |
|
Chevron Corp.(1) | 7,255 |
| 947,140 |
|
ConocoPhillips(1) | 1,085 |
| 93,017 |
|
Encana Corp.(1) | 49,168 |
| 1,165,774 |
|
EOG Resources, Inc.(1) | 16,264 |
| 1,900,611 |
|
Exxon Mobil Corp.(1) | 26,338 |
| 2,651,710 |
|
Gran Tierra Energy, Inc.(1)(2) | 154,635 |
| 1,255,636 |
|
Kosmos Energy Ltd.(2) | 68,862 |
| 773,320 |
|
|
| | | | | |
| | Shares | Value |
Occidental Petroleum Corp.(1) | 5,789 |
| $ | 594,125 |
|
Valero Energy Corp.(1) | 25,811 |
| 1,293,131 |
|
| | | 10,792,164 |
|
| PAPER AND FOREST PRODUCTS — 0.5% | | |
International Paper Co.(1) | 14,844 |
| 749,177 |
|
| PERSONAL PRODUCTS — 0.5% | | |
Avon Products, Inc.(1) | 50,305 |
| 734,956 |
|
| PHARMACEUTICALS — 7.9% | | |
AbbVie, Inc.(1) | 35,231 |
| 1,988,438 |
|
Eli Lilly & Co.(1) | 18,478 |
| 1,148,777 |
|
Johnson & Johnson(1) | 36,051 |
| 3,771,655 |
|
Merck & Co., Inc.(1) | 46,215 |
| 2,673,538 |
|
Pfizer, Inc.(1) | 92,023 |
| 2,731,243 |
|
| | | 12,313,651 |
|
| PROFESSIONAL SERVICES — 1.2% | | |
Manpowergroup, Inc.(1) | 14,411 |
| 1,222,774 |
|
| Towers Watson & Co., Class A | 5,705 |
| 594,632 |
|
| | | 1,817,406 |
|
| REAL ESTATE INVESTMENT TRUSTS (REITs) — 1.1% | | |
| Host Hotels & Resorts, Inc. | 58,576 |
| 1,289,258 |
|
| PS Business Parks, Inc. | 4,137 |
| 345,398 |
|
| | | 1,634,656 |
|
| REAL ESTATE MANAGEMENT AND DEVELOPMENT — 1.2% | | |
CBRE Group, Inc.(1)(2) | 40,556 |
| 1,299,414 |
|
St Joe Co. (The)(2) | 21,784 |
| 553,967 |
|
| | | 1,853,381 |
|
| SEMICONDUCTORS AND SEMICONDUCTOR EQUIPMENT — 3.9% | | |
Broadcom Corp., Class A(1) | 41,150 |
| 1,527,488 |
|
Fairchild Semiconductor International, Inc.(2) | 5,624 |
| 87,734 |
|
First Solar, Inc.(1)(2) | 1,892 |
| 134,446 |
|
Intel Corp.(1) | 87,367 |
| 2,699,640 |
|
KLA-Tencor Corp.(1) | 11,101 |
| 806,377 |
|
| Marvell Technology Group Ltd. | 9,479 |
| 135,834 |
|
Texas Instruments, Inc.(1) | 6,696 |
| 320,002 |
|
Xilinx, Inc.(1) | 7,308 |
| 345,741 |
|
| | | 6,057,262 |
|
| SOFTWARE — 5.5% | | |
| CA, Inc. | 3,644 |
| 104,728 |
|
Cadence Design Systems, Inc.(2) | 66,598 |
| 1,164,799 |
|
| Intuit, Inc. | 1,577 |
| 126,996 |
|
Mentor Graphics Corp.(1) | 38,347 |
| 827,145 |
|
Microsoft Corp.(1) | 51,491 |
| 2,147,175 |
|
Oracle Corp.(1) | 59,724 |
| 2,420,614 |
|
Symantec Corp.(1) | 39,983 |
| 915,611 |
|
Synopsys, Inc.(1)(2) | 24,497 |
| 950,973 |
|
| | | 8,658,041 |
|
|
| | | | | |
| | Shares | Value |
| SPECIALTY RETAIL — 2.7% | | |
Best Buy Co., Inc.(1) | 24,003 |
| $ | 744,333 |
|
Buckle, Inc. (The)(1) | 12,646 |
| 560,977 |
|
GameStop Corp., Class A(1) | 23,679 |
| 958,289 |
|
| Guess?, Inc. | 32,107 |
| 866,889 |
|
Lowe's Cos., Inc.(1) | 10,246 |
| 491,705 |
|
PetSmart, Inc.(1) | 5,241 |
| 313,412 |
|
Staples, Inc.(1) | 25,085 |
| 271,921 |
|
| | | 4,207,526 |
|
| TECHNOLOGY HARDWARE, STORAGE AND PERIPHERALS — 7.1% | | |
Apple, Inc.(1) | 67,851 |
| 6,305,393 |
|
EMC Corp.(1) | 61,476 |
| 1,619,278 |
|
Hewlett-Packard Co.(1) | 53,005 |
| 1,785,208 |
|
| NetApp, Inc. | 2,940 |
| 107,369 |
|
| SanDisk Corp. | 8,480 |
| 885,566 |
|
Seagate Technology plc(1) | 2,569 |
| 145,971 |
|
| Western Digital Corp. | 3,232 |
| 298,314 |
|
| | | 11,147,099 |
|
| TEXTILES, APPAREL AND LUXURY GOODS — 1.8% | | |
Deckers Outdoor Corp.(1)(2) | 11,084 |
| 956,882 |
|
Hanesbrands, Inc.(1) | 14,464 |
| 1,423,836 |
|
Iconix Brand Group, Inc.(1)(2) | 9,351 |
| 401,532 |
|
| | | 2,782,250 |
|
| THRIFTS AND MORTGAGE FINANCE — 0.8% | | |
| EverBank Financial Corp. | 59,012 |
| 1,189,682 |
|
| TOBACCO — 0.1% | | |
Philip Morris International, Inc.(1) | 925 |
| 77,987 |
|
| TRADING COMPANIES AND DISTRIBUTORS — 0.1% | | |
WESCO International, Inc.(1)(2) | 1,763 |
| 152,288 |
|
TOTAL COMMON STOCKS (Cost $161,936,431) | | 201,091,768 |
|
| TEMPORARY CASH INVESTMENTS — 1.5% | | |
| Repurchase Agreement, Bank of America Merrill Lynch, (collateralized by various U.S. Treasury obligations, 0.75% - 0.875%, 1/31/18 - 2/28/18, valued at $533,923), in a joint trading account at 0.05%, dated 6/30/14, due 7/1/14 (Delivery value $523,178) | | 523,177 |
|
| Repurchase Agreement, Credit Suisse First Boston, Inc., (collateralized by various U.S. Treasury obligations, 1.75%, 5/15/23, valued at $213,638), in a joint trading account at 0.01%, dated 6/30/14, due 7/1/14 (Delivery value $209,271) | | 209,271 |
|
| Repurchase Agreement, Goldman Sachs & Co., (collateralized by various U.S. Treasury obligations, 3.125%, 11/15/41, valued at $426,962), in a joint trading account at 0.03%, dated 6/30/14, due 7/1/14 (Delivery value $418,542) | | 418,542 |
|
| SSgA U.S. Government Money Market Fund, Class N | 1,236,980 |
| 1,236,980 |
|
TOTAL TEMPORARY CASH INVESTMENTS (Cost $2,387,970) | | 2,387,970 |
|
TOTAL INVESTMENT SECURITIES BEFORE SECURITIES SOLD SHORT — 130.2% (Cost $164,324,401) | 203,479,738 |
|
|
| | | | | |
| | Shares | Value |
| COMMON STOCKS SOLD SHORT — (30.2)% | | |
| AEROSPACE AND DEFENSE — (0.9)% | | |
| DigitalGlobe, Inc. | (38,398 | ) | $ | (1,067,464 | ) |
| Triumph Group, Inc. | (5,475 | ) | (382,265 | ) |
| | | (1,449,729 | ) |
| AIR FREIGHT AND LOGISTICS — (0.7)% | | |
| CH Robinson Worldwide, Inc. | (2,818 | ) | (179,760 | ) |
| UTi Worldwide, Inc. | (87,875 | ) | (908,628 | ) |
| | | (1,088,388 | ) |
| AUTOMOBILES — (0.4)% | | |
| Thor Industries, Inc. | (11,786 | ) | (670,270 | ) |
| BANKS — (0.2)% | | |
| BankUnited, Inc. | (9,241 | ) | (309,389 | ) |
| BIOTECHNOLOGY — (0.3)% | | |
| Intercept Pharmaceuticals, Inc. | (386 | ) | (91,339 | ) |
| Puma Biotechnology, Inc. | (4,772 | ) | (314,952 | ) |
| Synageva BioPharma Corp. | (1,278 | ) | (133,935 | ) |
| | | (540,226 | ) |
| BUILDING PRODUCTS — (0.6)% | | |
| Armstrong World Industries, Inc. | (16,744 | ) | (961,608 | ) |
| CAPITAL MARKETS — (0.1)% | | |
| State Street Corp. | (1,589 | ) | (106,876 | ) |
| CHEMICALS — (0.6)% | | |
| Chemtura Corp. | (30,635 | ) | (800,493 | ) |
| Kronos Worldwide, Inc. | (11,644 | ) | (182,461 | ) |
| | | (982,954 | ) |
| COMMERCIAL SERVICES AND SUPPLIES — (1.8)% | | |
| Copart, Inc. | (14,173 | ) | (509,661 | ) |
| Interface, Inc. | (51,643 | ) | (972,954 | ) |
| Iron Mountain, Inc. | (35,687 | ) | (1,265,104 | ) |
| | | (2,747,719 | ) |
| COMMUNICATIONS EQUIPMENT — (0.3)% | | |
| ViaSat, Inc. | (9,229 | ) | (534,913 | ) |
| CONSTRUCTION AND ENGINEERING — (0.8)% | | |
| Chicago Bridge & Iron Co. NV | (2,891 | ) | (197,166 | ) |
| Granite Construction, Inc. | (30,482 | ) | (1,096,743 | ) |
| | | (1,293,909 | ) |
| DIVERSIFIED FINANCIAL SERVICES — (1.1)% | | |
| Intercontinental Exchange, Inc. | (3,037 | ) | (573,689 | ) |
| Leucadia National Corp. | (41,366 | ) | (1,084,617 | ) |
| | | (1,658,306 | ) |
| ELECTRIC UTILITIES — (0.4)% | | |
| ALLETE, Inc. | (12,836 | ) | (659,129 | ) |
| ELECTRICAL EQUIPMENT — (0.7)% | | |
| Franklin Electric Co., Inc. | (25,587 | ) | (1,031,924 | ) |
|
| | | | | |
| | Shares | Value |
| ELECTRONIC EQUIPMENT, INSTRUMENTS AND COMPONENTS — (0.1)% | |
| AVX Corp. | (8,746 | ) | $ | (116,147 | ) |
| ENERGY EQUIPMENT AND SERVICES — (1.5)% | | |
| Bristow Group, Inc. | (8,304 | ) | (669,469 | ) |
| Dresser-Rand Group, Inc. | (6,014 | ) | (383,272 | ) |
| Hornbeck Offshore Services, Inc. | (4,687 | ) | (219,914 | ) |
| McDermott International, Inc. | (124,799 | ) | (1,009,624 | ) |
| | | (2,282,279 | ) |
| FOOD AND STAPLES RETAILING — (0.4)% | | |
| United Natural Foods, Inc. | (10,819 | ) | (704,317 | ) |
| FOOD PRODUCTS — (0.7)% | | |
| Darling Ingredients, Inc. | (48,740 | ) | (1,018,666 | ) |
| GAS UTILITIES — (0.2)% | | |
| South Jersey Industries, Inc. | (4,905 | ) | (296,311 | ) |
| HEALTH CARE EQUIPMENT AND SUPPLIES — (0.1)% | | |
| IDEXX Laboratories, Inc. | (815 | ) | (108,859 | ) |
| HEALTH CARE PROVIDERS AND SERVICES — (1.4)% | | |
| Acadia Healthcare Co., Inc. | (3,614 | ) | (164,437 | ) |
| Air Methods Corp. | (14,751 | ) | (761,889 | ) |
| AmerisourceBergen Corp. | (10,746 | ) | (780,804 | ) |
| Community Health Systems, Inc. | (2,043 | ) | (92,691 | ) |
| MWI Veterinary Supply, Inc. | (734 | ) | (104,221 | ) |
| Tenet Healthcare Corp. | (5,189 | ) | (243,572 | ) |
| | | (2,147,614 | ) |
| HOTELS, RESTAURANTS AND LEISURE — (0.3)% | | |
| BJ's Restaurants, Inc. | (13,805 | ) | (481,933 | ) |
| HOUSEHOLD DURABLES — (3.7)% | | |
| DR Horton, Inc. | (27,576 | ) | (677,818 | ) |
| Lennar Corp., Class A | (28,214 | ) | (1,184,424 | ) |
| M.D.C. Holdings, Inc. | (12,254 | ) | (371,174 | ) |
| Ryland Group, Inc. | (6,530 | ) | (257,543 | ) |
| Standard Pacific Corp. | (126,562 | ) | (1,088,433 | ) |
| Tempur Sealy International, Inc. | (19,319 | ) | (1,153,344 | ) |
| Toll Brothers, Inc. | (30,368 | ) | (1,120,579 | ) |
| | | (5,853,315 | ) |
| INSURANCE — (0.1)% | | |
| ProAssurance Corp. | (3,221 | ) | (143,012 | ) |
| INTERNET SOFTWARE AND SERVICES — (0.4)% | | |
| Dealertrack Technologies, Inc. | (12,178 | ) | (552,150 | ) |
| IT SERVICES — (1.1)% | | |
| Alliance Data Systems Corp. | (1,800 | ) | (506,250 | ) |
| WEX, Inc. | (11,772 | ) | (1,235,707 | ) |
| | | (1,741,957 | ) |
| MACHINERY — (0.8)% | | |
| Chart Industries, Inc. | (14,979 | ) | (1,239,362 | ) |
| MEDIA — (0.8)% | | |
| AMC Networks, Inc., Class A | (3,216 | ) | (197,752 | ) |
| Loral Space & Communications, Inc. | (14,507 | ) | (1,054,514 | ) |
| | | (1,252,266 | ) |
|
| | | | | |
| | Shares | Value |
| METALS AND MINING — (2.5)% | | |
| Allegheny Technologies, Inc. | (3,178 | ) | $ | (143,328 | ) |
| AuRico Gold, Inc. | (33,912 | ) | (144,465 | ) |
| Carpenter Technology Corp. | (7,375 | ) | (466,468 | ) |
| Hecla Mining Co. | (76,165 | ) | (262,769 | ) |
| New Gold, Inc. | (220,886 | ) | (1,407,044 | ) |
| Royal Gold, Inc. | (1,965 | ) | (149,576 | ) |
| Stillwater Mining Co. | (51,838 | ) | (909,757 | ) |
| Tahoe Resources, Inc. | (16,729 | ) | (438,300 | ) |
| | | (3,921,707 | ) |
| MULTILINE RETAIL — (0.1)% | | |
| Family Dollar Stores, Inc. | (1,496 | ) | (98,945 | ) |
| OIL, GAS AND CONSUMABLE FUELS — (0.8)% | | |
| Consol Energy, Inc. | (16,931 | ) | (780,011 | ) |
| Diamondback Energy, Inc. | (3,561 | ) | (316,217 | ) |
| Williams Cos., Inc. (The) | (2,257 | ) | (131,380 | ) |
| | | (1,227,608 | ) |
| PHARMACEUTICALS — (0.1)% | | |
| Hospira, Inc. | (2,363 | ) | (121,387 | ) |
| REAL ESTATE INVESTMENT TRUSTS (REITs) — (0.2)% | | |
| Plum Creek Timber Co., Inc. | (3,039 | ) | (137,059 | ) |
| Weingarten Realty Investors | (7,229 | ) | (237,400 | ) |
| | | (374,459 | ) |
| ROAD AND RAIL — (0.7)% | | |
| Kansas City Southern | (10,124 | ) | (1,088,431 | ) |
| SEMICONDUCTORS AND SEMICONDUCTOR EQUIPMENT — (0.8)% | | |
| SunEdison, Inc. | (58,350 | ) | (1,318,710 | ) |
| SOFTWARE — (1.2)% | | |
| Concur Technologies, Inc. | (7,910 | ) | (738,319 | ) |
| Solera Holdings, Inc. | (17,446 | ) | (1,171,499 | ) |
| | | (1,909,818 | ) |
| SPECIALTY RETAIL — (2.5)% | | |
| Cabela's, Inc. | (19,265 | ) | (1,202,136 | ) |
| CarMax, Inc. | (20,516 | ) | (1,067,037 | ) |
| Conn's, Inc. | (27,206 | ) | (1,343,705 | ) |
| Office Depot, Inc. | (55,509 | ) | (315,846 | ) |
| | | (3,928,724 | ) |
| TECHNOLOGY HARDWARE, STORAGE AND PERIPHERALS — (0.6)% | | |
| Stratasys Ltd. | (8,813 | ) | (1,001,421 | ) |
| TEXTILES, APPAREL AND LUXURY GOODS — (0.1)% | | |
| Carter's, Inc. | (1,333 | ) | (91,883 | ) |
| THRIFTS AND MORTGAGE FINANCE — (0.1)% | | |
| Capitol Federal Financial, Inc. | (8,544 | ) | (103,896 | ) |
TOTAL COMMON STOCKS SOLD SHORT — (30.2)% (Proceeds $43,525,721) | | (47,160,517 | ) |
OTHER ASSETS AND LIABILITIES† | | (9,545 | ) |
| TOTAL NET ASSETS - 100.0% | | $ | 156,309,676 |
|
|
| | |
| NOTES TO SCHEDULE OF INVESTMENTS |
| |
| † | Category is less than 0.05% of total net assets. |
| |
| (1) | Security, or a portion thereof, has been pledged at the custodian bank or with a broker for collateral requirements on securities sold short. At the period end, the aggregate value of securities pledged was $145,188,501. |
See Notes to Financial Statements.
|
|
| Statement of Assets and Liabilities |
|
| | | |
| JUNE 30, 2014 |
| Assets |
| Investment securities, at value (cost of $164,324,401) | $ | 203,479,738 |
|
| Cash | 2,734 |
|
| Deposits with broker for securities sold short | 797,257 |
|
| Receivable for investments sold | 429,404 |
|
| Receivable for capital shares sold | 18,497 |
|
| Dividends and interest receivable | 176,010 |
|
| | 204,903,640 |
|
| | |
| Liabilities |
| Securities sold short, at value (proceeds of $43,525,721) | 47,160,517 |
|
| Payable for investments purchased | 1,211,217 |
|
| Payable for capital shares redeemed | 34,897 |
|
| Accrued management fees | 164,356 |
|
| Distribution and service fees payable | 843 |
|
| Dividend expense payable on securities sold short | 22,134 |
|
| | 48,593,964 |
|
| | |
| Net Assets | $ | 156,309,676 |
|
| | |
| Net Assets Consist of: |
| Capital (par value and paid-in surplus) | $ | 108,436,699 |
|
| Undistributed net realized gain | 12,352,436 |
|
| Net unrealized appreciation | 35,520,541 |
|
| | $ | 156,309,676 |
|
|
| | | | | | |
| | Net Assets | Shares Outstanding | Net Asset Value Per Share |
| Investor Class, $0.01 Par Value |
| $148,619,673 |
| 9,828,097 |
| $15.12 |
| Institutional Class, $0.01 Par Value |
| $5,992,740 |
| 396,173 |
| $15.13 |
| A Class, $0.01 Par Value |
| $753,007 |
| 49,802 |
| $15.12* |
| C Class, $0.01 Par Value |
| $767,816 |
| 51,161 |
| $15.01 |
| R Class, $0.01 Par Value |
| $176,440 |
| 11,679 |
| $15.11 |
*Maximum offering price $16.04 (net asset value divided by 0.9425).
See Notes to Financial Statements.
|
| | | |
| YEAR ENDED JUNE 30, 2014 |
| Investment Income (Loss) |
| Income: | |
| Dividends (net of foreign taxes withheld of $4,021) | $ | 3,436,542 |
|
| Interest | 669 |
|
| | 3,437,211 |
|
| | |
| Expenses: | |
| Dividend expense on securities sold short | 387,598 |
|
| Broker fees and charges on securities sold short | 265,810 |
|
| Management fees | 1,797,561 |
|
| Distribution and service fees: | |
| A Class | 1,726 |
|
| C Class | 7,572 |
|
| R Class | 791 |
|
| Directors' fees and expenses | 8,406 |
|
| | 2,469,464 |
|
| | |
| Net investment income (loss) | 967,747 |
|
| | |
| Realized and Unrealized Gain (Loss) |
| Net realized gain (loss) on: | |
| Investment transactions | 23,149,512 |
|
| Securities sold short transactions | (5,918,494 | ) |
| | 17,231,018 |
|
| | |
| Change in net unrealized appreciation (depreciation) on: | |
| Investments | 16,323,079 |
|
| Securities sold short | (1,934,482 | ) |
| | 14,388,597 |
|
| | |
| Net realized and unrealized gain (loss) | 31,619,615 |
|
| | |
| Net Increase (Decrease) in Net Assets Resulting from Operations | $ | 32,587,362 |
|
See Notes to Financial Statements.
|
|
| Statement of Changes in Net Assets |
|
| | | | | | |
| YEARS ENDED JUNE 30, 2014 AND JUNE 30, 2013 | | |
| Increase (Decrease) in Net Assets | June 30, 2014 | June 30, 2013 |
| Operations | | |
| Net investment income (loss) | $ | 967,747 |
| $ | 1,199,296 |
|
| Net realized gain (loss) | 17,231,018 |
| 6,030,334 |
|
| Change in net unrealized appreciation (depreciation) | 14,388,597 |
| 13,756,514 |
|
| Net increase (decrease) in net assets resulting from operations | 32,587,362 |
| 20,986,144 |
|
| | | |
| Distributions to Shareholders | | |
| From net investment income: | | |
| Investor Class | (1,048,352 | ) | (1,217,032 | ) |
| Institutional Class | (49,529 | ) | (52,597 | ) |
| A Class | (3,670 | ) | (3,014 | ) |
| R Class | (421 | ) | (593 | ) |
| From net realized gains: | | |
| Investor Class | (8,566,466 | ) | (1,479,849 | ) |
| Institutional Class | (326,217 | ) | (38,590 | ) |
| A Class | (46,967 | ) | (4,572 | ) |
| C Class | (61,677 | ) | (2,741 | ) |
| R Class | (10,354 | ) | (1,862 | ) |
| Decrease in net assets from distributions | (10,113,653 | ) | (2,800,850 | ) |
| | | |
| Capital Share Transactions | | |
Net increase (decrease) in net assets from capital share transactions (Note 5) | 13,863,840 |
| 16,682,302 |
|
| | | |
| Net increase (decrease) in net assets | 36,337,549 |
| 34,867,596 |
|
| | | |
| Net Assets | | |
| Beginning of period | 119,972,127 |
| 85,104,531 |
|
| End of period | $ | 156,309,676 |
| $ | 119,972,127 |
|
| | | |
| Undistributed net investment income | — |
| $ | 169,014 |
|
See Notes to Financial Statements.
|
| | | |
| YEAR ENDED JUNE 30, 2014 | |
| Cash Flows From (Used In) Operating Activities | |
| Net increase (decrease) in net assets resulting from operations | $ | 32,587,362 |
|
| Adjustments to reconcile net increase (decrease) in net assets resulting from operations to net cash from (used in) operating activities: | |
| Purchases of investment securities | (142,621,831 | ) |
| Proceeds from investments sold | 134,653,274 |
|
| Purchases to cover securities sold short | (47,935,195 | ) |
| Proceeds from securities sold short | 52,089,334 |
|
| (Increase) decrease in short-term investments | (1,034,144 | ) |
| (Increase) decrease in deposits with broker for securities sold short | (674,235 | ) |
| (Increase) decrease in receivable for investments sold | (429,404 | ) |
| (Increase) decrease in dividends and interest receivable | (40,844 | ) |
| Increase (decrease) in payable for investments purchased | 1,211,217 |
|
| Increase (decrease) in accrued management fees | 36,241 |
|
| Increase (decrease) in distribution and service fees payable | 376 |
|
| Increase (decrease) in dividend expense payable on securities sold short | 1,367 |
|
| Increase (decrease) in broker fees and charges payable on securities sold short | (923 | ) |
| Change in net unrealized (appreciation) depreciation on investments | (16,323,079 | ) |
| Net realized (gain) loss on investment transactions | (23,149,512 | ) |
| Change in net unrealized (appreciation) depreciation on securities sold short | 1,934,482 |
|
| Net realized (gain) loss on securities sold short transactions | 5,918,494 |
|
| Net cash from (used in) operating activities | (3,777,020 | ) |
| | |
| Cash Flows From (Used In) Financing Activities | |
| Proceeds from shares sold | 14,467,778 |
|
| Payments for shares redeemed | (10,662,044 | ) |
| Distributions paid, net of reinvestments | (25,980 | ) |
| Net cash from (used in) financing activities | 3,779,754 |
|
| | |
| Net Increase (Decrease) In Cash | 2,734 |
|
| Cash at beginning of period | — |
|
| Cash at end of period | $ | 2,734 |
|
| | |
| Supplemental disclosure of cash flow information: | |
| Non cash financing activities not included herein consist of all reinvestment of distributions of $10,087,673. |
See Notes to Financial Statements.
|
|
| Notes to Financial Statements |
JUNE 30, 2014
1. Organization
American Century Quantitative Equity Funds, Inc. (the corporation) is registered under the Investment Company Act of 1940, as amended (the 1940 Act), as an open-end management investment company and is organized as a Maryland corporation. Core Equity Plus Fund (the fund) is one fund in a series issued by the corporation. The fund is diversified as defined under the 1940 Act. The fund’s investment objective is to seek long-term capital growth.
The fund offers the Investor Class, the Institutional Class, the A Class, the C Class and the R Class. The A Class may incur an initial sales charge. The A Class and C Class may be subject to a contingent deferred sales charge. The share classes differ principally in their respective sales charges and distribution and shareholder servicing expenses and arrangements. The Institutional Class is made available to institutional shareholders or through financial intermediaries whose clients do not require the same level of shareholder and administrative services as shareholders of other classes. As a result, the Institutional Class is charged a lower unified management fee.
2. Significant Accounting Policies
The following is a summary of significant accounting policies consistently followed by the fund in preparation of its financial statements. The financial statements are prepared in conformity with accounting principles generally accepted in the United States of America, which may require management to make certain estimates and assumptions at the date of the financial statements. Actual results could differ from these estimates. Management evaluated the impact of events or transactions occurring through the date the financial statements were issued that would merit recognition or disclosure.
Investment Valuations — The fund determines the fair value of its investments and computes its net asset value per share at the close of regular trading (usually 4 p.m. Eastern time) on the New York Stock Exchange (NYSE) on each day the NYSE is open. The Board of Directors has adopted valuation policies and procedures to guide the investment advisor in the fund’s investment valuation process and to provide methodologies for the oversight of the fund’s pricing function.
Equity securities that are listed or traded on a domestic securities exchange are valued at the last reported sales price or at the official closing price as provided by the exchange. Equity securities traded on foreign securities exchanges are generally valued at the closing price of such securities on the exchange where primarily traded or at the close of the NYSE, if that is earlier. If no last sales price is reported, or if local convention or regulation so provides, the mean of the latest bid and asked prices may be used. Securities traded over-the-counter are valued at the mean of the latest bid and asked prices, the last sales price, or the official closing price.
Fixed income securities maturing within 60 days at the time of purchase may be valued at cost, plus or minus any amortized discount or premium or at the evaluated mean as provided by an independent pricing service. Evaluated mean prices are commonly derived through utilization of market models, which may consider, among other factors: trade data, quotations from dealers and active market makers, relevant yield curve and spread data, related sector levels, creditworthiness, trade data or market information on comparable securities, and other relevant security specific information.
Open-end management investment companies are valued at the reported net asset value per share. Repurchase agreements are valued at cost, which approximates fair value.
If the fund determines that the market price for an investment is not readily available or the valuation methods mentioned above do not reflect an investment’s fair value, such investment is valued as determined in good faith by the Board of Directors or its delegate, in accordance with policies and procedures adopted by the Board of Directors. In its determination of fair value, the fund may review several factors including, but not limited to, market information regarding the specific investment or comparable investments and correlation with other investment types, futures indices or general market indicators. Circumstances that may cause the fund to use these procedures to value an investment include, but are not limited to: an investment has been declared in default or is distressed; trading in a security has been suspended during the trading day or a
security is not actively trading on its principal exchange; prices received from a regular pricing source are deemed unreliable; or there is a foreign market holiday and no trading occurred.
The fund monitors for significant events occurring after the close of an investment’s primary exchange but before the fund’s net asset value per share is determined. Significant events may include, but are not limited to: corporate announcements and transactions; governmental action and political unrest that could impact a specific investment or an investment sector; or armed conflicts, natural disasters and similar events that could affect investments in a specific country or region. The fund also monitors for significant fluctuations between domestic and foreign markets, as evidenced by the U.S. market or such other indicators that the Board of Directors, or its delegate, deems appropriate. If significant fluctuations in foreign markets are identified, the fund may apply a model-derived factor to the closing price of equity securities traded on foreign securities exchanges. The factor is based on observable market data as provided by an independent pricing service.
Security Transactions — Security transactions are accounted for as of the trade date. Net realized gains and losses are determined on the identified cost basis, which is also used for federal income tax purposes.
Investment Income — Dividend income less foreign taxes withheld, if any, is recorded as of the ex-dividend date. Distributions received on securities that represent a return of capital or long-term capital gain are recorded as a reduction of cost of investments and/or as a realized gain. The fund may estimate the components of distributions received that may be considered nontaxable distributions or long-term capital gain distributions for income tax purposes. Interest income is recorded on the accrual basis and includes accretion of discounts and amortization of premiums.
Securities Sold Short — The fund enters into short sales, which is selling securities it does not own, as part of its normal investment activities. Upon selling a security short, the fund will segregate cash, cash equivalents or other appropriate liquid securities in at least an amount equal to the current market value of the securities sold short until the fund replaces the borrowed security. Interest earned on segregated cash for securities sold short is reflected as interest income. The fund is required to pay any dividends or interest due on securities sold short. Such dividends and interest are recorded as an expense. The fund may pay fees or charges to the broker on the assets borrowed for securities sold short. These fees are calculated daily based upon the value of each security sold short and a rate that is dependent on the availability of such security. Liabilities for securities sold short are valued daily and changes in value are recorded as change in net unrealized appreciation (depreciation) on securities sold short. The fund records realized gain (loss) on a security sold short when it is terminated by the fund and includes as a component of net realized gain (loss) on securities sold short transactions.
Repurchase Agreements — The fund may enter into repurchase agreements with institutions that American Century Investment Management, Inc. (ACIM) (the investment advisor) has determined are creditworthy pursuant to criteria adopted by the Board of Directors. The fund requires that the collateral, represented by securities, received in a repurchase transaction be transferred to the custodian in a manner sufficient to enable the fund to obtain those securities in the event of a default under the repurchase agreement. ACIM monitors, on a daily basis, the securities transferred to ensure the value, including accrued interest, of the securities under each repurchase agreement is equal to or greater than amounts owed to the fund under each repurchase agreement.
Joint Trading Account — Pursuant to an Exemptive Order issued by the Securities and Exchange Commission, the fund, along with certain other funds in the American Century Investments family of funds, may transfer uninvested cash balances into a joint trading account. These balances are invested in one or more repurchase agreements that are collateralized by U.S. Treasury or Agency obligations.
Segregated Assets — In accordance with the 1940 Act, the fund segregates assets on its books and records to cover certain types of investments, including, but not limited to, futures contracts and short sales. ACIM monitors, on a daily basis, the securities segregated to ensure the fund designates a sufficient amount of liquid assets, marked-to-market daily. The fund may also receive assets or be required to pledge assets at the custodian bank or with a broker for margin requirements on futures contracts and short sales.
Income Tax Status — It is the fund’s policy to distribute substantially all net investment income and net realized gains to shareholders and to otherwise qualify as a regulated investment company under provisions of the Internal Revenue Code. Accordingly, no provision has been made for income taxes. The fund files U.S. federal, state, local and non-U.S. tax returns as applicable. The fund's tax returns are subject to examination by the relevant taxing authority until expiration of the applicable statute of limitations, which is generally three years from the date of filing but can be longer in certain jurisdictions. At this time, management believes there are no uncertain tax positions which, based on their technical merit, would not be sustained upon examination
and for which it is reasonably possible that the total amounts of unrecognized tax benefits will significantly change in the next twelve months.
Multiple Class — All shares of the fund represent an equal pro rata interest in the net assets of the class to which such shares belong, and have identical voting, dividend, liquidation and other rights and the same terms and conditions, except for class specific expenses and exclusive rights to vote on matters affecting only individual classes. Income, non-class specific expenses, and realized and unrealized capital gains and losses of the fund are allocated to each class of shares based on their relative net assets.
Distributions to Shareholders — Distributions from net investment income, if any, are generally declared and paid semiannually. Distributions from net realized gains, if any, are generally declared and paid annually.
Indemnifications — Under the corporation’s organizational documents, its officers and directors are indemnified against certain liabilities arising out of the performance of their duties to the fund. In addition, in the normal course of business, the fund enters into contracts that provide general indemnifications. The maximum exposure under these arrangements is unknown as this would involve future claims that may be made against a fund. The risk of material loss from such claims is considered by management to be remote.
Statement of Cash Flows — The beginning of period and end of period cash in the Statement of Cash Flows is the amount of domestic and foreign currency included in the fund's Statement of Assets and Liabilities and represents the cash on hand at the custodian bank and does not include any short-term investments or deposits with brokers for securities sold short.
3. Fees and Transactions with Related Parties
Certain officers and directors of the corporation are also officers and/or directors of American Century Companies, Inc. (ACC). The corporation’s investment advisor, ACIM, the corporation's distributor, American Century Investment Services, Inc. (ACIS), and the corporation’s transfer agent, American Century Services, LLC, are wholly owned, directly or indirectly, by ACC. Various funds issued by American Century Asset Allocation Portfolios, Inc. and American Century Strategic Asset Allocations, Inc. own, in aggregate, 93% of the shares of the fund. Related parties do not invest in the fund for the purpose of exercising management or control.
Management Fees — The corporation has entered into a management agreement with ACIM, under which ACIM provides the fund with investment advisory and management services in exchange for a single, unified management fee (the fee) per class. The agreement provides that all expenses of managing and operating the fund, except distribution and service fees, expenses on securities sold short, brokerage expenses, taxes, interest, fees and expenses of the independent directors (including legal counsel fees), and extraordinary expenses, will be paid by ACIM. The fee is computed and accrued daily based on each class’s daily net assets and paid monthly in arrears. The fee consists of (1) an Investment Category Fee based on the daily net assets of the fund and certain other accounts managed by the investment advisor that are in the same broad investment category as the fund and (2) a Complex Fee based on the assets of all the funds in the American Century Investments family of funds. The rates for the Investment Category Fee range from 0.9680% to 1.1500%. The rates for the Complex Fee range from 0.2500% to 0.3100% for the Investor Class, A Class, C Class and R Class. The rates for the Complex Fee range from 0.0500% to 0.1100% for the Institutional Class. The effective annual management fee for each class for the year ended June 30, 2014 was 1.30% for the Investor Class, A Class, C Class and R Class and 1.10% for the Institutional Class.
Distribution and Service Fees — The Board of Directors has adopted a separate Master Distribution and Individual Shareholder Services Plan for each of the A Class, C Class and R Class (collectively the plans), pursuant to Rule 12b-1 of the 1940 Act. The plans provide that the A Class will pay ACIS an annual distribution and service fee of 0.25%. The plans provide that the C Class will pay ACIS an annual distribution and service fee of 1.00%, of which 0.25% is paid for individual shareholder services and 0.75% is paid for distribution services. The plans provide that the R Class will pay ACIS an annual distribution and service fee of 0.50%. The fees are computed and accrued daily based on each class’s daily net assets and paid monthly in arrears. The fees are used to pay financial intermediaries for distribution and individual shareholder services. Fees incurred under the plans during the year ended June 30, 2014 are detailed in the Statement of Operations.
Directors' Fees and Expenses — The Board of Directors is responsible for overseeing the investment advisor’s management and operations of the fund. The directors receive detailed information about the fund and its investment advisor regularly throughout the year, and meet at least quarterly with management of the investment advisor to review reports about fund operations. Fees and expenses incurred in conjunction with
the directors during the year ended June 30, 2014 are detailed in the Statement of Operations. The fund’s officers do not receive compensation from the fund.
4. Investment Transactions
Purchases and sales of investment securities and securities sold short, excluding short-term investments, for the year ended June 30, 2014 were $190,557,026 and $186,742,608, respectively.
5. Capital Share Transactions
Transactions in shares of the fund were as follows:
|
| | | | | | | | | | |
| | Year ended June 30, 2014 | Year ended June 30, 2013 |
| | Shares | Amount | Shares | Amount |
| Investor Class/Shares Authorized | 50,000,000 |
| | 70,000,000 |
| |
| Sold | 754,248 |
| $ | 10,606,746 |
| 1,247,179 |
| $ | 14,456,890 |
|
| Issued in reinvestment of distributions | 686,141 |
| 9,588,838 |
| 233,568 |
| 2,692,484 |
|
| Redeemed | (525,553 | ) | (7,370,989 | ) | (360,423 | ) | (4,304,852 | ) |
| | 914,836 |
| 12,824,595 |
| 1,120,324 |
| 12,844,522 |
|
| Institutional Class/Shares Authorized | 10,000,000 |
| | 10,000,000 |
| |
| Sold | 214,905 |
| 2,995,143 |
| 389,399 |
| 4,516,129 |
|
| Issued in reinvestment of distributions | 26,818 |
| 375,746 |
| 7,857 |
| 91,187 |
|
| Redeemed | (190,289 | ) | (2,702,023 | ) | (101,967 | ) | (1,290,661 | ) |
| | 51,434 |
| 668,866 |
| 295,289 |
| 3,316,655 |
|
| A Class/Shares Authorized | 10,000,000 |
| | 10,000,000 |
| |
| Sold | 28,772 |
| 402,615 |
| 36,112 |
| 420,654 |
|
| Issued in reinvestment of distributions | 3,632 |
| 50,637 |
| 651 |
| 7,497 |
|
| Redeemed | (22,752 | ) | (318,636 | ) | (18,020 | ) | (216,949 | ) |
| | 9,652 |
| 134,616 |
| 18,743 |
| 211,202 |
|
| C Class/Shares Authorized | 10,000,000 |
| | 10,000,000 |
| |
| Sold | 32,457 |
| 463,111 |
| 25,347 |
| 316,261 |
|
| Issued in reinvestment of distributions | 4,473 |
| 61,677 |
| 243 |
| 2,741 |
|
| Redeemed | (20,863 | ) | (303,218 | ) | (913 | ) | (11,921 | ) |
| | 16,067 |
| 221,570 |
| 24,677 |
| 307,081 |
|
| R Class/Shares Authorized | 10,000,000 |
| | 10,000,000 |
| |
| Sold | 241 |
| 3,418 |
| 30 |
| 387 |
|
| Issued in reinvestment of distributions | 775 |
| 10,775 |
| 216 |
| 2,455 |
|
| | 1,016 |
| 14,193 |
| 246 |
| 2,842 |
|
| Net increase (decrease) | 993,005 |
| $ | 13,863,840 |
| 1,459,279 |
| $ | 16,682,302 |
|
6. Fair Value Measurements
The fund’s investments valuation process is based on several considerations and may use multiple inputs to determine the fair value of the investments held by the fund. In conformity with accounting principles generally accepted in the United States of America, the inputs used to determine a valuation are classified into three broad levels.
| |
| • | Level 1 valuation inputs consist of unadjusted quoted prices in an active market for identical investments. |
| |
| • | Level 2 valuation inputs consist of direct or indirect observable market data (including quoted prices for comparable investments, evaluations of subsequent market events, interest rates, prepayment speeds, credit risk, etc.). These inputs also consist of quoted prices for identical investments initially expressed in local currencies that are adjusted through translation into U.S. dollars. |
| |
| • | Level 3 valuation inputs consist of unobservable data (including a fund’s own assumptions). |
The level classification is based on the lowest level input that is significant to the fair valuation measurement. The valuation inputs are not necessarily an indication of the risks associated with investing in these securities or other financial instruments.
The following is a summary of the level classifications as of period end. The Schedule of Investments provides additional information on the fund’s portfolio holdings.
|
| | | | | | | | |
| | Level 1 | Level 2 | Level 3 |
| Assets |
| Investment Securities |
| Common Stocks | $ | 201,091,768 |
| — |
| — |
|
| Temporary Cash Investments | 1,236,980 |
| $ | 1,150,990 |
| — |
|
| | $ | 202,328,748 |
| $ | 1,150,990 |
| — |
|
| | | | |
| Liabilities |
| Securities Sold Short |
| Common Stocks | $ | (47,160,517 | ) | — |
| — |
|
7. Risk Factors
The fund's investment strategy utilizes leverage, which can increase market exposure and subject the fund to greater risk and higher volatility.
The fund’s investment process may result in high portfolio turnover, which could mean high transaction costs, affecting both performance and capital gains tax liabilities to investors.
The fund is subject to short sales risk. If the market price of a security increases after the fund borrows the security, the fund may suffer a loss when it replaces the borrowed security at the higher price. Any loss will be increased by the amount of compensation, interest or dividends, and transaction costs the fund must pay to the lender of the borrowed security.
If the fund is overweighted in a stock or sector, any negative development related to that stock or sector will have a greater impact on the fund than other funds that are not overweighted in that stock or sector.
8. Federal Tax Information
The tax character of distributions paid during the years ended June 30, 2014 and June 30, 2013 were as follows:
|
| | | | | | |
| | 2014 | 2013 |
| Distributions Paid From | | |
| Ordinary income | $ | 2,724,056 |
| $ | 2,800,850 |
|
| Long-term capital gains | $ | 7,389,597 |
| — |
|
The book-basis character of distributions made during the year from net investment income or net realized gains may differ from their ultimate characterization for federal income tax purposes. These differences reflect the differing character of certain income items and net realized gains and losses for financial statement and tax purposes, and may result in reclassification among certain capital accounts on the financial statements.
As of June 30, 2014, the federal tax cost of investments and the components of distributable earnings on a tax-basis were as follows: |
| | | |
| Federal tax cost of investments | $ | 164,333,257 |
|
| Gross tax appreciation of investments | $ | 40,320,333 |
|
| Gross tax depreciation of investments | (1,173,852 | ) |
| Net tax appreciation (depreciation) of investments | 39,146,481 |
|
| Net tax appreciation (depreciation) on securities sold short | (3,662,763 | ) |
| Net tax appreciation (depreciation) | $ | 35,483,718 |
|
| Undistributed ordinary income | $ | 781,116 |
|
| Accumulated long-term gains | $ | 11,608,143 |
|
The difference between book-basis and tax-basis unrealized appreciation (depreciation) is attributable primarily to the tax deferral of losses on wash sales.
|
| | | | | | | | | | | | | | | | |
| For a Share Outstanding Throughout the Years Ended June 30 (except as noted) |
| Per-Share Data | Ratios and Supplemental Data |
| | | Income From Investment Operations: | Distributions From: | | | Ratio to Average Net Assets of: | | |
| | Net Asset Value, Beginning of Period | Net Investment Income (Loss)(1) | Net Realized and Unrealized Gain (Loss) | Total From Investment Operations | Net Investment Income | Net Realized Gains | Total Distributions | Net Asset Value, End of Period | Total Return(2) | Operating Expenses | Operating Expenses (excluding expenses on securities sold short) | Net Investment Income (Loss) | Portfolio Turnover Rate | Net Assets, End of Period (in thousands) |
| Investor Class |
| 2014 | $12.84 | 0.10 | 3.25 | 3.35 | (0.11) | (0.96) | (1.07) | $15.12 | 26.86% | 1.77% | 1.30% | 0.69% | 104% |
| $148,620 |
|
| 2013 | $10.79 | 0.14 | 2.23 | 2.37 | (0.14) | (0.18) | (0.32) | $12.84 | 22.33% | 1.87% | 1.30% | 1.15% | 107% |
| $114,444 |
|
2012(3) | $10.00 | 0.03 | 0.76 | 0.79 | —(4) | — | —(4) | $10.79 | 7.95% | 2.06%(5) | 1.31%(5) | 0.39%(5) | 105% |
| $84,116 |
|
| Institutional Class |
| 2014 | $12.84 | 0.13 | 3.26 | 3.39 | (0.14) | (0.96) | (1.10) | $15.13 | 27.19% | 1.57% | 1.10% | 0.89% | 104% |
| $5,993 |
|
| 2013 | $10.80 | 0.15 | 2.25 | 2.40 | (0.18) | (0.18) | (0.36) | $12.84 | 22.45% | 1.67% | 1.10% | 1.35% | 107% |
| $4,427 |
|
2012(3) | $10.00 | 0.06 | 0.75 | 0.81 | (0.01) | — | (0.01) | $10.80 | 8.19% | 1.86%(5) | 1.11%(5) | 0.59%(5) | 105% |
| $534 |
|
| A Class |
| 2014 | $12.84 | 0.06 | 3.25 | 3.31 | (0.07) | (0.96) | (1.03) | $15.12 | 26.55% | 2.02% | 1.55% | 0.44% | 104% |
| $753 |
|
| 2013 | $10.78 | 0.10 | 2.24 | 2.34 | (0.10) | (0.18) | (0.28) | $12.84 | 22.01% | 2.12% | 1.55% | 0.90% | 107% |
| $515 |
|
2012(3) | $10.00 | 0.04 | 0.74 | 0.78 | —(4) | — | —(4) | $10.78 | 7.80% | 2.31%(5) | 1.56%(5) | 0.14%(5) | 105% |
| $231 |
|
| C Class |
| 2014 | $12.78 | (0.05) | 3.24 | 3.19 | — | (0.96) | (0.96) | $15.01 | 25.66% | 2.77% | 2.30% | (0.31)% | 104% |
| $768 |
|
| 2013 | $10.73 | 0.01 | 2.22 | 2.23 | — | (0.18) | (0.18) | $12.78 | 20.99% | 2.87% | 2.30% | 0.15% | 107% |
| $449 |
|
2012(3) | $10.00 | —(4) | 0.73 | 0.73 | — | — | — | $10.73 | 7.30% | 3.06%(5) | 2.31%(5) | (0.61)%(5) | 105% |
| $112 |
|
|
| | | | | | | | | | | | | | | | |
| For a Share Outstanding Throughout the Years Ended June 30 (except as noted) |
| Per-Share Data | Ratios and Supplemental Data |
| | | Income From Investment Operations: | Distributions From: | | | Ratio to Average Net Assets of: | | |
| | Net Asset Value, Beginning of Period | Net Investment Income (Loss)(1) | Net Realized and Unrealized Gain (Loss) | Total From Investment Operations | Net Investment Income | Net Realized Gains | Total Distributions | Net Asset Value, End of Period | Total Return(2) | Operating Expenses | Operating Expenses (excluding expenses on securities sold short) | Net Investment Income (Loss) | Portfolio Turnover Rate | Net Assets, End of Period (in thousands) |
| R Class |
| 2014 | $12.83 | 0.03 | 3.25 | 3.28 | (0.04) | (0.96) | (1.00) | $15.11 | 26.27% | 2.27% | 1.80% | 0.19% | 104% |
| $176 |
|
| 2013 | $10.76 | 0.08 | 2.23 | 2.31 | (0.06) | (0.18) | (0.24) | $12.83 | 21.70% | 2.37% | 1.80% | 0.65% | 107% |
| $137 |
|
2012(3) | $10.00 | 0.03 | 0.73 | 0.76 | — | — | — | $10.76 | 7.60% | 2.56%(5) | 1.81%(5) | (0.11)%(5) | 105% |
| $112 |
|
|
|
| Notes to Financial Highlights |
| |
| (1) | Computed using average shares outstanding throughout the period. |
| |
| (2) | Total returns are calculated based on the net asset value of the last business day and do not reflect applicable sales charges, if any. Total returns for periods less than one year are not annualized. |
| |
| (3) | October 31, 2011 (fund inception) through June 30, 2012. |
| |
| (4) | Per-share amount was less than $0.005. |
See Notes to Financial Statements.
|
|
| Report of Independent Registered Public Accounting Firm |
To the Directors of the American Century Quantitative Equity Funds, Inc. and Shareholders of the Core Equity Plus Fund:
In our opinion, the accompanying statement of assets and liabilities, including the schedule of investments, and the related statements of operations, of changes in net assets and of cash flows and the financial highlights present fairly, in all material respects, the financial position of the Core Equity Plus Fund (one of the fifteen funds comprising the American Century Quantitative Equity Funds, Inc., hereafter referred to as the “Fund”) at June 30, 2014, the results of its operations and its cash flows for the year then ended, the changes in its net assets for each of the two years in the period then ended and the financial highlights for each of the periods presented, in conformity with accounting principles generally accepted in the United States of America. These financial statements and financial highlights (hereafter referred to as "financial statements") are the responsibility of the Fund's management. Our responsibility is to express an opinion on these financial statements based on our audits. We conducted our audits of these financial statements in accordance with the standards of the Public Company Accounting Oversight Board (United States). Those standards require that we plan and perform the audit to obtain reasonable assurance about whether the financial statements are free of material misstatement. An audit includes examining, on a test basis, evidence supporting the amounts and disclosures in the financial statements, assessing the accounting principles used and significant estimates made by management, and evaluating the overall financial statement presentation. We believe that our audits, which included confirmation of securities at June 30, 2014 by correspondence with the custodian and brokers, provide a reasonable basis for our opinion.
PricewaterhouseCoopers LLP
Kansas City, Missouri
August 21, 2014
Board of Directors
The individuals listed below serve as directors of the funds. Each director will continue to serve in this capacity until death, retirement, resignation or removal from office. The board has adopted a mandatory retirement age for directors who are not “interested persons,” as that term is defined in the Investment Company Act (independent directors). Independent directors shall retire on December 31 of the year in which they reach their 75th birthday; provided, however, that on or after January 1, 2022, independent directors shall retire on December 31 of the year in which they reach their 76th birthday.
Mr. Thomas is an “interested person” because he currently serves as President and Chief Executive Officer of American Century Companies, Inc. (ACC), the parent company of American Century Investment Management, Inc. (ACIM or the advisor). The other directors (more than three-fourths of the total number) are independent. They are not employees, directors or officers of, and have no financial interest in, ACC or any of its wholly owned, direct or indirect, subsidiaries, including ACIM, American Century Investment Services, Inc. (ACIS) and American Century Services, LLC (ACS), and do not have any other affiliations, positions or relationships that would cause them to be considered “interested persons” under the Investment Company Act. The directors serve in this capacity for eight (in the case of Mr. Thomas, 15) registered investment companies in the American Century Investments family of funds.
The following table presents additional information about the directors. The mailing address for each director other than Mr. Thomas is 1665 Charleston Road, Mountain View, California 94043. The mailing address for Mr. Thomas is 4500 Main Street, Kansas City, Missouri 64111.
|
| | | | | |
Name (Year of Birth) | Position(s) Held with Funds | Length of Time Served | Principal Occupation(s) During Past 5 Years | Number of
American
Century
Portfolios
Overseen
by Director | Other Directorships Held During Past 5 Years |
| Independent Directors |
Tanya S. Beder (1955) | Director | Since 2011 | Chairman, SBCC Group Inc. (independent advisory services) (2006 to present) | 42 | CYS Investments, Inc. (specialty finance company) |
Jeremy I. Bulow (1954) | Director | Since 2011 | Professor of Economics, Stanford University, Graduate School of Business (1979 to present) | 42 | None |
Ronald J. Gilson (1946) | Director and Chairman of the Board | Since 1995 (Chairman since 2005) | Charles J. Meyers Professor of Law and Business, Stanford Law School (1979 to present); Marc and Eva Stern Professor of Law and Business, Columbia University School of Law (1992 to present) | 42 | None |
|
| | | | | |
Name (Year of Birth) | Position(s) Held with Funds | Length of Time Served | Principal Occupation(s) During Past 5 Years | Number of
American
Century
Portfolios
Overseen
by Director | Other Directorships Held During Past 5 Years |
| Independent Directors |
Frederick L. A. Grauer (1946) | Director | Since 2008 | Senior Advisor, BlackRock, Inc. (investment management firm) (2010 to 2011); Senior Advisor, Barclays Global Investors (investment management firm) (2003 to 2009) | 42 | None |
Peter F. Pervere
(1947) | Director | Since 2007 | Retired | 42 | Intraware, Inc. (2003 to 2009) |
Myron S. Scholes(1) (1941) | Director | Since 1980 | Chairman, Platinum Grove Asset Management, L.P. (asset manager) (1999 to 2009); Frank E. Buck Professor of Finance-Emeritus, Stanford Graduate School of Business (1996 to present) | 42 | Dimensional Fund Advisors (investment advisor); CME Group, Inc. (futures and options exchange) |
John B. Shoven
(1947) | Director | Since 2002 | Professor of Economics, Stanford University (1973 to present) | 42 | Cadence Design Systems; Exponent; Financial Engines |
| Interested Director |
Jonathan S. Thomas
(1963) | Director and
President | Since 2007 | President and Chief Executive Officer, ACC (March 2007 to present). Also serves as Chief Executive Officer and Manager, ACS; Executive Vice President, ACIM; Director, ACC, ACIM and other ACC subsidiaries | 115 | None |
(1) Myron S. Scholes resigned as director effective July 31, 2014.
Officers
The following table presents certain information about the executive officers of the funds. Each officer serves as an officer for each of the 15 investment companies in the American Century family of funds, unless otherwise noted. No officer is compensated for his or her service as an officer of the funds. The listed officers are interested persons of the funds and are appointed or re-appointed on an annual basis. The mailing address for each of the officers listed below is 4500 Main Street, Kansas City, Missouri 64111.
|
| | |
Name (Year of Birth) | Offices with the Funds | Principal Occupation(s) During the Past Five Years |
Jonathan S. Thomas (1963) | Director and President since 2007 | President and Chief Executive Officer, ACC (March 2007 to present). Also serves as Chief Executive Officer and Manager, ACS; Executive Vice President, ACIM; Director, ACC, ACIM and other ACC subsidiaries |
| Amy D. Shelton (1964) | Chief Compliance Officer since 2014 | Chief Compliance Officer, American Century funds, (March 2014 to present); Chief Compliance Officer, ACIM (February 2014 to present); Chief Compliance Officer, ACIS (October 2009 to present); Vice President, Client Interactions and Marketing, ACIS (February 2013 to January 2014); Director, Client Interactions and Marketing, ACIS (June 2007 to January 2013). Also serves as Vice President, ACIS |
Charles A. Etherington (1957) | General Counsel since 2007 and Senior Vice President since 2006 | Attorney, ACC (February 1994 to present); Vice President, ACC (November 2005 to present); General Counsel, ACC (March 2007 to present). Also serves as General Counsel, ACIM, ACS, ACIS and other ACC subsidiaries; and Senior Vice President, ACIM and ACS |
C. Jean Wade (1964) | Vice President, Treasurer and Chief Financial Officer since 2012 | Vice President, ACS (February 2000 to present) |
Robert J. Leach (1966) | Vice President since 2006 and Assistant Treasurer since 2012 | Vice President, ACS (February 2000 to present) |
David H. Reinmiller (1963) | Vice President since 2001 | Attorney, ACC (January 1994 to present); Associate General Counsel, ACC (January 2001 to present). Also serves as Vice President, ACIM and ACS |
Ward D. Stauffer (1960) | Secretary since 2005 | Attorney, ACC (June 2003 to present) |
The Statement of Additional Information has additional information about the fund’s directors and is available without charge, upon request, by calling 1-800-345-2021.
|
|
| Approval of Management Agreement |
At a meeting held on June 13, 2014, the Fund’s Board of Directors/Trustees unanimously approved the renewal of the management agreement pursuant to which American Century Investment Management, Inc. (the “Advisor”) acts as the investment advisor for the Fund. Under Section 15(c) of the Investment Company Act, contracts for investment advisory services are required to be reviewed, evaluated, and approved by a majority of a fund’s directors/trustees (the “Directors”), including a majority of the independent Directors, each year. The Board regards this annual evaluation and renewal as one of its most important responsibilities.
The independent Directors have memorialized a statement regarding the relationship between their ongoing obligations to oversee and evaluate the performance of the Advisor and their annual consideration of renewal of the management agreement. In that statement, the independent Directors noted that their assessment of the Advisor’s performance is an ongoing process that takes place over the entire year and is informed by all of the extensive information that the Board and its committees receive and consider over time. This information, together with the materials provided in connection with the review, are central to the Board’s assessment of the Advisor’s performance and its determination whether to renew the Fund’s management agreement.
Prior to its consideration of the renewal of the management agreement, the Board requested and reviewed extensive data and analysis relating to the proposed renewal. This information and analysis was compiled by the Advisor and certain independent providers of evaluation data concerning the Fund and the services provided to the Fund by the Advisor.
In connection with its consideration of the renewal of the management agreement, the Board’s review and evaluation of the services provided by the Advisor included, but was not limited to, the following:
| |
| • | the nature, extent, and quality of investment management, shareholder services, and other services provided by the Advisor to the Fund; |
| |
| • | the wide range of other programs and services the Advisor provides to the Fund and its shareholders on a routine and non-routine basis; |
| |
| • | the investment performance of the Fund, including data comparing the Fund’s performance to appropriate benchmarks and/or a peer group of other mutual funds with similar investment objectives and strategies; |
| |
| • | the cost of owning the Fund compared to the cost of owning similar funds; |
| |
| • | the Advisor’s compliance policies, procedures, and regulatory experience; |
| |
| • | financial data showing the cost of services provided to the Fund, the profitability of the Fund to the Advisor, and the overall profitability of the Advisor; |
| |
| • | possible economies of scale associated with the Advisor’s management of the Fund and other accounts under its management; |
| |
| • | data comparing services provided and charges to other investment management clients of the Advisor; and |
| |
| • | any collateral benefits derived by the Advisor from the management of the Fund. |
In keeping with its practice, the Board held two in-person meetings to review and discuss the information provided. The independent Directors also had the benefit of the advice of their independent counsel throughout the process.
Factors Considered
The Directors considered all of the information provided by the Advisor, the independent data providers, and the independent Directors’ independent counsel in connection with the review, and evaluated such information for the Fund. In connection with their review, the Directors did not identify any single factor as being all-important or controlling and each Director may have attributed
different levels of importance to different factors. In deciding to renew the management agreement, the Board based its decision on a number of factors, including the following:
Nature, Extent and Quality of Services — Generally. Under the management agreement, the Advisor is responsible for providing or arranging for all services necessary for the operation of the Fund. The Board noted that under the management agreement, the Advisor provides or arranges at its own expense a wide variety of services including:
| |
| • | constructing and designing the Fund |
| |
| • | portfolio research and security selection |
| |
| • | initial capitalization/funding |
| |
| • | daily valuation of the Fund’s portfolio |
| |
| • | shareholder servicing and transfer agency, including shareholder confirmations, recordkeeping, and communications |
| |
| • | regulatory and portfolio compliance |
| |
| • | marketing and distribution |
The Board noted that many of these services have expanded over time both in terms of quantity and complexity in response to shareholder demands, competition in the industry, changing distribution channels, and the changing regulatory environment.
Investment Management Services. The nature of the investment management services provided to the Fund is quite complex and allows Fund shareholders access to professional money management, instant diversification of their investments within an asset class, the opportunity to easily diversify among asset classes by investing in or exchanging among various American Century Investments funds, and liquidity. In evaluating investment performance, the Board expects the Advisor to manage the Fund in accordance with its investment objectives and approved strategies. Further, the Directors recognize that the Advisor has an obligation to seek the best execution of fund trades. In providing these services, the Advisor utilizes teams of investment professionals (portfolio managers, analysts, research assistants, and securities traders) who require extensive information technology, research, training, compliance and other systems to conduct their business. The Board, directly and through its Portfolio Committee, regularly reviews investment performance information for the Fund, together with comparative information for appropriate benchmarks and/or peer groups of similarly-managed funds, over different time horizons. The Directors also review detailed performance information during the management agreement approval process. If performance concerns are identified, the Fund receives special reviews until performance improves, during which the Board discusses with the Advisor the reasons for such results (e.g., market conditions, security selection) and any efforts being undertaken to improve performance. The Fund’s performance was above its benchmark for the one-year period reviewed by the Board. The Board found the investment management services provided by the Advisor to the Fund to be satisfactory and consistent with the management agreement.
Shareholder and Other Services. Under the management agreement, the Advisor provides the Fund with a comprehensive package of transfer agency, shareholder, and other services. The Board, directly and through various committees of the Board, regularly reviews reports and evaluations of such services at its regular meetings. These reports include, but are not limited to, information regarding the operational efficiency and accuracy of the shareholder and transfer agency services provided, staffing levels, shareholder satisfaction (as measured by external as well as internal sources), technology support, new products and services offered to Fund shareholders, securities trading activities, portfolio valuation services, auditing services, and legal and operational compliance activities. Certain aspects of shareholder and transfer agency service level efficiency
and the quality of securities trading activities are measured by independent third party providers and are presented in comparison to other fund groups not managed by the Advisor. The Board found the services provided by the Advisor to the Fund under the management agreement to be competitive and of high quality.
Costs of Services and Profitability. The Advisor provides detailed information concerning its cost of providing various services to the Fund, its profitability in managing the Fund, its overall profitability, and its financial condition. The Directors have reviewed with the Advisor the methodology used to prepare this financial information. The financial information regarding the Advisor is considered in evaluating the Advisor’s financial condition, its ability to continue to provide services under the management agreement, and the reasonableness of the current management fee. The Board concluded that the Advisor’s profits were reasonable in light of the services provided to the Fund.
Ethics. The Board generally considers the Advisor’s commitment to providing quality services to shareholders and to conducting its business ethically. They noted that the Advisor’s practices generally meet or exceed industry best practices.
Economies of Scale. The Board also reviewed information provided by the Advisor regarding the possible existence of economies of scale in connection with the management of the Fund. The Board concluded that economies of scale are difficult to measure and predict with precision, especially on a fund-by-fund basis. The Board concluded that the Advisor is appropriately sharing economies of scale through its competitive fee structure, offering competitive fees from fund inception, and through reinvestment in its business to provide shareholders additional content and services.
Comparison to Other Funds’ Fees. The management agreement provides that the Fund pays the Advisor a single, all-inclusive (or unified) management fee for providing all services necessary for the management and operation of the Fund, other than brokerage expenses, taxes, interest, extraordinary expenses, and the fees and expenses of the Fund’s independent directors (including their independent legal counsel) and expenses incurred in connection with the provision of shareholder services and distribution services under a plan adopted pursuant to Rule 12b-1 under the 1940 Act. Under the unified fee structure, the Advisor is responsible for providing all investment advisory, custody, audit, administrative, compliance, recordkeeping, marketing and shareholder services, or arranging and supervising third parties to provide such services. By contrast, most other funds are charged a variety of fees, including an investment advisory fee, a transfer agency fee, an administrative fee, distribution charges and other expenses. Other than their investment advisory fees and any applicable Rule 12b-1 distribution fees, all other components of the total fees charged by these other funds may be increased without shareholder approval. The Board believes the unified fee structure is a benefit to Fund shareholders because it clearly discloses to shareholders the cost of owning Fund shares, and, since the unified fee cannot be increased without a vote of Fund shareholders, it shifts to the Advisor the risk of increased costs of operating the Fund and provides a direct incentive to minimize administrative inefficiencies. Part of the Board’s analysis of fee levels involves reviewing certain evaluative data compiled by an independent provider and comparing the Fund’s unified fee to the total expense ratio of other funds in the Fund’s peer group. The unified fee charged to shareholders of the Fund was below the median of the total expense ratios of the Fund’s peer group. The Board concluded that the management fee paid by the Fund to the Advisor under the management agreement is reasonable in light of the services provided to the Fund.
Comparison to Fees and Services Provided to Other Clients of the Advisor. The Board also requested and received information from the Advisor concerning the nature of the services, fees, costs and profitability of its advisory services to advisory clients other than the Fund. They observed that these varying types of client accounts require different services and involve different regulatory and entrepreneurial risks than the management of the Fund. The Board analyzed this information and concluded that the fees charged and services provided to the Fund were reasonable by comparison.
Collateral or “Fall-Out” Benefits Derived by the Advisor. The Board considered the existence of collateral benefits the Advisor may receive as a result of its relationship with the Fund. They concluded that the Advisor’s primary business is managing mutual funds and it generally does not use fund or shareholder information to generate profits in other lines of business, and therefore does not derive any significant collateral benefits from them. The Board noted that the Advisor receives proprietary research from broker-dealers that execute fund portfolio transactions and concluded that this research is likely to benefit Fund shareholders. The Board also determined that the Advisor is able to provide investment management services to certain clients other than the Fund, at least in part, due to its existing infrastructure built to serve the fund complex. The Board concluded, however, that the assets of those other clients are not material to the analysis and, where applicable, may be included with the assets of the Fund to determine breakpoints in the management fee schedule.
Existing Relationship. The Board also considered whether there was any reason for not continuing the existing arrangement with the Advisor. In this regard, the Board was mindful of the potential disruptions of the Fund’s operations and various risks, uncertainties, and other effects that could occur as a result of a decision not to continue such relationship. In particular, the Board recognized that most shareholders have invested in the Fund on the strength of the Advisor’s industry standing and reputation and in the expectation that the Advisor will have a continuing role in providing advisory services to the Fund.
Conclusion of the Directors. As a result of this process, the Board, including all of the independent Directors and assisted by the advice of independent legal counsel, taking into account all of the factors discussed above and the information provided by the Advisor and others, concluded that the management agreement between the Fund and the Advisor is fair and reasonable in light of the services provided and should be renewed.
Retirement Account Information
As required by law, distributions you receive from certain IRAs are subject to federal income tax withholding, unless you elect not to have withholding apply. Tax will be withheld on the total amount withdrawn even though you may be receiving amounts that are not subject to withholding, such as nondeductible contributions. In such case, excess amounts of withholding could occur. You may adjust your withholding election so that a greater or lesser amount will be withheld.
If you don’t want us to withhold on this amount, you must notify us to not withhold the federal income tax. You may notify us in writing or in certain situations by telephone or through other electronic means. For systematic withdrawals, your withholding election will remain in effect until revoked or changed by filing a new election. You have the right to revoke your election at any time.
Remember, even if you elect not to have income tax withheld, you are liable for paying income tax on the taxable portion of your withdrawal. If you elect not to have income tax withheld or you don’t have enough income tax withheld, you may be responsible for payment of estimated tax. You may incur penalties under the estimated tax rules if your withholding and estimated tax payments are not sufficient. You can reduce or defer the income tax on a distribution by directly or indirectly rolling such distribution over to another IRA or eligible plan. You should consult your tax advisor for additional information.
State tax will be withheld if, at the time of your distribution, your address is within one of the mandatory withholding states and you have federal income tax withheld (or as otherwise required by state law). State taxes will be withheld from your distribution in accordance with the respective state rules.
Distributions you receive from 403(b), 457 and qualified plans are subject to special tax and withholding rules. Your plan administrator or plan sponsor is required to provide you with a special tax notice explaining those rules at the time you request a distribution. If applicable, federal and/or state taxes may be withheld from your distribution amount.
Proxy Voting Policies
Descriptions of the principles and policies that the fund's investment advisor uses in exercising the voting rights associated with the securities purchased and/or held by the fund are available without charge, upon request, by calling 1-800-345-2021 or visiting the "About Us" page of American Century Investments’ website at americancentury.com. A description of the policies is also available on the Securities and Exchange Commission’s website at sec.gov. Information regarding how the investment advisor voted proxies relating to portfolio securities during the most recent 12-month period ended June 30 is available on the "About Us" page at americancentury.com. It is also available at sec.gov.
Quarterly Portfolio Disclosure
The fund files its complete schedule of portfolio holdings with the Securities and Exchange Commission (SEC) for the first and third quarters of each fiscal year on Form N-Q. The fund’s Forms N-Q are available on the SEC’s website at sec.gov, and may be reviewed and copied at the SEC’s Public Reference Room in Washington, DC. Information on the operation of the Public Reference Room may be obtained by calling 1-800-SEC-0330. The fund also makes its complete schedule of portfolio holdings for the most recent quarter of its fiscal year available on its website at americancentury.com and, upon request, by calling 1-800-345-2021.
Other Tax Information
The following information is provided pursuant to provisions of the Internal Revenue Code.
The fund hereby designates up to the maximum amount allowable as qualified dividend income for the fiscal year ended June 30, 2014.
For corporate taxpayers, the fund hereby designates $1,930,442, or up to the maximum amount allowable, of ordinary income distributions paid during the fiscal year ended June 30, 2014 as qualified for the corporate dividends received deduction.
The fund hereby designates $1,626,639 as qualified short-term capital gain distributions for purposes of Internal Revenue Code Section 871.
The fund hereby designates $7,389,597, or up to the maximum amount allowable, as long-term capital gain distributions for the fiscal year ended June 30, 2014.
|
| | |
| |
| | | |
| Contact Us | americancentury.com | |
| Automated Information Line | 1-800-345-8765 | |
| Investor Services Representative | 1-800-345-2021
or 816-531-5575 | |
| Investors Using Advisors | 1-800-378-9878 | |
Business, Not-For-Profit, Employer-Sponsored
Retirement Plans | 1-800-345-3533 | |
Banks and Trust Companies, Broker-Dealers,
Financial Professionals, Insurance Companies | 1-800-345-6488 | |
| Telecommunications Relay Service for the Deaf | 711 | |
| | | |
| American Century Quantitative Equity Funds, Inc. | |
| | | |
Investment Advisor: American Century Investment Management, Inc. Kansas City, Missouri | |
| | | |
| This report and the statements it contains are submitted for the general information of our shareholders. The report is not authorized for distribution to prospective investors unless preceded or accompanied by an effective prospectus. | |
| | | |
©2014 American Century Proprietary Holdings, Inc. All rights reserved.
CL-ANN-82891 1408 | |
|
| |
ANNUAL REPORT | JUNE 30, 2014 |
Disciplined Growth Fund
|
| |
| President's Letter | |
| Performance | |
| Portfolio Commentary | |
| Fund Characteristics | |
| Shareholder Fee Example | |
| Schedule of Investments | |
| Statement of Assets and Liabilities | |
| Statement of Operations | |
| Statement of Changes in Net Assets | |
| Notes to Financial Statements | |
| Financial Highlights | |
| Report of Independent Registered Public Accounting Firm | |
| Management | |
| Approval of Management Agreement | |
| Additional Information | |
Any opinions expressed in this report reflect those of the author as of the date of the report, and do not necessarily represent the opinions of American Century Investments® or any other person in the American Century Investments organization. Any such opinions are subject to change at any time based upon market or other conditions and American Century Investments disclaims any responsibility to update such opinions. These opinions may not be relied upon as investment advice and, because investment decisions made by American Century Investments funds are based on numerous factors, may not be relied upon as an indication of trading intent on behalf of any American Century Investments fund. Security examples are used for representational purposes only and are not intended as recommendations to purchase or sell securities. Performance information for comparative indices and securities is provided to American Century Investments by third party vendors. To the best of American Century Investments’ knowledge, such information is accurate at the time of printing.
|
| |
| Dear Investor:
Thank you for reviewing this annual report for the 12 months ended June 30, 2014. It provides investment performance and portfolio information for the reporting period, plus longer-term historical performance data.
Annual reports remain important vehicles for conveying information about fund returns, including market and economic factors that affected performance during the reporting period. For additional, updated investment and market insights, we encourage you to visit our website, americancentury.com.
|
| Jonathan Thomas |
Aggressive Monetary Policies Boosted Stock and Bond Returns
Stimulative monetary policies and expectations of economic improvement, interspersed with concerns about weaker-than-expected economic data and geopolitical conflicts, helped drive financial market returns during the reporting period. We believe the combination of longer-term optimism about global economic growth, low costs of capital, and central bank purchases of fixed income securities helped persuade investors to seek risk and yield, especially in the U.S. and Europe. Stock index returns were strong in these markets, particularly at the smaller capitalization end of the company size spectrum. The MSCI Europe and S&P 500® indices advanced 29.28% and 24.61%, respectively.
Remarkably, for a period in which stock market performance was so strong, government bond performance was also generally positive. Not surprisingly, U.S. corporate high-yield bonds posted double-digit returns, but the 30-year U.S. Treasury bond also outperformed most broader bond market measures. In addition, a generally weaker U.S. dollar during the reporting period meant that international bond returns for U.S. investors with currency exposure were generally higher than U.S. bonds returns. The Barclays Global Aggregate Bond and Barclays U.S. Aggregate Bond indices returned 7.39% and 4.37%, respectively.
Looking ahead, we see signs of sustained moderate economic growth in the second half of 2014, but headwinds persist. In the U.S., which was supposed to be an economic growth leader this year, housing market momentum has slowed, interest rates could rise, and economic growth and U.S. employment levels remain subpar compared with past post-recession periods. In this environment, we continue to believe in a disciplined, diversified, long-term investment approach, using professionally managed stock and bond portfolios—as appropriate—for meeting financial goals. We appreciate your continued trust in us.
Sincerely,
Jonathan Thomas
President and Chief Executive Officer
American Century Investments
|
| | | | | |
| Total Returns as of June 30, 2014 |
| | | | Average Annual Returns | |
| | Ticker Symbol | 1 year | 5 years | Since Inception | Inception Date |
| Investor Class | ADSIX | 28.05% | 20.59% | 9.19% | 9/30/05 |
| Russell 1000 Growth Index | — | 26.92% | 19.23% | 8.72% | — |
| Institutional Class | ADCIX | 28.30% | 20.85% | 9.41% | 9/30/05 |
A Class(1) | ADCVX | | | | 9/30/05 |
| No sales charge* | | 27.75% | 20.30% | 8.92% | |
| With sales charge* | | 20.38% | 18.87% | 8.19% | |
| C Class | ADCCX | 26.80% | 19.39% | 6.64% | 9/28/07 |
| R Class | ADRRX | 27.41% | 20.00% | 8.65% | 9/30/05 |
| |
| * | Sales charges include initial sales charges and contingent deferred sales charges (CDSCs), as applicable. A Class shares have a 5.75% maximum initial sales charge and may be subject to a maximum CDSC of 1.00%. C Class shares redeemed within 12 months of purchase are subject to a maximum CDSC of 1.00%. The SEC requires that mutual funds provide performance information net of maximum sales charges in all cases where charges could be applied. |
| |
| (1) | Prior to September 4, 2007, the A Class was referred to as the Advisor Class and did not have a front-end sales charge. Performance has been adjusted to reflect this charge. |
Data presented reflect past performance. Past performance is no guarantee of future results. Current performance may be higher or lower than the performance shown. Investment return and principal value will fluctuate, and redemption value may be more or less than original cost. To obtain performance data current to the most recent month end, please call 1-800-345-2021 or visit americancentury.com. The fund’s investment process may result in high portfolio turnover, which could mean high transaction costs, affecting both performance and capital gains tax liabilities to investors.
Unless otherwise indicated, performance reflects Investor Class shares; performance for other share classes will vary due to differences in fee structure. For information about other share classes available, please consult the prospectus. Data assumes reinvestment of dividends and capital gains, and none of the charts reflect the deduction of taxes that a shareholder would pay on fund distributions or the redemption of fund shares. Returns for the index are provided for comparison. The fund’s total returns include operating expenses (such as transaction costs and management fees) that reduce returns, while the total returns of the index do not.
|
|
| Growth of $10,000 Over Life of Class |
| $10,000 investment made September 30, 2005 |
|
| |
| Value on June 30, 2014 |
| | Investor Class — $21,590 |
| |
| | Russell 1000 Growth Index — $20,785 |
| |
*From September 30, 2005, the Investor Class's inception date. Not annualized.
|
| | | | |
| Total Annual Fund Operating Expenses |
| Investor Class | Institutional Class | A Class | C Class | R Class |
| 1.03% | 0.83% | 1.28% | 2.03% | 1.53% |
The total annual fund operating expenses shown is as stated in the fund’s prospectus current as of the date of this report. The prospectus may vary from the expense ratio shown elsewhere in this report because it is based on a different time period, includes acquired fund fees and expenses, and, if applicable, does not include fee waivers or expense reimbursements.
Data presented reflect past performance. Past performance is no guarantee of future results. Current performance may be higher or lower than the performance shown. Investment return and principal value will fluctuate, and redemption value may be more or less than original cost. To obtain performance data current to the most recent month end, please call 1-800-345-2021 or visit americancentury.com. The fund’s investment process may result in high portfolio turnover, which could mean high transaction costs, affecting both performance and capital gains tax liabilities to investors.
Unless otherwise indicated, performance reflects Investor Class shares; performance for other share classes will vary due to differences in fee structure. For information about other share classes available, please consult the prospectus. Data assumes reinvestment of dividends and capital gains, and none of the charts reflect the deduction of taxes that a shareholder would pay on fund distributions or the redemption of fund shares. Returns for the index are provided for comparison. The fund’s total returns include operating expenses (such as transaction costs and management fees) that reduce returns, while the total returns of the index do not.
Portfolio Managers: Bill Martin and Lynette Pang
Performance Summary
Disciplined Growth returned 28.05%* for the fiscal year ended June 30, 2014, compared with the 26.92% return of its benchmark, the Russell 1000 Growth Index, and the 24.61%** return of the broad S&P 500 Index.
As U.S. equity markets continued their robust appreciation, Disciplined Growth posted a solid gain for the 12-month period, outperforming the Russell 1000 Growth Index. The fund’s stock selection process incorporates factors of valuation, quality, growth, and momentum (sentiment) while striving to minimize unintended risks along industries and other risk characteristics. Security selection in the consumer staples and health care sectors contributed the most to fund results, while consumer discretionary holdings weighed on relative performance.
Consumer Staples and Health Care Outperformed
The consumer staples and health care sectors were among the leading contributors to the fund’s returns relative to the Russell 1000 Growth Index. Stock choices in the consumer staples sector, particularly among food products manufacturers and food and staples retailers, were especially effective, driving the sector's substantial outperformance relative to the index. Among the top sector contributors was an overweight position, relative to the index, in chain drug store Rite Aid, which rose on revenue growth and efficiency and distribution chain improvements, bolstering the sector’s return. Significant contribution also came from supermarket chain store operator Safeway, which advanced on speculation of being acquired by private equity firm Cerberus Capital Management, owner of the Albertson’s chain of grocery stores. Following their appreciation, we took profits in both holdings and exited our positions. Specialty coffee company Keurig Green Mountain gained on news of a partnership with Coca-Cola to sell branded single-serve beverage pods. Several chicken processors helped boost the fund’s performance including Pilgrim’s Pride, which rallied following management’s decision to bow out of the race with Tyson Foods to acquire Hillshire Brands.
Health care sector outperformance was primarily due to successful stock selection and positioning in the strongly appreciating pharmaceuticals industry. Holdings among health care equipment and supplies manufacturers also helped the sector’s advance. Questcor Pharmaceuticals rose on strong sales and earnings growth, and we sold out of the position following its strong advance. Likewise, biopharmaceutical firm Celgene enhanced results thanks to continued strength in sales of its key multiple myeloma drug, Revlimid.
Significant contribution also came from several information technology holdings, including an overweight position to semiconductor producer Skyworks Solutions, which added value following the company’s better-than-expected quarterly results and upward revisions to future earnings expectations. Likewise, apparel manufacturer Hanesbrands’ earnings growth and announced intent to purchase French clothing manufacturer DBApparel, thereby increasing exposure in Europe, helped to drive its stock price higher.
* All fund returns referenced in this commentary are for Investor Class shares. Performance for other share
classes will vary due to differences in fee structure; when Investor Class performance exceeds that of the
fund's benchmark, other share classes may not. See page 3 for returns for all share classes.
**The S&P 500 Index average annual returns were 18.82% for the five-year period ended June 30, 2014,
and 7.74% since the fund’s inception on September 30, 2005.
Consumer Discretionary Was Leading Detractor
Security selection in the consumer discretionary sector was the principal detractor from the fund’s 12-month results. A number of specialty retailers declined during the period including electronics retailer Best Buy, whose weaker-than-expected holiday sales amid a promotional sales environment failed to drive higher industry demand. Likewise, toy manufacturer Mattel diminished fund returns after disappointing holiday sales impacted the company’s earnings. Multiline retailer Target lagged in the wake of news about a security breach in its credit card payment system, as well as greater-than-expected cost increases associated with expansion. We ultimately sold the fund's positions in Best Buy, Mattel, and Target.
Stock selection among the fund’s information technology holdings also weighed on returns. Information technology and internet service providers were prominent underperformers. These included real-time data provider NeuStar, which declined on earnings guidance revisions below analyst estimates, and the fund sold its stake in the holding. An underweight position to social networking site Facebook also hurt results as its stock reached all-time highs. Despite this appreciation, the holding’s valuation profile continues to show weakness.
Holding several personal care products manufacturers proved to be unfavorable. Nu Skin Enterprises fell on accusations by Chinese authorities of operating a pyramid scheme, and Avon declined on shrinking sales volumes in North America and emerging markets countries. Both holdings were subsequently sold.
A Look Ahead
Economic recovery in the U.S. appears to be progressing, albeit at a slower pace than during prior post-recessionary periods, and is expected to stay the course through the remainder of 2014. Recent indicators such as improvements in small business and consumer confidence point to a sustainable rebound, and economic growth is likely to further benefit from the recovering labor and housing markets. Though a continuation of political instability in non-U.S. markets as well as the potential for rising inflation and interest rates could lead to heightened market volatility, our disciplined, objective, and systematic investment strategy is designed to take advantage of opportunities at the individual company level. We believe this approach is the most powerful way to capitalize on market inefficiencies that lead to the mispricing of individual stocks. The portfolio’s current holdings exhibit the highest exposure to quality insights, followed closely by value and growth, and we maintain positive exposure to momentum (sentiment). The fund's largest overweights are in health care and industrials, while the underweights are led by the consumer discretionary and financials sectors.
|
| |
| JUNE 30, 2014 | |
| Top Ten Holdings | % of net assets |
| Apple, Inc. | 4.9% |
| Verizon Communications, Inc. | 2.7% |
| Microsoft Corp. | 2.6% |
| Google, Inc.* | 2.3% |
| Oracle Corp. | 2.1% |
| QUALCOMM, Inc. | 2.0% |
| International Business Machines Corp. | 1.7% |
| AbbVie, Inc. | 1.7% |
| Boeing Co. (The) | 1.6% |
| Schlumberger Ltd. | 1.6% |
| *Includes all classes of the issuer. | |
| | |
| Top Five Industries | % of net assets |
| Technology Hardware, Storage and Peripherals | 7.0% |
| Software | 6.9% |
| Biotechnology | 5.4% |
| Internet Software and Services | 4.9% |
| Aerospace and Defense | 4.4% |
| | |
| Types of Investments in Portfolio | % of net assets |
| Common Stocks | 97.9% |
| Temporary Cash Investments | 2.8% |
| Other Assets and Liabilities | (0.7)% |
Fund shareholders may incur two types of costs: (1) transaction costs, including sales charges (loads) on purchase payments and redemption/exchange fees; and (2) ongoing costs, including management fees; distribution and service (12b-1) fees; and other fund expenses. This example is intended to help you understand your ongoing costs (in dollars) of investing in your fund and to compare these costs with the ongoing cost of investing in other mutual funds.
The example is based on an investment of $1,000 made at the beginning of the period and held for the entire period from January 1, 2014 to June 30, 2014.
Actual Expenses
The table provides information about actual account values and actual expenses for each class. You may use the information, together with the amount you invested, to estimate the expenses that you paid over the period. First, identify the share class you own. Then simply divide your account value by $1,000 (for example, an $8,600 account value divided by $1,000 = 8.6), then multiply the result by the number under the heading “Expenses Paid During Period” to estimate the expenses you paid on your account during this period.
If you hold Investor Class shares of any American Century Investments fund, or Institutional Class shares of the American Century Diversified Bond Fund, in an American Century Investments account (i.e., not a financial intermediary or retirement plan account), American Century Investments may charge you a $12.50 semiannual account maintenance fee if the value of those shares is less than $10,000. We will redeem shares automatically in one of your accounts to pay the $12.50 fee. In determining your total eligible investment amount, we will include your investments in all personal accounts (including American Century Investments Brokerage accounts) registered under your Social Security number. Personal accounts include individual accounts, joint accounts, UGMA/UTMA accounts, personal trusts, Coverdell Education Savings Accounts and IRAs (including traditional, Roth, Rollover, SEP-, SARSEP- and SIMPLE-IRAs), and certain other retirement accounts. If you have only business, business retirement, employer-sponsored or American Century Investments Brokerage accounts, you are currently not subject to this fee. If you are subject to the Account Maintenance Fee, your account value could be reduced by the fee amount.
Hypothetical Example for Comparison Purposes
The table also provides information about hypothetical account values and hypothetical expenses based on the actual expense ratio of each class of your fund and an assumed rate of return of 5% per year before expenses, which is not the actual return of a fund’s share class. The hypothetical account values and expenses may not be used to estimate the actual ending account balance or expenses you paid for the period. You may use this information to compare the ongoing costs of investing in your fund and other funds. To do so, compare this 5% hypothetical example with the 5% hypothetical examples that appear in the shareholder reports of the other funds.
Please note that the expenses shown in the table are meant to highlight your ongoing costs only and do not reflect any transactional costs, such as sales charges (loads) or redemption/exchange fees. Therefore, the table is useful in comparing ongoing costs only, and will not help you determine the relative total costs of owning different funds. In addition, if these transactional costs were included, your costs would have been higher.
|
| | | | |
| | Beginning
Account Value
1/1/14 | Ending
Account Value
6/30/14 | Expenses Paid
During Period(1)1/1/14 - 6/30/14 | Annualized
Expense Ratio(1) |
| Actual | | | | |
| Investor Class | $1,000 | $1,071.20 | $5.24 | 1.02% |
| Institutional Class | $1,000 | $1,072.60 | $4.21 | 0.82% |
| A Class | $1,000 | $1,070.20 | $6.52 | 1.27% |
| C Class | $1,000 | $1,066.20 | $10.35 | 2.02% |
| R Class | $1,000 | $1,069.10 | $7.80 | 1.52% |
| Hypothetical | | | | |
| Investor Class | $1,000 | $1,019.74 | $5.11 | 1.02% |
| Institutional Class | $1,000 | $1,020.73 | $4.11 | 0.82% |
| A Class | $1,000 | $1,018.50 | $6.36 | 1.27% |
| C Class | $1,000 | $1,014.78 | $10.09 | 2.02% |
| R Class | $1,000 | $1,017.26 | $7.60 | 1.52% |
| |
| (1) | Expenses are equal to the class’s annualized expense ratio listed in the table above, multiplied by the average account value over the period, multiplied by 181, the number of days in the most recent fiscal half-year, divided by 365, to reflect the one-half year period. |
JUNE 30, 2014
|
| | | | |
| | Shares | Value |
| COMMON STOCKS — 97.9% | | |
| AEROSPACE AND DEFENSE — 4.4% | | |
| Boeing Co. (The) | 48,226 | $ | 6,135,794 |
|
| Honeywell International, Inc. | 57,082 | 5,305,772 |
|
| Lockheed Martin Corp. | 26,691 | 4,290,044 |
|
| United Technologies Corp. | 8,226 | 949,692 |
|
| | | 16,681,302 |
|
| AIR FREIGHT AND LOGISTICS — 1.5% | | |
| United Parcel Service, Inc., Class B | 54,023 | 5,546,001 |
|
| AIRLINES — 1.7% | | |
| Delta Air Lines, Inc. | 72,860 | 2,821,139 |
|
| Southwest Airlines Co. | 132,224 | 3,551,537 |
|
| | | 6,372,676 |
|
| AUTO COMPONENTS — 2.9% | | |
| Delphi Automotive plc | 49,847 | 3,426,483 |
|
| Drew Industries, Inc. | 20,312 | 1,015,803 |
|
| Gentex Corp. | 92,279 | 2,684,396 |
|
Tenneco, Inc.(1) | 11,453 | 752,462 |
|
Tower International, Inc.(1) | 86,700 | 3,194,028 |
|
| | | 11,073,172 |
|
| AUTOMOBILES — 0.9% | | |
| Harley-Davidson, Inc. | 47,459 | 3,315,011 |
|
| BEVERAGES — 2.6% | | |
| Coca-Cola Co. (The) | 66,862 | 2,832,274 |
|
| Coca-Cola Enterprises, Inc. | 35,082 | 1,676,218 |
|
| Dr Pepper Snapple Group, Inc. | 56,072 | 3,284,698 |
|
| PepsiCo, Inc. | 23,671 | 2,114,767 |
|
| | | 9,907,957 |
|
| BIOTECHNOLOGY — 5.4% | | |
Alexion Pharmaceuticals, Inc.(1) | 8,034 | 1,255,312 |
|
| Amgen, Inc. | 49,858 | 5,901,691 |
|
Biogen Idec, Inc.(1) | 13,449 | 4,240,604 |
|
Celgene Corp.(1) | 37,460 | 3,217,065 |
|
Gilead Sciences, Inc.(1) | 25,789 | 2,138,166 |
|
Pharmacyclics, Inc.(1) | 15,735 | 1,411,587 |
|
United Therapeutics Corp.(1) | 26,038 | 2,304,103 |
|
| | | 20,468,528 |
|
| CAPITAL MARKETS — 1.2% | | |
Affiliated Managers Group, Inc.(1) | 8,822 | 1,812,039 |
|
| Franklin Resources, Inc. | 43,738 | 2,529,806 |
|
INTL FCStone, Inc.(1) | 6,095 | 121,412 |
|
| Westwood Holdings Group, Inc. | 1,850 | 111,074 |
|
| | | 4,574,331 |
|
| | | |
|
| | | | |
| | Shares | Value |
| CHEMICALS — 3.5% | | |
| Dow Chemical Co. (The) | 67,821 | $ | 3,490,069 |
|
| Eastman Chemical Co. | 36,631 | 3,199,718 |
|
| FutureFuel Corp. | 63,153 | 1,047,708 |
|
| NewMarket Corp. | 202 | 79,206 |
|
| Olin Corp. | 5,309 | 142,918 |
|
| PPG Industries, Inc. | 13,282 | 2,791,213 |
|
| Scotts Miracle-Gro Co. (The), Class A | 12,586 | 715,640 |
|
| Sigma-Aldrich Corp. | 16,221 | 1,646,107 |
|
| | | 13,112,579 |
|
| COMMUNICATIONS EQUIPMENT — 2.1% | | |
| Harris Corp. | 1,734 | 131,351 |
|
Juniper Networks, Inc.(1) | 2,428 | 59,583 |
|
| QUALCOMM, Inc. | 97,726 | 7,739,899 |
|
| | | 7,930,833 |
|
| CONSTRUCTION AND ENGINEERING — 0.3% | | |
AECOM Technology Corp.(1) | 30,338 | 976,884 |
|
| CONSUMER FINANCE — 0.3% | | |
| American Express Co. | 3,557 | 337,453 |
|
Credit Acceptance Corp.(1) | 7,810 | 961,411 |
|
| | | 1,298,864 |
|
| CONTAINERS AND PACKAGING — 0.8% | | |
| Ball Corp. | 49,866 | 3,125,601 |
|
| DIVERSIFIED CONSUMER SERVICES — 0.1% | | |
| Capella Education Co. | 7,676 | 417,498 |
|
| DIVERSIFIED TELECOMMUNICATION SERVICES — 2.7% | | |
| Verizon Communications, Inc. | 205,680 | 10,063,922 |
|
| ELECTRICAL EQUIPMENT — 2.2% | | |
| Emerson Electric Co. | 59,604 | 3,955,322 |
|
| Rockwell Automation, Inc. | 27,156 | 3,398,845 |
|
Thermon Group Holdings, Inc.(1) | 31,942 | 840,713 |
|
| | | 8,194,880 |
|
| ENERGY EQUIPMENT AND SERVICES — 2.6% | | |
| Baker Hughes, Inc. | 46,829 | 3,486,419 |
|
| RPC, Inc. | 18,231 | 428,246 |
|
| Schlumberger Ltd. | 50,618 | 5,970,393 |
|
| | | 9,885,058 |
|
| FOOD AND STAPLES RETAILING — 0.8% | | |
| Wal-Mart Stores, Inc. | 3,017 | 226,486 |
|
| Walgreen Co. | 40,531 | 3,004,563 |
|
| | | 3,231,049 |
|
| FOOD PRODUCTS — 4.0% | | |
| Archer-Daniels-Midland Co. | 63,366 | 2,795,074 |
|
| Kellogg Co. | 50,385 | 3,310,295 |
|
| Keurig Green Mountain, Inc. | 18,255 | 2,274,756 |
|
|
| | | | |
| | Shares | Value |
Pilgrim's Pride Corp.(1) | 117,825 | $ | 3,223,692 |
|
| Sanderson Farms, Inc. | 35,502 | 3,450,794 |
|
| | | 15,054,611 |
|
| HEALTH CARE EQUIPMENT AND SUPPLIES — 3.6% | | |
Align Technology, Inc.(1) | 7,530 | 421,981 |
|
| Becton Dickinson and Co. | 30,810 | 3,644,823 |
|
| C.R. Bard, Inc. | 21,825 | 3,121,193 |
|
| St. Jude Medical, Inc. | 46,853 | 3,244,571 |
|
| Stryker Corp. | 40,575 | 3,421,284 |
|
| | | 13,853,852 |
|
| HEALTH CARE PROVIDERS AND SERVICES — 1.2% | | |
Express Scripts Holding Co.(1) | 61,275 | 4,248,195 |
|
Mednax, Inc.(1) | 6,005 | 349,191 |
|
| | | 4,597,386 |
|
| HOTELS, RESTAURANTS AND LEISURE — 1.9% | | |
Bally Technologies, Inc.(1) | 26,037 | 1,711,152 |
|
| Las Vegas Sands Corp. | 44,676 | 3,405,205 |
|
| McDonald's Corp. | 7,919 | 797,760 |
|
| Wyndham Worldwide Corp. | 15,141 | 1,146,476 |
|
| | | 7,060,593 |
|
| HOUSEHOLD DURABLES — 0.9% | | |
NVR, Inc.(1) | 2,669 | 3,070,951 |
|
Universal Electronics, Inc.(1) | 7,709 | 376,816 |
|
| | | 3,447,767 |
|
| HOUSEHOLD PRODUCTS — 1.1% | | |
| Kimberly-Clark Corp. | 38,028 | 4,229,474 |
|
| Oil-Dri Corp. of America | 2,333 | 71,320 |
|
| | | 4,300,794 |
|
| INDUSTRIAL CONGLOMERATES — 1.5% | | |
| 3M Co. | 39,330 | 5,633,629 |
|
| INSURANCE — 1.7% | | |
| Amtrust Financial Services, Inc. | 35,370 | 1,478,820 |
|
| Chubb Corp. (The) | 18,257 | 1,682,747 |
|
| Hanover Insurance Group, Inc. (The) | 45,286 | 2,859,811 |
|
| Infinity Property & Casualty Corp. | 5,538 | 372,320 |
|
| United Fire Group, Inc. | 5,826 | 170,818 |
|
| | | 6,564,516 |
|
| INTERNET AND CATALOG RETAIL — 1.7% | | |
Amazon.com, Inc.(1) | 8,387 | 2,723,930 |
|
| HSN, Inc. | 39,976 | 2,368,178 |
|
Priceline Group, Inc. (The)(1) | 986 | 1,186,158 |
|
| | | 6,278,266 |
|
| INTERNET SOFTWARE AND SERVICES — 4.9% | | |
eBay, Inc.(1) | 85,307 | 4,270,469 |
|
Facebook, Inc., Class A(1) | 85,308 | 5,740,375 |
|
Google, Inc., Class A(1) | 9,616 | 5,622,187 |
|
|
| | | | |
| | Shares | Value |
Google, Inc., Class C(1) | 5,147 | $ | 2,960,966 |
|
| | | 18,593,997 |
|
| IT SERVICES — 3.4% | | |
| CSG Systems International, Inc. | 37,467 | 978,263 |
|
Euronet Worldwide, Inc.(1) | 8,706 | 419,978 |
|
Fiserv, Inc.(1) | 1,243 | 74,978 |
|
| International Business Machines Corp. | 36,596 | 6,633,757 |
|
| Jack Henry & Associates, Inc. | 48,905 | 2,906,424 |
|
| MasterCard, Inc., Class A | 5,929 | 435,604 |
|
| Visa, Inc., Class A | 6,171 | 1,300,291 |
|
| | | 12,749,295 |
|
| MACHINERY — 2.3% | | |
| Caterpillar, Inc. | 31,112 | 3,380,941 |
|
| Dover Corp. | 9,712 | 883,306 |
|
| IDEX Corp. | 23,289 | 1,880,354 |
|
| Snap-On, Inc. | 21,557 | 2,554,936 |
|
| | | 8,699,537 |
|
| MEDIA — 2.5% | | |
| Comcast Corp., Class A | 35,183 | 1,888,623 |
|
| Viacom, Inc., Class B | 38,964 | 3,379,348 |
|
| Walt Disney Co. (The) | 49,198 | 4,218,237 |
|
| | | 9,486,208 |
|
| METALS AND MINING — 0.2% | | |
| Compass Minerals International, Inc. | 7,515 | 719,486 |
|
| MULTILINE RETAIL — 1.5% | | |
| Dillard's, Inc., Class A | 19,412 | 2,263,633 |
|
| Macy's, Inc. | 58,718 | 3,406,819 |
|
| | | 5,670,452 |
|
| OIL, GAS AND CONSUMABLE FUELS — 1.9% | | |
| EOG Resources, Inc. | 44,093 | 5,152,708 |
|
REX American Resources Corp.(1) | 14,191 | 1,040,342 |
|
Southwestern Energy Co.(1) | 26,611 | 1,210,535 |
|
| | | 7,403,585 |
|
| PERSONAL PRODUCTS — 0.5% | | |
Medifast, Inc.(1) | 38,839 | 1,181,094 |
|
USANA Health Sciences, Inc.(1) | 11,353 | 887,123 |
|
| | | 2,068,217 |
|
| PHARMACEUTICALS — 4.4% | | |
| AbbVie, Inc. | 112,279 | 6,337,027 |
|
Actavis plc(1) | 8,546 | 1,906,185 |
|
| Eli Lilly & Co. | 43,365 | 2,696,002 |
|
| Johnson & Johnson | 42,512 | 4,447,606 |
|
Salix Pharmaceuticals Ltd.(1) | 10,061 | 1,241,024 |
|
| | | 16,627,844 |
|
| ROAD AND RAIL — 0.1% | | |
| Union Pacific Corp. | 5,366 | 535,259 |
|
|
| | | | |
| | Shares | Value |
| SEMICONDUCTORS AND SEMICONDUCTOR EQUIPMENT — 4.3% | | |
| Broadcom Corp., Class A | 95,337 | $ | 3,538,910 |
|
| Intel Corp. | 113,718 | 3,513,886 |
|
| Lam Research Corp. | 12,555 | 848,467 |
|
| Skyworks Solutions, Inc. | 59,615 | 2,799,520 |
|
| Texas Instruments, Inc. | 94,913 | 4,535,892 |
|
| Xilinx, Inc. | 22,767 | 1,077,107 |
|
| | | 16,313,782 |
|
| SOFTWARE — 6.9% | | |
Cadence Design Systems, Inc.(1) | 109,621 | 1,917,271 |
|
| Intuit, Inc. | 7,191 | 579,091 |
|
| Microsoft Corp. | 237,888 | 9,919,930 |
|
| Oracle Corp. | 194,860 | 7,897,676 |
|
PTC, Inc.(1) | 21,903 | 849,836 |
|
| Symantec Corp. | 128,882 | 2,951,398 |
|
VMware, Inc., Class A(1) | 20,721 | 2,006,000 |
|
| | | 26,121,202 |
|
| SPECIALTY RETAIL — 2.0% | | |
AutoZone, Inc.(1) | 6,416 | 3,440,516 |
|
| Children's Place, Inc. (The) | 9,904 | 491,536 |
|
| Haverty Furniture Cos., Inc. | 54,519 | 1,370,062 |
|
| Home Depot, Inc. (The) | 16,063 | 1,300,460 |
|
| Lowe's Cos., Inc. | 23,887 | 1,146,337 |
|
| | | 7,748,911 |
|
| TECHNOLOGY HARDWARE, STORAGE AND PERIPHERALS — 7.0% | | |
| Apple, Inc. | 198,923 | 18,485,914 |
|
| EMC Corp. | 47,219 | 1,243,749 |
|
| NetApp, Inc. | 81,787 | 2,986,861 |
|
| SanDisk Corp. | 38,295 | 3,999,147 |
|
| | | 26,715,671 |
|
| TEXTILES, APPAREL AND LUXURY GOODS — 1.8% | | |
Deckers Outdoor Corp.(1) | 35,165 | 3,035,795 |
|
| Hanesbrands, Inc. | 37,478 | 3,689,334 |
|
| | | 6,725,129 |
|
| TOBACCO — 0.6% | | |
| Philip Morris International, Inc. | 26,249 | 2,213,053 |
|
TOTAL COMMON STOCKS (Cost $312,219,987) | | 371,359,188 |
|
| TEMPORARY CASH INVESTMENTS — 2.8% | | |
| Repurchase Agreement, Bank of America Merrill Lynch, (collateralized by various U.S. Treasury obligations, 0.75% - 0.875%, 1/31/18 - 2/28/18, valued at $2,372,095), in a joint trading account at 0.05%, dated 6/30/14, due 7/1/14 (Delivery value $2,324,360) | | 2,324,357 |
|
| Repurchase Agreement, Credit Suisse First Boston, Inc., (collateralized by various U.S. Treasury obligations, 1.75%, 5/15/23, valued at $949,145), in a joint trading account at 0.01%, dated 6/30/14, due 7/1/14 (Delivery value $929,743) | | 929,743 |
|
|
| | | | |
| | Shares | Value |
| Repurchase Agreement, Goldman Sachs & Co., (collateralized by various U.S. Treasury obligations, 3.125%, 11/15/41, valued at $1,896,892), in a joint trading account at 0.03%, dated 6/30/14, due 7/1/14 (Delivery value $1,859,488) | | $ | 1,859,486 |
|
| SSgA U.S. Government Money Market Fund, Class N | 5,494,333 | 5,494,333 |
|
TOTAL TEMPORARY CASH INVESTMENTS (Cost $10,607,919) | | 10,607,919 |
|
TOTAL INVESTMENT SECURITIES — 100.7% (Cost $322,827,906) | | 381,967,107 |
|
| OTHER ASSETS AND LIABILITIES — (0.7)% | | (2,496,401) |
|
| TOTAL NET ASSETS — 100.0% | | $ | 379,470,706 |
|
|
| | |
| NOTES TO SCHEDULE OF INVESTMENTS |
See Notes to Financial Statements.
|
|
| Statement of Assets and Liabilities |
|
| | | |
| JUNE 30, 2014 | |
| Assets | |
| Investment securities, at value (cost of $322,827,906) | $ | 381,967,107 |
|
| Receivable for capital shares sold | 1,367,258 |
|
| Dividends and interest receivable | 252,644 |
|
| | 383,587,009 |
|
| | |
| Liabilities | |
| Payable for investments purchased | 3,533,511 |
|
| Payable for capital shares redeemed | 240,520 |
|
| Accrued management fees | 301,362 |
|
| Distribution and service fees payable | 40,910 |
|
| | 4,116,303 |
|
| | |
| Net Assets | $ | 379,470,706 |
|
| | |
| Net Assets Consist of: | |
| Capital (par value and paid-in surplus) | $ | 306,217,850 |
|
| Undistributed net investment income | 23,157 |
|
| Undistributed net realized gain | 14,090,498 |
|
| Net unrealized appreciation | 59,139,201 |
|
| | $ | 379,470,706 |
|
|
| | | | | | |
| | Net Assets | Shares Outstanding | Net Asset Value Per Share |
| Investor Class, $0.01 Par Value |
| $226,370,353 |
| 12,026,939 |
| $18.82 |
| Institutional Class, $0.01 Par Value |
| $26,334,342 |
| 1,395,829 |
| $18.87 |
| A Class, $0.01 Par Value |
| $95,508,584 |
| 5,089,168 |
| $18.77* |
| C Class, $0.01 Par Value |
| $24,646,083 |
| 1,353,530 |
| $18.21 |
| R Class, $0.01 Par Value |
| $6,611,344 |
| 355,423 |
| $18.60 |
*Maximum offering price $19.92 (net asset value divided by 0.9425).
See Notes to Financial Statements.
|
| | | |
| YEAR ENDED JUNE 30, 2014 | |
| Investment Income (Loss) | |
| Income: | |
| Dividends (net of foreign taxes withheld of $255) | $ | 4,782,418 |
|
| Interest | 761 |
|
| | 4,783,179 |
|
| | |
| Expenses: | |
| Management fees | 2,786,451 |
|
| Distribution and service fees: | |
| A Class | 171,392 |
|
| C Class | 164,591 |
|
| R Class | 32,558 |
|
| Directors' fees and expenses | 16,306 |
|
| Other expenses | 366 |
|
| | 3,171,664 |
|
| | |
| Net investment income (loss) | 1,611,515 |
|
| | |
| Realized and Unrealized Gain (Loss) | |
| Net realized gain (loss) on investment transactions | 21,798,137 |
|
| Change in net unrealized appreciation (depreciation) on investments | 41,666,448 |
|
| | |
| Net realized and unrealized gain (loss) | 63,464,585 |
|
| | |
| Net Increase (Decrease) in Net Assets Resulting from Operations | $ | 65,076,100 |
|
See Notes to Financial Statements.
|
|
| Statement of Changes in Net Assets |
|
| | | | | | |
| YEARS ENDED JUNE 30, 2014 AND JUNE 30, 2013 | | |
| Increase (Decrease) in Net Assets | June 30, 2014 | June 30, 2013 |
| Operations | | |
| Net investment income (loss) | $ | 1,611,515 |
| $ | 1,138,198 |
|
| Net realized gain (loss) | 21,798,137 |
| 8,144,454 |
|
| Change in net unrealized appreciation (depreciation) | 41,666,448 |
| 9,207,526 |
|
| Net increase (decrease) in net assets resulting from operations | 65,076,100 |
| 18,490,178 |
|
| | | |
| Distributions to Shareholders | | |
| From net investment income: | | |
| Investor Class | (1,118,387 | ) | (916,204 | ) |
| Institutional Class | (161,505 | ) | (55,374 | ) |
| A Class | (263,244 | ) | (269,562 | ) |
| R Class | (6,853 | ) | (16,303 | ) |
| From net realized gains: | | |
| Investor Class | (8,175,308 | ) | — |
|
| Institutional Class | (783,055 | ) | — |
|
| A Class | (3,202,886 | ) | — |
|
| C Class | (806,884 | ) | — |
|
| R Class | (355,074 | ) | — |
|
| Decrease in net assets from distributions | (14,873,196 | ) | (1,257,443 | ) |
| | | |
| Capital Share Transactions | | |
Net increase (decrease) in net assets from capital share transactions (Note 5) | 142,933,604 |
| 90,430,843 |
|
| | | |
| Net increase (decrease) in net assets | 193,136,508 |
| 107,663,578 |
|
| | | |
| Net Assets | | |
| Beginning of period | 186,334,198 |
| 78,670,620 |
|
| End of period | $ | 379,470,706 |
| $ | 186,334,198 |
|
| | | |
| Undistributed net investment income | $ | 23,157 |
| $ | 32,350 |
|
See Notes to Financial Statements.
|
|
| Notes to Financial Statements |
JUNE 30, 2014
1. Organization
American Century Quantitative Equity Funds, Inc. (the corporation) is registered under the Investment Company Act of 1940, as amended (the 1940 Act), as an open-end management investment company and is organized as a Maryland corporation. Disciplined Growth Fund (the fund) is one fund in a series issued by the corporation. The fund is diversified as defined under the 1940 Act. The fund’s investment objective is to seek long-term capital growth.
The fund offers the Investor Class, the Institutional Class, the A Class, the C Class and the R Class. The A Class may incur an initial sales charge. The A Class and C Class may be subject to a contingent deferred sales charge. The share classes differ principally in their respective sales charges and distribution and shareholder servicing expenses and arrangements. The Institutional Class is made available to institutional shareholders or through financial intermediaries whose clients do not require the same level of shareholder and administrative services as shareholders of other classes. As a result, the Institutional Class is charged a lower unified management fee.
2. Significant Accounting Policies
The following is a summary of significant accounting policies consistently followed by the fund in preparation of its financial statements. The financial statements are prepared in conformity with accounting principles generally accepted in the United States of America, which may require management to make certain estimates and assumptions at the date of the financial statements. Actual results could differ from these estimates. Management evaluated the impact of events or transactions occurring through the date the financial statements were issued that would merit recognition or disclosure.
Investment Valuations — The fund determines the fair value of its investments and computes its net asset value per share at the close of regular trading (usually 4 p.m. Eastern time) on the New York Stock Exchange (NYSE) on each day the NYSE is open. The Board of Directors has adopted valuation policies and procedures to guide the investment advisor in the fund’s investment valuation process and to provide methodologies for the oversight of the fund’s pricing function.
Equity securities that are listed or traded on a domestic securities exchange are valued at the last reported sales price or at the official closing price as provided by the exchange. Equity securities traded on foreign securities exchanges are generally valued at the closing price of such securities on the exchange where primarily traded or at the close of the NYSE, if that is earlier. If no last sales price is reported, or if local convention or regulation so provides, the mean of the latest bid and asked prices may be used. Securities traded over-the-counter are valued at the mean of the latest bid and asked prices, the last sales price, or the official closing price.
Fixed income securities maturing within 60 days at the time of purchase may be valued at cost, plus or minus any amortized discount or premium or at the evaluated mean as provided by an independent pricing service. Evaluated mean prices are commonly derived through utilization of market models, which may consider, among other factors: trade data, quotations from dealers and active market makers, relevant yield curve and spread data, related sector levels, creditworthiness, trade data or market information on comparable securities, and other relevant security specific information.
Open-end management investment companies are valued at the reported net asset value per share. Repurchase agreements are valued at cost, which approximates fair value.
If the fund determines that the market price for an investment is not readily available or the valuation methods mentioned above do not reflect an investment’s fair value, such investment is valued as determined in good faith by the Board of Directors or its delegate, in accordance with policies and procedures adopted by the Board of Directors. In its determination of fair value, the fund may review several factors including, but not limited to, market information regarding the specific investment or comparable investments and correlation with other investment types, futures indices or general market indicators. Circumstances that may cause the fund to use these procedures to value an investment include, but are not limited to: an investment has been declared in default or is distressed; trading in a security has been suspended during the trading day or a
security is not actively trading on its principal exchange; prices received from a regular pricing source are deemed unreliable; or there is a foreign market holiday and no trading occurred.
The fund monitors for significant events occurring after the close of an investment’s primary exchange but before the fund’s net asset value per share is determined. Significant events may include, but are not limited to: corporate announcements and transactions; governmental action and political unrest that could impact a specific investment or an investment sector; or armed conflicts, natural disasters and similar events that could affect investments in a specific country or region. The fund also monitors for significant fluctuations between domestic and foreign markets, as evidenced by the U.S. market or such other indicators that the Board of Directors, or its delegate, deems appropriate. If significant fluctuations in foreign markets are identified, the fund may apply a model-derived factor to the closing price of equity securities traded on foreign securities exchanges. The factor is based on observable market data as provided by an independent pricing service.
Security Transactions — Security transactions are accounted for as of the trade date. Net realized gains and losses are determined on the identified cost basis, which is also used for federal income tax purposes.
Investment Income — Dividend income less foreign taxes withheld, if any, is recorded as of the ex-dividend date. Distributions received on securities that represent a return of capital or long-term capital gain are recorded as a reduction of cost of investments and/or as a realized gain. The fund may estimate the components of distributions received that may be considered nontaxable distributions or long-term capital gain distributions for income tax purposes. Interest income is recorded on the accrual basis and includes accretion of discounts and amortization of premiums.
Repurchase Agreements — The fund may enter into repurchase agreements with institutions that American Century Investment Management, Inc. (ACIM) (the investment advisor) has determined are creditworthy pursuant to criteria adopted by the Board of Directors. The fund requires that the collateral, represented by securities, received in a repurchase transaction be transferred to the custodian in a manner sufficient to enable the fund to obtain those securities in the event of a default under the repurchase agreement. ACIM monitors, on a daily basis, the securities transferred to ensure the value, including accrued interest, of the securities under each repurchase agreement is equal to or greater than amounts owed to the fund under each repurchase agreement.
Joint Trading Account — Pursuant to an Exemptive Order issued by the Securities and Exchange Commission, the fund, along with certain other funds in the American Century Investments family of funds, may transfer uninvested cash balances into a joint trading account. These balances are invested in one or more repurchase agreements that are collateralized by U.S. Treasury or Agency obligations.
Income Tax Status — It is the fund’s policy to distribute substantially all net investment income and net realized gains to shareholders and to otherwise qualify as a regulated investment company under provisions of the Internal Revenue Code. Accordingly, no provision has been made for income taxes. The fund files U.S. federal, state, local and non-U.S. tax returns as applicable. The fund's tax returns are subject to examination by the relevant taxing authority until expiration of the applicable statute of limitations, which is generally three years from the date of filing but can be longer in certain jurisdictions. At this time, management believes there are no uncertain tax positions which, based on their technical merit, would not be sustained upon examination and for which it is reasonably possible that the total amounts of unrecognized tax benefits will significantly change in the next twelve months.
Multiple Class — All shares of the fund represent an equal pro rata interest in the net assets of the class to which such shares belong, and have identical voting, dividend, liquidation and other rights and the same terms and conditions, except for class specific expenses and exclusive rights to vote on matters affecting only individual classes. Income, non-class specific expenses, and realized and unrealized capital gains and losses of the fund are allocated to each class of shares based on their relative net assets.
Distributions to Shareholders — Distributions from net investment income, if any, are generally declared and paid semiannually. Distributions from net realized gains, if any, are generally declared and paid annually.
Indemnifications — Under the corporation’s organizational documents, its officers and directors are indemnified against certain liabilities arising out of the performance of their duties to the fund. In addition, in the normal course of business, the fund enters into contracts that provide general indemnifications. The maximum exposure under these arrangements is unknown as this would involve future claims that may be made against a fund. The risk of material loss from such claims is considered by management to be remote.
3. Fees and Transactions with Related Parties
Certain officers and directors of the corporation are also officers and/or directors of American Century Companies, Inc. (ACC). The corporation’s investment advisor, ACIM, the corporation's distributor, American Century Investment Services, Inc. (ACIS), and the corporation’s transfer agent, American Century Services, LLC, are wholly owned, directly or indirectly, by ACC.
Management Fees — The corporation has entered into a management agreement with ACIM, under which ACIM provides the fund with investment advisory and management services in exchange for a single, unified management fee (the fee) per class. The agreement provides that all expenses of managing and operating the fund, except distribution and service fees, brokerage expenses, taxes, interest, fees and expenses of the independent directors (including legal counsel fees), and extraordinary expenses, will be paid by ACIM. The fee is computed and accrued daily based on each class’s daily net assets and paid monthly in arrears. The fee consists of (1) an Investment Category Fee based on the daily net assets of the fund and certain other accounts managed by the investment advisor that are in the same broad investment category as the fund and (2) a Complex Fee based on the assets of all the funds in the American Century Investments family of funds. The rates for the Investment Category Fee range from 0.6880% to 0.8700%. The rates for the Complex Fee range from 0.2500% to 0.3100% for the Investor Class, A Class, C Class and R Class. The rates for the Complex Fee range from 0.0500% to 0.1100% for the Institutional Class. The effective annual management fee for each class for the year ended June 30, 2014 was 1.02% for the Investor Class, A Class, C Class and R Class and 0.82% for the Institutional Class.
Distribution and Service Fees — The Board of Directors has adopted a separate Master Distribution and Individual Shareholder Services Plan for each of the A Class, C Class and R Class (collectively the plans), pursuant to Rule 12b-1 of the 1940 Act. The plans provide that the A Class will pay ACIS an annual distribution and service fee of 0.25%. The plans provide that the C Class will pay ACIS an annual distribution and service fee of 1.00%, of which 0.25% is paid for individual shareholder services and 0.75% is paid for distribution services. The plans provide that the R Class will pay ACIS an annual distribution and service fee of 0.50%. The fees are computed and accrued daily based on each class’s daily net assets and paid monthly in arrears. The fees are used to pay financial intermediaries for distribution and individual shareholder services. Fees incurred under the plans during the year ended June 30, 2014 are detailed in the Statement of Operations.
Directors' Fees and Expenses — The Board of Directors is responsible for overseeing the investment advisor’s management and operations of the fund. The directors receive detailed information about the fund and its investment advisor regularly throughout the year, and meet at least quarterly with management of the investment advisor to review reports about fund operations. Fees and expenses incurred in conjunction with the directors during the year ended June 30, 2014 are detailed in the Statement of Operations. The fund’s officers do not receive compensation from the fund.
4. Investment Transactions
Purchases and sales of investment securities, excluding short-term investments, for the year ended June 30, 2014 were $405,458,373 and $281,487,581, respectively.
5. Capital Share Transactions
Transactions in shares of the fund were as follows:
|
| | | | | | | | | | |
| | Year ended June 30, 2014 | Year ended June 30, 2013 |
| | Shares | Amount | Shares | Amount |
| Investor Class/Shares Authorized | 50,000,000 |
| | 50,000,000 |
| |
| Sold | 6,893,130 |
| $ | 119,853,193 |
| 4,258,230 |
| $ | 63,225,442 |
|
| Issued in reinvestment of distributions | 525,527 |
| 9,094,991 |
| 62,561 |
| 901,365 |
|
| Redeemed | (2,418,185 | ) | (42,063,379 | ) | (1,612,468 | ) | (23,296,506 | ) |
| | 5,000,472 |
| 86,884,805 |
| 2,708,323 |
| 40,830,301 |
|
| Institutional Class/Shares Authorized | 10,000,000 |
| | 10,000,000 |
| |
| Sold | 1,308,290 |
| 22,677,090 |
| 664,297 |
| 10,129,591 |
|
| Issued in reinvestment of distributions | 54,256 |
| 944,560 |
| 3,697 |
| 55,374 |
|
| Redeemed | (615,721 | ) | (10,652,473 | ) | (84,401 | ) | (1,253,578 | ) |
| | 746,825 |
| 12,969,177 |
| 583,593 |
| 8,931,387 |
|
| A Class/Shares Authorized | 35,000,000 |
| | 10,000,000 |
| |
| Sold | 3,522,429 |
| 61,683,117 |
| 2,573,486 |
| 37,454,410 |
|
| Issued in reinvestment of distributions | 195,823 |
| 3,368,533 |
| 18,265 |
| 262,997 |
|
| Redeemed | (1,972,503 | ) | (34,230,449 | ) | (428,107 | ) | (6,315,309 | ) |
| | 1,745,749 |
| 30,821,201 |
| 2,163,644 |
| 31,402,098 |
|
| C Class/Shares Authorized | 10,000,000 |
| | 10,000,000 |
| |
| Sold | 773,894 |
| 13,114,904 |
| 465,146 |
| 6,674,767 |
|
| Issued in reinvestment of distributions | 42,877 |
| 713,903 |
| — |
| — |
|
| Redeemed | (95,810 | ) | (1,637,289 | ) | (93,436 | ) | (1,357,370 | ) |
| | 720,961 |
| 12,191,518 |
| 371,710 |
| 5,317,397 |
|
| R Class/Shares Authorized | 10,000,000 |
| | 10,000,000 |
| |
| Sold | 170,076 |
| 2,913,012 |
| 337,570 |
| 4,761,451 |
|
| Issued in reinvestment of distributions | 21,306 |
| 361,927 |
| 1,159 |
| 16,303 |
|
| Redeemed | (184,695 | ) | (3,208,036 | ) | (57,956 | ) | (828,094 | ) |
| | 6,687 |
| 66,903 |
| 280,773 |
| 3,949,660 |
|
| Net increase (decrease) | 8,220,694 |
| $ | 142,933,604 |
| 6,108,043 |
| $ | 90,430,843 |
|
6. Fair Value Measurements
The fund’s investments valuation process is based on several considerations and may use multiple inputs to determine the fair value of the investments held by the fund. In conformity with accounting principles generally accepted in the United States of America, the inputs used to determine a valuation are classified into three broad levels.
| |
| • | Level 1 valuation inputs consist of unadjusted quoted prices in an active market for identical investments. |
| |
| • | Level 2 valuation inputs consist of direct or indirect observable market data (including quoted prices for comparable investments, evaluations of subsequent market events, interest rates, prepayment speeds, credit risk, etc.). These inputs also consist of quoted prices for identical investments initially expressed in local currencies that are adjusted through translation into U.S. dollars. |
| |
| • | Level 3 valuation inputs consist of unobservable data (including a fund’s own assumptions). |
The level classification is based on the lowest level input that is significant to the fair valuation measurement. The valuation inputs are not necessarily an indication of the risks associated with investing in these securities or other financial instruments.
The following is a summary of the level classifications as of period end. The Schedule of Investments provides additional information on the fund’s portfolio holdings.
|
| | | | | | | | |
| | Level 1 | Level 2 | Level 3 |
| Assets | | | |
| Investment Securities | | | |
| Common Stocks | $ | 371,359,188 |
| — |
| — |
|
| Temporary Cash Investments | 5,494,333 |
| $ | 5,113,586 |
| — |
|
| | $ | 376,853,521 |
| $ | 5,113,586 |
| — |
|
7. Risk Factors
The fund’s investment process may result in high portfolio turnover, which could mean high transaction costs, affecting both performance and capital gains tax liabilities to investors.
8. Federal Tax Information
The tax character of distributions paid during the years ended June 30, 2014 and June 30, 2013 were as follows:
|
| | | | | | |
| | 2014 | 2013 |
| Distributions Paid From | | |
| Ordinary income | $ | 9,121,736 |
| $ | 1,257,443 |
|
| Long-term capital gains | $ | 5,751,460 |
| – |
|
The book-basis character of distributions made during the year from net investment income or net realized gains may differ from their ultimate characterization for federal income tax purposes. These differences reflect the differing character of certain income items and net realized gains and losses for financial statement and tax purposes, and may result in reclassification among certain capital accounts on the financial statements.
As of June 30, 2014, the federal tax cost of investments and the components of distributable earnings on a tax-basis were as follows:
|
| | | |
| Federal tax cost of investments | $ | 323,961,726 |
|
| Gross tax appreciation of investments | $ | 59,494,144 |
|
| Gross tax depreciation of investments | (1,488,763 | ) |
| Net tax appreciation (depreciation) of investments | $ | 58,005,381 |
|
| Undistributed ordinary income | $ | 8,297,849 |
|
| Accumulated long-term gains | $ | 6,949,626 |
|
| | |
The difference between book-basis and tax-basis unrealized appreciation (depreciation) is attributable primarily to the tax deferral of losses on wash sales.
|
| | | | | | | | | | | | | | | |
| For a Share Outstanding Throughout the Years Ended June 30 (except as noted) | | |
| Per-Share Data | | | | | Ratios and Supplemental Data |
| | | Income From Investment Operations: | Distributions From: | | | Ratio to Average Net Assets of: | |
| | Net Asset
Value,
Beginning
of Period | Net
Investment
Income
(Loss)(1) | Net
Realized
and
Unrealized
Gain (Loss) | Total From
Investment
Operations | Net
Investment
Income | Net
Realized
Gains | Total
Distributions | Net Asset
Value,
End
of Period | Total
Return(2) | Operating
Expenses | Net
Investment
Income
(Loss) | Portfolio
Turnover
Rate | Net
Assets,
End of
Period
(in thousands) |
| Investor Class | | | | | | | | | | | |
| 2014 | $15.56 | 0.12 | 4.15 | 4.27 | (0.11) | (0.90) | (1.01) | $18.82 | 28.05% | 1.02% | 0.70% | 102% |
| $226,370 |
|
| 2013 | $13.38 | 0.16 | 2.19 | 2.35 | (0.17) | — | (0.17) | $15.56 | 17.70% | 1.03% | 1.07% | 94% |
| $109,366 |
|
| 2012 | $12.85 | 0.09 | 0.50 | 0.59 | (0.06) | — | (0.06) | $13.38 | 4.68% | 1.04% | 0.73% | 94% |
| $57,780 |
|
| 2011 | $9.27 | 0.04 | 3.57 | 3.61 | (0.03) | — | (0.03) | $12.85 | 39.00% | 1.04% | 0.37% | 117% |
| $31,450 |
|
| 2010 | $8.01 | 0.04 | 1.27 | 1.31 | (0.05) | — | (0.05) | $9.27 | 16.35% | 1.05% | 0.46% | 84% |
| $12,787 |
|
| Institutional Class | | | | | | | | | | | |
| 2014 | $15.60 | 0.16 | 4.15 | 4.31 | (0.14) | (0.90) | (1.04) | $18.87 | 28.30% | 0.82% | 0.90% | 102% |
| $26,334 |
|
| 2013 | $13.42 | 0.19 | 2.20 | 2.39 | (0.21) | — | (0.21) | $15.60 | 17.99% | 0.83% | 1.27% | 94% |
| $10,124 |
|
| 2012 | $12.89 | 0.10 | 0.52 | 0.62 | (0.09) | — | (0.09) | $13.42 | 4.87% | 0.84% | 0.93% | 94% |
| $878 |
|
| 2011 | $9.30 | 0.06 | 3.59 | 3.65 | (0.06) | — | (0.06) | $12.89 | 39.26% | 0.84% | 0.57% | 117% |
| $3,097 |
|
| 2010 | $8.03 | 0.06 | 1.28 | 1.34 | (0.07) | — | (0.07) | $9.30 | 16.67% | 0.85% | 0.66% | 84% |
| $2,152 |
|
| A Class | | | | | | | | | | |
| 2014 | $15.52 | 0.08 | 4.13 | 4.21 | (0.06) | (0.90) | (0.96) | $18.77 | 27.75% | 1.27% | 0.45% | 102% |
| $95,509 |
|
| 2013 | $13.33 | 0.12 | 2.19 | 2.31 | (0.12) | — | (0.12) | $15.52 | 17.42% | 1.28% | 0.82% | 94% |
| $51,897 |
|
| 2012 | $12.80 | 0.07 | 0.49 | 0.56 | (0.03) | — | (0.03) | $13.33 | 4.44% | 1.29% | 0.48% | 94% |
| $15,726 |
|
| 2011 | $9.23 | 0.02 | 3.55 | 3.57 | —(3) | — | —(3) | $12.80 | 38.71% | 1.29% | 0.12% | 117% |
| $3,026 |
|
| 2010 | $7.98 | 0.02 | 1.26 | 1.28 | (0.03) | — | (0.03) | $9.23 | 16.00% | 1.30% | 0.21% | 84% |
| $661 |
|
|
| | | | | | | | | | | | | | | |
| For a Share Outstanding Throughout the Years Ended June 30 (except as noted) | | |
| Per-Share Data | | | | | Ratios and Supplemental Data |
| | | Income From Investment Operations: | Distributions From: | | | Ratio to Average Net Assets of: | |
| | Net Asset
Value,
Beginning
of Period | Net
Investment
Income
(Loss)(1) | Net
Realized
and
Unrealized
Gain (Loss) | Total From
Investment
Operations | Net
Investment
Income | Net
Realized
Gains | Total
Distributions | Net Asset
Value,
End
of Period | Total
Return(2) | Operating
Expenses | Net
Investment
Income
(Loss) | Portfolio
Turnover
Rate | Net
Assets,
End of
Period
(in thousands) |
| C Class | | | | | | | | | | | |
| 2014 | $15.14 | (0.05) | 4.02 | 3.97 | — | (0.90) | (0.90) | $18.21 | 26.80% | 2.02% | (0.30)% | 102% |
| $24,646 |
|
| 2013 | $12.99 | 0.01 | 2.14 | 2.15 | — | — | — | $15.14 | 16.55% | 2.03% | 0.07% | 94% |
| $9,580 |
|
| 2012 | $12.53 | (0.03) | 0.49 | 0.46 | — | — | — | $12.99 | 3.67% | 2.04% | (0.27)% | 94% |
| $3,389 |
|
| 2011 | $9.11 | (0.07) | 3.49 | 3.42 | — | — | — | $12.53 | 37.54% | 2.04% | (0.63)% | 117% |
| $167 |
|
| 2010 | $7.91 | (0.05) | 1.25 | 1.20 | — | — | — | $9.11 | 15.17% | 2.05% | (0.54)% | 84% |
| $41 |
|
| R Class | | | | | | | | | | |
| 2014 | $15.39 | 0.03 | 4.10 | 4.13 | (0.02) | (0.90) | (0.92) | $18.60 | 27.41% | 1.52% | 0.20% | 102% |
| $6,611 |
|
| 2013 | $13.20 | 0.09 | 2.17 | 2.26 | (0.07) | — | (0.07) | $15.39 | 17.16% | 1.53% | 0.57% | 94% |
| $5,368 |
|
| 2012 | $12.68 | 0.02 | 0.50 | 0.52 | —(3) | — | —(3) | $13.20 | 4.13% | 1.54% | 0.23% | 94% |
| $897 |
|
| 2011 | $9.17 | (0.01) | 3.52 | 3.51 | — | — | — | $12.68 | 38.28% | 1.54% | (0.13)% | 117% |
| $493 |
|
| 2010 | $7.92 | —(3) | 1.25 | 1.25 | —(3) | — | —(3) | $9.17 | 15.82% | 1.55% | (0.04)% | 84% |
| $264 |
|
|
|
| Notes to Financial Highlights |
| |
| (1) | Computed using average shares outstanding throughout the period. |
| |
| (2) | Total returns are calculated based on the net asset value of the last business day and do not reflect applicable sales charges, if any. Total returns for periods less than one year are not annualized. |
| |
| (3) | Per-share amount was less than $0.005. |
See Notes to Financial Statements.
|
|
| Report of Independent Registered Public Accounting Firm |
To the Directors of the American Century Quantitative Equity Funds, Inc. and Shareholders of the Disciplined Growth Fund:
In our opinion, the accompanying statement of assets and liabilities, including the schedule of investments, and the related statements of operations, of changes in net assets and the financial highlights present fairly, in all material respects, the financial position of the Disciplined Growth Fund (one of the fifteen funds comprising the American Century Quantitative Equity Funds, Inc., hereafter referred to as the “Fund”) at June 30, 2014, the results of its operations for the year then ended, the changes in its net assets for each of the two years in the period then ended and the financial highlights for each of the five years in the period then ended, in conformity with accounting principles generally accepted in the United States of America. These financial statements and financial highlights (hereafter referred to as "financial statements") are the responsibility of the Fund's management. Our responsibility is to express an opinion on these financial statements based on our audits. We conducted our audits of these financial statements in accordance with the standards of the Public Company Accounting Oversight Board (United States). Those standards require that we plan and perform the audit to obtain reasonable assurance about whether the financial statements are free of material misstatement. An audit includes examining, on a test basis, evidence supporting the amounts and disclosures in the financial statements, assessing the accounting principles used and significant estimates made by management, and evaluating the overall financial statement presentation. We believe that our audits, which included confirmation of securities at June 30, 2014 by correspondence with the custodian and brokers, provide a reasonable basis for our opinion.
PricewaterhouseCoopers LLP
Kansas City, Missouri
August 21, 2014
Board of Directors
The individuals listed below serve as directors of the funds. Each director will continue to serve in this capacity until death, retirement, resignation or removal from office. The board has adopted a mandatory retirement age for directors who are not “interested persons,” as that term is defined in the Investment Company Act (independent directors). Independent directors shall retire on December 31 of the year in which they reach their 75th birthday; provided, however, that on or after January 1, 2022, independent directors shall retire on December 31 of the year in which they reach their 76th birthday.
Mr. Thomas is an “interested person” because he currently serves as President and Chief Executive Officer of American Century Companies, Inc. (ACC), the parent company of American Century Investment Management, Inc. (ACIM or the advisor). The other directors (more than three-fourths of the total number) are independent. They are not employees, directors or officers of, and have no financial interest in, ACC or any of its wholly owned, direct or indirect, subsidiaries, including ACIM, American Century Investment Services, Inc. (ACIS) and American Century Services, LLC (ACS), and do not have any other affiliations, positions or relationships that would cause them to be considered “interested persons” under the Investment Company Act. The directors serve in this capacity for eight (in the case of Mr. Thomas, 15) registered investment companies in the American Century Investments family of funds.
The following table presents additional information about the directors. The mailing address for each director other than Mr. Thomas is 1665 Charleston Road, Mountain View, California 94043. The mailing address for Mr. Thomas is 4500 Main Street, Kansas City, Missouri 64111.
|
| | | | | |
Name (Year of Birth) | Position(s) Held with Funds | Length of Time Served | Principal Occupation(s) During Past 5 Years | Number of
American
Century
Portfolios
Overseen
by Director | Other Directorships Held During Past 5 Years |
| Independent Directors |
Tanya S. Beder (1955) | Director | Since 2011 | Chairman, SBCC Group Inc. (independent advisory services) (2006 to present) | 42 | CYS Investments, Inc. (specialty finance company) |
Jeremy I. Bulow (1954) | Director | Since 2011 | Professor of Economics, Stanford University, Graduate School of Business (1979 to present) | 42 | None |
Ronald J. Gilson (1946) | Director and Chairman of the Board | Since 1995 (Chairman since 2005) | Charles J. Meyers Professor of Law and Business, Stanford Law School (1979 to present); Marc and Eva Stern Professor of Law and Business, Columbia University School of Law (1992 to present) | 42 | None |
|
| | | | | |
Name (Year of Birth) | Position(s) Held with Funds | Length of Time Served | Principal Occupation(s) During Past 5 Years | Number of
American
Century
Portfolios
Overseen
by Director | Other Directorships Held During Past 5 Years |
| Independent Directors |
Frederick L. A. Grauer (1946) | Director | Since 2008 | Senior Advisor, BlackRock, Inc. (investment management firm) (2010 to 2011); Senior Advisor, Barclays Global Investors (investment management firm) (2003 to 2009) | 42 | None |
Peter F. Pervere
(1947) | Director | Since 2007 | Retired | 42 | Intraware, Inc. (2003 to 2009) |
Myron S. Scholes(1) (1941) | Director | Since 1980 | Chairman, Platinum Grove Asset Management, L.P. (asset manager) (1999 to 2009); Frank E. Buck Professor of Finance-Emeritus, Stanford Graduate School of Business (1996 to present) | 42 | Dimensional Fund Advisors (investment advisor); CME Group, Inc. (futures and options exchange) |
John B. Shoven
(1947) | Director | Since 2002 | Professor of Economics, Stanford University (1973 to present) | 42 | Cadence Design Systems; Exponent; Financial Engines |
| Interested Director |
Jonathan S. Thomas
(1963) | Director and
President | Since 2007 | President and Chief Executive Officer, ACC (March 2007 to present). Also serves as Chief Executive Officer and Manager, ACS; Executive Vice President, ACIM; Director, ACC, ACIM and other ACC subsidiaries | 115 | None |
(1) Myron S. Scholes resigned as director effective July 31, 2014.
Officers
The following table presents certain information about the executive officers of the funds. Each officer serves as an officer for each of the 15 investment companies in the American Century family of funds, unless otherwise noted. No officer is compensated for his or her service as an officer of the funds. The listed officers are interested persons of the funds and are appointed or re-appointed on an annual basis. The mailing address for each of the officers listed below is 4500 Main Street, Kansas City, Missouri 64111.
|
| | |
Name (Year of Birth) | Offices with the Funds | Principal Occupation(s) During the Past Five Years |
Jonathan S. Thomas (1963) | Director and President since 2007 | President and Chief Executive Officer, ACC (March 2007 to present). Also serves as Chief Executive Officer and Manager, ACS; Executive Vice President, ACIM; Director, ACC, ACIM and other ACC subsidiaries |
| Amy D. Shelton (1964) | Chief Compliance Officer since 2014 | Chief Compliance Officer, American Century funds, (March 2014 to present); Chief Compliance Officer, ACIM (February 2014 to present); Chief Compliance Officer, ACIS (October 2009 to present); Vice President, Client Interactions and Marketing, ACIS (February 2013 to January 2014); Director, Client Interactions and Marketing, ACIS (June 2007 to January 2013). Also serves as Vice President, ACIS |
Charles A. Etherington (1957) | General Counsel since 2007 and Senior Vice President since 2006 | Attorney, ACC (February 1994 to present); Vice President, ACC (November 2005 to present); General Counsel, ACC (March 2007 to present). Also serves as General Counsel, ACIM, ACS, ACIS and other ACC subsidiaries; and Senior Vice President, ACIM and ACS |
C. Jean Wade (1964) | Vice President, Treasurer and Chief Financial Officer since 2012 | Vice President, ACS (February 2000 to present) |
Robert J. Leach (1966) | Vice President since 2006 and Assistant Treasurer since 2012 | Vice President, ACS (February 2000 to present) |
David H. Reinmiller (1963) | Vice President since 2001 | Attorney, ACC (January 1994 to present); Associate General Counsel, ACC (January 2001 to present). Also serves as Vice President, ACIM and ACS |
Ward D. Stauffer (1960) | Secretary since 2005 | Attorney, ACC (June 2003 to present) |
The Statement of Additional Information has additional information about the fund’s directors and is available without charge, upon request, by calling 1-800-345-2021.
|
|
| Approval of Management Agreement |
At a meeting held on June 13, 2014, the Fund’s Board of Directors/Trustees unanimously approved the renewal of the management agreement pursuant to which American Century Investment Management, Inc. (the “Advisor”) acts as the investment advisor for the Fund. Under Section 15(c) of the Investment Company Act, contracts for investment advisory services are required to be reviewed, evaluated, and approved by a majority of a fund’s directors/trustees (the “Directors”), including a majority of the independent Directors, each year. The Board regards this annual evaluation and renewal as one of its most important responsibilities.
The independent Directors have memorialized a statement regarding the relationship between their ongoing obligations to oversee and evaluate the performance of the Advisor and their annual consideration of renewal of the management agreement. In that statement, the independent Directors noted that their assessment of the Advisor’s performance is an ongoing process that takes place over the entire year and is informed by all of the extensive information that the Board and its committees receive and consider over time. This information, together with the materials provided in connection with the review, are central to the Board’s assessment of the Advisor’s performance and its determination whether to renew the Fund’s management agreement.
Prior to its consideration of the renewal of the management agreement, the Board requested and reviewed extensive data and analysis relating to the proposed renewal. This information and analysis was compiled by the Advisor and certain independent providers of evaluation data concerning the Fund and the services provided to the Fund by the Advisor.
In connection with its consideration of the renewal of the management agreement, the Board’s review and evaluation of the services provided by the Advisor included, but was not limited to, the following:
| |
| • | the nature, extent, and quality of investment management, shareholder services, and other services provided by the Advisor to the Fund; |
| |
| • | the wide range of other programs and services the Advisor provides to the Fund and its shareholders on a routine and non-routine basis; |
| |
| • | the investment performance of the Fund, including data comparing the Fund’s performance to appropriate benchmarks and/or a peer group of other mutual funds with similar investment objectives and strategies; |
| |
| • | the cost of owning the Fund compared to the cost of owning similar funds; |
| |
| • | the Advisor’s compliance policies, procedures, and regulatory experience; |
| |
| • | financial data showing the cost of services provided to the Fund, the profitability of the Fund to the Advisor, and the overall profitability of the Advisor; |
| |
| • | possible economies of scale associated with the Advisor’s management of the Fund and other accounts under its management; |
| |
| • | data comparing services provided and charges to other investment management clients of the Advisor; and |
| |
| • | any collateral benefits derived by the Advisor from the management of the Fund. |
In keeping with its practice, the Board held two in-person meetings to review and discuss the information provided. The independent Directors also had the benefit of the advice of their independent counsel throughout the process.
Factors Considered
The Directors considered all of the information provided by the Advisor, the independent data providers, and the independent Directors’ independent counsel in connection with the review, and evaluated such information for the Fund. In connection with their review, the Directors did not identify any single factor as being all-important or controlling and each Director may have attributed
different levels of importance to different factors. In deciding to renew the management agreement, the Board based its decision on a number of factors, including the following:
Nature, Extent and Quality of Services — Generally. Under the management agreement, the Advisor is responsible for providing or arranging for all services necessary for the operation of the Fund. The Board noted that under the management agreement, the Advisor provides or arranges at its own expense a wide variety of services including:
| |
| • | constructing and designing the Fund |
| |
| • | portfolio research and security selection |
| |
| • | initial capitalization/funding |
| |
| • | daily valuation of the Fund’s portfolio |
| |
| • | shareholder servicing and transfer agency, including shareholder confirmations, recordkeeping, and communications |
| |
| • | regulatory and portfolio compliance |
| |
| • | marketing and distribution |
The Board noted that many of these services have expanded over time both in terms of quantity and complexity in response to shareholder demands, competition in the industry, changing distribution channels, and the changing regulatory environment.
Investment Management Services. The nature of the investment management services provided to the Fund is quite complex and allows Fund shareholders access to professional money management, instant diversification of their investments within an asset class, the opportunity to easily diversify among asset classes by investing in or exchanging among various American Century Investments funds, and liquidity. In evaluating investment performance, the Board expects the Advisor to manage the Fund in accordance with its investment objectives and approved strategies. Further, the Directors recognize that the Advisor has an obligation to seek the best execution of fund trades. In providing these services, the Advisor utilizes teams of investment professionals (portfolio managers, analysts, research assistants, and securities traders) who require extensive information technology, research, training, compliance and other systems to conduct their business. The Board, directly and through its Portfolio Committee, regularly reviews investment performance information for the Fund, together with comparative information for appropriate benchmarks and/or peer groups of similarly-managed funds, over different time horizons. The Directors also review detailed performance information during the management agreement approval process. If performance concerns are identified, the Fund receives special reviews until performance improves, during which the Board discusses with the Advisor the reasons for such results (e.g., market conditions, security selection) and any efforts being undertaken to improve performance. The Fund’s performance was above its benchmark for the one-, three-, and five-year periods reviewed by the Board. The Board found the investment management services provided by the Advisor to the Fund to be satisfactory and consistent with the management agreement.
Shareholder and Other Services. Under the management agreement, the Advisor provides the Fund with a comprehensive package of transfer agency, shareholder, and other services. The Board, directly and through various committees of the Board, regularly reviews reports and evaluations of such services at its regular meetings. These reports include, but are not limited to, information regarding the operational efficiency and accuracy of the shareholder and transfer agency services provided, staffing levels, shareholder satisfaction (as measured by external as well as internal sources), technology support, new products and services offered to Fund shareholders, securities trading activities, portfolio valuation services, auditing services, and legal and operational compliance activities. Certain aspects of shareholder and transfer agency service level efficiency
and the quality of securities trading activities are measured by independent third party providers and are presented in comparison to other fund groups not managed by the Advisor. The Board found the services provided by the Advisor to the Fund under the management agreement to be competitive and of high quality.
Costs of Services and Profitability. The Advisor provides detailed information concerning its cost of providing various services to the Fund, its profitability in managing the Fund, its overall profitability, and its financial condition. The Directors have reviewed with the Advisor the methodology used to prepare this financial information. The financial information regarding the Advisor is considered in evaluating the Advisor’s financial condition, its ability to continue to provide services under the management agreement, and the reasonableness of the current management fee. The Board concluded that the Advisor’s profits were reasonable in light of the services provided to the Fund.
Ethics. The Board generally considers the Advisor’s commitment to providing quality services to shareholders and to conducting its business ethically. They noted that the Advisor’s practices generally meet or exceed industry best practices.
Economies of Scale. The Board also reviewed information provided by the Advisor regarding the possible existence of economies of scale in connection with the management of the Fund. The Board concluded that economies of scale are difficult to measure and predict with precision, especially on a fund-by-fund basis. The Board concluded that the Advisor is appropriately sharing economies of scale through its competitive fee structure, offering competitive fees from fund inception, and through reinvestment in its business to provide shareholders additional content and services.
Comparison to Other Funds’ Fees. The management agreement provides that the Fund pays the Advisor a single, all-inclusive (or unified) management fee for providing all services necessary for the management and operation of the Fund, other than brokerage expenses, taxes, interest, extraordinary expenses, and the fees and expenses of the Fund’s independent directors (including their independent legal counsel) and expenses incurred in connection with the provision of shareholder services and distribution services under a plan adopted pursuant to Rule 12b-1 under the 1940 Act. Under the unified fee structure, the Advisor is responsible for providing all investment advisory, custody, audit, administrative, compliance, recordkeeping, marketing and shareholder services, or arranging and supervising third parties to provide such services. By contrast, most other funds are charged a variety of fees, including an investment advisory fee, a transfer agency fee, an administrative fee, distribution charges and other expenses. Other than their investment advisory fees and any applicable Rule 12b-1 distribution fees, all other components of the total fees charged by these other funds may be increased without shareholder approval. The Board believes the unified fee structure is a benefit to Fund shareholders because it clearly discloses to shareholders the cost of owning Fund shares, and, since the unified fee cannot be increased without a vote of Fund shareholders, it shifts to the Advisor the risk of increased costs of operating the Fund and provides a direct incentive to minimize administrative inefficiencies. Part of the Board’s analysis of fee levels involves reviewing certain evaluative data compiled by an independent provider and comparing the Fund’s unified fee to the total expense ratio of other funds in the Fund’s peer group. The unified fee charged to shareholders of the Fund was below the median of the total expense ratios of the Fund’s peer universe. The Board concluded that the management fee paid by the Fund to the Advisor under the management agreement is reasonable in light of the services provided to the Fund.
Comparison to Fees and Services Provided to Other Clients of the Advisor. The Board also requested and received information from the Advisor concerning the nature of the services, fees, costs and profitability of its advisory services to advisory clients other than the Fund. They observed that these varying types of client accounts require different services and involve different regulatory and entrepreneurial risks than the management of the Fund. The Board analyzed this information and concluded that the fees charged and services provided to the Fund were reasonable by comparison.
Collateral or “Fall-Out” Benefits Derived by the Advisor. The Board considered the existence of collateral benefits the Advisor may receive as a result of its relationship with the Fund. They concluded that the Advisor’s primary business is managing mutual funds and it generally does not use fund or shareholder information to generate profits in other lines of business, and therefore does not derive any significant collateral benefits from them. The Board noted that the Advisor receives proprietary research from broker-dealers that execute fund portfolio transactions and concluded that this research is likely to benefit Fund shareholders. The Board also determined that the Advisor is able to provide investment management services to certain clients other than the Fund, at least in part, due to its existing infrastructure built to serve the fund complex. The Board concluded, however, that the assets of those other clients are not material to the analysis and, where applicable, may be included with the assets of the Fund to determine breakpoints in the management fee schedule.
Existing Relationship. The Board also considered whether there was any reason for not continuing the existing arrangement with the Advisor. In this regard, the Board was mindful of the potential disruptions of the Fund’s operations and various risks, uncertainties, and other effects that could occur as a result of a decision not to continue such relationship. In particular, the Board recognized that most shareholders have invested in the Fund on the strength of the Advisor’s industry standing and reputation and in the expectation that the Advisor will have a continuing role in providing advisory services to the Fund.
Conclusion of the Directors. As a result of this process, the Board, including all of the independent Directors and assisted by the advice of independent legal counsel, taking into account all of the factors discussed above and the information provided by the Advisor and others, concluded that the management agreement between the Fund and the Advisor is fair and reasonable in light of the services provided and should be renewed.
Retirement Account Information
As required by law, distributions you receive from certain IRAs are subject to federal income tax withholding, unless you elect not to have withholding apply. Tax will be withheld on the total amount withdrawn even though you may be receiving amounts that are not subject to withholding, such as nondeductible contributions. In such case, excess amounts of withholding could occur. You may adjust your withholding election so that a greater or lesser amount will be withheld.
If you don’t want us to withhold on this amount, you must notify us to not withhold the federal income tax. You may notify us in writing or in certain situations by telephone or through other electronic means. For systematic withdrawals, your withholding election will remain in effect until revoked or changed by filing a new election. You have the right to revoke your election at any time.
Remember, even if you elect not to have income tax withheld, you are liable for paying income tax on the taxable portion of your withdrawal. If you elect not to have income tax withheld or you don’t have enough income tax withheld, you may be responsible for payment of estimated tax. You may incur penalties under the estimated tax rules if your withholding and estimated tax payments are not sufficient. You can reduce or defer the income tax on a distribution by directly or indirectly rolling such distribution over to another IRA or eligible plan. You should consult your tax advisor for additional information.
State tax will be withheld if, at the time of your distribution, your address is within one of the mandatory withholding states and you have federal income tax withheld (or as otherwise required by state law). State taxes will be withheld from your distribution in accordance with the respective state rules.
Distributions you receive from 403(b), 457 and qualified plans are subject to special tax and withholding rules. Your plan administrator or plan sponsor is required to provide you with a special tax notice explaining those rules at the time you request a distribution. If applicable, federal and/or state taxes may be withheld from your distribution amount.
Proxy Voting Policies
Descriptions of the principles and policies that the fund's investment advisor uses in exercising the voting rights associated with the securities purchased and/or held by the fund are available without charge, upon request, by calling 1-800-345-2021 or visiting the "About Us" page of American Century Investments’ website at americancentury.com. A description of the policies is also available on the Securities and Exchange Commission’s website at sec.gov. Information regarding how the investment advisor voted proxies relating to portfolio securities during the most recent 12-month period ended June 30 is available on the "About Us" page at americancentury.com. It is also available at sec.gov.
Quarterly Portfolio Disclosure
The fund files its complete schedule of portfolio holdings with the Securities and Exchange Commission (SEC) for the first and third quarters of each fiscal year on Form N-Q. The fund’s Forms N-Q are available on the SEC’s website at sec.gov, and may be reviewed and copied at the SEC’s Public Reference Room in Washington, DC. Information on the operation of the Public Reference Room may be obtained by calling 1-800-SEC-0330. The fund also makes its complete schedule of portfolio holdings for the most recent quarter of its fiscal year available on its website at americancentury.com and, upon request, by calling 1-800-345-2021.
Other Tax Information
The following information is provided pursuant to provisions of the Internal Revenue Code.
The fund hereby designates up to the maximum amount allowable as qualified dividend income for the fiscal year ended June 30, 2014.
For corporate taxpayers, the fund hereby designates $5,825,793, or up to the maximum amount allowable, of ordinary income distributions paid during the fiscal year ended June 30, 2014 as qualified for the corporate dividends received deduction.
The fund hereby designates $7,571,747 as qualified short-term capital gain distributions for purposes of Internal Revenue Code Section 871.
The fund hereby designates $5,751,460, or up to the maximum amount allowable, as long-term capital gain distributions for the fiscal year ended June 30, 2014.
|
| | |
| |
| | | |
| Contact Us | americancentury.com | |
| Automated Information Line | 1-800-345-8765 | |
| Investor Services Representative | 1-800-345-2021
or 816-531-5575 | |
| Investors Using Advisors | 1-800-378-9878 | |
Business, Not-For-Profit, Employer-Sponsored
Retirement Plans | 1-800-345-3533 | |
Banks and Trust Companies, Broker-Dealers,
Financial Professionals, Insurance Companies | 1-800-345-6488 | |
| Telecommunications Relay Service for the Deaf | 711 | |
| | | |
| American Century Quantitative Equity Funds, Inc. | |
| | | |
Investment Advisor: American Century Investment Management, Inc. Kansas City, Missouri | |
| | | |
| This report and the statements it contains are submitted for the general information of our shareholders. The report is not authorized for distribution to prospective investors unless preceded or accompanied by an effective prospectus. | |
| | | |
©2014 American Century Proprietary Holdings, Inc. All rights reserved.
CL-ANN-82885 1408 | |
|
| |
ANNUAL REPORT | JUNE 30, 2014 |
Disciplined Growth Plus Fund
|
| |
| President's Letter | |
| Performance | |
| Portfolio Commentary | |
| Fund Characteristics | |
| Shareholder Fee Example | |
| Schedule of Investments | |
| Statement of Assets and Liabilities | |
| Statement of Operations | |
| Statement of Changes in Net Assets | |
| Statement of Cash Flows | |
| Notes to Financial Statements | |
| Financial Highlights | |
| Report of Independent Registered Public Accounting Firm | |
| Management | |
| Approval of Management Agreement | |
| Additional Information | |
Any opinions expressed in this report reflect those of the author as of the date of the report, and do not necessarily represent the opinions of American Century Investments® or any other person in the American Century Investments organization. Any such opinions are subject to change at any time based upon market or other conditions and American Century Investments disclaims any responsibility to update such opinions. These opinions may not be relied upon as investment advice and, because investment decisions made by American Century Investments funds are based on numerous factors, may not be relied upon as an indication of trading intent on behalf of any American Century Investments fund. Security examples are used for representational purposes only and are not intended as recommendations to purchase or sell securities. Performance information for comparative indices and securities is provided to American Century Investments by third party vendors. To the best of American Century Investments’ knowledge, such information is accurate at the time of printing.
|
| |
| Dear Investor:
Thank you for reviewing this annual report for the 12 months ended June 30, 2014. It provides investment performance and portfolio information for the reporting period, plus longer-term historical performance data.
Annual reports remain important vehicles for conveying information about fund returns, including market and economic factors that affected performance during the reporting period. For additional, updated investment and market insights, we encourage you to visit our website, americancentury.com.
|
| Jonathan Thomas |
Aggressive Monetary Policies Boosted Stock and Bond Returns
Stimulative monetary policies and expectations of economic improvement, interspersed with concerns about weaker-than-expected economic data and geopolitical conflicts, helped drive financial market returns during the reporting period. We believe the combination of longer-term optimism about global economic growth, low costs of capital, and central bank purchases of fixed income securities helped persuade investors to seek risk and yield, especially in the U.S. and Europe. Stock index returns were strong in these markets, particularly at the smaller capitalization end of the company size spectrum. The MSCI Europe and S&P 500® indices advanced 29.28% and 24.61%, respectively.
Remarkably, for a period in which stock market performance was so strong, government bond performance was also generally positive. Not surprisingly, U.S. corporate high-yield bonds posted double-digit returns, but the 30-year U.S. Treasury bond also outperformed most broader bond market measures. In addition, a generally weaker U.S. dollar during the reporting period meant that international bond returns for U.S. investors with currency exposure were generally higher than U.S. bonds returns. The Barclays Global Aggregate Bond and Barclays U.S. Aggregate Bond indices returned 7.39% and 4.37%, respectively.
Looking ahead, we see signs of sustained moderate economic growth in the second half of 2014, but headwinds persist. In the U.S., which was supposed to be an economic growth leader this year, housing market momentum has slowed, interest rates could rise, and economic growth and U.S. employment levels remain subpar compared with past post-recession periods. In this environment, we continue to believe in a disciplined, diversified, long-term investment approach, using professionally managed stock and bond portfolios—as appropriate—for meeting financial goals. We appreciate your continued trust in us.
Sincerely,
Jonathan Thomas
President and Chief Executive Officer
American Century Investments
|
| | | | |
| Total Returns as of June 30, 2014 |
| | Average Annual Returns | |
| | Ticker Symbol | 1 year | Since Inception | Inception Date |
| Investor Class | ACDJX | 30.29%(1) | 20.93% | 10/31/11 |
| Russell 1000 Growth Index | — | 26.92% | 20.12% | — |
| Institutional Class | ACDKX | 30.52%(1) | 21.15% | 10/31/11 |
| A Class | ACDQX | | | 10/31/11 |
| No sales charge* | | 29.99% | 20.62% | |
| With sales charge* | | 22.52% | 17.97% | |
| C Class | ACDHX | 28.94% | 19.72% | 10/31/11 |
| R Class | ACDWX | 29.61% | 20.32% | 10/31/11 |
| |
| * | Sales charges include initial sales charges and contingent deferred sales charges (CDSCs), as applicable. A Class shares have a 5.75% maximum initial sales charge and may be subject to a maximum CDSC of 1.00%. C Class shares redeemed within 12 months of purchase are subject to a maximum CDSC of 1.00%. The SEC requires that mutual funds provide performance information net of maximum sales charges in all cases where charges could be applied. |
| |
| (1) | Extraordinary performance is attributable in part to unusually favorable market conditions and may not be repeated or consistently achieved in the future. |
Data presented reflect past performance. Past performance is no guarantee of future results. Current performance may be higher or lower than the performance shown. Investment return and principal value will fluctuate, and redemption value may be more or less than original cost. To obtain performance data current to the most recent month end, please call 1-800-345-2021 or visit americancentury.com. The fund’s investment approach may involve higher price volatility, short sales risk, leverage risk and overweighting risk.
Unless otherwise indicated, performance reflects Investor Class shares; performance for other share classes will vary due to differences in fee structure. For information about other share classes available, please consult the prospectus. Data assumes reinvestment of dividends and capital gains, and none of the charts reflect the deduction of taxes that a shareholder would pay on fund distributions or the redemption of fund shares. Returns for the index are provided for comparison. The fund’s total returns include operating expenses (such as transaction costs and management fees) that reduce returns, while the total returns of the index do not.
|
|
| Growth of $10,000 Over Life of Class |
| $10,000 investment made October 31, 2011 |
|
| |
| Value on June 30, 2014 |
| | Investor Class — $16,596 |
| |
| | Russell 1000 Growth Index — $16,301 |
| |
*From October 31, 2011, the Investor Class’s inception date. Not annualized.
|
| | | | |
| Total Annual Fund Operating Expenses |
| Investor Class | Institutional Class | A Class | C Class | R Class |
| 1.87% | 1.67% | 2.12% | 2.87% | 2.37% |
The total annual fund operating expenses shown is as stated in the fund’s prospectus current as of the date of this report. The prospectus may vary from the expense ratio shown elsewhere in this report because it is based on a different time period, includes acquired fund fees and expenses, and, if applicable, does not include fee waivers or expense reimbursements.
Data presented reflect past performance. Past performance is no guarantee of future results. Current performance may be higher or lower than the performance shown. Investment return and principal value will fluctuate, and redemption value may be more or less than original cost. To obtain performance data current to the most recent month end, please call 1-800-345-2021 or visit americancentury.com. The fund’s investment approach may involve higher price volatility, short sales risk, leverage risk and overweighting risk.
Unless otherwise indicated, performance reflects Investor Class shares; performance for other share classes will vary due to differences in fee structure. For information about other share classes available, please consult the prospectus. Data assumes reinvestment of dividends and capital gains, and none of the charts reflect the deduction of taxes that a shareholder would pay on fund distributions or the redemption of fund shares. Returns for the index are provided for comparison. The fund’s total returns include operating expenses (such as transaction costs and management fees) that reduce returns, while the total returns of the index do not.
Portfolio Managers: Scott Wittman, Bill Martin and Lynette Pang
Performance Summary
Disciplined Growth Plus returned 30.29%* for the fiscal year ended June 30, 2014, compared with the 26.92% return of its benchmark, the Russell 1000 Growth Index and the 24.61%** return of the broad S&P 500 Index.
As U.S. equity markets continued their robust appreciation, Disciplined Growth Plus posted a solid gain for the 12-month period, strongly outperforming the Russell 1000 Growth Index. The fund is managed to have a 100% net exposure to the equity market by investing approximately 130% of its net assets in long positions, while 30% of its net assets are sold short. The proceeds from the securities sold short are used to fund the purchase of the additional 30% of long positions. The fund’s stock selection process incorporates factors of valuation, quality, growth, and momentum (sentiment) while striving to minimize unintended risks along industries and other risk characteristics. Security selection in the consumer staples and industrials sectors contributed the most to fund results, while information technology and consumer discretionary holdings weighed on relative performance.
Consumer Staples and Industrials Outperformed
The consumer staples and industrials sectors were among the leading contributors to the fund’s returns relative to the Russell 1000 Growth Index. Stock choices in the consumer staples sector, particularly among food products manufacturers and food and staples retailers, were especially effective, driving the sector's substantial outperformance relative to the index. Among the top sector contributors was an overweight position in chain drug store Rite Aid, which rose on revenue growth and efficiency and distribution chain improvements, bolstering the sector’s return. Significant contribution also came from supermarket chain store operator Safeway, which advanced on speculation of being acquired by private equity firm Cerberus Capital Management, owner of the Albertson’s chain of grocery stores. Following its appreciation, we took profits in Safeway and exited the position. Specialty coffee company Keurig Green Mountain gained on news of a partnership with Coca-Cola to sell branded single-serve beverage pods. Several chicken processors helped boost the fund’s performance including Pilgrim’s Pride, which rallied following management’s decision to bow out of the race with Tyson Foods to acquire Hillshire Brands.
Successful stock selection across a number of industries in the industrials sector contributed to outperformance. Leading sector outperformers included TASER International, a manufacturer of electroshock guns and wearable cameras, which benefited from growing sales to law-enforcement agencies. Following solid appreciation we sold the holding to lock in gains. Several short positions—which are designed to profit when a stock’s price declines—among commercial services and supplies holdings, enhanced the fund’s results. These included print management solutions provider InnerWorkings and carpet manufacturer Interface, both of which produced declines during the year.
Meaningful contribution also came from a short position in insurance provider Tower Group International, which declined following complications with filing its second-quarter financial results. The position was ultimately eliminated. Apparel manufacturer Hanesbrands’ earnings growth and announced intent to purchase French clothing manufacturer DBApparel, thereby increasing exposure in Europe, helped to drive its stock price higher. The fund's long position in the company helped to bolster results.
* All fund returns referenced in this commentary are for Investor Class shares. Performance for other share
classes will vary due to differences in fee structure; when Investor Class performance exceeds that of the
fund's benchmark, other share classes may not. See page 3 for returns for all share classes.
**The S&P 500 Index average return was 20.90% since the fund’s inception on October 31, 2011.
Information Technology and Consumer Discretionary Among Leading Detractors
Stock selection among the fund’s information technology holdings was the principal detractor from the fund’s 12-month results. Prominent underperformers were found in the internet software and services and information technology services industries. These included payment service provider MoneyGram International, which fell following Wal-Mart’s announced intent to enter the domestic wire-transfer space. Real-time data provider NeuStar declined on earnings guidance revisions below analyst estimates, negatively impacting the portfolio. Both holdings remain attractive across a number of metrics. An underweight position to social networking site Facebook, whose stock reached all-time highs, was detrimental. Despite this appreciation, the holding’s valuation insights continue to show weakness. A short position in solar power semiconductor manufacturer SunEdison, which benefited from several analyst upgrades based on a continued rise in solar power demand, also hurt results. We believe that the short position is justified given the company’s unappealing profile across valuation, quality, and growth measures.
Security selection in the consumer discretionary sector was likewise unfavorable to results. A number of specialty and internet retailers, in which the fund held long positions, declined during the period, weighing on the fund’s returns. These included casino game equipment maker International Game Technology, which fell on disappointing earnings stemming from declining slot machine sales. We ultimately exited our position in the holding. ReachLocal, an online marketing solutions vendor, also fell following lower-than-expected future revenue guidance, but the firm’s valuation and quality insights position it as an attractive holding.
Elsewhere in the fund, a short position in specialty pharmaceutical manufacturer Depomed, which reported strong results thanks to recent product rights acquisitions, diminished returns. Likewise, a long position in personal care products manufacturer Avon, which declined on shrinking sales volumes in North America and emerging markets countries, was another leading individual detractor.
A Look Ahead
Economic recovery in the U.S. appears to be progressing, albeit at a slower pace than during prior post-recessionary periods, and is expected to stay the course through the remainder of 2014. Recent indicators such as improvements in small business and consumer confidence point to a sustainable rebound, and economic growth is likely to further benefit from the recovering labor and housing markets. Though a continuation of political instability in non-U.S. markets as well as the potential for rising inflation and interest rates could lead to heightened market volatility, our disciplined, objective, and systematic investment strategy is designed to take advantage of opportunities at the individual company level in both the long and short portions of the portfolio. We believe this approach is the most powerful way to capitalize on market inefficiencies that lead to the mispricing of individual stocks. The portfolio’s current holdings exhibit the highest exposure to valuation and quality insights, followed closely by growth, and we maintain positive exposure to momentum (sentiment). The fund's largest overweights are in health care and industrials, while the underweights are led by the financials and consumer discretionary sectors.
|
| |
| JUNE 30, 2014 |
| Top Ten Long Holdings | % of net assets |
| Apple, Inc. | 4.45% |
| Microsoft Corp. | 3.78% |
| Verizon Communications, Inc. | 2.59% |
Google, Inc.(1) | 2.23% |
| Oracle Corp. | 2.05% |
| QUALCOMM, Inc. | 1.99% |
| AbbVie, Inc. | 1.62% |
| Boeing Co. (The) | 1.61% |
| Schlumberger Ltd. | 1.57% |
| United Parcel Service, Inc., Class B | 1.40% |
| (1) Includes all classes of the issuer. | |
| | |
| Top Five Short Holdings | % of net assets |
| LSB Industries, Inc. | (0.86)% |
| SunEdison, Inc. | (0.80)% |
| Rentech, Inc. | (0.78)% |
| William Lyon Homes, Class A | (0.76)% |
| Planet Payment, Inc. | (0.74)% |
| | |
| Types of Investments in Portfolio | % of net assets |
| Common Stocks | 127.4% |
| Common Stocks Sold Short | (30.2)% |
| Temporary Cash Investments | 1.5% |
| Other Assets and Liabilities | 1.3% |
Fund shareholders may incur two types of costs: (1) transaction costs, including sales charges (loads) on purchase payments and redemption/exchange fees; and (2) ongoing costs, including management fees; distribution and service (12b-1) fees; and other fund expenses. This example is intended to help you understand your ongoing costs (in dollars) of investing in your fund and to compare these costs with the ongoing cost of investing in other mutual funds.
The example is based on an investment of $1,000 made at the beginning of the period and held for the entire period from January 1, 2014 to June 30, 2014.
Actual Expenses
The table provides information about actual account values and actual expenses for each class. You may use the information, together with the amount you invested, to estimate the expenses that you paid over the period. First, identify the share class you own. Then simply divide your account value by $1,000 (for example, an $8,600 account value divided by $1,000 = 8.6), then multiply the result by the number under the heading “Expenses Paid During Period” to estimate the expenses you paid on your account during this period.
If you hold Investor Class shares of any American Century Investments fund, or Institutional Class shares of the American Century Diversified Bond Fund, in an American Century Investments account (i.e., not a financial intermediary or retirement plan account), American Century Investments may charge you a $12.50 semiannual account maintenance fee if the value of those shares is less than $10,000. We will redeem shares automatically in one of your accounts to pay the $12.50 fee. In determining your total eligible investment amount, we will include your investments in all personal accounts (including American Century Investments Brokerage accounts) registered under your Social Security number. Personal accounts include individual accounts, joint accounts, UGMA/UTMA accounts, personal trusts, Coverdell Education Savings Accounts and IRAs (including traditional, Roth, Rollover, SEP-, SARSEP- and SIMPLE-IRAs), and certain other retirement accounts. If you have only business, business retirement, employer-sponsored or American Century Investments Brokerage accounts, you are currently not subject to this fee. If you are subject to the Account Maintenance Fee, your account value could be reduced by the fee amount.
Hypothetical Example for Comparison Purposes
The table also provides information about hypothetical account values and hypothetical expenses based on the actual expense ratio of each class of your fund and an assumed rate of return of 5% per year before expenses, which is not the actual return of a fund’s share class. The hypothetical account values and expenses may not be used to estimate the actual ending account balance or expenses you paid for the period. You may use this information to compare the ongoing costs of investing in your fund and other funds. To do so, compare this 5% hypothetical example with the 5% hypothetical examples that appear in the shareholder reports of the other funds.
Please note that the expenses shown in the table are meant to highlight your ongoing costs only and do not reflect any transactional costs, such as sales charges (loads) or redemption/exchange fees. Therefore, the table is useful in comparing ongoing costs only, and will not help you determine the relative total costs of owning different funds. In addition, if these transactional costs were included, your costs would have been higher.
|
| | | | |
| | Beginning Account Value 1/1/14 | Ending Account Value 6/30/14 | Expenses Paid During Period(1) 1/1/14 – 6/30/14 | Annualized Expense Ratio(1) |
| Actual |
| Investor Class | $1,000 | $1,075.90 | $9.37 | 1.82% |
| Institutional Class | $1,000 | $1,076.60 | $8.34 | 1.62% |
| A Class | $1,000 | $1,074.70 | $10.65 | 2.07% |
| C Class | $1,000 | $1,070.20 | $14.47 | 2.82% |
| R Class | $1,000 | $1,073.50 | $11.93 | 2.32% |
| Hypothetical |
| Investor Class | $1,000 | $1,015.77 | $9.10 | 1.82% |
| Institutional Class | $1,000 | $1,016.76 | $8.10 | 1.62% |
| A Class | $1,000 | $1,014.53 | $10.34 | 2.07% |
| C Class | $1,000 | $1,010.81 | $14.06 | 2.82% |
| R Class | $1,000 | $1,013.29 | $11.58 | 2.32% |
| |
| (1) | Expenses are equal to the class’s annualized expense ratio listed in the table above, multiplied by the average account value over the period, multiplied by 181, the number of days in the most recent fiscal half-year, divided by 365, to reflect the one-half year period. |
JUNE 30, 2014
|
| | | | | |
| | Shares | Value |
| COMMON STOCKS — 127.4% | | |
| AEROSPACE AND DEFENSE — 4.7% | | |
Boeing Co. (The)(1) | 2,297 |
| $ | 292,247 |
|
Honeywell International, Inc.(1) | 2,670 |
| 248,176 |
|
Lockheed Martin Corp.(1) | 1,235 |
| 198,502 |
|
Moog, Inc., Class A(2) | 1,077 |
| 78,503 |
|
United Technologies Corp.(1) | 303 |
| 34,981 |
|
| | | 852,409 |
|
| AIR FREIGHT AND LOGISTICS — 1.4% | | |
United Parcel Service, Inc., Class B(1) | 2,470 |
| 253,570 |
|
| AIRLINES — 1.2% | | |
Delta Air Lines, Inc.(1) | 1,736 |
| 67,218 |
|
Southwest Airlines Co.(1) | 5,869 |
| 157,641 |
|
| | | 224,859 |
|
| AUTO COMPONENTS — 2.4% | | |
Delphi Automotive plc(1) | 2,393 |
| 164,495 |
|
Gentex Corp.(1) | 3,487 |
| 101,437 |
|
Tenneco, Inc.(2) | 142 |
| 9,329 |
|
Tower International, Inc.(1)(2) | 4,429 |
| 163,164 |
|
| | | 438,425 |
|
| AUTOMOBILES — 0.2% | | |
| Harley-Davidson, Inc. | 440 |
| 30,734 |
|
| BEVERAGES — 1.8% | | |
Coca-Cola Co. (The)(1) | 2,851 |
| 120,768 |
|
| Dr Pepper Snapple Group, Inc. | 2,144 |
| 125,596 |
|
PepsiCo, Inc.(1) | 977 |
| 87,285 |
|
| | | 333,649 |
|
| BIOTECHNOLOGY — 5.3% | | |
Alexion Pharmaceuticals, Inc.(2) | 315 |
| 49,219 |
|
Amgen, Inc.(1) | 1,502 |
| 177,792 |
|
Arena Pharmaceuticals, Inc.(2) | 7,366 |
| 43,165 |
|
Biogen Idec, Inc.(1)(2) | 545 |
| 171,844 |
|
Celgene Corp.(1)(2) | 1,496 |
| 128,477 |
|
Cytokinetics, Inc.(2) | 3,218 |
| 15,382 |
|
Emergent Biosolutions, Inc.(1)(2) | 1,451 |
| 32,589 |
|
Gilead Sciences, Inc.(1)(2) | 2,109 |
| 174,857 |
|
Ligand Pharmaceuticals, Inc., Class B(2) | 463 |
| 28,840 |
|
Myriad Genetics, Inc.(1)(2) | 1,144 |
| 44,524 |
|
Regeneron Pharmaceuticals, Inc.(2) | 31 |
| 8,757 |
|
SIGA Technologies, Inc.(2) | 5,935 |
| 16,737 |
|
Threshold Pharmaceuticals, Inc.(1)(2) | 7,263 |
| 28,761 |
|
United Therapeutics Corp.(1)(2) | 500 |
| 44,245 |
|
| | | 965,189 |
|
| | | |
|
| | | | | |
| | Shares | Value |
| CAPITAL MARKETS — 2.3% | | |
Affiliated Managers Group, Inc.(2) | 344 |
| $ | 70,657 |
|
| Financial Engines, Inc. | 703 |
| 31,832 |
|
Franklin Resources, Inc.(1) | 3,014 |
| 174,330 |
|
INTL FCStone, Inc.(2) | 4,695 |
| 93,524 |
|
SEI Investments Co.(1) | 462 |
| 15,140 |
|
| Waddell & Reed Financial, Inc., Class A | 651 |
| 40,746 |
|
| | | 426,229 |
|
| CHEMICALS — 5.8% | | |
Chase Corp.(1) | 3,915 |
| 133,658 |
|
Dow Chemical Co. (The)(1) | 3,082 |
| 158,600 |
|
Eastman Chemical Co.(1) | 1,779 |
| 155,396 |
|
| FutureFuel Corp. | 1,930 |
| 32,019 |
|
LyondellBasell Industries NV, Class A(1) | 242 |
| 23,631 |
|
| NewMarket Corp. | 148 |
| 58,032 |
|
Penford Corp.(2) | 1,555 |
| 19,951 |
|
PPG Industries, Inc.(1) | 854 |
| 179,468 |
|
| Quaker Chemical Corp. | 608 |
| 46,688 |
|
Scotts Miracle-Gro Co. (The), Class A(1) | 2,192 |
| 124,637 |
|
Sigma-Aldrich Corp.(1) | 1,253 |
| 127,154 |
|
| | | 1,059,234 |
|
| COMMERCIAL SERVICES AND SUPPLIES — 1.1% | | |
Deluxe Corp.(1) | 961 |
| 56,295 |
|
Performant Financial Corp.(1)(2) | 6,198 |
| 62,600 |
|
RR Donnelley & Sons Co.(1) | 3,462 |
| 58,716 |
|
Steelcase, Inc., Class A(1) | 1,676 |
| 25,358 |
|
| | | 202,969 |
|
| COMMUNICATIONS EQUIPMENT — 3.3% | | |
ARRIS Group, Inc.(1)(2) | 491 |
| 15,972 |
|
Calix, Inc.(2) | 3,336 |
| 27,288 |
|
Ciena Corp.(1)(2) | 5,365 |
| 116,206 |
|
Harris Corp.(1) | 309 |
| 23,407 |
|
Juniper Networks, Inc.(2) | 2,306 |
| 56,589 |
|
QUALCOMM, Inc.(1) | 4,568 |
| 361,786 |
|
| | | 601,248 |
|
| CONSTRUCTION AND ENGINEERING — 0.3% | | |
AECOM Technology Corp.(1)(2) | 1,843 |
| 59,345 |
|
| CONSUMER FINANCE — 0.4% | | |
American Express Co.(1) | 182 |
| 17,266 |
|
World Acceptance Corp.(2) | 730 |
| 55,451 |
|
| | | 72,717 |
|
| CONTAINERS AND PACKAGING — 1.2% | | |
| Avery Dennison Corp. | 1,342 |
| 68,778 |
|
| Ball Corp. | 1,358 |
| 85,119 |
|
Packaging Corp. of America(1) | 791 |
| 56,549 |
|
| | | 210,446 |
|
|
| | | | | |
| | Shares | Value |
| DISTRIBUTORS — 0.5% | | |
| Core-Mark Holding Co., Inc. | 1,024 |
| $ | 46,725 |
|
| Weyco Group, Inc. | 1,645 |
| 45,090 |
|
| | | 91,815 |
|
| DIVERSIFIED CONSUMER SERVICES — 0.9% | | |
Capella Education Co.(1) | 1,851 |
| 100,676 |
|
K12, Inc.(1)(2) | 2,016 |
| 48,525 |
|
Strayer Education, Inc.(2) | 408 |
| 21,424 |
|
| | | 170,625 |
|
| DIVERSIFIED FINANCIAL SERVICES — 1.4% | | |
Moody's Corp.(1) | 1,614 |
| 141,483 |
|
MSCI, Inc., Class A(1)(2) | 2,494 |
| 114,350 |
|
| | | 255,833 |
|
| DIVERSIFIED TELECOMMUNICATION SERVICES — 2.9% | | |
Inteliquent, Inc.(1) | 3,661 |
| 50,778 |
|
Verizon Communications, Inc.(1) | 9,613 |
| 470,364 |
|
| | | 521,142 |
|
| ELECTRICAL EQUIPMENT — 2.2% | | |
Emerson Electric Co.(1) | 2,693 |
| 178,707 |
|
Rockwell Automation, Inc.(1) | 1,243 |
| 155,574 |
|
Thermon Group Holdings, Inc.(2) | 2,411 |
| 63,458 |
|
| | | 397,739 |
|
| ELECTRONIC EQUIPMENT, INSTRUMENTS AND COMPONENTS — 0.2% | | |
Coherent, Inc.(2) | 250 |
| 16,543 |
|
Zebra Technologies Corp., Class A(2) | 272 |
| 22,391 |
|
| | | 38,934 |
|
| ENERGY EQUIPMENT AND SERVICES — 3.5% | | |
Baker Hughes, Inc.(1) | 2,105 |
| 156,717 |
|
ION Geophysical Corp.(2) | 9,614 |
| 40,571 |
|
Newpark Resources, Inc.(2) | 851 |
| 10,604 |
|
RPC, Inc.(1) | 6,166 |
| 144,839 |
|
Schlumberger Ltd.(1) | 2,412 |
| 284,495 |
|
| | | 637,226 |
|
| FOOD AND STAPLES RETAILING — 2.2% | | |
Rite Aid Corp.(1)(2) | 19,299 |
| 138,374 |
|
Wal-Mart Stores, Inc.(1) | 160 |
| 12,011 |
|
Walgreen Co.(1) | 3,250 |
| 240,923 |
|
| | | 391,308 |
|
| FOOD PRODUCTS — 3.8% | | |
Archer-Daniels-Midland Co.(1) | 3,037 |
| 133,962 |
|
Kellogg Co.(1) | 2,409 |
| 158,271 |
|
Keurig Green Mountain, Inc.(1) | 956 |
| 119,127 |
|
Pilgrim's Pride Corp.(1)(2) | 4,140 |
| 113,270 |
|
Sanderson Farms, Inc.(1) | 1,662 |
| 161,547 |
|
| | | 686,177 |
|
|
| | | | | |
| | Shares | Value |
| HEALTH CARE EQUIPMENT AND SUPPLIES — 4.9% | | |
Align Technology, Inc.(2) | 359 |
| $ | 20,118 |
|
Analogic Corp.(1) | 1,353 |
| 105,859 |
|
Becton Dickinson and Co.(1) | 1,234 |
| 145,982 |
|
| C.R. Bard, Inc. | 339 |
| 48,480 |
|
DexCom, Inc.(2) | 637 |
| 25,264 |
|
Medical Action Industries, Inc.(1)(2) | 9,627 |
| 132,179 |
|
St. Jude Medical, Inc.(1) | 2,137 |
| 147,987 |
|
Stryker Corp.(1) | 1,757 |
| 148,150 |
|
Thoratec Corp.(1)(2) | 2,087 |
| 72,753 |
|
Zimmer Holdings, Inc.(1) | 340 |
| 35,312 |
|
| | | 882,084 |
|
| HEALTH CARE PROVIDERS AND SERVICES — 1.2% | | |
Express Scripts Holding Co.(1)(2) | 2,896 |
| 200,780 |
|
Mednax, Inc.(2) | 207 |
| 12,037 |
|
| | | 212,817 |
|
| HEALTH CARE TECHNOLOGY — 1.1% | | |
MedAssets, Inc.(2) | 1,231 |
| 28,116 |
|
Merge Healthcare, Inc.(1)(2) | 37,931 |
| 86,104 |
|
Omnicell, Inc.(1)(2) | 2,858 |
| 82,053 |
|
| | | 196,273 |
|
| HOTELS, RESTAURANTS AND LEISURE — 3.3% | | |
Bally Technologies, Inc.(1)(2) | 1,592 |
| 104,626 |
|
Denny's Corp.(2) | 4,102 |
| 26,745 |
|
Einstein Noah Restaurant Group, Inc.(1) | 8,494 |
| 136,414 |
|
| Las Vegas Sands Corp. | 1,243 |
| 94,741 |
|
McDonald's Corp.(1) | 428 |
| 43,117 |
|
Multimedia Games Holding Co., Inc.(1)(2) | 2,375 |
| 70,395 |
|
| Ruth's Hospitality Group, Inc. | 3,407 |
| 42,076 |
|
| Wyndham Worldwide Corp. | 1,165 |
| 88,214 |
|
| | | 606,328 |
|
| HOUSEHOLD DURABLES — 1.7% | | |
iRobot Corp.(1)(2) | 2,367 |
| 96,929 |
|
Libbey, Inc.(2) | 388 |
| 10,336 |
|
PulteGroup, Inc.(1) | 3,595 |
| 72,475 |
|
Universal Electronics, Inc.(2) | 389 |
| 19,014 |
|
Whirlpool Corp.(1) | 785 |
| 109,288 |
|
| | | 308,042 |
|
| HOUSEHOLD PRODUCTS — 1.0% | | |
Kimberly-Clark Corp.(1) | 1,695 |
| 188,518 |
|
| INDUSTRIAL CONGLOMERATES — 1.8% | | |
3M Co.(1) | 1,379 |
| 197,528 |
|
Danaher Corp.(1) | 1,529 |
| 120,378 |
|
| | | 317,906 |
|
|
| | | | | |
| | Shares | Value |
| INSURANCE — 1.6% | | |
Amtrust Financial Services, Inc.(1) | 1,680 |
| $ | 70,241 |
|
Hallmark Financial Services(1)(2) | 10,103 |
| 108,607 |
|
Infinity Property & Casualty Corp.(1) | 1,233 |
| 82,895 |
|
Travelers Cos., Inc. (The)(1) | 285 |
| 26,810 |
|
Universal Insurance Holdings, Inc.(1) | 663 |
| 8,599 |
|
| | | 297,152 |
|
| INTERNET AND CATALOG RETAIL — 2.7% | | |
Amazon.com, Inc.(1)(2) | 453 |
| 147,125 |
|
Expedia, Inc.(1) | 1,249 |
| 98,371 |
|
HomeAway, Inc.(1)(2) | 1,375 |
| 47,878 |
|
HSN, Inc.(1) | 2,057 |
| 121,857 |
|
Orbitz Worldwide, Inc.(1)(2) | 6,434 |
| 57,263 |
|
Overstock.com, Inc.(1)(2) | 1,359 |
| 21,431 |
|
| | | 493,925 |
|
| INTERNET SOFTWARE AND SERVICES — 5.4% | | |
Carbonite, Inc.(1)(2) | 1,376 |
| 16,471 |
|
Conversant, Inc.(2) | 504 |
| 12,801 |
|
eBay, Inc.(1)(2) | 3,716 |
| 186,023 |
|
Facebook, Inc., Class A(1)(2) | 3,483 |
| 234,371 |
|
Google, Inc., Class A(1)(2) | 530 |
| 309,875 |
|
Google, Inc., Class C(1)(2) | 165 |
| 94,921 |
|
Web.com Group, Inc.(2) | 1,200 |
| 34,644 |
|
XO Group, Inc.(1)(2) | 7,154 |
| 87,422 |
|
| | | 976,528 |
|
| IT SERVICES — 4.6% | | |
Accenture plc, Class A(1) | 518 |
| 41,875 |
|
CSG Systems International, Inc.(1) | 3,129 |
| 81,698 |
|
Euronet Worldwide, Inc.(2) | 221 |
| 10,661 |
|
International Business Machines Corp.(1) | 1,136 |
| 205,923 |
|
Jack Henry & Associates, Inc.(1) | 2,315 |
| 137,580 |
|
Lionbridge Technologies, Inc.(2) | 4,386 |
| 26,053 |
|
MasterCard, Inc., Class A(1) | 295 |
| 21,674 |
|
MoneyGram International, Inc.(1)(2) | 9,705 |
| 142,955 |
|
NeuStar, Inc., Class A(1)(2) | 1,031 |
| 26,826 |
|
Teradata Corp.(2) | 2,139 |
| 85,988 |
|
Visa, Inc., Class A(1) | 254 |
| 53,520 |
|
| | | 834,753 |
|
| LEISURE PRODUCTS — 1.3% | | |
Arctic Cat, Inc.(1) | 1,639 |
| 64,609 |
|
| Brunswick Corp. | 800 |
| 33,704 |
|
Hasbro, Inc.(1) | 2,189 |
| 116,127 |
|
| Sturm Ruger & Co., Inc. | 271 |
| 15,992 |
|
| | | 230,432 |
|
| LIFE SCIENCES TOOLS AND SERVICES — 0.2% | | |
Charles River Laboratories International, Inc.(2) | 821 |
| 43,940 |
|
| | | |
|
| | | | | |
| | Shares | Value |
| MACHINERY — 4.8% | | |
Altra Industrial Motion Corp.(1) | 1,268 |
| $ | 46,143 |
|
Caterpillar, Inc.(1) | 1,413 |
| 153,551 |
|
| CIRCOR International, Inc. | 1,036 |
| 79,907 |
|
Dover Corp.(1) | 1,502 |
| 136,607 |
|
| Hyster-Yale Materials Handling, Inc. | 962 |
| 85,175 |
|
IDEX Corp.(1) | 1,386 |
| 111,906 |
|
Snap-On, Inc.(1) | 1,169 |
| 138,550 |
|
Wabash National Corp.(2) | 5,569 |
| 79,358 |
|
WABCO Holdings, Inc.(1)(2) | 436 |
| 46,573 |
|
| | | 877,770 |
|
| MARINE — 0.7% | | |
Matson, Inc.(1) | 4,725 |
| 126,819 |
|
| MEDIA — 3.4% | | |
Comcast Corp., Class A(1) | 1,630 |
| 87,498 |
|
Cumulus Media, Inc., Class A(1)(2) | 15,099 |
| 99,503 |
|
DIRECTV(2) | 404 |
| 34,344 |
|
ReachLocal, Inc.(1)(2) | 12,025 |
| 84,536 |
|
Regal Entertainment Group, Class A(1) | 4,874 |
| 102,842 |
|
| Saga Communications, Inc., Class A | 914 |
| 39,046 |
|
Viacom, Inc., Class B(1) | 1,506 |
| 130,615 |
|
| Walt Disney Co. (The) | 410 |
| 35,153 |
|
| | | 613,537 |
|
| METALS AND MINING — 0.5% | | |
| Compass Minerals International, Inc. | 960 |
| 91,910 |
|
| MULTILINE RETAIL — 0.6% | | |
Macy's, Inc.(1) | 2,034 |
| 118,013 |
|
| OIL, GAS AND CONSUMABLE FUELS — 2.7% | | |
| EOG Resources, Inc. | 1,830 |
| 213,854 |
|
Kosmos Energy Ltd.(2) | 8,665 |
| 97,308 |
|
Panhandle Oil and Gas, Inc., Class A(1) | 2,407 |
| 134,864 |
|
REX American Resources Corp.(2) | 623 |
| 45,672 |
|
| | | 491,698 |
|
| PAPER AND FOREST PRODUCTS — 0.5% | | |
| International Paper Co. | 268 |
| 13,526 |
|
Schweitzer-Mauduit International, Inc.(1) | 1,708 |
| 74,571 |
|
| | | 88,097 |
|
| PERSONAL PRODUCTS — 1.0% | | |
Avon Products, Inc.(1) | 5,133 |
| 74,993 |
|
Medifast, Inc.(1)(2) | 2,218 |
| 67,450 |
|
USANA Health Sciences, Inc.(1)(2) | 515 |
| 40,242 |
|
| | | 182,685 |
|
| PHARMACEUTICALS — 4.3% | | |
AbbVie, Inc.(1) | 5,208 |
| 293,940 |
|
Bristol-Myers Squibb Co.(1) | 1,243 |
| 60,298 |
|
| | | |
|
| | | | | |
| | Shares | Value |
Eli Lilly & Co.(1) | 2,602 |
| $ | 161,766 |
|
Johnson & Johnson(1) | 1,893 |
| 198,046 |
|
Salix Pharmaceuticals Ltd.(1)(2) | 504 |
| 62,168 |
|
| | | 776,218 |
|
| PROFESSIONAL SERVICES — 0.8% | | |
Huron Consulting Group, Inc.(2) | 960 |
| 67,987 |
|
RPX Corp.(1)(2) | 4,844 |
| 85,981 |
|
| | | 153,968 |
|
| REAL ESTATE MANAGEMENT AND DEVELOPMENT — 0.3% | | |
CBRE Group, Inc.(2) | 1,448 |
| 46,394 |
|
| ROAD AND RAIL — 0.6% | | |
Quality Distribution, Inc.(1)(2) | 6,342 |
| 94,242 |
|
Union Pacific Corp.(1) | 140 |
| 13,965 |
|
| | | 108,207 |
|
| SEMICONDUCTORS AND SEMICONDUCTOR EQUIPMENT — 4.2% | | |
Applied Micro Circuits Corp.(2) | 2,651 |
| 28,657 |
|
Broadcom Corp., Class A(1) | 4,487 |
| 166,557 |
|
Cabot Microelectronics Corp.(2) | 466 |
| 20,807 |
|
Intel Corp.(1) | 5,458 |
| 168,652 |
|
MaxLinear, Inc., Class A(1)(2) | 9,349 |
| 94,144 |
|
Microsemi Corp.(2) | 735 |
| 19,669 |
|
Semtech Corp.(2) | 508 |
| 13,284 |
|
Skyworks Solutions, Inc.(1) | 484 |
| 22,729 |
|
Texas Instruments, Inc.(1) | 4,273 |
| 204,207 |
|
| Xilinx, Inc. | 618 |
| 29,238 |
|
| | | 767,944 |
|
| SOFTWARE — 9.2% | | |
Cadence Design Systems, Inc.(1)(2) | 5,191 |
| 90,791 |
|
Callidus Software, Inc.(2) | 1,738 |
| 20,752 |
|
EnerNOC, Inc.(2) | 1,610 |
| 30,509 |
|
Gigamon, Inc.(2) | 2,630 |
| 50,338 |
|
Intuit, Inc.(1) | 1,841 |
| 148,256 |
|
Microsoft Corp.(1) | 16,468 |
| 686,716 |
|
NetScout Systems, Inc.(2) | 440 |
| 19,510 |
|
Oracle Corp.(1) | 9,201 |
| 372,916 |
|
PTC, Inc.(2) | 681 |
| 26,423 |
|
Symantec Corp.(1) | 6,925 |
| 158,582 |
|
VMware, Inc., Class A(1)(2) | 625 |
| 60,506 |
|
| | | 1,665,299 |
|
| SPECIALTY RETAIL — 4.7% | | |
AutoZone, Inc.(2) | 42 |
| 22,522 |
|
Barnes & Noble, Inc.(2) | 5,117 |
| 116,616 |
|
Best Buy Co., Inc.(1) | 3,372 |
| 104,566 |
|
Brown Shoe Co., Inc.(1) | 3,757 |
| 107,488 |
|
Gap, Inc. (The)(1) | 2,444 |
| 101,597 |
|
| Haverty Furniture Cos., Inc. | 811 |
| 20,380 |
|
Home Depot, Inc. (The)(1) | 735 |
| 59,506 |
|
|
| | | | | |
| | Shares | Value |
Kirkland's, Inc.(2) | 1,927 |
| $ | 35,746 |
|
Lowe's Cos., Inc.(1) | 3,990 |
| 191,480 |
|
PetSmart, Inc.(1) | 1,206 |
| 72,119 |
|
Urban Outfitters, Inc.(2) | 412 |
| 13,950 |
|
| | | 845,970 |
|
| TECHNOLOGY HARDWARE, STORAGE AND PERIPHERALS — 7.2% | | |
Apple, Inc.(1) | 8,701 |
| 808,584 |
|
EMC Corp.(1) | 6,382 |
| 168,102 |
|
NetApp, Inc.(1) | 3,861 |
| 141,004 |
|
SanDisk Corp.(1) | 1,769 |
| 184,736 |
|
| | | 1,302,426 |
|
| TEXTILES, APPAREL AND LUXURY GOODS — 1.4% | | |
Deckers Outdoor Corp.(2) | 768 |
| 66,302 |
|
Hanesbrands, Inc.(1) | 1,732 |
| 170,498 |
|
Steven Madden Ltd.(1)(2) | 294 |
| 10,084 |
|
| | | 246,884 |
|
| TOBACCO — 0.6% | | |
Altria Group, Inc.(1) | 267 |
| 11,198 |
|
Philip Morris International, Inc.(1) | 1,161 |
| 97,884 |
|
| | | 109,082 |
|
| TRADING COMPANIES AND DISTRIBUTORS — 0.1% | | |
| Aceto Corp. | 1,069 |
| 19,392 |
|
TOTAL COMMON STOCKS (Cost $19,171,038) | | 23,142,833 |
|
| TEMPORARY CASH INVESTMENTS — 1.5% | | |
| Repurchase Agreement, Bank of America Merrill Lynch, (collateralized by various U.S. Treasury obligations, 0.75% - 0.875%, 1/31/18 - 2/28/18, valued at $59,040), in a joint trading account at 0.05%, dated 6/30/14, due 7/1/14 (Delivery value $57,852) | | 57,852 |
|
| Repurchase Agreement, Credit Suisse First Boston, Inc., (collateralized by various U.S. Treasury obligations, 1.75%, 5/15/23, valued at $23,624), in a joint trading account at 0.01%, dated 6/30/14, due 7/1/14 (Delivery value $23,141) | | 23,141 |
|
| Repurchase Agreement, Goldman Sachs & Co., (collateralized by various U.S. Treasury obligations, 3.125%, 11/15/41, valued at $47,213), in a joint trading account at 0.03%, dated 6/30/14, due 7/1/14 (Delivery value $46,282) | | 46,282 |
|
| SSgA U.S. Government Money Market Fund, Class N | 137,483 |
| 137,483 |
|
TOTAL TEMPORARY CASH INVESTMENTS (Cost $264,758) | | 264,758 |
|
TOTAL INVESTMENT SECURITIES BEFORE SECURITIES SOLD SHORT — 128.9% (Cost $19,435,796) | 23,407,591 |
|
| COMMON STOCKS SOLD SHORT — (30.2)% | | |
| AEROSPACE AND DEFENSE — (0.7)% | | |
| Innovative Solutions & Support, Inc. | (12,034 | ) | (89,533 | ) |
| LMI Aerospace, Inc. | (2,443 | ) | (31,954 | ) |
| | | (121,487 | ) |
| AIR FREIGHT AND LOGISTICS — (0.3)% | | |
| UTi Worldwide, Inc. | (4,978 | ) | (51,473 | ) |
| BIOTECHNOLOGY — (0.1)% | | |
| Infinity Pharmaceuticals, Inc. | (1,057 | ) | (13,466 | ) |
|
| | | | | |
| | Shares | Value |
| CAPITAL MARKETS — (0.7)% | | |
| ICG Group, Inc. | (5,666 | ) | $ | (118,306 | ) |
| CHEMICALS — (1.9)% | | |
| Chemtura Corp. | (2,146 | ) | (56,075 | ) |
| LSB Industries, Inc. | (3,728 | ) | (155,346 | ) |
| Rentech, Inc. | (54,646 | ) | (141,533 | ) |
| | | (352,954 | ) |
| COMMERCIAL SERVICES AND SUPPLIES — (1.2)% | | |
| InnerWorkings, Inc. | (12,799 | ) | (108,792 | ) |
| Interface, Inc. | (5,730 | ) | (107,953 | ) |
| | | (216,745 | ) |
| COMMUNICATIONS EQUIPMENT — (0.8)% | | |
| Procera Networks, Inc. | (8,928 | ) | (90,083 | ) |
| ViaSat, Inc. | (961 | ) | (55,700 | ) |
| | | (145,783 | ) |
| CONSTRUCTION AND ENGINEERING — (0.1)% | | |
| Furmanite Corp. | (795 | ) | (9,254 | ) |
| Sterling Construction Co., Inc. | (1,619 | ) | (15,186 | ) |
| | | (24,440 | ) |
| CONTAINERS AND PACKAGING — (0.3)% | | |
| AEP Industries, Inc. | (1,733 | ) | (60,430 | ) |
| DIVERSIFIED TELECOMMUNICATION SERVICES — (0.2)% | | |
| Cincinnati Bell, Inc. | (9,250 | ) | (36,352 | ) |
| ELECTRICAL EQUIPMENT — (0.8)% | | |
| Franklin Electric Co., Inc. | (1,520 | ) | (61,302 | ) |
| PowerSecure International, Inc. | (9,472 | ) | (92,257 | ) |
| | | (153,559 | ) |
| ELECTRONIC EQUIPMENT, INSTRUMENTS AND COMPONENTS — (0.2)% | |
| Badger Meter, Inc. | (734 | ) | (38,645 | ) |
| FOOD AND STAPLES RETAILING — (0.2)% | | |
| Chefs' Warehouse, Inc. (The) | (2,213 | ) | (43,751 | ) |
| FOOD PRODUCTS — (0.3)% | | |
| Inventure Foods, Inc. | (672 | ) | (7,573 | ) |
| Lifeway Foods, Inc. | (3,799 | ) | (53,110 | ) |
| | | (60,683 | ) |
| GAS UTILITIES — (0.7)% | | |
| South Jersey Industries, Inc. | (1,988 | ) | (120,095 | ) |
| HEALTH CARE EQUIPMENT AND SUPPLIES — (0.5)% | | |
| NxStage Medical, Inc. | (4,804 | ) | (69,033 | ) |
| Spectranetics Corp. (The) | (520 | ) | (11,898 | ) |
| Volcano Corp. | (649 | ) | (11,429 | ) |
| | | (92,360 | ) |
| HEALTH CARE PROVIDERS AND SERVICES — (0.7)% | | |
| Acadia Healthcare Co., Inc. | (480 | ) | (21,840 | ) |
| Air Methods Corp. | (1,155 | ) | (59,656 | ) |
|
| | | | | |
| | Shares | Value |
| BioScrip, Inc. | (5,450 | ) | $ | (45,453 | ) |
| | | (126,949 | ) |
| HOTELS, RESTAURANTS AND LEISURE — (0.9)% | | |
| BJ's Restaurants, Inc. | (1,300 | ) | (45,383 | ) |
| Diversified Restaurant Holdings, Inc. | (22,523 | ) | (107,435 | ) |
| Nathan's Famous, Inc. | (198 | ) | (10,729 | ) |
| | | (163,547 | ) |
| HOUSEHOLD DURABLES — (2.3)% | | |
| Beazer Homes USA, Inc. | (1,503 | ) | (31,533 | ) |
| KB Home | (5,423 | ) | (101,301 | ) |
| M.D.C. Holdings, Inc. | (1,961 | ) | (59,399 | ) |
| Tempur Sealy International, Inc. | (196 | ) | (11,701 | ) |
| WCI Communities, Inc. | (4,204 | ) | (81,179 | ) |
| William Lyon Homes, Class A | (4,538 | ) | (138,137 | ) |
| | | (423,250 | ) |
| INSURANCE — (0.4)% | | |
| Ambac Financial Group, Inc. | (2,374 | ) | (64,834 | ) |
| INTERNET SOFTWARE AND SERVICES — (0.6)% | | |
| E2open, Inc. | (597 | ) | (12,340 | ) |
| WebMD Health Corp. | (2,001 | ) | (96,648 | ) |
| | | (108,988 | ) |
| IT SERVICES — (1.2)% | | |
| Planet Payment, Inc. | (47,609 | ) | (135,209 | ) |
| WEX, Inc. | (779 | ) | (81,772 | ) |
| | | (216,981 | ) |
| LIFE SCIENCES TOOLS AND SERVICES — (0.3)% | | |
| Cambrex Corp. | (837 | ) | (17,326 | ) |
| Harvard Bioscience, Inc. | (8,919 | ) | (40,581 | ) |
| | | (57,907 | ) |
| MACHINERY — (1.1)% | | |
| Chart Industries, Inc. | (1,066 | ) | (88,201 | ) |
| EnPro Industries, Inc. | (177 | ) | (12,949 | ) |
| RBC Bearings, Inc. | (1,473 | ) | (94,346 | ) |
| | | (195,496 | ) |
| MEDIA — (0.7)% | | |
| Loral Space & Communications, Inc. | (926 | ) | (67,311 | ) |
| Nexstar Broadcasting Group, Inc., Class A | (983 | ) | (50,733 | ) |
| | | (118,044 | ) |
| METALS AND MINING — (1.7)% | | |
| Hecla Mining Co. | (38,356 | ) | (132,328 | ) |
| Royal Gold, Inc. | (685 | ) | (52,143 | ) |
| Tahoe Resources, Inc. | (4,871 | ) | (127,620 | ) |
| | | (312,091 | ) |
| MULTILINE RETAIL — (0.5)% | | |
| Gordmans Stores, Inc. | (19,244 | ) | (82,749 | ) |
|
| | | | | |
| | Shares | Value |
| OIL, GAS AND CONSUMABLE FUELS — (0.9)% | | |
| Delek US Holdings, Inc. | (1,406 | ) | $ | (39,692 | ) |
| Gastar Exploration, Inc. | (1,313 | ) | (11,436 | ) |
| SemGroup Corp., Class A | (1,032 | ) | (81,373 | ) |
| Synergy Resources Corp. | (2,325 | ) | (30,806 | ) |
| | | (163,307 | ) |
| PAPER AND FOREST PRODUCTS — (0.5)% | | |
| Deltic Timber Corp. | (1,490 | ) | (90,026 | ) |
| PERSONAL PRODUCTS — (0.2)% | | |
| Elizabeth Arden, Inc. | (1,554 | ) | (33,287 | ) |
| PHARMACEUTICALS — (0.4)% | | |
| Auxilium Pharmaceuticals, Inc. | (1,133 | ) | (22,728 | ) |
| Depomed, Inc. | (829 | ) | (11,523 | ) |
| Pacira Pharmaceuticals, Inc. | (360 | ) | (33,070 | ) |
| Repros Therapeutics, Inc. | (681 | ) | (11,781 | ) |
| | | (79,102 | ) |
| REAL ESTATE INVESTMENT TRUSTS (REITs) — (0.3)% | | |
| Plum Creek Timber Co., Inc. | (1,125 | ) | (50,737 | ) |
| REAL ESTATE MANAGEMENT AND DEVELOPMENT — (1.8)% | | |
| Forestar Group, Inc. | (6,506 | ) | (124,200 | ) |
| Kennedy-Wilson Holdings, Inc. | (3,182 | ) | (85,341 | ) |
| Tejon Ranch Co. | (3,420 | ) | (110,090 | ) |
| | | (319,631 | ) |
| ROAD AND RAIL — (0.5)% | | |
| Heartland Express, Inc. | (4,031 | ) | (86,021 | ) |
| Roadrunner Transportation Systems, Inc. | (317 | ) | (8,908 | ) |
| | | (94,929 | ) |
| SEMICONDUCTORS AND SEMICONDUCTOR EQUIPMENT — (1.4)% | | |
| SunEdison, Inc. | (6,467 | ) | (146,154 | ) |
| Ultratech, Inc. | (5,096 | ) | (113,029 | ) |
| | | (259,183 | ) |
| SOFTWARE — (1.2)% | | |
| Epiq Systems, Inc. | (7,945 | ) | (111,627 | ) |
| ePlus, Inc. | (731 | ) | (42,544 | ) |
| Rally Software Development Corp. | (1,047 | ) | (11,402 | ) |
| Solera Holdings, Inc. | (750 | ) | (50,363 | ) |
| | | (215,936 | ) |
| SPECIALTY RETAIL — (1.8)% | | |
| America's Car-Mart, Inc. | (330 | ) | (13,052 | ) |
| American Eagle Outfitters, Inc. | (1,644 | ) | (18,446 | ) |
| Asbury Automotive Group, Inc. | (538 | ) | (36,982 | ) |
| CarMax, Inc. | (904 | ) | (47,017 | ) |
| Conn's, Inc. | (1,296 | ) | (64,009 | ) |
| Lithia Motors, Inc., Class A | (178 | ) | (16,745 | ) |
| Signet Jewelers Ltd. | (1,216 | ) | (134,477 | ) |
| | | (330,728 | ) |
|
| | | | | |
| | Shares | Value |
| TECHNOLOGY HARDWARE, STORAGE AND PERIPHERALS — (0.3)% | | |
| Silicon Graphics International Corp. | (4,583 | ) | $ | (44,088 | ) |
| Stratasys Ltd. | (111 | ) | (12,613 | ) |
| | | (56,701 | ) |
| TEXTILES, APPAREL AND LUXURY GOODS — (0.5)% | | |
| Oxford Industries, Inc. | (856 | ) | (57,070 | ) |
| Quiksilver, Inc. | (10,281 | ) | (36,806 | ) |
| | | (93,876 | ) |
| TRADING COMPANIES AND DISTRIBUTORS — (1.0)% | | |
| Aircastle Ltd. | (3,234 | ) | (57,468 | ) |
| H&E Equipment Services, Inc. | (3,361 | ) | (122,139 | ) |
| | | (179,607 | ) |
TOTAL COMMON STOCKS SOLD SHORT — (30.2)% (Proceeds $5,078,633) | | (5,488,415 | ) |
| OTHER ASSETS AND LIABILITIES — 1.3% | | 244,233 |
|
| TOTAL NET ASSETS — 100.0% | | $ | 18,163,409 |
|
|
| | |
| NOTES TO SCHEDULE OF INVESTMENTS |
| |
| (1) | Security, or a portion thereof, has been pledged at the custodian bank or with a broker for collateral requirements on securities sold short. At the period end, the aggregate value of securities pledged was $16,290,128. |
See Notes to Financial Statements.
|
|
| Statement of Assets and Liabilities |
|
| | | |
| JUNE 30, 2014 |
| Assets |
| Investment securities, at value (cost of $19,435,796) | $ | 23,407,591 |
|
| Deposits with broker for securities sold short | 226,885 |
|
| Receivable for capital shares sold | 27,911 |
|
| Dividends and interest receivable | 15,297 |
|
| | 23,677,684 |
|
| | |
| Liabilities |
| Securities sold short, at value (proceeds of $5,078,633) | 5,488,415 |
|
| Payable for capital shares redeemed | 2,103 |
|
| Accrued management fees | 21,078 |
|
| Distribution and service fees payable | 1,026 |
|
| Dividend expense payable on securities sold short | 1,653 |
|
| | 5,514,275 |
|
| | |
| Net Assets | $ | 18,163,409 |
|
| | |
| Net Assets Consist of: |
| Capital (par value and paid-in surplus) | $ | 13,687,581 |
|
| Undistributed net investment income | 1,171 |
|
| Undistributed net realized gain | 912,644 |
|
| Net unrealized appreciation | 3,562,013 |
|
| | $ | 18,163,409 |
|
|
| | | | | | |
| | Net Assets | Shares Outstanding | Net Asset Value Per Share |
| Investor Class, $0.01 Par Value |
| $15,188,443 |
| 948,203 |
| $16.02 |
| Institutional Class, $0.01 Par Value |
| $503,421 |
| 31,398 |
| $16.03 |
| A Class, $0.01 Par Value |
| $1,251,945 |
| 78,410 |
| $15.97* |
| C Class, $0.01 Par Value |
| $699,099 |
| 44,498 |
| $15.71 |
| R Class, $0.01 Par Value |
| $520,501 |
| 32,719 |
| $15.91 |
*Maximum offering price $16.94 (net asset value divided by 0.9425).
See Notes to Financial Statements.
|
| | | |
| YEAR ENDED JUNE 30, 2014 |
| Investment Income (Loss) |
| Income: | |
| Dividends (net of foreign taxes withheld of $11) | $ | 292,702 |
|
| Interest | 100 |
|
| | 292,802 |
|
| | |
| Expenses: | |
| Dividend expense on securities sold short | 23,913 |
|
| Broker fees and charges on securities sold short | 28,449 |
|
| Management fees | 212,861 |
|
| Distribution and service fees: | |
| A Class | 2,362 |
|
| C Class | 5,935 |
|
| R Class | 2,297 |
|
| Directors' fees and expenses | 873 |
|
| Other expenses | 279 |
|
| | 276,969 |
|
| | |
| Net investment income (loss) | 15,833 |
|
| | |
| Realized and Unrealized Gain (Loss) |
| Net realized gain (loss) on: | |
| Investment transactions | 2,054,190 |
|
| Securities sold short transactions | (726,238 | ) |
| | 1,327,952 |
|
| | |
| Change in net unrealized appreciation (depreciation) on: | |
| Investments | 2,424,810 |
|
| Securities sold short | (106,040 | ) |
| | 2,318,770 |
|
| | |
| Net realized and unrealized gain (loss) | 3,646,722 |
|
| | |
| Net Increase (Decrease) in Net Assets Resulting from Operations | $ | 3,662,555 |
|
See Notes to Financial Statements.
|
|
| Statement of Changes in Net Assets |
|
| | | | | | |
| YEARS ENDED JUNE 30, 2014 AND JUNE 30, 2013 | | |
| Increase (Decrease) in Net Assets | June 30, 2014 | June 30, 2013 |
| Operations | | |
| Net investment income (loss) | $ | 15,833 |
| $ | 22,504 |
|
| Net realized gain (loss) | 1,327,952 |
| 89,920 |
|
| Change in net unrealized appreciation (depreciation) | 2,318,770 |
| 1,052,077 |
|
| Net increase (decrease) in net assets resulting from operations | 3,662,555 |
| 1,164,501 |
|
| | | |
| Distributions to Shareholders | | |
| From net investment income: | | |
| Investor Class | (9,913 | ) | (14,266 | ) |
| Institutional Class | (1,286 | ) | (2,608 | ) |
| A Class | — |
| (1,698 | ) |
| R Class | — |
| (253 | ) |
| From net realized gains: | | |
| Investor Class | (331,823 | ) | — |
|
| Institutional Class | (12,402 | ) | — |
|
| A Class | (25,398 | ) | — |
|
| C Class | (16,154 | ) | — |
|
| R Class | (12,826 | ) | — |
|
| Decrease in net assets from distributions | (409,802 | ) | (18,825 | ) |
| | | |
| Capital Share Transactions | | |
Net increase (decrease) in net assets from capital share transactions (Note 5) | 4,419,523 |
| 5,545,799 |
|
| | | |
| Net increase (decrease) in net assets | 7,672,276 |
| 6,691,475 |
|
| | | |
| Net Assets | | |
| Beginning of period | 10,491,133 |
| 3,799,658 |
|
| End of period | $ | 18,163,409 |
| $ | 10,491,133 |
|
| | | |
| Undistributed net investment income | $ | 1,171 |
| $ | — |
|
See Notes to Financial Statements.
|
| | | |
| YEAR ENDED JUNE 30, 2014 | |
| Cash Flows From (Used In) Operating Activities | |
| Net increase (decrease) in net assets resulting from operations | $ | 3,662,555 |
|
| Adjustments to reconcile net increase (decrease) in net assets resulting from operations to net cash from (used in) operating activities: | |
| Purchases of investment securities | (17,058,413 | ) |
| Proceeds from investments sold | 11,889,020 |
|
| Purchases to cover securities sold short | (4,833,112 | ) |
| Proceeds from securities sold short | 6,370,561 |
|
| (Increase) decrease in short-term investments | (63,996 | ) |
| (Increase) decrease in deposits with broker for securities sold short | (141,273 | ) |
| (Increase) decrease in receivable for investments sold | 582,991 |
|
| (Increase) decrease in dividends and interest receivable | (7,100 | ) |
| Increase (decrease) in payable for investments purchased | (759,043 | ) |
| Increase (decrease) in accrued management fees | 8,692 |
|
| Increase (decrease) in distribution and service fees payable | 339 |
|
| Increase (decrease) in dividend expense payable on securities sold short | 1,359 |
|
| Increase (decrease) in broker fees and charges payable on securities sold short | (72 | ) |
| Change in net unrealized (appreciation) depreciation on investments | (2,424,810 | ) |
| Net realized (gain) loss on investment transactions | (2,054,190 | ) |
| Change in net unrealized (appreciation) depreciation on securities sold short | 106,040 |
|
| Net realized (gain) loss on securities sold short transactions | 726,238 |
|
| Net cash from (used in) operating activities | (3,994,214 | ) |
| | |
| Cash Flows From (Used In) Financing Activities | |
| Proceeds from shares sold | 9,607,418 |
|
| Payments for shares redeemed | (5,608,342 | ) |
| Distributions paid, net of reinvestments | (4,862 | ) |
| Net cash from (used in) financing activities | 3,994,214 |
|
| | |
| Net Increase (Decrease) In Cash | — |
|
| Cash at beginning of period | — |
|
| Cash at end of period | — |
|
| | |
| Supplemental disclosure of cash flow information: | |
| Non cash financing activities not included herein consist of all reinvestment of distributions of $404,940. |
See Notes to Financial Statements.
|
|
| Notes to Financial Statements |
JUNE 30, 2014
1. Organization
American Century Quantitative Equity Funds, Inc. (the corporation) is registered under the Investment Company Act of 1940, as amended (the 1940 Act), as an open-end management investment company and is organized as a Maryland corporation. Disciplined Growth Plus Fund (the fund) is one fund in a series issued by the corporation. The fund is diversified as defined under the 1940 Act. The fund’s investment objective is to seek long-term capital growth.
The fund offers the Investor Class, the Institutional Class, the A Class, the C Class and the R Class. The A Class may incur an initial sales charge. The A Class and C Class may be subject to a contingent deferred sales charge. The share classes differ principally in their respective sales charges and distribution and shareholder servicing expenses and arrangements. The Institutional Class is made available to institutional shareholders or through financial intermediaries whose clients do not require the same level of shareholder and administrative services as shareholders of other classes. As a result, the Institutional Class is charged a lower unified management fee.
2. Significant Accounting Policies
The following is a summary of significant accounting policies consistently followed by the fund in preparation of its financial statements. The financial statements are prepared in conformity with accounting principles generally accepted in the United States of America, which may require management to make certain estimates and assumptions at the date of the financial statements. Actual results could differ from these estimates. Management evaluated the impact of events or transactions occurring through the date the financial statements were issued that would merit recognition or disclosure.
Investment Valuations — The fund determines the fair value of its investments and computes its net asset value per share at the close of regular trading (usually 4 p.m. Eastern time) on the New York Stock Exchange (NYSE) on each day the NYSE is open. The Board of Directors has adopted valuation policies and procedures to guide the investment advisor in the fund’s investment valuation process and to provide methodologies for the oversight of the fund’s pricing function.
Equity securities that are listed or traded on a domestic securities exchange are valued at the last reported sales price or at the official closing price as provided by the exchange. Equity securities traded on foreign securities exchanges are generally valued at the closing price of such securities on the exchange where primarily traded or at the close of the NYSE, if that is earlier. If no last sales price is reported, or if local convention or regulation so provides, the mean of the latest bid and asked prices may be used. Securities traded over-the-counter are valued at the mean of the latest bid and asked prices, the last sales price, or the official closing price.
Fixed income securities maturing within 60 days at the time of purchase may be valued at cost, plus or minus any amortized discount or premium or at the evaluated mean as provided by an independent pricing service. Evaluated mean prices are commonly derived through utilization of market models, which may consider, among other factors: trade data, quotations from dealers and active market makers, relevant yield curve and spread data, related sector levels, creditworthiness, trade data or market information on comparable securities, and other relevant security specific information.
Open-end management investment companies are valued at the reported net asset value per share. Repurchase agreements are valued at cost, which approximates fair value.
If the fund determines that the market price for an investment is not readily available or the valuation methods mentioned above do not reflect an investment’s fair value, such investment is valued as determined in good faith by the Board of Directors or its delegate, in accordance with policies and procedures adopted by the Board of Directors. In its determination of fair value, the fund may review several factors including, but not limited to, market information regarding the specific investment or comparable investments and correlation with other investment types, futures indices or general market indicators. Circumstances that may cause the fund to use these procedures to value an investment include, but are not limited to: an investment has been declared in default or is distressed; trading in a security has been suspended during the trading day or a
security is not actively trading on its principal exchange; prices received from a regular pricing source are deemed unreliable; or there is a foreign market holiday and no trading occurred.
The fund monitors for significant events occurring after the close of an investment’s primary exchange but before the fund’s net asset value per share is determined. Significant events may include, but are not limited to: corporate announcements and transactions; governmental action and political unrest that could impact a specific investment or an investment sector; or armed conflicts, natural disasters and similar events that could affect investments in a specific country or region. The fund also monitors for significant fluctuations between domestic and foreign markets, as evidenced by the U.S. market or such other indicators that the Board of Directors, or its delegate, deems appropriate. If significant fluctuations in foreign markets are identified, the fund may apply a model-derived factor to the closing price of equity securities traded on foreign securities exchanges. The factor is based on observable market data as provided by an independent pricing service.
Security Transactions — Security transactions are accounted for as of the trade date. Net realized gains and losses are determined on the identified cost basis, which is also used for federal income tax purposes.
Investment Income — Dividend income less foreign taxes withheld, if any, is recorded as of the ex-dividend date. Distributions received on securities that represent a return of capital or long-term capital gain are recorded as a reduction of cost of investments and/or as a realized gain. The fund may estimate the components of distributions received that may be considered nontaxable distributions or long-term capital gain distributions for income tax purposes. Interest income is recorded on the accrual basis and includes accretion of discounts and amortization of premiums.
Securities Sold Short — The fund enters into short sales, which is selling securities it does not own, as part of its normal investment activities. Upon selling a security short, the fund will segregate cash, cash equivalents or other appropriate liquid securities in at least an amount equal to the current market value of the securities sold short until the fund replaces the borrowed security. Interest earned on segregated cash for securities sold short is reflected as interest income. The fund is required to pay any dividends or interest due on securities sold short. Such dividends and interest are recorded as an expense. The fund may pay fees or charges to the broker on the assets borrowed for securities sold short. These fees are calculated daily based upon the value of each security sold short and a rate that is dependent on the availability of such security. Liabilities for securities sold short are valued daily and changes in value are recorded as change in net unrealized appreciation (depreciation) on securities sold short. The fund records realized gain (loss) on a security sold short when it is terminated by the fund and includes as a component of net realized gain (loss) on securities sold short transactions.
Repurchase Agreements — The fund may enter into repurchase agreements with institutions that American Century Investment Management, Inc. (ACIM) (the investment advisor) has determined are creditworthy pursuant to criteria adopted by the Board of Directors. The fund requires that the collateral, represented by securities, received in a repurchase transaction be transferred to the custodian in a manner sufficient to enable the fund to obtain those securities in the event of a default under the repurchase agreement. ACIM monitors, on a daily basis, the securities transferred to ensure the value, including accrued interest, of the securities under each repurchase agreement is equal to or greater than amounts owed to the fund under each repurchase agreement.
Joint Trading Account — Pursuant to an Exemptive Order issued by the Securities and Exchange Commission, the fund, along with certain other funds in the American Century Investments family of funds, may transfer uninvested cash balances into a joint trading account. These balances are invested in one or more repurchase agreements that are collateralized by U.S. Treasury or Agency obligations.
Segregated Assets — In accordance with the 1940 Act, the fund segregates assets on its books and records to cover certain types of investments, including, but not limited to, futures contracts and short sales. ACIM monitors, on a daily basis, the securities segregated to ensure the fund designates a sufficient amount of liquid assets, marked-to-market daily. The fund may also receive assets or be required to pledge assets at the custodian bank or with a broker for margin requirements on futures contracts and short sales.
Income Tax Status — It is the fund’s policy to distribute substantially all net investment income and net realized gains to shareholders and to otherwise qualify as a regulated investment company under provisions of the Internal Revenue Code. Accordingly, no provision has been made for income taxes. The fund files U.S. federal, state, local and non-U.S. tax returns as applicable. The fund's tax returns are subject to examination by the relevant taxing authority until expiration of the applicable statute of limitations, which is generally three years from the date of filing but can be longer in certain jurisdictions. At this time, management believes there are no uncertain tax positions which, based on their technical merit, would not be sustained upon examination
and for which it is reasonably possible that the total amounts of unrecognized tax benefits will significantly change in the next twelve months.
Multiple Class — All shares of the fund represent an equal pro rata interest in the net assets of the class to which such shares belong, and have identical voting, dividend, liquidation and other rights and the same terms and conditions, except for class specific expenses and exclusive rights to vote on matters affecting only individual classes. Income, non-class specific expenses, and realized and unrealized capital gains and losses of the fund are allocated to each class of shares based on their relative net assets.
Distributions to Shareholders — Distributions from net investment income, if any, are generally declared and paid semiannually. Distributions from net realized gains, if any, are generally declared and paid annually.
Indemnifications — Under the corporation’s organizational documents, its officers and directors are indemnified against certain liabilities arising out of the performance of their duties to the fund. In addition, in the normal course of business, the fund enters into contracts that provide general indemnifications. The maximum exposure under these arrangements is unknown as this would involve future claims that may be made against a fund. The risk of material loss from such claims is considered by management to be remote.
Statement of Cash Flows — The beginning of period and end of period cash in the Statement of Cash Flows is the amount of domestic and foreign currency included in the fund's Statement of Assets and Liabilities and represents the cash on hand at the custodian bank and does not include any short-term investments or deposits with brokers for securities sold short.
3. Fees and Transactions with Related Parties
Certain officers and directors of the corporation are also officers and/or directors of American Century Companies, Inc. (ACC). The corporation’s investment advisor, ACIM, the corporation's distributor, American Century Investment Services, Inc. (ACIS), and the corporation’s transfer agent, American Century Services, LLC, are wholly owned, directly or indirectly, by ACC. ACIM owns 11% of the shares of the fund.
Management Fees — The corporation has entered into a management agreement with ACIM, under which ACIM provides the fund with investment advisory and management services in exchange for a single, unified management fee (the fee) per class. The agreement provides that all expenses of managing and operating the fund, except distribution and service fees, expenses on securities sold short, brokerage expenses, taxes, interest, fees and expenses of the independent directors (including legal counsel fees), and extraordinary expenses, will be paid by ACIM. The fee is computed and accrued daily based on each class’s daily net assets and paid monthly in arrears. The fee consists of (1) an Investment Category Fee based on the daily net assets of the fund and certain other accounts managed by the investment advisor that are in the same broad investment category as the fund and (2) a Complex Fee based on the assets of all the funds in the American Century Investments family of funds. The rates for the Investment Category Fee range from 1.1180% to 1.3000%. The rates for the Complex Fee range from 0.2500% to 0.3100% for the Investor Class, A Class, C Class and R Class. The rates for the Complex Fee range from 0.0500% to 0.1100% for the Institutional Class. The effective annual management fee for each class for the year ended June 30, 2014 was 1.45% for the Investor Class, A Class, C Class and R Class and 1.25% for the Institutional Class.
Distribution and Service Fees — The Board of Directors has adopted a separate Master Distribution and Individual Shareholder Services Plan for each of the A Class, C Class and R Class (collectively the plans), pursuant to Rule 12b-1 of the 1940 Act. The plans provide that the A Class will pay ACIS an annual distribution and service fee of 0.25%. The plans provide that the C Class will pay ACIS an annual distribution and service fee of 1.00%, of which 0.25% is paid for individual shareholder services and 0.75% is paid for distribution services. The plans provide that the R Class will pay ACIS an annual distribution and service fee of 0.50%. The fees are computed and accrued daily based on each class’s daily net assets and paid monthly in arrears. The fees are used to pay financial intermediaries for distribution and individual shareholder services. Fees incurred under the plans during the year ended June 30, 2014 are detailed in the Statement of Operations.
Directors' Fees and Expenses — The Board of Directors is responsible for overseeing the investment advisor’s management and operations of the fund. The directors receive detailed information about the fund and its investment advisor regularly throughout the year, and meet at least quarterly with management of the investment advisor to review reports about fund operations. Fees and expenses incurred in conjunction with the directors during the year ended June 30, 2014 are detailed in the Statement of Operations. The fund’s officers do not receive compensation from the fund.
4. Investment Transactions
Purchases and sales of investment securities and securities sold short, excluding short-term investments, for the year ended June 30, 2014 were $21,841,954 and $18,213,097, respectively.
5. Capital Share Transactions
Transactions in shares of the fund were as follows:
|
| | | | | | | | | | |
| | Year ended June 30, 2014 | Year ended June 30, 2013 |
| | Shares | Amount | Shares | Amount |
| Investor Class/Shares Authorized | 10,000,000 |
| | 10,000,000 |
| |
| Sold | 631,052 |
| $ | 9,140,599 |
| 646,550 |
| $ | 7,547,211 |
|
| Issued in reinvestment of distributions | 23,160 |
| 336,874 |
| 1,222 |
| 13,632 |
|
| Redeemed | (385,706 | ) | (5,592,567 | ) | (175,129 | ) | (2,103,544 | ) |
| | 268,506 |
| 3,884,906 |
| 472,643 |
| 5,457,299 |
|
| Institutional Class/Shares Authorized | 10,000,000 |
| | 10,000,000 |
| |
| Sold | 222 |
| 2,976 |
| – |
| – |
|
| Issued in reinvestment of distributions | 939 |
| 13,688 |
| 234 |
| 2,608 |
|
| Redeemed | (44 | ) | (700 | ) | – |
| – |
|
| | 1,117 |
| 15,964 |
| 234 |
| 2,608 |
|
| A Class/Shares Authorized | 10,000,000 |
| | 10,000,000 |
| |
| Sold | 25,900 |
| 379,280 |
| 9,549 |
| 116,097 |
|
| Issued in reinvestment of distributions | 1,752 |
| 25,398 |
| 152 |
| 1,698 |
|
| Redeemed | (998 | ) | (14,611 | ) | (10,244 | ) | (116,000 | ) |
| | 26,654 |
| 390,067 |
| (543 | ) | 1,795 |
|
| C Class/Shares Authorized | 10,000,000 |
| | 10,000,000 |
| |
| Sold | 5,530 |
| 78,582 |
| 7,614 |
| 86,275 |
|
| Issued in reinvestment of distributions | 1,127 |
| 16,154 |
| – |
| – |
|
| Redeemed | (47 | ) | (697 | ) | (440 | ) | (5,303 | ) |
| | 6,610 |
| 94,039 |
| 7,174 |
| 80,972 |
|
| R Class/Shares Authorized | 10,000,000 |
| | 10,000,000 |
| |
| Sold | 1,528 |
| 21,908 |
| 244 |
| 2,872 |
|
| Issued in reinvestment of distributions | 886 |
| 12,826 |
| 23 |
| 253 |
|
| Redeemed | (12 | ) | (187 | ) | – |
| – |
|
| | 2,402 |
| 34,547 |
| 267 |
| 3,125 |
|
| Net increase (decrease) | 305,289 |
| $ | 4,419,523 |
| 479,775 |
| $ | 5,545,799 |
|
6. Fair Value Measurements
The fund’s investments valuation process is based on several considerations and may use multiple inputs to determine the fair value of the investments held by the fund. In conformity with accounting principles generally accepted in the United States of America, the inputs used to determine a valuation are classified into three broad levels.
| |
| • | Level 1 valuation inputs consist of unadjusted quoted prices in an active market for identical investments. |
| |
| • | Level 2 valuation inputs consist of direct or indirect observable market data (including quoted prices for comparable investments, evaluations of subsequent market events, interest rates, prepayment speeds, credit risk, etc.). These inputs also consist of quoted prices for identical investments initially expressed in local currencies that are adjusted through translation into U.S. dollars. |
| |
| • | Level 3 valuation inputs consist of unobservable data (including a fund’s own assumptions). |
The level classification is based on the lowest level input that is significant to the fair valuation measurement. The valuation inputs are not necessarily an indication of the risks associated with investing in these securities or other financial instruments.
The following is a summary of the level classifications as of period end. The Schedule of Investments provides additional information on the fund’s portfolio holdings.
|
| | | | | | | | |
| | Level 1 | Level 2 | Level 3 |
| Assets |
| Investment Securities |
| Common Stocks | $ | 23,142,833 |
| — |
| — |
|
| Temporary Cash Investments | 137,483 |
| $ | 127,275 |
| — |
|
| | $ | 23,280,316 |
| $ | 127,275 |
| — |
|
| | | | |
| Liabilities |
| Securities Sold Short |
| Common Stocks | $ | (5,488,415 | ) | — |
| — |
|
7. Risk Factors
The fund's investment strategy utilizes leverage, which can increase market exposure and subject the fund to greater risk and higher volatility.
The fund is subject to short sales risk. If the market price of a security increases after the fund borrows the security, the fund may suffer a loss when it replaces the borrowed security at the higher price. Any loss will be increased by the amount of compensation, interest or dividends, and transaction costs the fund must pay to the lender of the borrowed security.
If the fund is overweighted in a stock or sector, any negative development related to that stock or sector will have a greater impact on the fund than other funds that are not overweighted in that stock or sector.
8. Federal Tax Information
The tax character of distributions paid during the years ended June 30, 2014 and June 30, 2013 were as follows:
|
| | | | | | |
| | 2014 | 2013 |
| Distributions Paid From | | |
| Ordinary income | $ | 84,724 |
| $ | 16,263 |
|
| Long-term capital gains | $ | 325,078 |
| $ | 2,562 |
|
The book-basis character of distributions made during the year from net investment income or net realized gains may differ from their ultimate characterization for federal income tax purposes. These differences reflect the differing character of certain income items and net realized gains and losses for financial statement and tax purposes, and may result in reclassification among certain capital accounts on the financial statements.
As of June 30, 2014, the federal tax cost of investments and the components of distributable earnings on a tax-basis were as follows:
|
| | | |
| Federal tax cost of investments | $ | 19,439,920 |
|
| Gross tax appreciation of investments | $ | 4,298,110 |
|
| Gross tax depreciation of investments | (330,439 | ) |
| Net tax appreciation (depreciation) of investments | 3,967,671 |
|
| Net tax appreciation (depreciation) on securities sold short | (413,221 | ) |
| Net tax appreciation (depreciation) | $ | 3,554,450 |
|
| Undistributed ordinary income | $ | 119,665 |
|
| Accumulated long-term gains | $ | 801,713 |
|
| | |
The difference between book-basis and tax-basis unrealized appreciation (depreciation) is attributable primarily to the tax deferral of losses on wash sales.
|
| | | | | | | | | | | | | | | | |
| For a Share Outstanding Throughout the Years Ended June 30 (except as noted) |
| Per-Share Data | Ratios and Supplemental Data |
| | | Income From Investment Operations: | Distributions From: | | | Ratio to Average Net Assets of: | | |
| | Net Asset Value, Beginning of Period | Net Investment Income (Loss)(1) | Net Realized and Unrealized Gain (Loss) | Total From Investment Operations | Net Investment Income | Net Realized Gains | Total Distributions | Net Asset Value, End of Period | Total Return(2) | Operating Expenses | Operating Expenses (excluding expenses on securities sold short) | Net Investment Income (Loss) | Portfolio Turnover Rate | Net Assets, End of Period (in thousands) |
| Investor Class |
| 2014 | $12.65 | 0.03 | 3.76 | 3.79 | (0.01) | (0.41) | (0.42) | $16.02 | 30.29% | 1.81% | 1.46% | 0.17% | 96% |
| $15,188 |
|
| 2013 | $10.86 | 0.04 | 1.81 | 1.85 | (0.06) | — | (0.06) | $12.65 | 17.15% | 1.87% | 1.46% | 0.42% | 100% |
| $8,597 |
|
2012(3) | $10.00 | (0.03) | 0.90 | 0.87 | (0.01) | — | (0.01) | $10.86 | 8.73% | 2.48%(4) | 1.47%(4) | (0.38)%(4) | 89% |
| $2,249 |
|
| Institutional Class |
| 2014 | $12.66 | 0.05 | 3.77 | 3.82 | (0.04) | (0.41) | (0.45) | $16.03 | 30.52% | 1.61% | 1.26% | 0.37% | 96% |
| $503 |
|
| 2013 | $10.87 | 0.09 | 1.79 | 1.88 | (0.09) | — | (0.09) | $12.66 | 17.37% | 1.67% | 1.26% | 0.62% | 100% |
| $383 |
|
2012(3) | $10.00 | (0.01) | 0.90 | 0.89 | (0.02) | — | (0.02) | $10.87 | 8.87% | 2.28%(4) | 1.27%(4) | (0.18)%(4) | 89% |
| $327 |
|
| A Class |
| 2014 | $12.63 | (0.01) | 3.76 | 3.75 | — | (0.41) | (0.41) | $15.97 | 29.99% | 2.06% | 1.71% | (0.08)% | 96% |
| $1,252 |
|
| 2013 | $10.85 | 0.04 | 1.78 | 1.82 | (0.04) | — | (0.04) | $12.63 | 16.79% | 2.12% | 1.71% | 0.17% | 100% |
| $654 |
|
2012(3) | $10.00 | (0.05) | 0.91 | 0.86 | (0.01) | — | (0.01) | $10.85 | 8.59% | 2.73%(4) | 1.72%(4) | (0.63)%(4) | 89% |
| $567 |
|
| C Class |
| 2014 | $12.53 | (0.12) | 3.71 | 3.59 | — | (0.41) | (0.41) | $15.71 | 28.94% | 2.81% | 2.46% | (0.83)% | 96% |
| $699 |
|
| 2013 | $10.80 | (0.05) | 1.78 | 1.73 | — | — | — | $12.53 | 16.02% | 2.87% | 2.46% | (0.58)% | 100% |
| $475 |
|
2012(3) | $10.00 | (0.09) | 0.89 | 0.80 | — | — | — | $10.80 | 8.00% | 3.48%(4) | 2.47%(4) | (1.38)%(4) | 89% |
| $332 |
|
|
| | | | | | | | | | | | | | | | |
| For a Share Outstanding Throughout the Years Ended June 30 (except as noted) |
| Per-Share Data | Ratios and Supplemental Data |
| | | Income From Investment Operations: | Distributions From: | | | Ratio to Average Net Assets of: | | |
| | Net Asset Value, Beginning of Period | Net Investment Income (Loss)(1) | Net Realized and Unrealized Gain (Loss) | Total From Investment Operations | Net Investment Income | Net Realized Gains | Total Distributions | Net Asset Value, End of Period | Total Return(2) | Operating Expenses | Operating Expenses (excluding expenses on securities sold short) | Net Investment Income (Loss) | Portfolio Turnover Rate | Net Assets, End of Period (in thousands) |
| R Class |
| 2014 | $12.62 | (0.05) | 3.75 | 3.70 | — | (0.41) | (0.41) | $15.91 | 29.61% | 2.31% | 1.96% | (0.33)% | 96% |
| $521 |
|
| 2013 | $10.83 | 0.01 | 1.79 | 1.80 | (0.01) | — | (0.01) | $12.62 | 16.62% | 2.37% | 1.96% | (0.08)% | 100% |
| $382 |
|
2012(3) | $10.00 | (0.06) | 0.89 | 0.83 | —(5) | — | —(5) | $10.83 | 8.34% | 2.98%(4) | 1.97%(4) | (0.88)%(4) | 89% |
| $326 |
|
|
|
| Notes to Financial Highlights |
| |
| (1) | Computed using average shares outstanding throughout the period. |
| |
| (2) | Total returns are calculated based on the net asset value of the last business day and do not reflect applicable sales charges, if any. Total returns for periods less than one year are not annualized. |
| |
| (3) | October 31, 2011 (fund inception) through June 30, 2012. |
| |
| (5) | Per-share amount was less than $0.005. |
See Notes to Financial Statements.
|
|
| Report of Independent Registered Public Accounting Firm |
To the Directors of the American Century Quantitative Equity Funds, Inc. and Shareholders of the Disciplined Growth Plus Fund:
In our opinion, the accompanying statement of assets and liabilities, including the schedule of investments, and the related statements of operations, of changes in net assets and of cash flows and the financial highlights present fairly, in all material respects, the financial position of the Disciplined Growth Plus Fund (one of the fifteen funds comprising the American Century Quantitative Equity Funds, Inc., hereafter referred to as the “Fund”) at June 30, 2014, the results of its operations and its cash flows for the year then ended, the changes in its net assets for each of the two years in the period then ended and the financial highlights for each of the periods presented, in conformity with accounting principles generally accepted in the United States of America. These financial statements and financial highlights (hereafter referred to as "financial statements") are the responsibility of the Fund's management. Our responsibility is to express an opinion on these financial statements based on our audits. We conducted our audits of these financial statements in accordance with the standards of the Public Company Accounting Oversight Board (United States). Those standards require that we plan and perform the audit to obtain reasonable assurance about whether the financial statements are free of material misstatement. An audit includes examining, on a test basis, evidence supporting the amounts and disclosures in the financial statements, assessing the accounting principles used and significant estimates made by management, and evaluating the overall financial statement presentation. We believe that our audits, which included confirmation of securities at June 30, 2014 by correspondence with the custodian and brokers, provide a reasonable basis for our opinion.
PricewaterhouseCoopers LLP
Kansas City, Missouri
August 21, 2014
Board of Directors
The individuals listed below serve as directors of the funds. Each director will continue to serve in this capacity until death, retirement, resignation or removal from office. The board has adopted a mandatory retirement age for directors who are not “interested persons,” as that term is defined in the Investment Company Act (independent directors). Independent directors shall retire on December 31 of the year in which they reach their 75th birthday; provided, however, that on or after January 1, 2022, independent directors shall retire on December 31 of the year in which they reach their 76th birthday.
Mr. Thomas is an “interested person” because he currently serves as President and Chief Executive Officer of American Century Companies, Inc. (ACC), the parent company of American Century Investment Management, Inc. (ACIM or the advisor). The other directors (more than three-fourths of the total number) are independent. They are not employees, directors or officers of, and have no financial interest in, ACC or any of its wholly owned, direct or indirect, subsidiaries, including ACIM, American Century Investment Services, Inc. (ACIS) and American Century Services, LLC (ACS), and do not have any other affiliations, positions or relationships that would cause them to be considered “interested persons” under the Investment Company Act. The directors serve in this capacity for eight (in the case of Mr. Thomas, 15) registered investment companies in the American Century Investments family of funds.
The following table presents additional information about the directors. The mailing address for each director other than Mr. Thomas is 1665 Charleston Road, Mountain View, California 94043. The mailing address for Mr. Thomas is 4500 Main Street, Kansas City, Missouri 64111.
|
| | | | | |
Name (Year of Birth) | Position(s) Held with Funds | Length of Time Served | Principal Occupation(s) During Past 5 Years | Number of
American
Century
Portfolios
Overseen
by Director | Other Directorships Held During Past 5 Years |
| Independent Directors |
Tanya S. Beder (1955) | Director | Since 2011 | Chairman, SBCC Group Inc. (independent advisory services) (2006 to present) | 42 | CYS Investments, Inc. (specialty finance company) |
Jeremy I. Bulow (1954) | Director | Since 2011 | Professor of Economics, Stanford University, Graduate School of Business (1979 to present) | 42 | None |
Ronald J. Gilson (1946) | Director and Chairman of the Board | Since 1995 (Chairman since 2005) | Charles J. Meyers Professor of Law and Business, Stanford Law School (1979 to present); Marc and Eva Stern Professor of Law and Business, Columbia University School of Law (1992 to present) | 42 | None |
|
| | | | | |
Name (Year of Birth) | Position(s) Held with Funds | Length of Time Served | Principal Occupation(s) During Past 5 Years | Number of
American
Century
Portfolios
Overseen
by Director | Other Directorships Held During Past 5 Years |
| Independent Directors |
Frederick L. A. Grauer (1946) | Director | Since 2008 | Senior Advisor, BlackRock, Inc. (investment management firm) (2010 to 2011); Senior Advisor, Barclays Global Investors (investment management firm) (2003 to 2009) | 42 | None |
Peter F. Pervere
(1947) | Director | Since 2007 | Retired | 42 | Intraware, Inc. (2003 to 2009) |
Myron S. Scholes(1) (1941) | Director | Since 1980 | Chairman, Platinum Grove Asset Management, L.P. (asset manager) (1999 to 2009); Frank E. Buck Professor of Finance-Emeritus, Stanford Graduate School of Business (1996 to present) | 42 | Dimensional Fund Advisors (investment advisor); CME Group, Inc. (futures and options exchange) |
John B. Shoven
(1947) | Director | Since 2002 | Professor of Economics, Stanford University (1973 to present) | 42 | Cadence Design Systems; Exponent; Financial Engines |
| Interested Director |
Jonathan S. Thomas
(1963) | Director and
President | Since 2007 | President and Chief Executive Officer, ACC (March 2007 to present). Also serves as Chief Executive Officer and Manager, ACS; Executive Vice President, ACIM; Director, ACC, ACIM and other ACC subsidiaries | 115 | None |
(1) Myron S. Scholes resigned as director effective July 31, 2014.
Officers
The following table presents certain information about the executive officers of the funds. Each officer serves as an officer for each of the 15 investment companies in the American Century family of funds, unless otherwise noted. No officer is compensated for his or her service as an officer of the funds. The listed officers are interested persons of the funds and are appointed or re-appointed on an annual basis. The mailing address for each of the officers listed below is 4500 Main Street, Kansas City, Missouri 64111.
|
| | |
Name (Year of Birth) | Offices with the Funds | Principal Occupation(s) During the Past Five Years |
Jonathan S. Thomas (1963) | Director and President since 2007 | President and Chief Executive Officer, ACC (March 2007 to present). Also serves as Chief Executive Officer and Manager, ACS; Executive Vice President, ACIM; Director, ACC, ACIM and other ACC subsidiaries |
| Amy D. Shelton (1964) | Chief Compliance Officer since 2014 | Chief Compliance Officer, American Century funds, (March 2014 to present); Chief Compliance Officer, ACIM (February 2014 to present); Chief Compliance Officer, ACIS (October 2009 to present); Vice President, Client Interactions and Marketing, ACIS (February 2013 to January 2014); Director, Client Interactions and Marketing, ACIS (June 2007 to January 2013). Also serves as Vice President, ACIS |
Charles A. Etherington (1957) | General Counsel since 2007 and Senior Vice President since 2006 | Attorney, ACC (February 1994 to present); Vice President, ACC (November 2005 to present); General Counsel, ACC (March 2007 to present). Also serves as General Counsel, ACIM, ACS, ACIS and other ACC subsidiaries; and Senior Vice President, ACIM and ACS |
C. Jean Wade (1964) | Vice President, Treasurer and Chief Financial Officer since 2012 | Vice President, ACS (February 2000 to present) |
Robert J. Leach (1966) | Vice President since 2006 and Assistant Treasurer since 2012 | Vice President, ACS (February 2000 to present) |
David H. Reinmiller (1963) | Vice President since 2001 | Attorney, ACC (January 1994 to present); Associate General Counsel, ACC (January 2001 to present). Also serves as Vice President, ACIM and ACS |
Ward D. Stauffer (1960) | Secretary since 2005 | Attorney, ACC (June 2003 to present) |
The Statement of Additional Information has additional information about the fund’s directors and is available without charge, upon request, by calling 1-800-345-2021.
|
|
| Approval of Management Agreement |
At a meeting held on June 13, 2014, the Fund’s Board of Directors/Trustees unanimously approved the renewal of the management agreement pursuant to which American Century Investment Management, Inc. (the “Advisor”) acts as the investment advisor for the Fund. Under Section 15(c) of the Investment Company Act, contracts for investment advisory services are required to be reviewed, evaluated, and approved by a majority of a fund’s directors/trustees (the “Directors”), including a majority of the independent Directors, each year. The Board regards this annual evaluation and renewal as one of its most important responsibilities.
The independent Directors have memorialized a statement regarding the relationship between their ongoing obligations to oversee and evaluate the performance of the Advisor and their annual consideration of renewal of the management agreement. In that statement, the independent Directors noted that their assessment of the Advisor’s performance is an ongoing process that takes place over the entire year and is informed by all of the extensive information that the Board and its committees receive and consider over time. This information, together with the materials provided in connection with the review, are central to the Board’s assessment of the Advisor’s performance and its determination whether to renew the Fund’s management agreement.
Prior to its consideration of the renewal of the management agreement, the Board requested and reviewed extensive data and analysis relating to the proposed renewal. This information and analysis was compiled by the Advisor and certain independent providers of evaluation data concerning the Fund and the services provided to the Fund by the Advisor.
In connection with its consideration of the renewal of the management agreement, the Board’s review and evaluation of the services provided by the Advisor included, but was not limited to, the following:
| |
| • | the nature, extent, and quality of investment management, shareholder services, and other services provided by the Advisor to the Fund; |
| |
| • | the wide range of other programs and services the Advisor provides to the Fund and its shareholders on a routine and non-routine basis; |
| |
| • | the investment performance of the Fund, including data comparing the Fund’s performance to appropriate benchmarks and/or a peer group of other mutual funds with similar investment objectives and strategies; |
| |
| • | the cost of owning the Fund compared to the cost of owning similar funds; |
| |
| • | the Advisor’s compliance policies, procedures, and regulatory experience; |
| |
| • | financial data showing the cost of services provided to the Fund, the profitability of the Fund to the Advisor, and the overall profitability of the Advisor; |
| |
| • | possible economies of scale associated with the Advisor’s management of the Fund and other accounts under its management; |
| |
| • | data comparing services provided and charges to other investment management clients of the Advisor; and |
| |
| • | any collateral benefits derived by the Advisor from the management of the Fund. |
In keeping with its practice, the Board held two in-person meetings to review and discuss the information provided. The independent Directors also had the benefit of the advice of their independent counsel throughout the process.
Factors Considered
The Directors considered all of the information provided by the Advisor, the independent data providers, and the independent Directors’ independent counsel in connection with the review, and evaluated such information for the Fund. In connection with their review, the Directors did not identify any single factor as being all-important or controlling and each Director may have attributed
different levels of importance to different factors. In deciding to renew the management agreement, the Board based its decision on a number of factors, including the following:
Nature, Extent and Quality of Services — Generally. Under the management agreement, the Advisor is responsible for providing or arranging for all services necessary for the operation of the Fund. The Board noted that under the management agreement, the Advisor provides or arranges at its own expense a wide variety of services including:
| |
| • | constructing and designing the Fund |
| |
| • | portfolio research and security selection |
| |
| • | initial capitalization/funding |
| |
| • | daily valuation of the Fund’s portfolio |
| |
| • | shareholder servicing and transfer agency, including shareholder confirmations, recordkeeping, and communications |
| |
| • | regulatory and portfolio compliance |
| |
| • | marketing and distribution |
The Board noted that many of these services have expanded over time both in terms of quantity and complexity in response to shareholder demands, competition in the industry, changing distribution channels, and the changing regulatory environment.
Investment Management Services. The nature of the investment management services provided to the Fund is quite complex and allows Fund shareholders access to professional money management, instant diversification of their investments within an asset class, the opportunity to easily diversify among asset classes by investing in or exchanging among various American Century Investments funds, and liquidity. In evaluating investment performance, the Board expects the Advisor to manage the Fund in accordance with its investment objectives and approved strategies. Further, the Directors recognize that the Advisor has an obligation to seek the best execution of fund trades. In providing these services, the Advisor utilizes teams of investment professionals (portfolio managers, analysts, research assistants, and securities traders) who require extensive information technology, research, training, compliance and other systems to conduct their business. The Board, directly and through its Portfolio Committee, regularly reviews investment performance information for the Fund, together with comparative information for appropriate benchmarks and/or peer groups of similarly-managed funds, over different time horizons. The Directors also review detailed performance information during the management agreement approval process. If performance concerns are identified, the Fund receives special reviews until performance improves, during which the Board discusses with the Advisor the reasons for such results (e.g., market conditions, security selection) and any efforts being undertaken to improve performance. The Fund’s performance was above its benchmark for the one-year period reviewed by the Board. The Board found the investment management services provided by the Advisor to the Fund to be satisfactory and consistent with the management agreement.
Shareholder and Other Services. Under the management agreement, the Advisor provides the Fund with a comprehensive package of transfer agency, shareholder, and other services. The Board, directly and through various committees of the Board, regularly reviews reports and evaluations of such services at its regular meetings. These reports include, but are not limited to, information regarding the operational efficiency and accuracy of the shareholder and transfer agency services provided, staffing levels, shareholder satisfaction (as measured by external as well as internal sources), technology support, new products and services offered to Fund shareholders, securities trading activities, portfolio valuation services, auditing services, and legal and operational compliance activities. Certain aspects of shareholder and transfer agency service level efficiency
and the quality of securities trading activities are measured by independent third party providers and are presented in comparison to other fund groups not managed by the Advisor. The Board found the services provided by the Advisor to the Fund under the management agreement to be competitive and of high quality.
Costs of Services and Profitability. The Advisor provides detailed information concerning its cost of providing various services to the Fund, its profitability in managing the Fund, its overall profitability, and its financial condition. The Directors have reviewed with the Advisor the methodology used to prepare this financial information. The financial information regarding the Advisor is considered in evaluating the Advisor’s financial condition, its ability to continue to provide services under the management agreement, and the reasonableness of the current management fee. The Board concluded that the Advisor’s profits were reasonable in light of the services provided to the Fund.
Ethics. The Board generally considers the Advisor’s commitment to providing quality services to shareholders and to conducting its business ethically. They noted that the Advisor’s practices generally meet or exceed industry best practices.
Economies of Scale. The Board also reviewed information provided by the Advisor regarding the possible existence of economies of scale in connection with the management of the Fund. The Board concluded that economies of scale are difficult to measure and predict with precision, especially on a fund-by-fund basis. The Board concluded that the Advisor is appropriately sharing economies of scale through its competitive fee structure, offering competitive fees from fund inception, and through reinvestment in its business to provide shareholders additional content and services.
Comparison to Other Funds’ Fees. The management agreement provides that the Fund pays the Advisor a single, all-inclusive (or unified) management fee for providing all services necessary for the management and operation of the Fund, other than brokerage expenses, taxes, interest, extraordinary expenses, and the fees and expenses of the Fund’s independent directors (including their independent legal counsel) and expenses incurred in connection with the provision of shareholder services and distribution services under a plan adopted pursuant to Rule 12b-1 under the 1940 Act. Under the unified fee structure, the Advisor is responsible for providing all investment advisory, custody, audit, administrative, compliance, recordkeeping, marketing and shareholder services, or arranging and supervising third parties to provide such services. By contrast, most other funds are charged a variety of fees, including an investment advisory fee, a transfer agency fee, an administrative fee, distribution charges and other expenses. Other than their investment advisory fees and any applicable Rule 12b-1 distribution fees, all other components of the total fees charged by these other funds may be increased without shareholder approval. The Board believes the unified fee structure is a benefit to Fund shareholders because it clearly discloses to shareholders the cost of owning Fund shares, and, since the unified fee cannot be increased without a vote of Fund shareholders, it shifts to the Advisor the risk of increased costs of operating the Fund and provides a direct incentive to minimize administrative inefficiencies. Part of the Board’s analysis of fee levels involves reviewing certain evaluative data compiled by an independent provider and comparing the Fund’s unified fee to the total expense ratio of other funds in the Fund’s peer group. The unified fee charged to shareholders of the Fund was at the median of the total expense ratios of the Fund’s peer universe. The Board concluded that the management fee paid by the Fund to the Advisor under the management agreement is reasonable in light of the services provided to the Fund.
Comparison to Fees and Services Provided to Other Clients of the Advisor. The Board also requested and received information from the Advisor concerning the nature of the services, fees, costs and profitability of its advisory services to advisory clients other than the Fund. They observed that these varying types of client accounts require different services and involve different regulatory and entrepreneurial risks than the management of the Fund. The Board analyzed this information and concluded that the fees charged and services provided to the Fund were reasonable by comparison.
Collateral or “Fall-Out” Benefits Derived by the Advisor. The Board considered the existence of collateral benefits the Advisor may receive as a result of its relationship with the Fund. They concluded that the Advisor’s primary business is managing mutual funds and it generally does not use fund or shareholder information to generate profits in other lines of business, and therefore does not derive any significant collateral benefits from them. The Board noted that the Advisor receives proprietary research from broker-dealers that execute fund portfolio transactions and concluded that this research is likely to benefit Fund shareholders. The Board also determined that the Advisor is able to provide investment management services to certain clients other than the Fund, at least in part, due to its existing infrastructure built to serve the fund complex. The Board concluded, however, that the assets of those other clients are not material to the analysis and, where applicable, may be included with the assets of the Fund to determine breakpoints in the management fee schedule.
Existing Relationship. The Board also considered whether there was any reason for not continuing the existing arrangement with the Advisor. In this regard, the Board was mindful of the potential disruptions of the Fund’s operations and various risks, uncertainties, and other effects that could occur as a result of a decision not to continue such relationship. In particular, the Board recognized that most shareholders have invested in the Fund on the strength of the Advisor’s industry standing and reputation and in the expectation that the Advisor will have a continuing role in providing advisory services to the Fund.
Conclusion of the Directors. As a result of this process, the Board, including all of the independent Directors and assisted by the advice of independent legal counsel, taking into account all of the factors discussed above and the information provided by the Advisor and others, concluded that the management agreement between the Fund and the Advisor is fair and reasonable in light of the services provided and should be renewed.
Retirement Account Information
As required by law, distributions you receive from certain IRAs are subject to federal income tax withholding, unless you elect not to have withholding apply. Tax will be withheld on the total amount withdrawn even though you may be receiving amounts that are not subject to withholding, such as nondeductible contributions. In such case, excess amounts of withholding could occur. You may adjust your withholding election so that a greater or lesser amount will be withheld.
If you don’t want us to withhold on this amount, you must notify us to not withhold the federal income tax. You may notify us in writing or in certain situations by telephone or through other electronic means. For systematic withdrawals, your withholding election will remain in effect until revoked or changed by filing a new election. You have the right to revoke your election at any time.
Remember, even if you elect not to have income tax withheld, you are liable for paying income tax on the taxable portion of your withdrawal. If you elect not to have income tax withheld or you don’t have enough income tax withheld, you may be responsible for payment of estimated tax. You may incur penalties under the estimated tax rules if your withholding and estimated tax payments are not sufficient. You can reduce or defer the income tax on a distribution by directly or indirectly rolling such distribution over to another IRA or eligible plan. You should consult your tax advisor for additional information.
State tax will be withheld if, at the time of your distribution, your address is within one of the mandatory withholding states and you have federal income tax withheld (or as otherwise required by state law). State taxes will be withheld from your distribution in accordance with the respective state rules.
Distributions you receive from 403(b), 457 and qualified plans are subject to special tax and withholding rules. Your plan administrator or plan sponsor is required to provide you with a special tax notice explaining those rules at the time you request a distribution. If applicable, federal and/or state taxes may be withheld from your distribution amount.
Proxy Voting Policies
Descriptions of the principles and policies that the fund's investment advisor uses in exercising the voting rights associated with the securities purchased and/or held by the fund are available without charge, upon request, by calling 1-800-345-2021 or visiting the "About Us" page of American Century Investments’ website at americancentury.com. A description of the policies is also available on the Securities and Exchange Commission’s website at sec.gov. Information regarding how the investment advisor voted proxies relating to portfolio securities during the most recent 12-month period ended June 30 is available on the "About Us" page at americancentury.com. It is also available at sec.gov.
Quarterly Portfolio Disclosure
The fund files its complete schedule of portfolio holdings with the Securities and Exchange Commission (SEC) for the first and third quarters of each fiscal year on Form N-Q. The fund’s Forms N-Q are available on the SEC’s website at sec.gov, and may be reviewed and copied at the SEC’s Public Reference Room in Washington, DC. Information on the operation of the Public Reference Room may be obtained by calling 1-800-SEC-0330. The fund also makes its complete schedule of portfolio holdings for the most recent quarter of its fiscal year available on its website at americancentury.com and, upon request, by calling 1-800-345-2021.
Other Tax Information
The following information is provided pursuant to provisions of the Internal Revenue Code.
The fund hereby designates up to the maximum amount allowable as qualified dividend income for the fiscal year ended June 30, 2014.
For corporate taxpayers, the fund hereby designates $84,724, or up to the maximum amount allowable, of ordinary income distributions paid during the fiscal year ended June 30, 2014 as qualified for the corporate dividends received deduction.
The fund hereby designates $88,796 as qualified short-term capital gain distributions for purposes of Internal Revenue Code Section 871.
The fund hereby designates $403,199, or up to the maximum amount allowable, as long-term capital gain distributions for the fiscal year ended June 30, 2014.
The fund utilized earnings and profits of $94,376 distributed to shareholders on redemption of shares as part of the dividends paid deduction (tax equalization).
|
| | |
| |
| | | |
| Contact Us | americancentury.com | |
| Automated Information Line | 1-800-345-8765 | |
| Investor Services Representative | 1-800-345-2021
or 816-531-5575 | |
| Investors Using Advisors | 1-800-378-9878 | |
Business, Not-For-Profit, Employer-Sponsored
Retirement Plans | 1-800-345-3533 | |
Banks and Trust Companies, Broker-Dealers,
Financial Professionals, Insurance Companies | 1-800-345-6488 | |
| Telecommunications Relay Service for the Deaf | 711 | |
| | | |
| American Century Quantitative Equity Funds, Inc. | |
| | | |
Investment Advisor: American Century Investment Management, Inc. Kansas City, Missouri | |
| | | |
| This report and the statements it contains are submitted for the general information of our shareholders. The report is not authorized for distribution to prospective investors unless preceded or accompanied by an effective prospectus. | |
| | | |
©2014 American Century Proprietary Holdings, Inc. All rights reserved.
CL-ANN-82892 1408 | |
|
| |
ANNUAL REPORT | JUNE 30, 2014 |
Emerging Markets Value Fund
|
| |
| President's Letter | |
| Performance | |
| Portfolio Commentary | |
| Fund Characteristics | |
| Shareholder Fee Example | |
| Schedule of Investments | |
| Statement of Assets and Liabilities | |
| Statement of Operations | |
| Statement of Changes in Net Assets | |
| Notes to Financial Statements | |
| Financial Highlights | |
| Report of Independent Registered Public Accounting Firm | |
| Management | |
| Approval of Management Agreement | |
| Additional Information | |
Any opinions expressed in this report reflect those of the author as of the date of the report, and do not necessarily represent the opinions of American Century Investments® or any other person in the American Century Investments organization. Any such opinions are subject to change at any time based upon market or other conditions and American Century Investments disclaims any responsibility to update such opinions. These opinions may not be relied upon as investment advice and, because investment decisions made by American Century Investments funds are based on numerous factors, may not be relied upon as an indication of trading intent on behalf of any American Century Investments fund. Security examples are used for representational purposes only and are not intended as recommendations to purchase or sell securities. Performance information for comparative indices and securities is provided to American Century Investments by third party vendors. To the best of American Century Investments’ knowledge, such information is accurate at the time of printing.
|
| |
| Dear Investor:
Thank you for reviewing this annual report for the eight months from the fund’s inception on October 31, 2013, to June 30, 2014. It provides our macro overview of the period (below), followed by fund performance, portfolio manager commentary, a schedule of fund investments, and other financial information.
For additional commentary and updated information on fund performance, key factors that affected asset returns, and other insights regarding the investment markets, we encourage you to visit our website, americancentury.com.
|
| Jonathan Thomas |
Emerging Markets Value Stocks Lagged
Generally favorable conditions—particularly in the form of aggressive monetary stimulus by central banks, low inflation, and low costs of capital—combined with expectations for improving economic conditions as 2014 progresses, produced generally positive investment performance across most broad asset classes during the eight-month reporting period. In the U.S., the S&P 500® Index gained 13.20% and the Barclays U.S. Aggregate Bond Index advanced 2.95%. In non-U.S. developed markets, the MSCI EAFE Index gained 7.16%, while the Barclays Global Treasury ex-U.S. Bond Index advanced 3.39%.
However, emerging markets (EM) equity indices lagged other equity categories, and EM value stocks lagged in particular. The MSCI Emerging Markets Index gained 3.07% during the reporting period, while the MSCI Emerging Markets Value Index advanced 2.48%. While supported by the broader equity market rallies, EM stocks were negatively affected by the U.S. Federal Reserve’s decision to taper its monthly bond buying program (expected to lead to higher U.S. interest rates, drawing capital away from typically higher-yielding EM investments) and by geopolitical uncertainties and conflicts in several regions.
Looking ahead, we still see signs of potential global economic improvement in the second half of 2014 as central banks continue to provide extraordinary levels of monetary stimulus, but headwinds persist and geopolitical tensions remain a wildcard. Inflation pressures are starting to build in the U.S., interest rates could rise, and geopolitics could disrupt oil trading and other markets. In this environment, we continue to believe in a disciplined, diversified, long-term investment approach, using professionally managed stock and bond portfolios—as appropriate—for meeting financial goals. We appreciate your continued trust in us.
Sincerely,
Jonathan Thomas
President and Chief Executive Officer
American Century Investments
|
| | | |
| Total Returns as of June 30, 2014 | | |
| | Ticker Symbol | Since Inception(1) | Inception Date |
Investor Class(2) | AEVVX | 0.40% | 10/31/13 |
| MSCI Emerging Markets Value Index | — | 2.48% | — |
| MSCI Emerging Markets Index | — | 3.07% | — |
Institutional Class(2) | AEVNX | 0.60% | 10/31/13 |
A Class(2) | AEVLX | | 10/31/13 |
| No sales charge* | | 0.30% | |
| With sales charge* | | -5.47% | |
C Class(2) | AEVTX | | 10/31/13 |
| No sales charge* | | -0.20% | |
| With sales charge* | | -1.20% | |
R Class(2) | AEVRX | 0.10% | 10/31/13 |
| |
| * | Sales charges include initial sales charges and contingent deferred sales charges (CDSCs), as applicable. A Class shares have a 5.75% maximum initial sales charge and may be subject to a maximum CDSC of 1.00%. C Class shares redeemed within 12 months of purchase are subject to a maximum CDSC of 1.00%. The SEC requires that mutual funds provide performance information net of maximum sales charges in all cases where charges could be applied. |
| |
| (1) | Total returns for periods less than one year are not annualized. |
| |
| (2) | Returns would have been lower if a portion of the management fee had not been waived. |
Data presented reflect past performance. Past performance is no guarantee of future results. Current performance may be higher or lower than the performance shown. Investment return and principal value will fluctuate, and redemption value may be more or less than original cost. To obtain performance data current to the most recent month end, please call 1-800-345-2021 or visit americancentury.com. International investing involves special risks, such as political instability and currency fluctuations. Investing in emerging markets may accentuate these risks.
Unless otherwise indicated, performance reflects Investor Class shares; performance for other share classes will vary due to differences in fee structure. For information about other share classes available, please consult the prospectus. Data assumes reinvestment of dividends and capital gains, and none of the charts reflect the deduction of taxes that a shareholder would pay on fund distributions or the redemption of fund shares. Returns for the indices are provided for comparison. The fund’s total returns include operating expenses (such as transaction costs and management fees) that reduce returns, while the total returns of the indices do not.
|
|
| Growth of $10,000 Over Life of Class |
| $10,000 investment made October 31, 2013 |
|
| |
| Value on June 30, 2014 |
| | Investor Class — $10,040** |
| |
| | MSCI Emerging Markets Value Index — $10,248 |
| |
| | MSCI Emerging Markets Index — $10,307 |
| |
* From October 31, 2013, the Investor Class’s inception date. Not annualized.
**Ending value would have been lower if a portion of the management fee had not been waived.
|
| | | | |
| Total Annual Fund Operating Expenses |
| Investor Class | Institutional Class | A Class | C Class | R Class |
| 1.53% | 1.33% | 1.78% | 2.53% | 2.03% |
The total annual fund operating expenses shown is as stated in the fund’s prospectus current as of the date of this report. The prospectus may vary from the expense ratio shown elsewhere in this report because it is based on a different time period, includes acquired fund fees and expenses, and, if applicable, does not include fee waivers or expense reimbursements.
Data presented reflect past performance. Past performance is no guarantee of future results. Current performance may be higher or lower than the performance shown. Investment return and principal value will fluctuate, and redemption value may be more or less than original cost. To obtain performance data current to the most recent month end, please call 1-800-345-2021 or visit americancentury.com. International investing involves special risks, such as political instability and currency fluctuations. Investing in emerging markets may accentuate these risks.
Unless otherwise indicated, performance reflects Investor Class shares; performance for other share classes will vary due to differences in fee structure. For information about other share classes available, please consult the prospectus. Data assumes reinvestment of dividends and capital gains, and none of the charts reflect the deduction of taxes that a shareholder would pay on fund distributions or the redemption of fund shares. Returns for the indices are provided for comparison. The fund’s total returns include operating expenses (such as transaction costs and management fees) that reduce returns, while the total returns of the indices do not.
Portfolio Managers: Elizabeth Xie, Yulin Long, and Vinod Chandrashekaran
Performance Summary
Emerging Markets Value returned 0.40%* for the eight-month period ended June 30, 2014, compared with the 2.48% return of the fund’s benchmark, the MSCI Emerging Markets Value Index.
In a volatile year for emerging markets equities, Emerging Markets Value produced a slight gain, but underperformed the MSCI Emerging Markets Value Index. The fund’s stock selection process incorporates factors of valuation, quality, growth, and momentum (sentiment) while striving to minimize unintended risks along industries and other risk characteristics. The fund's insights of valuation and quality proved unsuccessful during the period, weighing on results. Momentum-based insights added value, but were unable to offset weakness in the other factors. Security selection was the primary factor behind the fund’s underperformance relative to the index, particularly in the financials and consumer discretionary sectors. Information technology and utilities holdings contributed to relative results. From a regional perspective, India-based holdings were leading detractors while stock selection in Taiwan and Turkey contributed to gains.
Financials Sector Leading Detractor
Security selection in the financials sector largely drove relative underperformance. Emerging market bank holdings declined during the first half of the period amid uncertainty surrounding the U.S. Federal Reserve’s tapering of quantitative easing, which led to excess volatility throughout the industry. In the fund, several South American banks were key detractors from returns. These included Brazil-based Banco do Estado do Rio Grande do Sul and Banco Santander Brasil, and Chile-based Banco de Chile. The fund subsequently exited its stake in Banco Santander Brasil.
Elsewhere in the sector, the fund’s overweight to the insurance industry, which underperformed the index, also weighed on results.
The consumer discretionary sector was another area of weakness. Stock selection in automobiles and overweight positioning in the textiles, apparel, and luxury goods industry, which declined, hurt the fund’s performance. Sector underperformers included Taiwan-based Pou Chen Corp., an original equipment manufacturer of athletic shoes for companies such as Nike, Adidas, and Reebok. The company’s stock fell in May when a Vietnamese subsidiary halted production amid anti-China protests.
Key individual holdings that diminished returns included Hanwha Corp., a Korea-based distributor of chemical products, whose stock declined over the course of the reporting period. The fund’s underweight position in Taiwan-based Hon Hai Precision Industry, a manufacturer of computers and consumer electronic products, also imparted a negative impact. The company’s stock strongly appreciated following an announcement of a merger agreement with Asia Pacific Telecom.
*All fund returns referenced in this commentary are for Investor Class shares. Total returns for periods less
than one year are not annualized. Returns would have been lower if a portion of the management fee had not
been waived. Performance for other share classes will vary due to differences in fee structure; when Investor
Class performance exceeds that of the fund's benchmark, other share classes may not. See page 3 for
returns for all share classes.
Information Technology and Utilities Sectors Main Relative Outperfomers
Prominent relative contribution to performance came from security selection among the fund’s information technology holdings. Successful stock picks in the computers and peripherals industry, as well as overweight positioning relative to the benchmark, added value. Leading outperformers here included Taiwan-based Catcher Technology Co., a manufacturer of casings and components for computer and consumer electronics products, whose stock rallied nearly 60% during the year. Overweight exposure to a number of Taiwan-based semiconductor manufacturers also proved beneficial. A portfolio-only position in Vanguard International Semiconductor bolstered the fund’s performance thanks to strong appreciation.
Positioning and security selection in the independent power and renewable electricity producers industry drove outperformance in the utilities sector. An overweight position to outperforming Brazil-based electricity provider Cia Energetica de Sao Paulo added to relative returns. Other main individual contributors included Turkey-based Eregli Demir ve Celik Fabrikalari, a manufacturer of iron and steel. The company’s share price rose nearly 45% on strong profit margin and operating cashflow expectations.
A Look Ahead
We believe that global economic growth will continue to progress, albeit at a slower pace than during prior post-recessionary periods, and we expect it to stay the course through the remainder of 2014. Likewise, we think that the strengthening recovery of developed markets is likely to positively impact emerging markets as well. Though a continuation of political instability in several emerging markets could lead to heightened levels of market volatility, our disciplined, objective, and systematic investment strategy is designed to take advantage of opportunities at the individual company level. We believe this approach is the most powerful way to capitalize on market inefficiencies that lead to the mispricing of individual stocks.
|
| |
| JUNE 30, 2014 | |
| Top Ten Holdings | % of net assets |
| China Construction Bank Corp., H Shares | 3.1% |
| iShares MSCI India ETF | 3.0% |
| Sasol Ltd. | 2.6% |
| Petroleo Brasileiro SA Preference Shares ADR | 2.2% |
| Industrial & Commercial Bank of China Ltd., H Shares | 2.2% |
| China Mobile Ltd. | 2.1% |
| Gazprom OAO ADR | 2.0% |
| Infosys Ltd. ADR | 1.6% |
| Samsung Electronics Co. Ltd. | 1.5% |
| Kia Motors Corp. | 1.5% |
|
| |
| Types of Investments in Portfolio | % of net assets |
| Foreign Common Stocks | 93.6% |
| Exchange-Traded Funds | 4.7% |
| Rights | —* |
| Total Equity Exposure | 98.3% |
| Temporary Cash Investments | 1.1% |
| Other Assets and Liabilities | 0.6% |
*Category is less than 0.05% of total net assets.
|
| |
| Investments by Country | % of net assets |
| China | 17.3% |
| South Korea | 14.9% |
| Brazil | 11.2% |
| Taiwan | 10.8% |
| South Africa | 7.3% |
| Russia | 5.3% |
| Mexico | 4.1% |
| India | 4.0% |
| Malaysia | 3.2% |
| Indonesia | 2.8% |
| Turkey | 2.7% |
| Thailand | 2.6% |
| Other Countries | 7.4% |
| Exchange-Traded Funds | 4.7% |
| Cash and Equivalents** | 1.7% |
**Includes temporary cash investments and other assets and liabilities.
Fund shareholders may incur two types of costs: (1) transaction costs, including sales charges (loads) on purchase payments and redemption/exchange fees; and (2) ongoing costs, including management fees; distribution and service (12b-1) fees; and other fund expenses. This example is intended to help you understand your ongoing costs (in dollars) of investing in your fund and to compare these costs with the ongoing cost of investing in other mutual funds.
The example is based on an investment of $1,000 made at the beginning of the period and held for the entire period from January 1, 2014 to June 30, 2014.
Actual Expenses
The table provides information about actual account values and actual expenses for each class. You may use the information, together with the amount you invested, to estimate the expenses that you paid over the period. First, identify the share class you own. Then simply divide your account value by $1,000 (for example, an $8,600 account value divided by $1,000 = 8.6), then multiply the result by the number under the heading “Expenses Paid During Period” to estimate the expenses you paid on your account during this period.
If you hold Investor Class shares of any American Century Investments fund, or Institutional Class shares of the American Century Diversified Bond Fund, in an American Century Investments account (i.e., not a financial intermediary or retirement plan account), American Century Investments may charge you a $12.50 semiannual account maintenance fee if the value of those shares is less than $10,000. We will redeem shares automatically in one of your accounts to pay the $12.50 fee. In determining your total eligible investment amount, we will include your investments in all personal accounts (including American Century Investments Brokerage accounts) registered under your Social Security number. Personal accounts include individual accounts, joint accounts, UGMA/UTMA accounts, personal trusts, Coverdell Education Savings Accounts and IRAs (including traditional, Roth, Rollover, SEP-, SARSEP- and SIMPLE-IRAs), and certain other retirement accounts. If you have only business, business retirement, employer-sponsored or American Century Investments Brokerage accounts, you are currently not subject to this fee. If you are subject to the Account Maintenance Fee, your account value could be reduced by the fee amount.
Hypothetical Example for Comparison Purposes
The table also provides information about hypothetical account values and hypothetical expenses based on the actual expense ratio of each class of your fund and an assumed rate of return of 5% per year before expenses, which is not the actual return of a fund’s share class. The hypothetical account values and expenses may not be used to estimate the actual ending account balance or expenses you paid for the period. You may use this information to compare the ongoing costs of investing in your fund and other funds. To do so, compare this 5% hypothetical example with the 5% hypothetical examples that appear in the shareholder reports of the other funds.
Please note that the expenses shown in the table are meant to highlight your ongoing costs only and do not reflect any transactional costs, such as sales charges (loads) or redemption/exchange fees. Therefore, the table is useful in comparing ongoing costs only, and will not help you determine the relative total costs of owning different funds. In addition, if these transactional costs were included, your costs would have been higher.
|
| | | | |
| | Beginning
Account Value
1/1/14 | Ending
Account Value
6/30/14 | Expenses Paid
During Period(1)
1/1/14 - 6/30/14 | Annualized
Expense Ratio(1) |
| Actual | | | | |
| Investor Class (after waiver) | $1,000 | $1,039.30 | $7.38 | 1.46% |
| Investor Class (before waiver) | $1,000 | $1,039.30(2) | $7.74 | 1.53% |
| Institutional Class (after waiver) | $1,000 | $1,041.40 | $6.38 | 1.26% |
| Institutional Class (before waiver) | $1,000 | $1,041.40(2) | $6.73 | 1.33% |
| A Class (after waiver) | $1,000 | $1,038.30 | $8.64 | 1.71% |
| A Class (before waiver) | $1,000 | $1,038.30(2) | $9.00 | 1.78% |
| C Class (after waiver) | $1,000 | $1,035.30 | $12.41 | 2.46% |
| C Class (before waiver) | $1,000 | $1,035.30(2) | $12.77 | 2.53% |
| R Class (after waiver) | $1,000 | $1,037.30 | $9.90 | 1.96% |
| R Class (before waiver) | $1,000 | $1,037.30(2) | $10.25 | 2.03% |
| Hypothetical | | | | |
| Investor Class (after waiver) | $1,000 | $1,017.56 | $7.30 | 1.46% |
| Investor Class (before waiver) | $1,000 | $1,017.21 | $7.65 | 1.53% |
| Institutional Class (after waiver) | $1,000 | $1,018.55 | $6.31 | 1.26% |
| Institutional Class (before waiver) | $1,000 | $1,018.20 | $6.66 | 1.33% |
| A Class (after waiver) | $1,000 | $1,016.32 | $8.55 | 1.71% |
| A Class (before waiver) | $1,000 | $1,015.97 | $8.90 | 1.78% |
| C Class (after waiver) | $1,000 | $1,012.60 | $12.28 | 2.46% |
| C Class (before waiver) | $1,000 | $1,012.25 | $12.62 | 2.53% |
| R Class (after waiver) | $1,000 | $1,015.08 | $9.79 | 1.96% |
| R Class (before waiver) | $1,000 | $1,014.73 | $10.14 | 2.03% |
| |
| (1) | Expenses are equal to the class's annualized expense ratio listed in the table above, multiplied by the average account value over the period, multiplied by 181, the number of days in the most recent fiscal half-year, divided by 365, to reflect the one-half year period. |
| |
| (2) | Ending account value assumes the return earned after waiver and would have been lower if a portion of the management fee had not been waived. |
JUNE 30, 2014
|
| | | | | |
| | Shares | Value |
| COMMON STOCKS — 93.6% | | |
| BRAZIL — 11.2% | | |
| AES Tiete SA Preference Shares | 5,400 |
| $ | 47,658 |
|
| Banco do Brasil SA | 6,100 |
| 68,468 |
|
| Banco do Estado do Rio Grande do Sul SA Preference Shares | 7,300 |
| 35,517 |
|
| Cia Brasileira de Distribuicao Grupo Pao de Acucar ADR | 700 |
| 32,431 |
|
| Cia de Saneamento Basico do Estado de Sao Paulo ADR | 2,000 |
| 21,440 |
|
| Cia Energetica de Minas Gerais ADR | 7,184 |
| 57,400 |
|
| Cia Energetica de Sao Paulo Preference Shares | 5,300 |
| 66,517 |
|
| Cia Siderurgica Nacional SA ADR | 2,600 |
| 11,076 |
|
| Petroleo Brasileiro SA Preference Shares ADR | 8,812 |
| 137,820 |
|
| Porto Seguro SA | 1,800 |
| 25,711 |
|
| Souza Cruz SA | 4,400 |
| 45,643 |
|
| Telefonica Brasil SA ADR | 500 |
| 10,255 |
|
| Ultrapar Participacoes SA | 800 |
| 18,907 |
|
| Vale SA ADR | 4,800 |
| 63,504 |
|
Via Varejo SA(1) | 5,300 |
| 58,889 |
|
| | | 701,236 |
|
| CHILE — 1.8% | | |
| Banco de Chile | 491,627 |
| 65,367 |
|
| Banco de Credito e Inversiones | 490 |
| 28,345 |
|
| Corpbanca SA | 1,668,036 |
| 20,601 |
|
| | | 114,313 |
|
| CHINA — 17.3% | | |
| Agricultural Bank of China Ltd., H Shares | 164,000 |
| 72,368 |
|
| Anhui Conch Cement Co. Ltd., H Shares | 14,500 |
| 49,765 |
|
| ANTA Sports Products Ltd. | 14,000 |
| 22,254 |
|
| Bank of China Ltd., H Shares | 184,000 |
| 82,380 |
|
| China BlueChemical Ltd., H Shares | 102,000 |
| 55,669 |
|
| China CITIC Bank Corp. Ltd., H Shares | 28,000 |
| 16,980 |
|
| China Construction Bank Corp., H Shares | 253,000 |
| 191,291 |
|
| China Merchants Bank Co. Ltd., H Shares | 34,000 |
| 67,031 |
|
| China Mobile Ltd. | 13,500 |
| 130,987 |
|
| China Petroleum & Chemical Corp., H Shares | 28,000 |
| 26,698 |
|
| CNOOC Ltd. | 15,000 |
| 26,941 |
|
| Country Garden Holdings Co. | 26,000 |
| 10,332 |
|
| GOME Electrical Appliances Holding Ltd. | 111,000 |
| 18,189 |
|
| Greentown China Holdings Ltd. | 5,000 |
| 4,993 |
|
| Haitian International Holdings Ltd. | 8,000 |
| 18,683 |
|
| Huaneng Power International, Inc., H Shares | 34,000 |
| 38,385 |
|
|
| | | | | |
| | Shares | Value |
| Industrial & Commercial Bank of China Ltd., H Shares | 217,000 |
| $ | 137,193 |
|
| Jiangsu Expressway Co. Ltd., H Shares | 16,000 |
| 18,931 |
|
| PetroChina Co. Ltd., H Shares | 12,000 |
| 15,158 |
|
| Shanghai Electric Group Co. Ltd., H Shares | 136,000 |
| 54,748 |
|
| Shougang Fushan Resources Group Ltd. | 50,000 |
| 10,258 |
|
| SOHO China Ltd. | 22,500 |
| 17,738 |
|
| | | 1,086,972 |
|
| COLOMBIA — 1.1% | | |
Cemex Latam Holdings SA(1) | 2,067 |
| 20,258 |
|
| Interconexion Electrica SA ESP | 9,846 |
| 48,128 |
|
| | | 68,386 |
|
| EGYPT — 0.7% | | |
| Commercial International Bank Egypt S.A.E. | 8,906 |
| 44,716 |
|
| GREECE — 0.9% | | |
Alpha Bank AE(1) | 48,263 |
| 44,939 |
|
Hellenic Telecommunications Organization SA(1) | 1,006 |
| 14,877 |
|
| | | 59,816 |
|
| HUNGARY — 0.3% | | |
| MOL Hungarian Oil & Gas plc | 351 |
| 18,778 |
|
| INDIA — 4.0% | | |
| HDFC Bank Ltd. ADR | 1,300 |
| 60,866 |
|
| ICICI Bank Ltd. ADR | 700 |
| 34,930 |
|
| Infosys Ltd. ADR | 1,850 |
| 99,475 |
|
Reliance Industries Ltd. GDR(2) | 1,668 |
| 56,128 |
|
| | | 251,399 |
|
| INDONESIA — 2.8% | | |
| PT Adaro Energy Tbk | 292,500 |
| 28,991 |
|
| PT Bank Rakyat Indonesia (Persero) Tbk | 95,000 |
| 82,739 |
|
| PT Indo Tambangraya Megah Tbk | 19,000 |
| 43,273 |
|
| PT Semen Gresik (Persero) Tbk | 4,900 |
| 6,231 |
|
| PT Telekomunikasi Indonesia (Persero) Tbk | 68,500 |
| 14,243 |
|
| | | 175,477 |
|
| MALAYSIA — 3.2% | | |
| Alliance Financial Group Bhd | 39,300 |
| 57,769 |
|
| Berjaya Sports Toto Bhd | 437 |
| 528 |
|
| Hong Leong Financial Group Bhd | 8,900 |
| 44,736 |
|
| Malayan Banking Bhd | 20,300 |
| 62,145 |
|
| Tenaga Nasional Bhd | 8,700 |
| 33,001 |
|
| | | 198,179 |
|
| MEXICO — 4.1% | | |
| Alfa SAB de CV, Series A | 2,200 |
| 6,088 |
|
| America Movil SAB de CV, Series L ADR | 2,500 |
| 51,875 |
|
| Compartamos SAB de CV | 28,400 |
| 54,858 |
|
Genomma Lab Internacional SAB de CV, Series B(1) | 4,700 |
| 12,734 |
|
|
| | | | | |
| | Shares | Value |
Gruma SAB de CV, B Shares(1) | 5,200 |
| $ | 62,235 |
|
| Grupo Financiero Inbursa SAB de CV | 13,200 |
| 39,345 |
|
Promotora y Operadora de Infraestructura SAB de CV(1) | 2,200 |
| 29,352 |
|
| | | 256,487 |
|
| PERU — 0.6% | | |
| Southern Copper Corp. | 1,200 |
| 36,444 |
|
| PHILIPPINES — 0.8% | | |
| Philippine Long Distance Telephone Co. | 715 |
| 48,944 |
|
| POLAND — 1.2% | | |
| KGHM Polska Miedz SA | 720 |
| 29,505 |
|
| Polskie Gornictwo Naftowe i Gazownictwo SA | 26,197 |
| 45,288 |
|
| | | 74,793 |
|
| RUSSIA — 5.3% | | |
| Gazprom OAO ADR | 14,275 |
| 124,407 |
|
| Lukoil OAO ADR | 1,068 |
| 63,770 |
|
| Mobile Telesystems OJSC ADR | 800 |
| 15,792 |
|
| Sberbank of Russia ADR | 826 |
| 8,367 |
|
| Sistema JSFC GDR | 1,881 |
| 57,935 |
|
| Tatneft OAO ADR | 1,566 |
| 60,792 |
|
| | | 331,063 |
|
| SOUTH AFRICA — 7.3% | | |
| Barloworld Ltd. | 5,284 |
| 50,306 |
|
| Kumba Iron Ore Ltd. | 1,744 |
| 55,592 |
|
| MMI Holdings Ltd. | 22,875 |
| 56,462 |
|
| MTN Group Ltd. | 1,970 |
| 41,491 |
|
| Sasol Ltd. | 2,762 |
| 164,229 |
|
| Standard Bank Group Ltd. | 1,693 |
| 23,083 |
|
| Vodacom Group Ltd. | 5,185 |
| 64,087 |
|
| | | 455,250 |
|
| SOUTH KOREA — 14.9% | | |
| BS Financial Group, Inc. | 1,550 |
| 22,826 |
|
| Coway Co. Ltd. | 573 |
| 47,967 |
|
| DGB Financial Group, Inc. | 3,910 |
| 58,546 |
|
| Dongbu Insurance Co. Ltd. | 928 |
| 47,693 |
|
| Halla Visteon Climate Control Corp. | 980 |
| 44,360 |
|
| Hana Financial Group, Inc. | 490 |
| 18,161 |
|
| Hankook Tire Co. Ltd. | 699 |
| 41,727 |
|
| Hanwha Corp. | 1,750 |
| 44,710 |
|
| Hyundai Mobis | 35 |
| 9,824 |
|
| Hyundai Motor Co. | 325 |
| 73,718 |
|
| Kia Motors Corp. | 1,629 |
| 91,126 |
|
| Korea Zinc Co. Ltd. | 56 |
| 21,973 |
|
| LG Chem Ltd. | 194 |
| 56,754 |
|
| LG Corp. | 1,088 |
| 67,207 |
|
|
| | | | | |
| | Shares | Value |
| POSCO | 82 |
| $ | 24,637 |
|
| Samsung Electronics Co. Ltd. | 70 |
| 91,461 |
|
| Shinhan Financial Group Co. Ltd. | 1,290 |
| 59,732 |
|
SK Networks Co. Ltd.(1) | 3,230 |
| 34,317 |
|
| SK Telecom Co. Ltd. | 323 |
| 75,499 |
|
| | | 932,238 |
|
| TAIWAN — 10.8% | | |
| Asustek Computer, Inc. | 1,000 |
| 11,153 |
|
| Catcher Technology Co. Ltd. | 8,000 |
| 74,620 |
|
| Cathay Financial Holding Co. Ltd. | 26,000 |
| 40,622 |
|
| CTBC Financial Holding Co. Ltd. | 48,000 |
| 31,991 |
|
| Fubon Financial Holding Co. Ltd. | 22,000 |
| 31,794 |
|
| Highwealth Construction Corp. | 17,000 |
| 38,033 |
|
| Hon Hai Precision Industry Co. Ltd. | 20,000 |
| 66,984 |
|
| Inventec Corp. | 49,000 |
| 46,936 |
|
| Pou Chen Corp. | 38,000 |
| 45,753 |
|
| Powertech Technology, Inc. | 12,000 |
| 21,703 |
|
| Quanta Computer, Inc. | 18,000 |
| 52,448 |
|
| Realtek Semiconductor Corp. | 12,000 |
| 38,020 |
|
| Shin Kong Financial Holding Co. Ltd. | 129,000 |
| 39,791 |
|
| Taiwan Cement Corp. | 43,000 |
| 65,095 |
|
| Teco Electric and Machinery Co. Ltd. | 6,000 |
| 6,903 |
|
| Vanguard International Semiconductor Corp. | 40,000 |
| 64,237 |
|
| | | 676,083 |
|
| THAILAND — 2.6% | | |
| Advanced Info Service PCL | 4,000 |
| 27,114 |
|
| Airports of Thailand PCL | 5,000 |
| 30,581 |
|
| Kasikornbank PCL | 1,200 |
| 7,580 |
|
| PTT Exploration & Production PCL | 17,100 |
| 88,253 |
|
| PTT Global Chemical PCL | 4,372 |
| 9,093 |
|
| | | 162,621 |
|
| TURKEY — 2.7% | | |
| Eregli Demir ve Celik Fabrikalari TAS | 40,329 |
| 72,145 |
|
| TAV Havalimanlari Holding AS | 2,628 |
| 20,902 |
|
| Tofas Turk Otomobil Fabrikasi | 6,936 |
| 43,051 |
|
| Turkiye Halk Bankasi AS | 4,200 |
| 31,521 |
|
| | | 167,619 |
|
TOTAL COMMON STOCKS (Cost $5,749,374) | | 5,860,814 |
|
| EXCHANGE-TRADED FUNDS — 4.7% | | |
| iShares MSCI Brazil Capped ETF | 376 |
| 17,965 |
|
| iShares MSCI Emerging Markets Index Fund | 2,038 |
| 88,103 |
|
| iShares MSCI India ETF | 6,346 |
| 188,698 |
|
TOTAL EXCHANGE-TRADED FUNDS (Cost $262,910) | | 294,766 |
|
|
| | | | | |
| | Shares | Value |
RIGHTS† | | |
SOUTH KOREA† | | |
BS Financial Group, Inc.(1) (Cost $—) | 262 |
| $ | 608 |
|
| TEMPORARY CASH INVESTMENTS — 1.1% | | |
| Repurchase Agreement, Bank of America Merrill Lynch, (collateralized by various U.S. Treasury obligations, 0.75% - 0.875%, 1/31/18 - 2/28/18, valued at $14,946), in a joint trading account at 0.05%, dated 6/30/14, due 7/1/14 (Delivery value $14,646) | | 14,646 |
|
| Repurchase Agreement, Credit Suisse First Boston, Inc., (collateralized by various U.S. Treasury obligations, 1.75%, 5/15/23, valued at $5,980), in a joint trading account at 0.01%, dated 6/30/14, due 7/1/14 (Delivery value $5,858) | | 5,858 |
|
| Repurchase Agreement, Goldman Sachs & Co., (collateralized by various U.S. Treasury obligations, 3.125%, 11/15/41, valued at $11,952), in a joint trading account at 0.03%, dated 6/30/14, due 7/1/14 (Delivery value $11,716) | | 11,716 |
|
| SSgA U.S. Government Money Market Fund, Class N | 34,628 |
| 34,628 |
|
TOTAL TEMPORARY CASH INVESTMENTS (Cost $66,848) | | 66,848 |
|
TOTAL INVESTMENT SECURITIES — 99.4% (Cost $6,079,132) | | 6,223,036 |
|
| OTHER ASSETS AND LIABILITIES — 0.6% | | 37,241 |
|
| TOTAL NET ASSETS — 100.0% | | $ | 6,260,277 |
|
|
| | |
| MARKET SECTOR DIVERSIFICATION | |
| (as a % of net assets) | |
| Financials | 30.7 | % |
| Energy | 14.6 | % |
| Materials | 10.2 | % |
| Information Technology | 9.2 | % |
| Telecommunication Services | 8.8 | % |
| Consumer Discretionary | 7.2 | % |
| Industrials | 5.4 | % |
| Utilities | 5.1 | % |
| Consumer Staples | 2.2 | % |
| Health Care | 0.2 | % |
| Exchange-Traded Funds | 4.7 | % |
| Cash and Equivalents* | 1.7 | % |
*Includes temporary cash investments and other assets and liabilities.
|
| | |
| NOTES TO SCHEDULE OF INVESTMENTS |
| ADR | - | American Depositary Receipt |
| GDR | - | Global Depositary Receipt |
| JSFC | - | Joint-Stock Financial Corporation |
| OJSC | - | Open Joint Stock Company |
| |
| † | Category is less than 0.05% of total net assets. |
| |
| (2) | Restricted security exempt from registration pursuant to Rule 144A under the Securities Act of 1933. These securities may be sold without restriction to qualified institutional investors and have been deemed liquid under policies approved by the Board of Directors. The aggregate value of these securities at the period end was $56,128, which represented 0.9% of total net assets. |
See Notes to Financial Statements.
|
|
| Statement of Assets and Liabilities |
|
| | | |
| JUNE 30, 2014 | |
| Assets | |
| Investment securities, at value (cost of $6,079,132) | $ | 6,223,036 |
|
| Foreign currency holdings, at value (cost of $9,692) | 9,664 |
|
| Receivable for capital shares sold | 1,360 |
|
| Dividends and interest receivable | 33,953 |
|
| | 6,268,013 |
|
| | |
| Liabilities | |
| Accrued management fees | 7,125 |
|
| Distribution and service fees payable | 611 |
|
| | 7,736 |
|
| | |
| Net Assets | $ | 6,260,277 |
|
| | |
| Net Assets Consist of: | |
| Capital (par value and paid-in surplus) | $ | 6,175,584 |
|
| Undistributed net investment income | 75,487 |
|
| Accumulated net realized loss | (134,737 | ) |
| Net unrealized appreciation | 143,943 |
|
| | $ | 6,260,277 |
|
|
| | | |
| | Net Assets | Shares Outstanding | Net Asset Value Per Share |
| Investor Class, $0.01 Par Value | $2,748,000 | 273,637 | $10.04 |
| Institutional Class, $0.01 Par Value | $1,508,388 | 150,000 | $10.06 |
| A Class, $0.01 Par Value | $1,504,247 | 150,035 | $10.03* |
| C Class, $0.01 Par Value | $249,407 | 25,000 | $9.98 |
| R Class, $0.01 Par Value | $250,235 | 25,000 | $10.01 |
*Maximum offering price $10.64 (net asset value divided by 0.9425).
See Notes to Financial Statements.
|
| | | |
FOR THE PERIOD ENDED JUNE 30, 2014(1) | |
| Investment Income (Loss) | |
| Income: | |
| Dividends (net of foreign taxes withheld of $13,954) | $ | 122,354 |
|
| Interest | 13 |
|
| | 122,367 |
|
| | |
| Expenses: | |
| Management fees | 53,272 |
|
| Distribution and service fees: | |
| A Class | 2,357 |
|
| C Class | 1,567 |
|
| R Class | 785 |
|
| Directors' fees and expenses | 183 |
|
| Other expenses | 175 |
|
| | 58,339 |
|
| Fees waived | (2,541 | ) |
| | 55,798 |
|
| | |
| Net investment income (loss) | 66,569 |
|
| | |
| Realized and Unrealized Gain (Loss) | |
| Net realized gain (loss) on: | |
| Investment transactions | (130,694 | ) |
| Foreign currency transactions | 3,034 |
|
| | (127,660 | ) |
| | |
| Change in net unrealized appreciation (depreciation) on: | |
| Investments | 143,904 |
|
| Translation of assets and liabilities in foreign currencies | 39 |
|
| | 143,943 |
|
| | |
| Net realized and unrealized gain (loss) | 16,283 |
|
| | |
| Net Increase (Decrease) in Net Assets Resulting from Operations | $ | 82,852 |
|
| |
| (1) | October 31, 2013 (fund inception) through June 30, 2014. |
See Notes to Financial Statements.
|
|
| Statement of Changes in Net Assets |
|
| | | |
PERIOD ENDED JUNE 30, 2014(1) | |
| Increase (Decrease) in Net Assets | |
| Operations | |
| Net investment income (loss) | $ | 66,569 |
|
| Net realized gain (loss) | (127,660 | ) |
| Change in net unrealized appreciation (depreciation) | 143,943 |
|
| Net increase (decrease) in net assets resulting from operations | 82,852 |
|
| | |
| Capital Share Transactions | |
| Net increase (decrease) in net assets from capital share transactions (Note 5) | 6,177,425 |
|
| | |
| Net increase (decrease) in net assets | 6,260,277 |
|
| | |
| Net Assets | |
| End of period | $ | 6,260,277 |
|
| | |
| Undistributed net investment income | $ | 75,487 |
|
| |
| (1) | October 31, 2013 (fund inception) through June 30, 2014. |
See Notes to Financial Statements.
|
|
| Notes to Financial Statements |
JUNE 30, 2014
1. Organization
American Century Quantitative Equity Funds, Inc. (the corporation) is registered under the Investment Company Act of 1940, as amended (the 1940 Act), as an open-end management investment company and is organized as a Maryland corporation. Emerging Markets Value Fund (the fund) is one fund in a series issued by the corporation. The fund is diversified as defined under the 1940 Act. The fund’s investment objective is to seek capital growth.
The fund offers the Investor Class, the Institutional Class, the A Class, the C Class and the R Class. The A Class may incur an initial sales charge. The A Class and C Class may be subject to a contingent deferred sales charge. The share classes differ principally in their respective sales charges and distribution and shareholder servicing expenses and arrangements. The Institutional Class is made available to institutional shareholders or through financial intermediaries whose clients do not require the same level of shareholder and administrative services as shareholders of other classes. As a result, the Institutional Class is charged a lower unified management fee. All classes of the fund commenced sale on October 31, 2013, the fund's inception date.
2. Significant Accounting Policies
The following is a summary of significant accounting policies consistently followed by the fund in preparation of its financial statements. The financial statements are prepared in conformity with accounting principles generally accepted in the United States of America, which may require management to make certain estimates and assumptions at the date of the financial statements. Actual results could differ from these estimates. Management evaluated the impact of events or transactions occurring through the date the financial statements were issued that would merit recognition or disclosure.
Investment Valuations — The fund determines the fair value of its investments and computes its net asset value per share at the close of regular trading (usually 4 p.m. Eastern time) on the New York Stock Exchange (NYSE) on each day the NYSE is open. The Board of Directors has adopted valuation policies and procedures to guide the investment advisor in the fund’s investment valuation process and to provide methodologies for the oversight of the fund’s pricing function.
Equity securities that are listed or traded on a domestic securities exchange are valued at the last reported sales price or at the official closing price as provided by the exchange. Equity securities traded on foreign securities exchanges are generally valued at the closing price of such securities on the exchange where primarily traded or at the close of the NYSE, if that is earlier. If no last sales price is reported, or if local convention or regulation so provides, the mean of the latest bid and asked prices may be used. Securities traded over-the-counter are valued at the mean of the latest bid and asked prices, the last sales price, or the official closing price. Equity securities initially expressed in local currencies are translated into U.S. dollars at the mean of the appropriate currency exchange rate at the close of the NYSE as provided by an independent pricing service.
Fixed income securities maturing within 60 days at the time of purchase may be valued at cost, plus or minus any amortized discount or premium or at the evaluated mean as provided by an independent pricing service. Evaluated mean prices are commonly derived through utilization of market models, which may consider, among other factors: trade data, quotations from dealers and active market makers, relevant yield curve and spread data, related sector levels, creditworthiness, trade data or market information on comparable securities, and other relevant security specific information.
Open-end management investment companies are valued at the reported net asset value per share. Repurchase agreements are valued at cost, which approximates fair value.
If the fund determines that the market price for an investment is not readily available or the valuation methods mentioned above do not reflect an investment’s fair value, such investment is valued as determined in good faith by the Board of Directors or its delegate, in accordance with policies and procedures adopted by the Board of Directors. In its determination of fair value, the fund may review several factors including, but not limited to, market information regarding the specific investment or comparable investments and correlation
with other investment types, futures indices or general market indicators. Circumstances that may cause the fund to use these procedures to value an investment include, but are not limited to: an investment has been declared in default or is distressed; trading in a security has been suspended during the trading day or a security is not actively trading on its principal exchange; prices received from a regular pricing source are deemed unreliable; or there is a foreign market holiday and no trading occurred.
The fund monitors for significant events occurring after the close of an investment’s primary exchange but before the fund’s net asset value per share is determined. Significant events may include, but are not limited to: corporate announcements and transactions; governmental action and political unrest that could impact a specific investment or an investment sector; or armed conflicts, natural disasters and similar events that could affect investments in a specific country or region. The fund also monitors for significant fluctuations between domestic and foreign markets, as evidenced by the U.S. market or such other indicators that the Board of Directors, or its delegate, deems appropriate. If significant fluctuations in foreign markets are identified, the fund may apply a model-derived factor to the closing price of equity securities traded on foreign securities exchanges. The factor is based on observable market data as provided by an independent pricing service.
Security Transactions — Security transactions are accounted for as of the trade date. Net realized gains and losses are determined on the identified cost basis, which is also used for federal income tax purposes.
Investment Income — Dividend income less foreign taxes withheld, if any, is recorded as of the ex-dividend date. Distributions received on securities that represent a return of capital or long-term capital gain are recorded as a reduction of cost of investments and/or as a realized gain. The fund may estimate the components of distributions received that may be considered nontaxable distributions or long-term capital gain distributions for income tax purposes. Interest income is recorded on the accrual basis and includes accretion of discounts and amortization of premiums.
Foreign Currency Translations — All assets and liabilities initially expressed in foreign currencies are translated into U.S. dollars at prevailing exchange rates at period end. The fund may enter into spot foreign currency exchange contracts to facilitate transactions denominated in a foreign currency. Purchases and sales of investment securities, dividend and interest income, spot foreign currency exchange contracts, and expenses are translated at the rates of exchange prevailing on the respective dates of such transactions. Net realized and unrealized foreign currency exchange gains or losses related to investment securities are a component of net realized gain (loss) on investment transactions and change in net unrealized appreciation (depreciation) on investments, respectively.
Repurchase Agreements — The fund may enter into repurchase agreements with institutions that American Century Investment Management, Inc. (ACIM) (the investment advisor) has determined are creditworthy pursuant to criteria adopted by the Board of Directors. The fund requires that the collateral, represented by securities, received in a repurchase transaction be transferred to the custodian in a manner sufficient to enable the fund to obtain those securities in the event of a default under the repurchase agreement. ACIM monitors, on a daily basis, the securities transferred to ensure the value, including accrued interest, of the securities under each repurchase agreement is equal to or greater than amounts owed to the fund under each repurchase agreement.
Joint Trading Account — Pursuant to an Exemptive Order issued by the Securities and Exchange Commission, the fund, along with certain other funds in the American Century Investments family of funds, may transfer uninvested cash balances into a joint trading account. These balances are invested in one or more repurchase agreements that are collateralized by U.S. Treasury or Agency obligations.
Income Tax Status — It is the fund’s policy to distribute substantially all net investment income and net realized gains to shareholders and to otherwise qualify as a regulated investment company under provisions of the Internal Revenue Code. Accordingly, no provision has been made for income taxes. The fund files U.S. federal, state, local and non-U.S. tax returns as applicable. The fund's tax returns are subject to examination by the relevant taxing authority until expiration of the applicable statute of limitations, which is generally three years from the date of filing but can be longer in certain jurisdictions. At this time, management believes there are no uncertain tax positions which, based on their technical merit, would not be sustained upon examination and for which it is reasonably possible that the total amounts of unrecognized tax benefits will significantly change in the next twelve months.
Multiple Class — All shares of the fund represent an equal pro rata interest in the net assets of the class to which such shares belong, and have identical voting, dividend, liquidation and other rights and the same terms and conditions, except for class specific expenses and exclusive rights to vote on matters affecting only
individual classes. Income, non-class specific expenses, and realized and unrealized capital gains and losses of the fund are allocated to each class of shares based on their relative net assets.
Distributions to Shareholders — Distributions from net investment income and net realized gains, if any, are generally declared and paid annually.
Indemnifications — Under the corporation’s organizational documents, its officers and directors are indemnified against certain liabilities arising out of the performance of their duties to the fund. In addition, in the normal course of business, the fund enters into contracts that provide general indemnifications. The maximum exposure under these arrangements is unknown as this would involve future claims that may be made against a fund. The risk of material loss from such claims is considered by management to be remote.
3. Fees and Transactions with Related Parties
Certain officers and directors of the corporation are also officers and/or directors of American Century Companies, Inc. (ACC). The corporation’s investment advisor, ACIM, the corporation's distributor, American Century Investment Services, Inc. (ACIS), and the corporation’s transfer agent, American Century Services, LLC, are wholly owned, directly or indirectly, by ACC. ACIM owns 80% of the shares of the fund. Related parties do not invest in the fund for the purpose of exercising management or control.
Management Fees — The corporation has entered into a management agreement with ACIM, under which ACIM provides the fund with investment advisory and management services in exchange for a single, unified management fee (the fee) per class. The agreement provides that all expenses of managing and operating the fund, except distribution and service fees, brokerage expenses, taxes, interest, fees and expenses of the independent directors (including legal counsel fees), and extraordinary expenses, will be paid by ACIM. The fee is computed and accrued daily based on each class’s daily net assets and paid monthly in arrears. The annual management fee is 1.52% for the Investor Class, A Class, C Class and R Class and 1.32% for the Institutional Class. During the period ended June 30, 2014, the investment advisor voluntarily agreed to waive 0.07% of its management fee. The investment advisor expects the fee waiver to continue through October 31, 2014, and cannot terminate it without the approval of the Board of Directors. The total amount of the waiver for each class for the period October 31, 2013 (fund inception) through June 30, 2014 was $1,000, $661, $660, $110 and $110 for the Investor Class, Institutional Class, A Class, C Class and R Class, respectively. The effective annual management fee after waiver for each class for the period October 31, 2013 (fund inception) through June 30, 2014 was 1.45% for the Investor Class, A Class, C Class and R Class and 1.25% for the Institutional Class.
Distribution and Service Fees — The Board of Directors has adopted a separate Master Distribution and Individual Shareholder Services Plan for each of the A Class, C Class and R Class (collectively the plans), pursuant to Rule 12b-1 of the 1940 Act. The plans provide that the A Class will pay ACIS an annual distribution and service fee of 0.25%. The plans provide that the C Class will pay ACIS an annual distribution and service fee of 1.00%, of which 0.25% is paid for individual shareholder services and 0.75% is paid for distribution services. The plans provide that the R Class will pay ACIS an annual distribution and service fee of 0.50%. The fees are computed and accrued daily based on each class’s daily net assets and paid monthly in arrears. The fees are used to pay financial intermediaries for distribution and individual shareholder services. Fees incurred under the plans during the period October 31, 2013 (fund inception) through June 30, 2014 are detailed in the Statement of Operations.
Directors' Fees and Expenses — The Board of Directors is responsible for overseeing the investment advisor’s management and operations of the fund. The directors receive detailed information about the fund and its investment advisor regularly throughout the year, and meet at least quarterly with management of the investment advisor to review reports about fund operations. Fees and expenses incurred in conjunction with the directors during the period October 31, 2013 (fund inception) through June 30, 2014 are detailed in the Statement of Operations. The fund’s officers do not receive compensation from the fund.
Acquired Fund Fees and Expenses — The fund may invest in mutual funds, exchange-traded funds, and business development companies (the acquired funds). The fund will indirectly realize its pro rata share of the fees and expenses of the acquired funds in which it invests. These indirect fees and expenses are not paid out of the fund's assets but are reflected in the return realized by the fund on its investment in the acquired funds.
4. Investment Transactions
Purchases and sales of investment securities, excluding short-term investments, for the period October 31, 2013 (fund inception) through June 30, 2014 were $8,516,241 and $2,373,326, respectively.
5. Capital Share Transactions
Transactions in shares of the fund were as follows:
|
| | | | |
| | Period ended June 30, 2014(1) |
| | Shares | Amount |
| Investor Class/Shares Authorized | 50,000,000 | |
| Sold | 310,768 | $ | 3,023,635 |
|
| Redeemed | (37,131) | (346,555 | ) |
| | 273,637 | 2,677,080 |
|
| Institutional Class/Shares Authorized | 50,000,000 | |
| Sold | 150,000 | 1,500,000 |
|
| A Class/Shares Authorized | 50,000,000 | |
| Sold | 150,035 | 1,500,345 |
|
| C Class/Shares Authorized | 50,000,000 | |
| Sold | 25,000 | 250,000 |
|
| R Class/Shares Authorized | 10,000,000 | |
| Sold | 25,000 | 250,000 |
|
| Net increase (decrease) | 623,672 | $ | 6,177,425 |
|
| |
| (1) | October 31, 2013 (fund inception) through June 30, 2014. |
6. Fair Value Measurements
The fund’s investments valuation process is based on several considerations and may use multiple inputs to determine the fair value of the investments held by the fund. In conformity with accounting principles generally accepted in the United States of America, the inputs used to determine a valuation are classified into three broad levels.
| |
| • | Level 1 valuation inputs consist of unadjusted quoted prices in an active market for identical investments. |
| |
| • | Level 2 valuation inputs consist of direct or indirect observable market data (including quoted prices for comparable investments, evaluations of subsequent market events, interest rates, prepayment speeds, credit risk, etc.). These inputs also consist of quoted prices for identical investments initially expressed in local currencies that are adjusted through translation into U.S. dollars. |
| |
| • | Level 3 valuation inputs consist of unobservable data (including a fund’s own assumptions). |
The level classification is based on the lowest level input that is significant to the fair valuation measurement. The valuation inputs are not necessarily an indication of the risks associated with investing in these securities or other financial instruments.
The following is a summary of the level classifications as of period end. The Schedule of Investments provides additional information on the fund’s portfolio holdings.
|
| | | | | | | | |
| | Level 1 | Level 2 | Level 3 |
| Assets | | | |
| Investment Securities | | | |
| Common Stocks | $ | 633,308 |
| $ | 5,227,506 |
| — |
|
| Exchange-Traded Funds | 294,766 |
| — |
| — |
|
| Rights | — |
| 608 |
| — |
|
| Temporary Cash Investments | 34,628 |
| 32,220 |
| — |
|
| | $ | 962,702 |
| $ | 5,260,334 |
| — |
|
7. Risk Factors
There are certain risks involved in investing in foreign securities. These risks include those resulting from future adverse political, social and economic developments, fluctuations in currency exchange rates, the possible imposition of exchange controls, and other foreign laws or restrictions. Investing in emerging markets may accentuate these risks.
8. Federal Tax Information
The book-basis character of distributions made during the year from net investment income or net realized gains may differ from their ultimate characterization for federal income tax purposes. These differences reflect the differing character of certain income items and net realized gains and losses for financial statement and tax purposes, and may result in reclassification among certain capital accounts on the financial statements. There were no distributions paid by the fund during the period October 31, 2013 (fund inception) through June 30, 2014.
As of June 30, 2014, the federal tax cost of investments and the components of distributable earnings on a tax-basis were as follows:
|
| | | |
| Federal tax cost of investments | $ | 6,108,721 |
|
| Gross tax appreciation of investments | $ | 353,260 |
|
| Gross tax depreciation of investments | (238,945 | ) |
| Net tax appreciation (depreciation) of investments | 114,315 |
|
Net tax appreciation (depreciation) on translation of assets and liabilities in foreign currencies | 39 |
|
| Net tax appreciation (depreciation) | $ | 114,354 |
|
| Undistributed ordinary income | $ | 103,720 |
|
| Accumulated short-term capital losses | $ | (133,381 | ) |
The difference between book-basis and tax-basis unrealized appreciation (depreciation) is attributable primarily to the realization to ordinary income for tax purposes of unrealized gains on investments in passive foreign investment companies.
Accumulated capital losses represent net capital loss carryovers that may be used to offset future realized capital gains for federal income tax purposes. The capital loss carryovers may be carried forward for an unlimited period. Future capital loss carryover utilization in any given year may be subject to Internal Revenue Code limitations.
|
| | | | | | | | | | | | | | |
| For a Share Outstanding Throughout the Period Indicated | | | | |
| Per-Share Data | | | | | Ratios and Supplemental Data | | | |
| | | Income From Investment Operations: | | | Ratio to Average Net Assets of: | | |
| | Net Asset
Value,
Beginning
of Period | Net
Investment
Income
(Loss)(1) | Net
Realized
and
Unrealized
Gain (Loss) | Total From
Investment
Operations | Net Asset
Value,
End
of Period | Total
Return(2) | Operating
Expenses(3) | Operating
Expenses
(before
expense
waiver)(3) | Net
Investment
Income
(Loss) | Net
Investment
Income (Loss)
(before
expense
waiver) | Portfolio
Turnover
Rate | Net
Assets,
End of
Period
(in thousands) |
| Investor Class | | | | | | | | | | | |
2014(4) | $10.00 | 0.13 | (0.09) | 0.04 | $10.04 | 0.40% | 1.46%(5) | 1.53%(5) | 1.91%(5) | 1.84%(5) | 44% |
| $2,748 |
|
| Institutional Class | | | | | | | | | | | |
2014(4) | $10.00 | 0.13 | (0.07) | 0.06 | $10.06 | 0.60% | 1.26%(5) | 1.33%(5) | 2.11%(5) | 2.04%(5) | 44% |
| $1,508 |
|
| A Class | | | | | | | | | | | | |
2014(4) | $10.00 | 0.10 | (0.07) | 0.03 | $10.03 | 0.30% | 1.71%(5) | 1.78%(5) | 1.66%(5) | 1.59%(5) | 44% |
| $1,504 |
|
| C Class | | | | | | | | | | | | |
2014(4) | $10.00 | 0.05 | (0.07) | (0.02) | $9.98 | (0.20)% | 2.46%(5) | 2.53%(5) | 0.91%(5) | 0.84%(5) | 44% |
| $249 |
|
| R Class | | | | | | | | | | | | |
2014(4) | $10.00 | 0.08 | (0.07) | 0.01 | $10.01 | 0.10% | 1.96%(5) | 2.03%(5) | 1.41%(5) | 1.34%(5) | 44% |
| $250 |
|
|
|
| Notes to Financial Highlights |
| |
| (1) | Computed using average shares outstanding throughout the period. |
| |
| (2) | Total returns are calculated based on the net asset value of the last business day and do not reflect applicable sales charges, if any. Total returns for periods less than one year are not annualized. |
| |
| (3) | Ratio of operating expenses to average net assets does not include any fees and expenses of the acquired funds. |
| |
| (4) | October 31, 2013 (fund inception) through June 30, 2014. |
See Notes to Financial Statements.
|
|
| Report of Independent Registered Public Accounting Firm |
To the Directors of the American Century Quantitative Equity Funds, Inc. and Shareholders of the Emerging Markets Value Fund:
In our opinion, the accompanying statement of assets and liabilities, including the schedule of investments, and the related statements of operations, of changes in net assets and the financial highlights present fairly, in all material respects, the financial position of the Emerging Markets Value Fund (one of the fifteen funds comprising the American Century Quantitative Equity Funds, Inc., hereafter referred to as the “Fund”) at June 30, 2014, and the results of its operations, the changes in its net assets and the financial highlights for the period October 31, 2013 (commencement of operations) through June 30, 2014, in conformity with accounting principles generally accepted in the United States of America. These financial statements and financial highlights (hereafter referred to as "financial statements") are the responsibility of the Fund's management. Our responsibility is to express an opinion on these financial statements based on our audit. We conducted our audit of these financial statements in accordance with the standards of the Public Company Accounting Oversight Board (United States). Those standards require that we plan and perform the audit to obtain reasonable assurance about whether the financial statements are free of material misstatement. An audit includes examining, on a test basis, evidence supporting the amounts and disclosures in the financial statements, assessing the accounting principles used and significant estimates made by management, and evaluating the overall financial statement presentation. We believe that our audit, which included confirmation of securities at June 30, 2014 by correspondence with the custodian and brokers, provides a reasonable basis for our opinion.
PricewaterhouseCoopers LLP
Kansas City, Missouri
August 21, 2014
Board of Directors
The individuals listed below serve as directors of the funds. Each director will continue to serve in this capacity until death, retirement, resignation or removal from office. The board has adopted a mandatory retirement age for directors who are not “interested persons,” as that term is defined in the Investment Company Act (independent directors). Independent directors shall retire on December 31 of the year in which they reach their 75th birthday; provided, however, that on or after January 1, 2022, independent directors shall retire on December 31 of the year in which they reach their 76th birthday.
Mr. Thomas is an “interested person” because he currently serves as President and Chief Executive Officer of American Century Companies, Inc. (ACC), the parent company of American Century Investment Management, Inc. (ACIM or the advisor). The other directors (more than three-fourths of the total number) are independent. They are not employees, directors or officers of, and have no financial interest in, ACC or any of its wholly owned, direct or indirect, subsidiaries, including ACIM, American Century Investment Services, Inc. (ACIS) and American Century Services, LLC (ACS), and do not have any other affiliations, positions or relationships that would cause them to be considered “interested persons” under the Investment Company Act. The directors serve in this capacity for eight (in the case of Mr. Thomas, 15) registered investment companies in the American Century Investments family of funds.
The following table presents additional information about the directors. The mailing address for each director other than Mr. Thomas is 1665 Charleston Road, Mountain View, California 94043. The mailing address for Mr. Thomas is 4500 Main Street, Kansas City, Missouri 64111.
|
| | | | | |
Name (Year of Birth) | Position(s) Held with Funds | Length of Time Served | Principal Occupation(s) During Past 5 Years | Number of
American
Century
Portfolios
Overseen
by Director | Other Directorships Held During Past 5 Years |
| Independent Directors |
Tanya S. Beder (1955) | Director | Since 2011 | Chairman, SBCC Group Inc. (independent advisory services) (2006 to present) | 42 | CYS Investments, Inc. (specialty finance company) |
Jeremy I. Bulow (1954) | Director | Since 2011 | Professor of Economics, Stanford University, Graduate School of Business (1979 to present) | 42 | None |
Ronald J. Gilson (1946) | Director and Chairman of the Board | Since 1995 (Chairman since 2005) | Charles J. Meyers Professor of Law and Business, Stanford Law School (1979 to present); Marc and Eva Stern Professor of Law and Business, Columbia University School of Law (1992 to present) | 42 | None |
|
| | | | | |
Name (Year of Birth) | Position(s) Held with Funds | Length of Time Served | Principal Occupation(s) During Past 5 Years | Number of
American
Century
Portfolios
Overseen
by Director | Other Directorships Held During Past 5 Years |
| Independent Directors |
Frederick L. A. Grauer (1946) | Director | Since 2008 | Senior Advisor, BlackRock, Inc. (investment management firm) (2010 to 2011); Senior Advisor, Barclays Global Investors (investment management firm) (2003 to 2009) | 42 | None |
Peter F. Pervere
(1947) | Director | Since 2007 | Retired | 42 | Intraware, Inc. (2003 to 2009) |
Myron S. Scholes(1) (1941) | Director | Since 1980 | Chairman, Platinum Grove Asset Management, L.P. (asset manager) (1999 to 2009); Frank E. Buck Professor of Finance-Emeritus, Stanford Graduate School of Business (1996 to present) | 42 | Dimensional Fund Advisors (investment advisor); CME Group, Inc. (futures and options exchange) |
John B. Shoven
(1947) | Director | Since 2002 | Professor of Economics, Stanford University (1973 to present) | 42 | Cadence Design Systems; Exponent; Financial Engines |
| Interested Director |
Jonathan S. Thomas
(1963) | Director and
President | Since 2007 | President and Chief Executive Officer, ACC (March 2007 to present). Also serves as Chief Executive Officer and Manager, ACS; Executive Vice President, ACIM; Director, ACC, ACIM and other ACC subsidiaries | 115 | None |
(1) Myron S. Scholes resigned as director effective July 31, 2014.
Officers
The following table presents certain information about the executive officers of the funds. Each officer serves as an officer for each of the 15 investment companies in the American Century family of funds, unless otherwise noted. No officer is compensated for his or her service as an officer of the funds. The listed officers are interested persons of the funds and are appointed or re-appointed on an annual basis. The mailing address for each of the officers listed below is 4500 Main Street, Kansas City, Missouri 64111.
|
| | |
Name (Year of Birth) | Offices with the Funds | Principal Occupation(s) During the Past Five Years |
Jonathan S. Thomas (1963) | Director and President since 2007 | President and Chief Executive Officer, ACC (March 2007 to present). Also serves as Chief Executive Officer and Manager, ACS; Executive Vice President, ACIM; Director, ACC, ACIM and other ACC subsidiaries |
| Amy D. Shelton (1964) | Chief Compliance Officer since 2014 | Chief Compliance Officer, American Century funds, (March 2014 to present); Chief Compliance Officer, ACIM (February 2014 to present); Chief Compliance Officer, ACIS (October 2009 to present); Vice President, Client Interactions and Marketing, ACIS (February 2013 to January 2014); Director, Client Interactions and Marketing, ACIS (June 2007 to January 2013). Also serves as Vice President, ACIS |
Charles A. Etherington (1957) | General Counsel since 2007 and Senior Vice President since 2006 | Attorney, ACC (February 1994 to present); Vice President, ACC (November 2005 to present); General Counsel, ACC (March 2007 to present). Also serves as General Counsel, ACIM, ACS, ACIS and other ACC subsidiaries; and Senior Vice President, ACIM and ACS |
C. Jean Wade (1964) | Vice President, Treasurer and Chief Financial Officer since 2012 | Vice President, ACS (February 2000 to present) |
Robert J. Leach (1966) | Vice President since 2006 and Assistant Treasurer since 2012 | Vice President, ACS (February 2000 to present) |
David H. Reinmiller (1963) | Vice President since 2001 | Attorney, ACC (January 1994 to present); Associate General Counsel, ACC (January 2001 to present). Also serves as Vice President, ACIM and ACS |
Ward D. Stauffer (1960) | Secretary since 2005 | Attorney, ACC (June 2003 to present) |
The Statement of Additional Information has additional information about the fund’s directors and is available without charge, upon request, by calling 1-800-345-2021.
|
|
| Approval of Management Agreement |
At a meeting held on June 13, 2014, the Fund’s Board of Directors/Trustees unanimously approved the renewal of the management agreement pursuant to which American Century Investment Management, Inc. (the “Advisor”) acts as the investment advisor for the Fund. Under Section 15(c) of the Investment Company Act, contracts for investment advisory services are required to be reviewed, evaluated, and approved by a majority of a fund’s directors/trustees (the “Directors”), including a majority of the independent Directors, each year. The Board regards this annual evaluation and renewal as one of its most important responsibilities.
The independent Directors have memorialized a statement regarding the relationship between their ongoing obligations to oversee and evaluate the performance of the Advisor and their annual consideration of renewal of the management agreement. In that statement, the independent Directors noted that their assessment of the Advisor’s performance is an ongoing process that takes place over the entire year and is informed by all of the extensive information that the Board and its committees receive and consider over time. This information, together with the materials provided in connection with the review, are central to the Board’s assessment of the Advisor’s performance and its determination whether to renew the Fund’s management agreement.
Prior to its consideration of the renewal of the management agreement, the Board requested and reviewed extensive data and analysis relating to the proposed renewal. This information and analysis was compiled by the Advisor and certain independent providers of evaluation data concerning the Fund and the services provided to the Fund by the Advisor.
In connection with its consideration of the renewal of the management agreement, the Board’s review and evaluation of the services provided by the Advisor included, but was not limited to, the following:
| |
| • | the nature, extent, and quality of investment management, shareholder services, and other services provided by the Advisor to the Fund; |
| |
| • | the wide range of other programs and services the Advisor provides to the Fund and its shareholders on a routine and non-routine basis; |
| |
| • | the investment performance of the Fund, including data comparing the Fund’s performance to appropriate benchmarks and/or a peer group of other mutual funds with similar investment objectives and strategies; |
| |
| • | the cost of owning the Fund compared to the cost of owning similar funds; |
| |
| • | the Advisor’s compliance policies, procedures, and regulatory experience; |
| |
| • | financial data showing the cost of services provided to the Fund, the profitability of the Fund to the Advisor, and the overall profitability of the Advisor; |
| |
| • | possible economies of scale associated with the Advisor’s management of the Fund and other accounts under its management; |
| |
| • | data comparing services provided and charges to other investment management clients of the Advisor; and |
| |
| • | any collateral benefits derived by the Advisor from the management of the Fund. |
In keeping with its practice, the Board held two in-person meetings to review and discuss the information provided. The independent Directors also had the benefit of the advice of their independent counsel throughout the process.
Factors Considered
The Directors considered all of the information provided by the Advisor, the independent data providers, and the independent Directors’ independent counsel in connection with the review, and evaluated such information for the Fund. In connection with their review, the Directors did not
identify any single factor as being all-important or controlling and each Director may have attributed different levels of importance to different factors. In deciding to renew the management agreement, the Board based its decision on a number of factors, including the following:
Nature, Extent and Quality of Services — Generally. Under the management agreement, the Advisor is responsible for providing or arranging for all services necessary for the operation of the Fund. The Board noted that under the management agreement, the Advisor provides or arranges at its own expense a wide variety of services including:
| |
| • | constructing and designing the Fund |
| |
| • | portfolio research and security selection |
| |
| • | initial capitalization/funding |
| |
| • | daily valuation of the Fund’s portfolio |
| |
| • | shareholder servicing and transfer agency, including shareholder confirmations, recordkeeping, and communications |
| |
| • | regulatory and portfolio compliance |
| |
| • | marketing and distribution |
The Board noted that many of these services have expanded over time both in terms of quantity and complexity in response to shareholder demands, competition in the industry, changing distribution channels, and the changing regulatory environment.
Investment Management Services. The nature of the investment management services provided to the Fund is quite complex and allows Fund shareholders access to professional money management, instant diversification of their investments within an asset class, the opportunity to easily diversify among asset classes by investing in or exchanging among various American Century Investments funds, and liquidity. In evaluating investment performance, the Board expects the Advisor to manage the Fund in accordance with its investment objectives and approved strategies. Further, the Directors recognize that the Advisor has an obligation to seek the best execution of fund trades. In providing these services, the Advisor utilizes teams of investment professionals (portfolio managers, analysts, research assistants, and securities traders) who require extensive information technology, research, training, compliance and other systems to conduct their business. The Fund has less than one year of performance history. The Board, directly and through its Portfolio Committee, regularly reviews the investment management services of the Advisor. The Board found the investment management services provided to the Fund to be satisfactory and consistent with the management agreement.
Shareholder and Other Services. Under the management agreement, the Advisor provides the Fund with a comprehensive package of transfer agency, shareholder, and other services. The Board, directly and through various committees of the Board, regularly reviews reports and evaluations of such services at its regular meetings. These reports include, but are not limited to, information regarding the operational efficiency and accuracy of the shareholder and transfer agency services provided, staffing levels, shareholder satisfaction (as measured by external as well as internal sources), technology support, new products and services offered to Fund shareholders, securities trading activities, portfolio valuation services, auditing services, and legal and operational compliance activities. Certain aspects of shareholder and transfer agency service level efficiency and the quality of securities trading activities are measured by independent third party providers and are presented in comparison to other fund groups not managed by the Advisor. The Board found the services provided by the Advisor to the Fund under the management agreement to be competitive and of high quality.
Costs of Services and Profitability. The Advisor provides detailed information concerning its cost of providing various services to the Fund, its profitability in managing the Fund, its overall profitability, and its financial condition. The Directors have reviewed with the Advisor the methodology used to prepare this financial information. The financial information regarding the Advisor is considered in evaluating the Advisor’s financial condition, its ability to continue to provide services under the management agreement, and the reasonableness of the current management fee. The Board concluded that the Advisor’s profits were reasonable in light of the services provided to the Fund.
Ethics. The Board generally considers the Advisor’s commitment to providing quality services to shareholders and to conducting its business ethically. They noted that the Advisor’s practices generally meet or exceed industry best practices.
Economies of Scale. The Board also reviewed information provided by the Advisor regarding the possible existence of economies of scale in connection with the management of the Fund. The Board concluded that economies of scale are difficult to measure and predict with precision, especially on a fund-by-fund basis. The Board concluded that the Advisor is appropriately sharing economies of scale through its competitive fee structure, offering competitive fees from fund inception, and through reinvestment in its business to provide shareholders additional content and services.
Comparison to Other Funds’ Fees. The management agreement provides that the Fund pays the Advisor a single, all-inclusive (or unified) management fee for providing all services necessary for the management and operation of the Fund, other than brokerage expenses, taxes, interest, extraordinary expenses, and the fees and expenses of the Fund’s independent directors (including their independent legal counsel) and expenses incurred in connection with the provision of shareholder services and distribution services under a plan adopted pursuant to Rule 12b-1 under the 1940 Act. Under the unified fee structure, the Advisor is responsible for providing all investment advisory, custody, audit, administrative, compliance, recordkeeping, marketing and shareholder services, or arranging and supervising third parties to provide such services. By contrast, most other funds are charged a variety of fees, including an investment advisory fee, a transfer agency fee, an administrative fee, distribution charges and other expenses. Other than their investment advisory fees and any applicable Rule 12b-1 distribution fees, all other components of the total fees charged by these other funds may be increased without shareholder approval. The Board believes the unified fee structure is a benefit to Fund shareholders because it clearly discloses to shareholders the cost of owning Fund shares, and, since the unified fee cannot be increased without a vote of Fund shareholders, it shifts to the Advisor the risk of increased costs of operating the Fund and provides a direct incentive to minimize administrative inefficiencies. Part of the Board’s analysis of fee levels involves reviewing certain evaluative data compiled by an independent provider and comparing the Fund’s unified fee to the total expense ratio of other funds in the Fund’s peer group. The unified fee charged to shareholders of the Fund was slightly above the median of the total expense ratios of the Fund’s peer universe. The Board concluded that the management fee paid by the Fund to the Advisor under the management agreement is reasonable in light of the services provided to the Fund.
Comparison to Fees and Services Provided to Other Clients of the Advisor. The Board also requested and received information from the Advisor concerning the nature of the services, fees, costs and profitability of its advisory services to advisory clients other than the Fund. They observed that these varying types of client accounts require different services and involve different regulatory and entrepreneurial risks than the management of the Fund. The Board analyzed this information and concluded that the fees charged and services provided to the Fund were reasonable by comparison.
Collateral or “Fall-Out” Benefits Derived by the Advisor. The Board considered the existence of collateral benefits the Advisor may receive as a result of its relationship with the Fund. They concluded that the Advisor’s primary business is managing mutual funds and it generally does not use fund or shareholder information to generate profits in other lines of business, and therefore
does not derive any significant collateral benefits from them. The Board noted that the Advisor receives proprietary research from broker-dealers that execute fund portfolio transactions and concluded that this research is likely to benefit Fund shareholders.
Existing Relationship. The Board also considered whether there was any reason for not continuing the existing arrangement with the Advisor. In this regard, the Board was mindful of the potential disruptions of the Fund’s operations and various risks, uncertainties, and other effects that could occur as a result of a decision not to continue such relationship. In particular, the Board recognized that most shareholders have invested in the Fund on the strength of the Advisor’s industry standing and reputation and in the expectation that the Advisor will have a continuing role in providing advisory services to the Fund.
Conclusion of the Directors. As a result of this process, the Board, including all of the independent Directors and assisted by the advice of independent legal counsel, taking into account all of the factors discussed above and the information provided by the Advisor and others, concluded that the management agreement between the Fund and the Advisor is fair and reasonable in light of the services provided and should be renewed.
Retirement Account Information
As required by law, distributions you receive from certain IRAs are subject to federal income tax withholding, unless you elect not to have withholding apply. Tax will be withheld on the total amount withdrawn even though you may be receiving amounts that are not subject to withholding, such as nondeductible contributions. In such case, excess amounts of withholding could occur. You may adjust your withholding election so that a greater or lesser amount will be withheld.
If you don’t want us to withhold on this amount, you must notify us to not withhold the federal income tax. You may notify us in writing or in certain situations by telephone or through other electronic means. For systematic withdrawals, your withholding election will remain in effect until revoked or changed by filing a new election. You have the right to revoke your election at any time.
Remember, even if you elect not to have income tax withheld, you are liable for paying income tax on the taxable portion of your withdrawal. If you elect not to have income tax withheld or you don’t have enough income tax withheld, you may be responsible for payment of estimated tax. You may incur penalties under the estimated tax rules if your withholding and estimated tax payments are not sufficient. You can reduce or defer the income tax on a distribution by directly or indirectly rolling such distribution over to another IRA or eligible plan. You should consult your tax advisor for additional information.
State tax will be withheld if, at the time of your distribution, your address is within one of the mandatory withholding states and you have federal income tax withheld (or as otherwise required by state law). State taxes will be withheld from your distribution in accordance with the respective state rules.
Distributions you receive from 403(b), 457 and qualified plans are subject to special tax and withholding rules. Your plan administrator or plan sponsor is required to provide you with a special tax notice explaining those rules at the time you request a distribution. If applicable, federal and/or state taxes may be withheld from your distribution amount.
Proxy Voting Policies
Descriptions of the principles and policies that the fund's investment advisor uses in exercising the voting rights associated with the securities purchased and/or held by the fund are available without charge, upon request, by calling 1-800-345-2021 or visiting the "About Us" page of American Century Investments’ website at americancentury.com. A description of the policies is also available on the Securities and Exchange Commission’s website at sec.gov. Information regarding how the investment advisor voted proxies relating to portfolio securities during the most recent 12-month period ended June 30 is available on the "About Us" page at americancentury.com. It is also available at sec.gov.
Quarterly Portfolio Disclosure
The fund files its complete schedule of portfolio holdings with the Securities and Exchange Commission (SEC) for the first and third quarters of each fiscal year on Form N-Q. The fund’s Forms N-Q are available on the SEC’s website at sec.gov, and may be reviewed and copied at the SEC’s Public Reference Room in Washington, DC. Information on the operation of the Public Reference Room may be obtained by calling 1-800-SEC-0330. The fund also makes its complete schedule of portfolio holdings for the most recent quarter of its fiscal year available on its website at americancentury.com and, upon request, by calling 1-800-345-2021.
Other Tax Information
The following information is provided pursuant to provisions of the Internal Revenue Code.
For the fiscal year ended June 30, 2014, the fund intends to pass through to shareholders $13,954, or up to the maximum amount allowable, as a foreign tax credit which represents taxes paid on income derived from sources within foreign countries or possessions of the United States. During the fiscal year ended June 30, 2014, the fund earned $133,347 from income derived from foreign sources. Foreign source income and foreign tax expense per outstanding share on June 30, 2014 are $0.2138 and $0.0224, respectively.
|
| | |
| |
| | | |
| Contact Us | americancentury.com | |
| Automated Information Line | 1-800-345-8765 | |
| Investor Services Representative | 1-800-345-2021
or 816-531-5575 | |
| Investors Using Advisors | 1-800-378-9878 | |
Business, Not-For-Profit, Employer-Sponsored
Retirement Plans | 1-800-345-3533 | |
Banks and Trust Companies, Broker-Dealers,
Financial Professionals, Insurance Companies | 1-800-345-6488 | |
| Telecommunications Relay Service for the Deaf | 711 | |
| | | |
| American Century Quantitative Equity Funds, Inc. | |
| | | |
Investment Advisor: American Century Investment Management, Inc. Kansas City, Missouri | |
| | | |
| This report and the statements it contains are submitted for the general information of our shareholders. The report is not authorized for distribution to prospective investors unless preceded or accompanied by an effective prospectus. | |
| | | |
©2014 American Century Proprietary Holdings, Inc. All rights reserved.
CL-ANN-82894 1408 | |
|
| |
ANNUAL REPORT | JUNE 30, 2014 |
Equity Growth Fund
|
| |
| President's Letter | |
| Performance | |
| Portfolio Commentary | |
| Fund Characteristics | |
| Shareholder Fee Example | |
| Schedule of Investments | |
| Statement of Assets and Liabilities | |
| Statement of Operations | |
| Statement of Changes in Net Assets | |
| Notes to Financial Statements | |
| Financial Highlights | |
| Report of Independent Registered Public Accounting Firm | |
| Management | |
| Approval of Management Agreement | |
| Additional Information | |
Any opinions expressed in this report reflect those of the author as of the date of the report, and do not necessarily represent the opinions of American Century Investments® or any other person in the American Century Investments organization. Any such opinions are subject to change at any time based upon market or other conditions and American Century Investments disclaims any responsibility to update such opinions. These opinions may not be relied upon as investment advice and, because investment decisions made by American Century Investments funds are based on numerous factors, may not be relied upon as an indication of trading intent on behalf of any American Century Investments fund. Security examples are used for representational purposes only and are not intended as recommendations to purchase or sell securities. Performance information for comparative indices and securities is provided to American Century Investments by third party vendors. To the best of American Century Investments’ knowledge, such information is accurate at the time of printing.
|
| |
| Dear Investor:
Thank you for reviewing this annual report for the 12 months ended June 30, 2014. It provides investment performance and portfolio information for the reporting period, plus longer-term historical performance data.
Annual reports remain important vehicles for conveying information about fund returns, including market and economic factors that affected performance during the reporting period. For additional, updated investment and market insights, we encourage you to visit our website, americancentury.com.
|
| Jonathan Thomas |
Aggressive Monetary Policies Boosted Stock and Bond Returns
Stimulative monetary policies and expectations of economic improvement, interspersed with concerns about weaker-than-expected economic data and geopolitical conflicts, helped drive financial market returns during the reporting period. We believe the combination of longer-term optimism about global economic growth, low costs of capital, and central bank purchases of fixed income securities helped persuade investors to seek risk and yield, especially in the U.S. and Europe. Stock index returns were strong in these markets, particularly at the smaller capitalization end of the company size spectrum. The MSCI Europe and S&P 500® indices advanced 29.28% and 24.61%, respectively.
Remarkably, for a period in which stock market performance was so strong, government bond performance was also generally positive. Not surprisingly, U.S. corporate high-yield bonds posted double-digit returns, but the 30-year U.S. Treasury bond also outperformed most broader bond market measures. In addition, a generally weaker U.S. dollar during the reporting period meant that international bond returns for U.S. investors with currency exposure were generally higher than U.S. bonds returns. The Barclays Global Aggregate Bond and Barclays U.S. Aggregate Bond indices returned 7.39% and 4.37%, respectively.
Looking ahead, we see signs of sustained moderate economic growth in the second half of 2014, but headwinds persist. In the U.S., which was supposed to be an economic growth leader this year, housing market momentum has slowed, interest rates could rise, and economic growth and U.S. employment levels remain subpar compared with past post-recession periods. In this environment, we continue to believe in a disciplined, diversified, long-term investment approach, using professionally managed stock and bond portfolios—as appropriate—for meeting financial goals. We appreciate your continued trust in us.
Sincerely,
Jonathan Thomas
President and Chief Executive Officer
American Century Investments
|
| | | | | | |
| Total Returns as of June 30, 2014 | | | |
| | | | Average Annual Returns | |
| | Ticker Symbol | 1 year | 5 years | 10 years | Since Inception | Inception Date |
| Investor Class | BEQGX | 24.92% | 19.05% | 7.87% | 9.78% | 5/9/91 |
| S&P 500 Index | — | 24.61% | 18.82% | 7.78% | 9.59% | — |
| Institutional Class | AMEIX | 25.19% | 19.28% | 8.08% | 6.50% | 1/2/98 |
A Class(1) | BEQAX | | | | | 10/9/97 |
| No sales charge* | | 24.59% | 18.75% | 7.60% | 5.91% | |
| With sales charge* | | 17.43% | 17.36% | 6.97% | 5.54% | |
| C Class | AEYCX | 23.68% | 17.86% | 6.80% | 5.28% | 7/18/01 |
| R Class | AEYRX | 24.31% | 18.45% | — | 6.64% | 7/29/05 |
| |
| * | Sales charges include initial sales charges and contingent deferred sales charges (CDSCs), as applicable. A Class shares have a 5.75% maximum initial sales charge and may be subject to a maximum CDSC of 1.00%. C Class shares redeemed within 12 months of purchase are subject to a maximum CDSC of 1.00%. The SEC requires that mutual funds provide performance information net of maximum sales charges in all cases where charges could be applied. |
| |
| (1) | Prior to September 4, 2007, the A Class was referred to as the Advisor Class and did not have a front-end sales charge. Performance has been adjusted to reflect this charge. |
Data presented reflect past performance. Past performance is no guarantee of future results. Current performance may be higher or lower than the performance shown. Investment return and principal value will fluctuate, and redemption value may be more or less than original cost. To obtain performance data current to the most recent month end, please call 1-800-345-2021 or visit americancentury.com.
Unless otherwise indicated, performance reflects Investor Class shares; performance for other share classes will vary due to differences in fee structure. For information about other share classes available, please consult the prospectus. Data assumes reinvestment of dividends and capital gains, and none of the charts reflect the deduction of taxes that a shareholder would pay on fund distributions or the redemption of fund shares. Returns for the index are provided for comparison. The fund’s total returns include operating expenses (such as transaction costs and management fees) that reduce returns, while the total returns of the index do not.
|
|
| Growth of $10,000 Over 10 Years |
| $10,000 investment made June 30, 2004 |
|
| |
| Value on June 30, 2014 |
| | Investor Class — $21,334 |
| |
| | S&P 500 Index — $21,159 |
| |
|
| | | | |
| Total Annual Fund Operating Expenses | | |
| Investor Class | Institutional Class | A Class | C Class | R Class |
| 0.68% | 0.48% | 0.93% | 1.68% | 1.18% |
The total annual fund operating expenses shown is as stated in the fund’s prospectus current as of the date of this report. The prospectus may vary from the expense ratio shown elsewhere in this report because it is based on a different time period, includes acquired fund fees and expenses, and, if applicable, does not include fee waivers or expense reimbursements.
Data presented reflect past performance. Past performance is no guarantee of future results. Current performance may be higher or lower than the performance shown. Investment return and principal value will fluctuate, and redemption value may be more or less than original cost. To obtain performance data current to the most recent month end, please call 1-800-345-2021 or visit americancentury.com.
Unless otherwise indicated, performance reflects Investor Class shares; performance for other share classes will vary due to differences in fee structure. For information about other share classes available, please consult the prospectus. Data assumes reinvestment of dividends and capital gains, and none of the charts reflect the deduction of taxes that a shareholder would pay on fund distributions or the redemption of fund shares. Returns for the index are provided for comparison. The fund’s total returns include operating expenses (such as transaction costs and management fees) that reduce returns, while the total returns of the index do not.
Portfolio Managers: Bill Martin and Claudia Musat
Performance Summary
Equity Growth returned 24.92%* for the fiscal year ended June 30, 2014, compared with the 24.61% return of its benchmark, the S&P 500 Index.
As U.S. equity markets continued their robust appreciation, Equity Growth posted a solid gain for the 12-month period, slightly outperforming the S&P 500. Security selection in the consumer staples and industrials sectors contributed the most to fund results, while consumer discretionary holdings weighed on relative performance.
Equity Growth’s stock selection process incorporates factors of valuation, quality, growth, and momentum (sentiment) while striving to minimize unintended risks along industries and other risk characteristics. Within the fund, sentiment- and growth-based measures were the leading drivers of returns, although all factors contributed positively to results.
Consumer Staples and Industrials Outperformed
The consumer staples and industrials sectors were among the leading contributors to the fund’s returns relative to the S&P 500. Stock choices in the consumer staples sector, particularly among food products manufacturers and food and staples retailers, were especially effective, driving the sector's substantial outperformance relative to the index. Among the top sector contributors was supermarket chain store operator Safeway, which appreciated on speculation of being acquired by private equity firm Cerberus Capital Management, owner of the Albertson’s chain of grocery stores. Significant contribution also came from chain drug store Rite Aid, which rose on revenue growth and efficiency and distribution chain improvements, bolstering the sector’s return. Following their appreciation, we took profits and exited both positions. Other key sector contributors included an underweight position, relative to the benchmark, to tobacco manufacturer Philip Morris, which is weak across measures of sentiment, growth, and quality.
Industrials sector outperformance was primarily due to successful stock selection and positioning in the strongly-appreciating aerospace and defense industry. A number of defense contractors were key contributors, benefiting from an overall pickup in activity amid an improving economic landscape. Strong contributions came from Raytheon as well as Northrop Grumman, which appreciated nearly 50% largely on new government contracts. Overweight positioning in the airlines industry was also beneficial, particularly commercial airline Delta Air Lines, which nearly doubled in value thanks to solid earnings. Industrial automation giant Rockwell Automation also aided relative gains. The company appears particularly attractive across growth and sentiment measures, and is above average on quality- and valuation-based insights.
Significant contribution also came from several energy equipment manufacturers, including drilling and rig services provider Nabors Industries. The company’s solid earnings and merger news propelled its stock higher, and we sold the holding to lock in gains. Elsewhere, apparel manufacturer Hanesbrands’ earnings growth and announced intent to purchase French clothing manufacturer DBApparel, thereby increasing exposure in Europe, helped to drive its stock price higher.
*All fund returns referenced in this commentary are for Investor Class shares. Performance for other share
classes will vary due to differences in fee structure; when Investor Class performance exceeds that of the
fund's benchmark, other share classes may not. See page 3 for returns for all share classes.
Consumer Discretionary Was Leading Detractor
Security selection in the consumer discretionary sector was the principal detractor from the fund’s 12-month results. A number of specialty retailers declined during the period including office products superstore Staples, which was down nearly 30% on disappointing revenues and profits and an announcement of 225 store closings. Multiline retailer Target lagged in the wake of news about a security breach in its credit card payment system, as well as greater-than-expected cost increases associated with expansion. A portfolio-only position in apparel retailer American Eagle Outfitters was also detrimental following the holding’s decline on lower-than-expected sales early in the period. We ultimately sold the fund’s positions in Staples, Target, and American Eagle Outfitters. Other sector detractors included casino game equipment maker International Game Technology, which fell on disappointing earnings stemming from declining slot machine sales. We exited our position in the holding.
Elsewhere in the portfolio, an underweight position in biopharmaceutical company Gilead Sciences negatively impacted fund returns as strong sales of its Sovaldi Hepatitis C treatment propelled the stock higher. Several financials sector holdings also diminished returns. Mortgage service provider Ocwen Financial Corp. fell steeply in light of possible legal action by a group of investors as well as a New York state investigation into conflicts of interest. The holding was sold due to its uncertain future. Citigroup was another main underperformer. The banking giant declined on worries about emerging market currencies and economic growth rates due to its substantial exposure to those regions, but it continues to maintain a strong valuation profile.
A Look Ahead
Economic recovery in the U.S. appears to be progressing, albeit at a slower pace than during prior post-recessionary periods, and is expected to stay the course through the remainder of 2014. Recent indicators such as improvements in small business and consumer confidence point to a sustainable rebound, and economic growth is likely to further benefit from the recovering labor and housing markets. Though a continuation of political instability in non-U.S. markets as well as the potential for rising inflation and interest rates could lead to heightened market volatility, our disciplined, objective, and systematic investment strategy is designed to take advantage of opportunities at the individual company level. We believe this approach is the most powerful way to capitalize on market inefficiencies that lead to the mispricing of individual stocks. Our strategy is designed to provide investors with well-diversified and risk-controlled exposure to broad U.S. equities. As such, we do not see significant deviations versus the S&P 500. The portfolio’s current holdings exhibit the highest exposure to quality insights, followed closely by growth and value, and we maintain positive exposure to sentiment.The fund's largest, but modest, overweights are in health care and information technology, while the underweights are led by the financials and consumer staples sectors.
|
| |
| JUNE 30, 2014 | |
| Top Ten Holdings | % of net assets |
| Apple, Inc. | 4.1% |
| Johnson & Johnson | 2.4% |
| Verizon Communications, Inc. | 1.9% |
| Pfizer, Inc. | 1.8% |
| AT&T, Inc. | 1.8% |
| Intel Corp. | 1.7% |
| Merck & Co., Inc. | 1.7% |
| Exxon Mobil Corp. | 1.7% |
| Oracle Corp. | 1.6% |
| Bank of America Corp. | 1.5% |
| | |
| Top Five Industries | % of net assets |
| Pharmaceuticals | 8.4% |
| Technology Hardware, Storage and Peripherals | 6.8% |
| Oil, Gas and Consumable Fuels | 6.2% |
| Insurance | 5.1% |
| Aerospace and Defense | 5.0% |
| | |
| Types of Investments in Portfolio | % of net assets |
| Common Stocks | 99.1% |
| Temporary Cash Investments | 0.9% |
| Other Assets and Liabilities | —* |
*Category is less than 0.05% of total net assets.
Fund shareholders may incur two types of costs: (1) transaction costs, including sales charges (loads) on purchase payments and redemption/exchange fees; and (2) ongoing costs, including management fees; distribution and service (12b-1) fees; and other fund expenses. This example is intended to help you understand your ongoing costs (in dollars) of investing in your fund and to compare these costs with the ongoing cost of investing in other mutual funds.
The example is based on an investment of $1,000 made at the beginning of the period and held for the entire period from January 1, 2014 to June 30, 2014.
Actual Expenses
The table provides information about actual account values and actual expenses for each class. You may use the information, together with the amount you invested, to estimate the expenses that you paid over the period. First, identify the share class you own. Then simply divide your account value by $1,000 (for example, an $8,600 account value divided by $1,000 = 8.6), then multiply the result by the number under the heading “Expenses Paid During Period” to estimate the expenses you paid on your account during this period.
If you hold Investor Class shares of any American Century Investments fund, or Institutional Class shares of the American Century Diversified Bond Fund, in an American Century Investments account (i.e., not a financial intermediary or retirement plan account), American Century Investments may charge you a $12.50 semiannual account maintenance fee if the value of those shares is less than $10,000. We will redeem shares automatically in one of your accounts to pay the $12.50 fee. In determining your total eligible investment amount, we will include your investments in all personal accounts (including American Century Investments Brokerage accounts) registered under your Social Security number. Personal accounts include individual accounts, joint accounts, UGMA/UTMA accounts, personal trusts, Coverdell Education Savings Accounts and IRAs (including traditional, Roth, Rollover, SEP-, SARSEP- and SIMPLE-IRAs), and certain other retirement accounts. If you have only business, business retirement, employer-sponsored or American Century Investments Brokerage accounts, you are currently not subject to this fee. If you are subject to the Account Maintenance Fee, your account value could be reduced by the fee amount.
Hypothetical Example for Comparison Purposes
The table also provides information about hypothetical account values and hypothetical expenses based on the actual expense ratio of each class of your fund and an assumed rate of return of 5% per year before expenses, which is not the actual return of a fund’s share class. The hypothetical account values and expenses may not be used to estimate the actual ending account balance or expenses you paid for the period. You may use this information to compare the ongoing costs of investing in your fund and other funds. To do so, compare this 5% hypothetical example with the 5% hypothetical examples that appear in the shareholder reports of the other funds.
Please note that the expenses shown in the table are meant to highlight your ongoing costs only and do not reflect any transactional costs, such as sales charges (loads) or redemption/exchange fees. Therefore, the table is useful in comparing ongoing costs only, and will not help you determine the relative total costs of owning different funds. In addition, if these transactional costs were included, your costs would have been higher.
|
| | | | |
| | Beginning
Account Value
1/1/14 | Ending
Account Value
6/30/14 | Expenses Paid
During Period(1) 1/1/14 - 6/30/14 | Annualized
Expense Ratio(1) |
| Actual | | | | |
| Investor Class | $1,000 | $1,071.00 | $3.44 | 0.67% |
| Institutional Class | $1,000 | $1,071.90 | $2.41 | 0.47% |
| A Class | $1,000 | $1,069.50 | $4.72 | 0.92% |
| C Class | $1,000 | $1,065.70 | $8.55 | 1.67% |
| R Class | $1,000 | $1,068.30 | $6.00 | 1.17% |
| Hypothetical | | | | |
| Investor Class | $1,000 | $1,021.47 | $3.36 | 0.67% |
| Institutional Class | $1,000 | $1,022.46 | $2.36 | 0.47% |
| A Class | $1,000 | $1,020.23 | $4.61 | 0.92% |
| C Class | $1,000 | $1,016.51 | $8.35 | 1.67% |
| R Class | $1,000 | $1,018.99 | $5.86 | 1.17% |
| |
| (1) | Expenses are equal to the class’s annualized expense ratio listed in the table above, multiplied by the average account value over the period, multiplied by 181, the number of days in the most recent fiscal half-year, divided by 365, to reflect the one-half year period. |
JUNE 30, 2014
|
| | | | | |
| | Shares | Value |
| COMMON STOCKS — 99.1% | | |
| AEROSPACE AND DEFENSE — 5.0% | | |
| Boeing Co. (The) | 320,235 |
| $ | 40,743,499 |
|
| Honeywell International, Inc. | 402,147 |
| 37,379,564 |
|
| Lockheed Martin Corp. | 202,493 |
| 32,546,700 |
|
| Northrop Grumman Corp. | 206,966 |
| 24,759,342 |
|
| Raytheon Co. | 352,648 |
| 32,531,778 |
|
| | | 167,960,883 |
|
| AIR FREIGHT AND LOGISTICS — 0.7% | | |
| United Parcel Service, Inc., Class B | 223,087 |
| 22,902,111 |
|
| AIRLINES — 1.4% | | |
| Delta Air Lines, Inc. | 392,154 |
| 15,184,203 |
|
| Southwest Airlines Co. | 1,173,873 |
| 31,530,229 |
|
| | | 46,714,432 |
|
| AUTO COMPONENTS — 2.6% | | |
| Delphi Automotive plc | 401,459 |
| 27,596,292 |
|
| Gentex Corp. | 51,454 |
| 1,496,797 |
|
| Johnson Controls, Inc. | 654,457 |
| 32,677,038 |
|
| Magna International, Inc. | 242,078 |
| 26,083,904 |
|
| | | 87,854,031 |
|
| BANKS — 3.4% | | |
| Bank of America Corp. | 3,327,717 |
| 51,147,010 |
|
| Citigroup, Inc. | 76,085 |
| 3,583,604 |
|
| JPMorgan Chase & Co. | 658,936 |
| 37,967,892 |
|
| Wells Fargo & Co. | 390,140 |
| 20,505,759 |
|
| | | 113,204,265 |
|
| BEVERAGES — 1.0% | | |
| Coca-Cola Co. (The) | 91,557 |
| 3,878,354 |
|
| Dr Pepper Snapple Group, Inc. | 489,541 |
| 28,677,312 |
|
| PepsiCo, Inc. | 11,293 |
| 1,008,917 |
|
| | | 33,564,583 |
|
| BIOTECHNOLOGY — 2.9% | | |
| Amgen, Inc. | 352,724 |
| 41,751,940 |
|
Biogen Idec, Inc.(1) | 127,779 |
| 40,289,997 |
|
United Therapeutics Corp.(1) | 158,027 |
| 13,983,809 |
|
| | | 96,025,746 |
|
| CAPITAL MARKETS — 1.9% | | |
Affiliated Managers Group, Inc.(1) | 56,780 |
| 11,662,612 |
|
| Franklin Resources, Inc. | 522,938 |
| 30,246,734 |
|
Stifel Financial Corp.(1) | 144,694 |
| 6,851,261 |
|
| T. Rowe Price Group, Inc. | 10,963 |
| 925,387 |
|
| Waddell & Reed Financial, Inc., Class A | 198,061 |
| 12,396,638 |
|
| | | 62,082,632 |
|
|
| | | | | |
| | Shares | Value |
| CHEMICALS — 3.7% | | |
| Ashland, Inc. | 126,695 |
| $ | 13,776,814 |
|
| Cabot Corp. | 41,740 |
| 2,420,503 |
|
| Dow Chemical Co. (The) | 798,869 |
| 41,109,799 |
|
| Eastman Chemical Co. | 304,350 |
| 26,584,973 |
|
| NewMarket Corp. | 15,222 |
| 5,968,698 |
|
| Olin Corp. | 160,494 |
| 4,320,498 |
|
| PPG Industries, Inc. | 78,649 |
| 16,528,087 |
|
| Scotts Miracle-Gro Co. (The), Class A | 180,112 |
| 10,241,168 |
|
| Sigma-Aldrich Corp. | 34,664 |
| 3,517,703 |
|
| | | 124,468,243 |
|
| COMMERCIAL SERVICES AND SUPPLIES — 0.1% | | |
| Deluxe Corp. | 70,576 |
| 4,134,342 |
|
| COMMUNICATIONS EQUIPMENT — 3.0% | | |
| Cisco Systems, Inc. | 2,044,535 |
| 50,806,695 |
|
| QUALCOMM, Inc. | 632,122 |
| 50,064,062 |
|
| | | 100,870,757 |
|
| CONSUMER FINANCE — 0.8% | | |
| Cash America International, Inc. | 538,666 |
| 23,932,931 |
|
Portfolio Recovery Associates, Inc.(1) | 59,346 |
| 3,532,867 |
|
| | | 27,465,798 |
|
| CONTAINERS AND PACKAGING — 1.2% | | |
| Ball Corp. | 305,013 |
| 19,118,215 |
|
| Sonoco Products Co. | 513,882 |
| 22,574,836 |
|
| | | 41,693,051 |
|
| DIVERSIFIED FINANCIAL SERVICES — 1.4% | | |
Berkshire Hathaway, Inc., Class B(1) | 138,098 |
| 17,477,683 |
|
| Moody's Corp. | 22,276 |
| 1,952,714 |
|
MSCI, Inc., Class A(1) | 158,563 |
| 7,270,114 |
|
| Voya Financial, Inc. | 506,810 |
| 18,417,475 |
|
| | | 45,117,986 |
|
| DIVERSIFIED TELECOMMUNICATION SERVICES — 3.7% | | |
| AT&T, Inc. | 1,698,239 |
| 60,049,731 |
|
| Verizon Communications, Inc. | 1,272,124 |
| 62,245,027 |
|
| | | 122,294,758 |
|
| ELECTRICAL EQUIPMENT — 1.5% | | |
| Emerson Electric Co. | 492,157 |
| 32,659,538 |
|
| Rockwell Automation, Inc. | 149,256 |
| 18,680,881 |
|
| | | 51,340,419 |
|
| ELECTRONIC EQUIPMENT, INSTRUMENTS AND COMPONENTS — 0.7% | |
| TE Connectivity Ltd. | 362,188 |
| 22,397,706 |
|
| ENERGY EQUIPMENT AND SERVICES — 2.7% | | |
| Baker Hughes, Inc. | 516,634 |
| 38,463,401 |
|
| RPC, Inc. | 280,647 |
| 6,592,398 |
|
| Schlumberger Ltd. | 383,294 |
| 45,209,528 |
|
| | | 90,265,327 |
|
|
| | | | | |
| | Shares | Value |
| FOOD AND STAPLES RETAILING — 0.1% | | |
| Walgreen Co. | 64,067 |
| $ | 4,749,287 |
|
| FOOD PRODUCTS — 3.6% | | |
| Archer-Daniels-Midland Co. | 743,437 |
| 32,793,006 |
|
| Hormel Foods Corp. | 60,350 |
| 2,978,273 |
|
| Ingredion, Inc. | 143,692 |
| 10,782,648 |
|
| Kellogg Co. | 428,092 |
| 28,125,644 |
|
Pilgrim's Pride Corp.(1) | 605,709 |
| 16,572,198 |
|
| Tyson Foods, Inc., Class A | 741,669 |
| 27,842,254 |
|
| | | 119,094,023 |
|
| HEALTH CARE EQUIPMENT AND SUPPLIES — 4.2% | | |
| Becton Dickinson and Co. | 243,766 |
| 28,837,518 |
|
| C.R. Bard, Inc. | 103,522 |
| 14,804,681 |
|
| Covidien plc | 28,193 |
| 2,542,445 |
|
| Medtronic, Inc. | 594,339 |
| 37,895,055 |
|
| St. Jude Medical, Inc. | 393,953 |
| 27,281,245 |
|
| Stryker Corp. | 343,859 |
| 28,994,191 |
|
| | | 140,355,135 |
|
| HEALTH CARE PROVIDERS AND SERVICES — 0.2% | | |
| Cardinal Health, Inc. | 88,243 |
| 6,049,940 |
|
| HOTELS, RESTAURANTS AND LEISURE — 0.6% | | |
Bally Technologies, Inc.(1) | 158,731 |
| 10,431,801 |
|
| Wyndham Worldwide Corp. | 136,983 |
| 10,372,353 |
|
| | | 20,804,154 |
|
| HOUSEHOLD DURABLES — 0.6% | | |
| Newell Rubbermaid, Inc. | 410,490 |
| 12,721,085 |
|
NVR, Inc.(1) | 5,241 |
| 6,030,295 |
|
| Whirlpool Corp. | 7,022 |
| 977,603 |
|
| | | 19,728,983 |
|
| HOUSEHOLD PRODUCTS — 2.4% | | |
| Energizer Holdings, Inc. | 246,257 |
| 30,050,742 |
|
| Kimberly-Clark Corp. | 291,466 |
| 32,416,848 |
|
| Procter & Gamble Co. (The) | 205,846 |
| 16,177,437 |
|
| | | 78,645,027 |
|
| INDUSTRIAL CONGLOMERATES — 1.3% | | |
| 3M Co. | 14,612 |
| 2,093,023 |
|
| Danaher Corp. | 221,468 |
| 17,436,176 |
|
| General Electric Co. | 964,847 |
| 25,356,179 |
|
| | | 44,885,378 |
|
| INSURANCE — 5.1% | | |
| Allstate Corp. (The) | 418,868 |
| 24,595,929 |
|
| American International Group, Inc. | 665,660 |
| 36,331,723 |
|
| Amtrust Financial Services, Inc. | 457,470 |
| 19,126,821 |
|
| Aspen Insurance Holdings Ltd. | 400,782 |
| 18,203,518 |
|
| Everest Re Group Ltd. | 114,716 |
| 18,410,771 |
|
| Hanover Insurance Group, Inc. (The) | 75,632 |
| 4,776,161 |
|
|
| | | | | |
| | Shares | Value |
| Old Republic International Corp. | 1,138,010 |
| $ | 18,822,685 |
|
| RenaissanceRe Holdings Ltd. | 252,696 |
| 27,038,472 |
|
| Travelers Cos., Inc. (The) | 16,378 |
| 1,540,678 |
|
| | | 168,846,758 |
|
| INTERNET AND CATALOG RETAIL — 0.3% | | |
| Expedia, Inc. | 108,399 |
| 8,537,505 |
|
| HSN, Inc. | 26,650 |
| 1,578,746 |
|
| | | 10,116,251 |
|
| INTERNET SOFTWARE AND SERVICES — 1.9% | | |
eBay, Inc.(1) | 559,702 |
| 28,018,682 |
|
Google, Inc., Class A(1) | 8,175 |
| 4,779,677 |
|
Google, Inc., Class C(1) | 53,130 |
| 30,564,627 |
|
| | | 63,362,986 |
|
| IT SERVICES — 1.7% | | |
| Amdocs Ltd. | 250,890 |
| 11,623,734 |
|
| International Business Machines Corp. | 244,903 |
| 44,393,567 |
|
| | | 56,017,301 |
|
| LEISURE PRODUCTS — 0.7% | | |
| Hasbro, Inc. | 466,369 |
| 24,740,875 |
|
| MACHINERY — 2.4% | | |
| Caterpillar, Inc. | 355,366 |
| 38,617,623 |
|
| Dover Corp. | 179,615 |
| 16,335,984 |
|
| Snap-On, Inc. | 167,604 |
| 19,864,426 |
|
| Valmont Industries, Inc. | 29,713 |
| 4,514,891 |
|
| | | 79,332,924 |
|
| MEDIA — 2.2% | | |
| John Wiley & Sons, Inc., Class A | 93,674 |
| 5,675,708 |
|
| Time Warner, Inc. | 307,017 |
| 21,567,944 |
|
| Walt Disney Co. (The) | 521,165 |
| 44,684,687 |
|
| | | 71,928,339 |
|
| METALS AND MINING — 0.1% | | |
| Compass Minerals International, Inc. | 25,611 |
| 2,451,997 |
|
| MULTI-UTILITIES — 0.8% | | |
| Wisconsin Energy Corp. | 573,610 |
| 26,913,781 |
|
| MULTILINE RETAIL — 1.6% | | |
| Dillard's, Inc., Class A | 199,274 |
| 23,237,341 |
|
| Macy's, Inc. | 498,340 |
| 28,913,687 |
|
| | | 52,151,028 |
|
| OIL, GAS AND CONSUMABLE FUELS — 6.2% | | |
| Chevron Corp. | 157,418 |
| 20,550,920 |
|
| Encana Corp. | 1,042,875 |
| 24,726,566 |
|
| EOG Resources, Inc. | 263,384 |
| 30,779,054 |
|
| Exxon Mobil Corp. | 564,562 |
| 56,840,102 |
|
Gran Tierra Energy, Inc.(1) | 926,070 |
| 7,519,689 |
|
| Occidental Petroleum Corp. | 392,930 |
| 40,326,406 |
|
| Valero Energy Corp. | 552,442 |
| 27,677,344 |
|
| | | 208,420,081 |
|
|
| | | | | |
| | Shares | Value |
| PHARMACEUTICALS — 8.4% | | |
| AbbVie, Inc. | 778,749 |
| $ | 43,952,594 |
|
| Eli Lilly & Co. | 608,749 |
| 37,845,925 |
|
| Johnson & Johnson | 774,349 |
| 81,012,392 |
|
| Merck & Co., Inc. | 983,189 |
| 56,877,484 |
|
| Pfizer, Inc. | 2,038,842 |
| 60,512,830 |
|
| | | 280,201,225 |
|
| PROFESSIONAL SERVICES — 0.2% | | |
| Manpowergroup, Inc. | 92,160 |
| 7,819,776 |
|
| REAL ESTATE INVESTMENT TRUSTS (REITs) — 0.7% | | |
| Host Hotels & Resorts, Inc. | 1,005,649 |
| 22,134,335 |
|
| Potlatch Corp. | 18,310 |
| 758,034 |
|
| PS Business Parks, Inc. | 23,190 |
| 1,936,133 |
|
| | | 24,828,502 |
|
| SEMICONDUCTORS AND SEMICONDUCTOR EQUIPMENT — 2.9% | |
| Broadcom Corp., Class A | 787,850 |
| 29,244,992 |
|
| Intel Corp. | 1,859,630 |
| 57,462,567 |
|
| Texas Instruments, Inc. | 230,325 |
| 11,007,232 |
|
| | | 97,714,791 |
|
| SOFTWARE — 4.0% | | |
| CA, Inc. | 292,680 |
| 8,411,623 |
|
| Intuit, Inc. | 96,211 |
| 7,747,872 |
|
| Microsoft Corp. | 1,195,991 |
| 49,872,824 |
|
| Oracle Corp. | 1,330,494 |
| 53,924,922 |
|
Synopsys, Inc.(1) | 368,462 |
| 14,303,695 |
|
| | | 134,260,936 |
|
| SPECIALTY RETAIL — 1.0% | | |
AutoZone, Inc.(1) | 4,887 |
| 2,620,605 |
|
| GameStop Corp., Class A | 599,422 |
| 24,258,608 |
|
| PetSmart, Inc. | 129,443 |
| 7,740,692 |
|
| | | 34,619,905 |
|
| TECHNOLOGY HARDWARE, STORAGE AND PERIPHERALS — 6.8% | |
| Apple, Inc. | 1,483,251 |
| 137,838,515 |
|
| EMC Corp. | 1,298,813 |
| 34,210,734 |
|
| Hewlett-Packard Co. | 1,129,609 |
| 38,045,231 |
|
| Seagate Technology plc | 136,791 |
| 7,772,465 |
|
| Western Digital Corp. | 110,345 |
| 10,184,844 |
|
| | | 228,051,789 |
|
| TEXTILES, APPAREL AND LUXURY GOODS — 1.1% | | |
Deckers Outdoor Corp.(1) | 26,658 |
| 2,301,385 |
|
| Hanesbrands, Inc. | 349,115 |
| 34,366,881 |
|
| | | 36,668,266 |
|
| THRIFTS AND MORTGAGE FINANCE — 0.3% | | |
| EverBank Financial Corp. | 496,994 |
| 10,019,399 |
|
TOBACCO† | | |
| Philip Morris International, Inc. | 8,559 |
| 721,609 |
|
TOTAL COMMON STOCKS (Cost $2,577,722,163) | | 3,313,857,516 |
|
|
| | | | | |
| | Shares | Value |
| TEMPORARY CASH INVESTMENTS — 0.9% | | |
| Repurchase Agreement, Bank of America Merrill Lynch, (collateralized by various U.S. Treasury obligations, 0.75% - 0.875%, 1/31/18 - 2/28/18, valued at $6,485,789), in a joint trading account at 0.05%, dated 6/30/14, due 7/1/14 (Delivery value $6,355,273) | | $ | 6,355,264 |
|
| Repurchase Agreement, Credit Suisse First Boston, Inc., (collateralized by various U.S. Treasury obligations, 1.75%, 5/15/23, valued at $2,595,156), in a joint trading account at 0.01%, dated 6/30/14, due 7/1/14 (Delivery value $2,542,107) | | 2,542,106 |
|
| Repurchase Agreement, Goldman Sachs & Co., (collateralized by various U.S. Treasury obligations, 3.125%, 11/15/41, valued at $5,186,487), in a joint trading account at 0.03%, dated 6/30/14, due 7/1/14 (Delivery value $5,084,215) | | 5,084,211 |
|
| SSgA U.S. Government Money Market Fund, Class N | 15,024,732 |
| 15,024,732 |
|
TOTAL TEMPORARY CASH INVESTMENTS (Cost $29,006,313) | | 29,006,313 |
|
TOTAL INVESTMENT SECURITIES — 100.0% (Cost $2,606,728,476) | | 3,342,863,829 |
|
OTHER ASSETS AND LIABILITIES† | | 931,475 |
|
| TOTAL NET ASSETS — 100.0% | | $ | 3,343,795,304 |
|
|
| | |
| NOTES TO SCHEDULE OF INVESTMENTS |
| |
| † | Category is less than 0.05% of total net assets. |
See Notes to Financial Statements.
|
|
| Statement of Assets and Liabilities |
|
| | | |
| JUNE 30, 2014 | |
| Assets | |
| Investment securities, at value (cost of $2,606,728,476) | $ | 3,342,863,829 |
|
| Cash | 62,051 |
|
| Receivable for investments sold | 4,125,946 |
|
| Receivable for capital shares sold | 1,715,262 |
|
| Dividends and interest receivable | 3,528,476 |
|
| | 3,352,295,564 |
|
| | |
| Liabilities | |
| Payable for investments purchased | 5,685,318 |
|
| Payable for capital shares redeemed | 998,818 |
|
| Accrued management fees | 1,739,715 |
|
| Distribution and service fees payable | 76,409 |
|
| | 8,500,260 |
|
| | |
| Net Assets | $ | 3,343,795,304 |
|
| | |
| Net Assets Consist of: | |
| Capital (par value and paid-in surplus) | $ | 2,373,636,400 |
|
| Undistributed net investment income | 2,227,251 |
|
| Undistributed net realized gain | 231,796,300 |
|
| Net unrealized appreciation | 736,135,353 |
|
| | $ | 3,343,795,304 |
|
|
| | | | | | |
| | Net Assets | Shares Outstanding | Net Asset Value Per Share |
| Investor Class, $0.01 Par Value |
| $2,568,710,587 |
| 78,440,804 |
| $32.75 |
| Institutional Class, $0.01 Par Value |
| $450,166,351 |
| 13,738,808 |
| $32.77 |
| A Class, $0.01 Par Value |
| $298,676,535 |
| 9,128,793 |
| $32.72* |
| C Class, $0.01 Par Value |
| $13,446,612 |
| 413,769 |
| $32.50 |
| R Class, $0.01 Par Value |
| $12,795,219 |
| 390,853 |
| $32.74 |
*Maximum offering price $34.72 (net asset value divided by 0.9425).
See Notes to Financial Statements.
|
| | | |
| YEAR ENDED JUNE 30, 2014 | |
| Investment Income (Loss) | |
| Income: | |
| Dividends (net of foreign taxes withheld of $24,656) | $ | 64,044,467 |
|
| Interest | 5,335 |
|
| | 64,049,802 |
|
| | |
| Expenses: | |
| Management fees | 19,301,861 |
|
| Distribution and service fees: | |
| A Class | 669,057 |
|
| C Class | 108,815 |
|
| R Class | 58,199 |
|
| Directors' fees and expenses | 181,800 |
|
| | 20,319,732 |
|
| | |
| Net investment income (loss) | 43,730,070 |
|
| | |
| Realized and Unrealized Gain (Loss) | |
| Net realized gain (loss) on investment transactions | 343,786,771 |
|
| Change in net unrealized appreciation (depreciation) on investments | 274,003,480 |
|
| | |
| Net realized and unrealized gain (loss) | 617,790,251 |
|
| | |
| Net Increase (Decrease) in Net Assets Resulting from Operations | $ | 661,520,321 |
|
See Notes to Financial Statements.
|
|
| Statement of Changes in Net Assets |
|
| | | | | | |
| YEARS ENDED JUNE 30, 2014 AND JUNE 30, 2013 | | |
| Increase (Decrease) in Net Assets | June 30, 2014 | June 30, 2013 |
| Operations | | |
| Net investment income (loss) | $ | 43,730,070 |
| $ | 43,632,991 |
|
| Net realized gain (loss) | 343,786,771 |
| 294,643,883 |
|
| Change in net unrealized appreciation (depreciation) | 274,003,480 |
| 117,964,810 |
|
| Net increase (decrease) in net assets resulting from operations | 661,520,321 |
| 456,241,684 |
|
| | | |
| Distributions to Shareholders | | |
| From net investment income: | | |
| Investor Class | (33,042,705 | ) | (33,048,796 | ) |
| Institutional Class | (6,326,318 | ) | (6,069,274 | ) |
| A Class | (3,111,946 | ) | (3,263,216 | ) |
| C Class | (43,709 | ) | (61,024 | ) |
| R Class | (103,113 | ) | (106,615 | ) |
| From net realized gains: | | |
| Investor Class | (97,419,589 | ) | — |
|
| Institutional Class | (16,453,295 | ) | — |
|
| A Class | (11,119,624 | ) | — |
|
| C Class | (452,244 | ) | — |
|
| R Class | (534,564 | ) | — |
|
| Decrease in net assets from distributions | (168,607,107 | ) | (42,548,925 | ) |
| | | |
| Capital Share Transactions | | |
Net increase (decrease) in net assets from capital share transactions (Note 5) | 208,528,008 |
| 160,369,984 |
|
| | | |
| Net increase (decrease) in net assets | 701,441,222 |
| 574,062,743 |
|
| | | |
| Net Assets | | |
| Beginning of period | 2,642,354,082 |
| 2,068,291,339 |
|
| End of period | $ | 3,343,795,304 |
| $ | 2,642,354,082 |
|
| | | |
| Undistributed net investment income | $ | 2,227,251 |
| $ | 1,760,891 |
|
See Notes to Financial Statements.
|
|
| Notes to Financial Statements |
JUNE 30, 2014
1. Organization
American Century Quantitative Equity Funds, Inc. (the corporation) is registered under the Investment Company Act of 1940, as amended (the 1940 Act), as an open-end management investment company and is organized as a Maryland corporation. Equity Growth Fund (the fund) is one fund in a series issued by the corporation. The fund is diversified as defined under the 1940 Act. The fund’s investment objective is to seek long-term capital growth by investing in common stocks.
The fund offers the Investor Class, the Institutional Class, the A Class, the C Class and the R Class. The A Class may incur an initial sales charge. The A Class and C Class may be subject to a contingent deferred sales charge. The share classes differ principally in their respective sales charges and distribution and shareholder servicing expenses and arrangements. The Institutional Class is made available to institutional shareholders or through financial intermediaries whose clients do not require the same level of shareholder and administrative services as shareholders of other classes. As a result, the Institutional Class is charged a lower unified management fee.
2. Significant Accounting Policies
The following is a summary of significant accounting policies consistently followed by the fund in preparation of its financial statements. The financial statements are prepared in conformity with accounting principles generally accepted in the United States of America, which may require management to make certain estimates and assumptions at the date of the financial statements. Actual results could differ from these estimates. Management evaluated the impact of events or transactions occurring through the date the financial statements were issued that would merit recognition or disclosure.
Investment Valuations — The fund determines the fair value of its investments and computes its net asset value per share at the close of regular trading (usually 4 p.m. Eastern time) on the New York Stock Exchange (NYSE) on each day the NYSE is open. The Board of Directors has adopted valuation policies and procedures to guide the investment advisor in the fund’s investment valuation process and to provide methodologies for the oversight of the fund’s pricing function.
Equity securities that are listed or traded on a domestic securities exchange are valued at the last reported sales price or at the official closing price as provided by the exchange. Equity securities traded on foreign securities exchanges are generally valued at the closing price of such securities on the exchange where primarily traded or at the close of the NYSE, if that is earlier. If no last sales price is reported, or if local convention or regulation so provides, the mean of the latest bid and asked prices may be used. Securities traded over-the-counter are valued at the mean of the latest bid and asked prices, the last sales price, or the official closing price.
Fixed income securities maturing within 60 days at the time of purchase may be valued at cost, plus or minus any amortized discount or premium or at the evaluated mean as provided by an independent pricing service. Evaluated mean prices are commonly derived through utilization of market models, which may consider, among other factors: trade data, quotations from dealers and active market makers, relevant yield curve and spread data, related sector levels, creditworthiness, trade data or market information on comparable securities, and other relevant security specific information.
Open-end management investment companies are valued at the reported net asset value per share. Repurchase agreements are valued at cost, which approximates fair value.
If the fund determines that the market price for an investment is not readily available or the valuation methods mentioned above do not reflect an investment’s fair value, such investment is valued as determined in good faith by the Board of Directors or its delegate, in accordance with policies and procedures adopted by the Board of Directors. In its determination of fair value, the fund may review several factors including, but not limited to, market information regarding the specific investment or comparable investments and correlation with other investment types, futures indices or general market indicators. Circumstances that may cause the fund to use these procedures to value an investment include, but are not limited to: an investment has been declared in default or is distressed; trading in a security has been suspended during the trading day or a
security is not actively trading on its principal exchange; prices received from a regular pricing source are deemed unreliable; or there is a foreign market holiday and no trading occurred.
The fund monitors for significant events occurring after the close of an investment’s primary exchange but before the fund’s net asset value per share is determined. Significant events may include, but are not limited to: corporate announcements and transactions; governmental action and political unrest that could impact a specific investment or an investment sector; or armed conflicts, natural disasters and similar events that could affect investments in a specific country or region. The fund also monitors for significant fluctuations between domestic and foreign markets, as evidenced by the U.S. market or such other indicators that the Board of Directors, or its delegate, deems appropriate. If significant fluctuations in foreign markets are identified, the fund may apply a model-derived factor to the closing price of equity securities traded on foreign securities exchanges. The factor is based on observable market data as provided by an independent pricing service.
Security Transactions — Security transactions are accounted for as of the trade date. Net realized gains and losses are determined on the identified cost basis, which is also used for federal income tax purposes.
Investment Income — Dividend income less foreign taxes withheld, if any, is recorded as of the ex-dividend date. Distributions received on securities that represent a return of capital or long-term capital gain are recorded as a reduction of cost of investments and/or as a realized gain. The fund may estimate the components of distributions received that may be considered nontaxable distributions or long-term capital gain distributions for income tax purposes. Interest income is recorded on the accrual basis and includes accretion of discounts and amortization of premiums.
Repurchase Agreements — The fund may enter into repurchase agreements with institutions that American Century Investment Management, Inc. (ACIM) (the investment advisor) has determined are creditworthy pursuant to criteria adopted by the Board of Directors. The fund requires that the collateral, represented by securities, received in a repurchase transaction be transferred to the custodian in a manner sufficient to enable the fund to obtain those securities in the event of a default under the repurchase agreement. ACIM monitors, on a daily basis, the securities transferred to ensure the value, including accrued interest, of the securities under each repurchase agreement is equal to or greater than amounts owed to the fund under each repurchase agreement.
Joint Trading Account — Pursuant to an Exemptive Order issued by the Securities and Exchange Commission, the fund, along with certain other funds in the American Century Investments family of funds, may transfer uninvested cash balances into a joint trading account. These balances are invested in one or more repurchase agreements that are collateralized by U.S. Treasury or Agency obligations.
Income Tax Status — It is the fund’s policy to distribute substantially all net investment income and net realized gains to shareholders and to otherwise qualify as a regulated investment company under provisions of the Internal Revenue Code. Accordingly, no provision has been made for income taxes. The fund files U.S. federal, state, local and non-U.S. tax returns as applicable. The fund's tax returns are subject to examination by the relevant taxing authority until expiration of the applicable statute of limitations, which is generally three years from the date of filing but can be longer in certain jurisdictions. At this time, management believes there are no uncertain tax positions which, based on their technical merit, would not be sustained upon examination and for which it is reasonably possible that the total amounts of unrecognized tax benefits will significantly change in the next twelve months.
Multiple Class — All shares of the fund represent an equal pro rata interest in the net assets of the class to which such shares belong, and have identical voting, dividend, liquidation and other rights and the same terms and conditions, except for class specific expenses and exclusive rights to vote on matters affecting only individual classes. Income, non-class specific expenses, and realized and unrealized capital gains and losses of the fund are allocated to each class of shares based on their relative net assets.
Distributions to Shareholders — Distributions from net investment income, if any, are generally declared and paid quarterly. Distributions from net realized gains, if any, are generally declared and paid annually.
Indemnifications — Under the corporation’s organizational documents, its officers and directors are indemnified against certain liabilities arising out of the performance of their duties to the fund. In addition, in the normal course of business, the fund enters into contracts that provide general indemnifications. The maximum exposure under these arrangements is unknown as this would involve future claims that may be made against a fund. The risk of material loss from such claims is considered by management to be remote.
3. Fees and Transactions with Related Parties
Certain officers and directors of the corporation are also officers and/or directors of American Century Companies, Inc. (ACC). The corporation’s investment advisor, ACIM, the corporation's distributor, American Century Investment Services, Inc. (ACIS), and the corporation’s transfer agent, American Century Services, LLC, are wholly owned, directly or indirectly, by ACC. Various funds issued by American Century Asset Allocation Portfolios, Inc. own, in aggregate, 12% of the shares of the fund.
Management Fees — The corporation has entered into a management agreement with ACIM, under which ACIM provides the fund with investment advisory and management services in exchange for a single, unified management fee (the fee) per class. The agreement provides that all expenses of managing and operating the fund, except distribution and service fees, brokerage expenses, taxes, interest, fees and expenses of the independent directors (including legal counsel fees), and extraordinary expenses, will be paid by ACIM. The fee is computed and accrued daily based on each class’s daily net assets and paid monthly in arrears. The fee consists of (1) an Investment Category Fee based on the daily net assets of the fund and certain other accounts managed by the investment advisor that are in the same broad investment category as the fund and (2) a Complex Fee based on the assets of all the funds in the American Century Investments family of funds. The rates for the Investment Category Fee range from 0.3380% to 0.5200%. The rates for the Complex Fee range from 0.2500% to 0.3100% for the Investor Class, A Class, C Class and R Class. The rates for the Complex Fee range from 0.0500% to 0.1100% for the Institutional Class. The effective annual management fee for each class for the year ended June 30, 2014 was 0.67% for the Investor Class, A Class, C Class and R Class and 0.47% for the Institutional Class.
Distribution and Service Fees — The Board of Directors has adopted a separate Master Distribution and Individual Shareholder Services Plan for each of the A Class, C Class and R Class (collectively the plans), pursuant to Rule 12b-1 of the 1940 Act. The plans provide that the A Class will pay ACIS an annual distribution and service fee of 0.25%. The plans provide that the C Class will pay ACIS an annual distribution and service fee of 1.00%, of which 0.25% is paid for individual shareholder services and 0.75% is paid for distribution services. The plans provide that the R Class will pay ACIS an annual distribution and service fee of 0.50%. The fees are computed and accrued daily based on each class’s daily net assets and paid monthly in arrears. The fees are used to pay financial intermediaries for distribution and individual shareholder services. Fees incurred under the plans during the year ended June 30, 2014 are detailed in the Statement of Operations.
Directors' Fees and Expenses — The Board of Directors is responsible for overseeing the investment advisor’s management and operations of the fund. The directors receive detailed information about the fund and its investment advisor regularly throughout the year, and meet at least quarterly with management of the investment advisor to review reports about fund operations. Fees and expenses incurred in conjunction with the directors during the year ended June 30, 2014 are detailed in the Statement of Operations. The fund’s officers do not receive compensation from the fund.
4. Investment Transactions
Purchases and sales of investment securities, excluding short-term investments, for the year ended June 30, 2014 were $2,458,143,272 and $2,371,392,166, respectively.
5. Capital Share Transactions
Transactions in shares of the fund were as follows:
|
| | | | | | | | | | |
| | Year ended June 30, 2014 | Year ended June 30, 2013 |
| | Shares | Amount | Shares | Amount |
| Investor Class/Shares Authorized | 400,000,000 |
| | 400,000,000 |
| |
| Sold | 10,817,509 |
| $ | 328,452,026 |
| 15,328,834 |
| $ | 390,764,923 |
|
| Issued in reinvestment of distributions | 4,256,773 |
| 128,872,644 |
| 1,270,317 |
| 32,521,097 |
|
| Redeemed | (11,629,899 | ) | (352,671,700 | ) | (12,603,686 | ) | (322,348,337 | ) |
| | 3,444,383 |
| 104,652,970 |
| 3,995,465 |
| 100,937,683 |
|
| Institutional Class/Shares Authorized | 90,000,000 |
| | 90,000,000 |
| |
| Sold | 4,665,915 |
| 141,911,794 |
| 7,780,588 |
| 193,149,671 |
|
| Issued in reinvestment of distributions | 748,636 |
| 22,705,520 |
| 236,786 |
| 6,064,308 |
|
| Redeemed | (2,603,995 | ) | (79,289,381 | ) | (6,389,784 | ) | (160,992,644 | ) |
| | 2,810,556 |
| 85,327,933 |
| 1,627,590 |
| 38,221,335 |
|
| A Class/Shares Authorized | 50,000,000 |
| | 80,000,000 |
| |
| Sold | 1,649,958 |
| 50,403,488 |
| 1,925,292 |
| 48,494,309 |
|
| Issued in reinvestment of distributions | 461,154 |
| 13,933,693 |
| 125,102 |
| 3,194,532 |
|
| Redeemed | (1,642,181 | ) | (49,790,221 | ) | (1,272,971 | ) | (32,460,561 | ) |
| | 468,931 |
| 14,546,960 |
| 777,423 |
| 19,228,280 |
|
| C Class/Shares Authorized | 10,000,000 |
| | 10,000,000 |
| |
| Sold | 118,288 |
| 3,619,781 |
| 87,682 |
| 2,217,568 |
|
| Issued in reinvestment of distributions | 15,240 |
| 455,468 |
| 2,253 |
| 56,375 |
|
| Redeemed | (47,976 | ) | (1,444,342 | ) | (64,868 | ) | (1,613,380 | ) |
| | 85,552 |
| 2,630,907 |
| 25,067 |
| 660,563 |
|
| R Class/Shares Authorized | 10,000,000 |
| | 10,000,000 |
| |
| Sold | 182,812 |
| 5,509,223 |
| 147,847 |
| 3,808,972 |
|
| Issued in reinvestment of distributions | 21,122 |
| 637,563 |
| 4,180 |
| 106,615 |
|
| Redeemed | (159,249 | ) | (4,777,548 | ) | (99,866 | ) | (2,593,464 | ) |
| | 44,685 |
| 1,369,238 |
| 52,161 |
| 1,322,123 |
|
| Net increase (decrease) | 6,854,107 |
| $ | 208,528,008 |
| 6,477,706 |
| $ | 160,369,984 |
|
6. Fair Value Measurements
The fund’s investments valuation process is based on several considerations and may use multiple inputs to determine the fair value of the investments held by the fund. In conformity with accounting principles generally accepted in the United States of America, the inputs used to determine a valuation are classified into three broad levels.
| |
| • | Level 1 valuation inputs consist of unadjusted quoted prices in an active market for identical investments. |
| |
| • | Level 2 valuation inputs consist of direct or indirect observable market data (including quoted prices for comparable investments, evaluations of subsequent market events, interest rates, prepayment speeds, credit risk, etc.). These inputs also consist of quoted prices for identical investments initially expressed in local currencies that are adjusted through translation into U.S. dollars. |
| |
| • | Level 3 valuation inputs consist of unobservable data (including a fund’s own assumptions). |
The level classification is based on the lowest level input that is significant to the fair valuation measurement. The valuation inputs are not necessarily an indication of the risks associated with investing in these securities or other financial instruments.
The following is a summary of the level classifications as of period end. The Schedule of Investments provides additional information on the fund’s portfolio holdings.
|
| | | | | | | | |
| | Level 1 | Level 2 | Level 3 |
| Assets | | | |
| Investment Securities | | | |
| Common Stocks | $ | 3,313,857,516 |
| — |
| — |
|
| Temporary Cash Investments | 15,024,732 |
| $ | 13,981,581 |
| — |
|
| | $ | 3,328,882,248 |
| $ | 13,981,581 |
| — |
|
7. Federal Tax Information
The tax character of distributions paid during the years ended June 30, 2014 and June 30, 2013 were as follows:
|
| | | | | | |
| | 2014 | 2013 |
| Distributions Paid From | | |
| Ordinary income | $ | 92,093,892 |
| $ | 42,548,925 |
|
| Long-term capital gains | $ | 76,513,215 |
| – |
|
The book-basis character of distributions made during the year from net investment income or net realized gains may differ from their ultimate characterization for federal income tax purposes. These differences reflect the differing character of certain income items and net realized gains and losses for financial statement and tax purposes, and may result in reclassification among certain capital accounts on the financial statements.
As of June 30, 2014, the federal tax cost of investments and the components of distributable earnings on a tax-basis were as follows:
|
| | | |
| Federal tax cost of investments | $ | 2,610,110,991 |
|
| Gross tax appreciation of investments | $ | 741,827,203 |
|
| Gross tax depreciation of investments | (9,074,365 | ) |
| Net tax appreciation (depreciation) of investments | $ | 732,752,838 |
|
| Undistributed ordinary income | $ | 81,460,785 |
|
| Accumulated long-term gains | $ | 155,945,281 |
|
| | |
The difference between book-basis and tax-basis unrealized appreciation (depreciation) is attributable primarily to the tax deferral of losses on wash sales.
|
| | | | | | | | | | | | | | | |
| For a Share Outstanding Throughout the Years Ended June 30 (except as noted) | | | | | | |
| Per-Share Data | | | | | | | | Ratios and Supplemental Data | | |
| | | Income From Investment Operations: | Distributions From: | | | Ratio to Average Net Assets of: | | |
| | Net Asset
Value,
Beginning
of Period | Net
Investment
Income
(Loss)(1) | Net
Realized
and
Unrealized
Gain (Loss) | Total From
Investment
Operations | Net
Investment
Income | Net
Realized
Gains | Total
Distributions | Net Asset
Value,
End
of Period | Total
Return(2) | Operating
Expenses | Net
Investment
Income
(Loss) | Portfolio
Turnover
Rate | Net
Assets,
End of
Period
(in thousands) |
| Investor Class | | | | | | | | | | | |
| 2014 | $27.74 | 0.44 | 6.31 | 6.75 | (0.43) | (1.31) | (1.74) | $32.75 | 24.92% | 0.67% | 1.45% | 80% |
| $2,568,711 |
|
| 2013 | $23.30 | 0.47 | 4.43 | 4.90 | (0.46) | – | (0.46) | $27.74 | 21.19% | 0.68% | 1.82% | 94% |
| $2,080,375 |
|
| 2012 | $22.37 | 0.34 | 0.93 | 1.27 | (0.34) | – | (0.34) | $23.30 | 5.76% | 0.68% | 1.55% | 86% |
| $1,654,130 |
|
| 2011 | $17.20 | 0.26 | 5.16 | 5.42 | (0.25) | – | (0.25) | $22.37 | 31.66% | 0.69% | 1.28% | 74% |
| $1,615,829 |
|
| 2010 | $15.32 | 0.21 | 1.87 | 2.08 | (0.20) | – | (0.20) | $17.20 | 13.47% | 0.70% | 1.14% | 64% |
| $1,371,992 |
|
| Institutional Class | | | | | | | | | | | |
| 2014 | $27.75 | 0.50 | 6.32 | 6.82 | (0.49) | (1.31) | (1.80) | $32.77 | 25.19% | 0.47% | 1.65% | 80% |
| $450,166 |
|
| 2013 | $23.31 | 0.52 | 4.43 | 4.95 | (0.51) | – | (0.51) | $27.75 | 21.42% | 0.48% | 2.02% | 94% |
| $303,312 |
|
| 2012 | $22.38 | 0.38 | 0.93 | 1.31 | (0.38) | – | (0.38) | $23.31 | 5.97% | 0.48% | 1.75% | 86% |
| $216,802 |
|
| 2011 | $17.21 | 0.30 | 5.17 | 5.47 | (0.30) | – | (0.30) | $22.38 | 31.91% | 0.49% | 1.48% | 74% |
| $200,191 |
|
| 2010 | $15.33 | 0.24 | 1.87 | 2.11 | (0.23) | – | (0.23) | $17.21 | 13.69% | 0.50% | 1.34% | 64% |
| $203,860 |
|
| A Class | | | | | | | | | | | | | |
| 2014 | $27.72 | 0.37 | 6.29 | 6.66 | (0.35) | (1.31) | (1.66) | $32.72 | 24.59% | 0.92% | 1.20% | 80% |
| $298,677 |
|
| 2013 | $23.28 | 0.40 | 4.43 | 4.83 | (0.39) | – | (0.39) | $27.72 | 20.91% | 0.93% | 1.57% | 94% |
| $240,027 |
|
| 2012 | $22.35 | 0.28 | 0.93 | 1.21 | (0.28) | – | (0.28) | $23.28 | 5.51% | 0.93% | 1.30% | 86% |
| $183,498 |
|
| 2011 | $17.19 | 0.20 | 5.16 | 5.36 | (0.20) | – | (0.20) | $22.35 | 31.30% | 0.94% | 1.03% | 74% |
| $182,195 |
|
| 2010 | $15.31 | 0.16 | 1.87 | 2.03 | (0.15) | – | (0.15) | $17.19 | 13.20% | 0.95% | 0.89% | 64% |
| $237,076 |
|
|
| | | | | | | | | | | | | | | |
| For a Share Outstanding Throughout the Years Ended June 30 (except as noted) | | | | | | |
| Per-Share Data | | | | | | | | Ratios and Supplemental Data | | |
| | | Income From Investment Operations: | Distributions From: | | | Ratio to Average Net Assets of: | | |
| | Net Asset
Value,
Beginning
of Period | Net
Investment
Income
(Loss)(1) | Net
Realized
and
Unrealized
Gain (Loss) | Total From
Investment
Operations | Net
Investment
Income | Net
Realized
Gains | Total
Distributions | Net Asset
Value,
End
of Period | Total
Return(2) | Operating
Expenses | Net
Investment
Income
(Loss) | Portfolio
Turnover
Rate | Net
Assets,
End of
Period
(in thousands) |
| C Class | | | | | | | | | | | | | |
| 2014 | $27.54 | 0.14 | 6.25 | 6.39 | (0.12) | (1.31) | (1.43) | $32.50 | 23.68% | 1.67% | 0.45% | 80% |
| $13,447 |
|
| 2013 | $23.13 | 0.21 | 4.40 | 4.61 | (0.20) | – | (0.20) | $27.54 | 20.02% | 1.68% | 0.82% | 94% |
| $9,039 |
|
| 2012 | $22.21 | 0.12 | 0.92 | 1.04 | (0.12) | – | (0.12) | $23.13 | 4.71% | 1.68% | 0.55% | 86% |
| $7,013 |
|
| 2011 | $17.08 | 0.06 | 5.12 | 5.18 | (0.05) | – | (0.05) | $22.21 | 30.34% | 1.69% | 0.28% | 74% |
| $6,611 |
|
| 2010 | $15.22 | 0.03 | 1.85 | 1.88 | (0.02) | – | (0.02) | $17.08 | 12.33% | 1.70% | 0.14% | 64% |
| $5,536 |
|
| R Class | | | | | | | | | | | | | |
| 2014 | $27.73 | 0.29 | 6.30 | 6.59 | (0.27) | (1.31) | (1.58) | $32.74 | 24.31% | 1.17% | 0.95% | 80% |
| $12,795 |
|
| 2013 | $23.29 | 0.34 | 4.43 | 4.77 | (0.33) | – | (0.33) | $27.73 | 20.60% | 1.18% | 1.32% | 94% |
| $9,600 |
|
| 2012 | $22.36 | 0.23 | 0.93 | 1.16 | (0.23) | – | (0.23) | $23.29 | 5.24% | 1.18% | 1.05% | 86% |
| $6,848 |
|
| 2011 | $17.20 | 0.16 | 5.15 | 5.31 | (0.15) | – | (0.15) | $22.36 | 30.95% | 1.19% | 0.78% | 74% |
| $5,189 |
|
| 2010 | $15.32 | 0.12 | 1.87 | 1.99 | (0.11) | – | (0.11) | $17.20 | 12.91% | 1.20% | 0.64% | 64% |
| $3,770 |
|
|
|
| Notes to Financial Highlights |
| |
| (1) | Computed using average shares outstanding throughout the period. |
| |
| (2) | Total returns are calculated based on the net asset value of the last business day and do not reflect applicable sales charges, if any. Total returns for periods less than one year are not annualized. |
See Notes to Financial Statements.
|
|
| Report of Independent Registered Public Accounting Firm |
To the Directors of the American Century Quantitative Equity Funds, Inc. and Shareholders of the Equity Growth Fund:
In our opinion, the accompanying statement of assets and liabilities, including the schedule of investments, and the related statements of operations, of changes in net assets and the financial highlights present fairly, in all material respects, the financial position of the Equity Growth Fund (one of the fifteen funds comprising the American Century Quantitative Equity Funds, Inc., hereafter referred to as the “Fund”) at June 30, 2014, the results of its operations for the year then ended, the changes in its net assets for each of the two years in the period then ended and the financial highlights for each of the five years in the period then ended, in conformity with accounting principles generally accepted in the United States of America. These financial statements and financial highlights (hereafter referred to as "financial statements") are the responsibility of the Fund's management. Our responsibility is to express an opinion on these financial statements based on our audits. We conducted our audits of these financial statements in accordance with the standards of the Public Company Accounting Oversight Board (United States). Those standards require that we plan and perform the audit to obtain reasonable assurance about whether the financial statements are free of material misstatement. An audit includes examining, on a test basis, evidence supporting the amounts and disclosures in the financial statements, assessing the accounting principles used and significant estimates made by management, and evaluating the overall financial statement presentation. We believe that our audits, which included confirmation of securities at June 30, 2014 by correspondence with the custodian and brokers, provide a reasonable basis for our opinion.
PricewaterhouseCoopers LLP
Kansas City, Missouri
August 21, 2014
Board of Directors
The individuals listed below serve as directors of the funds. Each director will continue to serve in this capacity until death, retirement, resignation or removal from office. The board has adopted a mandatory retirement age for directors who are not “interested persons,” as that term is defined in the Investment Company Act (independent directors). Independent directors shall retire on December 31 of the year in which they reach their 75th birthday; provided, however, that on or after January 1, 2022, independent directors shall retire on December 31 of the year in which they reach their 76th birthday.
Mr. Thomas is an “interested person” because he currently serves as President and Chief Executive Officer of American Century Companies, Inc. (ACC), the parent company of American Century Investment Management, Inc. (ACIM or the advisor). The other directors (more than three-fourths of the total number) are independent. They are not employees, directors or officers of, and have no financial interest in, ACC or any of its wholly owned, direct or indirect, subsidiaries, including ACIM, American Century Investment Services, Inc. (ACIS) and American Century Services, LLC (ACS), and do not have any other affiliations, positions or relationships that would cause them to be considered “interested persons” under the Investment Company Act. The directors serve in this capacity for eight (in the case of Mr. Thomas, 15) registered investment companies in the American Century Investments family of funds.
The following table presents additional information about the directors. The mailing address for each director other than Mr. Thomas is 1665 Charleston Road, Mountain View, California 94043. The mailing address for Mr. Thomas is 4500 Main Street, Kansas City, Missouri 64111.
|
| | | | | |
Name (Year of Birth) | Position(s) Held with Funds | Length of Time Served | Principal Occupation(s) During Past 5 Years | Number of
American
Century
Portfolios
Overseen
by Director | Other Directorships Held During Past 5 Years |
| Independent Directors |
Tanya S. Beder (1955) | Director | Since 2011 | Chairman, SBCC Group Inc. (independent advisory services) (2006 to present) | 42 | CYS Investments, Inc. (specialty finance company) |
Jeremy I. Bulow (1954) | Director | Since 2011 | Professor of Economics, Stanford University, Graduate School of Business (1979 to present) | 42 | None |
Ronald J. Gilson (1946) | Director and Chairman of the Board | Since 1995 (Chairman since 2005) | Charles J. Meyers Professor of Law and Business, Stanford Law School (1979 to present); Marc and Eva Stern Professor of Law and Business, Columbia University School of Law (1992 to present) | 42 | None |
|
| | | | | |
Name (Year of Birth) | Position(s) Held with Funds | Length of Time Served | Principal Occupation(s) During Past 5 Years | Number of
American
Century
Portfolios
Overseen
by Director | Other Directorships Held During Past 5 Years |
| Independent Directors |
Frederick L. A. Grauer (1946) | Director | Since 2008 | Senior Advisor, BlackRock, Inc. (investment management firm) (2010 to 2011); Senior Advisor, Barclays Global Investors (investment management firm) (2003 to 2009) | 42 | None |
Peter F. Pervere
(1947) | Director | Since 2007 | Retired | 42 | Intraware, Inc. (2003 to 2009) |
Myron S. Scholes(1) (1941) | Director | Since 1980 | Chairman, Platinum Grove Asset Management, L.P. (asset manager) (1999 to 2009); Frank E. Buck Professor of Finance-Emeritus, Stanford Graduate School of Business (1996 to present) | 42 | Dimensional Fund Advisors (investment advisor); CME Group, Inc. (futures and options exchange) |
John B. Shoven
(1947) | Director | Since 2002 | Professor of Economics, Stanford University (1973 to present) | 42 | Cadence Design Systems; Exponent; Financial Engines |
| Interested Director |
Jonathan S. Thomas
(1963) | Director and
President | Since 2007 | President and Chief Executive Officer, ACC (March 2007 to present). Also serves as Chief Executive Officer and Manager, ACS; Executive Vice President, ACIM; Director, ACC, ACIM and other ACC subsidiaries | 115 | None |
(1) Myron S. Scholes resigned as director effective July 31, 2014.
Officers
The following table presents certain information about the executive officers of the funds. Each officer serves as an officer for each of the 15 investment companies in the American Century family of funds, unless otherwise noted. No officer is compensated for his or her service as an officer of the funds. The listed officers are interested persons of the funds and are appointed or re-appointed on an annual basis. The mailing address for each of the officers listed below is 4500 Main Street, Kansas City, Missouri 64111.
|
| | |
Name (Year of Birth) | Offices with the Funds | Principal Occupation(s) During the Past Five Years |
Jonathan S. Thomas (1963) | Director and President since 2007 | President and Chief Executive Officer, ACC (March 2007 to present). Also serves as Chief Executive Officer and Manager, ACS; Executive Vice President, ACIM; Director, ACC, ACIM and other ACC subsidiaries |
| Amy D. Shelton (1964) | Chief Compliance Officer since 2014 | Chief Compliance Officer, American Century funds, (March 2014 to present); Chief Compliance Officer, ACIM (February 2014 to present); Chief Compliance Officer, ACIS (October 2009 to present); Vice President, Client Interactions and Marketing, ACIS (February 2013 to January 2014); Director, Client Interactions and Marketing, ACIS (June 2007 to January 2013). Also serves as Vice President, ACIS |
Charles A. Etherington (1957) | General Counsel since 2007 and Senior Vice President since 2006 | Attorney, ACC (February 1994 to present); Vice President, ACC (November 2005 to present); General Counsel, ACC (March 2007 to present). Also serves as General Counsel, ACIM, ACS, ACIS and other ACC subsidiaries; and Senior Vice President, ACIM and ACS |
C. Jean Wade (1964) | Vice President, Treasurer and Chief Financial Officer since 2012 | Vice President, ACS (February 2000 to present) |
Robert J. Leach (1966) | Vice President since 2006 and Assistant Treasurer since 2012 | Vice President, ACS (February 2000 to present) |
David H. Reinmiller (1963) | Vice President since 2001 | Attorney, ACC (January 1994 to present); Associate General Counsel, ACC (January 2001 to present). Also serves as Vice President, ACIM and ACS |
Ward D. Stauffer (1960) | Secretary since 2005 | Attorney, ACC (June 2003 to present) |
The Statement of Additional Information has additional information about the fund’s directors and is available without charge, upon request, by calling 1-800-345-2021.
|
|
| Approval of Management Agreement |
At a meeting held on June 13, 2014, the Fund’s Board of Directors/Trustees unanimously approved the renewal of the management agreement pursuant to which American Century Investment Management, Inc. (the “Advisor”) acts as the investment advisor for the Fund. Under Section 15(c) of the Investment Company Act, contracts for investment advisory services are required to be reviewed, evaluated, and approved by a majority of a fund’s directors/trustees (the “Directors”), including a majority of the independent Directors, each year. The Board regards this annual evaluation and renewal as one of its most important responsibilities.
The independent Directors have memorialized a statement regarding the relationship between their ongoing obligations to oversee and evaluate the performance of the Advisor and their annual consideration of renewal of the management agreement. In that statement, the independent Directors noted that their assessment of the Advisor’s performance is an ongoing process that takes place over the entire year and is informed by all of the extensive information that the Board and its committees receive and consider over time. This information, together with the materials provided in connection with the review, are central to the Board’s assessment of the Advisor’s performance and its determination whether to renew the Fund’s management agreement.
Prior to its consideration of the renewal of the management agreement, the Board requested and reviewed extensive data and analysis relating to the proposed renewal. This information and analysis was compiled by the Advisor and certain independent providers of evaluation data concerning the Fund and the services provided to the Fund by the Advisor.
In connection with its consideration of the renewal of the management agreement, the Board’s review and evaluation of the services provided by the Advisor included, but was not limited to, the following:
| |
| • | the nature, extent, and quality of investment management, shareholder services, and other services provided by the Advisor to the Fund; |
| |
| • | the wide range of other programs and services the Advisor provides to the Fund and its shareholders on a routine and non-routine basis; |
| |
| • | the investment performance of the Fund, including data comparing the Fund’s performance to appropriate benchmarks and/or a peer group of other mutual funds with similar investment objectives and strategies; |
| |
| • | the cost of owning the Fund compared to the cost of owning similar funds; |
| |
| • | the Advisor’s compliance policies, procedures, and regulatory experience; |
| |
| • | financial data showing the cost of services provided to the Fund, the profitability of the Fund to the Advisor, and the overall profitability of the Advisor; |
| |
| • | possible economies of scale associated with the Advisor’s management of the Fund and other accounts under its management; |
| |
| • | data comparing services provided and charges to other investment management clients of the Advisor; and |
| |
| • | any collateral benefits derived by the Advisor from the management of the Fund. |
In keeping with its practice, the Board held two in-person meetings to review and discuss the information provided. The independent Directors also had the benefit of the advice of their independent counsel throughout the process.
Factors Considered
The Directors considered all of the information provided by the Advisor, the independent data providers, and the independent Directors’ independent counsel in connection with the review, and evaluated such information for the Fund. In connection with their review, the Directors did not identify any single factor as being all-important or controlling and each Director may have attributed
different levels of importance to different factors. In deciding to renew the management agreement, the Board based its decision on a number of factors, including the following:
Nature, Extent and Quality of Services — Generally. Under the management agreement, the Advisor is responsible for providing or arranging for all services necessary for the operation of the Fund. The Board noted that under the management agreement, the Advisor provides or arranges at its own expense a wide variety of services including:
| |
| • | constructing and designing the Fund |
| |
| • | portfolio research and security selection |
| |
| • | initial capitalization/funding |
| |
| • | daily valuation of the Fund’s portfolio |
| |
| • | shareholder servicing and transfer agency, including shareholder confirmations, recordkeeping, and communications |
| |
| • | regulatory and portfolio compliance |
| |
| • | marketing and distribution |
The Board noted that many of these services have expanded over time both in terms of quantity and complexity in response to shareholder demands, competition in the industry, changing distribution channels, and the changing regulatory environment.
Investment Management Services. The nature of the investment management services provided to the Fund is quite complex and allows Fund shareholders access to professional money management, instant diversification of their investments within an asset class, the opportunity to easily diversify among asset classes by investing in or exchanging among various American Century Investments funds, and liquidity. In evaluating investment performance, the Board expects the Advisor to manage the Fund in accordance with its investment objectives and approved strategies. Further, the Directors recognize that the Advisor has an obligation to seek the best execution of fund trades. In providing these services, the Advisor utilizes teams of investment professionals (portfolio managers, analysts, research assistants, and securities traders) who require extensive information technology, research, training, compliance and other systems to conduct their business. The Board, directly and through its Portfolio Committee, regularly reviews investment performance information for the Fund, together with comparative information for appropriate benchmarks and/or peer groups of similarly-managed funds, over different time horizons. The Directors also review detailed performance information during the management agreement approval process. If performance concerns are identified, the Fund receives special reviews until performance improves, during which the Board discusses with the Advisor the reasons for such results (e.g., market conditions, security selection) and any efforts being undertaken to improve performance. The Fund’s performance was above its benchmark for the one-, three-, five-, and ten-year periods reviewed by the Board. The Board found the investment management services provided by the Advisor to the Fund to be satisfactory and consistent with the management agreement.
Shareholder and Other Services. Under the management agreement, the Advisor provides the Fund with a comprehensive package of transfer agency, shareholder, and other services. The Board, directly and through various committees of the Board, regularly reviews reports and evaluations of such services at its regular meetings. These reports include, but are not limited to, information regarding the operational efficiency and accuracy of the shareholder and transfer agency services provided, staffing levels, shareholder satisfaction (as measured by external as well as internal sources), technology support, new products and services offered to Fund shareholders, securities trading activities, portfolio valuation services, auditing services, and legal and operational compliance activities. Certain aspects of shareholder and transfer agency service level efficiency
and the quality of securities trading activities are measured by independent third party providers and are presented in comparison to other fund groups not managed by the Advisor. The Board found the services provided by the Advisor to the Fund under the management agreement to be competitive and of high quality.
Costs of Services and Profitability. The Advisor provides detailed information concerning its cost of providing various services to the Fund, its profitability in managing the Fund, its overall profitability, and its financial condition. The Directors have reviewed with the Advisor the methodology used to prepare this financial information. The financial information regarding the Advisor is considered in evaluating the Advisor’s financial condition, its ability to continue to provide services under the management agreement, and the reasonableness of the current management fee. The Board concluded that the Advisor’s profits were reasonable in light of the services provided to the Fund.
Ethics. The Board generally considers the Advisor’s commitment to providing quality services to shareholders and to conducting its business ethically. They noted that the Advisor’s practices generally meet or exceed industry best practices.
Economies of Scale. The Board also reviewed information provided by the Advisor regarding the possible existence of economies of scale in connection with the management of the Fund. The Board concluded that economies of scale are difficult to measure and predict with precision, especially on a fund-by-fund basis. The Board concluded that the Advisor is appropriately sharing economies of scale through its competitive fee structure, offering competitive fees from fund inception, and through reinvestment in its business to provide shareholders additional content and services.
Comparison to Other Funds’ Fees. The management agreement provides that the Fund pays the Advisor a single, all-inclusive (or unified) management fee for providing all services necessary for the management and operation of the Fund, other than brokerage expenses, taxes, interest, extraordinary expenses, and the fees and expenses of the Fund’s independent directors (including their independent legal counsel) and expenses incurred in connection with the provision of shareholder services and distribution services under a plan adopted pursuant to Rule 12b-1 under the 1940 Act. Under the unified fee structure, the Advisor is responsible for providing all investment advisory, custody, audit, administrative, compliance, recordkeeping, marketing and shareholder services, or arranging and supervising third parties to provide such services. By contrast, most other funds are charged a variety of fees, including an investment advisory fee, a transfer agency fee, an administrative fee, distribution charges and other expenses. Other than their investment advisory fees and any applicable Rule 12b-1 distribution fees, all other components of the total fees charged by these other funds may be increased without shareholder approval. The Board believes the unified fee structure is a benefit to Fund shareholders because it clearly discloses to shareholders the cost of owning Fund shares, and, since the unified fee cannot be increased without a vote of Fund shareholders, it shifts to the Advisor the risk of increased costs of operating the Fund and provides a direct incentive to minimize administrative inefficiencies. Part of the Board’s analysis of fee levels involves reviewing certain evaluative data compiled by an independent provider and comparing the Fund’s unified fee to the total expense ratio of other funds in the Fund’s peer group. The unified fee charged to shareholders of the Fund was below the median of the total expense ratios of the Fund’s peer group. The Board concluded that the management fee paid by the Fund to the Advisor under the management agreement is reasonable in light of the services provided to the Fund.
Comparison to Fees and Services Provided to Other Clients of the Advisor. The Board also requested and received information from the Advisor concerning the nature of the services, fees, costs and profitability of its advisory services to advisory clients other than the Fund. They observed that these varying types of client accounts require different services and involve different regulatory and entrepreneurial risks than the management of the Fund. The Board analyzed this information and concluded that the fees charged and services provided to the Fund were reasonable by comparison.
Collateral or “Fall-Out” Benefits Derived by the Advisor. The Board considered the existence of collateral benefits the Advisor may receive as a result of its relationship with the Fund. They concluded that the Advisor’s primary business is managing mutual funds and it generally does not use fund or shareholder information to generate profits in other lines of business, and therefore does not derive any significant collateral benefits from them. The Board noted that the Advisor receives proprietary research from broker-dealers that execute fund portfolio transactions and concluded that this research is likely to benefit Fund shareholders. The Board also determined that the Advisor is able to provide investment management services to certain clients other than the Fund, at least in part, due to its existing infrastructure built to serve the fund complex. The Board concluded, however, that the assets of those other clients are not material to the analysis and, where applicable, may be included with the assets of the Fund to determine breakpoints in the management fee schedule.
Existing Relationship. The Board also considered whether there was any reason for not continuing the existing arrangement with the Advisor. In this regard, the Board was mindful of the potential disruptions of the Fund’s operations and various risks, uncertainties, and other effects that could occur as a result of a decision not to continue such relationship. In particular, the Board recognized that most shareholders have invested in the Fund on the strength of the Advisor’s industry standing and reputation and in the expectation that the Advisor will have a continuing role in providing advisory services to the Fund.
Conclusion of the Directors. As a result of this process, the Board, including all of the independent Directors and assisted by the advice of independent legal counsel, taking into account all of the factors discussed above and the information provided by the Advisor and others, concluded that the management agreement between the Fund and the Advisor is fair and reasonable in light of the services provided and should be renewed.
Retirement Account Information
As required by law, distributions you receive from certain IRAs are subject to federal income tax withholding, unless you elect not to have withholding apply. Tax will be withheld on the total amount withdrawn even though you may be receiving amounts that are not subject to withholding, such as nondeductible contributions. In such case, excess amounts of withholding could occur. You may adjust your withholding election so that a greater or lesser amount will be withheld.
If you don’t want us to withhold on this amount, you must notify us to not withhold the federal income tax. You may notify us in writing or in certain situations by telephone or through other electronic means. For systematic withdrawals, your withholding election will remain in effect until revoked or changed by filing a new election. You have the right to revoke your election at any time.
Remember, even if you elect not to have income tax withheld, you are liable for paying income tax on the taxable portion of your withdrawal. If you elect not to have income tax withheld or you don’t have enough income tax withheld, you may be responsible for payment of estimated tax. You may incur penalties under the estimated tax rules if your withholding and estimated tax payments are not sufficient. You can reduce or defer the income tax on a distribution by directly or indirectly rolling such distribution over to another IRA or eligible plan. You should consult your tax advisor for additional information.
State tax will be withheld if, at the time of your distribution, your address is within one of the mandatory withholding states and you have federal income tax withheld (or as otherwise required by state law). State taxes will be withheld from your distribution in accordance with the respective state rules.
Distributions you receive from 403(b), 457 and qualified plans are subject to special tax and withholding rules. Your plan administrator or plan sponsor is required to provide you with a special tax notice explaining those rules at the time you request a distribution. If applicable, federal and/or state taxes may be withheld from your distribution amount.
Proxy Voting Policies
Descriptions of the principles and policies that the fund's investment advisor uses in exercising the voting rights associated with the securities purchased and/or held by the fund are available without charge, upon request, by calling 1-800-345-2021 or visiting the "About Us" page of American Century Investments’ website at americancentury.com. A description of the policies is also available on the Securities and Exchange Commission’s website at sec.gov. Information regarding how the investment advisor voted proxies relating to portfolio securities during the most recent 12-month period ended June 30 is available on the "About Us" page at americancentury.com. It is also available at sec.gov.
Quarterly Portfolio Disclosure
The fund files its complete schedule of portfolio holdings with the Securities and Exchange Commission (SEC) for the first and third quarters of each fiscal year on Form N-Q. The fund’s Forms N-Q are available on the SEC’s website at sec.gov, and may be reviewed and copied at the SEC’s Public Reference Room in Washington, DC. Information on the operation of the Public Reference Room may be obtained by calling 1-800-SEC-0330. The fund also makes its complete schedule of portfolio holdings for the most recent quarter of its fiscal year available on its website at americancentury.com and, upon request, by calling 1-800-345-2021.
Other Tax Information
The following information is provided pursuant to provisions of the Internal Revenue Code.
The fund hereby designates up to the maximum amount allowable as qualified dividend income for the fiscal year ended June 30, 2014.
For corporate taxpayers, the fund hereby designates $62,791,179, or up to the maximum amount allowable, of ordinary income distributions paid during the fiscal year ended June 30, 2014 as qualified for the corporate dividends received deduction.
The fund hereby designates $49,466,101 as qualified short-term capital gain distributions for purposes of Internal Revenue Code Section 871.
The fund hereby designates $76,513,215, or up to the maximum amount allowable, as long-term capital gain distributions for the fiscal year ended June 30, 2014.
|
| | |
| |
| | | |
| Contact Us | americancentury.com | |
| Automated Information Line | 1-800-345-8765 | |
| Investor Services Representative | 1-800-345-2021
or 816-531-5575 | |
| Investors Using Advisors | 1-800-378-9878 | |
Business, Not-For-Profit, Employer-Sponsored
Retirement Plans | 1-800-345-3533 | |
Banks and Trust Companies, Broker-Dealers,
Financial Professionals, Insurance Companies | 1-800-345-6488 | |
| Telecommunications Relay Service for the Deaf | 711 | |
| | | |
| American Century Quantitative Equity Funds, Inc. | |
| | | |
Investment Advisor: American Century Investment Management, Inc. Kansas City, Missouri | |
| | | |
| This report and the statements it contains are submitted for the general information of our shareholders. The report is not authorized for distribution to prospective investors unless preceded or accompanied by an effective prospectus. | |
| | | |
©2014 American Century Proprietary Holdings, Inc. All rights reserved.
CL-ANN-82886 1408 | |
|
| |
ANNUAL REPORT | JUNE 30, 2014 |
Equity Market Neutral Fund
|
| |
| President's Letter | |
| Performance | |
| Portfolio Commentary | |
| Fund Characteristics | |
| Shareholder Fee Example | |
| Schedule of Investments | |
| Statement of Assets and Liabilities | |
| Statement of Operations | |
| Statement of Changes in Net Assets | |
| Notes to Financial Statements | |
| Financial Highlights | |
| Report of Independent Registered Public Accounting Firm | |
| Management | |
| Approval of Management Agreement | |
| Additional Information | |
Any opinions expressed in this report reflect those of the author as of the date of the report, and do not necessarily represent the opinions of American Century Investments® or any other person in the American Century Investments organization. Any such opinions are subject to change at any time based upon market or other conditions and American Century Investments disclaims any responsibility to update such opinions. These opinions may not be relied upon as investment advice and, because investment decisions made by American Century Investments funds are based on numerous factors, may not be relied upon as an indication of trading intent on behalf of any American Century Investments fund. Security examples are used for representational purposes only and are not intended as recommendations to purchase or sell securities. Performance information for comparative indices and securities is provided to American Century Investments by third party vendors. To the best of American Century Investments’ knowledge, such information is accurate at the time of printing.
|
| |
| Dear Investor:
Thank you for reviewing this annual report for the 12 months ended June 30, 2014. It provides investment performance and portfolio information for the reporting period, plus longer-term historical performance data.
Annual reports remain important vehicles for conveying information about fund returns, including market and economic factors that affected performance during the reporting period. For additional, updated investment and market insights, we encourage you to visit our website, americancentury.com.
|
| Jonathan Thomas |
Aggressive Monetary Policies Boosted Stock and Bond Returns
Stimulative monetary policies and expectations of economic improvement, interspersed with concerns about weaker-than-expected economic data and geopolitical conflicts, helped drive financial market returns during the reporting period. We believe the combination of longer-term optimism about global economic growth, low costs of capital, and central bank purchases of fixed income securities helped persuade investors to seek risk and yield, especially in the U.S. and Europe. Stock index returns were strong in these markets, particularly at the smaller capitalization end of the company size spectrum. The MSCI Europe and S&P 500® indices advanced 29.28% and 24.61%, respectively.
Remarkably, for a period in which stock market performance was so strong, government bond performance was also generally positive. Not surprisingly, U.S. corporate high-yield bonds posted double-digit returns, but the 30-year U.S. Treasury bond also outperformed most broader bond market measures. In addition, a generally weaker U.S. dollar during the reporting period meant that international bond returns for U.S. investors with currency exposure were generally higher than U.S. bonds returns. The Barclays Global Aggregate Bond and Barclays U.S. Aggregate Bond indices returned 7.39% and 4.37%, respectively.
Looking ahead, we see signs of sustained moderate economic growth in the second half of 2014, but headwinds persist. In the U.S., which was supposed to be an economic growth leader this year, housing market momentum has slowed, interest rates could rise, and economic growth and U.S. employment levels remain subpar compared with past post-recession periods. In this environment, we continue to believe in a disciplined, diversified, long-term investment approach, using professionally managed stock and bond portfolios—as appropriate—for meeting financial goals. We appreciate your continued trust in us.
Sincerely,
Jonathan Thomas
President and Chief Executive Officer
American Century Investments
|
| | | | | |
| Total Returns as of June 30, 2014 | | | | |
| | Average Annual Returns | |
| | Ticker Symbol | 1 year | 5 years | Since Inception | Inception Date |
| Investor Class | ALHIX | 4.27% | 2.34% | 1.67% | 9/30/05 |
| Barclays U.S. 1-3 Month Treasury Bill Index | — | 0.03% | 0.08% | 1.44% | — |
| Institutional Class | ALISX | 4.49% | 2.55% | 1.87% | 9/30/05 |
| A Class | ALIAX | | | | 9/30/05 |
| No sales charge* | | 3.95% | 2.08% | 1.41% | |
| With sales charge* | | -2.04% | 0.87% | 0.73% | |
| C Class | ALICX | 3.17% | 1.32% | 0.65% | 9/30/05 |
| R Class | ALIRX | 3.64% | 1.83% | 1.15% | 9/30/05 |
| |
| * | Sales charges include initial sales charges and contingent deferred sales charges (CDSCs), as applicable. A Class shares have a 5.75% maximum initial sales charge and may be subject to a maximum CDSC of 1.00%. C Class shares redeemed within 12 months of purchase are subject to a maximum CDSC of 1.00%. The SEC requires that mutual funds provide performance information net of maximum sales charges in all cases where charges could be applied. |
Data presented reflect past performance. Past performance is no guarantee of future results. Current performance may be higher or lower than the performance shown. Investment return and principal value will fluctuate, and redemption value may be more or less than original cost. To obtain performance data current to the most recent month end, please call 1-800-345-2021 or visit americancentury.com. The fund’s investment process may result in high portfolio turnover, which could mean high transaction costs, affecting both performance and capital gains tax liabilities to investors. In addition, its investment approach may involve higher price volatility, short sales risk and overweighting risk.
Unless otherwise indicated, performance reflects Investor Class shares; performance for other share classes will vary due to differences in fee structure. For information about other share classes available, please consult the prospectus. Data assumes reinvestment of dividends and capital gains, and none of the charts reflect the deduction of taxes that a shareholder would pay on fund distributions or the redemption of fund shares. Returns for the index are provided for comparison. The fund’s total returns include operating expenses (such as transaction costs and management fees) that reduce returns, while the total returns of the index do not.
|
|
| Growth of $10,000 Over Life of Class |
| $10,000 investment made September 30, 2005 |
|
| |
| Value on June 30, 2014 |
| | Investor Class — $11,556 |
| |
| | Barclays U.S. 1-3 Month Treasury Bill Index — $11,331 |
| |
*From September 30, 2005, the Investor Class’s inception date. Not annualized.
|
| | | | |
| Total Annual Fund Operating Expenses |
| Investor Class | Institutional Class | A Class | C Class | R Class |
| 3.07% | 2.87% | 3.32% | 4.07% | 3.57% |
The total annual fund operating expenses shown is as stated in the fund’s prospectus current as of the date of this report. The prospectus may vary from the expense ratio shown elsewhere in this report because it is based on a different time period, includes acquired fund fees and expenses, and, if applicable, does not include fee waivers or expense reimbursements.
Data presented reflect past performance. Past performance is no guarantee of future results. Current performance may be higher or lower than the performance shown. Investment return and principal value will fluctuate, and redemption value may be more or less than original cost. To obtain performance data current to the most recent month end, please call 1-800-345-2021 or visit americancentury.com. The fund’s investment process may result in high portfolio turnover, which could mean high transaction costs, affecting both performance and capital gains tax liabilities to investors. In addition, its investment approach may involve higher price volatility, short sales risk and overweighting risk.
Unless otherwise indicated, performance reflects Investor Class shares; performance for other share classes will vary due to differences in fee structure. For information about other share classes available, please consult the prospectus. Data assumes reinvestment of dividends and capital gains, and none of the charts reflect the deduction of taxes that a shareholder would pay on fund distributions or the redemption of fund shares. Returns for the index are provided for comparison. The fund’s total returns include operating expenses (such as transaction costs and management fees) that reduce returns, while the total returns of the index do not.
Portfolio Managers: Brian Garbe and Claudia Musat
Performance Summary
Equity Market Neutral returned 4.27%* for the fiscal year ended June 30, 2014, compared with the 0.03% return of its benchmark, the Barclays U.S. 1-3 Month Treasury Bill Index.
Equity Market Neutral is designed to generate capital appreciation in all market environments, regardless of general stock market performance, so the fund uses a riskless asset—a short-term Treasury bill index—as its benchmark. The fund advanced for the period, meeting its investment objective and outperforming its benchmark during a year when U.S. equity markets produced strong appreciation. The portfolio’s stock selection process incorporates factors of valuation, quality, growth, and momentum (sentiment) while striving to minimize unintended risks along industries and other risk characteristics. The fund’s outperformance was driven primarily by long positions, which delivered positive results for the 12-month period and more than offset modest losses from some of the fund’s short holdings.
Industrials Drove Relative Gains
Successful stock selection in industrials sector holdings was a key driver of the fund’s outperformance. Long positions in the aerospace and defense, airlines, and machinery industries were strongly beneficial. A number of companies in the sector posted substantial gains amid improving economic conditions, which led to increased orders. Key contributors included commercial airline Delta Air Lines, whose solid earnings led to substantial appreciation. We took profits and exited the position. Aerospace defense manufacturer Northrop Grumman was also a strong performer, rising on new government contracts.
The health care sector was another area of gains, particularly among pharmaceuticals and biotechnology companies. Pharmaceutical manufacturer Endo International was a main driver of sector performance, benefiting from an aggressive acquisitions strategy. Following its considerable appreciation, we took profits and exited the position in March. Other sector outperformers included gene sequencing and diagnostics developer Illumina, whose earnings beat expectations and propelled the stock to appreciate nearly 140% during the fiscal year.
A number of consumer-oriented investments were among the fund’s best-performing holdings. Chain drug store Rite Aid rose on revenue growth as well as efficiency and distribution chain improvements, bolstering the sector’s return. Likewise, apparel manufacturer Hanesbrands’ earnings growth and announced intent to purchase French clothing manufacturer DBApparel, thereby increasing exposure in Europe, helped to drive its stock price higher.
Utilities, Information Technology Detracted
The utilities and information technology sectors were the main detractors from returns. Modest losses across a number of short positions in utilities companies caused that sector to be the fund’s leading underperformer. The short position in MDU Resources Group, a distributor of natural gas, diminished returns following its 39% stock price appreciation on sizable earnings growth. However, our research shows weak valuation and cash-flow generation relative to its industry peers, warranting the fund’s short positioning in the holding.
* All fund returns referenced in this commentary are for Investor Class shares. Performance for other share classes will vary due to differences in fee structure; when Investor Class performance exceeds that of the fund's benchmark, other share classes may not. See page 3 for returns for all share classes.
Likewise, a number of short positions in the internet and IT services industries weighed on the fund’s returns. Key detraction stemmed from the short position in solar power semiconductor manufacturer SunEdison, which benefited from several analyst upgrades based on a continued rise in solar power demand. Despite its climbing share value, we believe that the company is unappealing across valuation, quality, and growth measures, which justify the short position. Other leading sector detractors included short positions in Stratasys, a 3-D printer manufacturer, and logistics solution company Ingram Micro. We ultimately sold the position in Ingram Micro.
The fund’s net-short position in the oil, gas, and consumable fuels industry in the energy sector was also detrimental following a substantial rise in oil prices toward the end of the fiscal year. A number of the portfolio’s leading individual detractors were energy-related holdings including short positions in energy infrastructure company The Williams Companies and gas producer CONSOL Energy, both of which look weak across most factors.
A Look Ahead
Economic recovery in the U.S. appears to be progressing, albeit at a slower pace than during prior post-recessionary periods, and is expected to stay the course through the remainder of 2014. Recent indicators such as improvements in small business and consumer confidence point to a sustainable rebound, and economic growth is likely to further benefit from the recovering labor and housing markets. Though a continuation of political instability in non-U.S. markets as well as the potential for rising inflation and interest rates could lead to heightened market volatility, our disciplined, objective, and systematic investment strategy is designed to take advantage of opportunities at the individual company level, in both the long and short portions of the portfolio. We believe this approach is the most powerful way to capitalize on market inefficiencies that lead to the mispricing of individual stocks.
|
| |
| JUNE 30, 2014 |
| Top Ten Long Holdings | % of net assets |
| Illumina, Inc. | 0.62% |
| Nabors Industries Ltd. | 0.61% |
| JetBlue Airways Corp. | 0.59% |
| Centene Corp. | 0.59% |
| Akorn, Inc. | 0.59% |
| Pilgrim's Pride Corp. | 0.59% |
| Zebra Technologies Corp., Class A | 0.59% |
| Keurig Green Mountain, Inc. | 0.58% |
| Buffalo Wild Wings, Inc. | 0.58% |
| Energizer Holdings, Inc. | 0.57% |
| | |
| Top Ten Short Holdings | % of net assets |
| SunEdison, Inc. | (0.63)% |
| Williams Cos., Inc. (The) | (0.63)% |
| Under Armour, Inc., Class A | (0.62)% |
| Diamondback Energy, Inc. | (0.62)% |
| tw telecom, Inc. | (0.61)% |
| Iron Mountain, Inc. | (0.61)% |
| Community Health Systems, Inc. | (0.60)% |
| CarMax, Inc. | (0.57)% |
| Tyler Technologies, Inc. | (0.57)% |
| Tempur Sealy International, Inc. | (0.57)% |
| | |
| Types of Investments in Portfolio | % of net assets |
| Common Stocks | 96.9% |
| Common Stocks Sold Short | (97.3)% |
| Temporary Cash Investments | 3.4% |
| Other Assets and Liabilities* | 97.0% |
*Amount relates primarily to deposits with broker for securities sold short at period end.
Fund shareholders may incur two types of costs: (1) transaction costs, including sales charges (loads) on purchase payments and redemption/exchange fees; and (2) ongoing costs, including management fees; distribution and service (12b-1) fees; and other fund expenses. This example is intended to help you understand your ongoing costs (in dollars) of investing in your fund and to compare these costs with the ongoing cost of investing in other mutual funds.
The example is based on an investment of $1,000 made at the beginning of the period and held for the entire period from January 1, 2014 to June 30, 2014.
Actual Expenses
The table provides information about actual account values and actual expenses for each class. You may use the information, together with the amount you invested, to estimate the expenses that you paid over the period. First, identify the share class you own. Then simply divide your account value by $1,000 (for example, an $8,600 account value divided by $1,000 = 8.6), then multiply the result by the number under the heading “Expenses Paid During Period” to estimate the expenses you paid on your account during this period.
If you hold Investor Class shares of any American Century Investments fund, or Institutional Class shares of the American Century Diversified Bond Fund, in an American Century Investments account (i.e., not a financial intermediary or retirement plan account), American Century Investments may charge you a $12.50 semiannual account maintenance fee if the value of those shares is less than $10,000. We will redeem shares automatically in one of your accounts to pay the $12.50 fee. In determining your total eligible investment amount, we will include your investments in all personal accounts (including American Century Investments Brokerage accounts) registered under your Social Security number. Personal accounts include individual accounts, joint accounts, UGMA/UTMA accounts, personal trusts, Coverdell Education Savings Accounts and IRAs (including traditional, Roth, Rollover, SEP-, SARSEP- and SIMPLE-IRAs), and certain other retirement accounts. If you have only business, business retirement, employer-sponsored or American Century Investments Brokerage accounts, you are currently not subject to this fee. If you are subject to the Account Maintenance Fee, your account value could be reduced by the fee amount.
Hypothetical Example for Comparison Purposes
The table also provides information about hypothetical account values and hypothetical expenses based on the actual expense ratio of each class of your fund and an assumed rate of return of 5% per year before expenses, which is not the actual return of a fund’s share class. The hypothetical account values and expenses may not be used to estimate the actual ending account balance or expenses you paid for the period. You may use this information to compare the ongoing costs of investing in your fund and other funds. To do so, compare this 5% hypothetical example with the 5% hypothetical examples that appear in the shareholder reports of the other funds.
Please note that the expenses shown in the table are meant to highlight your ongoing costs only and do not reflect any transactional costs, such as sales charges (loads) or redemption/exchange fees. Therefore, the table is useful in comparing ongoing costs only, and will not help you determine the relative total costs of owning different funds. In addition, if these transactional costs were included, your costs would have been higher.
|
| | | | |
| | Beginning
Account Value
1/1/14 | Ending
Account Value
6/30/14 | Expenses Paid
During Period(1)
1/1/14 - 6/30/14 | Annualized
Expense Ratio(1) |
| Actual | | | | |
| Investor Class | $1,000 | $1,009.00 | $14.40 | 2.89% |
| Institutional Class | $1,000 | $1,009.70 | $13.40 | 2.69% |
| A Class | $1,000 | $1,007.30 | $15.63 | 3.14% |
| C Class | $1,000 | $1,003.90 | $19.33 | 3.89% |
| R Class | $1,000 | $1,005.60 | $16.86 | 3.39% |
| Hypothetical | | | | |
| Investor Class | $1,000 | $1,010.46 | $14.41 | 2.89% |
| Institutional Class | $1,000 | $1,011.46 | $13.42 | 2.69% |
| A Class | $1,000 | $1,009.22 | $15.64 | 3.14% |
| C Class | $1,000 | $1,005.50 | $19.34 | 3.89% |
| R Class | $1,000 | $1,007.98 | $16.88 | 3.39% |
| |
| (1) | Expenses are equal to the class’s annualized expense ratio listed in the table above, multiplied by the average account value over the period, multiplied by 181, the number of days in the most recent fiscal half-year, divided by 365, to reflect the one-half year period. |
JUNE 30, 2014
|
| | | | | |
| | Shares | Value |
| COMMON STOCKS — 96.9% | | |
| AEROSPACE AND DEFENSE — 3.0% | | |
| Boeing Co. (The) | 3,590 |
| $ | 456,756 |
|
Esterline Technologies Corp.(1) | 3,696 |
| 425,483 |
|
| General Dynamics Corp. | 4,184 |
| 487,645 |
|
| L-3 Communications Holdings, Inc. | 1,209 |
| 145,987 |
|
Lockheed Martin Corp.(2) | 1,673 |
| 268,901 |
|
Moog, Inc., Class A(1)(2) | 7,774 |
| 566,647 |
|
Northrop Grumman Corp.(2) | 2,765 |
| 330,777 |
|
| Raytheon Co. | 5,591 |
| 515,770 |
|
| | | 3,197,966 |
|
| AIRLINES — 1.5% | | |
Alaska Air Group, Inc.(2) | 4,560 |
| 433,428 |
|
JetBlue Airways Corp.(1)(2) | 57,889 |
| 628,096 |
|
Southwest Airlines Co.(2) | 21,007 |
| 564,248 |
|
| | | 1,625,772 |
|
| AUTO COMPONENTS — 2.1% | | |
Gentex Corp.(2) | 17,731 |
| 515,795 |
|
Johnson Controls, Inc.(2) | 8,402 |
| 419,512 |
|
| Magna International, Inc. | 2,544 |
| 274,116 |
|
Tenneco, Inc.(1) | 7,748 |
| 509,043 |
|
Visteon Corp.(1) | 5,307 |
| 514,832 |
|
| | | 2,233,298 |
|
| BANKS — 0.3% | | |
Bank of America Corp.(2) | 10,738 |
| 165,043 |
|
Regions Financial Corp.(2) | 13,410 |
| 142,414 |
|
| | | 307,457 |
|
| BEVERAGES — 0.6% | | |
Dr Pepper Snapple Group, Inc.(2) | 9,308 |
| 545,263 |
|
| Molson Coors Brewing Co., Class B | 1,660 |
| 123,105 |
|
| | | 668,368 |
|
| BIOTECHNOLOGY — 1.4% | | |
Alexion Pharmaceuticals, Inc.(1) | 1,522 |
| 237,812 |
|
Biogen Idec, Inc.(1) | 797 |
| 251,302 |
|
Isis Pharmaceuticals, Inc.(1) | 7,835 |
| 269,916 |
|
Myriad Genetics, Inc.(1)(2) | 7,024 |
| 273,374 |
|
Seattle Genetics, Inc.(1) | 4,718 |
| 180,464 |
|
United Therapeutics Corp.(1) | 3,104 |
| 274,673 |
|
| | | 1,487,541 |
|
|
| | | | | |
| | Shares | Value |
| BUILDING PRODUCTS — 0.2% | | |
| Masco Corp. | 11,289 |
| $ | 250,616 |
|
| CAPITAL MARKETS — 3.8% | | |
Affiliated Managers Group, Inc.(1)(2) | 2,643 |
| 542,872 |
|
E*Trade Financial Corp.(1) | 5,059 |
| 107,554 |
|
Evercore Partners, Inc., Class A(2) | 6,465 |
| 372,643 |
|
Franklin Resources, Inc.(2) | 9,269 |
| 536,119 |
|
Investment Technology Group, Inc.(1)(2) | 8,027 |
| 135,496 |
|
Janus Capital Group, Inc.(2) | 46,303 |
| 577,861 |
|
| Legg Mason, Inc. | 3,378 |
| 173,325 |
|
SEI Investments Co.(2) | 9,027 |
| 295,815 |
|
Stifel Financial Corp.(1)(2) | 11,530 |
| 545,946 |
|
| T. Rowe Price Group, Inc. | 2,479 |
| 209,252 |
|
Waddell & Reed Financial, Inc., Class A(2) | 8,655 |
| 541,717 |
|
| | | 4,038,600 |
|
| CHEMICALS — 5.1% | | |
| Ashland, Inc. | 5,030 |
| 546,962 |
|
Cabot Corp.(2) | 9,207 |
| 533,914 |
|
Dow Chemical Co. (The)(2) | 10,113 |
| 520,415 |
|
| Eastman Chemical Co. | 5,577 |
| 487,151 |
|
| International Flavors & Fragrances, Inc. | 4,012 |
| 418,372 |
|
| NewMarket Corp. | 1,239 |
| 485,824 |
|
Olin Corp.(2) | 19,169 |
| 516,030 |
|
PolyOne Corp.(2) | 13,871 |
| 584,524 |
|
PPG Industries, Inc.(2) | 1,947 |
| 409,162 |
|
Scotts Miracle-Gro Co. (The), Class A(2) | 8,236 |
| 468,299 |
|
| Sigma-Aldrich Corp. | 3,884 |
| 394,148 |
|
| | | 5,364,801 |
|
| COMMERCIAL SERVICES AND SUPPLIES — 2.7% | | |
Deluxe Corp.(2) | 7,081 |
| 414,805 |
|
Herman Miller, Inc.(2) | 15,555 |
| 470,383 |
|
Pitney Bowes, Inc.(2) | 19,563 |
| 540,330 |
|
Ritchie Bros Auctioneers, Inc.(2) | 23,110 |
| 569,661 |
|
RR Donnelley & Sons Co.(2) | 22,037 |
| 373,748 |
|
Steelcase, Inc., Class A(2) | 31,539 |
| 477,185 |
|
| | | 2,846,112 |
|
| COMMUNICATIONS EQUIPMENT — 2.2% | | |
ADTRAN, Inc.(2) | 18,846 |
| 425,166 |
|
ARRIS Group, Inc.(1)(2) | 10,288 |
| 334,669 |
|
Brocade Communications Systems, Inc.(2) | 44,305 |
| 407,606 |
|
Ciena Corp.(1)(2) | 27,464 |
| 594,870 |
|
F5 Networks, Inc.(1) | 719 |
| 80,125 |
|
Juniper Networks, Inc.(1) | 4,764 |
| 116,909 |
|
| QUALCOMM, Inc. | 4,441 |
| 351,727 |
|
| | | 2,311,072 |
|
|
| | | | | |
| | Shares | Value |
| CONSTRUCTION AND ENGINEERING — 0.5% | | |
AECOM Technology Corp.(1)(2) | 14,820 |
| $ | 477,204 |
|
| CONSUMER FINANCE — 0.9% | | |
Cash America International, Inc.(2) | 12,065 |
| 536,048 |
|
Credit Acceptance Corp.(1) | 3,566 |
| 438,975 |
|
| | | 975,023 |
|
| CONTAINERS AND PACKAGING — 1.5% | | |
Ball Corp.(2) | 8,773 |
| 549,892 |
|
Berry Plastics Group, Inc.(1) | 7,080 |
| 182,664 |
|
Crown Holdings, Inc.(1) | 7,037 |
| 350,161 |
|
Sonoco Products Co.(2) | 12,520 |
| 550,003 |
|
| | | 1,632,720 |
|
| DIVERSIFIED CONSUMER SERVICES — 0.9% | | |
Apollo Education Group, Inc., Class A(1)(2) | 13,674 |
| 427,313 |
|
Matthews International Corp., Class A(2) | 12,179 |
| 506,281 |
|
| | | 933,594 |
|
| DIVERSIFIED FINANCIAL SERVICES — 0.5% | | |
| Voya Financial, Inc. | 14,727 |
| 535,179 |
|
| DIVERSIFIED TELECOMMUNICATION SERVICES — 1.3% | | |
AT&T, Inc.(2) | 12,955 |
| 458,089 |
|
CenturyLink, Inc.(2) | 2,712 |
| 98,174 |
|
Frontier Communications Corp.(2) | 77,192 |
| 450,801 |
|
Verizon Communications, Inc.(2) | 7,417 |
| 362,914 |
|
| | | 1,369,978 |
|
| ELECTRIC UTILITIES — 0.3% | | |
| Entergy Corp. | 2,460 |
| 201,941 |
|
PNM Resources, Inc.(2) | 5,132 |
| 150,522 |
|
| | | 352,463 |
|
| ELECTRICAL EQUIPMENT — 1.2% | | |
Babcock & Wilcox Co. (The)(2) | 10,742 |
| 348,685 |
|
| Eaton Corp. plc | 971 |
| 74,942 |
|
| Emerson Electric Co. | 7,234 |
| 480,048 |
|
Rockwell Automation, Inc.(2) | 3,375 |
| 422,415 |
|
| | | 1,326,090 |
|
| ELECTRONIC EQUIPMENT, INSTRUMENTS AND COMPONENTS — 1.4% | |
Dolby Laboratories, Inc., Class A(1)(2) | 13,253 |
| 572,529 |
|
Itron, Inc.(1)(2) | 6,574 |
| 266,576 |
|
Zebra Technologies Corp., Class A(1)(2) | 7,578 |
| 623,821 |
|
| | | 1,462,926 |
|
| ENERGY EQUIPMENT AND SERVICES — 3.9% | | |
Baker Hughes, Inc.(2) | 7,563 |
| 563,065 |
|
| Core Laboratories NV | 2,262 |
| 377,890 |
|
Dril-Quip, Inc.(1) | 3,431 |
| 374,802 |
|
Exterran Holdings, Inc.(2) | 5,222 |
| 234,938 |
|
|
| | | | | |
| | Shares | Value |
| Helmerich & Payne, Inc. | 4,977 |
| $ | 577,879 |
|
Nabors Industries Ltd.(2) | 22,108 |
| 649,312 |
|
Patterson-UTI Energy, Inc.(2) | 11,489 |
| 401,426 |
|
RPC, Inc.(2) | 23,186 |
| 544,639 |
|
Unit Corp.(1) | 6,731 |
| 463,295 |
|
| | | 4,187,246 |
|
| FOOD AND STAPLES RETAILING — 0.6% | | |
Rite Aid Corp.(1)(2) | 75,237 |
| 539,449 |
|
| Sysco Corp. | 1,452 |
| 54,378 |
|
| | | 593,827 |
|
| FOOD PRODUCTS — 2.7% | | |
Archer-Daniels-Midland Co.(2) | 11,877 |
| 523,894 |
|
Kellogg Co.(2) | 7,638 |
| 501,817 |
|
Keurig Green Mountain, Inc.(2) | 4,939 |
| 615,449 |
|
Pilgrim's Pride Corp.(1)(2) | 22,890 |
| 626,270 |
|
Tyson Foods, Inc., Class A(2) | 15,105 |
| 567,042 |
|
| | | 2,834,472 |
|
| GAS UTILITIES — 0.4% | | |
UGI Corp.(2) | 8,134 |
| 410,767 |
|
| HEALTH CARE EQUIPMENT AND SUPPLIES — 3.3% | | |
Align Technology, Inc.(1) | 3,306 |
| 185,268 |
|
Becton Dickinson and Co.(2) | 4,551 |
| 538,383 |
|
Boston Scientific Corp.(1)(2) | 26,097 |
| 333,259 |
|
C.R. Bard, Inc.(2) | 3,890 |
| 556,309 |
|
DexCom, Inc.(1) | 3,354 |
| 133,020 |
|
Hill-Rom Holdings, Inc.(2) | 8,385 |
| 348,061 |
|
Insulet Corp.(1) | 1,924 |
| 76,325 |
|
| Medtronic, Inc. | 3,433 |
| 218,888 |
|
| St. Jude Medical, Inc. | 2,634 |
| 182,404 |
|
| Stryker Corp. | 3,762 |
| 317,212 |
|
Thoratec Corp.(1)(2) | 16,644 |
| 580,210 |
|
| | | 3,469,339 |
|
| HEALTH CARE PROVIDERS AND SERVICES — 2.1% | | |
Cardinal Health, Inc.(2) | 7,916 |
| 542,721 |
|
Centene Corp.(1)(2) | 8,301 |
| 627,639 |
|
Health Net, Inc.(1) | 13,381 |
| 555,847 |
|
Mednax, Inc.(1)(2) | 6,883 |
| 400,246 |
|
VCA, Inc.(1)(2) | 3,840 |
| 134,745 |
|
| | | 2,261,198 |
|
| HEALTH CARE TECHNOLOGY — 0.1% | | |
Allscripts Healthcare Solutions, Inc.(1) | 3,536 |
| 56,753 |
|
| HOTELS, RESTAURANTS AND LEISURE — 3.2% | | |
Bally Technologies, Inc.(1)(2) | 6,847 |
| 449,985 |
|
Buffalo Wild Wings, Inc.(1)(2) | 3,699 |
| 612,961 |
|
|
| | | | | |
| | Shares | Value |
| Cheesecake Factory, Inc. (The) | 6,288 |
| $ | 291,889 |
|
| Cracker Barrel Old Country Store, Inc. | 3,974 |
| 395,691 |
|
Royal Caribbean Cruises Ltd.(2) | 9,874 |
| 548,995 |
|
| SeaWorld Entertainment, Inc. | 8,165 |
| 231,315 |
|
Wendy's Co. (The)(2) | 33,678 |
| 287,273 |
|
| Wyndham Worldwide Corp. | 7,374 |
| 558,359 |
|
| | | 3,376,468 |
|
| HOUSEHOLD DURABLES — 2.3% | | |
| Garmin Ltd. | 1,790 |
| 109,011 |
|
| Harman International Industries, Inc. | 2,532 |
| 272,013 |
|
Newell Rubbermaid, Inc.(2) | 16,571 |
| 513,535 |
|
NVR, Inc.(1)(2) | 470 |
| 540,782 |
|
PulteGroup, Inc.(2) | 25,488 |
| 513,838 |
|
Whirlpool Corp.(2) | 3,176 |
| 442,163 |
|
| | | 2,391,342 |
|
| HOUSEHOLD PRODUCTS — 1.3% | | |
| Clorox Co. | 2,872 |
| 262,501 |
|
| Energizer Holdings, Inc. | 4,945 |
| 603,438 |
|
Kimberly-Clark Corp.(2) | 4,686 |
| 521,177 |
|
| | | 1,387,116 |
|
| INDEPENDENT POWER AND RENEWABLE ELECTRICITY PRODUCERS — 0.5% | |
AES Corp. (The)(2) | 34,088 |
| 530,068 |
|
| INDUSTRIAL CONGLOMERATES — 0.4% | | |
Danaher Corp.(2) | 4,979 |
| 391,997 |
|
| INSURANCE — 2.6% | | |
American International Group, Inc.(2) | 6,170 |
| 336,759 |
|
Amtrust Financial Services, Inc.(2) | 11,983 |
| 501,009 |
|
Aspen Insurance Holdings Ltd.(2) | 5,735 |
| 260,484 |
|
Hanover Insurance Group, Inc. (The)(2) | 7,870 |
| 496,990 |
|
MBIA, Inc.(1) | 18,592 |
| 205,256 |
|
Old Republic International Corp.(2) | 28,930 |
| 478,502 |
|
RenaissanceRe Holdings Ltd.(2) | 4,623 |
| 494,661 |
|
| | | 2,773,661 |
|
| INTERNET AND CATALOG RETAIL — 1.6% | | |
Expedia, Inc.(2) | 7,441 |
| 586,053 |
|
HomeAway, Inc.(1)(2) | 14,390 |
| 501,060 |
|
HSN, Inc.(2) | 9,446 |
| 559,581 |
|
| | | 1,646,694 |
|
| INTERNET SOFTWARE AND SERVICES — 0.9% | | |
Conversant, Inc.(1)(2) | 21,269 |
| 540,233 |
|
VeriSign, Inc.(1)(2) | 9,563 |
| 466,770 |
|
| | | 1,007,003 |
|
| IT SERVICES — 1.9% | | |
Amdocs Ltd.(2) | 5,212 |
| 241,472 |
|
|
| | | | | |
| | Shares | Value |
| Computer Sciences Corp. | 4,180 |
| $ | 264,176 |
|
Euronet Worldwide, Inc.(1)(2) | 6,735 |
| 324,896 |
|
Jack Henry & Associates, Inc.(2) | 8,527 |
| 506,760 |
|
NeuStar, Inc., Class A(1)(2) | 7,666 |
| 199,469 |
|
Teradata Corp.(1)(2) | 12,813 |
| 515,083 |
|
| | | 2,051,856 |
|
| LEISURE PRODUCTS — 0.7% | | |
Brunswick Corp.(2) | 8,051 |
| 339,189 |
|
Hasbro, Inc.(2) | 7,861 |
| 417,026 |
|
| | | 756,215 |
|
| LIFE SCIENCES TOOLS AND SERVICES — 1.3% | | |
Charles River Laboratories International, Inc.(1) | 4,814 |
| 257,645 |
|
Covance, Inc.(1) | 3,163 |
| 270,690 |
|
Illumina, Inc.(1)(2) | 3,671 |
| 655,420 |
|
| PerkinElmer, Inc. | 3,594 |
| 168,343 |
|
| | | 1,352,098 |
|
| MACHINERY — 4.3% | | |
Actuant Corp., Class A(2) | 8,804 |
| 304,354 |
|
| AGCO Corp. | 2,753 |
| 154,774 |
|
Caterpillar, Inc.(2) | 3,946 |
| 428,812 |
|
| Dover Corp. | 3,917 |
| 356,251 |
|
IDEX Corp.(2) | 6,849 |
| 552,988 |
|
| Joy Global, Inc. | 2,192 |
| 134,983 |
|
Lincoln Electric Holdings, Inc.(2) | 7,281 |
| 508,796 |
|
Manitowoc Co., Inc. (The)(2) | 15,182 |
| 498,881 |
|
Oshkosh Corp.(2) | 5,860 |
| 325,406 |
|
| Snap-On, Inc. | 3,887 |
| 460,687 |
|
Terex Corp.(2) | 6,515 |
| 267,767 |
|
| Toro Co. (The) | 1,136 |
| 72,250 |
|
| Valmont Industries, Inc. | 1,396 |
| 212,122 |
|
WABCO Holdings, Inc.(1)(2) | 2,900 |
| 309,778 |
|
| | | 4,587,849 |
|
| MARINE — 1.1% | | |
Kirby Corp.(1) | 4,893 |
| 573,166 |
|
Matson, Inc.(2) | 22,072 |
| 592,413 |
|
| | | 1,165,579 |
|
| MEDIA — 2.0% | | |
Cablevision Systems Corp., Class A(2) | 30,347 |
| 535,624 |
|
John Wiley & Sons, Inc., Class A(2) | 9,501 |
| 575,666 |
|
Live Nation Entertainment, Inc.(1)(2) | 24,271 |
| 599,251 |
|
| New York Times Co. (The), Class A | 3,950 |
| 60,079 |
|
Starz - Liberty Capital(1)(2) | 11,383 |
| 339,100 |
|
| | | 2,109,720 |
|
|
| | | | | |
| | Shares | Value |
| METALS AND MINING — 1.9% | | |
Commercial Metals Co.(2) | 21,091 |
| $ | 365,085 |
|
| Compass Minerals International, Inc. | 5,671 |
| 542,942 |
|
| Reliance Steel & Aluminum Co. | 1,608 |
| 118,526 |
|
United States Steel Corp.(2) | 23,049 |
| 600,196 |
|
Worthington Industries, Inc.(2) | 8,410 |
| 361,966 |
|
| | | 1,988,715 |
|
| MULTI-UTILITIES — 0.7% | | |
| Vectren Corp. | 5,172 |
| 219,810 |
|
Wisconsin Energy Corp.(2) | 11,471 |
| 538,219 |
|
| | | 758,029 |
|
| MULTILINE RETAIL — 0.9% | | |
Dillard's, Inc., Class A(2) | 4,487 |
| 523,229 |
|
Macy's, Inc.(2) | 8,355 |
| 484,757 |
|
| | | 1,007,986 |
|
| OIL, GAS AND CONSUMABLE FUELS — 3.6% | | |
Anadarko Petroleum Corp.(2) | 4,668 |
| 511,006 |
|
Denbury Resources, Inc.(2) | 28,997 |
| 535,285 |
|
Encana Corp.(2) | 22,947 |
| 544,073 |
|
EOG Resources, Inc.(2) | 5,033 |
| 588,156 |
|
Gran Tierra Energy, Inc.(1)(2) | 68,897 |
| 559,444 |
|
Kosmos Energy Ltd.(1)(2) | 49,661 |
| 557,693 |
|
| Occidental Petroleum Corp. | 792 |
| 81,283 |
|
Valero Energy Corp.(2) | 8,724 |
| 437,072 |
|
| | | 3,814,012 |
|
| PAPER AND FOREST PRODUCTS — 0.2% | | |
| International Paper Co. | 5,201 |
| 262,495 |
|
| PERSONAL PRODUCTS — 0.5% | | |
Avon Products, Inc.(2) | 35,997 |
| 525,916 |
|
| PHARMACEUTICALS — 2.1% | | |
| AbbVie, Inc. | 1,378 |
| 77,774 |
|
Akorn, Inc.(1)(2) | 18,865 |
| 627,261 |
|
Johnson & Johnson(2) | 4,530 |
| 473,929 |
|
Merck & Co., Inc.(2) | 9,315 |
| 538,873 |
|
Pfizer, Inc.(2) | 16,094 |
| 477,670 |
|
| | | 2,195,507 |
|
| PROFESSIONAL SERVICES — 1.0% | | |
Manpowergroup, Inc.(2) | 6,481 |
| 549,913 |
|
| Towers Watson & Co., Class A | 4,963 |
| 517,293 |
|
| | | 1,067,206 |
|
| REAL ESTATE INVESTMENT TRUSTS (REITs) — 2.1% | | |
| CommonWealth REIT | 4,514 |
| 118,809 |
|
| Host Hotels & Resorts, Inc. | 23,695 |
| 521,527 |
|
| Potlatch Corp. | 13,331 |
| 551,903 |
|
|
| | | | | |
| | Shares | Value |
| PS Business Parks, Inc. | 6,219 |
| $ | 519,224 |
|
Ryman Hospitality Properties, Inc.(2) | 11,340 |
| 546,021 |
|
| | | 2,257,484 |
|
| REAL ESTATE MANAGEMENT AND DEVELOPMENT — 1.6% | | |
Altisource Portfolio Solutions SA(1) | 5,007 |
| 573,702 |
|
CBRE Group, Inc.(1)(2) | 17,572 |
| 563,007 |
|
St Joe Co. (The)(1) | 21,068 |
| 535,759 |
|
| | | 1,672,468 |
|
| ROAD AND RAIL — 0.3% | | |
Avis Budget Group, Inc.(1) | 5,312 |
| 317,073 |
|
| SEMICONDUCTORS AND SEMICONDUCTOR EQUIPMENT — 2.3% | |
| Broadcom Corp., Class A | 5,562 |
| 206,461 |
|
Fairchild Semiconductor International, Inc.(1)(2) | 23,944 |
| 373,526 |
|
Freescale Semiconductor Ltd.(1)(2) | 13,222 |
| 310,717 |
|
International Rectifier Corp.(1)(2) | 10,979 |
| 306,314 |
|
KLA-Tencor Corp.(2) | 3,420 |
| 248,429 |
|
| Microchip Technology, Inc. | 1,613 |
| 78,731 |
|
Microsemi Corp.(1)(2) | 5,257 |
| 140,677 |
|
ON Semiconductor Corp.(1)(2) | 36,761 |
| 335,996 |
|
Semtech Corp.(1) | 17,281 |
| 451,898 |
|
| | | 2,452,749 |
|
| SOFTWARE — 3.0% | | |
Aspen Technology, Inc.(1)(2) | 3,207 |
| 148,805 |
|
| CA, Inc. | 2,377 |
| 68,315 |
|
Cadence Design Systems, Inc.(1)(2) | 32,792 |
| 573,532 |
|
Manhattan Associates, Inc.(1) | 3,552 |
| 122,295 |
|
Mentor Graphics Corp.(2) | 19,734 |
| 425,662 |
|
Oracle Corp.(2) | 7,308 |
| 296,193 |
|
PTC, Inc.(1)(2) | 12,031 |
| 466,803 |
|
Symantec Corp.(2) | 23,193 |
| 531,120 |
|
Synopsys, Inc.(1)(2) | 13,779 |
| 534,901 |
|
| | | 3,167,626 |
|
| SPECIALTY RETAIL — 3.6% | | |
Aaron's, Inc.(2) | 16,068 |
| 572,664 |
|
Best Buy Co., Inc.(2) | 9,751 |
| 302,379 |
|
Buckle, Inc. (The)(2) | 10,973 |
| 486,762 |
|
| DSW, Inc., Class A | 14,508 |
| 405,354 |
|
GameStop Corp., Class A(2) | 14,369 |
| 581,513 |
|
Guess?, Inc.(2) | 18,568 |
| 501,336 |
|
PetSmart, Inc.(2) | 9,075 |
| 542,685 |
|
Staples, Inc.(2) | 22,716 |
| 246,241 |
|
Urban Outfitters, Inc.(1)(2) | 6,915 |
| 234,142 |
|
| | | 3,873,076 |
|
|
| | | | | |
| | Shares | Value |
| TECHNOLOGY HARDWARE, STORAGE AND PERIPHERALS — 1.2% | |
| Diebold, Inc. | 1,921 |
| $ | 77,167 |
|
EMC Corp.(2) | 4,689 |
| 123,508 |
|
| Hewlett-Packard Co. | 3,214 |
| 108,247 |
|
NetApp, Inc.(2) | 11,442 |
| 417,862 |
|
| SanDisk Corp. | 3,797 |
| 396,521 |
|
| Western Digital Corp. | 1,157 |
| 106,791 |
|
| | | 1,230,096 |
|
| TEXTILES, APPAREL AND LUXURY GOODS — 2.2% | | |
| Columbia Sportswear Co. | 5,139 |
| 424,738 |
|
Deckers Outdoor Corp.(1)(2) | 5,962 |
| 514,699 |
|
Hanesbrands, Inc.(2) | 5,413 |
| 532,856 |
|
Iconix Brand Group, Inc.(1)(2) | 12,367 |
| 531,039 |
|
Steven Madden Ltd.(1)(2) | 10,865 |
| 372,670 |
|
| | | 2,376,002 |
|
| THRIFTS AND MORTGAGE FINANCE — 0.5% | | |
EverBank Financial Corp.(2) | 28,301 |
| 570,548 |
|
| TRADING COMPANIES AND DISTRIBUTORS — 0.6% | | |
United Rentals, Inc.(1) | 1,793 |
| 187,781 |
|
WESCO International, Inc.(1) | 5,348 |
| 461,960 |
|
| | | 649,741 |
|
TOTAL COMMON STOCKS (Cost $87,996,097) | | 102,924,777 |
|
| TEMPORARY CASH INVESTMENTS — 3.4% | | |
| Repurchase Agreement, Bank of America Merrill Lynch, (collateralized by various U.S. Treasury obligations, 0.75% - 0.875%, 1/31/18 - 2/28/18, valued at $805,670), in a joint trading account at 0.05%, dated 6/30/14, due 7/1/14 (Delivery value $789,457) | | 789,456 |
|
| Repurchase Agreement, Credit Suisse First Boston, Inc., (collateralized by various U.S. Treasury obligations, 1.75%, 5/15/23, valued at $322,372), in a joint trading account at 0.01%, dated 6/30/14, due 7/1/14 (Delivery value $315,782) | | 315,782 |
|
| Repurchase Agreement, Goldman Sachs & Co., (collateralized by various U.S. Treasury obligations, 3.125%, 11/15/41, valued at $644,269), in a joint trading account at 0.03%, dated 6/30/14, due 7/1/14 (Delivery value $631,566) | | 631,565 |
|
| SSgA U.S. Government Money Market Fund, Class N | 1,865,698 |
| 1,865,698 |
|
TOTAL TEMPORARY CASH INVESTMENTS (Cost $3,602,501) | | 3,602,501 |
|
TOTAL INVESTMENT SECURITIES BEFORE SECURITIES SOLD SHORT — 100.3% (Cost $91,598,598) | 106,527,278 |
|
| COMMON STOCKS SOLD SHORT — (97.3)% | | |
| AEROSPACE AND DEFENSE — (1.5)% | | |
| DigitalGlobe, Inc. | (16,398 | ) | (455,865 | ) |
| Rockwell Collins, Inc. | (3,744 | ) | (292,556 | ) |
| TransDigm Group, Inc. | (2,150 | ) | (359,609 | ) |
| Triumph Group, Inc. | (7,248 | ) | (506,055 | ) |
| | | (1,614,085 | ) |
|
| | | | | |
| | Shares | Value |
| AIR FREIGHT AND LOGISTICS — (1.4)% | | |
| Atlas Air Worldwide Holdings, Inc. | (9,035 | ) | $ | (332,940 | ) |
| CH Robinson Worldwide, Inc. | (9,033 | ) | (576,215 | ) |
| UTi Worldwide, Inc. | (55,866 | ) | (577,654 | ) |
| | | (1,486,809 | ) |
| AIRLINES — (0.5)% | | |
| Spirit Airlines, Inc. | (8,621 | ) | (545,192 | ) |
| AUTO COMPONENTS — (0.5)% | | |
| BorgWarner, Inc. | (828 | ) | (53,977 | ) |
| Lear Corp. | (5,450 | ) | (486,794 | ) |
| | | (540,771 | ) |
| AUTOMOBILES — (0.5)% | | |
| Thor Industries, Inc. | (8,982 | ) | (510,806 | ) |
| BANKS — (1.6)% | | |
| Bank of Hawaii Corp. | (2,005 | ) | (117,673 | ) |
| BankUnited, Inc. | (13,659 | ) | (457,303 | ) |
| City National Corp. | (1,693 | ) | (128,262 | ) |
| Commerce Bancshares, Inc. | (5,801 | ) | (269,747 | ) |
| Cullen/Frost Bankers, Inc. | (2,647 | ) | (210,225 | ) |
| FirstMerit Corp. | (4,650 | ) | (91,837 | ) |
| M&T Bank Corp. | (3,836 | ) | (475,856 | ) |
| | | (1,750,903 | ) |
| BEVERAGES — (1.0)% | | |
| Brown-Forman Corp., Class B | (5,357 | ) | (504,469 | ) |
| Constellation Brands, Inc., Class A | (6,170 | ) | (543,762 | ) |
| | | (1,048,231 | ) |
| BIOTECHNOLOGY — (1.7)% | | |
| ACADIA Pharmaceuticals, Inc. | (11,134 | ) | (251,517 | ) |
| Alnylam Pharmaceuticals, Inc. | (2,240 | ) | (141,501 | ) |
| BioMarin Pharmaceutical, Inc. | (2,821 | ) | (175,494 | ) |
| Clovis Oncology, Inc. | (3,488 | ) | (144,438 | ) |
| Intercept Pharmaceuticals, Inc. | (892 | ) | (211,074 | ) |
| Medivation, Inc. | (3,588 | ) | (276,563 | ) |
| Puma Biotechnology, Inc. | (4,595 | ) | (303,270 | ) |
| Synageva BioPharma Corp. | (2,860 | ) | (299,728 | ) |
| | | (1,803,585 | ) |
| BUILDING PRODUCTS — (1.2)% | | |
| Armstrong World Industries, Inc. | (9,959 | ) | (571,946 | ) |
| Fortune Brands Home & Security, Inc. | (13,574 | ) | (542,010 | ) |
| USG Corp. | (6,187 | ) | (186,414 | ) |
| | | (1,300,370 | ) |
| CAPITAL MARKETS — (3.0)% | | |
| Bank of New York Mellon Corp. (The) | (14,468 | ) | (542,261 | ) |
| Charles Schwab Corp. (The) | (18,424 | ) | (496,158 | ) |
|
| | | | | |
| | Shares | Value |
| Eaton Vance Corp. | (10,530 | ) | $ | (397,929 | ) |
| Invesco Ltd. | (4,751 | ) | (179,350 | ) |
| LPL Financial Holdings, Inc. | (10,989 | ) | (546,593 | ) |
| Northern Trust Corp. | (7,036 | ) | (451,782 | ) |
| State Street Corp. | (8,236 | ) | (553,953 | ) |
| | | (3,168,026 | ) |
| CHEMICALS — (5.4)% | | |
| Agrium, Inc. | (4,074 | ) | (373,301 | ) |
| Air Products & Chemicals, Inc. | (4,349 | ) | (559,368 | ) |
| Chemtura Corp. | (18,561 | ) | (484,999 | ) |
| Cytec Industries, Inc. | (812 | ) | (85,601 | ) |
| Ecolab, Inc. | (4,114 | ) | (458,053 | ) |
| FMC Corp. | (5,488 | ) | (390,691 | ) |
| HB Fuller Co. | (10,650 | ) | (512,265 | ) |
| Intrepid Potash, Inc. | (4,032 | ) | (67,576 | ) |
| Mosaic Co. (The) | (10,555 | ) | (521,945 | ) |
| Praxair, Inc. | (2,818 | ) | (374,343 | ) |
| Rockwood Holdings, Inc. | (4,226 | ) | (321,134 | ) |
| Sensient Technologies Corp. | (7,713 | ) | (429,768 | ) |
| Tronox Ltd., Class A | (18,661 | ) | (501,981 | ) |
| Valhi, Inc. | (28,285 | ) | (181,590 | ) |
| WR Grace & Co. | (5,127 | ) | (484,655 | ) |
| | | (5,747,270 | ) |
| COMMERCIAL SERVICES AND SUPPLIES — (2.4)% | | |
| Clean Harbors, Inc. | (6,149 | ) | (395,073 | ) |
| Copart, Inc. | (12,943 | ) | (465,430 | ) |
| Covanta Holding Corp. | (26,178 | ) | (539,529 | ) |
| Interface, Inc. | (29,189 | ) | (549,921 | ) |
| Iron Mountain, Inc. | (18,312 | ) | (649,160 | ) |
| | | (2,599,113 | ) |
| COMMUNICATIONS EQUIPMENT — (0.8)% | | |
| EchoStar Corp., Class A | (6,116 | ) | (323,781 | ) |
| ViaSat, Inc. | (9,426 | ) | (546,331 | ) |
| | | (870,112 | ) |
| CONSTRUCTION AND ENGINEERING — (1.7)% | | |
| Chicago Bridge & Iron Co. NV | (6,424 | ) | (438,117 | ) |
| EMCOR Group, Inc. | (10,820 | ) | (481,815 | ) |
| Granite Construction, Inc. | (15,046 | ) | (541,355 | ) |
| MasTec, Inc. | (10,242 | ) | (315,658 | ) |
| | | (1,776,945 | ) |
| CONSUMER FINANCE — (0.1)% | | |
| Discover Financial Services | (1,611 | ) | (99,850 | ) |
| CONTAINERS AND PACKAGING — (1.1)% | | |
| Greif, Inc., Class A | (1,697 | ) | (92,588 | ) |
|
| | | | | |
| | Shares | Value |
| MeadWestvaco Corp. | (11,080 | ) | $ | (490,401 | ) |
| Sealed Air Corp. | (15,620 | ) | (533,736 | ) |
| | | (1,116,725 | ) |
| DISTRIBUTORS — (0.3)% | | |
| Pool Corp. | (4,852 | ) | (274,429 | ) |
| DIVERSIFIED FINANCIAL SERVICES — (1.3)% | | |
| CME Group, Inc. | (4,032 | ) | (286,070 | ) |
| Intercontinental Exchange, Inc. | (2,752 | ) | (519,853 | ) |
| Leucadia National Corp. | (20,735 | ) | (543,672 | ) |
| | | (1,349,595 | ) |
| DIVERSIFIED TELECOMMUNICATION SERVICES — (0.6)% | | |
| tw telecom, Inc. | (16,197 | ) | (652,901 | ) |
| ELECTRIC UTILITIES — (0.8)% | | |
| ALLETE, Inc. | (9,981 | ) | (512,524 | ) |
| ITC Holdings Corp. | (8,862 | ) | (323,286 | ) |
| | | (835,810 | ) |
| ELECTRICAL EQUIPMENT — (0.5)% | | |
| Franklin Electric Co., Inc. | (13,482 | ) | (543,729 | ) |
| ELECTRONIC EQUIPMENT, INSTRUMENTS AND COMPONENTS — (2.0)% | |
| Amphenol Corp., Class A | (5,450 | ) | (525,053 | ) |
| AVX Corp. | (40,065 | ) | (532,063 | ) |
| Belden, Inc. | (6,057 | ) | (473,415 | ) |
| SYNNEX Corp. | (7,889 | ) | (574,714 | ) |
| | | (2,105,245 | ) |
| ENERGY EQUIPMENT AND SERVICES — (3.9)% | | |
| Atwood Oceanics, Inc. | (10,526 | ) | (552,404 | ) |
| Bristow Group, Inc. | (6,942 | ) | (559,664 | ) |
| Cameron International Corp. | (6,067 | ) | (410,796 | ) |
| Dresser-Rand Group, Inc. | (8,493 | ) | (541,259 | ) |
| Hornbeck Offshore Services, Inc. | (11,964 | ) | (561,351 | ) |
| McDermott International, Inc. | (47,608 | ) | (385,149 | ) |
| Seadrill Ltd. | (14,207 | ) | (567,570 | ) |
| Tidewater, Inc. | (9,925 | ) | (557,289 | ) |
| | | (4,135,482 | ) |
| FOOD AND STAPLES RETAILING — (2.0)% | | |
| Casey's General Stores, Inc. | (5,951 | ) | (418,296 | ) |
| Costco Wholesale Corp. | (4,470 | ) | (514,765 | ) |
| Fresh Market, Inc. (The) | (10,117 | ) | (338,616 | ) |
| Pricesmart, Inc. | (4,122 | ) | (358,779 | ) |
| United Natural Foods, Inc. | (7,751 | ) | (504,590 | ) |
| | | (2,135,046 | ) |
| FOOD PRODUCTS — (2.4)% | | |
| Darling Ingredients, Inc. | (26,365 | ) | (551,028 | ) |
| Flowers Foods, Inc. | (11,711 | ) | (246,868 | ) |
|
| | | | | |
| | Shares | Value |
| Hain Celestial Group, Inc. (The) | (5,679 | ) | $ | (503,954 | ) |
| McCormick & Co., Inc. | (3,942 | ) | (282,208 | ) |
| Post Holdings, Inc. | (9,171 | ) | (466,896 | ) |
| WhiteWave Foods Co., Class A | (15,064 | ) | (487,622 | ) |
| | | (2,538,576 | ) |
| GAS UTILITIES — (1.2)% | | |
| Piedmont Natural Gas Co., Inc. | (9,138 | ) | (341,853 | ) |
| South Jersey Industries, Inc. | (7,471 | ) | (451,323 | ) |
| WGL Holdings, Inc. | (10,323 | ) | (444,921 | ) |
| | | (1,238,097 | ) |
| HEALTH CARE EQUIPMENT AND SUPPLIES — (1.7)% | | |
| Abbott Laboratories | (13,441 | ) | (549,737 | ) |
| Cooper Cos., Inc. (The) | (1,305 | ) | (176,867 | ) |
| IDEXX Laboratories, Inc. | (4,095 | ) | (546,969 | ) |
| Sirona Dental Systems, Inc. | (6,705 | ) | (552,894 | ) |
| | | (1,826,467 | ) |
| HEALTH CARE PROVIDERS AND SERVICES — (3.6)% | | |
| Acadia Healthcare Co., Inc. | (11,547 | ) | (525,389 | ) |
| Air Methods Corp. | (9,434 | ) | (487,266 | ) |
| AmerisourceBergen Corp. | (7,600 | ) | (552,216 | ) |
| Community Health Systems, Inc. | (13,979 | ) | (634,227 | ) |
| MWI Veterinary Supply, Inc. | (3,679 | ) | (522,381 | ) |
| Owens & Minor, Inc. | (15,538 | ) | (527,981 | ) |
| Tenet Healthcare Corp. | (12,197 | ) | (572,527 | ) |
| | | (3,821,987 | ) |
| HOTELS, RESTAURANTS AND LEISURE — (2.7)% | | |
| BJ's Restaurants, Inc. | (6,179 | ) | (215,709 | ) |
| Bob Evans Farms, Inc. | (10,920 | ) | (546,546 | ) |
| Carnival Corp. | (13,281 | ) | (500,030 | ) |
| Life Time Fitness, Inc. | (10,063 | ) | (490,470 | ) |
| Norwegian Cruise Line Holdings Ltd. | (16,224 | ) | (514,301 | ) |
| Starbucks Corp. | (7,336 | ) | (567,660 | ) |
| | | (2,834,716 | ) |
| HOUSEHOLD DURABLES — (3.2)% | | |
| DR Horton, Inc. | (19,741 | ) | (485,234 | ) |
| Lennar Corp., Class A | (11,515 | ) | (483,400 | ) |
| M.D.C. Holdings, Inc. | (18,287 | ) | (553,913 | ) |
| Ryland Group, Inc. | (6,920 | ) | (272,925 | ) |
| Standard Pacific Corp. | (49,654 | ) | (427,024 | ) |
| Tempur Sealy International, Inc. | (10,098 | ) | (602,851 | ) |
| Toll Brothers, Inc. | (15,107 | ) | (557,448 | ) |
| | | (3,382,795 | ) |
| INSURANCE — (3.9)% | | |
| Arthur J Gallagher & Co. | (1,956 | ) | (91,150 | ) |
|
| | | | | |
| | Shares | Value |
| CNO Financial Group, Inc. | (32,032 | ) | $ | (570,170 | ) |
| Enstar Group Ltd. | (995 | ) | (149,976 | ) |
| Loews Corp. | (12,110 | ) | (532,961 | ) |
| Marsh & McLennan Cos., Inc. | (10,484 | ) | (543,281 | ) |
| Platinum Underwriters Holdings Ltd. | (7,828 | ) | (507,646 | ) |
| ProAssurance Corp. | (11,601 | ) | (515,084 | ) |
| Prudential Financial, Inc. | (3,410 | ) | (302,706 | ) |
| RLI Corp. | (11,793 | ) | (539,883 | ) |
| White Mountains Insurance Group Ltd. | (673 | ) | (409,480 | ) |
| | | (4,162,337 | ) |
| INTERNET SOFTWARE AND SERVICES — (1.3)% | | |
| Dealertrack Technologies, Inc. | (13,016 | ) | (590,145 | ) |
| Pandora Media, Inc. | (19,353 | ) | (570,914 | ) |
| Rackspace Hosting, Inc. | (5,935 | ) | (199,772 | ) |
| | | (1,360,831 | ) |
| IT SERVICES — (3.3)% | | |
| Alliance Data Systems Corp. | (1,430 | ) | (402,187 | ) |
| Automatic Data Processing, Inc. | (4,446 | ) | (352,479 | ) |
| CoreLogic, Inc. | (17,835 | ) | (541,471 | ) |
| FleetCor Technologies, Inc. | (4,365 | ) | (575,307 | ) |
| Leidos Holdings, Inc. | (14,039 | ) | (538,255 | ) |
| MAXIMUS, Inc. | (4,735 | ) | (203,700 | ) |
| Total System Services, Inc. | (7,906 | ) | (248,327 | ) |
| WEX, Inc. | (5,735 | ) | (602,003 | ) |
| | | (3,463,729 | ) |
| MACHINERY — (3.2)% | | |
| Chart Industries, Inc. | (7,179 | ) | (593,990 | ) |
| CLARCOR, Inc. | (9,192 | ) | (568,525 | ) |
| Ingersoll-Rand plc | (8,162 | ) | (510,207 | ) |
| ITT Corp. | (9,876 | ) | (475,036 | ) |
| Middleby Corp. (The) | (4,026 | ) | (333,031 | ) |
| Nordson Corp. | (4,513 | ) | (361,897 | ) |
| Wabtec Corp. | (6,793 | ) | (561,034 | ) |
| | | (3,403,720 | ) |
| MEDIA — (3.5)% | | |
| AMC Networks, Inc., Class A | (7,551 | ) | (464,311 | ) |
| Charter Communications, Inc., Class A | (3,786 | ) | (599,627 | ) |
| Cinemark Holdings, Inc. | (10,315 | ) | (364,738 | ) |
| DISH Network Corp., Class A | (7,261 | ) | (472,546 | ) |
| DreamWorks Animation SKG, Inc., Class A | (14,920 | ) | (347,039 | ) |
| Loral Space & Communications, Inc. | (7,248 | ) | (526,857 | ) |
| Sinclair Broadcast Group, Inc., Class A | (1,740 | ) | (60,465 | ) |
| Tribune Co. | (4,043 | ) | (343,857 | ) |
| Twenty-First Century Fox, Inc. | (15,199 | ) | (534,245 | ) |
| | | (3,713,685 | ) |
|
| | | | | |
| | Shares | Value |
| METALS AND MINING — (3.5)% | | |
| Allegheny Technologies, Inc. | (12,887 | ) | $ | (581,204 | ) |
| Carpenter Technology Corp. | (8,093 | ) | (511,882 | ) |
| Goldcorp, Inc. | (13,377 | ) | (373,352 | ) |
| Hecla Mining Co. | (30,143 | ) | (103,993 | ) |
| New Gold, Inc. | (81,327 | ) | (518,053 | ) |
| Nucor Corp. | (9,982 | ) | (491,614 | ) |
| Royal Gold, Inc. | (2,078 | ) | (158,177 | ) |
| Stillwater Mining Co. | (25,858 | ) | (453,808 | ) |
| Tahoe Resources, Inc. | (21,995 | ) | (576,269 | ) |
| | | (3,768,352 | ) |
| MULTI-UTILITIES — (1.5)% | | |
| Dominion Resources, Inc. | (6,912 | ) | (494,346 | ) |
| MDU Resources Group, Inc. | (15,569 | ) | (546,472 | ) |
| NiSource, Inc. | (11,215 | ) | (441,198 | ) |
| Sempra Energy | (1,416 | ) | (148,270 | ) |
| | | (1,630,286 | ) |
| MULTILINE RETAIL — (0.6)% | | |
| Family Dollar Stores, Inc. | (9,057 | ) | (599,030 | ) |
| OIL, GAS AND CONSUMABLE FUELS — (5.1)% | | |
| CONSOL Energy, Inc. | (11,235 | ) | (517,597 | ) |
| Continental Resources, Inc. | (3,429 | ) | (541,919 | ) |
| Diamondback Energy, Inc. | (7,364 | ) | (653,923 | ) |
| Enbridge, Inc. | (10,870 | ) | (515,999 | ) |
| Energen Corp. | (5,380 | ) | (478,174 | ) |
| Gulfport Energy Corp. | (6,397 | ) | (401,732 | ) |
| Kinder Morgan, Inc. | (2,885 | ) | (104,610 | ) |
| Noble Energy, Inc. | (7,464 | ) | (578,161 | ) |
| Pioneer Natural Resources Co. | (578 | ) | (132,830 | ) |
| Range Resources Corp. | (610 | ) | (53,040 | ) |
| Spectra Energy Corp. | (7,428 | ) | (315,541 | ) |
| Tesoro Corp. | (1,219 | ) | (71,519 | ) |
| Whiting Petroleum Corp. | (4,768 | ) | (382,632 | ) |
| Williams Cos., Inc. (The) | (11,413 | ) | (664,351 | ) |
| | | (5,412,028 | ) |
| PAPER AND FOREST PRODUCTS — (0.2)% | | |
| Louisiana-Pacific Corp. | (17,071 | ) | (256,406 | ) |
| PHARMACEUTICALS — (1.5)% | | |
| Hospira, Inc. | (8,899 | ) | (457,142 | ) |
| Jazz Pharmaceuticals plc | (1,118 | ) | (164,357 | ) |
| Pacira Pharmaceuticals, Inc. | (3,586 | ) | (329,410 | ) |
| Perrigo Co. plc | (3,415 | ) | (497,770 | ) |
| Valeant Pharmaceuticals International, Inc. | (1,383 | ) | (174,424 | ) |
| | | (1,623,103 | ) |
|
| | | | | |
| | Shares | Value |
| PROFESSIONAL SERVICES — (0.7)% | | |
| Advisory Board Co. (The) | (4,605 | ) | $ | (238,539 | ) |
| IHS, Inc., Class A | (4,081 | ) | (553,669 | ) |
| | | (792,208 | ) |
| REAL ESTATE INVESTMENT TRUSTS (REITs) — (1.2)% | | |
| American Realty Capital Properties, Inc. | (13,344 | ) | (167,200 | ) |
| Plum Creek Timber Co., Inc. | (12,028 | ) | (542,463 | ) |
| Weingarten Realty Investors | (7,223 | ) | (237,203 | ) |
| WP Carey, Inc. | (5,599 | ) | (360,576 | ) |
| | | (1,307,442 | ) |
| REAL ESTATE MANAGEMENT AND DEVELOPMENT — (1.1)% | | |
| Alexander & Baldwin, Inc. | (13,733 | ) | (569,233 | ) |
| Howard Hughes Corp. (The) | (3,490 | ) | (550,827 | ) |
| | | (1,120,060 | ) |
| ROAD AND RAIL — (1.0)% | | |
| JB Hunt Transport Services, Inc. | (6,769 | ) | (499,417 | ) |
| Kansas City Southern | (5,098 | ) | (548,086 | ) |
| | | (1,047,503 | ) |
| SEMICONDUCTORS AND SEMICONDUCTOR EQUIPMENT — (1.3)% | |
| Altera Corp. | (13,255 | ) | (460,744 | ) |
| SunEdison, Inc. | (29,571 | ) | (668,305 | ) |
| SunPower Corp. | (5,345 | ) | (219,038 | ) |
| | | (1,348,087 | ) |
| SOFTWARE — (2.0)% | | |
| CommVault Systems, Inc. | (7,113 | ) | (349,746 | ) |
| Concur Technologies, Inc. | (6,234 | ) | (581,881 | ) |
| Solera Holdings, Inc. | (8,168 | ) | (548,481 | ) |
| Tyler Technologies, Inc. | (6,661 | ) | (607,550 | ) |
| Workday, Inc., Class A | (695 | ) | (62,453 | ) |
| | | (2,150,111 | ) |
| SPECIALTY RETAIL — (4.7)% | | |
| Abercrombie & Fitch Co., Class A | (1,256 | ) | (54,322 | ) |
| American Eagle Outfitters, Inc. | (49,375 | ) | (553,988 | ) |
| Cabela's, Inc. | (8,132 | ) | (507,437 | ) |
| CarMax, Inc. | (11,690 | ) | (607,997 | ) |
| Conn's, Inc. | (11,431 | ) | (564,577 | ) |
| Dick's Sporting Goods, Inc. | (7,423 | ) | (345,615 | ) |
| L Brands, Inc. | (9,078 | ) | (532,515 | ) |
| Lumber Liquidators Holdings, Inc. | (5,001 | ) | (379,826 | ) |
| Penske Automotive Group, Inc. | (9,135 | ) | (452,182 | ) |
| Rent-A-Center, Inc. | (11,350 | ) | (325,518 | ) |
| Tiffany & Co. | (2,622 | ) | (262,855 | ) |
| Ulta Salon Cosmetics & Fragrance, Inc. | (4,780 | ) | (436,940 | ) |
| | | (5,023,772 | ) |
| | | |
|
| | | | | |
| | Shares | Value |
| TECHNOLOGY HARDWARE, STORAGE AND PERIPHERALS — (1.1)% | |
| NCR Corp. | (15,967 | ) | $ | (560,282 | ) |
| Stratasys Ltd. | (5,237 | ) | (595,080 | ) |
| | | (1,155,362 | ) |
| TEXTILES, APPAREL AND LUXURY GOODS — (1.9)% | | |
| Carter's, Inc. | (7,665 | ) | (528,348 | ) |
| NIKE, Inc., Class B | (6,516 | ) | (505,316 | ) |
| Ralph Lauren Corp. | (2,141 | ) | (344,037 | ) |
| Under Armour, Inc., Class A | (11,152 | ) | (663,433 | ) |
| | | (2,041,134 | ) |
| THRIFTS AND MORTGAGE FINANCE — (1.8)% | | |
| Astoria Financial Corp. | (31,761 | ) | (427,186 | ) |
| Capitol Federal Financial, Inc. | (38,826 | ) | (472,124 | ) |
| People's United Financial, Inc. | (36,963 | ) | (560,729 | ) |
| Washington Federal, Inc. | (18,052 | ) | (404,906 | ) |
| | | (1,864,945 | ) |
| TOBACCO — (0.5)% | | |
| Universal Corp. | (9,416 | ) | (521,176 | ) |
| TRADING COMPANIES AND DISTRIBUTORS — (1.3)% | | |
| Fastenal Co. | (9,498 | ) | (470,056 | ) |
| GATX Corp. | (8,085 | ) | (541,210 | ) |
| MSC Industrial Direct Co., Inc., Class A | (4,366 | ) | (417,564 | ) |
| | | (1,428,830 | ) |
| WIRELESS TELECOMMUNICATION SERVICES — (0.5)% | | |
| United States Cellular Corp. | (12,626 | ) | (515,141 | ) |
TOTAL COMMON STOCKS SOLD SHORT — (97.3)% (Proceeds $94,394,993) | | (103,362,946 | ) |
OTHER ASSETS AND LIABILITIES(3) — 97.0% | | 103,088,510 |
|
| TOTAL NET ASSETS — 100.0% | | $ | 106,252,842 |
|
|
| | |
| NOTES TO SCHEDULE OF INVESTMENTS |
| |
| (2) | Security, or a portion thereof, has been pledged at the custodian bank or with a broker for collateral requirements on securities sold short. At the period end, the aggregate value of securities pledged was $60,871,350. |
| |
| (3) | Amount relates primarily to deposits with broker for securities sold short at period end. |
See Notes to Financial Statements.
|
|
| Statement of Assets and Liabilities |
|
| | | |
| JUNE 30, 2014 |
| Assets |
| Investment securities, at value (cost of $91,598,598) | $ | 106,527,278 |
|
| Cash | 2,225 |
|
| Deposits with broker for securities sold short | 103,278,143 |
|
| Receivable for capital shares sold | 289,891 |
|
| Dividends and interest receivable | 72,065 |
|
| | 210,169,602 |
|
| | |
| Liabilities | |
| Securities sold short, at value (proceeds of $94,394,993) | 103,362,946 |
|
| Payable for capital shares redeemed | 350,675 |
|
| Accrued management fees | 117,559 |
|
| Distribution and service fees payable | 11,899 |
|
| Dividend expense payable on securities sold short | 73,681 |
|
| | 103,916,760 |
|
| | |
| Net Assets | $ | 106,252,842 |
|
| �� | |
| Net Assets Consist of: | |
| Capital (par value and paid-in surplus) | $ | 109,602,633 |
|
| Accumulated net investment loss | (754,355 | ) |
| Accumulated net realized loss | (8,556,163 | ) |
| Net unrealized appreciation | 5,960,727 |
|
| | $ | 106,252,842 |
|
|
| | | | | | |
| | Net Assets | Shares Outstanding | Net Asset Value Per Share |
| Investor Class, $0.01 Par Value |
| $50,641,444 |
| 4,506,488 |
| $11.24 |
| Institutional Class, $0.01 Par Value |
| $16,809,860 |
| 1,473,654 |
| $11.41 |
| A Class, $0.01 Par Value |
| $31,354,433 |
| 2,839,795 |
| $11.04* |
| C Class, $0.01 Par Value |
| $5,729,196 |
| 549,827 |
| $10.42 |
| R Class, $0.01 Par Value |
| $1,717,909 |
| 158,571 |
| $10.83 |
See Notes to Financial Statements.
|
| | | |
| YEAR ENDED JUNE 30, 2014 | |
| Investment Income (Loss) | |
| Income: | |
| Dividends (net of foreign taxes withheld of $2,523) | $ | 983,126 |
|
| Interest | 542 |
|
| | 983,668 |
|
| | |
| Expenses: | |
| Dividend expense on securities sold short | 945,593 |
|
| Broker fees and charges on securities sold short | 171,463 |
|
| Management fees | 976,013 |
|
| Distribution and service fees: | |
| A Class | 58,602 |
|
| C Class | 49,139 |
|
| R Class | 7,226 |
|
| Directors' fees and expenses | 4,151 |
|
| Other expenses | 40 |
|
| | 2,212,227 |
|
| | |
| Net investment income (loss) | (1,228,559 | ) |
| | |
| Realized and Unrealized Gain (Loss) | |
| Net realized gain (loss) on: | |
| Investment transactions | 8,184,352 |
|
| Securities sold short transactions | (5,722,369 | ) |
| Foreign currency transactions | 160 |
|
| | 2,462,143 |
|
| | |
| Change in net unrealized appreciation (depreciation) on: | |
| Investments | 8,000,597 |
|
| Securities sold short | (7,021,548 | ) |
| Translation of assets and liabilities in foreign currencies | (4 | ) |
| | 979,045 |
|
| | |
| Net realized and unrealized gain (loss) | 3,441,188 |
|
| | |
| Net Increase (Decrease) in Net Assets Resulting from Operations | $ | 2,212,629 |
|
See Notes to Financial Statements.
|
|
| Statement of Changes in Net Assets |
|
| | | | | | |
| YEARS ENDED JUNE 30, 2014 AND JUNE 30, 2013 | | |
| Increase (Decrease) in Net Assets | June 30, 2014 | June 30, 2013 |
| Operations | | |
| Net investment income (loss) | $ | (1,228,559 | ) | $ | (630,670 | ) |
| Net realized gain (loss) | 2,462,143 |
| 2,868,722 |
|
| Change in net unrealized appreciation (depreciation) | 979,045 |
| (1,251,346 | ) |
| Net increase (decrease) in net assets resulting from operations | 2,212,629 |
| 986,706 |
|
| | | |
| Capital Share Transactions | | |
| Net increase (decrease) in net assets from capital share transactions (Note 5) | 58,107,021 |
| (22,929,637 | ) |
| | | |
| Net increase (decrease) in net assets | 60,319,650 |
| (21,942,931 | ) |
| | | |
| Net Assets | | |
| Beginning of period | 45,933,192 |
| 67,876,123 |
|
| End of period | $ | 106,252,842 |
| $ | 45,933,192 |
|
| | | |
| Accumulated net investment loss | $ | (754,355 | ) | $ | (319,360 | ) |
See Notes to Financial Statements.
|
|
| Notes to Financial Statements |
JUNE 30, 2014
1. Organization
American Century Quantitative Equity Funds, Inc. (the corporation) is registered under the Investment Company Act of 1940, as amended (the 1940 Act), as an open-end management investment company and is organized as a Maryland corporation. Equity Market Neutral Fund (the fund) is one fund in a series issued by the corporation. The fund is diversified as defined under the 1940 Act. The fund’s investment objective is to seek capital appreciation independent of equity market conditions.
The fund offers the Investor Class, the Institutional Class, the A Class, the C Class and the R Class. The A Class may incur an initial sales charge. The A Class and C Class may be subject to a contingent deferred sales charge. The share classes differ principally in their respective sales charges and distribution and shareholder servicing expenses and arrangements. The Institutional Class is made available to institutional shareholders or through financial intermediaries whose clients do not require the same level of shareholder and administrative services as shareholders of other classes. As a result, the Institutional Class is charged a lower unified management fee.
2. Significant Accounting Policies
The following is a summary of significant accounting policies consistently followed by the fund in preparation of its financial statements. The financial statements are prepared in conformity with accounting principles generally accepted in the United States of America, which may require management to make certain estimates and assumptions at the date of the financial statements. Actual results could differ from these estimates. Management evaluated the impact of events or transactions occurring through the date the financial statements were issued that would merit recognition or disclosure.
Investment Valuations — The fund determines the fair value of its investments and computes its net asset value per share at the close of regular trading (usually 4 p.m. Eastern time) on the New York Stock Exchange (NYSE) on each day the NYSE is open. The Board of Directors has adopted valuation policies and procedures to guide the investment advisor in the fund’s investment valuation process and to provide methodologies for the oversight of the fund’s pricing function.
Equity securities that are listed or traded on a domestic securities exchange are valued at the last reported sales price or at the official closing price as provided by the exchange. Equity securities traded on foreign securities exchanges are generally valued at the closing price of such securities on the exchange where primarily traded or at the close of the NYSE, if that is earlier. If no last sales price is reported, or if local convention or regulation so provides, the mean of the latest bid and asked prices may be used. Securities traded over-the-counter are valued at the mean of the latest bid and asked prices, the last sales price, or the official closing price. Equity securities initially expressed in local currencies are translated into U.S. dollars at the mean of the appropriate currency exchange rate at the close of the NYSE as provided by an independent pricing service.
Fixed income securities maturing within 60 days at the time of purchase may be valued at cost, plus or minus any amortized discount or premium or at the evaluated mean as provided by an independent pricing service. Evaluated mean prices are commonly derived through utilization of market models, which may consider, among other factors: trade data, quotations from dealers and active market makers, relevant yield curve and spread data, related sector levels, creditworthiness, trade data or market information on comparable securities, and other relevant security specific information.
Open-end management investment companies are valued at the reported net asset value per share. Repurchase agreements are valued at cost, which approximates fair value.
If the fund determines that the market price for an investment is not readily available or the valuation methods mentioned above do not reflect an investment’s fair value, such investment is valued as determined in good faith by the Board of Directors or its delegate, in accordance with policies and procedures adopted by the Board of Directors. In its determination of fair value, the fund may review several factors including, but not limited to, market information regarding the specific investment or comparable investments and correlation with other investment types, futures indices or general market indicators. Circumstances that may cause the fund to use these procedures to value an investment include, but are not limited to: an investment has been
declared in default or is distressed; trading in a security has been suspended during the trading day or a security is not actively trading on its principal exchange; prices received from a regular pricing source are deemed unreliable; or there is a foreign market holiday and no trading occurred.
The fund monitors for significant events occurring after the close of an investment’s primary exchange but before the fund’s net asset value per share is determined. Significant events may include, but are not limited to: corporate announcements and transactions; governmental action and political unrest that could impact a specific investment or an investment sector; or armed conflicts, natural disasters and similar events that could affect investments in a specific country or region. The fund also monitors for significant fluctuations between domestic and foreign markets, as evidenced by the U.S. market or such other indicators that the Board of Directors, or its delegate, deems appropriate. If significant fluctuations in foreign markets are identified, the fund may apply a model-derived factor to the closing price of equity securities traded on foreign securities exchanges. The factor is based on observable market data as provided by an independent pricing service.
Security Transactions — Security transactions are accounted for as of the trade date. Net realized gains and losses are determined on the identified cost basis, which is also used for federal income tax purposes.
Investment Income — Dividend income less foreign taxes withheld, if any, is recorded as of the ex-dividend date. Distributions received on securities that represent a return of capital or long-term capital gain are recorded as a reduction of cost of investments and/or as a realized gain. The fund may estimate the components of distributions received that may be considered nontaxable distributions or long-term capital gain distributions for income tax purposes. Interest income is recorded on the accrual basis and includes accretion of discounts and amortization of premiums.
Securities Sold Short — The fund enters into short sales, which is selling securities it does not own, as part of its normal investment activities. Upon selling a security short, the fund will segregate cash, cash equivalents or other appropriate liquid securities in at least an amount equal to the current market value of the securities sold short until the fund replaces the borrowed security. Interest earned on segregated cash for securities sold short is reflected as interest income. The fund is required to pay any dividends or interest due on securities sold short. Such dividends and interest are recorded as an expense. The fund may pay fees or charges to the broker on the assets borrowed for securities sold short. These fees are calculated daily based upon the value of each security sold short and a rate that is dependent on the availability of such security. Liabilities for securities sold short are valued daily and changes in value are recorded as change in net unrealized appreciation (depreciation) on securities sold short. The fund records realized gain (loss) on a security sold short when it is terminated by the fund and includes as a component of net realized gain (loss) on securities sold short transactions.
Foreign Currency Translations — All assets and liabilities initially expressed in foreign currencies are translated into U.S. dollars at prevailing exchange rates at period end. The fund may enter into spot foreign currency exchange contracts to facilitate transactions denominated in a foreign currency. Purchases and sales of investment securities, dividend and interest income, spot foreign currency exchange contracts, and expenses are translated at the rates of exchange prevailing on the respective dates of such transactions. Net realized and unrealized foreign currency exchange gains or losses related to investment securities are a component of net realized gain (loss) on investment transactions and change in net unrealized appreciation (depreciation) on investments, respectively. Net realized and unrealized foreign currency exchange gains or losses related to securities sold short are a component of net realized gain (loss) on securities sold short transactions and change in net unrealized appreciation (depreciation) on securities sold short, respectively.
Repurchase Agreements — The fund may enter into repurchase agreements with institutions that American Century Investment Management, Inc. (ACIM) (the investment advisor) has determined are creditworthy pursuant to criteria adopted by the Board of Directors. The fund requires that the collateral, represented by securities, received in a repurchase transaction be transferred to the custodian in a manner sufficient to enable the fund to obtain those securities in the event of a default under the repurchase agreement. ACIM monitors, on a daily basis, the securities transferred to ensure the value, including accrued interest, of the securities under each repurchase agreement is equal to or greater than amounts owed to the fund under each repurchase agreement.
Joint Trading Account — Pursuant to an Exemptive Order issued by the Securities and Exchange Commission, the fund, along with certain other funds in the American Century Investments family of funds, may transfer uninvested cash balances into a joint trading account. These balances are invested in one or more repurchase agreements that are collateralized by U.S. Treasury or Agency obligations.
Segregated Assets — In accordance with the 1940 Act, the fund segregates assets on its books and records to cover certain types of investments, including, but not limited to, futures contracts and short sales. ACIM monitors, on a daily basis, the securities segregated to ensure the fund designates a sufficient amount of liquid assets, marked-to-market daily. The fund may also receive assets or be required to pledge assets at the custodian bank or with a broker for margin requirements on futures contracts and short sales.
Income Tax Status — It is the fund’s policy to distribute substantially all net investment income and net realized gains to shareholders and to otherwise qualify as a regulated investment company under provisions of the Internal Revenue Code. Accordingly, no provision has been made for income taxes. The fund files U.S. federal, state, local and non-U.S. tax returns as applicable. The fund's tax returns are subject to examination by the relevant taxing authority until expiration of the applicable statute of limitations, which is generally three years from the date of filing but can be longer in certain jurisdictions. At this time, management believes there are no uncertain tax positions which, based on their technical merit, would not be sustained upon examination and for which it is reasonably possible that the total amounts of unrecognized tax benefits will significantly change in the next twelve months.
Multiple Class — All shares of the fund represent an equal pro rata interest in the net assets of the class to which such shares belong, and have identical voting, dividend, liquidation and other rights and the same terms and conditions, except for class specific expenses and exclusive rights to vote on matters affecting only individual classes. Income, non-class specific expenses, and realized and unrealized capital gains and losses of the fund are allocated to each class of shares based on their relative net assets.
Distributions to Shareholders — Distributions from net investment income, if any, are generally declared and paid semiannually. Distributions from net realized gains, if any, are generally declared and paid annually.
Indemnifications — Under the corporation’s organizational documents, its officers and directors are indemnified against certain liabilities arising out of the performance of their duties to the fund. In addition, in the normal course of business, the fund enters into contracts that provide general indemnifications. The maximum exposure under these arrangements is unknown as this would involve future claims that may be made against a fund. The risk of material loss from such claims is considered by management to be remote.
3. Fees and Transactions with Related Parties
Certain officers and directors of the corporation are also officers and/or directors of American Century Companies, Inc. (ACC). The corporation’s investment advisor, ACIM, the corporation's distributor, American Century Investment Services, Inc. (ACIS), and the corporation’s transfer agent, American Century Services, LLC, are wholly owned, directly or indirectly, by ACC.
Management Fees — The corporation has entered into a management agreement with ACIM, under which ACIM provides the fund with investment advisory and management services in exchange for a single, unified management fee (the fee) per class. The agreement provides that all expenses of managing and operating the fund, except distribution and service fees, expenses on securities sold short, brokerage expenses, taxes, interest, fees and expenses of the independent directors (including legal counsel fees), and extraordinary expenses, will be paid by ACIM. The fee is computed and accrued daily based on each class’s daily net assets and paid monthly in arrears. The fee consists of (1) an Investment Category Fee based on the daily net assets of the fund and certain other accounts managed by the investment advisor that are in the same broad investment category as the fund and (2) a Complex Fee based on the assets of all the funds in the American Century Investments family of funds. The rates for the Investment Category Fee range from 1.0480% to 1.2300%. The rates for the Complex Fee range from 0.2500% to 0.3100% for the Investor Class, A Class, C Class and R Class. The rates for the Complex Fee range from 0.0500% to 0.1100% for the Institutional Class. The effective annual management fee for each class for the year ended June 30, 2014 was 1.38% for the Investor Class, A Class, C Class and R Class and 1.18% for the Institutional Class.
Distribution and Service Fees — The Board of Directors has adopted a separate Master Distribution and Individual Shareholder Services Plan for each of the A Class, C Class and R Class (collectively the plans), pursuant to Rule 12b-1 of the 1940 Act. The plans provide that the A Class will pay ACIS an annual distribution and service fee of 0.25%. The plans provide that the C Class will pay ACIS an annual distribution and service fee of 1.00%, of which 0.25% is paid for individual shareholder services and 0.75% is paid for distribution services. The plans provide that the R Class will pay ACIS an annual distribution and service fee of 0.50%. The fees are computed and accrued daily based on each class’s daily net assets and paid monthly in arrears. The fees are used to pay financial intermediaries for distribution and individual shareholder services. Fees incurred under the plans during the year ended June 30, 2014 are detailed in the Statement of Operations.
Directors' Fees and Expenses — The Board of Directors is responsible for overseeing the investment advisor’s management and operations of the fund. The directors receive detailed information about the fund and its investment advisor regularly throughout the year, and meet at least quarterly with management of the investment advisor to review reports about fund operations. Fees and expenses incurred in conjunction with the directors during the year ended June 30, 2014 are detailed in the Statement of Operations. The fund’s officers do not receive compensation from the fund.
4. Investment Transactions
Purchases and sales of investment securities and securities sold short, excluding short-term investments, for the year ended June 30, 2014 were $154,512,153 and $158,361,912, respectively.
5. Capital Share Transactions
Transactions in shares of the fund were as follows:
|
| | | | | | | | | | |
| | Year ended June 30, 2014 | Year ended June 30, 2013 |
| | Shares | Amount | Shares | Amount |
| Investor Class/Shares Authorized | 40,000,000 |
| | 50,000,000 |
| |
| Sold | 4,167,692 |
| $ | 46,504,446 |
| 717,061 |
| $ | 7,634,531 |
|
| Redeemed | (1,322,752 | ) | (14,744,863 | ) | (1,239,380 | ) | (13,161,107 | ) |
| | 2,844,940 |
| 31,759,583 |
| (522,319 | ) | (5,526,576 | ) |
| Institutional Class/Shares Authorized | 10,000,000 |
| | 50,000,000 |
| |
| Sold | 1,584,808 |
| 17,845,989 |
| 137,867 |
| 1,490,538 |
|
| Redeemed | (522,372 | ) | (5,868,679 | ) | (253,874 | ) | (2,732,320 | ) |
| | 1,062,436 |
| 11,977,310 |
| (116,007 | ) | (1,241,782 | ) |
| A Class/Shares Authorized | 20,000,000 |
| | 70,000,000 |
| |
| Sold | 2,785,296 |
| 30,631,505 |
| 433,325 |
| 4,544,382 |
|
| Redeemed | (1,597,487 | ) | (17,540,509 | ) | (1,892,656 | ) | (19,750,815 | ) |
| | 1,187,809 |
| 13,090,996 |
| (1,459,331 | ) | (15,206,433 | ) |
| C Class/Shares Authorized | 10,000,000 |
| | 10,000,000 |
| |
| Sold | 205,123 |
| 2,127,456 |
| 33,360 |
| 333,152 |
|
| Redeemed | (88,675 | ) | (914,954 | ) | (183,085 | ) | (1,829,832 | ) |
| | 116,448 |
| 1,212,502 |
| (149,725 | ) | (1,496,680 | ) |
| R Class/Shares Authorized | 10,000,000 |
| | 10,000,000 |
| |
| Sold | 66,960 |
| 724,675 |
| 91,159 |
| 943,682 |
|
| Redeemed | (61,969 | ) | (658,045 | ) | (38,809 | ) | (401,848 | ) |
| | 4,991 |
| 66,630 |
| 52,350 |
| 541,834 |
|
| Net increase (decrease) | 5,216,624 |
| $ | 58,107,021 |
| (2,195,032 | ) | $ | (22,929,637 | ) |
6. Fair Value Measurements
The fund’s investments valuation process is based on several considerations and may use multiple inputs to determine the fair value of the investments held by the fund. In conformity with accounting principles generally accepted in the United States of America, the inputs used to determine a valuation are classified into three broad levels.
| |
| • | Level 1 valuation inputs consist of unadjusted quoted prices in an active market for identical investments. |
| |
| • | Level 2 valuation inputs consist of direct or indirect observable market data (including quoted prices for comparable investments, evaluations of subsequent market events, interest rates, prepayment speeds, credit risk, etc.). These inputs also consist of quoted prices for identical investments initially expressed in local currencies that are adjusted through translation into U.S. dollars. |
| |
| • | Level 3 valuation inputs consist of unobservable data (including a fund’s own assumptions). |
The level classification is based on the lowest level input that is significant to the fair valuation measurement. The valuation inputs are not necessarily an indication of the risks associated with investing in these securities or other financial instruments.
The following is a summary of the level classifications as of period end. The Schedule of Investments provides additional information on the fund’s portfolio holdings.
|
| | | | | | | | |
| | Level 1 | Level 2 | Level 3 |
| Assets | | | |
| Investment Securities | | | |
| Common Stocks | $ | 102,924,777 |
| — |
| — |
|
| Temporary Cash Investments | 1,865,698 |
| $ | 1,736,803 |
| — |
|
| | $ | 104,790,475 |
| $ | 1,736,803 |
| — |
|
| | | | |
| Liabilities | | | |
| Securities Sold Short | | | |
| Common Stocks | $ | (103,362,946 | ) | — |
| — |
|
7. Risk Factors
The fund’s investment process may result in high portfolio turnover, which could mean high transaction costs, affecting both performance and capital gains tax liabilities to investors.
The fund is subject to short sales risk. If the market price of a security increases after the fund borrows the security, the fund may suffer a loss when it replaces the borrowed security at the higher price. Any loss will be increased by the amount of compensation, interest or dividends, and transaction costs the fund must pay to the lender of the borrowed security.
If the fund is overweighted in a stock or sector, any negative development related to that stock or sector will have a greater impact on the fund than other funds that are not overweighted in that stock or sector.
8. Federal Tax Information
The book-basis character of distributions made during the year from net investment income or net realized gains may differ from their ultimate characterization for federal income tax purposes. These differences reflect the differing character of certain income items and net realized gains and losses for financial statement and tax purposes, and may result in reclassification among certain capital accounts on the financial statements. There were no distributions paid by the fund during the years ended June 30, 2014 and June 30, 2013.
As of June 30, 2014, the federal tax cost of investments and the components of distributable earnings on a tax-basis were as follows:
|
| | | |
| Federal tax cost of investments | $ | 91,659,477 |
|
| Gross tax appreciation of investments | $ | 15,972,741 |
|
| Gross tax depreciation of investments | (1,104,940 | ) |
| Net tax appreciation (depreciation) of investments | $ | 14,867,801 |
|
| Net tax appreciation (depreciation) on securities sold short | $ | (9,052,080 | ) |
| Net tax appreciation (depreciation) | $ | 5,815,721 |
|
| Undistributed ordinary income | — |
|
| Accumulated short-term capital losses | $ | (5,253,967 | ) |
| Late-year ordinary loss deferral | $ | (754,355 | ) |
| Post-October capital loss deferral | $ | (3,157,190 | ) |
| | |
The difference between book-basis and tax-basis unrealized appreciation (depreciation) is attributable primarily to the tax deferral of losses on wash sales.
Accumulated capital losses represent net capital loss carryovers that may be used to offset future realized capital gains for federal income tax purposes. Future capital loss carryover utilization in any given year may be subject to Internal Revenue Code limitations. Capital loss carryovers expire in 2018.
Loss deferrals represent certain qualified losses that the fund has elected to treat as having been incurred in the following fiscal year for federal income tax purposes.
|
| | | | | | | | | | | | | |
| For a Share Outstanding Throughout the Years Ended June 30 (except as noted) |
| Per-Share Data | | | Ratios and Supplemental Data | | |
| | | Income From Investment Operations: | | | Ratio to Average Net Assets of: | | |
| | Net Asset Value, Beginning of Period | Net Investment Income (Loss)(1) | Net Realized and Unrealized Gain (Loss) | Total From Investment Operations | Net Asset Value, End of Period | Total Return(2) | Operating Expenses | Operating Expenses (excluding expenses on securities sold short) | Net Investment Income (Loss) | Portfolio Turnover Rate | Net Assets, End of Period (in thousands) |
| Investor Class | | | | | | | | | |
| 2014 | $10.78 | (0.17) | 0.63 | 0.46 | $11.24 | 4.27% | 2.92% | 1.38% | (1.56)% | 226% |
| $50,641 |
|
| 2013 | $10.54 | (0.11) | 0.35 | 0.24 | $10.78 | 2.28% | 3.07% | 1.39% | (1.00)% | 222% |
| $17,916 |
|
| 2012 | $10.37 | (0.22) | 0.39 | 0.17 | $10.54 | 1.64% | 3.38% | 1.40% | (2.07)% | 252% |
| $23,019 |
|
| 2011 | $10.00 | (0.22) | 0.59 | 0.37 | $10.37 | 3.70% | 3.50% | 1.42% | (2.34)% | 261% |
| $21,866 |
|
| 2010 | $10.01 | (0.17) | 0.16 | (0.01) | $10.00 | (0.10)% | 3.09% | 1.42% | (1.68)% | 140% |
| $16,570 |
|
| Institutional Class | | | | | | | | | |
| 2014 | $10.92 | (0.15) | 0.64 | 0.49 | $11.41 | 4.49% | 2.72% | 1.18% | (1.36)% | 226% |
| $16,810 |
|
| 2013 | $10.65 | (0.08) | 0.35 | 0.27 | $10.92 | 2.54% | 2.87% | 1.19% | (0.80)% | 222% |
| $4,491 |
|
| 2012 | $10.46 | (0.20) | 0.39 | 0.19 | $10.65 | 1.82% | 3.18% | 1.20% | (1.87)% | 252% |
| $5,618 |
|
| 2011 | $10.07 | (0.26) | 0.65 | 0.39 | $10.46 | 3.87% | 3.30% | 1.22% | (2.14)% | 261% |
| $4,194 |
|
| 2010 | $10.06 | (0.16) | 0.17 | 0.01 | $10.07 | 0.10% | 2.89% | 1.22% | (1.48)% | 140% |
| $11,882 |
|
| A Class | | | | | | | | |
|
| 2014 | $10.62 | (0.20) | 0.62 | 0.42 | $11.04 | 3.95% | 3.17% | 1.63% | (1.81)% | 226% |
| $31,354 |
|
| 2013 | $10.41 | (0.13) | 0.34 | 0.21 | $10.62 | 2.02% | 3.32% | 1.64% | (1.25)% | 222% |
| $17,545 |
|
| 2012 | $10.27 | (0.24) | 0.38 | 0.14 | $10.41 | 1.36% | 3.63% | 1.65% | (2.32)% | 252% |
| $32,386 |
|
| 2011 | $9.93 | (0.26) | 0.60 | 0.34 | $10.27 | 3.42% | 3.75% | 1.67% | (2.59)% | 261% |
| $28,691 |
|
| 2010 | $9.96 | (0.19) | 0.16 | (0.03) | $9.93 | (0.30)% | 3.34% | 1.67% | (1.93)% | 140% |
| $72,781 |
|
|
| | | | | | | | | | | | | |
| For a Share Outstanding Throughout the Years Ended June 30 (except as noted) |
| Per-Share Data | | | Ratios and Supplemental Data | | |
| | | Income From Investment Operations: | | | Ratio to Average Net Assets of: | | |
| | Net Asset Value, Beginning of Period | Net Investment Income (Loss)(1) | Net Realized and Unrealized Gain (Loss) | Total From Investment Operations | Net Asset Value, End of Period | Total Return(2) | Operating Expenses | Operating Expenses (excluding expenses on securities sold short) | Net Investment Income (Loss) | Portfolio Turnover Rate | Net Assets, End of Period (in thousands) |
| C Class | | | | | | | | |
| 2014 | $10.10 | (0.26) | 0.58 | 0.32 | $10.42 | 3.17% | 3.92% | 2.38% | (2.56)% | 226% |
| $5,729 |
|
| 2013 | $9.97 | (0.20) | 0.33 | 0.13 | $10.10 | 1.30% | 4.07% | 2.39% | (2.00)% | 222% |
| $4,377 |
|
| 2012 | $9.91 | (0.31) | 0.37 | 0.06 | $9.97 | 0.61% | 4.38% | 2.40% | (3.07)% | 252% |
| $5,815 |
|
| 2011 | $9.65 | (0.32) | 0.58 | 0.26 | $9.91 | 2.69% | 4.50% | 2.42% | (3.34)% | 261% |
| $6,845 |
|
| 2010 | $9.76 | (0.26) | 0.15 | (0.11) | $9.65 | (1.13)% | 4.09% | 2.42% | (2.68)% | 140% |
| $10,543 |
|
| R Class | | | | | | | | |
| 2014 | $10.45 | (0.22) | 0.60 | 0.38 | $10.83 | 3.64% | 3.42% | 1.88% | (2.06)% | 226% |
| $1,718 |
|
| 2013 | $10.26 | (0.16) | 0.35 | 0.19 | $10.45 | 1.85% | 3.57% | 1.89% | (1.50)% | 222% |
| $1,604 |
|
| 2012 | $10.15 | (0.26) | 0.37 | 0.11 | $10.26 | 1.08% | 3.88% | 1.90% | (2.57)% | 252% |
| $1,039 |
|
| 2011 | $9.84 | (0.26) | 0.57 | 0.31 | $10.15 | 3.15% | 4.00% | 1.92% | (2.84)% | 261% |
| $837 |
|
| 2010 | $9.89 | (0.21) | 0.16 | (0.05) | $9.84 | (0.51)% | 3.59% | 1.92% | (2.18)% | 140% |
| $586 |
|
|
|
| Notes to Financial Highlights |
| |
| (1) | Computed using average shares outstanding throughout the period. |
| |
| (2) | Total returns are calculated based on the net asset value of the last business day and do not reflect applicable sales charges, if any. Total returns for periods less than one year are not annualized. |
See Notes to Financial Statements.
|
|
| Report of Independent Registered Public Accounting Firm |
To the Directors of the American Century Quantitative Equity Funds, Inc. and Shareholders of the Equity Market Neutral Fund:
In our opinion, the accompanying statement of assets and liabilities, including the schedule of investments, and the related statements of operations, of changes in net assets and the financial highlights present fairly, in all material respects, the financial position of the Equity Market Neutral Fund (one of the fifteen funds comprising the American Century Quantitative Equity Funds, Inc., hereafter referred to as the “Fund”) at June 30, 2014, the results of its operations for the year then ended, the changes in its net assets for each of the two years in the period then ended and the financial highlights for each of the five years in the period then ended, in conformity with accounting principles generally accepted in the United States of America. These financial statements and financial highlights (hereafter referred to as "financial statements") are the responsibility of the Fund's management. Our responsibility is to express an opinion on these financial statements based on our audits. We conducted our audits of these financial statements in accordance with the standards of the Public Company Accounting Oversight Board (United States). Those standards require that we plan and perform the audit to obtain reasonable assurance about whether the financial statements are free of material misstatement. An audit includes examining, on a test basis, evidence supporting the amounts and disclosures in the financial statements, assessing the accounting principles used and significant estimates made by management, and evaluating the overall financial statement presentation. We believe that our audits, which included confirmation of securities at June 30, 2014 by correspondence with the custodian and brokers, provide a reasonable basis for our opinion.
PricewaterhouseCoopers LLP
Kansas City, Missouri
August 21, 2014
Board of Directors
The individuals listed below serve as directors of the funds. Each director will continue to serve in this capacity until death, retirement, resignation or removal from office. The board has adopted a mandatory retirement age for directors who are not “interested persons,” as that term is defined in the Investment Company Act (independent directors). Independent directors shall retire on December 31 of the year in which they reach their 75th birthday; provided, however, that on or after January 1, 2022, independent directors shall retire on December 31 of the year in which they reach their 76th birthday.
Mr. Thomas is an “interested person” because he currently serves as President and Chief Executive Officer of American Century Companies, Inc. (ACC), the parent company of American Century Investment Management, Inc. (ACIM or the advisor). The other directors (more than three-fourths of the total number) are independent. They are not employees, directors or officers of, and have no financial interest in, ACC or any of its wholly owned, direct or indirect, subsidiaries, including ACIM, American Century Investment Services, Inc. (ACIS) and American Century Services, LLC (ACS), and do not have any other affiliations, positions or relationships that would cause them to be considered “interested persons” under the Investment Company Act. The directors serve in this capacity for eight (in the case of Mr. Thomas, 15) registered investment companies in the American Century Investments family of funds.
The following table presents additional information about the directors. The mailing address for each director other than Mr. Thomas is 1665 Charleston Road, Mountain View, California 94043. The mailing address for Mr. Thomas is 4500 Main Street, Kansas City, Missouri 64111.
|
| | | | | |
Name (Year of Birth) | Position(s) Held with Funds | Length of Time Served | Principal Occupation(s) During Past 5 Years | Number of
American
Century
Portfolios
Overseen
by Director | Other Directorships Held During Past 5 Years |
| Independent Directors |
Tanya S. Beder (1955) | Director | Since 2011 | Chairman, SBCC Group Inc. (independent advisory services) (2006 to present) | 42 | CYS Investments, Inc. (specialty finance company) |
Jeremy I. Bulow (1954) | Director | Since 2011 | Professor of Economics, Stanford University, Graduate School of Business (1979 to present) | 42 | None |
Ronald J. Gilson (1946) | Director and Chairman of the Board | Since 1995 (Chairman since 2005) | Charles J. Meyers Professor of Law and Business, Stanford Law School (1979 to present); Marc and Eva Stern Professor of Law and Business, Columbia University School of Law (1992 to present) | 42 | None |
|
| | | | | |
Name (Year of Birth) | Position(s) Held with Funds | Length of Time Served | Principal Occupation(s) During Past 5 Years | Number of
American
Century
Portfolios
Overseen
by Director | Other Directorships Held During Past 5 Years |
| Independent Directors |
Frederick L. A. Grauer (1946) | Director | Since 2008 | Senior Advisor, BlackRock, Inc. (investment management firm) (2010 to 2011); Senior Advisor, Barclays Global Investors (investment management firm) (2003 to 2009) | 42 | None |
Peter F. Pervere
(1947) | Director | Since 2007 | Retired | 42 | Intraware, Inc. (2003 to 2009) |
Myron S. Scholes(1) (1941) | Director | Since 1980 | Chairman, Platinum Grove Asset Management, L.P. (asset manager) (1999 to 2009); Frank E. Buck Professor of Finance-Emeritus, Stanford Graduate School of Business (1996 to present) | 42 | Dimensional Fund Advisors (investment advisor); CME Group, Inc. (futures and options exchange) |
John B. Shoven
(1947) | Director | Since 2002 | Professor of Economics, Stanford University (1973 to present) | 42 | Cadence Design Systems; Exponent; Financial Engines |
| Interested Director |
Jonathan S. Thomas
(1963) | Director and
President | Since 2007 | President and Chief Executive Officer, ACC (March 2007 to present). Also serves as Chief Executive Officer and Manager, ACS; Executive Vice President, ACIM; Director, ACC, ACIM and other ACC subsidiaries | 115 | None |
(1) Myron S. Scholes resigned as director effective July 31, 2014.
Officers
The following table presents certain information about the executive officers of the funds. Each officer serves as an officer for each of the 15 investment companies in the American Century family of funds, unless otherwise noted. No officer is compensated for his or her service as an officer of the funds. The listed officers are interested persons of the funds and are appointed or re-appointed on an annual basis. The mailing address for each of the officers listed below is 4500 Main Street, Kansas City, Missouri 64111.
|
| | |
Name (Year of Birth) | Offices with the Funds | Principal Occupation(s) During the Past Five Years |
Jonathan S. Thomas (1963) | Director and President since 2007 | President and Chief Executive Officer, ACC (March 2007 to present). Also serves as Chief Executive Officer and Manager, ACS; Executive Vice President, ACIM; Director, ACC, ACIM and other ACC subsidiaries |
| Amy D. Shelton (1964) | Chief Compliance Officer since 2014 | Chief Compliance Officer, American Century funds, (March 2014 to present); Chief Compliance Officer, ACIM (February 2014 to present); Chief Compliance Officer, ACIS (October 2009 to present); Vice President, Client Interactions and Marketing, ACIS (February 2013 to January 2014); Director, Client Interactions and Marketing, ACIS (June 2007 to January 2013). Also serves as Vice President, ACIS |
Charles A. Etherington (1957) | General Counsel since 2007 and Senior Vice President since 2006 | Attorney, ACC (February 1994 to present); Vice President, ACC (November 2005 to present); General Counsel, ACC (March 2007 to present). Also serves as General Counsel, ACIM, ACS, ACIS and other ACC subsidiaries; and Senior Vice President, ACIM and ACS |
C. Jean Wade (1964) | Vice President, Treasurer and Chief Financial Officer since 2012 | Vice President, ACS (February 2000 to present) |
Robert J. Leach (1966) | Vice President since 2006 and Assistant Treasurer since 2012 | Vice President, ACS (February 2000 to present) |
David H. Reinmiller (1963) | Vice President since 2001 | Attorney, ACC (January 1994 to present); Associate General Counsel, ACC (January 2001 to present). Also serves as Vice President, ACIM and ACS |
Ward D. Stauffer (1960) | Secretary since 2005 | Attorney, ACC (June 2003 to present) |
The Statement of Additional Information has additional information about the fund’s directors and is available without charge, upon request, by calling 1-800-345-2021.
|
|
| Approval of Management Agreement |
At a meeting held on June 13, 2014, the Fund’s Board of Directors/Trustees unanimously approved the renewal of the management agreement pursuant to which American Century Investment Management, Inc. (the “Advisor”) acts as the investment advisor for the Fund. Under Section 15(c) of the Investment Company Act, contracts for investment advisory services are required to be reviewed, evaluated, and approved by a majority of a fund’s directors/trustees (the “Directors”), including a majority of the independent Directors, each year. The Board regards this annual evaluation and renewal as one of its most important responsibilities.
The independent Directors have memorialized a statement regarding the relationship between their ongoing obligations to oversee and evaluate the performance of the Advisor and their annual consideration of renewal of the management agreement. In that statement, the independent Directors noted that their assessment of the Advisor’s performance is an ongoing process that takes place over the entire year and is informed by all of the extensive information that the Board and its committees receive and consider over time. This information, together with the materials provided in connection with the review, are central to the Board’s assessment of the Advisor’s performance and its determination whether to renew the Fund’s management agreement.
Prior to its consideration of the renewal of the management agreement, the Board requested and reviewed extensive data and analysis relating to the proposed renewal. This information and analysis was compiled by the Advisor and certain independent providers of evaluation data concerning the Fund and the services provided to the Fund by the Advisor.
In connection with its consideration of the renewal of the management agreement, the Board’s review and evaluation of the services provided by the Advisor included, but was not limited to, the following:
| |
| • | the nature, extent, and quality of investment management, shareholder services, and other services provided by the Advisor to the Fund; |
| |
| • | the wide range of other programs and services the Advisor provides to the Fund and its shareholders on a routine and non-routine basis; |
| |
| • | the investment performance of the Fund, including data comparing the Fund’s performance to appropriate benchmarks and/or a peer group of other mutual funds with similar investment objectives and strategies; |
| |
| • | the cost of owning the Fund compared to the cost of owning similar funds; |
| |
| • | the Advisor’s compliance policies, procedures, and regulatory experience; |
| |
| • | financial data showing the cost of services provided to the Fund, the profitability of the Fund to the Advisor, and the overall profitability of the Advisor; |
| |
| • | possible economies of scale associated with the Advisor’s management of the Fund and other accounts under its management; |
| |
| • | data comparing services provided and charges to other investment management clients of the Advisor; and |
| |
| • | any collateral benefits derived by the Advisor from the management of the Fund. |
In keeping with its practice, the Board held two in-person meetings to review and discuss the information provided. The independent Directors also had the benefit of the advice of their independent counsel throughout the process.
Factors Considered
The Directors considered all of the information provided by the Advisor, the independent data providers, and the independent Directors’ independent counsel in connection with the review, and evaluated such information for the Fund. In connection with their review, the Directors did not identify any single factor as being all-important or controlling and each Director may have attributed
different levels of importance to different factors. In deciding to renew the management agreement, the Board based its decision on a number of factors, including the following:
Nature, Extent and Quality of Services — Generally. Under the management agreement, the Advisor is responsible for providing or arranging for all services necessary for the operation of the Fund. The Board noted that under the management agreement, the Advisor provides or arranges at its own expense a wide variety of services including:
| |
| • | constructing and designing the Fund |
| |
| • | portfolio research and security selection |
| |
| • | initial capitalization/funding |
| |
| • | daily valuation of the Fund’s portfolio |
| |
| • | shareholder servicing and transfer agency, including shareholder confirmations, recordkeeping, and communications |
| |
| • | regulatory and portfolio compliance |
| |
| • | marketing and distribution |
The Board noted that many of these services have expanded over time both in terms of quantity and complexity in response to shareholder demands, competition in the industry, changing distribution channels, and the changing regulatory environment.
Investment Management Services. The nature of the investment management services provided to the Fund is quite complex and allows Fund shareholders access to professional money management, instant diversification of their investments within an asset class, the opportunity to easily diversify among asset classes by investing in or exchanging among various American Century Investments funds, and liquidity. In evaluating investment performance, the Board expects the Advisor to manage the Fund in accordance with its investment objectives and approved strategies. Further, the Directors recognize that the Advisor has an obligation to seek the best execution of fund trades. In providing these services, the Advisor utilizes teams of investment professionals (portfolio managers, analysts, research assistants, and securities traders) who require extensive information technology, research, training, compliance and other systems to conduct their business. The Board, directly and through its Portfolio Committee, regularly reviews investment performance information for the Fund, together with comparative information for appropriate benchmarks and/or peer groups of similarly-managed funds, over different time horizons. The Directors also review detailed performance information during the management agreement approval process. If performance concerns are identified, the Fund receives special reviews until performance improves, during which the Board discusses with the Advisor the reasons for such results (e.g., market conditions, security selection) and any efforts being undertaken to improve performance. The Fund’s performance was above its benchmark for the one-, three-, and five-year periods reviewed by the Board. The Board found the investment management services provided by the Advisor to the Fund to be satisfactory and consistent with the management agreement.
Shareholder and Other Services. Under the management agreement, the Advisor provides the Fund with a comprehensive package of transfer agency, shareholder, and other services. The Board, directly and through various committees of the Board, regularly reviews reports and evaluations of such services at its regular meetings. These reports include, but are not limited to, information regarding the operational efficiency and accuracy of the shareholder and transfer agency services provided, staffing levels, shareholder satisfaction (as measured by external as well as internal sources), technology support, new products and services offered to Fund shareholders, securities trading activities, portfolio valuation services, auditing services, and legal and operational compliance activities. Certain aspects of shareholder and transfer agency service level efficiency
and the quality of securities trading activities are measured by independent third party providers and are presented in comparison to other fund groups not managed by the Advisor. The Board found the services provided by the Advisor to the Fund under the management agreement to be competitive and of high quality.
Costs of Services and Profitability. The Advisor provides detailed information concerning its cost of providing various services to the Fund, its profitability in managing the Fund, its overall profitability, and its financial condition. The Directors have reviewed with the Advisor the methodology used to prepare this financial information. The financial information regarding the Advisor is considered in evaluating the Advisor’s financial condition, its ability to continue to provide services under the management agreement, and the reasonableness of the current management fee. The Board concluded that the Advisor’s profits were reasonable in light of the services provided to the Fund.
Ethics. The Board generally considers the Advisor’s commitment to providing quality services to shareholders and to conducting its business ethically. They noted that the Advisor’s practices generally meet or exceed industry best practices.
Economies of Scale. The Board also reviewed information provided by the Advisor regarding the possible existence of economies of scale in connection with the management of the Fund. The Board concluded that economies of scale are difficult to measure and predict with precision, especially on a fund-by-fund basis. The Board concluded that the Advisor is appropriately sharing economies of scale through its competitive fee structure, offering competitive fees from fund inception, and through reinvestment in its business to provide shareholders additional content and services.
Comparison to Other Funds’ Fees. The management agreement provides that the Fund pays the Advisor a single, all-inclusive (or unified) management fee for providing all services necessary for the management and operation of the Fund, other than brokerage expenses, taxes, interest, extraordinary expenses, and the fees and expenses of the Fund’s independent directors (including their independent legal counsel) and expenses incurred in connection with the provision of shareholder services and distribution services under a plan adopted pursuant to Rule 12b-1 under the 1940 Act. Under the unified fee structure, the Advisor is responsible for providing all investment advisory, custody, audit, administrative, compliance, recordkeeping, marketing and shareholder services, or arranging and supervising third parties to provide such services. By contrast, most other funds are charged a variety of fees, including an investment advisory fee, a transfer agency fee, an administrative fee, distribution charges and other expenses. Other than their investment advisory fees and any applicable Rule 12b-1 distribution fees, all other components of the total fees charged by these other funds may be increased without shareholder approval. The Board believes the unified fee structure is a benefit to Fund shareholders because it clearly discloses to shareholders the cost of owning Fund shares, and, since the unified fee cannot be increased without a vote of Fund shareholders, it shifts to the Advisor the risk of increased costs of operating the Fund and provides a direct incentive to minimize administrative inefficiencies. Part of the Board’s analysis of fee levels involves reviewing certain evaluative data compiled by an independent provider and comparing the Fund’s unified fee to the total expense ratio of other funds in the Fund’s peer group. The unified fee charged to shareholders of the Fund was below the median of the total expense ratios of the Fund’s peer universe. The Board concluded that the management fee paid by the Fund to the Advisor under the management agreement is reasonable in light of the services provided to the Fund.
Comparison to Fees and Services Provided to Other Clients of the Advisor. The Board also requested and received information from the Advisor concerning the nature of the services, fees, costs and profitability of its advisory services to advisory clients other than the Fund. They observed that these varying types of client accounts require different services and involve different regulatory and entrepreneurial risks than the management of the Fund. The Board analyzed this information and concluded that the fees charged and services provided to the Fund were reasonable by comparison.
Collateral or “Fall-Out” Benefits Derived by the Advisor. The Board considered the existence of collateral benefits the Advisor may receive as a result of its relationship with the Fund. They concluded that the Advisor’s primary business is managing mutual funds and it generally does not use fund or shareholder information to generate profits in other lines of business, and therefore does not derive any significant collateral benefits from them. The Board noted that the Advisor receives proprietary research from broker-dealers that execute fund portfolio transactions and concluded that this research is likely to benefit Fund shareholders. The Board also determined that the Advisor is able to provide investment management services to certain clients other than the Fund, at least in part, due to its existing infrastructure built to serve the fund complex. The Board concluded, however, that the assets of those other clients are not material to the analysis and, where applicable, may be included with the assets of the Fund to determine breakpoints in the management fee schedule.
Existing Relationship. The Board also considered whether there was any reason for not continuing the existing arrangement with the Advisor. In this regard, the Board was mindful of the potential disruptions of the Fund’s operations and various risks, uncertainties, and other effects that could occur as a result of a decision not to continue such relationship. In particular, the Board recognized that most shareholders have invested in the Fund on the strength of the Advisor’s industry standing and reputation and in the expectation that the Advisor will have a continuing role in providing advisory services to the Fund.
Conclusion of the Directors. As a result of this process, the Board, including all of the independent Directors and assisted by the advice of independent legal counsel, taking into account all of the factors discussed above and the information provided by the Advisor and others, concluded that the management agreement between the Fund and the Advisor is fair and reasonable in light of the services provided and should be renewed.
Retirement Account Information
As required by law, distributions you receive from certain IRAs are subject to federal income tax withholding, unless you elect not to have withholding apply. Tax will be withheld on the total amount withdrawn even though you may be receiving amounts that are not subject to withholding, such as nondeductible contributions. In such case, excess amounts of withholding could occur. You may adjust your withholding election so that a greater or lesser amount will be withheld.
If you don’t want us to withhold on this amount, you must notify us to not withhold the federal income tax. You may notify us in writing or in certain situations by telephone or through other electronic means. For systematic withdrawals, your withholding election will remain in effect until revoked or changed by filing a new election. You have the right to revoke your election at any time.
Remember, even if you elect not to have income tax withheld, you are liable for paying income tax on the taxable portion of your withdrawal. If you elect not to have income tax withheld or you don’t have enough income tax withheld, you may be responsible for payment of estimated tax. You may incur penalties under the estimated tax rules if your withholding and estimated tax payments are not sufficient. You can reduce or defer the income tax on a distribution by directly or indirectly rolling such distribution over to another IRA or eligible plan. You should consult your tax advisor for additional information.
State tax will be withheld if, at the time of your distribution, your address is within one of the mandatory withholding states and you have federal income tax withheld (or as otherwise required by state law). State taxes will be withheld from your distribution in accordance with the respective state rules.
Distributions you receive from 403(b), 457 and qualified plans are subject to special tax and withholding rules. Your plan administrator or plan sponsor is required to provide you with a special tax notice explaining those rules at the time you request a distribution. If applicable, federal and/or state taxes may be withheld from your distribution amount.
Proxy Voting Policies
Descriptions of the principles and policies that the fund's investment advisor uses in exercising the voting rights associated with the securities purchased and/or held by the fund are available without charge, upon request, by calling 1-800-345-2021 or visiting the "About Us" page of American Century Investments’ website at americancentury.com. A description of the policies is also available on the Securities and Exchange Commission’s website at sec.gov. Information regarding how the investment advisor voted proxies relating to portfolio securities during the most recent 12-month period ended June 30 is available on the "About Us" page at americancentury.com. It is also available at sec.gov.
Quarterly Portfolio Disclosure
The fund files its complete schedule of portfolio holdings with the Securities and Exchange Commission (SEC) for the first and third quarters of each fiscal year on Form N-Q. The fund’s Forms N-Q are available on the SEC’s website at sec.gov, and may be reviewed and copied at the SEC’s Public Reference Room in Washington, DC. Information on the operation of the Public Reference Room may be obtained by calling 1-800-SEC-0330. The fund also makes its complete schedule of portfolio holdings for the most recent quarter of its fiscal year available on its website at americancentury.com and, upon request, by calling 1-800-345-2021.
|
| | |
| |
| | | |
| Contact Us | americancentury.com | |
| Automated Information Line | 1-800-345-8765 | |
| Investor Services Representative | 1-800-345-2021
or 816-531-5575 | |
| Investors Using Advisors | 1-800-378-9878 | |
Business, Not-For-Profit, Employer-Sponsored
Retirement Plans | 1-800-345-3533 | |
Banks and Trust Companies, Broker-Dealers,
Financial Professionals, Insurance Companies | 1-800-345-6488 | |
| Telecommunications Relay Service for the Deaf | 711 | |
| | | |
| American Century Quantitative Equity Funds, Inc. | |
| | | |
Investment Advisor: American Century Investment Management, Inc. Kansas City, Missouri | |
| | | |
| This report and the statements it contains are submitted for the general information of our shareholders. The report is not authorized for distribution to prospective investors unless preceded or accompanied by an effective prospectus. | |
| | | |
©2014 American Century Proprietary Holdings, Inc. All rights reserved.
CL-ANN-82883 1408 | |
|
| |
ANNUAL REPORT | JUNE 30, 2014 |
Global Gold Fund
|
| |
| President's Letter | |
| Performance | |
| Portfolio Commentary | |
| Fund Characteristics | |
| Shareholder Fee Example | |
| Schedule of Investments | |
| Statement of Assets and Liabilities | |
| Statement of Operations | |
| Statement of Changes in Net Assets | |
| Notes to Financial Statements | |
| Financial Highlights | |
| Report of Independent Registered Public Accounting Firm | |
| Management | |
| Approval of Management Agreement | |
| Additional Information | |
Any opinions expressed in this report reflect those of the author as of the date of the report, and do not necessarily represent the opinions of American Century Investments® or any other person in the American Century Investments organization. Any such opinions are subject to change at any time based upon market or other conditions and American Century Investments disclaims any responsibility to update such opinions. These opinions may not be relied upon as investment advice and, because investment decisions made by American Century Investments funds are based on numerous factors, may not be relied upon as an indication of trading intent on behalf of any American Century Investments fund. Security examples are used for representational purposes only and are not intended as recommendations to purchase or sell securities. Performance information for comparative indices and securities is provided to American Century Investments by third party vendors. To the best of American Century Investments’ knowledge, such information is accurate at the time of printing.
|
| |
| Dear Investor:
Thank you for reviewing this annual report for the 12 months ended June 30, 2014. It provides investment performance and portfolio information for the reporting period, plus longer-term historical performance data.
Annual reports remain important vehicles for conveying information about fund returns, including market and economic factors that affected performance during the reporting period. For additional, updated investment and market insights, we encourage you to visit our website, americancentury.com.
|
| Jonathan Thomas |
Aggressive Monetary Policies Boosted Stock and Bond Returns
Stimulative monetary policies and expectations of economic improvement, interspersed with concerns about weaker-than-expected economic data and geopolitical conflicts, helped drive financial market returns during the reporting period. We believe the combination of longer-term optimism about global economic growth, low costs of capital, and central bank purchases of fixed income securities helped persuade investors to seek risk and yield, especially in the U.S. and Europe. Stock index returns were strong in these markets, particularly at the smaller capitalization end of the company size spectrum. The MSCI Europe and S&P 500® indices advanced 29.28% and 24.61%, respectively.
Remarkably, for a period in which stock market performance was so strong, government bond performance was also generally positive. Not surprisingly, U.S. corporate high-yield bonds posted double-digit returns, but the 30-year U.S. Treasury bond also outperformed most broader bond market measures. In addition, a generally weaker U.S. dollar during the reporting period meant that international bond returns for U.S. investors with currency exposure were generally higher than U.S. bonds returns. The Barclays Global Aggregate Bond and Barclays U.S. Aggregate Bond indices returned 7.39% and 4.37%, respectively.
Looking ahead, we see signs of sustained moderate economic growth in the second half of 2014, but headwinds persist. In the U.S., which was supposed to be an economic growth leader this year, housing market momentum has slowed, interest rates could rise, and economic growth and U.S. employment levels remain subpar compared with past post-recession periods. In this environment, we continue to believe in a disciplined, diversified, long-term investment approach, using professionally managed stock and bond portfolios—as appropriate—for meeting financial goals. We appreciate your continued trust in us.
Sincerely,
Jonathan Thomas
President and Chief Executive Officer
American Century Investments
|
| | | | | | |
| Total Returns as of June 30, 2014 |
| | Average Annual Returns | |
| | Ticker Symbol | 1 year | 5 years | 10 years | Since Inception | Inception Date |
| Investor Class | BGEIX | 13.99% | -3.58% | 4.09% | 2.50% | 8/17/88 |
| NYSE Arca Gold Miners Index | — | 9.61% | -5.77% | N/A(1) | N/A(1) | — |
| MSCI World Index | — | 24.05% | 14.98% | 7.24% | 7.45%(2) | — |
| Institutional Class | AGGNX | 14.26% | -3.38% | — | -4.60% | 9/28/07 |
A Class(3) | ACGGX | | | | | 5/6/98 |
| No sales charge* | | 13.84% | -3.81% | 3.84% | 5.02% | |
| With sales charge* | | 7.25% | -4.94% | 3.23% | 4.63% | |
| C Class | AGYCX | 12.95% | -4.53% | — | -5.74% | 9/28/07 |
| R Class | AGGWX | 13.56% | -4.04% | — | -5.26% | 9/28/07 |
| |
| * | Sales charges include initial sales charges and contingent deferred sales charges (CDSCs), as applicable. A Class shares have a 5.75% maximum initial sales charge and may be subject to a maximum CDSC of 1.00%. C Class shares redeemed within 12 months of purchase are subject to a maximum CDSC of 1.00%. The SEC requires that mutual funds provide performance information net of maximum sales charges in all cases where charges could be applied. |
| |
| (1) | Benchmark total return data first available October 2004. |
| |
| (2) | Since August 31, 1988, the date nearest the Investor Class’s inception for which data are available. |
| |
| (3) | Prior to September 4, 2007, the A Class was referred to as the Advisor Class and did not have a front-end sales charge. Performance has been adjusted to reflect this charge. |
Data presented reflect past performance. Past performance is no guarantee of future results. Current performance may be higher or lower than the performance shown. Investment return and principal value will fluctuate, and redemption value may be more or less than original cost. To obtain performance data current to the most recent month end, please call 1-800-345-2021 or visit americancentury.com. International investing involves special risks, such as political instability and currency fluctuations. Investing in emerging markets may accentuate these risks. Gold stocks are generally considered speculative because of high share price volatility. The price of gold will likely impact the value of the companies in which the fund invests.
Unless otherwise indicated, performance reflects Investor Class shares; performance for other share classes will vary due to differences in fee structure. For information about other share classes available, please consult the prospectus. Data assumes reinvestment of dividends and capital gains, and none of the charts reflect the deduction of taxes that a shareholder would pay on fund distributions or the redemption of fund shares. Returns for the indices are provided for comparison. The fund’s total returns include operating expenses (such as transaction costs and management fees) that reduce returns, while the total returns of the indices do not.
|
|
| Growth of $10,000 Over 10 Years* |
| $10,000 investment made June 30, 2004 |
|
| |
| Value on June 30, 2014 |
| | Investor Class — $14,930 |
| |
| | MSCI World Index — $20,134 |
| |
| |
| * | Since NYSE Arca Gold Miners Index total return data is only available from October 2004, it is not included in the line chart. |
|
| | | | |
| Total Annual Fund Operating Expenses |
| Investor Class | Institutional Class | A Class | C Class | R Class |
| 0.68% | 0.48% | 0.93% | 1.68% | 1.18% |
The total annual fund operating expenses shown is as stated in the fund’s prospectus current as of the date of this report. The prospectus may vary from the expense ratio shown elsewhere in this report because it is based on a different time period, includes acquired fund fees and expenses, and, if applicable, does not include fee waivers or expense reimbursements.
Data presented reflect past performance. Past performance is no guarantee of future results. Current performance may be higher or lower than the performance shown. Investment return and principal value will fluctuate, and redemption value may be more or less than original cost. To obtain performance data current to the most recent month end, please call 1-800-345-2021 or visit americancentury.com. International investing involves special risks, such as political instability and currency fluctuations. Investing in emerging markets may accentuate these risks. Gold stocks are generally considered speculative because of high share price volatility. The price of gold will likely impact the value of the companies in which the fund invests.
Unless otherwise indicated, performance reflects Investor Class shares; performance for other share classes will vary due to differences in fee structure. For information about other share classes available, please consult the prospectus. Data assumes reinvestment of dividends and capital gains, and none of the charts reflect the deduction of taxes that a shareholder would pay on fund distributions or the redemption of fund shares. Returns for the indices are provided for comparison. The fund’s total returns include operating expenses (such as transaction costs and management fees) that reduce returns, while the total returns of the indices do not.
Portfolio Managers: Bill Martin and Lynette Pang
Performance Summary
Global Gold advanced 13.99%* for the 12 months ended June 30, 2014. The portfolio’s benchmark, the NYSE Arca Gold Miners Index, advanced 9.61% for the same period. The fund’s return reflects operating expenses, while the benchmark’s return does not.
Volatile Gold Finished Period Strong
Gold bullion experienced wide price swings during the 12-month period. During the first six months, assumptions about Federal Reserve (Fed) tapering of quantitative easing (QE), along with the actual December 2013 announcement that the Fed would begin reducing its monthly bond purchases in January 2014, put pressure on gold prices. Investors viewed the unwinding of QE as the removal of a key longer-term inflation trigger that had been supporting higher gold bullion prices. At the same time, a surge in global supply combined with reduced demand, particularly in India, where the government imposed restrictions on gold imports, contributed to the downward trend in gold prices and gold mining stocks.
The backdrop for gold prices and gold mining stocks improved dramatically in early 2014. Weak economic news out of the emerging markets, Russia’s actions in Crimea and Ukraine, and mounting tensions in the Middle East led to a rally in gold prices. In addition, inflation climbed modestly higher in the U.S., U.K., and Japan, and the U.S. dollar weakened against most major currencies—other positive factors for gold.
Overall for the 12-month period, gold prices increased more than 10%, according to the London Gold Market Fixing, spurring a rally in gold mining stocks.
Production Costs Influenced Mining Stocks’ Performance
Although it advanced for the period, the gold stock benchmark generally underperformed the price of gold. Concerns about rising production costs, including higher operating expenses for energy, parts, and labor, drove the underperformance. In addition, higher gold prices encouraged companies to extract harder-to-reach or lower-grade metal, driving production costs higher. Because it’s more expensive to mine this ore, the best time for companies to do so is when they can sell it at higher prices. Furthermore, geopolitical risks, which helped lift the price of gold, had the opposite effect on gold stocks, as investors worried some mining countries would increase fees or taxes to meet political goals.
The fund’s outperformance relative to the benchmark primarily was due to security selection. In particular, smaller-cap exploration firms and weightings in gold royalty firms generated the bulk of the outperformance.
Positioning Favored Quality
The fund typically holds a 20% allocation to explorers and emerging producers, which are more closely tied to the performance of the metal than the larger gold producers. The team increased the quality of this allocation by focusing on higher-grade projects and operations in “safe” geopolitical jurisdictions, while avoiding companies requiring financing in the next two years.
* All fund returns referenced in this commentary are for Investor Class shares. Performance for other share classes will vary due to differences in fee structure; when Investor Class performance exceeds that of the fund's benchmark, other share classes may not. See page 3 for returns for all share classes.
To counteract concerns about rising production costs, the team held an overweight position in stocks of companies with pre-negotiated revenue streams and the ability to participate in the upside of production growth. The team believes these companies should perform well when financing is tight.
Canada Led Contributors
Overall, stock selection in Canada and the U.S., along with an overweight position in Canadian gold companies and an underweight in U.S. firms, contributed to the portfolio’s relative performance. In terms of individual holdings, an overweight position in Canada’s Franco-Nevada, a gold-focused royalty and streaming company, contributed favorably to fund performance. As a royalty company, Franco-Nevada avoided the production risks facing many mining companies. Additionally, a solid balance sheet, strong dividend, and an optimistic outlook toward the mineral sites the company is testing pushed the stock price higher.
In addition, a portfolio-only position in Canada’s Tahoe Resources, a silver mining company, contributed to performance. The company began production at its low-cost, high-grade Escobal mine in Guatemala, one of the world’s largest silver mines.
U.K., South Africa Were Main Detractors
Stock selection in the United Kingdom and South Africa detracted from relative results. In terms of individual holdings, an underweight position in Sibanye Gold, a South Africa-based gold mining company, weighed on the fund’s relative performance. Despite the ongoing threat of long-term strikes from South African miners and a struggling national economy, the company’s stock advanced on growing production, contained costs, and an attractive dividend yield.
In addition, a portfolio-only position in U.K.-based Fresnillo, a gold and silver mining company with operations in Mexico, detracted from relative results. The company faced legal and royalty challenges in 2013, which constrained production. It also reported a sharp drop in profits and a flat outlook for 2014 silver production, which drove down the stock price.
Security Selection Remains Key
Although gold prices have recovered from the recent lows of December 2013, the investment team remains cautious toward the near-term prospects for gold mining stocks. The team believes longer-term support for gold prices could come in the form of strong demand from central banks in the emerging markets, inflationary monetary and fiscal policies in the developed world, and rising consumer demand from emerging economies.
With gold mining companies continuing to face production cost and geopolitical challenges, the team believes security selection remains crucial. In particular, the team favors companies with higher-quality means, proven reserves, and healthier balance sheets. The team will seek to provide an investment that moves in line with gold prices and add value wherever possible.
|
| |
| JUNE 30, 2014 | |
| Top Ten Holdings | % of net assets |
Goldcorp, Inc.(1) | 12.2% |
| Barrick Gold Corp. | 9.1% |
| Franco-Nevada Corp. | 5.9% |
| Randgold Resources Ltd. ADR | 5.8% |
Agnico-Eagle Mines Ltd.(1) | 5.0% |
| Silver Wheaton Corp. | 4.8% |
| Newmont Mining Corp. | 4.8% |
| Royal Gold, Inc. | 4.5% |
Yamana Gold, Inc.(1) | 4.3% |
AngloGold Ashanti Ltd.(1) | 3.0% |
| (1) Includes shares traded on all exchanges. | |
| | |
| Geographic Composition | % of net assets |
| Canada | 71.7% |
| United States | 11.0% |
| United Kingdom | 6.5% |
| South Africa | 4.8% |
| Australia | 2.6% |
| Peru | 1.9% |
| China | 0.4% |
| Hong Kong | 0.1% |
Cash and Equivalents(2) | 1.0% |
| (2) Includes temporary cash investments and other assets and liabilities. | |
| | |
| Types of Investments in Portfolio | % of net assets |
| Foreign Common Stocks | 87.8% |
| Domestic Common Stocks | 11.0% |
| Warrants | 0.2% |
| Total Equity Exposure | 99.0% |
| Temporary Cash Investments | 1.6% |
| Other Assets and Liabilities | (0.6)% |
Fund shareholders may incur two types of costs: (1) transaction costs, including sales charges (loads) on purchase payments and redemption/exchange fees; and (2) ongoing costs, including management fees; distribution and service (12b-1) fees; and other fund expenses. This example is intended to help you understand your ongoing costs (in dollars) of investing in your fund and to compare these costs with the ongoing cost of investing in other mutual funds.
The example is based on an investment of $1,000 made at the beginning of the period and held for the entire period from January 1, 2014 to June 30, 2014.
Actual Expenses
The table provides information about actual account values and actual expenses for each class. You may use the information, together with the amount you invested, to estimate the expenses that you paid over the period. First, identify the share class you own. Then simply divide your account value by $1,000 (for example, an $8,600 account value divided by $1,000 = 8.6), then multiply the result by the number under the heading “Expenses Paid During Period” to estimate the expenses you paid on your account during this period.
If you hold Investor Class shares of any American Century Investments fund, or Institutional Class shares of the American Century Diversified Bond Fund, in an American Century Investments account (i.e., not a financial intermediary or retirement plan account), American Century Investments may charge you a $12.50 semiannual account maintenance fee if the value of those shares is less than $10,000. We will redeem shares automatically in one of your accounts to pay the $12.50 fee. In determining your total eligible investment amount, we will include your investments in all personal accounts (including American Century Investments Brokerage accounts) registered under your Social Security number. Personal accounts include individual accounts, joint accounts, UGMA/UTMA accounts, personal trusts, Coverdell Education Savings Accounts and IRAs (including traditional, Roth, Rollover, SEP-, SARSEP- and SIMPLE-IRAs), and certain other retirement accounts. If you have only business, business retirement, employer-sponsored or American Century Investments Brokerage accounts, you are currently not subject to this fee. If you are subject to the Account Maintenance Fee, your account value could be reduced by the fee amount.
Hypothetical Example for Comparison Purposes
The table also provides information about hypothetical account values and hypothetical expenses based on the actual expense ratio of each class of your fund and an assumed rate of return of 5% per year before expenses, which is not the actual return of a fund’s share class. The hypothetical account values and expenses may not be used to estimate the actual ending account balance or expenses you paid for the period. You may use this information to compare the ongoing costs of investing in your fund and other funds. To do so, compare this 5% hypothetical example with the 5% hypothetical examples that appear in the shareholder reports of the other funds.
Please note that the expenses shown in the table are meant to highlight your ongoing costs only and do not reflect any transactional costs, such as sales charges (loads) or redemption/exchange fees. Therefore, the table is useful in comparing ongoing costs only, and will not help you determine the relative total costs of owning different funds. In addition, if these transactional costs were included, your costs would have been higher.
|
| | | | |
| | Beginning Account Value 1/1/14 | Ending Account Value 6/30/14 | Expenses Paid During Period(1) 1/1/14 – 6/30/14 | Annualized Expense Ratio(1) |
| Actual |
| Investor Class | $1,000 | $1,266.30 | $3.76 | 0.67% |
| Institutional Class | $1,000 | $1,267.30 | $2.64 | 0.47% |
| A Class | $1,000 | $1,264.70 | $5.17 | 0.92% |
| C Class | $1,000 | $1,260.70 | $9.36 | 1.67% |
| R Class | $1,000 | $1,263.30 | $6.57 | 1.17% |
| Hypothetical |
| Investor Class | $1,000 | $1,021.47 | $3.36 | 0.67% |
| Institutional Class | $1,000 | $1,022.46 | $2.36 | 0.47% |
| A Class | $1,000 | $1,020.23 | $4.61 | 0.92% |
| C Class | $1,000 | $1,016.51 | $8.35 | 1.67% |
| R Class | $1,000 | $1,018.99 | $5.86 | 1.17% |
| |
| (1) | Expenses are equal to the class’s annualized expense ratio listed in the table above, multiplied by the average account value over the period, multiplied by 181, the number of days in the most recent fiscal half-year, divided by 365, to reflect the one-half year period. |
JUNE 30, 2014
|
| | | | | |
| | Shares | Value |
| COMMON STOCKS — 98.8% | | |
| AUSTRALIA — 2.6% | | |
Newcrest Mining Ltd.(1) | 1,271,213 |
| $ | 12,610,217 |
|
| CANADA — 71.5% | | |
| Agnico-Eagle Mines Ltd. | 390,166 |
| 14,940,437 |
|
| Agnico-Eagle Mines Ltd. New York Shares | 250,000 |
| 9,575,000 |
|
| Alacer Gold Corp. | 820,100 |
| 2,175,046 |
|
| Alamos Gold, Inc. | 410,900 |
| 4,155,017 |
|
Argonaut Gold, Inc.(1) | 888,400 |
| 3,679,985 |
|
ATAC Resources Ltd.(1) | 2,801,700 |
| 3,177,037 |
|
| AuRico Gold, Inc. | 877,731 |
| 3,750,952 |
|
B2Gold Corp.(1) | 3,741,582 |
| 10,905,131 |
|
| Barrick Gold Corp. | 2,466,112 |
| 45,129,849 |
|
Continental Gold Ltd.(1) | 621,000 |
| 2,036,924 |
|
Detour Gold Corp.(1) | 521,901 |
| 7,140,954 |
|
Dundee Precious Metals, Inc.(1) | 541,000 |
| 2,590,797 |
|
| Eldorado Gold Corp. | 1,666,400 |
| 12,743,380 |
|
First Majestic Silver Corp.(1) | 244,500 |
| 2,641,943 |
|
| Franco-Nevada Corp. | 507,394 |
| 29,125,048 |
|
GoGold Resources, Inc.(1) | 6,166,125 |
| 8,899,145 |
|
Gold Standard Ventures Corp. (Acquired 2/25/14, Cost $3,843,794)(1)(2)(3) | 5,918,108 |
| 4,658,836 |
|
| Goldcorp, Inc. | 2,119,776 |
| 59,160,235 |
|
| Goldcorp, Inc. New York Shares | 39,500 |
| 1,102,445 |
|
Guyana Goldfields, Inc.(1) | 1,621,621 |
| 3,920,887 |
|
| IAMGOLD Corp. | 479,119 |
| 1,971,166 |
|
Kinross Gold Corp.(1) | 1,900,052 |
| 7,870,512 |
|
Kinross Gold Corp. New York Shares(1) | 1,354,457 |
| 5,607,452 |
|
MAG Silver Corp.(1) | 252,500 |
| 2,387,634 |
|
Midas Gold Corp.(1) | 768,200 |
| 590,342 |
|
| Nevsun Resources Ltd. | 220,400 |
| 826,203 |
|
New Gold, Inc.(1) | 2,323,100 |
| 14,739,128 |
|
OceanaGold Corp.(1) | 322,300 |
| 999,778 |
|
Osisko Gold Royalties Ltd.(1) | 176,790 |
| 2,659,181 |
|
| Pan American Silver Corp. | 96,870 |
| 1,485,210 |
|
| Pan American Silver Corp. NASDAQ Shares | 174,400 |
| 2,677,040 |
|
Premier Gold Mines Ltd.(1) | 1,198,800 |
| 3,314,240 |
|
Pretium Resources, Inc.(1) | 143,400 |
| 1,186,657 |
|
Primero Mining Corp.(1) | 585,812 |
| 4,693,962 |
|
Roxgold, Inc.(1) | 1,184,000 |
| 943,161 |
|
Sandstorm Gold Ltd.(1) | 566,207 |
| 3,931,956 |
|
| SEMAFO, Inc. | 372,000 |
| 1,746,610 |
|
| Silver Wheaton Corp. | 904,600 |
| 23,763,842 |
|
Tahoe Resources, Inc.(1) | 276,000 |
| 7,226,878 |
|
|
| | | | | |
| | Shares | Value |
Timmins Gold Corp.(1) | 667,800 |
| $ | 1,195,350 |
|
Torex Gold Resources, Inc.(1) | 4,994,290 |
| 7,629,158 |
|
Virginia Mines, Inc.(1) | 319,300 |
| 3,641,705 |
|
| Yamana Gold, Inc. | 1,794,223 |
| 14,763,391 |
|
| Yamana Gold, Inc. New York Shares | 789,081 |
| 6,486,246 |
|
| | | 353,845,850 |
|
| CHINA — 0.4% | | |
| Zhaojin Mining Industry Co. Ltd. | 840,000 |
| 480,130 |
|
| Zijin Mining Group Co. Ltd., H Shares | 6,218,000 |
| 1,412,015 |
|
| | | 1,892,145 |
|
| HONG KONG — 0.1% | | |
G-Resources Group Ltd.(1) | 24,249,000 |
| 606,976 |
|
| PERU — 1.9% | | |
| Cia de Minas Buenaventura SA ADR | 784,700 |
| 9,267,307 |
|
| SOUTH AFRICA — 4.8% | | |
AngloGold Ashanti Ltd.(1) | 381,002 |
| 6,466,477 |
|
AngloGold Ashanti Ltd. ADR(1) | 499,676 |
| 8,599,424 |
|
| Gold Fields Ltd. | 1,462,510 |
| 5,379,832 |
|
Harmony Gold Mining Co. Ltd.(1) | 773,950 |
| 2,292,626 |
|
| Sibanye Gold Ltd. ADR | 106,800 |
| 1,178,004 |
|
| | | 23,916,363 |
|
| UNITED KINGDOM — 6.5% | | |
| Fresnillo plc | 252,303 |
| 3,765,220 |
|
| Randgold Resources Ltd. ADR | 337,800 |
| 28,577,880 |
|
| | | 32,343,100 |
|
| UNITED STATES — 11.0% | | |
Coeur Mining, Inc.(1) | 225,959 |
| 2,074,304 |
|
| Hecla Mining Co. | 604,275 |
| 2,084,749 |
|
McEwen Mining, Inc.(1) | 749,100 |
| 2,157,408 |
|
Midway Gold Corp.(1) | 2,428,409 |
| 2,185,568 |
|
| Newmont Mining Corp. | 925,114 |
| 23,534,900 |
|
| Royal Gold, Inc. | 293,421 |
| 22,335,206 |
|
| | | 54,372,135 |
|
TOTAL COMMON STOCKS (Cost $340,354,004) | | 488,854,093 |
|
| WARRANTS — 0.2% | | |
| CANADA — 0.2% | | |
Gold Standard Ventures Corp. (Acquired 2/25/14, Cost $—)(1)(2)(3) | 2,959,054 |
| 748,742 |
|
Sandstorm Gold Ltd.(1) | 115,000 |
| 134,717 |
|
Torex Gold Resources, Inc.(1) | 750,000 |
| 98,402 |
|
TOTAL WARRANTS (Cost $—) | | 981,861 |
|
|
| | | | | |
| | Shares | Value |
| TEMPORARY CASH INVESTMENTS — 1.6% | | |
| Repurchase Agreement, Bank of America Merrill Lynch, (collateralized by various U.S. Treasury obligations, 0.75% - 0.875%, 1/31/18 - 2/28/18, valued at $1,827,469), in a joint trading account at 0.05%, dated 6/30/14, due 7/1/14 (Delivery value $1,790,694) | | $ | 1,790,692 |
|
| Repurchase Agreement, Credit Suisse First Boston, Inc., (collateralized by various U.S. Treasury obligations, 1.75%, 5/15/23, valued at $731,224), in a joint trading account at 0.01%, dated 6/30/14, due 7/1/14 (Delivery value $716,277) | | 716,277 |
|
| Repurchase Agreement, Goldman Sachs & Co., (collateralized by various U.S. Treasury obligations, 3.125%, 11/15/41, valued at $1,461,371), in a joint trading account at 0.03%, dated 6/30/14, due 7/1/14 (Delivery value $1,432,554) | | 1,432,553 |
|
| SSgA U.S. Government Money Market Fund, Class N | 4,233,840 |
| 4,233,840 |
|
TOTAL TEMPORARY CASH INVESTMENTS (Cost $8,173,362) | | 8,173,362 |
|
TOTAL INVESTMENT SECURITIES — 100.6% (Cost $348,527,366) | | 498,009,316 |
|
| OTHER ASSETS AND LIABILITIES — (0.6)% | | (3,077,623 | ) |
| TOTAL NET ASSETS — 100.0% | | $ | 494,931,693 |
|
|
| | |
| NOTES TO SCHEDULE OF INVESTMENTS |
| ADR | - | American Depositary Receipt |
| |
| (2) | Restricted security that may not be offered for public sale without being registered with the Securities and Exchange Commission and/or may be subject to resale, redemption or transferability restrictions. The aggregate value of these securities at the period end was $5,407,578, which represented 1.1% of total net assets. |
| |
| (3) | Affiliated Company: the fund’s holding represents ownership of 5% or more of the voting securities of the company; therefore, the company is affiliated as defined in the Investment Company Act of 1940. |
See Notes to Financial Statements.
|
|
| Statement of Assets and Liabilities |
|
| | | |
| JUNE 30, 2014 |
| Assets |
| Investment securities - unaffiliated, at value (cost of $344,683,572) | $ | 492,601,738 |
|
| Investment securities - affiliated, at value (cost of $3,843,794) | 5,407,578 |
|
| Total investment securities, at value (cost of $348,527,366) | 498,009,316 |
|
| Receivable for capital shares sold | 399,902 |
|
| Dividends and interest receivable | 161,521 |
|
| | 498,570,739 |
|
| | |
| Liabilities | |
| Foreign currency overdraft payable, at value (cost of $124,553) | 124,028 |
|
| Payable for investments purchased | 3,081,566 |
|
| Payable for capital shares redeemed | 181,861 |
|
| Accrued management fees | 244,402 |
|
| Distribution and service fees payable | 7,189 |
|
| | 3,639,046 |
|
| | |
| Net Assets | $ | 494,931,693 |
|
| | |
| Net Assets Consist of: | |
| Capital (par value and paid-in surplus) | $ | 443,329,481 |
|
| Distributions in excess of net investment income | (11,279,109 | ) |
| Accumulated net realized loss | (86,598,295 | ) |
| Net unrealized appreciation | 149,479,616 |
|
| | $ | 494,931,693 |
|
|
| | | | | | |
| | Net Assets | Shares Outstanding | Net Asset Value Per Share |
| Investor Class, $0.01 Par Value |
| $455,211,294 |
| 41,078,077 |
| $11.08 |
| Institutional Class, $0.01 Par Value |
| $14,374,770 |
| 1,290,112 |
| $11.14 |
| A Class, $0.01 Par Value |
| $18,386,860 |
| 1,680,752 |
| $10.94* |
| C Class, $0.01 Par Value |
| $3,464,787 |
| 325,648 |
| $10.64 |
| R Class, $0.01 Par Value |
| $3,493,982 |
| 320,915 |
| $10.89 |
*Maximum offering price $11.61 (net asset value divided by 0.9425).
See Notes to Financial Statements.
|
| | | |
| YEAR ENDED JUNE 30, 2014 |
| Investment Income (Loss) |
| Income: | |
| Dividends (net of foreign taxes withheld of $626,869) | $ | 4,920,245 |
|
| Interest | 1,221 |
|
| | 4,921,466 |
|
| | |
| Expenses: | |
| Management fees | 3,041,005 |
|
| Distribution and service fees: | |
| A Class | 36,292 |
|
| C Class | 24,664 |
|
| R Class | 14,816 |
|
| Directors’ fees and expenses | 27,544 |
|
| Other expenses | 1,219 |
|
| | 3,145,540 |
|
| | |
| Net investment income (loss) | 1,775,926 |
|
| | |
| Realized and Unrealized Gain (Loss) |
| Net realized gain (loss) on: | |
| Investment transactions | (43,869,968 | ) |
| Foreign currency transactions | 75,778 |
|
| | (43,794,190 | ) |
| | |
| Change in net unrealized appreciation (depreciation) on: | |
| Investments | 100,864,979 |
|
| Translation of assets and liabilities in foreign currencies | 953 |
|
| | 100,865,932 |
|
| | |
| Net realized and unrealized gain (loss) | 57,071,742 |
|
| | |
| Net Increase (Decrease) in Net Assets Resulting from Operations | $ | 58,847,668 |
|
See Notes to Financial Statements.
|
|
| Statement of Changes in Net Assets |
|
| | | | | | |
| YEARS ENDED JUNE 30, 2014 AND JUNE 30, 2013 | | |
| Increase (Decrease) in Net Assets | June 30, 2014 | June 30, 2013 |
| Operations | | |
| Net investment income (loss) | $ | 1,775,926 |
| $ | 4,655,297 |
|
| Net realized gain (loss) | (43,794,190 | ) | (8,432,100 | ) |
| Change in net unrealized appreciation (depreciation) | 100,865,932 |
| (329,126,948 | ) |
| Net increase (decrease) in net assets resulting from operations | 58,847,668 |
| (332,903,751 | ) |
| | | |
| Distributions to Shareholders | | |
| From net investment income: | | |
| Investor Class | — |
| (9,167,987 | ) |
| Institutional Class | — |
| (254,455 | ) |
| A Class | — |
| (164,538 | ) |
| C Class | — |
| (4,958 | ) |
| R Class | — |
| (17,663 | ) |
| Decrease in net assets from distributions | — |
| (9,609,601 | ) |
| | | |
| Capital Share Transactions | | |
| Net increase (decrease) in net assets from capital share transactions (Note 5) | (12,947,944 | ) | (34,733,148 | ) |
| | | |
| Redemption Fees | | |
| Increase in net assets from redemption fees | 116,151 |
| 56,943 |
|
| | | |
| Net increase (decrease) in net assets | 46,015,875 |
| (377,189,557 | ) |
| | | |
| Net Assets | | |
| Beginning of period | 448,915,818 |
| 826,105,375 |
|
| End of period | $ | 494,931,693 |
| $ | 448,915,818 |
|
| | | |
| Distributions in excess of net investment income | $ | (11,279,109 | ) | $ | (26,388,397 | ) |
See Notes to Financial Statements.
|
|
| Notes to Financial Statements |
JUNE 30, 2014
1. Organization
American Century Quantitative Equity Funds, Inc. (the corporation) is registered under the Investment Company Act of 1940, as amended (the 1940 Act), as an open-end management investment company and is organized as a Maryland corporation. Global Gold Fund (the fund) is one fund in a series issued by the corporation. The fund is nondiversified as defined under the 1940 Act. The fund’s investment objective is to seek to realize a total return (capital growth and dividends) consistent with investment in securities of companies that are engaged in mining, processing, fabricating or distributing gold or other precious metals throughout the world.
The fund offers the Investor Class, the Institutional Class, the A Class, the C Class and the R Class. The A Class may incur an initial sales charge. The A Class and C Class may be subject to a contingent deferred sales charge. The share classes differ principally in their respective sales charges and distribution and shareholder servicing expenses and arrangements. The Institutional Class is made available to institutional shareholders or through financial intermediaries whose clients do not require the same level of shareholder and administrative services as shareholders of other classes. As a result, the Institutional Class is charged a lower unified management fee.
2. Significant Accounting Policies
The following is a summary of significant accounting policies consistently followed by the fund in preparation of its financial statements. The financial statements are prepared in conformity with accounting principles generally accepted in the United States of America, which may require management to make certain estimates and assumptions at the date of the financial statements. Actual results could differ from these estimates. Management evaluated the impact of events or transactions occurring through the date the financial statements were issued that would merit recognition or disclosure.
Investment Valuations — The fund determines the fair value of its investments and computes its net asset value per share at the close of regular trading (usually 4 p.m. Eastern time) on the New York Stock Exchange (NYSE) on each day the NYSE is open. The Board of Directors has adopted valuation policies and procedures to guide the investment advisor in the fund’s investment valuation process and to provide methodologies for the oversight of the fund’s pricing function.
Equity securities that are listed or traded on a domestic securities exchange are valued at the last reported sales price or at the official closing price as provided by the exchange. Equity securities traded on foreign securities exchanges are generally valued at the closing price of such securities on the exchange where primarily traded or at the close of the NYSE, if that is earlier. If no last sales price is reported, or if local convention or regulation so provides, the mean of the latest bid and asked prices may be used. Securities traded over-the-counter are valued at the mean of the latest bid and asked prices, the last sales price, or the official closing price. Equity securities initially expressed in local currencies are translated into U.S. dollars at the mean of the appropriate currency exchange rate at the close of the NYSE as provided by an independent pricing service.
Fixed income securities maturing within 60 days at the time of purchase may be valued at cost, plus or minus any amortized discount or premium or at the evaluated mean as provided by an independent pricing service. Evaluated mean prices are commonly derived through utilization of market models, which may consider, among other factors: trade data, quotations from dealers and active market makers, relevant yield curve and spread data, related sector levels, creditworthiness, trade data or market information on comparable securities, and other relevant security specific information.
Open-end management investment companies are valued at the reported net asset value per share. Repurchase agreements are valued at cost, which approximates fair value.
If the fund determines that the market price for an investment is not readily available or the valuation methods mentioned above do not reflect an investment’s fair value, such investment is valued as determined in good faith by the Board of Directors or its delegate, in accordance with policies and procedures adopted by the Board of Directors. In its determination of fair value, the fund may review several factors including, but not limited to, market information regarding the specific investment or comparable investments and correlation
with other investment types, futures indices or general market indicators. Circumstances that may cause the fund to use these procedures to value an investment include, but are not limited to: an investment has been declared in default or is distressed; trading in a security has been suspended during the trading day or a security is not actively trading on its principal exchange; prices received from a regular pricing source are deemed unreliable; or there is a foreign market holiday and no trading occurred.
The fund monitors for significant events occurring after the close of an investment’s primary exchange but before the fund’s net asset value per share is determined. Significant events may include, but are not limited to: corporate announcements and transactions; governmental action and political unrest that could impact a specific investment or an investment sector; or armed conflicts, natural disasters and similar events that could affect investments in a specific country or region. The fund also monitors for significant fluctuations between domestic and foreign markets, as evidenced by the U.S. market or such other indicators that the Board of Directors, or its delegate, deems appropriate. If significant fluctuations in foreign markets are identified, the fund may apply a model-derived factor to the closing price of equity securities traded on foreign securities exchanges. The factor is based on observable market data as provided by an independent pricing service.
Security Transactions — Security transactions are accounted for as of the trade date. Net realized gains and losses are determined on the identified cost basis, which is also used for federal income tax purposes.
Investment Income — Dividend income less foreign taxes withheld, if any, is recorded as of the ex-dividend date. Distributions received on securities that represent a return of capital or long-term capital gain are recorded as a reduction of cost of investments and/or as a realized gain. The fund may estimate the components of distributions received that may be considered nontaxable distributions or long-term capital gain distributions for income tax purposes. Interest income is recorded on the accrual basis and includes accretion of discounts and amortization of premiums.
Foreign Currency Translations — All assets and liabilities initially expressed in foreign currencies are translated into U.S. dollars at prevailing exchange rates at period end. The fund may enter into spot foreign currency exchange contracts to facilitate transactions denominated in a foreign currency. Purchases and sales of investment securities, dividend and interest income, spot foreign currency exchange contracts, and expenses are translated at the rates of exchange prevailing on the respective dates of such transactions. Net realized and unrealized foreign currency exchange gains or losses related to investment securities are a component of net realized gain (loss) on investment transactions and change in net unrealized appreciation (depreciation) on investments, respectively.
Repurchase Agreements — The fund may enter into repurchase agreements with institutions that American Century Investment Management, Inc. (ACIM) (the investment advisor) has determined are creditworthy pursuant to criteria adopted by the Board of Directors. The fund requires that the collateral, represented by securities, received in a repurchase transaction be transferred to the custodian in a manner sufficient to enable the fund to obtain those securities in the event of a default under the repurchase agreement. ACIM monitors, on a daily basis, the securities transferred to ensure the value, including accrued interest, of the securities under each repurchase agreement is equal to or greater than amounts owed to the fund under each repurchase agreement.
Joint Trading Account — Pursuant to an Exemptive Order issued by the Securities and Exchange Commission, the fund, along with certain other funds in the American Century Investments family of funds, may transfer uninvested cash balances into a joint trading account. These balances are invested in one or more repurchase agreements that are collateralized by U.S. Treasury or Agency obligations.
Income Tax Status — It is the fund’s policy to distribute substantially all net investment income and net realized gains to shareholders and to otherwise qualify as a regulated investment company under provisions of the Internal Revenue Code. Accordingly, no provision has been made for income taxes. The fund files U.S. federal, state, local and non-U.S. tax returns as applicable. The fund's tax returns are subject to examination by the relevant taxing authority until expiration of the applicable statute of limitations, which is generally three years from the date of filing but can be longer in certain jurisdictions. At this time, management believes there are no uncertain tax positions which, based on their technical merit, would not be sustained upon examination and for which it is reasonably possible that the total amounts of unrecognized tax benefits will significantly change in the next twelve months.
Multiple Class — All shares of the fund represent an equal pro rata interest in the net assets of the class to which such shares belong, and have identical voting, dividend, liquidation and other rights and the same terms and conditions, except for class specific expenses and exclusive rights to vote on matters affecting only
individual classes. Income, non-class specific expenses, and realized and unrealized capital gains and losses of the fund are allocated to each class of shares based on their relative net assets.
Distributions to Shareholders — Distributions from net investment income, if any, are generally declared and paid semiannually. Distributions from net realized gains, if any, are generally declared and paid annually.
Redemption Fees — The fund may impose a 1.00% redemption fee on shares held less than 60 days. The fee may not be applicable to all classes. The redemption fee is retained by the fund and helps cover transaction costs that long-term investors may bear when the fund sells securities to meet investor redemptions.
Indemnifications — Under the corporation’s organizational documents, its officers and directors are indemnified against certain liabilities arising out of the performance of their duties to the fund. In addition, in the normal course of business, the fund enters into contracts that provide general indemnifications. The maximum exposure under these arrangements is unknown as this would involve future claims that may be made against a fund. The risk of material loss from such claims is considered by management to be remote.
3. Fees and Transactions with Related Parties
Certain officers and directors of the corporation are also officers and/or directors of American Century Companies, Inc. (ACC). The corporation’s investment advisor, ACIM, the corporation's distributor, American Century Investment Services, Inc. (ACIS), and the corporation’s transfer agent, American Century Services, LLC, are wholly owned, directly or indirectly, by ACC.
Management Fees — The corporation has entered into a management agreement with ACIM, under which ACIM provides the fund with investment advisory and management services in exchange for a single, unified management fee (the fee) per class. The agreement provides that all expenses of managing and operating the fund, except distribution and service fees, brokerage expenses, taxes, interest, fees and expenses of the independent directors (including legal counsel fees), and extraordinary expenses, will be paid by ACIM. The fee is computed and accrued daily based on each class’s daily net assets and paid monthly in arrears. The fee consists of (1) an Investment Category Fee based on the daily net assets of the fund and certain other accounts managed by the investment advisor that are in the same broad investment category as the fund and (2) a Complex Fee based on the assets of all the funds in the American Century Investments family of funds. The rates for the Investment Category Fee range from 0.3380% to 0.5200%. The rates for the Complex Fee range from 0.2500% to 0.3100% for the Investor Class, A Class, C Class and R Class. The rates for the Complex Fee range from 0.0500% to 0.1100% for the Institutional Class. The effective annual management fee for each class for the year ended June 30, 2014 was 0.67% for the Investor Class, A Class, C Class and R Class and 0.47% for the Institutional Class.
Distribution and Service Fees — The Board of Directors has adopted a separate Master Distribution and Individual Shareholder Services Plan for each of the A Class, C Class and R Class (collectively the plans), pursuant to Rule 12b-1 of the 1940 Act. The plans provide that the A Class will pay ACIS an annual distribution and service fee of 0.25%. The plans provide that the C Class will pay ACIS an annual distribution and service fee of 1.00%, of which 0.25% is paid for individual shareholder services and 0.75% is paid for distribution services. The plans provide that the R Class will pay ACIS an annual distribution and service fee of 0.50%. The fees are computed and accrued daily based on each class’s daily net assets and paid monthly in arrears. The fees are used to pay financial intermediaries for distribution and individual shareholder services. Fees incurred under the plans during the year ended June 30, 2014 are detailed in the Statement of Operations.
Directors' Fees and Expenses — The Board of Directors is responsible for overseeing the investment advisor’s management and operations of the fund. The directors receive detailed information about the fund and its investment advisor regularly throughout the year, and meet at least quarterly with management of the investment advisor to review reports about fund operations. Fees and expenses incurred in conjunction with the directors during the year ended June 30, 2014 are detailed in the Statement of Operations. The fund’s officers do not receive compensation from the fund.
4. Investment Transactions
Purchases and sales of investment securities, excluding short-term investments, for the year ended June 30, 2014 were $130,437,945 and $132,969,162, respectively.
5. Capital Share Transactions
Transactions in shares of the fund were as follows:
|
| | | | | | | | | | |
| | Year ended June 30, 2014 | Year ended June 30, 2013 |
| | Shares | Amount | Shares | Amount |
| Investor Class/Shares Authorized | 300,000,000 |
| | 200,000,000 |
| |
| Sold | 8,675,193 |
| $ | 87,122,900 |
| 7,569,342 |
| $ | 114,272,021 |
|
| Issued in reinvestment of distributions | — |
| — |
| 482,896 |
| 8,426,551 |
|
| Redeemed | (10,791,654 | ) | (105,185,148 | ) | (11,065,457 | ) | (169,504,740 | ) |
| | (2,116,461 | ) | (18,062,248 | ) | (3,013,219 | ) | (46,806,168 | ) |
| Institutional Class/Shares Authorized | 10,000,000 |
| | 10,000,000 |
| |
| Sold | 641,890 |
| 6,525,981 |
| 905,601 |
| 13,367,519 |
|
| Issued in reinvestment of distributions | — |
| — |
| 14,549 |
| 254,455 |
|
| Redeemed | (785,576 | ) | (7,970,276 | ) | (418,567 | ) | (6,265,764 | ) |
| | (143,686 | ) | (1,444,295 | ) | 501,583 |
| 7,356,210 |
|
| A Class/Shares Authorized | 10,000,000 |
| | 20,000,000 |
| |
| Sold | 2,178,363 |
| 20,602,231 |
| 1,218,153 |
| 18,638,390 |
|
| Issued in reinvestment of distributions | — |
| — |
| 8,757 |
| 151,405 |
|
| Redeemed | (1,596,288 | ) | (15,500,470 | ) | (1,048,455 | ) | (16,218,355 | ) |
| | 582,075 |
| 5,101,761 |
| 178,455 |
| 2,571,440 |
|
| C Class/Shares Authorized | 10,000,000 |
| | 10,000,000 |
| |
| Sold | 169,566 |
| 1,601,064 |
| 99,945 |
| 1,433,539 |
|
| Issued in reinvestment of distributions | — |
| — |
| 235 |
| 3,997 |
|
| Redeemed | (67,047 | ) | (655,016 | ) | (47,714 | ) | (685,081 | ) |
| | 102,519 |
| 946,048 |
| 52,466 |
| 752,455 |
|
| R Class/Shares Authorized | 10,000,000 |
| | 10,000,000 |
| |
| Sold | 192,549 |
| 1,877,414 |
| 183,825 |
| 2,480,710 |
|
| Issued in reinvestment of distributions | — |
| — |
| 1,023 |
| 17,663 |
|
| Redeemed | (139,953 | ) | (1,366,624 | ) | (72,152 | ) | (1,105,458 | ) |
| | 52,596 |
| 510,790 |
| 112,696 |
| 1,392,915 |
|
| Net increase (decrease) | (1,522,957 | ) | $ | (12,947,944 | ) | (2,168,019 | ) | $ | (34,733,148 | ) |
6. Affiliated Company Transactions
If a fund's holding represents ownership of 5% or more of the voting securities of a company, the company is affiliated as defined in the 1940 Act. A summary of transactions for each company which is or was an affiliate at or during the year ended June 30, 2014 follows:
|
| | | | | | | | | | | | | | | | |
| | June 30, 2013 | | | | | June 30, 2014 |
| Company | Share
Balance | Purchase
Cost | Sales Cost | Realized
Gain (Loss) | Dividend
Income | Share
Balance | Market
Value |
Gold Standard Ventures Corp.(1)(2) | — |
| $ | 3,843,794 |
| — |
| — |
| — |
| 5,918,108 |
| $ | 4,658,836 |
|
Gold Standard Ventures Corp. (Warrants)(1)(2) | — |
| — |
| — |
| — |
| — |
| 2,959,054 |
| 748,742 |
|
| | | $ | 3,843,794 |
| — |
| — |
| — |
| | $ | 5,407,578 |
|
7. Fair Value Measurements
The fund’s investments valuation process is based on several considerations and may use multiple inputs to determine the fair value of the investments held by the fund. In conformity with accounting principles generally accepted in the United States of America, the inputs used to determine a valuation are classified into three broad levels.
| |
| • | Level 1 valuation inputs consist of unadjusted quoted prices in an active market for identical investments. |
| |
| • | Level 2 valuation inputs consist of direct or indirect observable market data (including quoted prices for comparable investments, evaluations of subsequent market events, interest rates, prepayment speeds, credit risk, etc.). These inputs also consist of quoted prices for identical investments initially expressed in local currencies that are adjusted through translation into U.S. dollars. |
| |
| • | Level 3 valuation inputs consist of unobservable data (including a fund’s own assumptions). |
The level classification is based on the lowest level input that is significant to the fair valuation measurement. The valuation inputs are not necessarily an indication of the risks associated with investing in these securities or other financial instruments.
The following is a summary of the level classifications as of period end. The Schedule of Investments provides additional information on the fund’s portfolio holdings.
|
| | | | | | | | |
| | Level 1 | Level 2 | Level 3 |
| Assets | | | |
| Investment Securities | | | |
| Foreign Common Stocks | $ | 141,964,489 |
| $ | 292,517,469 |
| — |
|
| Domestic Common Stocks | 54,372,135 |
| — |
| — |
|
| Warrants | — |
| 981,861 |
| — |
|
| Temporary Cash Investments | 4,233,840 |
| 3,939,522 |
| — |
|
| | $ | 200,570,464 |
| $ | 297,438,852 |
| — |
|
8. Risk Factors
There are certain risks involved in investing in foreign securities. These risks include those resulting from future adverse political, social and economic developments, fluctuations in currency exchange rates, the possible imposition of exchange controls, and other foreign laws or restrictions. Investing in emerging markets may accentuate these risks.
The fund concentrates its investments in a narrow segment of the total market. Because of this, the fund may be subject to greater risk and market fluctuations than a portfolio representing a broader range of industries. Gold stocks are generally considered speculative because of high share price volatility. The price of gold will likely impact the value of the companies in which the fund invests. The price of gold will fluctuate, sometimes considerably. Though many investors believe that gold investments hedge against inflation, currency devaluations and stock market declines, there is no guarantee that these historical inverse relationships will continue.
9. Federal Tax Information
The tax character of distributions paid during the years ended June 30, 2014 and June 30, 2013 were as follows:
|
| | | | | |
| | 2014 | 2013 |
| Distributions Paid From | | |
| Ordinary income | — |
| $ | 9,609,601 |
|
| Long-term capital gains | — |
| — |
|
The book-basis character of distributions made during the year from net investment income or net realized gains may differ from their ultimate characterization for federal income tax purposes. These differences reflect the differing character of certain income items and net realized gains and losses for financial statement and tax purposes, and may result in reclassification among certain capital accounts on the financial statements.
The reclassifications, which are primarily due to passive foreign investment company transactions, were made to distributions in excess of net investment income $13,333,362 and accumulated net realized loss $(13,333,362).
As of June 30, 2014, the federal tax cost of investments and the components of distributable earnings on a tax-basis were as follows:
|
| | | |
| Federal tax cost of investments | $ | 382,310,457 |
|
| Gross tax appreciation of investments | $ | 169,802,825 |
|
| Gross tax depreciation of investments | (54,103,966 | ) |
| Net tax appreciation (depreciation) of investments | 115,698,859 |
|
| Net tax appreciation (depreciation) on translation of assets and liabilities in foreign currencies | (2,269 | ) |
| Net tax appreciation (depreciation) | $ | 115,696,590 |
|
| Undistributed ordinary income | $ | 10,790,646 |
|
| Accumulated short-term capital losses | $ | (17,040,871 | ) |
Accumulated long-term capital losses
| $ | (57,844,153 | ) |
| | |
The difference between book-basis and tax-basis unrealized appreciation (depreciation) is attributable primarily to the realization to ordinary income for tax purposes of unrealized gains on investments in passive foreign investment companies.
Accumulated capital losses represent net capital loss carryovers that may be used to offset future realized capital gains for federal income tax purposes. The capital loss carryovers may be carried forward for an unlimited period. Future capital loss carryover utilization in any given year may be subject to Internal Revenue Code limitations.
|
| | | | | | | | | | | | | | | |
| For a Share Outstanding Throughout the Years Ended June 30 (except as noted) |
| Per-Share Data | | | | | | Ratios and Supplemental Data | |
| | | Income From Investment Operations: | Distributions From: | | | Ratio to Average Net Assets of: | | |
| | Net Asset Value, Beginning of Period | Net Investment Income (Loss)(1) | Net Realized and Unrealized Gain (Loss) | Total From Investment Operations | Net Investment Income | Net Realized Gains | Total Distributions | Net Asset Value, End of Period | Total Return(2) | Operating Expenses | Net Investment Income (Loss) | Portfolio Turnover Rate | Net Assets, End of Period (in thousands) |
| Investor Class | | | | | | | | | | | |
| 2014 | $9.72 | 0.04 | 1.32 | 1.36 | — | — | — | $11.08 | 13.99% | 0.67% | 0.40% | 29% |
| $455,211 |
|
| 2013 | $17.08 | 0.10 | (7.26) | (7.16) | (0.20) | — | (0.20) | $9.72 | (42.43)% | 0.68% | 0.61% | 6% |
| $419,703 |
|
| 2012 | $22.90 | 0.05 | (4.50) | (4.45) | — | (1.37) | (1.37) | $17.08 | (20.43)% | 0.69% | 0.23% | 8% |
| $789,135 |
|
| 2011 | $23.11 | (0.04) | 3.06 | 3.02 | (1.60) | (1.63) | (3.23) | $22.90 | 11.44% | 0.69% | (0.18)% | 32% |
| $1,081,258 |
|
| 2010 | $16.24 | (0.03) | 7.03 | 7.00 | (0.13) | — | (0.13) | $23.11 | 43.18% | 0.69% | (0.16)% | 24% |
| $1,032,309 |
|
| Institutional Class | | | | | | | | | | | |
| 2014 | $9.75 | 0.06 | 1.33 | 1.39 | — | — | — | $11.14 | 14.26% | 0.47% | 0.60% | 29% |
| $14,375 |
|
| 2013 | $17.13 | 0.14 | (7.28) | (7.14) | (0.24) | — | (0.24) | $9.75 | (42.30)% | 0.48% | 0.81% | 6% |
| $13,976 |
|
| 2012 | $22.92 | 0.10 | (4.52) | (4.42) | — | (1.37) | (1.37) | $17.13 | (20.28)% | 0.49% | 0.43% | 8% |
| $15,971 |
|
| 2011 | $23.13 | 0.01 | 3.06 | 3.07 | (1.65) | (1.63) | (3.28) | $22.92 | 11.64% | 0.49% | 0.02% | 32% |
| $19,854 |
|
| 2010 | $16.25 | 0.01 | 7.04 | 7.05 | (0.17) | — | (0.17) | $23.13 | 43.51% | 0.49% | 0.04% | 24% |
| $15,751 |
|
| A Class | | | | | | | | | | |
| 2014 | $9.61 | 0.01 | 1.32 | 1.33 | — | — | — | $10.94 | 13.84% | 0.92% | 0.15% | 29% |
| $18,387 |
|
| 2013 | $16.90 | 0.06 | (7.19) | (7.13) | (0.16) | — | (0.16) | $9.61 | (42.61)% | 0.93% | 0.36% | 6% |
| $10,561 |
|
| 2012 | $22.72 | —(3) | (4.45) | (4.45) | — | (1.37) | (1.37) | $16.90 | (20.60)% | 0.94% | (0.02)% | 8% |
| $15,550 |
|
| 2011 | $22.95 | (0.10) | 3.03 | 2.93 | (1.53) | (1.63) | (3.16) | $22.72 | 11.15% | 0.94% | (0.43)% | 32% |
| $21,292 |
|
| 2010 | $16.13 | (0.08) | 6.97 | 6.89 | (0.07) | — | (0.07) | $22.95 | 42.80% | 0.94% | (0.41)% | 24% |
| $20,879 |
|
|
| | | | | | | | | | | | | | | |
| For a Share Outstanding Throughout the Years Ended June 30 (except as noted) |
| Per-Share Data | | | | | | Ratios and Supplemental Data | |
| | | Income From Investment Operations: | Distributions From: | | | Ratio to Average Net Assets of: | | |
| | Net Asset Value, Beginning of Period | Net Investment Income (Loss)(1) | Net Realized and Unrealized Gain (Loss) | Total From Investment Operations | Net Investment Income | Net Realized Gains | Total Distributions | Net Asset Value, End of Period | Total Return(2) | Operating Expenses | Net Investment Income (Loss) | Portfolio Turnover Rate | Net Assets, End of Period (in thousands) |
| C Class | | | | | | | | | | |
| 2014 | $9.42 | (0.06) | 1.28 | 1.22 | — | — | — | $10.64 | 12.95% | 1.67% | (0.60)% | 29% |
| $3,465 |
|
| 2013 | $16.56 | (0.05) | (7.06) | (7.11) | (0.03) | — | (0.03) | $9.42 | (43.02)% | 1.68% | (0.39)% | 6% |
| $2,102 |
|
| 2012 | $22.46 | (0.16) | (4.37) | (4.53) | — | (1.37) | (1.37) | $16.56 | (21.21)% | 1.69% | (0.77)% | 8% |
| $2,826 |
|
| 2011 | $22.72 | (0.29) | 2.99 | 2.70 | (1.33) | (1.63) | (2.96) | $22.46 | 10.31% | 1.69% | (1.18)% | 32% |
| $3,593 |
|
| 2010 | $16.02 | (0.23) | 6.93 | 6.70 | — | — | — | $22.72 | 41.82% | 1.69% | (1.16)% | 24% |
| $2,318 |
|
| R Class | | | | | | | | | | |
| 2014 | $9.59 | (0.01) | 1.31 | 1.30 | — | — | — | $10.89 | 13.56% | 1.17% | (0.10)% | 29% |
| $3,494 |
|
| 2013 | $16.86 | 0.03 | (7.18) | (7.15) | (0.12) | — | (0.12) | $9.59 | (42.74)% | 1.18% | 0.11% | 6% |
| $2,574 |
|
| 2012 | $22.73 | (0.05) | (4.45) | (4.50) | — | (1.37) | (1.37) | $16.86 | (20.82)% | 1.19% | (0.27)% | 8% |
| $2,623 |
|
| 2011 | $22.96 | (0.16) | 3.02 | 2.86 | (1.46) | (1.63) | (3.09) | $22.73 | 10.87% | 1.19% | (0.68)% | 32% |
| $2,567 |
|
| 2010 | $16.13 | (0.13) | 6.98 | 6.85 | (0.02) | — | (0.02) | $22.96 | 42.50% | 1.19% | (0.66)% | 24% |
| $1,117 |
|
|
|
| Notes to Financial Highlights |
| |
| (1) | Computed using average shares outstanding throughout the period. |
| |
| (2) | Total returns are calculated based on the net asset value of the last business day and do not reflect applicable sales charges, if any. Total returns for periods less than one year are not annualized. |
| |
| (3) | Per-share amount was less than $0.005. |
See Notes to Financial Statements.
|
|
| Report of Independent Registered Public Accounting Firm |
To the Directors of the American Century Quantitative Equity Funds, Inc. and Shareholders of the Global Gold Fund:
In our opinion, the accompanying statement of assets and liabilities, including the schedule of investments, and the related statements of operations, of changes in net assets and the financial highlights present fairly, in all material respects, the financial position of the Global Gold Fund (one of the fifteen funds comprising the American Century Quantitative Equity Funds, Inc., hereafter referred to as the “Fund”) at June 30, 2014, the results of its operations for the year then ended, the changes in its net assets for each of the two years in the period then ended and the financial highlights for each of the five years in the period then ended, in conformity with accounting principles generally accepted in the United States of America. These financial statements and financial highlights (hereafter referred to as "financial statements") are the responsibility of the Fund's management. Our responsibility is to express an opinion on these financial statements based on our audits. We conducted our audits of these financial statements in accordance with the standards of the Public Company Accounting Oversight Board (United States). Those standards require that we plan and perform the audit to obtain reasonable assurance about whether the financial statements are free of material misstatement. An audit includes examining, on a test basis, evidence supporting the amounts and disclosures in the financial statements, assessing the accounting principles used and significant estimates made by management, and evaluating the overall financial statement presentation. We believe that our audits, which included confirmation of securities at June 30, 2014 by correspondence with the custodian and brokers, provide a reasonable basis for our opinion.
PricewaterhouseCoopers LLP
Kansas City, Missouri
August 21, 2014
Board of Directors
The individuals listed below serve as directors of the funds. Each director will continue to serve in this capacity until death, retirement, resignation or removal from office. The board has adopted a mandatory retirement age for directors who are not “interested persons,” as that term is defined in the Investment Company Act (independent directors). Independent directors shall retire on December 31 of the year in which they reach their 75th birthday; provided, however, that on or after January 1, 2022, independent directors shall retire on December 31 of the year in which they reach their 76th birthday.
Mr. Thomas is an “interested person” because he currently serves as President and Chief Executive Officer of American Century Companies, Inc. (ACC), the parent company of American Century Investment Management, Inc. (ACIM or the advisor). The other directors (more than three-fourths of the total number) are independent. They are not employees, directors or officers of, and have no financial interest in, ACC or any of its wholly owned, direct or indirect, subsidiaries, including ACIM, American Century Investment Services, Inc. (ACIS) and American Century Services, LLC (ACS), and do not have any other affiliations, positions or relationships that would cause them to be considered “interested persons” under the Investment Company Act. The directors serve in this capacity for eight (in the case of Mr. Thomas, 15) registered investment companies in the American Century Investments family of funds.
The following table presents additional information about the directors. The mailing address for each director other than Mr. Thomas is 1665 Charleston Road, Mountain View, California 94043. The mailing address for Mr. Thomas is 4500 Main Street, Kansas City, Missouri 64111.
|
| | | | | |
Name (Year of Birth) | Position(s) Held with Funds | Length of Time Served | Principal Occupation(s) During Past 5 Years | Number of
American
Century
Portfolios
Overseen
by Director | Other Directorships Held During Past 5 Years |
| Independent Directors |
Tanya S. Beder (1955) | Director | Since 2011 | Chairman, SBCC Group Inc. (independent advisory services) (2006 to present) | 42 | CYS Investments, Inc. (specialty finance company) |
Jeremy I. Bulow (1954) | Director | Since 2011 | Professor of Economics, Stanford University, Graduate School of Business (1979 to present) | 42 | None |
Ronald J. Gilson (1946) | Director and Chairman of the Board | Since 1995 (Chairman since 2005) | Charles J. Meyers Professor of Law and Business, Stanford Law School (1979 to present); Marc and Eva Stern Professor of Law and Business, Columbia University School of Law (1992 to present) | 42 | None |
|
| | | | | |
Name (Year of Birth) | Position(s) Held with Funds | Length of Time Served | Principal Occupation(s) During Past 5 Years | Number of
American
Century
Portfolios
Overseen
by Director | Other Directorships Held During Past 5 Years |
| Independent Directors |
Frederick L. A. Grauer (1946) | Director | Since 2008 | Senior Advisor, BlackRock, Inc. (investment management firm) (2010 to 2011); Senior Advisor, Barclays Global Investors (investment management firm) (2003 to 2009) | 42 | None |
Peter F. Pervere
(1947) | Director | Since 2007 | Retired | 42 | Intraware, Inc. (2003 to 2009) |
Myron S. Scholes(1) (1941) | Director | Since 1980 | Chairman, Platinum Grove Asset Management, L.P. (asset manager) (1999 to 2009); Frank E. Buck Professor of Finance-Emeritus, Stanford Graduate School of Business (1996 to present) | 42 | Dimensional Fund Advisors (investment advisor); CME Group, Inc. (futures and options exchange) |
John B. Shoven
(1947) | Director | Since 2002 | Professor of Economics, Stanford University (1973 to present) | 42 | Cadence Design Systems; Exponent; Financial Engines |
| Interested Director |
Jonathan S. Thomas
(1963) | Director and
President | Since 2007 | President and Chief Executive Officer, ACC (March 2007 to present). Also serves as Chief Executive Officer and Manager, ACS; Executive Vice President, ACIM; Director, ACC, ACIM and other ACC subsidiaries | 115 | None |
(1) Myron S. Scholes resigned as director effective July 31, 2014.
Officers
The following table presents certain information about the executive officers of the funds. Each officer serves as an officer for each of the 15 investment companies in the American Century family of funds, unless otherwise noted. No officer is compensated for his or her service as an officer of the funds. The listed officers are interested persons of the funds and are appointed or re-appointed on an annual basis. The mailing address for each of the officers listed below is 4500 Main Street, Kansas City, Missouri 64111.
|
| | |
Name (Year of Birth) | Offices with the Funds | Principal Occupation(s) During the Past Five Years |
Jonathan S. Thomas (1963) | Director and President since 2007 | President and Chief Executive Officer, ACC (March 2007 to present). Also serves as Chief Executive Officer and Manager, ACS; Executive Vice President, ACIM; Director, ACC, ACIM and other ACC subsidiaries |
| Amy D. Shelton (1964) | Chief Compliance Officer since 2014 | Chief Compliance Officer, American Century funds, (March 2014 to present); Chief Compliance Officer, ACIM (February 2014 to present); Chief Compliance Officer, ACIS (October 2009 to present); Vice President, Client Interactions and Marketing, ACIS (February 2013 to January 2014); Director, Client Interactions and Marketing, ACIS (June 2007 to January 2013). Also serves as Vice President, ACIS |
Charles A. Etherington (1957) | General Counsel since 2007 and Senior Vice President since 2006 | Attorney, ACC (February 1994 to present); Vice President, ACC (November 2005 to present); General Counsel, ACC (March 2007 to present). Also serves as General Counsel, ACIM, ACS, ACIS and other ACC subsidiaries; and Senior Vice President, ACIM and ACS |
C. Jean Wade (1964) | Vice President, Treasurer and Chief Financial Officer since 2012 | Vice President, ACS (February 2000 to present) |
Robert J. Leach (1966) | Vice President since 2006 and Assistant Treasurer since 2012 | Vice President, ACS (February 2000 to present) |
David H. Reinmiller (1963) | Vice President since 2001 | Attorney, ACC (January 1994 to present); Associate General Counsel, ACC (January 2001 to present). Also serves as Vice President, ACIM and ACS |
Ward D. Stauffer (1960) | Secretary since 2005 | Attorney, ACC (June 2003 to present) |
The Statement of Additional Information has additional information about the fund’s directors and is available without charge, upon request, by calling 1-800-345-2021.
|
|
| Approval of Management Agreement |
At a meeting held on June 13, 2014, the Fund’s Board of Directors/Trustees unanimously approved the renewal of the management agreement pursuant to which American Century Investment Management, Inc. (the “Advisor”) acts as the investment advisor for the Fund. Under Section 15(c) of the Investment Company Act, contracts for investment advisory services are required to be reviewed, evaluated, and approved by a majority of a fund’s directors/trustees (the “Directors”), including a majority of the independent Directors, each year. The Board regards this annual evaluation and renewal as one of its most important responsibilities.
The independent Directors have memorialized a statement regarding the relationship between their ongoing obligations to oversee and evaluate the performance of the Advisor and their annual consideration of renewal of the management agreement. In that statement, the independent Directors noted that their assessment of the Advisor’s performance is an ongoing process that takes place over the entire year and is informed by all of the extensive information that the Board and its committees receive and consider over time. This information, together with the materials provided in connection with the review, are central to the Board’s assessment of the Advisor’s performance and its determination whether to renew the Fund’s management agreement.
Prior to its consideration of the renewal of the management agreement, the Board requested and reviewed extensive data and analysis relating to the proposed renewal. This information and analysis was compiled by the Advisor and certain independent providers of evaluation data concerning the Fund and the services provided to the Fund by the Advisor.
In connection with its consideration of the renewal of the management agreement, the Board’s review and evaluation of the services provided by the Advisor included, but was not limited to, the following:
| |
| • | the nature, extent, and quality of investment management, shareholder services, and other services provided by the Advisor to the Fund; |
| |
| • | the wide range of other programs and services the Advisor provides to the Fund and its shareholders on a routine and non-routine basis; |
| |
| • | the investment performance of the Fund, including data comparing the Fund’s performance to appropriate benchmarks and/or a peer group of other mutual funds with similar investment objectives and strategies; |
| |
| • | the cost of owning the Fund compared to the cost of owning similar funds; |
| |
| • | the Advisor’s compliance policies, procedures, and regulatory experience; |
| |
| • | financial data showing the cost of services provided to the Fund, the profitability of the Fund to the Advisor, and the overall profitability of the Advisor; |
| |
| • | possible economies of scale associated with the Advisor’s management of the Fund and other accounts under its management; |
| |
| • | data comparing services provided and charges to other investment management clients of the Advisor; and |
| |
| • | any collateral benefits derived by the Advisor from the management of the Fund. |
In keeping with its practice, the Board held two in-person meetings to review and discuss the information provided. The independent Directors also had the benefit of the advice of their independent counsel throughout the process.
Factors Considered
The Directors considered all of the information provided by the Advisor, the independent data providers, and the independent Directors’ independent counsel in connection with the review, and evaluated such information for the Fund. In connection with their review, the Directors did not identify any single factor as being all-important or controlling and each Director may have attributed
different levels of importance to different factors. In deciding to renew the management agreement, the Board based its decision on a number of factors, including the following:
Nature, Extent and Quality of Services — Generally. Under the management agreement, the Advisor is responsible for providing or arranging for all services necessary for the operation of the Fund. The Board noted that under the management agreement, the Advisor provides or arranges at its own expense a wide variety of services including:
| |
| • | constructing and designing the Fund |
| |
| • | portfolio research and security selection |
| |
| • | initial capitalization/funding |
| |
| • | daily valuation of the Fund’s portfolio |
| |
| • | shareholder servicing and transfer agency, including shareholder confirmations, recordkeeping, and communications |
| |
| • | regulatory and portfolio compliance |
| |
| • | marketing and distribution |
The Board noted that many of these services have expanded over time both in terms of quantity and complexity in response to shareholder demands, competition in the industry, changing distribution channels, and the changing regulatory environment.
Investment Management Services. The nature of the investment management services provided to the Fund is quite complex and allows Fund shareholders access to professional money management, instant diversification of their investments within an asset class, the opportunity to easily diversify among asset classes by investing in or exchanging among various American Century Investments funds, and liquidity. In evaluating investment performance, the Board expects the Advisor to manage the Fund in accordance with its investment objectives and approved strategies. Further, the Directors recognize that the Advisor has an obligation to seek the best execution of fund trades. In providing these services, the Advisor utilizes teams of investment professionals (portfolio managers, analysts, research assistants, and securities traders) who require extensive information technology, research, training, compliance and other systems to conduct their business. The Board, directly and through its Portfolio Committee, regularly reviews investment performance information for the Fund, together with comparative information for appropriate benchmarks and/or peer groups of similarly-managed funds, over different time horizons. The Directors also review detailed performance information during the management agreement approval process. If performance concerns are identified, the Fund receives special reviews until performance improves, during which the Board discusses with the Advisor the reasons for such results (e.g., market conditions, security selection) and any efforts being undertaken to improve performance. The Fund’s performance was above its benchmark for the one-, three-, five-, and ten-year periods reviewed by the Board. The Board found the investment management services provided by the Advisor to the Fund to be satisfactory and consistent with the management agreement.
Shareholder and Other Services. Under the management agreement, the Advisor provides the Fund with a comprehensive package of transfer agency, shareholder, and other services. The Board, directly and through various committees of the Board, regularly reviews reports and evaluations of such services at its regular meetings. These reports include, but are not limited to, information regarding the operational efficiency and accuracy of the shareholder and transfer agency services provided, staffing levels, shareholder satisfaction (as measured by external as well as internal sources), technology support, new products and services offered to Fund shareholders, securities trading activities, portfolio valuation services, auditing services, and legal and operational compliance activities. Certain aspects of shareholder and transfer agency service level efficiency
and the quality of securities trading activities are measured by independent third party providers and are presented in comparison to other fund groups not managed by the Advisor. The Board found the services provided by the Advisor to the Fund under the management agreement to be competitive and of high quality.
Costs of Services and Profitability. The Advisor provides detailed information concerning its cost of providing various services to the Fund, its profitability in managing the Fund, its overall profitability, and its financial condition. The Directors have reviewed with the Advisor the methodology used to prepare this financial information. The financial information regarding the Advisor is considered in evaluating the Advisor’s financial condition, its ability to continue to provide services under the management agreement, and the reasonableness of the current management fee. The Board concluded that the Advisor’s profits were reasonable in light of the services provided to the Fund.
Ethics. The Board generally considers the Advisor’s commitment to providing quality services to shareholders and to conducting its business ethically. They noted that the Advisor’s practices generally meet or exceed industry best practices.
Economies of Scale. The Board also reviewed information provided by the Advisor regarding the possible existence of economies of scale in connection with the management of the Fund. The Board concluded that economies of scale are difficult to measure and predict with precision, especially on a fund-by-fund basis. The Board concluded that the Advisor is appropriately sharing economies of scale through its competitive fee structure, offering competitive fees from fund inception, and through reinvestment in its business to provide shareholders additional content and services.
Comparison to Other Funds’ Fees. The management agreement provides that the Fund pays the Advisor a single, all-inclusive (or unified) management fee for providing all services necessary for the management and operation of the Fund, other than brokerage expenses, taxes, interest, extraordinary expenses, and the fees and expenses of the Fund’s independent directors (including their independent legal counsel) and expenses incurred in connection with the provision of shareholder services and distribution services under a plan adopted pursuant to Rule 12b-1 under the 1940 Act. Under the unified fee structure, the Advisor is responsible for providing all investment advisory, custody, audit, administrative, compliance, recordkeeping, marketing and shareholder services, or arranging and supervising third parties to provide such services. By contrast, most other funds are charged a variety of fees, including an investment advisory fee, a transfer agency fee, an administrative fee, distribution charges and other expenses. Other than their investment advisory fees and any applicable Rule 12b-1 distribution fees, all other components of the total fees charged by these other funds may be increased without shareholder approval. The Board believes the unified fee structure is a benefit to Fund shareholders because it clearly discloses to shareholders the cost of owning Fund shares, and, since the unified fee cannot be increased without a vote of Fund shareholders, it shifts to the Advisor the risk of increased costs of operating the Fund and provides a direct incentive to minimize administrative inefficiencies. Part of the Board’s analysis of fee levels involves reviewing certain evaluative data compiled by an independent provider and comparing the Fund’s unified fee to the total expense ratio of other funds in the Fund’s peer group. The unified fee charged to shareholders of the Fund was below the median of the total expense ratios of the Fund’s peer group. The Board concluded that the management fee paid by the Fund to the Advisor under the management agreement is reasonable in light of the services provided to the Fund.
Comparison to Fees and Services Provided to Other Clients of the Advisor. The Board also requested and received information from the Advisor concerning the nature of the services, fees, costs and profitability of its advisory services to advisory clients other than the Fund. They observed that these varying types of client accounts require different services and involve different regulatory and entrepreneurial risks than the management of the Fund. The Board analyzed this information and concluded that the fees charged and services provided to the Fund were reasonable by comparison.
Collateral or “Fall-Out” Benefits Derived by the Advisor. The Board considered the existence of collateral benefits the Advisor may receive as a result of its relationship with the Fund. They concluded that the Advisor’s primary business is managing mutual funds and it generally does not use fund or shareholder information to generate profits in other lines of business, and therefore does not derive any significant collateral benefits from them. The Board noted that the Advisor receives proprietary research from broker-dealers that execute fund portfolio transactions and concluded that this research is likely to benefit Fund shareholders. The Board also determined that the Advisor is able to provide investment management services to certain clients other than the Fund, at least in part, due to its existing infrastructure built to serve the fund complex. The Board concluded, however, that the assets of those other clients are not material to the analysis and, where applicable, may be included with the assets of the Fund to determine breakpoints in the management fee schedule.
Existing Relationship. The Board also considered whether there was any reason for not continuing the existing arrangement with the Advisor. In this regard, the Board was mindful of the potential disruptions of the Fund’s operations and various risks, uncertainties, and other effects that could occur as a result of a decision not to continue such relationship. In particular, the Board recognized that most shareholders have invested in the Fund on the strength of the Advisor’s industry standing and reputation and in the expectation that the Advisor will have a continuing role in providing advisory services to the Fund.
Conclusion of the Directors. As a result of this process, the Board, including all of the independent Directors and assisted by the advice of independent legal counsel, taking into account all of the factors discussed above and the information provided by the Advisor and others, concluded that the management agreement between the Fund and the Advisor is fair and reasonable in light of the services provided and should be renewed.
Retirement Account Information
As required by law, distributions you receive from certain IRAs are subject to federal income tax withholding, unless you elect not to have withholding apply. Tax will be withheld on the total amount withdrawn even though you may be receiving amounts that are not subject to withholding, such as nondeductible contributions. In such case, excess amounts of withholding could occur. You may adjust your withholding election so that a greater or lesser amount will be withheld.
If you don’t want us to withhold on this amount, you must notify us to not withhold the federal income tax. You may notify us in writing or in certain situations by telephone or through other electronic means. For systematic withdrawals, your withholding election will remain in effect until revoked or changed by filing a new election. You have the right to revoke your election at any time.
Remember, even if you elect not to have income tax withheld, you are liable for paying income tax on the taxable portion of your withdrawal. If you elect not to have income tax withheld or you don’t have enough income tax withheld, you may be responsible for payment of estimated tax. You may incur penalties under the estimated tax rules if your withholding and estimated tax payments are not sufficient. You can reduce or defer the income tax on a distribution by directly or indirectly rolling such distribution over to another IRA or eligible plan. You should consult your tax advisor for additional information.
State tax will be withheld if, at the time of your distribution, your address is within one of the mandatory withholding states and you have federal income tax withheld (or as otherwise required by state law). State taxes will be withheld from your distribution in accordance with the respective state rules.
Distributions you receive from 403(b), 457 and qualified plans are subject to special tax and withholding rules. Your plan administrator or plan sponsor is required to provide you with a special tax notice explaining those rules at the time you request a distribution. If applicable, federal and/or state taxes may be withheld from your distribution amount.
Proxy Voting Policies
Descriptions of the principles and policies that the fund's investment advisor uses in exercising the voting rights associated with the securities purchased and/or held by the fund are available without charge, upon request, by calling 1-800-345-2021 or visiting the "About Us" page of American Century Investments’ website at americancentury.com. A description of the policies is also available on the Securities and Exchange Commission’s website at sec.gov. Information regarding how the investment advisor voted proxies relating to portfolio securities during the most recent 12-month period ended June 30 is available on the "About Us" page at americancentury.com. It is also available at sec.gov.
Quarterly Portfolio Disclosure
The fund files its complete schedule of portfolio holdings with the Securities and Exchange Commission (SEC) for the first and third quarters of each fiscal year on Form N-Q. The fund’s Forms N-Q are available on the SEC’s website at sec.gov, and may be reviewed and copied at the SEC’s Public Reference Room in Washington, DC. Information on the operation of the Public Reference Room may be obtained by calling 1-800-SEC-0330. The fund also makes its complete schedule of portfolio holdings for the most recent quarter of its fiscal year available on its website at americancentury.com and, upon request, by calling 1-800-345-2021.
Other Tax Information
The following information is provided pursuant to provisions of the Internal Revenue Code.
For the fiscal year ended June 30, 2014, the fund intends to pass through to shareholders $626,869, or up to the maximum amount allowable, as a foreign tax credit which represents taxes paid on income derived from sources within foreign countries or possessions of the United States. During the fiscal year ended June 30, 2014, the fund earned $4,544,377 from income derived from foreign sources. Foreign source income and foreign tax expense per outstanding share on June 30, 2014 are $0.1017 and $0.0140, respectively.
|
| | |
| |
| | | |
| Contact Us | americancentury.com | |
| Automated Information Line | 1-800-345-8765 | |
| Investor Services Representative | 1-800-345-2021
or 816-531-5575 | |
| Investors Using Advisors | 1-800-378-9878 | |
Business, Not-For-Profit, Employer-Sponsored
Retirement Plans | 1-800-345-3533 | |
Banks and Trust Companies, Broker-Dealers,
Financial Professionals, Insurance Companies | 1-800-345-6488 | |
| Telecommunications Relay Service for the Deaf | 711 | |
| | | |
| American Century Quantitative Equity Funds, Inc. | |
| | | |
Investment Advisor: American Century Investment Management, Inc. Kansas City, Missouri | |
| | | |
| This report and the statements it contains are submitted for the general information of our shareholders. The report is not authorized for distribution to prospective investors unless preceded or accompanied by an effective prospectus. | |
| | | |
©2014 American Century Proprietary Holdings, Inc. All rights reserved.
CL-ANN-82884 1408 | |
|
| |
ANNUAL REPORT | JUNE 30, 2014 |
Income & Growth Fund
|
| |
| President's Letter | |
| Performance | |
| Portfolio Commentary | |
| Fund Characteristics | |
| Shareholder Fee Example | |
| Schedule of Investments | |
| Statement of Assets and Liabilities | |
| Statement of Operations | |
| Statement of Changes in Net Assets | |
| Notes to Financial Statements | |
| Financial Highlights | |
| Report of Independent Registered Public Accounting Firm | |
| Management | |
| Approval of Management Agreement | |
| Additional Information | |
Any opinions expressed in this report reflect those of the author as of the date of the report, and do not necessarily represent the opinions of American Century Investments® or any other person in the American Century Investments organization. Any such opinions are subject to change at any time based upon market or other conditions and American Century Investments disclaims any responsibility to update such opinions. These opinions may not be relied upon as investment advice and, because investment decisions made by American Century Investments funds are based on numerous factors, may not be relied upon as an indication of trading intent on behalf of any American Century Investments fund. Security examples are used for representational purposes only and are not intended as recommendations to purchase or sell securities. Performance information for comparative indices and securities is provided to American Century Investments by third party vendors. To the best of American Century Investments’ knowledge, such information is accurate at the time of printing.
|
| |
| Dear Investor:
Thank you for reviewing this annual report for the 12 months ended June 30, 2014. It provides investment performance and portfolio information for the reporting period, plus longer-term historical performance data.
Annual reports remain important vehicles for conveying information about fund returns, including market and economic factors that affected performance during the reporting period. For additional, updated investment and market insights, we encourage you to visit our website, americancentury.com.
|
| Jonathan Thomas |
Aggressive Monetary Policies Boosted Stock and Bond Returns
Stimulative monetary policies and expectations of economic improvement, interspersed with concerns about weaker-than-expected economic data and geopolitical conflicts, helped drive financial market returns during the reporting period. We believe the combination of longer-term optimism about global economic growth, low costs of capital, and central bank purchases of fixed income securities helped persuade investors to seek risk and yield, especially in the U.S. and Europe. Stock index returns were strong in these markets, particularly at the smaller capitalization end of the company size spectrum. The MSCI Europe and S&P 500® indices advanced 29.28% and 24.61%, respectively.
Remarkably, for a period in which stock market performance was so strong, government bond performance was also generally positive. Not surprisingly, U.S. corporate high-yield bonds posted double-digit returns, but the 30-year U.S. Treasury bond also outperformed most broader bond market measures. In addition, a generally weaker U.S. dollar during the reporting period meant that international bond returns for U.S. investors with currency exposure were generally higher than U.S. bonds returns. The Barclays Global Aggregate Bond and Barclays U.S. Aggregate Bond indices returned 7.39% and 4.37%, respectively.
Looking ahead, we see signs of sustained moderate economic growth in the second half of 2014, but headwinds persist. In the U.S., which was supposed to be an economic growth leader this year, housing market momentum has slowed, interest rates could rise, and economic growth and U.S. employment levels remain subpar compared with past post-recession periods. In this environment, we continue to believe in a disciplined, diversified, long-term investment approach, using professionally managed stock and bond portfolios—as appropriate—for meeting financial goals. We appreciate your continued trust in us.
Sincerely,
Jonathan Thomas
President and Chief Executive Officer
American Century Investments
|
| | | | | | |
| Total Returns as of June 30, 2014 |
| | | | Average Annual Returns | |
| | Ticker Symbol | 1 year | 5 years | 10 years | Since Inception | Inception Date |
| Investor Class | BIGRX | 24.66% | 18.54% | 7.13% | 10.43% | 12/17/90 |
| S&P 500 Index | — | 24.61% | 18.82% | 7.78% | 10.16% | — |
| Institutional Class | AMGIX | 24.89% | 18.77% | 7.34% | 6.43% | 1/28/98 |
A Class(1) | AMADX | | | | | 12/15/97 |
| No sales charge* | | 24.34% | 18.25% | 6.86% | 5.99% | |
| With sales charge* | | 17.21% | 16.85% | 6.23% | 5.61% | |
| C Class | ACGCX | 23.42% | 17.36% | 6.06% | 4.76% | 6/28/01 |
| R Class | AICRX | 24.05% | 17.94% | 6.60% | 7.68% | 8/29/03 |
| |
| * | Sales charges include initial sales charges and contingent deferred sales charges (CDSCs), as applicable. A Class shares have a 5.75% maximum initial sales charge and may be subject to a maximum CDSC of 1.00%. C Class shares redeemed within 12 months of purchase are subject to a maximum CDSC of 1.00%. The SEC requires that mutual funds provide performance information net of maximum sales charges in all cases where charges could be applied. |
| |
| (1) | Prior to September 4, 2007, the A Class was referred to as the Advisor Class and did not have a front-end sales charge. Performance has been adjusted to reflect this charge. |
Data presented reflect past performance. Past performance is no guarantee of future results. Current performance may be higher or lower than the performance shown. Investment return and principal value will fluctuate, and redemption value may be more or less than original cost. To obtain performance data current to the most recent month end, please call 1-800-345-2021 or visit americancentury.com.
Unless otherwise indicated, performance reflects Investor Class shares; performance for other share classes will vary due to differences in fee structure. For information about other share classes available, please consult the prospectus. Data assumes reinvestment of dividends and capital gains, and none of the charts reflect the deduction of taxes that a shareholder would pay on fund distributions or the redemption of fund shares. Returns for the index are provided for comparison. The fund’s total returns include operating expenses (such as transaction costs and management fees) that reduce returns, while the total returns of the index do not.
|
|
| Growth of $10,000 Over 10 Years |
| $10,000 investment made June 30, 2004 |
|
| |
| Value on June 30, 2014 |
| | Investor Class — $19,914 |
| |
| | S&P 500 Index — $21,159 |
| |
|
| | | | |
| Total Annual Fund Operating Expenses |
| Investor Class | Institutional Class | A Class | C Class | R Class |
| 0.68% | 0.48% | 0.93% | 1.68% | 1.18% |
The total annual fund operating expenses shown is as stated in the fund’s prospectus current as of the date of this report. The prospectus may vary from the expense ratio shown elsewhere in this report because it is based on a different time period, includes acquired fund fees and expenses, and, if applicable, does not include fee waivers or expense reimbursements.
Data presented reflect past performance. Past performance is no guarantee of future results. Current performance may be higher or lower than the performance shown. Investment return and principal value will fluctuate, and redemption value may be more or less than original cost. To obtain performance data current to the most recent month end, please call 1-800-345-2021 or visit americancentury.com.
Unless otherwise indicated, performance reflects Investor Class shares; performance for other share classes will vary due to differences in fee structure. For information about other share classes available, please consult the prospectus. Data assumes reinvestment of dividends and capital gains, and none of the charts reflect the deduction of taxes that a shareholder would pay on fund distributions or the redemption of fund shares. Returns for the index are provided for comparison. The fund’s total returns include operating expenses (such as transaction costs and management fees) that reduce returns, while the total returns of the index do not.
Portfolio Managers: Brian Garbe and Claudia Musat
Performance Summary
Income & Growth returned 24.66%* for the fiscal year ended June 30, 2014, compared with the 24.61% return of its benchmark, the S&P 500 Index.
As U.S. equity markets continued their robust appreciation, Income & Growth posted a solid gain for the 12-month period, slightly outperforming the S&P 500 Index. As an added benefit, the fund targets companies with strong current income potential and thus produced higher levels of dividend income versus the index.
Income & Growth’s stock selection process incorporates factors of valuation, quality, growth, and momentum (sentiment) with a value tilt, while striving to minimize unintended risks along industries and other risk characteristics. Valuation factors were largely ignored in the markets as investors rewarded growth stocks, particularly during the first half of the period. Within the fund, security selection was the primary driver of returns, with industrials and consumer staples holdings providing the majority of contribution. Consumer discretionary holdings detracted from the fund’s results.
Industrials and Consumer Staples Outperformed
The industrials and consumer staples sectors were among the leading contributors to the fund’s returns relative to the S&P 500. Industrials sector outperformance was primarily due to successful stock selection as well as an overweight, relative to the index, to the strongly appreciating aerospace and defense industry. A number of defense contractors were key contributors including Lockheed Martin, which displays strength across measures of quality, growth, and valuation, and is above average on sentiment factors. Raytheon and General Dynamics were also strong performers, benefiting from an overall pickup in activity amid an improving economic landscape. The commercial services industry bolstered fund results, especially mail and shipping equipment company Pitney Bowes, which delivered solid earnings as it continued its transformation from an “old economy” stamps and mailing business to becoming a market leader in big data analysis. The company’s strong profile across valuation, quality, and growth factors make it particularly attractive. Industrial automation giant Rockwell Automation also aided relative gains. The company appears particularly attractive across growth and sentiment measures, and is above average on quality- and valuation-based insights.
Stock choices in the consumer staples sector also helped returns. Security selection among food retailers was strongly additive, driving that sector's substantial outperformance relative to the index. Among the top sector contributors was supermarket chain store operator Safeway, which appreciated on speculation of being acquired by private equity firm Cerberus Capital Management, owner of the Albertson’s chain of grocery stores. Following its appreciation, we took profits and exited the position. Other key contributors included an underweight position to tobacco manufacturer Philip Morris, which is weak across measures of sentiment, quality and growth.
* All fund returns referenced in this commentary are for Investor Class shares. Performance for other share classes will vary due to differences in fee structure; when Investor Class performance exceeds that of the fund's benchmark, other share classes may not. See page 3 for returns for all share classes.
Elsewhere in the portfolio, strong individual contributions came from several information technology holdings, including a portfolio-only position in printing and imaging device manufacturer Lexmark International, which rallied on increased demand for laser and multifunction peripheral printers and on increasing revenues from its newer business lines. Personal technology giant Apple likewise outperformed thanks to better-than-expected sales of the iPhone and in anticipation of a new product cycle.
Consumer Discretionary Was Leading Detractor
Security selection in the consumer discretionary sector was the principal detractor from the fund’s 12-month results. A number of specialty retailers declined during the period including office products superstore Staples, which was down nearly 30% on disappointing revenues and profits and an announcement of 225 store closings. Despite these difficulties, the company remains very strong on valuation measures and is appealing across quality and sentiment. Multiline retailer Target lagged in the wake of news about a security breach in its credit card payment system, as well as greater-than-expected cost increases associated with expansion. A portfolio-only position in apparel retailer American Eagle Outfitters was also detrimental following the holding’s decline on lower-than-expected sales early in the period. Elsewhere in the sector, casino game equipment maker International Game Technology fell on disappointing earnings stemming from declining slot machine sales. We ultimately sold the fund’s positions in Target, American Eagle Outfitters, and International Game Technology.
Elsewhere in the portfolio, an underweight position to Schlumberger, a provider of technology solutions and project management to the oil and gas industry, hurt results as the company reached a record high following stronger-than-expected profit guidance. Likewise, not owning biopharmaceutical company Gilead Sciences negatively impacted fund returns as strong sales of its Sovaldi Hepatitis C treatment propelled the stock higher.
A Look Ahead
Economic recovery in the U.S. appears to be progressing, albeit at a slower pace than during prior post-recessionary periods, and is expected to stay the course through the remainder of 2014. Recent indicators such as improvements in small business and consumer confidence point to a sustainable rebound, and economic growth is likely to further benefit from the recovering labor and housing markets. Though a continuation of political instability in non-U.S. markets as well as the potential for rising inflation and interest rates could lead to heightened market volatility, our disciplined, objective, and systematic investment strategy is designed to take advantage of opportunities at the individual company level. We believe this approach is the most powerful way to capitalize on market inefficiencies that lead to the mispricing of individual stocks. Our strategy is designed to provide broad U.S. equity market exposure with strong current income and exceptional risk management. Currently, the fund’s most significant sector overweight positions are in information technology and industrials while financials and consumer discretionary represent the greatest sector underweights.
|
| |
| JUNE 30, 2014 |
| Top Ten Holdings | % of net assets |
| Apple, Inc. | 4.1% |
| Microsoft Corp. | 2.6% |
| Johnson & Johnson | 2.4% |
| JPMorgan Chase & Co. | 2.0% |
| Verizon Communications, Inc. | 1.9% |
| Pfizer, Inc. | 1.8% |
| AT&T, Inc. | 1.8% |
| Merck & Co., Inc. | 1.8% |
| Intel Corp. | 1.8% |
| Exxon Mobil Corp. | 1.7% |
| | |
| Top Five Industries | % of net assets |
| Pharmaceuticals | 8.5% |
| Technology Hardware, Storage and Peripherals | 6.8% |
| Oil, Gas and Consumable Fuels | 6.1% |
| Software | 5.0% |
| Diversified Telecommunication Services | 4.5% |
| | |
| Types of Investments in Portfolio | % of net assets |
| Common Stocks | 98.7% |
| Temporary Cash Investments | 1.3% |
| Other Assets and Liabilities | —* |
*Category is less than 0.05% of total net assets.
Fund shareholders may incur two types of costs: (1) transaction costs, including sales charges (loads) on purchase payments and redemption/exchange fees; and (2) ongoing costs, including management fees; distribution and service (12b-1) fees; and other fund expenses. This example is intended to help you understand your ongoing costs (in dollars) of investing in your fund and to compare these costs with the ongoing cost of investing in other mutual funds.
The example is based on an investment of $1,000 made at the beginning of the period and held for the entire period from January 1, 2014 to June 30, 2014.
Actual Expenses
The table provides information about actual account values and actual expenses for each class. You may use the information, together with the amount you invested, to estimate the expenses that you paid over the period. First, identify the share class you own. Then simply divide your account value by $1,000 (for example, an $8,600 account value divided by $1,000 = 8.6), then multiply the result by the number under the heading “Expenses Paid During Period” to estimate the expenses you paid on your account during this period.
If you hold Investor Class shares of any American Century Investments fund, or Institutional Class shares of the American Century Diversified Bond Fund, in an American Century Investments account (i.e., not a financial intermediary or retirement plan account), American Century Investments may charge you a $12.50 semiannual account maintenance fee if the value of those shares is less than $10,000. We will redeem shares automatically in one of your accounts to pay the $12.50 fee. In determining your total eligible investment amount, we will include your investments in all personal accounts (including American Century Investments Brokerage accounts) registered under your Social Security number. Personal accounts include individual accounts, joint accounts, UGMA/UTMA accounts, personal trusts, Coverdell Education Savings Accounts and IRAs (including traditional, Roth, Rollover, SEP-, SARSEP- and SIMPLE-IRAs), and certain other retirement accounts. If you have only business, business retirement, employer-sponsored or American Century Investments Brokerage accounts, you are currently not subject to this fee. If you are subject to the Account Maintenance Fee, your account value could be reduced by the fee amount.
Hypothetical Example for Comparison Purposes
The table also provides information about hypothetical account values and hypothetical expenses based on the actual expense ratio of each class of your fund and an assumed rate of return of 5% per year before expenses, which is not the actual return of a fund’s share class. The hypothetical account values and expenses may not be used to estimate the actual ending account balance or expenses you paid for the period. You may use this information to compare the ongoing costs of investing in your fund and other funds. To do so, compare this 5% hypothetical example with the 5% hypothetical examples that appear in the shareholder reports of the other funds.
Please note that the expenses shown in the table are meant to highlight your ongoing costs only and do not reflect any transactional costs, such as sales charges (loads) or redemption/exchange fees. Therefore, the table is useful in comparing ongoing costs only, and will not help you determine the relative total costs of owning different funds. In addition, if these transactional costs were included, your costs would have been higher.
|
| | | | |
| | Beginning
Account Value
1/1/14 | Ending Account Value
6/30/14 | Expenses Paid
During Period(1)1/1/14 – 6/30/14 | Annualized
Expense Ratio(1) |
| Actual | | | | |
| Investor Class | $1,000 | $1,072.60 | $3.44 | 0.67% |
| Institutional Class | $1,000 | $1,073.40 | $2.42 | 0.47% |
| A Class | $1,000 | $1,071.20 | $4.72 | 0.92% |
| C Class | $1,000 | $1,067.10 | $8.56 | 1.67% |
| R Class | $1,000 | $1,069.90 | $6.00 | 1.17% |
| Hypothetical | | | | |
| Investor Class | $1,000 | $1,021.47 | $3.36 | 0.67% |
| Institutional Class | $1,000 | $1,022.46 | $2.36 | 0.47% |
| A Class | $1,000 | $1,020.23 | $4.61 | 0.92% |
| C Class | $1,000 | $1,016.51 | $8.35 | 1.67% |
| R Class | $1,000 | $1,018.99 | $5.86 | 1.17% |
| |
| (1) | Expenses are equal to the class’s annualized expense ratio listed in the table above, multiplied by the average account value over the period, multiplied by 181, the number of days in the most recent fiscal half-year, divided by 365, to reflect the one-half year period. |
JUNE 30, 2014
|
| | | | |
| | Shares | Value |
| COMMON STOCKS — 98.7% | | |
| AEROSPACE AND DEFENSE — 4.2% | | |
| Boeing Co. (The) | 192,160 | $ | 24,448,517 |
|
| General Dynamics Corp. | 30,320 | 3,533,796 |
|
| Honeywell International, Inc. | 166,585 | 15,484,076 |
|
| Lockheed Martin Corp. | 133,078 | 21,389,627 |
|
| Northrop Grumman Corp. | 15,969 | 1,910,371 |
|
| Raytheon Co. | 203,574 | 18,779,701 |
|
| | | 85,546,088 |
|
| AIR FREIGHT AND LOGISTICS — 1.2% | | |
| United Parcel Service, Inc., Class B | 234,601 | 24,084,139 |
|
| AUTO COMPONENTS — 1.5% | | |
| Gentex Corp. | 220,244 | 6,406,898 |
|
| Johnson Controls, Inc. | 164,038 | 8,190,417 |
|
| Magna International, Inc. | 152,854 | 16,470,019 |
|
| | | 31,067,334 |
|
| BANKS — 3.4% | | |
| Bank of America Corp. | 295,946 | 4,548,690 |
|
| Citigroup, Inc. | 30,434 | 1,433,441 |
|
| JPMorgan Chase & Co. | 716,182 | 41,266,407 |
|
| Wells Fargo & Co. | 432,667 | 22,740,978 |
|
| | | 69,989,516 |
|
| BEVERAGES — 1.0% | | |
| Coca-Cola Co. (The) | 58,026 | 2,457,981 |
|
| Dr Pepper Snapple Group, Inc. | 305,281 | 17,883,361 |
|
| PepsiCo, Inc. | 9,659 | 862,935 |
|
| | | 21,204,277 |
|
| BIOTECHNOLOGY — 1.4% | | |
| Amgen, Inc. | 233,272 | 27,612,407 |
|
| CAPITAL MARKETS — 1.8% | | |
| Janus Capital Group, Inc. | 1,315,293 | 16,414,856 |
|
| Morgan Stanley | 319,721 | 10,336,580 |
|
| T. Rowe Price Group, Inc. | 111,168 | 9,383,691 |
|
| | | 36,135,127 |
|
| CHEMICALS — 2.3% | | |
| Dow Chemical Co. (The) | 423,793 | 21,808,388 |
|
| E.I. du Pont de Nemours & Co. | 379,433 | 24,830,096 |
|
| Potash Corp. of Saskatchewan, Inc. | 26,363 | 1,000,739 |
|
| | | 47,639,223 |
|
|
| | | | |
| | Shares | Value |
| COMMERCIAL SERVICES AND SUPPLIES — 1.1% | | |
| Pitney Bowes, Inc. | 547,561 | $ | 15,123,635 |
|
| Steelcase, Inc., Class A | 513,268 | 7,765,745 |
|
| | | 22,889,380 |
|
| COMMUNICATIONS EQUIPMENT — 3.4% | | |
| Cisco Systems, Inc. | 1,284,824 | 31,927,876 |
|
| Harris Corp. | 85,586 | 6,483,140 |
|
| QUALCOMM, Inc. | 390,487 | 30,926,570 |
|
| | | 69,337,586 |
|
| CONTAINERS AND PACKAGING — 0.8% | | |
| Sonoco Products Co. | 364,703 | 16,021,403 |
|
| DIVERSIFIED FINANCIAL SERVICES — 0.5% | | |
Berkshire Hathaway, Inc., Class B(1) | 85,040 | 10,762,662 |
|
| DIVERSIFIED TELECOMMUNICATION SERVICES — 4.5% | | |
| AT&T, Inc. | 1,055,140 | 37,309,750 |
|
| BCE, Inc. | 344,805 | 15,640,355 |
|
| Verizon Communications, Inc. | 809,172 | 39,592,786 |
|
| | | 92,542,891 |
|
| ELECTRIC UTILITIES — 0.9% | | |
| Entergy Corp. | 216,420 | 17,765,918 |
|
| ELECTRICAL EQUIPMENT — 2.0% | | |
| Emerson Electric Co. | 306,820 | 20,360,575 |
|
| Rockwell Automation, Inc. | 160,758 | 20,120,471 |
|
| | | 40,481,046 |
|
| ELECTRONIC EQUIPMENT, INSTRUMENTS AND COMPONENTS — 0.9% | |
| Corning, Inc. | 865,303 | 18,993,401 |
|
| ENERGY EQUIPMENT AND SERVICES — 2.9% | | |
| Baker Hughes, Inc. | 68,294 | 5,084,488 |
|
| Ensco plc, Class A | 321,652 | 17,874,202 |
|
| National Oilwell Varco, Inc. | 76,261 | 6,280,093 |
|
| Noble Corp. plc | 514,652 | 17,271,721 |
|
| Schlumberger Ltd. | 101,688 | 11,994,100 |
|
| | | 58,504,604 |
|
| FOOD AND STAPLES RETAILING — 0.9% | | |
| Sysco Corp. | 475,458 | 17,805,902 |
|
| FOOD PRODUCTS — 1.8% | | |
| Archer-Daniels-Midland Co. | 431,561 | 19,036,156 |
|
| Kellogg Co. | 266,719 | 17,523,438 |
|
| | | 36,559,594 |
|
| HEALTH CARE EQUIPMENT AND SUPPLIES — 4.5% | | |
| Becton Dickinson and Co. | 151,210 | 17,888,143 |
|
| Covidien plc | 146,063 | 13,171,961 |
|
| Medtronic, Inc. | 401,222 | 25,581,915 |
|
| St. Jude Medical, Inc. | 285,198 | 19,749,962 |
|
|
| | | | |
| | Shares | Value |
| Stryker Corp. | 185,313 | $ | 15,625,592 |
|
| | | 92,017,573 |
|
| HEALTH CARE PROVIDERS AND SERVICES — 0.9% | | |
| Cardinal Health, Inc. | 259,100 | 17,763,896 |
|
| HOTELS, RESTAURANTS AND LEISURE — 0.8% | | |
| Las Vegas Sands Corp. | 199,366 | 15,195,676 |
|
| HOUSEHOLD DURABLES — 1.6% | | |
| Garmin Ltd. | 346,463 | 21,099,597 |
|
| Newell Rubbermaid, Inc. | 391,581 | 12,135,095 |
|
| | | 33,234,692 |
|
| HOUSEHOLD PRODUCTS — 1.7% | | |
| Energizer Holdings, Inc. | 30,137 | 3,677,618 |
|
| Kimberly-Clark Corp. | 182,043 | 20,246,823 |
|
| Procter & Gamble Co. (The) | 123,543 | 9,709,244 |
|
| | | 33,633,685 |
|
| INDUSTRIAL CONGLOMERATES — 2.1% | | |
| 3M Co. | 186,482 | 26,711,682 |
|
| General Electric Co. | 607,498 | 15,965,047 |
|
| | | 42,676,729 |
|
| INSURANCE — 3.2% | | |
| Aflac, Inc. | 156,288 | 9,728,928 |
|
| Allstate Corp. (The) | 306,475 | 17,996,212 |
|
| American International Group, Inc. | 163,553 | 8,926,723 |
|
| MetLife, Inc. | 245,596 | 13,645,314 |
|
| Old Republic International Corp. | 925,767 | 15,312,186 |
|
| | | 65,609,363 |
|
| INTERNET SOFTWARE AND SERVICES — 1.0% | | |
Google, Inc., Class A(1) | 16,854 | 9,854,028 |
|
Google, Inc., Class C(1) | 16,854 | 9,695,769 |
|
| | | 19,549,797 |
|
| IT SERVICES — 1.7% | | |
| International Business Machines Corp. | 185,206 | 33,572,292 |
|
| LEISURE PRODUCTS — 0.9% | | |
| Hasbro, Inc. | 332,457 | 17,636,844 |
|
| MACHINERY — 2.9% | | |
| Caterpillar, Inc. | 241,926 | 26,290,098 |
|
| Dover Corp. | 178,127 | 16,200,651 |
|
| Parker-Hannifin Corp. | 136,027 | 17,102,675 |
|
| | | 59,593,424 |
|
| MEDIA — 1.0% | | |
| Regal Entertainment Group, Class A | 199,274 | 4,204,681 |
|
| Time Warner, Inc. | 26,402 | 1,854,741 |
|
| Walt Disney Co. (The) | 174,925 | 14,998,069 |
|
| | | 21,057,491 |
|
| | | |
|
| | | | |
| | Shares | Value |
| METALS AND MINING — 0.1% | | |
| Cliffs Natural Resources, Inc. | 188,715 | $ | 2,840,161 |
|
| MULTI-UTILITIES — 1.7% | | |
| Consolidated Edison, Inc. | 192,349 | 11,106,231 |
|
| Vectren Corp. | 171,158 | 7,274,215 |
|
| Wisconsin Energy Corp. | 350,562 | 16,448,369 |
|
| | | 34,828,815 |
|
| MULTILINE RETAIL — 0.6% | | |
| Kohl's Corp. | 41,746 | 2,199,179 |
|
| Macy's, Inc. | 173,912 | 10,090,374 |
|
| | | 12,289,553 |
|
| OIL, GAS AND CONSUMABLE FUELS — 6.1% | | |
| Chevron Corp. | 99,221 | 12,953,301 |
|
| ConocoPhillips | 348,557 | 29,881,792 |
|
| EOG Resources, Inc. | 30,316 | 3,542,728 |
|
| Exxon Mobil Corp. | 352,182 | 35,457,684 |
|
| Occidental Petroleum Corp. | 248,505 | 25,504,068 |
|
| Valero Energy Corp. | 342,977 | 17,183,148 |
|
| | | 124,522,721 |
|
| PAPER AND FOREST PRODUCTS — 0.9% | | |
| International Paper Co. | 376,110 | 18,982,272 |
|
| PHARMACEUTICALS — 8.5% | | |
| AbbVie, Inc. | 480,754 | 27,133,756 |
|
| Bristol-Myers Squibb Co. | 11,140 | 540,402 |
|
| Eli Lilly & Co. | 357,519 | 22,226,956 |
|
| Johnson & Johnson | 471,065 | 49,282,820 |
|
| Merck & Co., Inc. | 640,893 | 37,075,660 |
|
| Pfizer, Inc. | 1,268,600 | 37,652,048 |
|
| | | 173,911,642 |
|
| REAL ESTATE INVESTMENT TRUSTS (REITs) — 2.8% | | |
| Digital Realty Trust, Inc. | 69,889 | 4,075,926 |
|
| HCP, Inc. | 421,270 | 17,432,153 |
|
| Health Care REIT, Inc. | 77,437 | 4,852,977 |
|
| Hospitality Properties Trust | 510,165 | 15,509,016 |
|
| Senior Housing Properties Trust | 664,500 | 16,140,705 |
|
| | | 58,010,777 |
|
| SEMICONDUCTORS AND SEMICONDUCTOR EQUIPMENT — 3.9% | |
| Broadcom Corp., Class A | 251,906 | 9,350,751 |
|
| Intel Corp. | 1,165,343 | 36,009,099 |
|
| Marvell Technology Group Ltd. | 515,939 | 7,393,406 |
|
| Texas Instruments, Inc. | 455,307 | 21,759,121 |
|
| Xilinx, Inc. | 112,297 | 5,312,771 |
|
| | | 79,825,148 |
|
|
| | | | |
| | Shares | Value |
| SOFTWARE — 5.0% | | |
| CA, Inc. | 550,689 | $ | 15,826,802 |
|
| Compuware Corp. | 1,494,937 | 14,934,420 |
|
| Microsoft Corp. | 1,248,421 | 52,059,156 |
|
| Oracle Corp. | 55,012 | 2,229,636 |
|
| Symantec Corp. | 695,533 | 15,927,706 |
|
| | | 100,977,720 |
|
| SPECIALTY RETAIL — 2.0% | | |
| Best Buy Co., Inc. | 147,890 | 4,586,069 |
|
| DSW, Inc., Class A | 277,646 | 7,757,429 |
|
| GameStop Corp., Class A | 319,201 | 12,918,064 |
|
| Lowe's Cos., Inc. | 18,552 | 890,311 |
|
| Staples, Inc. | 1,431,069 | 15,512,788 |
|
| | | 41,664,661 |
|
| TECHNOLOGY HARDWARE, STORAGE AND PERIPHERALS — 6.8% | |
| Apple, Inc. | 892,866 | 82,974,038 |
|
| Hewlett-Packard Co. | 263,612 | 8,878,452 |
|
| Lexmark International, Inc., Class A | 414,795 | 19,976,527 |
|
| Seagate Technology plc | 340,365 | 19,339,539 |
|
| Western Digital Corp. | 87,681 | 8,092,956 |
|
| | | 139,261,512 |
|
| THRIFTS AND MORTGAGE FINANCE — 0.2% | | |
| New York Community Bancorp, Inc. | 232,900 | 3,721,742 |
|
| TOBACCO — 1.3% | | |
| Altria Group, Inc. | 396,056 | 16,610,589 |
|
| Lorillard, Inc. | 32,343 | 1,971,953 |
|
| Philip Morris International, Inc. | 81,553 | 6,875,733 |
|
| | | 25,458,275 |
|
TOTAL COMMON STOCKS (Cost $1,450,518,791) | | 2,012,778,959 |
|
| TEMPORARY CASH INVESTMENTS — 1.3% | | |
| Repurchase Agreement, Bank of America Merrill Lynch, (collateralized by various U.S. Treasury obligations, 0.75% - 0.875%, 1/31/18 - 2/28/18, valued at $5,939,397), in a joint trading account at 0.05%, dated 6/30/14, due 7/1/14 (Delivery value $5,819,876) | | 5,819,868 |
|
| Repurchase Agreement, Credit Suisse First Boston, Inc., (collateralized by various U.S. Treasury obligations, 1.75%, 5/15/23, valued at $2,376,528), in a joint trading account at 0.01%, dated 6/30/14, due 7/1/14 (Delivery value $2,327,948) | | 2,327,947 |
|
| Repurchase Agreement, Goldman Sachs & Co., (collateralized by various U.S. Treasury obligations, 3.125%, 11/15/41, valued at $4,749,554), in a joint trading account at 0.03%, dated 6/30/14, due 7/1/14 (Delivery value $4,655,899) | | 4,655,895 |
|
| SSgA U.S. Government Money Market Fund, Class N | 13,596,844 | 13,596,844 |
|
TOTAL TEMPORARY CASH INVESTMENTS (Cost $26,400,554) | | 26,400,554 |
|
TOTAL INVESTMENT SECURITIES — 100.0% (Cost $1,476,919,345) | | 2,039,179,513 |
|
OTHER ASSETS AND LIABILITIES† | | (178,167) |
|
| TOTAL NET ASSETS — 100.0% | | $ | 2,039,001,346 |
|
|
| | |
| NOTES TO SCHEDULE OF INVESTMENTS |
| |
| † | Category is less than 0.05% of total net assets. |
See Notes to Financial Statements.
|
|
| Statement of Assets and Liabilities |
|
| | | |
| JUNE 30, 2014 | |
| Assets | |
| Investment securities, at value (cost of $1,476,919,345) | $ | 2,039,179,513 |
|
| Cash | 166,302 |
|
| Receivable for capital shares sold | 2,218,005 |
|
| Dividends and interest receivable | 2,378,335 |
|
| | 2,043,942,155 |
|
| | |
| Liabilities | |
| Payable for capital shares redeemed | 3,798,921 |
|
| Accrued management fees | 1,088,683 |
|
| Distribution and service fees payable | 53,205 |
|
| | 4,940,809 |
|
| | |
| Net Assets | $ | 2,039,001,346 |
|
| | |
| Net Assets Consist of: | |
| Capital (par value and paid-in surplus) | $ | 1,455,446,860 |
|
| Undistributed net investment income | 2,067,487 |
|
| Undistributed net realized gain | 19,224,002 |
|
| Net unrealized appreciation | 562,262,997 |
|
| | $ | 2,039,001,346 |
|
|
| | | | | | |
| | Net Assets | Shares Outstanding | Net Asset Value Per Share |
| Investor Class, $0.01 Par Value |
| $1,708,290,995 |
| 44,352,155 |
| $38.52 |
| Institutional Class, $0.01 Par Value |
| $89,217,617 |
| 2,314,277 |
| $38.55 |
| A Class, $0.01 Par Value |
| $232,470,705 |
| 6,042,074 |
| $38.48* |
| C Class, $0.01 Par Value |
| $5,445,068 |
| 141,739 |
| $38.42 |
| R Class, $0.01 Par Value |
| $3,576,961 |
| 92,891 |
| $38.51 |
*Maximum offering price $40.83 (net asset value divided by 0.9425).
See Notes to Financial Statements.
|
| | | |
| YEAR ENDED JUNE 30, 2014 | |
| Investment Income (Loss) | |
| Income: | |
| Dividends (net of foreign taxes withheld of $237,374) | $ | 53,540,077 |
|
| Interest | 3,560 |
|
| | 53,543,637 |
|
| | |
| Expenses: | |
| Management fees | 12,365,671 |
|
| Distribution and service fees: | |
| A Class | 534,516 |
|
| C Class | 35,264 |
|
| R Class | 12,126 |
|
| Directors' fees and expenses | 113,748 |
|
| Other expenses | 2,052 |
|
| | 13,063,377 |
|
| | |
| Net investment income (loss) | 40,480,260 |
|
| | |
| Realized and Unrealized Gain (Loss) | |
| Net realized gain (loss) on: | |
| Investment transactions | 217,412,922 |
|
| Futures contract transactions | 239,857 |
|
| Foreign currency transactions | (3,668 | ) |
| | 217,649,111 |
|
| | |
| Change in net unrealized appreciation (depreciation) on: | |
| Investments | 151,186,857 |
|
| Translation of assets and liabilities in foreign currencies | 7,074 |
|
| | 151,193,931 |
|
| | |
| Net realized and unrealized gain (loss) | 368,843,042 |
|
| | |
| Net Increase (Decrease) in Net Assets Resulting from Operations | $ | 409,323,302 |
|
See Notes to Financial Statements.
|
|
| Statement of Changes in Net Assets |
|
| | | | | | |
| YEARS ENDED JUNE 30, 2014 AND JUNE 30, 2013 | | |
| Increase (Decrease) in Net Assets | June 30, 2014 | June 30, 2013 |
| Operations | | |
| Net investment income (loss) | $ | 40,480,260 |
| $ | 37,930,692 |
|
| Net realized gain (loss) | 217,649,111 |
| 226,308,238 |
|
| Change in net unrealized appreciation (depreciation) | 151,193,931 |
| 62,872,038 |
|
| Net increase (decrease) in net assets resulting from operations | 409,323,302 |
| 327,110,968 |
|
| | | |
| Distributions to Shareholders | | |
| From net investment income: | | |
| Investor Class | (34,762,952 | ) | (30,297,598 | ) |
| Institutional Class | (1,905,100 | ) | (2,073,548 | ) |
| A Class | (4,161,820 | ) | (3,500,707 | ) |
| C Class | (43,873 | ) | (18,979 | ) |
| R Class | (42,236 | ) | (26,746 | ) |
| Decrease in net assets from distributions | (40,915,981 | ) | (35,917,578 | ) |
| | | |
| Capital Share Transactions | | |
Net increase (decrease) in net assets from capital share transactions (Note 5) | (10,375,855 | ) | (133,196,359 | ) |
| | | |
| Net increase (decrease) in net assets | 358,031,466 |
| 157,997,031 |
|
| | | |
| Net Assets | | |
| Beginning of period | 1,680,969,880 |
| 1,522,972,849 |
|
| End of period | $ | 2,039,001,346 |
| $ | 1,680,969,880 |
|
| | | |
| Undistributed net investment income | $ | 2,067,487 |
| $ | 2,636,322 |
|
See Notes to Financial Statements.
|
|
| Notes to Financial Statements |
JUNE 30, 2014
1. Organization
American Century Quantitative Equity Funds, Inc. (the corporation) is registered under the Investment Company Act of 1940, as amended (the 1940 Act), as an open-end management investment company and is organized as a Maryland corporation. Income & Growth Fund (the fund) is one fund in a series issued by the corporation. The fund is diversified as defined under the 1940 Act. The fund’s investment objective is to seek long-term capital growth by investing in common stocks. Income is a secondary objective.
The fund offers the Investor Class, the Institutional Class, the A Class, the C Class and the R Class. The A Class may incur an initial sales charge. The A Class and C Class may be subject to a contingent deferred sales charge. The share classes differ principally in their respective sales charges and distribution and shareholder servicing expenses and arrangements. The Institutional Class is made available to institutional shareholders or through financial intermediaries whose clients do not require the same level of shareholder and administrative services as shareholders of other classes. As a result, the Institutional Class is charged a lower unified management fee.
2. Significant Accounting Policies
The following is a summary of significant accounting policies consistently followed by the fund in preparation of its financial statements. The financial statements are prepared in conformity with accounting principles generally accepted in the United States of America, which may require management to make certain estimates and assumptions at the date of the financial statements. Actual results could differ from these estimates. Management evaluated the impact of events or transactions occurring through the date the financial statements were issued that would merit recognition or disclosure.
Investment Valuations — The fund determines the fair value of its investments and computes its net asset value per share at the close of regular trading (usually 4 p.m. Eastern time) on the New York Stock Exchange (NYSE) on each day the NYSE is open. The Board of Directors has adopted valuation policies and procedures to guide the investment advisor in the fund’s investment valuation process and to provide methodologies for the oversight of the fund’s pricing function.
Equity securities that are listed or traded on a domestic securities exchange are valued at the last reported sales price or at the official closing price as provided by the exchange. Equity securities traded on foreign securities exchanges are generally valued at the closing price of such securities on the exchange where primarily traded or at the close of the NYSE, if that is earlier. If no last sales price is reported, or if local convention or regulation so provides, the mean of the latest bid and asked prices may be used. Securities traded over-the-counter are valued at the mean of the latest bid and asked prices, the last sales price, or the official closing price. Equity securities initially expressed in local currencies are translated into U.S. dollars at the mean of the appropriate currency exchange rate at the close of the NYSE as provided by an independent pricing service.
Fixed income securities maturing within 60 days at the time of purchase may be valued at cost, plus or minus any amortized discount or premium or at the evaluated mean as provided by an independent pricing service. Evaluated mean prices are commonly derived through utilization of market models, which may consider, among other factors: trade data, quotations from dealers and active market makers, relevant yield curve and spread data, related sector levels, creditworthiness, trade data or market information on comparable securities, and other relevant security specific information.
Open-end management investment companies are valued at the reported net asset value per share. Repurchase agreements are valued at cost, which approximates fair value. Exchange-traded futures contracts are valued at the settlement price as provided by the appropriate clearing corporation.
If the fund determines that the market price for an investment is not readily available or the valuation methods mentioned above do not reflect an investment’s fair value, such investment is valued as determined in good faith by the Board of Directors or its delegate, in accordance with policies and procedures adopted by the Board of Directors. In its determination of fair value, the fund may review several factors including, but not limited to, market information regarding the specific investment or comparable investments and correlation
with other investment types, futures indices or general market indicators. Circumstances that may cause the fund to use these procedures to value an investment include, but are not limited to: an investment has been declared in default or is distressed; trading in a security has been suspended during the trading day or a security is not actively trading on its principal exchange; prices received from a regular pricing source are deemed unreliable; or there is a foreign market holiday and no trading occurred.
The fund monitors for significant events occurring after the close of an investment’s primary exchange but before the fund’s net asset value per share is determined. Significant events may include, but are not limited to: corporate announcements and transactions; governmental action and political unrest that could impact a specific investment or an investment sector; or armed conflicts, natural disasters and similar events that could affect investments in a specific country or region. The fund also monitors for significant fluctuations between domestic and foreign markets, as evidenced by the U.S. market or such other indicators that the Board of Directors, or its delegate, deems appropriate. If significant fluctuations in foreign markets are identified, the fund may apply a model-derived factor to the closing price of equity securities traded on foreign securities exchanges. The factor is based on observable market data as provided by an independent pricing service.
Security Transactions — Security transactions are accounted for as of the trade date. Net realized gains and losses are determined on the identified cost basis, which is also used for federal income tax purposes.
Investment Income — Dividend income less foreign taxes withheld, if any, is recorded as of the ex-dividend date. Distributions received on securities that represent a return of capital or long-term capital gain are recorded as a reduction of cost of investments and/or as a realized gain. The fund may estimate the components of distributions received that may be considered nontaxable distributions or long-term capital gain distributions for income tax purposes. Interest income is recorded on the accrual basis and includes accretion of discounts and amortization of premiums.
Foreign Currency Translations — All assets and liabilities initially expressed in foreign currencies are translated into U.S. dollars at prevailing exchange rates at period end. The fund may enter into spot foreign currency exchange contracts to facilitate transactions denominated in a foreign currency. Purchases and sales of investment securities, dividend and interest income, spot foreign currency exchange contracts, and expenses are translated at the rates of exchange prevailing on the respective dates of such transactions. Net realized and unrealized foreign currency exchange gains or losses related to investment securities are a component of net realized gain (loss) on investment transactions and change in net unrealized appreciation (depreciation) on investments, respectively.
Repurchase Agreements — The fund may enter into repurchase agreements with institutions that American Century Investment Management, Inc. (ACIM) (the investment advisor) has determined are creditworthy pursuant to criteria adopted by the Board of Directors. The fund requires that the collateral, represented by securities, received in a repurchase transaction be transferred to the custodian in a manner sufficient to enable the fund to obtain those securities in the event of a default under the repurchase agreement. ACIM monitors, on a daily basis, the securities transferred to ensure the value, including accrued interest, of the securities under each repurchase agreement is equal to or greater than amounts owed to the fund under each repurchase agreement.
Joint Trading Account — Pursuant to an Exemptive Order issued by the Securities and Exchange Commission, the fund, along with certain other funds in the American Century Investments family of funds, may transfer uninvested cash balances into a joint trading account. These balances are invested in one or more repurchase agreements that are collateralized by U.S. Treasury or Agency obligations.
Segregated Assets — In accordance with the 1940 Act, the fund segregates assets on its books and records to cover futures contracts. ACIM monitors, on a daily basis, the securities segregated to ensure the fund designates a sufficient amount of liquid assets, marked-to-market daily. The fund may also receive assets or be required to pledge assets at the custodian bank or with a broker for margin requirements on futures contracts.
Income Tax Status — It is the fund’s policy to distribute substantially all net investment income and net realized gains to shareholders and to otherwise qualify as a regulated investment company under provisions of the Internal Revenue Code. Accordingly, no provision has been made for income taxes. The fund files U.S. federal, state, local and non-U.S. tax returns as applicable. The fund's tax returns are subject to examination by the relevant taxing authority until expiration of the applicable statute of limitations, which is generally three years from the date of filing but can be longer in certain jurisdictions. At this time, management believes there are no uncertain tax positions which, based on their technical merit, would not be sustained upon examination
and for which it is reasonably possible that the total amounts of unrecognized tax benefits will significantly change in the next twelve months.
Multiple Class — All shares of the fund represent an equal pro rata interest in the net assets of the class to which such shares belong, and have identical voting, dividend, liquidation and other rights and the same terms and conditions, except for class specific expenses and exclusive rights to vote on matters affecting only individual classes. Income, non-class specific expenses, and realized and unrealized capital gains and losses of the fund are allocated to each class of shares based on their relative net assets.
Distributions to Shareholders — Distributions from net investment income, if any, are generally declared and paid quarterly. Distributions from net realized gains, if any, are generally declared and paid annually.
Indemnifications — Under the corporation’s organizational documents, its officers and directors are indemnified against certain liabilities arising out of the performance of their duties to the fund. In addition, in the normal course of business, the fund enters into contracts that provide general indemnifications. The maximum exposure under these arrangements is unknown as this would involve future claims that may be made against a fund. The risk of material loss from such claims is considered by management to be remote.
3. Fees and Transactions with Related Parties
Certain officers and directors of the corporation are also officers and/or directors of American Century Companies, Inc. (ACC). The corporation’s investment advisor, ACIM, the corporation's distributor, American Century Investment Services, Inc. (ACIS), and the corporation’s transfer agent, American Century Services, LLC, are wholly owned, directly or indirectly, by ACC.
Management Fees — The corporation has entered into a management agreement with ACIM, under which ACIM provides the fund with investment advisory and management services in exchange for a single, unified management fee (the fee) per class. The agreement provides that all expenses of managing and operating the fund, except distribution and service fees, brokerage expenses, taxes, interest, fees and expenses of the independent directors (including legal counsel fees), and extraordinary expenses, will be paid by ACIM. The fee is computed and accrued daily based on each class's daily net assets and paid monthly in arrears. The fee consists of (1) an Investment Category Fee based on the daily net assets of the fund and certain other accounts managed by the investment advisor that are in the same broad investment category as the fund and (2) a Complex Fee based on the assets of all the funds in the American Century Investments family of funds. The rates for the Investment Category Fee range from 0.3380% to 0.5200%. The rates for the Complex Fee range from 0.2500% to 0.3100% for the Investor Class, A Class, C Class and R Class. The rates for the Complex Fee range from 0.0500% to 0.1100% for the Institutional Class. The effective annual management fee for each class for the year ended June 30, 2014 was 0.67% for the Investor Class, A Class, C Class and R Class and 0.47% for the Institutional Class.
Distribution and Service Fees — The Board of Directors has adopted a separate Master Distribution and Individual Shareholder Services Plan for each of the A Class, C Class and R Class (collectively the plans), pursuant to Rule 12b-1 of the 1940 Act. The plans provide that the A Class will pay ACIS an annual distribution and service fee of 0.25%. The plans provide that the C Class will pay ACIS an annual distribution and service fee of 1.00%, of which 0.25% is paid for individual shareholder services and 0.75% is paid for distribution services. The plans provide that the R Class will pay ACIS an annual distribution and service fee of 0.50%. The fees are computed and accrued daily based on each class’s daily net assets and paid monthly in arrears. The fees are used to pay financial intermediaries for distribution and individual shareholder services. Fees incurred under the plans during the year ended June 30, 2014 are detailed in the Statement of Operations.
Directors' Fees and Expenses — The Board of Directors is responsible for overseeing the investment advisor’s management and operations of the fund. The directors receive detailed information about the fund and its investment advisor regularly throughout the year, and meet at least quarterly with management of the investment advisor to review reports about fund operations. Fees and expenses incurred in conjunction with the directors during the year ended June 30, 2014 are detailed in the Statement of Operations. The fund’s officers do not receive compensation from the fund.
4. Investment Transactions
Purchases and sales of investment securities, excluding short-term investments, for the year ended June 30, 2014 were $1,414,239,596 and $1,425,547,697, respectively.
5. Capital Share Transactions
Transactions in shares of the fund were as follows:
|
| | | | | | | | | | |
| | Year ended June 30, 2014 | Year ended June 30, 2013 |
| | Shares | Amount | Shares | Amount |
| Investor Class/Shares Authorized | 230,000,000 |
| | 230,000,000 |
| |
| Sold | 6,249,991 |
| $ | 221,131,933 |
| 3,881,646 |
| $ | 112,671,468 |
|
| Issued in reinvestment of distributions | 941,777 |
| 33,492,283 |
| 1,008,361 |
| 29,157,438 |
|
| Redeemed | (7,736,304 | ) | (274,189,960 | ) | (9,680,455 | ) | (276,089,844 | ) |
| | (544,536 | ) | (19,565,744 | ) | (4,790,448 | ) | (134,260,938 | ) |
| Institutional Class/Shares Authorized | 20,000,000 |
| | 75,000,000 |
| |
| Sold | 773,957 |
| 27,297,836 |
| 877,214 |
| 25,831,442 |
|
| Issued in reinvestment of distributions | 53,104 |
| 1,895,148 |
| 60,220 |
| 1,737,950 |
|
| Redeemed | (669,025 | ) | (23,360,411 | ) | (2,498,610 | ) | (71,948,164 | ) |
| | 158,036 |
| 5,832,573 |
| (1,561,176 | ) | (44,378,772 | ) |
| A Class/Shares Authorized | 75,000,000 |
| | 75,000,000 |
| |
| Sold | 1,157,163 |
| 40,694,503 |
| 3,177,243 |
| 89,779,424 |
|
| Issued in reinvestment of distributions | 116,049 |
| 4,120,267 |
| 119,774 |
| 3,465,169 |
|
| Redeemed | (1,285,925 | ) | (45,308,043 | ) | (1,687,925 | ) | (49,082,569 | ) |
| | (12,713 | ) | (493,273 | ) | 1,609,092 |
| 44,162,024 |
|
| C Class/Shares Authorized | 10,000,000 |
| | 10,000,000 |
| |
| Sold | 93,441 |
| 3,304,247 |
| 35,630 |
| 1,040,918 |
|
| Issued in reinvestment of distributions | 997 |
| 35,605 |
| 456 |
| 13,219 |
|
| Redeemed | (15,079 | ) | (536,923 | ) | (17,573 | ) | (514,886 | ) |
| | 79,359 |
| 2,802,929 |
| 18,513 |
| 539,251 |
|
| R Class/Shares Authorized | 10,000,000 |
| | 10,000,000 |
| |
| Sold | 43,102 |
| 1,576,774 |
| 49,094 |
| 1,368,318 |
|
| Issued in reinvestment of distributions | 985 |
| 35,149 |
| 756 |
| 22,119 |
|
| Redeemed | (16,133 | ) | (564,263 | ) | (22,826 | ) | (648,361 | ) |
| | 27,954 |
| 1,047,660 |
| 27,024 |
| 742,076 |
|
| Net increase (decrease) | (291,900 | ) | $ | (10,375,855 | ) | (4,696,995 | ) | $ | (133,196,359 | ) |
6. Fair Value Measurements
The fund’s investments valuation process is based on several considerations and may use multiple inputs to determine the fair value of the investments held by the fund. In conformity with accounting principles generally accepted in the United States of America, the inputs used to determine a valuation are classified into three broad levels.
| |
| • | Level 1 valuation inputs consist of unadjusted quoted prices in an active market for identical investments. |
| |
| • | Level 2 valuation inputs consist of direct or indirect observable market data (including quoted prices for comparable investments, evaluations of subsequent market events, interest rates, prepayment speeds, credit risk, etc.). These inputs also consist of quoted prices for identical investments initially expressed in local currencies that are adjusted through translation into U.S. dollars. |
| |
| • | Level 3 valuation inputs consist of unobservable data (including a fund’s own assumptions). |
The level classification is based on the lowest level input that is significant to the fair valuation measurement. The valuation inputs are not necessarily an indication of the risks associated with investing in these securities or other financial instruments.
The following is a summary of the level classifications as of period end. The Schedule of Investments provides additional information on the fund’s portfolio holdings.
|
| | | | | | | | |
| | Level 1 | Level 2 | Level 3 |
| Assets | | | |
| Investment Securities | | | |
| Common Stocks | $ | 2,012,778,959 |
| — |
| — |
|
| Temporary Cash Investments | 13,596,844 |
| $ | 12,803,710 |
| — |
|
| | $ | 2,026,375,803 |
| $ | 12,803,710 |
| — |
|
7. Derivative Instruments
Equity Price Risk — The fund is subject to equity price risk in the normal course of pursuing its investment objectives. A fund may enter into futures contracts based on an equity index in order to manage its exposure to changes in market conditions. A fund may purchase futures contracts to gain exposure to increases in market value or sell futures contracts to protect against a decline in market value. Upon entering into a futures contract, a fund is required to deposit either cash or securities in an amount equal to a certain percentage of the contract value (initial margin). Subsequent payments (variation margin) are made or received daily, in cash, by a fund. The variation margin is equal to the daily change in the contract value and is recorded as unrealized gains and losses. A fund recognizes a realized gain or loss when the contract is closed or expires. Net realized and unrealized gains or losses occurring during the holding period of futures contracts are a component of net realized gain (loss) on futures contract transactions and change in net unrealized appreciation (depreciation) on futures contracts, respectively. One of the risks of entering into futures contracts is the possibility that the change in value of the contract may not correlate with the changes in value of the underlying securities. During the period, the fund infrequently purchased equity price risk derivative instruments for temporary investment purposes.
At period end, the fund did not have any derivative instruments disclosed on the Statement of Assets and Liabilities. For the year ended June 30, 2014, the effect of equity price risk derivative instruments on the Statement of Operations was $239,857 in net realized gain (loss) on futures contract transactions.
8. Federal Tax Information
The tax character of distributions paid during the years ended June 30, 2014 and June 30, 2013 were as follows:
|
| | | | | | |
| | 2014 | 2013 |
| Distributions Paid From | | |
| Ordinary income | $ | 40,915,981 |
| $ | 35,917,578 |
|
| Long-term capital gains | — |
| — |
|
The book-basis character of distributions made during the year from net investment income or net realized gains may differ from their ultimate characterization for federal income tax purposes. These differences reflect the differing character of certain income items and net realized gains and losses for financial statement and tax purposes, and may result in reclassification among certain capital accounts on the financial statements.
As of June 30, 2014, the federal tax cost of investments and the components of distributable earnings on a tax-basis were as follows:
|
| | | |
| Federal tax cost of investments | $ | 1,480,265,797 |
|
| Gross tax appreciation of investments | $ | 564,032,167 |
|
| Gross tax depreciation of investments | (5,118,451 | ) |
| Net tax appreciation (depreciation) of investments | 558,913,716 |
|
Net tax appreciation (depreciation) on derivatives and translation of assets and liabilities in foreign currencies | 2,829 |
|
| Net tax appreciation (depreciation) | $ | 558,916,545 |
|
| Undistributed ordinary income | $ | 2,067,487 |
|
| Accumulated long-term gains | $ | 22,570,454 |
|
The difference between book-basis and tax-basis unrealized appreciation (depreciation) is attributable primarily to the tax deferral of losses on wash sales.
|
| | | | | | | | | | | | | |
| For a Share Outstanding Throughout the Years Ended June 30 (except as noted) |
| Per-Share Data | | | | | Ratios and Supplemental Data |
| | | Income From Investment Operations: | | Ratio to Average Net Assets of: | | |
| | Net Asset Value, Beginning of Period | Net Investment Income (Loss)(1) | Net Realized and Unrealized Gain (Loss) | Total From Investment Operations | Distributions From Net Investment Income | Net Asset Value, End of Period | Total Return(2) | Operating Expenses | Net Investment Income (Loss) | Portfolio Turnover Rate | Net Assets, End of Period (in thousands) |
| Investor Class | | | | | | | | | |
| 2014 | $31.58 | 0.77 | 6.95 | 7.72 | (0.78) | $38.52 | 24.66% | 0.67% | 2.17% | 76% |
| $1,708,291 |
|
| 2013 | $26.29 | 0.68 | 5.27 | 5.95 | (0.66) | $31.58 | 22.86% | 0.68% | 2.39% | 74% |
| $1,417,796 |
|
| 2012 | $25.54 | 0.43 | 0.76 | 1.19 | (0.44) | $26.29 | 4.75% | 0.68% | 1.73% | 53% |
| $1,306,254 |
|
| 2011 | $19.88 | 0.36 | 5.64 | 6.00 | (0.34) | $25.54 | 30.31% | 0.69% | 1.52% | 42% |
| $1,351,936 |
|
| 2010 | $18.03 | 0.33 | 1.85 | 2.18 | (0.33) | $19.88 | 11.99% | 0.70% | 1.58% | 45% |
| $1,227,234 |
|
| Institutional Class | | | | | | | | | |
| 2014 | $31.61 | 0.84 | 6.95 | 7.79 | (0.85) | $38.55 | 24.89% | 0.47% | 2.37% | 76% |
| $89,218 |
|
| 2013 | $26.31 | 0.74 | 5.27 | 6.01 | (0.71) | $31.61 | 23.12% | 0.48% | 2.59% | 74% |
| $68,152 |
|
| 2012 | $25.56 | 0.48 | 0.76 | 1.24 | (0.49) | $26.31 | 4.96% | 0.48% | 1.93% | 53% |
| $97,809 |
|
| 2011 | $19.89 | 0.40 | 5.66 | 6.06 | (0.39) | $25.56 | 30.61% | 0.49% | 1.72% | 42% |
| $128,468 |
|
| 2010 | $18.04 | 0.38 | 1.85 | 2.23 | (0.38) | $19.89 | 12.20% | 0.50% | 1.78% | 45% |
| $197,196 |
|
| A Class | | | | | | | | | | | |
| 2014 | $31.55 | 0.68 | 6.94 | 7.62 | (0.69) | $38.48 | 24.34% | 0.92% | 1.92% | 76% |
| $232,471 |
|
| 2013 | $26.26 | 0.63 | 5.24 | 5.87 | (0.58) | $31.55 | 22.58% | 0.93% | 2.14% | 74% |
| $191,007 |
|
| 2012 | $25.52 | 0.37 | 0.74 | 1.11 | (0.37) | $26.26 | 4.46% | 0.93% | 1.48% | 53% |
| $116,762 |
|
| 2011 | $19.86 | 0.30 | 5.64 | 5.94 | (0.28) | $25.52 | 30.02% | 0.94% | 1.27% | 42% |
| $128,920 |
|
| 2010 | $18.01 | 0.28 | 1.85 | 2.13 | (0.28) | $19.86 | 11.72% | 0.95% | 1.33% | 45% |
| $125,981 |
|
|
| | | | | | | | | | | | | |
| For a Share Outstanding Throughout the Years Ended June 30 (except as noted) |
| Per-Share Data | | | | | Ratios and Supplemental Data |
| | | Income From Investment Operations: | | Ratio to Average Net Assets of: | | |
| | Net Asset Value, Beginning of Period | Net Investment Income (Loss)(1) | Net Realized and Unrealized Gain (Loss) | Total From Investment Operations | Distributions From Net Investment Income | Net Asset Value, End of Period | Total Return(2) | Operating Expenses | Net Investment Income (Loss) | Portfolio Turnover Rate | Net Assets, End of Period (in thousands) |
| C Class | | | | | | | | | | | |
| 2014 | $31.50 | 0.41 | 6.93 | 7.34 | (0.42) | $38.42 | 23.42% | 1.67% | 1.17% | 76% |
| $5,445 |
|
| 2013 | $26.23 | 0.41 | 5.23 | 5.64 | (0.37) | $31.50 | 21.63% | 1.68% | 1.39% | 74% |
| $1,965 |
|
| 2012 | $25.48 | 0.18 | 0.76 | 0.94 | (0.19) | $26.23 | 3.73% | 1.68% | 0.73% | 53% |
| $1,151 |
|
| 2011 | $19.83 | 0.12 | 5.63 | 5.75 | (0.10) | $25.48 | 29.04% | 1.69% | 0.52% | 42% |
| $933 |
|
| 2010 | $17.99 | 0.12 | 1.84 | 1.96 | (0.12) | $19.83 | 10.85% | 1.70% | 0.58% | 45% |
| $863 |
|
| R Class | | | | | | | | | | | |
| 2014 | $31.57 | 0.59 | 6.95 | 7.54 | (0.60) | $38.51 | 24.05% | 1.17% | 1.67% | 76% |
| $3,577 |
|
| 2013 | $26.28 | 0.57 | 5.23 | 5.80 | (0.51) | $31.57 | 22.26% | 1.18% | 1.89% | 74% |
| $2,050 |
|
| 2012 | $25.54 | 0.31 | 0.74 | 1.05 | (0.31) | $26.28 | 4.19% | 1.18% | 1.23% | 53% |
| $997 |
|
| 2011 | $19.87 | 0.24 | 5.65 | 5.89 | (0.22) | $25.54 | 29.73% | 1.19% | 1.02% | 42% |
| $506 |
|
| 2010 | $18.03 | 0.23 | 1.84 | 2.07 | (0.23) | $19.87 | 11.38% | 1.20% | 1.08% | 45% |
| $279 |
|
|
|
| Notes to Financial Highlights |
| |
| (1) | Computed using average shares outstanding throughout the period. |
| |
| (2) | Total returns are calculated based on the net asset value of the last business day and do not reflect applicable sales charges, if any. Total returns for periods less than one year are not annualized. |
See Notes to Financial Statements.
|
|
| Report of Independent Registered Public Accounting Firm |
To the Directors of the American Century Quantitative Equity Funds, Inc. and Shareholders of the Income & Growth Fund:
In our opinion, the accompanying statement of assets and liabilities, including the schedule of investments, and the related statements of operations, of changes in net assets and the financial highlights present fairly, in all material respects, the financial position of the Income & Growth Fund (one of the fifteen funds comprising the American Century Quantitative Equity Funds, Inc., hereafter referred to as the “Fund”) at June 30, 2014, the results of its operations for the year then ended, the changes in its net assets for each of the two years in the period then ended and the financial highlights for each of the five years in the period then ended, in conformity with accounting principles generally accepted in the United States of America. These financial statements and financial highlights (hereafter referred to as "financial statements") are the responsibility of the Fund's management. Our responsibility is to express an opinion on these financial statements based on our audits. We conducted our audits of these financial statements in accordance with the standards of the Public Company Accounting Oversight Board (United States). Those standards require that we plan and perform the audit to obtain reasonable assurance about whether the financial statements are free of material misstatement. An audit includes examining, on a test basis, evidence supporting the amounts and disclosures in the financial statements, assessing the accounting principles used and significant estimates made by management, and evaluating the overall financial statement presentation. We believe that our audits, which included confirmation of securities at June 30, 2014 by correspondence with the custodian and brokers, provide a reasonable basis for our opinion.
PricewaterhouseCoopers LLP
Kansas City, Missouri
August 21, 2014
Board of Directors
The individuals listed below serve as directors of the funds. Each director will continue to serve in this capacity until death, retirement, resignation or removal from office. The board has adopted a mandatory retirement age for directors who are not “interested persons,” as that term is defined in the Investment Company Act (independent directors). Independent directors shall retire on December 31 of the year in which they reach their 75th birthday; provided, however, that on or after January 1, 2022, independent directors shall retire on December 31 of the year in which they reach their 76th birthday.
Mr. Thomas is an “interested person” because he currently serves as President and Chief Executive Officer of American Century Companies, Inc. (ACC), the parent company of American Century Investment Management, Inc. (ACIM or the advisor). The other directors (more than three-fourths of the total number) are independent. They are not employees, directors or officers of, and have no financial interest in, ACC or any of its wholly owned, direct or indirect, subsidiaries, including ACIM, American Century Investment Services, Inc. (ACIS) and American Century Services, LLC (ACS), and do not have any other affiliations, positions or relationships that would cause them to be considered “interested persons” under the Investment Company Act. The directors serve in this capacity for eight (in the case of Mr. Thomas, 15) registered investment companies in the American Century Investments family of funds.
The following table presents additional information about the directors. The mailing address for each director other than Mr. Thomas is 1665 Charleston Road, Mountain View, California 94043. The mailing address for Mr. Thomas is 4500 Main Street, Kansas City, Missouri 64111.
|
| | | | | |
Name (Year of Birth) | Position(s) Held with Funds | Length of Time Served | Principal Occupation(s) During Past 5 Years | Number of
American
Century
Portfolios
Overseen
by Director | Other Directorships Held During Past 5 Years |
| Independent Directors |
Tanya S. Beder (1955) | Director | Since 2011 | Chairman, SBCC Group Inc. (independent advisory services) (2006 to present) | 42 | CYS Investments, Inc. (specialty finance company) |
Jeremy I. Bulow (1954) | Director | Since 2011 | Professor of Economics, Stanford University, Graduate School of Business (1979 to present) | 42 | None |
Ronald J. Gilson (1946) | Director and Chairman of the Board | Since 1995 (Chairman since 2005) | Charles J. Meyers Professor of Law and Business, Stanford Law School (1979 to present); Marc and Eva Stern Professor of Law and Business, Columbia University School of Law (1992 to present) | 42 | None |
|
| | | | | |
Name (Year of Birth) | Position(s) Held with Funds | Length of Time Served | Principal Occupation(s) During Past 5 Years | Number of
American
Century
Portfolios
Overseen
by Director | Other Directorships Held During Past 5 Years |
| Independent Directors |
Frederick L. A. Grauer (1946) | Director | Since 2008 | Senior Advisor, BlackRock, Inc. (investment management firm) (2010 to 2011); Senior Advisor, Barclays Global Investors (investment management firm) (2003 to 2009) | 42 | None |
Peter F. Pervere
(1947) | Director | Since 2007 | Retired | 42 | Intraware, Inc. (2003 to 2009) |
Myron S. Scholes(1) (1941) | Director | Since 1980 | Chairman, Platinum Grove Asset Management, L.P. (asset manager) (1999 to 2009); Frank E. Buck Professor of Finance-Emeritus, Stanford Graduate School of Business (1996 to present) | 42 | Dimensional Fund Advisors (investment advisor); CME Group, Inc. (futures and options exchange) |
John B. Shoven
(1947) | Director | Since 2002 | Professor of Economics, Stanford University (1973 to present) | 42 | Cadence Design Systems; Exponent; Financial Engines |
| Interested Director |
Jonathan S. Thomas
(1963) | Director and
President | Since 2007 | President and Chief Executive Officer, ACC (March 2007 to present). Also serves as Chief Executive Officer and Manager, ACS; Executive Vice President, ACIM; Director, ACC, ACIM and other ACC subsidiaries | 115 | None |
(1) Myron S. Scholes resigned as director effective July 31, 2014.
Officers
The following table presents certain information about the executive officers of the funds. Each officer serves as an officer for each of the 15 investment companies in the American Century family of funds, unless otherwise noted. No officer is compensated for his or her service as an officer of the funds. The listed officers are interested persons of the funds and are appointed or re-appointed on an annual basis. The mailing address for each of the officers listed below is 4500 Main Street, Kansas City, Missouri 64111.
|
| | |
Name (Year of Birth) | Offices with the Funds | Principal Occupation(s) During the Past Five Years |
Jonathan S. Thomas (1963) | Director and President since 2007 | President and Chief Executive Officer, ACC (March 2007 to present). Also serves as Chief Executive Officer and Manager, ACS; Executive Vice President, ACIM; Director, ACC, ACIM and other ACC subsidiaries |
| Amy D. Shelton (1964) | Chief Compliance Officer since 2014 | Chief Compliance Officer, American Century funds, (March 2014 to present); Chief Compliance Officer, ACIM (February 2014 to present); Chief Compliance Officer, ACIS (October 2009 to present); Vice President, Client Interactions and Marketing, ACIS (February 2013 to January 2014); Director, Client Interactions and Marketing, ACIS (June 2007 to January 2013). Also serves as Vice President, ACIS |
Charles A. Etherington (1957) | General Counsel since 2007 and Senior Vice President since 2006 | Attorney, ACC (February 1994 to present); Vice President, ACC (November 2005 to present); General Counsel, ACC (March 2007 to present). Also serves as General Counsel, ACIM, ACS, ACIS and other ACC subsidiaries; and Senior Vice President, ACIM and ACS |
C. Jean Wade (1964) | Vice President, Treasurer and Chief Financial Officer since 2012 | Vice President, ACS (February 2000 to present) |
Robert J. Leach (1966) | Vice President since 2006 and Assistant Treasurer since 2012 | Vice President, ACS (February 2000 to present) |
David H. Reinmiller (1963) | Vice President since 2001 | Attorney, ACC (January 1994 to present); Associate General Counsel, ACC (January 2001 to present). Also serves as Vice President, ACIM and ACS |
Ward D. Stauffer (1960) | Secretary since 2005 | Attorney, ACC (June 2003 to present) |
The Statement of Additional Information has additional information about the fund’s directors and is available without charge, upon request, by calling 1-800-345-2021.
|
|
| Approval of Management Agreement |
At a meeting held on June 13, 2014, the Fund’s Board of Directors/Trustees unanimously approved the renewal of the management agreement pursuant to which American Century Investment Management, Inc. (the “Advisor”) acts as the investment advisor for the Fund. Under Section 15(c) of the Investment Company Act, contracts for investment advisory services are required to be reviewed, evaluated, and approved by a majority of a fund’s directors/trustees (the “Directors”), including a majority of the independent Directors, each year. The Board regards this annual evaluation and renewal as one of its most important responsibilities.
The independent Directors have memorialized a statement regarding the relationship between their ongoing obligations to oversee and evaluate the performance of the Advisor and their annual consideration of renewal of the management agreement. In that statement, the independent Directors noted that their assessment of the Advisor’s performance is an ongoing process that takes place over the entire year and is informed by all of the extensive information that the Board and its committees receive and consider over time. This information, together with the materials provided in connection with the review, are central to the Board’s assessment of the Advisor’s performance and its determination whether to renew the Fund’s management agreement.
Prior to its consideration of the renewal of the management agreement, the Board requested and reviewed extensive data and analysis relating to the proposed renewal. This information and analysis was compiled by the Advisor and certain independent providers of evaluation data concerning the Fund and the services provided to the Fund by the Advisor.
In connection with its consideration of the renewal of the management agreement, the Board’s review and evaluation of the services provided by the Advisor included, but was not limited to, the following:
| |
| • | the nature, extent, and quality of investment management, shareholder services, and other services provided by the Advisor to the Fund; |
| |
| • | the wide range of other programs and services the Advisor provides to the Fund and its shareholders on a routine and non-routine basis; |
| |
| • | the investment performance of the Fund, including data comparing the Fund’s performance to appropriate benchmarks and/or a peer group of other mutual funds with similar investment objectives and strategies; |
| |
| • | the cost of owning the Fund compared to the cost of owning similar funds; |
| |
| • | the Advisor’s compliance policies, procedures, and regulatory experience; |
| |
| • | financial data showing the cost of services provided to the Fund, the profitability of the Fund to the Advisor, and the overall profitability of the Advisor; |
| |
| • | possible economies of scale associated with the Advisor’s management of the Fund and other accounts under its management; |
| |
| • | data comparing services provided and charges to other investment management clients of the Advisor; and |
| |
| • | any collateral benefits derived by the Advisor from the management of the Fund. |
In keeping with its practice, the Board held two in-person meetings to review and discuss the information provided. The independent Directors also had the benefit of the advice of their independent counsel throughout the process.
Factors Considered
The Directors considered all of the information provided by the Advisor, the independent data providers, and the independent Directors’ independent counsel in connection with the review, and evaluated such information for the Fund. In connection with their review, the Directors did not
identify any single factor as being all-important or controlling and each Director may have attributed different levels of importance to different factors. In deciding to renew the management agreement, the Board based its decision on a number of factors, including the following:
Nature, Extent and Quality of Services — Generally. Under the management agreement, the Advisor is responsible for providing or arranging for all services necessary for the operation of the Fund. The Board noted that under the management agreement, the Advisor provides or arranges at its own expense a wide variety of services including:
| |
| • | constructing and designing the Fund |
| |
| • | portfolio research and security selection |
| |
| • | initial capitalization/funding |
| |
| • | daily valuation of the Fund’s portfolio |
| |
| • | shareholder servicing and transfer agency, including shareholder confirmations, recordkeeping, and communications |
| |
| • | regulatory and portfolio compliance |
| |
| • | marketing and distribution |
The Board noted that many of these services have expanded over time both in terms of quantity and complexity in response to shareholder demands, competition in the industry, changing distribution channels, and the changing regulatory environment.
Investment Management Services. The nature of the investment management services provided to the Fund is quite complex and allows Fund shareholders access to professional money management, instant diversification of their investments within an asset class, the opportunity to easily diversify among asset classes by investing in or exchanging among various American Century Investments funds, and liquidity. In evaluating investment performance, the Board expects the Advisor to manage the Fund in accordance with its investment objectives and approved strategies. Further, the Directors recognize that the Advisor has an obligation to seek the best execution of fund trades. In providing these services, the Advisor utilizes teams of investment professionals (portfolio managers, analysts, research assistants, and securities traders) who require extensive information technology, research, training, compliance and other systems to conduct their business. The Board, directly and through its Portfolio Committee, regularly reviews investment performance information for the Fund, together with comparative information for appropriate benchmarks and/or peer groups of similarly-managed funds, over different time horizons. The Directors also review detailed performance information during the management agreement approval process. If performance concerns are identified, the Fund receives special reviews until performance improves, during which the Board discusses with the Advisor the reasons for such results (e.g., market conditions, security selection) and any efforts being undertaken to improve performance. The Fund’s performance was above its benchmark for the one-, three-, and ten-year periods and below its benchmark for the five-year period reviewed by the Board. The Board found the investment management services provided by the Advisor to the Fund to be satisfactory and consistent with the management agreement.
Shareholder and Other Services. Under the management agreement, the Advisor provides the Fund with a comprehensive package of transfer agency, shareholder, and other services. The Board, directly and through various committees of the Board, regularly reviews reports and evaluations of such services at its regular meetings. These reports include, but are not limited to, information regarding the operational efficiency and accuracy of the shareholder and transfer agency services provided, staffing levels, shareholder satisfaction (as measured by external as well as internal sources), technology support, new products and services offered to Fund shareholders, securities trading activities, portfolio valuation services, auditing services, and legal and operational
compliance activities. Certain aspects of shareholder and transfer agency service level efficiency and the quality of securities trading activities are measured by independent third party providers and are presented in comparison to other fund groups not managed by the Advisor. The Board found the services provided by the Advisor to the Fund under the management agreement to be competitive and of high quality.
Costs of Services and Profitability. The Advisor provides detailed information concerning its cost of providing various services to the Fund, its profitability in managing the Fund, its overall profitability, and its financial condition. The Directors have reviewed with the Advisor the methodology used to prepare this financial information. The financial information regarding the Advisor is considered in evaluating the Advisor’s financial condition, its ability to continue to provide services under the management agreement, and the reasonableness of the current management fee. The Board concluded that the Advisor’s profits were reasonable in light of the services provided to the Fund.
Ethics. The Board generally considers the Advisor’s commitment to providing quality services to shareholders and to conducting its business ethically. They noted that the Advisor’s practices generally meet or exceed industry best practices.
Economies of Scale. The Board also reviewed information provided by the Advisor regarding the possible existence of economies of scale in connection with the management of the Fund. The Board concluded that economies of scale are difficult to measure and predict with precision, especially on a fund-by-fund basis. The Board concluded that the Advisor is appropriately sharing economies of scale through its competitive fee structure, offering competitive fees from fund inception, and through reinvestment in its business to provide shareholders additional content and services.
Comparison to Other Funds’ Fees. The management agreement provides that the Fund pays the Advisor a single, all-inclusive (or unified) management fee for providing all services necessary for the management and operation of the Fund, other than brokerage expenses, taxes, interest, extraordinary expenses, and the fees and expenses of the Fund’s independent directors (including their independent legal counsel) and expenses incurred in connection with the provision of shareholder services and distribution services under a plan adopted pursuant to Rule 12b-1 under the 1940 Act. Under the unified fee structure, the Advisor is responsible for providing all investment advisory, custody, audit, administrative, compliance, recordkeeping, marketing and shareholder services, or arranging and supervising third parties to provide such services. By contrast, most other funds are charged a variety of fees, including an investment advisory fee, a transfer agency fee, an administrative fee, distribution charges and other expenses. Other than their investment advisory fees and any applicable Rule 12b-1 distribution fees, all other components of the total fees charged by these other funds may be increased without shareholder approval. The Board believes the unified fee structure is a benefit to Fund shareholders because it clearly discloses to shareholders the cost of owning Fund shares, and, since the unified fee cannot be increased without a vote of Fund shareholders, it shifts to the Advisor the risk of increased costs of operating the Fund and provides a direct incentive to minimize administrative inefficiencies. Part of the Board’s analysis of fee levels involves reviewing certain evaluative data compiled by an independent provider and comparing the Fund’s unified fee to the total expense ratio of other funds in the Fund’s peer group. The unified fee charged to shareholders of the Fund was below the median of the total expense ratios of the Fund’s peer group. The Board concluded that the management fee paid by the Fund to the Advisor under the management agreement is reasonable in light of the services provided to the Fund.
Comparison to Fees and Services Provided to Other Clients of the Advisor. The Board also requested and received information from the Advisor concerning the nature of the services, fees, costs and profitability of its advisory services to advisory clients other than the Fund. They observed that these varying types of client accounts require different services and involve different regulatory and entrepreneurial risks than the management of the Fund. The Board analyzed this
information and concluded that the fees charged and services provided to the Fund were reasonable by comparison.
Collateral or “Fall-Out” Benefits Derived by the Advisor. The Board considered the existence of collateral benefits the Advisor may receive as a result of its relationship with the Fund. They concluded that the Advisor’s primary business is managing mutual funds and it generally does not use fund or shareholder information to generate profits in other lines of business, and therefore does not derive any significant collateral benefits from them. The Board noted that the Advisor receives proprietary research from broker-dealers that execute fund portfolio transactions and concluded that this research is likely to benefit Fund shareholders. The Board also determined that the Advisor is able to provide investment management services to certain clients other than the Fund, at least in part, due to its existing infrastructure built to serve the fund complex. The Board concluded, however, that the assets of those other clients are not material to the analysis and, where applicable, may be included with the assets of the Fund to determine breakpoints in the management fee schedule.
Existing Relationship. The Board also considered whether there was any reason for not continuing the existing arrangement with the Advisor. In this regard, the Board was mindful of the potential disruptions of the Fund’s operations and various risks, uncertainties, and other effects that could occur as a result of a decision not to continue such relationship. In particular, the Board recognized that most shareholders have invested in the Fund on the strength of the Advisor’s industry standing and reputation and in the expectation that the Advisor will have a continuing role in providing advisory services to the Fund.
Conclusion of the Directors. As a result of this process, the Board, including all of the independent Directors and assisted by the advice of independent legal counsel, taking into account all of the factors discussed above and the information provided by the Advisor and others, concluded that the management agreement between the Fund and the Advisor is fair and reasonable in light of the services provided and should be renewed.
Retirement Account Information
As required by law, distributions you receive from certain IRAs are subject to federal income tax withholding, unless you elect not to have withholding apply. Tax will be withheld on the total amount withdrawn even though you may be receiving amounts that are not subject to withholding, such as nondeductible contributions. In such case, excess amounts of withholding could occur. You may adjust your withholding election so that a greater or lesser amount will be withheld.
If you don’t want us to withhold on this amount, you must notify us to not withhold the federal income tax. You may notify us in writing or in certain situations by telephone or through other electronic means. For systematic withdrawals, your withholding election will remain in effect until revoked or changed by filing a new election. You have the right to revoke your election at any time.
Remember, even if you elect not to have income tax withheld, you are liable for paying income tax on the taxable portion of your withdrawal. If you elect not to have income tax withheld or you don’t have enough income tax withheld, you may be responsible for payment of estimated tax. You may incur penalties under the estimated tax rules if your withholding and estimated tax payments are not sufficient. You can reduce or defer the income tax on a distribution by directly or indirectly rolling such distribution over to another IRA or eligible plan. You should consult your tax advisor for additional information.
State tax will be withheld if, at the time of your distribution, your address is within one of the mandatory withholding states and you have federal income tax withheld (or as otherwise required by state law). State taxes will be withheld from your distribution in accordance with the respective state rules.
Distributions you receive from 403(b), 457 and qualified plans are subject to special tax and withholding rules. Your plan administrator or plan sponsor is required to provide you with a special tax notice explaining those rules at the time you request a distribution. If applicable, federal and/or state taxes may be withheld from your distribution amount.
Proxy Voting Policies
Descriptions of the principles and policies that the fund's investment advisor uses in exercising the voting rights associated with the securities purchased and/or held by the fund are available without charge, upon request, by calling 1-800-345-2021 or visiting the "About Us" page of American Century Investments’ website at americancentury.com. A description of the policies is also available on the Securities and Exchange Commission’s website at sec.gov. Information regarding how the investment advisor voted proxies relating to portfolio securities during the most recent 12-month period ended June 30 is available on the "About Us" page at americancentury.com. It is also available at sec.gov.
Quarterly Portfolio Disclosure
The fund files its complete schedule of portfolio holdings with the Securities and Exchange Commission (SEC) for the first and third quarters of each fiscal year on Form N-Q. The fund’s Forms N-Q are available on the SEC’s website at sec.gov, and may be reviewed and copied at the SEC’s Public Reference Room in Washington, DC. Information on the operation of the Public Reference Room may be obtained by calling 1-800-SEC-0330. The fund also makes its complete schedule of portfolio holdings for the most recent quarter of its fiscal year available on its website at americancentury.com and, upon request, by calling 1-800-345-2021.
Other Tax Information
The following information is provided pursuant to provisions of the Internal Revenue Code.
The fund hereby designates up to the maximum amount allowable as qualified dividend income for the fiscal year ended June 30, 2014.
For corporate taxpayers, the fund hereby designates $40,915,981, or up to the maximum amount allowable, of ordinary income distributions paid during the fiscal year ended June 30, 2014 as qualified for the corporate dividends received deduction.
|
| | |
| |
| | | |
| Contact Us | americancentury.com | |
| Automated Information Line | 1-800-345-8765 | |
| Investor Services Representative | 1-800-345-2021
or 816-531-5575 | |
| Investors Using Advisors | 1-800-378-9878 | |
Business, Not-For-Profit, Employer-Sponsored
Retirement Plans | 1-800-345-3533 | |
Banks and Trust Companies, Broker-Dealers,
Financial Professionals, Insurance Companies | 1-800-345-6488 | |
| Telecommunications Relay Service for the Deaf | 711 | |
| | | |
| American Century Quantitative Equity Funds, Inc. | |
| | | |
Investment Advisor: American Century Investment Management, Inc. Kansas City, Missouri | |
| | | |
| This report and the statements it contains are submitted for the general information of our shareholders. The report is not authorized for distribution to prospective investors unless preceded or accompanied by an effective prospectus. | |
| | | |
©2014 American Century Proprietary Holdings, Inc. All rights reserved.
CL-ANN-82887 1408 | |
|
| |
ANNUAL REPORT | JUNE 30, 2014 |
International Core Equity Fund
|
| |
| President's Letter | |
| Performance | |
| Portfolio Commentary | |
| Fund Characteristics | |
| Shareholder Fee Example | |
| Schedule of Investments | |
| Statement of Assets and Liabilities | |
| Statement of Operations | |
| Statement of Changes in Net Assets | |
| Notes to Financial Statements | |
| Financial Highlights | |
| Report of Independent Registered Public Accounting Firm | |
| Management | |
| Approval of Management Agreement | |
| Additional Information | |
Any opinions expressed in this report reflect those of the author as of the date of the report, and do not necessarily represent the opinions of American Century Investments® or any other person in the American Century Investments organization. Any such opinions are subject to change at any time based upon market or other conditions and American Century Investments disclaims any responsibility to update such opinions. These opinions may not be relied upon as investment advice and, because investment decisions made by American Century Investments funds are based on numerous factors, may not be relied upon as an indication of trading intent on behalf of any American Century Investments fund. Security examples are used for representational purposes only and are not intended as recommendations to purchase or sell securities. Performance information for comparative indices and securities is provided to American Century Investments by third party vendors. To the best of American Century Investments’ knowledge, such information is accurate at the time of printing.
|
| |
| Dear Investor:
Thank you for reviewing this annual report for the 12 months ended June 30, 2014. It provides investment performance and portfolio information for the reporting period, plus longer-term historical performance data.
Annual reports remain important vehicles for conveying information about fund returns, including market and economic factors that affected performance during the reporting period. For additional, updated investment and market insights, we encourage you to visit our website, americancentury.com.
|
| Jonathan Thomas |
Aggressive Monetary Policies Boosted Stock and Bond Returns
Stimulative monetary policies and expectations of economic improvement, interspersed with concerns about weaker-than-expected economic data and geopolitical conflicts, helped drive financial market returns during the reporting period. We believe the combination of longer-term optimism about global economic growth, low costs of capital, and central bank purchases of fixed income securities helped persuade investors to seek risk and yield, especially in the U.S. and Europe. Stock index returns were strong in these markets, particularly at the smaller capitalization end of the company size spectrum. The MSCI Europe and S&P 500® indices advanced 29.28% and 24.61%, respectively.
Remarkably, for a period in which stock market performance was so strong, government bond performance was also generally positive. Not surprisingly, U.S. corporate high-yield bonds posted double-digit returns, but the 30-year U.S. Treasury bond also outperformed most broader bond market measures. In addition, a generally weaker U.S. dollar during the reporting period meant that international bond returns for U.S. investors with currency exposure were generally higher than U.S. bonds returns. The Barclays Global Aggregate Bond and Barclays U.S. Aggregate Bond indices returned 7.39% and 4.37%, respectively.
Looking ahead, we see signs of sustained moderate economic growth in the second half of 2014, but headwinds persist. In the U.S., which was supposed to be an economic growth leader this year, housing market momentum has slowed, interest rates could rise, and economic growth and U.S. employment levels remain subpar compared with past post-recession periods. In this environment, we continue to believe in a disciplined, diversified, long-term investment approach, using professionally managed stock and bond portfolios—as appropriate—for meeting financial goals. We appreciate your continued trust in us.
Sincerely,
Jonathan Thomas
President and Chief Executive Officer
American Century Investments
|
| | | | | |
| Total Returns as of June 30, 2014 |
| | Average Annual Returns | |
| | Ticker Symbol | 1 year | 5 years | Since Inception | Inception Date |
| Investor Class | ACIMX | 26.15% | 13.14% | 2.45% | 11/30/06 |
| MSCI EAFE Index | — | 23.57% | 11.76% | 2.68% | — |
| Institutional Class | ACIUX | 26.37% | 13.35% | 2.65% | 11/30/06 |
| A Class | ACIQX | | | | 11/30/06 |
| No sales charge* | | 25.87% | 12.87% | 2.20% | |
| With sales charge* | | 18.68% | 11.56% | 1.41% | |
| C Class | ACIKX | 24.92% | 11.99% | 1.43% | 11/30/06 |
| R Class | ACIRX | 25.62% | 12.58% | 1.94% | 11/30/06 |
| |
| * | Sales charges include initial sales charges and contingent deferred sales charges (CDSCs), as applicable. A Class shares have a 5.75% maximum initial sales charge and may be subject to a maximum CDSC of 1.00%. C Class shares redeemed within 12 months of purchase are subject to a maximum CDSC of 1.00%. The SEC requires that mutual funds provide performance information net of maximum sales charges in all cases where charges could be applied. |
Data presented reflect past performance. Past performance is no guarantee of future results. Current performance may be higher or lower than the performance shown. Investment return and principal value will fluctuate, and redemption value may be more or less than original cost. To obtain performance data current to the most recent month end, please call 1-800-345-2021 or visit americancentury.com. International investing involves special risks, such as political instability and currency fluctuations. Investing in emerging markets may accentuate these risks. The fund’s investment process may result in high portfolio turnover, which could mean high transaction costs, affecting both performance and capital gains tax liabilities to investors.
Unless otherwise indicated, performance reflects Investor Class shares; performance for other share classes will vary due to differences in fee structure. For information about other share classes available, please consult the prospectus. Data assumes reinvestment of dividends and capital gains, and none of the charts reflect the deduction of taxes that a shareholder would pay on fund distributions or the redemption of fund shares. Returns for the index are provided for comparison. The fund’s total returns include operating expenses (such as transaction costs and management fees) that reduce returns, while the total returns of the index do not.
|
|
| Growth of $10,000 Over Life of Class |
| $10,000 investment made November 30, 2006 |
|
| |
| Value on June 30, 2014 |
| | Investor Class — $12,014 |
| |
| | MSCI EAFE Index — $12,223 |
| |
*From November 30, 2006, the Investor Class’s inception date. Not annualized.
|
| | | | |
| Total Annual Fund Operating Expenses |
| Investor Class | Institutional Class | A Class | C Class | R Class |
| 1.16% | 0.96% | 1.41% | 2.16% | 1.66% |
The total annual fund operating expenses shown is as stated in the fund’s prospectus current as of the date of this report. The prospectus may vary from the expense ratio shown elsewhere in this report because it is based on a different time period, includes acquired fund fees and expenses, and, if applicable, does not include fee waivers or expense reimbursements.
Data presented reflect past performance. Past performance is no guarantee of future results. Current performance may be higher or lower than the performance shown. Investment return and principal value will fluctuate, and redemption value may be more or less than original cost. To obtain performance data current to the most recent month end, please call 1-800-345-2021 or visit americancentury.com. International investing involves special risks, such as political instability and currency fluctuations. Investing in emerging markets may accentuate these risks. The fund’s investment process may result in high portfolio turnover, which could mean high transaction costs, affecting both performance and capital gains tax liabilities to investors.
Unless otherwise indicated, performance reflects Investor Class shares; performance for other share classes will vary due to differences in fee structure. For information about other share classes available, please consult the prospectus. Data assumes reinvestment of dividends and capital gains, and none of the charts reflect the deduction of taxes that a shareholder would pay on fund distributions or the redemption of fund shares. Returns for the index are provided for comparison. The fund’s total returns include operating expenses (such as transaction costs and management fees) that reduce returns, while the total returns of the index do not.
Portfolio Managers: Elizabeth Xie, Yulin Long, and Vinod Chandrashekaran
Performance Summary
International Core Equity returned 26.15%* for the fiscal year ended June 30, 2014, compared with the 23.57% return of the fund’s benchmark, the MSCI EAFE Index.
International Core Equity posted strong gains, outperforming the MSCI EAFE Index. Individual stock selection was the primary driver of outperformance relative to the index, particularly in the industrials sector, although most sectors contributed positively to results. From a geographical perspective, European-based holdings, especially in the U.K. and France, were leading contributors to outperformance. Stock selection in Japan also added value, while Asia Pacific-based holdings generally detracted from returns. The fund’s stock selection process incorporates factors of valuation, quality, and momentum (sentiment) while striving to minimize unintended risks along industries and other risk characteristics. Stock selection insights based on momentum and select valuation measures were key drivers of performance.
Industrials Holdings Outperformed
The industrials sector was among the best-performing sectors of the index, rising as economic recovery progressed around the globe, albeit slowly, and companies benefited from rising orders. Stock selection in the industrials sector produced significant contribution to outperformance, with securities in the electrical equipment and construction and engineering industries particularly beneficial to results. Significant contribution came from Vestas Wind Systems, a Denmark-based manufacturer of wind turbines, whose recent restructuring and cost-cutting program led to an unexpected quarterly profit, bolstering the company’s stock price. Bouygues, a France-based diversified construction and telecommunications conglomerate, was also a prominent contributor, appreciating steadily throughout the year amid speculation about several merger opportunities. A portfolio-only position in Berendsen, a U.K.-based provider of textile maintenance services, was also beneficial as the holding rallied over 50% during the year.
The fund’s stock selection in the utilities sector also added to returns relative to the MSCI EAFE Index. The sector’s holdings, especially among electric utilities, outperformed their index counterparts helping to drive fund outperformance. Overweight positions in several electrical and gas service distributors were key contributors to sector results. These included Portugal-based EDP, who’s stock appreciated over 60%. Likewise, France-based GDF Suez, which is particularly strong across value and momentum, also produced substantial gains.
Other leading individual positions that bolstered the fund’s results included U.K.-based global pharmaceuticals manufacturer AstraZeneca, which appreciated on discussions of an acquisition by industry rival Pfizer. Japan-based technology equipment manufacturer Seiko Epson also aided portfolio outperformance, benefiting from a weak yen for much of the period and from generally positive economic news, including the easing of deflationary pressures in Japan, at period-end.
*All fund returns referenced in this commentary are for Investor Class shares. Performance for other share
classes will vary due to differences in fee structure; when Investor Class performance exceeds that of the
fund's benchmark, other share classes may not. See page 3 for returns for all share classes.
Consumer Discretionary Holdings Lagged
The consumer discretionary sector was the only sector to impart a negative relative impact on the portfolio, driven by difficult stock selection in holdings aligned with automobile production. Specifically, automobile and automobile component manufacturers cumulatively accounted for the majority of the sector’s underperformance. Overweight positioning in Japan-based Mitsubishi Motors proved difficult early in the fiscal year as the company’s stock declined following a recall of its minicars. Despite these difficulties, we believe that the holding remains very appealing on factors of sentiment and value. The fund was negatively impacted by not holding German-based car and truck manufacturer Daimler due to that company’s strongly advancing stock. We maintain this positioning based on very weak quality insights that continue to make the holding unsuitable for addition to the fund. Elsewhere in the sector, Japan-based Sony was a main underperformer, falling over 15% during the period. The position was ultimately sold.
Other prominent individual detractors from returns included a non-index position in Australia-based mining company Regis Resources, which declined on falling gold and precious metals prices. An overweight position in U.K.-based integrated energy company Centrica also hurt results. The company scaled back revenue guidance based on lower demand for its gas and electricity services, but its strength across valuation- and quality-based signals continues to make it an attractive portfolio holding.
A Look Ahead
We believe that global economic growth will continue to progress, albeit at a slower pace than during prior post-recessionary periods, and we expect it to stay the course through the remainder of 2014. Despite mixed data, we think that Europe seems poised to continue its rebound, especially those countries and sectors that have made meaningful progress in structural reform. It appears the effects of Japan’s recent consumer tax increase were not as dramatic as initially feared, and we continue to closely monitor the long-term effectiveness of economic reforms, namely corporate tax cuts, which could be a positive step for the country’s economy. Though a continuation of political instability in non-U.S. markets as well as the potential for rising inflation and interest rates could lead to heightened levels of market volatility, our disciplined, objective, and systematic investment strategy is designed to take advantage of opportunities at the individual company level. We believe this approach is the most powerful way to capitalize on market inefficiencies that lead to the mispricing of individual stocks.
|
| |
| JUNE 30, 2014 | |
| Top Ten Holdings | % of net assets |
| Roche Holding AG | 2.5% |
| Nestle SA | 2.5% |
| Royal Dutch Shell plc, B Shares | 2.3% |
| GlaxoSmithKline plc | 1.9% |
| HSBC Holdings plc | 1.8% |
| Banco Santander SA | 1.8% |
| Siemens AG | 1.4% |
| iShares MSCI EAFE ETF | 1.4% |
| Imperial Tobacco Group plc | 1.3% |
| Total SA | 1.3% |
| | |
| Investments by Country | % of net assets |
| Japan | 20.2% |
| United Kingdom | 19.8% |
| France | 10.0% |
| Germany | 9.1% |
| Switzerland | 8.1% |
| Australia | 7.7% |
| Hong Kong | 3.4% |
| Sweden | 2.8% |
| Spain | 2.6% |
| Netherlands | 2.4% |
| Singapore | 2.4% |
| Denmark | 2.3% |
| Other Countries | 7.1% |
| Exchange-Traded Funds | 1.4% |
| Cash and Equivalents* | 0.7% |
| *Includes temporary cash investments and other assets and liabilities. | |
| | |
| Types of Investments in Portfolio | % of net assets |
| Foreign Common Stocks | 97.9% |
| Exchange-Traded Funds | 1.4% |
| Total Equity Exposure | 99.3% |
| Temporary Cash Investments | 1.3% |
| Other Assets and Liabilities | (0.6)% |
Fund shareholders may incur two types of costs: (1) transaction costs, including sales charges (loads) on purchase payments and redemption/exchange fees; and (2) ongoing costs, including management fees; distribution and service (12b-1) fees; and other fund expenses. This example is intended to help you understand your ongoing costs (in dollars) of investing in your fund and to compare these costs with the ongoing cost of investing in other mutual funds.
The example is based on an investment of $1,000 made at the beginning of the period and held for the entire period from January 1, 2014 to June 30, 2014.
Actual Expenses
The table provides information about actual account values and actual expenses for each class. You may use the information, together with the amount you invested, to estimate the expenses that you paid over the period. First, identify the share class you own. Then simply divide your account value by $1,000 (for example, an $8,600 account value divided by $1,000 = 8.6), then multiply the result by the number under the heading “Expenses Paid During Period” to estimate the expenses you paid on your account during this period.
If you hold Investor Class shares of any American Century Investments fund, or Institutional Class shares of the American Century Diversified Bond Fund, in an American Century Investments account (i.e., not a financial intermediary or retirement plan account), American Century Investments may charge you a $12.50 semiannual account maintenance fee if the value of those shares is less than $10,000. We will redeem shares automatically in one of your accounts to pay the $12.50 fee. In determining your total eligible investment amount, we will include your investments in all personal accounts (including American Century Investments Brokerage accounts) registered under your Social Security number. Personal accounts include individual accounts, joint accounts, UGMA/UTMA accounts, personal trusts, Coverdell Education Savings Accounts and IRAs (including traditional, Roth, Rollover, SEP-, SARSEP- and SIMPLE-IRAs), and certain other retirement accounts. If you have only business, business retirement, employer-sponsored or American Century Investments Brokerage accounts, you are currently not subject to this fee. If you are subject to the Account Maintenance Fee, your account value could be reduced by the fee amount.
Hypothetical Example for Comparison Purposes
The table also provides information about hypothetical account values and hypothetical expenses based on the actual expense ratio of each class of your fund and an assumed rate of return of 5% per year before expenses, which is not the actual return of a fund’s share class. The hypothetical account values and expenses may not be used to estimate the actual ending account balance or expenses you paid for the period. You may use this information to compare the ongoing costs of investing in your fund and other funds. To do so, compare this 5% hypothetical example with the 5% hypothetical examples that appear in the shareholder reports of the other funds.
Please note that the expenses shown in the table are meant to highlight your ongoing costs only and do not reflect any transactional costs, such as sales charges (loads) or redemption/exchange fees. Therefore, the table is useful in comparing ongoing costs only, and will not help you determine the relative total costs of owning different funds. In addition, if these transactional costs were included, your costs would have been higher.
|
| | | | |
| | Beginning Account Value 1/1/14 | Ending Account Value 6/30/14 | Expenses Paid During Period(1) 1/1/14 – 6/30/14 | Annualized Expense Ratio(1) |
| Actual |
| Investor Class | $1,000 | $1,072.00 | $5.96 | 1.16% |
| Institutional Class | $1,000 | $1,071.90 | $4.93 | 0.96% |
| A Class | $1,000 | $1,070.90 | $7.24 | 1.41% |
| C Class | $1,000 | $1,066.50 | $11.07 | 2.16% |
| R Class | $1,000 | $1,068.70 | $8.51 | 1.66% |
| Hypothetical |
| Investor Class | $1,000 | $1,019.04 | $5.81 | 1.16% |
| Institutional Class | $1,000 | $1,020.03 | $4.81 | 0.96% |
| A Class | $1,000 | $1,017.80 | $7.05 | 1.41% |
| C Class | $1,000 | $1,014.08 | $10.79 | 2.16% |
| R Class | $1,000 | $1,016.56 | $8.30 | 1.66% |
| |
| (1) | Expenses are equal to the class’s annualized expense ratio listed in the table above, multiplied by the average account value over the period, multiplied by 181, the number of days in the most recent fiscal half-year, divided by 365, to reflect the one-half year period. |
JUNE 30, 2014
|
| | | | | |
| | Shares | Value |
| COMMON STOCKS — 97.9% | | |
| AUSTRALIA — 7.7% | | |
| Australia & New Zealand Banking Group Ltd. | 6,503 |
| $ | 204,441 |
|
| Bendigo and Adelaide Bank Ltd. | 6,547 |
| 75,317 |
|
| BHP Billiton Ltd. | 1,733 |
| 58,665 |
|
| Coca-Cola Amatil Ltd. | 8,209 |
| 73,227 |
|
| Commonwealth Bank of Australia | 729 |
| 55,598 |
|
| Downer EDI Ltd. | 6,303 |
| 26,864 |
|
| Fortescue Metals Group Ltd. | 36,222 |
| 148,577 |
|
| Insurance Australia Group Ltd. | 30,098 |
| 165,744 |
|
| Mineral Resources Ltd. | 10,247 |
| 92,662 |
|
| Orica Ltd. | 4,683 |
| 86,020 |
|
| Regis Resources Ltd. | 49,676 |
| 76,821 |
|
| Telstra Corp. Ltd. | 41,910 |
| 205,894 |
|
| Westpac Banking Corp. | 4,145 |
| 132,421 |
|
| | | 1,402,251 |
|
| AUSTRIA — 0.1% | | |
| Raiffeisen Bank International AG | 715 |
| 22,827 |
|
| BELGIUM — 0.6% | | |
| Delhaize Group SA | 882 |
| 59,673 |
|
KBC Groep NV(1) | 1,058 |
| 57,587 |
|
| | | 117,260 |
|
| DENMARK — 2.3% | | |
| AP Moeller - Maersk A/S, B Shares | 58 |
| 144,125 |
|
| H. Lundbeck A/S | 6,201 |
| 152,609 |
|
Vestas Wind Systems A/S(1) | 2,434 |
| 122,799 |
|
| | | 419,533 |
|
| FINLAND — 0.4% | | |
| Kone Oyj, B Shares | 177 |
| 7,388 |
|
Outokumpu Oyj(1) | 5,812 |
| 58,454 |
|
| | | 65,842 |
|
| FRANCE — 10.0% | | |
| AXA SA | 1,008 |
| 24,092 |
|
| Bouygues SA | 3,938 |
| 163,872 |
|
| Cie Generale des Etablissements Michelin, Class B | 1,153 |
| 137,766 |
|
| Credit Agricole SA | 6,955 |
| 98,092 |
|
| Faurecia | 2,369 |
| 89,401 |
|
| GDF Suez | 8,621 |
| 237,334 |
|
| Metropole Television SA | 8,727 |
| 177,277 |
|
| Orange SA | 12,012 |
| 189,564 |
|
| Societe Generale SA | 1,393 |
| 72,969 |
|
| Suez Environnement Co. | 7,112 |
| 136,144 |
|
| Total SA | 3,342 |
| 241,532 |
|
|
| | | | | |
| | Shares | Value |
| Valeo SA | 379 |
| $ | 50,905 |
|
| Vinci SA | 2,674 |
| 199,918 |
|
| | | 1,818,866 |
|
| GERMANY — 9.1% | | |
| Allianz SE | 991 |
| 165,144 |
|
| BASF SE | 2,004 |
| 233,329 |
|
| Bayer AG | 375 |
| 52,966 |
|
| Continental AG | 398 |
| 92,184 |
|
| Deutsche Lufthansa AG | 3,743 |
| 80,365 |
|
| Deutsche Telekom AG | 7,363 |
| 129,052 |
|
| Duerr AG | 428 |
| 37,977 |
|
| E.ON AG | 872 |
| 18,006 |
|
| Hannover Rueck SE | 188 |
| 16,941 |
|
| Merck KGaA | 1,172 |
| 101,729 |
|
Metro AG(1) | 1,071 |
| 46,679 |
|
| Muenchener Rueckversicherungs AG | 249 |
| 55,201 |
|
OSRAM Licht AG(1) | 1,553 |
| 78,330 |
|
| ProSiebenSat.1 Media AG | 4,114 |
| 183,279 |
|
| RWE AG | 1,151 |
| 49,433 |
|
| Siemens AG | 1,966 |
| 259,648 |
|
| Suedzucker AG | 3,340 |
| 67,459 |
|
| | | 1,667,722 |
|
| HONG KONG — 3.4% | | |
| BOC Hong Kong Holdings Ltd. | 7,500 |
| 21,725 |
|
| Hang Seng Bank Ltd. | 11,400 |
| 186,215 |
|
| Li & Fung Ltd. | 42,000 |
| 62,211 |
|
| Link Real Estate Investment Trust (The) | 39,000 |
| 209,834 |
|
| Sands China Ltd. | 2,400 |
| 18,131 |
|
| SJM Holdings Ltd. | 49,000 |
| 122,778 |
|
| | | 620,894 |
|
| ISRAEL — 1.2% | | |
| Bank Hapoalim BM | 27,172 |
| 157,101 |
|
| Teva Pharmaceutical Industries Ltd. | 1,120 |
| 59,207 |
|
| | | 216,308 |
|
| ITALY — 1.6% | | |
| ENI SpA | 5,605 |
| 153,345 |
|
| Exor SpA | 826 |
| 33,920 |
|
Fiat SpA(1) | 2,645 |
| 26,113 |
|
Mediaset SpA(1) | 17,968 |
| 87,589 |
|
| | | 300,967 |
|
| JAPAN — 20.2% | | |
| Aeon Co. Ltd. | 2,300 |
| 28,289 |
|
| Asahi Kasei Corp. | 19,000 |
| 145,353 |
|
| Astellas Pharma, Inc. | 5,000 |
| 65,693 |
|
| Bridgestone Corp. | 4,800 |
| 167,968 |
|
| Canon, Inc. | 6,400 |
| 208,227 |
|
| Central Japan Railway Co. | 900 |
| 128,375 |
|
|
| | | | | |
| | Shares | Value |
| Daito Trust Construction Co. Ltd. | 1,600 |
| $ | 188,105 |
|
| FamilyMart Co. Ltd. | 2,700 |
| 116,337 |
|
| Fuji Heavy Industries Ltd. | 6,900 |
| 191,052 |
|
| FUJIFILM Holdings Corp. | 6,100 |
| 170,105 |
|
| Fukuoka Financial Group, Inc. | 5,000 |
| 24,135 |
|
Gree, Inc.(1) | 2,100 |
| 18,408 |
|
| Hino Motors Ltd. | 3,100 |
| 42,688 |
|
| Hoya Corp. | 2,000 |
| 66,453 |
|
| Japan Airlines Co. Ltd. | 2,700 |
| 149,252 |
|
| JGC Corp. | 3,000 |
| 91,150 |
|
| Kao Corp. | 5,000 |
| 196,782 |
|
| KDDI Corp. | 1,600 |
| 97,590 |
|
| Konica Minolta Holdings, Inc. | 14,000 |
| 138,335 |
|
| KYORIN Holdings, Inc. | 2,200 |
| 45,257 |
|
| Lawson, Inc. | 600 |
| 45,013 |
|
| Mitsubishi Electric Corp. | 16,000 |
| 197,424 |
|
| Mitsubishi Motors Corp. | 5,300 |
| 58,491 |
|
| Mochida Pharmaceutical Co. Ltd. | 600 |
| 43,058 |
|
| Nippon Telegraph & Telephone Corp. | 1,600 |
| 99,786 |
|
| NTT Data Corp. | 1,700 |
| 65,278 |
|
| NTT DoCoMo, Inc. | 1,900 |
| 32,484 |
|
| Otsuka Holdings Co. Ltd. | 1,100 |
| 34,095 |
|
| Panasonic Corp. | 13,900 |
| 169,316 |
|
| Seiko Epson Corp. | 1,700 |
| 72,326 |
|
| Seven & I Holdings Co. Ltd. | 1,800 |
| 75,834 |
|
| Seven Bank Ltd. | 27,500 |
| 112,383 |
|
| Shin-Etsu Chemical Co. Ltd. | 2,100 |
| 127,652 |
|
| Showa Shell Sekiyu KK | 1,000 |
| 11,362 |
|
| Sumitomo Chemical Co. Ltd. | 18,000 |
| 68,052 |
|
| Sumitomo Mitsui Financial Group, Inc. | 600 |
| 25,136 |
|
| Suzuki Motor Corp. | 600 |
| 18,793 |
|
| TDK Corp. | 2,900 |
| 135,976 |
|
| Toyota Motor Corp. | 400 |
| 24,022 |
|
| | | 3,696,035 |
|
| NETHERLANDS — 2.4% | | |
ING Groep NV CVA(1) | 16,760 |
| 235,462 |
|
| Koninklijke Ahold NV | 11,283 |
| 211,817 |
|
| | | 447,279 |
|
| NEW ZEALAND — 0.8% | | |
| Telecom Corp. of New Zealand Ltd. | 65,862 |
| 154,544 |
|
| NORWAY — 1.5% | | |
| Statoil ASA | 5,780 |
| 177,532 |
|
| TGS Nopec Geophysical Co. ASA | 1,209 |
| 38,652 |
|
| Yara International ASA | 1,286 |
| 64,427 |
|
| | | 280,611 |
|
| PORTUGAL — 0.9% | | |
| EDP - Energias de Portugal SA | 31,050 |
| 155,781 |
|
|
| | | | | |
| | Shares | Value |
| SINGAPORE — 2.4% | | |
| ComfortDelGro Corp. Ltd. | 35,000 |
| $ | 70,174 |
|
| Singapore Post Ltd. | 157,000 |
| 218,458 |
|
| United Overseas Bank Ltd. | 8,000 |
| 144,486 |
|
| | | 433,118 |
|
| SPAIN — 2.6% | | |
| Banco Santander SA | 31,119 |
| 325,124 |
|
Fomento de Construcciones y Contratas SA(1) | 1,165 |
| 27,167 |
|
| Gas Natural SDG SA | 1,808 |
| 57,102 |
|
| Mapfre SA | 17,356 |
| 69,181 |
|
| | | 478,574 |
|
| SWEDEN — 2.8% | | |
| Hennes & Mauritz AB, B Shares | 3,892 |
| 170,090 |
|
| Industrivarden AB, C Shares | 2,470 |
| 48,797 |
|
| Intrum Justitia AB | 2,241 |
| 66,879 |
|
| Investor AB, B Shares | 5,182 |
| 194,435 |
|
| Telefonaktiebolaget LM Ericsson, B Shares | 1,947 |
| 23,530 |
|
| | | 503,731 |
|
| SWITZERLAND — 8.1% | | |
| Givaudan SA | 11 |
| 18,346 |
|
| Lonza Group AG | 279 |
| 30,360 |
|
| Nestle SA | 5,853 |
| 453,429 |
|
| Novartis AG | 1,313 |
| 118,893 |
|
| Roche Holding AG | 1,552 |
| 462,905 |
|
Schmolz + Bickenbach AG(1) | 17,523 |
| 28,059 |
|
| Sika AG | 7 |
| 28,622 |
|
| Straumann Holding AG | 157 |
| 36,364 |
|
| Swiss Reinsurance Co. | 616 |
| 54,806 |
|
| Zurich Financial Services AG | 796 |
| 239,931 |
|
| | | 1,471,715 |
|
| UNITED KINGDOM — 19.8% | | |
Afren plc(1) | 8,953 |
| 22,217 |
|
| Antofagasta plc | 8,272 |
| 108,016 |
|
| AstraZeneca plc | 1,685 |
| 125,167 |
|
| Berendsen plc | 7,363 |
| 123,364 |
|
| BP plc | 3,148 |
| 27,740 |
|
| British American Tobacco plc | 1,586 |
| 94,403 |
|
| British Sky Broadcasting Group plc | 10,062 |
| 155,670 |
|
| Britvic plc | 5,391 |
| 67,120 |
|
| BT Group plc | 24,605 |
| 162,078 |
|
| Catlin Group Ltd. | 5,788 |
| 52,995 |
|
| Centrica plc | 31,831 |
| 170,291 |
|
| Direct Line Insurance Group plc | 40,221 |
| 185,715 |
|
Dixons Retail plc(1) | 189,832 |
| 161,757 |
|
| Experian plc | 2,152 |
| 36,387 |
|
| GlaxoSmithKline plc | 12,918 |
| 345,767 |
|
| HSBC Holdings plc | 33,182 |
| 336,694 |
|
|
| | | | | |
| | Shares | Value |
| IMI plc | 1,041 |
| $ | 26,492 |
|
| Imperial Tobacco Group plc | 5,455 |
| 245,529 |
|
Lloyds Banking Group plc(1) | 112,041 |
| 142,372 |
|
| Man Group plc | 5,436 |
| 9,787 |
|
| Marks & Spencer Group plc | 2,836 |
| 20,637 |
|
| QinetiQ Group plc | 10,649 |
| 37,689 |
|
| Reckitt Benckiser Group plc | 396 |
| 34,563 |
|
| Royal Dutch Shell plc, B Shares | 9,576 |
| 416,674 |
|
| Shire plc | 170 |
| 13,296 |
|
| Soco International plc | 20,813 |
| 146,966 |
|
| St. James's Place plc | 4,334 |
| 56,519 |
|
| Standard Chartered plc | 2,157 |
| 44,076 |
|
| Standard Life plc | 28,570 |
| 182,915 |
|
| TUI Travel plc | 9,090 |
| 61,915 |
|
| Vedanta Resources plc | 135 |
| 2,562 |
|
| | | 3,617,373 |
|
TOTAL COMMON STOCKS (Cost $16,016,389) | | 17,891,231 |
|
| EXCHANGE-TRADED FUNDS — 1.4% | | |
iShares MSCI EAFE ETF (Cost $242,728) | 3,636 |
| 248,593 |
|
| TEMPORARY CASH INVESTMENTS — 1.3% | | |
| Repurchase Agreement, Bank of America Merrill Lynch, (collateralized by various U.S. Treasury obligations, 0.75% - 0.875%, 1/31/18 - 2/28/18, valued at $54,007), in a joint trading account at 0.05%, dated 6/30/14, due 7/1/14 (Delivery value $52,921) | | 52,921 |
|
| Repurchase Agreement, Credit Suisse First Boston, Inc., (collateralized by various U.S. Treasury obligations, 1.75%, 5/15/23, valued at $21,610), in a joint trading account at 0.01%, dated 6/30/14, due 7/1/14 (Delivery value $21,168) | | 21,168 |
|
| Repurchase Agreement, Goldman Sachs & Co., (collateralized by various U.S. Treasury obligations, 3.125%, 11/15/41, valued at $43,188), in a joint trading account at 0.03%, dated 6/30/14, due 7/1/14 (Delivery value $42,336) | | 42,336 |
|
| SSgA U.S. Government Money Market Fund, Class N | 125,123 |
| 125,123 |
|
TOTAL TEMPORARY CASH INVESTMENTS (Cost $241,548) | | 241,548 |
|
TOTAL INVESTMENT SECURITIES — 100.6% (Cost $16,500,665) | | 18,381,372 |
|
| OTHER ASSETS AND LIABILITIES — (0.6)% | | (114,422 | ) |
| TOTAL NET ASSETS — 100.0% | | $ | 18,266,950 |
|
|
| | |
| MARKET SECTOR DIVERSIFICATION |
| (as a % of net assets) | |
| Financials | 24.1 | % |
| Industrials | 13.3 | % |
| Consumer Discretionary | 12.2 | % |
| Consumer Staples | 9.9 | % |
| Health Care | 9.3 | % |
| Materials | 6.9 | % |
| Energy | 6.8 | % |
| Telecommunication Services | 5.9 | % |
| Information Technology | 4.9 | % |
| Utilities | 4.6 | % |
| Exchange-Traded Funds | 1.4 | % |
| Cash and Equivalents* | 0.7 | % |
*Includes temporary cash investments and other assets and liabilities.
|
| | |
| NOTES TO SCHEDULE OF INVESTMENTS |
| CVA | - | Certificaten Van Aandelen |
See Notes to Financial Statements.
|
|
| Statement of Assets and Liabilities |
|
| | | |
| JUNE 30, 2014 | |
| Assets | |
| Investment securities, at value (cost of $16,500,665) | $ | 18,381,372 |
|
| Foreign currency holdings, at value (cost of $30,078) | 30,196 |
|
| Receivable for investments sold | 243 |
|
| Receivable for capital shares sold | 75,654 |
|
| Dividends and interest receivable | 59,601 |
|
| | 18,547,066 |
|
| | |
| Liabilities | |
| Payable for capital shares redeemed | 260,625 |
|
| Accrued management fees | 17,136 |
|
| Distribution and service fees payable | 2,355 |
|
| | 280,116 |
|
| | |
| Net Assets | $ | 18,266,950 |
|
| | |
| Net Assets Consist of: | |
| Capital (par value and paid-in surplus) | $ | 18,171,013 |
|
| Undistributed net investment income | 284,153 |
|
| Accumulated net realized loss | (2,069,451 | ) |
| Net unrealized appreciation | 1,881,235 |
|
| | $ | 18,266,950 |
|
|
| | | | | | |
| | Net Assets | Shares Outstanding | Net Asset Value Per Share |
| Investor Class, $0.01 Par Value |
| $11,859,466 |
| 1,225,187 |
| $9.68 |
| Institutional Class, $0.01 Par Value |
| $920,880 |
| 95,000 |
| $9.69 |
| A Class, $0.01 Par Value |
| $3,163,544 |
| 327,182 |
| $9.67* |
| C Class, $0.01 Par Value |
| $1,081,415 |
| 112,438 |
| $9.62 |
| R Class, $0.01 Par Value |
| $1,241,645 |
| 128,690 |
| $9.65 |
*Maximum offering price $10.26 (net asset value divided by 0.9425).
See Notes to Financial Statements.
|
| | | |
| YEAR ENDED JUNE 30, 2014 |
| Investment Income (Loss) |
| Income: | |
| Dividends (net of foreign taxes withheld of $42,053) | $ | 530,322 |
|
| Interest | 49 |
|
| | 530,371 |
|
| | |
| Expenses: | |
| Management fees | 160,327 |
|
| Distribution and service fees: | |
| A Class | 10,131 |
|
| C Class | 11,365 |
|
| R Class | 6,662 |
|
| Directors' fees and expenses | 815 |
|
| Other expenses | 383 |
|
| | 189,683 |
|
| | |
| Net investment income (loss) | 340,688 |
|
| | |
| Realized and Unrealized Gain (Loss) |
| Net realized gain (loss) on: | |
| Investment transactions | 1,190,378 |
|
| Foreign currency transactions | 1,092 |
|
| | 1,191,470 |
|
| | |
| Change in net unrealized appreciation (depreciation) on: | |
| Investments | 1,252,633 |
|
| Translation of assets and liabilities in foreign currencies | 1,844 |
|
| | 1,254,477 |
|
| | |
| Net realized and unrealized gain (loss) | 2,445,947 |
|
| | |
| Net Increase (Decrease) in Net Assets Resulting from Operations | $ | 2,786,635 |
|
See Notes to Financial Statements.
|
|
| Statement of Changes in Net Assets |
|
| | | | | | |
| YEARS ENDED JUNE 30, 2014 AND JUNE 30, 2013 | | |
| Increase (Decrease) in Net Assets | June 30, 2014 | June 30, 2013 |
| Operations | | |
| Net investment income (loss) | $ | 340,688 |
| $ | 174,437 |
|
| Net realized gain (loss) | 1,191,470 |
| 465,632 |
|
| Change in net unrealized appreciation (depreciation) | 1,254,477 |
| 502,165 |
|
| Net increase (decrease) in net assets resulting from operations | 2,786,635 |
| 1,142,234 |
|
| | | |
| Distributions to Shareholders | | |
| From net investment income: | | |
| Investor Class | (77,129 | ) | (67,431 | ) |
| Institutional Class | (8,863 | ) | (16,249 | ) |
| A Class | (77,654 | ) | (65,085 | ) |
| C Class | (2,727 | ) | (18,335 | ) |
| R Class | (10,425 | ) | (24,988 | ) |
| Decrease in net assets from distributions | (176,798 | ) | (192,088 | ) |
| | | |
| Capital Share Transactions | | |
Net increase (decrease) in net assets from capital share transactions (Note 5) | 7,825,443 |
| 1,205,213 |
|
| | | |
| Redemption Fees | | |
| Increase in net assets from redemption fees | 2,244 |
| 257 |
|
| | | |
| Net increase (decrease) in net assets | 10,437,524 |
| 2,155,616 |
|
| | | |
| Net Assets | | |
| Beginning of period | 7,829,426 |
| 5,673,810 |
|
| End of period | $ | 18,266,950 |
| $ | 7,829,426 |
|
| | | |
| Undistributed net investment income | $ | 284,153 |
| $ | 119,171 |
|
See Notes to Financial Statements.
|
|
| Notes to Financial Statements |
JUNE 30, 2014
1. Organization
American Century Quantitative Equity Funds, Inc. (the corporation) is registered under the Investment Company Act of 1940, as amended (the 1940 Act), as an open-end management investment company and is organized as a Maryland corporation. International Core Equity Fund (the fund) is one fund in a series issued by the corporation. The fund is diversified as defined under the 1940 Act. The fund’s investment objective is to seek long-term capital growth.
The fund offers the Investor Class, the Institutional Class, the A Class, the C Class and the R Class. The A Class may incur an initial sales charge. The A Class and C Class may be subject to a contingent deferred sales charge. The share classes differ principally in their respective sales charges and distribution and shareholder servicing expenses and arrangements. The Institutional Class is made available to institutional shareholders or through financial intermediaries whose clients do not require the same level of shareholder and administrative services as shareholders of other classes. As a result, the Institutional Class is charged a lower unified management fee.
2. Significant Accounting Policies
The following is a summary of significant accounting policies consistently followed by the fund in preparation of its financial statements. The financial statements are prepared in conformity with accounting principles generally accepted in the United States of America, which may require management to make certain estimates and assumptions at the date of the financial statements. Actual results could differ from these estimates. Management evaluated the impact of events or transactions occurring through the date the financial statements were issued that would merit recognition or disclosure.
Investment Valuations — The fund determines the fair value of its investments and computes its net asset value per share at the close of regular trading (usually 4 p.m. Eastern time) on the New York Stock Exchange (NYSE) on each day the NYSE is open. The Board of Directors has adopted valuation policies and procedures to guide the investment advisor in the fund’s investment valuation process and to provide methodologies for the oversight of the fund’s pricing function.
Equity securities that are listed or traded on a domestic securities exchange are valued at the last reported sales price or at the official closing price as provided by the exchange. Equity securities traded on foreign securities exchanges are generally valued at the closing price of such securities on the exchange where primarily traded or at the close of the NYSE, if that is earlier. If no last sales price is reported, or if local convention or regulation so provides, the mean of the latest bid and asked prices may be used. Securities traded over-the-counter are valued at the mean of the latest bid and asked prices, the last sales price, or the official closing price. Equity securities initially expressed in local currencies are translated into U.S. dollars at the mean of the appropriate currency exchange rate at the close of the NYSE as provided by an independent pricing service.
Fixed income securities maturing within 60 days at the time of purchase may be valued at cost, plus or minus any amortized discount or premium or at the evaluated mean as provided by an independent pricing service. Evaluated mean prices are commonly derived through utilization of market models, which may consider, among other factors: trade data, quotations from dealers and active market makers, relevant yield curve and spread data, related sector levels, creditworthiness, trade data or market information on comparable securities, and other relevant security specific information.
Open-end management investment companies are valued at the reported net asset value per share. Repurchase agreements are valued at cost, which approximates fair value.
If the fund determines that the market price for an investment is not readily available or the valuation methods mentioned above do not reflect an investment’s fair value, such investment is valued as determined in good faith by the Board of Directors or its delegate, in accordance with policies and procedures adopted by the Board of Directors. In its determination of fair value, the fund may review several factors including, but not limited to, market information regarding the specific investment or comparable investments and correlation with other investment types, futures indices or general market indicators. Circumstances that may cause the
fund to use these procedures to value an investment include, but are not limited to: an investment has been declared in default or is distressed; trading in a security has been suspended during the trading day or a security is not actively trading on its principal exchange; prices received from a regular pricing source are deemed unreliable; or there is a foreign market holiday and no trading occurred.
The fund monitors for significant events occurring after the close of an investment’s primary exchange but before the fund’s net asset value per share is determined. Significant events may include, but are not limited to: corporate announcements and transactions; governmental action and political unrest that could impact a specific investment or an investment sector; or armed conflicts, natural disasters and similar events that could affect investments in a specific country or region. The fund also monitors for significant fluctuations between domestic and foreign markets, as evidenced by the U.S. market or such other indicators that the Board of Directors, or its delegate, deems appropriate. If significant fluctuations in foreign markets are identified, the fund may apply a model-derived factor to the closing price of equity securities traded on foreign securities exchanges. The factor is based on observable market data as provided by an independent pricing service.
Security Transactions — Security transactions are accounted for as of the trade date. Net realized gains and losses are determined on the identified cost basis, which is also used for federal income tax purposes.
Investment Income — Dividend income less foreign taxes withheld, if any, is recorded as of the ex-dividend date. Distributions received on securities that represent a return of capital or long-term capital gain are recorded as a reduction of cost of investments and/or as a realized gain. The fund may estimate the components of distributions received that may be considered nontaxable distributions or long-term capital gain distributions for income tax purposes. Interest income is recorded on the accrual basis and includes accretion of discounts and amortization of premiums.
Foreign Currency Translations — All assets and liabilities initially expressed in foreign currencies are translated into U.S. dollars at prevailing exchange rates at period end. The fund may enter into spot foreign currency exchange contracts to facilitate transactions denominated in a foreign currency. Purchases and sales of investment securities, dividend and interest income, spot foreign currency exchange contracts, and expenses are translated at the rates of exchange prevailing on the respective dates of such transactions. Net realized and unrealized foreign currency exchange gains or losses related to investment securities are a component of net realized gain (loss) on investment transactions and change in net unrealized appreciation (depreciation) on investments, respectively.
Repurchase Agreements — The fund may enter into repurchase agreements with institutions that American Century Investment Management, Inc. (ACIM) (the investment advisor) has determined are creditworthy pursuant to criteria adopted by the Board of Directors. The fund requires that the collateral, represented by securities, received in a repurchase transaction be transferred to the custodian in a manner sufficient to enable the fund to obtain those securities in the event of a default under the repurchase agreement. ACIM monitors, on a daily basis, the securities transferred to ensure the value, including accrued interest, of the securities under each repurchase agreement is equal to or greater than amounts owed to the fund under each repurchase agreement.
Joint Trading Account — Pursuant to an Exemptive Order issued by the Securities and Exchange Commission, the fund, along with certain other funds in the American Century Investments family of funds, may transfer uninvested cash balances into a joint trading account. These balances are invested in one or more repurchase agreements that are collateralized by U.S. Treasury or Agency obligations.
Income Tax Status — It is the fund’s policy to distribute substantially all net investment income and net realized gains to shareholders and to otherwise qualify as a regulated investment company under provisions of the Internal Revenue Code. Accordingly, no provision has been made for income taxes. The fund files U.S. federal, state, local and non-U.S. tax returns as applicable. The fund's tax returns are subject to examination by the relevant taxing authority until expiration of the applicable statute of limitations, which is generally three years from the date of filing but can be longer in certain jurisdictions. At this time, management believes there are no uncertain tax positions which, based on their technical merit, would not be sustained upon examination and for which it is reasonably possible that the total amounts of unrecognized tax benefits will significantly change in the next twelve months.
Multiple Class — All shares of the fund represent an equal pro rata interest in the net assets of the class to which such shares belong, and have identical voting, dividend, liquidation and other rights and the same terms and conditions, except for class specific expenses and exclusive rights to vote on matters affecting only individual classes. Income, non-class specific expenses, and realized and unrealized capital gains and losses of the fund are allocated to each class of shares based on their relative net assets.
Distributions to Shareholders — Distributions from net investment income and net realized gains, if any, are generally declared and paid annually.
Redemption Fees — The fund may impose a 2.00% redemption fee on shares held less than 60 days. The fee may not be applicable to all classes. The redemption fee is retained by the fund and helps cover transaction costs that long-term investors may bear when the fund sells securities to meet investor redemptions.
Indemnifications — Under the corporation’s organizational documents, its officers and directors are indemnified against certain liabilities arising out of the performance of their duties to the fund. In addition, in the normal course of business, the fund enters into contracts that provide general indemnifications. The maximum exposure under these arrangements is unknown as this would involve future claims that may be made against a fund. The risk of material loss from such claims is considered by management to be remote.
3. Fees and Transactions with Related Parties
Certain officers and directors of the corporation are also officers and/or directors of American Century Companies, Inc. (ACC). The corporation’s investment advisor, ACIM, the corporation's distributor, American Century Investment Services, Inc. (ACIS), and the corporation’s transfer agent, American Century Services, LLC, are wholly owned, directly or indirectly, by ACC. ACIM owns 11% of the shares of the fund.
Management Fees — The corporation has entered into a management agreement with ACIM, under which ACIM provides the fund with investment advisory and management services in exchange for a single, unified management fee (the fee) per class. The agreement provides that all expenses of managing and operating the fund, except distribution and service fees, brokerage expenses, taxes, interest, fees and expenses of the independent directors (including legal counsel fees), and extraordinary expenses, will be paid by ACIM. The fee is computed and accrued daily based on each class's daily net assets and paid monthly in arrears. The fee consists of (1) an Investment Category Fee based on the daily net assets of the fund and certain other accounts managed by the investment advisor that are in the same broad investment category as the fund and (2) a Complex Fee based on the assets of all the funds in the American Century Investments family of funds. The rates for the Investment Category Fee range from 0.8180% to 1.0000%. The rates for the Complex Fee range from 0.2500% to 0.3100% for the Investor Class, A Class, C Class and R Class. The rates for the Complex Fee range from 0.0500% to 0.1100% for the Institutional Class. The effective annual management fee for each class for the year ended June 30, 2014 was 1.15% for the Investor Class, A Class, C Class and R Class and 0.95% for the Institutional Class.
Distribution and Service Fees — The Board of Directors has adopted a separate Master Distribution and Individual Shareholder Services Plan for each of the A Class, C Class and R Class (collectively the plans), pursuant to Rule 12b-1 of the 1940 Act. The plans provide that the A Class will pay ACIS an annual distribution and service fee of 0.25%. The plans provide that the C Class will pay ACIS an annual distribution and service fee of 1.00%, of which 0.25% is paid for individual shareholder services and 0.75% is paid for distribution services. The plans provide that the R Class will pay ACIS an annual distribution and service fee of 0.50%. The fees are computed and accrued daily based on each class’s daily net assets and paid monthly in arrears. The fees are used to pay financial intermediaries for distribution and individual shareholder services. Fees incurred under the plans during the year ended June 30, 2014 are detailed in the Statement of Operations.
Directors' Fees and Expenses — The Board of Directors is responsible for overseeing the investment advisor’s management and operations of the fund. The directors receive detailed information about the fund and its investment advisor regularly throughout the year, and meet at least quarterly with management of the investment advisor to review reports about fund operations. Fees and expenses incurred in conjunction with the directors during the year ended June 30, 2014 are detailed in the Statement of Operations. The fund’s officers do not receive compensation from the fund.
4. Investment Transactions
Purchases and sales of investment securities, excluding short-term investments, for the year ended June 30, 2014 were $25,238,405 and $17,301,661, respectively.
5. Capital Share Transactions
Transactions in shares of the fund were as follows:
|
| | | | | | | | | | |
| | Year ended June 30, 2014 | Year ended June 30, 2013 |
| | Shares | Amount | Shares | Amount |
| Investor Class/Shares Authorized | 10,000,000 |
| | 50,000,000 |
| |
| Sold | 994,691 |
| $ | 8,981,121 |
| 202,052 |
| $ | 1,541,413 |
|
| Issued in reinvestment of distributions | 8,579 |
| 75,069 |
| 9,208 |
| 66,666 |
|
| Redeemed | (194,251 | ) | (1,738,719 | ) | (82,972 | ) | (619,598 | ) |
| | 809,019 |
| 7,317,471 |
| 128,288 |
| 988,481 |
|
| Institutional Class/Shares Authorized | 10,000,000 |
| | 50,000,000 |
| |
| Sold | 61,382 |
| 571,684 |
| — |
| — |
|
| Issued in reinvestment of distributions | 1,013 |
| 8,863 |
| 2,244 |
| 16,249 |
|
| Redeemed | (32,166 | ) | (310,273 | ) | (258 | ) | (1,918 | ) |
| | 30,229 |
| 270,274 |
| 1,986 |
| 14,331 |
|
| A Class/Shares Authorized | 10,000,000 |
| | 10,000,000 |
| |
| Sold | 916,070 |
| 8,154,414 |
| 53,752 |
| 405,391 |
|
| Issued in reinvestment of distributions | 8,866 |
| 77,574 |
| 7,572 |
| 54,819 |
|
| Redeemed | (876,480 | ) | (7,879,965 | ) | (60,072 | ) | (447,241 | ) |
| | 48,456 |
| 352,023 |
| 1,252 |
| 12,969 |
|
| C Class/Shares Authorized | 10,000,000 |
| | 10,000,000 |
| |
| Sold | 18,605 |
| 171,940 |
| 20,494 |
| 163,261 |
|
| Issued in reinvestment of distributions | 312 |
| 2,727 |
| 2,528 |
| 18,282 |
|
| Redeemed | (32,628 | ) | (308,683 | ) | (2,404 | ) | (19,042 | ) |
| | (13,711 | ) | (134,016 | ) | 20,618 |
| 162,501 |
|
| R Class/Shares Authorized | 10,000,000 |
| | 10,000,000 |
| |
| Sold | 39,531 |
| 349,832 |
| 300 |
| 2,325 |
|
| Issued in reinvestment of distributions | 1,193 |
| 10,425 |
| 3,456 |
| 24,988 |
|
| Redeemed | (35,560 | ) | (340,566 | ) | (55 | ) | (382 | ) |
| | 5,164 |
| 19,691 |
| 3,701 |
| 26,931 |
|
| Net increase (decrease) | 879,157 |
| $ | 7,825,443 |
| 155,845 |
| $ | 1,205,213 |
|
6. Fair Value Measurements
The fund’s investments valuation process is based on several considerations and may use multiple inputs to determine the fair value of the investments held by the fund. In conformity with accounting principles generally accepted in the United States of America, the inputs used to determine a valuation are classified into three broad levels.
| |
| • | Level 1 valuation inputs consist of unadjusted quoted prices in an active market for identical investments. |
| |
| • | Level 2 valuation inputs consist of direct or indirect observable market data (including quoted prices for comparable investments, evaluations of subsequent market events, interest rates, prepayment speeds, credit risk, etc.). These inputs also consist of quoted prices for identical investments initially expressed in local currencies that are adjusted through translation into U.S. dollars. |
| |
| • | Level 3 valuation inputs consist of unobservable data (including a fund’s own assumptions). |
The level classification is based on the lowest level input that is significant to the fair valuation measurement. The valuation inputs are not necessarily an indication of the risks associated with investing in these securities or other financial instruments.
The following is a summary of the level classifications as of period end. The Schedule of Investments provides additional information on the fund’s portfolio holdings.
|
| | | | | | | | |
| | Level 1 | Level 2 | Level 3 |
| Assets | | | |
| Investment Securities | | | |
| Common Stocks | — |
| $ | 17,891,231 |
| — |
|
| Exchange-Traded Funds | $ | 248,593 |
| — |
| — |
|
| Temporary Cash Investments | 125,123 |
| 116,425 |
| — |
|
| | $ | 373,716 |
| $ | 18,007,656 |
| — |
|
7. Risk Factors
There are certain risks involved in investing in foreign securities. These risks include those resulting from future adverse political, social and economic developments, fluctuations in currency exchange rates, the possible imposition of exchange controls, and other foreign laws or restrictions. Investing in emerging markets may accentuate these risks.
The fund’s investment process may result in high portfolio turnover, which could mean high transaction costs, affecting both performance and capital gains tax liabilities to investors.
8. Federal Tax Information
The tax character of distributions paid during the years ended June 30, 2014 and June 30, 2013 were as follows:
|
| | | | | | |
| | 2014 | 2013 |
| Distributions Paid From | | |
| Ordinary income | $ | 176,798 |
| $ | 192,088 |
|
| Long-term capital gains | — |
| — |
|
The book-basis character of distributions made during the year from net investment income or net realized gains may differ from their ultimate characterization for federal income tax purposes. These differences reflect the differing character of certain income items and net realized gains and losses for financial statement and tax purposes, and may result in reclassification among certain capital accounts on the financial statements.
As of June 30, 2014, the federal tax cost of investments and the components of distributable earnings on a tax-basis were as follows:
|
| | | |
| Federal tax cost of investments | $ | 16,596,121 |
|
| Gross tax appreciation of investments | $ | 2,060,633 |
|
| Gross tax depreciation of investments | (275,382 | ) |
| Net tax appreciation (depreciation) of investments | 1,785,251 |
|
| Net tax appreciation (depreciation) on translation of assets and liabilities in foreign currencies | 528 |
|
| Net tax appreciation (depreciation) | $ | 1,785,779 |
|
| Undistributed ordinary income | $ | 337,750 |
|
| Accumulated short-term capital losses | $ | (2,027,592 | ) |
The difference between book-basis and tax-basis unrealized appreciation (depreciation) is attributable primarily to the realization to ordinary income for tax purposes of unrealized gains on investments in passive foreign investment companies.
Accumulated capital losses represent net capital loss carryovers that may be used to offset future realized capital gains for federal income tax purposes. Future capital loss carryover utilization in any given year may be subject to Internal Revenue Code limitations. Capital loss carryovers of $(47,669) and $(1,979,923) expire in 2017 and 2018, respectively.
|
| | | | | | | | | | | | | |
| For a Share Outstanding Throughout the Years Ended June 30 (except as noted) |
| Per-Share Data | | | Ratios and Supplemental Data | | |
| | | Income From Investment Operations: | | | | Ratio to Average Net Assets of: | | |
| | Net Asset Value, Beginning of Period | Net Investment Income (Loss)(1) | Net Realized and Unrealized Gain (Loss) | Total From Investment Operations | Distributions From Net Investment Income | Net Asset Value, End of Period | Total Return(2) | Operating Expenses | Net Investment Income (Loss) | Portfolio Turnover Rate | Net Assets, End of Period (in thousands) |
| Investor Class | | | | | | | |
| 2014 | $7.77 | 0.26 | 1.76 | 2.02 | (0.11) | $9.68 | 26.15% | 1.15% | 2.61% | 125% |
| $11,859 |
|
| 2013 | $6.66 | 0.22 | 1.13 | 1.35 | (0.24) | $7.77 | 20.60% | 1.16% | 2.85% | 101% |
| $3,233 |
|
| 2012 | $8.08 | 0.15 | (1.43) | (1.28) | (0.14) | $6.66 | (15.68)% | 1.18% | 2.42% | 113% |
| $1,917 |
|
| 2011 | $5.95 | 0.20 | 2.05 | 2.25 | (0.12) | $8.08 | 38.09% | 1.18% | 2.53% | 77% |
| $2,755 |
|
| 2010 | $5.80 | 0.10 | 0.19 | 0.29 | (0.14) | $5.95 | 4.68% | 1.18% | 1.55% | 83% |
| $1,490 |
|
| Institutional Class | | | | | | | |
| 2014 | $7.78 | 0.28 | 1.76 | 2.04 | (0.13) | $9.69 | 26.37% | 0.95% | 2.81% | 125% |
| $921 |
|
| 2013 | $6.67 | 0.22 | 1.15 | 1.37 | (0.26) | $7.78 | 20.81% | 0.96% | 3.05% | 101% |
| $504 |
|
| 2012 | $8.10 | 0.18 | (1.45) | (1.27) | (0.16) | $6.67 | (15.59)% | 0.98% | 2.62% | 113% |
| $419 |
|
| 2011 | $5.96 | 0.21 | 2.07 | 2.28 | (0.14) | $8.10 | 38.47% | 0.98% | 2.73% | 77% |
| $1,116 |
|
| 2010 | $5.81 | 0.11 | 0.19 | 0.30 | (0.15) | $5.96 | 4.88% | 0.98% | 1.75% | 83% |
| $653 |
|
| A Class | | | | | | | | | |
| 2014 | $7.76 | 0.16 | 1.84 | 2.00 | (0.09) | $9.67 | 25.87% | 1.40% | 2.36% | 125% |
| $3,164 |
|
| 2013 | $6.65 | 0.19 | 1.15 | 1.34 | (0.23) | $7.76 | 20.34% | 1.41% | 2.60% | 101% |
| $2,162 |
|
| 2012 | $8.07 | 0.18 | (1.47) | (1.29) | (0.13) | $6.65 | (15.92)% | 1.43% | 2.17% | 113% |
| $1,845 |
|
| 2011 | $5.94 | 0.16 | 2.08 | 2.24 | (0.11) | $8.07 | 37.80% | 1.43% | 2.28% | 77% |
| $1,019 |
|
| 2010 | $5.79 | 0.09 | 0.18 | 0.27 | (0.12) | $5.94 | 4.42% | 1.43% | 1.30% | 83% |
| $730 |
|
|
| | | | | | | | | | | | | |
| For a Share Outstanding Throughout the Years Ended June 30 (except as noted) |
| Per-Share Data | | | Ratios and Supplemental Data | | |
| | | Income From Investment Operations: | | | | Ratio to Average Net Assets of: | | |
| | Net Asset Value, Beginning of Period | Net Investment Income (Loss)(1) | Net Realized and Unrealized Gain (Loss) | Total From Investment Operations | Distributions From Net Investment Income | Net Asset Value, End of Period | Total Return(2) | Operating Expenses | Net Investment Income (Loss) | Portfolio Turnover Rate | Net Assets, End of Period (in thousands) |
| C Class | | | | | | | |
| 2014 | $7.72 | 0.14 | 1.78 | 1.92 | (0.02) | $9.62 | 24.92% | 2.15% | 1.61% | 125% |
| $1,081 |
|
| 2013 | $6.62 | 0.14 | 1.13 | 1.27 | (0.17) | $7.72 | 19.40% | 2.16% | 1.85% | 101% |
| $974 |
|
| 2012 | $8.04 | 0.11 | (1.45) | (1.34) | (0.08) | $6.62 | (16.62)% | 2.18% | 1.42% | 113% |
| $698 |
|
| 2011 | $5.92 | 0.11 | 2.06 | 2.17 | (0.05) | $8.04 | 36.72% | 2.18% | 1.53% | 77% |
| $956 |
|
| 2010 | $5.77 | 0.04 | 0.18 | 0.22 | (0.07) | $5.92 | 3.64% | 2.18% | 0.55% | 83% |
| $631 |
|
| R Class | | | | | | | |
| 2014 | $7.74 | 0.19 | 1.79 | 1.98 | (0.07) | $9.65 | 25.62% | 1.65% | 2.11% | 125% |
| $1,242 |
|
| 2013 | $6.64 | 0.17 | 1.14 | 1.31 | (0.21) | $7.74 | 19.93% | 1.66% | 2.35% | 101% |
| $956 |
|
| 2012 | $8.06 | 0.14 | (1.45) | (1.31) | (0.11) | $6.64 | (16.15)% | 1.68% | 1.92% | 113% |
| $795 |
|
| 2011 | $5.93 | 0.15 | 2.07 | 2.22 | (0.09) | $8.06 | 37.52% | 1.68% | 2.03% | 77% |
| $988 |
|
| 2010 | $5.78 | 0.08 | 0.17 | 0.25 | (0.10) | $5.93 | 4.16% | 1.68% | 1.05% | 83% |
| $682 |
|
|
|
| Notes to Financial Highlights |
| |
| (1) | Computed using average shares outstanding throughout the period. |
| |
| (2) | Total returns are calculated based on the net asset value of the last business day and do not reflect applicable sales charges, if any. Total returns for periods less than one year are not annualized. |
See Notes to Financial Statements.
|
|
| Report of Independent Registered Public Accounting Firm |
To the Directors of the American Century Quantitative Equity Funds, Inc. and Shareholders of the International Core Equity Fund:
In our opinion, the accompanying statement of assets and liabilities, including the schedule of investments, and the related statements of operations, of changes in net assets and the financial highlights present fairly, in all material respects, the financial position of the International Core Equity Fund (one of the fifteen funds comprising the American Century Quantitative Equity Funds, Inc., hereafter referred to as the “Fund”) at June 30, 2014, the results of its operations for the year then ended, the changes in its net assets for each of the two years in the period then ended and the financial highlights for each of the five years in the period then ended, in conformity with accounting principles generally accepted in the United States of America. These financial statements and financial highlights (hereafter referred to as "financial statements") are the responsibility of the Fund's management. Our responsibility is to express an opinion on these financial statements based on our audits. We conducted our audits of these financial statements in accordance with the standards of the Public Company Accounting Oversight Board (United States). Those standards require that we plan and perform the audit to obtain reasonable assurance about whether the financial statements are free of material misstatement. An audit includes examining, on a test basis, evidence supporting the amounts and disclosures in the financial statements, assessing the accounting principles used and significant estimates made by management, and evaluating the overall financial statement presentation. We believe that our audits, which included confirmation of securities at June 30, 2014 by correspondence with the custodian and brokers, provide a reasonable basis for our opinion.
PricewaterhouseCoopers LLP
Kansas City, Missouri
August 21, 2014
Board of Directors
The individuals listed below serve as directors of the funds. Each director will continue to serve in this capacity until death, retirement, resignation or removal from office. The board has adopted a mandatory retirement age for directors who are not “interested persons,” as that term is defined in the Investment Company Act (independent directors). Independent directors shall retire on December 31 of the year in which they reach their 75th birthday; provided, however, that on or after January 1, 2022, independent directors shall retire on December 31 of the year in which they reach their 76th birthday.
Mr. Thomas is an “interested person” because he currently serves as President and Chief Executive Officer of American Century Companies, Inc. (ACC), the parent company of American Century Investment Management, Inc. (ACIM or the advisor). The other directors (more than three-fourths of the total number) are independent. They are not employees, directors or officers of, and have no financial interest in, ACC or any of its wholly owned, direct or indirect, subsidiaries, including ACIM, American Century Investment Services, Inc. (ACIS) and American Century Services, LLC (ACS), and do not have any other affiliations, positions or relationships that would cause them to be considered “interested persons” under the Investment Company Act. The directors serve in this capacity for eight (in the case of Mr. Thomas, 15) registered investment companies in the American Century Investments family of funds.
The following table presents additional information about the directors. The mailing address for each director other than Mr. Thomas is 1665 Charleston Road, Mountain View, California 94043. The mailing address for Mr. Thomas is 4500 Main Street, Kansas City, Missouri 64111.
|
| | | | | |
Name (Year of Birth) | Position(s) Held with Funds | Length of Time Served | Principal Occupation(s) During Past 5 Years | Number of
American
Century
Portfolios
Overseen
by Director | Other Directorships Held During Past 5 Years |
| Independent Directors |
Tanya S. Beder (1955) | Director | Since 2011 | Chairman, SBCC Group Inc. (independent advisory services) (2006 to present) | 42 | CYS Investments, Inc. (specialty finance company) |
Jeremy I. Bulow (1954) | Director | Since 2011 | Professor of Economics, Stanford University, Graduate School of Business (1979 to present) | 42 | None |
Ronald J. Gilson (1946) | Director and Chairman of the Board | Since 1995 (Chairman since 2005) | Charles J. Meyers Professor of Law and Business, Stanford Law School (1979 to present); Marc and Eva Stern Professor of Law and Business, Columbia University School of Law (1992 to present) | 42 | None |
|
| | | | | |
Name (Year of Birth) | Position(s) Held with Funds | Length of Time Served | Principal Occupation(s) During Past 5 Years | Number of
American
Century
Portfolios
Overseen
by Director | Other Directorships Held During Past 5 Years |
| Independent Directors |
Frederick L. A. Grauer (1946) | Director | Since 2008 | Senior Advisor, BlackRock, Inc. (investment management firm) (2010 to 2011); Senior Advisor, Barclays Global Investors (investment management firm) (2003 to 2009) | 42 | None |
Peter F. Pervere
(1947) | Director | Since 2007 | Retired | 42 | Intraware, Inc. (2003 to 2009) |
Myron S. Scholes(1) (1941) | Director | Since 1980 | Chairman, Platinum Grove Asset Management, L.P. (asset manager) (1999 to 2009); Frank E. Buck Professor of Finance-Emeritus, Stanford Graduate School of Business (1996 to present) | 42 | Dimensional Fund Advisors (investment advisor); CME Group, Inc. (futures and options exchange) |
John B. Shoven
(1947) | Director | Since 2002 | Professor of Economics, Stanford University (1973 to present) | 42 | Cadence Design Systems; Exponent; Financial Engines |
| Interested Director |
Jonathan S. Thomas
(1963) | Director and
President | Since 2007 | President and Chief Executive Officer, ACC (March 2007 to present). Also serves as Chief Executive Officer and Manager, ACS; Executive Vice President, ACIM; Director, ACC, ACIM and other ACC subsidiaries | 115 | None |
(1) Myron S. Scholes resigned as director effective July 31, 2014.
Officers
The following table presents certain information about the executive officers of the funds. Each officer serves as an officer for each of the 15 investment companies in the American Century family of funds, unless otherwise noted. No officer is compensated for his or her service as an officer of the funds. The listed officers are interested persons of the funds and are appointed or re-appointed on an annual basis. The mailing address for each of the officers listed below is 4500 Main Street, Kansas City, Missouri 64111.
|
| | |
Name (Year of Birth) | Offices with the Funds | Principal Occupation(s) During the Past Five Years |
Jonathan S. Thomas (1963) | Director and President since 2007 | President and Chief Executive Officer, ACC (March 2007 to present). Also serves as Chief Executive Officer and Manager, ACS; Executive Vice President, ACIM; Director, ACC, ACIM and other ACC subsidiaries |
| Amy D. Shelton (1964) | Chief Compliance Officer since 2014 | Chief Compliance Officer, American Century funds, (March 2014 to present); Chief Compliance Officer, ACIM (February 2014 to present); Chief Compliance Officer, ACIS (October 2009 to present); Vice President, Client Interactions and Marketing, ACIS (February 2013 to January 2014); Director, Client Interactions and Marketing, ACIS (June 2007 to January 2013). Also serves as Vice President, ACIS |
Charles A. Etherington (1957) | General Counsel since 2007 and Senior Vice President since 2006 | Attorney, ACC (February 1994 to present); Vice President, ACC (November 2005 to present); General Counsel, ACC (March 2007 to present). Also serves as General Counsel, ACIM, ACS, ACIS and other ACC subsidiaries; and Senior Vice President, ACIM and ACS |
C. Jean Wade (1964) | Vice President, Treasurer and Chief Financial Officer since 2012 | Vice President, ACS (February 2000 to present) |
Robert J. Leach (1966) | Vice President since 2006 and Assistant Treasurer since 2012 | Vice President, ACS (February 2000 to present) |
David H. Reinmiller (1963) | Vice President since 2001 | Attorney, ACC (January 1994 to present); Associate General Counsel, ACC (January 2001 to present). Also serves as Vice President, ACIM and ACS |
Ward D. Stauffer (1960) | Secretary since 2005 | Attorney, ACC (June 2003 to present) |
The Statement of Additional Information has additional information about the fund’s directors and is available without charge, upon request, by calling 1-800-345-2021.
|
|
| Approval of Management Agreement |
At a meeting held on June 13, 2014, the Fund’s Board of Directors/Trustees unanimously approved the renewal of the management agreement pursuant to which American Century Investment Management, Inc. (the “Advisor”) acts as the investment advisor for the Fund. Under Section 15(c) of the Investment Company Act, contracts for investment advisory services are required to be reviewed, evaluated, and approved by a majority of a fund’s directors/trustees (the “Directors”), including a majority of the independent Directors, each year. The Board regards this annual evaluation and renewal as one of its most important responsibilities.
The independent Directors have memorialized a statement regarding the relationship between their ongoing obligations to oversee and evaluate the performance of the Advisor and their annual consideration of renewal of the management agreement. In that statement, the independent Directors noted that their assessment of the Advisor’s performance is an ongoing process that takes place over the entire year and is informed by all of the extensive information that the Board and its committees receive and consider over time. This information, together with the materials provided in connection with the review, are central to the Board’s assessment of the Advisor’s performance and its determination whether to renew the Fund’s management agreement.
Prior to its consideration of the renewal of the management agreement, the Board requested and reviewed extensive data and analysis relating to the proposed renewal. This information and analysis was compiled by the Advisor and certain independent providers of evaluation data concerning the Fund and the services provided to the Fund by the Advisor.
In connection with its consideration of the renewal of the management agreement, the Board’s review and evaluation of the services provided by the Advisor included, but was not limited to, the following:
| |
| • | the nature, extent, and quality of investment management, shareholder services, and other services provided by the Advisor to the Fund; |
| |
| • | the wide range of other programs and services the Advisor provides to the Fund and its shareholders on a routine and non-routine basis; |
| |
| • | the investment performance of the Fund, including data comparing the Fund’s performance to appropriate benchmarks and/or a peer group of other mutual funds with similar investment objectives and strategies; |
| |
| • | the cost of owning the Fund compared to the cost of owning similar funds; |
| |
| • | the Advisor’s compliance policies, procedures, and regulatory experience; |
| |
| • | financial data showing the cost of services provided to the Fund, the profitability of the Fund to the Advisor, and the overall profitability of the Advisor; |
| |
| • | possible economies of scale associated with the Advisor’s management of the Fund and other accounts under its management; |
| |
| • | data comparing services provided and charges to other investment management clients of the Advisor; and |
| |
| • | any collateral benefits derived by the Advisor from the management of the Fund. |
In keeping with its practice, the Board held two in-person meetings to review and discuss the information provided. The independent Directors also had the benefit of the advice of their independent counsel throughout the process.
Factors Considered
The Directors considered all of the information provided by the Advisor, the independent data providers, and the independent Directors’ independent counsel in connection with the review, and evaluated such information for the Fund. In connection with their review, the Directors did not identify any single factor as being all-important or controlling and each Director may have attributed
different levels of importance to different factors. In deciding to renew the management agreement, the Board based its decision on a number of factors, including the following:
Nature, Extent and Quality of Services — Generally. Under the management agreement, the Advisor is responsible for providing or arranging for all services necessary for the operation of the Fund. The Board noted that under the management agreement, the Advisor provides or arranges at its own expense a wide variety of services including:
| |
| • | constructing and designing the Fund |
| |
| • | portfolio research and security selection |
| |
| • | initial capitalization/funding |
| |
| • | daily valuation of the Fund’s portfolio |
| |
| • | shareholder servicing and transfer agency, including shareholder confirmations, recordkeeping, and communications |
| |
| • | regulatory and portfolio compliance |
| |
| • | marketing and distribution |
The Board noted that many of these services have expanded over time both in terms of quantity and complexity in response to shareholder demands, competition in the industry, changing distribution channels, and the changing regulatory environment.
Investment Management Services. The nature of the investment management services provided to the Fund is quite complex and allows Fund shareholders access to professional money management, instant diversification of their investments within an asset class, the opportunity to easily diversify among asset classes by investing in or exchanging among various American Century Investments funds, and liquidity. In evaluating investment performance, the Board expects the Advisor to manage the Fund in accordance with its investment objectives and approved strategies. Further, the Directors recognize that the Advisor has an obligation to seek the best execution of fund trades. In providing these services, the Advisor utilizes teams of investment professionals (portfolio managers, analysts, research assistants, and securities traders) who require extensive information technology, research, training, compliance and other systems to conduct their business. The Board, directly and through its Portfolio Committee, regularly reviews investment performance information for the Fund, together with comparative information for appropriate benchmarks and/or peer groups of similarly-managed funds, over different time horizons. The Directors also review detailed performance information during the management agreement approval process. If performance concerns are identified, the Fund receives special reviews until performance improves, during which the Board discusses with the Advisor the reasons for such results (e.g., market conditions, security selection) and any efforts being undertaken to improve performance. The Fund’s performance was above its benchmark for the one-, three-, and five-year periods reviewed by the Board. The Board found the investment management services provided by the Advisor to the Fund to be satisfactory and consistent with the management agreement.
Shareholder and Other Services. Under the management agreement, the Advisor provides the Fund with a comprehensive package of transfer agency, shareholder, and other services. The Board, directly and through various committees of the Board, regularly reviews reports and evaluations of such services at its regular meetings. These reports include, but are not limited to, information regarding the operational efficiency and accuracy of the shareholder and transfer agency services provided, staffing levels, shareholder satisfaction (as measured by external as well as internal sources), technology support, new products and services offered to Fund shareholders, securities trading activities, portfolio valuation services, auditing services, and legal and operational compliance activities. Certain aspects of shareholder and transfer agency service level efficiency
and the quality of securities trading activities are measured by independent third party providers and are presented in comparison to other fund groups not managed by the Advisor. The Board found the services provided by the Advisor to the Fund under the management agreement to be competitive and of high quality.
Costs of Services and Profitability. The Advisor provides detailed information concerning its cost of providing various services to the Fund, its profitability in managing the Fund, its overall profitability, and its financial condition. The Directors have reviewed with the Advisor the methodology used to prepare this financial information. The financial information regarding the Advisor is considered in evaluating the Advisor’s financial condition, its ability to continue to provide services under the management agreement, and the reasonableness of the current management fee. The Board concluded that the Advisor’s profits were reasonable in light of the services provided to the Fund.
Ethics. The Board generally considers the Advisor’s commitment to providing quality services to shareholders and to conducting its business ethically. They noted that the Advisor’s practices generally meet or exceed industry best practices.
Economies of Scale. The Board also reviewed information provided by the Advisor regarding the possible existence of economies of scale in connection with the management of the Fund. The Board concluded that economies of scale are difficult to measure and predict with precision, especially on a fund-by-fund basis. The Board concluded that the Advisor is appropriately sharing economies of scale through its competitive fee structure, offering competitive fees from fund inception, and through reinvestment in its business to provide shareholders additional content and services.
Comparison to Other Funds’ Fees. The management agreement provides that the Fund pays the Advisor a single, all-inclusive (or unified) management fee for providing all services necessary for the management and operation of the Fund, other than brokerage expenses, taxes, interest, extraordinary expenses, and the fees and expenses of the Fund’s independent directors (including their independent legal counsel) and expenses incurred in connection with the provision of shareholder services and distribution services under a plan adopted pursuant to Rule 12b-1 under the 1940 Act. Under the unified fee structure, the Advisor is responsible for providing all investment advisory, custody, audit, administrative, compliance, recordkeeping, marketing and shareholder services, or arranging and supervising third parties to provide such services. By contrast, most other funds are charged a variety of fees, including an investment advisory fee, a transfer agency fee, an administrative fee, distribution charges and other expenses. Other than their investment advisory fees and any applicable Rule 12b-1 distribution fees, all other components of the total fees charged by these other funds may be increased without shareholder approval. The Board believes the unified fee structure is a benefit to Fund shareholders because it clearly discloses to shareholders the cost of owning Fund shares, and, since the unified fee cannot be increased without a vote of Fund shareholders, it shifts to the Advisor the risk of increased costs of operating the Fund and provides a direct incentive to minimize administrative inefficiencies. Part of the Board’s analysis of fee levels involves reviewing certain evaluative data compiled by an independent provider and comparing the Fund’s unified fee to the total expense ratio of other funds in the Fund’s peer group. The unified fee charged to shareholders of the Fund was below the median of the total expense ratios of the Fund’s peer universe. The Board concluded that the management fee paid by the Fund to the Advisor under the management agreement is reasonable in light of the services provided to the Fund.
Comparison to Fees and Services Provided to Other Clients of the Advisor. The Board also requested and received information from the Advisor concerning the nature of the services, fees, costs and profitability of its advisory services to advisory clients other than the Fund. They observed that these varying types of client accounts require different services and involve different regulatory and entrepreneurial risks than the management of the Fund. The Board analyzed this information and concluded that the fees charged and services provided to the Fund were reasonable by comparison.
Collateral or “Fall-Out” Benefits Derived by the Advisor. The Board considered the existence of collateral benefits the Advisor may receive as a result of its relationship with the Fund. They concluded that the Advisor’s primary business is managing mutual funds and it generally does not use fund or shareholder information to generate profits in other lines of business, and therefore does not derive any significant collateral benefits from them. The Board noted that the Advisor receives proprietary research from broker-dealers that execute fund portfolio transactions and concluded that this research is likely to benefit Fund shareholders. The Board also determined that the Advisor is able to provide investment management services to certain clients other than the Fund, at least in part, due to its existing infrastructure built to serve the fund complex. The Board concluded, however, that the assets of those other clients are not material to the analysis and, where applicable, may be included with the assets of the Fund to determine breakpoints in the management fee schedule.
Existing Relationship. The Board also considered whether there was any reason for not continuing the existing arrangement with the Advisor. In this regard, the Board was mindful of the potential disruptions of the Fund’s operations and various risks, uncertainties, and other effects that could occur as a result of a decision not to continue such relationship. In particular, the Board recognized that most shareholders have invested in the Fund on the strength of the Advisor’s industry standing and reputation and in the expectation that the Advisor will have a continuing role in providing advisory services to the Fund.
Conclusion of the Directors. As a result of this process, the Board, including all of the independent Directors and assisted by the advice of independent legal counsel, taking into account all of the factors discussed above and the information provided by the Advisor and others, concluded that the management agreement between the Fund and the Advisor is fair and reasonable in light of the services provided and should be renewed.
Retirement Account Information
As required by law, distributions you receive from certain IRAs are subject to federal income tax withholding, unless you elect not to have withholding apply. Tax will be withheld on the total amount withdrawn even though you may be receiving amounts that are not subject to withholding, such as nondeductible contributions. In such case, excess amounts of withholding could occur. You may adjust your withholding election so that a greater or lesser amount will be withheld.
If you don’t want us to withhold on this amount, you must notify us to not withhold the federal income tax. You may notify us in writing or in certain situations by telephone or through other electronic means. For systematic withdrawals, your withholding election will remain in effect until revoked or changed by filing a new election. You have the right to revoke your election at any time.
Remember, even if you elect not to have income tax withheld, you are liable for paying income tax on the taxable portion of your withdrawal. If you elect not to have income tax withheld or you don’t have enough income tax withheld, you may be responsible for payment of estimated tax. You may incur penalties under the estimated tax rules if your withholding and estimated tax payments are not sufficient. You can reduce or defer the income tax on a distribution by directly or indirectly rolling such distribution over to another IRA or eligible plan. You should consult your tax advisor for additional information.
State tax will be withheld if, at the time of your distribution, your address is within one of the mandatory withholding states and you have federal income tax withheld (or as otherwise required by state law). State taxes will be withheld from your distribution in accordance with the respective state rules.
Distributions you receive from 403(b), 457 and qualified plans are subject to special tax and withholding rules. Your plan administrator or plan sponsor is required to provide you with a special tax notice explaining those rules at the time you request a distribution. If applicable, federal and/or state taxes may be withheld from your distribution amount.
Proxy Voting Policies
Descriptions of the principles and policies that the fund's investment advisor uses in exercising the voting rights associated with the securities purchased and/or held by the fund are available without charge, upon request, by calling 1-800-345-2021 or visiting the "About Us" page of American Century Investments’ website at americancentury.com. A description of the policies is also available on the Securities and Exchange Commission’s website at sec.gov. Information regarding how the investment advisor voted proxies relating to portfolio securities during the most recent 12-month period ended June 30 is available on the "About Us" page at americancentury.com. It is also available at sec.gov.
Quarterly Portfolio Disclosure
The fund files its complete schedule of portfolio holdings with the Securities and Exchange Commission (SEC) for the first and third quarters of each fiscal year on Form N-Q. The fund’s Forms N-Q are available on the SEC’s website at sec.gov, and may be reviewed and copied at the SEC’s Public Reference Room in Washington, DC. Information on the operation of the Public Reference Room may be obtained by calling 1-800-SEC-0330. The fund also makes its complete schedule of portfolio holdings for the most recent quarter of its fiscal year available on its website at americancentury.com and, upon request, by calling 1-800-345-2021.
Other Tax Information
The following information is provided pursuant to provisions of the Internal Revenue Code.
The fund hereby designates up to the maximum amount allowable as qualified dividend income for the fiscal year ended June 30, 2014.
For the fiscal year ended June 30, 2014, the fund intends to pass through to shareholders $42,053, or up to the maximum amount allowable, as a foreign tax credit which represents taxes paid on income derived from sources within foreign countries or possessions of the United States. During the fiscal year ended June 30, 2014, the fund earned $544,497 from income derived from foreign sources. Foreign source income and foreign tax expense per outstanding share on June 30, 2014 are $0.2883 and $0.0223, respectively.
|
| | |
| |
| | | |
| Contact Us | americancentury.com | |
| Automated Information Line | 1-800-345-8765 | |
| Investor Services Representative | 1-800-345-2021
or 816-531-5575 | |
| Investors Using Advisors | 1-800-378-9878 | |
Business, Not-For-Profit, Employer-Sponsored
Retirement Plans | 1-800-345-3533 | |
Banks and Trust Companies, Broker-Dealers,
Financial Professionals, Insurance Companies | 1-800-345-6488 | |
| Telecommunications Relay Service for the Deaf | 711 | |
| | | |
| American Century Quantitative Equity Funds, Inc. | |
| | | |
Investment Advisor: American Century Investment Management, Inc. Kansas City, Missouri | |
| | | |
| This report and the statements it contains are submitted for the general information of our shareholders. The report is not authorized for distribution to prospective investors unless preceded or accompanied by an effective prospectus. | |
| | | |
©2014 American Century Proprietary Holdings, Inc. All rights reserved.
CL-ANN-82881 1408 | |
|
| |
ANNUAL REPORT | JUNE 30, 2014 |
NT Core Equity Plus Fund
|
| |
| President's Letter | |
| Performance | |
| Portfolio Commentary | |
| Fund Characteristics | |
| Shareholder Fee Example | |
| Schedule of Investments | |
| Statement of Assets and Liabilities | |
| Statement of Operations | |
| Statement of Changes in Net Assets | |
| Statement of Cash Flows | |
| Notes to Financial Statements | |
| Financial Highlights | |
| Report of Independent Registered Public Accounting Firm | |
| Management | |
| Approval of Management Agreement | |
| Additional Information | |
Any opinions expressed in this report reflect those of the author as of the date of the report, and do not necessarily represent the opinions of American Century Investments® or any other person in the American Century Investments organization. Any such opinions are subject to change at any time based upon market or other conditions and American Century Investments disclaims any responsibility to update such opinions. These opinions may not be relied upon as investment advice and, because investment decisions made by American Century Investments funds are based on numerous factors, may not be relied upon as an indication of trading intent on behalf of any American Century Investments fund. Security examples are used for representational purposes only and are not intended as recommendations to purchase or sell securities. Performance information for comparative indices and securities is provided to American Century Investments by third party vendors. To the best of American Century Investments’ knowledge, such information is accurate at the time of printing.
|
| |
| Dear Investor:
Thank you for reviewing this annual report for the 12 months ended June 30, 2014. It provides investment performance and portfolio information for the reporting period, plus longer-term historical performance data.
Annual reports remain important vehicles for conveying information about fund returns, including market and economic factors that affected performance during the reporting period. For additional, updated investment and market insights, we encourage you to visit our website, americancentury.com.
|
| Jonathan Thomas |
Aggressive Monetary Policies Boosted Stock and Bond Returns
Stimulative monetary policies and expectations of economic improvement, interspersed with concerns about weaker-than-expected economic data and geopolitical conflicts, helped drive financial market returns during the reporting period. We believe the combination of longer-term optimism about global economic growth, low costs of capital, and central bank purchases of fixed income securities helped persuade investors to seek risk and yield, especially in the U.S. and Europe. Stock index returns were strong in these markets, particularly at the smaller capitalization end of the company size spectrum. The MSCI Europe and S&P 500® indices advanced 29.28% and 24.61%, respectively.
Remarkably, for a period in which stock market performance was so strong, government bond performance was also generally positive. Not surprisingly, U.S. corporate high-yield bonds posted double-digit returns, but the 30-year U.S. Treasury bond also outperformed most broader bond market measures. In addition, a generally weaker U.S. dollar during the reporting period meant that international bond returns for U.S. investors with currency exposure were generally higher than U.S. bonds returns. The Barclays Global Aggregate Bond and Barclays U.S. Aggregate Bond indices returned 7.39% and 4.37%, respectively.
Looking ahead, we see signs of sustained moderate economic growth in the second half of 2014, but headwinds persist. In the U.S., which was supposed to be an economic growth leader this year, housing market momentum has slowed, interest rates could rise, and economic growth and U.S. employment levels remain subpar compared with past post-recession periods. In this environment, we continue to believe in a disciplined, diversified, long-term investment approach, using professionally managed stock and bond portfolios—as appropriate—for meeting financial goals. We appreciate your continued trust in us.
Sincerely,
Jonathan Thomas
President and Chief Executive Officer
American Century Investments
|
| | | | |
| Total Returns as of June 30, 2014 |
| | | | Average Annual Returns | |
| | Ticker Symbol | 1 year | Since Inception | Inception Date |
| Institutional Class | ACNKX | 27.10% | 23.00% | 12/1/11 |
| S&P 500 Index | — | 24.61% | 21.85% | — |
|
|
| Growth of $10,000 Over Life of Class |
| $10,000 investment made December 1, 2011 |
|
| |
| Value on June 30, 2014 |
| | Institutional Class — $17,061 |
| |
| | S&P 500 Index — $16,653 |
| |
*From December 1, 2011, the Institutional Class’s inception date. Not annualized.
|
| |
| Total Annual Fund Operating Expenses |
| Institutional Class | 1.66% |
The total annual fund operating expenses shown is as stated in the fund’s prospectus current as of the date of this report. The prospectus may vary from the expense ratio shown elsewhere in this report because it is based on a different time period, includes acquired fund fees and expenses, and, if applicable, does not include fee waivers or expense reimbursements.
Data presented reflect past performance. Past performance is no guarantee of future results. Current performance may be higher or lower than the performance shown. Investment return and principal value will fluctuate, and redemption value may be more or less than original cost. To obtain performance data current to the most recent month end, please call 1-800-345-2021 or visit americancentury.com. The fund’s investment process may result in high portfolio turnover, which could mean high transaction costs, affecting both performance and capital gains tax liabilities to investors. In addition, its investment approach may involve higher price volatility, short sales risk, leverage risk and overweighting risk.
Data assumes reinvestment of dividends and capital gains, and none of the charts reflect the deduction of taxes that a shareholder would pay on fund distributions or the redemption of fund shares. Returns for the index are provided for comparison. The fund’s total returns include operating expenses (such as transaction costs and management fees) that reduce returns, while the total returns of the index do not.
Portfolio Managers: Scott Wittman, Bill Martin and Claudia Musat
Performance Summary
NT Core Equity Plus returned 27.10% for the fiscal year ended June 30, 2014, compared with the 24.61% return of its benchmark, the S&P 500 Index.
As U.S. equity markets continued their robust appreciation, NT Core Equity Plus posted a solid gain for the 12-month period, outperforming the S&P 500 Index. The fund is managed to have a 100% net exposure to the equity market by investing approximately 130% of its net assets in long positions, while 30% of its net assets are sold short. The proceeds from the securities sold short are used to fund the purchase of the additional 30% of long positions. The portfolio’s stock selection process incorporates factors of valuation, quality, growth, and momentum (sentiment) while striving to minimize unintended risks along industries and other risk characteristics. Security selection in the consumer staples and industrials sectors contributed the most to fund results, while information technology and consumer discretionary holdings weighed on relative performance.
Consumer Staples and Industrials Outperformed
The consumer staples and industrials sectors were among the leading contributors to the fund’s returns relative to the S&P 500. Stock choices in the consumer staples sector, particularly among food products manufacturers and food and staples retailers, were especially effective, driving the sector's substantial outperformance relative to the index. Among the top sector contributors was a portfolio-only position in chain drug store Rite Aid, which rose on revenue growth and efficiency and distribution chain improvements, bolstering the sector’s return. Significant contribution also came from supermarket chain store operator Safeway, which appreciated on speculation of being acquired by private equity firm Cerberus Capital Management, owner of the Albertson’s chain of grocery stores. Following its appreciation, we took profits in Safeway and exited the position.
Several chicken processors helped boost the fund’s performance including a portfolio-only position in Pilgrim’s Pride, which rallied following management’s decision to bow out of the race with Tyson Foods to acquire Hillshire Brands.
Industrials sector outperformance was primarily due to successful stock selection and positioning in the strongly appreciating aerospace and defense industry. A number of defense contractors were key contributors, benefiting from an overall pickup in activity amid an improving economic landscape. Strong contributions came from Alliant Techsystems, which we sold to lock in gains,
as well as Northrop Grumman, which appreciated nearly 50% largely on new government contracts. A short position—which is designed to profit when a stock’s price declines—in DigitalGlobe, a provider of satellite imagery technology, also helped returns as the company’s stock declined during the period.
Significant contribution also came from several long positions among energy equipment manufacturers, including drilling and rig services provider Nabors Industries. The company, with robust quality and sentiment profiles, rallied over 70% during the period on solid earnings and merger news. Elsewhere, apparel manufacturer Hanesbrands’ earnings growth and announced intent to purchase French clothing manufacturer DBApparel, thereby increasing exposure in Europe, helped to drive its stock price higher.
Information Technology Was Leading Detractor
Security selection in the information technology sector was the principal detractor from the fund’s 12-month results. Semiconductor manufacturers were leading drivers of sector underperformance including a short position in solar power semiconductor manufacturer SunEdison, which benefited from several analyst upgrades based on a continued rise in solar power demand. Despite its climbing share value, we believe that the company is unappealing across valuation, quality, and growth measures, which justify the short position.
A number of long positions in the consumer discretionary sector, particularly in retail industries, declined during the period, negatively impacting the fund’s performance. These included office products superstore Staples, which was down nearly 30% on disappointing revenues and profits and an announcement of 225 store closings. Electronics retailer Best Buy reported weaker-than-expected holiday sales amid a promotional sales environment that failed to drive higher industry demand. Likewise, toy manufacturer Mattel diminished fund returns after disappointing holiday sales impacted the company’s earnings, and was subsequently sold. Other sector detractors included casino game equipment maker International Game Technology, which fell on disappointing earnings stemming from declining slot machine sales. We ultimately exited our position in the holding.
A Look Ahead
Economic recovery in the U.S. appears to be progressing, albeit at a slower pace than during prior post-recessionary periods, and is expected to stay the course through the remainder of 2014. Recent indicators such as improvements in small business and consumer confidence point to a sustainable rebound, and economic growth is likely to further benefit from the recovering labor and housing markets. Though a continuation of political instability in non-U.S. markets as well as the potential for rising inflation and interest rates could lead to heightened market volatility, our disciplined, objective, and systematic investment strategy is designed to take advantage of opportunities at the individual company level in both the long and short portions of the portfolio. We believe this approach is the most powerful way to capitalize on market inefficiencies that lead to the mispricing of individual stocks. The portfolio’s current holdings exhibit the highest exposure to quality insights, followed by value and growth, and we maintain positive exposure to sentiment. The fund's largest overweights, relative to the benchmark, are in health care and information technology, while the underweights are led by the financials and energy sectors.
|
| |
| JUNE 30, 2014 |
| Top Ten Long Holdings | % of net assets |
| Apple, Inc. | 4.02% |
| Johnson & Johnson | 2.43% |
| Verizon Communications, Inc. | 1.79% |
| AT&T, Inc. | 1.78% |
| Intel Corp. | 1.76% |
| Pfizer, Inc. | 1.76% |
| Merck & Co., Inc. | 1.74% |
| Exxon Mobil Corp. | 1.66% |
| Oracle Corp. | 1.59% |
| Cisco Systems, Inc. | 1.53% |
| | |
| Top Five Short Holdings | % of net assets |
| New Gold, Inc. | (0.90)% |
| Conn's, Inc. | (0.85)% |
| SunEdison, Inc. | (0.85)% |
| Iron Mountain, Inc. | (0.82)% |
| WEX, Inc. | (0.81)% |
| | |
| Types of Investments in Portfolio | % of net assets |
| Common Stocks | 128.6% |
| Common Stocks Sold Short | (30.2)% |
| Temporary Cash Investments | 1.8% |
| Other Assets and Liabilities | (0.2)% |
Fund shareholders may incur two types of costs: (1) transaction costs, including sales charges (loads) on purchase payments and redemption/exchange fees; and (2) ongoing costs, including management fees; distribution and service (12b-1) fees; and other fund expenses. This example is intended to help you understand your ongoing costs (in dollars) of investing in your fund and to compare these costs with the ongoing cost of investing in other mutual funds.
The example is based on an investment of $1,000 made at the beginning of the period and held for the entire period from January 1, 2014 to June 30, 2014.
Actual Expenses
The table provides information about actual account values and actual expenses for each class. You may use the information, together with the amount you invested, to estimate the expenses that you paid over the period. First, identify the share class you own. Then simply divide your account value by $1,000 (for example, an $8,600 account value divided by $1,000 = 8.6), then multiply the result by the number under the heading “Expenses Paid During Period” to estimate the expenses you paid on your account during this period.
If you hold Investor Class shares of any American Century Investments fund, or Institutional Class shares of the American Century Diversified Bond Fund, in an American Century Investments account (i.e., not a financial intermediary or retirement plan account), American Century Investments may charge you a $12.50 semiannual account maintenance fee if the value of those shares is less than $10,000. We will redeem shares automatically in one of your accounts to pay the $12.50 fee. In determining your total eligible investment amount, we will include your investments in all personal accounts (including American Century Investments Brokerage accounts) registered under your Social Security number. Personal accounts include individual accounts, joint accounts, UGMA/UTMA accounts, personal trusts, Coverdell Education Savings Accounts and IRAs (including traditional, Roth, Rollover, SEP-, SARSEP- and SIMPLE-IRAs), and certain other retirement accounts. If you have only business, business retirement, employer-sponsored or American Century Investments Brokerage accounts, you are currently not subject to this fee. If you are subject to the Account Maintenance Fee, your account value could be reduced by the fee amount.
Hypothetical Example for Comparison Purposes
The table also provides information about hypothetical account values and hypothetical expenses based on the actual expense ratio of each class of your fund and an assumed rate of return of 5% per year before expenses, which is not the actual return of a fund’s share class. The hypothetical account values and expenses may not be used to estimate the actual ending account balance or expenses you paid for the period. You may use this information to compare the ongoing costs of investing in your fund and other funds. To do so, compare this 5% hypothetical example with the 5% hypothetical examples that appear in the shareholder reports of the other funds.
Please note that the expenses shown in the table are meant to highlight your ongoing costs only and do not reflect any transactional costs, such as sales charges (loads) or redemption/exchange fees. Therefore, the table is useful in comparing ongoing costs only, and will not help you determine the relative total costs of owning different funds. In addition, if these transactional costs were included, your costs would have been higher.
|
| | | | |
| | Beginning Account Value 1/1/14 | Ending Account Value 6/30/14 | Expenses Paid During Period(1) 1/1/14 – 6/30/14 | Annualized Expense Ratio(1) |
| Actual | | | | |
| Institutional Class | $1,000 | $1,074.00 | $7.71 | 1.50% |
| Hypothetical | | | | |
| Institutional Class | $1,000 | $1,017.36 | $7.50 | 1.50% |
| |
| (1) | Expenses are equal to the class’s annualized expense ratio listed in the table above, multiplied by the average account value over the period, multiplied by 181, the number of days in the most recent fiscal half-year, divided by 365, to reflect the one-half year period. |
JUNE 30, 2014
|
| | | | | |
| | Shares | Value |
| COMMON STOCKS — 128.6% | | |
| AEROSPACE AND DEFENSE — 5.5% | | |
Boeing Co. (The)(1) | 35,908 |
| $ | 4,568,575 |
|
Esterline Technologies Corp.(2) | 7,193 |
| 828,058 |
|
General Dynamics Corp.(1) | 6,548 |
| 763,169 |
|
Honeywell International, Inc.(1) | 40,207 |
| 3,737,241 |
|
| Lockheed Martin Corp. | 23,939 |
| 3,847,715 |
|
Moog, Inc., Class A(2) | 9,421 |
| 686,697 |
|
Northrop Grumman Corp.(1) | 28,062 |
| 3,357,057 |
|
Raytheon Co.(1) | 37,418 |
| 3,451,811 |
|
| | | 21,240,323 |
|
| AIR FREIGHT AND LOGISTICS — 0.6% | | |
| United Parcel Service, Inc., Class B | 23,617 |
| 2,424,521 |
|
| AIRLINES — 1.8% | | |
JetBlue Airways Corp.(1)(2) | 317,523 |
| 3,445,125 |
|
Southwest Airlines Co.(1) | 128,863 |
| 3,461,260 |
|
| | | 6,906,385 |
|
| AUTO COMPONENTS — 2.8% | | |
Gentex Corp.(1) | 86,322 |
| 2,511,107 |
|
Johnson Controls, Inc.(1) | 73,940 |
| 3,691,824 |
|
Magna International, Inc.(1) | 27,340 |
| 2,945,885 |
|
Tenneco, Inc.(2) | 27,193 |
| 1,786,580 |
|
| | | 10,935,396 |
|
| BANKS — 3.6% | | |
Bank of America Corp.(1) | 365,595 |
| 5,619,195 |
|
Citigroup, Inc.(1) | 85,626 |
| 4,032,985 |
|
JPMorgan Chase & Co.(1) | 34,708 |
| 1,999,875 |
|
Wells Fargo & Co.(1) | 44,116 |
| 2,318,737 |
|
| | | 13,970,792 |
|
| BEVERAGES — 0.9% | | |
Coca-Cola Co. (The)(1) | 8,077 |
| 342,142 |
|
Dr Pepper Snapple Group, Inc.(1) | 54,978 |
| 3,220,611 |
|
PepsiCo, Inc.(1) | 995 |
| 88,893 |
|
| | | 3,651,646 |
|
| BIOTECHNOLOGY — 3.1% | | |
Alexion Pharmaceuticals, Inc.(2) | 1,303 |
| 203,594 |
|
Amgen, Inc.(1) | 24,393 |
| 2,887,399 |
|
Biogen Idec, Inc.(1)(2) | 8,022 |
| 2,529,417 |
|
Celgene Corp.(1)(2) | 26,266 |
| 2,255,724 |
|
Gilead Sciences, Inc.(1)(2) | 22,060 |
| 1,828,995 |
|
Isis Pharmaceuticals, Inc.(2) | 14,331 |
| 493,703 |
|
Myriad Genetics, Inc.(1)(2) | 23,799 |
| 926,257 |
|
United Therapeutics Corp.(1)(2) | 9,731 |
| 861,096 |
|
| | | 11,986,185 |
|
|
| | | | | |
| | Shares | Value |
| CAPITAL MARKETS — 2.4% | | |
Affiliated Managers Group, Inc.(1)(2) | 9,301 |
| $ | 1,910,425 |
|
Franklin Resources, Inc.(1) | 53,621 |
| 3,101,439 |
|
Janus Capital Group, Inc.(1) | 70,452 |
| 879,241 |
|
SEI Investments Co.(1) | 54,017 |
| 1,770,137 |
|
Stifel Financial Corp.(1)(2) | 36,237 |
| 1,715,822 |
|
| | | 9,377,064 |
|
| CHEMICALS — 5.3% | | |
| Ashland, Inc. | 27,248 |
| 2,962,947 |
|
Cabot Corp.(1) | 38,131 |
| 2,211,217 |
|
Dow Chemical Co. (The)(1) | 89,576 |
| 4,609,581 |
|
| Eastman Chemical Co. | 26,425 |
| 2,308,224 |
|
| Olin Corp. | 70,472 |
| 1,897,106 |
|
PPG Industries, Inc.(1) | 18,888 |
| 3,969,313 |
|
Scotts Miracle-Gro Co. (The), Class A(1) | 45,159 |
| 2,567,741 |
|
| | | 20,526,129 |
|
| COMMERCIAL SERVICES AND SUPPLIES — 1.4% | | |
Deluxe Corp.(1) | 42,160 |
| 2,469,733 |
|
RR Donnelley & Sons Co.(1) | 148,808 |
| 2,523,784 |
|
| Steelcase, Inc., Class A | 23,035 |
| 348,519 |
|
| | | 5,342,036 |
|
| COMMUNICATIONS EQUIPMENT — 3.8% | | |
Brocade Communications Systems, Inc.(1) | 302,936 |
| 2,787,011 |
|
Cisco Systems, Inc.(1) | 238,579 |
| 5,928,688 |
|
QUALCOMM, Inc.(1) | 73,130 |
| 5,791,896 |
|
| | | 14,507,595 |
|
| CONSTRUCTION AND ENGINEERING — 0.7% | | |
AECOM Technology Corp.(1)(2) | 88,954 |
| 2,864,319 |
|
| CONSUMER FINANCE — 1.4% | | |
Cash America International, Inc.(1) | 69,548 |
| 3,090,018 |
|
Credit Acceptance Corp.(2) | 19,936 |
| 2,454,121 |
|
| | | 5,544,139 |
|
| CONTAINERS AND PACKAGING — 1.4% | | |
| Ball Corp. | 41,058 |
| 2,573,515 |
|
Sonoco Products Co.(1) | 65,276 |
| 2,867,575 |
|
| | | 5,441,090 |
|
| DIVERSIFIED CONSUMER SERVICES — 0.1% | | |
Apollo Education Group, Inc., Class A(1)(2) | 10,138 |
| 316,813 |
|
| DIVERSIFIED FINANCIAL SERVICES — 0.6% | | |
Berkshire Hathaway, Inc., Class B(1)(2) | 13,730 |
| 1,737,669 |
|
| Voya Financial, Inc. | 15,096 |
| 548,588 |
|
| | | 2,286,257 |
|
| DIVERSIFIED TELECOMMUNICATION SERVICES — 3.6% | | |
AT&T, Inc.(1) | 194,232 |
| 6,868,044 |
|
Verizon Communications, Inc.(1) | 141,614 |
| 6,929,173 |
|
| | | 13,797,217 |
|
| | | |
|
| | | | | |
| | Shares | Value |
| ELECTRICAL EQUIPMENT — 1.8% | | |
Emerson Electric Co.(1) | 54,491 |
| $ | 3,616,023 |
|
Rockwell Automation, Inc.(1) | 27,144 |
| 3,397,343 |
|
| | | 7,013,366 |
|
| ELECTRONIC EQUIPMENT, INSTRUMENTS AND COMPONENTS — 1.0% | |
Dolby Laboratories, Inc., Class A(2) | 44,284 |
| 1,913,069 |
|
| TE Connectivity Ltd. | 32,594 |
| 2,015,613 |
|
| | | 3,928,682 |
|
| ENERGY EQUIPMENT AND SERVICES — 3.8% | | |
Baker Hughes, Inc.(1) | 60,365 |
| 4,494,174 |
|
Nabors Industries Ltd.(1) | 92,416 |
| 2,714,258 |
|
National Oilwell Varco, Inc.(1) | 5,233 |
| 430,938 |
|
RPC, Inc.(1) | 124,321 |
| 2,920,300 |
|
| Schlumberger Ltd. | 34,052 |
| 4,016,433 |
|
| | | 14,576,103 |
|
| FOOD AND STAPLES RETAILING — 0.7% | | |
Rite Aid Corp.(1)(2) | 391,102 |
| 2,804,201 |
|
| FOOD PRODUCTS — 3.7% | | |
Archer-Daniels-Midland Co.(1) | 81,033 |
| 3,574,366 |
|
Kellogg Co.(1) | 49,122 |
| 3,227,315 |
|
Keurig Green Mountain, Inc.(1) | 4,306 |
| 536,571 |
|
Pilgrim's Pride Corp.(1)(2) | 137,200 |
| 3,753,792 |
|
Tyson Foods, Inc., Class A(1) | 85,189 |
| 3,197,995 |
|
| | | 14,290,039 |
|
| HEALTH CARE EQUIPMENT AND SUPPLIES — 4.7% | | |
Align Technology, Inc.(2) | 5,076 |
| 284,459 |
|
Becton Dickinson and Co.(1) | 11,957 |
| 1,414,513 |
|
Boston Scientific Corp.(1)(2) | 193,699 |
| 2,473,536 |
|
| C.R. Bard, Inc. | 12,571 |
| 1,797,779 |
|
| Covidien plc | 3,065 |
| 276,402 |
|
DexCom, Inc.(2) | 8,138 |
| 322,753 |
|
| Hill-Rom Holdings, Inc. | 45,138 |
| 1,873,678 |
|
Medtronic, Inc.(1) | 69,172 |
| 4,410,407 |
|
St. Jude Medical, Inc.(1) | 49,651 |
| 3,438,332 |
|
Stryker Corp.(1) | 21,540 |
| 1,816,253 |
|
| | | 18,108,112 |
|
| HEALTH CARE PROVIDERS AND SERVICES — 1.4% | | |
Cardinal Health, Inc.(1) | 47,672 |
| 3,268,393 |
|
Centene Corp.(2) | 7,107 |
| 537,360 |
|
Express Scripts Holding Co.(1)(2) | 25,800 |
| 1,788,714 |
|
| | | 5,594,467 |
|
| HOTELS, RESTAURANTS AND LEISURE — 2.2% | | |
Bally Technologies, Inc.(1)(2) | 39,913 |
| 2,623,083 |
|
| Las Vegas Sands Corp. | 24,809 |
| 1,890,942 |
|
| Royal Caribbean Cruises Ltd. | 30,715 |
| 1,707,754 |
|
| Wyndham Worldwide Corp. | 28,971 |
| 2,193,684 |
|
| | | 8,415,463 |
|
|
| | | | | |
| | Shares | Value |
| HOUSEHOLD DURABLES — 2.1% | | |
Newell Rubbermaid, Inc.(1) | 94,584 |
| $ | 2,931,158 |
|
NVR, Inc.(2) | 154 |
| 177,193 |
|
PulteGroup, Inc.(1) | 127,319 |
| 2,566,751 |
|
Whirlpool Corp.(1) | 17,859 |
| 2,486,330 |
|
| | | 8,161,432 |
|
| HOUSEHOLD PRODUCTS — 2.3% | | |
Energizer Holdings, Inc.(1) | 28,726 |
| 3,505,434 |
|
Kimberly-Clark Corp.(1) | 34,548 |
| 3,842,428 |
|
Procter & Gamble Co. (The)(1) | 19,625 |
| 1,542,329 |
|
| | | 8,890,191 |
|
| INDEPENDENT POWER AND RENEWABLE ELECTRICITY PRODUCERS — 0.8% | |
AES Corp. (The)(1) | 200,514 |
| 3,117,993 |
|
| INDUSTRIAL CONGLOMERATES — 1.9% | | |
3M Co.(1) | 6,403 |
| 917,165 |
|
Danaher Corp.(1) | 48,575 |
| 3,824,310 |
|
General Electric Co.(1) | 96,782 |
| 2,543,431 |
|
| | | 7,284,906 |
|
| INSURANCE — 4.1% | | |
| Allstate Corp. (The) | 11,626 |
| 682,679 |
|
American International Group, Inc.(1) | 87,270 |
| 4,763,197 |
|
Amtrust Financial Services, Inc.(1) | 65,042 |
| 2,719,406 |
|
Aspen Insurance Holdings Ltd.(1) | 45,795 |
| 2,080,009 |
|
Hanover Insurance Group, Inc. (The)(1) | 14,661 |
| 925,842 |
|
Old Republic International Corp.(1) | 96,723 |
| 1,599,798 |
|
RenaissanceRe Holdings Ltd.(1) | 27,229 |
| 2,913,503 |
|
| | | 15,684,434 |
|
| INTERNET AND CATALOG RETAIL — 2.0% | | |
Amazon.com, Inc.(2) | 5,538 |
| 1,798,632 |
|
Expedia, Inc.(1) | 40,415 |
| 3,183,085 |
|
| HSN, Inc. | 44,735 |
| 2,650,101 |
|
| | | 7,631,818 |
|
| INTERNET SOFTWARE AND SERVICES — 2.4% | | |
Conversant, Inc.(2) | 7,662 |
| 194,615 |
|
eBay, Inc.(1)(2) | 64,324 |
| 3,220,059 |
|
Google, Inc., Class A(1)(2) | 3,966 |
| 2,318,801 |
|
Google, Inc., Class C(1)(2) | 6,124 |
| 3,523,015 |
|
| | | 9,256,490 |
|
| IT SERVICES — 1.8% | | |
Accenture plc, Class A(1) | 4,280 |
| 345,995 |
|
Amdocs Ltd.(1) | 5,326 |
| 246,754 |
|
Euronet Worldwide, Inc.(2) | 26,277 |
| 1,267,603 |
|
Genpact Ltd.(2) | 10,861 |
| 190,393 |
|
International Business Machines Corp.(1) | 26,240 |
| 4,756,525 |
|
Teradata Corp.(2) | 4,686 |
| 188,377 |
|
| | | 6,995,647 |
|
|
| | | | | |
| | Shares | Value |
| LEISURE PRODUCTS — 0.7% | | |
Hasbro, Inc.(1) | 52,451 |
| $ | 2,782,526 |
|
| LIFE SCIENCES TOOLS AND SERVICES — 0.4% | | |
Charles River Laboratories International, Inc.(2) | 16,950 |
| 907,164 |
|
Illumina, Inc.(2) | 3,817 |
| 681,487 |
|
| | | 1,588,651 |
|
| MACHINERY — 4.0% | | |
AGCO Corp.(1) | 21,951 |
| 1,234,085 |
|
Caterpillar, Inc.(1) | 41,001 |
| 4,455,579 |
|
| Dover Corp. | 30,015 |
| 2,729,864 |
|
| IDEX Corp. | 2,528 |
| 204,111 |
|
| Lincoln Electric Holdings, Inc. | 9,872 |
| 689,855 |
|
Oshkosh Corp.(1) | 24,588 |
| 1,365,372 |
|
Snap-On, Inc.(1) | 25,379 |
| 3,007,919 |
|
Toro Co. (The)(1) | 7,496 |
| 476,746 |
|
WABCO Holdings, Inc.(1)(2) | 13,881 |
| 1,482,768 |
|
| | | 15,646,299 |
|
| MARINE — 0.6% | | |
Matson, Inc.(1) | 89,249 |
| 2,395,443 |
|
| MEDIA — 2.3% | | |
Comcast Corp., Class A(1) | 4,654 |
| 249,827 |
|
John Wiley & Sons, Inc., Class A(1) | 52,119 |
| 3,157,890 |
|
Live Nation Entertainment, Inc.(1)(2) | 87,245 |
| 2,154,079 |
|
| Time Warner, Inc. | 17,478 |
| 1,227,830 |
|
| Viacom, Inc., Class B | 1,808 |
| 156,808 |
|
| Walt Disney Co. (The) | 24,879 |
| 2,133,125 |
|
| | | 9,079,559 |
|
| METALS AND MINING — 1.4% | | |
| Compass Minerals International, Inc. | 21,710 |
| 2,078,515 |
|
United States Steel Corp.(1) | 123,510 |
| 3,216,201 |
|
| | | 5,294,716 |
|
| MULTI-UTILITIES — 0.8% | | |
Wisconsin Energy Corp.(1) | 69,075 |
| 3,240,999 |
|
| MULTILINE RETAIL — 1.5% | | |
Dillard's, Inc., Class A(1) | 21,628 |
| 2,522,041 |
|
Macy's, Inc.(1) | 56,746 |
| 3,292,403 |
|
| | | 5,814,444 |
|
| OIL, GAS AND CONSUMABLE FUELS — 6.8% | | |
| Chesapeake Energy Corp. | 9,611 |
| 298,710 |
|
Chevron Corp.(1) | 15,820 |
| 2,065,301 |
|
ConocoPhillips(1) | 2,115 |
| 181,319 |
|
Encana Corp.(1) | 123,396 |
| 2,925,719 |
|
EOG Resources, Inc.(1) | 39,892 |
| 4,661,779 |
|
Exxon Mobil Corp.(1) | 63,876 |
| 6,431,036 |
|
Gran Tierra Energy, Inc.(1)(2) | 385,358 |
| 3,129,107 |
|
Kosmos Energy Ltd.(1)(2) | 174,313 |
| 1,957,535 |
|
|
| | | | | |
| | Shares | Value |
Occidental Petroleum Corp.(1) | 15,612 |
| $ | 1,602,259 |
|
Valero Energy Corp.(1) | 64,651 |
| 3,239,015 |
|
| | | 26,491,780 |
|
| PAPER AND FOREST PRODUCTS — 0.5% | | |
| International Paper Co. | 36,225 |
| 1,828,276 |
|
| PERSONAL PRODUCTS — 0.5% | | |
Avon Products, Inc.(1) | 123,474 |
| 1,803,955 |
|
| PHARMACEUTICALS — 8.0% | | |
AbbVie, Inc.(1) | 88,664 |
| 5,004,196 |
|
Eli Lilly & Co.(1) | 45,204 |
| 2,810,333 |
|
Johnson & Johnson(1) | 90,023 |
| 9,418,206 |
|
Merck & Co., Inc.(1) | 116,557 |
| 6,742,822 |
|
Pfizer, Inc.(1) | 229,211 |
| 6,802,983 |
|
| | | 30,778,540 |
|
| PROFESSIONAL SERVICES — 1.2% | | |
Manpowergroup, Inc.(1) | 34,998 |
| 2,969,580 |
|
| Towers Watson & Co., Class A | 14,213 |
| 1,481,421 |
|
| | | 4,451,001 |
|
| REAL ESTATE INVESTMENT TRUSTS (REITs) — 1.1% | | |
| Host Hotels & Resorts, Inc. | 146,981 |
| 3,235,052 |
|
| PS Business Parks, Inc. | 11,095 |
| 926,321 |
|
| | | 4,161,373 |
|
| REAL ESTATE MANAGEMENT AND DEVELOPMENT — 1.2% | | |
CBRE Group, Inc.(1)(2) | 100,588 |
| 3,222,840 |
|
St Joe Co. (The)(2) | 54,219 |
| 1,378,789 |
|
| | | 4,601,629 |
|
| SEMICONDUCTORS AND SEMICONDUCTOR EQUIPMENT — 3.9% | | |
Broadcom Corp., Class A(1) | 100,194 |
| 3,719,201 |
|
Fairchild Semiconductor International, Inc.(2) | 14,533 |
| 226,715 |
|
First Solar, Inc.(1)(2) | 3,794 |
| 269,602 |
|
Intel Corp.(1) | 220,890 |
| 6,825,501 |
|
KLA-Tencor Corp.(1) | 27,377 |
| 1,988,665 |
|
| Marvell Technology Group Ltd. | 23,123 |
| 331,353 |
|
| Texas Instruments, Inc. | 15,772 |
| 753,744 |
|
| Xilinx, Inc. | 17,121 |
| 809,994 |
|
| | | 14,924,775 |
|
| SOFTWARE — 5.6% | | |
| CA, Inc. | 7,416 |
| 213,136 |
|
Cadence Design Systems, Inc.(1)(2) | 165,583 |
| 2,896,047 |
|
| Intuit, Inc. | 3,880 |
| 312,456 |
|
Mentor Graphics Corp.(1) | 92,447 |
| 1,994,082 |
|
Microsoft Corp.(1) | 129,606 |
| 5,404,570 |
|
Oracle Corp.(1) | 151,436 |
| 6,137,701 |
|
Symantec Corp.(1) | 96,516 |
| 2,210,217 |
|
Synopsys, Inc.(1)(2) | 62,882 |
| 2,441,079 |
|
| | | 21,609,288 |
|
|
| | | | | |
| | Shares | Value |
| SPECIALTY RETAIL — 2.7% | | |
Best Buy Co., Inc.(1) | 57,470 |
| $ | 1,782,145 |
|
Buckle, Inc. (The)(1) | 30,655 |
| 1,359,856 |
|
GameStop Corp., Class A(1) | 59,432 |
| 2,405,213 |
|
Guess?, Inc.(1) | 79,010 |
| 2,133,270 |
|
Lowe's Cos., Inc.(1) | 25,228 |
| 1,210,692 |
|
PetSmart, Inc.(1) | 12,433 |
| 743,493 |
|
Staples, Inc.(1) | 62,577 |
| 678,334 |
|
| | | 10,313,003 |
|
| TECHNOLOGY HARDWARE, STORAGE AND PERIPHERALS — 7.1% | | |
Apple, Inc.(1) | 167,468 |
| 15,562,801 |
|
EMC Corp.(1) | 151,932 |
| 4,001,889 |
|
Hewlett-Packard Co.(1) | 133,872 |
| 4,508,809 |
|
| NetApp, Inc. | 7,571 |
| 276,493 |
|
| SanDisk Corp. | 20,727 |
| 2,164,521 |
|
Seagate Technology plc(1) | 7,421 |
| 421,661 |
|
| Western Digital Corp. | 7,145 |
| 659,483 |
|
| | | 27,595,657 |
|
| TEXTILES, APPAREL AND LUXURY GOODS — 1.7% | | |
Deckers Outdoor Corp.(1)(2) | 27,295 |
| 2,356,377 |
|
Hanesbrands, Inc.(1) | 34,094 |
| 3,356,213 |
|
Iconix Brand Group, Inc.(1)(2) | 24,373 |
| 1,046,577 |
|
| | | 6,759,167 |
|
| THRIFTS AND MORTGAGE FINANCE — 0.8% | | |
EverBank Financial Corp.(1) | 147,277 |
| 2,969,104 |
|
| TRADING COMPANIES AND DISTRIBUTORS — 0.1% | | |
WESCO International, Inc.(2) | 4,753 |
| 410,564 |
|
TOTAL COMMON STOCKS (Cost $406,025,413) | | 497,412,000 |
|
| TEMPORARY CASH INVESTMENTS — 1.8% | | |
| Repurchase Agreement, Bank of America Merrill Lynch, (collateralized by various U.S. Treasury obligations, 0.75% - 0.875%, 1/31/18 - 2/28/18, valued at $1,536,473), in a joint trading account at 0.05%, dated 6/30/14, due 7/1/14 (Delivery value $1,505,554) | | 1,505,552 |
|
| Repurchase Agreement, Credit Suisse First Boston, Inc., (collateralized by various U.S. Treasury obligations, 1.75%, 5/15/23, valued at $614,788), in a joint trading account at 0.01%, dated 6/30/14, due 7/1/14 (Delivery value $602,221) | | 602,221 |
|
| Repurchase Agreement, Goldman Sachs & Co., (collateralized by various U.S. Treasury obligations, 3.125%, 11/15/41, valued at $1,228,671), in a joint trading account at 0.03%, dated 6/30/14, due 7/1/14 (Delivery value $1,204,442) | | 1,204,441 |
|
| SSgA U.S. Government Money Market Fund, Class N | 3,559,667 |
| 3,559,667 |
|
TOTAL TEMPORARY CASH INVESTMENTS (Cost $6,871,881) | | 6,871,881 |
|
TOTAL INVESTMENT SECURITIES BEFORE SECURITIES SOLD SHORT — 130.4% (Cost $412,897,294) | 504,283,881 |
|
| COMMON STOCKS SOLD SHORT — (30.2)% | | |
| AEROSPACE AND DEFENSE — (0.9)% | | |
| DigitalGlobe, Inc. | (95,333 | ) | (2,650,257 | ) |
| Triumph Group, Inc. | (13,544 | ) | (945,642 | ) |
| | | (3,595,899 | ) |
|
| | | | | |
| | Shares | Value |
| AIR FREIGHT AND LOGISTICS — (0.7)% | | |
| CH Robinson Worldwide, Inc. | (6,978 | ) | $ | (445,127 | ) |
| UTi Worldwide, Inc. | (217,809 | ) | (2,252,145 | ) |
| | | (2,697,272 | ) |
| AUTOMOBILES — (0.4)% | | |
| Thor Industries, Inc. | (29,609 | ) | (1,683,864 | ) |
| BANKS — (0.2)% | | |
| BankUnited, Inc. | (22,202 | ) | (743,323 | ) |
| BIOTECHNOLOGY — (0.3)% | | |
| Intercept Pharmaceuticals, Inc. | (1,138 | ) | (269,285 | ) |
| Puma Biotechnology, Inc. | (11,310 | ) | (746,460 | ) |
| Synageva BioPharma Corp. | (2,317 | ) | (242,822 | ) |
| | | (1,258,567 | ) |
| BUILDING PRODUCTS — (0.6)% | | |
| Armstrong World Industries, Inc. | (40,868 | ) | (2,347,049 | ) |
| CAPITAL MARKETS — (0.1)% | | |
| State Street Corp. | (3,806 | ) | (255,992 | ) |
| CHEMICALS — (0.6)% | | |
| Chemtura Corp. | (74,364 | ) | (1,943,131 | ) |
| Kronos Worldwide, Inc. | (29,196 | ) | (457,502 | ) |
| | | (2,400,633 | ) |
| COMMERCIAL SERVICES AND SUPPLIES — (1.8)% | | |
| Copart, Inc. | (34,718 | ) | (1,248,459 | ) |
| Interface, Inc. | (129,207 | ) | (2,434,260 | ) |
| Iron Mountain, Inc. | (89,613 | ) | (3,176,781 | ) |
| | | (6,859,500 | ) |
| COMMUNICATIONS EQUIPMENT — (0.3)% | | |
| ViaSat, Inc. | (22,713 | ) | (1,316,445 | ) |
| CONSTRUCTION AND ENGINEERING — (0.8)% | | |
| Chicago Bridge & Iron Co. NV | (7,366 | ) | (502,361 | ) |
| Granite Construction, Inc. | (77,202 | ) | (2,777,728 | ) |
| | | (3,280,089 | ) |
| DIVERSIFIED FINANCIAL SERVICES — (1.1)% | | |
| Intercontinental Exchange, Inc. | (7,628 | ) | (1,440,929 | ) |
| Leucadia National Corp. | (100,940 | ) | (2,646,647 | ) |
| | | (4,087,576 | ) |
| ELECTRIC UTILITIES — (0.4)% | | |
| ALLETE, Inc. | (28,411 | ) | (1,458,905 | ) |
| ELECTRICAL EQUIPMENT — (0.6)% | | |
| Franklin Electric Co., Inc. | (61,546 | ) | (2,482,150 | ) |
| ELECTRONIC EQUIPMENT, INSTRUMENTS AND COMPONENTS — (0.1)% | |
| AVX Corp. | (21,333 | ) | (283,302 | ) |
| ENERGY EQUIPMENT AND SERVICES — (1.5)% | | |
| Bristow Group, Inc. | (21,171 | ) | (1,706,806 | ) |
| Dresser-Rand Group, Inc. | (14,154 | ) | (902,034 | ) |
| Hornbeck Offshore Services, Inc. | (11,705 | ) | (549,199 | ) |
|
| | | | | |
| | Shares | Value |
| McDermott International, Inc. | (320,366 | ) | $ | (2,591,761 | ) |
| | | (5,749,800 | ) |
| FOOD AND STAPLES RETAILING — (0.5)% | | |
| United Natural Foods, Inc. | (27,566 | ) | (1,794,547 | ) |
| FOOD PRODUCTS — (0.7)% | | |
| Darling Ingredients, Inc. | (122,363 | ) | (2,557,387 | ) |
| GAS UTILITIES — (0.2)% | | |
| South Jersey Industries, Inc. | (11,697 | ) | (706,616 | ) |
| HEALTH CARE EQUIPMENT AND SUPPLIES — (0.1)% | | |
| IDEXX Laboratories, Inc. | (1,951 | ) | (260,595 | ) |
| HEALTH CARE PROVIDERS AND SERVICES — (1.4)% | | |
| Acadia Healthcare Co., Inc. | (9,131 | ) | (415,460 | ) |
| Air Methods Corp. | (35,971 | ) | (1,857,902 | ) |
| AmerisourceBergen Corp. | (27,622 | ) | (2,007,014 | ) |
| Community Health Systems, Inc. | (4,948 | ) | (224,491 | ) |
| MWI Veterinary Supply, Inc. | (2,027 | ) | (287,814 | ) |
| Tenet Healthcare Corp. | (12,886 | ) | (604,869 | ) |
| | | (5,397,550 | ) |
| HOTELS, RESTAURANTS AND LEISURE — (0.3)% | | |
| BJ's Restaurants, Inc. | (35,083 | ) | (1,224,747 | ) |
| HOUSEHOLD DURABLES — (3.7)% | | |
| DR Horton, Inc. | (66,833 | ) | (1,642,755 | ) |
| Lennar Corp., Class A | (67,834 | ) | (2,847,671 | ) |
| M.D.C. Holdings, Inc. | (31,934 | ) | (967,281 | ) |
| Ryland Group, Inc. | (14,400 | ) | (567,936 | ) |
| Standard Pacific Corp. | (312,497 | ) | (2,687,474 | ) |
| Tempur Sealy International, Inc. | (47,264 | ) | (2,821,661 | ) |
| Toll Brothers, Inc. | (74,203 | ) | (2,738,091 | ) |
| | | (14,272,869 | ) |
| INSURANCE — (0.1)% | | |
| ProAssurance Corp. | (6,844 | ) | (303,874 | ) |
| INTERNET SOFTWARE AND SERVICES — (0.3)% | | |
| Dealertrack Technologies, Inc. | (30,092 | ) | (1,364,371 | ) |
| IT SERVICES — (1.1)% | | |
| Alliance Data Systems Corp. | (4,330 | ) | (1,217,813 | ) |
| WEX, Inc. | (29,984 | ) | (3,147,420 | ) |
| | | (4,365,233 | ) |
| MACHINERY — (0.8)% | | |
| Chart Industries, Inc. | (37,194 | ) | (3,077,432 | ) |
| MEDIA — (0.8)% | | |
| AMC Networks, Inc., Class A | (7,797 | ) | (479,437 | ) |
| Loral Space & Communications, Inc. | (36,423 | ) | (2,647,588 | ) |
| | | (3,127,025 | ) |
| METALS AND MINING — (2.5)% | | |
| Allegheny Technologies, Inc. | (10,774 | ) | (485,907 | ) |
| AuRico Gold, Inc. | (90,183 | ) | (384,180 | ) |
| Carpenter Technology Corp. | (18,118 | ) | (1,145,963 | ) |
| Hecla Mining Co. | (185,622 | ) | (640,396 | ) |
|
| | | | | |
| | Shares | Value |
| New Gold, Inc. | (545,529 | ) | $ | (3,475,020 | ) |
| Royal Gold, Inc. | (4,773 | ) | (363,321 | ) |
| Stillwater Mining Co. | (128,047 | ) | (2,247,225 | ) |
| Tahoe Resources, Inc. | (42,812 | ) | (1,121,674 | ) |
| | | (9,863,686 | ) |
| MULTILINE RETAIL — (0.1)% | | |
| Family Dollar Stores, Inc. | (3,091 | ) | (204,439 | ) |
| OIL, GAS AND CONSUMABLE FUELS — (0.8)% | | |
| Consol Energy, Inc. | (43,510 | ) | (2,004,506 | ) |
| Diamondback Energy, Inc. | (9,139 | ) | (811,543 | ) |
| Williams Cos., Inc. (The) | (5,786 | ) | (336,803 | ) |
| | | (3,152,852 | ) |
| PHARMACEUTICALS — (0.1)% | | |
| Hospira, Inc. | (4,944 | ) | (253,973 | ) |
| REAL ESTATE INVESTMENT TRUSTS (REITs) — (0.3)% | | |
| Plum Creek Timber Co., Inc. | (8,676 | ) | (391,287 | ) |
| Weingarten Realty Investors | (21,890 | ) | (718,868 | ) |
| | | (1,110,155 | ) |
| ROAD AND RAIL — (0.7)% | | |
| Kansas City Southern | (25,122 | ) | (2,700,866 | ) |
| SEMICONDUCTORS AND SEMICONDUCTOR EQUIPMENT — (0.8)% | | |
| SunEdison, Inc. | (145,015 | ) | (3,277,339 | ) |
| SOFTWARE — (1.2)% | | |
| Concur Technologies, Inc. | (19,507 | ) | (1,820,783 | ) |
| Solera Holdings, Inc. | (42,358 | ) | (2,844,340 | ) |
| | | (4,665,123 | ) |
| SPECIALTY RETAIL — (2.5)% | | |
| Cabela's, Inc. | (48,621 | ) | (3,033,950 | ) |
| CarMax, Inc. | (50,048 | ) | (2,602,997 | ) |
| Conn's, Inc. | (66,938 | ) | (3,306,068 | ) |
| Office Depot, Inc. | (137,312 | ) | (781,305 | ) |
| | | (9,724,320 | ) |
| TECHNOLOGY HARDWARE, STORAGE AND PERIPHERALS — (0.6)% | | |
| Stratasys Ltd. | (21,260 | ) | (2,415,774 | ) |
| TEXTILES, APPAREL AND LUXURY GOODS — (0.1)% | | |
| Carter's, Inc. | (3,231 | ) | (222,713 | ) |
| THRIFTS AND MORTGAGE FINANCE — (0.1)% | | |
| Capitol Federal Financial, Inc. | (16,323 | ) | (198,488 | ) |
TOTAL COMMON STOCKS SOLD SHORT — (30.2)% (Proceeds $107,826,977) | | (116,742,340 | ) |
| OTHER ASSETS AND LIABILITIES — (0.2)% | | (664,843 | ) |
| TOTAL NET ASSETS — 100.0% | | $ | 386,876,698 |
|
|
| | |
| NOTES TO SCHEDULE OF INVESTMENTS |
| |
| (1) | Security, or a portion thereof, has been pledged at the custodian bank or with a broker for collateral requirements on securities sold short. At the period end, the aggregate value of securities pledged was $353,641,080. |
See Notes to Financial Statements.
|
|
| Statement of Assets and Liabilities |
|
| | | |
| JUNE 30, 2014 |
| Assets |
| Investment securities, at value (cost of $412,897,294) | $ | 504,283,881 |
|
| Cash | 6,786 |
|
| Deposits with broker for securities sold short | 1,261,004 |
|
| Receivable for investments sold | 1,054,588 |
|
| Receivable for capital shares sold | 973 |
|
| Dividends and interest receivable | 436,565 |
|
| | 507,043,797 |
|
| | |
| Liabilities | |
| Securities sold short, at value (proceeds of $107,826,977) | 116,742,340 |
|
| Payable for investments purchased | 3,024,605 |
|
| Accrued management fees | 345,504 |
|
| Dividend expense payable on securities sold short | 54,650 |
|
| | 120,167,099 |
|
| | |
| Net Assets | $ | 386,876,698 |
|
| | |
| Institutional Class Capital Shares, $0.01 Par Value | |
| Shares authorized | 100,000,000 |
|
| Shares outstanding | 24,886,803 |
|
| | |
| Net Asset Value Per Share | $ | 15.55 |
|
| | |
| Net Assets Consist of: | |
| Capital (par value and paid-in surplus) | $ | 276,890,617 |
|
| Undistributed net investment income | 55,052 |
|
| Undistributed net realized gain | 27,459,805 |
|
| Net unrealized appreciation | 82,471,224 |
|
| | $ | 386,876,698 |
|
See Notes to Financial Statements.
|
| | | |
| YEAR ENDED JUNE 30, 2014 |
| Investment Income (Loss) |
| Income: | |
| Dividends (net of foreign taxes withheld of $9,609) | $ | 8,105,494 |
|
| Interest | 2,010 |
|
| | 8,107,504 |
|
| | |
| Expenses: | |
| Dividend expense on securities sold short | 919,782 |
|
| Broker fees and charges on securities sold short | 627,919 |
|
| Management fees | 3,634,220 |
|
| Directors' fees and expenses | 19,822 |
|
| | 5,201,743 |
|
| | |
| Net investment income (loss) | 2,905,761 |
|
| | |
| Realized and Unrealized Gain (Loss) | |
| Net realized gain (loss) on: | |
| Investment transactions | 50,639,748 |
|
| Securities sold short transactions | (13,509,320 | ) |
| | 37,130,428 |
|
| | |
| Change in net unrealized appreciation (depreciation) on: | |
| Investments | 42,787,113 |
|
| Securities sold short | (5,244,833 | ) |
| | 37,542,280 |
|
| | |
| Net realized and unrealized gain (loss) | 74,672,708 |
|
| | |
| Net Increase (Decrease) in Net Assets Resulting from Operations | $ | 77,578,469 |
|
See Notes to Financial Statements.
|
|
| Statement of Changes in Net Assets |
|
| | | | | | |
| YEARS ENDED JUNE 30, 2014 AND JUNE 30, 2013 |
| Increase (Decrease) in Net Assets | June 30, 2014 | June 30, 2013 |
| Operations | | |
| Net investment income (loss) | $ | 2,905,761 |
| $ | 3,022,524 |
|
| Net realized gain (loss) | 37,130,428 |
| 11,750,342 |
|
| Change in net unrealized appreciation (depreciation) | 37,542,280 |
| 30,800,835 |
|
| Net increase (decrease) in net assets resulting from operations | 77,578,469 |
| 45,573,701 |
|
| | | |
| Distributions to Shareholders | | |
| From net investment income | (2,895,863 | ) | (3,503,918 | ) |
| From net realized gains | (18,191,926 | ) | (2,503,132 | ) |
| Decrease in net assets from distributions | (21,087,789 | ) | (6,007,050 | ) |
| | | |
| Capital Share Transactions | | |
| Proceeds from shares sold | 53,033,084 |
| 55,757,312 |
|
| Proceeds from reinvestment of distributions | 21,087,789 |
| 6,007,050 |
|
| Payments for shares redeemed | (11,310,492 | ) | (22,403,513 | ) |
| Net increase (decrease) in net assets from capital share transactions | 62,810,381 |
| 39,360,849 |
|
| | | |
| Net increase (decrease) in net assets | 119,301,061 |
| 78,927,500 |
|
| | | |
| Net Assets | | |
| Beginning of period | 267,575,637 |
| 188,648,137 |
|
| End of period | $ | 386,876,698 |
| $ | 267,575,637 |
|
| | | |
| Undistributed net investment income | $ | 55,052 |
| $ | 128,812 |
|
| | | |
| Transactions in Shares of the Fund | | |
| Sold | 3,687,822 |
| 4,747,230 |
|
| Issued in reinvestment of distributions | 1,466,219 |
| 507,547 |
|
| Redeemed | (763,715 | ) | (1,988,165 | ) |
| Net increase (decrease) in shares of the fund | 4,390,326 |
| 3,266,612 |
|
See Notes to Financial Statements.
|
| | | |
| YEAR ENDED JUNE 30, 2014 | |
| Cash Flows From (Used In) Operating Activities | |
| Net increase (decrease) in net assets resulting from operations | $ | 77,578,469 |
|
| Adjustments to reconcile net increase (decrease) in net assets resulting from operations to net cash from (used in) operating activities: | |
| Purchases of investment securities | (371,799,735 | ) |
| Proceeds from investments sold | 311,327,978 |
|
| Purchases to cover securities sold short | (110,960,845 | ) |
| Proceeds from securities sold short | 130,408,935 |
|
| (Increase) decrease in short-term investments | (4,347,543 | ) |
| (Increase) decrease in deposits with broker for securities sold short | (1,206,094 | ) |
| (Increase) decrease in receivable for investments sold | (1,054,588 | ) |
| (Increase) decrease in dividends and interest receivable | (149,399 | ) |
| Increase (decrease) in payable for investments purchased | 3,024,605 |
|
| Increase (decrease) in accrued management fees | 101,990 |
|
| Increase (decrease) in dividend expense payable on securities sold short | 8,870 |
|
| Increase (decrease) in broker fees and charges payable on securities sold short | (2,066 | ) |
| Change in net unrealized (appreciation) depreciation on investments | (42,787,113 | ) |
| Net realized (gain) loss on investment transactions | (50,639,748 | ) |
| Change in net unrealized (appreciation) depreciation on securities sold short | 5,244,833 |
|
| Net realized (gain) loss on securities sold short transactions | 13,509,320 |
|
| Net cash from (used in) operating activities | (41,742,131 | ) |
| | |
| Cash Flows From (Used In) Financing Activities | |
| Proceeds from shares sold | 53,059,409 |
|
| Payments for shares redeemed | (11,310,492 | ) |
| Distributions paid, net of reinvestments | — |
|
| Net cash from (used in) financing activities | 41,748,917 |
|
| | |
| Net Increase (Decrease) In Cash | 6,786 |
|
| Cash at beginning of period | — |
|
| Cash at end of period | $ | 6,786 |
|
| | |
| Supplemental disclosure of cash flow information: | |
| Non cash financing activities not included herein consist of all reinvestment of distributions of $21,087,789. |
See Notes to Financial Statements.
|
|
| Notes to Financial Statements |
JUNE 30, 2014
1. Organization
American Century Quantitative Equity Funds, Inc. (the corporation) is registered under the Investment Company Act of 1940, as amended (the 1940 Act), as an open-end management investment company and is organized as a Maryland corporation. NT Core Equity Plus Fund (the fund) is one fund in a series issued by the corporation. The fund is diversified as defined under the 1940 Act. The fund’s investment objective is to seek long-term capital growth. The fund is not permitted to invest in securities issued by companies assigned the Global Industry Classification Standard for the tobacco industry.
2. Significant Accounting Policies
The following is a summary of significant accounting policies consistently followed by the fund in preparation of its financial statements. The financial statements are prepared in conformity with accounting principles generally accepted in the United States of America, which may require management to make certain estimates and assumptions at the date of the financial statements. Actual results could differ from these estimates. Management evaluated the impact of events or transactions occurring through the date the financial statements were issued that would merit recognition or disclosure.
Investment Valuations — The fund determines the fair value of its investments and computes its net asset value per share at the close of regular trading (usually 4 p.m. Eastern time) on the New York Stock Exchange (NYSE) on each day the NYSE is open. The Board of Directors has adopted valuation policies and procedures to guide the investment advisor in the fund’s investment valuation process and to provide methodologies for the oversight of the fund’s pricing function.
Equity securities that are listed or traded on a domestic securities exchange are valued at the last reported sales price or at the official closing price as provided by the exchange. Equity securities traded on foreign securities exchanges are generally valued at the closing price of such securities on the exchange where primarily traded or at the close of the NYSE, if that is earlier. If no last sales price is reported, or if local convention or regulation so provides, the mean of the latest bid and asked prices may be used. Securities traded over-the-counter are valued at the mean of the latest bid and asked prices, the last sales price, or the official closing price.
Fixed income securities maturing within 60 days at the time of purchase may be valued at cost, plus or minus any amortized discount or premium or at the evaluated mean as provided by an independent pricing service. Evaluated mean prices are commonly derived through utilization of market models, which may consider, among other factors: trade data, quotations from dealers and active market makers, relevant yield curve and spread data, related sector levels, creditworthiness, trade data or market information on comparable securities, and other relevant security specific information.
Open-end management investment companies are valued at the reported net asset value per share. Repurchase agreements are valued at cost, which approximates fair value.
If the fund determines that the market price for an investment is not readily available or the valuation methods mentioned above do not reflect an investment’s fair value, such investment is valued as determined in good faith by the Board of Directors or its delegate, in accordance with policies and procedures adopted by the Board of Directors. In its determination of fair value, the fund may review several factors including, but not limited to, market information regarding the specific investment or comparable investments and correlation with other investment types, futures indices or general market indicators. Circumstances that may cause the fund to use these procedures to value an investment include, but are not limited to: an investment has been declared in default or is distressed; trading in a security has been suspended during the trading day or a security is not actively trading on its principal exchange; prices received from a regular pricing source are deemed unreliable; or there is a foreign market holiday and no trading occurred.
The fund monitors for significant events occurring after the close of an investment’s primary exchange but before the fund’s net asset value per share is determined. Significant events may include, but are not
limited to: corporate announcements and transactions; governmental action and political unrest that could impact a specific investment or an investment sector; or armed conflicts, natural disasters and similar events that could affect investments in a specific country or region. The fund also monitors for significant fluctuations between domestic and foreign markets, as evidenced by the U.S. market or such other indicators that the Board of Directors, or its delegate, deems appropriate. If significant fluctuations in foreign markets are identified, the fund may apply a model-derived factor to the closing price of equity securities traded on foreign securities exchanges. The factor is based on observable market data as provided by an independent pricing service.
Security Transactions — Security transactions are accounted for as of the trade date. Net realized gains and losses are determined on the identified cost basis, which is also used for federal income tax purposes.
Investment Income — Dividend income less foreign taxes withheld, if any, is recorded as of the ex-dividend date. Distributions received on securities that represent a return of capital or long-term capital gain are recorded as a reduction of cost of investments and/or as a realized gain. The fund may estimate the components of distributions received that may be considered nontaxable distributions or long-term capital gain distributions for income tax purposes. Interest income is recorded on the accrual basis and includes accretion of discounts and amortization of premiums.
Securities Sold Short — The fund enters into short sales, which is selling securities it does not own, as part of its normal investment activities. Upon selling a security short, the fund will segregate cash, cash equivalents or other appropriate liquid securities in at least an amount equal to the current market value of the securities sold short until the fund replaces the borrowed security. Interest earned on segregated cash for securities sold short is reflected as interest income. The fund is required to pay any dividends or interest due on securities sold short. Such dividends and interest are recorded as an expense. The fund may pay fees or charges to the broker on the assets borrowed for securities sold short. These fees are calculated daily based upon the value of each security sold short and a rate that is dependent on the availability of such security. Liabilities for securities sold short are valued daily and changes in value are recorded as change in net unrealized appreciation (depreciation) on securities sold short. The fund records realized gain (loss) on a security sold short when it is terminated by the fund and includes as a component of net realized gain (loss) on securities sold short transactions.
Repurchase Agreements — The fund may enter into repurchase agreements with institutions that American Century Investment Management, Inc. (ACIM) (the investment advisor) has determined are creditworthy pursuant to criteria adopted by the Board of Directors. The fund requires that the collateral, represented by securities, received in a repurchase transaction be transferred to the custodian in a manner sufficient to enable the fund to obtain those securities in the event of a default under the repurchase agreement. ACIM monitors, on a daily basis, the securities transferred to ensure the value, including accrued interest, of the securities under each repurchase agreement is equal to or greater than amounts owed to the fund under each repurchase agreement.
Joint Trading Account — Pursuant to an Exemptive Order issued by the Securities and Exchange Commission, the fund, along with certain other funds in the American Century Investments family of funds, may transfer uninvested cash balances into a joint trading account. These balances are invested in one or more repurchase agreements that are collateralized by U.S. Treasury or Agency obligations.
Segregated Assets — In accordance with the 1940 Act, the fund segregates assets on its books and records to cover certain types of investments, including, but not limited to, futures contracts and short sales. ACIM monitors, on a daily basis, the securities segregated to ensure the fund designates a sufficient amount of liquid assets, marked-to-market daily. The fund may also receive assets or be required to pledge assets at the custodian bank or with a broker for margin requirements on futures contracts and short sales.
Income Tax Status — It is the fund’s policy to distribute substantially all net investment income and net realized gains to shareholders and to otherwise qualify as a regulated investment company under provisions of the Internal Revenue Code. Accordingly, no provision has been made for income taxes. The fund files U.S. federal, state, local and non-U.S. tax returns as applicable. The fund's tax returns are subject to examination by the relevant taxing authority until expiration of the applicable statute of limitations, which is generally three years from the date of filing but can be longer in certain jurisdictions. At this time, management believes there are no uncertain tax positions which, based on their technical
merit, would not be sustained upon examination and for which it is reasonably possible that the total amounts of unrecognized tax benefits will significantly change in the next twelve months.
Distributions to Shareholders — Distributions from net investment income, if any, are generally declared and paid semiannually. Distributions from net realized gains, if any, are generally declared and paid annually.
Indemnifications — Under the corporation’s organizational documents, its officers and directors are indemnified against certain liabilities arising out of the performance of their duties to the fund. In addition, in the normal course of business, the fund enters into contracts that provide general indemnifications. The maximum exposure under these arrangements is unknown as this would involve future claims that may be made against a fund. The risk of material loss from such claims is considered by management to be remote.
Statement of Cash Flows — The beginning of period and end of period cash in the Statement of Cash Flows is the amount of domestic and foreign currency included in the fund's Statement of Assets and Liabilities and represents the cash on hand at the custodian bank and does not include any short-term investments or deposits with brokers for securities sold short.
3. Fees and Transactions with Related Parties
Certain officers and directors of the corporation are also officers and/or directors of American Century Companies, Inc. (ACC). The corporation’s investment advisor, ACIM, the corporation's distributor, American Century Investment Services, Inc., and the corporation’s transfer agent, American Century Services, LLC, are wholly owned, directly or indirectly, by ACC. Various funds issued by American Century Asset Allocation Portfolios, Inc. own, in aggregate, 100% of the shares of the fund. Related parties do not invest in the fund for the purpose of exercising management or control.
Management Fees — The corporation has entered into a management agreement with ACIM, under which ACIM provides the fund with investment advisory and management services in exchange for a single, unified management fee (the fee). The agreement provides that all expenses of managing and operating the fund, except distribution and service fees, expenses on securities sold short, brokerage expenses, taxes, interest, fees and expenses of the independent directors (including legal counsel fees), and extraordinary expenses, will be paid by ACIM. The fee is computed and accrued daily based on the daily net assets of the fund and paid monthly in arrears. The fee consists of (1) an Investment Category Fee based on the daily net assets of the fund and certain other accounts managed by the investment advisor that are in the same broad investment category as the fund and (2) a Complex Fee based on the assets of all the funds in the American Century Investments family of funds. The rates for the Investment Category Fee range from 0.9680% to 1.1500%. The rates for the Complex Fee range from 0.0500% to 0.1100%. The effective annual management fee for the year ended June 30, 2014 was 1.10%.
Directors' Fees and Expenses — The Board of Directors is responsible for overseeing the investment advisor’s management and operations of the fund. The directors receive detailed information about the fund and its investment advisor regularly throughout the year, and meet at least quarterly with management of the investment advisor to review reports about fund operations. Fees and expenses incurred in conjunction with the directors during the year ended June 30, 2014 are detailed in the Statement of Operations. The fund’s officers do not receive compensation from the fund.
4. Investment Transactions
Purchases and sales of investment securities and securities sold short, excluding short-term investments, for the year ended June 30, 2014 were $482,760,580 and $441,736,913, respectively.
5. Fair Value Measurements
The fund’s investments valuation process is based on several considerations and may use multiple inputs to determine the fair value of the investments held by the fund. In conformity with accounting principles generally accepted in the United States of America, the inputs used to determine a valuation are classified into three broad levels.
| |
| • | Level 1 valuation inputs consist of unadjusted quoted prices in an active market for identical investments. |
| |
| • | Level 2 valuation inputs consist of direct or indirect observable market data (including quoted prices for comparable investments, evaluations of subsequent market events, interest rates, prepayment speeds, credit risk, etc.). These inputs also consist of quoted prices for identical investments initially expressed in local currencies that are adjusted through translation into U.S. dollars. |
| |
| • | Level 3 valuation inputs consist of unobservable data (including a fund’s own assumptions). |
The level classification is based on the lowest level input that is significant to the fair valuation measurement. The valuation inputs are not necessarily an indication of the risks associated with investing in these securities or other financial instruments.
The following is a summary of the level classifications as of period end. The Schedule of Investments provides additional information on the fund’s portfolio holdings.
|
| | | | | | | | |
| | Level 1 | Level 2 | Level 3 |
| Assets |
| Investment Securities | | | |
| Common Stocks | $ | 497,412,000 |
| — |
| — |
|
| Temporary Cash Investments | 3,559,667 |
| $ | 3,312,214 |
| — |
|
| | $ | 500,971,667 |
| $ | 3,312,214 |
| — |
|
| | | | |
| Liabilities |
| Securities Sold Short | | | |
| Common Stocks | $ | (116,742,340 | ) | — |
| — |
|
6. Risk Factors
The fund's investment strategy utilizes leverage, which can increase market exposure and subject the fund to greater risk and higher volatility.
The fund’s investment process may result in high portfolio turnover, which could mean high transaction costs, affecting both performance and capital gains tax liabilities to investors.
The fund is subject to short sales risk. If the market price of a security increases after the fund borrows the security, the fund may suffer a loss when it replaces the borrowed security at the higher price. Any loss will be increased by the amount of compensation, interest or dividends, and transaction costs the fund must pay to the lender of the borrowed security.
If the fund is overweighted in a stock or sector, any negative development related to that stock or sector will have a greater impact on the fund than other funds that are not overweighted in that stock or sector.
7. Federal Tax Information
The tax character of distributions paid during the years ended June 30, 2014 and June 30, 2013 were as follows:
|
| | | | | | |
| | 2014 | 2013 |
| Distributions Paid From | | |
| Ordinary income | $ | 6,818,382 |
| $ | 5,753,135 |
|
| Long-term capital gains | $ | 14,269,407 |
| $ | 253,915 |
|
The book-basis character of distributions made during the year from net investment income or net realized gains may differ from their ultimate characterization for federal income tax purposes. These differences reflect the differing character of certain income items and net realized gains and losses for financial statement and tax purposes, and may result in reclassification among certain capital accounts on the financial statements.
As of June 30, 2014, the federal tax cost of investments and the components of distributable earnings on a tax-basis were as follows:
|
| | | |
| Federal tax cost of investments | $ | 412,938,749 |
|
| Gross tax appreciation of investments | $ | 94,272,212 |
|
| Gross tax depreciation of investments | (2,927,080 | ) |
| Net tax appreciation (depreciation) of investments | 91,345,132 |
|
| Net tax appreciation (depreciation) on securities sold short | (9,062,256 | ) |
| Net tax appreciation (depreciation) | $ | 82,282,876 |
|
| Undistributed ordinary income | $ | 2,076,017 |
|
| Accumulated long-term gains | $ | 25,627,188 |
|
The difference between book-basis and tax-basis unrealized appreciation (depreciation) is attributable primarily to the tax deferral of losses on wash sales.
|
| | | | | | | | | | | | | | | | |
| For a Share Outstanding Throughout the Years Ended June 30 (except as noted) |
| Per-Share Data | | | | | | | | Ratios and Supplemental Data | | |
| | | Income From Investment Operations: | Distributions From: | | | Ratio to Average Net Assets of: | | |
| | Net Asset Value, Beginning of Period | Net Investment Income (Loss)(1) | Net Realized and Unrealized Gain (Loss) | Total From Investment Operations | Net Investment Income | Net Realized Gains | Total Distributions | Net Asset Value, End of Period | Total Return(2) | Operating Expenses | Operating Expenses (excluding expenses on securities sold short) | Net Investment Income (Loss) | Portfolio Turnover Rate | Net Assets, End of Period (in thousands) |
| Institutional Class | | | | | | | | | | | |
| 2014 | $13.05 | 0.13 | 3.33 | 3.46 | (0.12) | (0.84) | (0.96) | $15.55 | 27.10% | 1.57% | 1.10% | 0.88% | 104% |
| $386,877 |
|
| 2013 | $10.95 | 0.16 | 2.26 | 2.42 | (0.18) | (0.14) | (0.32) | $13.05 | 22.54% | 1.66% | 1.10% | 1.35% | 111% |
| $267,576 |
|
2012(3) | $10.00 | 0.03 | 0.92 | 0.95 | —(4) | — | —(4) | $10.95 | 9.55% | 1.86%(5) | 1.11%(5) | 0.53%(5) | 81% |
| $188,648 |
|
|
|
| Notes to Financial Highlights |
| |
| (1) | Computed using average shares outstanding throughout the period. |
| |
| (2) | Total returns are calculated based on the net asset value of the last business day. Total returns for periods less than one year are not annualized. |
| |
| (3) | December 1, 2011 (fund inception) through June 30, 2012. |
| |
| (4) | Per-share amount was less than $0.005. |
See Notes to Financial Statements.
|
|
| Report of Independent Registered Public Accounting Firm |
To the Directors of the American Century Quantitative Equity Funds, Inc. and Shareholders of the NT Core Equity Plus Fund:
In our opinion, the accompanying statement of assets and liabilities, including the schedule of investments, and the related statements of operations, of changes in net assets and of cash flows and the financial highlights present fairly, in all material respects, the financial position of the NT Core Equity Plus Fund (one of the fifteen funds comprising the American Century Quantitative Equity Funds, Inc., hereafter referred to as the “Fund”) at June 30, 2014, the results of its operations and its cash flows for the year then ended, the changes in its net assets for each of the two years in the period then ended and the financial highlights for each of the periods presented, in conformity with accounting principles generally accepted in the United States of America. These financial statements and financial highlights (hereafter referred to as "financial statements") are the responsibility of the Fund's management. Our responsibility is to express an opinion on these financial statements based on our audits. We conducted our audits of these financial statements in accordance with the standards of the Public Company Accounting Oversight Board (United States). Those standards require that we plan and perform the audit to obtain reasonable assurance about whether the financial statements are free of material misstatement. An audit includes examining, on a test basis, evidence supporting the amounts and disclosures in the financial statements, assessing the accounting principles used and significant estimates made by management, and evaluating the overall financial statement presentation. We believe that our audits, which included confirmation of securities at June 30, 2014 by correspondence with the custodian and brokers, provide a reasonable basis for our opinion.
PricewaterhouseCoopers LLP
Kansas City, Missouri
August 21, 2014
Board of Directors
The individuals listed below serve as directors of the funds. Each director will continue to serve in this capacity until death, retirement, resignation or removal from office. The board has adopted a mandatory retirement age for directors who are not “interested persons,” as that term is defined in the Investment Company Act (independent directors). Independent directors shall retire on December 31 of the year in which they reach their 75th birthday; provided, however, that on or after January 1, 2022, independent directors shall retire on December 31 of the year in which they reach their 76th birthday.
Mr. Thomas is an “interested person” because he currently serves as President and Chief Executive Officer of American Century Companies, Inc. (ACC), the parent company of American Century Investment Management, Inc. (ACIM or the advisor). The other directors (more than three-fourths of the total number) are independent. They are not employees, directors or officers of, and have no financial interest in, ACC or any of its wholly owned, direct or indirect, subsidiaries, including ACIM, American Century Investment Services, Inc. (ACIS) and American Century Services, LLC (ACS), and do not have any other affiliations, positions or relationships that would cause them to be considered “interested persons” under the Investment Company Act. The directors serve in this capacity for eight (in the case of Mr. Thomas, 15) registered investment companies in the American Century Investments family of funds.
The following table presents additional information about the directors. The mailing address for each director other than Mr. Thomas is 1665 Charleston Road, Mountain View, California 94043. The mailing address for Mr. Thomas is 4500 Main Street, Kansas City, Missouri 64111.
|
| | | | | |
Name (Year of Birth) | Position(s) Held with Funds | Length of Time Served | Principal Occupation(s) During Past 5 Years | Number of
American
Century
Portfolios
Overseen
by Director | Other Directorships Held During Past 5 Years |
| Independent Directors |
Tanya S. Beder (1955) | Director | Since 2011 | Chairman, SBCC Group Inc. (independent advisory services) (2006 to present) | 42 | CYS Investments, Inc. (specialty finance company) |
Jeremy I. Bulow (1954) | Director | Since 2011 | Professor of Economics, Stanford University, Graduate School of Business (1979 to present) | 42 | None |
Ronald J. Gilson (1946) | Director and Chairman of the Board | Since 1995 (Chairman since 2005) | Charles J. Meyers Professor of Law and Business, Stanford Law School (1979 to present); Marc and Eva Stern Professor of Law and Business, Columbia University School of Law (1992 to present) | 42 | None |
|
| | | | | |
Name (Year of Birth) | Position(s) Held with Funds | Length of Time Served | Principal Occupation(s) During Past 5 Years | Number of
American
Century
Portfolios
Overseen
by Director | Other Directorships Held During Past 5 Years |
| Independent Directors |
Frederick L. A. Grauer (1946) | Director | Since 2008 | Senior Advisor, BlackRock, Inc. (investment management firm) (2010 to 2011); Senior Advisor, Barclays Global Investors (investment management firm) (2003 to 2009) | 42 | None |
Peter F. Pervere
(1947) | Director | Since 2007 | Retired | 42 | Intraware, Inc. (2003 to 2009) |
Myron S. Scholes(1) (1941) | Director | Since 1980 | Chairman, Platinum Grove Asset Management, L.P. (asset manager) (1999 to 2009); Frank E. Buck Professor of Finance-Emeritus, Stanford Graduate School of Business (1996 to present) | 42 | Dimensional Fund Advisors (investment advisor); CME Group, Inc. (futures and options exchange) |
John B. Shoven
(1947) | Director | Since 2002 | Professor of Economics, Stanford University (1973 to present) | 42 | Cadence Design Systems; Exponent; Financial Engines |
| Interested Director |
Jonathan S. Thomas
(1963) | Director and
President | Since 2007 | President and Chief Executive Officer, ACC (March 2007 to present). Also serves as Chief Executive Officer and Manager, ACS; Executive Vice President, ACIM; Director, ACC, ACIM and other ACC subsidiaries | 115 | None |
(1) Myron S. Scholes resigned as director effective July 31, 2014.
Officers
The following table presents certain information about the executive officers of the funds. Each officer serves as an officer for each of the 15 investment companies in the American Century family of funds, unless otherwise noted. No officer is compensated for his or her service as an officer of the funds. The listed officers are interested persons of the funds and are appointed or re-appointed on an annual basis. The mailing address for each of the officers listed below is 4500 Main Street, Kansas City, Missouri 64111.
|
| | |
Name (Year of Birth) | Offices with the Funds | Principal Occupation(s) During the Past Five Years |
Jonathan S. Thomas (1963) | Director and President since 2007 | President and Chief Executive Officer, ACC (March 2007 to present). Also serves as Chief Executive Officer and Manager, ACS; Executive Vice President, ACIM; Director, ACC, ACIM and other ACC subsidiaries |
| Amy D. Shelton (1964) | Chief Compliance Officer since 2014 | Chief Compliance Officer, American Century funds, (March 2014 to present); Chief Compliance Officer, ACIM (February 2014 to present); Chief Compliance Officer, ACIS (October 2009 to present); Vice President, Client Interactions and Marketing, ACIS (February 2013 to January 2014); Director, Client Interactions and Marketing, ACIS (June 2007 to January 2013). Also serves as Vice President, ACIS |
Charles A. Etherington (1957) | General Counsel since 2007 and Senior Vice President since 2006 | Attorney, ACC (February 1994 to present); Vice President, ACC (November 2005 to present); General Counsel, ACC (March 2007 to present). Also serves as General Counsel, ACIM, ACS, ACIS and other ACC subsidiaries; and Senior Vice President, ACIM and ACS |
C. Jean Wade (1964) | Vice President, Treasurer and Chief Financial Officer since 2012 | Vice President, ACS (February 2000 to present) |
Robert J. Leach (1966) | Vice President since 2006 and Assistant Treasurer since 2012 | Vice President, ACS (February 2000 to present) |
David H. Reinmiller (1963) | Vice President since 2001 | Attorney, ACC (January 1994 to present); Associate General Counsel, ACC (January 2001 to present). Also serves as Vice President, ACIM and ACS |
Ward D. Stauffer (1960) | Secretary since 2005 | Attorney, ACC (June 2003 to present) |
The Statement of Additional Information has additional information about the fund’s directors and is available without charge, upon request, by calling 1-800-345-2021.
|
|
| Approval of Management Agreement |
At a meeting held on June 13, 2014, the Fund’s Board of Directors/Trustees unanimously approved the renewal of the management agreement pursuant to which American Century Investment Management, Inc. (the “Advisor”) acts as the investment advisor for the Fund. Under Section 15(c) of the Investment Company Act, contracts for investment advisory services are required to be reviewed, evaluated, and approved by a majority of a fund’s directors/trustees (the “Directors”), including a majority of the independent Directors, each year. The Board regards this annual evaluation and renewal as one of its most important responsibilities.
The independent Directors have memorialized a statement regarding the relationship between their ongoing obligations to oversee and evaluate the performance of the Advisor and their annual consideration of renewal of the management agreement. In that statement, the independent Directors noted that their assessment of the Advisor’s performance is an ongoing process that takes place over the entire year and is informed by all of the extensive information that the Board and its committees receive and consider over time. This information, together with the materials provided in connection with the review, are central to the Board’s assessment of the Advisor’s performance and its determination whether to renew the Fund’s management agreement.
Prior to its consideration of the renewal of the management agreement, the Board requested and reviewed extensive data and analysis relating to the proposed renewal. This information and analysis was compiled by the Advisor and certain independent providers of evaluation data concerning the Fund and the services provided to the Fund by the Advisor.
In connection with its consideration of the renewal of the management agreement, the Board’s review and evaluation of the services provided by the Advisor included, but was not limited to, the following:
| |
| • | the nature, extent, and quality of investment management, shareholder services, and other services provided by the Advisor to the Fund; |
| |
| • | the wide range of other programs and services the Advisor provides to the Fund and its shareholders on a routine and non-routine basis; |
| |
| • | the investment performance of the Fund, including data comparing the Fund’s performance to appropriate benchmarks and/or a peer group of other mutual funds with similar investment objectives and strategies; |
| |
| • | the cost of owning the Fund compared to the cost of owning similar funds; |
| |
| • | the Advisor’s compliance policies, procedures, and regulatory experience; |
| |
| • | financial data showing the cost of services provided to the Fund, the profitability of the Fund to the Advisor, and the overall profitability of the Advisor; |
| |
| • | possible economies of scale associated with the Advisor’s management of the Fund and other accounts under its management; |
| |
| • | data comparing services provided and charges to other investment management clients of the Advisor; and |
| |
| • | any collateral benefits derived by the Advisor from the management of the Fund. |
In keeping with its practice, the Board held two in-person meetings to review and discuss the information provided. The independent Directors also had the benefit of the advice of their independent counsel throughout the process.
Factors Considered
The Directors considered all of the information provided by the Advisor, the independent data providers, and the independent Directors’ independent counsel in connection with the review, and evaluated such information for the Fund. In connection with their review, the Directors did not identify any single factor as being all-important or controlling and each Director may have attributed
different levels of importance to different factors. In deciding to renew the management agreement, the Board based its decision on a number of factors, including the following:
Nature, Extent and Quality of Services — Generally. Under the management agreement, the Advisor is responsible for providing or arranging for all services necessary for the operation of the Fund. The Board noted that under the management agreement, the Advisor provides or arranges at its own expense a wide variety of services including:
| |
| • | constructing and designing the Fund |
| |
| • | portfolio research and security selection |
| |
| • | initial capitalization/funding |
| |
| • | daily valuation of the Fund’s portfolio |
| |
| • | shareholder servicing and transfer agency, including shareholder confirmations, recordkeeping, and communications |
| |
| • | regulatory and portfolio compliance |
| |
| • | marketing and distribution |
The Board noted that many of these services have expanded over time both in terms of quantity and complexity in response to shareholder demands, competition in the industry, changing distribution channels, and the changing regulatory environment.
Investment Management Services. The nature of the investment management services provided to the Fund is quite complex and allows Fund shareholders access to professional money management, instant diversification of their investments within an asset class, the opportunity to easily diversify among asset classes by investing in or exchanging among various American Century Investments funds, and liquidity. In evaluating investment performance, the Board expects the Advisor to manage the Fund in accordance with its investment objectives and approved strategies. Further, the Directors recognize that the Advisor has an obligation to seek the best execution of fund trades. In providing these services, the Advisor utilizes teams of investment professionals (portfolio managers, analysts, research assistants, and securities traders) who require extensive information technology, research, training, compliance and other systems to conduct their business. The Board, directly and through its Portfolio Committee, regularly reviews investment performance information for the Fund, together with comparative information for appropriate benchmarks and/or peer groups of similarly-managed funds, over different time horizons. The Directors also review detailed performance information during the management agreement approval process. If performance concerns are identified, the Fund receives special reviews until performance improves, during which the Board discusses with the Advisor the reasons for such results (e.g., market conditions, security selection) and any efforts being undertaken to improve performance. The Fund’s performance was above its benchmark for the one-year period reviewed by the Board. The Board found the investment management services provided by the Advisor to the Fund to be satisfactory and consistent with the management agreement.
Shareholder and Other Services. Under the management agreement, the Advisor provides the Fund with a comprehensive package of transfer agency, shareholder, and other services. The Board, directly and through various committees of the Board, regularly reviews reports and evaluations of such services at its regular meetings. These reports include, but are not limited to, information regarding the operational efficiency and accuracy of the shareholder and transfer agency services provided, staffing levels, shareholder satisfaction (as measured by external as well as internal sources), technology support, new products and services offered to Fund shareholders, securities trading activities, portfolio valuation services, auditing services, and legal and operational compliance activities. Certain aspects of shareholder and transfer agency service level efficiency
and the quality of securities trading activities are measured by independent third party providers and are presented in comparison to other fund groups not managed by the Advisor. The Board found the services provided by the Advisor to the Fund under the management agreement to be competitive and of high quality.
Costs of Services and Profitability. The Advisor provides detailed information concerning its cost of providing various services to the Fund, its profitability in managing the Fund, its overall profitability, and its financial condition. The Directors have reviewed with the Advisor the methodology used to prepare this financial information. The financial information regarding the Advisor is considered in evaluating the Advisor’s financial condition, its ability to continue to provide services under the management agreement, and the reasonableness of the current management fee. The Board concluded that the Advisor’s profits were reasonable in light of the services provided to the Fund.
Ethics. The Board generally considers the Advisor’s commitment to providing quality services to shareholders and to conducting its business ethically. They noted that the Advisor’s practices generally meet or exceed industry best practices.
Economies of Scale. The Board also reviewed information provided by the Advisor regarding the possible existence of economies of scale in connection with the management of the Fund. The Board concluded that economies of scale are difficult to measure and predict with precision, especially on a fund-by-fund basis. The Board concluded that the Advisor is appropriately sharing economies of scale through its competitive fee structure, offering competitive fees from fund inception, and through reinvestment in its business to provide shareholders additional content and services.
Comparison to Other Funds’ Fees. The management agreement provides that the Fund pays the Advisor a single, all-inclusive (or unified) management fee for providing all services necessary for the management and operation of the Fund, other than brokerage expenses, taxes, interest, extraordinary expenses, and the fees and expenses of the Fund’s independent directors (including their independent legal counsel) and expenses incurred in connection with the provision of shareholder services and distribution services under a plan adopted pursuant to Rule 12b-1 under the 1940 Act. Under the unified fee structure, the Advisor is responsible for providing all investment advisory, custody, audit, administrative, compliance, recordkeeping, marketing and shareholder services, or arranging and supervising third parties to provide such services. By contrast, most other funds are charged a variety of fees, including an investment advisory fee, a transfer agency fee, an administrative fee, distribution charges and other expenses. Other than their investment advisory fees and any applicable Rule 12b-1 distribution fees, all other components of the total fees charged by these other funds may be increased without shareholder approval. The Board believes the unified fee structure is a benefit to Fund shareholders because it clearly discloses to shareholders the cost of owning Fund shares, and, since the unified fee cannot be increased without a vote of Fund shareholders, it shifts to the Advisor the risk of increased costs of operating the Fund and provides a direct incentive to minimize administrative inefficiencies. Part of the Board’s analysis of fee levels involves reviewing certain evaluative data compiled by an independent provider and comparing the Fund’s unified fee to the total expense ratio of other funds in the Fund’s peer group. The unified fee charged to shareholders of the Fund was below the median of the total expense ratios of the Fund’s peer group. The Board concluded that the management fee paid by the Fund to the Advisor under the management agreement is reasonable in light of the services provided to the Fund.
Comparison to Fees and Services Provided to Other Clients of the Advisor. The Board also requested and received information from the Advisor concerning the nature of the services, fees, costs and profitability of its advisory services to advisory clients other than the Fund. They observed that these varying types of client accounts require different services and involve different regulatory and entrepreneurial risks than the management of the Fund. The Board analyzed this information and concluded that the fees charged and services provided to the Fund were reasonable by comparison.
Collateral or “Fall-Out” Benefits Derived by the Advisor. The Board considered the existence of collateral benefits the Advisor may receive as a result of its relationship with the Fund. They concluded that the Advisor’s primary business is managing mutual funds and it generally does not use fund or shareholder information to generate profits in other lines of business, and therefore does not derive any significant collateral benefits from them. The Board noted that the Advisor receives proprietary research from broker-dealers that execute fund portfolio transactions and concluded that this research is likely to benefit Fund shareholders. The Board also determined that the Advisor is able to provide investment management services to certain clients other than the Fund, at least in part, due to its existing infrastructure built to serve the fund complex. The Board concluded, however, that the assets of those other clients are not material to the analysis and, where applicable, may be included with the assets of the Fund to determine breakpoints in the management fee schedule.
Existing Relationship. The Board also considered whether there was any reason for not continuing the existing arrangement with the Advisor. In this regard, the Board was mindful of the potential disruptions of the Fund’s operations and various risks, uncertainties, and other effects that could occur as a result of a decision not to continue such relationship. In particular, the Board recognized that most shareholders have invested in the Fund on the strength of the Advisor’s industry standing and reputation and in the expectation that the Advisor will have a continuing role in providing advisory services to the Fund.
Conclusion of the Directors. As a result of this process, the Board, including all of the independent Directors and assisted by the advice of independent legal counsel, taking into account all of the factors discussed above and the information provided by the Advisor and others, concluded that the management agreement between the Fund and the Advisor is fair and reasonable in light of the services provided and should be renewed.
Retirement Account Information
As required by law, distributions you receive from certain IRAs are subject to federal income tax withholding, unless you elect not to have withholding apply. Tax will be withheld on the total amount withdrawn even though you may be receiving amounts that are not subject to withholding, such as nondeductible contributions. In such case, excess amounts of withholding could occur. You may adjust your withholding election so that a greater or lesser amount will be withheld.
If you don’t want us to withhold on this amount, you must notify us to not withhold the federal income tax. You may notify us in writing or in certain situations by telephone or through other electronic means. For systematic withdrawals, your withholding election will remain in effect until revoked or changed by filing a new election. You have the right to revoke your election at any time.
Remember, even if you elect not to have income tax withheld, you are liable for paying income tax on the taxable portion of your withdrawal. If you elect not to have income tax withheld or you don’t have enough income tax withheld, you may be responsible for payment of estimated tax. You may incur penalties under the estimated tax rules if your withholding and estimated tax payments are not sufficient. You can reduce or defer the income tax on a distribution by directly or indirectly rolling such distribution over to another IRA or eligible plan. You should consult your tax advisor for additional information.
State tax will be withheld if, at the time of your distribution, your address is within one of the mandatory withholding states and you have federal income tax withheld (or as otherwise required by state law). State taxes will be withheld from your distribution in accordance with the respective state rules.
Distributions you receive from 403(b), 457 and qualified plans are subject to special tax and withholding rules. Your plan administrator or plan sponsor is required to provide you with a special tax notice explaining those rules at the time you request a distribution. If applicable, federal and/or state taxes may be withheld from your distribution amount.
Proxy Voting Policies
Descriptions of the principles and policies that the fund's investment advisor uses in exercising the voting rights associated with the securities purchased and/or held by the fund are available without charge, upon request, by calling 1-800-345-2021 or visiting the "About Us" page of American Century Investments’ website at americancentury.com. A description of the policies is also available on the Securities and Exchange Commission’s website at sec.gov. Information regarding how the investment advisor voted proxies relating to portfolio securities during the most recent 12-month period ended June 30 is available on the "About Us" page at americancentury.com. It is also available at sec.gov.
Quarterly Portfolio Disclosure
The fund files its complete schedule of portfolio holdings with the Securities and Exchange Commission (SEC) for the first and third quarters of each fiscal year on Form N-Q. The fund’s Forms N-Q are available on the SEC’s website at sec.gov, and may be reviewed and copied at the SEC’s Public Reference Room in Washington, DC. Information on the operation of the Public Reference Room may be obtained by calling 1-800-SEC-0330. The fund also makes its complete schedule of portfolio holdings for the most recent quarter of its fiscal year available on its website at americancentury.com and, upon request, by calling 1-800-345-2021.
Other Tax Information
The following information is provided pursuant to provisions of the Internal Revenue Code.
The fund hereby designates up to the maximum amount allowable as qualified dividend income for the fiscal year ended June 30, 2014.
For corporate taxpayers, the fund hereby designates $5,104,446, or up to the maximum amount allowable, of ordinary income distributions paid during the fiscal year ended June 30, 2014 as qualified for the corporate dividends received deduction.
The fund hereby designates $3,922,519 as qualified short-term capital gain distributions for purposes of Internal Revenue Code Section 871.
The fund hereby designates $14,269,407, or up to the maximum amount allowable, as long-term capital gain distributions for the fiscal year ended June 30, 2014.
|
| | |
| |
| | | |
| Contact Us | americancentury.com | |
| Automated Information Line | 1-800-345-8765 | |
| Investor Services Representative | 1-800-345-2021
or 816-531-5575 | |
| Investors Using Advisors | 1-800-378-9878 | |
Business, Not-For-Profit, Employer-Sponsored
Retirement Plans | 1-800-345-3533 | |
Banks and Trust Companies, Broker-Dealers,
Financial Professionals, Insurance Companies | 1-800-345-6488 | |
| Telecommunications Relay Service for the Deaf | 711 | |
| | | |
| American Century Quantitative Equity Funds, Inc. | |
| | | |
Investment Advisor: American Century Investment Management, Inc. Kansas City, Missouri | |
| | | |
| This report and the statements it contains are submitted for the general information of our shareholders. The report is not authorized for distribution to prospective investors unless preceded or accompanied by an effective prospectus. | |
| | | |
©2014 American Century Proprietary Holdings, Inc. All rights reserved.
CL-ANN-82897 1408 | |
|
| |
ANNUAL REPORT | JUNE 30, 2014 |
NT Equity Growth Fund
|
| |
| President's Letter | |
| Performance | |
| Portfolio Commentary | |
| Fund Characteristics | |
| Shareholder Fee Example | |
| Schedule of Investments | |
| Statement of Assets and Liabilities | |
| Statement of Operations | |
| Statement of Changes in Net Assets | |
| Notes to Financial Statements | |
| Financial Highlights | |
| Report of Independent Registered Public Accounting Firm | |
| Management | |
| Approval of Management Agreement | |
| Additional Information | |
Any opinions expressed in this report reflect those of the author as of the date of the report, and do not necessarily represent the opinions of American Century Investments® or any other person in the American Century Investments organization. Any such opinions are subject to change at any time based upon market or other conditions and American Century Investments disclaims any responsibility to update such opinions. These opinions may not be relied upon as investment advice and, because investment decisions made by American Century Investments funds are based on numerous factors, may not be relied upon as an indication of trading intent on behalf of any American Century Investments fund. Security examples are used for representational purposes only and are not intended as recommendations to purchase or sell securities. Performance information for comparative indices and securities is provided to American Century Investments by third party vendors. To the best of American Century Investments’ knowledge, such information is accurate at the time of printing.
|
| |
| Dear Investor:
Thank you for reviewing this annual report for the 12 months ended June 30, 2014. It provides investment performance and portfolio information for the reporting period, plus longer-term historical performance data.
Annual reports remain important vehicles for conveying information about fund returns, including market and economic factors that affected performance during the reporting period. For additional, updated investment and market insights, we encourage you to visit our website, americancentury.com.
|
| Jonathan Thomas |
Aggressive Monetary Policies Boosted Stock and Bond Returns
Stimulative monetary policies and expectations of economic improvement, interspersed with concerns about weaker-than-expected economic data and geopolitical conflicts, helped drive financial market returns during the reporting period. We believe the combination of longer-term optimism about global economic growth, low costs of capital, and central bank purchases of fixed income securities helped persuade investors to seek risk and yield, especially in the U.S. and Europe. Stock index returns were strong in these markets, particularly at the smaller capitalization end of the company size spectrum. The MSCI Europe and S&P 500® indices advanced 29.28% and 24.61%, respectively.
Remarkably, for a period in which stock market performance was so strong, government bond performance was also generally positive. Not surprisingly, U.S. corporate high-yield bonds posted double-digit returns, but the 30-year U.S. Treasury bond also outperformed most broader bond market measures. In addition, a generally weaker U.S. dollar during the reporting period meant that international bond returns for U.S. investors with currency exposure were generally higher than U.S. bonds returns. The Barclays Global Aggregate Bond and Barclays U.S. Aggregate Bond indices returned 7.39% and 4.37%, respectively.
Looking ahead, we see signs of sustained moderate economic growth in the second half of 2014, but headwinds persist. In the U.S., which was supposed to be an economic growth leader this year, housing market momentum has slowed, interest rates could rise, and economic growth and U.S. employment levels remain subpar compared with past post-recession periods. In this environment, we continue to believe in a disciplined, diversified, long-term investment approach, using professionally managed stock and bond portfolios—as appropriate—for meeting financial goals. We appreciate your continued trust in us.
Sincerely,
Jonathan Thomas
President and Chief Executive Officer
American Century Investments
|
| | | | | |
| Total Returns as of June 30, 2014 |
| | | | Average Annual Returns | |
| | Ticker Symbol | 1 year | 5 years | Since Inception | Inception Date |
| Institutional Class | ACLEX | 25.29% | 19.10% | 7.36% | 5/12/06 |
| S&P 500 Index | — | 24.61% | 18.82% | 7.54% | — |
|
|
| Growth of $10,000 Over Life of Class |
| $10,000 investment made May 12, 2006 |
|
| |
| Value on June 30, 2014 |
| | Institutional Class — $17,828 |
| |
| | S&P 500 Index — $18,066 |
| |
*From May 12, 2006, the Institutional Class’s inception date. Not annualized.
|
| |
| Total Annual Fund Operating Expenses |
| Institutional Class | 0.48% |
The total annual fund operating expenses shown is as stated in the fund’s prospectus current as of the date of this report. The prospectus may vary from the expense ratio shown elsewhere in this report because it is based on a different time period, includes acquired fund fees and expenses, and, if applicable, does not include fee waivers or expense reimbursements.
Data presented reflect past performance. Past performance is no guarantee of future results. Current performance may be higher or lower than the performance shown. Investment return and principal value will fluctuate, and redemption value may be more or less than original cost. To obtain performance data current to the most recent month end, please call 1-800-345-2021 or visit americancentury.com.
Data assumes reinvestment of dividends and capital gains, and none of the charts reflect the deduction of taxes that a shareholder would pay on fund distributions or the redemption of fund shares. Returns for the index are provided for comparison. The fund’s total returns include operating expenses (such as transaction costs and management fees) that reduce returns, while the total returns of the index do not.
Portfolio Managers: Bill Martin and Claudia Musat
Performance Summary
NT Equity Growth returned 25.29% for the fiscal year ended June 30, 2014, compared with the 24.61% return of its benchmark, the S&P 500 Index.
As U.S. equity markets continued their robust appreciation, NT Equity Growth posted a solid gain for the 12-month period, slightly outperforming the S&P 500. Security selection in the consumer staples and industrials sectors contributed the most to fund results, while consumer discretionary holdings weighed on relative performance.
NT Equity Growth’s stock selection process incorporates factors of valuation, quality, growth, and momentum (sentiment) while striving to minimize unintended risks along industries and other risk characteristics. Within the fund, sentiment- and growth-based measures were the leading drivers of returns, although all factors contributed positively to results.
Consumer Staples and Industrials Outperformed
The consumer staples and industrials sectors were among the leading contributors to the fund’s returns relative to the S&P 500. Stock choices in the consumer staples sector, particularly among food products manufacturers and food and staples retailers, were especially effective, driving the sector's substantial outperformance relative to the index. Among the top sector contributors was supermarket chain store operator Safeway, which appreciated on speculation of being acquired by private equity firm Cerberus Capital Management, owner of the Albertson’s chain of grocery stores. Significant contribution also came from chain drug store Rite Aid, which rose on revenue growth and efficiency and distribution chain improvements, bolstering the sector’s return. Following their appreciation, we took profits and exited both positions. Other key sector contributors included not owning tobacco manufacturer Philip Morris International, which posted weak returns for the year.
Industrials sector outperformance was primarily due to successful stock selection and positioning in the strongly-appreciating aerospace and defense industry. A number of defense contractors were key contributors, benefiting from an overall pickup in activity amid an improving economic landscape. Strong contributions came from Raytheon as well as Northrop Grumman, which appreciated nearly 50% largely on new government contracts. Overweight positioning, relative to the benchmark, in the airlines industry was also beneficial, particularly commercial airline Delta Air Lines, which nearly doubled in value thanks to solid earnings. Industrial automation giant Rockwell Automation also aided relative gains. The company appears particularly attractive across growth and sentiment measures, and is above average on quality- and valuation-based insights.
Significant contribution also came from several energy equipment manufacturers, including drilling and rig services provider Nabors Industries. The company’s solid earnings and merger news propelled its stock higher, and we sold the holding to lock in gains. Elsewhere, apparel manufacturer Hanesbrands’ earnings growth and announced intent to purchase French clothing manufacturer DBApparel, thereby increasing exposure in Europe, helped to drive its stock price higher.
Consumer Discretionary Was Leading Detractor
Security selection in the consumer discretionary sector was the principal detractor from the fund’s 12-month results. A number of specialty retailers declined during the period including office products superstore Staples, which was down nearly 30% on disappointing revenues and profits and an announcement of 225 store closings. Multiline retailer Target lagged in the wake of news about a security breach in its credit card payment system, as well as greater-than-expected cost increases associated with expansion. A portfolio-only position in apparel retailer American Eagle Outfitters was also detrimental following the holding’s decline on lower-than-expected sales early in the period. We ultimately sold the fund’s positions in Staples, Target, and American Eagle Outfitters. Other sector detractors included casino game equipment maker International Game Technology, which fell on disappointing earnings stemming from declining slot machine sales. We exited our position in the holding.
Elsewhere in the portfolio, an underweight position in biopharmaceutical company Gilead Sciences negatively impacted fund returns as strong sales of its Sovaldi Hepatitis C treatment propelled the stock higher. Several financials sector holdings also diminished returns. Mortgage service provider Ocwen Financial Corp. fell steeply in light of possible legal action by a group of investors as well as a New York state investigation into conflicts of interest. The holding was sold due to its uncertain future. Citigroup was another main underperformer. The banking giant declined on worries about emerging market currencies and economic growth rates due to its substantial exposure to those regions, but it continues to maintain a strong valuation profile.
A Look Ahead
Economic recovery in the U.S. appears to be progressing, albeit at a slower pace than during prior post-recessionary periods, and is expected to stay the course through the remainder of 2014. Recent indicators such as improvements in small business and consumer confidence point to a sustainable rebound, and economic growth is likely to further benefit from the recovering labor and housing markets. Though a continuation of political instability in non-U.S. markets as well as the potential for rising inflation and interest rates could lead to heightened market volatility, our disciplined, objective, and systematic investment strategy is designed to take advantage of opportunities at the individual company level. We believe this approach is the most powerful way to capitalize on market inefficiencies that lead to the mispricing of individual stocks. Our strategy is designed to provide investors with well-diversified and risk-controlled exposure to broad U.S. equities. As such, we do not see significant deviations versus the S&P 500. The portfolio’s current holdings exhibit the highest exposure to quality insights, followed closely by growth and value, and we maintain positive exposure to sentiment. The fund's largest, but modest, overweights are in health care and information technology, while the underweights are led by the financials and consumer staples sectors.
|
| |
| JUNE 30, 2014 | |
| Top Ten Holdings | % of net assets |
| Apple, Inc. | 4.1% |
| Johnson & Johnson | 2.5% |
| Verizon Communications, Inc. | 1.9% |
| Pfizer, Inc. | 1.8% |
| AT&T, Inc. | 1.8% |
| Intel Corp. | 1.7% |
| Merck & Co., Inc. | 1.7% |
| Exxon Mobil Corp. | 1.7% |
| Oracle Corp. | 1.6% |
| Bank of America Corp. | 1.5% |
| | |
| Top Five Industries | % of net assets |
| Pharmaceuticals | 8.4% |
| Technology Hardware, Storage and Peripherals | 6.8% |
| Oil, Gas and Consumable Fuels | 6.2% |
| Insurance | 5.1% |
| Aerospace and Defense | 5.1% |
| | |
| Types of Investments in Portfolio | % of net assets |
| Common Stocks | 99.1% |
| Temporary Cash Investments | 0.9% |
| Other Assets and Liabilities | —* |
*Category is less than 0.05% of total net assets.
Fund shareholders may incur two types of costs: (1) transaction costs, including sales charges (loads) on purchase payments and redemption/exchange fees; and (2) ongoing costs, including management fees; distribution and service (12b-1) fees; and other fund expenses. This example is intended to help you understand your ongoing costs (in dollars) of investing in your fund and to compare these costs with the ongoing cost of investing in other mutual funds.
The example is based on an investment of $1,000 made at the beginning of the period and held for the entire period from January 1, 2014 to June 30, 2014.
Actual Expenses
The table provides information about actual account values and actual expenses for each class. You may use the information, together with the amount you invested, to estimate the expenses that you paid over the period. First, identify the share class you own. Then simply divide your account value by $1,000 (for example, an $8,600 account value divided by $1,000 = 8.6), then multiply the result by the number under the heading “Expenses Paid During Period” to estimate the expenses you paid on your account during this period.
If you hold Investor Class shares of any American Century Investments fund, or Institutional Class shares of the American Century Diversified Bond Fund, in an American Century Investments account (i.e., not a financial intermediary or retirement plan account), American Century Investments may charge you a $12.50 semiannual account maintenance fee if the value of those shares is less than $10,000. We will redeem shares automatically in one of your accounts to pay the $12.50 fee. In determining your total eligible investment amount, we will include your investments in all personal accounts (including American Century Investments Brokerage accounts) registered under your Social Security number. Personal accounts include individual accounts, joint accounts, UGMA/UTMA accounts, personal trusts, Coverdell Education Savings Accounts and IRAs (including traditional, Roth, Rollover, SEP-, SARSEP- and SIMPLE-IRAs), and certain other retirement accounts. If you have only business, business retirement, employer-sponsored or American Century Investments Brokerage accounts, you are currently not subject to this fee. If you are subject to the Account Maintenance Fee, your account value could be reduced by the fee amount.
Hypothetical Example for Comparison Purposes
The table also provides information about hypothetical account values and hypothetical expenses based on the actual expense ratio of each class of your fund and an assumed rate of return of 5% per year before expenses, which is not the actual return of a fund’s share class. The hypothetical account values and expenses may not be used to estimate the actual ending account balance or expenses you paid for the period. You may use this information to compare the ongoing costs of investing in your fund and other funds. To do so, compare this 5% hypothetical example with the 5% hypothetical examples that appear in the shareholder reports of the other funds.
Please note that the expenses shown in the table are meant to highlight your ongoing costs only and do not reflect any transactional costs, such as sales charges (loads) or redemption/exchange fees. Therefore, the table is useful in comparing ongoing costs only, and will not help you determine the relative total costs of owning different funds. In addition, if these transactional costs were included, your costs would have been higher.
|
| | | | |
| | Beginning
Account Value
1/1/14 | Ending
Account Value
6/30/14 | Expenses Paid
During Period(1)
1/1/14 - 6/30/14 | Annualized
Expense Ratio(1) |
| Actual | | | | |
| Institutional Class | $1,000 | $1,072.40 | $2.42 | 0.47% |
| Hypothetical | | | | |
| Institutional Class | $1,000 | $1,022.46 | $2.36 | 0.47% |
| |
| (1) | Expenses are equal to the class’s annualized expense ratio listed in the table above, multiplied by the average account value over the period, multiplied by 181, the number of days in the most recent fiscal half-year, divided by 365, to reflect the one-half year period. |
JUNE 30, 2014
|
| | | | |
| | Shares | Value |
| COMMON STOCKS — 99.1% | | |
| AEROSPACE AND DEFENSE — 5.1% | | |
| Boeing Co. (The) | 106,740 | $ | 13,580,530 |
|
| Honeywell International, Inc. | 135,628 | 12,606,623 |
|
| Lockheed Martin Corp. | 70,163 | 11,277,299 |
|
| Northrop Grumman Corp. | 68,366 | 8,178,624 |
|
| Raytheon Co. | 122,315 | 11,283,559 |
|
| | | 56,926,635 |
|
| AIR FREIGHT AND LOGISTICS — 0.7% | | |
| United Parcel Service, Inc., Class B | 75,930 | 7,794,974 |
|
| AIRLINES — 1.4% | | |
| Delta Air Lines, Inc. | 130,927 | 5,069,494 |
|
| Southwest Airlines Co. | 391,270 | 10,509,512 |
|
| | | 15,579,006 |
|
| AUTO COMPONENTS — 2.6% | | |
| Delphi Automotive plc | 133,463 | 9,174,247 |
|
| Gentex Corp. | 16,147 | 469,716 |
|
| Johnson Controls, Inc. | 218,612 | 10,915,297 |
|
| Magna International, Inc. | 80,679 | 8,693,162 |
|
| | | 29,252,422 |
|
| BANKS — 3.4% | | |
| Bank of America Corp. | 1,120,124 | 17,216,306 |
|
| Citigroup, Inc. | 25,947 | 1,222,104 |
|
| JPMorgan Chase & Co. | 224,830 | 12,954,704 |
|
| Wells Fargo & Co. | 131,791 | 6,926,935 |
|
| | | 38,320,049 |
|
| BEVERAGES — 1.0% | | |
| Coca-Cola Co. (The) | 24,275 | 1,028,289 |
|
| Dr Pepper Snapple Group, Inc. | 167,646 | 9,820,703 |
|
| PepsiCo, Inc. | 1,029 | 91,931 |
|
| | | 10,940,923 |
|
| BIOTECHNOLOGY — 2.9% | | |
| Amgen, Inc. | 119,380 | 14,131,010 |
|
Biogen Idec, Inc.(1) | 42,659 | 13,450,809 |
|
United Therapeutics Corp.(1) | 53,789 | 4,759,789 |
|
| | | 32,341,608 |
|
| CAPITAL MARKETS — 1.8% | | |
Affiliated Managers Group, Inc.(1) | 19,177 | 3,938,956 |
|
| Franklin Resources, Inc. | 171,646 | 9,928,005 |
|
Stifel Financial Corp.(1) | 49,636 | 2,350,264 |
|
|
| | | | |
| | Shares | Value |
| T. Rowe Price Group, Inc. | 2,635 | $ | 222,420 |
|
| Waddell & Reed Financial, Inc., Class A | 66,254 | 4,146,838 |
|
| | | 20,586,483 |
|
| CHEMICALS — 3.8% | | |
| Ashland, Inc. | 42,949 | 4,670,274 |
|
| Cabot Corp. | 14,360 | 832,736 |
|
| Dow Chemical Co. (The) | 267,786 | 13,780,267 |
|
| Eastman Chemical Co. | 103,028 | 8,999,496 |
|
| NewMarket Corp. | 4,915 | 1,927,221 |
|
| Olin Corp. | 50,840 | 1,368,613 |
|
| PPG Industries, Inc. | 28,068 | 5,898,490 |
|
| Scotts Miracle-Gro Co. (The), Class A | 62,193 | 3,536,294 |
|
| Sigma-Aldrich Corp. | 12,372 | 1,255,511 |
|
| | | 42,268,902 |
|
| COMMERCIAL SERVICES AND SUPPLIES — 0.1% | | |
| Deluxe Corp. | 26,100 | 1,528,938 |
|
| COMMUNICATIONS EQUIPMENT — 3.0% | | |
| Cisco Systems, Inc. | 688,983 | 17,121,228 |
|
| QUALCOMM, Inc. | 215,361 | 17,056,591 |
|
| | | 34,177,819 |
|
| CONSUMER FINANCE — 0.8% | | |
| Cash America International, Inc. | 181,268 | 8,053,737 |
|
Portfolio Recovery Associates, Inc.(1) | 18,541 | 1,103,746 |
|
| | | 9,157,483 |
|
| CONTAINERS AND PACKAGING — 1.2% | | |
| Ball Corp. | 102,202 | 6,406,021 |
|
| Sonoco Products Co. | 170,663 | 7,497,226 |
|
| | | 13,903,247 |
|
| DIVERSIFIED FINANCIAL SERVICES — 1.3% | | |
Berkshire Hathaway, Inc., Class B(1) | 40,916 | 5,178,329 |
|
| Moody's Corp. | 6,044 | 529,817 |
|
MSCI, Inc., Class A(1) | 47,032 | 2,156,417 |
|
| Voya Financial, Inc. | 171,872 | 6,245,829 |
|
| | | 14,110,392 |
|
| DIVERSIFIED TELECOMMUNICATION SERVICES — 3.7% | | |
| AT&T, Inc. | 575,837 | 20,361,596 |
|
| Verizon Communications, Inc. | 429,245 | 21,002,958 |
|
| | | 41,364,554 |
|
| ELECTRICAL EQUIPMENT — 1.5% | | |
| Emerson Electric Co. | 165,168 | 10,960,549 |
|
| Rockwell Automation, Inc. | 49,915 | 6,247,361 |
|
| | | 17,207,910 |
|
|
| | | | |
| | Shares | Value |
| ELECTRONIC EQUIPMENT, INSTRUMENTS AND COMPONENTS — 0.7% | |
| TE Connectivity Ltd. | 121,443 | $ | 7,510,035 |
|
| ENERGY EQUIPMENT AND SERVICES — 2.7% | | |
| Baker Hughes, Inc. | 176,089 | 13,109,826 |
|
| RPC, Inc. | 98,276 | 2,308,503 |
|
| Schlumberger Ltd. | 130,216 | 15,358,977 |
|
| | | 30,777,306 |
|
| FOOD AND STAPLES RETAILING — 0.1% | | |
| Walgreen Co. | 22,148 | 1,641,831 |
|
| FOOD PRODUCTS — 3.6% | | |
| Archer-Daniels-Midland Co. | 253,121 | 11,165,167 |
|
| Hormel Foods Corp. | 20,000 | 987,000 |
|
| Ingredion, Inc. | 48,840 | 3,664,954 |
|
| Kellogg Co. | 147,698 | 9,703,758 |
|
Pilgrim's Pride Corp.(1) | 203,686 | 5,572,849 |
|
| Tyson Foods, Inc., Class A | 249,570 | 9,368,858 |
|
| | | 40,462,586 |
|
| HEALTH CARE EQUIPMENT AND SUPPLIES — 4.2% | | |
| Becton Dickinson and Co. | 83,004 | 9,819,373 |
|
| C.R. Bard, Inc. | 35,066 | 5,014,789 |
|
| Covidien plc | 8,859 | 798,905 |
|
| Medtronic, Inc. | 199,586 | 12,725,603 |
|
| St. Jude Medical, Inc. | 131,231 | 9,087,747 |
|
| Stryker Corp. | 116,395 | 9,814,426 |
|
| | | 47,260,843 |
|
| HEALTH CARE PROVIDERS AND SERVICES — 0.2% | | |
| Cardinal Health, Inc. | 30,863 | 2,115,967 |
|
| HOTELS, RESTAURANTS AND LEISURE — 0.6% | | |
Bally Technologies, Inc.(1) | 54,825 | 3,603,099 |
|
| Wyndham Worldwide Corp. | 44,970 | 3,405,128 |
|
| | | 7,008,227 |
|
| HOUSEHOLD DURABLES — 0.6% | | |
| Newell Rubbermaid, Inc. | 140,996 | 4,369,466 |
|
NVR, Inc.(1) | 1,732 | 1,992,839 |
|
| Whirlpool Corp. | 2,827 | 393,575 |
|
| | | 6,755,880 |
|
| HOUSEHOLD PRODUCTS — 2.3% | | |
| Energizer Holdings, Inc. | 83,791 | 10,225,016 |
|
| Kimberly-Clark Corp. | 103,466 | 11,507,489 |
|
| Procter & Gamble Co. (The) | 59,209 | 4,653,235 |
|
| | | 26,385,740 |
|
| INDUSTRIAL CONGLOMERATES — 1.3% | | |
| 3M Co. | 1,529 | 219,014 |
|
| Danaher Corp. | 72,498 | 5,707,768 |
|
|
| | | | |
| | Shares | Value |
| General Electric Co. | 315,372 | $ | 8,287,976 |
|
| | | 14,214,758 |
|
| INSURANCE — 5.1% | | |
| Allstate Corp. (The) | 141,312 | 8,297,841 |
|
| American International Group, Inc. | 225,081 | 12,284,921 |
|
| Amtrust Financial Services, Inc. | 155,427 | 6,498,403 |
|
| Aspen Insurance Holdings Ltd. | 141,202 | 6,413,395 |
|
| Everest Re Group Ltd. | 36,627 | 5,878,267 |
|
| Hanover Insurance Group, Inc. (The) | 24,166 | 1,526,083 |
|
| Old Republic International Corp. | 380,569 | 6,294,611 |
|
| RenaissanceRe Holdings Ltd. | 87,971 | 9,412,897 |
|
| Travelers Cos., Inc. (The) | 4,416 | 415,413 |
|
| | | 57,021,831 |
|
| INTERNET AND CATALOG RETAIL — 0.3% | | |
| Expedia, Inc. | 36,438 | 2,869,857 |
|
| HSN, Inc. | 9,191 | 544,475 |
|
| | | 3,414,332 |
|
| INTERNET SOFTWARE AND SERVICES — 1.9% | | |
eBay, Inc.(1) | 191,015 | 9,562,211 |
|
Google, Inc., Class A(1) | 2,603 | 1,521,896 |
|
Google, Inc., Class C(1) | 17,647 | 10,151,966 |
|
| | | 21,236,073 |
|
| IT SERVICES — 1.7% | | |
| Amdocs Ltd. | 82,816 | 3,836,865 |
|
| International Business Machines Corp. | 82,954 | 15,037,072 |
|
| | | 18,873,937 |
|
| LEISURE PRODUCTS — 0.7% | | |
| Hasbro, Inc. | 156,239 | 8,288,479 |
|
| MACHINERY — 2.4% | | |
| Caterpillar, Inc. | 120,787 | 13,125,923 |
|
| Dover Corp. | 60,683 | 5,519,119 |
|
| Snap-On, Inc. | 53,992 | 6,399,132 |
|
| Valmont Industries, Inc. | 10,905 | 1,657,015 |
|
| | | 26,701,189 |
|
| MEDIA — 2.2% | | |
| John Wiley & Sons, Inc., Class A | 31,274 | 1,894,892 |
|
| Time Warner, Inc. | 104,573 | 7,346,253 |
|
| Walt Disney Co. (The) | 175,904 | 15,082,009 |
|
| | | 24,323,154 |
|
| METALS AND MINING — 0.1% | | |
| Compass Minerals International, Inc. | 8,927 | 854,671 |
|
| MULTI-UTILITIES — 0.8% | | |
| Wisconsin Energy Corp. | 201,554 | 9,456,914 |
|
|
| | | | |
| | Shares | Value |
| MULTILINE RETAIL — 1.6% | | |
| Dillard's, Inc., Class A | 67,869 | $ | 7,914,204 |
|
| Macy's, Inc. | 167,379 | 9,711,330 |
|
| | | 17,625,534 |
|
| OIL, GAS AND CONSUMABLE FUELS — 6.2% | | |
| Chevron Corp. | 47,764 | 6,235,590 |
|
| Encana Corp. | 351,217 | 8,327,355 |
|
| EOG Resources, Inc. | 88,460 | 10,337,436 |
|
| Exxon Mobil Corp. | 186,905 | 18,817,595 |
|
Gran Tierra Energy, Inc.(1) | 319,600 | 2,595,152 |
|
| Occidental Petroleum Corp. | 133,844 | 13,736,410 |
|
| Valero Energy Corp. | 187,195 | 9,378,469 |
|
| | | 69,428,007 |
|
| PHARMACEUTICALS — 8.4% | | |
| AbbVie, Inc. | 261,123 | 14,737,782 |
|
| Eli Lilly & Co. | 204,470 | 12,711,900 |
|
| Johnson & Johnson | 265,440 | 27,770,333 |
|
| Merck & Co., Inc. | 334,303 | 19,339,429 |
|
| Pfizer, Inc. | 687,940 | 20,418,059 |
|
| | | 94,977,503 |
|
| PROFESSIONAL SERVICES — 0.2% | | |
| Manpowergroup, Inc. | 30,183 | 2,561,028 |
|
| REAL ESTATE INVESTMENT TRUSTS (REITs) — 0.7% | | |
| Host Hotels & Resorts, Inc. | 339,218 | 7,466,188 |
|
| Potlatch Corp. | 5,452 | 225,713 |
|
| PS Business Parks, Inc. | 7,558 | 631,017 |
|
| | | 8,322,918 |
|
| SEMICONDUCTORS AND SEMICONDUCTOR EQUIPMENT — 2.9% | |
| Broadcom Corp., Class A | 267,370 | 9,924,774 |
|
| Intel Corp. | 628,260 | 19,413,234 |
|
| Texas Instruments, Inc. | 77,571 | 3,707,118 |
|
| | | 33,045,126 |
|
| SOFTWARE — 4.1% | | |
| CA, Inc. | 100,720 | 2,894,693 |
|
| Intuit, Inc. | 32,483 | 2,615,856 |
|
| Microsoft Corp. | 405,412 | 16,905,680 |
|
| Oracle Corp. | 450,860 | 18,273,356 |
|
Synopsys, Inc.(1) | 124,592 | 4,836,661 |
|
| | | 45,526,246 |
|
| SPECIALTY RETAIL — 1.0% | | |
AutoZone, Inc.(1) | 1,490 | 798,998 |
|
| GameStop Corp., Class A | 200,255 | 8,104,320 |
|
| PetSmart, Inc. | 42,998 | 2,571,280 |
|
| | | 11,474,598 |
|
|
| | | | |
| | Shares | Value |
| TECHNOLOGY HARDWARE, STORAGE AND PERIPHERALS — 6.8% | |
| Apple, Inc. | 496,090 | $ | 46,101,644 |
|
| EMC Corp. | 436,610 | 11,500,307 |
|
| Hewlett-Packard Co. | 384,887 | 12,962,994 |
|
| Seagate Technology plc | 46,672 | 2,651,903 |
|
| Western Digital Corp. | 36,750 | 3,392,025 |
|
| | | 76,608,873 |
|
| TEXTILES, APPAREL AND LUXURY GOODS — 1.1% | | |
Deckers Outdoor Corp.(1) | 7,948 | 686,151 |
|
| Hanesbrands, Inc. | 117,133 | 11,530,572 |
|
| | | 12,216,723 |
|
| THRIFTS AND MORTGAGE FINANCE — 0.3% | | |
| EverBank Financial Corp. | 171,166 | 3,450,707 |
|
TOTAL COMMON STOCKS (Cost $895,212,236) | | 1,115,002,361 |
|
| TEMPORARY CASH INVESTMENTS — 0.9% | | |
| Repurchase Agreement, Bank of America Merrill Lynch, (collateralized by various U.S. Treasury obligations, 0.75% - 0.875%, 1/31/18 - 2/28/18, valued at $2,256,898), in a joint trading account at 0.05%, dated 6/30/14, due 7/1/14 (Delivery value $2,211,481) | | 2,211,478 |
|
| Repurchase Agreement, Credit Suisse First Boston, Inc., (collateralized by various U.S. Treasury obligations, 1.75%, 5/15/23, valued at $903,051), in a joint trading account at 0.01%, dated 6/30/14, due 7/1/14 (Delivery value $884,591) | | 884,591 |
|
| Repurchase Agreement, Goldman Sachs & Co., (collateralized by various U.S. Treasury obligations, 3.125%, 11/15/41, valued at $1,804,772), in a joint trading account at 0.03%, dated 6/30/14, due 7/1/14 (Delivery value $1,769,184) | | 1,769,183 |
|
| SSgA U.S. Government Money Market Fund, Class N | 5,228,731 | 5,228,731 |
|
TOTAL TEMPORARY CASH INVESTMENTS (Cost $10,093,983) | | 10,093,983 |
|
TOTAL INVESTMENT SECURITIES — 100.0% (Cost $905,306,219) | | 1,125,096,344 |
|
OTHER ASSETS AND LIABILITIES† | | (393,528) |
|
| TOTAL NET ASSETS — 100.0% | | $ | 1,124,702,816 |
|
|
|
| NOTES TO SCHEDULE OF INVESTMENTS |
| |
| † | Category is less than 0.05% of total net assets. |
See Notes to Financial Statements.
|
|
| Statement of Assets and Liabilities |
|
| | | |
| JUNE 30, 2014 | |
| Assets | |
| Investment securities, at value (cost of $905,306,219) | $ | 1,125,096,344 |
|
| Cash | 20,897 |
|
| Receivable for investments sold | 1,297,759 |
|
| Receivable for capital shares sold | 418 |
|
| Dividends and interest receivable | 1,190,345 |
|
| | 1,127,605,763 |
|
| | |
| Liabilities | |
| Payable for investments purchased | 1,936,258 |
|
| Payable for capital shares redeemed | 541,535 |
|
| Accrued management fees | 425,154 |
|
| | 2,902,947 |
|
| | |
| Net Assets | $ | 1,124,702,816 |
|
| | |
| Institutional Class Capital Shares, $0.01 Par Value | |
| Shares authorized | 310,000,000 |
|
| Shares outstanding | 86,275,833 |
|
| | |
| Net Asset Value Per Share | $ | 13.04 |
|
| | |
| Net Assets Consist of: | |
| Capital (par value and paid-in surplus) | $ | 837,498,999 |
|
| Undistributed net investment income | 917,994 |
|
| Undistributed net realized gain | 66,495,698 |
|
| Net unrealized appreciation | 219,790,125 |
|
| | $ | 1,124,702,816 |
|
See Notes to Financial Statements.
|
| | | |
| YEAR ENDED JUNE 30, 2014 | |
| Investment Income (Loss) | |
| Income: | |
| Dividends (net of foreign taxes withheld of $7,908) | $ | 20,315,687 |
|
| Interest | 1,846 |
|
| | 20,317,533 |
|
| | |
| Expenses: | |
| Management fees | 4,487,840 |
|
| Directors' fees and expenses | 57,584 |
|
| | 4,545,424 |
|
| | |
| Net investment income (loss) | 15,772,109 |
|
| | |
| Realized and Unrealized Gain (Loss) | |
| Net realized gain (loss) on investment transactions | 98,191,715 |
|
| Change in net unrealized appreciation (depreciation) on investments | 100,152,803 |
|
| | |
| Net realized and unrealized gain (loss) | 198,344,518 |
|
| | |
| Net Increase (Decrease) in Net Assets Resulting from Operations | $ | 214,116,627 |
|
See Notes to Financial Statements.
|
|
| Statement of Changes in Net Assets |
|
| | | | | | |
| YEARS ENDED JUNE 30, 2014 AND JUNE 30, 2013 | | |
| Increase (Decrease) in Net Assets | June 30, 2014 | June 30, 2013 |
| Operations | | |
| Net investment income (loss) | $ | 15,772,109 |
| $ | 13,334,451 |
|
| Net realized gain (loss) | 98,191,715 |
| 71,912,936 |
|
| Change in net unrealized appreciation (depreciation) | 100,152,803 |
| 42,808,875 |
|
| Net increase (decrease) in net assets resulting from operations | 214,116,627 |
| 128,056,262 |
|
| | | |
| Distributions to Shareholders | | |
| From net investment income | (15,303,543 | ) | (12,886,615 | ) |
| From net realized gains | (83,092,332 | ) | (28,744,659 | ) |
| Decrease in net assets from distributions | (98,395,875 | ) | (41,631,274 | ) |
| | | |
| Capital Share Transactions | | |
| Proceeds from shares sold | 179,185,362 |
| 185,962,552 |
|
| Proceeds from reinvestment of distributions | 98,395,875 |
| 41,631,274 |
|
| Payments for shares redeemed | (48,276,197 | ) | (93,334,487 | ) |
| Net increase (decrease) in net assets from capital share transactions | 229,305,040 |
| 134,259,339 |
|
| | | |
| Net increase (decrease) in net assets | 345,025,792 |
| 220,684,327 |
|
| | | |
| Net Assets | | |
| Beginning of period | 779,677,024 |
| 558,992,697 |
|
| End of period | $ | 1,124,702,816 |
| $ | 779,677,024 |
|
| | | |
| Undistributed net investment income | $ | 917,994 |
| $ | 635,711 |
|
| | | |
| Transactions in Shares of the Fund | | |
| Sold | 14,586,133 |
| 17,428,384 |
|
| Issued in reinvestment of distributions | 8,165,196 |
| 3,971,594 |
|
| Redeemed | (3,824,575 | ) | (8,840,152 | ) |
| Net increase (decrease) in shares of the fund | 18,926,754 |
| 12,559,826 |
|
See Notes to Financial Statements.
|
|
| Notes to Financial Statements |
JUNE 30, 2014
1. Organization
American Century Quantitative Equity Funds, Inc. (the corporation) is registered under the Investment Company Act of 1940, as amended (the 1940 Act), as an open-end management investment company and is organized as a Maryland corporation. NT Equity Growth Fund (the fund) is one fund in a series issued by the corporation. The fund is diversified as defined under the 1940 Act. The fund’s investment objective is to seek long-term capital growth. The fund is not permitted to invest in securities issued by companies assigned the Global Industry Classification Standard for the tobacco industry.
2. Significant Accounting Policies
The following is a summary of significant accounting policies consistently followed by the fund in preparation of its financial statements. The financial statements are prepared in conformity with accounting principles generally accepted in the United States of America, which may require management to make certain estimates and assumptions at the date of the financial statements. Actual results could differ from these estimates. Management evaluated the impact of events or transactions occurring through the date the financial statements were issued that would merit recognition or disclosure.
Investment Valuations — The fund determines the fair value of its investments and computes its net asset value per share at the close of regular trading (usually 4 p.m. Eastern time) on the New York Stock Exchange (NYSE) on each day the NYSE is open. The Board of Directors has adopted valuation policies and procedures to guide the investment advisor in the fund’s investment valuation process and to provide methodologies for the oversight of the fund’s pricing function.
Equity securities that are listed or traded on a domestic securities exchange are valued at the last reported sales price or at the official closing price as provided by the exchange. Equity securities traded on foreign securities exchanges are generally valued at the closing price of such securities on the exchange where primarily traded or at the close of the NYSE, if that is earlier. If no last sales price is reported, or if local convention or regulation so provides, the mean of the latest bid and asked prices may be used. Securities traded over-the-counter are valued at the mean of the latest bid and asked prices, the last sales price, or the official closing price.
Fixed income securities maturing within 60 days at the time of purchase may be valued at cost, plus or minus any amortized discount or premium or at the evaluated mean as provided by an independent pricing service. Evaluated mean prices are commonly derived through utilization of market models, which may consider, among other factors: trade data, quotations from dealers and active market makers, relevant yield curve and spread data, related sector levels, creditworthiness, trade data or market information on comparable securities, and other relevant security specific information.
Open-end management investment companies are valued at the reported net asset value per share. Repurchase agreements are valued at cost, which approximates fair value.
If the fund determines that the market price for an investment is not readily available or the valuation methods mentioned above do not reflect an investment’s fair value, such investment is valued as determined in good faith by the Board of Directors or its delegate, in accordance with policies and procedures adopted by the Board of Directors. In its determination of fair value, the fund may review several factors including, but not limited to, market information regarding the specific investment or comparable investments and correlation with other investment types, futures indices or general market indicators. Circumstances that may cause the fund to use these procedures to value an investment include, but are not limited to: an investment has been declared in default or is distressed; trading in a security has been suspended during the trading day or a security is not actively trading on its principal exchange; prices received from a regular pricing source are deemed unreliable; or there is a foreign market holiday and no trading occurred.
The fund monitors for significant events occurring after the close of an investment’s primary exchange but before the fund’s net asset value per share is determined. Significant events may include, but are not limited to: corporate announcements and transactions; governmental action and political unrest that could impact a specific investment or an investment sector; or armed conflicts, natural disasters and similar events that could affect investments in a specific country or region. The fund also monitors for significant fluctuations between
domestic and foreign markets, as evidenced by the U.S. market or such other indicators that the Board of Directors, or its delegate, deems appropriate. If significant fluctuations in foreign markets are identified, the fund may apply a model-derived factor to the closing price of equity securities traded on foreign securities exchanges. The factor is based on observable market data as provided by an independent pricing service.
Security Transactions — Security transactions are accounted for as of the trade date. Net realized gains and losses are determined on the identified cost basis, which is also used for federal income tax purposes.
Investment Income — Dividend income less foreign taxes withheld, if any, is recorded as of the ex-dividend date. Distributions received on securities that represent a return of capital or long-term capital gain are recorded as a reduction of cost of investments and/or as a realized gain. The fund may estimate the components of distributions received that may be considered nontaxable distributions or long-term capital gain distributions for income tax purposes. Interest income is recorded on the accrual basis and includes accretion of discounts and amortization of premiums.
Repurchase Agreements — The fund may enter into repurchase agreements with institutions that American Century Investment Management, Inc. (ACIM) (the investment advisor) has determined are creditworthy pursuant to criteria adopted by the Board of Directors. The fund requires that the collateral, represented by securities, received in a repurchase transaction be transferred to the custodian in a manner sufficient to enable the fund to obtain those securities in the event of a default under the repurchase agreement. ACIM monitors, on a daily basis, the securities transferred to ensure the value, including accrued interest, of the securities under each repurchase agreement is equal to or greater than amounts owed to the fund under each repurchase agreement.
Joint Trading Account — Pursuant to an Exemptive Order issued by the Securities and Exchange Commission, the fund, along with certain other funds in the American Century Investments family of funds, may transfer uninvested cash balances into a joint trading account. These balances are invested in one or more repurchase agreements that are collateralized by U.S. Treasury or Agency obligations.
Income Tax Status — It is the fund’s policy to distribute substantially all net investment income and net realized gains to shareholders and to otherwise qualify as a regulated investment company under provisions of the Internal Revenue Code. Accordingly, no provision has been made for income taxes. The fund files U.S. federal, state, local and non-U.S. tax returns as applicable. The fund's tax returns are subject to examination by the relevant taxing authority until expiration of the applicable statute of limitations, which is generally three years from the date of filing but can be longer in certain jurisdictions. At this time, management believes there are no uncertain tax positions which, based on their technical merit, would not be sustained upon examination and for which it is reasonably possible that the total amounts of unrecognized tax benefits will significantly change in the next twelve months.
Distributions to Shareholders — Distributions from net investment income, if any, are generally declared and paid quarterly. Distributions from net realized gains, if any, are generally declared and paid annually.
Indemnifications — Under the corporation’s organizational documents, its officers and directors are indemnified against certain liabilities arising out of the performance of their duties to the fund. In addition, in the normal course of business, the fund enters into contracts that provide general indemnifications. The maximum exposure under these arrangements is unknown as this would involve future claims that may be made against a fund. The risk of material loss from such claims is considered by management to be remote.
3. Fees and Transactions with Related Parties
Certain officers and directors of the corporation are also officers and/or directors of American Century Companies, Inc. (ACC). The corporation’s investment advisor, ACIM, the corporation's distributor, American Century Investment Services, Inc., and the corporation’s transfer agent, American Century Services, LLC, are wholly owned, directly or indirectly, by ACC. Various funds issued by American Century Asset Allocation Portfolios, Inc. own, in aggregate, 100% of the shares of the fund. Related parties do not invest in the fund for the purpose of exercising management or control.
Management Fees — The corporation has entered into a management agreement with ACIM, under which ACIM provides the fund with investment advisory and management services in exchange for a single, unified management fee (the fee). The agreement provides that all expenses of managing and operating the fund, except distribution and service fees, brokerage expenses, taxes, interest, fees and expenses of the independent directors (including legal counsel fees), and extraordinary expenses, will be paid by ACIM. The fee is computed and accrued daily based on the daily net assets of the fund and paid monthly in arrears. The
fee consists of (1) an Investment Category Fee based on the daily net assets of the fund and certain other accounts managed by the investment advisor that are in the same broad investment category as the fund and (2) a Complex Fee based on the assets of all the funds in the American Century Investments family of funds. The rates for the Investment Category Fee range from 0.3380% to 0.5200%. The rates for the Complex Fee range from 0.0500% to 0.1100%. The effective annual management fee for the year ended June 30, 2014 was 0.47%.
Directors' Fees and Expenses — The Board of Directors is responsible for overseeing the investment advisor’s management and operations of the fund. The directors receive detailed information about the fund and its investment advisor regularly throughout the year, and meet at least quarterly with management of the investment advisor to review reports about fund operations. Fees and expenses incurred in conjunction with the directors during the year ended June 30, 2014 are detailed in the Statement of Operations. The fund’s officers do not receive compensation from the fund.
4. Investment Transactions
Purchases and sales of investment securities, excluding short-term investments, for the year ended June 30, 2014 were $877,806,535 and $734,096,677, respectively.
5. Fair Value Measurements
The fund’s investments valuation process is based on several considerations and may use multiple inputs to determine the fair value of the investments held by the fund. In conformity with accounting principles generally accepted in the United States of America, the inputs used to determine a valuation are classified into three broad levels.
| |
| • | Level 1 valuation inputs consist of unadjusted quoted prices in an active market for identical investments. |
| |
| • | Level 2 valuation inputs consist of direct or indirect observable market data (including quoted prices for comparable investments, evaluations of subsequent market events, interest rates, prepayment speeds, credit risk, etc.). These inputs also consist of quoted prices for identical investments initially expressed in local currencies that are adjusted through translation into U.S. dollars. |
| |
| • | Level 3 valuation inputs consist of unobservable data (including a fund’s own assumptions). |
The level classification is based on the lowest level input that is significant to the fair valuation measurement. The valuation inputs are not necessarily an indication of the risks associated with investing in these securities or other financial instruments.
The following is a summary of the level classifications as of period end. The Schedule of Investments provides additional information on the fund’s portfolio holdings.
|
| | | | | | | | |
| | Level 1 | Level 2 | Level 3 |
| Assets | | | |
| Investment Securities | | | |
| Common Stocks | $ | 1,115,002,361 |
| — |
| — |
|
| Temporary Cash Investments | 5,228,731 |
| $ | 4,865,252 |
| — |
|
| | $ | 1,120,231,092 |
| $ | 4,865,252 |
| — |
|
6. Federal Tax Information
The tax character of distributions paid during the years ended June 30, 2014 and June 30, 2013 were as follows:
|
| | | | | | |
| | 2014 | 2013 |
| Distributions Paid From | | |
| Ordinary income | $ | 59,700,311 |
| $ | 13,826,058 |
|
| Long-term capital gains | $ | 38,695,564 |
| $ | 27,805,216 |
|
The book-basis character of distributions made during the year from net investment income or net realized gains may differ from their ultimate characterization for federal income tax purposes. These differences reflect the differing character of certain income items and net realized gains and losses for financial statement and tax purposes, and may result in reclassification among certain capital accounts on the financial statements.
As of June 30, 2014, the federal tax cost of investments and the components of distributable earnings on a tax-basis were as follows:
|
| | | |
| Federal tax cost of investments | $ | 908,489,634 |
|
| Gross tax appreciation of investments | $ | 219,881,220 |
|
| Gross tax depreciation of investments | (3,274,510 | ) |
| Net tax appreciation (depreciation) of investments | $ | 216,606,710 |
|
| Undistributed ordinary income | $ | 26,341,684 |
|
| Accumulated long-term gains | $ | 44,255,423 |
|
| | |
The difference between book-basis and tax-basis unrealized appreciation (depreciation) is attributable primarily to the tax deferral of losses on wash sales.
|
| | | | | | | | | | | | | | | |
| For a Share Outstanding Throughout the Years Ended June 30 (except as noted) | | | |
| Per-Share Data | | | | Ratios and Supplemental Data |
| | | Income From Investment Operations: | Distributions From: | | | Ratio to Average Net Assets of: | | |
| | Net Asset Value, Beginning of Period | Net Investment Income (Loss)(1) | Net Realized and Unrealized Gain (Loss) | Total From Investment Operations | Net Investment Income | Net Realized Gains | Total Distributions | Net Asset Value, End of Period | Total Return(2) | Operating Expenses | Net Investment Income (Loss) | Portfolio Turnover Rate | Net Assets, End of Period (in thousands) |
| Institutional Class | | | | | | | | | | |
| 2014 | $11.58 | 0.20 | 2.59 | 2.79 | (0.19) | (1.14) | (1.33) | $13.04 | 25.29% | 0.47% | 1.64% | 77% |
| $1,124,703 |
|
| 2013 | $10.20 | 0.22 | 1.87 | 2.09 | (0.21) | (0.50) | (0.71) | $11.58 | 21.39% | 0.48% | 2.03% | 95% |
| $779,677 |
|
| 2012 | $10.27 | 0.17 | 0.35 | 0.52 | (0.18) | (0.41) | (0.59) | $10.20 | 5.65% | 0.48% | 1.75% | 104% |
| $558,993 |
|
| 2011 | $7.92 | 0.14 | 2.34 | 2.48 | (0.13) | – | (0.13) | $10.27 | 31.45% | 0.49% | 1.46% | 84% |
| $550,202 |
|
| 2010 | $7.06 | 0.11 | 0.85 | 0.96 | (0.10) | – | (0.10) | $7.92 | 13.53% | 0.49% | 1.31% | 69% |
| $320,958 |
|
|
|
| Notes to Financial Highlights |
| |
| (1) | Computed using average shares outstanding throughout the period. |
| |
| (2) | Total returns are calculated based on the net asset value of the last business day. Total returns for periods less than one year are not annualized. |
See Notes to Financial Statements.
|
|
| Report of Independent Registered Public Accounting Firm |
To the Directors of the American Century Quantitative Equity Funds, Inc. and Shareholders of the NT Equity Growth Fund:
In our opinion, the accompanying statement of assets and liabilities, including the schedule of investments, and the related statements of operations, of changes in net assets and the financial highlights present fairly, in all material respects, the financial position of the NT Equity Growth Fund (one of the fifteen funds comprising the American Century Quantitative Equity Funds, Inc., hereafter referred to as the “Fund”) at June 30, 2014, the results of its operations for the year then ended, the changes in its net assets for each of the two years in the period then ended and the financial highlights for each of the five years in the period then ended, in conformity with accounting principles generally accepted in the United States of America. These financial statements and financial highlights (hereafter referred to as "financial statements") are the responsibility of the Fund's management. Our responsibility is to express an opinion on these financial statements based on our audits. We conducted our audits of these financial statements in accordance with the standards of the Public Company Accounting Oversight Board (United States). Those standards require that we plan and perform the audit to obtain reasonable assurance about whether the financial statements are free of material misstatement. An audit includes examining, on a test basis, evidence supporting the amounts and disclosures in the financial statements, assessing the accounting principles used and significant estimates made by management, and evaluating the overall financial statement presentation. We believe that our audits, which included confirmation of securities at June 30, 2014 by correspondence with the custodian and brokers, provide a reasonable basis for our opinion.
PricewaterhouseCoopers LLP
Kansas City, Missouri
August 21, 2014
Board of Directors
The individuals listed below serve as directors of the funds. Each director will continue to serve in this capacity until death, retirement, resignation or removal from office. The board has adopted a mandatory retirement age for directors who are not “interested persons,” as that term is defined in the Investment Company Act (independent directors). Independent directors shall retire on December 31 of the year in which they reach their 75th birthday; provided, however, that on or after January 1, 2022, independent directors shall retire on December 31 of the year in which they reach their 76th birthday.
Mr. Thomas is an “interested person” because he currently serves as President and Chief Executive Officer of American Century Companies, Inc. (ACC), the parent company of American Century Investment Management, Inc. (ACIM or the advisor). The other directors (more than three-fourths of the total number) are independent. They are not employees, directors or officers of, and have no financial interest in, ACC or any of its wholly owned, direct or indirect, subsidiaries, including ACIM, American Century Investment Services, Inc. (ACIS) and American Century Services, LLC (ACS), and do not have any other affiliations, positions or relationships that would cause them to be considered “interested persons” under the Investment Company Act. The directors serve in this capacity for eight (in the case of Mr. Thomas, 15) registered investment companies in the American Century Investments family of funds.
The following table presents additional information about the directors. The mailing address for each director other than Mr. Thomas is 1665 Charleston Road, Mountain View, California 94043. The mailing address for Mr. Thomas is 4500 Main Street, Kansas City, Missouri 64111.
|
| | | | | |
Name (Year of Birth) | Position(s) Held with Funds | Length of Time Served | Principal Occupation(s) During Past 5 Years | Number of
American
Century
Portfolios
Overseen
by Director | Other Directorships Held During Past 5 Years |
| Independent Directors |
Tanya S. Beder (1955) | Director | Since 2011 | Chairman, SBCC Group Inc. (independent advisory services) (2006 to present) | 42 | CYS Investments, Inc. (specialty finance company) |
Jeremy I. Bulow (1954) | Director | Since 2011 | Professor of Economics, Stanford University, Graduate School of Business (1979 to present) | 42 | None |
Ronald J. Gilson (1946) | Director and Chairman of the Board | Since 1995 (Chairman since 2005) | Charles J. Meyers Professor of Law and Business, Stanford Law School (1979 to present); Marc and Eva Stern Professor of Law and Business, Columbia University School of Law (1992 to present) | 42 | None |
|
| | | | | |
Name (Year of Birth) | Position(s) Held with Funds | Length of Time Served | Principal Occupation(s) During Past 5 Years | Number of
American
Century
Portfolios
Overseen
by Director | Other Directorships Held During Past 5 Years |
| Independent Directors |
Frederick L. A. Grauer (1946) | Director | Since 2008 | Senior Advisor, BlackRock, Inc. (investment management firm) (2010 to 2011); Senior Advisor, Barclays Global Investors (investment management firm) (2003 to 2009) | 42 | None |
Peter F. Pervere
(1947) | Director | Since 2007 | Retired | 42 | Intraware, Inc. (2003 to 2009) |
Myron S. Scholes(1) (1941) | Director | Since 1980 | Chairman, Platinum Grove Asset Management, L.P. (asset manager) (1999 to 2009); Frank E. Buck Professor of Finance-Emeritus, Stanford Graduate School of Business (1996 to present) | 42 | Dimensional Fund Advisors (investment advisor); CME Group, Inc. (futures and options exchange) |
John B. Shoven
(1947) | Director | Since 2002 | Professor of Economics, Stanford University (1973 to present) | 42 | Cadence Design Systems; Exponent; Financial Engines |
| Interested Director |
Jonathan S. Thomas
(1963) | Director and
President | Since 2007 | President and Chief Executive Officer, ACC (March 2007 to present). Also serves as Chief Executive Officer and Manager, ACS; Executive Vice President, ACIM; Director, ACC, ACIM and other ACC subsidiaries | 115 | None |
(1) Myron S. Scholes resigned as director effective July 31, 2014.
Officers
The following table presents certain information about the executive officers of the funds. Each officer serves as an officer for each of the 15 investment companies in the American Century family of funds, unless otherwise noted. No officer is compensated for his or her service as an officer of the funds. The listed officers are interested persons of the funds and are appointed or re-appointed on an annual basis. The mailing address for each of the officers listed below is 4500 Main Street, Kansas City, Missouri 64111.
|
| | |
Name (Year of Birth) | Offices with the Funds | Principal Occupation(s) During the Past Five Years |
Jonathan S. Thomas (1963) | Director and President since 2007 | President and Chief Executive Officer, ACC (March 2007 to present). Also serves as Chief Executive Officer and Manager, ACS; Executive Vice President, ACIM; Director, ACC, ACIM and other ACC subsidiaries |
| Amy D. Shelton (1964) | Chief Compliance Officer since 2014 | Chief Compliance Officer, American Century funds, (March 2014 to present); Chief Compliance Officer, ACIM (February 2014 to present); Chief Compliance Officer, ACIS (October 2009 to present); Vice President, Client Interactions and Marketing, ACIS (February 2013 to January 2014); Director, Client Interactions and Marketing, ACIS (June 2007 to January 2013). Also serves as Vice President, ACIS |
Charles A. Etherington (1957) | General Counsel since 2007 and Senior Vice President since 2006 | Attorney, ACC (February 1994 to present); Vice President, ACC (November 2005 to present); General Counsel, ACC (March 2007 to present). Also serves as General Counsel, ACIM, ACS, ACIS and other ACC subsidiaries; and Senior Vice President, ACIM and ACS |
C. Jean Wade (1964) | Vice President, Treasurer and Chief Financial Officer since 2012 | Vice President, ACS (February 2000 to present) |
Robert J. Leach (1966) | Vice President since 2006 and Assistant Treasurer since 2012 | Vice President, ACS (February 2000 to present) |
David H. Reinmiller (1963) | Vice President since 2001 | Attorney, ACC (January 1994 to present); Associate General Counsel, ACC (January 2001 to present). Also serves as Vice President, ACIM and ACS |
Ward D. Stauffer (1960) | Secretary since 2005 | Attorney, ACC (June 2003 to present) |
The Statement of Additional Information has additional information about the fund’s directors and is available without charge, upon request, by calling 1-800-345-2021.
|
|
| Approval of Management Agreement |
At a meeting held on June 13, 2014, the Fund’s Board of Directors/Trustees unanimously approved the renewal of the management agreement pursuant to which American Century Investment Management, Inc. (the “Advisor”) acts as the investment advisor for the Fund. Under Section 15(c) of the Investment Company Act, contracts for investment advisory services are required to be reviewed, evaluated, and approved by a majority of a fund’s directors/trustees (the “Directors”), including a majority of the independent Directors, each year. The Board regards this annual evaluation and renewal as one of its most important responsibilities.
The independent Directors have memorialized a statement regarding the relationship between their ongoing obligations to oversee and evaluate the performance of the Advisor and their annual consideration of renewal of the management agreement. In that statement, the independent Directors noted that their assessment of the Advisor’s performance is an ongoing process that takes place over the entire year and is informed by all of the extensive information that the Board and its committees receive and consider over time. This information, together with the materials provided in connection with the review, are central to the Board’s assessment of the Advisor’s performance and its determination whether to renew the Fund’s management agreement.
Prior to its consideration of the renewal of the management agreement, the Board requested and reviewed extensive data and analysis relating to the proposed renewal. This information and analysis was compiled by the Advisor and certain independent providers of evaluation data concerning the Fund and the services provided to the Fund by the Advisor.
In connection with its consideration of the renewal of the management agreement, the Board’s review and evaluation of the services provided by the Advisor included, but was not limited to, the following:
| |
| • | the nature, extent, and quality of investment management, shareholder services, and other services provided by the Advisor to the Fund; |
| |
| • | the wide range of other programs and services the Advisor provides to the Fund and its shareholders on a routine and non-routine basis; |
| |
| • | the investment performance of the Fund, including data comparing the Fund’s performance to appropriate benchmarks and/or a peer group of other mutual funds with similar investment objectives and strategies; |
| |
| • | the cost of owning the Fund compared to the cost of owning similar funds; |
| |
| • | the Advisor’s compliance policies, procedures, and regulatory experience; |
| |
| • | financial data showing the cost of services provided to the Fund, the profitability of the Fund to the Advisor, and the overall profitability of the Advisor; |
| |
| • | possible economies of scale associated with the Advisor’s management of the Fund and other accounts under its management; |
| |
| • | data comparing services provided and charges to other investment management clients of the Advisor; and |
| |
| • | any collateral benefits derived by the Advisor from the management of the Fund. |
In keeping with its practice, the Board held two in-person meetings to review and discuss the information provided. The independent Directors also had the benefit of the advice of their independent counsel throughout the process.
Factors Considered
The Directors considered all of the information provided by the Advisor, the independent data providers, and the independent Directors’ independent counsel in connection with the review, and evaluated such information for the Fund. In connection with their review, the Directors did not identify any single factor as being all-important or controlling and each Director may have attributed
different levels of importance to different factors. In deciding to renew the management agreement, the Board based its decision on a number of factors, including the following:
Nature, Extent and Quality of Services — Generally. Under the management agreement, the Advisor is responsible for providing or arranging for all services necessary for the operation of the Fund. The Board noted that under the management agreement, the Advisor provides or arranges at its own expense a wide variety of services including:
| |
| • | constructing and designing the Fund |
| |
| • | portfolio research and security selection |
| |
| • | initial capitalization/funding |
| |
| • | daily valuation of the Fund’s portfolio |
| |
| • | shareholder servicing and transfer agency, including shareholder confirmations, recordkeeping, and communications |
| |
| • | regulatory and portfolio compliance |
| |
| • | marketing and distribution |
The Board noted that many of these services have expanded over time both in terms of quantity and complexity in response to shareholder demands, competition in the industry, changing distribution channels, and the changing regulatory environment.
Investment Management Services. The nature of the investment management services provided to the Fund is quite complex and allows Fund shareholders access to professional money management, instant diversification of their investments within an asset class, the opportunity to easily diversify among asset classes by investing in or exchanging among various American Century Investments funds, and liquidity. In evaluating investment performance, the Board expects the Advisor to manage the Fund in accordance with its investment objectives and approved strategies. Further, the Directors recognize that the Advisor has an obligation to seek the best execution of fund trades. In providing these services, the Advisor utilizes teams of investment professionals (portfolio managers, analysts, research assistants, and securities traders) who require extensive information technology, research, training, compliance and other systems to conduct their business. The Board, directly and through its Portfolio Committee, regularly reviews investment performance information for the Fund, together with comparative information for appropriate benchmarks and/or peer groups of similarly-managed funds, over different time horizons. The Directors also review detailed performance information during the management agreement approval process. If performance concerns are identified, the Fund receives special reviews until performance improves, during which the Board discusses with the Advisor the reasons for such results (e.g., market conditions, security selection) and any efforts being undertaken to improve performance. The Fund’s performance was above its benchmark for both the one- and three-year periods reviewed by the Board. The Board found the investment management services provided by the Advisor to the Fund to be satisfactory and consistent with the management agreement.
Shareholder and Other Services. Under the management agreement, the Advisor provides the Fund with a comprehensive package of transfer agency, shareholder, and other services. The Board, directly and through various committees of the Board, regularly reviews reports and evaluations of such services at its regular meetings. These reports include, but are not limited to, information regarding the operational efficiency and accuracy of the shareholder and transfer agency services provided, staffing levels, shareholder satisfaction (as measured by external as well as internal sources), technology support, new products and services offered to Fund shareholders, securities trading activities, portfolio valuation services, auditing services, and legal and operational compliance activities. Certain aspects of shareholder and transfer agency service level efficiency
and the quality of securities trading activities are measured by independent third party providers and are presented in comparison to other fund groups not managed by the Advisor. The Board found the services provided by the Advisor to the Fund under the management agreement to be competitive and of high quality.
Costs of Services and Profitability. The Advisor provides detailed information concerning its cost of providing various services to the Fund, its profitability in managing the Fund, its overall profitability, and its financial condition. The Directors have reviewed with the Advisor the methodology used to prepare this financial information. The financial information regarding the Advisor is considered in evaluating the Advisor’s financial condition, its ability to continue to provide services under the management agreement, and the reasonableness of the current management fee. The Board concluded that the Advisor’s profits were reasonable in light of the services provided to the Fund.
Ethics. The Board generally considers the Advisor’s commitment to providing quality services to shareholders and to conducting its business ethically. They noted that the Advisor’s practices generally meet or exceed industry best practices.
Economies of Scale. The Board also reviewed information provided by the Advisor regarding the possible existence of economies of scale in connection with the management of the Fund. The Board concluded that economies of scale are difficult to measure and predict with precision, especially on a fund-by-fund basis. The Board concluded that the Advisor is appropriately sharing economies of scale through its competitive fee structure, offering competitive fees from fund inception, and through reinvestment in its business to provide shareholders additional content and services.
Comparison to Other Funds’ Fees. The management agreement provides that the Fund pays the Advisor a single, all-inclusive (or unified) management fee for providing all services necessary for the management and operation of the Fund, other than brokerage expenses, taxes, interest, extraordinary expenses, and the fees and expenses of the Fund’s independent directors (including their independent legal counsel) and expenses incurred in connection with the provision of shareholder services and distribution services under a plan adopted pursuant to Rule 12b-1 under the 1940 Act. Under the unified fee structure, the Advisor is responsible for providing all investment advisory, custody, audit, administrative, compliance, recordkeeping, marketing and shareholder services, or arranging and supervising third parties to provide such services. By contrast, most other funds are charged a variety of fees, including an investment advisory fee, a transfer agency fee, an administrative fee, distribution charges and other expenses. Other than their investment advisory fees and any applicable Rule 12b-1 distribution fees, all other components of the total fees charged by these other funds may be increased without shareholder approval. The Board believes the unified fee structure is a benefit to Fund shareholders because it clearly discloses to shareholders the cost of owning Fund shares, and, since the unified fee cannot be increased without a vote of Fund shareholders, it shifts to the Advisor the risk of increased costs of operating the Fund and provides a direct incentive to minimize administrative inefficiencies. Part of the Board’s analysis of fee levels involves reviewing certain evaluative data compiled by an independent provider and comparing the Fund’s unified fee to the total expense ratio of other funds in the Fund’s peer group. The unified fee charged to shareholders of the Fund was below the median of the total expense ratios of the Fund’s peer group. The Board concluded that the management fee paid by the Fund to the Advisor under the management agreement is reasonable in light of the services provided to the Fund.
Comparison to Fees and Services Provided to Other Clients of the Advisor. The Board also requested and received information from the Advisor concerning the nature of the services, fees, costs and profitability of its advisory services to advisory clients other than the Fund. They observed that these varying types of client accounts require different services and involve different regulatory and entrepreneurial risks than the management of the Fund. The Board analyzed this information and concluded that the fees charged and services provided to the Fund were reasonable by comparison.
Collateral or “Fall-Out” Benefits Derived by the Advisor. The Board considered the existence of collateral benefits the Advisor may receive as a result of its relationship with the Fund. They concluded that the Advisor’s primary business is managing mutual funds and it generally does not use fund or shareholder information to generate profits in other lines of business, and therefore does not derive any significant collateral benefits from them. The Board noted that the Advisor receives proprietary research from broker-dealers that execute fund portfolio transactions and concluded that this research is likely to benefit Fund shareholders. The Board also determined that the Advisor is able to provide investment management services to certain clients other than the Fund, at least in part, due to its existing infrastructure built to serve the fund complex. The Board concluded, however, that the assets of those other clients are not material to the analysis and, where applicable, may be included with the assets of the Fund to determine breakpoints in the management fee schedule.
Existing Relationship. The Board also considered whether there was any reason for not continuing the existing arrangement with the Advisor. In this regard, the Board was mindful of the potential disruptions of the Fund’s operations and various risks, uncertainties, and other effects that could occur as a result of a decision not to continue such relationship. In particular, the Board recognized that most shareholders have invested in the Fund on the strength of the Advisor’s industry standing and reputation and in the expectation that the Advisor will have a continuing role in providing advisory services to the Fund.
Conclusion of the Directors. As a result of this process, the Board, including all of the independent Directors and assisted by the advice of independent legal counsel, taking into account all of the factors discussed above and the information provided by the Advisor and others, concluded that the management agreement between the Fund and the Advisor is fair and reasonable in light of the services provided and should be renewed.
Retirement Account Information
As required by law, distributions you receive from certain IRAs are subject to federal income tax withholding, unless you elect not to have withholding apply. Tax will be withheld on the total amount withdrawn even though you may be receiving amounts that are not subject to withholding, such as nondeductible contributions. In such case, excess amounts of withholding could occur. You may adjust your withholding election so that a greater or lesser amount will be withheld.
If you don’t want us to withhold on this amount, you must notify us to not withhold the federal income tax. You may notify us in writing or in certain situations by telephone or through other electronic means. For systematic withdrawals, your withholding election will remain in effect until revoked or changed by filing a new election. You have the right to revoke your election at any time.
Remember, even if you elect not to have income tax withheld, you are liable for paying income tax on the taxable portion of your withdrawal. If you elect not to have income tax withheld or you don’t have enough income tax withheld, you may be responsible for payment of estimated tax. You may incur penalties under the estimated tax rules if your withholding and estimated tax payments are not sufficient. You can reduce or defer the income tax on a distribution by directly or indirectly rolling such distribution over to another IRA or eligible plan. You should consult your tax advisor for additional information.
State tax will be withheld if, at the time of your distribution, your address is within one of the mandatory withholding states and you have federal income tax withheld (or as otherwise required by state law). State taxes will be withheld from your distribution in accordance with the respective state rules.
Distributions you receive from 403(b), 457 and qualified plans are subject to special tax and withholding rules. Your plan administrator or plan sponsor is required to provide you with a special tax notice explaining those rules at the time you request a distribution. If applicable, federal and/or state taxes may be withheld from your distribution amount.
Proxy Voting Policies
Descriptions of the principles and policies that the fund's investment advisor uses in exercising the voting rights associated with the securities purchased and/or held by the fund are available without charge, upon request, by calling 1-800-345-2021 or visiting the "About Us" page of American Century Investments’ website at americancentury.com. A description of the policies is also available on the Securities and Exchange Commission’s website at sec.gov. Information regarding how the investment advisor voted proxies relating to portfolio securities during the most recent 12-month period ended June 30 is available on the "About Us" page at americancentury.com. It is also available at sec.gov.
Quarterly Portfolio Disclosure
The fund files its complete schedule of portfolio holdings with the Securities and Exchange Commission (SEC) for the first and third quarters of each fiscal year on Form N-Q. The fund’s Forms N-Q are available on the SEC’s website at sec.gov, and may be reviewed and copied at the SEC’s Public Reference Room in Washington, DC. Information on the operation of the Public Reference Room may be obtained by calling 1-800-SEC-0330. The fund also makes its complete schedule of portfolio holdings for the most recent quarter of its fiscal year available on its website at americancentury.com and, upon request, by calling 1-800-345-2021.
Other Tax Information
The following information is provided pursuant to provisions of the Internal Revenue Code.
The fund hereby designates up to the maximum amount allowable as qualified dividend income for the fiscal year ended June 30, 2014.
For corporate taxpayers, the fund hereby designates $20,719,941, or up to the maximum amount allowable, of ordinary income distributions paid during the fiscal year ended June 30, 2014 as qualified for the corporate dividends received deduction.
The fund hereby designates $44,396,768 as qualified short-term capital gain distributions for purposes of Internal Revenue Code Section 871.
The fund hereby designates $38,695,564, or up to the maximum amount allowable, as long-term capital gain distributions for the fiscal year ended June 30, 2014.
|
| | |
| |
| | | |
| Contact Us | americancentury.com | |
| Automated Information Line | 1-800-345-8765 | |
| Investor Services Representative | 1-800-345-2021
or 816-531-5575 | |
| Investors Using Advisors | 1-800-378-9878 | |
Business, Not-For-Profit, Employer-Sponsored
Retirement Plans | 1-800-345-3533 | |
Banks and Trust Companies, Broker-Dealers,
Financial Professionals, Insurance Companies | 1-800-345-6488 | |
| Telecommunications Relay Service for the Deaf | 711 | |
| | | |
| American Century Quantitative Equity Funds, Inc. | |
| | | |
Investment Advisor: American Century Investment Management, Inc. Kansas City, Missouri | |
| | | |
| This report and the statements it contains are submitted for the general information of our shareholders. The report is not authorized for distribution to prospective investors unless preceded or accompanied by an effective prospectus. | |
| | | |
©2014 American Century Proprietary Holdings, Inc. All rights reserved.
CL-ANN-82895 1408 | |
|
| |
ANNUAL REPORT | JUNE 30, 2014 |
NT Small Company Fund
|
| |
| President's Letter | |
| Performance | |
| Portfolio Commentary | |
| Fund Characteristics | |
| Shareholder Fee Example | |
| Schedule of Investments | |
| Statement of Assets and Liabilities | |
| Statement of Operations | |
| Statement of Changes in Net Assets | |
| Notes to Financial Statements | |
| Financial Highlights | |
| Report of Independent Registered Public Accounting Firm | |
| Management | |
| Approval of Management Agreement | |
| Additional Information | |
Any opinions expressed in this report reflect those of the author as of the date of the report, and do not necessarily represent the opinions of American Century Investments® or any other person in the American Century Investments organization. Any such opinions are subject to change at any time based upon market or other conditions and American Century Investments disclaims any responsibility to update such opinions. These opinions may not be relied upon as investment advice and, because investment decisions made by American Century Investments funds are based on numerous factors, may not be relied upon as an indication of trading intent on behalf of any American Century Investments fund. Security examples are used for representational purposes only and are not intended as recommendations to purchase or sell securities. Performance information for comparative indices and securities is provided to American Century Investments by third party vendors. To the best of American Century Investments’ knowledge, such information is accurate at the time of printing.
|
| |
| Dear Investor:
Thank you for reviewing this annual report for the 12 months ended June 30, 2014. It provides investment performance and portfolio information for the reporting period, plus longer-term historical performance data.
Annual reports remain important vehicles for conveying information about fund returns, including market and economic factors that affected performance during the reporting period. For additional, updated investment and market insights, we encourage you to visit our website, americancentury.com.
|
| Jonathan Thomas |
Aggressive Monetary Policies Boosted Stock and Bond Returns
Stimulative monetary policies and expectations of economic improvement, interspersed with concerns about weaker-than-expected economic data and geopolitical conflicts, helped drive financial market returns during the reporting period. We believe the combination of longer-term optimism about global economic growth, low costs of capital, and central bank purchases of fixed income securities helped persuade investors to seek risk and yield, especially in the U.S. and Europe. Stock index returns were strong in these markets, particularly at the smaller capitalization end of the company size spectrum. The MSCI Europe and S&P 500® indices advanced 29.28% and 24.61%, respectively.
Remarkably, for a period in which stock market performance was so strong, government bond performance was also generally positive. Not surprisingly, U.S. corporate high-yield bonds posted double-digit returns, but the 30-year U.S. Treasury bond also outperformed most broader bond market measures. In addition, a generally weaker U.S. dollar during the reporting period meant that international bond returns for U.S. investors with currency exposure were generally higher than U.S. bonds returns. The Barclays Global Aggregate Bond and Barclays U.S. Aggregate Bond indices returned 7.39% and 4.37%, respectively.
Looking ahead, we see signs of sustained moderate economic growth in the second half of 2014, but headwinds persist. In the U.S., which was supposed to be an economic growth leader this year, housing market momentum has slowed, interest rates could rise, and economic growth and U.S. employment levels remain subpar compared with past post-recession periods. In this environment, we continue to believe in a disciplined, diversified, long-term investment approach, using professionally managed stock and bond portfolios—as appropriate—for meeting financial goals. We appreciate your continued trust in us.
Sincerely,
Jonathan Thomas
President and Chief Executive Officer
American Century Investments
|
| | | | | |
| Total Returns as of June 30, 2014 |
| | | | Average Annual Returns | |
| | Ticker Symbol | 1 year | 5 years | Since Inception | Inception Date |
| Institutional Class | ACLOX | 26.77% | 21.81% | 5.02% | 5/12/06 |
| Russell 2000 Index | — | 23.64% | 20.20% | 7.46% | — |
|
|
| Growth of $10,000 Over Life of Class |
| $10,000 investment made May 12, 2006 |
|
| |
| Value on June 30, 2014 |
| | Institutional Class — $14,902 |
| |
| | Russell 2000 Index — $17,959 |
| |
* From May 12, 2006, the Institutional Class's inception date. Not annualized.
|
| |
| Total Annual Fund Operating Expenses |
| Institutional Class | 0.68% |
The total annual fund operating expenses shown is as stated in the fund’s prospectus current as of the date of this report. The prospectus may vary from the expense ratio shown elsewhere in this report because it is based on a different time period, includes acquired fund fees and expenses, and, if applicable, does not include fee waivers or expense reimbursements.
Data presented reflect past performance. Past performance is no guarantee of future results. Current performance may be higher or lower than the performance shown. Investment return and principal value will fluctuate, and redemption value may be more or less than original cost. To obtain performance data current to the most recent month end, please call 1-800-345-2021 or visit americancentury.com. Historically, small company stocks have been more volatile than the stocks of larger, more established companies.
Data assumes reinvestment of dividends and capital gains, and none of the charts reflect the deduction of taxes that a shareholder would pay on fund distributions or the redemption of fund shares. Returns for the index are provided for comparison. The fund’s total returns include operating expenses (such as transaction costs and management fees) that reduce returns, while the total returns of the index do not.
Portfolio Managers: Brian Garbe and Tal Sansani
Performance Summary
NT Small Company returned 26.77% for the fiscal year ended June 30, 2014, compared with the 23.64% return of its benchmark, the Russell 2000 Index.
As U.S. equity markets continued their robust appreciation, NT Small Company posted strong gains for the 12-month period, outperforming the Russell 2000 Index. NT Small Company’s stock selection process incorporates factors of valuation, quality, growth, and momentum (sentiment) while striving to minimize unintended risks along industries and other risk characteristics. Valuation factors were largely ignored in the markets as investors rewarded growth stocks, particularly during the first half of the period. Markets likewise favored sentiment-based measures. Within the fund, security selection was the primary driver of returns, with industrials and financials holdings providing the majority of contribution. The materials and consumer discretionary sectors detracted from the fund’s results.
Industrials and Financials Outperformed
The industrials and financials sectors were among the leading contributors to the fund’s returns relative to the Russell 2000 Index. Industrials sector outperformance was primarily due to successful stock selection in the machinery industry. The Greenbrier Companies, a manufacturer of railroad freight equipment, was a key fund outperformer, appreciating strongly thanks to rising orders of its railcars. The holding’s strong quality, sentiment, and growth profiles make it particularly attractive. Shares of lift truck manufacturer Hyster-Yale Materials Handling appreciated on revenue growth driven by increases in unit growth as well as fleet services and shipments. Holdings in the commercial services and supplies industry added to results. Here, Deluxe Corporation, a provider of small business and financial services, was a key outperformer, rising nearly 73% during the period.
The financials sector was another area of outperformance. A number of successful bank holdings contributed to the industry’s returns, as did select insurance companies, including Universal Insurance Holdings. The company’s stock nearly doubled in value thanks to solid third quarter results, a special dividend payout, and New York Stock Exchange listing. Underweight positioning, relative to the benchmark, in real estate investment trusts likewise added value.
Security selection in the information technology and health care sectors also enhanced gains. ARRIS Group, a provider of media entertainment and data communications solutions, gained nearly 130% during the year on growing demand for its set-top boxes. Synaptics, a provider of touch-sensitive interface technologies, appreciated on news of its intent to acquire Renesas SP Drivers, a maker of display drivers for LCDs. In the health care sector, Questcor Pharmaceuticals was a top individual contributor, appreciating on strong sales and earnings growth.
Materials and Consumer Discretionary Sectors Detracted
Security selection in the materials sector, particularly within paper and forest product holdings, diminished fund returns during the 12-month period, driven in large part by specialty paper producer Schweitzer-Mauduit International, which declined 10%. Consumer discretionary holdings and sector positioning were also relative detractors. Overweight exposure in a number of internet retailers pressured portfolios gains. Prominent underperformers included Overstock.com, which fell on news of management changes despite strong earnings results. Other sector constituents that hurt results included ITT Educational Services, a for-profit education provider, which fell on declining enrollment and future guidance as well as concerns surrounding the filing of the company’s current financials. Sporting goods retailer Big 5 Sporting Goods missed revenue estimates due to weakening sales, which negatively impacted its stock price. The fund subsequently exited its stake in the holding.
A number of key individual detractors were found in the information technology sector. These included solar power semiconductor manufacturer SunEdison, which the fund did not hold. The company’s stock benefited from several analyst upgrades based on a continued rise in solar power demand. An overweight position in InterDigital, a developer of wireless communication technology, also decreased returns as investors punished the company’s stock early in the period following the loss of a patent-infringement case against Nokia. The position was ultimately sold.
A Look Ahead
Economic recovery in the U.S. appears to be progressing, albeit at a slower pace than during prior post-recessionary periods, and is expected to stay the course through the remainder of 2014. Recent indicators such as improvements in small business and consumer confidence point to a sustainable rebound, and economic growth is likely to further benefit from the recovering labor and housing markets. Though a continuation of political instability in non-U.S. markets as well as the potential for rising inflation and interest rates could lead to heightened market volatility, our disciplined, objective, and systematic investment strategy is designed to take advantage of opportunities at the individual company level. We believe this approach is the most powerful way to capitalize on market inefficiencies that lead to the mispricing of individual stocks. Currently, the fund’s most significant sector overweight positions are in industrials and information technology while energy and utilities represent the greatest sector underweights.
|
| |
| JUNE 30, 2014 | |
| Top Ten Holdings | % of net assets |
| RLJ Lodging Trust | 0.8% |
| Synaptics, Inc. | 0.8% |
| Deluxe Corp. | 0.7% |
| Sanderson Farms, Inc. | 0.7% |
| Brunswick Corp. | 0.7% |
| Esterline Technologies Corp. | 0.7% |
| Strategic Hotels & Resorts, Inc. | 0.7% |
| Cooper Tire & Rubber Co. | 0.7% |
| Take-Two Interactive Software, Inc. | 0.7% |
| Moog, Inc., Class A | 0.7% |
| | |
| Top Five Industries | % of net assets |
| Semiconductors and Semiconductor Equipment | 6.1% |
| Real Estate Investment Trusts (REITs) | 6.0% |
| Machinery | 5.8% |
| Software | 5.3% |
| Banks | 4.7% |
| | |
| Types of Investments in Portfolio | % of net assets |
| Common Stocks | 100.2% |
| Temporary Cash Investments | 0.4% |
| Other Assets and Liabilities | (0.6)% |
Fund shareholders may incur two types of costs: (1) transaction costs, including sales charges (loads) on purchase payments and redemption/exchange fees; and (2) ongoing costs, including management fees; distribution and service (12b-1) fees; and other fund expenses. This example is intended to help you understand your ongoing costs (in dollars) of investing in your fund and to compare these costs with the ongoing cost of investing in other mutual funds.
The example is based on an investment of $1,000 made at the beginning of the period and held for the entire period from January 1, 2014 to June 30, 2014.
Actual Expenses
The table provides information about actual account values and actual expenses for each class. You may use the information, together with the amount you invested, to estimate the expenses that you paid over the period. First, identify the share class you own. Then simply divide your account value by $1,000 (for example, an $8,600 account value divided by $1,000 = 8.6), then multiply the result by the number under the heading “Expenses Paid During Period” to estimate the expenses you paid on your account during this period.
If you hold Investor Class shares of any American Century Investments fund, or Institutional Class shares of the American Century Diversified Bond Fund, in an American Century Investments account (i.e., not a financial intermediary or retirement plan account), American Century Investments may charge you a $12.50 semiannual account maintenance fee if the value of those shares is less than $10,000. We will redeem shares automatically in one of your accounts to pay the $12.50 fee. In determining your total eligible investment amount, we will include your investments in all personal accounts (including American Century Investments Brokerage accounts) registered under your Social Security number. Personal accounts include individual accounts, joint accounts, UGMA/UTMA accounts, personal trusts, Coverdell Education Savings Accounts and IRAs (including traditional, Roth, Rollover, SEP-, SARSEP- and SIMPLE-IRAs), and certain other retirement accounts. If you have only business, business retirement, employer-sponsored or American Century Investments Brokerage accounts, you are currently not subject to this fee. If you are subject to the Account Maintenance Fee, your account value could be reduced by the fee amount.
Hypothetical Example for Comparison Purposes
The table also provides information about hypothetical account values and hypothetical expenses based on the actual expense ratio of each class of your fund and an assumed rate of return of 5% per year before expenses, which is not the actual return of a fund’s share class. The hypothetical account values and expenses may not be used to estimate the actual ending account balance or expenses you paid for the period. You may use this information to compare the ongoing costs of investing in your fund and other funds. To do so, compare this 5% hypothetical example with the 5% hypothetical examples that appear in the shareholder reports of the other funds.
Please note that the expenses shown in the table are meant to highlight your ongoing costs only and do not reflect any transactional costs, such as sales charges (loads) or redemption/exchange fees. Therefore, the table is useful in comparing ongoing costs only, and will not help you determine the relative total costs of owning different funds. In addition, if these transactional costs were included, your costs would have been higher.
|
| | | | |
| | Beginning Account Value 1/1/14 | Ending Account Value 6/30/14 | Expenses Paid During Period(1) 1/1/14-6/30/14 | Annualized Expense Ratio(1) |
| Actual | | | | |
| Institutional Class | $1,000 | $1,045.60 | $3.40 | 0.67% |
| Hypothetical | | | | |
| Institutional Class | $1,000 | $1,021.47 | $3.36 | 0.67% |
| |
| (1) | Expenses are equal to the class’s annualized expense ratio listed in the table above, multiplied by the average account value over the period, multiplied by 181, the number of days in the most recent fiscal half-year, divided by 365, to reflect the one-half year period. |
JUNE 30, 2014
|
| | | | |
| | Shares | Value |
| COMMON STOCKS — 100.2% | | |
| AEROSPACE AND DEFENSE — 2.6% | | |
| AAR Corp. | 81,031 | $ | 2,233,214 |
|
| Alliant Techsystems, Inc. | 4,370 | 585,230 |
|
Ducommun, Inc.(1) | 37,320 | 975,172 |
|
Engility Holdings, Inc.(1) | 3,901 | 149,252 |
|
Esterline Technologies Corp.(1) | 23,229 | 2,674,123 |
|
Moog, Inc., Class A(1) | 34,949 | 2,547,433 |
|
Orbital Sciences Corp.(1) | 15,595 | 460,832 |
|
| | | 9,625,256 |
|
| AIRLINES — 1.4% | | |
| Alaska Air Group, Inc. | 19,017 | 1,807,566 |
|
JetBlue Airways Corp.(1) | 201,631 | 2,187,696 |
|
| Skywest, Inc. | 99,951 | 1,221,401 |
|
| | | 5,216,663 |
|
| AUTO COMPONENTS — 2.9% | | |
| Cooper Tire & Rubber Co. | 85,024 | 2,550,720 |
|
| Drew Industries, Inc. | 14,966 | 748,450 |
|
Fuel Systems Solutions, Inc.(1) | 75,515 | 841,237 |
|
Modine Manufacturing Co.(1) | 72,259 | 1,137,357 |
|
Stoneridge, Inc.(1) | 100,652 | 1,078,989 |
|
Tenneco, Inc.(1) | 31,834 | 2,091,494 |
|
Tower International, Inc.(1) | 64,760 | 2,385,758 |
|
| | | 10,834,005 |
|
| BANKS — 4.7% | | |
| Cardinal Financial Corp. | 87,431 | 1,613,976 |
|
| Cathay General Bancorp. | 44,233 | 1,130,596 |
|
Customers Bancorp, Inc.(1) | 74,671 | 1,494,157 |
|
Eagle Bancorp, Inc.(1) | 37,805 | 1,275,919 |
|
First BanCorp(1) | 150,931 | 821,065 |
|
| First Interstate Bancsystem, Inc. | 61,865 | 1,681,491 |
|
| First Midwest Bancorp, Inc. | 26,739 | 455,365 |
|
First NBC Bank Holding Co.(1) | 4,709 | 157,799 |
|
| Hancock Holding Co. | 47,157 | 1,665,585 |
|
| Home Bancshares, Inc. | 8,550 | 280,611 |
|
| IBERIABANK Corp. | 32,323 | 2,236,428 |
|
| OFG Bancorp | 111,012 | 2,043,731 |
|
| Renasant Corp. | 13,631 | 396,253 |
|
| South State Corp. | 6,545 | 399,245 |
|
| State Bank Financial Corp. | 21,650 | 366,102 |
|
Tristate Capital Holdings, Inc.(1) | 7,134 | 100,803 |
|
| Washington Trust Bancorp, Inc. | 4,755 | 174,841 |
|
| Wilshire Bancorp, Inc. | 108,556 | 1,114,870 |
|
|
| | | | |
| | Shares | Value |
| Wintrust Financial Corp. | 219 | $ | 10,074 |
|
Yadkin Financial Corp.(1) | 3,924 | 73,928 |
|
| | | 17,492,839 |
|
| BIOTECHNOLOGY — 3.0% | | |
Emergent Biosolutions, Inc.(1) | 81,907 | 1,839,631 |
|
Insys Therapeutics, Inc.(1) | 26,672 | 832,967 |
|
Isis Pharmaceuticals, Inc.(1) | 44,723 | 1,540,707 |
|
Ligand Pharmaceuticals, Inc., Class B(1) | 3,792 | 236,204 |
|
NPS Pharmaceuticals, Inc.(1) | 75,998 | 2,511,734 |
|
| PDL BioPharma, Inc. | 236,721 | 2,291,459 |
|
Prothena Corp. plc(1) | 30,778 | 694,044 |
|
Sangamo Biosciences, Inc.(1) | 26,926 | 411,160 |
|
Threshold Pharmaceuticals, Inc.(1) | 188,201 | 745,276 |
|
| | | 11,103,182 |
|
| BUILDING PRODUCTS — 0.3% | | |
| Simpson Manufacturing Co., Inc. | 29,382 | 1,068,330 |
|
| CAPITAL MARKETS — 3.4% | | |
| Calamos Asset Management, Inc., Class A | 75,477 | 1,010,637 |
|
| Diamond Hill Investment Group, Inc. | 5,360 | 684,579 |
|
| Evercore Partners, Inc., Class A | 40,615 | 2,341,049 |
|
FBR & Co.(1) | 23,518 | 638,043 |
|
| Financial Engines, Inc. | 10,845 | 491,062 |
|
| FXCM, Inc., Class A | 67,986 | 1,017,071 |
|
Investment Technology Group, Inc.(1) | 29,171 | 492,406 |
|
| Janus Capital Group, Inc. | 124,944 | 1,559,301 |
|
| Manning & Napier, Inc. | 80,102 | 1,382,561 |
|
Piper Jaffray Cos.(1) | 13,550 | 701,483 |
|
Stifel Financial Corp.(1) | 52,477 | 2,484,786 |
|
| | | 12,802,978 |
|
| CHEMICALS — 2.4% | | |
Ferro Corp.(1) | 154,697 | 1,942,995 |
|
| FutureFuel Corp. | 77,471 | 1,285,244 |
|
| Minerals Technologies, Inc. | 15,983 | 1,048,165 |
|
| Olin Corp. | 90,463 | 2,435,264 |
|
| Quaker Chemical Corp. | 29,423 | 2,259,392 |
|
| | | 8,971,060 |
|
| COMMERCIAL SERVICES AND SUPPLIES — 2.8% | | |
ACCO Brands Corp.(1) | 41,163 | 263,855 |
|
| Deluxe Corp. | 47,249 | 2,767,847 |
|
| Ennis, Inc. | 33,959 | 518,214 |
|
| Herman Miller, Inc. | 62,060 | 1,876,694 |
|
| Intersections, Inc. | 34,050 | 167,526 |
|
| Kimball International, Inc., Class B | 92,303 | 1,543,306 |
|
Performant Financial Corp.(1) | 12,118 | 122,392 |
|
| Quad/Graphics, Inc. | 49,507 | 1,107,472 |
|
| Steelcase, Inc., Class A | 144,324 | 2,183,622 |
|
| | | 10,550,928 |
|
|
| | | | |
| | Shares | Value |
| COMMUNICATIONS EQUIPMENT — 1.6% | | |
ARRIS Group, Inc.(1) | 63,522 | $ | 2,066,371 |
|
| Brocade Communications Systems, Inc. | 96,801 | 890,569 |
|
Ciena Corp.(1) | 112,399 | 2,434,562 |
|
Finisar Corp.(1) | 7,831 | 154,662 |
|
Harmonic, Inc.(1) | 35,789 | 266,986 |
|
| | | 5,813,150 |
|
| CONSUMER FINANCE — 1.9% | | |
| Cash America International, Inc. | 48,093 | 2,136,772 |
|
Credit Acceptance Corp.(1) | 7,847 | 965,966 |
|
Green Dot Corp., Class A(1) | 2,598 | 49,310 |
|
Portfolio Recovery Associates, Inc.(1) | 31,301 | 1,863,348 |
|
Regional Management Corp.(1) | 17,861 | 276,310 |
|
World Acceptance Corp.(1) | 21,423 | 1,627,291 |
|
| | | 6,918,997 |
|
| CONTAINERS AND PACKAGING — 0.6% | | |
Berry Plastics Group, Inc.(1) | 90,322 | 2,330,308 |
|
| DIVERSIFIED CONSUMER SERVICES — 0.7% | | |
| Capella Education Co. | 13,075 | 711,149 |
|
| Carriage Services, Inc. | 6,716 | 115,045 |
|
ITT Educational Services, Inc.(1) | 39,748 | 663,394 |
|
K12, Inc.(1) | 16,270 | 391,619 |
|
Strayer Education, Inc.(1) | 16,880 | 886,369 |
|
| | | 2,767,576 |
|
| DIVERSIFIED FINANCIAL SERVICES — 0.6% | | |
PHH Corp.(1) | 91,377 | 2,099,843 |
|
| DIVERSIFIED TELECOMMUNICATION SERVICES — 1.3% | | |
Fairpoint Communications, Inc.(1) | 36,552 | 510,631 |
|
| IDT Corp., Class B | 49,997 | 870,948 |
|
| Inteliquent, Inc. | 135,454 | 1,878,747 |
|
Premiere Global Services, Inc.(1) | 103,929 | 1,387,452 |
|
| | | 4,647,778 |
|
| ELECTRIC UTILITIES — 0.7% | | |
| Cleco Corp. | 23,760 | 1,400,652 |
|
| UIL Holdings Corp. | 33,588 | 1,300,191 |
|
| | | 2,700,843 |
|
| ELECTRICAL EQUIPMENT — 0.3% | | |
Enphase Energy, Inc.(1) | 51,493 | 440,265 |
|
Thermon Group Holdings, Inc.(1) | 19,816 | 521,557 |
|
| | | 961,822 |
|
| ELECTRONIC EQUIPMENT, INSTRUMENTS AND COMPONENTS — 3.9% | |
| Anixter International, Inc. | 6,709 | 671,369 |
|
Benchmark Electronics, Inc.(1) | 94,758 | 2,414,434 |
|
Checkpoint Systems, Inc.(1) | 124,121 | 1,736,453 |
|
Coherent, Inc.(1) | 30,208 | 1,998,863 |
|
| Daktronics, Inc. | 22,390 | 266,889 |
|
|
| | | | |
| | Shares | Value |
GSI Group, Inc.(1) | 22,315 | $ | 284,070 |
|
Insight Enterprises, Inc.(1) | 2,839 | 87,271 |
|
Newport Corp.(1) | 51,812 | 958,522 |
|
| PC Connection, Inc. | 3,879 | 80,218 |
|
Plexus Corp.(1) | 18,083 | 782,813 |
|
Rogers Corp.(1) | 8,612 | 571,406 |
|
Sanmina Corp.(1) | 105,464 | 2,402,470 |
|
ScanSource, Inc.(1) | 56,739 | 2,160,621 |
|
| | | 14,415,399 |
|
| ENERGY EQUIPMENT AND SERVICES — 0.8% | | |
ION Geophysical Corp.(1) | 285,365 | 1,204,240 |
|
Matrix Service Co.(1) | 11,591 | 380,069 |
|
Newpark Resources, Inc.(1) | 24,805 | 309,070 |
|
SEACOR Holdings, Inc.(1) | 878 | 72,216 |
|
| Tesco Corp. | 42,681 | 910,813 |
|
TGC Industries, Inc.(1) | 19,418 | 105,828 |
|
| | | 2,982,236 |
|
| FOOD AND STAPLES RETAILING — 1.3% | | |
| Andersons, Inc. (The) | 34,322 | 1,770,329 |
|
Rite Aid Corp.(1) | 339,027 | 2,430,824 |
|
| Roundy's, Inc. | 111,291 | 613,213 |
|
| | | 4,814,366 |
|
| FOOD PRODUCTS — 1.7% | | |
Chiquita Brands International, Inc.(1) | 66,912 | 725,995 |
|
Farmer Bros. Co.(1) | 14,329 | 309,650 |
|
Omega Protein Corp.(1) | 39,706 | 543,178 |
|
Pilgrim's Pride Corp.(1) | 80,163 | 2,193,260 |
|
| Sanderson Farms, Inc. | 27,992 | 2,720,822 |
|
| | | 6,492,905 |
|
| GAS UTILITIES — 0.7% | | |
| New Jersey Resources Corp. | 42,543 | 2,431,758 |
|
| HEALTH CARE EQUIPMENT AND SUPPLIES — 3.0% | | |
Align Technology, Inc.(1) | 39,220 | 2,197,889 |
|
| Analogic Corp. | 8,460 | 661,910 |
|
Anika Therapeutics, Inc.(1) | 39,815 | 1,844,629 |
|
| Atrion Corp. | 340 | 110,840 |
|
Greatbatch, Inc.(1) | 43,610 | 2,139,507 |
|
Haemonetics Corp.(1) | 44,279 | 1,562,163 |
|
| Hill-Rom Holdings, Inc. | 40,405 | 1,677,212 |
|
Medical Action Industries, Inc.(1) | 7,654 | 105,089 |
|
Natus Medical, Inc.(1) | 13,268 | 333,557 |
|
NuVasive, Inc.(1) | 4,397 | 156,401 |
|
Symmetry Medical, Inc.(1) | 31,917 | 282,785 |
|
| | | 11,071,982 |
|
| HEALTH CARE PROVIDERS AND SERVICES — 4.1% | | |
Addus HomeCare Corp.(1) | 53,139 | 1,194,565 |
|
AMN Healthcare Services, Inc.(1) | 121,506 | 1,494,524 |
|
|
| | | | |
| | Shares | Value |
Amsurg Corp.(1) | 49,422 | $ | 2,252,160 |
|
Centene Corp.(1) | 28,729 | 2,172,200 |
|
| Chemed Corp. | 26,171 | 2,452,746 |
|
Corvel Corp.(1) | 3,504 | 158,311 |
|
| Kindred Healthcare, Inc. | 62,241 | 1,437,767 |
|
PharMerica Corp.(1) | 74,629 | 2,133,643 |
|
Providence Service Corp. (The)(1) | 45,839 | 1,677,249 |
|
Skilled Healthcare Group, Inc., Class A(1) | 42,590 | 267,891 |
|
| | | 15,241,056 |
|
| HEALTH CARE TECHNOLOGY — 0.6% | | |
MedAssets, Inc.(1) | 90,299 | 2,062,429 |
|
| HOTELS, RESTAURANTS AND LEISURE — 2.3% | | |
| Cracker Barrel Old Country Store, Inc. | 22,760 | 2,266,213 |
|
| Interval Leisure Group, Inc. | 78,039 | 1,712,176 |
|
| Jack in the Box, Inc. | 41,687 | 2,494,550 |
|
Monarch Casino & Resort, Inc.(1) | 19,289 | 292,035 |
|
Multimedia Games Holding Co., Inc.(1) | 28,718 | 851,202 |
|
| Ruth's Hospitality Group, Inc. | 85,064 | 1,050,540 |
|
| | | 8,666,716 |
|
| HOUSEHOLD DURABLES — 1.3% | | |
| CSS Industries, Inc. | 19,777 | 521,520 |
|
iRobot Corp.(1) | 55,993 | 2,292,913 |
|
Libbey, Inc.(1) | 32,368 | 862,284 |
|
Skullcandy, Inc.(1) | 42,989 | 311,670 |
|
Universal Electronics, Inc.(1) | 16,784 | 820,402 |
|
| | | 4,808,789 |
|
| HOUSEHOLD PRODUCTS — 0.1% | | |
| Orchids Paper Products Co. | 17,512 | 561,084 |
|
| INSURANCE — 3.7% | | |
| American Equity Investment Life Holding Co. | 46,781 | 1,150,813 |
|
| AMERISAFE, Inc. | 48,507 | 1,972,780 |
|
| Amtrust Financial Services, Inc. | 51,780 | 2,164,922 |
|
| Employers Holdings, Inc. | 9,869 | 209,025 |
|
| Infinity Property & Casualty Corp. | 14,569 | 979,474 |
|
| Maiden Holdings Ltd. | 170,489 | 2,061,212 |
|
| OneBeacon Insurance Group Ltd., Class A | 38,476 | 597,917 |
|
| Safety Insurance Group, Inc. | 2,839 | 145,868 |
|
| Selective Insurance Group, Inc. | 15,956 | 394,432 |
|
| Stewart Information Services Corp. | 38,911 | 1,206,630 |
|
| United Fire Group, Inc. | 35,798 | 1,049,597 |
|
| Universal Insurance Holdings, Inc. | 141,181 | 1,831,118 |
|
| | | 13,763,788 |
|
| INTERNET AND CATALOG RETAIL — 1.6% | | |
| HSN, Inc. | 38,362 | 2,272,565 |
|
Orbitz Worldwide, Inc.(1) | 227,750 | 2,026,975 |
|
Overstock.com, Inc.(1) | 53,151 | 838,191 |
|
| PetMed Express, Inc. | 62,888 | 847,730 |
|
| | | 5,985,461 |
|
|
| | | | |
| | Shares | Value |
| INTERNET SOFTWARE AND SERVICES — 1.5% | | |
comScore, Inc.(1) | 11,619 | $ | 412,242 |
|
Conversant, Inc.(1) | 89,619 | 2,276,323 |
|
CoStar Group, Inc.(1) | 4,982 | 788,003 |
|
support.com, Inc.(1) | 42,528 | 115,251 |
|
| United Online, Inc. | 14,008 | 145,683 |
|
Web.com Group, Inc.(1) | 32,055 | 925,428 |
|
XO Group, Inc.(1) | 60,895 | 744,137 |
|
| | | 5,407,067 |
|
| IT SERVICES — 1.8% | | |
| Convergys Corp. | 42,465 | 910,450 |
|
| CSG Systems International, Inc. | 29,639 | 773,874 |
|
Euronet Worldwide, Inc.(1) | 52,590 | 2,536,942 |
|
ExlService Holdings, Inc.(1) | 12,718 | 374,545 |
|
Lionbridge Technologies, Inc.(1) | 50,570 | 300,386 |
|
MoneyGram International, Inc.(1) | 106,351 | 1,566,550 |
|
PRGX Global, Inc.(1) | 19,427 | 124,138 |
|
Sapient Corp.(1) | 4,116 | 66,885 |
|
| | | 6,653,770 |
|
| LEISURE PRODUCTS — 1.0% | | |
| Arctic Cat, Inc. | 8,483 | 334,400 |
|
| Brunswick Corp. | 64,188 | 2,704,240 |
|
| Sturm Ruger & Co., Inc. | 9,911 | 584,848 |
|
| | | 3,623,488 |
|
| LIFE SCIENCES TOOLS AND SERVICES — 0.1% | | |
Charles River Laboratories International, Inc.(1) | 8,153 | 436,349 |
|
| MACHINERY — 5.8% | | |
| Actuant Corp., Class A | 57,098 | 1,973,878 |
|
| Altra Industrial Motion Corp. | 39,976 | 1,454,727 |
|
| Barnes Group, Inc. | 32,901 | 1,268,004 |
|
| CIRCOR International, Inc. | 24,244 | 1,869,940 |
|
| Douglas Dynamics, Inc. | 15,047 | 265,128 |
|
| Federal Signal Corp. | 49,416 | 723,944 |
|
Greenbrier Cos., Inc.(1) | 41,828 | 2,409,293 |
|
| Hillenbrand, Inc. | 19,701 | 642,647 |
|
| Hyster-Yale Materials Handling, Inc. | 20,693 | 1,832,158 |
|
| Kadant, Inc. | 10,696 | 411,261 |
|
Lydall, Inc.(1) | 43,814 | 1,199,189 |
|
| Mueller Water Products, Inc., Class A | 252,481 | 2,181,436 |
|
| NN, Inc. | 6,522 | 166,833 |
|
Rexnord Corp.(1) | 63,114 | 1,776,659 |
|
Wabash National Corp.(1) | 132,519 | 1,888,396 |
|
WABCO Holdings, Inc.(1) | 9,068 | 968,644 |
|
Xerium Technologies, Inc.(1) | 28,586 | 399,060 |
|
| | | 21,431,197 |
|
| MARINE — 0.6% | | |
| Matson, Inc. | 85,021 | 2,281,964 |
|
|
| | | | |
| | Shares | Value |
| MEDIA — 0.9% | | |
Cumulus Media, Inc., Class A(1) | 313,861 | $ | 2,068,344 |
|
Entercom Communications Corp., Class A(1) | 61,207 | 656,751 |
|
| Harte-Hanks, Inc. | 19,216 | 138,163 |
|
Journal Communications, Inc., Class A(1) | 34,255 | 303,842 |
|
ReachLocal, Inc.(1) | 7,361 | 51,748 |
|
| Scholastic Corp. | 5,152 | 175,632 |
|
| | | 3,394,480 |
|
| METALS AND MINING — 0.1% | | |
Handy & Harman Ltd.(1) | 2,280 | 61,036 |
|
| Olympic Steel, Inc. | 8,074 | 199,831 |
|
| | | 260,867 |
|
| MULTILINE RETAIL — 0.3% | | |
| Dillard's, Inc., Class A | 9,503 | 1,108,145 |
|
| OIL, GAS AND CONSUMABLE FUELS — 2.9% | | |
Abraxas Petroleum Corp.(1) | 211,307 | 1,322,782 |
|
| Alon USA Energy, Inc. | 50,396 | 626,926 |
|
Clayton Williams Energy, Inc.(1) | 2,010 | 276,114 |
|
| Comstock Resources, Inc. | 43,506 | 1,254,713 |
|
| Equal Energy Ltd. | 131,404 | 712,210 |
|
| Green Plains, Inc. | 71,118 | 2,337,649 |
|
| Panhandle Oil and Gas, Inc., Class A | 8,705 | 487,741 |
|
Renewable Energy Group, Inc.(1) | 64,719 | 742,327 |
|
REX American Resources Corp.(1) | 25,440 | 1,865,006 |
|
Warren Resources, Inc.(1) | 168,121 | 1,042,350 |
|
| | | 10,667,818 |
|
| PAPER AND FOREST PRODUCTS — 0.4% | | |
| Schweitzer-Mauduit International, Inc. | 35,759 | 1,561,238 |
|
| PERSONAL PRODUCTS — 1.0% | | |
Medifast, Inc.(1) | 61,598 | 1,873,195 |
|
USANA Health Sciences, Inc.(1) | 25,250 | 1,973,035 |
|
| | | 3,846,230 |
|
| PHARMACEUTICALS — 1.3% | | |
Lannett Co., Inc.(1) | 40,907 | 2,029,805 |
|
Nektar Therapeutics(1) | 114,101 | 1,462,775 |
|
| Pozen, Inc. | 19,538 | 162,752 |
|
| Questcor Pharmaceuticals, Inc. | 10,850 | 1,003,516 |
|
| | | 4,658,848 |
|
| PROFESSIONAL SERVICES — 2.4% | | |
| Barrett Business Services, Inc. | 8,857 | 416,279 |
|
Huron Consulting Group, Inc.(1) | 35,718 | 2,529,549 |
|
ICF International, Inc.(1) | 4,654 | 164,565 |
|
Korn/Ferry International(1) | 58,785 | 1,726,515 |
|
Navigant Consulting, Inc.(1) | 100,499 | 1,753,708 |
|
RPX Corp.(1) | 119,527 | 2,121,604 |
|
| VSE Corp. | 1,290 | 90,713 |
|
| | | 8,802,933 |
|
|
| | | | |
| | Shares | Value |
| REAL ESTATE INVESTMENT TRUSTS (REITs) — 6.0% | | |
| Alexander's, Inc. | 280 | $ | 103,452 |
|
| Apollo Commercial Real Estate Finance, Inc. | 3,551 | 58,556 |
|
| Ashford Hospitality Trust, Inc. | 152,223 | 1,756,653 |
|
| Capstead Mortgage Corp. | 11,075 | 145,636 |
|
| CyrusOne, Inc. | 16,990 | 423,051 |
|
| CYS Investments, Inc. | 47,729 | 430,516 |
|
| DuPont Fabros Technology, Inc. | 28,190 | 760,002 |
|
| Dynex Capital, Inc. | 9,542 | 84,447 |
|
| FelCor Lodging Trust, Inc. | 206,256 | 2,167,751 |
|
| LTC Properties, Inc. | 59,201 | 2,311,207 |
|
| New Residential Investment Corp. | 43,640 | 274,932 |
|
| NorthStar Realty Finance Corp. | 66,581 | 1,157,178 |
|
| Potlatch Corp. | 57,386 | 2,375,780 |
|
| PS Business Parks, Inc. | 27,164 | 2,267,922 |
|
| Resource Capital Corp. | 50,758 | 285,767 |
|
| RLJ Lodging Trust | 101,043 | 2,919,132 |
|
| Saul Centers, Inc. | 3,896 | 189,346 |
|
Strategic Hotels & Resorts, Inc.(1) | 223,104 | 2,612,548 |
|
| Sunstone Hotel Investors, Inc. | 134,318 | 2,005,368 |
|
| | | 22,329,244 |
|
| ROAD AND RAIL — 0.7% | | |
| ArcBest Corp. | 53,988 | 2,349,018 |
|
Quality Distribution, Inc.(1) | 14,962 | 222,335 |
|
| | | 2,571,353 |
|
| SEMICONDUCTORS AND SEMICONDUCTOR EQUIPMENT — 6.1% | | |
Advanced Energy Industries, Inc.(1) | 58,656 | 1,129,128 |
|
Applied Micro Circuits Corp.(1) | 203,612 | 2,201,046 |
|
Cabot Microelectronics Corp.(1) | 19,507 | 870,988 |
|
Cirrus Logic, Inc.(1) | 74,671 | 1,698,018 |
|
Diodes, Inc.(1) | 10,832 | 313,695 |
|
First Solar, Inc.(1) | 27,618 | 1,962,535 |
|
International Rectifier Corp.(1) | 88,706 | 2,474,897 |
|
MaxLinear, Inc., Class A(1) | 137,114 | 1,380,738 |
|
OmniVision Technologies, Inc.(1) | 47,890 | 1,052,622 |
|
PLX Technology, Inc.(1) | 23,238 | 150,350 |
|
| Power Integrations, Inc. | 28,914 | 1,663,712 |
|
Rambus, Inc.(1) | 76,340 | 1,091,662 |
|
Semtech Corp.(1) | 66,590 | 1,741,328 |
|
Sigma Designs, Inc.(1) | 85,043 | 389,497 |
|
Synaptics, Inc.(1) | 31,878 | 2,889,422 |
|
TriQuint Semiconductor, Inc.(1) | 34,900 | 551,769 |
|
Ultra Clean Holdings, Inc.(1) | 125,984 | 1,140,155 |
|
| | | 22,701,562 |
|
| SOFTWARE — 5.3% | | |
Aspen Technology, Inc.(1) | 14,889 | 690,850 |
|
Cadence Design Systems, Inc.(1) | 33,582 | 587,349 |
|
|
| | | | |
| | Shares | Value |
Callidus Software, Inc.(1) | 108,400 | $ | 1,294,296 |
|
Manhattan Associates, Inc.(1) | 71,484 | 2,461,194 |
|
| Mentor Graphics Corp. | 110,372 | 2,380,724 |
|
NetScout Systems, Inc.(1) | 52,494 | 2,327,584 |
|
| Pegasystems, Inc. | 59,013 | 1,246,355 |
|
PTC, Inc.(1) | 57,949 | 2,248,421 |
|
SS&C Technologies Holdings, Inc.(1) | 32,402 | 1,432,816 |
|
Take-Two Interactive Software, Inc.(1) | 114,563 | 2,547,881 |
|
TeleNav, Inc.(1) | 41,942 | 238,650 |
|
Verint Systems, Inc.(1) | 48,221 | 2,365,240 |
|
| | | 19,821,360 |
|
| SPECIALTY RETAIL — 2.7% | | |
Barnes & Noble, Inc.(1) | 103,500 | 2,358,765 |
|
| Brown Shoe Co., Inc. | 82,903 | 2,371,855 |
|
| Buckle, Inc. (The) | 31,594 | 1,401,510 |
|
| Children's Place, Inc. (The) | 39,059 | 1,938,498 |
|
| GameStop Corp., Class A | 26,205 | 1,060,516 |
|
| Haverty Furniture Cos., Inc. | 18,789 | 472,168 |
|
Kirkland's, Inc.(1) | 13,887 | 257,604 |
|
| | | 9,860,916 |
|
| TEXTILES, APPAREL AND LUXURY GOODS — 1.7% | | |
| Culp, Inc. | 22,134 | 385,353 |
|
Iconix Brand Group, Inc.(1) | 52,041 | 2,234,641 |
|
Steven Madden Ltd.(1) | 69,250 | 2,375,275 |
|
Unifi, Inc.(1) | 45,714 | 1,258,506 |
|
| | | 6,253,775 |
|
| THRIFTS AND MORTGAGE FINANCE — 1.0% | | |
| EverBank Financial Corp. | 111,091 | 2,239,595 |
|
Ocwen Financial Corp.(1) | 23,872 | 885,651 |
|
Tree.com, Inc.(1) | 5,152 | 150,129 |
|
Walker & Dunlop, Inc.(1) | 22,935 | 323,613 |
|
| | | 3,598,988 |
|
| TRADING COMPANIES AND DISTRIBUTORS — 0.1% | | |
| Aceto Corp. | 29,348 | 532,373 |
|
| WIRELESS TELECOMMUNICATION SERVICES — 0.2% | | |
| USA Mobility, Inc. | 51,791 | 797,581 |
|
TOTAL COMMON STOCKS (Cost $307,139,869) | | 371,805,073 |
|
| TEMPORARY CASH INVESTMENTS — 0.4% | | |
| Repurchase Agreement, Bank of America Merrill Lynch, (collateralized by various U.S. Treasury obligations, 0.75% - 0.875%, 1/31/18 - 2/28/18, valued at $307,836), in a joint trading account at 0.05%, dated 6/30/14, due 7/1/14 (Delivery value $301,641) | | 301,641 |
|
| Repurchase Agreement, Credit Suisse First Boston, Inc., (collateralized by various U.S. Treasury obligations, 1.75%, 5/15/23, valued at $123,174), in a joint trading account at 0.01%, dated 6/30/14, due 7/1/14 (Delivery value $120,656) | | 120,656 |
|
|
| | | | |
| | Shares | Value |
| Repurchase Agreement, Goldman Sachs & Co., (collateralized by various U.S. Treasury obligations, 3.125%, 11/15/41, valued at $246,167), in a joint trading account at 0.03%, dated 6/30/14, due 7/1/14 (Delivery value $241,313) | | $ | 241,313 |
|
| SSgA U.S. Government Money Market Fund, Class N | 713,187 | 713,187 |
|
TOTAL TEMPORARY CASH INVESTMENTS (Cost $1,376,797) | | 1,376,797 |
|
TOTAL INVESTMENT SECURITIES — 100.6% (Cost $308,516,666) | | 373,181,870 |
|
| OTHER ASSETS AND LIABILITIES — (0.6)% | | (2,051,885) |
|
| TOTAL NET ASSETS — 100.0% | | $ | 371,129,985 |
|
|
|
| NOTES TO SCHEDULE OF INVESTMENTS |
(1) Non-income producing.
See Notes to Financial Statements.
|
|
| Statement of Assets and Liabilities |
|
| | | |
| JUNE 30, 2014 | |
| Assets | |
| Investment securities, at value (cost of $308,516,666) | $ | 373,181,870 |
|
| Dividends and interest receivable | 268,256 |
|
| | 373,450,126 |
|
| | |
| Liabilities | |
| Payable for capital shares redeemed | 2,119,370 |
|
| Accrued management fees | 200,771 |
|
| | 2,320,141 |
|
| | |
| Net Assets | $ | 371,129,985 |
|
| | |
| Institutional Class Capital Shares, $0.01 Par Value | |
| Shares authorized | 135,000,000 |
|
| Shares outstanding | 33,733,821 |
|
| | |
| Net Asset Value Per Share | $ | 11.00 |
|
| | |
| Net Assets Consist of: | |
| Capital (par value and paid-in surplus) | $ | 276,763,183 |
|
| Undistributed net investment income | 285,892 |
|
| Undistributed net realized gain | 29,415,706 |
|
| Net unrealized appreciation | 64,665,204 |
|
| | $ | 371,129,985 |
|
See Notes to Financial Statements.
|
| | | |
| YEAR ENDED JUNE 30, 2014 | |
| Investment Income (Loss) | |
| Income: | |
| Dividends (net of foreign taxes withheld of $5,815) | $ | 3,287,176 |
|
| Interest | 580 |
|
| | 3,287,756 |
|
| | |
| Expenses: | |
| Management fees | 2,084,033 |
|
| Directors' fees and expenses | 18,715 |
|
| Other expenses | 278 |
|
| | 2,103,026 |
|
| | |
| Net investment income (loss) | 1,184,730 |
|
| | |
| Realized and Unrealized Gain (Loss) | |
| Net realized gain (loss) on: | |
| Investment transactions | 47,604,401 |
|
| Futures contract transactions | (5,532 | ) |
| | 47,598,869 |
|
| | |
| Change in net unrealized appreciation (depreciation) on investments | 24,119,734 |
|
| | |
| Net realized and unrealized gain (loss) | 71,718,603 |
|
| | |
| Net Increase (Decrease) in Net Assets Resulting from Operations | $ | 72,903,333 |
|
See Notes to Financial Statements.
|
|
| Statement of Changes in Net Assets |
|
| | | | | | |
| YEARS ENDED JUNE 30, 2014 AND JUNE 30, 2013 | | |
| Increase (Decrease) in Net Assets | June 30, 2014 | June 30, 2013 |
| Operations | | |
| Net investment income (loss) | $ | 1,184,730 |
| $ | 2,354,665 |
|
| Net realized gain (loss) | 47,598,869 |
| 23,434,667 |
|
| Change in net unrealized appreciation (depreciation) | 24,119,734 |
| 26,674,960 |
|
| Net increase (decrease) in net assets resulting from operations | 72,903,333 |
| 52,464,292 |
|
| | | |
| Distributions to Shareholders | | |
| From net investment income | (1,227,746 | ) | (2,238,453 | ) |
| From net realized gains | (36,394,986 | ) | (9,263,359 | ) |
| Decrease in net assets from distributions | (37,622,732 | ) | (11,501,812 | ) |
| | | |
| Capital Share Transactions | | |
| Proceeds from shares sold | 70,430,340 |
| 57,254,934 |
|
| Proceeds from reinvestment of distributions | 37,622,732 |
| 11,501,812 |
|
| Payments for shares redeemed | (28,068,774 | ) | (31,289,776 | ) |
| Net increase (decrease) in net assets from capital share transactions | 79,984,298 |
| 37,466,970 |
|
| | | |
| Net increase (decrease) in net assets | 115,264,899 |
| 78,429,450 |
|
| | | |
| Net Assets | | |
| Beginning of period | 255,865,086 |
| 177,435,636 |
|
| End of period | $ | 371,129,985 |
| $ | 255,865,086 |
|
| | | |
| Undistributed net investment income | $ | 285,892 |
| $ | 350,228 |
|
| | | |
| Transactions in Shares of the Fund | | |
| Sold | 6,688,254 |
| 6,635,354 |
|
| Issued in reinvestment of distributions | 3,712,263 |
| 1,391,954 |
|
| Redeemed | (2,550,471 | ) | (3,604,188 | ) |
| Net increase (decrease) in shares of the fund | 7,850,046 |
| 4,423,120 |
|
See Notes to Financial Statements.
|
|
| Notes to Financial Statements |
JUNE 30, 2014
1. Organization
American Century Quantitative Equity Funds, Inc. (the corporation) is registered under the Investment Company Act of 1940, as amended (the 1940 Act), as an open-end management investment company and is organized as a Maryland corporation. NT Small Company Fund (the fund) is one fund in a series issued by the corporation. The fund is diversified as defined under the 1940 Act. The fund’s investment objective is to seek long-term capital growth. The fund is not permitted to invest in securities issued by companies assigned the Global Industry Classification Standard for the tobacco industry.
2. Significant Accounting Policies
The following is a summary of significant accounting policies consistently followed by the fund in preparation of its financial statements. The financial statements are prepared in conformity with accounting principles generally accepted in the United States of America, which may require management to make certain estimates and assumptions at the date of the financial statements. Actual results could differ from these estimates. Management evaluated the impact of events or transactions occurring through the date the financial statements were issued that would merit recognition or disclosure.
Investment Valuations — The fund determines the fair value of its investments and computes its net asset value per share at the close of regular trading (usually 4 p.m. Eastern time) on the New York Stock Exchange (NYSE) on each day the NYSE is open. The Board of Directors has adopted valuation policies and procedures to guide the investment advisor in the fund’s investment valuation process and to provide methodologies for the oversight of the fund’s pricing function.
Equity securities that are listed or traded on a domestic securities exchange are valued at the last reported sales price or at the official closing price as provided by the exchange. Equity securities traded on foreign securities exchanges are generally valued at the closing price of such securities on the exchange where primarily traded or at the close of the NYSE, if that is earlier. If no last sales price is reported, or if local convention or regulation so provides, the mean of the latest bid and asked prices may be used. Securities traded over-the-counter are valued at the mean of the latest bid and asked prices, the last sales price, or the official closing price.
Fixed income securities maturing within 60 days at the time of purchase may be valued at cost, plus or minus any amortized discount or premium or at the evaluated mean as provided by an independent pricing service. Evaluated mean prices are commonly derived through utilization of market models, which may consider, among other factors: trade data, quotations from dealers and active market makers, relevant yield curve and spread data, related sector levels, creditworthiness, trade data or market information on comparable securities, and other relevant security specific information.
Open-end management investment companies are valued at the reported net asset value per share. Repurchase agreements are valued at cost, which approximates fair value. Exchange-traded futures contracts are valued at the settlement price as provided by the appropriate clearing corporation.
If the fund determines that the market price for an investment is not readily available or the valuation methods mentioned above do not reflect an investment’s fair value, such investment is valued as determined in good faith by the Board of Directors or its delegate, in accordance with policies and procedures adopted by the Board of Directors. In its determination of fair value, the fund may review several factors including, but not limited to, market information regarding the specific investment or comparable investments and correlation with other investment types, futures indices or general market indicators. Circumstances that may cause the fund to use these procedures to value an investment include, but are not limited to: an investment has been declared in default or is distressed; trading in a security has been suspended during the trading day or a security is not actively trading on its principal exchange; prices received from a regular pricing source are deemed unreliable; or there is a foreign market holiday and no trading occurred.
The fund monitors for significant events occurring after the close of an investment’s primary exchange but before the fund’s net asset value per share is determined. Significant events may include, but are not limited to: corporate announcements and transactions; governmental action and political unrest that could impact a
specific investment or an investment sector; or armed conflicts, natural disasters and similar events that could affect investments in a specific country or region. The fund also monitors for significant fluctuations between domestic and foreign markets, as evidenced by the U.S. market or such other indicators that the Board of Directors, or its delegate, deems appropriate. If significant fluctuations in foreign markets are identified, the fund may apply a model-derived factor to the closing price of equity securities traded on foreign securities exchanges. The factor is based on observable market data as provided by an independent pricing service.
Security Transactions — Security transactions are accounted for as of the trade date. Net realized gains and losses are determined on the identified cost basis, which is also used for federal income tax purposes.
Investment Income — Dividend income less foreign taxes withheld, if any, is recorded as of the ex-dividend date. Distributions received on securities that represent a return of capital or long-term capital gain are recorded as a reduction of cost of investments and/or as a realized gain. The fund may estimate the components of distributions received that may be considered nontaxable distributions or long-term capital gain distributions for income tax purposes. Interest income is recorded on the accrual basis and includes accretion of discounts and amortization of premiums.
Repurchase Agreements — The fund may enter into repurchase agreements with institutions that American Century Investment Management, Inc. (ACIM) (the investment advisor) has determined are creditworthy pursuant to criteria adopted by the Board of Directors. The fund requires that the collateral, represented by securities, received in a repurchase transaction be transferred to the custodian in a manner sufficient to enable the fund to obtain those securities in the event of a default under the repurchase agreement. ACIM monitors, on a daily basis, the securities transferred to ensure the value, including accrued interest, of the securities under each repurchase agreement is equal to or greater than amounts owed to the fund under each repurchase agreement.
Joint Trading Account — Pursuant to an Exemptive Order issued by the Securities and Exchange Commission, the fund, along with certain other funds in the American Century Investments family of funds, may transfer uninvested cash balances into a joint trading account. These balances are invested in one or more repurchase agreements that are collateralized by U.S. Treasury or Agency obligations.
Segregated Assets — In accordance with the 1940 Act, the fund segregates assets on its books and records to cover futures contracts. ACIM monitors, on a daily basis, the securities segregated to ensure the fund designates a sufficient amount of liquid assets, marked-to-market daily. The fund may also receive assets or be required to pledge assets at the custodian bank or with a broker for margin requirements on futures contracts.
Income Tax Status — It is the fund’s policy to distribute substantially all net investment income and net realized gains to shareholders and to otherwise qualify as a regulated investment company under provisions of the Internal Revenue Code. Accordingly, no provision has been made for income taxes. The fund files U.S. federal, state, local and non-U.S. tax returns as applicable. The fund's tax returns are subject to examination by the relevant taxing authority until expiration of the applicable statute of limitations, which is generally three years from the date of filing but can be longer in certain jurisdictions. At this time, management believes there are no uncertain tax positions which, based on their technical merit, would not be sustained upon examination and for which it is reasonably possible that the total amounts of unrecognized tax benefits will significantly change in the next twelve months.
Distributions to Shareholders — Distributions from net investment income, if any, are generally declared and paid quarterly. Distributions from net realized gains, if any, are generally declared and paid annually.
Indemnifications — Under the corporation’s organizational documents, its officers and directors are indemnified against certain liabilities arising out of the performance of their duties to the fund. In addition, in the normal course of business, the fund enters into contracts that provide general indemnifications. The maximum exposure under these arrangements is unknown as this would involve future claims that may be made against a fund. The risk of material loss from such claims is considered by management to be remote.
3. Fees and Transactions with Related Parties
Certain officers and directors of the corporation are also officers and/or directors of American Century Companies, Inc. (ACC). The corporation’s investment advisor, ACIM, the corporation's distributor, American Century Investment Services, Inc., and the corporation’s transfer agent, American Century Services, LLC, are wholly owned, directly or indirectly, by ACC. Various funds issued by American Century Asset Allocation
Portfolios, Inc. own, in aggregate, 100% of the shares of the fund. Related parties do not invest in the fund for the purpose of exercising management or control.
Management Fees — The corporation has entered into a management agreement with ACIM, under which ACIM provides the fund with investment advisory and management services in exchange for a single, unified management fee (the fee). The agreement provides that all expenses of managing and operating the fund, except distribution and service fees, brokerage expenses, taxes, interest, fees and expenses of the independent directors (including legal counsel fees), and extraordinary expenses, will be paid by ACIM. The fee is computed and accrued daily based on the daily net assets of the fund and paid monthly in arrears. The fee consists of (1) an Investment Category Fee based on the daily net assets of the fund and certain other accounts managed by the investment advisor that are in the same broad investment category as the fund and (2) a Complex Fee based on the assets of all the funds in the American Century Investments family of funds. The rates for the Investment Category Fee range from 0.5380% to 0.7200%. The rates for the Complex Fee range from 0.0500% to 0.1100%. The effective annual management fee for the year ended June 30, 2014 was 0.67%.
Directors' Fees and Expenses — The Board of Directors is responsible for overseeing the investment advisor’s management and operations of the fund. The directors receive detailed information about the fund and its investment advisor regularly throughout the year, and meet at least quarterly with management of the investment advisor to review reports about fund operations. Fees and expenses incurred in conjunction with the directors during the year ended June 30, 2014 are detailed in the Statement of Operations. The fund’s officers do not receive compensation from the fund.
4. Investment Transactions
Purchases and sales of investment securities, excluding short-term investments, for the year ended June 30, 2014 were $341,894,054 and $296,391,685, respectively.
5. Fair Value Measurements
The fund’s investments valuation process is based on several considerations and may use multiple inputs to determine the fair value of the investments held by the fund. In conformity with accounting principles generally accepted in the United States of America, the inputs used to determine a valuation are classified into three broad levels.
| |
| • | Level 1 valuation inputs consist of unadjusted quoted prices in an active market for identical investments. |
| |
| • | Level 2 valuation inputs consist of direct or indirect observable market data (including quoted prices for comparable investments, evaluations of subsequent market events, interest rates, prepayment speeds, credit risk, etc.). These inputs also consist of quoted prices for identical investments initially expressed in local currencies that are adjusted through translation into U.S. dollars. |
| |
| • | Level 3 valuation inputs consist of unobservable data (including a fund’s own assumptions). |
The level classification is based on the lowest level input that is significant to the fair valuation measurement. The valuation inputs are not necessarily an indication of the risks associated with investing in these securities or other financial instruments.
The following is a summary of the level classifications as of period end. The Schedule of Investments provides additional information on the fund’s portfolio holdings.
|
| | | | | | | | |
| | Level 1 | Level 2 | Level 3 |
| Assets | | | |
| Investment Securities | | | |
| Common Stocks | $ | 371,805,073 |
| — |
| — |
|
| Temporary Cash Investments | 713,187 |
| $ | 663,610 |
| — |
|
| | $ | 372,518,260 |
| $ | 663,610 |
| — |
|
6. Derivative Instruments
Equity Price Risk — The fund is subject to equity price risk in the normal course of pursuing its investment objectives. A fund may enter into futures contracts based on an equity index in order to manage its exposure to changes in market conditions. A fund may purchase futures contracts to gain exposure to increases in market value or sell futures contracts to protect against a decline in market value. Upon entering into a futures contract, a fund is required to deposit either cash or securities in an amount equal to a certain percentage of the contract value (initial margin). Subsequent payments (variation margin) are made or received daily, in cash, by a fund. The variation margin is equal to the daily change in the contract value and is recorded as unrealized gains and losses. A fund recognizes a realized gain or loss when the contract is closed or expires. Net realized and unrealized gains or losses occurring during the holding period of futures contracts are a component of net realized gain (loss) on futures contract transactions and change in net unrealized appreciation (depreciation) on futures contracts, respectively. One of the risks of entering into futures contracts is the possibility that the change in value of the contract may not correlate with the changes in value of the underlying securities. During the period, the fund infrequently purchased equity price risk derivative instruments for temporary investment purposes.
At period end, the fund did not have any derivative instruments disclosed on the Statement of Assets and Liabilities. For the year ended June 30, 2014, the effect of equity price risk derivative instruments on the Statement of Operations was $(5,532) in net realized gain (loss) on futures contract transactions.
7. Risk Factors
The fund concentrates its investments in common stocks of small companies. Because of this, the fund may be subject to greater risk and market fluctuations than a fund investing in larger, more established companies.
8. Federal Tax Information
The tax character of distributions paid during the years ended June 30, 2014 and June 30, 2013 were as follows:
|
| | | | | | |
| | 2014 | 2013 |
| Distributions Paid From | | |
| Ordinary income | $ | 15,807,585 |
| $ | 2,238,453 |
|
| Long-term capital gains | $ | 21,815,147 |
| $ | 9,263,359 |
|
The book-basis character of distributions made during the year from net investment income or net realized gains may differ from their ultimate characterization for federal income tax purposes. These differences reflect the differing character of certain income items and net realized gains and losses for financial statement and tax purposes, and may result in reclassification among certain capital accounts on the financial statements.
As of June 30, 2014, the federal tax cost of investments and the components of distributable earnings on a tax-basis were as follows:
|
| | | |
| Federal tax cost of investments | $ | 309,862,125 |
|
| Gross tax appreciation of investments | $ | 69,122,483 |
|
| Gross tax depreciation of investments | (5,802,738 | ) |
| Net tax appreciation (depreciation) of investments | $ | 63,319,745 |
|
| Undistributed ordinary income | $ | 9,425,156 |
|
Accumulated long-term gains
| $ | 21,621,901 |
|
| | |
The difference between book-basis and tax-basis unrealized appreciation (depreciation) is attributable primarily to the tax deferral of losses on wash sales.
|
| | | | | | | | | | | | | | | |
| For a Share Outstanding Throughout the Years Ended June 30 (except as noted) | | | |
| Per-Share Data | | | | | | | Ratios and Supplemental Data | |
| | | Income From Investment Operations: | Distributions From: | | | Ratio to Average Net Assets of: | | |
| | Net Asset Value, Beginning of Period | Net Investment Income (Loss)(1) | Net Realized and Unrealized Gain (Loss) | Total From Investment Operations | Net Investment Income | Net Realized Gains | Total Distributions | Net Asset Value, End of Period | Total Return(2) | Operating Expenses | Net Investment Income (Loss) | Portfolio Turnover Rate | Net Assets, End of Period (in thousands) |
| Institutional Class | | | | | | | | | | |
| 2014 | $9.89 | 0.04 | 2.48 | 2.52 | (0.04) | (1.37) | (1.41) | $11.00 | 26.77% | 0.67% | 0.38% | 96% |
| $371,130 |
|
| 2013 | $8.27 | 0.10 | 2.03 | 2.13 | (0.10) | (0.41) | (0.51) | $9.89 | 26.98% | 0.68% | 1.12% | 106% |
| $255,865 |
|
| 2012 | $9.17 | 0.06 | (0.23) | (0.17) | (0.03) | (0.70) | (0.73) | $8.27 | (0.98)% | 0.68% | 0.67% | 86% |
| $177,436 |
|
| 2011 | $6.76 | 0.03 | 2.42 | 2.45 | (0.04) | — | (0.04) | $9.17 | 36.29% | 0.69% | 0.38% | 93% |
| $131,572 |
|
| 2010 | $5.50 | 0.02 | 1.27 | 1.29 | (0.03) | — | (0.03) | $6.76 | 23.50% | 0.69% | 0.34% | 78% |
| $76,433 |
|
|
|
| Notes to Financial Highlights |
| |
| (1) | Computed using average shares outstanding throughout the period. |
| |
| (2) | Total returns are calculated based on the net asset value of the last business day. Total returns for periods less than one year are not annualized. |
See Notes to Financial Statements.
|
|
| Report of Independent Registered Public Accounting Firm |
To the Directors of the American Century Quantitative Equity Funds, Inc. and Shareholders of the NT Small Company Fund:
In our opinion, the accompanying statement of assets and liabilities, including the schedule of investments, and the related statements of operations, of changes in net assets and the financial highlights present fairly, in all material respects, the financial position of the NT Small Company Fund (one of the fifteen funds comprising the American Century Quantitative Equity Funds, Inc., hereafter referred to as the “Fund”) at June 30, 2014, the results of its operations for the year then ended, the changes in its net assets for each of the two years in the period then ended and the financial highlights for each of the five years in the period then ended, in conformity with accounting principles generally accepted in the United States of America. These financial statements and financial highlights (hereafter referred to as "financial statements") are the responsibility of the Fund's management. Our responsibility is to express an opinion on these financial statements based on our audits. We conducted our audits of these financial statements in accordance with the standards of the Public Company Accounting Oversight Board (United States). Those standards require that we plan and perform the audit to obtain reasonable assurance about whether the financial statements are free of material misstatement. An audit includes examining, on a test basis, evidence supporting the amounts and disclosures in the financial statements, assessing the accounting principles used and significant estimates made by management, and evaluating the overall financial statement presentation. We believe that our audits, which included confirmation of securities at June 30, 2014 by correspondence with the custodian and brokers, provide a reasonable basis for our opinion.
PricewaterhouseCoopers LLP
Kansas City, Missouri
August 21, 2014
Board of Directors
The individuals listed below serve as directors of the funds. Each director will continue to serve in this capacity until death, retirement, resignation or removal from office. The board has adopted a mandatory retirement age for directors who are not “interested persons,” as that term is defined in the Investment Company Act (independent directors). Independent directors shall retire on December 31 of the year in which they reach their 75th birthday; provided, however, that on or after January 1, 2022, independent directors shall retire on December 31 of the year in which they reach their 76th birthday.
Mr. Thomas is an “interested person” because he currently serves as President and Chief Executive Officer of American Century Companies, Inc. (ACC), the parent company of American Century Investment Management, Inc. (ACIM or the advisor). The other directors (more than three-fourths of the total number) are independent. They are not employees, directors or officers of, and have no financial interest in, ACC or any of its wholly owned, direct or indirect, subsidiaries, including ACIM, American Century Investment Services, Inc. (ACIS) and American Century Services, LLC (ACS), and do not have any other affiliations, positions or relationships that would cause them to be considered “interested persons” under the Investment Company Act. The directors serve in this capacity for eight (in the case of Mr. Thomas, 15) registered investment companies in the American Century Investments family of funds.
The following table presents additional information about the directors. The mailing address for each director other than Mr. Thomas is 1665 Charleston Road, Mountain View, California 94043. The mailing address for Mr. Thomas is 4500 Main Street, Kansas City, Missouri 64111.
|
| | | | | |
Name (Year of Birth) | Position(s) Held with Funds | Length of Time Served | Principal Occupation(s) During Past 5 Years | Number of
American
Century
Portfolios
Overseen
by Director | Other Directorships Held During Past 5 Years |
| Independent Directors |
Tanya S. Beder (1955) | Director | Since 2011 | Chairman, SBCC Group Inc. (independent advisory services) (2006 to present) | 42 | CYS Investments, Inc. (specialty finance company) |
Jeremy I. Bulow (1954) | Director | Since 2011 | Professor of Economics, Stanford University, Graduate School of Business (1979 to present) | 42 | None |
Ronald J. Gilson (1946) | Director and Chairman of the Board | Since 1995 (Chairman since 2005) | Charles J. Meyers Professor of Law and Business, Stanford Law School (1979 to present); Marc and Eva Stern Professor of Law and Business, Columbia University School of Law (1992 to present) | 42 | None |
|
| | | | | |
Name (Year of Birth) | Position(s) Held with Funds | Length of Time Served | Principal Occupation(s) During Past 5 Years | Number of
American
Century
Portfolios
Overseen
by Director | Other Directorships Held During Past 5 Years |
| Independent Directors |
Frederick L. A. Grauer (1946) | Director | Since 2008 | Senior Advisor, BlackRock, Inc. (investment management firm) (2010 to 2011); Senior Advisor, Barclays Global Investors (investment management firm) (2003 to 2009) | 42 | None |
Peter F. Pervere
(1947) | Director | Since 2007 | Retired | 42 | Intraware, Inc. (2003 to 2009) |
Myron S. Scholes(1) (1941) | Director | Since 1980 | Chairman, Platinum Grove Asset Management, L.P. (asset manager) (1999 to 2009); Frank E. Buck Professor of Finance-Emeritus, Stanford Graduate School of Business (1996 to present) | 42 | Dimensional Fund Advisors (investment advisor); CME Group, Inc. (futures and options exchange) |
John B. Shoven
(1947) | Director | Since 2002 | Professor of Economics, Stanford University (1973 to present) | 42 | Cadence Design Systems; Exponent; Financial Engines |
| Interested Director |
Jonathan S. Thomas
(1963) | Director and
President | Since 2007 | President and Chief Executive Officer, ACC (March 2007 to present). Also serves as Chief Executive Officer and Manager, ACS; Executive Vice President, ACIM; Director, ACC, ACIM and other ACC subsidiaries | 115 | None |
(1) Myron S. Scholes resigned as director effective July 31, 2014.
Officers
The following table presents certain information about the executive officers of the funds. Each officer serves as an officer for each of the 15 investment companies in the American Century family of funds, unless otherwise noted. No officer is compensated for his or her service as an officer of the funds. The listed officers are interested persons of the funds and are appointed or re-appointed on an annual basis. The mailing address for each of the officers listed below is 4500 Main Street, Kansas City, Missouri 64111.
|
| | |
Name (Year of Birth) | Offices with the Funds | Principal Occupation(s) During the Past Five Years |
Jonathan S. Thomas (1963) | Director and President since 2007 | President and Chief Executive Officer, ACC (March 2007 to present). Also serves as Chief Executive Officer and Manager, ACS; Executive Vice President, ACIM; Director, ACC, ACIM and other ACC subsidiaries |
| Amy D. Shelton (1964) | Chief Compliance Officer since 2014 | Chief Compliance Officer, American Century funds, (March 2014 to present); Chief Compliance Officer, ACIM (February 2014 to present); Chief Compliance Officer, ACIS (October 2009 to present); Vice President, Client Interactions and Marketing, ACIS (February 2013 to January 2014); Director, Client Interactions and Marketing, ACIS (June 2007 to January 2013). Also serves as Vice President, ACIS |
Charles A. Etherington (1957) | General Counsel since 2007 and Senior Vice President since 2006 | Attorney, ACC (February 1994 to present); Vice President, ACC (November 2005 to present); General Counsel, ACC (March 2007 to present). Also serves as General Counsel, ACIM, ACS, ACIS and other ACC subsidiaries; and Senior Vice President, ACIM and ACS |
C. Jean Wade (1964) | Vice President, Treasurer and Chief Financial Officer since 2012 | Vice President, ACS (February 2000 to present) |
Robert J. Leach (1966) | Vice President since 2006 and Assistant Treasurer since 2012 | Vice President, ACS (February 2000 to present) |
David H. Reinmiller (1963) | Vice President since 2001 | Attorney, ACC (January 1994 to present); Associate General Counsel, ACC (January 2001 to present). Also serves as Vice President, ACIM and ACS |
Ward D. Stauffer (1960) | Secretary since 2005 | Attorney, ACC (June 2003 to present) |
The Statement of Additional Information has additional information about the fund’s directors and is available without charge, upon request, by calling 1-800-345-2021.
|
|
| Approval of Management Agreement |
At a meeting held on June 13, 2014, the Fund’s Board of Directors/Trustees unanimously approved the renewal of the management agreement pursuant to which American Century Investment Management, Inc. (the “Advisor”) acts as the investment advisor for the Fund. Under Section 15(c) of the Investment Company Act, contracts for investment advisory services are required to be reviewed, evaluated, and approved by a majority of a fund’s directors/trustees (the “Directors”), including a majority of the independent Directors, each year. The Board regards this annual evaluation and renewal as one of its most important responsibilities.
The independent Directors have memorialized a statement regarding the relationship between their ongoing obligations to oversee and evaluate the performance of the Advisor and their annual consideration of renewal of the management agreement. In that statement, the independent Directors noted that their assessment of the Advisor’s performance is an ongoing process that takes place over the entire year and is informed by all of the extensive information that the Board and its committees receive and consider over time. This information, together with the materials provided in connection with the review, are central to the Board’s assessment of the Advisor’s performance and its determination whether to renew the Fund’s management agreement.
Prior to its consideration of the renewal of the management agreement, the Board requested and reviewed extensive data and analysis relating to the proposed renewal. This information and analysis was compiled by the Advisor and certain independent providers of evaluation data concerning the Fund and the services provided to the Fund by the Advisor.
In connection with its consideration of the renewal of the management agreement, the Board’s review and evaluation of the services provided by the Advisor included, but was not limited to, the following:
| |
| • | the nature, extent, and quality of investment management, shareholder services, and other services provided by the Advisor to the Fund; |
| |
| • | the wide range of other programs and services the Advisor provides to the Fund and its shareholders on a routine and non-routine basis; |
| |
| • | the investment performance of the Fund, including data comparing the Fund’s performance to appropriate benchmarks and/or a peer group of other mutual funds with similar investment objectives and strategies; |
| |
| • | the cost of owning the Fund compared to the cost of owning similar funds; |
| |
| • | the Advisor’s compliance policies, procedures, and regulatory experience; |
| |
| • | financial data showing the cost of services provided to the Fund, the profitability of the Fund to the Advisor, and the overall profitability of the Advisor; |
| |
| • | possible economies of scale associated with the Advisor’s management of the Fund and other accounts under its management; |
| |
| • | data comparing services provided and charges to other investment management clients of the Advisor; and |
| |
| • | any collateral benefits derived by the Advisor from the management of the Fund. |
In keeping with its practice, the Board held two in-person meetings to review and discuss the information provided. The independent Directors also had the benefit of the advice of their independent counsel throughout the process.
Factors Considered
The Directors considered all of the information provided by the Advisor, the independent data providers, and the independent Directors’ independent counsel in connection with the review, and evaluated such information for the Fund. In connection with their review, the Directors did not identify any single factor as being all-important or controlling and each Director may have attributed
different levels of importance to different factors. In deciding to renew the management agreement, the Board based its decision on a number of factors, including the following:
Nature, Extent and Quality of Services — Generally. Under the management agreement, the Advisor is responsible for providing or arranging for all services necessary for the operation of the Fund. The Board noted that under the management agreement, the Advisor provides or arranges at its own expense a wide variety of services including:
| |
| • | constructing and designing the Fund |
| |
| • | portfolio research and security selection |
| |
| • | initial capitalization/funding |
| |
| • | daily valuation of the Fund’s portfolio |
| |
| • | shareholder servicing and transfer agency, including shareholder confirmations, recordkeeping, and communications |
| |
| • | regulatory and portfolio compliance |
| |
| • | marketing and distribution |
The Board noted that many of these services have expanded over time both in terms of quantity and complexity in response to shareholder demands, competition in the industry, changing distribution channels, and the changing regulatory environment.
Investment Management Services. The nature of the investment management services provided to the Fund is quite complex and allows Fund shareholders access to professional money management, instant diversification of their investments within an asset class, the opportunity to easily diversify among asset classes by investing in or exchanging among various American Century Investments funds, and liquidity. In evaluating investment performance, the Board expects the Advisor to manage the Fund in accordance with its investment objectives and approved strategies. Further, the Directors recognize that the Advisor has an obligation to seek the best execution of fund trades. In providing these services, the Advisor utilizes teams of investment professionals (portfolio managers, analysts, research assistants, and securities traders) who require extensive information technology, research, training, compliance and other systems to conduct their business. The Board, directly and through its Portfolio Committee, regularly reviews investment performance information for the Fund, together with comparative information for appropriate benchmarks and/or peer groups of similarly-managed funds, over different time horizons. The Directors also review detailed performance information during the management agreement approval process. If performance concerns are identified, the Fund receives special reviews until performance improves, during which the Board discusses with the Advisor the reasons for such results (e.g., market conditions, security selection) and any efforts being undertaken to improve performance. The Fund’s performance was above its benchmark for the one-, three-, and five-year periods reviewed by the Board. The Board found the investment management services provided by the Advisor to the Fund to be satisfactory and consistent with the management agreement.
Shareholder and Other Services. Under the management agreement, the Advisor provides the Fund with a comprehensive package of transfer agency, shareholder, and other services. The Board, directly and through various committees of the Board, regularly reviews reports and evaluations of such services at its regular meetings. These reports include, but are not limited to, information regarding the operational efficiency and accuracy of the shareholder and transfer agency services provided, staffing levels, shareholder satisfaction (as measured by external as well as internal sources), technology support, new products and services offered to Fund shareholders, securities trading activities, portfolio valuation services, auditing services, and legal and operational compliance activities. Certain aspects of shareholder and transfer agency service level efficiency
and the quality of securities trading activities are measured by independent third party providers and are presented in comparison to other fund groups not managed by the Advisor. The Board found the services provided by the Advisor to the Fund under the management agreement to be competitive and of high quality.
Costs of Services and Profitability. The Advisor provides detailed information concerning its cost of providing various services to the Fund, its profitability in managing the Fund, its overall profitability, and its financial condition. The Directors have reviewed with the Advisor the methodology used to prepare this financial information. The financial information regarding the Advisor is considered in evaluating the Advisor’s financial condition, its ability to continue to provide services under the management agreement, and the reasonableness of the current management fee. The Board concluded that the Advisor’s profits were reasonable in light of the services provided to the Fund.
Ethics. The Board generally considers the Advisor’s commitment to providing quality services to shareholders and to conducting its business ethically. They noted that the Advisor’s practices generally meet or exceed industry best practices.
Economies of Scale. The Board also reviewed information provided by the Advisor regarding the possible existence of economies of scale in connection with the management of the Fund. The Board concluded that economies of scale are difficult to measure and predict with precision, especially on a fund-by-fund basis. The Board concluded that the Advisor is appropriately sharing economies of scale through its competitive fee structure, offering competitive fees from fund inception, and through reinvestment in its business to provide shareholders additional content and services.
Comparison to Other Funds’ Fees. The management agreement provides that the Fund pays the Advisor a single, all-inclusive (or unified) management fee for providing all services necessary for the management and operation of the Fund, other than brokerage expenses, taxes, interest, extraordinary expenses, and the fees and expenses of the Fund’s independent directors (including their independent legal counsel) and expenses incurred in connection with the provision of shareholder services and distribution services under a plan adopted pursuant to Rule 12b-1 under the 1940 Act. Under the unified fee structure, the Advisor is responsible for providing all investment advisory, custody, audit, administrative, compliance, recordkeeping, marketing and shareholder services, or arranging and supervising third parties to provide such services. By contrast, most other funds are charged a variety of fees, including an investment advisory fee, a transfer agency fee, an administrative fee, distribution charges and other expenses. Other than their investment advisory fees and any applicable Rule 12b-1 distribution fees, all other components of the total fees charged by these other funds may be increased without shareholder approval. The Board believes the unified fee structure is a benefit to Fund shareholders because it clearly discloses to shareholders the cost of owning Fund shares, and, since the unified fee cannot be increased without a vote of Fund shareholders, it shifts to the Advisor the risk of increased costs of operating the Fund and provides a direct incentive to minimize administrative inefficiencies. Part of the Board’s analysis of fee levels involves reviewing certain evaluative data compiled by an independent provider and comparing the Fund’s unified fee to the total expense ratio of other funds in the Fund’s peer group. The unified fee charged to shareholders of the Fund was below the median of the total expense ratios of the Fund’s peer group. The Board concluded that the management fee paid by the Fund to the Advisor under the management agreement is reasonable in light of the services provided to the Fund.
Comparison to Fees and Services Provided to Other Clients of the Advisor. The Board also requested and received information from the Advisor concerning the nature of the services, fees, costs and profitability of its advisory services to advisory clients other than the Fund. They observed that these varying types of client accounts require different services and involve different regulatory and entrepreneurial risks than the management of the Fund. The Board analyzed this information and concluded that the fees charged and services provided to the Fund were reasonable by comparison.
Collateral or “Fall-Out” Benefits Derived by the Advisor. The Board considered the existence of collateral benefits the Advisor may receive as a result of its relationship with the Fund. They concluded that the Advisor’s primary business is managing mutual funds and it generally does not use fund or shareholder information to generate profits in other lines of business, and therefore does not derive any significant collateral benefits from them. The Board noted that the Advisor receives proprietary research from broker-dealers that execute fund portfolio transactions and concluded that this research is likely to benefit Fund shareholders. The Board also determined that the Advisor is able to provide investment management services to certain clients other than the Fund, at least in part, due to its existing infrastructure built to serve the fund complex. The Board concluded, however, that the assets of those other clients are not material to the analysis and, where applicable, may be included with the assets of the Fund to determine breakpoints in the management fee schedule.
Existing Relationship. The Board also considered whether there was any reason for not continuing the existing arrangement with the Advisor. In this regard, the Board was mindful of the potential disruptions of the Fund’s operations and various risks, uncertainties, and other effects that could occur as a result of a decision not to continue such relationship. In particular, the Board recognized that most shareholders have invested in the Fund on the strength of the Advisor’s industry standing and reputation and in the expectation that the Advisor will have a continuing role in providing advisory services to the Fund.
Conclusion of the Directors. As a result of this process, the Board, including all of the independent Directors and assisted by the advice of independent legal counsel, taking into account all of the factors discussed above and the information provided by the Advisor and others, concluded that the management agreement between the Fund and the Advisor is fair and reasonable in light of the services provided and should be renewed.
Retirement Account Information
As required by law, distributions you receive from certain IRAs are subject to federal income tax withholding, unless you elect not to have withholding apply. Tax will be withheld on the total amount withdrawn even though you may be receiving amounts that are not subject to withholding, such as nondeductible contributions. In such case, excess amounts of withholding could occur. You may adjust your withholding election so that a greater or lesser amount will be withheld.
If you don’t want us to withhold on this amount, you must notify us to not withhold the federal income tax. You may notify us in writing or in certain situations by telephone or through other electronic means. For systematic withdrawals, your withholding election will remain in effect until revoked or changed by filing a new election. You have the right to revoke your election at any time.
Remember, even if you elect not to have income tax withheld, you are liable for paying income tax on the taxable portion of your withdrawal. If you elect not to have income tax withheld or you don’t have enough income tax withheld, you may be responsible for payment of estimated tax. You may incur penalties under the estimated tax rules if your withholding and estimated tax payments are not sufficient. You can reduce or defer the income tax on a distribution by directly or indirectly rolling such distribution over to another IRA or eligible plan. You should consult your tax advisor for additional information.
State tax will be withheld if, at the time of your distribution, your address is within one of the mandatory withholding states and you have federal income tax withheld (or as otherwise required by state law). State taxes will be withheld from your distribution in accordance with the respective state rules.
Distributions you receive from 403(b), 457 and qualified plans are subject to special tax and withholding rules. Your plan administrator or plan sponsor is required to provide you with a special tax notice explaining those rules at the time you request a distribution. If applicable, federal and/or state taxes may be withheld from your distribution amount.
Proxy Voting Policies
Descriptions of the principles and policies that the fund's investment advisor uses in exercising the voting rights associated with the securities purchased and/or held by the fund are available without charge, upon request, by calling 1-800-345-2021 or visiting the "About Us" page of American Century Investments’ website at americancentury.com. A description of the policies is also available on the Securities and Exchange Commission’s website at sec.gov. Information regarding how the investment advisor voted proxies relating to portfolio securities during the most recent 12-month period ended June 30 is available on the "About Us" page at americancentury.com. It is also available at sec.gov.
Quarterly Portfolio Disclosure
The fund files its complete schedule of portfolio holdings with the Securities and Exchange Commission (SEC) for the first and third quarters of each fiscal year on Form N-Q. The fund’s Forms N-Q are available on the SEC’s website at sec.gov, and may be reviewed and copied at the SEC’s Public Reference Room in Washington, DC. Information on the operation of the Public Reference Room may be obtained by calling 1-800-SEC-0330. The fund also makes its complete schedule of portfolio holdings for the most recent quarter of its fiscal year available on its website at americancentury.com and, upon request, by calling 1-800-345-2021.
Other Tax Information
The following information is provided pursuant to provisions of the Internal Revenue Code.
The fund hereby designates up to the maximum amount allowable as qualified dividend income for the fiscal year ended June 30, 2014.
For corporate taxpayers, the fund hereby designates $4,274,262, or up to the maximum amount allowable, of ordinary income distributions paid during the fiscal year ended June 30, 2014 as qualified for the corporate dividends received deduction.
The fund hereby designates $14,579,839 as qualified short-term capital gain distributions for purposes of Internal Revenue Code Section 871.
The fund hereby designates $21,815,147, or up to the maximum amount allowable, as long-term capital gain distributions for the fiscal year ended June 30, 2014.
|
| | |
| |
| | | |
| Contact Us | americancentury.com | |
| Automated Information Line | 1-800-345-8765 | |
| Investor Services Representative | 1-800-345-2021
or 816-531-5575 | |
| Investors Using Advisors | 1-800-378-9878 | |
Business, Not-For-Profit, Employer-Sponsored
Retirement Plans | 1-800-345-3533 | |
Banks and Trust Companies, Broker-Dealers,
Financial Professionals, Insurance Companies | 1-800-345-6488 | |
| Telecommunications Relay Service for the Deaf | 711 | |
| | | |
| American Century Quantitative Equity Funds, Inc. | |
| | | |
Investment Advisor: American Century Investment Management, Inc. Kansas City, Missouri | |
| | | |
| This report and the statements it contains are submitted for the general information of our shareholders. The report is not authorized for distribution to prospective investors unless preceded or accompanied by an effective prospectus. | |
| | | |
©2014 American Century Proprietary Holdings, Inc. All rights reserved.
CL-ANN-82896 1408 | |
|
| |
ANNUAL REPORT | JUNE 30, 2014 |
Small Company Fund
|
| |
| President's Letter | |
| Performance | |
| Portfolio Commentary | |
| Fund Characteristics | |
| Shareholder Fee Example | |
| Schedule of Investments | |
| Statement of Assets and Liabilities | |
| Statement of Operations | |
| Statement of Changes in Net Assets | |
| Notes to Financial Statements | |
| Financial Highlights | |
| Report of Independent Registered Public Accounting Firm | |
| Management | |
| Approval of Management Agreement | |
| Additional Information | |
Any opinions expressed in this report reflect those of the author as of the date of the report, and do not necessarily represent the opinions of American Century Investments® or any other person in the American Century Investments organization. Any such opinions are subject to change at any time based upon market or other conditions and American Century Investments disclaims any responsibility to update such opinions. These opinions may not be relied upon as investment advice and, because investment decisions made by American Century Investments funds are based on numerous factors, may not be relied upon as an indication of trading intent on behalf of any American Century Investments fund. Security examples are used for representational purposes only and are not intended as recommendations to purchase or sell securities. Performance information for comparative indices and securities is provided to American Century Investments by third party vendors. To the best of American Century Investments’ knowledge, such information is accurate at the time of printing.
|
| |
| Dear Investor:
Thank you for reviewing this annual report for the 12 months ended June 30, 2014. It provides investment performance and portfolio information for the reporting period, plus longer-term historical performance data.
Annual reports remain important vehicles for conveying information about fund returns, including market and economic factors that affected performance during the reporting period. For additional, updated investment and market insights, we encourage you to visit our website, americancentury.com.
|
| Jonathan Thomas |
Aggressive Monetary Policies Boosted Stock and Bond Returns
Stimulative monetary policies and expectations of economic improvement, interspersed with concerns about weaker-than-expected economic data and geopolitical conflicts, helped drive financial market returns during the reporting period. We believe the combination of longer-term optimism about global economic growth, low costs of capital, and central bank purchases of fixed income securities helped persuade investors to seek risk and yield, especially in the U.S. and Europe. Stock index returns were strong in these markets, particularly at the smaller capitalization end of the company size spectrum. The MSCI Europe and S&P 500® indices advanced 29.28% and 24.61%, respectively.
Remarkably, for a period in which stock market performance was so strong, government bond performance was also generally positive. Not surprisingly, U.S. corporate high-yield bonds posted double-digit returns, but the 30-year U.S. Treasury bond also outperformed most broader bond market measures. In addition, a generally weaker U.S. dollar during the reporting period meant that international bond returns for U.S. investors with currency exposure were generally higher than U.S. bonds returns. The Barclays Global Aggregate Bond and Barclays U.S. Aggregate Bond indices returned 7.39% and 4.37%, respectively.
Looking ahead, we see signs of sustained moderate economic growth in the second half of 2014, but headwinds persist. In the U.S., which was supposed to be an economic growth leader this year, housing market momentum has slowed, interest rates could rise, and economic growth and U.S. employment levels remain subpar compared with past post-recession periods. In this environment, we continue to believe in a disciplined, diversified, long-term investment approach, using professionally managed stock and bond portfolios—as appropriate—for meeting financial goals. We appreciate your continued trust in us.
Sincerely,
Jonathan Thomas
President and Chief Executive Officer
American Century Investments
|
| | | | | | |
| Total Returns as of June 30, 2014 |
| | | | Average Annual Returns | |
| | Ticker Symbol | 1 year | 5 years | 10 years | Since Inception | Inception Date |
| Investor Class | ASQIX | 26.79% | 21.70% | 7.18% | 9.22% | 7/31/98 |
| Russell 2000 Index | — | 23.64% | 20.20% | 8.70% | 8.04% | — |
| Institutional Class | ASCQX | 27.02% | 21.96% | 7.39% | 10.53% | 10/1/99 |
A Class(1) | ASQAX | | | | | 9/7/00 |
| No sales charge* | | 26.54% | 21.43% | 6.91% | 8.54% | |
| With sales charge* | | 19.26% | 20.00% | 6.28% | 8.08% | |
| C Class | ASQCX | 25.49% | — | — | 17.22% | 3/1/10 |
| R Class | ASCRX | 26.17% | 21.12% | 6.65% | 8.79% | 8/29/03 |
| |
| * | Sales charges include initial sales charges and contingent deferred sales charges (CDSCs), as applicable. A Class shares have a 5.75% maximum initial sales charge and may be subject to a maximum CDSC of 1.00%. C Class shares redeemed within 12 months of purchase are subject to a maximum CDSC of 1.00%. The SEC requires that mutual funds provide performance information net of maximum sales charges in all cases where charges could be applied. |
| |
| (1) | Prior to March 1, 2010, the A Class was referred to as the Advisor Class and did not have a front-end sales charge. Performance has been adjusted to reflect this charge. |
Data presented reflect past performance. Past performance is no guarantee of future results. Current performance may be higher or lower than the performance shown. Investment return and principal value will fluctuate, and redemption value may be more or less than original cost. To obtain performance data current to the most recent month end, please call 1-800-345-2021 or visit americancentury.com. Historically, small company stocks have been more volatile than the stocks of larger, more established companies.
Unless otherwise indicated, performance reflects Investor Class shares; performance for other share classes will vary due to differences in fee structure. For information about other share classes available, please consult the prospectus. Data assumes reinvestment of dividends and capital gains, and none of the charts reflect the deduction of taxes that a shareholder would pay on fund distributions or the redemption of fund shares. Returns for the index are provided for comparison. The fund’s total returns include operating expenses (such as transaction costs and management fees) that reduce returns, while the total returns of the index do not.
|
|
| Growth of $10,000 Over 10 Years |
| $10,000 investment made June 30, 2004 |
|
| |
| Value on June 30, 2014 |
| | Investor Class — $20,011 |
| |
| | Russell 2000 Index — $23,030 |
| |
|
| | | | |
| Total Annual Fund Operating Expenses |
| Investor Class | Institutional Class | A Class | C Class | R Class |
| 0.88% | 0.68% | 1.13% | 1.88% | 1.38% |
The total annual fund operating expenses shown is as stated in the fund’s prospectus current as of the date of this report. The prospectus may vary from the expense ratio shown elsewhere in this report because it is based on a different time period, includes acquired fund fees and expenses, and, if applicable, does not include fee waivers or expense reimbursements.
Data presented reflect past performance. Past performance is no guarantee of future results. Current performance may be higher or lower than the performance shown. Investment return and principal value will fluctuate, and redemption value may be more or less than original cost. To obtain performance data current to the most recent month end, please call 1-800-345-2021 or visit americancentury.com. Historically, small company stocks have been more volatile than the stocks of larger, more established companies.
Unless otherwise indicated, performance reflects Investor Class shares; performance for other share classes will vary due to differences in fee structure. For information about other share classes available, please consult the prospectus. Data assumes reinvestment of dividends and capital gains, and none of the charts reflect the deduction of taxes that a shareholder would pay on fund distributions or the redemption of fund shares. Returns for the index are provided for comparison. The fund’s total returns include operating expenses (such as transaction costs and management fees) that reduce returns, while the total returns of the index do not.
Portfolio Managers: Brian Garbe and Tal Sansani
Performance Summary
Small Company returned 26.79%* for the fiscal year ended June 30, 2014, compared with the 23.64% return of its benchmark, the Russell 2000 Index.
As U.S. equity markets continued their robust appreciation, Small Company posted strong gains for the 12-month period, outperforming the Russell 2000 Index. Small Company’s stock selection process incorporates factors of valuation, quality, growth, and momentum (sentiment) while striving to minimize unintended risks along industries and other risk characteristics. Valuation factors were largely ignored in the markets as investors rewarded growth stocks, particularly during the first half of the period. Markets likewise favored sentiment-based measures. Within the fund, security selection was the primary driver of returns, with industrials and financials holdings providing the majority of contribution. The materials and consumer discretionary sectors detracted from the fund’s results.
Industrials and Financials Outperformed
The industrials and financials sectors were among the leading contributors to the fund’s returns relative to the Russell 2000 Index. Industrials sector outperformance was primarily due to successful stock selection in the machinery industry. The Greenbrier Companies, a manufacturer of railroad freight equipment, was a key fund outperformer, appreciating strongly thanks to rising orders of its railcars. The holding’s strong quality, sentiment, and growth profiles make it particularly attractive. Shares of lift truck manufacturer Hyster-Yale Materials Handling appreciated on revenue growth driven by increases in unit growth as well as fleet services and shipments. Holdings in the commercial services and supplies industry added to results. Here, Deluxe Corporation, a provider of small business and financial services, was a key outperformer, rising nearly 73% during the period. A portfolio-only position in commercial airline Alaska Air Group also helped returns following the holding’s steep appreciation.
The financials sector was another area of outperformance. A number of successful bank holdings contributed to the industry’s returns, as did select insurance companies, including Universal Insurance Holdings. The company’s stock nearly doubled in value thanks to solid third quarter results, a special dividend payout, and New York Stock Exchange listing. Underweight positioning, relative to the benchmark, in real estate investment trusts likewise added value.
Security selection in the information technology and health care sectors also enhanced gains. ARRIS Group, a provider of media entertainment and data communications solutions, gained nearly 130% during the year on growing demand for its set-top boxes. In the health care sector, Questcor Pharmaceuticals was a top individual contributor, appreciating on strong sales and earnings growth.
* All fund returns referenced in this commentary are for Investor Class shares. Performance for other share classes will vary due to differences in fee structure; when Investor Class performance exceeds that of the fund's benchmark, other share classes may not. See page 3 for returns for all share classes.
Materials and Consumer Discretionary Sectors Detracted
Security selection in the materials sector, particularly within paper and forest product holdings, diminished fund returns during the 12-month period, driven in large part by specialty paper producer Schweitzer-Mauduit International, which declined 10%. Consumer discretionary holdings and sector positioning were also relative detractors. Overweight exposure in a number of internet retailers pressured portfolios gains. Prominent underperformers included Overstock.com, which fell on news of management changes despite strong earnings results. Other sector constituents that hurt results included ITT Educational Services, a for-profit education provider, which fell on declining enrollment and future guidance as well as concerns surrounding the filing of the company’s current financials. Sporting goods retailer Big 5 Sporting Goods missed revenue estimates due to weakening sales, which negatively impacted its stock price. The fund subsequently exited its stake in the holding.
A number of key individual detractors were found in the information technology sector. These included solar power semiconductor manufacturer SunEdison, which the fund did not hold. The company’s stock benefited from several analyst upgrades based on a continued rise in solar power demand. An overweight position in InterDigital, a developer of wireless communication technology, also decreased returns as investors punished the company’s stock early in the period following the loss of a patent-infringement case against Nokia. The position was ultimately sold.
A Look Ahead
Economic recovery in the U.S. appears to be progressing, albeit at a slower pace than during prior post-recessionary periods, and is expected to stay the course through the remainder of 2014. Recent indicators such as improvements in small business and consumer confidence point to a sustainable rebound, and economic growth is likely to further benefit from the recovering labor and housing markets. Though a continuation of political instability in non-U.S. markets as well as the potential for rising inflation and interest rates could lead to heightened market volatility, our disciplined, objective, and systematic investment strategy is designed to take advantage of opportunities at the individual company level. We believe this approach is the most powerful way to capitalize on market inefficiencies that lead to the mispricing of individual stocks. Currently, the fund’s most significant sector overweight positions are in industrials and information technology while energy and utilities represent the greatest sector underweights.
|
| |
| JUNE 30, 2014 | |
| Top Ten Holdings | % of net assets |
| RLJ Lodging Trust | 0.8% |
| Esterline Technologies Corp. | 0.7% |
| Deluxe Corp. | 0.7% |
| Brunswick Corp. | 0.7% |
| Sanderson Farms, Inc. | 0.7% |
| Strategic Hotels & Resorts, Inc. | 0.7% |
| Synaptics, Inc. | 0.7% |
| Take-Two Interactive Software, Inc. | 0.7% |
| Moog, Inc., Class A | 0.7% |
| Cooper Tire & Rubber Co. | 0.7% |
| | |
| Top Five Industries | % of net assets |
| Real Estate Investment Trusts (REITs) | 6.0% |
| Semiconductors and Semiconductor Equipment | 5.9% |
| Machinery | 5.8% |
| Software | 5.4% |
| Banks | 4.7% |
| | |
| Types of Investments in Portfolio | % of net assets |
| Common Stocks | 99.7% |
| Temporary Cash Investments | 0.5% |
| Other Assets and Liabilities | (0.2)% |
Fund shareholders may incur two types of costs: (1) transaction costs, including sales charges (loads) on purchase payments and redemption/exchange fees; and (2) ongoing costs, including management fees; distribution and service (12b-1) fees; and other fund expenses. This example is intended to help you understand your ongoing costs (in dollars) of investing in your fund and to compare these costs with the ongoing cost of investing in other mutual funds.
The example is based on an investment of $1,000 made at the beginning of the period and held for the entire period from January 1, 2014 to June 30, 2014.
Actual Expenses
The table provides information about actual account values and actual expenses for each class. You may use the information, together with the amount you invested, to estimate the expenses that you paid over the period. First, identify the share class you own. Then simply divide your account value by $1,000 (for example, an $8,600 account value divided by $1,000 = 8.6), then multiply the result by the number under the heading “Expenses Paid During Period” to estimate the expenses you paid on your account during this period.
If you hold Investor Class shares of any American Century Investments fund, or Institutional Class shares of the American Century Diversified Bond Fund, in an American Century Investments account (i.e., not a financial intermediary or retirement plan account), American Century Investments may charge you a $12.50 semiannual account maintenance fee if the value of those shares is less than $10,000. We will redeem shares automatically in one of your accounts to pay the $12.50 fee. In determining your total eligible investment amount, we will include your investments in all personal accounts (including American Century Investments Brokerage accounts) registered under your Social Security number. Personal accounts include individual accounts, joint accounts, UGMA/UTMA accounts, personal trusts, Coverdell Education Savings Accounts and IRAs (including traditional, Roth, Rollover, SEP-, SARSEP- and SIMPLE-IRAs), and certain other retirement accounts. If you have only business, business retirement, employer-sponsored or American Century Investments Brokerage accounts, you are currently not subject to this fee. If you are subject to the Account Maintenance Fee, your account value could be reduced by the fee amount.
Hypothetical Example for Comparison Purposes
The table also provides information about hypothetical account values and hypothetical expenses based on the actual expense ratio of each class of your fund and an assumed rate of return of 5% per year before expenses, which is not the actual return of a fund’s share class. The hypothetical account values and expenses may not be used to estimate the actual ending account balance or expenses you paid for the period. You may use this information to compare the ongoing costs of investing in your fund and other funds. To do so, compare this 5% hypothetical example with the 5% hypothetical examples that appear in the shareholder reports of the other funds.
Please note that the expenses shown in the table are meant to highlight your ongoing costs only and do not reflect any transactional costs, such as sales charges (loads) or redemption/exchange fees. Therefore, the table is useful in comparing ongoing costs only, and will not help you determine the relative total costs of owning different funds. In addition, if these transactional costs were included, your costs would have been higher.
|
| | | | |
| | Beginning Account Value 1/1/14 | Ending Account Value 6/30/14 | Expenses Paid
During Period(1) 1/1/14 - 6/30/14 | Annualized Expense Ratio(1) |
| Actual | | | | |
| Investor Class | $1,000 | $1,047.00 | $4.42 | 0.87% |
| Institutional Class | $1,000 | $1,047.50 | $3.40 | 0.67% |
| A Class | $1,000 | $1,045.60 | $5.68 | 1.12% |
| C Class | $1,000 | $1,041.80 | $9.47 | 1.87% |
| R Class | $1,000 | $1,044.50 | $6.94 | 1.37% |
| Hypothetical | | | | |
| Investor Class | $1,000 | $1,020.48 | $4.36 | 0.87% |
| Institutional Class | $1,000 | $1,021.47 | $3.36 | 0.67% |
| A Class | $1,000 | $1,019.24 | $5.61 | 1.12% |
| C Class | $1,000 | $1,015.52 | $9.35 | 1.87% |
| R Class | $1,000 | $1,018.00 | $6.85 | 1.37% |
| |
| (1) | Expenses are equal to the class’s annualized expense ratio listed in the table above, multiplied by the average account value over the period, multiplied by 181, the number of days in the most recent fiscal half-year, divided by 365, to reflect the one-half year period. |
JUNE 30, 2014
|
| | | | | |
| | Shares | Value |
| COMMON STOCKS — 99.7% | | |
| AEROSPACE AND DEFENSE — 2.6% | | |
| AAR Corp. | 90,460 |
| $ | 2,493,078 |
|
| Alliant Techsystems, Inc. | 5,175 |
| 693,036 |
|
Ducommun, Inc.(1) | 40,129 |
| 1,048,571 |
|
Engility Holdings, Inc.(1) | 2,621 |
| 100,279 |
|
Esterline Technologies Corp.(1) | 27,561 |
| 3,172,822 |
|
Moog, Inc., Class A(1) | 39,756 |
| 2,897,815 |
|
Orbital Sciences Corp.(1) | 16,795 |
| 496,292 |
|
| | | 10,901,893 |
|
| AIRLINES — 1.4% | | |
| Alaska Air Group, Inc. | 21,346 |
| 2,028,938 |
|
JetBlue Airways Corp.(1) | 228,852 |
| 2,483,044 |
|
| Skywest, Inc. | 116,759 |
| 1,426,795 |
|
| | | 5,938,777 |
|
| AUTO COMPONENTS — 2.8% | | |
| Cooper Tire & Rubber Co. | 96,450 |
| 2,893,500 |
|
| Drew Industries, Inc. | 15,682 |
| 784,257 |
|
Fuel Systems Solutions, Inc.(1) | 89,198 |
| 993,666 |
|
Modine Manufacturing Co.(1) | 83,382 |
| 1,312,432 |
|
Stoneridge, Inc.(1) | 109,947 |
| 1,178,632 |
|
Tenneco, Inc.(1) | 35,987 |
| 2,364,346 |
|
Tower International, Inc.(1) | 63,522 |
| 2,340,150 |
|
| | | 11,866,983 |
|
| BANKS — 4.7% | | |
| Cardinal Financial Corp. | 98,184 |
| 1,812,477 |
|
| Cathay General Bancorp. | 52,837 |
| 1,350,514 |
|
Customers Bancorp, Inc.(1) | 88,058 |
| 1,762,041 |
|
Eagle Bancorp, Inc.(1) | 43,284 |
| 1,460,835 |
|
First BanCorp(1) | 176,808 |
| 961,835 |
|
| First Interstate Bancsystem, Inc. | 67,448 |
| 1,833,237 |
|
| First Midwest Bancorp., Inc. | 30,563 |
| 520,488 |
|
First NBC Bank Holding Co.(1) | 6,463 |
| 216,575 |
|
| Hancock Holding Co. | 51,650 |
| 1,824,278 |
|
| Home Bancshares, Inc. | 11,821 |
| 387,965 |
|
| IBERIABANK Corp. | 37,880 |
| 2,620,917 |
|
| OFG Bancorp | 127,055 |
| 2,339,083 |
|
| Renasant Corp. | 14,264 |
| 414,654 |
|
| South State Corp. | 6,747 |
| 411,567 |
|
| State Bank Financial Corp. | 22,225 |
| 375,825 |
|
Tristate Capital Holdings, Inc.(1) | 8,488 |
| 119,935 |
|
| Washington Trust Bancorp, Inc. | 2,449 |
| 90,050 |
|
| Wilshire Bancorp, Inc. | 126,850 |
| 1,302,749 |
|
|
| | | | | |
| | Shares | Value |
| Wintrust Financial Corp. | 2,206 |
| $ | 101,476 |
|
Yadkin Financial Corp.(1) | 4,913 |
| 92,561 |
|
| | | 19,999,062 |
|
| BIOTECHNOLOGY — 3.0% | | |
Emergent Biosolutions, Inc.(1) | 91,830 |
| 2,062,502 |
|
Insys Therapeutics, Inc.(1) | 30,710 |
| 959,073 |
|
Isis Pharmaceuticals, Inc.(1) | 51,186 |
| 1,763,358 |
|
Ligand Pharmaceuticals, Inc., Class B(1) | 4,806 |
| 299,366 |
|
NPS Pharmaceuticals, Inc.(1) | 87,266 |
| 2,884,141 |
|
| PDL BioPharma, Inc. | 272,229 |
| 2,635,177 |
|
Prothena Corp. plc(1) | 35,944 |
| 810,537 |
|
Sangamo Biosciences, Inc.(1) | 31,046 |
| 474,072 |
|
Threshold Pharmaceuticals, Inc.(1) | 225,749 |
| 893,966 |
|
| | | 12,782,192 |
|
| BUILDING PRODUCTS — 0.3% | | |
| Simpson Manufacturing Co., Inc. | 33,228 |
| 1,208,170 |
|
| CAPITAL MARKETS — 3.5% | | |
| Calamos Asset Management, Inc., Class A | 90,521 |
| 1,212,076 |
|
| Diamond Hill Investment Group, Inc. | 5,741 |
| 733,241 |
|
| Evercore Partners, Inc., Class A | 45,903 |
| 2,645,849 |
|
FBR & Co.(1) | 28,246 |
| 766,314 |
|
| Financial Engines, Inc. | 11,950 |
| 541,096 |
|
| FXCM, Inc., Class A | 83,773 |
| 1,253,244 |
|
Investment Technology Group, Inc.(1) | 32,559 |
| 549,596 |
|
| Janus Capital Group, Inc. | 144,153 |
| 1,799,029 |
|
| Manning & Napier, Inc. | 90,378 |
| 1,559,924 |
|
Piper Jaffray Cos.(1) | 16,806 |
| 870,047 |
|
Stifel Financial Corp.(1) | 59,229 |
| 2,804,493 |
|
| | | 14,734,909 |
|
| CHEMICALS — 2.4% | | |
Ferro Corp.(1) | 181,053 |
| 2,274,026 |
|
| FutureFuel Corp. | 85,575 |
| 1,419,689 |
|
| Minerals Technologies, Inc. | 19,447 |
| 1,275,334 |
|
| Olin Corp. | 102,664 |
| 2,763,715 |
|
| Quaker Chemical Corp. | 33,303 |
| 2,557,337 |
|
| | | 10,290,101 |
|
| COMMERCIAL SERVICES AND SUPPLIES — 2.8% | | |
ACCO Brands Corp.(1) | 51,034 |
| 327,128 |
|
| Deluxe Corp. | 53,583 |
| 3,138,892 |
|
| Ennis, Inc. | 39,394 |
| 601,152 |
|
| Herman Miller, Inc. | 70,565 |
| 2,133,886 |
|
| Intersections, Inc. | 51,156 |
| 251,688 |
|
| Kimball International, Inc., Class B | 102,705 |
| 1,717,228 |
|
Performant Financial Corp.(1) | 14,464 |
| 146,086 |
|
| Quad/Graphics, Inc. | 43,177 |
| 965,869 |
|
| Steelcase, Inc., Class A | 165,739 |
| 2,507,631 |
|
| | | 11,789,560 |
|
|
| | | | | |
| | Shares | Value |
| COMMUNICATIONS EQUIPMENT — 1.6% | | |
ARRIS Group, Inc.(1) | 73,216 |
| $ | 2,381,717 |
|
| Brocade Communications Systems, Inc. | 108,382 |
| 997,114 |
|
Ciena Corp.(1) | 127,603 |
| 2,763,881 |
|
Finisar Corp.(1) | 10,592 |
| 209,192 |
|
Harmonic, Inc.(1) | 38,420 |
| 286,613 |
|
| | | 6,638,517 |
|
| CONSUMER FINANCE — 1.9% | | |
| Cash America International, Inc. | 54,007 |
| 2,399,531 |
|
Credit Acceptance Corp.(1) | 9,138 |
| 1,124,888 |
|
Green Dot Corp., Class A(1) | 3,477 |
| 65,994 |
|
Portfolio Recovery Associates, Inc.(1) | 37,072 |
| 2,206,896 |
|
Regional Management Corp.(1) | 22,737 |
| 351,741 |
|
World Acceptance Corp.(1) | 23,950 |
| 1,819,242 |
|
| | | 7,968,292 |
|
| CONTAINERS AND PACKAGING — 0.7% | | |
Berry Plastics Group, Inc.(1) | 107,069 |
| 2,762,380 |
|
| DIVERSIFIED CONSUMER SERVICES — 0.7% | | |
| Capella Education Co. | 14,165 |
| 770,434 |
|
| Carriage Services, Inc. | 9,471 |
| 162,238 |
|
ITT Educational Services, Inc.(1) | 45,427 |
| 758,177 |
|
K12, Inc.(1) | 17,427 |
| 419,468 |
|
Strayer Education, Inc.(1) | 19,738 |
| 1,036,442 |
|
| | | 3,146,759 |
|
| DIVERSIFIED FINANCIAL SERVICES — 0.6% | | |
PHH Corp.(1) | 103,596 |
| 2,380,636 |
|
| DIVERSIFIED TELECOMMUNICATION SERVICES — 1.3% | | |
Fairpoint Communications, Inc.(1) | 40,279 |
| 562,698 |
|
| IDT Corp., Class B | 58,856 |
| 1,025,272 |
|
| Inteliquent, Inc. | 157,875 |
| 2,189,726 |
|
Premiere Global Services, Inc.(1) | 119,990 |
| 1,601,866 |
|
| | | 5,379,562 |
|
| ELECTRIC UTILITIES — 0.8% | | |
| Cleco Corp. | 30,858 |
| 1,819,079 |
|
| UIL Holdings Corp. | 37,020 |
| 1,433,044 |
|
| | | 3,252,123 |
|
| ELECTRICAL EQUIPMENT — 0.2% | | |
Enphase Energy, Inc.(1) | 54,109 |
| 462,632 |
|
Thermon Group Holdings, Inc.(1) | 21,768 |
| 572,934 |
|
| | | 1,035,566 |
|
| ELECTRONIC EQUIPMENT, INSTRUMENTS AND COMPONENTS — 3.9% | |
| Anixter International, Inc. | 8,088 |
| 809,366 |
|
Benchmark Electronics, Inc.(1) | 106,721 |
| 2,719,251 |
|
Checkpoint Systems, Inc.(1) | 145,575 |
| 2,036,594 |
|
Coherent, Inc.(1) | 35,243 |
| 2,332,029 |
|
| | | |
|
| | | | | |
| | Shares | Value |
| Daktronics, Inc. | 22,278 |
| $ | 265,554 |
|
GSI Group, Inc.(1) | 27,322 |
| 347,809 |
|
Insight Enterprises, Inc.(1) | 3,426 |
| 105,315 |
|
Newport Corp.(1) | 59,004 |
| 1,091,574 |
|
| PC Connection, Inc. | 5,241 |
| 108,384 |
|
Plexus Corp.(1) | 20,021 |
| 866,709 |
|
Rogers Corp.(1) | 9,856 |
| 653,946 |
|
Sanmina Corp.(1) | 119,482 |
| 2,721,800 |
|
ScanSource, Inc.(1) | 63,562 |
| 2,420,441 |
|
| | | 16,478,772 |
|
| ENERGY EQUIPMENT AND SERVICES — 0.7% | | |
ION Geophysical Corp.(1) | 315,257 |
| 1,330,384 |
|
Matrix Service Co.(1) | 4,440 |
| 145,588 |
|
Newpark Resources, Inc.(1) | 26,022 |
| 324,234 |
|
SEACOR Holdings, Inc.(1) | 2,103 |
| 172,972 |
|
| Tesco Corp. | 49,482 |
| 1,055,946 |
|
TGC Industries, Inc.(1) | 23,884 |
| 130,168 |
|
| | | 3,159,292 |
|
| FOOD AND STAPLES RETAILING — 1.3% | | |
| Andersons, Inc. (The) | 39,689 |
| 2,047,158 |
|
Rite Aid Corp.(1) | 387,822 |
| 2,780,684 |
|
| Roundy's, Inc. | 132,880 |
| 732,169 |
|
| | | 5,560,011 |
|
| FOOD PRODUCTS — 1.7% | | |
Chiquita Brands International, Inc.(1) | 73,143 |
| 793,602 |
|
Farmer Bros. Co.(1) | 13,234 |
| 285,987 |
|
Omega Protein Corp.(1) | 46,689 |
| 638,705 |
|
Pilgrim's Pride Corp.(1) | 91,479 |
| 2,502,865 |
|
| Sanderson Farms, Inc. | 31,216 |
| 3,034,195 |
|
| | | 7,255,354 |
|
| GAS UTILITIES — 0.6% | | |
| New Jersey Resources Corp. | 46,762 |
| 2,672,916 |
|
| HEALTH CARE EQUIPMENT AND SUPPLIES — 3.0% | | |
Align Technology, Inc.(1) | 45,148 |
| 2,530,094 |
|
| Analogic Corp. | 9,789 |
| 765,891 |
|
Anika Therapeutics, Inc.(1) | 45,533 |
| 2,109,544 |
|
| Atrion Corp. | 327 |
| 106,602 |
|
Greatbatch, Inc.(1) | 49,208 |
| 2,414,144 |
|
Haemonetics Corp.(1) | 51,032 |
| 1,800,409 |
|
| Hill-Rom Holdings, Inc. | 46,506 |
| 1,930,464 |
|
Medical Action Industries, Inc.(1) | 9,609 |
| 131,932 |
|
Natus Medical, Inc.(1) | 14,535 |
| 365,410 |
|
NuVasive, Inc.(1) | 4,366 |
| 155,299 |
|
Symmetry Medical, Inc.(1) | 42,858 |
| 379,722 |
|
| | | 12,689,511 |
|
| HEALTH CARE PROVIDERS AND SERVICES — 4.1% | | |
Addus HomeCare Corp.(1) | 63,318 |
| 1,423,389 |
|
|
| | | | | |
| | Shares | Value |
AMN Healthcare Services, Inc.(1) | 139,791 |
| $ | 1,719,429 |
|
Amsurg Corp.(1) | 55,663 |
| 2,536,563 |
|
Centene Corp.(1) | 32,949 |
| 2,491,274 |
|
| Chemed Corp. | 29,928 |
| 2,804,852 |
|
Corvel Corp.(1) | 4,526 |
| 204,485 |
|
| Kindred Healthcare, Inc. | 72,542 |
| 1,675,720 |
|
PharMerica Corp.(1) | 85,810 |
| 2,453,308 |
|
Providence Service Corp. (The)(1) | 51,528 |
| 1,885,409 |
|
Skilled Healthcare Group, Inc., Class A(1) | 54,172 |
| 340,742 |
|
| | | 17,535,171 |
|
| HEALTH CARE TECHNOLOGY — 0.6% | | |
MedAssets, Inc.(1) | 102,189 |
| 2,333,997 |
|
| HOTELS, RESTAURANTS AND LEISURE — 2.3% | | |
| Cracker Barrel Old Country Store, Inc. | 26,201 |
| 2,608,834 |
|
| Interval Leisure Group, Inc. | 88,179 |
| 1,934,647 |
|
| Jack in the Box, Inc. | 47,935 |
| 2,868,430 |
|
Monarch Casino & Resort, Inc.(1) | 18,584 |
| 281,362 |
|
Multimedia Games Holding Co., Inc.(1) | 32,868 |
| 974,208 |
|
| Ruth's Hospitality Group, Inc. | 96,744 |
| 1,194,788 |
|
| | | 9,862,269 |
|
| HOUSEHOLD DURABLES — 1.3% | | |
| CSS Industries, Inc. | 19,112 |
| 503,983 |
|
iRobot Corp.(1) | 63,706 |
| 2,608,761 |
|
Libbey, Inc.(1) | 36,100 |
| 961,704 |
|
Skullcandy, Inc.(1) | 44,949 |
| 325,880 |
|
Universal Electronics, Inc.(1) | 19,084 |
| 932,826 |
|
| | | 5,333,154 |
|
| HOUSEHOLD PRODUCTS — 0.2% | | |
| Orchids Paper Products Co. | 22,473 |
| 720,035 |
|
| INSURANCE — 3.8% | | |
| American Equity Investment Life Holding Co. | 56,057 |
| 1,379,002 |
|
| AMERISAFE, Inc. | 53,067 |
| 2,158,235 |
|
| Amtrust Financial Services, Inc. | 58,858 |
| 2,460,853 |
|
| Employers Holdings, Inc. | 11,589 |
| 245,455 |
|
| Infinity Property & Casualty Corp. | 17,207 |
| 1,156,827 |
|
| Maiden Holdings Ltd. | 198,160 |
| 2,395,754 |
|
| OneBeacon Insurance Group Ltd., Class A | 46,798 |
| 727,241 |
|
| Safety Insurance Group, Inc. | 3,048 |
| 156,606 |
|
| Selective Insurance Group, Inc. | 17,089 |
| 422,440 |
|
| Stewart Information Services Corp. | 47,809 |
| 1,482,557 |
|
| United Fire Group, Inc. | 39,686 |
| 1,163,594 |
|
| Universal Insurance Holdings, Inc. | 165,197 |
| 2,142,605 |
|
| | | 15,891,169 |
|
| INTERNET AND CATALOG RETAIL — 1.6% | | |
| HSN, Inc. | 44,565 |
| 2,640,031 |
|
Orbitz Worldwide, Inc.(1) | 257,365 |
| 2,290,549 |
|
Overstock.com, Inc.(1) | 63,334 |
| 998,777 |
|
|
| | | | | |
| | Shares | Value |
| PetMed Express, Inc. | 71,215 |
| $ | 959,978 |
|
| | | 6,889,335 |
|
| INTERNET SOFTWARE AND SERVICES — 1.4% | | |
comScore, Inc.(1) | 12,409 |
| 440,271 |
|
Conversant, Inc.(1) | 101,591 |
| 2,580,412 |
|
CoStar Group, Inc.(1) | 5,612 |
| 887,650 |
|
support.com, Inc.(1) | 38,345 |
| 103,915 |
|
| United Online, Inc. | 17,576 |
| 182,790 |
|
Web.com Group, Inc.(1) | 36,956 |
| 1,066,920 |
|
XO Group, Inc.(1) | 69,754 |
| 852,394 |
|
| | | 6,114,352 |
|
| IT SERVICES — 1.7% | | |
| Convergys Corp. | 51,259 |
| 1,098,993 |
|
| CSG Systems International, Inc. | 33,454 |
| 873,484 |
|
Euronet Worldwide, Inc.(1) | 59,386 |
| 2,864,781 |
|
ExlService Holdings, Inc.(1) | 7,378 |
| 217,282 |
|
Lionbridge Technologies, Inc.(1) | 60,686 |
| 360,475 |
|
MoneyGram International, Inc.(1) | 117,159 |
| 1,725,752 |
|
PRGX Global, Inc.(1) | 23,047 |
| 147,270 |
|
Sapient Corp.(1) | 4,920 |
| 79,950 |
|
| | | 7,367,987 |
|
| LEISURE PRODUCTS — 0.9% | | |
| Arctic Cat, Inc. | 10,019 |
| 394,949 |
|
| Brunswick Corp. | 74,147 |
| 3,123,813 |
|
| Sturm Ruger & Co., Inc. | 8,281 |
| 488,662 |
|
| | | 4,007,424 |
|
| LIFE SCIENCES TOOLS AND SERVICES — 0.1% | | |
Charles River Laboratories International, Inc.(1) | 9,148 |
| 489,601 |
|
| MACHINERY — 5.8% | | |
| Actuant Corp., Class A | 68,519 |
| 2,368,702 |
|
| Altra Industrial Motion Corp. | 45,404 |
| 1,652,252 |
|
| Barnes Group, Inc. | 38,684 |
| 1,490,881 |
|
| CIRCOR International, Inc. | 27,406 |
| 2,113,825 |
|
| Douglas Dynamics, Inc. | 15,483 |
| 272,810 |
|
| Federal Signal Corp. | 39,877 |
| 584,198 |
|
Greenbrier Cos., Inc.(1) | 47,427 |
| 2,731,795 |
|
| Hillenbrand, Inc. | 21,752 |
| 709,550 |
|
| Hyster-Yale Materials Handling, Inc. | 24,065 |
| 2,130,715 |
|
| Kadant, Inc. | 12,889 |
| 495,582 |
|
Lydall, Inc.(1) | 51,148 |
| 1,399,921 |
|
| Mueller Water Products, Inc., Class A | 287,598 |
| 2,484,847 |
|
| NN, Inc. | 7,693 |
| 196,787 |
|
Rexnord Corp.(1) | 72,385 |
| 2,037,638 |
|
Wabash National Corp.(1) | 152,716 |
| 2,176,203 |
|
WABCO Holdings, Inc.(1) | 10,412 |
| 1,112,210 |
|
Xerium Technologies, Inc.(1) | 35,539 |
| 496,124 |
|
| | | 24,454,040 |
|
|
| | | | | |
| | Shares | Value |
| MARINE — 0.6% | | |
| Matson, Inc. | 95,658 |
| $ | 2,567,461 |
|
| MEDIA — 0.9% | | |
Cumulus Media, Inc., Class A(1) | 360,436 |
| 2,375,273 |
|
Entercom Communications Corp., Class A(1) | 68,655 |
| 736,668 |
|
| Harte-Hanks, Inc. | 27,275 |
| 196,107 |
|
Journal Communications, Inc., Class A(1) | 37,656 |
| 334,009 |
|
ReachLocal, Inc.(1) | 9,194 |
| 64,634 |
|
| Scholastic Corp. | 2,509 |
| 85,532 |
|
| | | 3,792,223 |
|
| METALS AND MINING — 0.1% | | |
Handy & Harman Ltd.(1) | 4,306 |
| 115,272 |
|
| Olympic Steel, Inc. | 10,226 |
| 253,093 |
|
| | | 368,365 |
|
| MULTILINE RETAIL — 0.3% | | |
| Dillard's, Inc., Class A | 10,768 |
| 1,255,656 |
|
| OIL, GAS AND CONSUMABLE FUELS — 2.9% | | |
Abraxas Petroleum Corp.(1) | 243,964 |
| 1,527,215 |
|
| Alon USA Energy, Inc. | 59,952 |
| 745,803 |
|
Clayton Williams Energy, Inc.(1) | 2,301 |
| 316,088 |
|
| Comstock Resources, Inc. | 49,321 |
| 1,422,418 |
|
| Equal Energy Ltd. | 147,806 |
| 801,109 |
|
| Green Plains, Inc. | 72,853 |
| 2,394,678 |
|
| Panhandle Oil and Gas, Inc., Class A | 11,567 |
| 648,099 |
|
Renewable Energy Group, Inc.(1) | 72,890 |
| 836,048 |
|
REX American Resources Corp.(1) | 29,113 |
| 2,134,274 |
|
Warren Resources, Inc.(1) | 216,881 |
| 1,344,662 |
|
| | | 12,170,394 |
|
| PAPER AND FOREST PRODUCTS — 0.3% | | |
| Schweitzer-Mauduit International, Inc. | 30,425 |
| 1,328,356 |
|
| PERSONAL PRODUCTS — 1.0% | | |
Medifast, Inc.(1) | 69,566 |
| 2,115,502 |
|
USANA Health Sciences, Inc.(1) | 29,562 |
| 2,309,975 |
|
| | | 4,425,477 |
|
| PHARMACEUTICALS — 1.3% | | |
Lannett Co., Inc.(1) | 47,819 |
| 2,372,779 |
|
Nektar Therapeutics(1) | 126,935 |
| 1,627,307 |
|
| Pozen, Inc. | 32,795 |
| 273,182 |
|
| Questcor Pharmaceuticals, Inc. | 13,186 |
| 1,219,573 |
|
| | | 5,492,841 |
|
| PROFESSIONAL SERVICES — 2.3% | | |
| Barrett Business Services, Inc. | 9,636 |
| 452,892 |
|
Huron Consulting Group, Inc.(1) | 40,727 |
| 2,884,286 |
|
ICF International, Inc.(1) | 6,689 |
| 236,523 |
|
Korn/Ferry International(1) | 68,798 |
| 2,020,598 |
|
Navigant Consulting, Inc.(1) | 99,909 |
| 1,743,412 |
|
|
| | | | | |
| | Shares | Value |
RPX Corp.(1) | 134,427 |
| $ | 2,386,079 |
|
| VSE Corp. | 1,563 |
| 109,910 |
|
| | | 9,833,700 |
|
| REAL ESTATE INVESTMENT TRUSTS (REITs) — 6.0% | | |
| Alexander's, Inc. | 471 |
| 174,020 |
|
| Apollo Commercial Real Estate Finance, Inc. | 8,129 |
| 134,047 |
|
| Ashford Hospitality Trust, Inc. | 174,456 |
| 2,013,222 |
|
| Capstead Mortgage Corp. | 9,262 |
| 121,795 |
|
| CyrusOne, Inc. | 17,747 |
| 441,900 |
|
| CYS Investments, Inc. | 42,748 |
| 385,587 |
|
| DuPont Fabros Technology, Inc. | 31,568 |
| 851,073 |
|
| Dynex Capital, Inc. | 14,419 |
| 127,608 |
|
| FelCor Lodging Trust, Inc. | 239,727 |
| 2,519,531 |
|
| LTC Properties, Inc. | 66,637 |
| 2,601,509 |
|
| New Residential Investment Corp. | 59,882 |
| 377,257 |
|
| NorthStar Realty Finance Corp. | 79,538 |
| 1,382,371 |
|
| Potlatch Corp. | 63,703 |
| 2,637,304 |
|
| PS Business Parks, Inc. | 31,942 |
| 2,666,838 |
|
| Resource Capital Corp. | 34,004 |
| 191,443 |
|
| RLJ Lodging Trust | 117,782 |
| 3,402,722 |
|
| Saul Centers, Inc. | 3,410 |
| 165,726 |
|
Strategic Hotels & Resorts, Inc.(1) | 252,302 |
| 2,954,456 |
|
| Sunstone Hotel Investors, Inc. | 157,730 |
| 2,354,909 |
|
| | | 25,503,318 |
|
| ROAD AND RAIL — 0.7% | | |
| ArcBest Corp. | 60,968 |
| 2,652,718 |
|
Quality Distribution, Inc.(1) | 12,599 |
| 187,221 |
|
| | | 2,839,939 |
|
| SEMICONDUCTORS AND SEMICONDUCTOR EQUIPMENT — 5.9% | | |
Advanced Energy Industries, Inc.(1) | 67,452 |
| 1,298,451 |
|
Applied Micro Circuits Corp.(1) | 235,908 |
| 2,550,165 |
|
Cabot Microelectronics Corp.(1) | 14,862 |
| 663,588 |
|
Cirrus Logic, Inc.(1) | 86,042 |
| 1,956,595 |
|
Diodes, Inc.(1) | 10,144 |
| 293,770 |
|
First Solar, Inc.(1) | 31,142 |
| 2,212,950 |
|
International Rectifier Corp.(1) | 100,026 |
| 2,790,725 |
|
MaxLinear, Inc., Class A(1) | 159,371 |
| 1,604,866 |
|
OmniVision Technologies, Inc.(1) | 55,415 |
| 1,218,022 |
|
PLX Technology, Inc.(1) | 19,874 |
| 128,585 |
|
| Power Integrations, Inc. | 33,892 |
| 1,950,146 |
|
Rambus, Inc.(1) | 83,290 |
| 1,191,047 |
|
Semtech Corp.(1) | 77,551 |
| 2,027,959 |
|
Sigma Designs, Inc.(1) | 87,691 |
| 401,625 |
|
Synaptics, Inc.(1) | 32,446 |
| 2,940,905 |
|
TriQuint Semiconductor, Inc.(1) | 41,297 |
| 652,906 |
|
Ultra Clean Holdings, Inc.(1) | 140,235 |
| 1,269,127 |
|
| | | 25,151,432 |
|
|
| | | | | |
| | Shares | Value |
| SOFTWARE — 5.4% | | |
Aspen Technology, Inc.(1) | 16,625 |
| $ | 771,400 |
|
Cadence Design Systems, Inc.(1) | 40,420 |
| 706,946 |
|
Callidus Software, Inc.(1) | 122,309 |
| 1,460,369 |
|
Manhattan Associates, Inc.(1) | 81,343 |
| 2,800,639 |
|
| Mentor Graphics Corp. | 124,702 |
| 2,689,822 |
|
NetScout Systems, Inc.(1) | 60,581 |
| 2,686,162 |
|
| Pegasystems, Inc. | 68,218 |
| 1,440,764 |
|
PTC, Inc.(1) | 66,415 |
| 2,576,902 |
|
SS&C Technologies Holdings, Inc.(1) | 37,625 |
| 1,663,777 |
|
Take-Two Interactive Software, Inc.(1) | 130,462 |
| 2,901,475 |
|
TeleNav, Inc.(1) | 58,714 |
| 334,083 |
|
Verint Systems, Inc.(1) | 54,391 |
| 2,667,879 |
|
| | | 22,700,218 |
|
| SPECIALTY RETAIL — 2.7% | | |
Barnes & Noble, Inc.(1) | 119,503 |
| 2,723,473 |
|
| Brown Shoe Co., Inc. | 96,269 |
| 2,754,256 |
|
| Buckle, Inc. (The) | 36,616 |
| 1,624,286 |
|
| Children's Place, Inc. (The) | 44,024 |
| 2,184,911 |
|
| GameStop Corp., Class A | 30,079 |
| 1,217,297 |
|
| Haverty Furniture Cos., Inc. | 19,257 |
| 483,929 |
|
Kirkland's, Inc.(1) | 12,864 |
| 238,627 |
|
| | | 11,226,779 |
|
| TEXTILES, APPAREL AND LUXURY GOODS — 1.7% | | |
| Culp, Inc. | 24,807 |
| 431,890 |
|
Iconix Brand Group, Inc.(1) | 59,223 |
| 2,543,036 |
|
Steven Madden Ltd.(1) | 78,700 |
| 2,699,410 |
|
Unifi, Inc.(1) | 53,969 |
| 1,485,766 |
|
| | | 7,160,102 |
|
| THRIFTS AND MORTGAGE FINANCE — 1.0% | | |
| EverBank Financial Corp. | 124,192 |
| 2,503,711 |
|
Ocwen Financial Corp.(1) | 26,784 |
| 993,686 |
|
Tree.com, Inc.(1) | 6,294 |
| 183,407 |
|
Walker & Dunlop, Inc.(1) | 26,886 |
| 379,362 |
|
| | | 4,060,166 |
|
| TRADING COMPANIES AND DISTRIBUTORS — 0.1% | | |
| Aceto Corp. | 33,779 |
| 612,751 |
|
| WIRELESS TELECOMMUNICATION SERVICES — 0.2% | | |
| USA Mobility, Inc. | 56,316 |
| 867,266 |
|
TOTAL COMMON STOCKS (Cost $345,134,865) | | 422,246,316 |
|
|
| | | | | |
| | Shares | Value |
| TEMPORARY CASH INVESTMENTS — 0.5% | | |
| Repurchase Agreement, Bank of America Merrill Lynch, (collateralized by various U.S. Treasury obligations, 0.75% - 0.875%, 1/31/18 - 2/28/18, valued at $484,752), in a joint trading account at 0.05%, dated 6/30/14, due 7/1/14 (Delivery value $474,998) | | $ | 474,997 |
|
| Repurchase Agreement, Credit Suisse First Boston, Inc., (collateralized by various U.S. Treasury obligations, 1.75%, 5/15/23, valued at $193,964), in a joint trading account at 0.01%, dated 6/30/14, due 7/1/14 (Delivery value $189,999) | | 189,999 |
|
| Repurchase Agreement, Goldman Sachs & Co., (collateralized by various U.S. Treasury obligations, 3.125%, 11/15/41, valued at $387,642), in a joint trading account at 0.03%, dated 6/30/14, due 7/1/14 (Delivery value $379,997) | | 379,997 |
|
| SSgA U.S. Government Money Market Fund, Class N | 1,123,111 |
| 1,123,111 |
|
TOTAL TEMPORARY CASH INVESTMENTS (Cost $2,168,104) | | 2,168,104 |
|
TOTAL INVESTMENT SECURITIES — 100.2% (Cost $347,302,969) | | 424,414,420 |
|
| OTHER ASSETS AND LIABILITIES — (0.2)% | | (655,571 | ) |
| TOTAL NET ASSETS — 100.0% | | $ | 423,758,849 |
|
|
|
| NOTES TO SCHEDULE OF INVESTMENTS |
(1) Non-income producing.
See Notes to Financial Statements.
|
|
| Statement of Assets and Liabilities |
|
| | | |
| JUNE 30, 2014 |
| Assets |
| Investment securities, at value (cost of $347,302,969) | $ | 424,414,420 |
|
| Receivable for capital shares sold | 651,838 |
|
| Dividends and interest receivable | 300,322 |
|
| | 425,366,580 |
|
| | |
| Liabilities | |
| Payable for capital shares redeemed | 1,306,790 |
|
| Accrued management fees | 291,483 |
|
| Distribution and service fees payable | 9,458 |
|
| | 1,607,731 |
|
| | |
| Net Assets | $ | 423,758,849 |
|
| | |
| Net Assets Consist of: | |
| Capital (par value and paid-in surplus) | $ | 423,590,453 |
|
| Undistributed net investment income | 82,345 |
|
| Accumulated net realized loss | (77,025,400 | ) |
| Net unrealized appreciation | 77,111,451 |
|
| | $ | 423,758,849 |
|
|
| | | | | | |
| | Net Assets | Shares Outstanding | Net Asset Value Per Share |
| Investor Class, $0.01 Par Value |
| $342,090,056 |
| 26,122,378 |
| $13.10 |
| Institutional Class, $0.01 Par Value |
| $39,804,676 |
| 3,027,754 |
| $13.15 |
| A Class, $0.01 Par Value |
| $38,436,669 |
| 2,993,970 |
| $12.84* |
| C Class, $0.01 Par Value |
| $684,526 |
| 53,901 |
| $12.70 |
| R Class, $0.01 Par Value |
| $2,742,922 |
| 216,389 |
| $12.68 |
*Maximum offering price $13.62 (net asset value divided by 0.9425).
See Notes to Financial Statements.
|
| | | |
| YEAR ENDED JUNE 30, 2014 |
| Investment Income (Loss) |
| Income: | |
| Dividends (net of foreign taxes withheld of $7,353) | $ | 4,188,438 |
|
| Interest | 906 |
|
| | 4,189,344 |
|
| Expenses: | |
| Management fees | 3,363,689 |
|
| Distribution and service fees: | |
| A Class | 86,663 |
|
| C Class | 4,596 |
|
| R Class | 9,771 |
|
| Directors' fees and expenses | 23,718 |
|
| Other expenses | 566 |
|
| | 3,489,003 |
|
| | |
| Net investment income (loss) | 700,341 |
|
| | |
| Realized and Unrealized Gain (Loss) | |
| Net realized gain (loss) on: | |
| Investment transactions | 59,724,916 |
|
| Futures contract transactions | 41,590 |
|
| | 59,766,506 |
|
| | |
| Change in net unrealized appreciation (depreciation) on investments | 28,715,909 |
|
| | |
| Net realized and unrealized gain (loss) | 88,482,415 |
|
| | |
| Net Increase (Decrease) in Net Assets Resulting from Operations | $ | 89,182,756 |
|
See Notes to Financial Statements.
|
|
| Statement of Changes in Net Assets |
|
| | | | | | |
| YEARS ENDED JUNE 30, 2014 AND JUNE 30, 2013 |
| Increase (Decrease) in Net Assets | June 30, 2014 | June 30, 2013 |
| Operations | | |
| Net investment income (loss) | $ | 700,341 |
| $ | 2,447,770 |
|
| Net realized gain (loss) | 59,766,506 |
| 33,870,193 |
|
| Change in net unrealized appreciation (depreciation) | 28,715,909 |
| 27,284,573 |
|
| Net increase (decrease) in net assets resulting from operations | 89,182,756 |
| 63,602,536 |
|
| | | |
| Distributions to Shareholders | | |
| From net investment income: | | |
| Investor Class | (819,277 | ) | (1,851,351 | ) |
| Institutional Class | (223,632 | ) | (338,268 | ) |
| A Class | (9,668 | ) | (179,380 | ) |
| C Class | — |
| (322 | ) |
| R Class | — |
| (5,473 | ) |
| Decrease in net assets from distributions | (1,052,577 | ) | (2,374,794 | ) |
| | | |
| Capital Share Transactions | | |
Net increase (decrease) in net assets from capital share transactions (Note 5) | 33,941,478 |
| (4,515,642 | ) |
| | | |
| Net increase (decrease) in net assets | 122,071,657 |
| 56,712,100 |
|
| | | |
| Net Assets | | |
| Beginning of period | 301,687,192 |
| 244,975,092 |
|
| End of period | $ | 423,758,849 |
| $ | 301,687,192 |
|
| | | |
| Undistributed net investment income | $ | 82,345 |
| $ | 459,547 |
|
See Notes to Financial Statements.
|
|
| Notes to Financial Statements |
JUNE 30, 2014
1. Organization
American Century Quantitative Equity Funds, Inc. (the corporation) is registered under the Investment Company Act of 1940, as amended (the 1940 Act), as an open-end management investment company and is organized as a Maryland corporation. Small Company Fund (the fund) is one fund in a series issued by the corporation. The fund is diversified as defined under the 1940 Act. The fund’s investment objective is to seek long-term capital growth by investing primarily in stocks of small companies.
The fund offers the Investor Class, the Institutional Class, the A Class, the C Class and the R Class. The A Class may incur an initial sales charge. The A Class and C Class may be subject to a contingent deferred sales charge. The share classes differ principally in their respective sales charges and distribution and shareholder servicing expenses and arrangements. The Institutional Class is made available to institutional shareholders or through financial intermediaries whose clients do not require the same level of shareholder and administrative services as shareholders of other classes. As a result, the Institutional Class is charged a lower unified management fee.
2. Significant Accounting Policies
The following is a summary of significant accounting policies consistently followed by the fund in preparation of its financial statements. The financial statements are prepared in conformity with accounting principles generally accepted in the United States of America, which may require management to make certain estimates and assumptions at the date of the financial statements. Actual results could differ from these estimates. Management evaluated the impact of events or transactions occurring through the date the financial statements were issued that would merit recognition or disclosure.
Investment Valuations — The fund determines the fair value of its investments and computes its net asset value per share at the close of regular trading (usually 4 p.m. Eastern time) on the New York Stock Exchange (NYSE) on each day the NYSE is open. The Board of Directors has adopted valuation policies and procedures to guide the investment advisor in the fund’s investment valuation process and to provide methodologies for the oversight of the fund’s pricing function.
Equity securities that are listed or traded on a domestic securities exchange are valued at the last reported sales price or at the official closing price as provided by the exchange. Equity securities traded on foreign securities exchanges are generally valued at the closing price of such securities on the exchange where primarily traded or at the close of the NYSE, if that is earlier. If no last sales price is reported, or if local convention or regulation so provides, the mean of the latest bid and asked prices may be used. Securities traded over-the-counter are valued at the mean of the latest bid and asked prices, the last sales price, or the official closing price.
Fixed income securities maturing within 60 days at the time of purchase may be valued at cost, plus or minus any amortized discount or premium or at the evaluated mean as provided by an independent pricing service. Evaluated mean prices are commonly derived through utilization of market models, which may consider, among other factors: trade data, quotations from dealers and active market makers, relevant yield curve and spread data, related sector levels, creditworthiness, trade data or market information on comparable securities, and other relevant security specific information.
Open-end management investment companies are valued at the reported net asset value per share. Repurchase agreements are valued at cost, which approximates fair value. Exchange-traded futures contracts are valued at the settlement price as provided by the appropriate clearing corporation.
If the fund determines that the market price for an investment is not readily available or the valuation methods mentioned above do not reflect an investment’s fair value, such investment is valued as determined in good faith by the Board of Directors or its delegate, in accordance with policies and procedures adopted by the Board of Directors. In its determination of fair value, the fund may review several factors including, but not limited to, market information regarding the specific investment or comparable investments and correlation with other investment types, futures indices or general market indicators. Circumstances that may cause the fund to use these procedures to value an investment include, but are not limited to: an investment has been
declared in default or is distressed; trading in a security has been suspended during the trading day or a security is not actively trading on its principal exchange; prices received from a regular pricing source are deemed unreliable; or there is a foreign market holiday and no trading occurred.
The fund monitors for significant events occurring after the close of an investment’s primary exchange but before the fund’s net asset value per share is determined. Significant events may include, but are not limited to: corporate announcements and transactions; governmental action and political unrest that could impact a specific investment or an investment sector; or armed conflicts, natural disasters and similar events that could affect investments in a specific country or region. The fund also monitors for significant fluctuations between domestic and foreign markets, as evidenced by the U.S. market or such other indicators that the Board of Directors, or its delegate, deems appropriate. If significant fluctuations in foreign markets are identified, the fund may apply a model-derived factor to the closing price of equity securities traded on foreign securities exchanges. The factor is based on observable market data as provided by an independent pricing service.
Security Transactions — Security transactions are accounted for as of the trade date. Net realized gains and losses are determined on the identified cost basis, which is also used for federal income tax purposes.
Investment Income — Dividend income less foreign taxes withheld, if any, is recorded as of the ex-dividend date. Distributions received on securities that represent a return of capital or long-term capital gain are recorded as a reduction of cost of investments and/or as a realized gain. The fund may estimate the components of distributions received that may be considered nontaxable distributions or long-term capital gain distributions for income tax purposes. Interest income is recorded on the accrual basis and includes accretion of discounts and amortization of premiums.
Repurchase Agreements — The fund may enter into repurchase agreements with institutions that American Century Investment Management, Inc. (ACIM) (the investment advisor) has determined are creditworthy pursuant to criteria adopted by the Board of Directors. The fund requires that the collateral, represented by securities, received in a repurchase transaction be transferred to the custodian in a manner sufficient to enable the fund to obtain those securities in the event of a default under the repurchase agreement. ACIM monitors, on a daily basis, the securities transferred to ensure the value, including accrued interest, of the securities under each repurchase agreement is equal to or greater than amounts owed to the fund under each repurchase agreement.
Joint Trading Account — Pursuant to an Exemptive Order issued by the Securities and Exchange Commission, the fund, along with certain other funds in the American Century Investments family of funds, may transfer uninvested cash balances into a joint trading account. These balances are invested in one or more repurchase agreements that are collateralized by U.S. Treasury or Agency obligations.
Segregated Assets — In accordance with the 1940 Act, the fund segregates assets on its books and records to cover futures contracts. ACIM monitors, on a daily basis, the securities segregated to ensure the fund designates a sufficient amount of liquid assets, marked-to-market daily. The fund may also receive assets or be required to pledge assets at the custodian bank or with a broker for margin requirements on futures contracts.
Income Tax Status — It is the fund’s policy to distribute substantially all net investment income and net realized gains to shareholders and to otherwise qualify as a regulated investment company under provisions of the Internal Revenue Code. Accordingly, no provision has been made for income taxes. The fund files U.S. federal, state, local and non-U.S. tax returns as applicable. The fund's tax returns are subject to examination by the relevant taxing authority until expiration of the applicable statute of limitations, which is generally three years from the date of filing but can be longer in certain jurisdictions. At this time, management believes there are no uncertain tax positions which, based on their technical merit, would not be sustained upon examination and for which it is reasonably possible that the total amounts of unrecognized tax benefits will significantly change in the next twelve months.
Multiple Class — All shares of the fund represent an equal pro rata interest in the net assets of the class to which such shares belong, and have identical voting, dividend, liquidation and other rights and the same terms and conditions, except for class specific expenses and exclusive rights to vote on matters affecting only individual classes. Income, non-class specific expenses, and realized and unrealized capital gains and losses of the fund are allocated to each class of shares based on their relative net assets.
Distributions to Shareholders — Distributions from net investment income, if any, are generally declared and paid quarterly. Distributions from net realized gains, if any, are generally declared and paid annually.
Indemnifications — Under the corporation’s organizational documents, its officers and directors are indemnified against certain liabilities arising out of the performance of their duties to the fund. In addition, in the normal course of business, the fund enters into contracts that provide general indemnifications. The maximum exposure under these arrangements is unknown as this would involve future claims that may be made against a fund. The risk of material loss from such claims is considered by management to be remote.
3. Fees and Transactions with Related Parties
Certain officers and directors of the corporation are also officers and/or directors of American Century Companies, Inc. (ACC). The corporation’s investment advisor, ACIM, the corporation's distributor, American Century Investment Services, Inc. (ACIS), and the corporation’s transfer agent, American Century Services, LLC, are wholly owned, directly or indirectly, by ACC. Various funds issued by American Century Asset Allocation Portfolios, Inc. and American Century Strategic Asset Allocations, Inc. own, in aggregate, 23% of the shares of the fund.
Management Fees — The corporation has entered into a management agreement with ACIM, under which ACIM provides the fund with investment advisory and management services in exchange for a single, unified management fee (the fee) per class. The agreement provides that all expenses of managing and operating the fund, except distribution and service fees, brokerage expenses, taxes, interest, fees and expenses of the independent directors (including legal counsel fees), and extraordinary expenses, will be paid by ACIM. The fee is computed and accrued daily based on each class's daily net assets and paid monthly in arrears. The fee consists of (1) an Investment Category Fee based on the daily net assets of the fund and certain other accounts managed by the investment advisor that are in the same broad investment category as the fund and (2) a Complex Fee based on the assets of all the funds in the American Century Investments family of funds. The rates for the Investment Category Fee range from 0.5380% to 0.7200%. The rates for the Complex Fee range from 0.2500% to 0.3100% for the Investor Class, A Class, C Class and R Class. The rates for the Complex Fee range from 0.0500% to 0.1100% for the Institutional Class. The effective annual management fee for each class for the year ended June 30, 2014 was 0.87% for the Investor Class, A Class, C Class and R Class and 0.67% for the Institutional Class.
Distribution and Service Fees — The Board of Directors has adopted a separate Master Distribution and Individual Shareholder Services Plan for each of the A Class, C Class and R Class (collectively the plans), pursuant to Rule 12b-1 of the 1940 Act. The plans provide that the A Class will pay ACIS an annual distribution and service fee of 0.25%. The plans provide that the C Class will pay ACIS an annual distribution and service fee of 1.00%, of which 0.25% is paid for individual shareholder services and 0.75% is paid for distribution services. The plans provide that the R Class will pay ACIS an annual distribution and service fee of 0.50%. The fees are computed and accrued daily based on each class’s daily net assets and paid monthly in arrears. The fees are used to pay financial intermediaries for distribution and individual shareholder services. Fees incurred under the plans during the year ended June 30, 2014 are detailed in the Statement of Operations.
Directors' Fees and Expenses — The Board of Directors is responsible for overseeing the investment advisor’s management and operations of the fund. The directors receive detailed information about the fund and its investment advisor regularly throughout the year, and meet at least quarterly with management of the investment advisor to review reports about fund operations. Fees and expenses incurred in conjunction with the directors during the year ended June 30, 2014 are detailed in the Statement of Operations. The fund’s officers do not receive compensation from the fund.
4. Investment Transactions
Purchases and sales of investment securities, excluding short-term investments, for the year ended June 30, 2014 were $363,813,060 and $326,524,332, respectively.
5. Capital Share Transactions
Transactions in shares of the fund were as follows:
|
| | | | | | | | | | |
| | Year ended June 30, 2014 | Year ended June 30, 2013 |
| | Shares | Amount | Shares | Amount |
| Investor Class/Shares Authorized | 175,000,000 |
| | 200,000,000 |
| |
| Sold | 9,832,062 |
| $ | 113,605,442 |
| 3,498,387 |
| $ | 32,689,224 |
|
| Issued in reinvestment of distributions | 69,246 |
| 804,576 |
| 208,686 |
| 1,814,208 |
|
| Redeemed | (6,591,527 | ) | (79,024,918 | ) | (3,781,840 | ) | (34,374,585 | ) |
| | 3,309,781 |
| 35,385,100 |
| (74,767 | ) | 128,847 |
|
| Institutional Class/Shares Authorized | 50,000,000 |
| | 100,000,000 |
| |
| Sold | 676,351 |
| 8,103,817 |
| 725,575 |
| 6,624,102 |
|
| Issued in reinvestment of distributions | 18,841 |
| 223,479 |
| 38,679 |
| 337,845 |
|
| Redeemed | (1,212,044 | ) | (14,876,569 | ) | (786,549 | ) | (7,168,177 | ) |
| | (516,852 | ) | (6,549,273 | ) | (22,295 | ) | (206,230 | ) |
| A Class/Shares Authorized | 50,000,000 |
| | 140,000,000 |
| |
| Sold | 1,179,236 |
| 13,737,241 |
| 561,261 |
| 5,069,211 |
|
| Issued in reinvestment of distributions | 876 |
| 9,624 |
| 20,992 |
| 178,740 |
|
| Redeemed | (831,330 | ) | (9,883,023 | ) | (1,147,527 | ) | (10,046,009 | ) |
| | 348,782 |
| 3,863,842 |
| (565,274 | ) | (4,798,058 | ) |
| C Class/Shares Authorized | 10,000,000 |
| | 10,000,000 |
| |
| Sold | 32,612 |
| 384,884 |
| 26,032 |
| 239,425 |
|
| Issued in reinvestment of distributions | – |
| – |
| 38 |
| 322 |
|
| Redeemed | (8,699 | ) | (101,795 | ) | (5,586 | ) | (51,722 | ) |
| | 23,913 |
| 283,089 |
| 20,484 |
| 188,025 |
|
| R Class/Shares Authorized | 10,000,000 |
| | 10,000,000 |
| |
| Sold | 151,181 |
| 1,777,695 |
| 64,202 |
| 577,806 |
|
| Issued in reinvestment of distributions | – |
| – |
| 605 |
| 5,089 |
|
| Redeemed | (69,691 | ) | (818,975 | ) | (46,128 | ) | (411,121 | ) |
| | 81,490 |
| 958,720 |
| 18,679 |
| 171,774 |
|
| Net increase (decrease) | 3,247,114 |
| $ | 33,941,478 |
| (623,173 | ) | $ | (4,515,642 | ) |
6. Fair Value Measurements
The fund’s investments valuation process is based on several considerations and may use multiple inputs to determine the fair value of the investments held by the fund. In conformity with accounting principles generally accepted in the United States of America, the inputs used to determine a valuation are classified into three broad levels.
| |
| • | Level 1 valuation inputs consist of unadjusted quoted prices in an active market for identical investments. |
| |
| • | Level 2 valuation inputs consist of direct or indirect observable market data (including quoted prices for comparable investments, evaluations of subsequent market events, interest rates, prepayment speeds, credit risk, etc.). These inputs also consist of quoted prices for identical investments initially expressed in local currencies that are adjusted through translation into U.S. dollars. |
| |
| • | Level 3 valuation inputs consist of unobservable data (including a fund’s own assumptions). |
The level classification is based on the lowest level input that is significant to the fair valuation measurement. The valuation inputs are not necessarily an indication of the risks associated with investing in these securities or other financial instruments.
The following is a summary of the level classifications as of period end. The Schedule of Investments provides additional information on the fund’s portfolio holdings.
|
| | | | | | | | |
| | Level 1 | Level 2 | Level 3 |
| Assets | | | |
| Investment Securities | | | |
| Common Stocks | $ | 422,246,316 |
| — |
| — |
|
| Temporary Cash Investments | 1,123,111 |
| $ | 1,044,993 |
| — |
|
| | $ | 423,369,427 |
| $ | 1,044,993 |
| — |
|
7. Derivative Instruments
Equity Price Risk — The fund is subject to equity price risk in the normal course of pursuing its investment objectives. A fund may enter into futures contracts based on an equity index in order to manage its exposure to changes in market conditions. A fund may purchase futures contracts to gain exposure to increases in market value or sell futures contracts to protect against a decline in market value. Upon entering into a futures contract, a fund is required to deposit either cash or securities in an amount equal to a certain percentage of the contract value (initial margin). Subsequent payments (variation margin) are made or received daily, in cash, by a fund. The variation margin is equal to the daily change in the contract value and is recorded as unrealized gains and losses. A fund recognizes a realized gain or loss when the contract is closed or expires. Net realized and unrealized gains or losses occurring during the holding period of futures contracts are a component of net realized gain (loss) on futures contract transactions and change in net unrealized appreciation (depreciation) on futures contracts, respectively. One of the risks of entering into futures contracts is the possibility that the change in value of the contract may not correlate with the changes in value of the underlying securities. During the period, the fund infrequently purchased equity price risk derivative instruments for temporary investment purposes.
At period end, the fund did not have any derivative instruments disclosed on the Statement of Assets and Liabilities. For the year ended June 30, 2014, the effect of equity price risk derivative instruments on the Statement of Operations was $41,590 in net realized gain (loss) on futures contract transactions.
8. Risk Factors
The fund concentrates its investments in common stocks of small companies. Because of this, the fund may be subject to greater risk and market fluctuations than a fund investing in larger, more established companies.
9. Federal Tax Information
The tax character of distributions paid during the years ended June 30, 2014 and June 30, 2013 were as follows:
|
| | | | | | |
| | 2014 | 2013 |
| Distributions Paid From | | |
| Ordinary income | $ | 1,052,577 |
| $ | 2,374,794 |
|
| Long-term capital gains | — |
| — |
|
The book-basis character of distributions made during the year from net investment income or net realized gains may differ from their ultimate characterization for federal income tax purposes. These differences reflect the differing character of certain income items and net realized gains and losses for financial statement and tax purposes, and may result in reclassification among certain capital accounts on the financial statements.
As of June 30, 2014, the federal tax cost of investments and the components of distributable earnings on a tax-basis were as follows:
|
| | | |
| Federal tax cost of investments | $ | 347,512,404 |
|
| Gross tax appreciation of investments | $ | 85,198,615 |
|
| Gross tax depreciation of investments | (8,296,599 | ) |
| Net tax appreciation (depreciation) of investments | $ | 76,902,016 |
|
| Undistributed ordinary income | 302,395 |
|
Accumulated short-term capital losses
| $ | (77,036,015 | ) |
| | |
The difference between book-basis and tax-basis unrealized appreciation (depreciation) is attributable primarily to the realization to ordinary income for tax purposes of unrealized gains on investments in passive foreign investment companies.
Accumulated capital losses represent net capital loss carryovers that may be used to offset future realized capital gains for federal income tax purposes. Future capital loss carryover utilization in any given year may be subject to Internal Revenue Code limitations. Capital loss carryovers expire in 2018.
|
| | | | | | | | | | | | | |
| For a Share Outstanding Throughout the Years Ended June 30 (except as noted) | | | |
| Per-Share Data | | | | | Ratios and Supplemental Data | |
| | | Income From Investment Operations: | | | | Ratio to Average Net Assets of: | | |
| | Net Asset Value, Beginning of Period | Net Investment Income (Loss)(1) | Net Realized and Unrealized Gain (Loss) | Total From Investment Operations | Distributions From Net Investment Income | Net Asset Value, End of Period | Total Return(2) | Operating Expenses | Net Investment Income (Loss) | Portfolio Turnover Rate | Net Assets, End of Period (in thousands) |
| Investor Class | | | | | | | | |
| 2014 | $10.36 | 0.02 | 2.75 | 2.77 | (0.03) | $13.10 | 26.79% | 0.87% | 0.18% | 83% |
| $342,090 |
|
| 2013 | $8.24 | 0.08 | 2.12 | 2.20 | (0.08) | $10.36 | 26.92% | 0.88% | 0.92% | 93% |
| $236,280 |
|
| 2012 | $8.38 | 0.04 | (0.16) | (0.12) | (0.02) | $8.24 | (1.37)% | 0.89% | 0.45% | 72% |
| $188,519 |
|
| 2011 | $6.15 | 0.01 | 2.23 | 2.24 | (0.01) | $8.38 | 36.39% | 0.89% | 0.17% | 61% |
| $218,642 |
|
| 2010 | $5.00 | 0.01 | 1.16 | 1.17 | (0.02) | $6.15 | 23.39% | 0.90% | 0.12% | 44% |
| $234,727 |
|
| Institutional Class | | | | | | | | |
| 2014 | $10.41 | 0.05 | 2.76 | 2.81 | (0.07) | $13.15 | 27.02% | 0.67% | 0.38% | 83% |
| $39,805 |
|
| 2013 | $8.27 | 0.10 | 2.14 | 2.24 | (0.10) | $10.41 | 27.27% | 0.68% | 1.12% | 93% |
| $36,886 |
|
| 2012 | $8.42 | 0.05 | (0.15) | (0.10) | (0.05) | $8.27 | (1.20)% | 0.69% | 0.65% | 72% |
| $29,506 |
|
| 2011 | $6.19 | 0.03 | 2.22 | 2.25 | (0.02) | $8.42 | 36.43% | 0.69% | 0.37% | 61% |
| $42,541 |
|
| 2010 | $5.02 | 0.02 | 1.18 | 1.20 | (0.03) | $6.19 | 23.87% | 0.70% | 0.32% | 44% |
| $42,599 |
|
A Class(3) | | | | | | | | | | |
| 2014 | $10.15 | (0.01) | 2.70 | 2.69 | —(4) | $12.84 | 26.54% | 1.12% | (0.07)% | 83% |
| $38,437 |
|
| 2013 | $8.08 | 0.06 | 2.07 | 2.13 | (0.06) | $10.15 | 26.58% | 1.13% | 0.67% | 93% |
| $26,862 |
|
| 2012 | $8.22 | 0.02 | (0.15) | (0.13) | (0.01) | $8.08 | (1.64)% | 1.14% | 0.20% | 72% |
| $25,944 |
|
| 2011 | $6.05 | (0.01) | 2.18 | 2.17 | — | $8.22 | 35.87% | 1.14% | (0.08)% | 61% |
| $33,452 |
|
| 2010 | $4.91 | (0.01) | 1.16 | 1.15 | (0.01) | $6.05 | 23.40% | 1.15% | (0.13)% | 44% |
| $35,567 |
|
|
| | | | | | | | | | | | | |
| For a Share Outstanding Throughout the Years Ended June 30 (except as noted) | | | |
| Per-Share Data | | | | | Ratios and Supplemental Data | |
| | | Income From Investment Operations: | | | | Ratio to Average Net Assets of: | | |
| | Net Asset Value, Beginning of Period | Net Investment Income (Loss)(1) | Net Realized and Unrealized Gain (Loss) | Total From Investment Operations | Distributions From Net Investment Income | Net Asset Value, End of Period | Total Return(2) | Operating Expenses | Net Investment Income (Loss) | Portfolio Turnover Rate | Net Assets, End of Period (in thousands) |
| C Class | | | | | | | | |
| 2014 | $10.12 | (0.10) | 2.68 | 2.58 | — | $12.70 | 25.49% | 1.87% | (0.82)% | 83% |
| $685 |
|
| 2013 | $8.08 | (0.03) | 2.10 | 2.07 | (0.03) | $10.12 | 25.68% | 1.88% | (0.08)% | 93% |
| $303 |
|
| 2012 | $8.27 | (0.04) | (0.15) | (0.19) | — | $8.08 | (2.30)% | 1.89% | (0.55)% | 72% |
| $77 |
|
| 2011 | $6.13 | (0.06) | 2.20 | 2.14 | — | $8.27 | 34.91% | 1.89% | (0.83)% | 61% |
| $74 |
|
2010(5) | $6.40 | (0.02) | (0.25) | (0.27) | — | $6.13 | (4.22)% | 1.90%(6) | (0.79)%(6) | 44%(7) |
| $24 |
|
| R Class | | | | | | | | | | | |
| 2014 | $10.05 | (0.04) | 2.67 | 2.63 | — | $12.68 | 26.17% | 1.37% | (0.32)% | 83% |
| $2,743 |
|
| 2013 | $8.00 | 0.04 | 2.06 | 2.10 | (0.05) | $10.05 | 26.33% | 1.38% | 0.42% | 93% |
| $1,356 |
|
| 2012 | $8.15 | —(4) | (0.15) | (0.15) | — | $8.00 | (1.84)% | 1.39% | (0.05)% | 72% |
| $930 |
|
| 2011 | $6.01 | (0.02) | 2.16 | 2.14 | — | $8.15 | 35.61% | 1.39% | (0.33)% | 61% |
| $945 |
|
| 2010 | $4.89 | (0.02) | 1.14 | 1.12 | — | $6.01 | 22.90% | 1.40% | (0.38)% | 44% |
| $384 |
|
|
|
| Notes to Financial Highlights |
| |
| (1) | Computed using average shares outstanding throughout the period. |
| |
| (2) | Total returns are calculated based on the net asset value of the last business day and do not reflect applicable sales charges, if any. Total returns for periods less than one year are not annualized. |
| |
| (3) | Prior to March 1, 2010, the A Class was referred to as the Advisor Class. |
| |
| (4) | Per-share amount was less than $0.005. |
| |
| (5) | March 1, 2010 (commencement of sale) through June 30, 2010. |
| |
| (7) | Portfolio turnover is calculated at the fund level. Percentage indicated was calculated for the year ended June 30, 2010. |
See Notes to Financial Statements.
|
|
| Report of Independent Registered Public Accounting Firm |
To the Directors of the American Century Quantitative Equity Funds, Inc. and Shareholders of the Small Company Fund:
In our opinion, the accompanying statement of assets and liabilities, including the schedule of investments, and the related statements of operations, of changes in net assets and the financial highlights present fairly, in all material respects, the financial position of the Small Company Fund (one of the fifteen funds comprising the American Century Quantitative Equity Funds, Inc., hereafter referred to as the “Fund”) at June 30, 2014, the results of its operations for the year then ended, the changes in its net assets for each of the two years in the period then ended and the financial highlights for each of the periods presented, in conformity with accounting principles generally accepted in the United States of America. These financial statements and financial highlights (hereafter referred to as "financial statements") are the responsibility of the Fund's management. Our responsibility is to express an opinion on these financial statements based on our audits. We conducted our audits of these financial statements in accordance with the standards of the Public Company Accounting Oversight Board (United States). Those standards require that we plan and perform the audit to obtain reasonable assurance about whether the financial statements are free of material misstatement. An audit includes examining, on a test basis, evidence supporting the amounts and disclosures in the financial statements, assessing the accounting principles used and significant estimates made by management, and evaluating the overall financial statement presentation. We believe that our audits, which included confirmation of securities at June 30, 2014 by correspondence with the custodian and brokers, provide a reasonable basis for our opinion.
PricewaterhouseCoopers LLP
Kansas City, Missouri
August 21, 2014
Board of Directors
The individuals listed below serve as directors of the funds. Each director will continue to serve in this capacity until death, retirement, resignation or removal from office. The board has adopted a mandatory retirement age for directors who are not “interested persons,” as that term is defined in the Investment Company Act (independent directors). Independent directors shall retire on December 31 of the year in which they reach their 75th birthday; provided, however, that on or after January 1, 2022, independent directors shall retire on December 31 of the year in which they reach their 76th birthday.
Mr. Thomas is an “interested person” because he currently serves as President and Chief Executive Officer of American Century Companies, Inc. (ACC), the parent company of American Century Investment Management, Inc. (ACIM or the advisor). The other directors (more than three-fourths of the total number) are independent. They are not employees, directors or officers of, and have no financial interest in, ACC or any of its wholly owned, direct or indirect, subsidiaries, including ACIM, American Century Investment Services, Inc. (ACIS) and American Century Services, LLC (ACS), and do not have any other affiliations, positions or relationships that would cause them to be considered “interested persons” under the Investment Company Act. The directors serve in this capacity for eight (in the case of Mr. Thomas, 15) registered investment companies in the American Century Investments family of funds.
The following table presents additional information about the directors. The mailing address for each director other than Mr. Thomas is 1665 Charleston Road, Mountain View, California 94043. The mailing address for Mr. Thomas is 4500 Main Street, Kansas City, Missouri 64111.
|
| | | | | |
Name (Year of Birth) | Position(s) Held with Funds | Length of Time Served | Principal Occupation(s) During Past 5 Years | Number of
American
Century
Portfolios
Overseen
by Director | Other Directorships Held During Past 5 Years |
| Independent Directors |
Tanya S. Beder (1955) | Director | Since 2011 | Chairman, SBCC Group Inc. (independent advisory services) (2006 to present) | 42 | CYS Investments, Inc. (specialty finance company) |
Jeremy I. Bulow (1954) | Director | Since 2011 | Professor of Economics, Stanford University, Graduate School of Business (1979 to present) | 42 | None |
Ronald J. Gilson (1946) | Director and Chairman of the Board | Since 1995 (Chairman since 2005) | Charles J. Meyers Professor of Law and Business, Stanford Law School (1979 to present); Marc and Eva Stern Professor of Law and Business, Columbia University School of Law (1992 to present) | 42 | None |
|
| | | | | |
Name (Year of Birth) | Position(s) Held with Funds | Length of Time Served | Principal Occupation(s) During Past 5 Years | Number of
American
Century
Portfolios
Overseen
by Director | Other Directorships Held During Past 5 Years |
| Independent Directors |
Frederick L. A. Grauer (1946) | Director | Since 2008 | Senior Advisor, BlackRock, Inc. (investment management firm) (2010 to 2011); Senior Advisor, Barclays Global Investors (investment management firm) (2003 to 2009) | 42 | None |
Peter F. Pervere
(1947) | Director | Since 2007 | Retired | 42 | Intraware, Inc. (2003 to 2009) |
Myron S. Scholes(1) (1941) | Director | Since 1980 | Chairman, Platinum Grove Asset Management, L.P. (asset manager) (1999 to 2009); Frank E. Buck Professor of Finance-Emeritus, Stanford Graduate School of Business (1996 to present) | 42 | Dimensional Fund Advisors (investment advisor); CME Group, Inc. (futures and options exchange) |
John B. Shoven
(1947) | Director | Since 2002 | Professor of Economics, Stanford University (1973 to present) | 42 | Cadence Design Systems; Exponent; Financial Engines |
| Interested Director |
Jonathan S. Thomas
(1963) | Director and
President | Since 2007 | President and Chief Executive Officer, ACC (March 2007 to present). Also serves as Chief Executive Officer and Manager, ACS; Executive Vice President, ACIM; Director, ACC, ACIM and other ACC subsidiaries | 115 | None |
(1) Myron S. Scholes resigned as director effective July 31, 2014.
Officers
The following table presents certain information about the executive officers of the funds. Each officer serves as an officer for each of the 15 investment companies in the American Century family of funds, unless otherwise noted. No officer is compensated for his or her service as an officer of the funds. The listed officers are interested persons of the funds and are appointed or re-appointed on an annual basis. The mailing address for each of the officers listed below is 4500 Main Street, Kansas City, Missouri 64111.
|
| | |
Name (Year of Birth) | Offices with the Funds | Principal Occupation(s) During the Past Five Years |
Jonathan S. Thomas (1963) | Director and President since 2007 | President and Chief Executive Officer, ACC (March 2007 to present). Also serves as Chief Executive Officer and Manager, ACS; Executive Vice President, ACIM; Director, ACC, ACIM and other ACC subsidiaries |
| Amy D. Shelton (1964) | Chief Compliance Officer since 2014 | Chief Compliance Officer, American Century funds, (March 2014 to present); Chief Compliance Officer, ACIM (February 2014 to present); Chief Compliance Officer, ACIS (October 2009 to present); Vice President, Client Interactions and Marketing, ACIS (February 2013 to January 2014); Director, Client Interactions and Marketing, ACIS (June 2007 to January 2013). Also serves as Vice President, ACIS |
Charles A. Etherington (1957) | General Counsel since 2007 and Senior Vice President since 2006 | Attorney, ACC (February 1994 to present); Vice President, ACC (November 2005 to present); General Counsel, ACC (March 2007 to present). Also serves as General Counsel, ACIM, ACS, ACIS and other ACC subsidiaries; and Senior Vice President, ACIM and ACS |
C. Jean Wade (1964) | Vice President, Treasurer and Chief Financial Officer since 2012 | Vice President, ACS (February 2000 to present) |
Robert J. Leach (1966) | Vice President since 2006 and Assistant Treasurer since 2012 | Vice President, ACS (February 2000 to present) |
David H. Reinmiller (1963) | Vice President since 2001 | Attorney, ACC (January 1994 to present); Associate General Counsel, ACC (January 2001 to present). Also serves as Vice President, ACIM and ACS |
Ward D. Stauffer (1960) | Secretary since 2005 | Attorney, ACC (June 2003 to present) |
The Statement of Additional Information has additional information about the fund’s directors and is available without charge, upon request, by calling 1-800-345-2021.
|
|
| Approval of Management Agreement |
At a meeting held on June 13, 2014, the Fund’s Board of Directors/Trustees unanimously approved the renewal of the management agreement pursuant to which American Century Investment Management, Inc. (the “Advisor”) acts as the investment advisor for the Fund. Under Section 15(c) of the Investment Company Act, contracts for investment advisory services are required to be reviewed, evaluated, and approved by a majority of a fund’s directors/trustees (the “Directors”), including a majority of the independent Directors, each year. The Board regards this annual evaluation and renewal as one of its most important responsibilities.
The independent Directors have memorialized a statement regarding the relationship between their ongoing obligations to oversee and evaluate the performance of the Advisor and their annual consideration of renewal of the management agreement. In that statement, the independent Directors noted that their assessment of the Advisor’s performance is an ongoing process that takes place over the entire year and is informed by all of the extensive information that the Board and its committees receive and consider over time. This information, together with the materials provided in connection with the review, are central to the Board’s assessment of the Advisor’s performance and its determination whether to renew the Fund’s management agreement.
Prior to its consideration of the renewal of the management agreement, the Board requested and reviewed extensive data and analysis relating to the proposed renewal. This information and analysis was compiled by the Advisor and certain independent providers of evaluation data concerning the Fund and the services provided to the Fund by the Advisor.
In connection with its consideration of the renewal of the management agreement, the Board’s review and evaluation of the services provided by the Advisor included, but was not limited to, the following:
| |
| • | the nature, extent, and quality of investment management, shareholder services, and other services provided by the Advisor to the Fund; |
| |
| • | the wide range of other programs and services the Advisor provides to the Fund and its shareholders on a routine and non-routine basis; |
| |
| • | the investment performance of the Fund, including data comparing the Fund’s performance to appropriate benchmarks and/or a peer group of other mutual funds with similar investment objectives and strategies; |
| |
| • | the cost of owning the Fund compared to the cost of owning similar funds; |
| |
| • | the Advisor’s compliance policies, procedures, and regulatory experience; |
| |
| • | financial data showing the cost of services provided to the Fund, the profitability of the Fund to the Advisor, and the overall profitability of the Advisor; |
| |
| • | possible economies of scale associated with the Advisor’s management of the Fund and other accounts under its management; |
| |
| • | data comparing services provided and charges to other investment management clients of the Advisor; and |
| |
| • | any collateral benefits derived by the Advisor from the management of the Fund. |
In keeping with its practice, the Board held two in-person meetings to review and discuss the information provided. The independent Directors also had the benefit of the advice of their independent counsel throughout the process.
Factors Considered
The Directors considered all of the information provided by the Advisor, the independent data providers, and the independent Directors’ independent counsel in connection with the review, and evaluated such information for the Fund. In connection with their review, the Directors did not identify any single factor as being all-important or controlling and each Director may have attributed
different levels of importance to different factors. In deciding to renew the management agreement, the Board based its decision on a number of factors, including the following:
Nature, Extent and Quality of Services — Generally. Under the management agreement, the Advisor is responsible for providing or arranging for all services necessary for the operation of the Fund. The Board noted that under the management agreement, the Advisor provides or arranges at its own expense a wide variety of services including:
| |
| • | constructing and designing the Fund |
| |
| • | portfolio research and security selection |
| |
| • | initial capitalization/funding |
| |
| • | daily valuation of the Fund’s portfolio |
| |
| • | shareholder servicing and transfer agency, including shareholder confirmations, recordkeeping, and communications |
| |
| • | regulatory and portfolio compliance |
| |
| • | marketing and distribution |
The Board noted that many of these services have expanded over time both in terms of quantity and complexity in response to shareholder demands, competition in the industry, changing distribution channels, and the changing regulatory environment.
Investment Management Services. The nature of the investment management services provided to the Fund is quite complex and allows Fund shareholders access to professional money management, instant diversification of their investments within an asset class, the opportunity to easily diversify among asset classes by investing in or exchanging among various American Century Investments funds, and liquidity. In evaluating investment performance, the Board expects the Advisor to manage the Fund in accordance with its investment objectives and approved strategies. Further, the Directors recognize that the Advisor has an obligation to seek the best execution of fund trades. In providing these services, the Advisor utilizes teams of investment professionals (portfolio managers, analysts, research assistants, and securities traders) who require extensive information technology, research, training, compliance and other systems to conduct their business. The Board, directly and through its Portfolio Committee, regularly reviews investment performance information for the Fund, together with comparative information for appropriate benchmarks and/or peer groups of similarly-managed funds, over different time horizons. The Directors also review detailed performance information during the management agreement approval process. If performance concerns are identified, the Fund receives special reviews until performance improves, during which the Board discusses with the Advisor the reasons for such results (e.g., market conditions, security selection) and any efforts being undertaken to improve performance. The Fund’s performance was above its benchmark for the one-, three-, and five-year periods and below its benchmark for the ten-year period reviewed by the Board. The Board found the investment management services provided by the Advisor to the Fund to be satisfactory and consistent with the management agreement.
Shareholder and Other Services. Under the management agreement, the Advisor provides the Fund with a comprehensive package of transfer agency, shareholder, and other services. The Board, directly and through various committees of the Board, regularly reviews reports and evaluations of such services at its regular meetings. These reports include, but are not limited to, information regarding the operational efficiency and accuracy of the shareholder and transfer agency services provided, staffing levels, shareholder satisfaction (as measured by external as well as internal sources), technology support, new products and services offered to Fund shareholders, securities trading activities, portfolio valuation services, auditing services, and legal and operational compliance activities. Certain aspects of shareholder and transfer agency service level efficiency
and the quality of securities trading activities are measured by independent third party providers and are presented in comparison to other fund groups not managed by the Advisor. The Board found the services provided by the Advisor to the Fund under the management agreement to be competitive and of high quality.
Costs of Services and Profitability. The Advisor provides detailed information concerning its cost of providing various services to the Fund, its profitability in managing the Fund, its overall profitability, and its financial condition. The Directors have reviewed with the Advisor the methodology used to prepare this financial information. The financial information regarding the Advisor is considered in evaluating the Advisor’s financial condition, its ability to continue to provide services under the management agreement, and the reasonableness of the current management fee. The Board concluded that the Advisor’s profits were reasonable in light of the services provided to the Fund.
Ethics. The Board generally considers the Advisor’s commitment to providing quality services to shareholders and to conducting its business ethically. They noted that the Advisor’s practices generally meet or exceed industry best practices.
Economies of Scale. The Board also reviewed information provided by the Advisor regarding the possible existence of economies of scale in connection with the management of the Fund. The Board concluded that economies of scale are difficult to measure and predict with precision, especially on a fund-by-fund basis. The Board concluded that the Advisor is appropriately sharing economies of scale through its competitive fee structure, offering competitive fees from fund inception, and through reinvestment in its business to provide shareholders additional content and services.
Comparison to Other Funds’ Fees. The management agreement provides that the Fund pays the Advisor a single, all-inclusive (or unified) management fee for providing all services necessary for the management and operation of the Fund, other than brokerage expenses, taxes, interest, extraordinary expenses, and the fees and expenses of the Fund’s independent directors (including their independent legal counsel) and expenses incurred in connection with the provision of shareholder services and distribution services under a plan adopted pursuant to Rule 12b-1 under the 1940 Act. Under the unified fee structure, the Advisor is responsible for providing all investment advisory, custody, audit, administrative, compliance, recordkeeping, marketing and shareholder services, or arranging and supervising third parties to provide such services. By contrast, most other funds are charged a variety of fees, including an investment advisory fee, a transfer agency fee, an administrative fee, distribution charges and other expenses. Other than their investment advisory fees and any applicable Rule 12b-1 distribution fees, all other components of the total fees charged by these other funds may be increased without shareholder approval. The Board believes the unified fee structure is a benefit to Fund shareholders because it clearly discloses to shareholders the cost of owning Fund shares, and, since the unified fee cannot be increased without a vote of Fund shareholders, it shifts to the Advisor the risk of increased costs of operating the Fund and provides a direct incentive to minimize administrative inefficiencies. Part of the Board’s analysis of fee levels involves reviewing certain evaluative data compiled by an independent provider and comparing the Fund’s unified fee to the total expense ratio of other funds in the Fund’s peer group. The unified fee charged to shareholders of the Fund was below the median of the total expense ratios of the Fund’s peer group. The Board concluded that the management fee paid by the Fund to the Advisor under the management agreement is reasonable in light of the services provided to the Fund.
Comparison to Fees and Services Provided to Other Clients of the Advisor. The Board also requested and received information from the Advisor concerning the nature of the services, fees, costs and profitability of its advisory services to advisory clients other than the Fund. They observed that these varying types of client accounts require different services and involve different regulatory and entrepreneurial risks than the management of the Fund. The Board analyzed this information and concluded that the fees charged and services provided to the Fund were reasonable by comparison.
Collateral or “Fall-Out” Benefits Derived by the Advisor. The Board considered the existence of collateral benefits the Advisor may receive as a result of its relationship with the Fund. They concluded that the Advisor’s primary business is managing mutual funds and it generally does not use fund or shareholder information to generate profits in other lines of business, and therefore does not derive any significant collateral benefits from them. The Board noted that the Advisor receives proprietary research from broker-dealers that execute fund portfolio transactions and concluded that this research is likely to benefit Fund shareholders. The Board also determined that the Advisor is able to provide investment management services to certain clients other than the Fund, at least in part, due to its existing infrastructure built to serve the fund complex. The Board concluded, however, that the assets of those other clients are not material to the analysis and, where applicable, may be included with the assets of the Fund to determine breakpoints in the management fee schedule.
Existing Relationship. The Board also considered whether there was any reason for not continuing the existing arrangement with the Advisor. In this regard, the Board was mindful of the potential disruptions of the Fund’s operations and various risks, uncertainties, and other effects that could occur as a result of a decision not to continue such relationship. In particular, the Board recognized that most shareholders have invested in the Fund on the strength of the Advisor’s industry standing and reputation and in the expectation that the Advisor will have a continuing role in providing advisory services to the Fund.
Conclusion of the Directors. As a result of this process, the Board, including all of the independent Directors and assisted by the advice of independent legal counsel, taking into account all of the factors discussed above and the information provided by the Advisor and others, concluded that the management agreement between the Fund and the Advisor is fair and reasonable in light of the services provided and should be renewed.
Retirement Account Information
As required by law, distributions you receive from certain IRAs are subject to federal income tax withholding, unless you elect not to have withholding apply. Tax will be withheld on the total amount withdrawn even though you may be receiving amounts that are not subject to withholding, such as nondeductible contributions. In such case, excess amounts of withholding could occur. You may adjust your withholding election so that a greater or lesser amount will be withheld.
If you don’t want us to withhold on this amount, you must notify us to not withhold the federal income tax. You may notify us in writing or in certain situations by telephone or through other electronic means. For systematic withdrawals, your withholding election will remain in effect until revoked or changed by filing a new election. You have the right to revoke your election at any time.
Remember, even if you elect not to have income tax withheld, you are liable for paying income tax on the taxable portion of your withdrawal. If you elect not to have income tax withheld or you don’t have enough income tax withheld, you may be responsible for payment of estimated tax. You may incur penalties under the estimated tax rules if your withholding and estimated tax payments are not sufficient. You can reduce or defer the income tax on a distribution by directly or indirectly rolling such distribution over to another IRA or eligible plan. You should consult your tax advisor for additional information.
State tax will be withheld if, at the time of your distribution, your address is within one of the mandatory withholding states and you have federal income tax withheld (or as otherwise required by state law). State taxes will be withheld from your distribution in accordance with the respective state rules.
Distributions you receive from 403(b), 457 and qualified plans are subject to special tax and withholding rules. Your plan administrator or plan sponsor is required to provide you with a special tax notice explaining those rules at the time you request a distribution. If applicable, federal and/or state taxes may be withheld from your distribution amount.
Proxy Voting Policies
Descriptions of the principles and policies that the fund's investment advisor uses in exercising the voting rights associated with the securities purchased and/or held by the fund are available without charge, upon request, by calling 1-800-345-2021 or visiting the "About Us" page of American Century Investments’ website at americancentury.com. A description of the policies is also available on the Securities and Exchange Commission’s website at sec.gov. Information regarding how the investment advisor voted proxies relating to portfolio securities during the most recent 12-month period ended June 30 is available on the "About Us" page at americancentury.com. It is also available at sec.gov.
Quarterly Portfolio Disclosure
The fund files its complete schedule of portfolio holdings with the Securities and Exchange Commission (SEC) for the first and third quarters of each fiscal year on Form N-Q. The fund’s Forms N-Q are available on the SEC’s website at sec.gov, and may be reviewed and copied at the SEC’s Public Reference Room in Washington, DC. Information on the operation of the Public Reference Room may be obtained by calling 1-800-SEC-0330. The fund also makes its complete schedule of portfolio holdings for the most recent quarter of its fiscal year available on its website at americancentury.com and, upon request, by calling 1-800-345-2021.
Other Tax Information
The following information is provided pursuant to provisions of the Internal Revenue Code.
The fund hereby designates up to the maximum amount allowable as qualified dividend income for the fiscal year ended June 30, 2014.
For corporate taxpayers, the fund hereby designates $1,052,577, or up to the maximum amount allowable, of ordinary income distributions paid during the fiscal year ended June 30, 2014 as qualified for the corporate dividends received deduction.
|
| | |
| |
| | | |
| Contact Us | americancentury.com | |
| Automated Information Line | 1-800-345-8765 | |
| Investor Services Representative | 1-800-345-2021
or 816-531-5575 | |
| Investors Using Advisors | 1-800-378-9878 | |
Business, Not-For-Profit, Employer-Sponsored
Retirement Plans | 1-800-345-3533 | |
Banks and Trust Companies, Broker-Dealers,
Financial Professionals, Insurance Companies | 1-800-345-6488 | |
| Telecommunications Relay Service for the Deaf | 711 | |
| | | |
| American Century Quantitative Equity Funds, Inc. | |
| | | |
Investment Advisor: American Century Investment Management, Inc. Kansas City, Missouri | |
| | | |
| This report and the statements it contains are submitted for the general information of our shareholders. The report is not authorized for distribution to prospective investors unless preceded or accompanied by an effective prospectus. | |
| | | |
©2014 American Century Proprietary Holdings, Inc. All rights reserved.
CL-ANN-82889 1408 | |
|
| |
ANNUAL REPORT | JUNE 30, 2014 |
Strategic Inflation Opportunities Fund
|
| |
| President's Letter | |
| Performance | |
| Portfolio Commentary | |
| Fund Characteristics | |
| Shareholder Fee Example | |
| Schedule of Investments | |
| Statement of Assets and Liabilities | |
| Statement of Operations | |
| Statement of Changes in Net Assets | |
| Notes to Financial Statements | |
| Financial Highlights | |
| Report of Independent Registered Public Accounting Firm | |
| Management | |
| Approval of Management Agreement | |
| Additional Information | |
Any opinions expressed in this report reflect those of the author as of the date of the report, and do not necessarily represent the opinions of American Century Investments® or any other person in the American Century Investments organization. Any such opinions are subject to change at any time based upon market or other conditions and American Century Investments disclaims any responsibility to update such opinions. These opinions may not be relied upon as investment advice and, because investment decisions made by American Century Investments funds are based on numerous factors, may not be relied upon as an indication of trading intent on behalf of any American Century Investments fund. Security examples are used for representational purposes only and are not intended as recommendations to purchase or sell securities. Performance information for comparative indices and securities is provided to American Century Investments by third party vendors. To the best of American Century Investments’ knowledge, such information is accurate at the time of printing.
|
| |
| Dear Investor:
Thank you for reviewing this annual report for the 12 months ended June 30, 2014. It provides investment performance and portfolio information for the reporting period, plus longer-term historical performance data.
Annual reports remain important vehicles for conveying information about fund returns, including market and economic factors that affected performance during the reporting period. For additional, updated investment and market insights, we encourage you to visit our website, americancentury.com.
|
| Jonathan Thomas |
Aggressive Monetary Policies Boosted Stock and Bond Returns
Stimulative monetary policies and expectations of economic improvement, interspersed with concerns about weaker-than-expected economic data and geopolitical conflicts, helped drive financial market returns during the reporting period. We believe the combination of longer-term optimism about global economic growth, low costs of capital, and central bank purchases of fixed income securities helped persuade investors to seek risk and yield, especially in the U.S. and Europe. Stock index returns were strong in these markets, particularly at the smaller capitalization end of the company size spectrum. The MSCI Europe and S&P 500® indices advanced 29.28% and 24.61%, respectively.
Remarkably, for a period in which stock market performance was so strong, government bond performance was also generally positive. Not surprisingly, U.S. corporate high-yield bonds posted double-digit returns, but the 30-year U.S. Treasury bond also outperformed most broader bond market measures. In addition, a generally weaker U.S. dollar during the reporting period meant that international bond returns for U.S. investors with currency exposure were generally higher than U.S. bonds returns. The Barclays Global Aggregate Bond and Barclays U.S. Aggregate Bond indices returned 7.39% and 4.37%, respectively.
Looking ahead, we see signs of sustained moderate economic growth in the second half of 2014, but headwinds persist. In the U.S., which was supposed to be an economic growth leader this year, housing market momentum has slowed, interest rates could rise, and economic growth and U.S. employment levels remain subpar compared with past post-recession periods. In this environment, we continue to believe in a disciplined, diversified, long-term investment approach, using professionally managed stock and bond portfolios—as appropriate—for meeting financial goals. We appreciate your continued trust in us.
Sincerely,
Jonathan Thomas
President and Chief Executive Officer
American Century Investments
|
| | | | |
| Total Returns as of June 30, 2014 |
| | | | Average Annual Returns | |
| | Ticker Symbol | 1 year | Since Inception | Inception Date |
Investor Class(1) | ASIOX | 6.09% | 1.83% | 4/30/10 |
| Barclays U.S. 1-3 Month Treasury Bill Index | — | 0.03% | 0.08% | — |
Institutional Class(1) | ASINX | 6.28% | 2.04% | 4/30/10 |
A Class(1) | ASIDX | | | 4/30/10 |
| No sales charge* | | 5.88% | 1.58% | |
| With sales charge* | | -0.19% | 0.15% | |
C Class(1) | ASIZX | 5.03% | 0.81% | 4/30/10 |
R Class(1) | ASIUX | 5.60% | 1.33% | 4/30/10 |
| |
| * | Sales charges include initial sales charges and contingent deferred sales charges (CDSCs), as applicable. A Class shares have a 5.75% maximum initial sales charge and may be subject to a maximum CDSC of 1.00%. C Class shares redeemed within 12 months of purchase are subject to a maximum CDSC of 1.00%. The SEC requires that mutual funds provide performance information net of maximum sales charges in all cases where charges could be applied. |
(1) Returns would have been lower if a portion of the management fee had not been waived.
Data presented reflect past performance. Past performance is no guarantee of future results. Current performance may be higher or lower than the performance shown. Investment return and principal value will fluctuate, and redemption value may be more or less than original cost. To obtain performance data current to the most recent month end, please call 1-800-345-2021 or visit americancentury.com. As interest rates rise, bond values will decline. International investing involves special risks, such as political instability and currency fluctuations. Investing in emerging markets may accentuate these risks. There are certain risks involved in investing in forward foreign currency exchange contracts; changes in the value of foreign currencies against the U.S. dollar could result in losses to the fund. Commodity- and gold-related investing involves special risks, such as weather, disease, embargoes, tariffs, taxes and economic, political and regulatory developments. The fund may be subject to certain risks similar to those associated with direct investment in real estate.
Unless otherwise indicated, performance reflects Investor Class shares; performance for other share classes will vary due to differences in fee structure. For information about other share classes available, please consult the prospectus. Data assumes reinvestment of dividends and capital gains, and none of the charts reflect the deduction of taxes that a shareholder would pay on fund distributions or the redemption of fund shares. Returns for the index are provided for comparison. The fund’s total returns include operating expenses (such as transaction costs and management fees) that reduce returns, while the total returns of the index do not.
|
|
| Growth of $10,000 Over Life of Class |
| $10,000 investment made April 30, 2010 |
|
| |
| Value on June 30, 2014 |
| | Investor Class — $10,788** |
| |
| | Barclays U.S. 1-3 Month Treasury Bill Index — $10,032 |
| |
* From April 30, 2010, the Investor Class’s inception date. Not annualized.
**Ending value would have been lower if a portion of the management fee had not been waived.
|
| | | | |
| Total Annual Fund Operating Expenses |
| Investor Class | Institutional Class | A Class | C Class | R Class |
| 1.20% | 1.00% | 1.45% | 2.20% | 1.70% |
The total annual fund operating expenses shown is as stated in the fund’s prospectus current as of the date of this report. The prospectus may vary from the expense ratio shown elsewhere in this report because it is based on a different time period, includes acquired fund fees and expenses, and, if applicable, does not include fee waivers or expense reimbursements.
Data presented reflect past performance. Past performance is no guarantee of future results. Current performance may be higher or lower than the performance shown. Investment return and principal value will fluctuate, and redemption value may be more or less than original cost. To obtain performance data current to the most recent month end, please call 1-800-345-2021 or visit americancentury.com. As interest rates rise, bond values will decline. International investing involves special risks, such as political instability and currency fluctuations. Investing in emerging markets may accentuate these risks. There are certain risks involved in investing in forward foreign currency exchange contracts; changes in the value of foreign currencies against the U.S. dollar could result in losses to the fund. Commodity- and gold-related investing involves special risks, such as weather, disease, embargoes, tariffs, taxes and economic, political and regulatory developments. The fund may be subject to certain risks similar to those associated with direct investment in real estate.
Unless otherwise indicated, performance reflects Investor Class shares; performance for other share classes will vary due to differences in fee structure. For information about other share classes available, please consult the prospectus. Data assumes reinvestment of dividends and capital gains, and none of the charts reflect the deduction of taxes that a shareholder would pay on fund distributions or the redemption of fund shares. Returns for the index are provided for comparison. The fund’s total returns include operating expenses (such as transaction costs and management fees) that reduce returns, while the total returns of the index do not.
Portfolio Managers: Bob Gahagan, Bill Martin, Brian Howell, John Lovito, and Steven Brown
Performance Summary
For the 12 months ended June 30, 2014, Strategic Inflation Opportunities advanced 6.09%.* The portfolio’s benchmark, the Barclays U.S. 1-3 Month Treasury Bill Index, advanced 0.03% during the same period.
Economic growth in the major developed market economies generally remained weak, while inflation was mixed. In most countries, the year-over-year inflation rates as of June 30, 2014, remained relatively tame, despite ongoing and aggressive central bank stimulus programs. Nevertheless, investments that typically provide investor protection against the primary sources of inflation, including Treasury inflation-protected securities (TIPS), commodity-related investments, foreign currencies, and real estate, generally advanced during the 12-month period and accounted for the fund’s outperformance relative to its Treasury bill benchmark. A variety of factors—including continued stimulus measures from the world’s leading central banks (which ultimately may trigger higher inflation), improving economic outlooks (primarily in the U.S. and U.K.), and mounting geopolitical risks (mainly in Russia/Ukraine and the Middle East)—influenced performance in each asset class.
Inflation in U.S., U.K., Japan Headed Upward; Deflation Fears Emerged in Europe
After remaining tame in the first half of the period, current inflation increased during the second half in the U.S., U.K., and Japan, moving close to or within central bank target ranges. Conversely, ultra-low inflation in Europe triggered worries about deflation, which led to a fresh round of stimulus measures from the European Central Bank late in the period.
Commodity prices, a key inflation trigger, increased 10.40% during the period, according to the S&P Goldman Sachs Commodities Index, a measure of global commodities prices. Energy prices were a main driver of that gain, as Brent oil and West Texas Intermediate crude futures increased 10%. Industrial and precious metals also advanced during the period. After declining sharply in 2013 on news the Federal Reserve (the Fed) would begin tapering its quantitative easing program (which, because of its longer-term inflationary implications, had supported gold prices), gold bullion rebounded strongly during the first six months of 2014 due to heightened geopolitical tensions, a weaker U.S. dollar (gold is priced in dollars, so a weaker dollar makes it more attractive for foreign buyers), and rising U.S. inflation.
Portfolio Positioning & Strategy
The fund’s neutral asset mix as of June 30, 2014, was 45% inflation-linked bonds and other fixed-income securities, 25% non-dollar investments, 15% commodity-related investments, 10% global real estate investment trusts (REITs), and 5% gold securities that track the price of gold bullion, including gold exchange-traded funds (ETFs). The portfolio’s actual asset weightings varied based on short-term tactical adjustments and fluctuating securities prices. The portfolio’s investment team makes modest tactical adjustments to its asset mix in an effort to add value and improve the fund’s ability to meet its investment objective.
*All fund returns referenced in this commentary are for Investor Class shares. Returns would have been lower
if a portion of the management fee had not been waived. Performance for other share classes will vary due to
differences in fee structure; when Investor Class performance exceeds that of the fund's benchmark, other
share classes may not. See page 3 for returns for all share classes.
Within the portfolio’s inflation-linked securities allocation, robust performance in the second half of the reporting period helped TIPS outperform the benchmark. Specifically, declining Treasury yields, steady demand for Treasuries, and mounting inflationary pressures aided TIPS. The portfolio also held higher-yielding mortgage-backed securities and investment-grade and high-yield corporate bonds in conjunction with inflation “swaps” (effectively creating an “inflation overlay” for the corporate and mortgage securities), which also outperformed. Ongoing investor demand for yield generally helped fuel solid gains for corporate and mortgage securities. This allocation also included a small position in Puerto Rico municipal bonds, which detracted from results. These securities declined in value due to mounting fiscal challenges facing Puerto Rico. Late in the period, Puerto Rico unexpectedly passed legislation enabling its public corporations to restructure their debt, which led to widespread declines throughout the Puerto Rico municipal market.
Within the commodities component, the portfolio was invested in common stocks, commodity ETFs, and gold-related securities (such as holdings in mining companies). This exposure generated strong results for the period, primarily due to the team’s preference for the energy sector, which generated robust performance. The team maintained an underweight position in industrial metals, relative to its neutral asset mix, which detracted from performance as these prices generally increased, and a neutral weighting in gold securities, which helped performance as gold prices and gold stocks increased.
The team increased the fund’s REIT exposure to an overweight position relative to its neutral allocation target, which, along with security selection, contributed favorably to portfolio performance. In particular, the team favored office and lodging and resort REITs. The team remains optimistic toward global REITs and expects to maintain a strategic overweight to the asset class due to the belief that supply/demand dynamics remain favorable and select holdings offer high dividend yields, strong fundamentals, and attractive relative value. The team believes these factors should outweigh the effects of gradually rising interest rates.
Within the non-dollar component, the team maintained an underweight position relative to its neutral allocation target, given the team’s expectations for a stronger U.S. dollar, which, despite Fed tapering, didn’t materialize. The team favored higher-yielding emerging market currencies, which aided performance. The portfolio ended the period with overweight allocations in countries the team believes have the most promising economic outlooks, including South Korea, the U.K., Norway, and the commodity-based economies (Australia, New Zealand, and Canada), and underweight positions in the euro, the Japanese yen, and the Swiss franc.
Outlook
The investment team expects near-term global inflation to remain relatively contained. Longer term, the team believes a gradually improving global economy, wage pressures, record government debt, and aggressive monetary policies and long-term stimulus programs from leading central banks eventually may result in higher inflation than what is currently priced into the financial markets. The team believes this scenario underscores the importance of securing potential inflation hedges and protecting purchasing power through investments in inflation-fighting portfolios, such as Strategic Inflation Opportunities.
|
| |
| JUNE 30, 2014 | |
| Types of Investments in Portfolio | % of net assets |
| U.S. Treasury Securities | 35.7% |
| Domestic Common Stocks | 13.6% |
| Foreign Common Stocks | 10.3% |
| Commercial Paper | 18.1% |
| Exchange-Traded Funds | 10.9% |
| Collateralized Mortgage Obligations | 3.3% |
| Corporate Bonds | 3.2% |
| Commercial Mortgage-Backed Securities | 0.7% |
| Municipal Securities | 0.7% |
| Asset-Backed Securities | 0.3% |
| Warrants | 0.1% |
| Cash and Equivalents* | 3.1% |
* Includes temporary cash investments and other assets and liabilities.
Fund shareholders may incur two types of costs: (1) transaction costs, including sales charges (loads) on purchase payments and redemption/exchange fees; and (2) ongoing costs, including management fees; distribution and service (12b-1) fees; and other fund expenses. This example is intended to help you understand your ongoing costs (in dollars) of investing in your fund and to compare these costs with the ongoing cost of investing in other mutual funds.
The example is based on an investment of $1,000 made at the beginning of the period and held for the entire period from January 1, 2014 to June 30, 2014.
Actual Expenses
The table provides information about actual account values and actual expenses for each class. You may use the information, together with the amount you invested, to estimate the expenses that you paid over the period. First, identify the share class you own. Then simply divide your account value by $1,000 (for example, an $8,600 account value divided by $1,000 = 8.6), then multiply the result by the number under the heading “Expenses Paid During Period” to estimate the expenses you paid on your account during this period.
If you hold Investor Class shares of any American Century Investments fund, or Institutional Class shares of the American Century Diversified Bond Fund, in an American Century Investments account (i.e., not a financial intermediary or retirement plan account), American Century Investments may charge you a $12.50 semiannual account maintenance fee if the value of those shares is less than $10,000. We will redeem shares automatically in one of your accounts to pay the $12.50 fee. In determining your total eligible investment amount, we will include your investments in all personal accounts (including American Century Investments Brokerage accounts) registered under your Social Security number. Personal accounts include individual accounts, joint accounts, UGMA/UTMA accounts, personal trusts, Coverdell Education Savings Accounts and IRAs (including traditional, Roth, Rollover, SEP-, SARSEP- and SIMPLE-IRAs), and certain other retirement accounts. If you have only business, business retirement, employer-sponsored or American Century Investments Brokerage accounts, you are currently not subject to this fee. If you are subject to the Account Maintenance Fee, your account value could be reduced by the fee amount.
Hypothetical Example for Comparison Purposes
The table also provides information about hypothetical account values and hypothetical expenses based on the actual expense ratio of each class of your fund and an assumed rate of return of 5% per year before expenses, which is not the actual return of a fund’s share class. The hypothetical account values and expenses may not be used to estimate the actual ending account balance or expenses you paid for the period. You may use this information to compare the ongoing costs of investing in your fund and other funds. To do so, compare this 5% hypothetical example with the 5% hypothetical examples that appear in the shareholder reports of the other funds.
Please note that the expenses shown in the table are meant to highlight your ongoing costs only and do not reflect any transactional costs, such as sales charges (loads) or redemption/exchange fees. Therefore, the table is useful in comparing ongoing costs only, and will not help you determine the relative total costs of owning different funds. In addition, if these transactional costs were included, your costs would have been higher.
|
| | | | |
| | Beginning Account Value 1/1/14 | Ending Account Value 6/30/14 | Expenses Paid During Period(1) 1/1/14 – 6/30/14 | Annualized Expense Ratio(1) |
| Actual |
| Investor Class (after waiver) | $1,000 | $1,040.60 | $4.50 | 0.89% |
| Investor Class (before waiver) | $1,000 | $1,040.60(2) | $5.51 | 1.09% |
| Institutional Class (after waiver) | $1,000 | $1,041.50 | $3.49 | 0.69% |
| Institutional Class (before waiver) | $1,000 | $1,041.50(2) | $4.51 | 0.89% |
| A Class (after waiver) | $1,000 | $1,039.80 | $5.77 | 1.14% |
| A Class (before waiver) | $1,000 | $1,039.80(2) | $6.78 | 1.34% |
| C Class (after waiver) | $1,000 | $1,035.40 | $9.54 | 1.89% |
| C Class (before waiver) | $1,000 | $1,035.40(2) | $10.55 | 2.09% |
| R Class (after waiver) | $1,000 | $1,038.00 | $7.02 | 1.39% |
| R Class (before waiver) | $1,000 | $1,038.00(2) | $8.03 | 1.59% |
| Hypothetical |
| Investor Class (after waiver) | $1,000 | $1,020.38 | $4.46 | 0.89% |
| Investor Class (before waiver) | $1,000 | $1,019.39 | $5.46 | 1.09% |
| Institutional Class (after waiver) | $1,000 | $1,021.37 | $3.46 | 0.69% |
| Institutional Class (before waiver) | $1,000 | $1,020.38 | $4.46 | 0.89% |
| A Class (after waiver) | $1,000 | $1,019.14 | $5.71 | 1.14% |
| A Class (before waiver) | $1,000 | $1,018.15 | $6.71 | 1.34% |
| C Class (after waiver) | $1,000 | $1,015.42 | $9.44 | 1.89% |
| C Class (before waiver) | $1,000 | $1,014.43 | $10.44 | 2.09% |
| R Class (after waiver) | $1,000 | $1,017.90 | $6.95 | 1.39% |
| R Class (before waiver) | $1,000 | $1,016.91 | $7.95 | 1.59% |
| |
| (1) | Expenses are equal to the class’s annualized expense ratio listed in the table above, multiplied by the average account value over the period, multiplied by 181, the number of days in the most recent fiscal half-year, divided by 365, to reflect the one-half year period. |
| |
| (2) | Ending account value assumes the return earned after waiver and would have been lower if a portion of the management fee had not been waived. |
JUNE 30, 2014
|
| | | | | | |
| | Principal Amount/Shares | Value |
| U.S. TREASURY SECURITIES — 35.7% | | |
| U.S. Treasury Inflation Indexed Notes, 2.00%, 1/15/16 | $ | 389,391 |
| $ | 410,716 |
|
| U.S. Treasury Inflation Indexed Notes, 2.50%, 7/15/16 | 845,208 |
| 917,579 |
|
| U.S. Treasury Inflation Indexed Notes, 2.375%, 1/15/17 | 3,409,182 |
| 3,730,923 |
|
U.S. Treasury Inflation Indexed Notes, 0.125%, 4/15/17(1) | 4,592,588 |
| 4,752,075 |
|
| U.S. Treasury Inflation Indexed Notes, 2.625%, 7/15/17 | 857,895 |
| 960,675 |
|
| U.S. Treasury Inflation Indexed Notes, 0.125%, 4/15/18 | 3,281,824 |
| 3,390,534 |
|
| U.S. Treasury Inflation Indexed Notes, 1.375%, 7/15/18 | 1,099,390 |
| 1,201,556 |
|
| U.S. Treasury Inflation Indexed Notes, 2.125%, 1/15/19 | 1,711,510 |
| 1,927,989 |
|
| U.S. Treasury Inflation Indexed Notes, 0.125%, 4/15/19 | 1,517,625 |
| 1,562,620 |
|
TOTAL U.S. TREASURY SECURITIES (Cost $18,736,967) | | 18,854,667 |
|
| COMMON STOCKS — 23.9% | | |
| CHEMICALS — 0.1% | | |
| CF Industries Holdings, Inc. | 82 |
| 19,723 |
|
| Dow Chemical Co. (The) | 471 |
| 24,238 |
|
| Monsanto Co. | 161 |
| 20,083 |
|
| | | 64,044 |
|
| CONSTRUCTION MATERIALS — 0.1% | | |
| Martin Marietta Materials, Inc. | 120 |
| 15,846 |
|
| Vulcan Materials Co. | 584 |
| 37,230 |
|
| | | 53,076 |
|
| CONTAINERS AND PACKAGING — 0.1% | | |
Crown Holdings, Inc.(2) | 146 |
| 7,265 |
|
| MeadWestvaco Corp. | 1,081 |
| 47,845 |
|
| Sealed Air Corp. | 537 |
| 18,349 |
|
| | | 73,459 |
|
| ENERGY EQUIPMENT AND SERVICES — 2.0% | | |
| Baker Hughes, Inc. | 2,035 |
| 151,506 |
|
| Calfrac Well Services Ltd. | 1,690 |
| 31,597 |
|
| Canadian Energy Services & Technology Corp. | 2,739 |
| 85,786 |
|
| Halliburton Co. | 2,694 |
| 191,301 |
|
| Nabors Industries Ltd. | 2,114 |
| 62,088 |
|
| National Oilwell Varco, Inc. | 915 |
| 75,350 |
|
| Patterson-UTI Energy, Inc. | 1,740 |
| 60,796 |
|
| Schlumberger Ltd. | 2,932 |
| 345,829 |
|
Weatherford International plc(2) | 1,418 |
| 32,614 |
|
| | | 1,036,867 |
|
| HOTELS, RESTAURANTS AND LEISURE — 0.7% | | |
Hilton Worldwide Holdings, Inc.(2) | 5,202 |
| 121,207 |
|
Hyatt Hotels Corp., Class A(2) | 1,839 |
| 112,142 |
|
| Marriott International, Inc., Class A | 2,059 |
| 131,982 |
|
| | | 365,331 |
|
|
| | | | | | |
| | Principal Amount/Shares | Value |
| HOUSEHOLD DURABLES — 0.1% | | |
| Taylor Wimpey plc | 20,469 |
| $ | 39,935 |
|
| METALS AND MINING — 0.7% | | |
B2Gold Corp.(2) | 7,753 |
| 22,597 |
|
| Barrick Gold Corp. | 1,560 |
| 28,548 |
|
| BHP Billiton Ltd. ADR | 227 |
| 15,538 |
|
| Franco-Nevada Corp. | 841 |
| 48,275 |
|
| Freeport-McMoRan Copper & Gold, Inc. | 1,708 |
| 62,342 |
|
| Goldcorp, Inc. New York Shares | 2,221 |
| 61,988 |
|
| Randgold Resources Ltd. ADR | 326 |
| 27,580 |
|
| Rio Tinto plc ADR | 294 |
| 15,958 |
|
| Royal Gold, Inc. | 291 |
| 22,151 |
|
| Silver Wheaton Corp. | 768 |
| 20,175 |
|
Tahoe Resources, Inc.(2) | 1,379 |
| 36,108 |
|
| | | 361,260 |
|
| OIL, GAS AND CONSUMABLE FUELS — 5.8% | | |
| Anadarko Petroleum Corp. | 772 |
| 84,511 |
|
| Apache Corp. | 1,239 |
| 124,668 |
|
| Canadian Natural Resources Ltd. | 924 |
| 42,421 |
|
Cheniere Energy, Inc.(2) | 1,597 |
| 114,505 |
|
| Chesapeake Energy Corp. | 1,012 |
| 31,453 |
|
| Chevron Corp. | 2,464 |
| 321,675 |
|
| ConocoPhillips | 2,231 |
| 191,264 |
|
Crocotta Energy, Inc. (Acquired 6/30/14, Cost $159,731)(2)(3) | 36,527 |
| 159,862 |
|
Delphi Energy Corp.(2) | 19,453 |
| 79,303 |
|
| Devon Energy Corp. | 615 |
| 48,831 |
|
| Encana Corp. | 1,208 |
| 28,642 |
|
| Energy Transfer Equity LP | 1,151 |
| 67,840 |
|
| Enterprise Products Partners LP | 690 |
| 54,020 |
|
| EOG Resources, Inc. | 1,728 |
| 201,934 |
|
| Exxon Mobil Corp. | 3,040 |
| 306,067 |
|
| Hess Corp. | 451 |
| 44,599 |
|
| Kinder Morgan, Inc. | 1,480 |
| 53,665 |
|
| Marathon Oil Corp. | 1,071 |
| 42,754 |
|
| Marathon Petroleum Corp. | 553 |
| 43,173 |
|
| Noble Energy, Inc. | 843 |
| 65,299 |
|
| Occidental Petroleum Corp. | 1,831 |
| 187,916 |
|
Paramount Resources Ltd., A Shares(2) | 1,708 |
| 95,320 |
|
| Peyto Exploration & Development Corp. | 1,830 |
| 69,132 |
|
| Phillips 66 | 832 |
| 66,918 |
|
| Pioneer Natural Resources Co. | 195 |
| 44,813 |
|
| Plains All American Pipeline LP | 473 |
| 28,404 |
|
RMP Energy, Inc.(2) | 5,822 |
| 51,506 |
|
| Spectra Energy Corp. | 1,103 |
| 46,855 |
|
StealthGas, Inc.(2) | 3,420 |
| 37,962 |
|
| Suncor Energy, Inc. | 2,545 |
| 108,493 |
|
|
| | | | | | |
| | Principal Amount/Shares | Value |
Tourmaline Oil Corp.(2) | 915 |
| $ | 48,243 |
|
| Trilogy Energy Corp. | 1,492 |
| 40,829 |
|
Ultra Petroleum Corp.(2) | 647 |
| 19,209 |
|
| Valero Energy Corp. | 1,167 |
| 58,467 |
|
| Veresen, Inc. | 14 |
| 246 |
|
| Williams Cos., Inc. (The) | 1,128 |
| 65,661 |
|
| | | 3,076,460 |
|
| PAPER AND FOREST PRODUCTS — 0.1% | | |
| Domtar Corp. | 162 |
| 6,942 |
|
| International Paper Co. | 821 |
| 41,436 |
|
| | | 48,378 |
|
| REAL ESTATE INVESTMENT TRUSTS (REITs) — 9.9% | | |
| Alexandria Real Estate Equities, Inc. | 2,027 |
| 157,376 |
|
| Allied Properties Real Estate Investment Trust | 2,675 |
| 88,619 |
|
| Apartment Investment & Management Co., Class A | 5,188 |
| 167,417 |
|
| Big Yellow Group plc | 5,544 |
| 47,060 |
|
| CapitaCommercial Trust | 41,000 |
| 55,899 |
|
| Charter Hall Group | 18,852 |
| 75,728 |
|
| Chartwell Retirement Residences | 4,949 |
| 50,276 |
|
| Corio NV | 1,218 |
| 62,209 |
|
| Cousins Properties, Inc. | 10,482 |
| 130,501 |
|
| Daiwa House REIT Investment Corp. | 23 |
| 101,713 |
|
| DDR Corp. | 8,963 |
| 158,018 |
|
| Derwent London plc | 1,506 |
| 69,048 |
|
| Duke Realty Corp. | 10,525 |
| 191,134 |
|
| Education Realty Trust, Inc. | 14,097 |
| 151,402 |
|
| Equity One, Inc. | 6,109 |
| 144,111 |
|
| Essex Property Trust, Inc. | 1,114 |
| 205,990 |
|
| Gecina SA | 421 |
| 61,395 |
|
| General Growth Properties, Inc. | 8,422 |
| 198,422 |
|
| GLP J-REIT | 86 |
| 96,268 |
|
| Goodman Group | 23,944 |
| 114,019 |
|
| Great Portland Estates plc | 6,048 |
| 66,657 |
|
| Health Care REIT, Inc. | 4,159 |
| 260,644 |
|
| Hudson Pacific Properties, Inc. | 5,317 |
| 134,733 |
|
Hulic Reit, Inc.(2) | 59 |
| 93,708 |
|
| Kilroy Realty Corp. | 2,424 |
| 150,967 |
|
| Klepierre | 1,990 |
| 101,407 |
|
| Land Securities Group plc | 6,714 |
| 119,040 |
|
| Link Real Estate Investment Trust (The) | 27,500 |
| 147,960 |
|
| Mapletree Logistics Trust | 50,000 |
| 46,716 |
|
| Mirvac Group | 32,759 |
| 55,139 |
|
| Orix JREIT, Inc. | 71 |
| 99,521 |
|
| Pebblebrook Hotel Trust | 3,382 |
| 124,999 |
|
| Safestore Holdings plc | 12,767 |
| 47,632 |
|
Scentre Group(2) | 45,238 |
| 136,503 |
|
|
| | | | | | |
| | Principal Amount/Shares | Value |
| Simon Property Group, Inc. | 1,788 |
| $ | 297,309 |
|
| SL Green Realty Corp. | 1,657 |
| 181,292 |
|
| Stockland | 17,634 |
| 64,516 |
|
| Suntec Real Estate Investment Trust | 36,000 |
| 52,258 |
|
| Taubman Centers, Inc. | 2,215 |
| 167,919 |
|
| UDR, Inc. | 6,385 |
| 182,802 |
|
| Unibail-Rodamco SE | 709 |
| 206,254 |
|
| Westfield Corp. | 16,259 |
| 109,620 |
|
| Workspace Group plc | 4,338 |
| 42,317 |
|
| | | 5,216,518 |
|
| REAL ESTATE MANAGEMENT AND DEVELOPMENT — 3.9% | | |
| Ayala Land, Inc. | 114,700 |
| 80,146 |
|
| BR Malls Participacoes SA | 5,900 |
| 50,201 |
|
| Brookfield Asset Management, Inc., Class A | 1,556 |
| 68,495 |
|
| CapitaLand Ltd. | 36,000 |
| 92,389 |
|
| Central Pattana PCL | 10,800 |
| 16,306 |
|
| Cheung Kong Holdings Ltd. | 5,000 |
| 88,705 |
|
| China Overseas Land & Investment Ltd. | 46,000 |
| 111,581 |
|
| Corp. Inmobiliaria Vesta SAB de CV | 21,459 |
| 45,090 |
|
| Countrywide plc | 6,049 |
| 53,262 |
|
| Deutsche Annington Immobilien SE | 2,088 |
| 61,442 |
|
| Emaar Properties PJSC | 17,058 |
| 39,060 |
|
| Fabege AB | 3,056 |
| 43,245 |
|
Grand City Properties SA(2) | 4,181 |
| 52,573 |
|
| Henderson Land Development Co. Ltd. | 7,700 |
| 45,055 |
|
| Hongkong Land Holdings Ltd. | 7,000 |
| 46,690 |
|
Howard Hughes Corp. (The)(2) | 847 |
| 133,682 |
|
| Hulic Co. Ltd. | 4,600 |
| 60,619 |
|
| KWG Property Holding Ltd. | 42,500 |
| 24,292 |
|
| Megaworld Corp. | 181,000 |
| 18,660 |
|
| Mitsubishi Estate Co. Ltd. | 3,000 |
| 74,064 |
|
| Mitsui Fudosan Co. Ltd. | 9,000 |
| 303,480 |
|
| Nexity SA | 534 |
| 24,506 |
|
| Prestige Estates Projects Ltd. | 6,509 |
| 24,794 |
|
| Pruksa Real Estate PCL | 39,700 |
| 35,780 |
|
| Quality Houses PCL | 296,500 |
| 32,340 |
|
Realia Business SA(2) | 21,649 |
| 45,355 |
|
| Sino Land Co. Ltd. | 42,000 |
| 69,147 |
|
| Sobha Developers Ltd. | 3,574 |
| 29,572 |
|
| Sumitomo Realty & Development Co. Ltd. | 3,000 |
| 128,730 |
|
| Sun Hung Kai Properties Ltd. | 14,000 |
| 192,016 |
|
| | | 2,091,277 |
|
| TRADING COMPANIES AND DISTRIBUTORS — 0.4% | | |
| Ashtead Group plc | 4,860 |
| 72,777 |
|
United Rentals, Inc.(2) | 1,255 |
| 131,436 |
|
| | | 204,213 |
|
TOTAL COMMON STOCKS (Cost $10,383,768) | | 12,630,818 |
|
|
| | | | | | |
| | Principal Amount/Shares | Value |
COMMERCIAL PAPER(4) — 18.1% | | |
Charta LLC, 0.13%, 8/6/14(5) | $ | 2,703,000 |
| $ | 2,702,542 |
|
Crown Point Capital Co., 0.18%, 7/10/14(5) | 2,238,000 |
| 2,237,914 |
|
Lexington Parker Capital, 0.18%, 7/18/14(5) | 2,400,000 |
| 2,399,820 |
|
Liberty Street Funding LLC, 0.17%, 9/8/14(5) | 2,200,000 |
| 2,199,200 |
|
TOTAL COMMERCIAL PAPER (Cost $9,539,627) | | 9,539,476 |
|
| EXCHANGE-TRADED FUNDS — 10.9% | | |
iShares S&P GSCI Commodity Indexed Trust(2) | 86,346 |
| 2,928,856 |
|
PowerShares DB Commodity Index Tracking Fund(2) | 8,656 |
| 230,077 |
|
SPDR Gold Shares(2) | 9,784 |
| 1,252,743 |
|
Sprott Physical Gold Trust(2) | 120,676 |
| 1,328,643 |
|
TOTAL EXCHANGE-TRADED FUNDS (Cost $5,818,827) | | 5,740,319 |
|
COLLATERALIZED MORTGAGE OBLIGATIONS(6) — 3.3% | | |
| PRIVATE SPONSOR COLLATERALIZED MORTGAGE OBLIGATIONS — 3.2% | |
| ABN Amro Mortgage Corp., Series 2003-6, Class 1A4, 5.50%, 5/25/33 | $ | 9,752 |
| 10,269 |
|
| Banc of America Mortgage Securities, Inc., Series 2004-7, Class 7A1, 5.00%, 8/25/19 | 8,326 |
| 8,554 |
|
| Banc of America Mortgage Securities, Inc., Series 2005-1, Class 1A15, 5.50%, 2/25/35 | 64,135 |
| 67,380 |
|
| Banc of America Mortgage Securities, Inc., Series 2007-1, Class 1A16, 5.625%, 3/25/37 | 52,927 |
| 49,422 |
|
| Bear Stearns Adjustable Rate Mortgage Trust, Series 2004-12, Class 2A1, VRN, 2.63%, 7/1/14 | 35,106 |
| 35,442 |
|
| Bear Stearns Adjustable Rate Mortgage Trust, Series 2006-1, Class A1, VRN, 2.37%, 7/1/14 | 91,429 |
| 92,284 |
|
| Citigroup Mortgage Loan Trust, Inc., Series 2004-UST1, Class A4, VRN, 2.17%, 7/1/14 | 59,457 |
| 59,767 |
|
| Citigroup Mortgage Loan Trust, Inc., Series 2005-4, Class A, VRN, 5.23%, 7/1/14 | 89,615 |
| 89,524 |
|
| Countrywide Home Loan Mortgage Pass-Through Trust, Series 2003-35, Class 1A3 SEQ, 5.00%, 9/25/18 | 7,203 |
| 7,436 |
|
| Countrywide Home Loan Mortgage Pass-Through Trust, Series 2004-4, Class A19, 5.25%, 5/25/34 | 81,203 |
| 86,001 |
|
| Countrywide Home Loan Mortgage Pass-Through Trust, Series 2004-5, Class 2A4, 5.50%, 5/25/34 | 13,138 |
| 14,010 |
|
| First Horizon Mortgage Pass-Through Trust, Series 2005-AR3, Class 4A1, VRN, 5.14%, 7/1/14 | 47,251 |
| 46,743 |
|
| GSR Mortgage Loan Trust, Series 2005-AR6, Class 2A1, VRN, 2.66%, 7/1/14 | 69,494 |
| 70,295 |
|
| JPMorgan Mortgage Trust, Series 2005-A6, Class 7A1, VRN, 2.74%, 7/1/14 | 82,975 |
| 79,925 |
|
| JPMorgan Mortgage Trust, Series 2006-A3, Class 7A1, VRN, 2.65%, 7/1/14 | 23,349 |
| 23,769 |
|
| MASTR Asset Securitization Trust, Series 2003-10, Class 3A1, 5.50%, 11/25/33 | 24,109 |
| 25,467 |
|
| PHHMC Mortgage Pass-Through Certificates, Series 2007-6, Class A1, VRN, 5.62%, 7/1/14 | 17,324 |
| 17,593 |
|
| Thornburg Mortgage Securities Trust 2004-3, Series 2004-3, Class A, VRN, 0.89%, 7/25/14 | 25,365 |
| 24,742 |
|
| Wamu Mortgage Pass-Through Certificates, Series 2003-S11, Class 3A5, 5.95%, 11/25/33 | 16,431 |
| 17,662 |
|
|
| | | | | | |
| | Principal Amount/Shares | Value |
| Wells Fargo Mortgage-Backed Securities Trust, Series 2005-5, Class 1A1, 5.00%, 5/25/20 | $ | 12,852 |
| $ | 13,174 |
|
| Wells Fargo Mortgage-Backed Securities Trust, Series 2005-AR14, Class A1, VRN, 5.36%, 7/1/14 | 25,580 |
| 26,477 |
|
| Wells Fargo Mortgage-Backed Securities Trust, Series 2005-AR16, Class 1A1, VRN, 2.61%, 7/1/14 | 88,604 |
| 91,127 |
|
| Wells Fargo Mortgage-Backed Securities Trust, Series 2005-AR16, Class 3A2, VRN, 2.62%, 7/1/14 | 63,729 |
| 64,683 |
|
| Wells Fargo Mortgage-Backed Securities Trust, Series 2005-AR7, Class 1A1, VRN, 5.06%, 7/1/14 | 46,603 |
| 47,266 |
|
| Wells Fargo Mortgage-Backed Securities Trust, Series 2006-10, Class A4 SEQ, 6.00%, 8/25/36 | 87,181 |
| 92,586 |
|
| Wells Fargo Mortgage-Backed Securities Trust, Series 2006-11, Class A9 SEQ, 6.50%, 9/25/36 | 86,805 |
| 86,150 |
|
| Wells Fargo Mortgage-Backed Securities Trust, Series 2006-9, Class 1A9 SEQ, 6.00%, 8/25/36 | 36,009 |
| 37,571 |
|
| Wells Fargo Mortgage-Backed Securities Trust, Series 2006-AR15, Class A1, VRN, 2.62%, 7/1/14 | 47,068 |
| 43,830 |
|
| Wells Fargo Mortgage-Backed Securities Trust, Series 2007-10, Class 1A5, 6.00%, 7/25/37 | 67,516 |
| 67,592 |
|
| Wells Fargo Mortgage-Backed Securities Trust, Series 2007-11, Class A3 SEQ, 6.00%, 8/25/37 | 50,918 |
| 50,976 |
|
| Wells Fargo Mortgage-Backed Securities Trust, Series 2007-13, Class A1, 6.00%, 9/25/37 | 63,862 |
| 65,563 |
|
| Wells Fargo Mortgage-Backed Securities Trust, Series 2007-14, Class 2A2, 5.50%, 10/25/22 | 25,484 |
| 26,494 |
|
| Wells Fargo Mortgage-Backed Securities Trust, Series 2007-16, Class 1A1, 6.00%, 12/28/37 | 24,261 |
| 25,205 |
|
| Wells Fargo Mortgage-Backed Securities Trust, Series 2007-3, Class 3A1, 5.50%, 4/25/22 | 8,732 |
| 9,062 |
|
| Wells Fargo Mortgage-Backed Securities Trust, Series 2007-AR10, Class 1A1, VRN, 6.11%, 7/1/14 | 9,239 |
| 9,338 |
|
WinWater Mortgage Loan Trust, Series 2014-1, Class A4 SEQ, VRN, 3.50%, 7/1/14(5) | 75,000 |
| 77,039 |
|
| | | 1,660,418 |
|
| U.S. GOVERNMENT AGENCY COLLATERALIZED MORTGAGE OBLIGATIONS — 0.1% |
| FHLMC, Series 2824, Class LB SEQ, 4.50%, 7/15/24 | 60,536 |
| 65,716 |
|
TOTAL COLLATERALIZED MORTGAGE OBLIGATIONS (Cost $1,681,526) | | 1,726,134 |
|
| CORPORATE BONDS — 3.2% | | |
AUTOMOBILES† | | |
Nissan Motor Acceptance Corp., 2.65%, 9/26/18(5) | 10,000 |
| 10,271 |
|
| BANKS — 0.1% | | |
| Bank of America Corp., 2.00%, 1/11/18 | 40,000 |
| 40,288 |
|
| CHEMICALS — 0.1% | | |
| Ashland, Inc., 4.75%, 8/15/22 | 75,000 |
| 75,750 |
|
| COMMUNICATIONS EQUIPMENT — 0.3% | | |
| Crown Castle International Corp., 5.25%, 1/15/23 | 75,000 |
| 78,563 |
|
| SBA Communications Corp., 5.625%, 10/1/19 | 75,000 |
| 79,781 |
|
| | | 158,344 |
|
| CONSTRUCTION MATERIALS — 0.2% | | |
| Covanta Holding Corp., 7.25%, 12/1/20 | 75,000 |
| 82,312 |
|
|
| | | | | | |
| | Principal Amount/Shares | Value |
| CONTAINERS AND PACKAGING — 0.1% | | |
Ardagh Packaging Finance plc, 7.375%, 10/15/17(5) | $ | 70,000 |
| $ | 73,915 |
|
| DIVERSIFIED FINANCIAL SERVICES — 0.1% | | |
| Morgan Stanley, MTN, 5.625%, 9/23/19 | 20,000 |
| 23,027 |
|
| Union Bank N.A., 2.625%, 9/26/18 | 10,000 |
| 10,291 |
|
| | | 33,318 |
|
| DIVERSIFIED TELECOMMUNICATION SERVICES — 0.1% | | |
| AT&T, Inc., 5.50%, 2/1/18 | 20,000 |
| 22,677 |
|
| Verizon Communications, Inc., 3.65%, 9/14/18 | 20,000 |
| 21,377 |
|
| Windstream Corp., 7.875%, 11/1/17 | 30,000 |
| 34,687 |
|
| | | 78,741 |
|
FOOD PRODUCTS† | | |
| Tyson Foods, Inc., 6.60%, 4/1/16 | 20,000 |
| 21,915 |
|
| HEALTH CARE PROVIDERS AND SERVICES — 0.3% | | |
| CHS/Community Health Systems, Inc., 5.125%, 8/15/18 | 55,000 |
| 57,819 |
|
Fresenius Medical Care US Finance II, Inc., 5.625%, 7/31/19(5) | 70,000 |
| 76,650 |
|
| | | 134,469 |
|
| INDUSTRIAL CONGLOMERATES — 0.1% | | |
Bombardier, Inc., 5.75%, 3/15/22(5) | 70,000 |
| 72,100 |
|
| INSURANCE — 0.1% | | |
| American International Group, Inc., 4.125%, 2/15/24 | 30,000 |
| 31,624 |
|
| XLIT Ltd., 2.30%, 12/15/18 | 20,000 |
| 19,909 |
|
| | | 51,533 |
|
LIFE SCIENCES TOOLS AND SERVICES† | | |
| Thermo Fisher Scientific, Inc., 3.20%, 3/1/16 | 20,000 |
| 20,784 |
|
| METALS AND MINING — 0.1% | | |
| Barrick Gold Corp., 2.90%, 5/30/16 | 30,000 |
| 30,976 |
|
| Rio Tinto Finance USA plc, 1.375%, 6/17/16 | 20,000 |
| 20,224 |
|
| | | 51,200 |
|
| MULTI-UTILITIES — 0.3% | | |
| CMS Energy Corp., 4.25%, 9/30/15 | 30,000 |
| 31,258 |
|
| CMS Energy Corp., 8.75%, 6/15/19 | 25,000 |
| 32,259 |
|
Dominion Gas Holdings LLC, 1.05%, 11/1/16(5) | 20,000 |
| 19,934 |
|
| GenOn Energy, Inc., 7.875%, 6/15/17 | 55,000 |
| 58,713 |
|
| | | 142,164 |
|
| OIL, GAS AND CONSUMABLE FUELS — 0.7% | | |
| Alpha Natural Resources, Inc., 6.00%, 6/1/19 | 70,000 |
| 51,275 |
|
| Anadarko Petroleum Corp., 5.95%, 9/15/16 | 20,000 |
| 22,161 |
|
| Bill Barrett Corp., 7.00%, 10/15/22 | 75,000 |
| 79,875 |
|
| Marathon Petroleum Corp., 3.50%, 3/1/16 | 20,000 |
| 20,893 |
|
| Newfield Exploration Co., 6.875%, 2/1/20 | 50,000 |
| 53,250 |
|
| Peabody Energy Corp., 7.375%, 11/1/16 | 30,000 |
| 33,113 |
|
| Peabody Energy Corp., 6.50%, 9/15/20 | 30,000 |
| 30,375 |
|
| QEP Resources, Inc., 5.25%, 5/1/23 | 75,000 |
| 77,062 |
|
| | | 368,004 |
|
|
| | | | | | |
| | Principal Amount/Shares | Value |
PHARMACEUTICALS† | | |
| Mylan, Inc., 1.35%, 11/29/16 | $ | 10,000 |
| $ | 10,022 |
|
| REAL ESTATE INVESTMENT TRUSTS (REITs) — 0.2% | | |
| HCP, Inc., 6.00%, 1/30/17 | 25,000 |
| 27,999 |
|
| Reckson Operating Partnership LP, 6.00%, 3/31/16 | 50,000 |
| 53,830 |
|
| | | 81,829 |
|
| SPECIALTY RETAIL — 0.1% | | |
| Hertz Corp. (The), 6.75%, 4/15/19 | 55,000 |
| 58,575 |
|
| TEXTILES, APPAREL AND LUXURY GOODS — 0.2% | | |
| Hanesbrands, Inc., 6.375%, 12/15/20 | 75,000 |
| 81,469 |
|
| WIRELESS TELECOMMUNICATION SERVICES — 0.1% | | |
| Sprint Communications, 6.00%, 12/1/16 | 70,000 |
| 76,387 |
|
TOTAL CORPORATE BONDS (Cost $1,687,447) | | 1,723,390 |
|
COMMERCIAL MORTGAGE-BACKED SECURITIES(6) — 0.7% | | |
| Banc of America Commercial Mortgage, Inc., Series 2005-5, Class AM, VRN, 5.18%, 7/1/14 | 75,000 |
| 79,055 |
|
BB-UBS Trust, Series 2012-SHOW, Class A SEQ, 3.43%, 11/5/36(5) | 75,000 |
| 74,590 |
|
| LB-UBS Commercial Mortgage Trust, Series 2004-C1, Class A4 SEQ, 4.57%, 1/15/31 | 9,143 |
| 9,459 |
|
| LB-UBS Commercial Mortgage Trust, Series 2004-C8, Class AJ, VRN, 4.86%, 7/11/14 | 25,000 |
| 25,399 |
|
| LB-UBS Commercial Mortgage Trust, Series 2005-C5, Class AM, VRN, 5.02%, 7/11/14 | 125,000 |
| 130,225 |
|
| LB-UBS Commercial Mortgage Trust, Series 2005-C7, Class AM, VRN, 5.26%, 7/11/14 | 75,000 |
| 79,194 |
|
TOTAL COMMERCIAL MORTGAGE-BACKED SECURITIES (Cost $397,055) | | 397,922 |
|
| MUNICIPAL SECURITIES — 0.7% | | |
| Puerto Rico Aqueduct & Sewer Authority Rev., Series 2012 A, (Senior Lien), 5.00%, 7/1/19 | 140,000 |
| 98,150 |
|
| Puerto Rico Electric Power Authority Rev., Series 2007 TT, 5.00%, 7/1/18 | 30,000 |
| 13,283 |
|
| Puerto Rico Electric Power Authority Rev., Series 2010 ZZ, 5.00%, 7/1/18 | 30,000 |
| 13,283 |
|
| Puerto Rico GO, Series 2001 A, (Public Improvement), 5.50%, 7/1/18 | 155,000 |
| 140,569 |
|
| Puerto Rico GO, Series 2007 A, (Public Improvement), 5.50%, 7/1/18 | 75,000 |
| 68,018 |
|
| Puerto Rico GO, Series 2008 A, (Public Improvement), 5.50%, 7/1/18 | 30,000 |
| 27,207 |
|
| Puerto Rico GO, Series 2011 D, (Public Improvement), 5.00%, 7/1/19 | 20,000 |
| 17,136 |
|
TOTAL MUNICIPAL SECURITIES (Cost $432,989) | | 377,646 |
|
ASSET-BACKED SECURITIES(6) — 0.3% | | |
Avis Budget Rental Car Funding AESOP LLC, Series 2012-3A, Class A SEQ, 2.10%, 3/20/19(5) | 100,000 |
| 101,173 |
|
Hilton Grand Vacations Trust, Series 2014-AA, Class A SEQ, 1.77%, 11/25/26(5) | 75,000 |
| 75,080 |
|
TOTAL ASSET-BACKED SECURITIES (Cost $176,663) | | 176,253 |
|
|
| | | | | | |
| | Principal Amount/Shares | Value |
| WARRANTS — 0.1% | | |
| METALS AND MINING — 0.1% | | |
GoGold Resources, Inc.(2) | 101,250 |
| $ | 25,620 |
|
REAL ESTATE MANAGEMENT AND DEVELOPMENT† | | |
Sun Hung Kai Properties Ltd.(2) | 750 |
| 979 |
|
TOTAL WARRANTS (Cost $—) | | 26,599 |
|
| TEMPORARY CASH INVESTMENTS — 8.3% | | |
SSgA U.S. Government Money Market Fund, Class N (Cost $4,382,261) | 4,382,261 |
| 4,382,261 |
|
TOTAL INVESTMENT SECURITIES — 105.2% (Cost $53,237,130) | | 55,575,485 |
|
| OTHER ASSETS AND LIABILITIES — (5.2)% | | (2,765,202 | ) |
| TOTAL NET ASSETS — 100.0% | | $ | 52,810,283 |
|
FORWARD FOREIGN CURRENCY EXCHANGE CONTRACTS |
| | | | | | | | | | |
| Currency Purchased | Currency Sold | Counterparty | Settlement Date | Unrealized Appreciation (Depreciation) |
| AUD | 375,926 |
| USD | 345,557 |
| Barclays Bank plc | 9/4/14 | $ | 7,317 |
|
| AUD | 100,000 |
| USD | 93,494 |
| Deutsche Bank | 9/4/14 | 374 |
|
| AUD | 840,000 |
| USD | 782,372 |
| JPMorgan Chase Bank N.A. | 9/4/14 | 6,118 |
|
| USD | 581,126 |
| AUD | 620,000 |
| Barclays Bank plc | 9/4/14 | (855 | ) |
| USD | 168,255 |
| AUD | 180,000 |
| JPMorgan Chase Bank N.A. | 9/4/14 | (707 | ) |
| BRL | 1,393,719 |
| USD | 599,423 |
| Barclays Bank plc | 9/4/14 | 20,054 |
|
| USD | 140,000 |
| BRL | 313,740 |
| Barclays Bank plc | 9/4/14 | 549 |
|
| CAD | 393,747 |
| USD | 360,000 |
| Barclays Bank plc | 9/4/14 | 8,428 |
|
| CAD | 1,051,073 |
| USD | 960,000 |
| Deutsche Bank | 9/4/14 | 23,486 |
|
| CAD | 535,039 |
| USD | 498,759 |
| JPMorgan Chase Bank N.A. | 9/4/14 | 1,875 |
|
| CAD | 451,210 |
| USD | 420,000 |
| Westpac Group | 9/4/14 | 2,195 |
|
| USD | 909,587 |
| CAD | 994,473 |
| Barclays Bank plc | 9/4/14 | (20,938 | ) |
| CHF | 160,511 |
| USD | 180,000 |
| JPMorgan Chase Bank N.A. | 9/4/14 | 1,097 |
|
| USD | 873,204 |
| CHF | 781,515 |
| Barclays Bank plc | 9/4/14 | (8,545 | ) |
| CLP | 54,219,972 |
| USD | 97,729 |
| Barclays Bank plc | 9/4/14 | (339 | ) |
| CLP | 165,840,000 |
| USD | 300,000 |
| Barclays Bank plc | 9/4/14 | (2,117 | ) |
| CNY | 90,278 |
| USD | 14,567 |
| HSBC Holdings plc | 9/4/14 | 68 |
|
| CNY | 14,122,040 |
| USD | 2,278,667 |
| HSBC Holdings plc | 9/4/14 | 10,584 |
|
| CNY | 115,760 |
| USD | 18,686 |
| Westpac Group | 9/4/14 | 79 |
|
| USD | 91,705 |
| CNY | 566,031 |
| HSBC Holdings plc | 9/4/14 | (51 | ) |
| USD | 9,817 |
| CNY | 61,294 |
| Westpac Group | 9/4/14 | (119 | ) |
| USD | 7,646 |
| CNY | 47,196 |
| Westpac Group | 9/4/14 | (5 | ) |
| COP | 1,973,919,732 |
| USD | 1,032,925 |
| Barclays Bank plc | 9/4/14 | 14,432 |
|
| USD | 908 |
| CZK | 18,292 |
| Deutsche Bank | 9/4/14 | (5 | ) |
| USD | 680,000 |
| CZK | 13,774,794 |
| JPMorgan Chase Bank N.A. | 9/4/14 | (7,701 | ) |
| EUR | 160,000 |
| USD | 216,741 |
| Deutsche Bank | 9/4/14 | 2,400 |
|
| EUR | 140,000 |
| USD | 190,915 |
| JPMorgan Chase Bank N.A. | 9/4/14 | 833 |
|
| USD | 719,063 |
| EUR | 527,807 |
| UBS AG | 9/4/14 | (3,837 | ) |
|
| | | | | | | | | | |
| Currency Purchased | Currency Sold | Counterparty | Settlement Date | Unrealized Appreciation (Depreciation) |
| GBP | 623,584 |
| USD | 1,043,608 |
| Deutsche Bank | 9/4/14 | $ | 23,050 |
|
| USD | 203,937 |
| GBP | 120,000 |
| JPMorgan Chase Bank N.A. | 9/4/14 | (1,326 | ) |
| HKD | 1,070,909 |
| USD | 138,138 |
| Barclays Bank plc | 9/4/14 | (18 | ) |
| USD | 5,270 |
| HKD | 40,860 |
| Barclays Bank plc | 9/4/14 | — |
|
| HUF | 67,573,012 |
| USD | 300,384 |
| Deutsche Bank | 9/4/14 | (2,341 | ) |
| IDR | 1,339,921,639 |
| USD | 112,155 |
| Westpac Group | 9/4/14 | (156 | ) |
| ILS | 390,032 |
| USD | 111,922 |
| JPMorgan Chase Bank N.A. | 9/4/14 | 1,694 |
|
| USD | 400,000 |
| ILS | 1,383,069 |
| JPMorgan Chase Bank N.A. | 9/4/14 | (2,885 | ) |
| INR | 67,165,679 |
| USD | 1,116,822 |
| JPMorgan Chase Bank N.A. | 9/4/14 | (9,865 | ) |
| INR | 18,108,000 |
| USD | 301,097 |
| JPMorgan Chase Bank N.A. | 9/4/14 | (2,660 | ) |
| USD | 840,000 |
| INR | 51,147,600 |
| JPMorgan Chase Bank N.A. | 9/4/14 | (2,963 | ) |
| JPY | 14,248,262 |
| USD | 140,000 |
| Barclays Bank plc | 9/4/14 | 712 |
|
| JPY | 10,217,117 |
| USD | 100,000 |
| Deutsche Bank | 9/4/14 | 901 |
|
| JPY | 24,548,520 |
| USD | 240,000 |
| JPMorgan Chase Bank N.A. | 9/4/14 | 2,434 |
|
| JPY | 16,197,072 |
| USD | 160,000 |
| JPMorgan Chase Bank N.A. | 9/4/14 | (42 | ) |
| USD | 1,755,331 |
| JPY | 180,170,663 |
| Barclays Bank plc | 9/4/14 | (23,982 | ) |
| KRW | 1,689,357,001 |
| USD | 1,643,503 |
| Westpac Group | 9/4/14 | 22,058 |
|
| KRW | 122,844,000 |
| USD | 120,000 |
| Westpac Group | 9/4/14 | 1,114 |
|
| KRW | 367,560,000 |
| USD | 360,000 |
| Westpac Group | 9/4/14 | 2,383 |
|
| MXN | 21,233,576 |
| USD | 1,628,973 |
| Deutsche Bank | 9/4/14 | 606 |
|
| USD | 340,000 |
| MXN | 4,439,482 |
| Barclays Bank plc | 9/4/14 | (710 | ) |
| USD | 520,000 |
| MXN | 6,843,983 |
| Deutsche Bank | 9/4/14 | (5,244 | ) |
| USD | 340,000 |
| MXN | 4,432,705 |
| JPMorgan Chase Bank N.A. | 9/4/14 | (190 | ) |
| MYR | 4,820,381 |
| USD | 1,483,879 |
| Westpac Group | 9/4/14 | 14,024 |
|
| MYR | 903,728 |
| USD | 280,000 |
| Westpac Group | 9/4/14 | 828 |
|
| USD | 402,352 |
| MYR | 1,307,040 |
| Westpac Group | 9/4/14 | (3,803 | ) |
| NOK | 3,945,095 |
| USD | 655,310 |
| JPMorgan Chase Bank N.A. | 9/4/14 | (13,685 | ) |
| USD | 640,000 |
| NOK | 3,951,206 |
| Deutsche Bank | 9/4/14 | (2,619 | ) |
| NZD | 100,000 |
| USD | 84,944 |
| Barclays Bank plc | 9/4/14 | 2,092 |
|
| NZD | 378,562 |
| USD | 315,946 |
| HSBC Holdings plc | 9/4/14 | 13,540 |
|
| USD | 208,437 |
| NZD | 240,000 |
| JPMorgan Chase Bank N.A. | 9/4/14 | (450 | ) |
| PEN | 3,111,960 |
| USD | 1,109,631 |
| Barclays Bank plc | 9/4/14 | (5,035 | ) |
| PHP | 2,699,814 |
| USD | 61,429 |
| Westpac Group | 9/4/14 | 444 |
|
| PHP | 25,247,400 |
| USD | 580,000 |
| Westpac Group | 9/4/14 | (1,392 | ) |
| PLN | 2,467,097 |
| USD | 808,415 |
| Barclays Bank plc | 9/4/14 | 695 |
|
| USD | 1,200,000 |
| PLN | 3,680,160 |
| Barclays Bank plc | 9/4/14 | (6,946 | ) |
| USD | 320,000 |
| PLN | 983,718 |
| Barclays Bank plc | 9/4/14 | (2,620 | ) |
| USD | 100,000 |
| PLN | 304,689 |
| JPMorgan Chase Bank N.A. | 9/4/14 | 74 |
|
| RUB | 22,989,000 |
| USD | 642,267 |
| JPMorgan Chase Bank N.A. | 9/4/14 | 25,740 |
|
| USD | 482,321 |
| RUB | 17,263,971 |
| JPMorgan Chase Bank N.A. | 9/4/14 | (19,330 | ) |
| SEK | 521,639 |
| USD | 77,992 |
| Barclays Bank plc | 9/4/14 | 27 |
|
| SGD | 258,153 |
| USD | 205,321 |
| HSBC Holdings plc | 9/4/14 | 1,718 |
|
| USD | 180,000 |
| SGD | 225,536 |
| Westpac Group | 9/4/14 | (881 | ) |
| THB | 19,826,135 |
| USD | 605,424 |
| Westpac Group | 9/4/14 | 4,353 |
|
| TRY | 1,789,069 |
| USD | 840,000 |
| Deutsche Bank | 9/4/14 | (6,629 | ) |
| USD | 420,000 |
| TRY | 917,141 |
| Barclays Bank plc | 9/4/14 | (7,216 | ) |
|
| | | | | | | | | | |
| Currency Purchased | Currency Sold | Counterparty | Settlement Date | Unrealized Appreciation (Depreciation) |
| USD | 723,777 |
| TWD | 21,756,736 |
| Westpac Group | 9/4/14 | $ | (6,018 | ) |
| ZAR | 7,031,163 |
| USD | 644,107 |
| Deutsche Bank | 9/4/14 | 10,077 |
|
| USD | 280,000 |
| ZAR | 3,039,772 |
| Barclays Bank plc | 9/4/14 | (2,822 | ) |
| USD | 120,000 |
| ZAR | 1,287,212 |
| JPMorgan Chase Bank N.A. | 9/4/14 | 237 |
|
| | | | | | | $ | 51,643 |
|
|
| | | | | | | | | |
| FUTURES CONTRACTS |
| Contracts Sold | Expiration Date | Underlying Face Amount at Value | Unrealized Appreciation (Depreciation) |
| 17 |
| U.S. Treasury 5-Year Notes | September 2014 | $ | 2,030,836 |
| $ | 7,798 |
|
| 5 |
| U.S. Treasury Long Bonds | September 2014 | 685,938 |
| 5,262 |
|
| 3 |
| U.S. Treasury Ultra Long Bonds | September 2014 | 449,812 |
| 3,248 |
|
| | | | $ | 3,166,586 |
| $ | 16,308 |
|
|
| | | | | | | | | | |
| TOTAL RETURN SWAP AGREEMENTS | | |
| Counterparty | Notional Amount | Floating Rate Referenced Index | Pay/Receive Total Return of Referenced Index | Fixed Rate | Termination Date | Value |
| Bank of America N.A. | $ | 925,000 |
| U.S. CPI Urban Consumers NSA Index | Receive | 2.28% | 1/21/16 | $ | (3,376 | ) |
| Bank of America N.A. | 1,000,000 |
| U.S. CPI Urban Consumers NSA Index | Receive | 2.21% | 3/13/19 | 6,963 |
|
| Barclays Bank plc | 900,000 |
| U.S. CPI Urban Consumers NSA Index | Receive | 2.30% | 1/11/16 | (3,946 | ) |
| | | | | | | $ | (359 | ) |
|
| | |
| NOTES TO SCHEDULE OF INVESTMENTS |
| ADR | - | American Depositary Receipt |
| AUD | - | Australian Dollar |
| BRL | - | Brazilian Real |
| CAD | - | Canadian Dollar |
| CHF | - | Swiss Franc |
| CLP | - | Chilean Peso |
| CNY | - | Chinese Yuan |
| COP | - | Colombian Peso |
| CPI | - | Consumer Price Index |
| CZK | - | Czech Koruna |
| EUR | - | Euro |
| FHLMC | - | Federal Home Loan Mortgage Corporation |
| GBP | - | British Pound |
| GO | - | General Obligation |
| HKD | - | Hong Kong Dollar |
| HUF | - | Hungarian Forint |
| IDR | - | Indonesian Rupiah |
| ILS | - | Israeli Shekel |
| INR | - | Indian Rupee |
| JPY | - | Japanese Yen |
| KRW | - | South Korea Won |
| MTN | - | Medium Term Note |
| MXN | - | Mexican Peso |
| MYR | - | Malaysian Ringgit |
| NOK | - | Norwegian Krone |
| NSA | - | Not Seasonally Adjusted |
| NZD | - | New Zealand Dollar |
| PEN | - | Peruvian Nuevo Sol |
| PHP | - | Philippine Peso |
| PLN | - | Polish Zloty |
| RUB | - | Russian Ruble |
| SEK | - | Swedish Krona |
| SEQ | - | Sequential Payer |
| SGD | - | Singapore Dollar |
| THB | - | Thai Baht |
| TRY | - | Turkish Lira |
| TWD | - | Taiwanese Dollar |
| USD | - | United States Dollar |
| VRN | - | Variable Rate Note. Interest reset date is indicated. Rate shown is effective at the period end. |
| ZAR | - | South African Rand |
| |
| † | Category is less than 0.05% of total net assets. |
| |
| (1) | Security, or a portion thereof, has been pledged at the custodian bank or with a broker for margin requirements on futures contracts. At the period end, the aggregate value of securities pledged was $59,401. |
| |
| (3) | Restricted security that may not be offered for public sale without being registered with the Securities and Exchange Commission and/or may be subject to resale, redemption or transferability restrictions. The aggregate value of these securities at the period end was $159,862, which represented 0.3% of total net assets. |
| |
| (4) | The rate indicated is the yield to maturity at purchase for non-interest bearing securities. For interest bearing securities, the stated coupon rate is shown. |
| |
| (5) | Restricted security exempt from registration pursuant to Rule 144A or Section 4(2) under the Securities Act of 1933. These securities may be sold without restriction to qualified institutional investors and have been deemed liquid under policies approved by the Board of Directors. The aggregate value of these securities at the period end was $10,120,228, which represented 19.2% of total net assets. |
| |
| (6) | Final maturity date indicated, unless otherwise noted. |
See Notes to Financial Statements.
|
|
| Statement of Assets and Liabilities |
|
| | | |
| JUNE 30, 2014 |
| Assets |
| Investment securities, at value (cost of $53,237,130) | $ | 55,575,485 |
|
| Foreign currency holdings, at value (cost of $3,989) | 4,020 |
|
| Receivable for investments sold | 602,952 |
|
| Receivable for capital shares sold | 10,039 |
|
| Unrealized appreciation on forward foreign currency exchange contracts | 228,690 |
|
| Swap agreements, at value | 6,963 |
|
| Dividends and interest receivable | 159,465 |
|
| Other assets | 556 |
|
| | 56,588,170 |
|
| | |
| Liabilities | |
| Disbursements in excess of demand deposit cash | 2,701,710 |
|
| Payable for investments purchased | 768,288 |
|
| Payable for capital shares redeemed | 70,679 |
|
| Payable for variation margin on futures contracts | 4,570 |
|
| Unrealized depreciation on forward foreign currency exchange contracts | 177,047 |
|
| Swap agreements, at value | 7,322 |
|
| Accrued management fees | 37,701 |
|
| Distribution and service fees payable | 10,325 |
|
| Accrued foreign taxes | 245 |
|
| | 3,777,887 |
|
| | |
| Net Assets | $ | 52,810,283 |
|
| | |
| Net Assets Consist of: | |
| Capital (par value and paid-in surplus) | $ | 53,673,010 |
|
| Undistributed net investment income | 82,568 |
|
| Accumulated net realized loss | (3,351,426 | ) |
| Net unrealized appreciation | 2,406,131 |
|
| | $ | 52,810,283 |
|
|
| | | | | | |
| | Net Assets | Shares Outstanding | Net Asset Value Per Share |
| Investor Class, $0.01 Par Value |
| $28,261,191 |
| 2,691,606 |
| $10.50 |
| Institutional Class, $0.01 Par Value |
| $1,359,786 |
| 129,151 |
| $10.53 |
| A Class, $0.01 Par Value |
| $14,044,394 |
| 1,343,948 |
| $10.45* |
| C Class, $0.01 Par Value |
| $9,029,331 |
| 882,470 |
| $10.23 |
| R Class, $0.01 Par Value |
| $115,581 |
| 11,139 |
| $10.38 |
*Maximum offering price $11.09 (net asset value divided by 0.9425).
See Notes to Financial Statements.
|
| | | |
| YEAR ENDED JUNE 30, 2014 |
| Investment Income (Loss) |
| Income: | |
| Interest | $ | 462,376 |
|
| Dividends (net of foreign taxes withheld of $14,437) | 296,987 |
|
| | 759,363 |
|
| | |
| Expenses: | |
| Management fees | 693,065 |
|
| Distribution and service fees: | |
| A Class | 42,964 |
|
| C Class | 102,359 |
|
| R Class | 599 |
|
| Directors' fees and expenses | 4,078 |
|
| Other expenses | 3,298 |
|
| | 846,363 |
|
| Fees waived | (115,038 | ) |
| | 731,325 |
|
| | |
| Net investment income (loss) | 28,038 |
|
| | |
| Realized and Unrealized Gain (Loss) |
| Net realized gain (loss) on: | |
| Investment transactions (net of foreign tax expenses paid (refunded) of $(340)) | 453,175 |
|
| Futures contract transactions | (121,278 | ) |
| Swap agreement transactions | (108,063 | ) |
| Foreign currency transactions | (336,141 | ) |
| | (112,307 | ) |
| | |
| Change in net unrealized appreciation (depreciation) on: | |
| Investments (includes (increase) decrease in accrued foreign taxes of $(245)) | 3,032,477 |
|
| Futures contracts | 12,143 |
|
| Swap agreements | 145,579 |
|
| Translation of assets and liabilities in foreign currencies | 407,668 |
|
| | 3,597,867 |
|
| | |
| Net realized and unrealized gain (loss) | 3,485,560 |
|
| | |
| Net Increase (Decrease) in Net Assets Resulting from Operations | $ | 3,513,598 |
|
See Notes to Financial Statements.
|
|
| Statement of Changes in Net Assets |
|
| | | | | | |
| YEARS ENDED JUNE 30, 2014 AND JUNE 30, 2013 | | |
| Increase (Decrease) in Net Assets | June 30, 2014 | June 30, 2013 |
| Operations | | |
| Net investment income (loss) | $ | 28,038 |
| $ | (508,446 | ) |
| Net realized gain (loss) | (112,307 | ) | (620,079 | ) |
| Change in net unrealized appreciation (depreciation) | 3,597,867 |
| 1,072,382 |
|
| Net increase (decrease) in net assets resulting from operations | 3,513,598 |
| (56,143 | ) |
| | | |
| Distributions to Shareholders | | |
| From net investment income: | | |
| Investor Class | (100,537 | ) | — |
|
| Institutional Class | (10,017 | ) | — |
|
| Decrease in net assets from distributions | (110,554 | ) | — |
|
| | | |
| Capital Share Transactions | | |
Net increase (decrease) in net assets from capital share transactions (Note 5) | (33,584,196 | ) | (30,107,715 | ) |
| | | |
| Net increase (decrease) in net assets | (30,181,152 | ) | (30,163,858 | ) |
| | | |
| Net Assets | | |
| Beginning of period | 82,991,435 |
| 113,155,293 |
|
| End of period | $ | 52,810,283 |
| $ | 82,991,435 |
|
| | | |
| Undistributed net investment income | $ | 82,568 |
| $ | 343,978 |
|
See Notes to Financial Statements.
|
|
| Notes to Financial Statements |
JUNE 30, 2014
1. Organization
American Century Quantitative Equity Funds, Inc. (the corporation) is registered under the Investment Company Act of 1940, as amended (the 1940 Act), as an open-end management investment company and is organized as a Maryland corporation. Strategic Inflation Opportunities Fund (the fund) is one fund in a series issued by the corporation. The fund is nondiversified as defined under the 1940 Act. The fund’s investment objective is to seek total real return.
The fund offers the Investor Class, the Institutional Class, the A Class, the C Class and the R Class. The A Class may incur an initial sales charge. The A Class and C Class may be subject to a contingent deferred sales charge. The share classes differ principally in their respective sales charges and distribution and shareholder servicing expenses and arrangements. The Institutional Class is made available to institutional shareholders or through financial intermediaries whose clients do not require the same level of shareholder and administrative services as shareholders of other classes. As a result, the Institutional Class is charged a lower unified management fee.
2. Significant Accounting Policies
The following is a summary of significant accounting policies consistently followed by the fund in preparation of its financial statements. The financial statements are prepared in conformity with accounting principles generally accepted in the United States of America, which may require management to make certain estimates and assumptions at the date of the financial statements. Actual results could differ from these estimates. Management evaluated the impact of events or transactions occurring through the date the financial statements were issued that would merit recognition or disclosure.
Investment Valuations — The fund determines the fair value of its investments and computes its net asset value per share at the close of regular trading (usually 4 p.m. Eastern time) on the New York Stock Exchange (NYSE) on each day the NYSE is open. The Board of Directors has adopted valuation policies and procedures to guide the investment advisor in the fund’s investment valuation process and to provide methodologies for the oversight of the fund’s pricing function.
Fixed income securities maturing in greater than 60 days at the time of purchase are valued at the evaluated mean as provided by independent pricing services or at the mean of the most recent bid and asked prices as provided by investment dealers. Fixed income securities maturing within 60 days at the time of purchase may be valued at cost, plus or minus any amortized discount or premium or at the evaluated mean as provided by an independent pricing service. Evaluated mean prices are commonly derived through utilization of market models, which may consider, among other factors: trade data, quotations from dealers and active market makers, relevant yield curve and spread data, related sector levels, creditworthiness, trade data or market information on comparable securities, and other relevant security specific information.
Equity securities that are listed or traded on a domestic securities exchange are valued at the last reported sales price or at the official closing price as provided by the exchange. Equity securities traded on foreign securities exchanges are generally valued at the closing price of such securities on the exchange where primarily traded or at the close of the NYSE, if that is earlier. If no last sales price is reported, or if local convention or regulation so provides, the mean of the latest bid and asked prices may be used. Securities traded over-the-counter are valued at the mean of the latest bid and asked prices, the last sales price, or the official closing price. Equity securities initially expressed in local currencies are translated into U.S. dollars at the mean of the appropriate currency exchange rate at the close of the NYSE as provided by an independent pricing service.
Open-end management investment companies are valued at the reported net asset value per share. Exchange-traded futures contracts are valued at the settlement price as provided by the appropriate clearing corporation. Swap agreements are valued at an evaluated price as provided by independent pricing services or independent brokers. Forward foreign currency exchange contracts are valued at the mean of the appropriate forward exchange rate at the close of the NYSE as provided by an independent pricing service.
If the fund determines that the market price for an investment is not readily available or the valuation methods mentioned above do not reflect an investment’s fair value, such investment is valued as determined in good faith by the Board of Directors or its delegate, in accordance with policies and procedures adopted by the Board of Directors. In its determination of fair value, the fund may review several factors including, but not limited to, market information regarding the specific investment or comparable investments and correlation with other investment types, futures indices or general market indicators. Circumstances that may cause the fund to use these procedures to value an investment include, but are not limited to: an investment has been declared in default or is distressed; trading in a security has been suspended during the trading day or a security is not actively trading on its principal exchange; prices received from a regular pricing source are deemed unreliable; or there is a foreign market holiday and no trading occurred.
The fund monitors for significant events occurring after the close of an investment’s primary exchange but before the fund’s net asset value per share is determined. Significant events may include, but are not limited to: corporate announcements and transactions; governmental action and political unrest that could impact a specific investment or an investment sector; or armed conflicts, natural disasters and similar events that could affect investments in a specific country or region. The fund also monitors for significant fluctuations between domestic and foreign markets, as evidenced by the U.S. market or such other indicators that the Board of Directors, or its delegate, deems appropriate. If significant fluctuations in foreign markets are identified, the fund may apply a model-derived factor to the closing price of equity securities traded on foreign securities exchanges. The factor is based on observable market data as provided by an independent pricing service.
Security Transactions — Security transactions are accounted for as of the trade date. Net realized gains and losses are determined on the identified cost basis, which is also used for federal income tax purposes. Certain countries impose taxes on realized gains on the sale of securities registered in their country. The fund records the foreign tax expense, if any, on an accrual basis. The foreign tax expense on realized gains and unrealized appreciation reduces the net realized gain (loss) on investment transactions and net unrealized appreciation (depreciation) on investments, respectively.
Investment Income — Dividend income less foreign taxes withheld, if any, is recorded as of the ex-dividend date. Distributions received on securities that represent a return of capital or long-term capital gain are recorded as a reduction of cost of investments and/or as a realized gain. The fund may estimate the components of distributions received that may be considered nontaxable distributions or long-term capital gain distributions for income tax purposes. Interest income is recorded on the accrual basis and includes paydown gain (loss) and accretion of discounts and amortization of premiums. Inflation adjustments related to inflation-linked debt securities are reflected as interest income.
Foreign Currency Translations — All assets and liabilities initially expressed in foreign currencies are translated into U.S. dollars at prevailing exchange rates at period end. The fund may enter into spot foreign currency exchange contracts to facilitate transactions denominated in a foreign currency. Purchases and sales of investment securities, dividend and interest income, spot foreign currency exchange contracts, and expenses are translated at the rates of exchange prevailing on the respective dates of such transactions. Net realized and unrealized foreign currency exchange gains or losses related to investment securities are a component of net realized gain (loss) on investment transactions and change in net unrealized appreciation (depreciation) on investments, respectively.
Income Tax Status — It is the fund’s policy to distribute substantially all net investment income and net realized gains to shareholders and to otherwise qualify as a regulated investment company under provisions of the Internal Revenue Code. Accordingly, no provision has been made for income taxes. The fund files U.S. federal, state, local and non-U.S. tax returns as applicable. The fund's tax returns are subject to examination by the relevant taxing authority until expiration of the applicable statute of limitations, which is generally three years from the date of filing but can be longer in certain jurisdictions. At this time, management believes there are no uncertain tax positions which, based on their technical merit, would not be sustained upon examination and for which it is reasonably possible that the total amounts of unrecognized tax benefits will significantly change in the next twelve months.
Segregated Assets — In accordance with the 1940 Act, the fund segregates assets on its books and records to cover certain types of investments, including, but not limited to, futures contracts, forward commitments, when-issued securities, swap agreements and certain forward foreign currency exchange contracts. American Century Investment Management, Inc. (ACIM) (the investment advisor) monitors, on a daily basis, the securities segregated to ensure the fund designates a sufficient amount of liquid assets, marked-to-market daily. The fund may also receive assets or be required to pledge assets at the custodian bank or with a broker for margin requirements on futures contracts, forward commitments and swap agreements.
Multiple Class — All shares of the fund represent an equal pro rata interest in the net assets of the class to which such shares belong, and have identical voting, dividend, liquidation and other rights and the same terms and conditions, except for class specific expenses and exclusive rights to vote on matters affecting only individual classes. Income, non-class specific expenses, and realized and unrealized capital gains and losses of the fund are allocated to each class of shares based on their relative net assets.
Distributions to Shareholders — Distributions from net investment income, if any, are generally declared and paid quarterly. Distributions from net realized gains, if any, are generally declared and paid annually.
Indemnifications — Under the corporation’s organizational documents, its officers and directors are indemnified against certain liabilities arising out of the performance of their duties to the fund. In addition, in the normal course of business, the fund enters into contracts that provide general indemnifications. The maximum exposure under these arrangements is unknown as this would involve future claims that may be made against a fund. The risk of material loss from such claims is considered by management to be remote.
3. Fees and Transactions with Related Parties
Certain officers and directors of the corporation are also officers and/or directors of American Century Companies, Inc. (ACC). The corporation’s investment advisor, ACIM, the corporation's distributor, American Century Investment Services, Inc. (ACIS), and the corporation’s transfer agent, American Century Services, LLC, are wholly owned, directly or indirectly, by ACC.
Management Fees — The corporation has entered into a management agreement with ACIM, under which ACIM provides the fund with investment advisory and management services in exchange for a single, unified management fee (the fee) per class. The agreement provides that all expenses of managing and operating the fund, except distribution and service fees, brokerage expenses, taxes, interest, fees and expenses of the independent directors (including legal counsel fees), and extraordinary expenses, will be paid by ACIM. The fee is computed and accrued daily based on each class’s daily net assets and paid monthly in arrears. The fee consists of (1) an Investment Category Fee based on the daily net assets of the fund and certain other accounts managed by the investment advisor that are in the same broad investment category as the fund and (2) a Complex Fee based on the assets of all the funds in the American Century Investments family of funds. The rates for the Investment Category Fee range from 0.7754% to 0.8929%. The rates for the Complex Fee range from 0.2500% to 0.3100% for the Investor Class, A Class, C Class and R Class. The rates for the Complex Fee range from 0.0500% to 0.1100% for the Institutional Class. Effective August 1, 2013, the investment advisor voluntarily agreed to waive 0.2000% of its management fee. The investment advisor expects the fee waiver to continue through October 31, 2014, and cannot terminate it without the approval of the Board of Directors. The total amount of the waiver for each class for the year ended June 30, 2014 was $62,559, $3,212, $30,494, $18,556 and $217 for the Investor Class, Institutional Class, A Class, C Class and R Class, respectively. The effective annual management fee before waiver for each class for the year ended June 30, 2014 was 1.08% for the Investor Class, A Class, C Class and R Class and 0.88% for the Institutional Class. The effective annual management fee after waiver for each class for the year ended June 30, 2014 was 0.90% for the Investor Class, A Class, C Class and R Class and 0.70% for the Institutional Class.
Distribution and Service Fees — The Board of Directors has adopted a separate Master Distribution and Individual Shareholder Services Plan for each of the A Class, C Class and R Class (collectively the plans), pursuant to Rule 12b-1 of the 1940 Act. The plans provide that the A Class will pay ACIS an annual distribution and service fee of 0.25%. The plans provide that the C Class will pay ACIS an annual distribution and service fee of 1.00%, of which 0.25% is paid for individual shareholder services and 0.75% is paid for distribution services. The plans provide that the R Class will pay ACIS an annual distribution and service fee of 0.50%. The fees are computed and accrued daily based on each class’s daily net assets and paid monthly in arrears. The fees are used to pay financial intermediaries for distribution and individual shareholder services. Fees incurred under the plans during the year ended June 30, 2014 are detailed in the Statement of Operations.
Directors' Fees and Expenses — The Board of Directors is responsible for overseeing the investment advisor’s management and operations of the fund. The directors receive detailed information about the fund and its investment advisor regularly throughout the year, and meet at least quarterly with management of the investment advisor to review reports about fund operations. Fees and expenses incurred in conjunction with the directors during the year ended June 30, 2014 are detailed in the Statement of Operations. The fund’s officers do not receive compensation from the fund.
Acquired Fund Fees and Expenses — The fund may invest in mutual funds, exchange-traded funds, and business development companies (the acquired funds). The fund will indirectly realize its pro rata share of the fees and expenses of the acquired funds in which it invests. These indirect fees and expenses are not paid out of the fund's assets but are reflected in the return realized by the fund on its investment in the acquired funds.
4. Investment Transactions
Purchases of investment securities, excluding short-term investments, for the year ended June 30, 2014 totaled $43,476,887, of which $13,360,491 represented U.S. Treasury and Government Agency obligations.
Sales of investment securities, excluding short-term investments, for the year ended June 30, 2014 totaled $63,576,818, of which $19,943,395 represented U.S. Treasury and Government Agency obligations.
5. Capital Share Transactions
Transactions in shares of the fund were as follows:
|
| | | | | | | | | | |
| | Year ended June 30, 2014 | Year ended June 30, 2013 |
| | Shares | Amount | Shares | Amount |
| Investor Class/Shares Authorized | 50,000,000 |
| | 50,000,000 |
| |
| Sold | 544,078 |
| $ | 5,523,649 |
| 1,972,806 |
| $ | 20,427,855 |
|
| Issued in reinvestment of distributions | 4,799 |
| 48,089 |
| – |
| – |
|
| Redeemed | (2,467,593 | ) | (24,881,633 | ) | (3,967,497 | ) | (40,974,107 | ) |
| | (1,918,716 | ) | (19,309,895 | ) | (1,994,691 | ) | (20,546,252 | ) |
| Institutional Class/Shares Authorized | 50,000,000 |
| | 50,000,000 |
| |
| Sold | 35,822 |
| 363,229 |
| 258,744 |
| 2,682,273 |
|
| Issued in reinvestment of distributions | 967 |
| 9,703 |
| – |
| – |
|
| Redeemed | (208,798 | ) | (2,106,791 | ) | (665,890 | ) | (6,874,904 | ) |
| | (172,009 | ) | (1,733,859 | ) | (407,146 | ) | (4,192,631 | ) |
| A Class/Shares Authorized | 50,000,000 |
| | 50,000,000 |
| |
| Sold | 159,775 |
| 1,622,519 |
| 1,003,003 |
| 10,375,269 |
|
| Redeemed | (1,156,419 | ) | (11,659,981 | ) | (1,803,527 | ) | (18,390,980 | ) |
| | (996,644 | ) | (10,037,462 | ) | (800,524 | ) | (8,015,711 | ) |
| C Class/Shares Authorized | 50,000,000 |
| | 50,000,000 |
| |
| Sold | 171,152 |
| 1,695,940 |
| 558,435 |
| 5,698,256 |
|
| Redeemed | (420,690 | ) | (4,171,635 | ) | (301,454 | ) | (3,052,321 | ) |
| | (249,538 | ) | (2,475,695 | ) | 256,981 |
| 2,645,935 |
|
| R Class/Shares Authorized | 10,000,000 |
| | 50,000,000 |
| |
| Sold | 800 |
| 8,015 |
| 1,344 |
| 13,565 |
|
| Redeemed | (3,519 | ) | (35,300 | ) | (1,213 | ) | (12,621 | ) |
| | (2,719 | ) | (27,285 | ) | 131 |
| 944 |
|
| Net increase (decrease) | (3,339,626 | ) | $ | (33,584,196 | ) | (2,945,249 | ) | $ | (30,107,715 | ) |
6. Fair Value Measurements
The fund’s investments valuation process is based on several considerations and may use multiple inputs to determine the fair value of the investments held by the fund. In conformity with accounting principles generally accepted in the United States of America, the inputs used to determine a valuation are classified into three broad levels.
| |
| • | Level 1 valuation inputs consist of unadjusted quoted prices in an active market for identical investments. |
| |
| • | Level 2 valuation inputs consist of direct or indirect observable market data (including quoted prices for comparable investments, evaluations of subsequent market events, interest rates, prepayment speeds, credit risk, etc.). These inputs also consist of quoted prices for identical investments initially expressed in local currencies that are adjusted through translation into U.S. dollars. |
| |
| • | Level 3 valuation inputs consist of unobservable data (including a fund’s own assumptions). |
The level classification is based on the lowest level input that is significant to the fair valuation measurement. The valuation inputs are not necessarily an indication of the risks associated with investing in these securities or other financial instruments.
The following is a summary of the level classifications as of period end. The Schedule of Investments provides additional information on the fund’s portfolio holdings.
|
| | | | | | | | |
| | Level 1 | Level 2 | Level 3 |
| Assets | | | |
| Investment Securities | | | |
| U.S. Treasury Securities | — |
| $ | 18,854,667 |
| — |
|
| Common Stocks | $ | 7,648,720 |
| 4,982,098 |
| — |
|
| Commercial Paper | — |
| 9,539,476 |
| — |
|
| Exchange-Traded Funds | 5,740,319 |
| — |
| — |
|
| Collateralized Mortgage Obligations | — |
| 1,726,134 |
| — |
|
| Corporate Bonds | — |
| 1,723,390 |
| — |
|
| Commercial Mortgage-Backed Securities | — |
| 397,922 |
| — |
|
| Municipal Securities | — |
| 377,646 |
| — |
|
| Asset-Backed Securities | — |
| 176,253 |
| — |
|
| Warrants | — |
| 26,599 |
| — |
|
| Temporary Cash Investments | 4,382,261 |
| — |
| — |
|
| | $ | 17,771,300 |
| $ | 37,804,185 |
| — |
|
| Other Financial Instruments | | | |
| Futures Contracts | $ | 16,308 |
| — |
| — |
|
| Swap Agreements | — |
| $ | 6,963 |
| — |
|
| Forward Foreign Currency Exchange Contracts | — |
| 228,690 |
| — |
|
| | $ | 16,308 |
| $ | 235,653 |
| |
| | | | |
| Liabilities | | | |
| Other Financial Instruments | | | |
| Swap Agreements | — |
| $ | (7,322 | ) | — |
|
| Forward Foreign Currency Exchange Contracts | — |
| (177,047 | ) | — |
|
| | — |
| $ | (184,369 | ) | — |
|
7. Derivative Instruments
Foreign Currency Risk — The fund is subject to foreign currency exchange rate risk in the normal course of pursuing its investment objectives. The value of foreign investments held by a fund may be significantly affected by changes in foreign currency exchange rates. The dollar value of a foreign security generally decreases when the value of the dollar rises against the foreign currency in which the security is denominated and tends to increase when the value of the dollar declines against such foreign currency. A fund may enter into forward foreign currency exchange contracts to reduce a fund's exposure to foreign currency exchange rate fluctuations or to gain exposure to the fluctuations in the value of foreign currencies. The net U.S. dollar value of foreign currency underlying all contractual commitments held by a fund and the resulting unrealized appreciation or depreciation are determined daily. Realized gain or loss is recorded upon the termination of the contract. Net realized and unrealized gains or losses occurring during the holding period of forward foreign currency exchange contracts are a component of net realized gain (loss) on foreign currency transactions and change in net unrealized appreciation (depreciation) on translation of assets and liabilities in foreign
currencies, respectively. A fund bears the risk of an unfavorable change in the foreign currency exchange rate underlying the forward contract. Additionally, losses, up to the fair value, may arise if the counterparties do not perform under the contract terms. The USD currency purchased and/or sold as disclosed on the Schedule of Investments is indicative of the fund's typical volume during the period.
Interest Rate Risk — The fund is subject to interest rate risk in the normal course of pursuing its investment objectives. The value of bonds generally declines as interest rates rise. A fund may enter into futures contracts based on a bond index or a specific underlying security. A fund may purchase futures contracts to gain exposure to increases in market value or sell futures contracts to protect against a decline in market value. Upon entering into a futures contract, a fund will segregate cash, cash equivalents or other appropriate liquid securities on its records in amounts sufficient to meet requirements. Subsequent payments (variation margin) are made or received daily, in cash, by a fund. The variation margin is equal to the daily change in the contract value and is recorded as unrealized gains and losses. A fund recognizes a realized gain or loss when the futures contract is closed or expires. Net realized and unrealized gains or losses occurring during the holding period of futures contracts are a component of net realized gain (loss) on futures contract transactions and change in net unrealized appreciation (depreciation) on futures contracts, respectively. One of the risks of entering into futures contracts is the possibility that the change in value of the contract may not correlate with the changes in value of the underlying securities. The futures contracts sold as disclosed on the Schedule of Investments are indicative of the fund's typical volume during the period.
Other Contracts — A fund may enter into total return swap agreements in order to attempt to obtain or preserve a particular return or spread at a lower cost than obtaining a return or spread through purchases and/or sales of instruments in other markets or gain exposure to certain markets in the most economical way possible. A fund will segregate cash, cash equivalents or other appropriate liquid securities on its records in amounts sufficient to meet requirements. Changes in value, including the periodic amounts of interest to be paid or received on swap agreements, are recorded as unrealized appreciation (depreciation) on swap agreements. Realized gain or loss is recorded upon receipt or payment of a periodic settlement or termination of swap agreements. Net realized and unrealized gains or losses occurring during the holding period of swap agreements are a component of net realized gain (loss) on swap agreement transactions and change in net unrealized appreciation (depreciation) on swap agreements, respectively. The risks of entering into swap agreements include the possible lack of liquidity, failure of the counterparty to meet its obligations, and that there may be unfavorable changes in the underlying investments or instruments. The notional amount as disclosed on the Schedule of Investments is indicative of the fund's typical volume during the period.
|
| | | | | | | | |
| Value of Derivative Instruments as of June 30, 2014 |
| | | | | |
| | Asset Derivatives | | Liability Derivatives | |
| Type of Risk Exposure | Location on Statement of Assets and Liabilities | Value | Location on Statement of Assets and Liabilities | Value |
| Foreign Currency Risk | Unrealized appreciation on forward foreign currency exchange contracts | $ | 228,690 |
| Unrealized depreciation on forward foreign currency exchange contracts | $ | 177,047 |
|
| Interest Rate Risk | Receivable for variation margin on futures contracts* | – |
| Payable for variation margin on futures contracts* | 4,570 |
|
| Other Contracts | Swap agreements | 6,963 |
| Swap agreements | 7,322 |
|
| | | $ | 235,653 |
| | $ | 188,939 |
|
| |
| * | Included in the unrealized appreciation (depreciation) on futures contracts as reported in the Schedule of Investments. |
Effect of Derivative Instruments on the Statement of Operations for the Year Ended June 30, 2014 |
| | | | | | | | |
| | Net Realized Gain (Loss) | | Change in Net Unrealized Appreciation (Depreciation) | |
| Type of Risk Exposure | Location on Statement of Operations | Value | Location on Statement of Operations | Value |
| Foreign Currency Risk | Net realized gain (loss) on foreign currency transactions | $ | (326,487 | ) | Change in net unrealized appreciation (depreciation) on translation of assets and liabilities in foreign currencies | $ | 406,974 |
|
| Interest Rate Risk | Net realized gain (loss) on futures contract transactions | (121,278 | ) | Change in net unrealized appreciation (depreciation) on futures contracts | 12,143 |
|
| Other Contracts | Net realized gain (loss) on swap agreement transactions | (108,063 | ) | Change in net unrealized appreciation (depreciation) on swap agreements | 145,579 |
|
| | | $ | (555,828 | ) | | $ | 564,696 |
|
8. Risk Factors
There are certain risks involved in investing in foreign securities. These risks include those resulting from future adverse political, social and economic developments, fluctuations in currency exchange rates, the possible imposition of exchange controls, and other foreign laws or restrictions. Investing in emerging markets may accentuate these risks.
There are certain risks involved with investing in forward foreign currency exchange contracts. Changes in the value of foreign currencies against the U.S. dollar could result in gains or losses to the fund. The value of a share of the fund is determined in U.S. dollars. As a result, the fund could recognize a gain or loss based solely upon a change in the exchange rate between the foreign currency and the U.S. dollar. Changes in exchange rates may increase losses and lower gains from the fund’s investments. The overall impact on the fund may be significant depending on the currencies represented in the portfolio and how each one appreciates or depreciates in relation to the U.S. dollar. Currency trends are unpredictable and exchange rates in foreign currencies may fluctuate significantly over short periods of time for a number of reasons, including changes in interest rates, intervention (or the failure to intervene) by U.S. or foreign governments, central banks or Supranational entities, or by the imposition of currency controls or other political developments in the United States or abroad.
The fund’s commodity- and gold-related investments may be subject to greater volatility than investments in traditional securities. The value of the fund’s commodity- and gold-related investments may be affected by changes in overall market movements, interest rate changes, and volatility in commodity- and gold-related indices. The value of these investments may also be affected by factors affecting a particular commodity, such as weather, disease, embargoes, tariffs, taxes and economic, political and regulatory developments.
The fund may be subject to certain risks similar to those associated with direct investment in real estate including but not limited to: local or regional economic conditions, changes in zoning laws, changes in property values, property tax increases, overbuilding, increased competition, environmental contamination, natural disasters, and interest rate risk.
9. Federal Tax Information
The tax character of distributions paid during the years ended June 30, 2014 and June 30, 2013 were as follows:
|
| | | | | |
| | 2014 | 2013 |
| Distributions Paid From | | |
| Ordinary income | $ | 110,554 |
| — |
|
| Long-term capital gains | — |
| — |
|
The book-basis character of distributions made during the year from net investment income or net realized gains may differ from their ultimate characterization for federal income tax purposes. These differences reflect the differing character of certain income items and net realized gains and losses for financial statement and tax purposes, and may result in reclassification among certain capital accounts on the financial statements.
As of June 30, 2014, the federal tax cost of investments and the components of distributable earnings on a tax-basis were as follows: |
| | | |
| Federal tax cost of investments | $ | 53,694,210 |
|
| Gross tax appreciation of investments | $ | 2,511,213 |
|
| Gross tax depreciation of investments | (629,938 | ) |
| Net tax appreciation (depreciation) of investments | 1,881,275 |
|
Net tax appreciation (depreciation) on derivatives and translation of assets and liabilities in foreign currencies | 15,573 |
|
| Net tax appreciation (depreciation) | $ | 1,896,848 |
|
| Other book-to-tax adjustments | $ | (47,706 | ) |
| Undistributed ordinary income | $ | 311,170 |
|
| Accumulated short-term capital losses | $ | (2,145,775 | ) |
| Accumulated long-term capital losses | $ | (877,264 | ) |
The difference between book-basis and tax-basis unrealized appreciation (depreciation) is attributable primarily to the tax deferral of losses on wash sales and the realization for tax purposes of unrealized gains on investments in passive foreign investment companies. Other book-to-tax adjustments are attributable primarily to the tax deferral of losses on straddle positions.
Accumulated capital losses represent net capital loss carryovers that may be used to offset future realized capital gains for federal income tax purposes. The capital loss carryovers may be carried forward for an unlimited period. Future capital loss carryover utilization in any given year may be subject to Internal Revenue Code limitations.
|
| | | | | | | | | | | | | | | | | |
| For a Share Outstanding Throughout the Years Ended June 30 (except as noted) |
| Per-Share Data | Ratios and Supplemental Data |
| | | Income From Investment Operations: | Distributions From: | | | Ratio to Average Net Assets of: | | |
| | Net Asset Value, Beginning of Period | Net Investment Income (Loss)(1) | Net Realized and Unrealized Gain (Loss) | Total From Investment Operations | Net Investment Income | Net Realized Gains | Total Distributions | Net Asset Value, End of Period | Total Return(2) | Operating Expenses(3) | Operating Expenses (before expense waiver)(3) | Net Investment Income (Loss) | Net Investment Income (Loss) (before expense waiver) | Portfolio Turnover Rate | Net Assets, End of Period (in thousands) |
| Investor Class |
| 2014 | $9.92 | 0.03 | 0.57 | 0.60 | (0.02) | — | (0.02) | $10.50 | 6.09% | 0.91% | 1.09% | 0.27% | 0.09% | 87% |
| $28,261 |
|
| 2013 | $9.99 | (0.03) | (0.04) | (0.07) | — | — | — | $9.92 | (0.70)% | 1.09% | 1.09% | (0.31)% | (0.31)% | 85% |
| $45,728 |
|
| 2012 | $10.71 | 0.01 | (0.57) | (0.56) | (0.13) | (0.03) | (0.16) | $9.99 | (5.32)% | 1.08% | 1.09% | 0.12% | 0.11% | 80% |
| $65,968 |
|
| 2011 | $9.59 | 0.12 | 1.10 | 1.22 | (0.10) | —(4) | (0.10) | $10.71 | 12.78% | 0.95% | 1.09% | 1.27% | 1.13% | 52% |
| $53,696 |
|
2010(5) | $10.00 | 0.01 | (0.42) | (0.41) | — | — | — | $9.59 | (4.10)% | 0.95%(6) | 1.09%(6) | 0.79%(6) | 0.65%(6) | 0% |
| $4,044 |
|
| Institutional Class |
| 2014 | $9.94 | 0.05 | 0.58 | 0.63 | (0.04) | — | (0.04) | $10.53 | 6.28% | 0.71% | 0.89% | 0.47% | 0.29% | 87% |
| $1,360 |
|
| 2013 | $9.99 | (0.02) | (0.03) | (0.05) | — | — | — | $9.94 | (0.40)% | 0.89% | 0.89% | (0.11)% | (0.11)% | 85% |
| $2,995 |
|
| 2012 | $10.71 | 0.04 | (0.58) | (0.54) | (0.15) | (0.03) | (0.18) | $9.99 | (5.13)% | 0.88% | 0.89% | 0.32% | 0.31% | 80% |
| $7,078 |
|
| 2011 | $9.59 | 0.15 | 1.09 | 1.24 | (0.12) | —(4) | (0.12) | $10.71 | 12.93% | 0.75% | 0.89% | 1.47% | 1.33% | 52% |
| $5,428 |
|
2010(5) | $10.00 | 0.02 | (0.43) | (0.41) | — | — | — | $9.59 | (4.10)% | 0.75%(6) | 0.89%(6) | 0.99%(6) | 0.85%(6) | 0% |
| $144 |
|
|
| | | | | | | | | | | | | | | | | |
| For a Share Outstanding Throughout the Years Ended June 30 (except as noted) |
| Per-Share Data | Ratios and Supplemental Data |
| | | Income From Investment Operations: | Distributions From: | | | Ratio to Average Net Assets of: | | |
| | Net Asset Value, Beginning of Period | Net Investment Income (Loss)(1) | Net Realized and Unrealized Gain (Loss) | Total From Investment Operations | Net Investment Income | Net Realized Gains | Total Distributions | Net Asset Value, End of Period | Total Return(2) | Operating Expenses(3) | Operating Expenses (before expense waiver)(3) | Net Investment Income (Loss) | Net Investment Income (Loss) (before expense waiver) | Portfolio Turnover Rate | Net Assets, End of Period (in thousands) |
| A Class |
| 2014 | $9.87 | —(4) | 0.58 | 0.58 | — | — | — | $10.45 | 5.88% | 1.16% | 1.34% | 0.02% | (0.16)% | 87% |
| $14,044 |
|
| 2013 | $9.97 | (0.05) | (0.05) | (0.10) | — | — | — | $9.87 | (1.00)% | 1.34% | 1.34% | (0.56)% | (0.56)% | 85% |
| $23,108 |
|
| 2012 | $10.69 | (0.02) | (0.56) | (0.58) | (0.11) | (0.03) | (0.14) | $9.97 | (5.51)% | 1.33% | 1.34% | (0.13)% | (0.14)% | 80% |
| $31,305 |
|
| 2011 | $9.58 | 0.13 | 1.06 | 1.19 | (0.08) | —(4) | (0.08) | $10.69 | 12.50% | 1.20% | 1.34% | 1.02% | 0.88% | 52% |
| $30,416 |
|
2010(5) | $10.00 | 0.01 | (0.43) | (0.42) | — | — | — | $9.58 | (4.20)% | 1.20%(6) | 1.34%(6) | 0.54%(6) | 0.40%(6) | 0% |
| $3,370 |
|
| C Class |
| 2014 | $9.74 | (0.07) | 0.56 | 0.49 | — | — | — | $10.23 | 5.03% | 1.91% | 2.09% | (0.73)% | (0.91)% | 87% |
| $9,029 |
|
| 2013 | $9.90 | (0.12) | (0.04) | (0.16) | — | — | — | $9.74 | (1.62)% | 2.09% | 2.09% | (1.31)% | (1.31)% | 85% |
| $11,025 |
|
| 2012 | $10.65 | (0.08) | (0.59) | (0.67) | (0.05) | (0.03) | (0.08) | $9.90 | (6.33)% | 2.08% | 2.09% | (0.88)% | (0.89)% | 80% |
| $8,667 |
|
| 2011 | $9.57 | 0.08 | 1.03 | 1.11 | (0.03) | —(4) | (0.03) | $10.65 | 11.64% | 1.95% | 2.09% | 0.27% | 0.13% | 52% |
| $6,167 |
|
2010(5) | $10.00 | —(4) | (0.43) | (0.43) | — | — | — | $9.57 | (4.30)% | 1.95%(6) | 2.09%(6) | (0.21)%(6) | (0.35)%(6) | 0% |
| $356 |
|
| R Class |
| 2014 | $9.83 | (0.02) | 0.57 | 0.55 | — | — | — | $10.38 | 5.60% | 1.41% | 1.59% | (0.23)% | (0.41)% | 87% |
| $116 |
|
| 2013 | $9.94 | (0.08) | (0.03) | (0.11) | — | — | — | $9.83 | (1.11)% | 1.59% | 1.59% | (0.81)% | (0.81)% | 85% |
| $136 |
|
| 2012 | $10.67 | (0.04) | (0.57) | (0.61) | (0.09) | (0.03) | (0.12) | $9.94 | (5.78)% | 1.58% | 1.59% | (0.38)% | (0.39)% | 80% |
| $137 |
|
| 2011 | $9.58 | 0.01 | 1.15 | 1.16 | (0.07) | —(4) | (0.07) | $10.67 | 12.10% | 1.45% | 1.59% | 0.77% | 0.63% | 52% |
| $124 |
|
2010(5) | $10.00 | 0.01 | (0.43) | (0.42) | — | — | — | $9.58 | (4.20)% | 1.45%(6) | 1.59%(6) | 0.29%(6) | 0.15%(6) | 0% |
| $144 |
|
|
|
| Notes to Financial Highlights |
| |
| (1) | Computed using average shares outstanding throughout the period. |
| |
| (2) | Total returns are calculated based on the net asset value of the last business day and do not reflect applicable sales charges, if any. Total returns for periods less than one year are not annualized. |
| |
| (3) | Ratio of operating expenses to average net assets does not include any fees and expenses of the acquired funds. |
| |
| (4) | Per-share amount was less than $0.005. |
| |
| (5) | April 30, 2010 (fund inception) through June 30, 2010. |
See Notes to Financial Statements.
|
|
| Report of Independent Registered Public Accounting Firm |
To the Directors of the American Century Quantitative Equity Funds, Inc. and Shareholders of the Strategic Inflation Opportunities Fund:
In our opinion, the accompanying statement of assets and liabilities, including the schedule of investments, and the related statements of operations, of changes in net assets and the financial highlights present fairly, in all material respects, the financial position of the Strategic Inflation Opportunities Fund (one of the fifteen funds comprising the American Century Quantitative Equity Funds, Inc., hereafter referred to as the “Fund”) at June 30, 2014, the results of its operations for the year then ended, the changes in its net assets for each of the two years in the period then ended and the financial highlights for each of the periods presented, in conformity with accounting principles generally accepted in the United States of America. These financial statements and financial highlights (hereafter referred to as "financial statements") are the responsibility of the Fund's management. Our responsibility is to express an opinion on these financial statements based on our audits. We conducted our audits of these financial statements in accordance with the standards of the Public Company Accounting Oversight Board (United States). Those standards require that we plan and perform the audit to obtain reasonable assurance about whether the financial statements are free of material misstatement. An audit includes examining, on a test basis, evidence supporting the amounts and disclosures in the financial statements, assessing the accounting principles used and significant estimates made by management, and evaluating the overall financial statement presentation. We believe that our audits, which included confirmation of securities at June 30, 2014 by correspondence with the custodian and brokers, provide a reasonable basis for our opinion.
PricewaterhouseCoopers LLP
Kansas City, Missouri
August 21, 2014
Board of Directors
The individuals listed below serve as directors of the funds. Each director will continue to serve in this capacity until death, retirement, resignation or removal from office. The board has adopted a mandatory retirement age for directors who are not “interested persons,” as that term is defined in the Investment Company Act (independent directors). Independent directors shall retire on December 31 of the year in which they reach their 75th birthday; provided, however, that on or after January 1, 2022, independent directors shall retire on December 31 of the year in which they reach their 76th birthday.
Mr. Thomas is an “interested person” because he currently serves as President and Chief Executive Officer of American Century Companies, Inc. (ACC), the parent company of American Century Investment Management, Inc. (ACIM or the advisor). The other directors (more than three-fourths of the total number) are independent. They are not employees, directors or officers of, and have no financial interest in, ACC or any of its wholly owned, direct or indirect, subsidiaries, including ACIM, American Century Investment Services, Inc. (ACIS) and American Century Services, LLC (ACS), and do not have any other affiliations, positions or relationships that would cause them to be considered “interested persons” under the Investment Company Act. The directors serve in this capacity for eight (in the case of Mr. Thomas, 15) registered investment companies in the American Century Investments family of funds.
The following table presents additional information about the directors. The mailing address for each director other than Mr. Thomas is 1665 Charleston Road, Mountain View, California 94043. The mailing address for Mr. Thomas is 4500 Main Street, Kansas City, Missouri 64111.
|
| | | | | |
Name (Year of Birth) | Position(s) Held with Funds | Length of Time Served | Principal Occupation(s) During Past 5 Years | Number of
American
Century
Portfolios
Overseen
by Director | Other Directorships Held During Past 5 Years |
| Independent Directors |
Tanya S. Beder (1955) | Director | Since 2011 | Chairman, SBCC Group Inc. (independent advisory services) (2006 to present) | 42 | CYS Investments, Inc. (specialty finance company) |
Jeremy I. Bulow (1954) | Director | Since 2011 | Professor of Economics, Stanford University, Graduate School of Business (1979 to present) | 42 | None |
Ronald J. Gilson (1946) | Director and Chairman of the Board | Since 1995 (Chairman since 2005) | Charles J. Meyers Professor of Law and Business, Stanford Law School (1979 to present); Marc and Eva Stern Professor of Law and Business, Columbia University School of Law (1992 to present) | 42 | None |
|
| | | | | |
Name (Year of Birth) | Position(s) Held with Funds | Length of Time Served | Principal Occupation(s) During Past 5 Years | Number of
American
Century
Portfolios
Overseen
by Director | Other Directorships Held During Past 5 Years |
| Independent Directors |
Frederick L. A. Grauer (1946) | Director | Since 2008 | Senior Advisor, BlackRock, Inc. (investment management firm) (2010 to 2011); Senior Advisor, Barclays Global Investors (investment management firm) (2003 to 2009) | 42 | None |
Peter F. Pervere
(1947) | Director | Since 2007 | Retired | 42 | Intraware, Inc. (2003 to 2009) |
Myron S. Scholes(1) (1941) | Director | Since 1980 | Chairman, Platinum Grove Asset Management, L.P. (asset manager) (1999 to 2009); Frank E. Buck Professor of Finance-Emeritus, Stanford Graduate School of Business (1996 to present) | 42 | Dimensional Fund Advisors (investment advisor); CME Group, Inc. (futures and options exchange) |
John B. Shoven
(1947) | Director | Since 2002 | Professor of Economics, Stanford University (1973 to present) | 42 | Cadence Design Systems; Exponent; Financial Engines |
| Interested Director |
Jonathan S. Thomas
(1963) | Director and
President | Since 2007 | President and Chief Executive Officer, ACC (March 2007 to present). Also serves as Chief Executive Officer and Manager, ACS; Executive Vice President, ACIM; Director, ACC, ACIM and other ACC subsidiaries | 115 | None |
(1) Myron S. Scholes resigned as director effective July 31, 2014.
Officers
The following table presents certain information about the executive officers of the funds. Each officer serves as an officer for each of the 15 investment companies in the American Century family of funds, unless otherwise noted. No officer is compensated for his or her service as an officer of the funds. The listed officers are interested persons of the funds and are appointed or re-appointed on an annual basis. The mailing address for each of the officers listed below is 4500 Main Street, Kansas City, Missouri 64111.
|
| | |
Name (Year of Birth) | Offices with the Funds | Principal Occupation(s) During the Past Five Years |
Jonathan S. Thomas (1963) | Director and President since 2007 | President and Chief Executive Officer, ACC (March 2007 to present). Also serves as Chief Executive Officer and Manager, ACS; Executive Vice President, ACIM; Director, ACC, ACIM and other ACC subsidiaries |
| Amy D. Shelton (1964) | Chief Compliance Officer since 2014 | Chief Compliance Officer, American Century funds, (March 2014 to present); Chief Compliance Officer, ACIM (February 2014 to present); Chief Compliance Officer, ACIS (October 2009 to present); Vice President, Client Interactions and Marketing, ACIS (February 2013 to January 2014); Director, Client Interactions and Marketing, ACIS (June 2007 to January 2013). Also serves as Vice President, ACIS |
Charles A. Etherington (1957) | General Counsel since 2007 and Senior Vice President since 2006 | Attorney, ACC (February 1994 to present); Vice President, ACC (November 2005 to present); General Counsel, ACC (March 2007 to present). Also serves as General Counsel, ACIM, ACS, ACIS and other ACC subsidiaries; and Senior Vice President, ACIM and ACS |
C. Jean Wade (1964) | Vice President, Treasurer and Chief Financial Officer since 2012 | Vice President, ACS (February 2000 to present) |
Robert J. Leach (1966) | Vice President since 2006 and Assistant Treasurer since 2012 | Vice President, ACS (February 2000 to present) |
David H. Reinmiller (1963) | Vice President since 2001 | Attorney, ACC (January 1994 to present); Associate General Counsel, ACC (January 2001 to present). Also serves as Vice President, ACIM and ACS |
Ward D. Stauffer (1960) | Secretary since 2005 | Attorney, ACC (June 2003 to present) |
The Statement of Additional Information has additional information about the fund’s directors and is available without charge, upon request, by calling 1-800-345-2021.
|
|
| Approval of Management Agreement |
At a meeting held on June 13, 2014, the Fund’s Board of Directors/Trustees unanimously approved the renewal of the management agreement pursuant to which American Century Investment Management, Inc. (the “Advisor”) acts as the investment advisor for the Fund. Under Section 15(c) of the Investment Company Act, contracts for investment advisory services are required to be reviewed, evaluated, and approved by a majority of a fund’s directors/trustees (the “Directors”), including a majority of the independent Directors, each year. The Board regards this annual evaluation and renewal as one of its most important responsibilities.
The independent Directors have memorialized a statement regarding the relationship between their ongoing obligations to oversee and evaluate the performance of the Advisor and their annual consideration of renewal of the management agreement. In that statement, the independent Directors noted that their assessment of the Advisor’s performance is an ongoing process that takes place over the entire year and is informed by all of the extensive information that the Board and its committees receive and consider over time. This information, together with the materials provided in connection with the review, are central to the Board’s assessment of the Advisor’s performance and its determination whether to renew the Fund’s management agreement.
Prior to its consideration of the renewal of the management agreement, the Board requested and reviewed extensive data and analysis relating to the proposed renewal. This information and analysis was compiled by the Advisor and certain independent providers of evaluation data concerning the Fund and the services provided to the Fund by the Advisor.
In connection with its consideration of the renewal of the management agreement, the Board’s review and evaluation of the services provided by the Advisor included, but was not limited to, the following:
| |
| • | the nature, extent, and quality of investment management, shareholder services, and other services provided by the Advisor to the Fund; |
| |
| • | the wide range of other programs and services the Advisor provides to the Fund and its shareholders on a routine and non-routine basis; |
| |
| • | the investment performance of the Fund, including data comparing the Fund’s performance to appropriate benchmarks and/or a peer group of other mutual funds with similar investment objectives and strategies; |
| |
| • | the cost of owning the Fund compared to the cost of owning similar funds; |
| |
| • | the Advisor’s compliance policies, procedures, and regulatory experience; |
| |
| • | financial data showing the cost of services provided to the Fund, the profitability of the Fund to the Advisor, and the overall profitability of the Advisor; |
| |
| • | possible economies of scale associated with the Advisor’s management of the Fund and other accounts under its management; |
| |
| • | data comparing services provided and charges to other investment management clients of the Advisor; and |
| |
| • | any collateral benefits derived by the Advisor from the management of the Fund. |
In keeping with its practice, the Board held two in-person meetings to review and discuss the information provided. The independent Directors also had the benefit of the advice of their independent counsel throughout the process.
Factors Considered
The Directors considered all of the information provided by the Advisor, the independent data providers, and the independent Directors’ independent counsel in connection with the review, and evaluated such information for the Fund. In connection with their review, the Directors did not identify any single factor as being all-important or controlling and each Director may have attributed
different levels of importance to different factors. In deciding to renew the management agreement, the Board based its decision on a number of factors, including the following:
Nature, Extent and Quality of Services — Generally. Under the management agreement, the Advisor is responsible for providing or arranging for all services necessary for the operation of the Fund. The Board noted that under the management agreement, the Advisor provides or arranges at its own expense a wide variety of services including:
| |
| • | constructing and designing the Fund |
| |
| • | portfolio research and security selection |
| |
| • | initial capitalization/funding |
| |
| • | daily valuation of the Fund’s portfolio |
| |
| • | shareholder servicing and transfer agency, including shareholder confirmations, recordkeeping, and communications |
| |
| • | regulatory and portfolio compliance |
| |
| • | marketing and distribution |
The Board noted that many of these services have expanded over time both in terms of quantity and complexity in response to shareholder demands, competition in the industry, changing distribution channels, and the changing regulatory environment.
Investment Management Services. The nature of the investment management services provided to the Fund is quite complex and allows Fund shareholders access to professional money management, instant diversification of their investments within an asset class, the opportunity to easily diversify among asset classes by investing in or exchanging among various American Century Investments funds, and liquidity. In evaluating investment performance, the Board expects the Advisor to manage the Fund in accordance with its investment objectives and approved strategies. Further, the Directors recognize that the Advisor has an obligation to seek the best execution of fund trades. In providing these services, the Advisor utilizes teams of investment professionals (portfolio managers, analysts, research assistants, and securities traders) who require extensive information technology, research, training, compliance and other systems to conduct their business. The Board, directly and through its Portfolio Committee, regularly reviews investment performance information for the Fund, together with comparative information for appropriate benchmarks and/or peer groups of similarly-managed funds, over different time horizons. The Directors also review detailed performance information during the management agreement approval process. If performance concerns are identified, the Fund receives special reviews until performance improves, during which the Board discusses with the Advisor the reasons for such results (e.g., market conditions, security selection) and any efforts being undertaken to improve performance. The Fund’s performance was below its benchmark for both the one- and three-year periods reviewed by the Board. The Board found the investment management services provided by the Advisor to the Fund to be satisfactory and consistent with the management agreement.
Shareholder and Other Services. Under the management agreement, the Advisor provides the Fund with a comprehensive package of transfer agency, shareholder, and other services. The Board, directly and through various committees of the Board, regularly reviews reports and evaluations of such services at its regular meetings. These reports include, but are not limited to, information regarding the operational efficiency and accuracy of the shareholder and transfer agency services provided, staffing levels, shareholder satisfaction (as measured by external as well as internal sources), technology support, new products and services offered to Fund shareholders, securities trading activities, portfolio valuation services, auditing services, and legal and operational compliance activities. Certain aspects of shareholder and transfer agency service level efficiency
and the quality of securities trading activities are measured by independent third party providers and are presented in comparison to other fund groups not managed by the Advisor. The Board found the services provided by the Advisor to the Fund under the management agreement to be competitive and of high quality.
Costs of Services and Profitability. The Advisor provides detailed information concerning its cost of providing various services to the Fund, its profitability in managing the Fund, its overall profitability, and its financial condition. The Directors have reviewed with the Advisor the methodology used to prepare this financial information. The financial information regarding the Advisor is considered in evaluating the Advisor’s financial condition, its ability to continue to provide services under the management agreement, and the reasonableness of the current management fee. The Board concluded that the Advisor’s profits were reasonable in light of the services provided to the Fund.
Ethics. The Board generally considers the Advisor’s commitment to providing quality services to shareholders and to conducting its business ethically. They noted that the Advisor’s practices generally meet or exceed industry best practices.
Economies of Scale. The Board also reviewed information provided by the Advisor regarding the possible existence of economies of scale in connection with the management of the Fund. The Board concluded that economies of scale are difficult to measure and predict with precision, especially on a fund-by-fund basis. The Board concluded that the Advisor is appropriately sharing economies of scale through its competitive fee structure, offering competitive fees from fund inception, and through reinvestment in its business to provide shareholders additional content and services.
Comparison to Other Funds’ Fees. The management agreement provides that the Fund pays the Advisor a single, all-inclusive (or unified) management fee for providing all services necessary for the management and operation of the Fund, other than brokerage expenses, taxes, interest, extraordinary expenses, and the fees and expenses of the Fund’s independent directors (including their independent legal counsel) and expenses incurred in connection with the provision of shareholder services and distribution services under a plan adopted pursuant to Rule 12b-1 under the 1940 Act. Under the unified fee structure, the Advisor is responsible for providing all investment advisory, custody, audit, administrative, compliance, recordkeeping, marketing and shareholder services, or arranging and supervising third parties to provide such services. By contrast, most other funds are charged a variety of fees, including an investment advisory fee, a transfer agency fee, an administrative fee, distribution charges and other expenses. Other than their investment advisory fees and any applicable Rule 12b-1 distribution fees, all other components of the total fees charged by these other funds may be increased without shareholder approval. The Board believes the unified fee structure is a benefit to Fund shareholders because it clearly discloses to shareholders the cost of owning Fund shares, and, since the unified fee cannot be increased without a vote of Fund shareholders, it shifts to the Advisor the risk of increased costs of operating the Fund and provides a direct incentive to minimize administrative inefficiencies. Part of the Board’s analysis of fee levels involves reviewing certain evaluative data compiled by an independent provider and comparing the Fund’s unified fee to the total expense ratio of other funds in the Fund’s peer group. The unified fee charged to shareholders of the Fund was below the median of the total expense ratios of the Fund’s peer universe. The Board concluded that the management fee paid by the Fund to the Advisor under the management agreement is reasonable in light of the services provided to the Fund.
Comparison to Fees and Services Provided to Other Clients of the Advisor. The Board also requested and received information from the Advisor concerning the nature of the services, fees, costs and profitability of its advisory services to advisory clients other than the Fund. They observed that these varying types of client accounts require different services and involve different regulatory and entrepreneurial risks than the management of the Fund. The Board analyzed this information and concluded that the fees charged and services provided to the Fund were reasonable by comparison.
Collateral or “Fall-Out” Benefits Derived by the Advisor. The Board considered the existence of collateral benefits the Advisor may receive as a result of its relationship with the Fund. They concluded that the Advisor’s primary business is managing mutual funds and it generally does not use fund or shareholder information to generate profits in other lines of business, and therefore does not derive any significant collateral benefits from them. The Board noted that the Advisor receives proprietary research from broker-dealers that execute fund portfolio transactions and concluded that this research is likely to benefit Fund shareholders. The Board also determined that the Advisor is able to provide investment management services to certain clients other than the Fund, at least in part, due to its existing infrastructure built to serve the fund complex. The Board concluded, however, that the assets of those other clients are not material to the analysis and, where applicable, may be included with the assets of the Fund to determine breakpoints in the management fee schedule.
Existing Relationship. The Board also considered whether there was any reason for not continuing the existing arrangement with the Advisor. In this regard, the Board was mindful of the potential disruptions of the Fund’s operations and various risks, uncertainties, and other effects that could occur as a result of a decision not to continue such relationship. In particular, the Board recognized that most shareholders have invested in the Fund on the strength of the Advisor’s industry standing and reputation and in the expectation that the Advisor will have a continuing role in providing advisory services to the Fund.
Conclusion of the Directors. As a result of this process, the Board, including all of the independent Directors and assisted by the advice of independent legal counsel, taking into account all of the factors discussed above and the information provided by the Advisor and others, concluded that the management agreement between the Fund and the Advisor is fair and reasonable in light of the services provided and should be renewed.
Retirement Account Information
As required by law, distributions you receive from certain IRAs are subject to federal income tax withholding, unless you elect not to have withholding apply. Tax will be withheld on the total amount withdrawn even though you may be receiving amounts that are not subject to withholding, such as nondeductible contributions. In such case, excess amounts of withholding could occur. You may adjust your withholding election so that a greater or lesser amount will be withheld.
If you don’t want us to withhold on this amount, you must notify us to not withhold the federal income tax. You may notify us in writing or in certain situations by telephone or through other electronic means. For systematic withdrawals, your withholding election will remain in effect until revoked or changed by filing a new election. You have the right to revoke your election at any time.
Remember, even if you elect not to have income tax withheld, you are liable for paying income tax on the taxable portion of your withdrawal. If you elect not to have income tax withheld or you don’t have enough income tax withheld, you may be responsible for payment of estimated tax. You may incur penalties under the estimated tax rules if your withholding and estimated tax payments are not sufficient. You can reduce or defer the income tax on a distribution by directly or indirectly rolling such distribution over to another IRA or eligible plan. You should consult your tax advisor for additional information.
State tax will be withheld if, at the time of your distribution, your address is within one of the mandatory withholding states and you have federal income tax withheld (or as otherwise required by state law). State taxes will be withheld from your distribution in accordance with the respective state rules.
Distributions you receive from 403(b), 457 and qualified plans are subject to special tax and withholding rules. Your plan administrator or plan sponsor is required to provide you with a special tax notice explaining those rules at the time you request a distribution. If applicable, federal and/or state taxes may be withheld from your distribution amount.
Proxy Voting Policies
Descriptions of the principles and policies that the fund's investment advisor uses in exercising the voting rights associated with the securities purchased and/or held by the fund are available without charge, upon request, by calling 1-800-345-2021 or visiting the "About Us" page of American Century Investments’ website at americancentury.com. A description of the policies is also available on the Securities and Exchange Commission’s website at sec.gov. Information regarding how the investment advisor voted proxies relating to portfolio securities during the most recent 12-month period ended June 30 is available on the "About Us" page at americancentury.com. It is also available at sec.gov.
Quarterly Portfolio Disclosure
The fund files its complete schedule of portfolio holdings with the Securities and Exchange Commission (SEC) for the first and third quarters of each fiscal year on Form N-Q. The fund’s Forms N-Q are available on the SEC’s website at sec.gov, and may be reviewed and copied at the SEC’s Public Reference Room in Washington, DC. Information on the operation of the Public Reference Room may be obtained by calling 1-800-SEC-0330. The fund also makes its complete schedule of portfolio holdings for the most recent quarter of its fiscal year available on its website at americancentury.com and, upon request, by calling 1-800-345-2021.
Other Tax Information
The following information is provided pursuant to provisions of the Internal Revenue Code.
The fund hereby designates up to the maximum amount allowable as qualified dividend income for the fiscal year ended June 30, 2014.
For corporate taxpayers, the fund hereby designates $110,554, or up to the maximum amount allowable, of ordinary income distributions paid during the fiscal year ended June 30, 2014 as qualified for the corporate dividends received deduction.
|
| | |
| |
| | | |
| Contact Us | americancentury.com | |
| Automated Information Line | 1-800-345-8765 | |
| Investor Services Representative | 1-800-345-2021
or 816-531-5575 | |
| Investors Using Advisors | 1-800-378-9878 | |
Business, Not-For-Profit, Employer-Sponsored
Retirement Plans | 1-800-345-3533 | |
Banks and Trust Companies, Broker-Dealers,
Financial Professionals, Insurance Companies | 1-800-345-6488 | |
| Telecommunications Relay Service for the Deaf | 711 | |
| | | |
| American Century Quantitative Equity Funds, Inc. | |
| | | |
Investment Advisor: American Century Investment Management, Inc. Kansas City, Missouri | |
| | | |
| This report and the statements it contains are submitted for the general information of our shareholders. The report is not authorized for distribution to prospective investors unless preceded or accompanied by an effective prospectus. | |
| | | |
©2014 American Century Proprietary Holdings, Inc. All rights reserved.
CL-ANN-82890 1408 | |
|
| |
ANNUAL REPORT | JUNE 30, 2014 |
Utilities Fund
|
| |
| President's Letter | |
| Performance | |
| Portfolio Commentary | |
| Fund Characteristics | |
| Shareholder Fee Example | |
| Schedule of Investments | |
| Statement of Assets and Liabilities | |
| Statement of Operations | |
| Statement of Changes in Net Assets | |
| Notes to Financial Statements | |
| Financial Highlights | |
| Report of Independent Registered Public Accounting Firm | |
| Management | |
| Approval of Management Agreement | |
| Additional Information | |
Any opinions expressed in this report reflect those of the author as of the date of the report, and do not necessarily represent the opinions of American Century Investments® or any other person in the American Century Investments organization. Any such opinions are subject to change at any time based upon market or other conditions and American Century Investments disclaims any responsibility to update such opinions. These opinions may not be relied upon as investment advice and, because investment decisions made by American Century Investments funds are based on numerous factors, may not be relied upon as an indication of trading intent on behalf of any American Century Investments fund. Security examples are used for representational purposes only and are not intended as recommendations to purchase or sell securities. Performance information for comparative indices and securities is provided to American Century Investments by third party vendors. To the best of American Century Investments’ knowledge, such information is accurate at the time of printing.
|
| |
| Dear Investor:
Thank you for reviewing this annual report for the 12 months ended June 30, 2014. It provides investment performance and portfolio information for the reporting period, plus longer-term historical performance data.
Annual reports remain important vehicles for conveying information about fund returns, including market and economic factors that affected performance during the reporting period. For additional, updated investment and market insights, we encourage you to visit our website, americancentury.com.
|
| Jonathan Thomas |
Aggressive Monetary Policies Boosted Stock and Bond Returns
Stimulative monetary policies and expectations of economic improvement, interspersed with concerns about weaker-than-expected economic data and geopolitical conflicts, helped drive financial market returns during the reporting period. We believe the combination of longer-term optimism about global economic growth, low costs of capital, and central bank purchases of fixed income securities helped persuade investors to seek risk and yield, especially in the U.S. and Europe. Stock index returns were strong in these markets, particularly at the smaller capitalization end of the company size spectrum. The MSCI Europe and S&P 500® indices advanced 29.28% and 24.61%, respectively.
Remarkably, for a period in which stock market performance was so strong, government bond performance was also generally positive. Not surprisingly, U.S. corporate high-yield bonds posted double-digit returns, but the 30-year U.S. Treasury bond also outperformed most broader bond market measures. In addition, a generally weaker U.S. dollar during the reporting period meant that international bond returns for U.S. investors with currency exposure were generally higher than U.S. bonds returns. The Barclays Global Aggregate Bond and Barclays U.S. Aggregate Bond indices returned 7.39% and 4.37%, respectively.
Looking ahead, we see signs of sustained moderate economic growth in the second half of 2014, but headwinds persist. In the U.S., which was supposed to be an economic growth leader this year, housing market momentum has slowed, interest rates could rise, and economic growth and U.S. employment levels remain subpar compared with past post-recession periods. In this environment, we continue to believe in a disciplined, diversified, long-term investment approach, using professionally managed stock and bond portfolios—as appropriate—for meeting financial goals. We appreciate your continued trust in us.
Sincerely,
Jonathan Thomas
President and Chief Executive Officer
American Century Investments
|
| | | | | | |
| Total Returns as of June 30, 2014 |
| | | | Average Annual Returns | |
| | Ticker Symbol | 1 year | 5 years | 10 years | Since Inception | Inception Date |
| Investor Class | BULIX | 17.35% | 14.34% | 10.56% | 8.31% | 3/1/93 |
| Russell 3000 Utilities Index | — | 16.43% | 14.74% | 9.26% | N/A(1) | — |
| S&P 500 Index | — | 24.61% | 18.82% | 7.78% | 9.34% | — |
| |
| (1) | Benchmark data first available August 1996. |
Data presented reflect past performance. Past performance is no guarantee of future results. Current performance may be higher or lower than the performance shown. Investment return and principal value will fluctuate, and redemption value may be more or less than original cost. To obtain performance data current to the most recent month end, please call 1-800-345-2021 or visit americancentury.com. The fund concentrates its investments in a narrow segment of the total market and is therefore subject to greater risks and market fluctuations than a portfolio representing a broader range of industries.
Data assumes reinvestment of dividends and capital gains, and none of the charts reflect the deduction of taxes that a shareholder would pay on fund distributions or the redemption of fund shares. Returns for the indices are provided for comparison. The fund’s total returns include operating expenses (such as transaction costs and management fees) that reduce returns, while the total returns of the indices do not.
|
|
| Growth of $10,000 Over 10 Years |
| $10,000 investment made June 30, 2004 |
|
| |
| Value on June 30, 2014 |
| | Investor Class — $27,296 |
| |
| | Russell 3000 Utilities Index — $24,260 |
| |
| | S&P 500 Index — $21,159 |
| |
|
| |
| Total Annual Fund Operating Expenses |
| Investor Class | 0.68% |
Data presented reflect past performance. Past performance is no guarantee of future results. Current performance may be higher or lower than the performance shown. Investment return and principal value will fluctuate, and redemption value may be more or less than original cost. To obtain performance data current to the most recent month end, please call 1-800-345-2021 or visit americancentury.com. The fund concentrates its investments in a narrow segment of the total market and is therefore subject to greater risks and market fluctuations than a portfolio representing a broader range of industries.
Data assumes reinvestment of dividends and capital gains, and none of the charts reflect the deduction of taxes that a shareholder would pay on fund distributions or the redemption of fund shares. Returns for the indices are provided for comparison. The fund’s total returns include operating expenses (such as transaction costs and management fees) that reduce returns, while the total returns of the indices do not.
Portfolio Managers: Bill Martin and Lynette Pang
Performance Summary
Utilities returned 17.35% for the 12 months ended June 30, 2014, outpacing the 16.43% return of its benchmark, the Russell 3000 Utilities Index. The S&P 500 Index, a broad market measure, returned 24.61%.
As described on page 2, the U.S. stock market posted strong returns for the 12-month period. In general, utilities stocks produced solid gains but lagged the overall market as investors grew increasingly less cautious and anticipated higher interest rates. Dividend-paying utility stocks are often seen as a good alternative to bonds in a low interest rate environment, while higher bond yields typically reduce utilities’ appeal.
The Russell 3000 Utilities Index is primarily made up of utilities and telecommunication services stocks but includes smaller allocations to other sectors. Energy stocks—a small proportion of the overall benchmark—performed the best on a total return basis, registering very strong gains. The information technology sector, also a very small part of the index, did well. Traditional utilities, which make up slightly less than 60% of the Russell benchmark, returned 21%, while telecommunication services, nearly 40% of the benchmark, rose a more modest 6%. The benchmark’s tiny industrials allocation lost ground during the period.
Stock selection and a slight overweight allocation in the traditional utilities sector were the top contributors to the fund’s outperformance versus the benchmark. Within the sector, stock choices in electric utilities were a key relative contributor, while gas utilities, independent power producers, and water utilities also were positive. The key detractors were positioning in industrials and an underweight in the strong energy sector.
Utilities Were the Top Contributors
Like the Russell benchmark, traditional utilities and telecommunication services stocks represent the vast majority of the fund’s holdings. A slight overweight to utilities along with stock decisions in the sector were key contributors to relative results during the year. It helped to be overweight several electric utilities, including UNS Energy, American Electric Power, and Edison International. Lighter exposure to Exelon and FirstEnergy was beneficial as well. Stock selection in gas utilities was positive, with overweight holdings in UGI, Chesapeake Utilities, and Southwest Gas adding to results. We took profits in some holdings, eliminating UNS Energy, Chesapeake Utilities, and Southwest Gas. Avoiding Questar and WGL Holdings also helped performance compared with the benchmark.
An overweight to independent power producers benefited results as did stock selection in the industry, which enjoyed improving prices for power and natural gas. Avoiding water utilities altogether was positive. However, stock selection and an underweight to multi-utilities detracted from relative performance.
Telecommunications and Information Technology Helped Results
The telecommunication services sector—the second-largest segment of the fund and index—provided positive relative contributions due both to an underweight allocation and stock decisions. The fund’s two largest positions in absolute terms were AT&T and Verizon, but the fund had lighter exposure to both companies than the index. This benefited performance as both stocks lagged during the year as a result of increasing competitive pressures. At the same time, heavier exposure to Inteliquent was a plus.
The tiny information technology segment was a key source of outperformance as the fund’s overweight allocation and stock selection were positive. Overweighting j2 Global and owning QUALCOMM, which is not represented in the index, were especially beneficial. Internet service provider j2 Global rose on higher revenues and strong guidance. We took profits and eliminated the stock from the portfolio as its price spiked. Chipmaker QUALCOMM reported increased profits and said it expects earnings to move higher this year.
Industrials and Energy Stocks Weighed on Relative Results
The fund’s largest detractor over the fiscal year was industrial sector company Pike Corp., formerly Pike Electric. The construction and engineering firm, whose services are directed to the electric energy industry, failed to meet analysts’ earnings expectations in its fiscal third quarter.
An underweight allocation to energy detracted from returns versus the benchmark. Not owning ONEOK was the chief cause of underperformance in the sector. Among other notable individual detractors was an overweight position in wireless provider NTELOS, which declined after lowering guidance for 2014 and eliminating its dividend. Another key detractor was magicJack VocalTec, whose chief product is a device for making phone calls over the internet. The stock fell on concerns about delays in shifting its product and marketing strategy.
Outlook
Utilities employs a structured, disciplined investment approach. The management team incorporates both growth and value measures into its stock selection process and attempts to balance the portfolio’s risk and expected return.
The team continues to overweight utilities, especially gas and electric utilities, but is still avoiding water utilities and is underweight multi-utilities. Telecommunication services is significantly underweight as a result of only modest exposure to diversified telecommunication services firms. The fund has a roughly neutral allocation to wireless services companies.
|
| | | | | | |
| Utilities Market Returns |
| For the 12 months ended June 30, 2014 |
| Broad U.S. Stock Market | | | Primary Utilities Industries in Fund Benchmark |
| S&P 500 Index | 24.61 | % | | Diversified Telecommunication Services | 6.35 | % |
| Nasdaq Composite Index* | 29.53 | % | | Electric Utilities | 19.19 | % |
| Broad Utilities Market | | | Multi-Utilities | 22.93 | % |
| Lipper Utility Funds Index | 25.60 | % | | Gas Utilities | 24.38 | % |
| Russell 3000 Utilities Index | 16.43 | % | | Independent Power and Renewable Electricity Producers | 30.36 | % |
| |
| * | Return does not reflect the reinvestment of dividends on securities in the index. Had such reinvestments been included, returns would have been higher. |
|
| |
| JUNE 30, 2014 | |
| Top Ten Holdings | % of net assets |
| AT&T, Inc. | 12.3% |
| Verizon Communications, Inc. | 10.0% |
| Public Service Enterprise Group, Inc. | 4.8% |
| American Electric Power Co., Inc. | 4.6% |
| Entergy Corp. | 4.4% |
| Edison International | 4.4% |
| Exelon Corp. | 4.1% |
| PPL Corp. | 3.9% |
| CenturyLink, Inc. | 3.9% |
| PG&E Corp. | 3.9% |
| | |
| Sub-Industry Allocation | % of net assets |
| Electric Utilities | 36.9% |
| Integrated Telecommunication Services | 27.1% |
| Multi-Utilities | 17.7% |
| Gas Utilities | 5.4% |
| Alternative Carriers | 3.8% |
| Independent Power Producers and Energy Traders | 3.1% |
| Communications Equipment | 2.2% |
| Wireless Telecommunication Services | 1.6% |
| Construction and Engineering | 1.0% |
| Office Services and Supplies | 0.5% |
| Cash and Equivalents* | 0.7% |
| *Includes temporary cash investments and other assets and liabilities. | |
| | |
| Types of Investments in Portfolio | % of net assets |
| Common Stocks | 99.3% |
| Temporary Cash Investments | 0.6% |
| Other Assets and Liabilities | 0.1% |
Fund shareholders may incur two types of costs: (1) transaction costs, including sales charges (loads) on purchase payments and redemption/exchange fees; and (2) ongoing costs, including management fees; distribution and service (12b-1) fees; and other fund expenses. This example is intended to help you understand your ongoing costs (in dollars) of investing in your fund and to compare these costs with the ongoing cost of investing in other mutual funds.
The example is based on an investment of $1,000 made at the beginning of the period and held for the entire period from January 1, 2014 to June 30, 2014.
Actual Expenses
The table provides information about actual account values and actual expenses for each class. You may use the information, together with the amount you invested, to estimate the expenses that you paid over the period. First, identify the share class you own. Then simply divide your account value by $1,000 (for example, an $8,600 account value divided by $1,000 = 8.6), then multiply the result by the number under the heading “Expenses Paid During Period” to estimate the expenses you paid on your account during this period.
If you hold Investor Class shares of any American Century Investments fund, or Institutional Class shares of the American Century Diversified Bond Fund, in an American Century Investments account (i.e., not a financial intermediary or retirement plan account), American Century Investments may charge you a $12.50 semiannual account maintenance fee if the value of those shares is less than $10,000. We will redeem shares automatically in one of your accounts to pay the $12.50 fee. In determining your total eligible investment amount, we will include your investments in all personal accounts (including American Century Investments Brokerage accounts) registered under your Social Security number. Personal accounts include individual accounts, joint accounts, UGMA/UTMA accounts, personal trusts, Coverdell Education Savings Accounts and IRAs (including traditional, Roth, Rollover, SEP-, SARSEP- and SIMPLE-IRAs), and certain other retirement accounts. If you have only business, business retirement, employer-sponsored or American Century Investments Brokerage accounts, you are currently not subject to this fee. If you are subject to the Account Maintenance Fee, your account value could be reduced by the fee amount.
Hypothetical Example for Comparison Purposes
The table also provides information about hypothetical account values and hypothetical expenses based on the actual expense ratio of each class of your fund and an assumed rate of return of 5% per year before expenses, which is not the actual return of a fund’s share class. The hypothetical account values and expenses may not be used to estimate the actual ending account balance or expenses you paid for the period. You may use this information to compare the ongoing costs of investing in your fund and other funds. To do so, compare this 5% hypothetical example with the 5% hypothetical examples that appear in the shareholder reports of the other funds.
Please note that the expenses shown in the table are meant to highlight your ongoing costs only and do not reflect any transactional costs, such as sales charges (loads) or redemption/exchange fees. Therefore, the table is useful in comparing ongoing costs only, and will not help you determine the relative total costs of owning different funds. In addition, if these transactional costs were included, your costs would have been higher.
|
| | | | |
| | Beginning Account Value 1/1/14 | Ending Account Value 6/30/14 | Expenses Paid
During Period(1)
1/1/14 - 6/30/14 | Annualized Expense Ratio(1) |
| Actual | | | | |
| Investor Class | $1,000 | $1,130.50 | $3.54 | 0.67% |
| Hypothetical | | | | |
| Investor Class | $1,000 | $1,021.47 | $3.36 | 0.67% |
| |
| (1) | Expenses are equal to the class’s annualized expense ratio listed in the table above, multiplied by the average account value over the period, multiplied by 181, the number of days in the most recent fiscal half-year, divided by 365, to reflect the one-half year period. |
JUNE 30, 2014
|
| | | | | |
| | Shares | Value |
| COMMON STOCKS — 99.3% | | |
| ALTERNATIVE CARRIERS — 3.8% | | |
| Inteliquent, Inc. | 591,215 |
| $ | 8,200,152 |
|
Intelsat SA(1) | 51,369 |
| 967,792 |
|
magicJack VocalTec Ltd.(1) | 308,879 |
| 4,670,250 |
|
Premiere Global Services, Inc.(1) | 129,488 |
| 1,728,665 |
|
| | | 15,566,859 |
|
| COMMUNICATIONS EQUIPMENT — 2.2% | | |
| QUALCOMM, Inc. | 116,358 |
| 9,215,554 |
|
| CONSTRUCTION AND ENGINEERING — 1.0% | | |
Pike Corp.(1) | 455,855 |
| 4,084,461 |
|
| ELECTRIC UTILITIES — 36.9% | | |
| American Electric Power Co., Inc. | 343,648 |
| 19,165,249 |
|
| Duke Energy Corp. | 105,410 |
| 7,820,368 |
|
| Edison International | 314,916 |
| 18,299,769 |
|
| Entergy Corp. | 222,956 |
| 18,302,458 |
|
| Exelon Corp. | 468,515 |
| 17,091,427 |
|
| FirstEnergy Corp. | 168,738 |
| 5,858,583 |
|
| Great Plains Energy, Inc. | 152,237 |
| 4,090,608 |
|
| IDACORP, Inc. | 32,323 |
| 1,869,239 |
|
| NextEra Energy, Inc. | 49,057 |
| 5,027,361 |
|
| Pinnacle West Capital Corp. | 226,953 |
| 13,126,962 |
|
| Portland General Electric Co. | 74,841 |
| 2,594,737 |
|
| PPL Corp. | 452,286 |
| 16,069,722 |
|
| Southern Co. (The) | 165,433 |
| 7,507,350 |
|
| Westar Energy, Inc. | 332,430 |
| 12,695,502 |
|
| Xcel Energy, Inc. | 112,193 |
| 3,615,980 |
|
| | | 153,135,315 |
|
| GAS UTILITIES — 5.4% | | |
| AGL Resources, Inc. | 114,467 |
| 6,299,119 |
|
| New Jersey Resources Corp. | 40,100 |
| 2,292,116 |
|
| UGI Corp. | 271,582 |
| 13,714,891 |
|
| | | 22,306,126 |
|
| INDEPENDENT POWER PRODUCERS AND ENERGY TRADERS — 3.1% | |
| AES Corp. (The) | 831,537 |
| 12,930,400 |
|
| INTEGRATED TELECOMMUNICATION SERVICES — 27.1% | | |
| AT&T, Inc. | 1,439,900 |
| 50,914,864 |
|
| CenturyLink, Inc. | 442,678 |
| 16,024,944 |
|
| Enventis Corp. | 23,007 |
| 364,431 |
|
| Frontier Communications Corp. | 92,299 |
| 539,026 |
|
| IDT Corp., Class B | 182,765 |
| 3,183,766 |
|
| Verizon Communications, Inc. | 847,439 |
| 41,465,190 |
|
| | | 112,492,221 |
|
|
| | | | | |
| | Shares | Value |
| MULTI-UTILITIES — 17.7% | | |
| Ameren Corp. | 119,074 |
| $ | 4,867,745 |
|
| Avista Corp. | 45,597 |
| 1,528,411 |
|
| CMS Energy Corp. | 51,872 |
| 1,615,813 |
|
| Consolidated Edison, Inc. | 153,323 |
| 8,852,870 |
|
| Dominion Resources, Inc. | 75,847 |
| 5,424,578 |
|
| DTE Energy Co. | 70,695 |
| 5,505,020 |
|
| PG&E Corp. | 332,951 |
| 15,988,307 |
|
| Public Service Enterprise Group, Inc. | 487,432 |
| 19,882,351 |
|
| SCANA Corp. | 182,851 |
| 9,839,212 |
|
| | | 73,504,307 |
|
| OFFICE SERVICES AND SUPPLIES — 0.5% | | |
| West Corp. | 80,122 |
| 2,147,270 |
|
| WIRELESS TELECOMMUNICATION SERVICES — 1.6% | | |
| NTELOS Holdings Corp. | 255,352 |
| 3,181,686 |
|
| USA Mobility, Inc. | 225,024 |
| 3,465,369 |
|
| | | 6,647,055 |
|
TOTAL COMMON STOCKS (Cost $328,909,627) | | 412,029,568 |
|
| TEMPORARY CASH INVESTMENTS — 0.6% | | |
| Repurchase Agreement, Bank of America Merrill Lynch, (collateralized by various U.S. Treasury obligations, 0.75% - 0.875%, 1/31/18 - 2/28/18, valued at $510,614), in a joint trading account at 0.05%, dated 6/30/14, due 7/1/14 (Delivery value $500,339) | | 500,338 |
|
| Repurchase Agreement, Credit Suisse First Boston, Inc., (collateralized by various U.S. Treasury obligations, 1.75%, 5/15/23, valued at $204,312), in a joint trading account at 0.01%, dated 6/30/14, due 7/1/14 (Delivery value $200,135) | | 200,135 |
|
| Repurchase Agreement, Goldman Sachs & Co., (collateralized by various U.S. Treasury obligations, 3.125%, 11/15/41, valued at $408,323), in a joint trading account at 0.03%, dated 6/30/14, due 7/1/14 (Delivery value $400,271) | | 400,271 |
|
| SSgA U.S. Government Money Market Fund, Class N | 1,182,980 |
| 1,182,980 |
|
TOTAL TEMPORARY CASH INVESTMENTS (Cost $2,283,724) | | 2,283,724 |
|
TOTAL INVESTMENT SECURITIES — 99.9% (Cost $331,193,351) | | 414,313,292 |
|
| OTHER ASSETS AND LIABILITIES — 0.1% | | 526,903 |
|
| TOTAL NET ASSETS — 100.0% | | $ | 414,840,195 |
|
|
| |
| NOTES TO SCHEDULE OF INVESTMENTS |
| (1) | Non-income producing.
|
See Notes to Financial Statements.
|
|
| Statement of Assets and Liabilities |
|
| | | |
| JUNE 30, 2014 |
| Assets |
| Investment securities, at value (cost of $331,193,351) | $ | 414,313,292 |
|
| Receivable for capital shares sold | 265,493 |
|
| Dividends and interest receivable | 1,016,617 |
|
| | 415,595,402 |
|
| | |
| Liabilities | |
| Payable for capital shares redeemed | 532,163 |
|
| Accrued management fees | 223,044 |
|
| | 755,207 |
|
| | |
| Net Assets | $ | 414,840,195 |
|
| | |
| Investor Class Capital Shares, $0.01 Par Value | |
| Shares authorized | 100,000,000 |
|
| Shares outstanding | 23,003,899 |
|
| | |
| Net Asset Value Per Share | $ | 18.03 |
|
| | |
| Net Assets Consist of: | |
| Capital (par value and paid-in surplus) | $ | 320,482,291 |
|
| Undistributed net investment income | 1,359,386 |
|
| Undistributed net realized gain | 9,878,552 |
|
| Net unrealized appreciation | 83,119,966 |
|
| | $ | 414,840,195 |
|
See Notes to Financial Statements.
|
| | | |
| YEAR ENDED JUNE 30, 2014 |
| Investment Income (Loss) |
| Income: | |
| Dividends (net of foreign taxes withheld of $27,704) | $ | 15,049,259 |
|
| Interest | 666 |
|
| | 15,049,925 |
|
| | |
| Expenses: | |
| Management fees | 2,455,203 |
|
| Directors' fees and expenses | 22,414 |
|
| Other expenses | 362 |
|
| | 2,477,979 |
|
| | |
| Net investment income (loss) | 12,571,946 |
|
| | |
| Realized and Unrealized Gain (Loss) | |
| Net realized gain (loss) on: | |
| Investment transactions | 20,051,084 |
|
| Foreign currency transactions | (2,187 | ) |
| | 20,048,897 |
|
| | |
| Change in net unrealized appreciation (depreciation) on: | |
| Investments | 27,251,698 |
|
| Translation of assets and liabilities in foreign currencies | 1,631 |
|
| | 27,253,329 |
|
| | |
| Net realized and unrealized gain (loss) | 47,302,226 |
|
| | |
| Net Increase (Decrease) in Net Assets Resulting from Operations | $ | 59,874,172 |
|
See Notes to Financial Statements.
|
|
| Statement of Changes in Net Assets |
|
| | | | | | |
| YEARS ENDED JUNE 30, 2014 AND JUNE 30, 2013 |
| Increase (Decrease) in Net Assets | June 30, 2014 | June 30, 2013 |
| Operations | | |
| Net investment income (loss) | $ | 12,571,946 |
| $ | 12,421,577 |
|
| Net realized gain (loss) | 20,048,897 |
| 12,825,977 |
|
| Change in net unrealized appreciation (depreciation) | 27,253,329 |
| 10,932,533 |
|
| Net increase (decrease) in net assets resulting from operations | 59,874,172 |
| 36,180,087 |
|
| | | |
| Distributions to Shareholders | | |
| From net investment income | (12,695,491 | ) | (11,910,971 | ) |
| From net realized gains | (20,977,352 | ) | (16,868,526 | ) |
| Decrease in net assets from distributions | (33,672,843 | ) | (28,779,497 | ) |
| | | |
| Capital Share Transactions | | |
| Proceeds from shares sold | 92,806,569 |
| 96,109,879 |
|
| Proceeds from reinvestment of distributions | 32,206,183 |
| 27,339,089 |
|
| Payments for shares redeemed | (84,646,037 | ) | (98,901,981 | ) |
| Net increase (decrease) in net assets from capital share transactions | 40,366,715 |
| 24,546,987 |
|
| | | |
| Net increase (decrease) in net assets | 66,568,044 |
| 31,947,577 |
|
| | | |
| Net Assets | | |
| Beginning of period | 348,272,151 |
| 316,324,574 |
|
| End of period | $ | 414,840,195 |
| $ | 348,272,151 |
|
| | | |
| Undistributed net investment income | $ | 1,359,386 |
| $ | 1,741,486 |
|
| | | |
| Transactions in Shares of the Fund | | |
| Sold | 5,430,035 |
| 5,755,035 |
|
| Issued in reinvestment of distributions | 1,981,828 |
| 1,748,810 |
|
| Redeemed | (5,014,400 | ) | (6,026,522 | ) |
| Net increase (decrease) in shares of the fund | 2,397,463 |
| 1,477,323 |
|
See Notes to Financial Statements.
|
|
| Notes to Financial Statements |
JUNE 30, 2014
1. Organization
American Century Quantitative Equity Funds, Inc. (the corporation) is registered under the Investment Company Act of 1940, as amended (the 1940 Act), as an open-end management investment company and is organized as a Maryland corporation. Utilities Fund (the fund) is one fund in a series issued by the corporation. The fund is diversified as defined under the 1940 Act. The fund’s investment objectives are to seek current income and long-term growth of capital and income. The fund invests at least 80% of its assets in equity securities of companies engaged in the utilities industry.
2. Significant Accounting Policies
The following is a summary of significant accounting policies consistently followed by the fund in preparation of its financial statements. The financial statements are prepared in conformity with accounting principles generally accepted in the United States of America, which may require management to make certain estimates and assumptions at the date of the financial statements. Actual results could differ from these estimates. Management evaluated the impact of events or transactions occurring through the date the financial statements were issued that would merit recognition or disclosure.
Investment Valuations — The fund determines the fair value of its investments and computes its net asset value per share at the close of regular trading (usually 4 p.m. Eastern time) on the New York Stock Exchange (NYSE) on each day the NYSE is open. The Board of Directors has adopted valuation policies and procedures to guide the investment advisor in the fund’s investment valuation process and to provide methodologies for the oversight of the fund’s pricing function.
Equity securities that are listed or traded on a domestic securities exchange are valued at the last reported sales price or at the official closing price as provided by the exchange. Equity securities traded on foreign securities exchanges are generally valued at the closing price of such securities on the exchange where primarily traded or at the close of the NYSE, if that is earlier. If no last sales price is reported, or if local convention or regulation so provides, the mean of the latest bid and asked prices may be used. Securities traded over-the-counter are valued at the mean of the latest bid and asked prices, the last sales price, or the official closing price. Equity securities initially expressed in local currencies are translated into U.S. dollars at the mean of the appropriate currency exchange rate at the close of the NYSE as provided by an independent pricing service.
Fixed income securities maturing within 60 days at the time of purchase may be valued at cost, plus or minus any amortized discount or premium or at the evaluated mean as provided by an independent pricing service. Evaluated mean prices are commonly derived through utilization of market models, which may consider, among other factors: trade data, quotations from dealers and active market makers, relevant yield curve and spread data, related sector levels, creditworthiness, trade data or market information on comparable securities, and other relevant security specific information.
Open-end management investment companies are valued at the reported net asset value per share. Repurchase agreements are valued at cost, which approximates fair value.
If the fund determines that the market price for an investment is not readily available or the valuation methods mentioned above do not reflect an investment’s fair value, such investment is valued as determined in good faith by the Board of Directors or its delegate, in accordance with policies and procedures adopted by the Board of Directors. In its determination of fair value, the fund may review several factors including, but not limited to, market information regarding the specific investment or comparable investments and correlation with other investment types, futures indices or general market indicators. Circumstances that may cause the fund to use these procedures to value an investment include, but are not limited to: an investment has been declared in default or is distressed; trading in a security has been suspended during the trading day or a security is not actively trading on its principal exchange; prices received from a regular pricing source are deemed unreliable; or there is a foreign market holiday and no trading occurred.
The fund monitors for significant events occurring after the close of an investment’s primary exchange but before the fund’s net asset value per share is determined. Significant events may include, but are not limited
to: corporate announcements and transactions; governmental action and political unrest that could impact a specific investment or an investment sector; or armed conflicts, natural disasters and similar events that could affect investments in a specific country or region. The fund also monitors for significant fluctuations between domestic and foreign markets, as evidenced by the U.S. market or such other indicators that the Board of Directors, or its delegate, deems appropriate. If significant fluctuations in foreign markets are identified, the fund may apply a model-derived factor to the closing price of equity securities traded on foreign securities exchanges. The factor is based on observable market data as provided by an independent pricing service.
Security Transactions — Security transactions are accounted for as of the trade date. Net realized gains and losses are determined on the identified cost basis, which is also used for federal income tax purposes.
Investment Income — Dividend income less foreign taxes withheld, if any, is recorded as of the ex-dividend date. Distributions received on securities that represent a return of capital or long-term capital gain are recorded as a reduction of cost of investments and/or as a realized gain. The fund may estimate the components of distributions received that may be considered nontaxable distributions or long-term capital gain distributions for income tax purposes. Interest income is recorded on the accrual basis and includes accretion of discounts and amortization of premiums.
Foreign Currency Translations — All assets and liabilities initially expressed in foreign currencies are translated into U.S. dollars at prevailing exchange rates at period end. The fund may enter into spot foreign currency exchange contracts to facilitate transactions denominated in a foreign currency. Purchases and sales of investment securities, dividend and interest income, spot foreign currency exchange contracts, and expenses are translated at the rates of exchange prevailing on the respective dates of such transactions. Net realized and unrealized foreign currency exchange gains or losses related to investment securities are a component of net realized gain (loss) on investment transactions and change in net unrealized appreciation (depreciation) on investments, respectively.
Repurchase Agreements — The fund may enter into repurchase agreements with institutions that American Century Investment Management, Inc. (ACIM) (the investment advisor) has determined are creditworthy pursuant to criteria adopted by the Board of Directors. The fund requires that the collateral, represented by securities, received in a repurchase transaction be transferred to the custodian in a manner sufficient to enable the fund to obtain those securities in the event of a default under the repurchase agreement. ACIM monitors, on a daily basis, the securities transferred to ensure the value, including accrued interest, of the securities under each repurchase agreement is equal to or greater than amounts owed to the fund under each repurchase agreement.
Joint Trading Account — Pursuant to an Exemptive Order issued by the Securities and Exchange Commission, the fund, along with certain other funds in the American Century Investments family of funds, may transfer uninvested cash balances into a joint trading account. These balances are invested in one or more repurchase agreements that are collateralized by U.S. Treasury or Agency obligations.
Income Tax Status — It is the fund’s policy to distribute substantially all net investment income and net realized gains to shareholders and to otherwise qualify as a regulated investment company under provisions of the Internal Revenue Code. Accordingly, no provision has been made for income taxes. The fund files U.S. federal, state, local and non-U.S. tax returns as applicable. The fund's tax returns are subject to examination by the relevant taxing authority until expiration of the applicable statute of limitations, which is generally three years from the date of filing but can be longer in certain jurisdictions. At this time, management believes there are no uncertain tax positions which, based on their technical merit, would not be sustained upon examination and for which it is reasonably possible that the total amounts of unrecognized tax benefits will significantly change in the next twelve months.
Distributions to Shareholders — Distributions from net investment income, if any, are generally declared and paid quarterly. Distributions from net realized gains, if any, are generally declared and paid annually.
Indemnifications — Under the corporation’s organizational documents, its officers and directors are indemnified against certain liabilities arising out of the performance of their duties to the fund. In addition, in the normal course of business, the fund enters into contracts that provide general indemnifications. The maximum exposure under these arrangements is unknown as this would involve future claims that may be made against a fund. The risk of material loss from such claims is considered by management to be remote.
3. Fees and Transactions with Related Parties
Certain officers and directors of the corporation are also officers and/or directors of American Century Companies, Inc. (ACC). The corporation’s investment advisor, ACIM, the corporation's distributor, American Century Investment Services, Inc., and the corporation’s transfer agent, American Century Services, LLC, are wholly owned, directly or indirectly, by ACC.
Management Fees — The corporation has entered into a management agreement with ACIM, under which ACIM provides the fund with investment advisory and management services in exchange for a single, unified management fee (the fee). The agreement provides that all expenses of managing and operating the fund, except distribution and service fees, brokerage expenses, taxes, interest, fees and expenses of the independent directors (including legal counsel fees), and extraordinary expenses, will be paid by ACIM. The fee is computed and accrued daily based on the daily net assets of the fund and paid monthly in arrears. The fee consists of (1) an Investment Category Fee based on the daily net assets of the fund and certain other accounts managed by the investment advisor that are in the same broad investment category as the fund and (2) a Complex Fee based on the assets of all the funds in the American Century Investments family of funds. The rates for the Investment Category Fee range from 0.3380% to 0.5200%. The rates for the Complex Fee range from 0.2500% to 0.3100%. The effective annual management fee for the year ended June 30, 2014 was 0.67%.
Directors' Fees and Expenses — The Board of Directors is responsible for overseeing the investment advisor’s management and operations of the fund. The directors receive detailed information about the fund and its investment advisor regularly throughout the year, and meet at least quarterly with management of the investment advisor to review reports about fund operations. Fees and expenses incurred in conjunction with the directors during the year ended June 30, 2014 are detailed in the Statement of Operations. The fund’s officers do not receive compensation from the fund.
4. Investment Transactions
Purchases and sales of investment securities, excluding short-term investments, for the year ended June 30, 2014 were $185,926,627 and $165,154,045, respectively.
5. Fair Value Measurements
The fund’s investments valuation process is based on several considerations and may use multiple inputs to determine the fair value of the investments held by the fund. In conformity with accounting principles generally accepted in the United States of America, the inputs used to determine a valuation are classified into three broad levels.
| |
| • | Level 1 valuation inputs consist of unadjusted quoted prices in an active market for identical investments. |
| |
| • | Level 2 valuation inputs consist of direct or indirect observable market data (including quoted prices for comparable investments, evaluations of subsequent market events, interest rates, prepayment speeds, credit risk, etc.). These inputs also consist of quoted prices for identical investments initially expressed in local currencies that are adjusted through translation into U.S. dollars. |
| |
| • | Level 3 valuation inputs consist of unobservable data (including a fund’s own assumptions). |
The level classification is based on the lowest level input that is significant to the fair valuation measurement. The valuation inputs are not necessarily an indication of the risks associated with investing in these securities or other financial instruments.
The following is a summary of the level classifications as of period end. The Schedule of Investments provides additional information on the fund’s portfolio holdings.
|
| | | | | | | | |
| | Level 1 | Level 2 | Level 3 |
| Assets | | | |
| Investment Securities | | | |
| Common Stocks | $ | 412,029,568 |
| — |
| — |
|
| Temporary Cash Investments | 1,182,980 |
| $ | 1,100,744 |
| — |
|
| | $ | 413,212,548 |
| $ | 1,100,744 |
| — |
|
6. Risk Factors
The fund concentrates its investments in a narrow segment of the total market. Because of this, the fund may be subject to greater risk and market fluctuations than a portfolio representing a broader range of industries.
7. Federal Tax Information
The tax character of distributions paid during the years ended June 30, 2014 and June 30, 2013 were as follows:
|
| | | | | | |
| | 2014 | 2013 |
| Distributions Paid From | | |
| Ordinary income | $ | 18,863,815 |
| $ | 12,275,738 |
|
| Long-term capital gains | $ | 14,809,028 |
| $ | 16,503,759 |
|
The book-basis character of distributions made during the year from net investment income or net realized gains may differ from their ultimate characterization for federal income tax purposes. These differences reflect the differing character of certain income items and net realized gains and losses for financial statement and tax purposes, and may result in reclassification among certain capital accounts on the financial statements.
As of June 30, 2014, the federal tax cost of investments and the components of distributable earnings on a tax-basis were as follows:
|
| | | |
| Federal tax cost of investments | $ | 332,958,427 |
|
| Gross tax appreciation of investments | $ | 84,742,913 |
|
| Gross tax depreciation of investments | (3,388,048 | ) |
| Net tax appreciation (depreciation) of investments | 81,354,865 |
|
Net tax appreciation (depreciation) on translation of assets and liabilities in foreign currencies | 25 |
|
| Net tax appreciation (depreciation) | $ | 81,354,890 |
|
| Undistributed ordinary income | $ | 2,272,761 |
|
| Accumulated long-term gains | $ | 10,730,253 |
|
| | |
The difference between book-basis and tax-basis unrealized appreciation (depreciation) is attributable primarily to the tax deferral of losses on wash sales.
|
| | | | | | | | | | | | | | | |
| For a Share Outstanding Throughout the Years Ended June 30 (except as noted) | | | |
| Per-Share Data | | | | | | | Ratios and Supplemental Data | |
| | | Income From Investment Operations: | Distributions From: | | | Ratio to Average Net Assets of: | | |
| | Net Asset Value, Beginning of Period | Net Investment Income (Loss)(1) | Net Realized and Unrealized Gain (Loss) | Total From Investment Operations | Net Investment Income | Net Realized Gains | Total Distributions | Net Asset Value, End of Period | Total Return(2) | Operating Expenses | Net Investment Income (Loss) | Portfolio Turnover Rate | Net Assets, End of Period (in thousands) |
| Investor Class | | | | | | | | | | |
| 2014 | $16.90 | 0.58 | 2.13 | 2.71 | (0.58) | (1.00) | (1.58) | $18.03 | 17.35% | 0.67% | 3.41% | 45% |
| $414,840 |
|
| 2013 | $16.54 | 0.63 | 1.20 | 1.83 | (0.60) | (0.87) | (1.47) | $16.90 | 12.06% | 0.68% | 3.79% | 41% |
| $348,272 |
|
| 2012 | $15.93 | 0.60 | 0.66 | 1.26 | (0.55) | (0.10) | (0.65) | $16.54 | 8.20% | 0.68% | 3.83% | 55% |
| $316,325 |
|
| 2011 | $12.62 | 0.51 | 3.30 | 3.81 | (0.50) | — | (0.50) | $15.93 | 30.50% | 0.69% | 3.47% | 17% |
| $284,177 |
|
| 2010 | $12.42 | 0.49 | 0.19 | 0.68 | (0.48) | — | (0.48) | $12.62 | 5.30% | 0.70% | 3.75% | 11% |
| $228,101 |
|
|
|
| Notes to Financial Highlights |
| |
| (1) | Computed using average shares outstanding throughout the period. |
| |
| (2) | Total returns are calculated based on the net asset value of the last business day. Total returns for periods less than one year are not annualized. |
See Notes to Financial Statements.
|
|
| Report of Independent Registered Public Accounting Firm |
To the Directors of the American Century Quantitative Equity Funds, Inc. and Shareholders of the Utilities Fund:
In our opinion, the accompanying statement of assets and liabilities, including the schedule of investments, and the related statements of operations, of changes in net assets and the financial highlights present fairly, in all material respects, the financial position of the Utilities Fund (one of the fifteen funds comprising the American Century Quantitative Equity Funds, Inc., hereafter referred to as the “Fund”) at June 30, 2014, the results of its operations for the year then ended, the changes in its net assets for each of the two years in the period then ended and the financial highlights for each of the five years in the period then ended, in conformity with accounting principles generally accepted in the United States of America. These financial statements and financial highlights (hereafter referred to as "financial statements") are the responsibility of the Fund's management. Our responsibility is to express an opinion on these financial statements based on our audits. We conducted our audits of these financial statements in accordance with the standards of the Public Company Accounting Oversight Board (United States). Those standards require that we plan and perform the audit to obtain reasonable assurance about whether the financial statements are free of material misstatement. An audit includes examining, on a test basis, evidence supporting the amounts and disclosures in the financial statements, assessing the accounting principles used and significant estimates made by management, and evaluating the overall financial statement presentation. We believe that our audits, which included confirmation of securities at June 30, 2014 by correspondence with the custodian and brokers, provide a reasonable basis for our opinion.
PricewaterhouseCoopers LLP
Kansas City, Missouri
August 21, 2014
Board of Directors
The individuals listed below serve as directors of the funds. Each director will continue to serve in this capacity until death, retirement, resignation or removal from office. The board has adopted a mandatory retirement age for directors who are not “interested persons,” as that term is defined in the Investment Company Act (independent directors). Independent directors shall retire on December 31 of the year in which they reach their 75th birthday; provided, however, that on or after January 1, 2022, independent directors shall retire on December 31 of the year in which they reach their 76th birthday.
Mr. Thomas is an “interested person” because he currently serves as President and Chief Executive Officer of American Century Companies, Inc. (ACC), the parent company of American Century Investment Management, Inc. (ACIM or the advisor). The other directors (more than three-fourths of the total number) are independent. They are not employees, directors or officers of, and have no financial interest in, ACC or any of its wholly owned, direct or indirect, subsidiaries, including ACIM, American Century Investment Services, Inc. (ACIS) and American Century Services, LLC (ACS), and do not have any other affiliations, positions or relationships that would cause them to be considered “interested persons” under the Investment Company Act. The directors serve in this capacity for eight (in the case of Mr. Thomas, 15) registered investment companies in the American Century Investments family of funds.
The following table presents additional information about the directors. The mailing address for each director other than Mr. Thomas is 1665 Charleston Road, Mountain View, California 94043. The mailing address for Mr. Thomas is 4500 Main Street, Kansas City, Missouri 64111.
|
| | | | | |
Name (Year of Birth) | Position(s) Held with Funds | Length of Time Served | Principal Occupation(s) During Past 5 Years | Number of
American
Century
Portfolios
Overseen
by Director | Other Directorships Held During Past 5 Years |
| Independent Directors |
Tanya S. Beder (1955) | Director | Since 2011 | Chairman, SBCC Group Inc. (independent advisory services) (2006 to present) | 42 | CYS Investments, Inc. (specialty finance company) |
Jeremy I. Bulow (1954) | Director | Since 2011 | Professor of Economics, Stanford University, Graduate School of Business (1979 to present) | 42 | None |
Ronald J. Gilson (1946) | Director and Chairman of the Board | Since 1995 (Chairman since 2005) | Charles J. Meyers Professor of Law and Business, Stanford Law School (1979 to present); Marc and Eva Stern Professor of Law and Business, Columbia University School of Law (1992 to present) | 42 | None |
|
| | | | | |
Name (Year of Birth) | Position(s) Held with Funds | Length of Time Served | Principal Occupation(s) During Past 5 Years | Number of
American
Century
Portfolios
Overseen
by Director | Other Directorships Held During Past 5 Years |
| Independent Directors |
Frederick L. A. Grauer (1946) | Director | Since 2008 | Senior Advisor, BlackRock, Inc. (investment management firm) (2010 to 2011); Senior Advisor, Barclays Global Investors (investment management firm) (2003 to 2009) | 42 | None |
Peter F. Pervere
(1947) | Director | Since 2007 | Retired | 42 | Intraware, Inc. (2003 to 2009) |
Myron S. Scholes(1) (1941) | Director | Since 1980 | Chairman, Platinum Grove Asset Management, L.P. (asset manager) (1999 to 2009); Frank E. Buck Professor of Finance-Emeritus, Stanford Graduate School of Business (1996 to present) | 42 | Dimensional Fund Advisors (investment advisor); CME Group, Inc. (futures and options exchange) |
John B. Shoven
(1947) | Director | Since 2002 | Professor of Economics, Stanford University (1973 to present) | 42 | Cadence Design Systems; Exponent; Financial Engines |
| Interested Director |
Jonathan S. Thomas
(1963) | Director and
President | Since 2007 | President and Chief Executive Officer, ACC (March 2007 to present). Also serves as Chief Executive Officer and Manager, ACS; Executive Vice President, ACIM; Director, ACC, ACIM and other ACC subsidiaries | 115 | None |
(1) Myron S. Scholes resigned as director effective July 31, 2014.
Officers
The following table presents certain information about the executive officers of the funds. Each officer serves as an officer for each of the 15 investment companies in the American Century family of funds, unless otherwise noted. No officer is compensated for his or her service as an officer of the funds. The listed officers are interested persons of the funds and are appointed or re-appointed on an annual basis. The mailing address for each of the officers listed below is 4500 Main Street, Kansas City, Missouri 64111.
|
| | |
Name (Year of Birth) | Offices with the Funds | Principal Occupation(s) During the Past Five Years |
Jonathan S. Thomas (1963) | Director and President since 2007 | President and Chief Executive Officer, ACC (March 2007 to present). Also serves as Chief Executive Officer and Manager, ACS; Executive Vice President, ACIM; Director, ACC, ACIM and other ACC subsidiaries |
| Amy D. Shelton (1964) | Chief Compliance Officer since 2014 | Chief Compliance Officer, American Century funds, (March 2014 to present); Chief Compliance Officer, ACIM (February 2014 to present); Chief Compliance Officer, ACIS (October 2009 to present); Vice President, Client Interactions and Marketing, ACIS (February 2013 to January 2014); Director, Client Interactions and Marketing, ACIS (June 2007 to January 2013). Also serves as Vice President, ACIS |
Charles A. Etherington (1957) | General Counsel since 2007 and Senior Vice President since 2006 | Attorney, ACC (February 1994 to present); Vice President, ACC (November 2005 to present); General Counsel, ACC (March 2007 to present). Also serves as General Counsel, ACIM, ACS, ACIS and other ACC subsidiaries; and Senior Vice President, ACIM and ACS |
C. Jean Wade (1964) | Vice President, Treasurer and Chief Financial Officer since 2012 | Vice President, ACS (February 2000 to present) |
Robert J. Leach (1966) | Vice President since 2006 and Assistant Treasurer since 2012 | Vice President, ACS (February 2000 to present) |
David H. Reinmiller (1963) | Vice President since 2001 | Attorney, ACC (January 1994 to present); Associate General Counsel, ACC (January 2001 to present). Also serves as Vice President, ACIM and ACS |
Ward D. Stauffer (1960) | Secretary since 2005 | Attorney, ACC (June 2003 to present) |
The Statement of Additional Information has additional information about the fund’s directors and is available without charge, upon request, by calling 1-800-345-2021.
|
|
| Approval of Management Agreement |
At a meeting held on June 13, 2014, the Fund’s Board of Directors/Trustees unanimously approved the renewal of the management agreement pursuant to which American Century Investment Management, Inc. (the “Advisor”) acts as the investment advisor for the Fund. Under Section 15(c) of the Investment Company Act, contracts for investment advisory services are required to be reviewed, evaluated, and approved by a majority of a fund’s directors/trustees (the “Directors”), including a majority of the independent Directors, each year. The Board regards this annual evaluation and renewal as one of its most important responsibilities.
The independent Directors have memorialized a statement regarding the relationship between their ongoing obligations to oversee and evaluate the performance of the Advisor and their annual consideration of renewal of the management agreement. In that statement, the independent Directors noted that their assessment of the Advisor’s performance is an ongoing process that takes place over the entire year and is informed by all of the extensive information that the Board and its committees receive and consider over time. This information, together with the materials provided in connection with the review, are central to the Board’s assessment of the Advisor’s performance and its determination whether to renew the Fund’s management agreement.
Prior to its consideration of the renewal of the management agreement, the Board requested and reviewed extensive data and analysis relating to the proposed renewal. This information and analysis was compiled by the Advisor and certain independent providers of evaluation data concerning the Fund and the services provided to the Fund by the Advisor.
In connection with its consideration of the renewal of the management agreement, the Board’s review and evaluation of the services provided by the Advisor included, but was not limited to, the following:
| |
| • | the nature, extent, and quality of investment management, shareholder services, and other services provided by the Advisor to the Fund; |
| |
| • | the wide range of other programs and services the Advisor provides to the Fund and its shareholders on a routine and non-routine basis; |
| |
| • | the investment performance of the Fund, including data comparing the Fund’s performance to appropriate benchmarks and/or a peer group of other mutual funds with similar investment objectives and strategies; |
| |
| • | the cost of owning the Fund compared to the cost of owning similar funds; |
| |
| • | the Advisor’s compliance policies, procedures, and regulatory experience; |
| |
| • | financial data showing the cost of services provided to the Fund, the profitability of the Fund to the Advisor, and the overall profitability of the Advisor; |
| |
| • | possible economies of scale associated with the Advisor’s management of the Fund and other accounts under its management; |
| |
| • | data comparing services provided and charges to other investment management clients of the Advisor; and |
| |
| • | any collateral benefits derived by the Advisor from the management of the Fund. |
In keeping with its practice, the Board held two in-person meetings to review and discuss the information provided. The independent Directors also had the benefit of the advice of their independent counsel throughout the process.
Factors Considered
The Directors considered all of the information provided by the Advisor, the independent data providers, and the independent Directors’ independent counsel in connection with the review, and evaluated such information for the Fund. In connection with their review, the Directors did not identify any single factor as being all-important or controlling and each Director may have attributed
different levels of importance to different factors. In deciding to renew the management agreement, the Board based its decision on a number of factors, including the following:
Nature, Extent and Quality of Services — Generally. Under the management agreement, the Advisor is responsible for providing or arranging for all services necessary for the operation of the Fund. The Board noted that under the management agreement, the Advisor provides or arranges at its own expense a wide variety of services including:
| |
| • | constructing and designing the Fund |
| |
| • | portfolio research and security selection |
| |
| • | initial capitalization/funding |
| |
| • | daily valuation of the Fund’s portfolio |
| |
| • | shareholder servicing and transfer agency, including shareholder confirmations, recordkeeping, and communications |
| |
| • | regulatory and portfolio compliance |
| |
| • | marketing and distribution |
The Board noted that many of these services have expanded over time both in terms of quantity and complexity in response to shareholder demands, competition in the industry, changing distribution channels, and the changing regulatory environment.
Investment Management Services. The nature of the investment management services provided to the Fund is quite complex and allows Fund shareholders access to professional money management, instant diversification of their investments within an asset class, the opportunity to easily diversify among asset classes by investing in or exchanging among various American Century Investments funds, and liquidity. In evaluating investment performance, the Board expects the Advisor to manage the Fund in accordance with its investment objectives and approved strategies. Further, the Directors recognize that the Advisor has an obligation to seek the best execution of fund trades. In providing these services, the Advisor utilizes teams of investment professionals (portfolio managers, analysts, research assistants, and securities traders) who require extensive information technology, research, training, compliance and other systems to conduct their business. The Board, directly and through its Portfolio Committee, regularly reviews investment performance information for the Fund, together with comparative information for appropriate benchmarks and/or peer groups of similarly-managed funds, over different time horizons. The Directors also review detailed performance information during the management agreement approval process. If performance concerns are identified, the Fund receives special reviews until performance improves, during which the Board discusses with the Advisor the reasons for such results (e.g., market conditions, security selection) and any efforts being undertaken to improve performance. The Fund’s performance was above its benchmark for the one-, five-, and ten-year periods and below its benchmark for the three-year period reviewed by the Board. The Board discussed the Fund’s performance with the Advisor and was satisfied with the efforts being undertaken by the Advisor. The Board found the investment management services provided by the Advisor to the Fund to be satisfactory and consistent with the management agreement.
Shareholder and Other Services. Under the management agreement, the Advisor provides the Fund with a comprehensive package of transfer agency, shareholder, and other services. The Board, directly and through various committees of the Board, regularly reviews reports and evaluations of such services at its regular meetings. These reports include, but are not limited to, information regarding the operational efficiency and accuracy of the shareholder and transfer agency services provided, staffing levels, shareholder satisfaction (as measured by external as well as internal sources), technology support, new products and services offered to Fund shareholders,
securities trading activities, portfolio valuation services, auditing services, and legal and operational compliance activities. Certain aspects of shareholder and transfer agency service level efficiency and the quality of securities trading activities are measured by independent third party providers and are presented in comparison to other fund groups not managed by the Advisor. The Board found the services provided by the Advisor to the Fund under the management agreement to be competitive and of high quality.
Costs of Services and Profitability. The Advisor provides detailed information concerning its cost of providing various services to the Fund, its profitability in managing the Fund, its overall profitability, and its financial condition. The Directors have reviewed with the Advisor the methodology used to prepare this financial information. The financial information regarding the Advisor is considered in evaluating the Advisor’s financial condition, its ability to continue to provide services under the management agreement, and the reasonableness of the current management fee. The Board concluded that the Advisor’s profits were reasonable in light of the services provided to the Fund.
Ethics. The Board generally considers the Advisor’s commitment to providing quality services to shareholders and to conducting its business ethically. They noted that the Advisor’s practices generally meet or exceed industry best practices.
Economies of Scale. The Board also reviewed information provided by the Advisor regarding the possible existence of economies of scale in connection with the management of the Fund. The Board concluded that economies of scale are difficult to measure and predict with precision, especially on a fund-by-fund basis. The Board concluded that the Advisor is appropriately sharing economies of scale through its competitive fee structure, offering competitive fees from fund inception, and through reinvestment in its business to provide shareholders additional content and services.
Comparison to Other Funds’ Fees. The management agreement provides that the Fund pays the Advisor a single, all-inclusive (or unified) management fee for providing all services necessary for the management and operation of the Fund, other than brokerage expenses, taxes, interest, extraordinary expenses, and the fees and expenses of the Fund’s independent directors (including their independent legal counsel) and expenses incurred in connection with the provision of shareholder services and distribution services under a plan adopted pursuant to Rule 12b-1 under the 1940 Act. Under the unified fee structure, the Advisor is responsible for providing all investment advisory, custody, audit, administrative, compliance, recordkeeping, marketing and shareholder services, or arranging and supervising third parties to provide such services. By contrast, most other funds are charged a variety of fees, including an investment advisory fee, a transfer agency fee, an administrative fee, distribution charges and other expenses. Other than their investment advisory fees and any applicable Rule 12b-1 distribution fees, all other components of the total fees charged by these other funds may be increased without shareholder approval. The Board believes the unified fee structure is a benefit to Fund shareholders because it clearly discloses to shareholders the cost of owning Fund shares, and, since the unified fee cannot be increased without a vote of Fund shareholders, it shifts to the Advisor the risk of increased costs of operating the Fund and provides a direct incentive to minimize administrative inefficiencies. Part of the Board’s analysis of fee levels involves reviewing certain evaluative data compiled by an independent provider and comparing the Fund’s unified fee to the total expense ratio of other funds in the Fund’s peer group. The unified fee charged to shareholders of the Fund was below the median of the total expense ratios of the Fund’s peer universe. The Board concluded that the management fee paid by the Fund to the Advisor under the management agreement is reasonable in light of the services provided to the Fund.
Comparison to Fees and Services Provided to Other Clients of the Advisor. The Board also requested and received information from the Advisor concerning the nature of the services, fees, costs and profitability of its advisory services to advisory clients other than the Fund. They observed that these varying types of client accounts require different services and involve different regulatory and entrepreneurial risks than the management of the Fund. The Board analyzed this
information and concluded that the fees charged and services provided to the Fund were reasonable by comparison.
Collateral or “Fall-Out” Benefits Derived by the Advisor. The Board considered the existence of collateral benefits the Advisor may receive as a result of its relationship with the Fund. They concluded that the Advisor’s primary business is managing mutual funds and it generally does not use fund or shareholder information to generate profits in other lines of business, and therefore does not derive any significant collateral benefits from them. The Board noted that the Advisor receives proprietary research from broker-dealers that execute fund portfolio transactions and concluded that this research is likely to benefit Fund shareholders. The Board also determined that the Advisor is able to provide investment management services to certain clients other than the Fund, at least in part, due to its existing infrastructure built to serve the fund complex. The Board concluded, however, that the assets of those other clients are not material to the analysis and, where applicable, may be included with the assets of the Fund to determine breakpoints in the management fee schedule.
Existing Relationship. The Board also considered whether there was any reason for not continuing the existing arrangement with the Advisor. In this regard, the Board was mindful of the potential disruptions of the Fund’s operations and various risks, uncertainties, and other effects that could occur as a result of a decision not to continue such relationship. In particular, the Board recognized that most shareholders have invested in the Fund on the strength of the Advisor’s industry standing and reputation and in the expectation that the Advisor will have a continuing role in providing advisory services to the Fund.
Conclusion of the Directors. As a result of this process, the Board, including all of the independent Directors and assisted by the advice of independent legal counsel, taking into account all of the factors discussed above and the information provided by the Advisor and others, concluded that the management agreement between the Fund and the Advisor is fair and reasonable in light of the services provided and should be renewed.
Retirement Account Information
As required by law, distributions you receive from certain IRAs are subject to federal income tax withholding, unless you elect not to have withholding apply. Tax will be withheld on the total amount withdrawn even though you may be receiving amounts that are not subject to withholding, such as nondeductible contributions. In such case, excess amounts of withholding could occur. You may adjust your withholding election so that a greater or lesser amount will be withheld.
If you don’t want us to withhold on this amount, you must notify us to not withhold the federal income tax. You may notify us in writing or in certain situations by telephone or through other electronic means. For systematic withdrawals, your withholding election will remain in effect until revoked or changed by filing a new election. You have the right to revoke your election at any time.
Remember, even if you elect not to have income tax withheld, you are liable for paying income tax on the taxable portion of your withdrawal. If you elect not to have income tax withheld or you don’t have enough income tax withheld, you may be responsible for payment of estimated tax. You may incur penalties under the estimated tax rules if your withholding and estimated tax payments are not sufficient. You can reduce or defer the income tax on a distribution by directly or indirectly rolling such distribution over to another IRA or eligible plan. You should consult your tax advisor for additional information.
State tax will be withheld if, at the time of your distribution, your address is within one of the mandatory withholding states and you have federal income tax withheld (or as otherwise required by state law). State taxes will be withheld from your distribution in accordance with the respective state rules.
Distributions you receive from 403(b), 457 and qualified plans are subject to special tax and withholding rules. Your plan administrator or plan sponsor is required to provide you with a special tax notice explaining those rules at the time you request a distribution. If applicable, federal and/or state taxes may be withheld from your distribution amount.
Proxy Voting Policies
Descriptions of the principles and policies that the fund's investment advisor uses in exercising the voting rights associated with the securities purchased and/or held by the fund are available without charge, upon request, by calling 1-800-345-2021 or visiting the "About Us" page of American Century Investments’ website at americancentury.com. A description of the policies is also available on the Securities and Exchange Commission’s website at sec.gov. Information regarding how the investment advisor voted proxies relating to portfolio securities during the most recent 12-month period ended June 30 is available on the "About Us" page at americancentury.com. It is also available at sec.gov.
Quarterly Portfolio Disclosure
The fund files its complete schedule of portfolio holdings with the Securities and Exchange Commission (SEC) for the first and third quarters of each fiscal year on Form N-Q. The fund’s Forms N-Q are available on the SEC’s website at sec.gov, and may be reviewed and copied at the SEC’s Public Reference Room in Washington, DC. Information on the operation of the Public Reference Room may be obtained by calling 1-800-SEC-0330. The fund also makes its complete schedule of portfolio holdings for the most recent quarter of its fiscal year available on its website at americancentury.com and, upon request, by calling 1-800-345-2021.
Other Tax Information
The following information is provided pursuant to provisions of the Internal Revenue Code.
The fund hereby designates up to the maximum amount allowable as qualified dividend income for the fiscal year ended June 30, 2014.
For corporate taxpayers, the fund hereby designates $16,117,015, or up to the maximum amount allowable, of ordinary income distributions paid during the fiscal year ended June 30, 2014 as qualified for the corporate dividends received deduction.
The fund hereby designates $6,168,324 as qualified short-term capital gain distributions for purposes of Internal Revenue Code Section 871.
The fund hereby designates $14,809,028, or up to the maximum amount allowable, as long-term capital gain distributions for the fiscal year ended June 30, 2014.
|
| | |
| |
| | | |
| Contact Us | americancentury.com | |
| Automated Information Line | 1-800-345-8765 | |
| Investor Services Representative | 1-800-345-2021
or 816-531-5575 | |
| Investors Using Advisors | 1-800-378-9878 | |
Business, Not-For-Profit, Employer-Sponsored
Retirement Plans | 1-800-345-3533 | |
Banks and Trust Companies, Broker-Dealers,
Financial Professionals, Insurance Companies | 1-800-345-6488 | |
| Telecommunications Relay Service for the Deaf | 711 | |
| | | |
| American Century Quantitative Equity Funds, Inc. | |
| | | |
Investment Advisor: American Century Investment Management, Inc. Kansas City, Missouri | |
| | | |
| This report and the statements it contains are submitted for the general information of our shareholders. The report is not authorized for distribution to prospective investors unless preceded or accompanied by an effective prospectus. | |
| | | |
©2014 American Century Proprietary Holdings, Inc. All rights reserved.
CL-ANN-82882 1408 | |
ITEM 2. CODE OF ETHICS.
| |
| (a) | The registrant has adopted a Code of Ethics for Senior Financial Officers that applies to the registrant’s principal executive officer, principal financial officer, principal accounting officer, and persons performing similar functions. |
| |
| (f) | The registrant’s Code of Ethics for Senior Financial Officers was filed as Exhibit 12 (a)(1) to American Century Asset Allocation Portfolios, Inc.’s Annual Certified Shareholder Report on Form N-CSR, File No. 811-21591, on September 29, 2005, and is incorporated herein by reference. |
ITEM 3. AUDIT COMMITTEE FINANCIAL EXPERT.
| |
| (a)(1) | The registrant's board has determined that the registrant has at least one audit committee financial expert serving on its audit committee. |
| |
| (a)(2) | Tanya S. Beder, Peter F. Pervere and Ronald J. Gilson are the registrant's designated audit committee financial experts. They are "independent" as defined in Item 3 of Form N-CSR. |
ITEM 4. PRINCIPAL ACCOUNTANT FEES AND SERVICES.
The aggregate fees billed for each of the last two fiscal years for professional services rendered by the principal accountant for the audit of the registrant’s annual financial statements or services that are normally provided by the accountant in connection with statutory and regulatory filings or engagements for those fiscal years were as follows:
FY 2013: $454,859
FY 2014: $409,403
The aggregate fees billed in each of the last two fiscal years for assurance and related services by the principal accountant that are reasonably related to the performance of the audit of the registrant’s financial statements and are not reported under paragraph (a) of this Item were as follows:
For services rendered to the registrant:
FY 2013:$0
FY 2014:$0
Fees required to be approved pursuant to paragraph (c)(7)(ii) of Rule 2-01 of Regulation S-X (relating to certain engagements for non-audit services with the registrant’s investment adviser and its affiliates):
FY 2013:$0
FY 2014:$0
The aggregate fees billed in each of the last two fiscal years for professional services rendered by the principal accountant for tax compliance, tax advice, and tax planning were as follows:
For services rendered to the registrant:
FY 2013: $0
FY 2014: $0
Fees required to be approved pursuant to paragraph (c)(7)(ii) of Rule 2-01 of Regulation S-X (relating to certain engagements for non-audit services with the registrant’s investment adviser and its affiliates):
FY 2013: $0
FY 2014: $0
The aggregate fees billed in each of the last two fiscal years for products and services provided by the principal accountant, other than the services reported in paragraphs (a) through (c) of this Item were as follows:
For services rendered to the registrant:
FY 2013: $0
FY 2014: $0
Fees required to be approved pursuant to paragraph (c)(7)(ii) of Rule 2-01 of Regulation S-X (relating to certain engagements for non-audit services with the registrant’s investment adviser and its affiliates):
FY 2013: $0
FY 2014: $0
| |
| (e)(1) | In accordance with paragraph (c)(7)(i)(A) of Rule 2-01 of Regulation S-X, before the accountant is engaged by the registrant to render audit or non-audit services, the engagement is approved by the registrant’s audit committee. Pursuant to paragraph (c)(7)(ii) of Rule 2-01 of Regulation S-X, the registrant’s audit committee also pre-approves its accountant’s engagements for non-audit services with the registrant’s investment adviser, its parent company, and any entity controlled by, or under common control with the investment adviser that provides ongoing services to the registrant, if the engagement relates directly to the operations and financial reporting of the registrant. |
| |
| (e)(2) | All services described in each of paragraphs (b) through (d) of this Item were pre-approved before the engagement by the registrant’s audit committee pursuant to paragraph (c)(7)(i)(A) of Rule 2-01 of Regulation S-X. Consequently, none of such services were required to be approved by the audit committee pursuant to paragraph (c)(7)(i)(C). |
| |
| (f) | The percentage of hours expended on the principal accountant’s engagement to audit the registrant’s financial statements for the most recent fiscal year that were attributed to work performed by persons other than the principal accountant’s full-time, permanent employees was less than 50%. |
| |
| (g) | The aggregate non-audit fees billed by the registrant’s accountant for services rendered to the registrant, and rendered to the registrant’s investment adviser (not including any sub-adviser whose role is primarily portfolio management and is subcontracted with or overseen by another investment adviser), and any entity controlling, controlled by, or under common control with the adviser that provides ongoing services to the registrant for each of the last two fiscal years of the registrant were as follows: |
FY 2013: $151,650
FY 2014: $ 71,500
| |
| (h) | The registrant’s investment adviser and accountant have notified the registrant’s audit committee of all non-audit services that were rendered by the registrant’s accountant to the registrant’s investment adviser, its parent company, and any entity controlled by, or under common control with the investment adviser that provides services to the registrant, which services were not required to be pre-approved pursuant to paragraph (c)(7)(ii) of Rule 2-01 of Regulation S-X. The notification provided to the registrant’s audit committee included sufficient details regarding such services to allow the registrant’s audit committee to consider the continuing independence of its principal accountant. |
ITEM 5. AUDIT COMMITTEE OF LISTED REGISTRANTS.
Not applicable.
ITEM 6. INVESTMENTS.
| |
| (a) | The schedule of investments is included as part of the report to stockholders filed under Item 1 of this Form. |
ITEM 7. DISCLOSURE OF PROXY VOTING POLICIES AND PROCEDURES FOR CLOSED-END MANAGEMENT INVESTMENT COMPANIES.
Not applicable.
ITEM 8. PORTFOLIO MANAGERS OF CLOSED-END MANAGEMENT INVESTMENT COMPANIES.
Not applicable.
ITEM 9. PURCHASES OF EQUITY SECURITIES BY CLOSED-END MANAGEMENT INVESTMENT COMPANY AND AFFILIATED PURCHASERS.
Not applicable.
ITEM 10. SUBMISSION OF MATTERS TO A VOTE OF SECURITY HOLDERS.
During the reporting period, there were no material changes to the procedures by which shareholders may recommend nominees to the registrant’s board.
ITEM 11. CONTROLS AND PROCEDURES.
| |
| (a) | The registrant's principal executive officer and principal financial officer have concluded that the registrant's disclosure controls and procedures (as defined in Rule 30a-3(c) under the Investment Company Act of 1940) are effective based on their evaluation of these controls and procedures as of a date within 90 days of the filing date of this report. |
| |
| (b) | There were no changes in the registrant's internal control over financial reporting (as defined in Rule 30a-3(d) under the Investment Company Act of 1940) that occurred during the registrant's second fiscal quarter of the period covered by this report that have materially affected, or are reasonably likely to materially affect, the registrant's internal control over financial reporting. |
ITEM 12. EXHIBITS.
| |
| (a)(1) | Registrant’s Code of Ethics for Senior Financial Officers, which is the subject of the disclosure required by Item 2 of Form N-CSR, was filed as Exhibit 12(a)(1) to American Century Asset Allocation Portfolios, Inc.’s Certified Shareholder Report on Form N-CSR, File No. 811-21591, on September 29, 2005. |
| |
| (a)(2) | Separate certifications by the registrant’s principal executive officer and principal financial officer, pursuant to Section 302 of the Sarbanes-Oxley Act of 2002 and Rule 30a-2(a) under the Investment Company Act of 1940, are filed and attached hereto as EX-99.CERT. |
| |
| (b) | A certification by the registrant’s chief executive officer and chief financial officer, pursuant to Section 906 of the Sarbanes-Oxley Act of 2002, is furnished and attached hereto as EX-99.906CERT. |
SIGNATURES
Pursuant to the requirements of the Securities Exchange Act of 1934 and the Investment Company Act of 1940, the registrant has duly caused this report to be signed on its behalf by the undersigned, thereunto duly authorized.
|
| | | |
| Registrant: | American Century Quantitative Equity Funds, Inc. |
| | | |
| By: | /s/ Jonathan S. Thomas |
| | Name: | Jonathan S. Thomas |
| | Title: | President |
| | | |
| Date: | August 29, 2014 |
Pursuant to the requirements of the Securities Exchange Act of 1934 and the Investment Company Act of 1940, this report has been signed below by the following persons on behalf of the registrant and in the capacities and on the dates indicated.
|
| | |
| By: | /s/ Jonathan S. Thomas |
| | Name: | Jonathan S. Thomas |
| | Title: | President |
| | | (principal executive officer) |
| | | |
| Date: | August 29, 2014 |
|
| | |
| By: | /s/ C. Jean Wade |
| | Name: | C. Jean Wade |
| | Title: | Vice President, Treasurer, and |
| | | Chief Financial Officer |
| | | (principal financial officer) |
| | | |
| Date: | August 29, 2014 |