Select Comfort
Second Quarter 2008 Investor Call
July 23, 2008
Statements in this presentation that relate to future plans, events, financial results or performance are forward-looking statements that are subject to certain risks and uncertainties including, among others, such factors as general and industry economic trends; uncertainties arising from global events; consumer confidence; effectiveness of our advertising and promotional efforts; our ability to fund our operations through cash flow from operations or availability under our bank line of credit or other sources, and the cost of credit or other capital resources necessary to finance operations; the risk of non-compliance with financial covenants under our bank line of credit, and the potential need to obtain additional capital through the issuance of debt or equity securities; our ability to attract and retain qualified sales professionals and other key employees; consumer acceptance of our products, product quality, innovation and brand image; our ability to continue to expand and improve our product line; industry competition; warranty expenses; risks of pending litigation; our dependence on significant suppliers, and the vulnerability of any suppliers to commodity shortages, inflationary pressures, labor negotiations, liquidity concerns or other factors; rising commodity costs; the capability of our information systems to meet our business requirements and our ability to upgrade our systems on a cost-effective basis without disruptions to our business; and increasing government regulations, including new flammability standards for the bedding industry which have added product cost pressures and have required implementation of systems and manufacturing process changes to ensure compliance. Additional information concerning these and other risks and uncertainties is contained in our filings with the Securities and Exchange Commission, including our Annual Report on Form 10-K, and other periodic reports filed with the SEC. The company has no obligation to publicly update or revise any of the forward-looking statements in this presentation.
Forward Looking Statements
FY08 Second Quarter Results Summary
Q2
Q2
2008
2007
Change
Net Sales
152.1
$
179.0
$
(26.9)
$
Gross Profit
90.6
$
109.5
$
(18.9)
$
% of Net Sales
59.6%
61.2%
Operating (loss) income
(10.3)
$
4.8
$
(15.1)
$
Net (loss) income per share
(0.15)
$
0.06
$
(0.21)
$
Diluted Shares (millions)
44.1
49.9
(5.8)
($ in millions, except EPS)
Cost Reduction and Margin Improvement
Reduce workforce: corporate, sales & operations
Lower promotions, price increase
Cash, Inventory and Payables
Defer programs: International, SAP & Stores
Stabilize / Restore Sales
Restore media investment
Introduce new product (6000 model)
Launch media campaign
Realizing the Benefits of Q1 Initiatives
2008 Impact
$30M
$8M-$15M
Flexible Spend at 2007 levels
Improving Mix
March Launch
Actions to Support Second Half
Impact
Cost and Profit Enhancement Initiatives:
• Productivity / Discretionary Spend Reductions
$3.0 M
• Pricing
$3.0 M
• 10 additional store closures
Revenue Support:
• Media and Marketing
• Adjust creative ad mix
• Flex with performance
• New Bed Model
• Premium price point
• Launch in late Q3
• Accessories
• New program launching in August
• Focused on holiday traffic
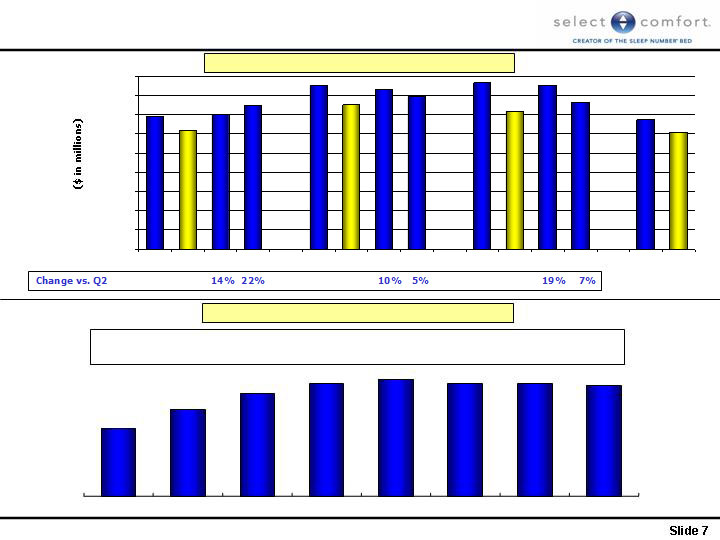
Improved Performance on Lower Seasonal Sales
Second quarter results reflect the impact of management actions
taken at the end of the first quarter
Q2
Q1
2008
2008
Improvement
Net Sales
$
152.1
$
168.2
Net Sales Change vs. Prior Year
(15%)
(22%)
+ 7 ppt
Gross Profit Rate
59.6%
57.6%
+ 200 bp
Operating (loss) income
(10.3)
$
(11.0)
$
0.7
$
Net (loss) income per share
(0.15)
$
(0.16)
$
0.01
$
($ in millions, except EPS)
Second-Half Outlook and Store Summary
Stores with New Fitch Design by Quarter
2 8 9 14 24 40 52 53
Store Count by Quarter
Net Sales Seasonality
Q2-08
Q1-08
Q4-07
Q3-07
Q2-07
Q1-07
Q4-06
Q3-06
Q2-06
Q1-06
Q4-05
Q3-05
Q2-05
Q1-05
$225
$200
$175
$150
$125
$100
$75
$50
$25
$0
471
477
478
478
481
478
447
460
Q1-07
Q2-07
Q3-07
Q4-07
Q1-08
Q2-08
Q3-08(E)
Q4-08(E)
Targeting Return to Profitability in Back Half
Quarterly Operating Profit Benefit of $10M+
+10-15% v Q2
Impact
+2M-$3M per Qtr
Profitability will result from aggressive cost actions and
expected return to historically higher seasonal volume
Average second half seasonal sales improvement
Profit flow through of incremental sales
Additional potential sales benefits
Pricing / promotion
Accessories programs
Profit Improvement Opportunities
Full benefit of Q1 actions
Additional cost savings identified
Store closures and discretionary spending reductions
Macro-economic environment remains uncertain
Long-term opportunity unchanged
Need for sleep increasing
Unique product – appreciated by customers
Team with passion for product and customers
Realizing improved performance due to Q1 actions
Positioned for profitability in the second half
Summary