| | | UNITED STATES |
| | | SECURITIES AND EXCHANGE COMMISSION |
| | | Washington, D.C. 20549 |
| |
| |
| | | FORM N-CSR/A |
| |
| CERTIFIED SHAREHOLDER REPORT OF REGISTERED MANAGEMENT |
| | | INVESTMENT COMPANIES |
| |
| Investment Company Act file number 811-5454 |
| |
| DREYFUS PREMIER NEW JERSEY MUNICIPAL BOND FUND, INC. |
| | | (Exact name of Registrant as specified in charter) |
| |
| |
| | | c/o The Dreyfus Corporation |
| | | 200 Park Avenue |
| | | New York, New York 10166 |
| | | (Address of principal executive offices) (Zip code) |
| |
| | | Mark N. Jacobs, Esq. |
| | | 200 Park Avenue |
| | | New York, New York 10166 |
| | | (Name and address of agent for service) |
| |
| Registrant's telephone number, including area code: (212) 922-6000 |
| |
| Date of fiscal year end: | | 12/31 |
| |
| Date of reporting period: | | 12/31/05 |
| | | | | FORM N-CSR |
| Item 1. | | Reports to Stockholders. | | |

Save time. Save paper. View your next shareholder report online as soon as it’s available. Log into www.dreyfus.com and sign up for Dreyfus eCommunications. It’s simple and only takes a few minutes.
The views expressed in this report reflect those of the portfolio manager only through the end of the period covered and do not necessarily represent the views of Dreyfus or any other person in the Dreyfus organization. Any such views are subject to change at any time based upon market or other conditions and Dreyfus disclaims any responsibility to update such views.These views may not be relied on as investment advice and, because investment decisions for a Dreyfus fund are based on numerous factors, may not be relied on as an indication of trading intent on behalf of any Dreyfus fund.
Not FDIC-Insured • Not Bank-Guaranteed • May Lose Value
| | | Contents |
| |
| | | T H E F U N D |
| |
|
| 2 | | Letter from the Chairman |
| 3 | | Discussion of Fund Performance |
| 6 | | Fund Performance |
| 8 | | Understanding Your Fund’s Expenses |
| 8 | | Comparing Your Fund’s Expenses |
| | | With Those of Other Funds |
| 9 | | Statement of Investments |
| 18 | | Statement of Assets and Liabilities |
| 19 | | Statement of Operations |
| 20 | | Statement of Changes in Net Assets |
| 22 | | Financial Highlights |
| 25 | | Notes to Financial Statements |
| 33 | | Report of Independent Registered |
| | | Public Accounting Firm |
| 35 | | Important Tax Information |
| 36 | | Board Members Information |
| 38 | | Officers of the Fund |
| | | F O R M O R E I N F O R M AT I O N |
| |
|
| | | Back Cover |
| Dreyfus Premier |
| New Jersey Municipal |
| Bond Fund, Inc. |
The Fund

L E T T E R F R O M T H E C H A I R M A N
We are pleased to present this annual report for Dreyfus Premier New Jersey Municipal Bond Fund, Inc., covering the 12-month period from January 1, 2005, through December 31, 2005. Inside, you’ll find valuable information about how the fund was managed during the reporting period, including a discussion with the fund’s portfolio manager,W. Michael Petty.
Municipal bonds generally shrugged off bad news and focused on more positive factors in 2005, helping the market post its sixth consecutive calendar year of positive returns.Although short-term interest rates rose by 200 basis points due to eight consecutive increases by the Federal Reserve Board during 2005, the yield of 30-year AAA-rated general obligation bonds ended the year 22 basis points lower than where it began.Analysts generally attribute the municipal bond market’s strength to low inflation and robust investor demand for tax-exempt income.
Looking forward, we expect the U.S. economy to continue its moderate expansion in 2006, while inflation should stay low and investor demand for income-producing securities should remain high. Risks in the new year include uncertainty regarding Fed policy under a new chairman and relatively rich valuations among municipal bonds compared to U.S.Treasury securities.
As always, we encourage you to speak with your financial consultant about how these and other market forces may affect your investments. Thank you for your continued confidence and support.

How did Dreyfus Premier New Jersey Municipal Bond Fund, Inc. perform relative to its benchmark?
For the 12-month period ended December 31, 2005, the fund achieved total returns of 3.22% for Class A shares, 2.63% for Class B shares and 2.45% for Class C shares.1 In comparison, the Lehman Brothers Municipal Bond Index (the “Index”), the fund’s benchmark, achieved a total return of 3.51% for the reporting period.2 In addition, the fund is reported in the Lipper New Jersey Municipal Debt Funds category. Over the reporting period, the average total return for all funds reported in the Lipper category was 3.25% .3
Longer-term municipal bonds generally withstood the eroding effects of rising short-term interest rates during 2005, as prices were supported by low inflation expectations and robust investor demand. In this environment, income from the fund’s seasoned core holdings helped it produce returns that were generally in line with its peer group average. However, the fund lagged the Index, primarily because the benchmark contains bonds from many states, not just New Jersey, and does not reflect fund fees and expenses.
What is the fund’s investment approach?
The fund seeks as high a level of current income exempt from federal and New Jersey income taxes as is consistent with the preservation of capital.
To pursue this goal, the fund normally invests at least 80% of its assets in municipal bonds that provide income exempt from federal and New Jersey personal income taxes.The fund invests at least 80% of its assets in investment-grade municipal bonds or the unrated equivalent as determined by Dreyfus.The fund may invest up to 20% of its assets in municipal bonds rated below investment grade (“high-yield” or “junk” bonds) or the unrated equivalent as determined by Dreyfus.The dollar-weighted average maturity of the fund’s portfolio normally exceeds 10 years.
D I S C U S S I O N O F F U N D P E R F O R M A N C E (continued)
We may buy and sell bonds based on credit quality, market outlook and yield potential. In selecting municipal bonds for investment, we may assess the current interest-rate environment and the municipal bond’s potential volatility in different rate environments.We focus on bonds with the potential to offer attractive current income, typically looking for bonds that can provide consistently attractive current yields or that are trading at competitive market prices.A portion of the fund’s assets may be allocated to “discount” bonds, which are bonds that sell at a price below their face value, or to “premium” bonds, which are bonds that sell at a price above their face value.The fund’s allocation to either discount bonds or to premium bonds will change along with our changing views of the current interest-rate and market environment.We also may look to select bonds that are most likely to obtain attractive prices when sold.
What other factors influenced the fund’s performance?
Rising short-term interest rates represented a significant factor affecting the fund’s performance during 2005. The Federal Reserve Board (the “Fed”) raised the overnight federal funds rate eight consecutive times, driving it from 2.25% at the start of the year to 4.25% by the end.
Yields of shorter-term municipal bonds rose along with interest rates, eroding their value. Contrary to historical norms, however, long-term municipal bond yields fell slightly amid low inflation expectations and robust investor demand. As a result, the yield curve flattened, producing better performance at the long end of the maturity spectrum.
In addition, bonds from New Jersey issuers benefited when reduced spending growth and higher tax revenues helped state lawmakers enact a budget for the 2006 fiscal year that could help address New Jersey’s structural imbalance.Although challenges remain, a major bond rating agency upgraded its credit rating for New Jersey’s uninsured general obligation bonds in 2005.
In this environment, we maintained the fund’s longstanding core holdings, which provided higher yields than were available from newly issued securities. However, it has been some time since these holdings
were purchased, and many now feature maturities of 10 to 15 years. Despite their income advantages, total returns from bonds in this maturity range generally lagged those of longer-term bonds.
The fund’s performance also was hindered by its relatively light exposure at the beginning of the reporting period to securities backed by New Jersey’s settlement with U.S. tobacco companies, which rallied in 2005 as litigation-related concerns waned.We gradually added to the fund’s holdings of higher-yielding bonds, including tobacco bonds and securities from some of the state’s private universities.This strategy was designed to help augment the tax-free income component of the fund’s results.
| | What is the fund’s current strategy?
|
Many analysts interpreted the minutes of the Fed’s December meeting as evidence that the end of the credit tightening cycle may be approaching. Meanwhile, the U.S. economy has been sending mixed signals, including signs of weaker consumer spending. Until the outlook becomes clearer, we have maintained a generally neutral investment posture. Of course, we are prepared to adjust our strategies as market conditions change.
| 1 | | Total return includes reinvestment of dividends and any capital gains paid and does not take into |
| | | consideration the maximum initial sales charge in the case of Class A shares or the applicable |
| | | contingent deferred sales charges imposed on redemptions in the case of Class B and Class C |
| | | shares. Had these charges been reflected, returns would have been lower. Past performance is no |
| | | guarantee of future results. Share price, yield and investment return fluctuate such that upon |
| | | redemption, fund shares may be worth more or less than their original cost. Income may be subject |
| | | to state and local taxes for non-New Jersey residents, and some income may be subject to the |
| | | federal alternative minimum tax (AMT) for certain investors. Capital gains, if any, are fully |
| | | taxable. Return figures provided reflect the absorption of certain fund expenses by The Dreyfus |
| | | Corporation pursuant to an agreement in which shareholders are given at least 90 days’ notice, at |
| | | which time it may be extended, terminated or modified. Had these expenses not been absorbed, |
| | | the fund’s returns would have been lower. |
| 2 | | SOURCE: LIPPER INC. — Reflects reinvestment of dividends and, where applicable, capital |
| | | gain distributions.The Lehman Brothers Municipal Bond Index is a widely accepted, unmanaged |
| | | total return performance benchmark for the long-term, investment-grade, tax-exempt bond market. |
| | | Index returns do not reflect fees and expenses associated with operating a mutual fund. |
| 3 | | Source: Lipper Inc. |
| |
| |
| | | T h e F u n d 5 |
| | F U N D P E R F O R M A N C E
|
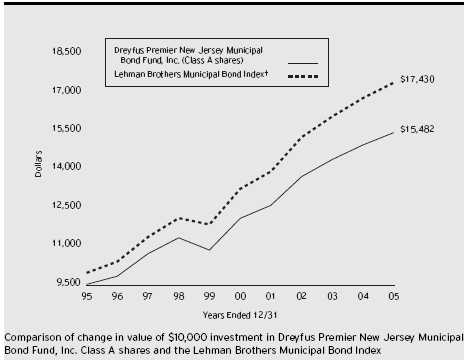
| † Source: Lipper Inc. |
| Past performance is not predictive of future performance. |
| The above graph compares a $10,000 investment made in Class A shares of Dreyfus Premier New Jersey Municipal |
| Bond Fund, Inc. on 12/31/95 to a $10,000 investment made in the Lehman Brothers Municipal Bond Index (the |
| “Index”) on that date. All dividends and capital gain distributions are reinvested. Performance for Class B and Class C |
| shares will vary from the performance of Class A shares shown above due to differences in charges and expenses. |
| The fund invests primarily in New Jersey municipal securities and its performance shown in the line graph takes into |
| account the maximum initial sales charge on Class A shares and all applicable fees and expenses.The Index is not |
| limited to investments in New Jersey municipal obligations and does not take into account charges, fees and other |
| expenses.The Index is an unmanaged total return performance benchmark for the long-term, investment-grade, |
| geographically unrestricted tax-exempt bond market, calculated by using municipal bonds selected to be representative of |
| the municipal market overall.These factors can contribute to the Index potentially outperforming or underperforming the |
| fund. Further information relating to fund performance, including expense reimbursements, if applicable, is contained in |
| the Financial Highlights section of the prospectus and elsewhere in this report. |
| Average Annual Total Returns | | as of 12/31/05 | | | | | | |
| |
| | | Inception | | | | | | | | From |
| | | Date | | 1 Year | | 5 Years | | 10 Years | | Inception |
| |
| |
| |
| |
| |
|
| Class A shares | | | | | | | | | | |
| with maximum sales charge (4.5%) | | | | (1.39)% | | 4.03% | | 4.47% | | |
| without sales charge | | | | 3.22% | | 5.00% | | 4.95% | | |
| Class B shares | | | | | | | | | | |
| with applicable redemption charge † | | 1/7/03 | | (1.33)% | | — | | — | | 2.80% |
| without redemption | | 1/7/03 | | 2.63% | | — | | — | | 3.74% |
| Class C shares | | | | | | | | | | |
| with applicable redemption charge †† | | 1/7/03 | | 1.46% | | — | | — | | 3.51% |
| without redemption | | 1/7/03 | | 2.45% | | — | | — | | 3.51% |
Past performance is not predictive of future performance.The fund’s performance shown in the graph and table does not reflect the deduction of taxes that a shareholder would pay on fund distributions or the redemption of fund shares.
| † | | The maximum contingent deferred sales charge for Class B shares is 4%. After six years Class B shares convert to |
| | | Class A shares. |
| †† | | The maximum contingent deferred sales charge for Class C shares is 1% for shares redeemed within one year of the |
| | | date of purchase. |
U N D E R S TA N D I N G YO U R F U N D ’ S E X P E N S E S ( U n a u d i t e d )
As a mutual fund investor, you pay ongoing expenses, such as management fees and other expenses. Using the information below, you can estimate how these expenses affect your investment and compare them with the expenses of other funds.You also may pay one-time transaction expenses, including sales charges (loads) and redemption fees, which are not shown in this section and would have resulted in higher total expenses. For more information, see your fund’s prospectus or talk to your financial adviser.
| | Review your fund’s expenses
|
The table below shows the expenses you would have paid on a $1,000 investment in Dreyfus Premier New Jersey Municipal Bond Fund, Inc. from July 1, 2005 to December 31, 2005. It also shows how much a $1,000 investment would be worth at the close of the period, assuming actual returns and expenses.
| Expenses and Value of a $1,000 Investment | | | | |
| assuming actual returns for the six months ended December 31, 2005 | | |
| | | Class A | | Class B | | Class C |
| |
| |
| |
|
| Expenses paid per $1,000 † | | $ 5.10 | | $ 7.61 | | $ 8.87 |
| Ending value (after expenses) | | $1,003.30 | | $1,000.00 | | $999.40 |
| C O M P A R I N G Y O U R | | F U N D ’ S E X P E N S E S |
| W I T H T H O S E O F | | O T H E R F U N D S ( U n a u d i t e d ) |
Using the SEC’s method to compare expenses
The Securities and Exchange Commission (SEC) has established guidelines to help investors assess fund expenses. Per these guidelines, the table below shows your fund’s expenses based on a $1,000 investment, assuming a hypothetical 5% annualized return. You can use this information to compare the ongoing expenses (but not transaction expenses or total cost) of investing in the fund with those of other funds.All mutual fund shareholder reports will provide this information to help you make this comparison. Please note that you cannot use this information to estimate your actual ending account balance and expenses paid during the period.
| Expenses and Value of a $1,000 Investment |
| assuming a hypothetical 5% annualized return for the six months ended December 31, 2005 |
| | | Class A | | Class B | | Class C |
| |
| |
| |
|
| Expenses paid per $1,000 † | | $ 5.14 | | $ 7.68 | | $ 8.94 |
| Ending value (after expenses) | | $1,020.11 | | $1,017.59 | | $1,016.33 |
| † Expenses are equal to the fund’s annualized expense ratio of 1.01% for Class A, 1.51% for Class B and 1.76% |
| for Class C, multiplied by the average account value over the period, multiplied by 184/365 (to reflect the one-half |
| year period). |
| S TAT E M E N T O F I N V E S T M E N T S | | | | |
| D e c e m b e r 3 1 , 2 0 0 5 | | | | | | |
| |
| |
| |
|
| |
| |
| |
| |
| | | Principal | | | | |
| Long-Term Municipal Investments—104.7% | | Amount ($) | | Value ($) |
| |
| |
|
| New Jersey—101.4% | | | | | | |
| Atlantic County Utilities Authority, | | | | | | |
| Solid Waste System Revenue: | | | | | | |
| 7%, 3/1/2008 | | 3,450,000 | | | | 3,488,881 |
| 7.125%, 3/1/2016 | | 13,250,000 | | | | 13,443,185 |
| Bayshore Regional Sewer Authority, Sewer Revenue | | | | | | |
| 5.50%, 4/1/2006 (Insured; MBIA) | | 2,000,000 | | a | | 2,050,440 |
| Bordentown Sewer Authority, Revenue | | | | | | |
| 5.375%, 12/1/2020 (Insured; FGIC) | | 3,880,000 | | | | 4,157,498 |
| Burlington County Bridge Commission, LR | | | | | | |
| County Guaranteed (Government | | | | | | |
| Leasing Project) 5.25%, 8/15/2021 | | 1,000,000 | | | | 1,069,070 |
| Camden Zero Coupon, 2/15/2012 (Insured; FSA) | | 4,385,000 | | | | 3,473,709 |
| Camden County Improvement Authority, | | | | | | |
| Health Care Redevelopment Project Revenue | | | | | | |
| (Cooper Health System Obligated Group Issue) | | | | | | |
| 5.25%, 2/15/2020 | | 4,545,000 | | b | | 4,709,711 |
| Carteret Board of Education, COP | | | | | | |
| 6%, 1/15/2024 (Insured; MBIA) | | 440,000 | | | | 486,147 |
| Delaware River and Bay Authority, Revenue: | | | | | | |
| 5.75%, 1/1/2010 (Insured; AMBAC) | | 5,000,000 | | a | | 5,480,950 |
| 5%, 1/1/2027 (Insured; MBIA) | | 3,220,000 | | | | 3,361,970 |
| East Orange: | | | | | | |
| Zero Coupon, 8/1/2010 (Insured; FSA) | | 4,240,000 | | | | 3,584,284 |
| Zero Coupon, 8/1/2011 (Insured; FSA) | | 2,500,000 | | | | 2,028,450 |
| East Orange Board of Education, COP, LR: | | | | | | |
| Zero Coupon, 2/1/2021 (Insured; FSA) | | 935,000 | | | | 481,338 |
| Zero Coupon, 2/1/2026 (Insured; FSA) | | 745,000 | | | | 295,914 |
| Zero Coupon, 2/1/2028 (Insured; FSA) | | 2,345,000 | | | | 845,959 |
| Essex County Improvement Authority, LR | | | | | | |
| (County Correctional Facility Project) | | | | | | |
| 6%, 10/1/2010 (Insured; FGIC) | | 10,000,000 | | a | | 11,110,700 |
| Gloucester Township Municipal Utilities Authority, Sewer | | | | |
| Revenue 5.65%, 3/1/2018 (Insured; AMBAC) | | 2,530,000 | | | | 2,854,422 |
| Hudson County, COP (Correctional Facilities) | | | | | | |
| 5%, 12/1/2021 (Insured; MBIA) | | 5,460,000 | | | | 5,792,678 |
| Hudson County Improvement Authority, | | | | | | |
| LR (County Services Building Project) | | | | | | |
| 5%, 4/1/2035 (Insured; AMBAC) | | 2,500,000 | | | | 2,606,075 |
| Jersey City: | | | | | | |
| 6%, 10/1/2008 (Insured; AMBAC) | | 2,490,000 | | | | 2,663,005 |
| Zero Coupon, 5/15/2010 (Insured; FSA) | | 4,745,000 | | | | 4,043,547 |
| | S TAT E M E N T O F I N V E S T M E N T S (continued)
|
| | | Principal | | | | |
| Long-Term Municipal Investments (continued) | | Amount ($) | | Value ($) |
| |
| |
|
| New Jersey (continued) | | | | | | |
| Mercer County Improvement Authority, Revenue | | | | | | |
| (County Courthouse Project) 5.75%, 11/1/2017 | | 500,000 | | | | 525,600 |
| Middlesex County Improvement Authority, Revenue, | | | | | | |
| Utility System (Perth Amboy Project): | | | | | | |
| Zero Coupon, 9/1/2020 (Insured; AMBAC) | | 4,800,000 | | | | 2,534,928 |
| Zero Coupon, 9/1/2022 (Insured; AMBAC) | | 5,000,000 | | | | 2,377,400 |
| New Brunswick Parking Authority, Guaranteed Parking | | | | | | |
| Revenue 5%, 9/1/2024 (Insured; MBIA) | | 1,220,000 | | | | 1,276,547 |
| New Jersey: | | | | | | |
| 6%, 5/1/2010 | | 3,695,000 | | a | | 4,075,659 |
| 6%, 7/15/2010 (Insured; MBIA) | | 7,400,000 | | | | 8,184,548 |
| New Jersey Building Authority, | | | | | | |
| State Building Revenue | | | | | | |
| 5%, 12/15/2012 (Insured; FSA) | | 1,000,000 | | a | | 1,083,240 |
| New Jersey Economic Development Authority: | | | | | | |
| Cigarette Tax Revenue 5.75%, 6/15/2029 | | 2,500,000 | | | | 2,646,525 |
| (Department of Human Services): | | | | | | |
| 6.10%, 7/1/2017 | | 3,700,000 | | | | 4,028,412 |
| 6.25%, 7/1/2024 | | 1,305,000 | | | | 1,439,611 |
| District Heating and Cooling Revenue | | | | | | |
| (Trigen-Trenton District Energy Co. L.P. Project): | | | | | | |
| 6.20%, 12/1/2007 | | 2,210,000 | | | | 2,230,376 |
| 6.20%, 12/1/2010 | | 4,040,000 | | | | 4,077,249 |
| Economic Development: | | | | | | |
| (American Airlines, Inc. Project) | | | | | | |
| 7.10%, 11/1/2031 | | 380,000 | | | | 311,836 |
| (Masonic Charity Foundation of New Jersey): | | | | | | |
| 5.875%, 6/1/2018 | | 2,750,000 | | | | 3,015,705 |
| 5.50%, 6/1/2021 | | 1,920,000 | | | | 2,069,952 |
| 6%, 6/1/2025 | | 1,000,000 | | | | 1,109,830 |
| 5.25%, 6/1/2032 | | 350,000 | | | | 370,650 |
| First Mortgage Revenue (The Evergreens): | | | | | | |
| 6%, 10/1/2017 | | 650,000 | | | | 666,386 |
| 6%, 10/1/2022 | | 700,000 | | | | 715,358 |
| Health, Hospital and Nursing Home Revenue | | | | | | |
| (Hillcrest Health Service): | | | | | | |
| Zero Coupon, 1/1/2012 (Insured; AMBAC) | | 1,000,000 | | | | 794,460 |
| Zero Coupon, 1/1/2013 (Insured; AMBAC) | | 1,000,000 | | | | 760,920 |
| Zero Coupon, 1/1/2015 (Insured; AMBAC) | | 3,250,000 | | | | 2,241,395 |
| Zero Coupon, 1/1/2017 (Insured; AMBAC) | | 5,000,000 | | | | 3,124,200 |
| Zero Coupon, 1/1/2018 (Insured; AMBAC) | | 2,500,000 | | | | 1,487,975 |
| Zero Coupon, 1/1/2020 (Insured; AMBAC) | | 6,500,000 | | | | 3,509,610 |
| Zero Coupon, 1/1/2022 (Insured; AMBAC) | | 6,000,000 | | | | 2,914,200 |
| |
| |
| 10 | | | | | | |
| | | Principal | | | | |
| Long-Term Municipal Investments (continued) | | Amount ($) | | Value ($) |
| |
| |
|
| New Jersey (continued) | | | | | | |
| New Jersey Economic Development Authority (continued): | | | | |
| Local or Guaranteed Housing, | | | | | | |
| First Mortgage (Fellowship Village Project): | | | | | | |
| 5.50%, 1/1/2018 | | 2,950,000 | | | | 2,995,961 |
| 5.50%, 1/1/2025 | | 3,000,000 | | | | 3,025,140 |
| (Morris Hall / Saint Lawrence Inc. Project) | | | | | | |
| 5.50%, 4/1/2006 (LOC; Wachovia Bank N.A.) | | 3,000,000 | | a | | 3,075,660 |
| Motor Vehicle Surcharge Revenue: | | | | | | |
| Zero Coupon, 7/1/2020 (Insured; MBIA) | | 3,600,000 | | | | 1,915,020 |
| Zero Coupon, 7/1/2021 (Insured; MBIA) | | 2,620,000 | | | | 1,324,279 |
| (School Facilities Construction) | | | | | | |
| 6.866%, 6/15/2018 (Insured; AMBAC) | | 10,000,000 | | c,d | | 10,846,950 |
| Special Facility Revenue (Continental Airlines, Inc. | | | | | | |
| Project) 6.25%, 9/15/2019 | | 5,000,000 | | | | 4,748,100 |
| State Lease Revenue (State Office Buildings Project): | | | | | | |
| 6%, 6/15/2010 (Insured; AMBAC) | | 2,425,000 | | a | | 2,680,474 |
| 6.125%, 6/15/2010 (Insured; AMBAC) | | 7,535,000 | | a | | 8,365,809 |
| Waste Paper Recycling Revenue | | | | | | |
| (Marcal Paper Mills Inc. Project): | | | | | | |
| 6.25%, 2/1/2009 | | 5,440,000 | | | | 5,529,216 |
| 8.50%, 2/1/2010 | | 3,955,000 | | | | 3,964,176 |
| New Jersey Educational Facilities Authority, Revenue: | | | | | | |
| (Fairleigh Dickinson University) | | | | | | |
| 6%, 7/1/2020 | | 2,535,000 | | | | 2,774,025 |
| (Higher Education Capital Improvement Fund) | | | | | | |
| 5%, 9/1/2021 (Insured; FSA) | | 5,270,000 | | | | 5,614,816 |
| (Public Library Project) | | | | | | |
| 5%, 9/1/2022 (Insured; AMBAC) | | 5,500,000 | | | | 5,806,350 |
| (Rowan University) | | | | | | |
| 5.75%, 7/1/2010 (Insured; FGIC) | | 15,405,000 | | a | | 16,881,107 |
| (Stevens Institute of Technology) | | | | | | |
| 5.375%, 7/1/2034 | | 2,500,000 | | | | 2,625,925 |
| (William Patterson University) | | | | | | |
| 5%, 7/1/2028 (Insured; FGIC) | | 2,000,000 | | | | 2,096,640 |
| New Jersey Environmental Infrastructure Trust | | | | | | |
| 5.25%, 9/1/2018 | | 4,070,000 | | | | 4,373,256 |
| New Jersey Health Care Facilities Financing Authority, | | | | | | |
| Health, Hospital and Nursing Home Revenue: | | | | | | |
| (Atlantic City Medical Center): | | | | | | |
| 6%, 7/1/2012 | | 3,000,000 | | | | 3,334,230 |
| 6.25%, 7/1/2017 | | 5,000,000 | | | | 5,603,650 |
| (Capital Health System Obligated Group) | | | | | | |
| 5.75%, 7/1/2023 | | 3,000,000 | | | | 3,221,730 |
| | S TAT E M E N T O F I N V E S T M E N T S (continued)
|
| | | Principal | | | | |
| Long-Term Municipal Investments (continued) | | Amount ($) | | Value ($) |
| |
| |
|
| New Jersey (continued) | | | | | | |
| New Jersey Health Care Facilities Financing Authority, | | | | | | |
| Health, Hospital and Nursing Home Revenue (continued): | | | | |
| (General Hospital Center at Passaic) | | | | | | |
| 6.75%, 7/1/2019 (Insured; FSA) | | 550,000 | | | | 675,598 |
| (Raritan Bay Medical Center) | | | | | | |
| 7.25%, 7/1/2014 | | 3,010,000 | | | | 3,109,932 |
| (Saint Barnabas Health) | | | | | | |
| Zero Coupon, 7/1/2023 (Insured; MBIA) | | 5,500,000 | | | | 2,468,510 |
| (Saint Elizabeth Hospital Obligated Group): | | | | | | |
| 6%, 7/1/2014 | | 2,500,000 | | | | 2,593,250 |
| 6%, 7/1/2020 | | 3,120,000 | | | | 3,250,510 |
| New Jersey Higher Education Assistance Authority, Student | | | | |
| Loan Revenue 6.125%, 6/1/2017 (Insured; MBIA) | | 380,000 | | | | 384,454 |
| New Jersey Highway Authority, Revenue (Garden State | | | | | | |
| Parkway) 6%, 1/1/2019 | | 6,645,000 | | | | 7,918,846 |
| New Jersey Housing and Mortgage | | | | | | |
| Finance Agency, Revenue: | | | | | | |
| Home Buyer: | | | | | | |
| 5.75%, 4/1/2018 (Insured; MBIA) | | 1,650,000 | | | | 1,705,027 |
| 5.30%, 4/1/2026 (Insured; MBIA) | | 2,555,000 | | | | 2,585,481 |
| Multi-Family Housing: | | | | | | |
| 5.70%, 5/1/2020 (Insured; FSA) | | 2,640,000 | | | | 2,774,983 |
| 5.75%, 5/1/2025 (Insured; FSA) | | 895,000 | | | | 937,459 |
| 5.65%, 5/1/2040 (Insured: AMBAC and FHA) | | 5,250,000 | | | | 5,479,372 |
| New Jersey Transit Corp., Lease Purchase Agreement, COP: | | | | |
| Federal Transit Administration Grants | | | | | | |
| 5.75%, 9/15/2010 (Insured; AMBAC) | | 5,000,000 | | a | | 5,497,150 |
| (Raymond Plaza East Inc.) | | | | | | |
| 6.50%, 4/1/2007 (Insured; FSA) | | 3,945,000 | | a | | 4,138,542 |
| New Jersey Transportation Trust Fund Authority | | | | | | |
| (Transportation System): | | | | | | |
| 5%, 6/15/2009 (Insured; FSA) | | 10,610,000 | | a | | 11,173,179 |
| 7.662%, 12/15/2011 | | 8,000,000 | | a,c,d | | 9,039,120 |
| 7.662%, 12/15/2011 | | 9,000,000 | | a,c,d | | 10,169,010 |
| 7%, 6/15/2012 (Insured; MBIA) | | 2,255,000 | | | | 2,685,682 |
| 7%, 6/15/2012 (Insured; MBIA) | | 3,745,000 | | | | 4,434,717 |
| 5.183%, 6/15/2014 | | 25,500,000 | | c,d | | 26,973,772 |
| | | Principal | | |
| Long-Term Municipal Investments (continued) | | Amount ($) | | Value ($) |
| |
| |
|
| New Jersey (continued) | | | | |
| New Jersey Turnpike Authority, Turnpike Revenue: | | | | |
| 6.50%, 1/1/2016 | | 60,000 | | 70,442 |
| 6.50%, 1/1/2016 | | 160,000 | | 188,758 |
| 6.50%, 1/1/2016 (Insured; FSA) | | 1,000,000 | | 1,178,660 |
| 6.50%, 1/1/2016 (Insured; MBIA) | | 1,210,000 | | 1,427,485 |
| 6.50%, 1/1/2016 (Insured; MBIA) | | 3,520,000 | | 4,148,883 |
| 6.50%, 1/1/2016 (Insured; MBIA) | | 17,935,000 | | 21,117,028 |
| 5%, 1/1/2035 (Insured; AMBAC) | | 7,450,000 | | 7,734,217 |
| North Hudson Sewer Authority, Sewer Revenue | | | | |
| 5.25%, 8/1/2019 (Insured; FGIC) | | 1,000,000 | | 1,078,620 |
| North Jersey District Water Supply Commission, | | | | |
| Sewer Revenue (Wanaque South Project) | | | | |
| 6%, 7/1/2019 (Insured; MBIA) | | 2,000,000 | | 2,304,840 |
| Port Authority of New York and New Jersey: | | | | |
| Port, Airport, and Marina Improvements Revenue: | | | | |
| (Consolidated Bond 119th Series) | | | | |
| 5.50%, 9/15/2016 (Insured; FGIC) | | 4,650,000 | | 4,757,461 |
| (Consolidated Bond 121st Series) | | | | |
| 5.375%, 10/15/2035 (Insured; MBIA) | | 14,950,000 | | 15,580,591 |
| (Consolidated Bond 124th Series) | | | | |
| 5%, 8/1/2019 | | 1,000,000 | | 1,024,520 |
| Special Obligation Revenue | | | | |
| (JFK International Air Terminal) | | | | |
| 6.25%, 12/1/2015 (Insured; MBIA) | | 5,000,000 | | 5,700,150 |
| Rahway, COP 5.625%, 2/15/2020 (Insured; MBIA) | | 600,000 | | 655,104 |
| Rahway Redevelopment Agency, | | | | |
| Public Library Revenue | | | | |
| 5%, 10/15/2022 (Insured; FGIC) | | 3,280,000 | | 3,483,557 |
| Rahway Valley Sewerage Authority, | | | | |
| Sewer Revenue: | | | | |
| Zero Coupon, 9/1/2032 (Insured; MBIA) | | 5,000,000 | | 1,415,950 |
| Zero Coupon, 9/1/2033 (Insured; MBIA) | | 5,000,000 | | 1,339,650 |
| Rutgers University | | | | |
| 5%, 5/1/2031 (Insured; FGIC) | | 3,000,000 | | 3,129,630 |
| South Jersey Transportation Authority, Transportation | | | | |
| System Revenue 5%, 11/1/2033 (Insured; FGIC) | | 2,500,000 | | 2,611,475 |
| | S TAT E M E N T O F I N V E S T M E N T S (continued)
|
| | | Principal | | | | |
| Long-Term Municipal Investments (continued) | | Amount ($) | | Value ($) |
| |
| |
|
| New Jersey (continued) | | | | | | |
| Tobacco Settlement Financing Corp. of New Jersey, | | | | | | |
| Tobacco Settlement Asset-Backed Bonds: | | | | | | |
| 5.75%, 6/1/2032 | | 13,730,000 | | | | 14,270,550 |
| 6.375%, 6/1/2032 | | 2,745,000 | | | | 3,020,159 |
| 6.75%, 6/1/2039 | | 1,790,000 | | | | 2,004,102 |
| 7%, 6/1/2041 | | 10,630,000 | | | | 12,128,192 |
| 6.25%, 6/1/2043 | | 3,490,000 | | | | 3,787,872 |
| Union County Improvement Authority, Revenue | | | | | | |
| (Correctional Facility Project) 5%, 6/15/2022 | | 3,155,000 | | | | 3,329,282 |
| Union County Utilities Authority, Solid Waste | | | | | | |
| Revenue (Ogden Martin) | | | | | | |
| 5.375%, 6/1/2020 (Insured; AMBAC) | | 4,990,000 | | | | 5,192,494 |
| University of Medicine and Dentistry of New Jersey | | | | | | |
| 5.50%, 12/1/2027 (Insured; AMBAC) | | 15,425,000 | | | | 16,774,071 |
| West Deptford Township | | | | | | |
| 5.50%, 9/1/2010 (Insured; FGIC) | | 1,800,000 | | a | | 1,958,436 |
| West Orange Board of Education, COP | | | | | | |
| 6%, 10/1/2009 (Insured; MBIA) | | 500,000 | | a | | 550,095 |
| U.S. Related—3.3% | | | | | | |
| Children’s Trust Fund of Puerto Rico, Tobacco | | | | | | |
| Settlement Revenue 5.75%, 7/1/2010 | | 3,000,000 | | a | | 3,278,280 |
| Commonwealth of Puerto Rico | | | | | | |
| 5.65%, 7/1/2015 (Insured; MBIA) | | 2,000,000 | | | | 2,284,920 |
| Guam Waterworks Authority, Water and Wastewater | | | | | | |
| System Revenue 6%, 7/1/2025 | | 1,000,000 | | | | 1,072,170 |
| Puerto Rico Housing Bank and Finance Agency, | | | | | | |
| SFMR (Affordable Housing Mortgage) | | | | | | |
| 6.25%, 4/1/2029 (Insured: FNMA and GNMA) | | 270,000 | | | | 274,393 |
| University of Puerto Rico, University Revenues | | | | | | |
| 5.375%, 6/1/2030 (Insured; MBIA) | | 3,450,000 | | | | 3,476,186 |
| Virgin Islands Public Finance Authority, Revenues, | | | | | | |
| Gross Receipts Taxes Loan Note: | | | | | | |
| 6.375%, 10/1/2019 | | 2,000,000 | | | | 2,231,660 |
| 6.50%, 10/1/2024 | | 3,000,000 | | | | 3,336,000 |
| Total Long-Term Municipal Investments | | | | | | |
| (cost $471,019,356) | | | | | | 502,313,496 |
| | | Principal | | |
| Short-Term Municipal Investments—.6% | | Amount ($) | | Value ($) |
| |
| |
|
| New Jersey; | | | | |
| New Jersey Educational Facilities Authority, | | | | |
| Revenue (Princeton University): | | | | |
| 3.70% | | 1,000,000 e | | 1,000,000 |
| 3.75% | | 2,100,000 e | | 2,100,000 |
| Total Short-Term Municipal Investments | | | | |
| (cost $3,100,000) | | | | 3,100,000 |
| |
| |
|
| Total Investments (cost $474,119,356) | | 105.3% | | 505,413,496 |
| Liabilities, Less Cash and Receivables | | (5.3%) | | (25,453,129) |
| Net Assets | | 100.0% | | 479,960,367 |
| | S TAT E M E N T O F I N V E S T M E N T S (continued)
|
| Summary of Abbreviations | | | | |
| |
| ACA | | American Capital Access | | GIC | | Guaranteed Investment Contract |
| AGC | | ACE Guaranty Corporation | | GNMA | | Government National Mortgage |
| AGIC | | Asset Guaranty Insurance Company | | | | Association |
| AMBAC | | American Municipal Bond | | GO | | General Obligation |
| | | Assurance Corporation | | HR | | Hospital Revenue |
| ARRN | | Adjustable Rate Receipt Notes | | IDB | | Industrial Development Board |
| BAN | | Bond Anticipation Notes | | IDC | | Industrial Development Corporation |
| BIGI | | Bond Investors Guaranty Insurance | | IDR | | Industrial Development Revenue |
| BPA | | Bond Purchase Agreement | | LOC | | Letter of Credit |
| CGIC | | Capital Guaranty Insurance | | LOR | | Limited Obligation Revenue |
| | | Company | | LR | | Lease Revenue |
| CIC | | Continental Insurance Company | | MBIA | | Municipal Bond Investors Assurance |
| CIFG | | CDC Ixis Financial Guaranty | | | | Insurance Corporation |
| CMAC | | Capital Market Assurance | | MFHR | | Multi-Family Housing Revenue |
| | | Corporation | | MFMR | | Multi-Family Mortgage Revenue |
| COP | | Certificate of Participation | | PCR | | Pollution Control Revenue |
| CP | | Commercial Paper | | RAC | | Revenue Anticipation Certificates |
| EDR | | Economic Development Revenue | | RAN | | Revenue Anticipation Notes |
| EIR | | Environmental Improvement | | RAW | | Revenue Anticipation Warrants |
| | | Revenue | | RRR | | Resources Recovery Revenue |
| FGIC | | Financial Guaranty Insurance | | SAAN | | State Aid Anticipation Notes |
| | | Company | | SBPA | | Standby Bond Purchase Agreement |
| FHA | | Federal Housing Administration | | SFHR | | Single Family Housing Revenue |
| FHLB | | Federal Home Loan Bank | | SFMR | | Single Family Mortgage Revenue |
| FHLMC | | Federal Home Loan Mortgage | | SONYMA | | State of New York Mortgage Agency |
| | | Corporation | | SWDR | | Solid Waste Disposal Revenue |
| FNMA | | Federal National Mortgage | | TAN | | Tax Anticipation Notes |
| | | Association | | TAW | | Tax Anticipation Warrants |
| FSA | | Financial Security Assurance | | TRAN | | Tax and Revenue Anticipation Notes |
| GAN | | Grant Anticipation Notes | | XLCA | | XL Capital Assurance |
| Summary of Combined Ratings (Unaudited) | | |
| |
| Fitch or | | Moody’s | | or Standard & Poor’s | | Value (%) † |
| |
| |
| |
|
| AAA | | Aaa | | AAA | | 66.7 |
| AA | | Aa | | AA | | 1.9 |
| A | | | | A | | A | | 10.6 |
| BBB | | Baa | | BBB | | 13.0 |
| BB | | | | Ba | | BB | | .2 |
| B | | | | B | | B | | 1.0 |
| CCC | | Caa | | CCC | | .1 |
| F1 | | | | MIG1/P1 | | SP1/A1 | | .6 |
| Not Rated f | | Not Rated f | | Not Rated f | | 5.9 |
| | | | | | | | | 100.0 |
| |
| † | | Based on total investments. | | | | |
| a | | These securities are prerefunded; the date shown represents the prerefunded date. Bonds which are prerefunded are |
| | | collateralized by U.S. Government securities which are held in escrow and are used to pay principal and interest on |
| | | the municipal issue and to retire the bonds in full at the earliest refunding date. | | |
| b | | Purchased on a delayed delivery basis. | | | | |
| c | | Collateral for floating rate borrowings. | | | | |
| d | | Securities exempt from registration under Rule 144A of the Securities Act of 1933.These securities may be resold in |
| | | transactions exempt from registration, normally to qualified institutional buyers. At December 31, 2005, these |
| | | securities amounted to $57,028,852 or 11.9% of net assets. | | |
| e | | Securities payable on demand.Variable interest rate—subject to periodic change. | | |
| f | | Securities which, while not rated by Fitch, Moody’s and Standard & Poor’s, have been determined by the Manager to |
| | | be of comparable quality to those rated securities in which the fund may invest. | | |
| See notes to financial statements. | | | | |
| S TAT E M E N T O F A S S E T S A N D | | L I A B I L I T I E S |
| D e c e m b e r 3 1 , 2 0 0 5 | | | | |
| |
| |
|
| |
| |
| |
| |
| | | Cost | | Value |
| |
| |
|
| Assets ($): | | | | |
| Investments in securities—See Statement of Investments | | 474,119,356 | | 505,413,496 |
| Interest receivable | | | | 6,523,328 |
| Receivable for shares of Common Stock subscribed | | | | 11,343 |
| Prepaid expenses | | | | 53,292 |
| | | | | 512,001,459 |
| |
| |
|
| Liabilities ($): | | | | |
| Due to The Dreyfus Corporation and affiliates—Note 3(c) | | | | 332,352 |
| Cash overdraft due to Custodian | | | | 527,864 |
| Payable for floating rate notes issued | | | | 26,250,000 |
| Payable for investment securities purchased | | | | 4,672,510 |
| Payable for shares of Common Stock redeemed | | | | 144,449 |
| Interest and related expenses payable | | | | 47,082 |
| Accrued expenses | | | | 66,835 |
| | | | | 32,041,092 |
| |
| |
|
| Net Assets ($) | | | | 479,960,367 |
| |
| |
|
| Composition of Net Assets ($): | | | | |
| Paid-in capital | | | | 451,148,476 |
| Accumulated net realized gain (loss) on investments | | | | (2,482,249) |
| Accumulated net unrealized appreciation | | | | |
| (depreciation) on investments | | | | 31,294,140 |
| |
| |
|
| Net Assets ($) | | | | 479,960,367 |
| Net Asset Value Per Share | | | | | | |
| | | Class A | | Class B | | Class C |
| |
| |
| |
|
| Net Assets ($) | | 475,203,355 | | 2,024,906 | | 2,732,106 |
| Shares Outstanding | | 36,226,919 | | 154,541 | | 208,471 |
| |
| |
| |
|
| Net Asset Value Per Share ($) | | 13.12 | | 13.10 | | 13.11 |
| | See notes to financial statements.
|
| S TAT E M E N T O F | | O P E R AT I O N S | | |
| Ye a r E n d e d D e c e m b e r 3 1 , | | 2 0 0 5 | | |
| |
| |
|
| |
| |
| |
| |
| Investment Income ($): | | | | |
| Interest Income | | | | 25,908,041 |
| Expenses: | | | | |
| Management fee—Note 3(a) | | | | 2,955,129 |
| Shareholder servicing costs—Note 3(c) | | 1,481,469 |
| Interest and related expenses | | | | 785,474 |
| Directors’ fees and expenses—Note 3(d) | | 87,696 |
| Professional fees | | | | 57,275 |
| Custodian fees | | | | 54,113 |
| Registration fees | | | | 37,438 |
| Distribution fees—Note 3(b) | | | | 24,599 |
| Prospectus and shareholders’ reports | | 21,805 |
| Loan commitment fees—Note 2 | | | | 2,194 |
| Miscellaneous | | | | 37,427 |
| Total Expenses | | | | 5,544,619 |
| Less—reduction in management fee due to | | |
| undertaking—Note 3(a) | | | | (545,919) |
| Less—reduction in custody fees due to | | |
| earnings credits—Note 1(b) | | | | (15,776) |
| Net Expenses | | | | 4,982,924 |
| Investment Income—Net | | | | 20,925,117 |
| |
| |
|
| Realized and Unrealized Gain (Loss) on Investments—Note 4 ($): |
| Net realized gain (loss) on investments and option transactions | | 529,919 |
| Net unrealized appreciation (depreciation) on investments | | (5,887,566) |
| Net Realized and Unrealized Gain (Loss) on Investments | | (5,357,647) |
| Net Increase in Net Assets Resulting from Operations | | 15,567,470 |
| | See notes to financial statements.
|
0
S TAT E M E N T O F C H A N G E S I N N E T A S S E T S
| | | Year Ended December 31, |
| |
|
| | | 2005 | | 2004 |
| |
| |
|
| Operations ($): | | | | |
| Investment income—net | | 20,925,117 | | 21,312,004 |
| Net realized gain (loss) on investments | | 529,919 | | 1,896,059 |
| Net unrealized appreciation | | | | |
| (depreciation) on investments | | (5,887,566) | | (3,775,974) |
| Net Increase (Decrease) in Net Assets | | | | |
| Resulting from Operations | | 15,567,470 | | 19,432,089 |
| |
| |
|
| Dividends to Shareholders from ($): | | | | |
| Investment income—net: | | | | |
| Class A shares | | (20,707,461) | | (21,140,425) |
| Class B shares | | (70,354) | | (50,803) |
| Class C shares | | (70,587) | | (51,709) |
| Net realized gain on investments: | | | | |
| Class A shares | | — | | (690,071) |
| Class B shares | | — | | (1,943) |
| Class C shares | | — | | (2,205) |
| Total Dividends | | (20,848,402) | | (21,937,156) |
| |
| |
|
| Capital Stock Transactions ($): | | | | |
| Net proceeds from shares sold: | | | | |
| Class A shares | | 25,969,722 | | 27,944,322 |
| Class B shares | | 654,150 | | 781,460 |
| Class C shares | | 1,182,252 | | 685,726 |
| Dividends reinvested: | | | | |
| Class A shares | | 14,803,889 | | 15,713,370 |
| Class B shares | | 45,823 | | 26,169 |
| Class C shares | | 38,855 | | 29,000 |
| Cost of shares redeemed: | | | | |
| Class A shares | | (60,922,298) | | (76,653,589) |
| Class B shares | | (266,976) | | (226,165) |
| Class C shares | | (198,594) | | (160,560) |
| Increase (Decrease) in Net Assets | | | | |
| from Capital Stock Transactions | | (18,693,177) | | (31,860,267) |
| Total Increase (Decrease) in Net Assets | | (23,974,109) | | (34,365,334) |
| |
| |
|
| Net Assets ($): | | | | |
| Beginning of Period | | 503,934,476 | | 538,299,810 |
| End of Period | | 479,960,367 | | 503,934,476 |
1
| | | Year Ended December 31, |
| |
|
| | | 2005 | | 2004 |
| |
| |
|
| Capital Share Transactions: | | | | |
| Class A a | | | | |
| Shares sold | | 1,962,222 | | 2,120,972 |
| Shares issued for dividends reinvested | | 1,119,324 | | 1,194,252 |
| Shares redeemed | | (4,603,505) | | (5,819,319) |
| Net Increase (Decrease) in Shares Outstanding | | (1,521,959) | | (2,504,095) |
| |
| |
|
| Class B a | | | | |
| Shares sold | | 49,513 | | 58,967 |
| Shares issued for dividends reinvested | | 3,470 | | 1,992 |
| Shares redeemed | | (20,261) | | (17,194) |
| Net Increase (Decrease) in Shares Outstanding | | 32,722 | | 43,765 |
| |
| |
|
| Class C | | | | |
| Shares sold | | 89,700 | | 51,853 |
| Shares issued for dividends reinvested | | 2,946 | | 2,209 |
| Shares redeemed | | (15,182) | | (12,353) |
| Net Increase (Decrease) in Shares Outstanding | | 77,464 | | 41,709 |
| a | | During the period ended December 31, 2005, 727 Class B shares representing $9,697 were automatically |
| | | converted to 726 Class A shares and during the period ended December 31, 2004, 1,505 Class B shares�� |
| | | representing $19,691 were automatically converted to 1,504 Class A shares. |
| See notes to financial statements. |
2
| | F I N A N C I A L H I G H L I G H T S
|
The following tables describe the performance for each share class for the fiscal periods indicated. All information (except portfolio turnover rate) reflects financial results for a single fund share.Total return shows how much your investment in the fund would have increased (or decreased) during each period, assuming you had reinvested all dividends and distributions.These figures have been derived from the fund’s financial statements.
| | | | | Year Ended December 31, | | |
| |
| |
| |
|
| Class A Shares | | 2005 | | 2004 | | 2003 a | | 2002 | | 2001 |
| |
| |
| |
| |
| |
|
| Per Share Data ($): | | | | | | | | | | |
| Net asset value, beginning of period | | 13.26 | | 13.32 | | 13.25 | | 12.76 | | 12.86 |
| Investment Operations: | | | | | | | | | | |
| Investment income—net b | | .56 | | .55 | | .57 | | .62 | | .63 |
| Net realized and unrealized | | | | | | | | | | |
| gain (loss) on investments | | (.14) | | (.04) | | .06 | | .49 | | (.10) |
| Total from Investment Operations | | .42 | | .51 | | .63 | | 1.11 | | .53 |
| Distributions: | | | | | | | | | | |
| Dividends from investment income—net | | (.56) | | (.55) | | (.56) | | (.62) | | (.63) |
| Dividends from net realized | | | | | | | | | | |
| gain on investments | | — | | (.02) | | — | | (.00)c | | (.00)c |
| Total Distributions | | (.56) | | (.57) | | (.56) | | (.62) | | (.63) |
| Net asset value, end of period | | 13.12 | | 13.26 | | 13.32 | | 13.25 | | 12.76 |
| |
| |
| |
| |
| |
|
| Total Return (%) | | 3.22d | | 3.91d | | 4.90d | | 8.88 | | 4.19 |
| |
| |
| |
| |
| |
|
| Ratios/Supplemental Data (%): | | | | | | | | | | |
| Ratio of total expenses | | | | | | | | | | |
| to average net assets e | | 1.12 | | 1.04 | | 1.03 | | 1.03 | | 1.06 |
| Ratio of net expenses | | | | | | | | | | |
| to average net assets e | | 1.01 | | .94 | | .94 | | .94 | | .98 |
| Ratio of net investment income | | | | | | | | | | |
| to average net assets | | 4.25 | | 4.16 | | 4.29 | | 4.77 | | 4.87 |
| Portfolio Turnover Rate | | 11.22 | | 16.98 | | 24.45 | | 33.10 | | 28.39 |
| |
| |
| |
| |
| |
|
| Net Assets, end of period ($ x 1,000) | | 475,203 | | 500,585 | | 536,073 | | 558,814 | | 545,112 |
| a | | The fund commenced offering three classes of shares on January 7, 2003.The existing shares were redesignated |
| | | Class A shares. |
| b | | Based on average shares outstanding at each month end. |
| c | | Amount represents less than $.01 per share. |
| d | | Exclusive of sales charge. |
| e | | Ratio of total expenses to average net assets and ratio of net expenses to average net assets for all periods have been |
| | | restated.This restatement has no impact on the fund’s previously reported net assets, net investment income, net asset |
| | | value or total return. See Note 5. |
| See notes to financial statements. |
3
| | | | | Year Ended December 31, |
| | | |
|
| Class B Shares | | 2005 | | 2004 | | 2003 a |
| |
| |
| |
|
| Per Share Data ($): | | | | | | |
| Net asset value, beginning of period | | 13.25 | | 13.30 | | 13.13 |
| Investment Operations: | | | | | | |
| Investment income—net b | | .50 | | .48 | | .48 |
| Net realized and unrealized | | | | | | |
| gain (loss) on investments | | (.16) | | (.03) | | .17 |
| Total from Investment Operations | | .34 | | .45 | | .65 |
| Distributions: | | | | | | |
| Dividends from investment income—net | | (.49) | | (.48) | | (.48) |
| Dividends from net realized gain on investments | | — | | (.02) | | — |
| Total Distributions | | (.49) | | (.50) | | (.48) |
| Net asset value, end of period | | 13.10 | | 13.25 | | 13.30 |
| |
| |
| |
|
| Total Return (%) c | | 2.63 | | 3.46 | | 5.07d |
| |
| |
| |
|
| Ratios/Supplemental Data (%): | | | | | | |
| Ratio of total expenses to average net assets e | | 1.67 | | 1.59 | | 1.57f |
| Ratio of net expenses to average net assets e | | 1.51 | | 1.44 | | 1.43f |
| Ratio of net investment income | | | | | | |
| to average net assets | | 3.74 | | 3.65 | | 3.63f |
| Portfolio Turnover Rate | | 11.22 | | 16.98 | | 24.45 |
| |
| |
| |
|
| Net Assets, end of period ($ x 1,000) | | 2,025 | | 1,614 | | 1,038 |
| |
| a | | From January 7, 2003 (commencement of initial offering) to December 31, 2003. | | | | |
| b | | Based on average shares outstanding at each month end. | | | | |
| c | | Exclusive of sales charge. | | | | | | |
| d | | Not annualized. | | | | | | |
| e | | Ratio of total expenses to average net assets and ratio of net expenses to average net assets for all periods have been |
| | | restated.This restatement has no impact on the fund’s previously reported net assets, net investment income, net asset |
| | | value or total return. See Note 5. | | | | | | |
| f | | Annualized. | | | | | | |
| See notes to financial statements. | | | | | | |
4
| | F I N A N C I A L H I G H L I G H T S (continued)
|
| | | | | Year Ended December 31, |
| | | |
|
| Class C Shares | | 2005 | | 2004 | | 2003 a |
| |
| |
| |
|
| Per Share Data ($): | | | | | | |
| Net asset value, beginning of period | | 13.25 | | 13.31 | | 13.13 |
| Investment Operations: | | | | | | |
| Investment income—net b | | .46 | | .45 | | .44 |
| Net realized and unrealized | | | | | | |
| gain (loss) on investments | | (.14) | | (.04) | | .19 |
| Total from Investment Operations | | .32 | | .41 | | .63 |
| Distributions: | | | | | | |
| Dividends from investment income—net | | (.46) | | (.45) | | (.45) |
| Dividends from net realized gain on investments | | — | | (.02) | | — |
| Total Distributions | | (.46) | | (.47) | | (.45) |
| Net asset value, end of period | | 13.11 | | 13.25 | | 13.31 |
| |
| |
| |
|
| Total Return (%) c | | 2.45 | | 3.13 | | 4.88d |
| |
| |
| |
|
| Ratios/Supplemental Data (%): | | | | | | |
| Ratio of total expenses to average net assets e | | 1.89 | | 1.81 | | 1.80f |
| Ratio of net expenses to average net assets e | | 1.76 | | 1.69 | | 1.67f |
| Ratio of net investment income | | | | | | |
| to average net assets | | 3.51 | | 3.41 | | 3.34f |
| Portfolio Turnover Rate | | 11.22 | | 16.98 | | 24.45 |
| |
| |
| |
|
| Net Assets, end of period ($ x 1,000) | | 2,732 | | 1,736 | | 1,188 |
| |
| a | | From January 7, 2003 (commencement of initial offering) to December 31, 2003. | | | | |
| b | | Based on average shares outstanding at each month end. | | | | |
| c | | Exclusive of sales charge. | | | | | | |
| d | | Not annualized. | | | | | | |
| e | | Ratio of total expenses to average net assets and ratio of net expenses to average net assets for all periods have been |
| | | restated.This restatement has no impact on the fund’s previously reported net assets, net investment income, net asset |
| | | value or total return. See Note 5. | | | | | | |
| f | | Annualized. | | | | | | |
| See notes to financial statements. | | | | | | |
5
N O T E S T O F I N A N C I A L S TAT E M E N T S
NOTE 1—Significant Accounting Policies:
Dreyfus Premier New Jersey Municipal Bond Fund, Inc. (the “fund”) is registered under the Investment Company Act of 1940, as amended (the “Act”), as a non-diversified open-end management investment company.The fund’s investment objective is to provide investors with as high a level of current income exempt from federal and New Jersey personal income taxes, as is consistent with the preservation of capital. The Dreyfus Corporation (the “Manager” or “Dreyfus”) serves as the fund’s investment adviser.The Manager is a wholly-owned subsidiary of Mellon Financial Corporation (“Mellon Financial”).
Dreyfus Service Corporation (the “Distributor”), a wholly-owned subsidiary of the Manager, is the distributor of the fund’s shares.The fund is authorized to issue 500 million shares of $.001 par value Common Stock.The fund currently offers three classes of shares: Class A (200 million shares authorized), Class B (150 million shares authorized) and Class C (150 million shares authorized). Class A shares are subject to a sales charge imposed at the time of purchase. Class B shares are subject to a contingent deferred sales charge (“CDSC”) imposed on Class B share redemptions made within six years of purchase and automatically convert to Class A shares after six years. Class C shares are subject to a CDSC imposed on Class C shares redeemed within one year of purchase. Other differences between the classes include the services offered to and the expenses borne by each class and certain voting rights. Income, expenses (other than expenses attributable to a specific class), and realized and unrealized gains or losses on investments are allocated to each class of shares based on its relative net assets.
The fund’s financial statements are prepared in accordance with U.S. generally accepted accounting principles, which may require the use of management estimates and assumptions. Actual results could differ from those estimates.
The fund enters into contracts that contain a variety of indemnifications. The fund’s maximum exposure under these arrangements is unknown.The fund does not anticipate recognizing any loss related to these arrangements.
T h e F u n d 25
6
N O T E S T O F I N A N C I A L S TAT E M E N T S (continued)
(a) Portfolio valuation: Investments in securities are valued each business day by an independent pricing service (the “Service”) approved by the fund’s Board of Directors. Investments for which quoted bid prices are readily available and are representative of the bid side of the market in the judgment of the Service are valued at the mean between the quoted bid prices (as obtained by the Service from dealers in such securities) and asked prices (as calculated by the Service based upon its evaluation of the market for such securities). Other investments (which constitute a majority of the portfolio securities) are carried at fair value as determined by the Service, based on methods which include consideration of: yields or prices of municipal securities of comparable quality, coupon, maturity and type; indications as to values from dealers; and general market conditions. Options and financial futures on municipal and U.S.Treasury securities are valued at the last sales price on the securities exchange on which such securities are primarily traded or at the last sales price on the national securities market on each business day.
(b) Securities transactions and investment income: Securities transactions are recorded on a trade date basis. Realized gain and loss from securities transactions are recorded on the identified cost basis. Interest income, adjusted for accretion of discount and amortization of premium on investments, is earned from settlement date and recognized on the accrual basis. Securities purchased or sold on a when-issued or delayed-delivery basis may be settled a month or more after the trade date.
The fund has an arrangement with the custodian bank whereby the fund receives earnings credits from the custodian when positive cash balances are maintained, which are used to offset custody fees. For financial reporting purposes, the fund includes net earnings credits as an expense offset in the Statement of Operations.
The fund follows an investment policy of investing primarily in municipal obligations of one state. Economic changes affecting the state and certain of its public bodies and municipalities may affect the ability of issuers within the state to pay interest on, or repay principal of, municipal obligations held by the fund.
7
(c) Dividends to shareholders: It is the policy of the fund to declare dividends from investment income-net on each business day. Such dividends are paid monthly. Dividends from net realized capital gain, if any, are normally declared and paid annually, but the fund may make distributions on a more frequent basis to comply with the distribution requirements of the Internal Revenue Code of 1986, as amended (the “Code”).To the extent that net realized capital gain can be offset by capital loss carryovers, it is the policy of the fund not to distribute such gain. Income and capital gain distributions are determined in accordance with income tax regulations, which may differ from U.S. generally accepted accounting principles.
(d) Federal income taxes: It is the policy of the fund to continue to qualify as a regulated investment company, which can distribute tax exempt dividends, by complying with the applicable provisions of the Code, and to make distributions of income and net realized capital gain sufficient to relieve it from substantially all federal income and excise taxes.
At December 31, 2005, the components of accumulated earnings on a tax basis were as follows: undistributed tax exempt income $182,563, accumulated capital losses $2,502,894 and unrealized appreciation $31,315,914. In addition, the fund had $1,129 of capital losses realized after October 31, 2005, which were deferred for tax purposes to the first day of the following fiscal year.
The accumulated capital loss carryover is available to be applied against future net securities profits, if any, realized subsequent to December 31, 2005. If not applied, $465,690 of the carryover expires in fiscal 2008, and $2,037,204 expires in fiscal 2011.
The tax character of distributions paid to shareholders during the fiscal periods ended December 31, 2005 and December 31, 2004 were as follows: tax exempt income $20,848,402 and $21,242,937 and ordinary income $0 and $694,219, respectively.
8
N O T E S T O F I N A N C I A L S TAT E M E N T S (continued)
During the period ended December 31, 2005, as a result of permanent book to tax differences, primarily due to the tax treatment for amortization adjustments, the fund decreased accumulated undistributed investment income-net by $76,715, increased accumulated net realized gain (loss) on investments by $229,602 and decreased paid-in capital by $152,887. Net assets were not affected by this reclassification.
NOTE 2—Bank Line of Credit:
|
The fund participates with other Dreyfus-managed funds in a $350 million redemption credit facility (the “Facility”) to be utilized for temporary or emergency purposes, including the financing of redemptions. In connection therewith, the fund has agreed to pay commitment fees on its pro rata portion of the Facility. Interest is charged to the fund based on prevailing market rates in effect at the time of borrowing. During the period ended December 31, 2005, the fund did not borrow under the Facility.
NOTE 3—Management Fee and Other Transactions With Affiliates:
(a) Pursuant to a Management Agreement (“Agreement”) with the Manager, the management fee is computed at the annual rate of .60% of the value of the fund’s average daily net assets and is payable monthly. The Manager has undertaken until such time as they give shareholders at least 90 days’ notice to the contrary, if the aggregate expenses of the fund, exclusive of taxes, brokerage commissions, interest expense, commitment fees, extraordinary expenses, shareholder services fees and Rule 12b-1 distribution plan fees, but including the management fee, exceed .60% of the value of the fund’s average daily net assets, the fund may deduct from the payments to be made to the Manager under the Agreement, or the Manager will bear such excess expense.The reduction in management fee, pursuant to the undertaking, amounted to $545,919 during the period ended December 31, 2005.
9
During the period ended December 31, 2005, the Distributor retained $9,676 from commissions earned on sales of the fund’s Class A shares and $6,192 and $327 from contingent deferred sales charges on redemptions of the fund’s Class B and Class C shares, respectively.
(b) Under the Distribution Plan (the “Plan”) adopted pursuant to Rule 12b-1 under the Act, Class B and Class C shares pay the Distributor for distributing their shares at an annual rate of .50% of the value of the average daily net assets of Class B shares and .75% of the value of the average daily net assets of Class C shares. During the period ended December 31, 2005, Class B and Class C shares were charged $9,435 and $15,164, respectively, pursuant to the Plan.
(c) Under the Shareholder Services Plan, Class A, Class B and Class C shares pay the Distributor at an annual rate of .25% of the value of the average daily net assets for the provision of certain services. The services provided may include personal services relating to shareholder accounts, such as answering shareholder inquiries regarding the fund and providing reports and other information, and services related to the maintenance of shareholder accounts. The Distributor may make payments to Service Agents (a securities dealer, financial institution or other industry professional) in respect of these services. The Distributor determines the amounts to be paid to Service Agents. During the period ended December 31, 2005, Class A, Class B and Class C shares were charged $1,221,532, $4,717 and $5,055, respectively, pursuant to the Shareholder Services Plan.
The fund compensates Dreyfus Transfer, Inc., a wholly-owned subsidiary of the Manager, under a transfer agency agreement for providing personnel and facilities to perform transfer agency services for the fund. During the period ended December 31, 2005, the fund was charged $144,619 pursuant to the transfer agency agreement.
N O T E S T O F I N A N C I A L S TAT E M E N T S (continued)
During the period ended December 31, 2005, the fund was charged $3,762 for services performed by the Chief Compliance Officer.
The components of Due to The Dreyfus Corporation and affiliates in the Statement of Assets and Liabilities consist of: management fees $243,395, Rule 12b-1 distribution plan fees $2,595, shareholder services plan fees $101,415, chief compliance officer fees $1,858 and transfer agency per account fees $24,983, which are offset against an expense reimbursement currently in effect in the amount of $41,894.
(d) Each Board member also serves as a Board member of other funds within the Dreyfus complex. Annual retainer fees and attendance fees are allocated to each fund based on net assets.
NOTE 4—Securities Transactions:
|
The aggregate amount of purchases and sales of investment securities, excluding short-term securities and options transactions, during the period ended December 31, 2005, amounted to $54,464,924 and $68,954,896, respectively.
At December 31, 2005, the cost of investments for federal income tax purposes was $447,847,582; accordingly, accumulated net unrealized appreciation on investments was $31,315,914, consisting of $31,601,076 gross unrealized appreciation and $285,162 gross unrealized depreciation.
Subsequent to the issuance of the December 31, 2005 financial statements, the fund determined that the transfers of certain tax-exempt municipal bond securities by the fund to special purpose bond trusts in connection with participation in inverse floater structures do not qualify for sale treatment under Statement of Financial Accounting
Standard No. 140,Accounting for Transfers and Servicing of Financial Assets and Extinguishment of Liabilities, and should have been accounted for as a secured borrowing.
The correction of the above item resulted in the restatement of the ratio of net expenses of the financial highlights table as shown below:
| Ratio of Total Expenses | | 2005 | | 2004 | | 2003 | | 2002 | | 2001 |
| |
| |
| |
| |
| |
|
| Class A shares: | | | | | | | | | | |
| As previously reported | | .96% | | .95% | | .95% | | .94% | | .94% |
| As restated | | 1.12% | | 1.04% | | 1.03% | | 1.03% | | 1.06% |
| Class B shares: | | 2005 | | 2004 | | 2003 | | 2002 | | 2001 |
| |
| |
| |
| |
| |
|
| As previously reported | | 1.51% | | 1.50% | | 1.49% | | | | |
| As restated | | 1.67% | | 1.59% | | 1.57% | | | | |
| Class C shares: | | 2005 | | 2004 | | 2003 | | 2002 | | 2001 |
| |
| |
| |
| |
| |
|
| As previously reported | | 1.73% | | 1.72% | | 1.72% | | | | |
| As restated | | 1.89% | | 1.81% | | 1.80% | | | | |
| |
| Ratio of Net Expenses | | 2005 | | 2004 | | 2003 | | 2002 | | 2001 |
| |
| |
| |
| |
| |
|
| Class A shares: | | | | | | | | | | |
| As previously reported | | .85% | | .85% | | .86% | | .85% | | .86% |
| As restated | | 1.01% | | .94% | | .94% | | .94% | | .98% |
| Class B shares: | | 2005 | | 2004 | | 2003 | | 2002 | | 2001 |
| |
| |
| |
| |
| |
|
| As previously reported | | 1.35% | | 1.35% | | 1.35% | | | | |
| As restated | | 1.51% | | 1.44% | | 1.43% | | | | |
| Class C shares: | | 2005 | | 2004 | | 2003 | | 2002 | | 2001 |
| |
| |
| |
| |
| |
|
| As previously reported | | 1.60% | | 1.60% | | 1.59% | | | | |
| As restated | | 1.76% | | 1.69% | | 1.67% | | | | |
This restatement has no impact on the fund’s previously reported net assets, net investment income, net asset value per share or total return.
N O T E S T O F I N A N C I A L S TAT E M E N T S (continued)
In addition, the statement of investments, the statement of assets and liabilities and the statement of operations were also restated as follows:
| | | 2005 | | 2005 |
| | | As Previously Reported | | As Restated |
| |
| |
|
| Portfolio of Investments: | | | | |
| Total investments | | 479,163,496 | | 505,413,496 |
| Identified cost | | 448,077,184 | | 474,119,356 |
| Other assets and liabilities | | 796,871 | | (25,453,129) |
| Statement of Assets and Liabilities: | | | | |
| Total investments in securities, at value | | 479,163,496 | | 505,413,496 |
| Identified cost | | 448,077,184 | | 474,119,356 |
| Interest receivable | | 6,476,246 | | 6,523,328 |
| Total assets | | 485,704,377 | | 512,001,459 |
| Payable for floating rate notes issued | | — | | 26,250,000 |
| Interest and related expenses payable | | — | | 47,082 |
| Total liabilities | | 5,744,010 | | 32,041,092 |
| Net unrealized appreciation | | | | |
| (depreciation) on investments | | 31,086,312 | | 31,294,140 |
| Accumulated net realized | | | | |
| gain (loss) on investments | | (2,274,421) | | (2,482,249) |
| Statement of Operations: | | | | |
| Investment income—Interest | | 25,122,567 | | 25,908,041 |
| Expense—Interest | | — | | 785,474 |
| Total expenses | | 4,759,145 | | 5,544,619 |
| Net expenses | | 4,197,450 | | 4,982,924 |
R E P O R T O F I N D E P E N D E N T R E G I S T E R E D P U B L I C A C C O U N T I N G F I R M
Shareholders and Board of Directors
Dreyfus Premier New Jersey Municipal Bond Fund, Inc.
We have audited the accompanying statement of assets and liabilities of Dreyfus Premier New Jersey Municipal Bond Fund, Inc., including the statement of investments, as of December 31, 2005, and the related statement of operations for the year then ended, the statement of changes in net assets for each of the two years in the period then ended, and financial highlights for each of the periods indicated therein.These financial statements and financial highlights are the responsibility of the Fund’s management. Our responsibility is to express an opinion on these financial statements and financial highlights based on our audits.
We conducted our audits in accordance with the standards of the Public Company Accounting Oversight Board (United States).Those standards require that we plan and perform the audit to obtain reasonable assurance about whether the financial statements and financial highlights are free of material misstatement.We were not engaged to perform an audit of the Fund’s internal control over financial reporting. Our audits included consideration of internal control over financial reporting as a basis for designing audit procedures that are appropriate in the circumstances, but not for the purpose of expressing an opinion on the effectiveness of the Fund’s internal control over financial reporting. Accordingly, we express no such opinion.An audit also includes examining, on a test basis, evidence supporting the amounts and disclosures in the financial statements and financial highlights, assessing the accounting principles used and significant estimates made by management, and evaluating the overall financial statement presentation. Our procedures included confirmation of securities owned as of December 31, 2005 by correspondence with the custodian and others or by other appropriate auditing procedures where replies from others were not received. We believe that our audits provide a reasonable basis for our opinion.
In our opinion, the financial statements and financial highlights referred to above present fairly, in all material respects, the financial position of Dreyfus Premier New Jersey Municipal Bond Fund, Inc. at December 31, 2005, the results of its operations for the year then ended, the changes in its net assets for each of the two years in the period then ended, and the financial highlights for each of the indicated periods, in conformity with U. S. generally accepted accounting principles.
R E P O R T O F I N D E P E N D E N T R E G I S T E R E D P U B L I C A C C O U N T I N G F I R M (continued)
As discussed in Note 5, the statement of assets and liabilities, including the statement of investments, as of December 31, 2005, and the related statements of operations for the year then ended, the statements of changes in net assets for each of the two years in the period then ended, and financial highlights for each of the periods indicated therein have been restated.
I M P O R TA N T TA X I N F O R M AT I O N ( U n a u d i t e d )
In accordance with federal tax law, the fund hereby designates all the dividends paid from investment income-net during the fiscal year ended December 31, 2005 as “exempt-interest dividends” (not subject to regular federal and, for individuals who are New Jersey residents, New Jersey personal income taxes).
As required by federal tax law rules, shareholders will receive notification of their portion of the fund’s taxable ordinary dividends and capital gains distributions paid for the 2005 calendar year on Form 1099-DIV which will be mailed by January 31, 2006.
| B O A R D M E M B E R S I N F O R M AT I O N ( U n a u d i t e d ) |
| |
| |
| |
| |
| Joseph S. DiMartino (62) |
| Chairman of the Board (1995) |
| Principal Occupation During Past 5 Years: |
| • Corporate Director and Trustee |
| Other Board Memberships and Affiliations: |
| • The Muscular Dystrophy Association, Director |
| • Levcor International, Inc., an apparel fabric processor, Director |
| • Century Business Services, Inc., a provider of outsourcing functions for small and medium size |
| companies, Director |
| • The Newark Group, a provider of a national market of paper recovery facilities, paperboard |
| mills and paperboard converting plants, Director |
| • Sunair Services Corporation, engages in the design, manufacture and sale of high frequency |
| systems for long-range voice and data communications, as well as providing certain outdoor- |
| related services to homes and businesses, Director |
| No. of Portfolios for which Board Member Serves: 193 |
| ——————— |
| Gordon J. Davis (64) |
| Board Member (1993) |
| Principal Occupation During Past 5 Years: |
| • Partner in the law firm of LeBoeuf, Lamb, Greene & MacRae, LLP |
| • President, Lincoln Center for the Performing Arts, Inc. (2001) |
| Other Board Memberships and Affiliations: |
| • Consolidated Edison, Inc., a utility company, Director |
| • Phoenix Companies Inc., a life insurance company, Director |
| • Board Member/Trustee for several not-for-profit groups |
| No. of Portfolios for which Board Member Serves: 26 |
| ——————— |
| David P. Feldman (66) |
| Board Member (1987) |
| Principal Occupation During Past 5 Years: |
| • Corporate Director and Trustee |
| Other Board Memberships and Affiliations: |
| • BBH Mutual Funds Group (11 funds), Director |
| • The Jeffrey Company, a private investment company, Director |
| • QMED, a medical device company, Director |
| No. of Portfolios for which Board Member Serves: 58 |
| ——————— |
| Lynn Martin (66) |
| Board Member (1993) |
| Principal Occupation During Past 5 Years: |
| • Advisor to the international accounting firm of Deloitte & Touche, LLP and Chair to its |
| Council for the Advancement of Women |
| Other Board Memberships and Affiliations: |
| • SBC Communications, Inc., Director |
| • Ryder System, Inc., a supply chain and transportation management company, Director |
| • The Proctor & Gamble Co., a consumer products company, Director |
| • Constellation Energy Group, Director |
| • Member of the Council of Foreign Relations |
| No. of Portfolios for which Board Member Serves: 11 |
| Daniel Rose (76) |
| Board Member (1992) |
| Principal Occupation During Past 5 Years: |
| • Chairman and Chief Executive Officer of Rose Associates, Inc., a New York based real estate |
| development and management firm |
| Other Board Memberships and Affiliations: |
| • Baltic-American Enterprise Fund,Vice Chairman and Director |
| • Harlem Educational Activities Fund, Inc., Chairman |
| • Housing Committee of the Real Estate Board of New York, Inc., Director |
| No. of Portfolios for which Board Member Serves: 22 |
| ——————— |
| Philip L. Toia (72) |
| Board Member (1997) |
| Principal Occupation During Past 5 Years: |
| • Retired |
| No. of Portfolios for which Board Member Serves: 11 |
| ——————— |
| Sander Vanocur (77) |
| Board Member (1992) |
| Principal Occupation During Past 5 Years: |
| • President, Old Owl Communications |
| No. of Portfolios for which Board Member Serves: 22 |
| ——————— |
| Anne Wexler (75) |
| Board Member (1994) |
| Principal Occupation During Past 5 Years: |
| • Chairman of the Wexler & Walker Public Policy Associates, consultants specializing in govern- |
| ment relations and public affairs |
| Other Board Memberships and Affiliations: |
| • Wilshire Mutual Funds (5 funds), Director |
| • Methanex Corporation, a methanol producing company, Director |
| • Member of the Council of Foreign Relations |
| • Member of the National Park Foundation |
| No. of Portfolios for which Board Member Serves: 36 |
| ——————— |
| Once elected all Board Members serve for an indefinite term.The address of the Board Members and Officers is in c/o |
| The Dreyfus Corporation, 200 Park Avenue, New York, New York 10166. Additional information about the Board |
| Members is available in the fund’s Statement of Additional Information which can be obtained from Dreyfus free of |
| charge by calling this toll free number: 1-800-554-4611. |
| |
| |
| T h e F u n d 37 |
O F F I C E R S O F T H E F U N D ( U n a u d i t e d )
| STEPHEN E. CANTER, President since |
| March 2000. |
Chairman of the Board, Chief Executive Officer and Chief Operating Officer of the Manager, and an officer of 90 investment companies (comprised of 184 portfolios) managed by the Manager. Mr. Canter also is a Board member and, where applicable, an Executive Committee Member of the other investment management subsidiaries of Mellon Financial Corporation, each of which is an affiliate of the Manager. He is 60 years old and has been an employee of the Manager since May 1995.
| STEPHEN R. BYERS, Executive Vice |
| President since November 2002. |
Chief Investment Officer,Vice Chairman and a director of the Manager, and an officer of 90 investment companies (comprised of 184 portfolios) managed by the Manager. Mr. Byers also is an officer, director or an Executive Committee Member of certain other investment management subsidiaries of Mellon Financial Corporation, each of which is an affiliate of the Manager. He is 52 years old and has been an employee of the Manager since January 2000.
| MARK N. JACOBS, Vice President since |
| March 2000. |
Executive Vice President, Secretary and General Counsel of the Manager, and an officer of 91 investment companies (comprised of 200 portfolios) managed by the Manager. He is 59 years old and has been an employee of the Manager since June 1977.
| MICHAEL A. ROSENBERG, Vice President |
| and Secretary since August 2005. |
Associate General Counsel of the Manager, and an officer of 91 investment companies (comprised of 200 portfolios) managed by the Manager. He is 45 years old and has been an employee of the Manager since October 1991.
| JAMES BITETTO, Vice President and |
| Assistant Secretary since August 2005. |
Assistant General Counsel and Assistant Secretary of the Manager, and an officer of 91 investment companies (comprised of 200 portfolios) managed by the Manager. He is 39 years old and has been an employee of the Manager since December 1996.
| JONI LACKS CHARATAN, Vice President |
| and Assistant Secretary since |
| August 2005. |
Associate General Counsel of the Manager, and an officer of 91 investment companies (comprised of 200 portfolios) managed by the Manager. She is 50 years old and has been an employee of the Manager since October 1988.
| JOSEPH M. CHIOFFI, Vice President and |
| Assistant Secretary since August 2005. |
Assistant General Counsel of the Manager, and an officer of 91 investment companies (comprised of 200 portfolios) managed by the Manager. He is 44 years old and has been an employee of the Manager since June 2000.
| JANETTE E. FARRAGHER, Vice President |
| and Assistant Secretary since |
| August 2005. |
Associate General Counsel of the Manager, and an officer of 91 investment companies (comprised of 200 portfolios) managed by the Manager. She is 43 years old and has been an employee of the Manager since February 1984.
| JOHN B. HAMMALIAN, Vice President and |
| Assistant Secretary since August 2005. |
Associate General Counsel of the Manager, and an officer of 91 investment companies (comprised of 200 portfolios) managed by the Manager. He is 42 years old and has been an employee of the Manager since February 1991.
| ROBERT R. MULLERY, Vice President and |
| Assistant Secretary since August 2005. |
Associate General Counsel of the Manager, and an officer of 91 investment companies (comprised of 200 portfolios) managed by the Manager. He is 53 years old and has been an employee of the Manager since May 1986.
| JEFF PRUSNOFSKY, Vice President and |
| Assistant Secretary since August 2005. |
Associate General Counsel of the Manager, and an officer of 91 investment companies (comprised of 200 portfolios) managed by the Manager. He is 40 years old and has been an employee of the Manager since October 1990.
| JAMES WINDELS, Treasurer since |
| November 2001. |
Director – Mutual Fund Accounting of the Manager, and an officer of 91 investment companies (comprised of 200 portfolios) managed by the Manager. He is 47 years old and has been an employee of the Manager since April 1985.
| ERIK D. NAVILOFF, Assistant Treasurer |
| since August 2005. |
Senior Accounting Manager – Taxable Fixed Income Funds of the Manager, and an officer of 91 investment companies (comprised of 200 portfolios) managed by the Manager. He is 37 years old and has been an employee of the Manager since November 1992.
| ROBERT ROBOL, Assistant Treasurer |
| since August 2005. |
Senior Accounting Manager – Money Market and Municipal Bond Funds of the Manager, and an officer of 91 investment companies (comprised of 200 portfolios) managed by the Manager. He is 41 years old and has been an employee of the Manager since October 1988.
| ROBERT SVAGNA, Assistant Treasurer |
| since August 2005. |
Senior Accounting Manager – Equity Funds of the Manager, and an officer of 91 investment companies (comprised of 200 portfolios) managed by the Manager. He is 38 years old and has been an employee of the Manager since November 1990.
| GAVIN C. REILLY, Assistant Treasurer |
| since December 2005. |
Tax Manager of the Investment Accounting and Support Department of the Manager, and an officer of 91 investment companies (comprised of 200 portfolios) managed by the Manager. He is 37 years old and has been an employee of the Manager since April 1991.
| JOSEPH W. CONNOLLY, Chief Compliance |
| Officer since October 2004. |
Chief Compliance Officer of the Manager and The Dreyfus Family of Funds (91 investment companies, comprised of 200 portfolios). From November 2001 through March 2004, Mr. Connolly was first Vice-President, Mutual Fund Servicing for Mellon Global Securities Services. In that capacity, Mr. Connolly was responsible for managing Mellon’s Custody, Fund Accounting and Fund Administration services to third-party mutual fund clients. He is 48 years old and has served in various capacities with the Manager since 1980, including manager of the firm’s Fund Accounting Department from 1997 through October 2001.
| WILLIAM GERMENIS, Anti-Money |
| Laundering Compliance Officer since |
| September 2002. |
Vice President and Anti-Money Laundering Compliance Officer of the Distributor, and the Anti-Money Laundering Compliance Officer of 87 investment companies (comprised of 196 portfolios) managed by the Manager. He is 35 years old and has been an employee of the Distributor since October 1998.
| Dreyfus Premier |
| New Jersey |
| Municipal Bond Fund, Inc. |
| 200 Park Avenue |
| New York, NY 10166 |
| |
| Manager |
| The Dreyfus Corporation |
| 200 Park Avenue |
| New York, NY 10166 |
| |
| Custodian |
| The Bank of New York |
| One Wall Street |
| New York, NY 10286 |
| Transfer Agent & |
| Dividend Disbursing Agent |
| Dreyfus Transfer, Inc. |
| 200 Park Avenue |
| New York, NY 10166 |
| |
| Distributor |
| Dreyfus Service Corporation |
| 200 Park Avenue |
| New York, NY 10166 |
Telephone Call your financial representative or 1-800-554-4611
| Mail | | The Dreyfus Premier Family of Funds |
| | | 144 Glenn Curtiss Boulevard, Uniondale, NY 11556-0144 |
The fund files its complete schedule of portfolio holdings with the Securities and Exchange Commission (“SEC”) for the first and third quarters of each fiscal year on Form N-Q. The fund's Forms N-Q are available on the SEC’s website at http://www.sec.gov and may be reviewed and copied at the SEC’s Public Reference Room in Washington, DC. Information on the operation of the Public Reference Room may be obtained by calling 1-800-SEC-0330.
Information regarding how the fund voted proxies relating to portfolio securities for the 12-month period ended June 30, 2005, is available on the SEC’s website at http://www.sec.gov and without charge, upon request, by calling 1-800-645-6561.
© 2006 Dreyfus Service Corporation

The Registrant has adopted a code of ethics that applies to the Registrant's principal executive officer, principal financial officer, principal accounting officer or controller, or persons performing similar functions. There have been no amendments to, or waivers in connection with, the Code of Ethics during the period covered by this Report.
| Item 3. | | Audit Committee Financial Expert. |
The Registrant's Board has determined that David P. Feldman, a member of the Audit Committee of the Board, is an audit committee financial expert as defined by the Securities and Exchange Commission (the "SEC"). David P. Feldman is "independent" as defined by the SEC for purposes of audit committee financial expert determinations.
| Item 4. | | Principal Accountant Fees and Services |
(a) Audit Fees. The aggregate fees billed for each of the last two fiscal years (the "Reporting Periods") for professional services rendered by the Registrant's principal accountant (the "Auditor") for the audit of the Registrant's annual financial statements, or services that are normally provided by the Auditor in connection with the statutory and regulatory filings or engagements for the Reporting Periods, were $32,550 in 2004 and $35,285 in 2005.
(b) Audit-Related Fees. The aggregate fees billed in the Reporting Periods for assurance and related services by the Auditor that are reasonably related to the performance of the audit of the Registrant's financial statements and are not reported under paragraph (a) of this Item 4 were $0 in 2004 and $0 in 2005.
The aggregate fees billed in the Reporting Periods for non-audit assurance and related services by the Auditor to the Registrant's investment adviser (not including any sub-investment adviser whose role is primarily portfolio management and is subcontracted with or overseen by another investment adviser), and any entity controlling, controlled by or under common control with the investment adviser that provides ongoing services to the Registrant ("Service Affiliates"), that were reasonably related to the performance of the annual audit of the Service Affiliate, which required pre-approval by the Audit Committee were $0 in 2004 and $0 in 2005.
Note: For the second paragraph in each of (b) through (d) of this Item 4, certain of such services were not pre-approved prior to May 6, 2003, when such services were required to be pre-approved. On and after May 6, 2003, 100% of all services provided by the Auditor were pre-approved as required. For comparative purposes, the fees shown assume that all such services were pre-approved, including services that were not pre-approved prior to the compliance date of the pre-approval requirement.
(c) Tax Fees. The aggregate fees billed in the Reporting Periods for professional services rendered by the Auditor for tax compliance, tax advice and tax planning ("Tax Services") were $2,577 in 2004 and $2,814 in 2005. These services consisted of (i) review or preparation of U.S. federal, state, local and excise tax returns; (ii) U.S. federal, state and local tax planning, advice and assistance regarding statutory, regulatory or administrative developments, (iii) tax advice regarding tax qualification matters and/or treatment of various
financial instruments held or proposed to be acquired or held, and (iv) determination of Passive Foreign Investment Companies (as applicable).
The aggregate fees billed in the Reporting Periods for Tax Services by the Auditor to Service Affiliates which required pre-approval by the Audit Committee were $0 in 2004 and $0 in 2005.
(d) All Other Fees. The aggregate fees billed in the Reporting Periods for products and services provided by the Auditor, other than the services reported in paragraphs (a) through (c) of this Item, were less than $600 in 2004 and $326 in 2005. These services consisted of a review of the Registrant's anti-money laundering program.
The aggregate fees billed in the Reporting Periods for Non-Audit Services by the Auditor to Service Affiliates, other than the services reported in paragraphs (b) through (c) of this Item, which required pre-approval by the Audit Committee were $0 in 2004 and $0 in 2005.
Audit Committee Pre-Approval Policies and Procedures. The Registrant's Audit Committee has established policies and procedures (the "Policy") for pre-approval (within specified fee limits) of the Auditor's engagements for non-audit services to the Registrant and Service Affiliates without specific case-by-case consideration. Pre-approval considerations include whether the proposed services are compatible with maintaining the Auditor's independence. Pre-approvals pursuant to the Policy are considered annually.
Non-Audit Fees. The aggregate non-audit fees billed by the Auditor for services rendered to the Registrant, and rendered to Service Affiliates, for the Reporting Periods were $592,101 in 2004 and $758,091 in 2005.
Auditor Independence. The Registrant's Audit Committee has considered whether the provision of non-audit services that were rendered to Service Affiliates which were not pre-approved (not requiring pre-approval) is compatible with maintaining the Auditor's independence.
| Item 5. | | Audit Committee of Listed Registrants. |
| | | Not applicable. |
| Item 6. | | Schedule of Investments. |
| | | Not applicable. |
| Item 7. | | Disclosure of Proxy Voting Policies and Procedures for Closed-End Management |
| | | Investment Companies. |
| | | Not applicable. |
| Item 8. | | Portfolio Managers of Closed-End Management Investment Companies. |
| | | Not applicable. |
| Item 9. | | Purchases of Equity Securities by Closed-End Management Investment Companies and |
| | | Affiliated Purchasers. |
| | | Not applicable. |
| Item 10. | | Submission of Matters to a Vote of Security Holders. |
The Registrant has a Nominating Committee (the "Committee"), which is responsible for selecting and nominating persons for election or appointment by the Registrant's Board as Board members. The Committee has adopted a Nominating Committee Charter (the "Charter"). Pursuant to the Charter, the Committee will consider recommendations for nominees from shareholders submitted to the Secretary of the Registrant, c/o The Dreyfus Corporation Legal Department, 200 Park Avenue, 8th Floor East, New York, New York 10166. A nomination submission must include information regarding the recommended nominee as specified in the Charter. This information includes all information relating to a recommended nominee that is required to be disclosed in solicitations or proxy statements for the election of Board members, as well as information sufficient to evaluate the factors to be considered by the Committee, including character and integrity, business and professional experience, and whether the person has the ability to apply sound and independent business judgment and would act in the interests of the Registrant and its shareholders.
Nomination submissions are required to be accompanied by a written consent of the individual to stand for election if nominated by the Board and to serve if elected by the shareholders, and such additional information must be provided regarding the recommended nominee as reasonably requested by the Committee.
| Item 11. | | Controls and Procedures. |
(a) The Registrant's principal executive and principal financial officers have concluded, based on their evaluation of the Registrant's disclosure controls and procedures as of a date within 90 days of the filing date of this report, that the Registrant's disclosure controls and procedures are reasonably designed to ensure that information required to be disclosed by the Registrant on Form N-CSR is recorded, processed, summarized and reported within the required time periods and that information required to be disclosed by the Registrant in the reports that it files or submits on Form N-CSR is accumulated and communicated to the Registrant's management, including its principal executive and principal financial officers, as appropriate to allow timely decisions regarding required disclosure.
(b) There were no changes to the Registrant's internal control over financial reporting that occurred during the second fiscal quarter of the period covered by this report that have materially affected, or are reasonably likely to materially affect, the Registrant's internal control over financial reporting.
| (a)(1) | | Code of ethics referred to in Item 2. |
| (a)(2) | | Certifications of principal executive and principal financial officers as required by Rule 30a-2(a) |
| under the Investment Company Act of 1940. |
| (a)(3) | | Not applicable. |
| (b) | | Certification of principal executive and principal financial officers as required by Rule 30a-2(b) |
| under the Investment Company Act of 1940. |
Pursuant to the requirements of the Securities Exchange Act of 1934 and the Investment Company Act of 1940, the Registrant has duly caused this Report to be signed on its behalf by the undersigned, thereunto duly authorized.
DREYFUS PREMIER NEW JERSEY MUNICIPAL BOND FUND, INC.

Pursuant to the requirements of the Securities Exchange Act of 1934 and the Investment Company Act of 1940, this Report has been signed below by the following persons on behalf of the Registrant and in the capacities and on the dates indicated.

| | | EXHIBIT INDEX |
| (a)(1) | | Code of ethics referred to in Item 2. |
| (a)(2) | | Certifications of principal executive and principal financial officers as required by Rule 30a- |
| 2(a) under the Investment Company Act of 1940. (EX-99.CERT) |
| (b) | | Certification of principal executive and principal financial officers as required by Rule 30a- |
| 2(b) under the Investment Company Act of 1940. (EX-99.906CERT) |