| | | UNITED STATES |
| | | SECURITIES AND EXCHANGE COMMISSION |
| | | Washington, D.C. 20549 |
| |
| |
| | | FORM N-CSR |
| |
| CERTIFIED SHAREHOLDER REPORT OF REGISTERED MANAGEMENT |
| | | INVESTMENT COMPANIES |
| |
| Investment Company Act file number 811-5454 |
| |
| DREYFUS PREMIER NEW JERSEY MUNICIPAL BOND FUND, INC. |
| | | (Exact name of Registrant as specified in charter) |
| |
| |
| | | c/o The Dreyfus Corporation |
| | | 200 Park Avenue |
| | | New York, New York 10166 |
| | | (Address of principal executive offices) (Zip code) |
| |
| | | Mark N. Jacobs, Esq. |
| | | 200 Park Avenue |
| | | New York, New York 10166 |
| | | (Name and address of agent for service) |
| |
| Registrant's telephone number, including area code: (212) 922-6000 |
| |
| Date of fiscal year end: | | 12/31 |
| |
| Date of reporting period: | | 12/31/06 |
| | | | | FORM N-CSR |
| Item 1. | | Reports to Stockholders. | | |
Save time. Save paper. View your next shareholder report online as soon as it’s available. Log into www.dreyfus.com and sign up for Dreyfus eCommunications. It’s simple and only takes a few minutes.
The views expressed in this report reflect those of the portfolio manager only through the end of the period covered and do not necessarily represent the views of Dreyfus or any other person in the Dreyfus organization. Any such views are subject to change at any time based upon market or other conditions and Dreyfus disclaims any responsibility to update such views.These views may not be relied on as investment advice and, because investment decisions for a Dreyfus fund are based on numerous factors, may not be relied on as an indication of trading intent on behalf of any Dreyfus fund.
Not FDIC-Insured • Not Bank-Guaranteed • May Lose Value
| Contents |
| |
| | | THE FUND |
| |
|
| 2 | | A Letter from the CEO |
| 3 | | Discussion of Fund Performance |
| 6 | | Fund Performance |
| 8 | | Understanding Your Fund’s Expenses |
| 8 | | Comparing Your Fund’s Expenses |
| With Those of Other Funds |
| 9 | | Statement of Investments |
| 21 | | Statement of Assets and Liabilities |
| 22 | | Statement of Operations |
| 23 | | Statement of Changes in Net Assets |
| 25 | | Financial Highlights |
| 28 | | Notes to Financial Statements |
| 38 | | Report of Independent Registered |
| | | Public Accounting Firm |
| 39 | | Important Tax Information |
| 40 | | Board Members Information |
| 43 | | Officers of the Fund |
| |
| FOR MORE INFORMATION |
|
| | | Back Cover |

We are pleased to present this annual report for Dreyfus Premier New Jersey Municipal Bond Fund, Inc., covering the 12-month period from January 1, 2006, through December 31, 2006.
In 2006, the tax-exempt bond market achieved its seventh consecutive year of positive absolute returns, as measured by the performance of the Lehman Brothers Municipal Bond Index.Yet, a number of developments during the year might have suggested otherwise, including mounting economic uncertainty,volatile energy prices,softening real estate markets, a change in U.S. monetary policy and ongoing geopolitical turmoil.
Why did municipal bond investors appear to shrug off some of the year’s more negative influences? In our analysis, investors disregarded near-term concerns in favor of a longer view, looking to broader trends that showed moderately slower economic growth, subdued inflation, stabilizing short-term interest rates, a flat “yield curve” and strong fiscal conditions for most states and municipalities. Indeed, 2006 confirmed that reacting to near-term influences with extreme shifts in investment strategy rarely is the right decision.We believe that a better course is to set a portfolio mix to meet long-term goals, while attempting to ignore short term market fluctuations.
For information about how the fund performed during the reporting period, as well as market perspectives, we have provided a Discussion of Fund Performance given by the fund’s portfolio manager.
Thank you for your continued confidence and support.We wish you good health and prosperity in 2007.
| Thomas F. Eggers |
| Chief Executive Officer |
| The Dreyfus Corporation |
| January 16, 2007 |

DISCUSSION OF FUND PERFORMANCE
W. Michael Petty, Portfolio Manager
How did Dreyfus Premier New Jersey Municipal Bond Fund perform relative to its benchmark?
For the 12-month period ended December 31, 2006, the fund achieved total returns of 4.00% for Class A shares, 3.56% for Class B shares and 3.22% for Class C shares.1 In comparison, the Lehman Brothers Municipal Bond Index (the “Index”), the fund’s benchmark, achieved a total return of 4.84% for the reporting period.2
After producing lackluster returns over the first half of 2006, municipal bonds generally rallied over the second half as short-term interest rates stabilized and inflation concerns waned. The fund’s returns lagged its benchmark, primarily due to its relatively short average duration.
What is the fund’s investment approach?
The fund seeks as high a level of current income exempt from federal and New Jersey income taxes as is consistent with the preservation of capital.
To pursue this goal, the fund normally invests at least 80% of its assets in municipal bonds that provide income exempt from federal and New Jersey personal income taxes.The fund invests at least 80% of its assets in investment-grade municipal bonds or the unrated equivalent as determined by Dreyfus.The fund may invest up to 20% of its assets in municipal bonds rated below investment grade (“high yield” or “junk” bonds) or the unrated equivalent as determined by Dreyfus. The dollar-weighted average maturity of the fund’s portfolio normally exceeds 10 years.
We may buy and sell bonds based on credit quality, market outlook and yield potential. In selecting municipal bonds for investment, we may assess the current interest-rate environment and the municipal bond’s potential volatility in different rate environments.We focus on bonds with the potential to offer attractive current income, typically looking for bonds that can provide consistently attractive current
The Fund 3
DISCUSSION OF FUND PERFORMANCE (continued)
yields or that are trading at competitive market prices.A portion of the fund’s assets may be allocated to “discount” bonds, which are bonds that sell at a price below their face value, or to “premium” bonds, which are bonds that sell at a price above their face value.The fund’s allocation to either discount bonds or to premium bonds will change along with our changing views of the current interest-rate and market environment.We also may look to select bonds that are most likely to obtain attractive prices when sold.
What other factors influenced the fund’s performance?
Although heightened market volatility limited returns over the first half of 2006, the municipal bond market generally rallied over the second half as energy prices declined, the rate of U.S. economic growth slowed and investors became less concerned about inflation. The Federal Reserve Board (the “Fed”) lent credence to a more benign inflation outlook when, after more than two years of steady rate hikes, it held short-term interest rates unchanged between July and December.
Favorable supply-and-demand factors also supported municipal bond prices. Like most states, New Jersey received more tax revenue than originally projected, reducing its need to borrow. Consequently, the supply of new municipal bonds fell compared to the same period one year earlier.Yet, demand remained robust from investors seeking competitive levels of tax-free income.
While the fund participated to a degree in the market’s rally over the second half of the year, its returns were held back by its average duration, which remained shorter than industry averages despite a gradual increase over the course of the year.The fund’s relatively short average duration was primarily a result of seasoned holdings that were purchased at higher yields than are available from comparable securities in today’s market. Over time, these bonds moved closer to their final maturities, putting downward pressure on the fund’s average duration.Yet, because of their relatively generous income characteristics, it has made little sense to replace these securities at current market levels.
In addition, the fund’s returns were undermined by a bankruptcy affecting one of the fund’s seasoned corporate-backed holdings. However, the effects of this default were offset somewhat by above-average returns from other holdings, including tax-exempt zero-coupon bonds, bonds issued to finance health care facilities and utilities, and municipal bonds backed by New Jersey’s settlement of litigation with U.S. tobacco companies.
What is the fund’s current strategy?
We believe that the fund’s relatively short average duration positions it well for 2007. In the wake of the market’s rally, yield differences along the municipal bond market’s maturity spectrum ended 2006 near historically narrow levels. Consequently, it appears to us that further substantial gains at the long end of the range are unlikely. Conversely, the fund’s shorter-term holdings could benefit if yield differences begin to widen later in the year. In the meantime, we expect the Fed to remain on hold for the foreseeable future, which may foster an environment in which the fund’s attractive income characteristics drive returns.
January 16, 2007
| 1 | | Total return includes reinvestment of dividends and any capital gains paid and does not take into |
| | | consideration the maximum initial sales charge in the case of Class A shares or the applicable |
| | | contingent deferred sales charges imposed on redemptions in the case of Class B and Class C |
| | | shares. Had these charges been reflected, returns would have been lower. Each share class is subject |
| | | to a different sales charge and distribution expense structure and will achieve different returns. Past |
| | | performance is no guarantee of future results. Share price, yield and investment return fluctuate |
| | | such that upon redemption, fund shares may be worth more or less than their original cost. Income |
| | | may be subject to state and local taxes for non-New Jersey residents, and some income may be |
| | | subject to the federal alternative minimum tax (AMT) for certain investors. Capital gains, if any, |
| | | are fully taxable. Return figures provided reflect the absorption of certain fund expenses by The |
| | | Dreyfus Corporation pursuant to an agreement, which may be terminated upon 90 days’ notice to |
| | | shareholders. Had these expenses not been absorbed, the fund’s returns would have been lower. |
| 2 | | SOURCE: LIPPER INC. — Reflects reinvestment of dividends and, where applicable, capital |
| | | gain distributions.The Lehman Brothers Municipal Bond Index is a widely accepted, unmanaged |
| | | total return performance benchmark for the long-term, investment-grade, tax-exempt bond market. |
| | | Index returns do not reflect fees and expenses associated with operating a mutual fund. |
The Fund 5
FUND PERFORMANCE
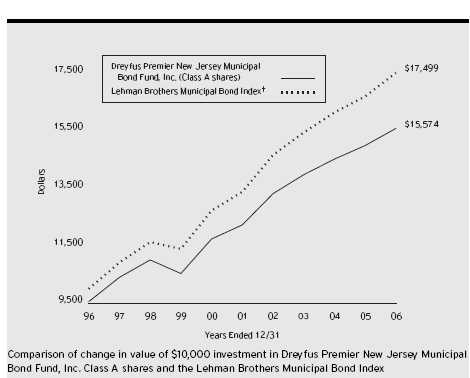
† Source: Lipper Inc.
Past performance is not predictive of future performance.
The above graph compares a $10,000 investment made in Class A shares of Dreyfus Premier New Jersey Municipal Bond Fund, Inc. on 12/31/96 to a $10,000 investment made in the Lehman Brothers Municipal Bond Index (the “Index”) on that date. All dividends and capital gain distributions are reinvested. Performance for Class B and Class C shares will vary from the performance of Class A shares shown above due to differences in charges and expenses. The fund invests primarily in New Jersey municipal securities and its performance shown in the line graph takes into account the maximum initial sales charge on Class A shares and all applicable fees and expenses.The Index is not limited to investments in New Jersey municipal obligations and does not take into account charges, fees and other expenses.The Index is an unmanaged total return performance benchmark for the long-term, investment-grade, geographically unrestricted tax-exempt bond market, calculated by using municipal bonds selected to be representative of the municipal market overall.These factors can contribute to the Index potentially outperforming or underperforming the fund. Further information relating to fund performance, including expense reimbursements, if applicable, is contained in the Financial Highlights section of the prospectus and elsewhere in this report.
| Average Annual Total Returns | | as of 12/31/06 | | | | | | |
| |
| | | Inception | | | | | | | | From |
| | | Date | | 1 Year | | 5 Years | | 10 Years | | Inception |
| |
| |
| |
| |
| |
|
| Class A shares | | | | | | | | | | |
| with maximum sales charge (4.5%) | | | | (0.70)% | | 4.00% | | 4.53% | | |
| without sales charge | | | | 4.00% | | 4.96% | | 5.01% | | |
| Class B shares | | | | | | | | | | |
| with applicable redemption charge † | | 1/7/03 | | (0.43)% | | — | | — | | 3.01% |
| without redemption | | 1/7/03 | | 3.56% | | — | | — | | 3.69% |
| Class C shares | | | | | | | | | | |
| with applicable redemption charge †† | | 1/7/03 | | 2.22% | | — | | — | | 3.43% |
| without redemption | | 1/7/03 | | 3.22% | | — | | — | | 3.43% |
Past performance is not predictive of future performance.The fund’s performance shown in the graph and table does not reflect the deduction of taxes that a shareholder would pay on fund distributions or the redemption of fund shares.
| † | | The maximum contingent deferred sales charge for Class B shares is 4%. After six years Class B shares convert to |
| | | Class A shares. |
| †† | | The maximum contingent deferred sales charge for Class C shares is 1% for shares redeemed within one year of the |
| | | date of purchase. |
The Fund 7
UNDERSTANDING YOUR FUND’S EXPENSES (Unaudited)
As a mutual fund investor, you pay ongoing expenses, such as management fees and other expenses. Using the information below, you can estimate how these expenses affect your investment and compare them with the expenses of other funds.You also may pay one-time transaction expenses, including sales charges (loads) and redemption fees, which are not shown in this section and would have resulted in higher total expenses. For more information, see your fund’s prospectus or talk to your financial adviser.
Review your fund’s expenses
The table below shows the expenses you would have paid on a $1,000 investment in Dreyfus Premier New Jersey Municipal Bond Fund, Inc. from July 1, 2006 to December 31, 2006. It also shows how much a $1,000 investment would be worth at the close of the period, assuming actual returns and expenses.
| Expenses and Value of a $1,000 Investment | | | | |
| assuming actual returns for the six months ended December 31, 2006 | | |
| | | Class A | | Class B | | Class C |
| |
| |
| |
|
| Expenses paid per $1,000 † | | $ 5.44 | | $ 8.00 | | $ 9.28 |
| Ending value (after expenses) | | $1,037.60 | | $1,035.80 | | $1,033.70 |
COMPARING YOUR FUND’S EXPENSES WITH THOSE OF OTHER FUNDS (Unaudited)
Using the SEC’s method to compare expenses
The Securities and Exchange Commission (SEC) has established guidelines to help investors assess fund expenses. Per these guidelines, the table below shows your fund’s expenses based on a $1,000 investment, assuming a hypothetical 5% annualized return. You can use this information to compare the ongoing expenses (but not transaction expenses or total cost) of investing in the fund with those of other funds.All mutual fund shareholder reports will provide this information to help you make this comparison. Please note that you cannot use this information to estimate your actual ending account balance and expenses paid during the period.
Expenses and Value of a $1,000 Investment assuming a hypothetical 5% annualized return for the six months ended December 31, 2006
| | | Class A | | Class B | | Class C |
| |
| |
| |
|
| Expenses paid per $1,000 † | | $ 5.40 | | $ 7.93 | | $ 9.20 |
| Ending value (after expenses) | | $1,019.86 | | $1,017.34 | | $1,016.08 |
- Expenses are equal to the fund’s annualized expense ratio of 1.06% for Class A, 1.56% for Class B and 1.81% for Class C, multiplied by the average account value over the period, multiplied by 184/365 (to reflect the one-half year period).
| STATEMENT OF INVESTMENTS |
| December 31, 2006 |
| Long-Term Municipal | | Coupon | | Maturity | | Principal | | |
| Investments—104.3% | | Rate (%) | | Date | | Amount ($) | | Value ($) |
| |
| |
| |
| |
|
| New Jersey—101.2% | | | | | | | | |
| Atlantic County Utilities | | | | | | | | |
| Authority, Solid Waste | | | | | | | | |
| System Revenue | | 7.00 | | 3/1/08 | | 2,380,000 | | 2,426,743 |
| Atlantic County Utilities | | | | | | | | |
| Authority, Solid Waste | | | | | | | | |
| System Revenue | | 7.13 | | 3/1/16 | | 13,250,000 | | 13,524,275 |
| Bayonne Redevelopment Agency, | | | | | | |
| Revenue (Royal Caribbean | | | | | | | | |
| Project) | | 5.38 | | 11/1/35 | | 4,120,000 | | 4,316,936 |
| Bordentown Sewer Authority, | | | | | | | | |
| Revenue (Insured; FGIC) | | 5.38 | | 12/1/20 | | 3,880,000 | | 4,105,700 |
| Burlington County Bridge | | | | | | | | |
| Commission, LR County Guaranteed | | | | | | |
| (Government Leasing Project) | | 5.25 | | 8/15/21 | | 1,000,000 | | 1,064,980 |
| Camden | | | | | | | | |
| (Insured; FSA) | | 0.00 | | 2/15/12 | | 4,385,000 | | 3,628,017 |
| Camden County Improvement | | | | | | | | |
| Authority, Health Care | | | | | | | | |
| Redevelopment Project Revenue | | | | | | |
| (Cooper Health System | | | | | | | | |
| Obligated Group Issue) | | 5.25 | | 2/15/20 | | 4,545,000 | | 4,785,703 |
| Carteret Board of Education, | | | | | | | | |
| COP (Insured; MBIA) | | 6.00 | | 1/15/10 | | 440,000 a | | 473,774 |
| Delaware River and Bay Authority, | | | | | | |
| Revenue (Insured; MBIA) | | 5.00 | | 1/1/27 | | 3,220,000 | | 3,385,122 |
| East Orange | | | | | | | | |
| (Insured; FSA) | | 0.00 | | 8/1/10 | | 4,240,000 | | 3,722,508 |
| East Orange | | | | | | | | |
| (Insured; FSA) | | 0.00 | | 8/1/11 | | 2,500,000 | | 2,111,925 |
| East Orange Board of Education, | | | | | | | | |
| COP, LR (Insured; FSA) | | 0.00 | | 2/1/21 | | 685,000 | | 380,860 |
| East Orange Board of Education, | | | | | | | | |
| COP, LR (Insured; FSA) | | 0.00 | | 2/1/26 | | 745,000 | | 329,484 |
| East Orange Board of Education, | | | | | | | | |
| COP, LR (Insured; FSA) | | 0.00 | | 2/1/28 | | 2,345,000 | | 942,362 |
| Essex County Improvement | | | | | | | | |
| Authority, LR (County | | | | | | | | |
| Correctional Facility Project) | | | | | | | | |
| (Insured; FGIC) | | 6.00 | | 10/1/10 | | 10,000,000 a | | 10,822,600 |
The Fund 9
STATEMENT OF INVESTMENTS (continued)
| Long-Term Municipal | | Coupon | | Maturity | | Principal | | |
| Investments (continued) | | Rate (%) | | Date | | Amount ($) | | Value ($) |
| |
| |
| |
| |
|
| New Jersey (continued) | | | | | | | | |
| Gloucester Township Municipal | | | | | | | | |
| Utilities Authority, Sewer | | | | | | | | |
| Revenue (Insured; AMBAC) | | 5.65 | | 3/1/18 | | 2,530,000 | | 2,829,603 |
| Hudson County, | | | | | | | | |
| COP (Correctional Facilities) | | | | | | | | |
| (Insured; MBIA) | | 5.00 | | 12/1/21 | | 2,410,000 | | 2,573,470 |
| Hudson County Improvement | | | | | | | | |
| Authority, Harrison Stadium | | | | | | | | |
| Land Acquisition Special | | | | | | | | |
| Obligation Revenue (Harrison | | | | | | | | |
| Redevelopment Project) | | | | | | | | |
| (Insured; MBIA) | | 0.00 | | 12/15/34 | | 3,000,000 | | 866,790 |
| Hudson County Improvement | | | | | | | | |
| Authority, LR (County Services | | | | | | | | |
| Building Project) (Insured; AMBAC) | | 5.00 | | 4/1/35 | | 2,500,000 | | 2,639,050 |
| Jersey City | | | | | | | | |
| (Insured; FSA) | | 0.00 | | 5/15/10 | | 4,745,000 | | 4,195,102 |
| Jersey City, | | | | | | | | |
| GO (Fiscal Year Adjustment | | | | | | | | |
| Refunding Bonds) (Insured; AMBAC) | | 6.00 | | 10/1/08 | | 1,575,000 | | 1,641,244 |
| Jersey City, | | | | | | | | |
| GO (Fiscal Year Adjustment | | | | | | | | |
| Refunding Bonds) | | | | | | | | |
| (Insured; AMBAC) | | 6.00 | | 10/1/08 | | 915,000 | | 952,533 |
| Middlesex County Improvement | | | | | | | | |
| Authority, Utility System | | | | | | | | |
| Revenue (Perth Amboy Project) | | | | | | | | |
| (Insured; AMBAC) | | 0.00 | | 9/1/20 | | 3,745,000 | | 2,130,081 |
| Middlesex County Improvement | | | | | | | | |
| Authority, Utility System | | | | | | | | |
| Revenue (Perth Amboy Project) | | | | | | | | |
| (Insured; AMBAC) | | 0.00 | | 9/1/22 | | 4,740,000 | | 2,459,633 |
| New Jersey | | 6.00 | | 5/1/10 | | 3,695,000 a | | 3,967,211 |
| New Jersey | | | | | | | | |
| (Insured; MBIA) | | 6.00 | | 7/15/10 | | 7,400,000 | | 7,974,388 |
| New Jersey Economic Development | | | | | | | | |
| Authority, Cigarette Tax Revenue | | 5.75 | | 6/15/29 | | 2,500,000 | | 2,707,350 |
| New Jersey Economic Development | | | | | | | | |
| Authority, Department of | | | | | | | | |
| Human Services Composite | | | | | | | | |
| Revenue (Division of | | | | | | | | |
| Developmental Disabilities) | | 6.25 | | 7/1/24 | | 1,295,000 | | 1,405,969 |
| Long-Term Municipal | | Coupon | | Maturity | | Principal | | |
| Investments (continued) | | Rate (%) | | Date | | Amount ($) | | Value ($) |
| |
| |
| |
| |
|
| New Jersey (continued) | | | | | | | | |
| New Jersey Economic Development | | | | | | | | |
| Authority, Department of Human | | | | | | | | |
| Services Composite Revenue | | | | | | | | |
| (Division of Mental Health Services) | | 6.10 | | 7/1/17 | | 3,320,000 | | 3,576,503 |
| New Jersey Economic Development | | | | | | | | |
| Authority, District Heating | | | | | | | | |
| and Cooling Revenue | | | | | | | | |
| (Trigen-Trenton District | | | | | | | | |
| Energy Co. L.P. Project) | | 6.20 | | 12/1/07 | | 515,000 | | 516,710 |
| New Jersey Economic Development | | | | | | | | |
| Authority, District Heating | | | | | | | | |
| and Cooling Revenue | | | | | | | | |
| (Trigen-Trenton District | | | | | | | | |
| Energy Co. L.P. Project) | | 6.20 | | 12/1/10 | | 4,040,000 | | 4,082,097 |
| New Jersey Economic Development | | | | | | | | |
| Authority, EDR (American | | | | | | | | |
| Airlines, Inc. Project) | | 7.10 | | 11/1/31 | | 1,085,000 | | 1,086,628 |
| New Jersey Economic Development | | | | | | | | |
| Authority, EDR (Masonic | | | | | | | | |
| Charity Foundation of New | | | | | | | | |
| Jersey Project) | | 5.88 | | 6/1/18 | | 2,750,000 | | 2,991,560 |
| New Jersey Economic Development | | | | | | | | |
| Authority, EDR (Masonic | | | | | | | | |
| Charity Foundation of New | | | | | | | | |
| Jersey Project) | | 5.50 | | 6/1/21 | | 1,920,000 | | 2,057,722 |
| New Jersey Economic Development | | | | | | | | |
| Authority, EDR (Masonic | | | | | | | | |
| Charity Foundation of New | | | | | | | | |
| Jersey Project) | | 6.00 | | 6/1/25 | | 1,000,000 | | 1,100,290 |
| New Jersey Economic Development | | | | | | | | |
| Authority, EDR (Masonic | | | | | | | | |
| Charity Foundation of New | | | | | | | | |
| Jersey Project) | | 5.25 | | 6/1/32 | | 350,000 | | 373,145 |
| New Jersey Economic Development | | | | | | | | |
| Authority, First Mortgage Revenue | | | | | | | | |
| (Fellowship Village Project) | | 5.50 | | 1/1/18 | | 2,950,000 | | 3,014,192 |
| New Jersey Economic Development | | | | | | | | |
| Authority, First Mortgage Revenue | | | | | | | | |
| (Fellowship Village Project) | | 5.50 | | 1/1/25 | | 3,000,000 | | 3,053,490 |
| New Jersey Economic Development | | | | | | | | |
| Authority, First Mortgage | | | | | | | | |
| Revenue (The Evergreens) | | 6.00 | | 10/1/17 | | 650,000 | | 661,212 |
The Fund 11
STATEMENT OF INVESTMENTS (continued)
| Long-Term Municipal | | Coupon | | Maturity | | Principal | | |
| Investments (continued) | | Rate (%) | | Date | | Amount ($) | | Value ($) |
| |
| |
| |
| |
|
| New Jersey (continued) | | | | | | | | |
| New Jersey Economic Development | | | | | | | | |
| Authority, First Mortgage | | | | | | | | |
| Revenue (The Evergreens) | | 6.00 | | 10/1/22 | | 700,000 | | 712,068 |
| New Jersey Economic Development | | | | | | | | |
| Authority, Motor Vehicle Surcharge | | | | | | |
| Revenue (Insured; MBIA) | | 0.00 | | 7/1/20 | | 3,350,000 | | 1,918,545 |
| New Jersey Economic Development | | | | | | | | |
| Authority, Motor Vehicle Surcharge | | | | | | |
| Revenue (Insured; MBIA) | | 0.00 | | 7/1/21 | | 2,620,000 | | 1,431,647 |
| New Jersey Economic Development | | | | | | | | |
| Authority, Retirement | | | | | | | | |
| Community Revenue (Seabrook | | | | | | | | |
| Village, Inc. Facility) | | 5.25 | | 11/15/26 | | 1,700,000 | | 1,732,045 |
| New Jersey Economic Development | | | | | | | | |
| Authority, Revenue (Hillcrest | | | | | | | | |
| Health Service System Project) | | | | | | | | |
| (Insured; AMBAC) | | 0.00 | | 1/1/12 | | 1,000,000 | | 831,110 |
| New Jersey Economic Development | | | | | | | | |
| Authority, Revenue (Hillcrest | | | | | | | | |
| Health Service System Project) | | | | | | | | |
| (Insured; AMBAC) | | 0.00 | | 1/1/13 | | 1,000,000 | | 799,070 |
| New Jersey Economic Development | | | | | | | | |
| Authority, Revenue (Hillcrest | | | | | | | | |
| Health Service System Project) | | | | | | | | |
| (Insured; AMBAC) | | 0.00 | | 1/1/15 | | 3,250,000 | | 2,389,335 |
| New Jersey Economic Development | | | | | | | | |
| Authority, Revenue (Hillcrest | | | | | | | | |
| Health Service System Project) | | | | | | | | |
| (Insured; AMBAC) | | 0.00 | | 1/1/17 | | 5,000,000 | | 3,357,500 |
| New Jersey Economic Development | | | | | | | | |
| Authority, Revenue (Hillcrest | | | | | | | | |
| Health Service System Project) | | | | | | | | |
| (Insured; AMBAC) | | 0.00 | | 1/1/18 | | 2,500,000 | | 1,602,850 |
| New Jersey Economic Development | | | | | | | | |
| Authority, Revenue (Hillcrest | | | | | | | | |
| Health Service System Project) | | | | | | | | |
| (Insured; AMBAC) | | 0.00 | | 1/1/20 | | 6,500,000 | | 3,800,160 |
| New Jersey Economic Development | | | | | | | | |
| Authority, Revenue (Hillcrest | | | | | | | | |
| Health Service System Project) | | | | | | | | |
| (Insured; AMBAC) | | 0.00 | | 1/1/22 | | 6,000,000 | | 3,201,600 |
| Long-Term Municipal | | Coupon | | Maturity | | Principal | | |
| Investments (continued) | | Rate (%) | | Date | | Amount ($) | | Value ($) |
| |
| |
| |
| |
|
| New Jersey (continued) | | | | | | | | |
| New Jersey Economic Development | | | | | | | | |
| Authority, School Facilities | | | | | | | | |
| Construction Revenue | | | | | | | | |
| (Insured; AMBAC) | | 6.50 | | 6/15/18 | | 10,000,000 b,c | | 10,655,150 |
| New Jersey Economic Development | | | | | | | | |
| Authority, Special Facility Revenue | | | | | | |
| (Continental Airlines, Inc. Project) | | 6.25 | | 9/15/19 | | 5,000,000 | | 5,176,750 |
| New Jersey Economic Development | | | | | | | | |
| Authority, Special Facility | | | | | | | | |
| Revenue (Continental | | | | | | | | |
| Airlines, Inc. Project) | | 6.25 | | 9/15/29 | | 2,000,000 | | 2,065,160 |
| New Jersey Economic Development | | | | | | | | |
| Authority, State LR (State | | | | | | | | |
| Office Buildings Project) | | | | | | | | |
| (Insured; AMBAC) | | 6.00 | | 6/15/10 | | 2,425,000 a | | 2,609,906 |
| New Jersey Economic Development | | | | | | | | |
| Authority, State LR (State | | | | | | | | |
| Office Buildings Project) | | | | | | | | |
| (Insured; AMBAC) | | 6.13 | | 6/15/10 | | 7,535,000 a | | 8,138,629 |
| New Jersey Economic Development | | | | | | | | |
| Authority, Waste Paper | | | | | | | | |
| Recycling Revenue (Marcal | | | | | | | | |
| Paper Mills Inc. Project) | | 6.25 | | 2/1/09 | | 4,205,000 | | 4,200,248 |
| New Jersey Economic Development | | | | | | | | |
| Authority, Waste Paper | | | | | | | | |
| Recycling Revenue (Marcal | | | | | | | | |
| Paper Mills Inc. Project) | | 8.50 | | 2/1/10 | | 3,240,000 d | | 1,960,427 |
| New Jersey Educational Facilities | | | | | | | | |
| Authority, Revenue (Fairleigh | | | | | | | | |
| Dickenson University Issue) | | 6.00 | | 7/1/20 | | 2,535,000 | | 2,818,388 |
| New Jersey Educational Facilities | | | | | | | | |
| Authority, Revenue (Public | | | | | | | | |
| Library Project) (Insured; AMBAC) | | 5.00 | | 9/1/22 | | 5,500,000 | | 5,793,480 |
| New Jersey Educational Facilities | | | | | | | | |
| Authority, Revenue (Ramapo | | | | | | | | |
| College of New Jersey Issue) | | | | | | | | |
| (Insured; AMBAC) | | 4.25 | | 7/1/36 | | 2,000,000 | | 1,923,520 |
| New Jersey Educational Facilities | | | | | | | | |
| Authority, Revenue (Rowan | | | | | | | | |
| University Issue) (Insured; FGIC) | | 5.75 | | 7/1/10 | | 15,405,000 a | | 16,468,253 |
The Fund 13
STATEMENT OF INVESTMENTS (continued)
| Long-Term Municipal | | Coupon | | Maturity | | Principal | | |
| Investments (continued) | | Rate (%) | | Date | | Amount ($) | | Value ($) |
| |
| |
| |
| |
|
| New Jersey (continued) | | | | | | | | |
| New Jersey Educational Facilities | | | | | | | | |
| Authority, Revenue (Rowan | | | | | | | | |
| University Issue) (Insured; MBIA) | | 5.00 | | 7/1/34 | | 8,750,000 | | 9,231,250 |
| New Jersey Educational Facilities | | | | | | | | |
| Authority, Revenue (Stevens | | | | | | | | |
| Institute of Technology Issue) | | 5.38 | | 7/1/34 | | 2,500,000 | | 2,642,100 |
| New Jersey Environmental | | | | | | | | |
| Infrastructure Trust | | 5.25 | | 9/1/10 | | 4,070,000 a | | 4,329,503 |
| New Jersey Health Care Facilities | | | | | | | | |
| Financing Authority, Revenue | | | | | | | | |
| (Atlantic City Medical Center Issue) | | 6.00 | | 7/1/12 | | 3,000,000 | | 3,253,170 |
| New Jersey Health Care Facilities | | | | | | | | |
| Financing Authority, Revenue | | | | | | | | |
| (Atlantic City Medical Center Issue) | | 6.25 | | 7/1/17 | | 5,000,000 | | 5,570,600 |
| New Jersey Health Care Facilities | | | | | | | | |
| Financing Authority, Revenue | | | | | | | | |
| (Capital Health System | | | | | | | | |
| Obligated Group Issue) | | 5.75 | | 7/1/23 | | 3,000,000 | | 3,231,360 |
| New Jersey Health Care Facilities | | | | | | | | |
| Financing Authority, Revenue | | | | | | | | |
| (General Hospital Center at | | | | | | | | |
| Passaic, Inc. Obligated Group | | | | | | | | |
| Issue) (Insured; FSA) | | 6.75 | | 7/1/19 | | 550,000 | | 676,648 |
| New Jersey Health Care Facilities | | | | | | | | |
| Financing Authority, Revenue | | | | | | | | |
| (Raritan Bay Medical Center Issue) | | 7.25 | | 7/1/14 | | 2,410,000 | | 2,469,768 |
| New Jersey Health Care Facilities | | | | | | | | |
| Financing Authority, Revenue | | | | | | | | |
| (Saint Barnabas Health Care | | | | | | | | |
| System Issue) (Insured; MBIA) | | 0.00 | | 7/1/23 | | 5,500,000 | | 2,747,305 |
| New Jersey Health Care Facilities | | | | | | | | |
| Financing Authority, Revenue | | | | | | | | |
| (Saint Elizabeth Hospital | | | | | | | | |
| Obligated Group Issue) | | 6.00 | | 7/1/14 | | 2,500,000 | | 2,572,825 |
| New Jersey Health Care Facilities | | | | | | | | |
| Financing Authority, Revenue | | | | | | | | |
| (Saint Elizabeth Hospital | | | | | | | | |
| Obligated Group Issue) | | 6.00 | | 7/1/20 | | 3,120,000 | | 3,208,826 |
| New Jersey Higher Education | | | | | | | | |
| Assistance Authority, Student | | | | | | | | |
| Loan Revenue (Insured; MBIA) | | 6.13 | | 6/1/17 | | 330,000 | | 335,897 |
| Long-Term Municipal | | Coupon | | Maturity | | Principal | | |
| Investments (continued) | | Rate (%) | | Date | | Amount ($) | | Value ($) |
| |
| |
| |
| |
|
| New Jersey (continued) | | | | | | | | |
| New Jersey Highway Authority, | | | | | | | | |
| Revenue (Garden State Parkway) | | 6.00 | | 1/1/19 | | 6,645,000 | | 7,893,197 |
| New Jersey Housing and Mortgage | | | | | | | | |
| Finance Agency, Home Buyer | | | | | | | | |
| Revenue (Insured; MBIA) | | 5.75 | | 4/1/18 | | 1,650,000 | | 1,690,013 |
| New Jersey Housing and Mortgage | | | | | | | | |
| Finance Agency, Home Buyer | | | | | | | | |
| Revenue (Insured; MBIA) | | 5.30 | | 4/1/26 | | 1,480,000 | | 1,490,434 |
| New Jersey Housing and Mortgage | | | | | | | | |
| Finance Agency, MFHR (Insured: | | | | | | | | |
| AMBAC and FHA) | | 5.65 | | 5/1/40 | | 5,250,000 | | 5,403,457 |
| New Jersey Housing and Mortgage | | | | | | | | |
| Finance Agency, MFHR | | | | | | | | |
| (Insured; FSA) | | 5.70 | | 5/1/20 | | 2,640,000 | | 2,767,063 |
| New Jersey Housing and Mortgage | | | | | | | | |
| Finance Agency, MFHR | | | | | | | | |
| (Insured; FSA) | | 5.75 | | 5/1/25 | | 895,000 | | 933,610 |
| New Jersey Housing and Mortgage | | | | | | | | |
| Finance Agency, Multi-Family | | | | | | | | |
| Revenue (Insured; FGIC) | | 5.00 | | 11/1/36 | | 800,000 | | 823,720 |
| New Jersey Transit Corp., | | | | | | | | |
| Lease Purchase Agreement, COP | | | | | | | | |
| (Raymond Plaza East Inc.) | | | | | | | | |
| (Insured; FSA) | | 6.50 | | 4/1/07 | | 3,945,000 a | | 4,012,736 |
| New Jersey Transit Corp., | | | | | | | | |
| Master Lease Agreement, COP, | | | | | | | | |
| Federal Transit Administration | | | | | | | | |
| Grants (Insured; AMBAC) | | 5.75 | | 9/15/10 | | 5,000,000 a | | 5,354,750 |
| New Jersey Transportation | | | | | | | | |
| Trust Fund Authority | | | | | | | | |
| (Transportation System) | | 5.78 | | 6/15/09 | | 25,500,000 b,c | | 26,447,325 |
| New Jersey Transportation | | | | | | | | |
| Trust Fund Authority | | | | | | | | |
| (Transportation System) | | 5.00 | | 6/15/20 | | 4,000,000 | | 4,247,800 |
| New Jersey Transportation | | | | | | | | |
| Trust Fund Authority | | | | | | | | |
| (Transportation System) | | 5.50 | | 12/15/22 | | 10,000,000 | | 11,570,400 |
| New Jersey Transportation | | | | | | | | |
| Trust Fund Authority | | | | | | | | |
| (Transportation System) | | 5.50 | | 12/15/23 | | 7,000,000 | | 8,109,850 |
The Fund 15
STATEMENT OF INVESTMENTS (continued)
| Long-Term Municipal | | Coupon | | Maturity | | Principal | | |
| Investments (continued) | | Rate (%) | | Date | | Amount ($) | | Value ($) |
| |
| |
| |
| |
|
| New Jersey (continued) | | | | | | | | |
| New Jersey Transportation Trust | | | | | | | | |
| Fund Authority (Transportation | | | | | | | | |
| System) (Insured; FSA) | | 5.00 | | 6/15/20 | | 2,500,000 | | 2,682,550 |
| New Jersey Transportation Trust | | | | | | | | |
| Fund Authority (Transportation | | | | | | | | |
| System) (Insured; MBIA) | | 7.20 | | 12/15/11 | | 9,000,000 a,b,c | | 9,953,820 |
| New Jersey Transportation Trust | | | | | | | | |
| Fund Authority (Transportation | | | | | | | | |
| System) (Insured; MBIA) | | 7.20 | | 12/15/11 | | 8,000,000 a,b,c | | 8,847,840 |
| New Jersey Transportation Trust | | | | | | | | |
| Fund Authority (Transportation | | | | | | | | |
| System) (Insured; MBIA) | | 7.00 | | 6/15/12 | | 2,255,000 | | 2,620,468 |
| New Jersey Transportation Trust | | | | | | | | |
| Fund Authority (Transportation | | | | | | | | |
| System) (Insured; MBIA) | | 7.00 | | 6/15/12 | | 3,745,000 | | 4,340,118 |
| New Jersey Turnpike Authority, | | | | | | | | |
| Turnpike Revenue | | 6.50 | | 1/1/16 | | 60,000 | | 69,586 |
| New Jersey Turnpike Authority, | | | | | | | | |
| Turnpike Revenue | | 6.50 | | 1/1/16 | | 160,000 | | 186,547 |
| New Jersey Turnpike Authority, | | | | | | | | |
| Turnpike Revenue (Insured; FSA) | | 6.50 | | 1/1/16 | | 1,000,000 | | 1,166,660 |
| New Jersey Turnpike Authority, | | | | | | | | |
| Turnpike Revenue (Insured; MBIA) | | 6.50 | | 1/1/16 | | 1,210,000 | | 1,410,763 |
| New Jersey Turnpike Authority, | | | | | | | | |
| Turnpike Revenue (Insured; MBIA) | | 6.50 | | 1/1/16 | | 3,520,000 | | 4,101,750 |
| New Jersey Turnpike Authority, | | | | | | | | |
| Turnpike Revenue (Insured; MBIA) | | 6.50 | | 1/1/16 | | 17,935,000 | | 20,910,775 |
| North Hudson Sewer Authority, | | | | | | | | |
| Sewer Revenue (Insured; FGIC) | | 5.25 | | 8/1/19 | | 1,000,000 | | 1,072,100 |
| North Jersey District Water Supply | | | | | | | | |
| Commission, Sewer Revenue | | | | | | | | |
| (Wanaque South Project) | | | | | | | | |
| (Insured; MBIA) | | 6.00 | | 7/1/19 | | 2,000,000 | | 2,298,180 |
| Port Authority of New York and New | | | | | | | | |
| Jersey (Consolidated Bonds, | | | | | | | | |
| 119th Series) (Insured; FGIC) | | 5.50 | | 9/15/16 | | 4,650,000 | | 4,701,801 |
| Port Authority of New York and New | | | | | | | | |
| Jersey (Consolidated Bonds, | | | | | | | | |
| 121st Series) (Insured; MBIA) | | 5.38 | | 10/15/35 | | 14,950,000 | | 15,287,422 |
| Long-Term Municipal | | Coupon | | Maturity | | Principal | | |
| Investments (continued) | | Rate (%) | | Date | | Amount ($) | | Value ($) |
| |
| |
| |
| |
|
| New Jersey (continued) | | | | | | | | |
| Port Authority of New York and New | | | | | | |
| Jersey (Consolidated Bonds, | | | | | | | | |
| 132nd Series) | | 5.00 | | 9/1/33 | | 6,245,000 | | 6,585,665 |
| Port Authority of New York and New | | | | | | |
| Jersey, Special Obligation | | | | | | | | |
| Revenue (JFK International Air | | | | | | | | |
| Terminal LLC Project) | | | | | | | | |
| (Insured; MBIA) | | 6.25 | | 12/1/15 | | 5,000,000 | | 5,817,450 |
| South Jersey Transportation | | | | | | | | |
| Authority, Transportation | | | | | | | | |
| System Revenue | | | | | | | | |
| (Insured; FGIC) | | 5.00 | | 11/1/33 | | 2,500,000 | | 2,643,400 |
| Tobacco Settlement Financing Corp. | | | | | | |
| of New Jersey, Tobacco | | | | | | | | |
| Settlement Asset-Backed Bonds | | 5.75 | | 6/1/32 | | 7,580,000 | | 8,053,523 |
| Tobacco Settlement Financing Corp. | | | | | | |
| of New Jersey, Tobacco | | | | | | | | |
| Settlement Asset-Backed Bonds | | 6.38 | | 6/1/32 | | 8,745,000 | | 9,842,760 |
| Tobacco Settlement Financing Corp. | | | | | | |
| of New Jersey, Tobacco | | | | | | | | |
| Settlement Asset-Backed Bonds | | 6.75 | | 6/1/39 | | 1,790,000 | | 2,052,235 |
| Tobacco Settlement Financing Corp. | | | | | | |
| of New Jersey, Tobacco | | | | | | | | |
| Settlement Asset-Backed Bonds | | 7.00 | | 6/1/41 | | 10,630,000 | | 12,335,796 |
| Tobacco Settlement Financing Corp. | | | | | | |
| of New Jersey, Tobacco | | | | | | | | |
| Settlement Asset-Backed Bonds | | 6.25 | | 6/1/43 | | 3,490,000 | | 3,901,646 |
| Union County Improvement | | | | | | | | |
| Authority, Revenue | | | | | | | | |
| (Correctional Facility Project) | | 5.00 | | 6/15/22 | | 3,155,000 | | 3,317,830 |
| Union County Utilities Authority, | | | | | | | | |
| Solid Waste Revenue (Ogden | | | | | | | | |
| Martin Systems of Union, Inc.) | | | | | | | | |
| (Insured; AMBAC) | | 5.38 | | 6/1/20 | | 4,990,000 | | 5,130,568 |
| University of Medicine and | | | | | | | | |
| Dentistry of New Jersey | | | | | | | | |
| (Insured; AMBAC) | | 5.50 | | 12/1/27 | | 15,425,000 | | 16,743,837 |
| West Orange Board of Education, | | | | | | | | |
| COP (Insured; MBIA) | | 6.00 | | 10/1/09 | | 500,000 a | | 536,600 |
The Fund 17
STATEMENT OF INVESTMENTS (continued)
| Long-Term Municipal | | Coupon | | Maturity | | Principal | | |
| Investments (continued) | | Rate (%) | | Date | | Amount ($) | | Value ($) |
| |
| |
| |
| |
|
| U.S. Related—3.1% | | | | | | | | |
| Guam Waterworks Authority, | | | | | | | | |
| Water and Wastewater | | | | | | | | |
| System Revenue | | 6.00 | | 7/1/25 | | 1,000,000 | | 1,096,520 |
| Puerto Rico Commonwealth | | | | | | | | |
| (Insured; MBIA) | | 5.65 | | 7/1/15 | | 2,000,000 | | 2,267,860 |
| Puerto Rico Commonwealth, | | | | | | | | |
| Public Improvement | | 5.25 | | 7/1/32 | | 5,000,000 | | 5,387,650 |
| Puerto Rico Housing Bank and | | | | | | | | |
| Finance Agency, SFMR | | | | | | | | |
| (Affordable Housing Mortgage | | | | | | | | |
| Subsidy Program) (Insured: | | | | | | | | |
| FHLMC, FNMA and GNMA) | | 6.25 | | 4/1/07 | | 270,000 a | | 271,561 |
| Virgin Islands Public Finance | | | | | | | | |
| Authority, Revenue, Virgin | | | | | | | | |
| Islands Gross Receipts | | | | | | | | |
| Taxes Loan Note | | 6.50 | | 10/1/10 | | 3,000,000 a | | 3,315,150 |
| Virgin Islands Public Finance | | | | | | | | |
| Authority, Revenue, Virgin | | | | | | | | |
| Islands Gross Receipts | | | | | | | | |
| Taxes Loan Note | | 6.38 | | 10/1/19 | | 2,000,000 | | 2,187,420 |
| |
| |
| |
| |
|
| |
| Total Investments (cost $462,656,149) | | | | | | 104.3% | | 490,614,261 |
| |
| Liabilities, Less Cash and Receivables | | | | | | (4.3%) | | (20,022,647) |
| |
| Net Assets | | | | | | 100.0% | | 470,591,614 |
| |
| a These securities are prerefunded; the date shown represents the prerefunded date. Bonds which are prerefunded are |
| collateralized by U.S. Government securities which are held in escrow and are used to pay principal and interest on |
| the municipal issue and to retire the bonds in full at the earliest refunding date. | | |
| b Collateral for floating rate borrowings. | | | | | | | | |
| c Securities exempt from registration under Rule 144A of the Securities Act of 1933.These securities may be resold in |
| transactions exempt from registration, normally to qualified institutional buyers. At December 31, 2006, these |
| securities amounted to $55,904,135 or 11.9% of net assets. | | | | |
| d Non-income producing security; interest payments in default. | | | | |
The Fund 19
STATEMENT OF INVESTMENTS (continued)
| Summary of Combined Ratings (Unaudited) | | |
| |
| Fitch | | or Moody’s | | or | | Standard & Poor’s | | Value (%) † |
| |
| |
| |
| |
|
| AAA | | Aaa | | | | AAA | | 59.1 |
| AA | | Aa | | | | AA | | 7.5 |
| A | | | | A | | | | A | | 9.5 |
| BBB | | Baa | | | | BBB | | 16.4 |
| BB | | Ba | | | | BB | | .2 |
| B | | | | B | | | | B | | 1.6 |
| CCC | | Caa | | | | CCC | | .2 |
| Not Rated e | | Not Rated e | | | | Not Rated e | | 5.5 |
| | | | | | | | | | | 100.0 |
| |
| † | | Based on total investments. | | | | | | |
| e | | Securities which, while not rated by Fitch, Moody’s and Standard & Poor’s, have been determined by the Manager to |
| | | be of comparable quality to those rated securities in which the fund may invest. | | |
| See notes to financial statements. | | | | | | |
| STATEMENT OF ASSETS AND LIABILITIES |
| December 31, 2006 |
| | | | | Cost | | Value |
| |
| |
| |
|
| Assets ($): | | | | | | |
| Investments in securities—See Statement of Investments | | 462,656,149 | | 490,614,261 |
| Cash | | | | | | 1,084,894 |
| Interest receivable | | | | | | 6,034,087 |
| Receivable for shares of Common Stock subscribed | | | | 4,073 |
| Prepaid expenses | | | | | | 19,354 |
| | | | | | | 497,756,669 |
| |
| |
| |
|
| Liabilities ($): | | | | | | |
| Due to The Dreyfus Corporation and affiliates—Note 3(c) | | | | 327,698 |
| Payable for floating rate notes issued | | | | 26,250,000 |
| Payable for shares of Common Stock redeemed | | | | 451,673 |
| Interest and related expenses payable | | | | 51,233 |
| Accrued expenses | | | | | | 84,451 |
| | | | | | | 27,165,055 |
| |
| |
| |
|
| Net Assets ($) | | | | | | 470,591,614 |
| |
| |
| |
|
| Composition of Net Assets ($): | | | | | | |
| Paid-in capital | | | | | | 443,365,695 |
| Accumulated net realized gain (loss) on investments | | | | (732,193) |
| Accumulated net unrealized appreciation | | | | |
| (depreciation) on investments | | | | | | 27,958,112 |
| |
| |
| |
|
| Net Assets ($) | | | | | | 470,591,614 |
| |
| |
| |
|
| |
| |
| Net Asset Value Per Share | | | | | | |
| | | Class A | | Class B | | Class C |
| |
| |
| |
|
| Net Assets ($) | | 465,694,699 | | 2,129,368 | | 2,767,547 |
| Shares Outstanding | | 35,617,623 | | 163,035 | | 211,849 |
| |
| |
| |
|
| Net Asset Value Per Share ($) | | 13.07 | | 13.06 | | 13.06 |
See notes to financial statements.
The Fund 21
| STATEMENT OF OPERATIONS |
| Year Ended December 31, 2006 |
| Investment Income ($): | | |
| Interest Income | | 25,350,560 |
| Expenses: | | |
| Management fee—Note 3(a) | | 2,824,397 |
| Shareholder servicing costs—Note 3(c) | | 1,374,187 |
| Interest and related expenses | | 1,031,703 |
| Directors’ fees and expenses—Note 3(d) | | 97,809 |
| Registration fees | | 65,084 |
| Professional fees | | 60,140 |
| Custodian fees | | 50,308 |
| Distribution fees—Note 3(b) | | 29,747 |
| Prospectus and shareholders’ reports | | 24,050 |
| Loan commitment fees—Note 2 | | 3,864 |
| Miscellaneous | | 39,083 |
| Total Expenses | | 5,600,372 |
| Less—reduction in management fee | | |
| due to undertaking—Note 3(a) | | (533,830) |
| Less—reduction in custody fees due | | |
| to earnings credits—Note 1(b) | | (33,780) |
| Net Expenses | | 5,032,762 |
| Investment Income—Net | | 20,317,798 |
| |
|
| Realized and Unrealized Gain (Loss) on Investments—Note 4 ($): |
| Net realized gain (loss) on investments and options transactions | | 2,169,407 |
| Net realized gain (loss) on financial futures | | (469,065) |
| Net Realized Gain (Loss) | | 1,700,342 |
| Net unrealized appreciation (depreciation) on investments | | (3,336,028) |
| Net Realized and Unrealized Gain (Loss) on Investments | | (1,635,686) |
| Net Increase in Net Assets Resulting from Operations | | 18,682,112 |
See notes to financial statements.
STATEMENT OF CHANGES IN NET ASSETS
| | | Year Ended December 31, |
| |
|
| | | 2006 | | 2005 |
| |
| |
|
| Operations ($): | | | | |
| Investment income—net | | 20,317,798 | | 20,925,117 |
| Net realized gain (loss) on investments | | 1,700,342 | | 529,919 |
| Net unrealized appreciation | | | | |
| (depreciation) on investments | | (3,336,028) | | (5,887,566) |
| Net Increase (Decrease) in Net Assets | | | | |
| Resulting from Operations | | 18,682,112 | | 15,567,470 |
| |
| |
|
| Dividends to Shareholders from ($): | | | | |
| Investment income—net: | | | | |
| Class A shares | | (20,061,424) | | (20,707,461) |
| Class B shares | | (76,257) | | (70,354) |
| Class C shares | | (93,384) | | (70,587) |
| Total Dividends | | (20,231,065) | | (20,848,402) |
| |
| |
|
| Capital Stock Transactions ($): | | | | |
| Net proceeds from shares sold: | | | | |
| Class A shares | | 33,931,033 | | 25,969,722 |
| Class B shares | | 355,054 | | 654,150 |
| Class C shares | | 404,894 | | 1,182,252 |
| Dividends reinvested: | | | | |
| Class A shares | | 14,677,264 | | 14,803,889 |
| Class B shares | | 49,740 | | 45,823 |
| Class C shares | | 51,129 | | 38,855 |
| Cost of shares redeemed: | | | | |
| Class A shares | | (56,582,974) | | (60,922,298) |
| Class B shares | | (294,864) | | (266,976) |
| Class C shares | | (411,076) | | (198,594) |
| Increase (Decrease) in Net Assets | | | | |
| from Capital Stock Transactions | | (7,819,800) | | (18,693,177) |
| Total Increase (Decrease) in Net Assets | | (9,368,753) | | (23,974,109) |
| |
| |
|
| Net Assets ($): | | | | |
| Beginning of Period | | 479,960,367 | | 503,934,476 |
| End of Period | | 470,591,614 | | 479,960,367 |
The Fund 23
STATEMENT OF CHANGES IN NET ASSETS (continued)
| | | Year Ended December 31, |
| |
|
| | | 2006 | | 2005 |
| |
| |
|
| Capital Share Transactions: | | | | |
| Class A a | | | | |
| Shares sold | | 2,602,149 | | 1,962,222 |
| Shares issued for dividends reinvested | | 1,126,636 | | 1,119,324 |
| Shares redeemed | | (4,338,081) | | (4,603,505) |
| Net Increase (Decrease) in Shares Outstanding | | (609,296) | | (1,521,959) |
| |
| |
|
| Class B a | | | | |
| Shares sold | | 27,258 | | 49,513 |
| Shares issued for dividends reinvested | | 3,816 | | 3,470 |
| Shares redeemed | | (22,580) | | (20,261) |
| Net Increase (Decrease) in Shares Outstanding | | 8,494 | | 32,722 |
| |
| |
|
| Class C | | | | |
| Shares sold | | 31,034 | | 89,700 |
| Shares issued for dividends reinvested | | 3,922 | | 2,946 |
| Shares redeemed | | (31,578) | | (15,182) |
| Net Increase (Decrease) in Shares Outstanding | | 3,378 | | 77,464 |
a During the period ended December 31, 2006, 1,434 Class B shares representing $18,792 were automatically converted to 1,433 Class A shares and during the period ended December 31, 2005, 727 Class B shares representing $9,697 were automatically converted to 726 Class A shares.
See notes to financial statements.
FINANCIAL HIGHLIGHTS
The following tables describe the performance for each share class for the fiscal periods indicated.All information (except portfolio turnover rate) reflects financial results for a single fund share.Total return shows how much your investment in the fund would have increased (or decreased) during each period, assuming you had reinvested all dividends and distributions.These figures have been derived from the fund’s financial statements.
| | | | | Year Ended December 31, | | |
| |
| |
| |
|
| Class A Shares | | 2006 | | 2005 | | 2004 | | 2003 a | | 2002 |
| |
| |
| |
| |
| |
|
| Per Share Data ($): | | | | | | | | | | |
| Net asset value, beginning of period | | 13.12 | | 13.26 | | 13.32 | | 13.25 | | 12.76 |
| Investment Operations: | | | | | | | | | | |
| Investment income—net b | | .56 | | .56 | | .55 | | .57 | | .62 |
| Net realized and unrealized | | | | | | | | | | |
| gain (loss) on investments | | (.05) | | (.14) | | (.04) | | .06 | | .49 |
| Total from Investment Operations | | .51 | | .42 | | .51 | | .63 | | 1.11 |
| Distributions: | | | | | | | | | | |
| Dividends from investment income—net | | (.56) | | (.56) | | (.55) | | (.56) | | (.62) |
| Dividends from net realized | | | | | | | | | | |
| gain on investments | | — | | — | | (.02) | | — | | (.00)c |
| Total Distributions | | (.56) | | (.56) | | (.57) | | (.56) | | (.62) |
| Net asset value, end of period | | 13.07 | | 13.12 | | 13.26 | | 13.32 | | 13.25 |
| |
| |
| |
| |
| |
|
| Total Return (%) | | 4.00d | | 3.22d | | 3.91d | | 4.90d | | 8.88 |
| |
| |
| |
| |
| |
|
| Ratios/Supplemental Data (%): | | | | | | | | | | |
| Ratio of total expenses | | | | | | | | | | |
| to average net assets | | 1.18 | | 1.12e | | 1.04e | | 1.03e | | 1.03e |
| Ratio of net expenses | | | | | | | | | | |
| to average net assets | | 1.06 | | 1.01e | | .94e | | .94e | | .94e |
| Ratio of net investment income | | | | | | | | | | |
| to average net assets | | 4.32 | | 4.25 | | 4.16 | | 4.29 | | 4.77 |
| Portfolio Turnover Rate | | 17.13 | | 11.22 | | 16.98 | | 24.45 | | 33.10 |
| |
| |
| |
| |
| |
|
| Net Assets, end of period ($ x 1,000) | | 465,695 | | 475,203 | | 500,585 | | 536,073 | | 558,814 |
| a | | The fund commenced offering three classes of shares on January 7, 2003.The existing shares were redesignated |
| | | Class A shares. |
| b | | Based on average shares outstanding at each month end. |
| c | | Amount represents less than $.01 per share. |
| d | | Exclusive of sales charge. |
| e | | Ratio of total expenses to average net assets and ratio of net expenses to average net assets for all periods footnoted |
| | | have been restated due to an interpretation of an accounting principle.This restatement has no impact on the fund’s |
| | | previously reported net assets, net investment income, net asset value or total return. See Note 5. |
| See notes to financial statements. |
The Fund 25
FINANCIAL HIGHLIGHTS (continued)
| | | | | | | Year Ended December 31, |
| | | |
| |
|
| Class B Shares | | 2006 | | 2005 | | 2004 | | 2003 a |
| |
| |
| |
| |
|
| Per Share Data ($): | | | | | | | | |
| Net asset value, beginning of period | | 13.10 | | 13.25 | | 13.30 | | 13.13 |
| Investment Operations: | | | | | | | | |
| Investment income—net b | | .50 | | .50 | | .48 | | .48 |
| Net realized and unrealized | | | | | | | | |
| gain (loss) on investments | | (.04) | | (.16) | | (.03) | | .17 |
| Total from Investment Operations | | .46 | | .34 | | .45 | | .65 |
| Distributions: | | | | | | | | |
| Dividends from investment income—net | | (.50) | | (.49) | | (.48) | | (.48) |
| Dividends from net realized | | | | | | | | |
| gain on investments | | — | | — | | (.02) | | — |
| Total Distributions | | (.50) | | (.49) | | (.50) | | (.48) |
| Net asset value, end of period | | 13.06 | | 13.10 | | 13.25 | | 13.30 |
| |
| |
| |
| |
|
| Total Return (%) c | | 3.56 | | 2.63 | | 3.46 | | 5.07d |
| |
| |
| |
| |
|
| Ratios/Supplemental Data (%): | | | | | | | | |
| Ratio of total expenses to average net assets | | 1.74 | | 1.67e | | 1.59e | | 1.57e,f |
| Ratio of net expenses to average net assets | | 1.56 | | 1.51e | | 1.44e | | 1.43e,f |
| Ratio of net investment income | | | | | | | | |
| to average net assets | | 3.82 | | 3.74 | | 3.65 | | 3.63f |
| Portfolio Turnover Rate | | 17.13 | | 11.22 | | 16.98 | | 24.45 |
| |
| |
| |
| |
|
| Net Assets, end of period ($ x 1,000) | | 2,129 | | 2,025 | | 1,614 | | 1,038 |
| |
| a | | From January 7, 2003 (commencement of initial offering) to December 31, 2003. | | | | |
| b | | Based on average shares outstanding at each month end. | | | | | | |
| c | | Exclusive of sales charge. | | | | | | | | |
| d | | Not annualized. | | | | | | | | |
| e | | Ratio of total expenses to average net assets and ratio of net expenses to average net assets for all periods footnoted |
| | | have been restated due to an interpretation of an accounting principle.This restatement has no impact on the fund’s |
| | | previously reported net assets, net investment income, net asset value or total return. See Note 5. | | |
| f | | Annualized. | | | | | | | | |
| See notes to financial statements. | | | | | | | | |
| | | | | | | Year Ended December 31, |
| | | |
| |
|
| Class C Shares | | 2006 | | 2005 | | 2004 | | 2003 a |
| |
| |
| |
| |
|
| Per Share Data ($): | | | | | | | | |
| Net asset value, beginning of period | | 13.11 | | 13.25 | | 13.31 | | 13.13 |
| Investment Operations: | | | | | | | | |
| Investment income—net b | | .46 | | .46 | | .45 | | .44 |
| Net realized and unrealized | | | | | | | | |
| gain (loss) on investments | | (.05) | | (.14) | | (.04) | | .19 |
| Total from Investment Operations | | .41 | | .32 | | .41 | | .63 |
| Distributions: | | | | | | | | |
| Dividends from investment income—net | | (.46) | | (.46) | | (.45) | | (.45) |
| Dividends from net realized | | | | | | | | |
| gain on investments | | — | | — | | (.02) | | — |
| Total Distributions | | (.46) | | (.46) | | (.47) | | (.45) |
| Net asset value, end of period | | 13.06 | | 13.11 | | 13.25 | | 13.31 |
| |
| |
| |
| |
|
| Total Return (%) c | | 3.22 | | 2.45 | | 3.13 | | 4.88d |
| |
| |
| |
| |
|
| Ratios/Supplemental Data (%): | | | | | | | | |
| Ratio of total expenses to average net assets | | 1.96 | | 1.89e | | 1.81e | | 1.80e,f |
| Ratio of net expenses to average net assets | | 1.81 | | 1.76e | | 1.69e | | 1.67e,f |
| Ratio of net investment income | | | | | | | | |
| to average net assets | | 3.57 | | 3.51 | | 3.41 | | 3.34f |
| Portfolio Turnover Rate | | 17.13 | | 11.22 | | 16.98 | | 24.45 |
| |
| |
| |
| |
|
| Net Assets, end of period ($ x 1,000) | | 2,768 | | 2,732 | | 1,736 | | 1,188 |
| |
| a | | From January 7, 2003 (commencement of initial offering) to December 31, 2003. | | | | |
| b | | Based on average shares outstanding at each month end. | | | | | | |
| c | | Exclusive of sales charge. | | | | | | | | |
| d | | Not annualized. | | | | | | | | |
| e | | Ratio of total expenses to average net assets and ratio of net expenses to average net assets for all periods footnoted |
| | | have been restated due to an interpretation of an accounting principle.This restatement has no impact on the fund’s |
| | | previously reported net assets, net investment income, net asset value or total return. See Note 5. | | |
| f | | Annualized. | | | | | | | | |
| See notes to financial statements. | | | | | | | | |
The Fund 27
NOTES TO FINANCIAL STATEMENTS
NOTE 1—Significant Accounting Policies:
Dreyfus Premier New Jersey Municipal Bond Fund, Inc. (the “fund”) is registered under the Investment Company Act of 1940, as amended (the “Act”), as a non-diversified open-end management investment company.The fund’s investment objective is to provide investors with as high a level of current income exempt from federal and New Jersey personal income taxes, as is consistent with the preservation of capital. The Dreyfus Corporation (the “Manager” or “Dreyfus”) serves as the fund’s investment adviser.The Manager is a wholly-owned subsidiary of Mellon Financial Corporation (“Mellon Financial”).
On December 4, 2006, Mellon Financial and The Bank of New York Company, Inc. announced that they had entered into a definitive agreement to merge. The new company will be called The Bank of New York Mellon Corporation. As part of this transaction, Dreyfus would become a wholly-owned subsidiary of The Bank of New York Mellon Corporation.The transaction is subject to certain regulatory approvals and the approval of The Bank of New York Company, Inc.’s and Mellon Financial’s shareholders, as well as other customary conditions to closing. Subject to such approvals and the satisfaction of the other conditions, Mellon Financial and The Bank of New York Company, Inc. expect the transaction to be completed in the third quarter of 2007.
Dreyfus Service Corporation (the “Distributor”), a wholly-owned subsidiary of the Manager, is the distributor of the fund’s shares.The fund is authorized to issue 500 million shares of $.001 par value Common Stock.The fund currently offers three classes of shares: Class A (200 million shares authorized), Class B (150 million shares authorized) and Class C (150 million shares authorized). Class A shares are subject to a sales charge imposed at the time of purchase. Class B shares are subject to a contingent deferred sales charge (“CDSC”) imposed on Class B share redemptions made within six years of purchase and automatically convert to Class A shares after six years. Class C shares are subject to a CDSC imposed on Class C shares redeemed within one year of purchase. Other differences between the classes include the services offered to and the expenses borne by each class and certain voting rights.
28
Income, expenses (other than expenses attributable to a specific class), and realized and unrealized gains or losses on investments are allocated to each class of shares based on its relative net assets.
Effective March 1, 2006, Class A shares of the fund may be purchased at net asset value (“NAV”) without payment of a sales charge:
- By qualified investors who (i) purchase Class A shares directly through the Distributor, and (ii) have, or whose spouse or minor children have, beneficially owned shares and continuously maintained an open account directly through the Distributor in a Dreyfus-managed fund, including the fund, or a Founders Asset Management LLC
(“Founders”) managed fund since on or before February 28, 2006. Founders is a wholly-owned subsidiary of the Distributor. - With the cash proceeds from an investor’s exercise of employment- related stock options, whether invested in the fund directly or indi- rectly through an exchange from a Dreyfus-managed money market fund, provided that the proceeds are processed through an entity that has entered into an agreement with the Distributor specifically relat- ing to processing stock options. Upon establishing the account in the fund or the Dreyfus-managed money market fund, the investor and the investor’s spouse and minor children become eligible to purchase Class A shares of the fund at NAV, whether or not using the proceeds of the employment-related stock options.
- By members of qualified affinity groups who purchase Class A shares directly through the Distributor, provided that the qualified affinity group has entered into an affinity agreement with the Distributor.
Effective June 1, 2006, the fund no longer offers Class B shares, except in connection with dividend reinvestment and permitted exchanges of Class B shares.
The fund’s financial statements are prepared in accordance with U.S. generally accepted accounting principles, which may require the use of management estimates and assumptions. Actual results could differ from those estimates.
The Fund 29
NOTES TO FINANCIAL STATEMENTS (continued)
The fund enters into contracts that contain a variety of indemnifications. The fund’s maximum exposure under these arrangements is unknown.The fund does not anticipate recognizing any loss related to these arrangements.
(a) Portfolio valuation: Investments in securities are valued each business day by an independent pricing service (the “Service”) approved by the fund’s Board of Directors. Investments for which quoted bid prices are readily available and are representative of the bid side of the market in the judgment of the Service are valued at the mean between the quoted bid prices (as obtained by the Service from dealers in such securities) and asked prices (as calculated by the Service based upon its evaluation of the market for such securities). Other investments (which constitute a majority of the portfolio securities) are carried at fair value as determined by the Service, based on methods which include consideration of: yields or prices of municipal securities of comparable quality, coupon, maturity and type; indications as to values from dealers; and general market conditions. Options and financial futures on municipal and U.S. Treasury securities are valued at the last sales price on the securities exchange on which such securities are primarily traded or at the last sales price on the national securities market on each business day.
On September 20, 2006, the Financial Accounting Standards Board (FASB) released Statement of Financial Accounting Standards No. 157 “Fair Value Measurements” (“FAS 157”). FAS 157 establishes an authoritative definition of fair value, sets out a framework for measuring fair value, and requires additional disclosures about fair-value measurements. The application of FAS 157 is required for fiscal years beginning after November 15, 2007 and interim periods within those fiscal years. Management does not believe that the application of this standard will have a material impact on the financial statements of the fund.
(b) Securities transactions and investment income: Securities transactions are recorded on a trade date basis. Realized gain and loss from securities transactions are recorded on the identified cost basis. Interest income, adjusted for accretion of discount and amortization of premium on investments, is earned from settlement date and recognized on the
accrual basis. Securities purchased or sold on a when-issued or delayed-delivery basis may be settled a month or more after the trade date.
Inverse floaters purchased after January 1, 1997 in the agency market are accounted for as financing transactions in accordance with FASB 140 “Accounting for Transfers and Servicing of Financial Assets and Extinguishments of Liabilities”.
The fund has an arrangement with the custodian bank whereby the fund receives earnings credits from the custodian when positive cash balances are maintained, which are used to offset custody fees. For financial reporting purposes, the fund includes net earnings credits as an expense offset in the Statement of Operations.
The fund follows an investment policy of investing primarily in municipal obligations of one state. Economic changes affecting the state and certain of its public bodies and municipalities may affect the ability of issuers within the state to pay interest on, or repay principal of, municipal obligations held by the fund.
(c) Dividends to shareholders: It is the policy of the fund to declare dividends from investment income-net on each business day. Such dividends are paid monthly. Dividends from net realized capital gain, if any, are normally declared and paid annually, but the fund may make distributions on a more frequent basis to comply with the distribution requirements of the Internal Revenue Code of 1986, as amended (the “Code”).To the extent that net realized capital gain can be offset by capital loss carryovers, it is the policy of the fund not to distribute such gain. Income and capital gain distributions are determined in accordance with income tax regulations, which may differ from U.S. generally accepted accounting principles.
(d) Federal income taxes: It is the policy of the fund to continue to qualify as a regulated investment company, which can distribute tax exempt dividends, by complying with the applicable provisions of the Code, and to make distributions of income and net realized capital gain sufficient to relieve it from substantially all federal income and excise taxes.
The Fund 31
NOTES TO FINANCIAL STATEMENTS (continued)
On July 13, 2006, the FASB released FASB Interpretation No. 48 “Accounting for Uncertainty in Income Taxes” (FIN 48). FIN 48 provides guidance for how uncertain tax positions should be recognized, measured, presented and disclosed in the financial statements. FIN 48 requires the evaluation of tax positions taken or expected to be taken in the course of preparing the fund’s tax returns to determine whether the tax positions are “more-likely-than-not” of being sustained by the applicable tax authority.Tax positions not deemed to meet the more-likely-than-not threshold would be recorded as a tax benefit or expense in the current year. Adoption of FIN 48 is required for fiscal years beginning after December 15, 2006 and is to be applied to all open tax years as of the effective date. Management does not believe that the application of this standard will have a material impact on the financial statements of the fund.
At December 31, 2006, the components of accumulated earnings on a tax basis were as follows: undistributed tax exempt income $219,581, accumulated capital losses $803,681 and unrealized appreciation $28,029,601.
The accumulated capital loss carryover is available to be applied against future net securities profits, if any, realized subsequent to December 31, 2006. If not applied, the carryover expires in fiscal 2011.
The tax character of distributions paid to shareholders during the fiscal periods ended December 31, 2006 and December 31, 2005 were as follows: tax exempt income $20,231,065 and $20,848,402, respectively.
During the period ended December 31, 2006, as a result of permanent book to tax differences, primarily due to the tax treatment for amortization adjustments, the fund decreased accumulated undistributed investment income-net by $86,733, increased accumulated net realized gain (loss) on investments by $49,715 and increased paid-in capital by $37,018. Net assets were not affected by this reclassification.
NOTE 2—Bank Line of Credit:
The fund participates with other Dreyfus-managed funds in a $350 million redemption credit facility (the “Facility”) to be utilized for temporary or emergency purposes, including the financing of redemptions. In connection therewith, the fund has agreed to pay commitment fees on its pro rata portion of the Facility. Interest is charged to the fund based on prevailing market rates in effect at the time of borrowing. During the period ended December 31, 2006, the fund did not borrow under the Facility.
NOTE 3—Management Fee and Other Transactions With Affiliates:
(a) Pursuant to a Management Agreement (“Agreement”) with the Manager, the management fee is computed at the annual rate of .60% of the value of the fund’s average daily net assets and is payable monthly. The Manager has undertaken until such time as they give shareholders at least 90 days’ notice to the contrary, if the aggregate expenses of the fund, exclusive of taxes, brokerage commissions, interest expense, commitment fees, extraordinary expenses, shareholder services fees and Rule 12b-1 distribution plan fees, but including the management fee, exceed .60% of the value of the fund’s average daily net assets, the fund may deduct from the payments to be made to the Manager under the Agreement, or the Manager will bear such excess expense.The reduction in management fee, pursuant to the undertaking, amounted to $533,830 during the period ended December 31, 2006.
During the period ended December 31, 2006, the Distributor retained $2,633 from commissions earned on sales of the fund’s Class A shares and $6,576 and $1,123 from CDSC on redemptions of the fund’s Class B and Class C shares, respectively.
(b) Under the Distribution Plan (the “Plan”) adopted pursuant to Rule 12b-1 under the Act, Class B and Class C shares pay the Distributor for
The Fund 33
NOTES TO FINANCIAL STATEMENTS (continued)
distributing their shares at an annual rate of .50% of the value of the average daily net assets of Class B shares and .75% of the value of the average daily net assets of Class C shares. During the period ended December 31, 2006, Class B and Class C shares were charged $10,020 and $19,727 respectively, pursuant to the Plan.
(c) Under the Shareholder Services Plan, Class A, Class B and Class C shares pay the Distributor at an annual rate of .25% of the value of the average daily net assets for the provision of certain services. The services provided may include personal services relating to shareholder accounts, such as answering shareholder inquiries regarding the fund and providing reports and other information, and services related to the maintenance of shareholder accounts.The Distributor may make payments to Service Agents (a securities dealer, financial institution or other industry professional) in respect of these services.The Distributor determines the amounts to be paid to Service Agents. During the period ended December 31, 2006, Class A, Class B and Class C shares were charged $1,165,246, $5,010 and $6,576, respectively, pursuant to the Shareholder Services Plan.
The fund compensates Dreyfus Transfer, Inc., a wholly-owned subsidiary of the Manager, under a transfer agency agreement for providing personnel and facilities to perform transfer agency services for the fund. During the period ended December 31, 2006, the fund was charged $120,556 pursuant to the transfer agency agreement.
During the period ended December 31, 2006, the fund was charged $4,204 for services performed by the Chief Compliance Officer.
The components of Due to The Dreyfus Corporation and affiliates in the Statement of Assets and Liabilities consist of: management fees $240,455, Rule 12b-1 distribution plan fees $2,672, shareholder services plan fees $100,190, chief compliance officer fees $2,044 and transfer agency per account fees $23,979, which are offset against an expense reimbursement currently in effect in the amount of $41,642.
(d) Each Board member also serves as a Board member of other funds within the Dreyfus complex. Annual retainer fees and attendance fees are allocated to each fund based on net assets.
NOTE 4—Securities Transactions:
The aggregate amount of purchases and sales of investment securities, excluding short-term securities, financial futures and options transactions, during the period ended December 31, 2006, amounted to $84,062,570 and $95,509,394, respectively.
The fund may invest in financial futures contracts in order to gain exposure to or protect against changes in the market.The fund is exposed to market risk as a result of changes in the value of the underlying financial instruments. Investments in financial futures require the fund to “mark to market” on a daily basis, which reflects the change in market value of the contracts at the close of each day’s trading.Accordingly, variation margin payments are received or made to reflect daily unrealized gains or losses. When the contracts are closed, the fund recognizes a realized gain or loss. These investments require initial margin deposits with a broker, which consist of cash or cash equivalents.The amount of these deposits is determined by the exchange or Board of Trade on which the contract is traded and is subject to change.At December 31, 2006, there were no financial futures contracts outstanding.
At December 31, 2006, the cost of investments for federal income tax purposes was $436,334,660; accordingly, accumulated net unrealized appreciation on investments was $28,029,601, consisting of $29,351,388 gross unrealized appreciation and $1,321,787 gross unrealized depreciation.
NOTE 5—Restatement:
Subsequent to the issuance of the December 31, 2005 financial statements, the fund determined that the transfers of certain tax-exempt municipal bond securities by the fund to special purpose bond trusts in
The Fund 35
NOTES TO FINANCIAL STATEMENTS (continued)
connection with participation in inverse floater structures do not qualify for sale treatment under Statement of Financial Accounting Standards No. 140, Accounting for Transfers and Servicing of Financial Assets and Extinguishment of Liabilities, and should have been accounted for as a secured borrowing.
The correction of the above item resulted in the restatement of the ratio of total and net expenses of the financial highlights table as shown below:
| Ratio of Total Expenses | | 2005 | | 2004 | | 2003 | | 2002 |
| |
| |
| |
| |
|
| Class A shares: | | | | | | | | |
| As previously reported | | .96% | | .95% | | .95% | | .94% |
| As restated | | 1.12% | | 1.04% | | 1.03% | | 1.03% |
| Class B shares: | | | | | | | | |
| As previously reported | | 1.51% | | 1.50% | | 1.49% | | |
| As restated | | 1.67% | | 1.59% | | 1.57% | | |
| Class C shares: | | | | | | | | |
| As previously reported | | 1.73% | | 1.72% | | 1.72% | | |
| As restated | | 1.89% | | 1.81% | | 1.80% | | |
| |
| Ratio of Net Expenses | | 2005 | | 2004 | | 2003 | | 2002 |
| |
| |
| |
| |
|
| Class A shares: | | | | | | | | |
| As previously reported | | .85% | | .85% | | .86% | | .85% |
| As restated | | 1.01% | | .94% | | .94% | | .94% |
| Class B shares: | | | | | | | | |
| As previously reported | | 1.35% | | 1.35% | | 1.35% | | |
| As restated | | 1.51% | | 1.44% | | 1.43% | | |
| Class C shares: | | | | | | | | |
| As previously reported | | 1.60% | | 1.60% | | 1.59% | | |
| As restated | | 1.76% | | 1.69% | | 1.67% | | |
This restatement has no impact on the fund’s previously reported net assets, net investment income, net asset value per share or total return.
NOTE 6—Reorganization Note:
On December 13, 2006, the Board of Directors of the fund approved an Agreement and Plan of Reorganization to merge Dreyfus New Jersey Intermediate Municipal Bond Fund into the fund as part of a tax-free reorganization. The merger currently is anticipated to occur, subject to shareholder approval, on or about April 16, 2007. On the date of the merger, Dreyfus New Jersey Intermediate Municipal Bond Fund will exchange all of its assets at net asset value, subject to liabilities, for Class Z shares of the fund.Those shares then will be distributed pro rata to shareholders of Dreyfus New Jersey Intermediate Municipal Bond Fund so that each shareholder receives a number of Class Z shares of the fund equal to the aggregate net asset value of the shareholder's Dreyfus New Jersey Intermediate Municipal Bond Fund shares.
The Fund 37
REPORT OF INDEPENDENT REGISTERED PUBLIC ACCOUNTING FIRM
| Shareholders and Board of Directors |
| Dreyfus Premier New Jersey Municipal Bond Fund, Inc. |
We have audited the accompanying statement of assets and liabilities of Dreyfus Premier New Jersey Municipal Bond Fund, Inc., including the statement of investments, as of December 31, 2006, and the related statement of operations for the year then ended, the statement of changes in net assets for each of the two years in the period then ended, and financial highlights for each of the periods indicated therein.These financial statements and financial highlights are the responsibility of the Fund’s management. Our responsibility is to express an opinion on these financial statements and financial highlights based on our audits.
We conducted our audits in accordance with the standards of the Public Company Accounting Oversight Board (United States).Those standards require that we plan and perform the audit to obtain reasonable assurance about whether the financial statements and financial highlights are free of material misstatement.We were not engaged to perform an audit of the Fund’s internal control over financial reporting. Our audits included consideration of internal control over financial reporting as a basis for designing audit procedures that are appropriate in the circumstances, but not for the purpose of expressing an opinion on the effectiveness of the Fund’s internal control over financial reporting. Accordingly, we express no such opinion.An audit also includes examining, on a test basis, evidence supporting the amounts and disclosures in the financial statements and financial highlights, assessing the accounting principles used and significant estimates made by management, and evaluating the overall financial statement presentation. Our procedures included confirmation of securities owned as of December 31, 2006 by correspondence with the custodian.We believe that our audits provide a reasonable basis for our opinion.
In our opinion, the financial statements and financial highlights referred to above present fairly, in all material respects, the financial position of Dreyfus Premier New Jersey Municipal Bond Fund, Inc. at December 31,2006,the results of its operations for the year then ended,the changes in its net assets for each of the two years in the period then ended, and the financial highlights for each of the indicated periods, in conformity with U. S. generally accepted accounting principles.
| New York, New York |
| February 15, 2007 |
IMPORTANT TAX INFORMATION (Unaudited)
In accordance with federal tax law, the fund hereby designates all the dividends paid from investment income-net during the fiscal year ended December 31, 2006 as “exempt-interest dividends” (not subject to regular federal and, for individuals who are New Jersey residents, New Jersey personal income taxes).
As required by federal tax law rules, shareholders will receive notification of their portion of the fund’s taxable ordinary dividends (if any) and capital gains (if any) distributions paid for the 2006 calendar year on Form 1099-DIV and their portion of the fund’s exempt-interest dividends paid for the 2006 calendar year on Form 1099-INT, both which will be mailed by January 31, 2007.
The Fund 39

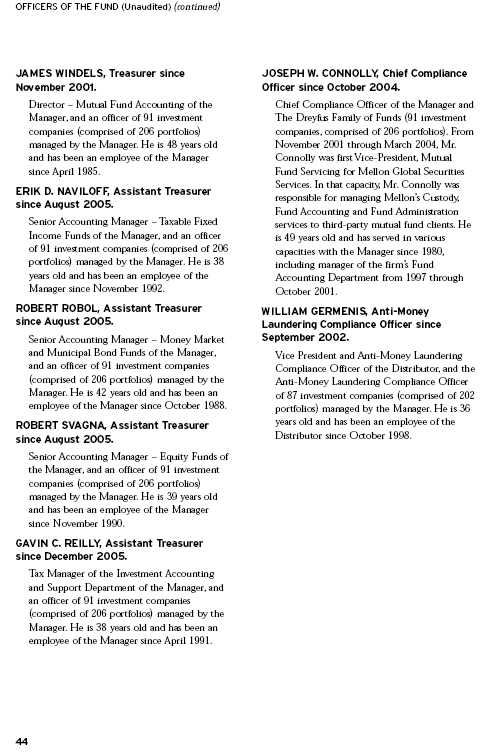
Telephone Call your financial representative or 1-800-554-4611
| Mail | | The Dreyfus Premier Family of Funds |
| | | 144 Glenn Curtiss Boulevard, Uniondale, NY 11556-0144 |
The fund files its complete schedule of portfolio holdings with the Securities and Exchange Commission (“SEC”) for the first and third quarters of each fiscal year on Form N-Q. The fund's Forms N-Q are available on the SEC’s website at http://www.sec.gov and may be reviewed and copied at the SEC’s Public Reference Room in Washington, DC. Information on the operation of the Public Reference Room may be obtained by calling 1-202-551-8090.
Information regarding how the fund voted proxies relating to portfolio securities for the 12-month period ended June 30, 2006, is available on the SEC’s website at http://www.sec.gov and without charge, upon request, by calling 1-800-645-6561.

The Registrant has adopted a code of ethics that applies to the Registrant's principal executive officer, principal financial officer, principal accounting officer or controller, or persons performing similar functions. There have been no amendments to, or waivers in connection with, the Code of Ethics during the period covered by this Report.
| Item 3. | | Audit Committee Financial Expert. |
The Registrant's Board has determined that David P. Feldman, a member of the Audit Committee of the Board, is an audit committee financial expert as defined by the Securities and Exchange Commission (the "SEC"). David P. Feldman is "independent" as defined by the SEC for purposes of audit committee financial expert determinations.
| Item 4. | | Principal Accountant Fees and Services |
(a) Audit Fees. The aggregate fees billed for each of the last two fiscal years (the "Reporting Periods") for professional services rendered by the Registrant's principal accountant (the "Auditor") for the audit of the Registrant's annual financial statements, or services that are normally provided by the Auditor in connection with the statutory and regulatory filings or engagements for the Reporting Periods, were $35,285 in 2005 and $36,962 in 2006.
(b) Audit-Related Fees. The aggregate fees billed in the Reporting Periods for assurance and related services by the Auditor that are reasonably related to the performance of the audit of the Registrant's financial statements and are not reported under paragraph (a) of this Item 4 were $0 in 2005 and $0 in 2006.
The aggregate fees billed in the Reporting Periods for non-audit assurance and related services by the Auditor to the Registrant's investment adviser (not including any sub-investment adviser whose role is primarily portfolio management and is subcontracted with or overseen by another investment adviser), and any entity controlling, controlled by or under common control with the investment adviser that provides ongoing services to the Registrant ("Service Affiliates"), that were reasonably related to the performance of the annual audit of the Service Affiliate, which required pre-approval by the Audit Committee were $0 in 2005 and $0 in 2006.
Note: For the second paragraph in each of (b) through (d) of this Item 4, certain of such services were not pre-approved prior to May 6, 2003, when such services were required to be pre-approved. On and after May 6, 2003, 100% of all services provided by the Auditor were pre-approved as required. For comparative purposes, the fees shown assume that all such services were pre-approved, including services that were not pre-approved prior to the compliance date of the pre-approval requirement.
(c) Tax Fees. The aggregate fees billed in the Reporting Periods for professional services rendered by the Auditor for tax compliance, tax advice and tax planning ("Tax Services") were $2,814 in 2005 and $3,124 in 2006. These services consisted of (i) review or preparation of U.S. federal, state, local and excise tax returns; (ii) U.S. federal, state and local tax planning, advice and assistance regarding statutory, regulatory or administrative developments, (iii) tax advice regarding tax qualification matters and/or treatment of various
financial instruments held or proposed to be acquired or held, and (iv) determination of Passive Foreign Investment Companies (as applicable).
The aggregate fees billed in the Reporting Periods for Tax Services by the Auditor to Service Affiliates which required pre-approval by the Audit Committee were $0 in 2005 and $0 in 2006.
(d) All Other Fees. The aggregate fees billed in the Reporting Periods for products and services provided by the Auditor, other than the services reported in paragraphs (a) through (c) of this Item, were $326 in 2005 and $361 in 2006. These services consisted of a review of the Registrant's anti-money laundering program.
The aggregate fees billed in the Reporting Periods for Non-Audit Services by the Auditor to Service Affiliates, other than the services reported in paragraphs (b) through (c) of this Item, which required pre-approval by the Audit Committee were $0 in 2005 and $6 in 2006.
Audit Committee Pre-Approval Policies and Procedures. The Registrant's Audit Committee has established policies and procedures (the "Policy") for pre-approval (within specified fee limits) of the Auditor's engagements for non-audit services to the Registrant and Service Affiliates without specific case-by-case consideration. Pre-approval considerations include whether the proposed services are compatible with maintaining the Auditor's independence. Pre-approvals pursuant to the Policy are considered annually.
Non-Audit Fees. The aggregate non-audit fees billed by the Auditor for services rendered to the Registrant, and rendered to Service Affiliates, for the Reporting Periods were $758,091 in 2005 and $383,726 in 2006.
Auditor Independence. The Registrant's Audit Committee has considered whether the provision of non-audit services that were rendered to Service Affiliates which were not pre-approved (not requiring pre-approval) is compatible with maintaining the Auditor's independence.
| Item 5. | | Audit Committee of Listed Registrants. |
| | | Not applicable. |
| Item 6. | | Schedule of Investments. |
| | | Not applicable. |
| Item 7. | | Disclosure of Proxy Voting Policies and Procedures for Closed-End Management |
| | | Investment Companies. |
| | | Not applicable. |
| Item 8. | | Portfolio Managers of Closed-End Management Investment Companies. |
| | | Not applicable. |
| Item 9. | | Purchases of Equity Securities by Closed-End Management Investment Companies and |
| | | Affiliated Purchasers. |
| | | Not applicable. |
| Item 10. | | Submission of Matters to a Vote of Security Holders. |
The Registrant has a Nominating Committee (the "Committee"), which is responsible for selecting and nominating persons for election or appointment by the Registrant's Board as Board members. The Committee has adopted a Nominating Committee Charter (the "Charter"). Pursuant to the Charter, the Committee will consider recommendations for nominees from shareholders submitted to the Secretary of the Registrant, c/o The Dreyfus Corporation Legal Department, 200 Park Avenue, 8th Floor East, New York, New York 10166. A nomination submission must include information regarding the recommended nominee as specified in the Charter. This information includes all information relating to a recommended nominee that is required to be disclosed in solicitations or proxy statements for the election of Board members, as well as information sufficient to evaluate the factors to be considered by the Committee, including character and integrity, business and professional experience, and whether the person has the ability to apply sound and independent business judgment and would act in the interests of the Registrant and its shareholders.
Nomination submissions are required to be accompanied by a written consent of the individual to stand for election if nominated by the Board and to serve if elected by the shareholders, and such additional information must be provided regarding the recommended nominee as reasonably requested by the Committee.
| Item 11. | | Controls and Procedures. |
(a) The Registrant's principal executive and principal financial officers have concluded, based on their evaluation of the Registrant's disclosure controls and procedures as of a date within 90 days of the filing date of this report, that the Registrant's disclosure controls and procedures are reasonably designed to ensure that information required to be disclosed by the Registrant on Form N-CSR is recorded, processed, summarized and reported within the required time periods and that information required to be disclosed by the Registrant in the reports that it files or submits on Form N-CSR is accumulated and communicated to the Registrant's management, including its principal executive and principal financial officers, as appropriate to allow timely decisions regarding required disclosure.
(b) The Registrant has revised its internal control over financial reporting with respect to investments in certain inverse floater structures to account for such investments as secured borrowings and to report the related income and expense.
| (a)(1) | | Code of ethics referred to in Item 2. |
| (a)(2) | | Certifications of principal executive and principal financial officers as required by Rule 30a-2(a) |
| under the Investment Company Act of 1940. |
| (a)(3) | | Not applicable. |
| (b) | | Certification of principal executive and principal financial officers as required by Rule 30a-2(b) |
| under the Investment Company Act of 1940. |
Pursuant to the requirements of the Securities Exchange Act of 1934 and the Investment Company Act of 1940, the Registrant has duly caused this Report to be signed on its behalf by the undersigned, thereunto duly authorized.
DREYFUS PREMIER NEW JERSEY MUNICIPAL BOND FUND, INC.
Pursuant to the requirements of the Securities Exchange Act of 1934 and the Investment Company Act of 1940, this Report has been signed below by the following persons on behalf of the Registrant and in the capacities and on the dates indicated.

| | | EXHIBIT INDEX |
| (a)(1) | | Code of ethics referred to in Item 2. |
| (a)(2) | | Certifications of principal executive and principal financial officers as required by Rule 30a- |
| 2(a) under the Investment Company Act of 1940. (EX-99.CERT) |
| (b) | | Certification of principal executive and principal financial officers as required by Rule 30a- |
| 2(b) under the Investment Company Act of 1940. (EX-99.906CERT) |