UNITED STATES
SECURITIES AND EXCHANGE COMMISSION
Washington, D.C. 20549 |
CERTIFIED SHAREHOLDER REPORT OF REGISTERED MANAGEMENT
INVESTMENT COMPANIES |
Investment Company Act file number 811- 5454
Dreyfus New Jersey Municipal Bond Fund, Inc.
(Exact name of Registrant as specified in charter) |
c/o The Dreyfus Corporation
200 Park Avenue
New York, New York 10166
(Address of principal executive offices) (Zip code) |
Michael A. Rosenberg, Esq.
200 Park Avenue
New York, New York 10166
(Name and address of agent for service) |
| Registrant's telephone number, including area code: | | (212) 922-6000 |
Date of fiscal year end: 12/31
Date of reporting period: 12/31/08
Item 1. Reports to Stockholders.
Save time. Save paper. View your next shareholder report online as soon as it’s available. Log into www.dreyfus.com and sign up for Dreyfus eCommunications. It’s simple and only takes a few minutes.
The views expressed in this report reflect those of the portfolio manager only through the end of the period covered and do not necessarily represent the views of Dreyfus or any other person in the Dreyfus organization. Any such views are subject to change at any time based upon market or other conditions and Dreyfus disclaims any responsibility to update such views.These views may not be relied on as investment advice and, because investment decisions for a Dreyfus fund are based on numerous factors, may not be relied on as an indication of trading intent on behalf of any Dreyfus fund.
Not FDIC-Insured • Not Bank-Guaranteed • May Lose Value
| | | Contents |
| |
| | | THE FUND |
| |
|
| 2 | | A Letter from the CEO |
| 3 | | Discussion of Fund Performance |
| 6 | | Fund Performance |
| 8 | | Understanding Your Fund’s Expenses |
| 8 | | Comparing Your Fund’s Expenses |
| | | With Those of Other Funds |
| 9 | | Statement of Investments |
| 25 | | Statement of Assets and Liabilities |
| 26 | | Statement of Operations |
| 27 | | Statement of Changes in Net Assets |
| 29 | | Financial Highlights |
| 34 | | Notes to Financial Statements |
| 44 | | Report of Independent Registered |
| | | Public Accounting Firm |
| 45 | | Important Tax Information |
| 46 | | Information About the Review and Approval |
| | | of the Fund’s Management Agreement |
| 51 | | Board Members Information |
| 54 | | Officers of the Fund |
| |
| | | FOR MORE INFORMATION |
| |
|
| | | Back Cover |
Dreyfus
New Jersey Municipal
Bond Fund, Inc. |

A LETTER FROM THE CEO
Dear Shareholder: |
We present to you this annual report for Dreyfus New Jersey Municipal Bond Fund, Inc., covering the 12-month period from January 1, 2008, through December 31, 2008.
2008 was by far the most difficult year this decade for the municipal bond markets.A credit crunch that began in 2007 exploded in mid-2008 into a global financial crisis, resulting in the failures of major financial institutions, a deep and prolonged recession and lower investment values across a broad range of asset classes.Governments and regulators throughout the world moved aggressively to curtail the damage, implementing unprecedented reductions of short-term interest rates, massive injections of liquidity into the banking system, government bailouts of struggling companies and plans for massive economic stimulus programs. Municipal bond prices suffered along with most other asset classes, ending the year with tax-exempt yields near generational highs that exceeded, on average, those of taxable U.S. government securities.
Although we expect the U.S. and global economies to remain weak until longstanding imbalances have worked their way out of the system, the financial markets currently appear to have priced in investors’ generally low expectations. In previous recessions, however, the markets have tended to anticipate economic improvement before it occurs, potentially leading to major rallies when few expected them.That’s why it makes sense to remain disciplined, maintain a long-term perspective and adopt a consistent asset allocation strategy that reflects one’s future goals and attitudes toward risk.As always, we urge you to consult with your financial advisor, who can recommend the course of action that is right for you.
For information about how the fund performed during the reporting period, as well as market perspectives, we have provided a Discussion of Fund Performance given by the fund’s Portfolio Manager.
Thank you for your continued confidence and support.

Jonathan R. Baum
Chief Executive Officer
The Dreyfus Corporation
January 15, 2009 |
2

DISCUSSION OF FUND PERFORMANCE
For the period of January 1, 2008, through December 31, 2008, as provided by W. Michael Petty, Senior Portfolio Manager
Fund and Market Performance Overview
For the 12-month period ended December 31, 2008, Class A, B, C, and Z shares of Dreyfus New Jersey Municipal Bond Fund produced total returns of –4.61%, –5.09%, –5.34% and –4.56%, respectively.1 In comparison, the Barclays Capital Municipal Bond Index (the “Index”), the fund’s benchmark, achieved a total return of –2.47% for the same period.2 In addition, the average total return for all funds reported in the Lipper New Jersey Municipal Debt Funds category was –8.78%.3
On December 15, 2008, the fund also began to offer Class I shares, which posted a total return of 3.61% for the period between its inception and December 31, 2008.1 Conversely the Index had a 4.56% return for the same period.2
A financial crisis and economic slowdown produced heightened volatility among many asset classes in 2008, including municipal bonds.While the fund produced lower returns than its geographically-unrestricted benchmark Index, the fund’s returns outperformed its Lipper category average, which we attribute to its focus on quality and maturities of 20 years and shorter.
The Fund’s Investment Approach
The fund normally invests at least 80% of its assets in municipal bonds that provide income exempt from federal and New Jersey personal income taxes.To pursue its goal, the fund invests at least 80% of its assets in investment-grade municipal bonds or the unrated equivalent as determined by Dreyfus.The fund may invest up to 20% of its assets in municipal bonds rated below investment grade (“high yield” or “junk” bonds) or the unrated equivalent as determined by Dreyfus.The dollar-weighted average maturity of the fund’s portfolio normally exceeds 10 years.
We may buy and sell bonds based on credit quality, market outlook and yield potential. In selecting municipal bonds for investment, we may
The Fund 3
| DISCUSSION OF FUND PERFORMANCE (continued) |
assess the current interest-rate environment and the municipal bond’s potential volatility in different rate environments.We focus on bonds with the potential to offer attractive current income, typically looking for bonds that we believe can provide consistently attractive current yields or that are trading at competitive market prices.A portion of the fund’s assets may be allocated to “discount” bonds, which are bonds that sell at a price below their face value, or to “premium” bonds, which are bonds that sell at a price above their face value.The fund’s allocation to either discount bonds or to premium bonds will change along with our changing views of the current interest-rate and market environment.We also may look to select bonds that are most likely to obtain attractive prices when sold.
Municipal Bonds: Caught in the Credit Crisis
A credit crisis originating among sub-prime mortgages sent shock-waves throughout the financial markets in 2008, as highly leveraged institutional investors were forced by massive losses to sell their more liquid and creditworthy holdings, including municipal bonds. These developments were exacerbated by declining housing prices, rising unemployment and plummeting consumer confidence, which weighed heavily on the U.S. economy.
Early in the year, the Federal Reserve Board (the “Fed”) responded to these developments with aggressive reductions of short-term interest rates and, in March, the rescue of a major investment bank. While markets stabilized, the resulting period of relative calm was brief, as the failures of several major financial institutions nearly led to the collapse of the global banking system in September 2008.The U.S. government responded with a $700 billion economic relief package for the nation’s banking system, and the Fed reduced its target for the overnight federal funds rate to a record low of 0% to 0.25% by year-end.
In addition, municipal bonds were hurt when monoline insurers incurred massive sub-prime losses, causing many insured bonds to trade at lower levels commensurate with their underlying credit characteristics.4 Finally, the slumping economy put pressure on state and local budgets, including New Jersey, further depressing investor sentiment. New Jersey currently is exploring ways to bridge projected gaps over the next several fiscal years.
4
Focus on Quality Helped Cushion Declines
While the fund was affected by the general market slump, an emphasis on higher-quality bonds enabled it to avoid the full brunt of weakness affecting lower-rated credits. A particularly favorable influence was an underweight position in New Jersey bonds backed by revenues from the state’s settlement of litigation with U.S. tobacco companies. In addition, the fund benefited from a focus on bonds with maturities of 20 years or less, which generally held up better than longer-term securities.We set the fund’s average duration in a range that was roughly in line with industry averages, a position that helped us manage risks in the volatile market environment.
Staying Cautious in a Volatile Market
As 2009 begins, the economic downturn has worsened and the financial crisis has persisted.Therefore, we have maintained a cautious investment posture in anticipation of continued volatility. However, we are watchful for opportunities to invest in fundamentally sound bonds that have been punished too severely by the financial crisis, and we believe that municipal bonds are likely to benefit over the long term as potentially rising state and federal income tax rates boost investor demand.
January 15, 2009
| 1 | | Total return includes reinvestment of dividends and any capital gains paid and does not take into |
| | | consideration the maximum initial sales charge in the case of Class A shares or the applicable |
| | | contingent deferred sales charges imposed on redemptions in the case of Class B and Class C |
| | | shares. Had these charges been reflected, returns would have been lower. Class Z and Class I |
| | | shares are not subject to any initial or deferred sales charge. Each share class is subject to a |
| | | different sales charge and distribution expense structure and will achieve different returns. Past |
| | | performance is no guarantee of future results. Share price, yield and investment return fluctuate |
| | | such that upon redemption, fund shares may be worth more or less than their original cost. Income |
| | | may be subject to state and local taxes for non-New Jersey residents, and some income may be |
| | | subject to the federal alternative minimum tax (AMT) for certain investors. Capital gains, if any, |
| | | are fully taxable. Return figures provided for Class A, B and C shares reflect the absorption of |
| | | certain fund expenses pursuant to an agreement by The Dreyfus Corporation which may be |
| | | terminated upon 90 days’ notice to shareholders. Had these expenses not been absorbed, the fund’s |
| | | returns would have been lower. |
| 2 | | SOURCE: LIPPER INC. — Reflects reinvestment of dividends and, where applicable, capital |
| | | gain distributions.The Barclays Capital Municipal Bond Index is a widely accepted, unmanaged |
| | | total return performance benchmark for the long-term, investment-grade, tax-exempt bond market. |
| | | Index returns do not reflect fees and expenses associated with operating a mutual fund. |
| 3 | | SOURCE: Lipper Inc. |
| 4 | | Third-party insurance on individual securities does not extend to the market value of the portfolio |
| | | securities or the value of the fund’s shares. |
The Fund 5
FUND PERFORMANCE
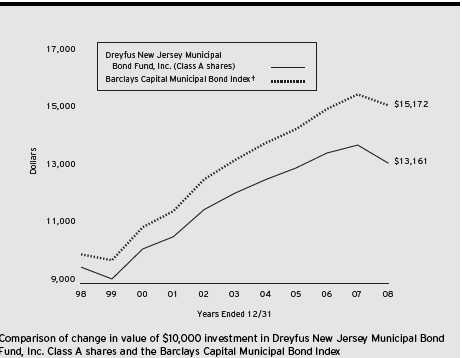
| † Source: Lipper Inc. |
| Past performance is not predictive of future performance. |
| The above graph compares a $10,000 investment made in Class A shares of Dreyfus New Jersey Municipal Bond |
| Fund, Inc. on 12/31/98 to a $10,000 investment made in the Barclays Capital Municipal Bond Index (the “Index”) |
| on that date.All dividends and capital gain distributions are reinvested. Performance for Class B, Class C, Class I and |
| Class Z shares will vary from the performance of Class A shares shown above due to differences in charges and expenses. |
| The fund invests primarily in New Jersey municipal securities and its performance shown in the line graph takes into |
| account the maximum initial sales charge on Class A shares and all applicable fees and expenses. The Index is not |
| limited to investments in New Jersey municipal obligations. The Index is an unmanaged total return performance |
| benchmark for the long-term, investment-grade, geographically unrestricted tax-exempt bond market, calculated by using |
| municipal bonds selected to be representative of the municipal market overall. Unlike a mutual fund, the Index is not |
| subject to charges, fees and other expenses. Investors cannot invest directly in any index. These factors can contribute to |
| the Index potentially outperforming or underperforming the fund. Further information relating to fund performance, |
| including expense reimbursements, if applicable, is contained in the Financial Highlights section of the prospectus and |
| elsewhere in this report. |
6
| Average Annual Total Returns as of 12/31/08 | | | | | | |
| |
| | | Inception | | | | | | | | From |
| | | Date | | 1 Year | | 5 Years | | 10 Years | | Inception |
| |
| |
| |
| |
| |
|
| Class A shares | | | | | | | | | | |
| with maximum sales charge (4.5%) | | | | (8.88)% | | 0.72% | | 2.79% | | |
| without sales charge | | | | (4.61)% | | 1.66% | | 3.26% | | |
| Class B shares | | | | | | | | | | |
| with applicable redemption charge † | | 1/7/03 | | (8.74)% | | 0.83% | | 3.15%†††,†††† | | |
| without redemption | | 1/7/03 | | (5.09)% | | 1.16% | | 3.15%†††,†††† | | |
| Class C shares | | | | | | | | | | |
| with applicable redemption charge †† | | 1/7/03 | | (6.25)% | | 0.89% | | 2.78%††† | | |
| without redemption | | 1/7/03 | | (5.34)% | | 0.89% | | 2.78%††† | | |
| Class I shares | | 12/15/08 | | (4.68)%††† | | 1.65%††† | | 3.25%††† | | |
| Class Z shares | | 6/7/07 | | (4.56)% | | — | | — | | (1.67)% |
| Past performance is not predictive of future performance.The fund’s performance shown in the graph and table does not |
| reflect the deduction of taxes that a shareholder would pay on fund distributions or the redemption of fund shares. |
| † | | The maximum contingent deferred sales charge for Class B shares is 4%.After six years Class B shares convert to |
| | | Class A shares. |
| †† | | The maximum contingent deferred sales charge for Class C shares is 1% for shares redeemed within one year of |
| | | the date of purchase. |
| ††† | | The total return performance figures presented for Class B and C shares of the fund reflect the performance of the |
| | | fund’s Class A shares for periods prior to 1/7/03 (the inception date for Class B and C shares), adjusted to reflect |
| | | the applicable sales load for that class and the applicable distribution/servicing fees thereafter. |
| | | The total return performance figures presented for Class I shares of the fund reflect the performance of the fund’s |
| | | Class A shares for periods prior to 12/15/08 (the inception date for Class I shares), adjusted to reflect the |
| | | applicable sales load for that class and the applicable distribution/servicing fees thereafter. |
| †††† | | Assumes the conversion of Class B shares to Class A shares at the end of the sixth year following the date |
| | | of purchase. |
The Fund 7
UNDERSTANDING YOUR FUND’S EXPENSES (Unaudited)
As a mutual fund investor, you pay ongoing expenses, such as management fees and other expenses. Using the information below, you can estimate how these expenses affect your investment and compare them with the expenses of other funds.You also may pay one-time transaction expenses, including sales charges (loads) and redemption fees, which are not shown in this section and would have resulted in higher total expenses. For more information, see your fund’s prospectus or talk to your financial adviser.
Review your fund’s expenses
The table below shows the expenses you would have paid on a $1,000 investment in Dreyfus New Jersey Municipal Bond Fund, Inc. from July 1, 2008 to December 31, 2008. It also shows how much a $1,000 investment would be worth at the close of the period, assuming actual returns and expenses.
| Expenses and Value of a $1,000 Investment | | | | | | |
| assuming actual returns for the six months ended December 31, 2008† | | | | |
| | | Class A | | Class B | | Class C | | Class I | | Class Z |
| |
| |
| |
| |
| |
|
| Expenses paid per $1,000†† | | $ 4.32 | | $ 6.77 | | $ 7.99 | | $ .33 | | $ 4.07 |
| Ending value (after expenses) | | $952.80 | | $951.10 | | $949.10 | | $1,036.10 | | $953.00 |
| COMPARING YOUR FUND’S EXPENSES |
| WITH THOSE OF OTHER FUNDS (Unaudited) |
Using the SEC’s method to compare expenses
The Securities and Exchange Commission (SEC) has established guidelines to help investors assess fund expenses. Per these guidelines, the table below shows your fund’s expenses based on a $1,000 investment, assuming a hypothetical 5% annualized return. You can use this information to compare the ongoing expenses (but not transaction expenses or total cost) of investing in the fund with those of other funds.All mutual fund shareholder reports will provide this information to help you make this comparison. Please note that you cannot use this information to estimate your actual ending account balance and expenses paid during the period.
| Expenses and Value of a $1,000 Investment | | | | | | |
| assuming a hypothetical 5% annualized return for the six months ended December 31, 2008††† |
| | | Class A | | Class B | | Class C | | Class I | | Class Z |
| |
| |
| |
| |
| |
|
| Expenses paid per $1,000†††† | | $ 4.47 | | $ 7.00 | | $ 8.26 | | $ 3.56 | | $ 4.22 |
| Ending value (after expenses) | | $1,020.71 | | $1,018.20 | | $1,016.94 | | $1,021.62 | | $1,020.96 |
| † | | From December 15, 2008 (commencement of initial offering) to December 31, 2008 for Class I. |
| †† | | Expenses are equal to the fund’s annualized expense ratio of .88% for Class A, 1.38% for Class B, 1.63% for |
| | | Class C and .83% for Class Z; multiplied by the average account value over the period, multiplied by 184/366 |
| | | (to reflect the one-half year period), and .70% for Class I, multiplied by the average account over the period, |
| | | multiplied by 17/366 (to reflect actual days in the period). |
| ††† | | Please note that while Class I commenced operations on December 15, 2008, the Hypothetical expenses paid |
| | | during the period reflect projected activity for the full six month period for purposes of comparability.This projection |
| | | assumes that annualized expense ratios were in effect during the period July 1, 2008 to December 31, 2008. |
| †††† | | Expenses are equal to the fund’s annualized expense ratio of .88% for Class A, 1.38% for Class B, 1.63% for |
| | | Class C, .70% for Class I and .83% for Class Z, multiplied by the average account value over the period, |
| | | multiplied by 184/366 (to reflect the one-half year period). |
8
| STATEMENT OF INVESTMENTS |
| December 31, 2008 |
| Long-Term Municipal | | Coupon | | Maturity | | Principal | | | |
| Investments—96.5% | | Rate (%) | | Date | | Amount ($) | | | Value ($) |
| |
| |
| |
|
| |
|
| New Jersey—92.7% | | | | | | | | | |
| Atlantic County Utilities | | | | | | | | | |
| Authority, Solid Waste System | | | | | | | | | |
| Revenue | | 7.13 | | 3/1/16 | | 13,250,000 | | | 12,241,410 |
| Bayonne Redevelopment Agency, | | | | | | | | | |
| Revenue (Royal Caribbean | | | | | | | | | |
| Project) | | 5.38 | | 11/1/35 | | 4,120,000 | | | 2,215,818 |
| Bergen County Utilities Authority, | | | | | | | | | |
| Water Pollution Control | | | | | | | | | |
| Revenue (Insured; FGIC) | | 5.38 | | 12/15/13 | | 1,155,000 | | | 1,213,096 |
| Bordentown Sewer Authority, | | | | | | | | | |
| Revenue (Insured; FGIC) | | 5.38 | | 12/1/20 | | 3,880,000 | | | 3,923,068 |
| Burlington County Bridge | | | | | | | | | |
| Commission, EDR (The | | | | | | | | | |
| Evergreens Project) | | 5.63 | | 1/1/38 | | 2,500,000 | | | 1,382,650 |
| Camden, | | | | | | | | | |
| GO (Insured; FSA) | | 0.00 | | 2/15/12 | | 4,385,000 | a | | 3,921,067 |
| Camden County Improvement | | | | | | | | | |
| Authority, Health Care | | | | | | | | | |
| Redevelopment Project Revenue | | | | | | | | | |
| (The Cooper Health System | | | | | | | | | |
| Obligated Group Issue) | | 5.25 | | 2/15/20 | | 4,545,000 | | | 3,337,575 |
| Camden County Improvement | | | | | | | | | |
| Authority, Health Care | | | | | | | | | |
| Redevelopment Project Revenue | | | | | | | | | |
| (The Cooper Health System | | | | | | | | | |
| Obligated Group Issue) | | 5.25 | | 2/15/20 | | 2,000,000 | | | 1,468,680 |
| Carteret Board of Education, | | | | | | | | | |
| COP (Insured; MBIA, Inc.) | | 6.00 | | 1/15/10 | | 440,000 | b | | 468,054 |
| East Orange, | | | | | | | | | |
| GO (Insured; FSA) | | 0.00 | | 8/1/10 | | 4,240,000 | a | | 4,117,252 |
| East Orange, | | | | | | | | | |
| GO (Insured; FSA) | | 0.00 | | 8/1/11 | | 2,500,000 | a | | 2,365,025 |
| East Orange Board of Education, | | | | | | | | | |
| COP, LR (Insured; FSA) | | 0.00 | | 2/1/21 | | 685,000 | a | | 360,995 |
| East Orange Board of Education, | | | | | | | | | |
| COP, LR (Insured; FSA) | | 0.00 | | 2/1/26 | | 745,000 | a | | 275,397 |
| East Orange Board of Education, | | | | | | | | | |
| COP, LR (Insured; FSA) | | 0.00 | | 2/1/28 | | 2,345,000 | a | | 749,696 |
The Fund 9
| STATEMENT OF INVESTMENTS (continued) |
| Long-Term Municipal | | Coupon | | Maturity | | Principal | | | |
| Investments (continued) | | Rate (%) | | Date | | Amount ($) | | | Value ($) |
| |
| |
| |
|
| |
|
| New Jersey (continued) | | | | | | | | | |
| Essex County Improvement | | | | | | | | | |
| Authority, LR (County | | | | | | | | | |
| Correctional Facility Project) | | | | | | | | | |
| (Insured; FGIC) | | 6.00 | | 10/1/10 | | 10,000,000 | b | | 10,807,600 |
| Freehold Regional High School | | | | | | | | | |
| District, School District | | | | | | | | | |
| Bonds (Guaranteed; School Bond | | | | | | | | | |
| Reserve Act and Insured; FGIC) | | 5.50 | | 3/1/09 | | 1,450,000 | | | 1,461,353 |
| Freehold Regional High School | | | | | | | | | |
| District, School District | | | | | | | | | |
| Bonds (Guaranteed; School Bond | | | | | | | | | |
| Reserve Act and Insured; FGIC) | | 5.50 | | 3/1/10 | | 2,460,000 | | | 2,583,320 |
| Gloucester County Improvement | | | | | | | | | |
| Authority, County Guaranteed | | | | | | | | | |
| Loan Revenue (County Capital | | | | | | | | | |
| Program) | | 5.00 | | 4/1/38 | | 8,000,000 | | | 7,713,680 |
| Gloucester Township Municipal | | | | | | | | | |
| Utilities Authority, Sewer | | | | | | | | | |
| Revenue (Insured; AMBAC) | | 5.65 | | 3/1/18 | | 2,530,000 | | | 2,752,944 |
| Higher Education Student | | | | | | | | | |
| Assistance Authority of New | | | | | | | | | |
| Jersey, Student Loan Revenue | | | | | | | | | |
| (Insured; MBIA, Inc.) | | 6.13 | | 6/1/17 | | 280,000 | | | 283,181 |
| Hudson County Improvement | | | | | | | | | |
| Authority, Harrison Stadium | | | | | | | | | |
| Land Acquisition Special | | | | | | | | | |
| Obligation Revenue (Harrison | | | | | | | | | |
| Redevelopment Project) | | | | | | | | | |
| (Insured; MBIA, Inc.) | | 0.00 | | 12/15/34 | | 3,000,000 | a | | 564,540 |
| Jersey City, | | | | | | | | | |
| GO (Insured; FSA) | | 0.00 | | 5/15/10 | | 4,745,000 | a | | 4,569,909 |
| Jersey City, | | | | | | | | | |
| Public Improvement Revenue | | | | | | | | | |
| (Insured; MBIA, Inc.) | | 5.25 | | 9/1/09 | | 1,605,000 | b | | 1,670,019 |
| Mercer County Improvement | | | | | | | | | |
| Authority, County Secured Open | | | | | | | | | |
| Space Revenue (Insured; MBIA, Inc.) | | 5.00 | | 8/1/40 | | 3,290,000 | | | 3,117,143 |
| Middlesex County Improvement | | | | | | | | | |
| Authority, Utility System | | | | | | | | | |
| Revenue (Perth Amboy Project) | | | | | | | | | |
| (Insured; AMBAC) | | 0.00 | | 9/1/20 | | 3,745,000 | a | | 1,947,700 |
10
| Long-Term Municipal | | Coupon | | Maturity | | Principal | | |
| Investments (continued) | | Rate (%) | | Date | | Amount ($) | | Value ($) |
| |
| |
| |
| |
|
| New Jersey (continued) | | | | | | | | |
| Middlesex County Improvement | | | | | | | | |
| Authority, Utility System | | | | | | | | |
| Revenue (Perth Amboy Project) | | | | | | | | |
| (Insured; AMBAC) | | 0.00 | | 9/1/22 | | 4,740,000 a | | 2,112,144 |
| Middlesex County Utilities | | | | | | | | |
| Authority, Sewer Revenue | | | | | | | | |
| (Insured; MBIA, Inc.) | | 6.25 | | 8/15/10 | | 650,000 | | 670,585 |
| New Jersey, | | | | | | | | |
| GO (Insured; MBIA, Inc.) | | 6.00 | | 7/15/10 | | 7,400,000 | | 7,891,508 |
| New Jersey Economic Development | | | | | | | | |
| Authority, Cigarette Tax | | | | | | | | |
| Revenue | | 5.50 | | 6/15/24 | | 2,300,000 | | 1,699,608 |
| New Jersey Economic Development | | | | | | | | |
| Authority, Cigarette Tax | | | | | | | | |
| Revenue | | 5.75 | | 6/15/29 | | 12,500,000 | | 9,021,875 |
| New Jersey Economic Development | | | | | | | | |
| Authority, Department of Human | | | | | | | | |
| Services Composite Revenue | | | | | | | | |
| (Division of Developmental | | | | | | | | |
| Disabilities) | | 6.25 | | 7/1/24 | | 1,255,000 | | 1,265,956 |
| New Jersey Economic Development | | | | | | | | |
| Authority, Department of Human | | | | | | | | |
| Services Composite Revenue | | | | | | | | |
| (Division of Mental Health Services) | | 6.10 | | 7/1/17 | | 2,555,000 | | 2,653,316 |
| New Jersey Economic Development | | | | | | | | |
| Authority, District Heating | | | | | | | | |
| and Cooling Revenue | | | | | | | | |
| (Trigen-Trenton District | | | | | | | | |
| Energy Company L.P. Project) | | 6.20 | | 12/1/10 | | 2,705,000 | | 2,702,836 |
| New Jersey Economic Development | | | | | | | | |
| Authority, EDR (American | | | | | | | | |
| Airlines, Inc. Project) | | 7.10 | | 11/1/31 | | 1,085,000 | | 447,660 |
| New Jersey Economic Development | | | | | | | | |
| Authority, EDR (Masonic | | | | | | | | |
| Charity Foundation of New | | | | | | | | |
| Jersey Project) | | 5.00 | | 6/1/18 | | 1,680,000 | | 1,639,781 |
| New Jersey Economic Development | | | | | | | | |
| Authority, EDR (Masonic | | | | | | | | |
| Charity Foundation of New | | | | | | | | |
| Jersey Project) | | 5.88 | | 6/1/18 | | 2,750,000 | | 2,759,267 |
The Fund 11
| STATEMENT OF INVESTMENTS (continued) |
| Long-Term Municipal | | Coupon | | Maturity | | Principal | | | |
| Investments (continued) | | Rate (%) | | Date | | Amount ($) | | | Value ($) |
| |
| |
| |
|
| |
|
| New Jersey (continued) | | | | | | | | | |
| New Jersey Economic Development | | | | | | | | | |
| Authority, EDR (Masonic | | | | | | | | | |
| Charity Foundation of New | | | | | | | | | |
| Jersey Project) | | 5.50 | | 6/1/21 | | 1,920,000 | | | 1,771,066 |
| New Jersey Economic Development | | | | | | | | | |
| Authority, EDR (Masonic | | | | | | | | | |
| Charity Foundation of New | | | | | | | | | |
| Jersey Project) | | 6.00 | | 6/1/25 | | 1,000,000 | | | 933,220 |
| New Jersey Economic Development | | | | | | | | | |
| Authority, EDR (Masonic | | | | | | | | | |
| Charity Foundation of New | | | | | | | | | |
| Jersey Project) | | 5.25 | | 6/1/32 | | 350,000 | | | 297,164 |
| New Jersey Economic Development | | | | | | | | | |
| Authority, EDR (United | | | | | | | | | |
| Methodist Homes of New Jersey | | | | | | | | | |
| Obligated Group Issue) | | 5.50 | | 7/1/19 | | 3,000,000 | | | 2,212,710 |
| New Jersey Economic Development | | | | | | | | | |
| Authority, First Mortgage Revenue | | | | | | | | | |
| (Fellowship Village Project) | | 5.50 | | 1/1/18 | | 2,950,000 | | | 2,979,500 |
| New Jersey Economic Development | | | | | | | | | |
| Authority, First Mortgage Revenue | | | | | | | | | |
| (Fellowship Village Project) | | 5.50 | | 1/1/25 | | 3,000,000 | | | 3,030,000 |
| New Jersey Economic Development | | | | | | | | | |
| Authority, Motor Vehicle | | | | | | | | | |
| Surcharge Revenue (Insured; | | | | | | | | | |
| MBIA, Inc.) | | 0.00 | | 7/1/20 | | 3,350,000 | a | | 1,805,081 |
| New Jersey Economic Development | | | | | | | | | |
| Authority, Motor Vehicle | | | | | | | | | |
| Surcharge Revenue (Insured; | | | | | | | | | |
| MBIA, Inc.) | | 0.00 | | 7/1/21 | | 2,620,000 | a | | 1,312,515 |
| New Jersey Economic Development | | | | | | | | | |
| Authority, Retirement | | | | | | | | | |
| Community Revenue (Seabrook | | | | | | | | | |
| Village, Inc. Facility) | | 5.25 | | 11/15/26 | | 1,700,000 | | | 1,019,439 |
| New Jersey Economic Development | | | | | | | | | |
| Authority, Revenue (Department | | | | | | | | | |
| of Human Services Pooled | | | | | | | | | |
| Financing Program) | | 5.75 | | 7/1/14 | | 1,080,000 | | | 1,164,197 |
| New Jersey Economic Development | | | | | | | | | |
| Authority, Revenue (Hillcrest | | | | | | | | | |
| Health Service System Project) | | | | | | | | | |
| (Insured; AMBAC) | | 0.00 | | 1/1/12 | | 1,000,000 | a | | 886,670 |
12
| Long-Term Municipal | | Coupon | | Maturity | | Principal | | | |
| Investments (continued) | | Rate (%) | | Date | | Amount ($) | | | Value ($) |
| |
| |
| |
|
| |
|
| New Jersey (continued) | | | | | | | | | |
| New Jersey Economic Development | | | | | | | | | |
| Authority, Revenue (Hillcrest | | | | | | | | | |
| Health Service System Project) | | | | | | | | | |
| (Insured; AMBAC) | | 0.00 | | 1/1/13 | | 1,000,000 | a | | 843,520 |
| New Jersey Economic Development | | | | | | | | | |
| Authority, Revenue (Hillcrest | | | | | | | | | |
| Health Service System Project) | | | | | | | | | |
| (Insured; AMBAC) | | 0.00 | | 1/1/15 | | 3,250,000 | a | | 2,469,513 |
| New Jersey Economic Development | | | | | | | | | |
| Authority, Revenue (Hillcrest | | | | | | | | | |
| Health Service System Project) | | | | | | | | | |
| (Insured; AMBAC) | | 0.00 | | 1/1/17 | | 5,000,000 | a | | 3,331,550 |
| New Jersey Economic Development | | | | | | | | | |
| Authority, Revenue (Hillcrest | | | | | | | | | |
| Health Service System Project) | | | | | | | | | |
| (Insured; AMBAC) | | 0.00 | | 1/1/18 | | 2,500,000 | a | | 1,555,800 |
| New Jersey Economic Development | | | | | | | | | |
| Authority, Revenue (Hillcrest | | | | | | | | | |
| Health Service System Project) | | | | | | | | | |
| (Insured; AMBAC) | | 0.00 | | 1/1/20 | | 6,500,000 | a | | 3,447,080 |
| New Jersey Economic Development | | | | | | | | | |
| Authority, Revenue (Hillcrest | | | | | | | | | |
| Health Service System Project) | | | | | | | | | |
| (Insured; AMBAC) | | 0.00 | | 1/1/22 | | 6,000,000 | a | | 2,716,260 |
| New Jersey Economic Development | | | | | | | | | |
| Authority, Revenue (Transportation | | | | | | | | | |
| Project) (Insured; FSA) | | 5.25 | | 5/1/11 | | 2,210,000 | | | 2,342,909 |
| New Jersey Economic Development | | | | | | | | | |
| Authority, School Facilities | | | | | | | | | |
| Construction Revenue | | 5.00 | | 9/1/37 | | 1,000,000 | | | 902,940 |
| New Jersey Economic Development | | | | | | | | | |
| Authority, School Facilities | | | | | | | | | |
| Construction Revenue | | | | | | | | | |
| (Insured; AMBAC) | | 5.25 | | 6/15/11 | | 10,000,000 | b | | 10,906,300 |
| New Jersey Economic Development | | | | | | | | | |
| Authority, School Facilities | | | | | | | | | |
| Construction Revenue | | | | | | | | | |
| (Insured; AMBAC) | | 5.50 | | 9/1/24 | | 4,300,000 | | | 4,416,745 |
| New Jersey Economic Development | | | | | | | | | |
| Authority, School Facilities | | | | | | | | | |
| Construction Revenue | | | | | | | | | |
| (Insured; AMBAC) | | 5.00 | | 9/1/37 | | 9,000,000 | | | 8,126,460 |
The Fund 13
| STATEMENT OF INVESTMENTS (continued) |
| Long-Term Municipal | | Coupon | | Maturity | | Principal | | |
| Investments (continued) | | Rate (%) | | Date | | Amount ($) | | Value ($) |
| |
| |
| |
| |
|
| New Jersey (continued) | | | | | | | | |
| New Jersey Economic Development | | | | | | | | |
| Authority, School Facilities | | | | | | | | |
| Construction Revenue | | | | | | | | |
| (Insured; FGIC) | | 5.50 | | 9/1/27 | | 10,000,000 | | 10,045,600 |
| New Jersey Economic | | | | | | | | |
| Development Authority, | | | | | | | | |
| Special Facility Revenue | | | | | | | | |
| (Continental Airlines, | | | | | | | | |
| Inc. Project) | | 6.25 | | 9/15/19 | | 5,000,000 | | 2,858,850 |
| New Jersey Economic | | | | | | | | |
| Development Authority, | | | | | | | | |
| State LR (State Office | | | | | | | | |
| Buildings Project) | | | | | | | | |
| (Insured; AMBAC) | | 6.00 | | 6/15/10 | | 2,425,000 b | | 2,596,472 |
| New Jersey Economic Development | | | | | | | | |
| Authority, Waste Paper | | | | | | | | |
| Recycling Revenue (Marcal | | | | | | | | |
| Paper Mills Inc. Project) | | 6.25 | | 2/1/09 | | 1,485,000 | | 1,475,689 |
| New Jersey Educational Facilities | | | | | | | | |
| Authority, Revenue (Fairleigh | | | | | | | | |
| Dickenson University Issue) | | 6.00 | | 7/1/20 | | 4,535,000 | | 3,720,514 |
| New Jersey Educational Facilities | | | | | | | | |
| Authority, Revenue (Georgian | | | | | | | | |
| Court University Project) | | 5.00 | | 7/1/27 | | 1,000,000 | | 836,590 |
| New Jersey Educational Facilities | | | | | | | | |
| Authority, Revenue (Georgian | | | | | | | | |
| Court University Project) | | 5.25 | | 7/1/27 | | 500,000 | | 431,605 |
| New Jersey Educational Facilities | | | | | | | | |
| Authority, Revenue (Georgian | | | | | | | | |
| Court University Project) | | 5.00 | | 7/1/33 | | 1,880,000 | | 1,489,374 |
| New Jersey Educational Facilities | | | | | | | | |
| Authority, Revenue (Georgian | | | | | | | | |
| Court University Project) | | 5.25 | | 7/1/37 | | 750,000 | | 599,333 |
| New Jersey Educational Facilities | | | | | | | | |
| Authority, Revenue (New Jersey | | | | | | | | |
| City University Issue) | | | | | | | | |
| (Insured; Assured Guaranty) | | 5.00 | | 7/1/35 | | 12,165,000 | | 11,766,231 |
| New Jersey Educational Facilities | | | | | | | | |
| Authority, Revenue (Princeton | | | | | | | | |
| University) | | 5.25 | | 7/1/10 | | 2,885,000 b | | 3,063,293 |
14
| Long-Term Municipal | | Coupon | | Maturity | | Principal | | | |
| Investments (continued) | | Rate (%) | | Date | | Amount ($) | | | Value ($) |
| |
| |
| |
|
| |
|
| New Jersey (continued) | | | | | | | | | |
| New Jersey Educational Facilities | | | | | | | | | |
| Authority, Revenue (Princeton | | | | | | | | | |
| University) | | 5.00 | | 7/1/15 | | 120,000 | b | | 138,948 |
| New Jersey Educational Facilities | | | | | | | | | |
| Authority, Revenue (Public | | | | | | | | | |
| Library Project Grant Program | | | | | | | | | |
| Issue) (Insured; AMBAC) | | 5.50 | | 9/1/17 | | 1,500,000 | | | 1,606,380 |
| New Jersey Educational Facilities | | | | | | | | | |
| Authority, Revenue (Public | | | | | | | | | |
| Library Project Grant Program | | | | | | | | | |
| Issue) (Insured; AMBAC) | | 5.00 | | 9/1/22 | | 5,500,000 | | | 5,551,480 |
| New Jersey Educational Facilities | | | | | | | | | |
| Authority, Revenue (Rowan | | | | | | | | | |
| University Issue) (Insured; FGIC) | | 5.75 | | 7/1/10 | | 15,405,000 | b | | 16,406,941 |
| New Jersey Educational Facilities | | | | | | | | | |
| Authority, Revenue (Seton Hall | | | | | | | | | |
| University Issue) | | 6.25 | | 7/1/37 | | 5,000,000 | | | 5,153,300 |
| New Jersey Educational Facilities | | | | | | | | | |
| Authority, Revenue (Stevens | | | | | | | | | |
| Institute of Technology Issue) | | 5.38 | | 7/1/14 | | 2,500,000 | b | | 2,901,350 |
| New Jersey Educational Facilities | | | | | | | | | |
| Authority, Revenue (Stevens | | | | | | | | | |
| Institute of Technology Issue) | | 5.00 | | 7/1/27 | | 5,000,000 | | | 3,547,400 |
| New Jersey Educational Facilities | | | | | | | | | |
| Authority, Revenue (Stevens | | | | | | | | | |
| Institute of Technology Issue) | | 5.00 | | 7/1/34 | | 7,655,000 | | | 5,020,226 |
| New Jersey Educational Facilities | | | | | | | | | |
| Authority, Revenue (The | | | | | | | | | |
| College of New Jersey Issue) | | | | | | | | | |
| (Insured; FSA) | | 5.00 | | 7/1/35 | | 7,910,000 | | | 7,541,790 |
| New Jersey Educational Facilities | | | | | | | | | |
| Authority, Revenue (The | | | | | | | | | |
| Richard Stockton College of | | | | | | | | | |
| New Jersey Issue) (Insured; | | | | | | | | | |
| MBIA, Inc.) | | 5.00 | | 7/1/34 | | 4,005,000 | | | 3,547,188 |
| New Jersey Educational Facilities | | | | | | | | | |
| Authority, Revenue (The | | | | | | | | | |
| Richard Stockton College of | | | | | | | | | |
| New Jersey Issue) (Insured; | | | | | | | | | |
| MBIA, Inc.) | | 5.00 | | 7/1/37 | | 6,945,000 | | | 6,087,570 |
The Fund 15
| STATEMENT OF INVESTMENTS (continued) |
| Long-Term Municipal | | Coupon | | Maturity | | Principal | | | |
| Investments (continued) | | Rate (%) | | Date | | Amount ($) | | | Value ($) |
| |
| �� |
| |
|
| |
|
| New Jersey (continued) | | | | | | | | | |
| New Jersey Educational Facilities | | | | | | | | | |
| Authority, Revenue (The | | | | | | | | | |
| William Paterson University of | | | | | | | | | |
| New Jersey Issue) (Insured; | | | | | | | | | |
| Assured Guaranty) | | 5.00 | | 7/1/38 | | 3,745,000 | | | 3,583,703 |
| New Jersey Environmental | | | | | | | | | |
| Infrastructure Trust, | | | | | | | | | |
| Environmental Infrastructure Bonds | | 5.25 | | 9/1/10 | | 4,070,000 | b | | 4,383,186 |
| New Jersey Health Care Facilities | | | | | | | | | |
| Financing Authority, Revenue | | | | | | | | | |
| (Atlantic City Medical Center Issue) | | 6.00 | | 7/1/12 | | 6,145,000 | | | 6,518,186 |
| New Jersey Health Care Facilities | | | | | | | | | |
| Financing Authority, Revenue | | | | | | | | | |
| (Atlantic City Medical Center Issue) | | 6.25 | | 7/1/12 | | 2,270,000 | b | | 2,570,276 |
| New Jersey Health Care Facilities | | | | | | | | | |
| Financing Authority, Revenue | | | | | | | | | |
| (Atlantic City Medical Center Issue) | | 6.25 | | 7/1/17 | | 2,730,000 | | | 2,739,746 |
| New Jersey Health Care Facilities | | | | | | | | | |
| Financing Authority, Revenue | | | | | | | | | |
| (Capital Health System | | | | | | | | | |
| Obligated Group Issue) | | 5.75 | | 7/1/23 | | 3,000,000 | | | 2,591,850 |
| New Jersey Health Care Facilities | | | | | | | | | |
| Financing Authority, Revenue | | | | | | | | | |
| (General Hospital Center at | | | | | | | | | |
| Passaic, Inc. Obligated Group | | | | | | | | | |
| Issue) (Insured; FSA) | | 6.75 | | 7/1/19 | | 550,000 | | | 674,140 |
| New Jersey Health Care Facilities | | | | | | | | | |
| Financing Authority, Revenue | | | | | | | | | |
| (Hackensack University Medical | | | | | | | | | |
| Center Issue) (Insured; | | | | | | | | | |
| Assured Guaranty) | | 5.25 | | 1/1/31 | | 3,750,000 | | | 3,530,962 |
| New Jersey Health Care Facilities | | | | | | | | | |
| Financing Authority, Revenue | | | | | | | | | |
| (Hackensack University Medical | | | | | | | | | |
| Center Issue) (Insured; | | | | | | | | | |
| Assured Guaranty) | | 5.25 | | 1/1/36 | | 3,000,000 | | | 2,768,610 |
| New Jersey Health Care Facilities | | | | | | | | | |
| Financing Authority, Revenue | | | | | | | | | |
| (Kimball Medical Center Issue) | | | | | | | | | |
| (Insured; AMBAC) | | 7.00 | | 7/1/20 | | 6,000,000 | | | 5,999,040 |
16
| Long-Term Municipal | | Coupon | | Maturity | | Principal | | | |
| Investments (continued) | | Rate (%) | | Date | | Amount ($) | | | Value ($) |
| |
| |
| |
|
| |
|
| New Jersey (continued) | | | | | | | | | |
| New Jersey Health Care Facilities | | | | | | | | | |
| Financing Authority, Revenue | | | | | | | | | |
| (Meridian Health System | | | | | | | | | |
| Obligated Group Issue) | | | | | | | | | |
| (Insured; Assured Guaranty) | | 5.00 | | 7/1/38 | | 5,000,000 | | | 4,535,950 |
| New Jersey Health Care Facilities | | | | | | | | | |
| Financing Authority, Revenue | | | | | | | | | |
| (Robert Wood Johnson | | | | | | | | | |
| University Hospital Issue) | | 5.38 | | 7/1/13 | | 2,000,000 | | | 2,067,000 |
| New Jersey Health Care Facilities | | | | | | | | | |
| Financing Authority, Revenue | | | | | | | | | |
| (Saint Barnabas Health Care | | | | | | | | | |
| System Issue) (Insured; MBIA, Inc.) | | 0.00 | | 7/1/23 | | 2,280,000 | a | | 1,213,006 |
| New Jersey Health Care Facilities | | | | | | | | | |
| Financing Authority, Revenue | | | | | | | | | |
| (Saint Barnabas Health Care | | | | | | | | | |
| System Issue) (Insured; MBIA, Inc.) | | 0.00 | | 7/1/23 | | 3,220,000 | a | | 999,939 |
| New Jersey Health Care Facilities | | | | | | | | | |
| Financing Authority, Revenue | | | | | | | | | |
| (Saint Joseph’s Healthcare | | | | | | | | | |
| System Obligated Group Issue) | | 6.00 | | 7/1/18 | | 1,000,000 | | | 819,140 |
| New Jersey Health Care Facilities | | | | | | | | | |
| Financing Authority, Revenue | | | | | | | | | |
| (Saint Joseph’s Healthcare | | | | | | | | | |
| System Obligated Group Issue) | | 6.63 | | 7/1/38 | | 4,000,000 | | | 2,836,920 |
| New Jersey Health Care Facilities | | | | | | | | | |
| Financing Authority, Revenue | | | | | | | | | |
| (South Jersey Hospital Issue) | | 6.00 | | 7/1/12 | | 2,475,000 | | | 2,586,177 |
| New Jersey Health Care Facilities | | | | | | | | | |
| Financing Authority, Revenue | | | | | | | | | |
| (Trinitas Hospital Obligated Group) | | 7.38 | | 7/1/10 | | 4,000,000 | b | | 4,338,440 |
| New Jersey Health Care Facilities | | | | | | | | | |
| Financing Authority, State | | | | | | | | | |
| Contract Revenue (Hospital | | | | | | | | | |
| Asset Transformation Program) | | 5.25 | | 10/1/38 | | 12,595,000 | | | 10,969,993 |
| New Jersey Higher Education | | | | | | | | | |
| Student Assistance Authority, | | | | | | | | | |
| Student Loan Revenue (Insured; | | | | | | | | | |
| Assured Guaranty) | | 5.88 | | 6/1/21 | | 12,000,000 | | | 11,587,440 |
The Fund 17
| STATEMENT OF INVESTMENTS (continued) |
| Long-Term Municipal | | Coupon | | Maturity | | Principal | | | |
| Investments (continued) | | Rate (%) | | Date | | Amount ($) | | | Value ($) |
| |
| |
| |
|
| |
|
| New Jersey (continued) | | | | | | | | | |
| New Jersey Highway Authority, | | | | | | | | | |
| Revenue (Garden State Parkway) | | 6.00 | | 1/1/19 | | 6,645,000 | | | 7,926,289 |
| New Jersey Housing and Mortgage | | | | | | | | | |
| Finance Agency, Home Buyer | | | | | | | | | |
| Revenue (Insured; MBIA, Inc.) | | 5.75 | | 4/1/18 | | 1,120,000 | | | 1,114,333 |
| New Jersey Housing and Mortgage | | | | | | | | | |
| Finance Agency, Home Buyer | | | | | | | | | |
| Revenue (Insured; MBIA, Inc.) | | 5.30 | | 4/1/26 | | 335,000 | | | 329,948 |
| New Jersey Housing and Mortgage | | | | | | | | | |
| Finance Agency, MFHR (Insured: | | | | | | | | | |
| AMBAC and FHA) | | 5.65 | | 5/1/40 | | 4,480,000 | | | 3,883,174 |
| New Jersey Housing and Mortgage | | | | | | | | | |
| Finance Agency, MFHR | | | | | | | | | |
| (Insured; FSA) | | 5.70 | | 5/1/20 | | 2,320,000 | | | 2,329,953 |
| New Jersey Housing and Mortgage | | | | | | | | | |
| Finance Agency, SFHR | | 6.38 | | 10/1/28 | | 6,000,000 | | | 6,119,220 |
| New Jersey Housing and Mortgage | | | | | | | | | |
| Finance Agency, SFHR | | 5.25 | | 10/1/37 | | 2,240,000 | | | 2,138,550 |
| New Jersey Transit Corporation, | | | | | | | | | |
| Federal Transit Administration | | | | | | | | | |
| Grants, COP (Master Lease | | | | | | | | | |
| Agreement) (Insured; AMBAC) | | 5.75 | | 9/15/10 | | 5,000,000 | b | | 5,377,900 |
| New Jersey Transportation Trust | | | | | | | | | |
| Fund Authority (Transportation | | | | | | | | | |
| System) | | 5.50 | | 6/15/09 | | 2,725,000 | | | 2,785,577 |
| New Jersey Transportation Trust | | | | | | | | | |
| Fund Authority (Transportation | | | | | | | | | |
| System) | | 5.00 | | 6/15/20 | | 4,000,000 | | | 4,071,200 |
| New Jersey Transportation Trust | | | | | | | | | |
| Fund Authority (Transportation | | | | | | | | | |
| System) | | 5.50 | | 12/15/23 | | 7,000,000 | | | 7,194,950 |
| New Jersey Transportation Trust | | | | | | | | | |
| Fund Authority (Transportation | | | | | | | | | |
| System) | | 6.00 | | 12/15/38 | | 10,000,000 | | | 10,179,600 |
| New Jersey Transportation Trust | | | | | | | | | |
| Fund Authority (Transportation | | | | | | | | | |
| System) (Insured; AMBAC) | | 0.00 | | 12/15/24 | | 1,000,000 | a | | 385,760 |
| New Jersey Transportation Trust | | | | | | | | | |
| Fund Authority (Transportation | | | | | | | | | |
| System) (Insured; AMBAC) | | 5.00 | | 12/15/32 | | 10,000,000 | | | 9,067,000 |
18
| Long-Term Municipal | | Coupon | | Maturity | | Principal | | |
| Investments (continued) | | Rate (%) | | Date | | Amount ($) | | Value ($) |
| |
| |
| |
| |
|
| New Jersey (continued) | | | | | | | | |
| New Jersey Transportation Trust | | | | | | | | |
| Fund Authority (Transportation | | | | | | | | |
| System) (Insured; AMBAC) | | 5.00 | | 12/15/34 | | 5,150,000 | | 4,625,988 |
| New Jersey Transportation Trust | | | | | | | | |
| Fund Authority (Transportation | | | | | | | | |
| System) (Insured; MBIA, Inc.) | | 6.00 | | 12/15/11 | | 5,000,000 b | | 5,640,150 |
| New Jersey Transportation Trust | | | | | | | | |
| Fund Authority (Transportation | | | | | | | | |
| System) (Insured; MBIA, Inc.) | | 7.00 | | 6/15/12 | | 2,255,000 | | 2,646,942 |
| New Jersey Transportation Trust | | | | | | | | |
| Fund Authority (Transportation | | | | | | | | |
| System) (Insured; MBIA, Inc.) | | 7.00 | | 6/15/12 | | 3,745,000 | | 4,229,229 |
| New Jersey Turnpike Authority, | | | | | | | | |
| Turnpike Revenue | | 6.50 | | 1/1/16 | | 60,000 | | 69,317 |
| New Jersey Turnpike Authority, | | | | | | | | |
| Turnpike Revenue | | 6.50 | | 1/1/16 | | 160,000 | | 186,026 |
| New Jersey Turnpike Authority, | | | | | | | | |
| Turnpike Revenue | | | | | | | | |
| (Insured; FSA) | | 6.50 | | 1/1/16 | | 835,000 | | 968,759 |
| New Jersey Turnpike Authority, | | | | | | | | |
| Turnpike Revenue | | | | | | | | |
| (Insured; FSA) | | 6.50 | | 1/1/16 | | 165,000 | | 197,876 |
| New Jersey Turnpike Authority, | | | | | | | | |
| Turnpike Revenue (Insured; FSA) | | 5.00 | | 1/1/20 | | 5,000,000 | | 5,129,500 |
| New Jersey Turnpike Authority, | | | | | | | | |
| Turnpike Revenue (Insured; | | | | | | | | |
| MBIA, Inc.) | | 5.75 | | 1/1/10 | | 685,000 | | 719,161 |
| New Jersey Turnpike Authority, | | | | | | | | |
| Turnpike Revenue (Insured; | | | | | | | | |
| MBIA, Inc.) | | 5.75 | | 1/1/10 | | 2,315,000 | | 2,404,753 |
| New Jersey Turnpike Authority, | | | | | | | | |
| Turnpike Revenue (Insured; | | | | | | | | |
| MBIA, Inc.) | | 6.50 | | 1/1/16 | | 3,520,000 | | 4,228,682 |
| North Jersey District Water Supply | | | | | | | | |
| Commission, Sewer Revenue | | | | | | | | |
| (Wanaque South Project) | | | | | | | | |
| (Insured; MBIA, Inc.) | | 6.00 | | 7/1/19 | | 2,000,000 | | 2,352,060 |
| Port Authority of New York and New | | | | | | | | |
| Jersey (Consolidated Bonds, | | | | | | | | |
| 93rd Series) | | 6.13 | | 6/1/94 | | 3,000,000 | | 3,222,210 |
The Fund 19
| STATEMENT OF INVESTMENTS (continued) |
| Long-Term Municipal | | Coupon | | Maturity | | Principal | | | |
| Investments (continued) | | Rate (%) | | Date | | Amount ($) | | | Value ($) |
| |
| |
| |
|
| |
|
| New Jersey (continued) | | | | | | | | | |
| Port Authority of New York and New | | | | | | | | | |
| Jersey (Consolidated Bonds, | | | | | | | | | |
| 127th Series) (Insured; AMBAC) | | 5.25 | | 12/15/32 | | 5,070,000 | | | 4,086,065 |
| Port Authority of New York and New | | | | | | | | | |
| Jersey, Special Obligation | | | | | | | | | |
| Revenue (JFK International Air | | | | | | | | | |
| Terminal LLC Project) | | | | | | | | | |
| (Insured; MBIA, Inc.) | | 6.25 | | 12/1/15 | | 5,000,000 | | | 4,685,700 |
| Rahway Valley Sewerage | | | | | | | | | |
| Authority, Sewer Revenue | | | | | | | | | |
| (Insured; MBIA, Inc.) | | 0.00 | | 9/1/30 | | 7,550,000 | a | | 1,938,010 |
| Salem County Improvement | | | | | | | | | |
| Authority, City-Guaranteed | | | | | | | | | |
| Revenue (Finlaw State Office | | | | | | | | | |
| Building Project) (Insured; FSA) | | 5.25 | | 8/15/38 | | 3,640,000 | | | 3,618,124 |
| South Brunswick Township Board of | | | | | | | | | |
| Education, School Bonds | | | | | | | | | |
| (Guaranteed; School Bond | | | | | | | | | |
| Reserve Act and Insured; FGIC) | | 5.63 | | 12/1/09 | | 1,820,000 | b | | 1,901,773 |
| Tobacco Settlement Financing | | | | | | | | | |
| Corporation of New Jersey, Tobacco | | | | | | | | | |
| Settlement Asset-Backed Bonds | | 5.38 | | 6/1/12 | | 2,500,000 | b | | 2,780,325 |
| Tobacco Settlement Financing | | | | | | | | | |
| Corporation of New Jersey, | | | | | | | | | |
| Tobacco Settlement | | | | | | | | | |
| Asset-Backed Bonds | | 6.75 | | 6/1/13 | | 1,790,000 | b | | 2,128,883 |
| Tobacco Settlement Financing | | | | | | | | | |
| Corporation of New Jersey, | | | | | | | | | |
| Tobacco Settlement | | | | | | | | | |
| Asset-Backed Bonds | | 7.00 | | 6/1/13 | | 10,630,000 | b | | 12,783,425 |
| Tobacco Settlement Financing | | | | | | | | | |
| Corporation of New Jersey, | | | | | | | | | |
| Tobacco Settlement | | | | | | | | | |
| Asset-Backed Bonds | | 4.63 | | 6/1/26 | | 3,000,000 | | | 2,035,620 |
| Tobacco Settlement Financing | | | | | | | | | |
| Corporation of New Jersey, | | | | | | | | | |
| Tobacco Settlement | | | | | | | | | |
| Asset-Backed Bonds | | 5.00 | | 6/1/29 | | 5,000,000 | | | 2,798,700 |
| Tobacco Settlement Financing | | | | | | | | | |
| Corporation of New Jersey, | | | | | | | | | |
| Tobacco Settlement | | | | | | | | | |
| Asset-Backed Bonds | | 5.75 | | 6/1/32 | | 6,180,000 | | | 6,694,176 |
20
| Long-Term Municipal | | Coupon | | Maturity | | Principal | | | |
| Investments (continued) | | Rate (%) | | Date | | Amount ($) | | | Value ($) |
| |
| |
| |
|
| |
|
| New Jersey (continued) | | | | | | | | | |
| Tobacco Settlement Financing | | | | | | | | | |
| Corporation of New Jersey, | | | | | | | | | |
| Tobacco Settlement | | | | | | | | | |
| Asset-Backed Bonds | | 4.75 | | 6/1/34 | | 11,115,000 | | | 5,619,966 |
| Union County Improvement | | | | | | | | | |
| Authority, Revenue | | | | | | | | | |
| (Correctional Facility Project) | | 5.00 | | 6/15/22 | | 1,780,000 | | | 1,799,633 |
| Union County Utilities Authority, | | | | | | | | | |
| Solid Waste Revenue (Ogden | | | | | | | | | |
| Martin Systems of Union, Inc.) | | | | | | | | | |
| (Insured; AMBAC) | | 5.38 | | 6/1/20 | | 4,990,000 | | | 4,441,898 |
| University of Medicine and | | | | | | | | | |
| Dentistry of New Jersey, GO | | | | | | | | | |
| (Insured; AMBAC) | | 5.50 | | 12/1/27 | | 15,425,000 | | | 12,525,717 |
| West Orange Board of Education, | | | | | | | | | |
| COP (Insured; MBIA, Inc.) | | 6.00 | | 10/1/09 | | 500,000 | b | | 524,620 |
| U.S. Related—3.8% | | | | | | | | | |
| Guam Waterworks Authority, | | | | | | | | | |
| Water and Wastewater System | | | | | | | | | |
| Revenue | | 6.00 | | 7/1/25 | | 1,000,000 | | | 733,050 |
| Puerto Rico Commonwealth, | | | | | | | | | |
| Public Improvement GO | | | | | | | | | |
| (Insured; MBIA, Inc.) | | 5.65 | | 7/1/15 | | 1,800,000 | | | 1,702,170 |
| Puerto Rico Electric Power | | | | | | | | | |
| Authority, Power Revenue | | 5.50 | | 7/1/38 | | 10,585,000 | | | 8,395,916 |
| Puerto Rico Sales Tax Financing | | | | | | | | | |
| Corporation, Sales Tax Revenue | | | | | | | | | |
| (Insured; Berkshire Hathaway | | | | | | | | | |
| Assurance Corporation) | | 0.00 | | 8/1/54 | | 46,600,000 | a | | 3,156,684 |
| Puerto Rico Sales Tax Financing | | | | | | | | | |
| Corporation, Sales Tax Revenue | | | | | | | | | |
| (Insured; MBIA, Inc.) | | 0.00 | | 8/1/43 | | 18,000,000 | a | | 1,666,800 |
| Virgin Islands Public Finance | | | | | | | | | |
| Authority, Revenue, Virgin | | | | | | | | | |
| Islands Gross Receipts Taxes | | | | | | | | | |
| Loan Note | | 6.50 | | 10/1/10 | | 3,000,000 | b | | 3,298,590 |
| Virgin Islands Public Finance | | | | | | | | | |
| Authority, Revenue, Virgin Islands | | | | | | | | | |
| Gross Receipts Taxes Loan Note | | 6.38 | | 10/1/19 | | 2,000,000 | | | 1,881,960 |
| Total Long-Term Municipal Investments | | | | | | | |
| (cost $559,632,961) | | | | | | | | | 531,268,087 |
The Fund 21
| STATEMENT OF INVESTMENTS (continued) |
| Short-Term Municipal | | Coupon | | Maturity | | Principal | | | |
| Investments—2.1% | | Rate (%) | | Date | | Amount ($) | | | Value ($) |
| |
| |
| |
|
| |
|
| New Jersey; | | | | | | | | | |
| New Jersey Health Care Facilities | | | | | | | | | |
| Financing Authority, Revenue | | | | | | | | | |
| (South Jersey Hospital, Inc.) | | | | | | | | | |
| (LOC; Wachovia Bank) | | 2.25 | | 1/7/09 | | 4,310,000 | c | | 4,310,000 |
| New Jersey Health Care Facilities | | | | | | | | | |
| Financing Authority, Revenue | | | | | | | | | |
| (Southern Ocean County Hospital | | | | | | | | | |
| Issue) (LOC; Wachovia Bank) | | 1.96 | | 1/7/09 | | 7,305,000 | c | | 7,305,000 |
| Total Short-Term Municipal Investments | | | | | | | |
| (cost $11,615,000) | | | | | | | | | 11,615,000 |
| |
| Total Investments (cost $571,247,961) | | | | | | 98.6% | | | 542,883,087 |
| Cash and Receivables (Net) | | | | | | 1.4% | | | 7,565,881 |
| Net Assets | | | | | | 100.0% | | | 550,448,968 |
| a Security issued with a zero coupon. Income is recognized through the accretion of discount. |
| b These securities are prerefunded; the date shown represents the prerefunded date. Bonds which are prerefunded are |
| collateralized by U.S. Government securities which are held in escrow and are used to pay principal and interest on |
| the municipal issue and to retire the bonds in full at the earliest refunding date. |
| c Variable rate demand note—rate shown is the interest rate in effect at December 31, 2008. Maturity date represents |
| the next demand date, or the ultimate maturity date if earlier. |
22
| Summary of Abbreviations | | | | |
| |
| ABAG | | Association of Bay Area Governments | | ACA | | American Capital Access |
| AGC | | ACE Guaranty Corporation | | AGIC | | Asset Guaranty Insurance Company |
| AMBAC | | American Municipal Bond | | | | |
| | | Assurance Corporation | | ARRN | | Adjustable Rate Receipt Notes |
| BAN | | Bond Anticipation Notes | | BIGI | | Bond Investors Guaranty Insurance |
| BPA | | Bond Purchase Agreement | | CGIC | | Capital Guaranty Insurance Company |
| CIC | | Continental Insurance Company | | CIFG | | CDC Ixis Financial Guaranty |
| CMAC | | Capital Market Assurance Corporation | | COP | | Certificate of Participation |
| CP | | Commercial Paper | | EDR | | Economic Development Revenue |
| EIR | | Environmental Improvement Revenue | | FGIC | | Financial Guaranty Insurance |
| | | | | | | Company |
| FHA | | Federal Housing Administration | | FHLB | | Federal Home Loan Bank |
| FHLMC | | Federal Home Loan Mortgage | | FNMA | | Federal National |
| | | Corporation | | | | Mortgage Association |
| FSA | | Financial Security Assurance | | GAN | | Grant Anticipation Notes |
| GIC | | Guaranteed Investment Contract | | GNMA | | Government National |
| | | | | | | Mortgage Association |
| GO | | General Obligation | | HR | | Hospital Revenue |
| IDB | | Industrial Development Board | | IDC | | Industrial Development Corporation |
| IDR | | Industrial Development Revenue | | LOC | | Letter of Credit |
| LOR | | Limited Obligation Revenue | | LR | | Lease Revenue |
| MFHR | | Multi-Family Housing Revenue | | MFMR | | Multi-Family Mortgage Revenue |
| PCR | | Pollution Control Revenue | | PILOT | | Payment in Lieu of Taxes |
| RAC | | Revenue Anticipation Certificates | | RAN | | Revenue Anticipation Notes |
| RAW | | Revenue Anticipation Warrants | | RRR | | Resources Recovery Revenue |
| SAAN | | State Aid Anticipation Notes | | SBPA | | Standby Bond Purchase Agreement |
| SFHR | | Single Family Housing Revenue | | SFMR | | Single Family Mortgage Revenue |
| SONYMA | | State of New York Mortgage Agency | | SWDR | | Solid Waste Disposal Revenue |
| TAN | | Tax Anticipation Notes | | TAW | | Tax Anticipation Warrants |
| TRAN | | Tax and Revenue Anticipation Notes | | XLCA | | XL Capital Assurance |
The Fund 23
| | STATEMENT OF INVESTMENTS (continued) |
| Summary of Combined Ratings (Unaudited) | | |
| |
| Fitch | | or | | Moody’s | | or | | Standard & Poor’s | | Value (%)† |
| |
| |
| |
| |
| |
|
| AAA | | | | Aaa | | | | AAA | | 43.7 |
| AA | | | | Aa | | | | AA | | 21.1 |
| A | | | | A | | | | A | | 17.4 |
| BBB | | | | Baa | | | | BBB | | 13.4 |
| BB | | | | Ba | | | | BB | | 1.0 |
| B | | | | B | | | | B | | .5 |
| CCC | | | | Caa | | | | CCC | | .1 |
| F1 | | | | MIG1/P1 | | | | SP1/A1 | | 2.1 |
| Not Ratedd | | | | Not Ratedd | | | | Not Ratedd | | .7 |
| | | | | | | | | | | 100.0 |
| † | | Based on total investments. |
| d | | Securities which, while not rated by Fitch, Moody’s and Standard & Poor’s, have been determined by the Manager to |
| | | be of comparable quality to those rated securities in which the fund may invest. |
| See notes to financial statements. |
24
STATEMENT OF ASSETS AND LIABILITIES
December 31, 2008
| | | | | | | | | Cost | | Value |
| |
| |
| |
| |
| |
|
| Assets ($): | | | | | | | | | | |
| Investments in securities—See Statement of Investments | | 571,247,961 | | 542,883,087 |
| Interest receivable | | | | | | | | | | 8,352,645 |
| Receivable for investment securities sold | | | | | | | | 81,501 |
| Receivable for shares of Common Stock subscribed | | | | | | 20,134 |
| Prepaid expenses | | | | | | | | | | 49,291 |
| | | | | | | | | | | 551,386,658 |
| Liabilities ($): | | | | | | | | | | |
| Due to The Dreyfus Corporation and affiliates—Note 3(c) | | | | | | 378,915 |
| Cash overdraft due to Custodian | | | | | | | | 135,657 |
| Payable for shares of Common Stock redeemed | | | | | | 315,908 |
| Accrued expenses | | | | | | | | | | 107,210 |
| | | | | | | | | | | 937,690 |
| Net Assets ($) | | | | | | | | | | 550,448,968 |
| Composition of Net Assets ($): | | | | | | | | |
| Paid-in capital | | | | | | | | | | 584,561,752 |
| Accumulated net realized gain (loss) on investments | | | | | | (5,747,910) |
| Accumulated net unrealized appreciation | | | | | | | | |
| (depreciation) on investments | | | | | | | | (28,364,874) |
| Net Assets ($) | | | | | | | | | | 550,448,968 |
| |
| |
| |
| |
| |
|
| |
| |
| Net Asset Value Per Share | | | | | | | | |
| | | Class A | | Class B | | Class C | | Class I | | Class Z |
| |
| |
| |
| |
| |
|
| Net Assets ($) | | 403,333,496 | | 1,440,632 | | 4,714,449 | | 10,341 | | 140,950,050 |
| Shares Outstanding | | 34,565,057 | | 123,599 | | 404,411 | | 887 | | 12,077,369 |
| Net Asset Value | | | | | | | | | | |
| Per Share ($) | | 11.67 | | 11.66 | | 11.66 | | 11.66 | | 11.67 |
| |
| See notes to financial statements. | | | | | | | | | | |
The Fund 25
| STATEMENT OF OPERATIONS | | |
| Year Ended December 31, 2008 | | |
| |
|
| |
| |
| |
| |
| Investment Income ($): | | |
| Interest Income | | 31,505,211 |
| Expenses: | | |
| Management fee—Note 3(a) | | 3,534,830 |
| Shareholder servicing costs—Note 3(c) | | 1,505,424 |
| Interest and expense related to floating rate notes issued—Note 4 | | 272,046 |
| Directors’ fees and expenses—Note 3(d) | | 82,553 |
| Professional fees | | 81,252 |
| Custodian fees—Note 3(c) | | 60,203 |
| Registration fees | | 50,832 |
| Distribution fees—Note 3(b) | | 37,974 |
| Prospectus and shareholders’ reports | | 23,487 |
| Loan commitment fees—Note 2 | | 2,630 |
| Interest expense—Note 2 | | 556 |
| Miscellaneous | | 53,243 |
| Total Expenses | | 5,705,030 |
| Less—reduction in management fee due to undertaking—Note 3(a) | | (439,297) |
| Less—reduction in fees due to earnings credits—Note 1(b) | | (21,446) |
| Net Expenses | | 5,244,287 |
| Investment Income—Net | | 26,260,924 |
| Realized and Unrealized Gain (Loss) on Investments—Note 4 ($): | | |
| Net realized gain (loss) on investments | | (4,248,360) |
| Net unrealized appreciation (depreciation) on investments | | (49,527,054) |
| Net Realized and Unrealized Gain (Loss) on Investments | | (53,775,414) |
| Net (Decrease) in Net Assets Resulting from Operations | | (27,514,490) |
| |
| See notes to financial statements. | | |
26
STATEMENT OF CHANGES IN NET ASSETS
| | | Year Ended December 31, |
| | |
|
| | | 2008 | | 2007 |
| |
| |
|
| Operations ($): | | | | |
| Investment income—net | | 26,260,924 | | 23,283,685 |
| Net realized gain (loss) on investments | | (4,248,360) | | (873,818) |
| Net unrealized appreciation | | | | |
| (depreciation) on investments | | (49,527,054) | | (9,766,018) |
| Net Increase (Decrease) in Net Assets | | | | |
| Resulting from Operations | | (27,514,490) | | 12,643,849 |
| Dividends to Shareholders from ($): | | | | |
| Investment income—net: | | | | |
| Class A Shares | | (19,021,061) | | (19,007,920) |
| Class B Shares | | (60,398) | | (65,465) |
| Class C Shares | | (147,847) | | (115,395) |
| Class I Shares | | (24) | | — |
| Class Z Shares | | (6,876,960) | | (4,014,094) |
| Total Dividends | | (26,106,290) | | (23,202,874) |
| Capital Stock Transactions ($): | | | | |
| Net proceeds from shares sold: | | | | |
| Class A Shares | | 41,543,250 | | 36,962,818 |
| Class B Shares | | 86,093 | | 39,619 |
| Class C Shares | | 2,136,106 | | 1,377,288 |
| Class I Shares | | 10,000 | | — |
| Class Z Shares | | 7,835,647 | | 4,521,012 |
| Net assets received in connection | | | | |
| with reorganization—Note 1 | | — | | 169,816,616 |
| Dividends reinvested: | | | | |
| Class A Shares | | 14,093,812 | | 14,057,805 |
| Class B Shares | | 40,424 | | 40,265 |
| Class C Shares | | 68,673 | | 52,432 |
| Class Z Shares | | 5,599,524 | | 3,230,206 |
| Cost of shares redeemed: | | | | |
| Class A Shares | | (52,791,117) | | (67,107,359) |
| Class B Shares | | (166,345) | | (550,603) |
| Class C Shares | | (861,204) | | (375,122) |
| Class Z Shares | | (22,515,718) | | (13,106,963) |
| Increase (Decrease) in Net Assets | | | | |
| from Capital Stock Transactions | | (4,920,855) | | 148,958,014 |
| Total Increase (Decrease) in Net Assets | | (58,541,635) | | 138,398,989 |
| Net Assets ($): | | | | |
| Beginning of Period | | 608,990,603 | | 470,591,614 |
| End of Period | | 550,448,968 | | 608,990,603 |
The Fund 27
STATEMENT OF CHANGES IN NET ASSETS (continued)
| | | Year Ended December 31, |
| | |
|
| | | 2008 | | 2007 |
| |
| |
|
| Capital Share Transactions: | | | | |
| Class Aa | | | | |
| Shares sold | | 3,341,634 | | 2,863,098 |
| Shares issued for dividends reinvested | | 1,144,566 | | 1,089,041 |
| Shares redeemed | | (4,296,280) | | (5,194,625) |
| Net Increase (Decrease) in Shares Outstanding | | 189,920 | | (1,242,486) |
| Class Ba | | | | |
| Shares sold | | 6,973 | | 3,089 |
| Shares issued for dividends reinvested | | 3,287 | | 3,121 |
| Shares redeemed | | (13,478) | | (42,428) |
| Net Increase (Decrease) in Shares Outstanding | | (3,218) | | (36,218) |
| Class C | | | | |
| Shares sold | | 177,134 | | 106,438 |
| Shares issued for dividends reinvested | | 5,594 | | 4,066 |
| Shares redeemed | | (71,610) | | (29,060) |
| Net Increase (Decrease) in Shares Outstanding | | 111,118 | | 81,444 |
| Class I | | | | |
| Shares sold | | 887 | | — |
| Net Increase (Decrease) in Shares Outstanding | | 887 | | — |
| Class Z | | | | |
| Shares sold | | 630,396 | | 353,100 |
| Shares received in connection | | | | |
| with reorganization—Note 1 | | — | | 13,226,443 |
| Shares issued for dividends reinvested | | 454,531 | | 251,982 |
| Shares redeemed | | (1,815,061) | | (1,024,022) |
| Net Increase (Decrease) in Shares Outstanding | | (730,134) | | 12,807,503 |
| a | | During the period ended December 31, 2008, 4,671 Class B shares representing $58,505, were automatically |
| | | converted to 4,667 Class A shares and during the period ended December 31, 2007, 5,026 Class B shares |
| | | representing $65,321 were automatically converted to 5,021 Class A shares. |
| See notes to financial statements. |
28
FINANCIAL HIGHLIGHTS
The following tables describe the performance for each share class for the fiscal periods indicated.All information (except portfolio turnover rate) reflects financial results for a single fund share.Total return shows how much your investment in the fund would have increased (or decreased) during each period, assuming you had reinvested all dividends and distributions.These figures have been derived from the fund’s financial statements.
| | | | | Year Ended December 31, | | |
| | |
| |
| |
|
| Class A Shares | | 2008 | | 2007 | | 2006 | | 2005 | | 2004 |
| |
| |
| |
| |
| |
|
| Per Share Data ($): | | | | | | | | | | |
| Net asset value, beginning of period | | 12.79 | | 13.07 | | 13.12 | | 13.26 | | 13.32 |
| Investment Operations: | | | | | | | | | | |
| Investment income—neta | | .55 | | .54 | | .56 | | .56 | | .55 |
| Net realized and unrealized | | | | | | | | | | |
| gain (loss) on investments | | (1.12) | | (.28) | | (.05) | | (.14) | | (.04) |
| Total from Investment Operations | | (.57) | | .26 | | .51 | | .42 | | .51 |
| Distributions: | | | | | | | | | | |
| Dividends from investment income—net | | (.55) | | (.54) | | (.56) | | (.56) | | (.55) |
| Dividends from net realized | | | | | | | | | | |
| gain on investments | | — | | — | | — | | — | | (.02) |
| Total Distributions | | (.55) | | (.54) | | (.56) | | (.56) | | (.57) |
| Net asset value, end of period | | 11.67 | | 12.79 | | 13.07 | | 13.12 | | 13.26 |
| Total Return (%)b | | (4.61) | | 2.05 | | 4.00 | | 3.22 | | 3.91 |
| Ratios/Supplemental Data (%): | | | | | | | | | | |
| Ratio of total expenses | | | | | | | | | | |
| to average net assetsc | | 1.00 | | 1.10 | | 1.18 | | 1.12 | | 1.04 |
| Ratio of net expenses | | | | | | | | | | |
| to average net assetsc | | .90 | | 1.00 | | 1.06 | | 1.01 | | .94 |
| Ratio of interest and expense | | | | | | | | | | |
| related to floating rate notes | | | | | | | | | | |
| issued to average net assets | | .05 | | .13 | | .22 | | .16 | | .09 |
| Ratio of net investment income | | | | | | | | | | |
| to average net assets | | 4.45 | | 4.21 | | 4.32 | | 4.25 | | 4.16 |
| Portfolio Turnover Rate | | 50.33 | | 36.63 | | 17.13 | | 11.22 | | 16.98 |
| Net Assets, end of period ($ x 1,000) | | 403,333 | | 439,752 | | 465,695 | | 475,203 | | 500,585 |
| a | | Based on average shares outstanding at each month end. |
| b | | Exclusive of sales charge. |
| c | | Includes interest and expense related to floating rate notes issued. |
| See notes to financial statements. |
The Fund 29
| | FINANCIAL HIGHLIGHTS (continued) |
| | | | | Year Ended December 31, | | |
| | |
| |
| |
|
| Class B Shares | | 2008 | | 2007 | | 2006 | | 2005 | | 2004 |
| |
| |
| |
| |
| |
|
| Per Share Data ($): | | | | | | | | | | |
| Net asset value, beginning of period | | 12.78 | | 13.06 | | 13.10 | | 13.25 | | 13.30 |
| Investment Operations: | | | | | | | | | | |
| Investment income—neta | | .49 | | .47 | | .50 | | .50 | | .48 |
| Net realized and unrealized | | | | | | | | | | |
| gain (loss) on investments | | (1.12) | | (.27) | | (.04) | | (.16) | | (.03) |
| Total from Investment Operations | | (.63) | | .20 | | .46 | | .34 | | .45 |
| Distributions: | | | | | | | | | | |
| Dividends from investment income—net | | (.49) | | (.48) | | (.50) | | (.49) | | (.48) |
| Dividends from net realized | | | | | | | | | | |
| gain on investments | | — | | — | | — | | — | | (.02) |
| Total Distributions | | (.49) | | (.48) | | (.50) | | (.49) | | (.50) |
| Net asset value, end of period | | 11.66 | | 12.78 | | 13.06 | | 13.10 | | 13.25 |
| Total Return (%)b | | (5.09) | | 1.53 | | 3.56 | | 2.63 | | 3.46 |
| Ratios/Supplemental Data (%): | | | | | | | | | | |
| Ratio of total expenses | | | | | | | | | | |
| to average net assetsc | | 1.57 | | 1.67 | | 1.74 | | 1.67 | | 1.59 |
| Ratio of net expenses | | | | | | | | | | |
| to average net assetsc | | 1.40 | | 1.50 | | 1.56 | | 1.51 | | 1.44 |
| Ratio of interest and expense | | | | | | | | | | |
| related to floating rate notes | | | | | | | | | | |
| issued to average net assets | | .05 | | .13 | | .22 | | .16 | | .09 |
| Ratio of net investment income | | | | | | | | | | |
| to average net assets | | 3.95 | | 3.71 | | 3.82 | | 3.74 | | 3.65 |
| Portfolio Turnover Rate | | 50.33 | | 36.63 | | 17.13 | | 11.22 | | 16.98 |
| Net Assets, end of period ($ x 1,000) | | 1,441 | | 1,621 | | 2,129 | | 2,025 | | 1,614 |
| a | | Based on average shares outstanding at each month end. |
| b | | Exclusive of sales charge. |
| c | | Includes interest and expense related to floating rate notes issued. |
| See notes to financial statements. |
30
| | | | | Year Ended December 31, | | |
| | |
| |
| |
|
| Class C Shares | | 2008 | | 2007 | | 2006 | | 2005 | | 2004 |
| |
| |
| |
| |
| |
|
| Per Share Data ($): | | | | | | | | | | |
| Net asset value, beginning of period | | 12.78 | | 13.06 | | 13.11 | | 13.25 | | 13.31 |
| Investment Operations: | | | | | | | | | | |
| Investment income—neta | | .45 | | .45 | | .46 | | .46 | | .45 |
| Net realized and unrealized | | | | | | | | | | |
| gain (loss) on investments | | (1.12) | | (.29) | | (.05) | | (.14) | | (.04) |
| Total from Investment Operations | | (.67) | | .16 | | .41 | | .32 | | .41 |
| Distributions: | | | | | | | | | | |
| Dividends from investment income—net | | (.45) | | (.44) | | (.46) | | (.46) | | (.45) |
| Dividends from net realized | | | | | | | | | | |
| gain on investments | | — | | — | | — | | — | | (.02) |
| Total Distributions | | (.45) | | (.44) | | (.46) | | (.46) | | (.47) |
| Net asset value, end of period | | 11.66 | | 12.78 | | 13.06 | | 13.11 | | 13.25 |
| Total Return (%)b | | (5.34) | | 1.28 | | 3.22 | | 2.45 | | 3.13 |
| Ratios/Supplemental Data (%): | | | | | | | | | | |
| Ratio of total expenses | | | | | | | | | | |
| to average net assetsc | | 1.77 | | 1.87 | | 1.96 | | 1.89 | | 1.81 |
| Ratio of net expenses | | | | | | | | | | |
| to average net assetsc | | 1.64 | | 1.75 | | 1.81 | | 1.76 | | 1.69 |
| Ratio of interest and expense | | | | | | | | | | |
| related to floating rate notes | | | | | | | | | | |
| issued to average net assets | | .05 | | .13 | | .22 | | .16 | | .09 |
| Ratio of net investment income | | | | | | | | | | |
| to average net assets | | 3.69 | | 3.44 | | 3.57 | | 3.51 | | 3.41 |
| Portfolio Turnover Rate | | 50.33 | | 36.63 | | 17.13 | | 11.22 | | 16.98 |
| Net Assets, end of period ($ x 1,000) | | 4,714 | | 3,749 | | 2,768 | | 2,732 | | 1,736 |
| a | | Based on average shares outstanding at each month end. |
| b | | Exclusive of sales charge. |
| c | | Includes interest and expense related to floating rate notes issued. |
| See notes to financial statements. |
The Fund 31
| | FINANCIAL HIGHLIGHTS (continued) |
| | | Year Ended |
| Class I Shares | | December 31, 2008a |
| |
|
| Per Share Data ($): | | |
| Net asset value, beginning of period | | 11.28 |
| Investment Operations: | | |
| Investment income—netb | | .03 |
| Net realized and unrealized gain (loss) on investments | | .38 |
| Total from Investment Operations | | .41 |
| Distributions: | | |
| Dividends from investment income—net | | (.03) |
| Net asset value, end of period | | 11.66 |
| Total Return (%) | | 3.61c |
| Ratios/Supplemental Data (%): | | |
| Ratio of total expenses to average net assets | | .76d |
| Ratio of net expenses to average net assets | | .70d |
| Ratio of net investment income to average net assets | | 5.03d |
| Portfolio Turnover Rate | | 50.33 |
| Net Assets, end of period ($ x 1,000) | | 10 |
| a | | From December 15, 2008 (commencement of initial offering) to December 31, 2008. |
| b | | Based on average shares outstanding. |
| c | | Not annualized. |
| d | | Annualized. |
| See notes to financial statements. |
32
| | | Year Ended December 31, |
| | |
|
| Class Z Shares | | 2008 | | 2007a |
| |
| |
|
| Per Share Data ($): | | | | |
| Net asset value, beginning of period | | 12.79 | | 12.84 |
| Investment Operations: | | | | |
| Investment income—netb | | .56 | | .31 |
| Net realized and unrealized | | | | |
| gain (loss) on investments | | (1.12) | | (.05) |
| Total from Investment Operations | | (.56) | | .26 |
| Distributions: | | | | |
| Dividends from investment income—net | | (.56) | | (.31) |
| Net asset value, end of period | | 11.67 | | 12.79 |
| Total Return (%) | | (4.56) | | 2.03c |
| Ratios/Supplemental Data (%): | | | | |
| Ratio of total expenses to average net assetsf | | .85 | | .91d |
| Ratio of net expenses to average net assetsf | | .85e | | .91d,e |
| Ratio of interest and expense related to floating | | | | |
| rate notes issued to average net assets | | .05 | | .13d |
| Ratio of net investment income to average net assets | | 4.50 | | 4.26d |
| Portfolio Turnover Rate | | 50.33 | | 36.63 |
| Net Assets, end of period ($ x 1,000) | | 140,950 | | 163,869 |
| a | | From June 7, 2007 (commencement of initial offering) to December 31, 2007. |
| b | | Based on average shares outstanding at each month end. |
| c | | Not annualized. |
| d | | Annualized. |
| e | | Expense waivers and/or reimbursements amounted to less than .01%. |
| f | | Includes interest and expense related to floating rate notes issued. |
| See notes to financial statements. |
The Fund 33
NOTES TO FINANCIAL STATEMENTS
NOTE 1—Significant Accounting Policies:
Dreyfus New Jersey Municipal Bond Fund, Inc. (the “fund”) is registered under the Investment Company Act of 1940, as amended (the “Act”), as a non-diversified open-end management investment com-pany.The fund’s investment objective is to provide investors with as high a level of current income exempt from federal and New Jersey personal income taxes, as is consistent with the preservation of capital. The Dreyfus Corporation (the “Manager” or “Dreyfus”), a wholly-owned subsidiary of The Bank of New York Mellon Corporation (“BNY Mellon”), serves as the fund’s investment adviser.
At a meeting of the fund’s Board of Directors held on July 10, 2008, the Board approved, effective December 1, 2008, a proposal to change the name of the fund from “Dreyfus Premier New Jersey Municipal Bond Fund, Inc.” to “Dreyfus New Jersey Municipal Bond Fund, Inc.”.
Effective July 1, 2008, BNY Mellon reorganized and consolidated a number of its banking and trust company subsidiaries.As a result of the reorganization, any services previously provided to the fund by Mellon Bank, N.A. or Mellon Trust of New England, N.A. are now provided by The Bank of NewYork Mellon (formerly,The Bank of NewYork).
On December 11, 2008, the fund’s Board of Directors approved the addition of Class I shares,which became effective on December 15,2008.
As of the close of business on June 7, 2007, pursuant to an Agreement and Plan of Reorganization previously approved by the fund’s Board of Directors, all of the assets, subject to liabilities, of Dreyfus New Jersey Intermediate Municipal Bond Fund were transferred to the fund in exchange for shares of Common Stock of the fund of equal value. Shareholders of Dreyfus New Jersey Intermediate Municipal Bond Fund received Class Z shares of the fund, in an amount equal to the aggregate net asset value of their investment in Dreyfus New Jersey Intermediate Municipal Bond Fund at the time of the exchange.The fund’s net asset value on the close of business on June 7, 2007 was $12.84 per share for Class Z shares, and a total of 13,226,443 Class Z
34
shares representing net assets of $169,816,616 (including $2,970,086 net unrealized appreciation on investments) were issued to shareholders of Dreyfus New Jersey Intermediate Municipal Bond Fund in the exchange. The exchange was a tax-free event to Dreyfus New Jersey Intermediate Municipal Bond Fund shareholders.
MBSC Securities Corporation (the “Distributor”), a wholly-owned subsidiary of the Manager, is the distributor of the fund’s shares.The fund is authorized to issue 675 million shares of $.001 par value Common Stock. The fund currently offers five classes of shares: Class A (200 million shares authorized), Class B (150 million shares authorized), Class C (150 million shares authorized), Class I (150 million shares authorized) and Class Z (25 million shares authorized). Class A shares are subject to a sales charge imposed at the time of purchase. Class B shares are subject to a contingent deferred sales charge (“CDSC”) imposed on Class B share redemptions made within six years of purchase and automatically convert to Class A shares after six years.The fund does not offer Class B shares, except in connection with dividend reinvestment and permitted exchanges of Class B shares. Class C shares are subject to a CDSC imposed on Class C shares redeemed within one year of purchase. Other differences between the classes include the services offered to and the expenses borne by each class, the allocation of certain transfer agency costs and certain voting rights. Income, expenses (other than expenses attributable to a specific class), and realized and unrealized gains or losses on investments are allocated to each class of shares based on its relative net assets.
The fund’s financial statements are prepared in accordance with U.S. generally accepted accounting principles, which may require the use of management estimates and assumptions. Actual results could differ from those estimates.
The fund enters into contracts that contain a variety of indemnifications. The fund’s maximum exposure under these arrangements is unknown.The fund does not anticipate recognizing any loss related to these arrangements.
The Fund 35
| NOTES TO FINANCIAL STATEMENTS (continued) |
(a) Portfolio valuation: Investments in securities are valued each business day by an independent pricing service (the “Service”) approved by the fund’s Board of Directors. Investments for which quoted bid prices are readily available and are representative of the bid side of the market in the judgment of the Service are valued at the mean between the quoted bid prices (as obtained by the Service from dealers in such securities) and asked prices (as calculated by the Service based upon its evaluation of the market for such securities). Other investments (which constitute a majority of the portfolio securities) are carried at fair value as determined by the Service, based on methods which include consideration of: yields or prices of municipal securities of comparable quality, coupon, maturity and type, indications as to values from dealers, and general market conditions. Options and financial futures on municipal and U.S. Treasury securities are valued at the last sales price on the securities exchange of which such securities are primarily traded or at the last sales price on the national securities market on each business day.
The fund adopted Statement of Financial Accounting Standards No. 157 “FairValue Measurements” (“FAS 157”). FAS 157 establishes an authoritative definition of fair value, sets out a framework for measuring fair value, and requires additional disclosures about fair value measurements.
Various inputs are used in determining the value of the fund’s investments relating to FAS 157.These inputs are summarized in the three broad levels listed below.
| Level 1—quoted prices in active markets for identical securities. |
| Level 2—other significant observable inputs (including quoted |
| prices for similar securities, interest rates, prepayment speeds, credit |
| risk, etc.). |
| Level 3—significant unobservable inputs (including the fund’s own |
| assumptions in determining the fair value of investments). |
The inputs or methodology used for valuing securities are not necessarily an indication of the risk associated with investing in those securities.
36
The following is a summary of the inputs used as of December 31, 2008 in valuing the fund’s investments carried at fair value:
| | | Investments in | | Other Financial |
| Valuation Inputs | | Securities ($) | | Instruments ($)† |
| |
| |
|
| Level 1—Quoted Prices | | 0 | | 0 |
| Level 2—Other Significant | | | | |
| Observable Inputs | | 542,883,087 | | 0 |
| Level 3—Significant | | | | |
| Unobservable Inputs | | 0 | | 0 |
| Total | | 542,883,087 | | 0 |
| † | | Other financial instruments include derivative instruments such as futures, forward currency |
| | | exchange contracts and swap contracts, which are valued at the unrealized appreciation |
| | | (depreciation) on the instrument and written options contracts which are shown at value. |
(b) Securities transactions and investment income: Securities transactions are recorded on a trade date basis. Realized gains and losses from securities transactions are recorded on the identified cost basis. Interest income, adjusted for accretion of discount and amortization of premium on investments, is earned from settlement date and recognized on the accrual basis. Securities purchased or sold on a when-issued or delayed-delivery basis may be settled a month or more after the trade date.
The fund has arrangements with the custodian and cash management banks whereby the fund may receive earnings credits when positive cash balances are maintained, which are used to offset custody and cash management fees. For financial reporting purposes, the fund includes net earnings credits as an expense offset in the Statement of Operations.
The fund follows an investment policy of investing primarily in municipal obligations of one state. Economic changes affecting the state and certain of its public bodies or municipalities may affect the ability of issuers within the state to pay interest on, or repay principal of, municipal obligations held by the fund.
(c) Dividends to shareholders: It is the policy of the fund to declare dividends from investment income-net on each business day. Such div-
The Fund 37
| NOTES TO FINANCIAL STATEMENTS (continued) |
idends are paid monthly. Dividends from net realized capital gains, if any, are normally declared and paid annually, but the fund may make distributions on a more frequent basis to comply with the distribution requirements of the Internal Revenue Code of 1986, as amended (the “Code”).To the extent that net realized capital gains can be offset by capital loss carryovers, it is the policy of the fund not to distribute such gains. Income and capital gain distributions are determined in accordance with income tax regulations, which may differ from U.S. generally accepted accounting principles.
(d) Federal income taxes: It is the policy of the fund to continue to qualify as a regulated investment company, which can distribute tax exempt dividends, by complying with the applicable provisions of the Code, and to make distributions of income and net realized capital gains sufficient to relieve it from substantially all federal income and excise taxes.
As of and during the period ended December 31, 2008, the fund did not have any liabilities for any unrecognized tax positions. The fund recognizes interest and penalties, if any, related to unrecognized tax positions as income tax expense in the Statement of Operations. During the period, the fund did not incur any interest or penalties.
Each of the tax years in the four-year period ended December 31, 2008 remains subject to examination by the Internal Revenue Service and state taxing authorities.
At December 31, 2008, the components of accumulated earnings on a tax basis were as follows: undistributed tax exempt income $264,885, accumulated capital losses $2,849,355 and unrealized depreciation $27,902,123. In addition, the fund had $3,361,306 of capital losses realized after October 31, 2008, which were deferred for tax purposes to the first day of the following fiscal year.
The accumulated capital loss carryover is available for federal income tax purposes to be applied against future net securities profits, if any, realized subsequent to December 31, 2008. If not applied, $803,681 of the carryover expires in fiscal 2011, $97,441 expires in fiscal 2014, $822,282 expires in fiscal 2015 and $1,125,951 expires in fiscal 2016.
38
The tax character of distributions paid to shareholders during the fiscal periods ended December 31, 2008 and December 31, 2007 were as follows: tax exempt income $26,096,393 and $23,186,156 and ordinary income $9,897 and $16,718, respectively.
During the period ended December 31, 2008, as a result of permanent book to tax differences, primarily due to the tax treatment for amortization adjustments, the fund decreased accumulated undistributed investment income-net by $154,634, increased accumulated net realized gain (loss) on investments by $142,954 and increased paid-in capital by $11,680. Net assets and net asset value per share were not affected by this reclassification.
NOTE 2—Bank Lines of Credit:
Prior to October 15, 2008, the fund participated with other Dreyfus-managed funds in a $350 million redemption credit facility. Effective October 15, 2008, the fund participates with other Dreyfus-managed funds in a $145 million redemption credit facility (the “Facility”) to be utilized for temporary or emergency purposes, including the financing of redemptions. In connection therewith, the fund has agreed to pay commitment fees on its pro rata portion of the Facility. Interest is charged to the fund based on prevailing market rates in effect at the time of borrowing.
The average daily amount of borrowings outstanding under the Facilities during the period ended December 31, 2008 was approximately $20,300, with a related weighted average annualized interest rate of 2.74%.
NOTE 3—Management Fee and Other Transactions With Affiliates:
(a) Pursuant to a Management Agreement (“Agreement”) with the Manager, the management fee is computed at the annual rate of .60% of the value of the fund’s average daily net assets and is payable monthly.The Manager has undertaken, until shareholders are given at least 90 days’ notice to the contrary, if the aggregate expenses of the
The Fund 39
| NOTES TO FINANCIAL STATEMENTS (continued) |
fund, exclusive of taxes, brokerage commissions, interest expense, commitment fees, extraordinary expenses, shareholder services fees and Rule 12b-1 distribution plan fees, but including the management fee, exceed .60% of the value of the fund’s average daily net assets, the fund may deduct from the payments to be made to the Manager under the Agreement, or the Manager will bear such excess expense.The reduction in management fee, pursuant to the undertaking, amounted to $439,297 during the period ended December 31, 2008.
During the period ended December 31, 2008, the Distributor retained $9,518 from commissions earned on sales of the fund’s Class A shares and $414 and $2,329 from CDSCs on redemptions of the fund’s Class B and Class C shares, respectively.
(b) Under the Distribution Plan (the “Plan”) adopted pursuant to Rule 12b-1 under the Act, Class B and Class C shares pay the Distributor for distributing their shares at an annual rate of .50% of the value of the average daily net assets of Class B shares and .75% of the value of the average daily net assets of Class C shares. During the period ended December 31, 2008, Class B and Class C shares were charged $7,699 and $30,275 respectively, pursuant to the Plan.
(c) Under the Shareholder Services Plan, Class A, Class B and Class C shares pay the Distributor at an annual rate of ..25% of the value of the average daily net assets for the provision of certain services.The services provided may include personal services relating to shareholder accounts, such as answering shareholder inquiries regarding the fund and providing reports and other information, and services related to the maintenance of shareholder accounts.The Distributor may make payments to Service Agents (a securities dealer, financial institution or other industry professional) in respect of these services.The Distributor determines the amounts to be paid to Service Agents. During the period ended December 31, 2008, Class A, Class B and Class C shares were charged $1,074,507, $3,849 and $10,092, respectively, pursuant to the Shareholder Services Plan.
40
Under the Shareholder Services Plan, Class Z shares reimburse the Distributor an amount not to exceed an annual rate of .25% of the value of Class Z shares’ average daily net assets for certain allocated expenses of providing personal services and/or maintaining shareholder accounts. The services provided may include personal services relating to shareholder accounts, such as answering shareholder inquiries regarding Class Z shares and providing reports and other information, and services related to the maintenance of shareholder accounts. During the period ended December 31, 2008, Class Z shares were charged $144,390 pursuant to the Shareholder Services Plan.
The fund compensates DreyfusTransfer, Inc., a wholly-owned subsidiary of the Manager, under a transfer agency agreement for providing personnel and facilities to perform transfer agency services for the fund. During the period ended December 31, 2008, the fund was charged $182,739 pursuant to the transfer agency agreement.
The fund compensates The Bank of New York Mellon, a subsidiary of BNY Mellon and an affiliate of Dreyfus, under a cash management agreement for performing cash management services related to fund subscriptions and redemptions. During the period ended December 31, 2008, the fund was charged $14,608 pursuant to the cash management agreement.
The fund compensates The Bank of New York Mellon under a custody agreement for providing custodial services for the fund. During the period ended December 31, 2008, the fund was charged $60,203 pursuant to the custody agreement.
During the period ended December 31, 2008, the fund was charged $5,403 for services performed by the Chief Compliance Officer.
The components of “Due to The Dreyfus Corporation and affiliates” in the Statement of Assets and Liabilities consist of: management fees $276,358, Rule 12b-1 distribution plan fees $3,398, shareholder ser-
The Fund 41
| NOTES TO FINANCIAL STATEMENTS (continued) |
vices plan fees $85,529, custodian fees $20,104, chief compliance officer fees $1,197 and transfer agency per account fees $31,156, which are offset against an expense reimbursement currently in effect in the amount of $38,827.
(d) Each Board member also serves as a Board member of other funds within the Dreyfus complex. Annual retainer fees and attendance fees are allocated to each fund based on net assets.
NOTE 4—Securities Transactions:
The aggregate amount of purchases and sales of investment securities, excluding short-term securities, during the period ended December 31, 2008, amounted to $288,642,809 and $315,036,348, respectively.
The fund may participate in secondary inverse floater structures in which fixed-rate, tax-exempt municipal bonds purchased by the fund are transferred to a trust.The trust subsequently issues two or more variable rate securities that are collateralized by the cash flows of the fixed-rate, tax-exempt municipal bonds. One or more of these variable rate securities pays interest based on a short-term floating rate set by a remarketing agent at predetermined intervals. A residual interest tax-exempt security is also created by the trust, which is transferred to the fund, and is paid interest based on the remaining cash flow of the trust, after payment of interest on the other securities and various expenses of the trust.
The fund accounts for the transfer of bonds to the trust as secured borrowings, with the securities transferred remaining in the fund’s investments, and the related floating rate certificate securities reflected as fund liabilities under the caption, “Payable for floating rate notes issued” in the Statement of Assets and Liabilities.
42
The average daily amount of borrowings outstanding under the inverse floater structures during the period ended December 31, 2008, was approximately $9,417,000, with a related weighted average annualized interest rate of 2.89%.
At December 31, 2008, the cost of investments for federal income tax purposes was $570,785,210; accordingly, accumulated net unrealized depreciation on investments was $27,902,123 consisting of $16,379,937 gross unrealized appreciation and $44,282,060 gross unrealized depreciation.
In March 2008, the Financial Accounting Standards Board released Statement of Financial Accounting Standards No. 161, “Disclosures about Derivative Instruments and Hedging Activities” (“FAS 161”). FAS 161 requires qualitative disclosures about objectives and strategies for using derivatives, quantitative disclosures about fair value amounts of gains and losses on derivative instruments, and disclosures about credit-risk-related contingent features in derivative agreements. The application of FAS 161 is required for fiscal years and interim periods beginning after November 15, 2008.At this time, management is evaluating the implications of FAS 161 and its impact on the financial statements and the accompanying notes has not yet been determined.
The Fund 43
REPORT OF INDEPENDENT REGISTERED PUBLIC ACCOUNTING FIRM
Shareholders and Board of Directors
Dreyfus New Jersey Municipal Bond Fund, Inc.
We have audited the accompanying statement of assets and liabilities of Dreyfus New Jersey Municipal Bond Fund, Inc. (formerly, Dreyfus Premier New Jersey Municipal Bond Fund, Inc.), including the statement of investments, as of December 31, 2008, and the related statement of operations for the year then ended, the statement of changes in net assets for each of the two years in the period then ended, and financial highlights for each of the periods indicated therein. These financial statements and financial highlights are the responsibility of the Fund’s management. Our responsibility is to express an opinion on these financial statements and financial highlights based on our audits. We conducted our audits in accordance with the standards of the Public Company Accounting Oversight Board (United States).Those standards require that we plan and perform the audit to obtain reasonable assurance about whether the financial statements and financial highlights are free of material misstatement.We were not engaged to perform an audit of the Fund’s internal control over financial reporting. Our audits included consideration of internal control over financial reporting as a basis for designing audit procedures that are appropriate in the circumstances, but not for the purpose of expressing an opinion on the effectiveness of the Fund’s internal control over financial reporting. Accordingly, we express no such opinion.An audit also includes examining, on a test basis, evidence supporting the amounts and disclosures in the financial statements and financial highlights, assessing the accounting principles used and significant estimates made by management, and evaluating the overall financial statement presentation. Our procedures included confirmation of securities owned as of December 31, 2008 by correspondence with the custodian and others. We believe that our audits provide a reasonable basis for our opinion.
In our opinion, the financial statements and financial highlights referred to above present fairly, in all material respects, the financial position of Dreyfus New Jersey Municipal Bond Fund, Inc. at December 31, 2008, the results of its operations for the year then ended, the changes in its net assets for each of the two years in the period then ended, and the financial highlights for each of the indicated periods, in conformity with U. S. generally accepted accounting principles.

New York, New York
February 24, 2009 |
44
IMPORTANT TAX INFORMATION (Unaudited)
In accordance with federal tax law, the fund hereby designates all the dividends paid from investment income-net during the fiscal year ended December 31, 2008 as “exempt-interest dividends” (not subject to regular federal and, for individuals who are New Jersey residents, New Jersey personal income taxes) except $9,897 designated as an ordinary income distribution for reporting purposes.
As required by federal tax law rules, shareholders will receive notification of their portion of the fund’s taxable ordinary dividends (if any) and capital gains (if any) distributions paid for the 2008 calendar year on Form 1099-DIV and their portion of the fund’s exempt-interest dividends paid for the 2008 calendar year on Form 1099-INT, both which will be mailed by January 31, 2009.
The Fund 45
| INFORMATION ABOUT THE REVIEW AND APPROVAL |
| OF THE FUND’S MANAGEMENT AGREEMENT (Unaudited) |
At a meeting of the fund’s Board held on July 10, 2008, the Board unanimously approved the continuation of the fund’s Management Agreement with Dreyfus for a one-year term ending July 31, 2009. The Board members, none of whom are “interested persons” (as defined in the Investment Company Act of 1940, as amended) of the fund, were assisted in their review by independent legal counsel and met with counsel in executive session separate from representatives of Dreyfus. In approving the continuance of the Management Agreement, the Board considered all factors that they believed to be relevant, including, among other things, the factors discussed below.
Analysis of Nature, Extent and Quality of Services Provided to the Fund. The Board members received a presentation from representatives of Dreyfus regarding services provided to the fund and other funds in the Dreyfus fund complex, and discussed the nature, extent and quality of the services provided to the fund pursuant to its Management Agreement. Dreyfus’ representatives reviewed the fund’s distribution of accounts and the relationships Dreyfus has with various intermediaries and the different needs of each. Dreyfus’ representatives noted the various distribution channels for the fund as well as the diverse methods of distribution among other funds in the Dreyfus fund complex, and Dreyfus’ corresponding need for broad, deep, and diverse resources to be able to provide ongoing shareholder services to each distribution channel, including those of the fund. Dreyfus also provided the number of accounts investing in the fund, as well as the fund’s asset size.
The Board members also considered Dreyfus’ research and portfolio management capabilities and Dreyfus’ oversight of day-to-day fund operations, including fund accounting, administration and assistance in meeting legal and regulatory requirements.The Board also considered Dreyfus’ brokerage policies and practices, the standards applied in seeking best execution and Dreyfus’ policies and practices regarding soft dollars.The Board members also considered Dreyfus’ extensive administrative, accounting and compliance infrastructure.
46
Comparative Analysis of the Fund’s Performance and Management Fee and Expense Ratio. The Board members reviewed the fund’s performance for the one-, three-, five- and ten-year periods ended May 31, 2008, and compared the fund’s performance to the performance of a group of comparable retail front-end load New Jersey municipal debt funds (the “Performance Group”) and to a larger universe of funds consisting of all retail and institutional New Jersey municipal debt funds (the “Performance Universe”) selected and provided by Lipper, Inc., an independent provider of investment company data.The Board was provided with a description of the methodology Lipper used to select the Performance Group and Performance Universe, as well as the Expense Group and Expense Universe (discussed below). The Board members noted that they also had received and discussed with management information at periodic intervals comparing the fund’s performance to that of its benchmark index.The Board members discussed the results of the comparisons and noted that the fund’s total return performance for the one-, and ten-year periods ended May 31, 2008 was at the median (in the second and third quartile, respectively) of the Performance Group, but below the median (in the third and fourth quartile, respectively) of the Performance Group for the three- and five-year periods ended May 31, 2008. The Board members also noted that the fund’s total return performance for the one- and ten-year periods ended May 31, 2008 was better than the median (in the second quartile) of the Performance Universe, but was below the median (in the third quartile) of the Performance Universe for the three- and five-year periods ended May 31, 2008.The Board also noted that the fund’s yield for the one-year period ended May 31, 2008 was in the first quartile of the Performance Group and Performance Universe. In addition, the Board noted Dreyfus’ voluntary undertaking currently in effect for the fund, which generally limits total annual operating expenses of the fund, exclusive of taxes, brokerage commissions, extraordinary expenses, interest expenses, commitment fees on
The Fund 47
| INFORMATION ABOUT THE REVIEW AND APPROVAL OF THE |
| FUND’S MANAGEMENT AGREEMENT (Unaudited) (continued) |
borrowings, shareholder servicing fees and Rule 12b-1 fees, but including the management fee, to no more than 0.60% of the value of the fund’s average daily net assets.
The Board members also discussed the fund’s contractual management fee and actual management fee (after waivers in effect as at May 31, 2008) and total expense ratio and reviewed the range of management fees and expense ratios as compared to a group of comparable retail front-end load New Jersey municipal debt funds (the “Expense Group”) and a broader group of funds consisting of all retail front-end load New Jersey municipal debt funds (the “Expense Universe”), each selected and provided by Lipper. The Board members noted that the fund’s actual management fee and total expense ratio (after waivers in effect as at May 31, 2008) were higher than the median (in the fourth quartile and third quartile, respectively) of management fees and total expense ratios of the other funds in the Expense Group and the Expense Universe.The Board again noted Dreyfus’ agreement to limit the fund’s expenses as discussed above.
Representatives of Dreyfus reviewed with the Board members the fees paid to Dreyfus or its affiliates by mutual funds managed by Dreyfus with similar investment objectives, policies and strategies as the fund (the “Similar Funds”). Dreyfus’ representatives also reviewed the costs associated with distribution through intermediaries. The Board analyzed differences in fees paid to Dreyfus and discussed the relationship of the advisory fees paid in light of Dreyfus’ performance, and the services provided.The Board members considered the relevance of the fee information provided for the Similar Funds managed by Dreyfus to evaluate the appropriateness and reasonableness of the fund’s management fees.The Board acknowledged that the differences in fees paid by the Similar Funds seemed to be consistent with the services provided.
Analysis of Profitability and Economies of Scale. Dreyfus’ representatives reviewed the dollar amount of expenses allocated and profit received by Dreyfus and the method used to determine such expenses
48
and profit. The Board members evaluated the profitability analysis in light of the relevant circumstances for the fund and the extent to which economies of scale would be realized if the fund grows and whether fee levels reflect these economies of scale for the benefit of fund investors.The Board members also considered potential benefits to Dreyfus from acting as investment adviser and noted the soft dollar arrangements with respect to trading the fund’s investments.
It was noted that the Board members should consider Dreyfus’ profitability with respect to the fund as part of their evaluation of whether the fees under the Management Agreement bear a reasonable relationship to the mix of services provided by Dreyfus, including the nature, extent and quality of such services and that a discussion of economies of scale is predicated on a fund having achieved a substantial size with increasing assets and that, if a fund’s assets had been static or decreasing, the possibility that Dreyfus may have realized any economies of scale would be less. It also was noted that the profitability percentage for managing the fund was within ranges determined by appropriate court cases to be reasonable given the services rendered and generally superior service levels provided.
At the conclusion of these discussions, the Board agreed that it had been furnished with sufficient information to make an informed business decision with respect to continuation of the fund’s Management Agreement. Based on the discussions and considerations as described above, the Board made the following conclusions and determinations.
- The Board concluded that the nature, extent and quality of the ser- vices provided by Dreyfus are adequate and appropriate.
- The Board was generally satisfied with the fund’s performance.
- The Board concluded that the fee payable by the fund to Dreyfus was reasonable in light of the considerations described above.
The Fund 49
INFORMATION ABOUT THE REVIEW AND APPROVAL OF THE FUND’S MANAGEMENT AGREEMENT (Unaudited) (continued)
- The Board determined that the economies of scale which may accrue to Dreyfus and its affiliates in connection with the manage- ment of the fund had been adequately considered by Dreyfus in connection with the management fee rate charged to the fund and that, to the extent in the future it were determined that material economies of scale had not been shared with the fund, the Board would seek to have those economies of scale shared with the fund.
The Board members considered these conclusions and determinations, along with information received on a routine and regular basis throughout the year, and, without any one factor being dispositive, the Board determined that continuation of the fund’s Management Agreement was in the best interests of the fund and its shareholders.
50
BOARD MEMBERS INFORMATION (Unaudited)
| | Joseph S. DiMartino (65)
Chairman of the Board (1995) |
Principal Occupation During Past 5Years:
- Corporate Director and Trustee
Other Board Memberships and Affiliations:
- The Muscular Dystrophy Association, Director
- Century Business Services, Inc., a provider of outsourcing functions for small and medium size
- The Newark Group, a provider of a national market of paper recovery facilities, paperboard mills and paperboard converting plants, Director
- Sunair Services Corporation, a provider of certain outdoor-related services to homes and businesses, Director
No. of Portfolios for which Board Member Serves: 191
| | Gordon J. Davis (67)
Board Member (1994)
Principal Occupation During Past 5Years: |
- Partner in the law firm of Dewey & LeBoeuf LLP
- President, Lincoln Center for the Performing Arts, Inc. (2001)
| | Other Board Memberships and Affiliations: |
- Consolidated Edison, Inc., a utility company, Director
- Phoenix Companies Inc., a life insurance company, Director
- Board Member/Trustee for several not-for-profit groups
| | No. of Portfolios for which Board Member Serves: 42 |
| | David P. Feldman (69)
Board Member (1994)
Principal Occupation During Past 5Years:
• Corporate Director and Trustee
Other Board Memberships and Affiliations: |
- BBH Mutual Funds Group (11 funds), Director
- The Jeffrey Company, a private investment company, Director
| | No. of Portfolios for which Board Member Serves: 55 |
The Fund 51
BOARD MEMBERS INFORMATION (Unaudited) (continued)
| | Lynn Martin (69)
Board Member (1994)
Principal Occupation During Past 5Years: |
- Advisor to the international accounting firm of Deloitte & Touche, LLP and Chair to its Council for the Advancement of Women from March 1993-September 2005
| | Other Board Memberships and Affiliations: |
- AT&T Inc., a telecommunications company, Director
- Ryder System, Inc., a supply chain and transportation management company, Director
- The Proctor & Gamble Co., a consumer products company, Director
- Constellation Energy Group, Director
- Chicago Council on Global Affairs
- Coca-Cola International Advisory Council
- Deutsche Bank Advisory Council
No. of Portfolios for which Board Member Serves: 14
| | Daniel Rose (79)
Board Member (1994)
Principal Occupation During Past 5Years: |
- Chairman and Chief Executive Officer of Rose Associates, Inc., a New York based real estate development and management firm
| | Other Board Memberships and Affiliations: |
- Baltic-American Enterprise Fund,Vice Chairman and Director
- Harlem Educational Activities Fund, Inc., Chairman
- Housing Committee of the Real Estate Board of New York, Inc., Director
No. of Portfolios for which Board Member Serves: 37
| | Philip L. Toia (75)
Board Member (1997) |
Principal Occupation During Past 5Years:
No. of Portfolios for which Board Member Serves: 25
52
Anne Wexler (78)
Board Member (1994)
Principal Occupation During Past 5Years: |
- Chairman of the Wexler & Walker Public Policy Associates, consultants specializing in government relations and public affairs from January 1981 to present
| Other Board Memberships and Affiliations: |
- The Community Foundation for the National Capital Region, Director
- Member of the Council of Foreign Relations
- WETA-DC’s Public TV and Radio Station,Vice Chairman
| No. of Portfolios for which Board Member Serves: 55 |
Once elected all Board Members serve for an indefinite term, but achieve Emeritus status upon reaching age 80.The address of the Board Members and Officers is in c/o The Dreyfus Corporation, 200 Park Avenue, NewYork, NewYork 10166.Additional information about the Board Members is available in the fund’s Statement of Additional Information which can be obtained from Dreyfus free of charge by calling this toll free number: 1-800-554-4611.
Sander Vanocur, Emeritus Board Member
OFFICERS OF THE FUND (Unaudited)
J. DAVID OFFICER, President since December 2006.
Chief Operating Officer,Vice Chairman and a Director of the Manager, and an officer of 77 investment companies (comprised of 180 portfolios) managed by the Manager. He is 60 years old and has been an employee of the Manager since April 1998.
PHILLIP N. MAISANO, Executive Vice President since July 2007.
Chief Investment Officer,Vice Chair and a director of the Manager, and an officer of 77 investment companies (comprised of 180 portfolios) managed by the Manager. Mr. Maisano also is an officer and/or Board member of certain other investment management subsidiaries of The Bank of New York Mellon Corporation, each of which is an affiliate of the Manager. He is 61 years old and has been an employee of the Manager since November 2006. Prior to joining the Manager, Mr. Maisano served as Chairman and Chief Executive Officer of EACM Advisors, an affiliate of the Manager, since August 2004, and served as Chief Executive Officer of Evaluation Associates, a leading institutional investment consulting firm, from 1988 until 2004.
MICHAEL A. ROSENBERG, Vice President and Secretary since August 2005.
Assistant General Counsel of BNY Mellon, and an officer of 78 investment companies (comprised of 201 portfolios) managed by the Manager. He is 48 years old and has been an employee of the Manager since October 1991.
JAMES BITETTO, Vice President and Assistant Secretary since August 2005.
Senior Counsel of BNY Mellon and Secretary of the Manager, and an officer of 78 investment companies (comprised of 201 portfolios) managed by the Manager. He is 42 years old and has been an employee of the Manager since December 1996.
JONI LACKS CHARATAN, Vice President and Assistant Secretary since August 2005.
Senior Counsel of BNY Mellon, and an officer of 78 investment companies (comprised of 201 portfolios) managed by the Manager. She is 53 years old and has been an employee of the Manager since October 1988.
JOSEPH M. CHIOFFI, Vice President and Assistant Secretary since August 2005.
Senior Counsel of BNY Mellon, and an officer of 78 investment companies (comprised of 201 portfolios) managed by the Manager. He is 47 years old and has been an employee of the Manager since June 2000.
JANETTE E. FARRAGHER, Vice President and Assistant Secretary since August 2005.
Assistant General Counsel of BNY Mellon, and an officer of 78 investment companies (comprised of 201 portfolios) managed by the Manager. She is 46 years old and has been an employee of the Manager since February 1984.
JOHN B. HAMMALIAN, Vice President and Assistant Secretary since August 2005.
Managing Counsel of BNY Mellon, and an officer of 78 investment companies (comprised of 201 portfolios) managed by the Manager. He is 45 years old and has been an employee of the Manager since February 1991.
ROBERT R. MULLERY, Vice President and Assistant Secretary since August 2005.
Managing Counsel of BNY Mellon, and an officer of 78 investment companies (comprised of 201 portfolios) managed by the Manager. He is 56 years old and has been an employee of the Manager since May 1986.
54
JEFF PRUSNOFSKY, Vice President and Assistant Secretary since August 2005.
Managing Counsel of BNY Mellon, and an officer of 78 investment companies (comprised of 201 portfolios) managed by the Manager. He is 43 years old and has been an employee of the Manager since October 1990.
JAMES WINDELS, Treasurer since November 2001.
Director – Mutual Fund Accounting of the Manager, and an officer of 78 investment companies (comprised of 201 portfolios) managed by the Manager. He is 49 years old and has been an employee of the Manager since April 1985.
RICHARD CASSARO, Assistant Treasurer since January 2008.
Senior Accounting Manager – Money Market and Municipal Bond Funds of the Manager, and an officer of 78 investment companies (comprised of 201 portfolios) managed by the Manager. He is 49 years old and has been an employee of the Manager since September 1982.
GAVIN C. REILLY, Assistant Treasurer since December 2005.
Tax Manager of the Investment Accounting and Support Department of the Manager, and an officer of 78 investment companies (comprised of 201 portfolios) managed by the Manager. He is 40 years old and has been an employee of the Manager since April 1991.
ROBERT ROBOL, Assistant Treasurer since August 2003.
Senior Accounting Manager – Fixed Income Funds of the Manager, and an officer of 78 investment companies (comprised of 201 portfolios) managed by the Manager. He is 44 years old and has been an employee of the Manager since October 1988.
ROBERT SALVIOLO, Assistant Treasurer since July 2007.
Senior Accounting Manager – Equity Funds of the Manager, and an officer of 78 investment companies (comprised of 201 portfolios) managed by the Manager. He is 41 years old and has been an employee of the Manager since June 1989.
ROBERT SVAGNA, Assistant Treasurer since August 2005.
Senior Accounting Manager – Equity Funds of the Manager, and an officer of 78 investment companies (comprised of 201 portfolios) managed by the Manager. He is 41 years old and has been an employee of the Manager since November 1990.
JOSEPH W. CONNOLLY, Chief Compliance Officer since October 2004.
Chief Compliance Officer of the Manager and The Dreyfus Family of Funds (78 investment companies, comprised of 201 portfolios). From November 2001 through March 2004, Mr. Connolly was first Vice-President, Mutual Fund Servicing for Mellon Global Securities Services. In that capacity, Mr. Connolly was responsible for managing Mellon’s Custody, Fund Accounting and Fund Administration services to third-party mutual fund clients. He is 51 years old and has served in various capacities with the Manager since 1980, including manager of the firm’s Fund Accounting Department from 1997 through October 2001.
WILLIAM GERMENIS, Anti-Money Laundering Compliance Officer since October 2002.
Vice President and Anti-Money Laundering Compliance Officer of the Distributor, and the Anti-Money Laundering Compliance Officer of 74 investment companies (comprised of 197 portfolios) managed by the Manager. He is 38 years old and has been an employee of the Distributor since October 1998.
The Fund 55
NOTES

The Registrant has adopted a code of ethics that applies to the Registrant's principal executive officer, principal financial officer, principal accounting officer or controller, or persons performing similar functions. There have been no amendments to, or waivers in connection with, the Code of Ethics during the period covered by this Report.
| Item 3. | | Audit Committee Financial Expert. |
The Registrant's Board has determined that David P. Feldman, a member of the Audit Committee of the Board, is an audit committee financial expert as defined by the Securities and Exchange Commission (the "SEC"). David P. Feldman is "independent" as defined by the SEC for purposes of audit committee financial expert determinations.
| Item 4. | | Principal Accountant Fees and Services. |
(a) Audit Fees. The aggregate fees billed for each of the last two fiscal years (the "Reporting Periods") for professional services rendered by the Registrant's principal accountant (the "Auditor") for the audit of the Registrant's annual financial statements or services that are normally provided by the Auditor in connection with the statutory and regulatory filings or engagements for the Reporting Periods, were $36,962 2007 and $38,070 in 2008.
(b) Audit-Related Fees. The aggregate fees billed in the Reporting Periods for assurance and related services by the Auditor that are reasonably related to the performance of the audit of the Registrant's financial statements and are not reported under paragraph (a) of this Item 4 were $0 2007 and $10,398 in 2008.
The aggregate fees billed in the Reporting Periods for non-audit assurance and related services by the Auditor to the Registrant's investment adviser (not including any sub-investment adviser whose role is primarily portfolio management and is subcontracted with or overseen by another investment adviser), and any entity controlling, controlled by or under common control with the investment adviser that provides ongoing services to the Registrant ("Service Affiliates"), that were reasonably related to the performance of the annual audit of the Service Affiliate, which required pre-approval by the Audit Committee were $0 in 2007 and $0 in 2008.
Note: For the second paragraph in each of (b) through (d) of this Item 4, certain of such services were not pre-approved prior to May 6, 2003, when such services were required to be pre-approved. On and after May 6, 2003, 100% of all services provided by the Auditor were pre-approved as required. For comparative purposes, the fees shown assume that all such services were pre-approved, including services that were not pre-approved prior to the compliance date of the pre-approval requirement.
(c) Tax Fees. The aggregate fees billed in the Reporting Periods for professional services rendered by the Auditor for tax compliance, tax advice, and tax planning ("Tax Services") were $3,311 in 2007 and $2,757 in 2008. These services consisted of: (i) review or preparation of U.S. federal, state, local and excise tax returns; (ii) U.S. federal, state and local tax planning, advice and assistance regarding statutory, regulatory or administrative developments; (iii) tax advice regarding tax qualification matters and/or treatment of various financial instruments held or proposed to be acquired or held. The aggregate fees billed in the Reporting Periods for Tax Services by the Auditor to Service Affiliates, which required pre-approval by the Audit Committee were $0 in 2007 and $0 in 2008.
-3-
(d) All Other Fees. The aggregate fees billed in the Reporting Periods for products and services provided by the Auditor, other than the services reported in paragraphs (a) through (c) of this Item, were $0 in 2007 and $230 in 2008. [These services consisted of a review of the Registrant's anti-money laundering program].
The aggregate fees billed in the Reporting Periods for Non-Audit Services by the Auditor to Service Affiliates, other than the services reported in paragraphs (b) through (c) of this Item, which required pre-approval by the Audit Committee, were $0 in 2007 and $0 in 2008.
Audit Committee Pre-Approval Policies and Procedures. The Registrant's Audit Committee has established policies and procedures (the "Policy") for pre-approval (within specified fee limits) of the Auditor's engagements for non-audit services to the Registrant and Service Affiliates without specific case-by-case consideration. Pre-approval considerations include whether the proposed services are compatible with maintaining the Auditor's independence. Pre-approvals pursuant to the Policy are considered annually.
Non-Audit Fees. The aggregate non-audit fees billed by the Auditor for services rendered to the Registrant, and rendered to Service Affiliates, for the Reporting Periods were $1,889,332 in 2007 and $12,561,320 in 2008.
Auditor Independence. The Registrant's Audit Committee has considered whether the provision of non-audit services that were rendered to Service Affiliates, which were not pre-approved (not requiring pre-approval), is compatible with maintaining the Auditor's independence.
| Item 5. | | Audit Committee of Listed Registrants. |
| | | Not applicable. [CLOSED-END FUNDS ONLY] |
| Item 6. | | Investments. |
| (a) | | Not applicable. |
| Item 7. | | Disclosure of Proxy Voting Policies and Procedures for Closed-End Management |
| | | Investment Companies. |
| | | Not applicable. [CLOSED-END FUNDS ONLY] |
| Item 8. | | Portfolio Managers of Closed-End Management Investment Companies. |
| | | Not applicable. [CLOSED-END FUNDS ONLY, beginning with reports for periods ended |
| | | on and after December 31, 2005] |
| Item 9. | | Purchases of Equity Securities by Closed-End Management Investment Companies and |
| | | Affiliated Purchasers. |
| | | Not applicable. [CLOSED-END FUNDS ONLY] |
| Item 10. | | Submission of Matters to a Vote of Security Holders. |
The Registrant has a Nominating Committee (the "Committee"), which is responsible for selecting and nominating persons for election or appointment by the Registrant's Board as Board members. The Committee has adopted a Nominating Committee Charter (the "Charter"). Pursuant to the Charter, the Committee will consider recommendations for nominees from shareholders submitted to the Secretary of the Registrant, c/o The Dreyfus Corporation Legal Department, 200 Park Avenue, 8th Floor East, New York,
-4-
New York 10166. A nomination submission must include information regarding the recommended nominee as specified in the Charter. This information includes all information relating to a recommended nominee that is required to be disclosed in solicitations or proxy statements for the election of Board members, as well as information sufficient to evaluate the factors to be considered by the Committee, including character and integrity, business and professional experience, and whether the person has the ability to apply sound and independent business judgment and would act in the interests of the Registrant and its shareholders. Nomination submissions are required to be accompanied by a written consent of the individual to stand for election if nominated by the Board and to serve if elected by the shareholders, and such additional information must be provided regarding the recommended nominee as reasonably requested by the Committee.
| Item 11. | | Controls and Procedures. |
(a) The Registrant's principal executive and principal financial officers have concluded, based on their evaluation of the Registrant's disclosure controls and procedures as of a date within 90 days of the filing date of this report, that the Registrant's disclosure controls and procedures are reasonably designed to ensure that information required to be disclosed by the Registrant on Form N-CSR is recorded, processed, summarized and reported within the required time periods and that information required to be disclosed by the Registrant in the reports that it files or submits on Form N-CSR is accumulated and communicated to the Registrant's management, including its principal executive and principal financial officers, as appropriate to allow timely decisions regarding required disclosure.
(b) There were no changes to the Registrant's internal control over financial reporting that occurred during the second fiscal quarter of the period covered by this report that have materially affected, or are reasonably likely to materially affect, the Registrant's internal control over financial reporting.
(a)(1) Code of ethics referred to in Item 2.
(a)(2) Certifications of principal executive and principal financial officers as required by Rule 30a-2(a) under the Investment Company Act of 1940.
(a)(3) Not applicable.
(b) Certification of principal executive and principal financial officers as required by Rule 30a-2(b) under the Investment Company Act of 1940.
-5-
Pursuant to the requirements of the Securities Exchange Act of 1934 and the Investment Company Act of 1940, the Registrant has duly caused this Report to be signed on its behalf by the undersigned, thereunto duly authorized.
Dreyfus New Jersey Municipal Bond Fund, Inc.
| By: | | /s/ J. David Officer |
| | | J. David Officer, |
| | President |
| |
| Date: | | February 23, 2009 |
| | | |
Pursuant to the requirements of the Securities Exchange Act of 1934 and the Investment Company Act of 1940, this Report has been signed below by the following persons on behalf of the Registrant and in the capacities and on the dates indicated.
| By: | | /s/ J. David Officer |
| | | J. David Officer, |
| | | President |
| |
| Date: | | February 23, 2009 |
| |
| By: | | /s/ James Windels |
| | | James Windels, |
| | | Treasurer |
| |
| Date: | | February 23, 2009 |
EXHIBIT INDEX
| (a)(1) | | Code of ethics referred to in Item 2. |
| |
| (a)(2) | | Certifications of principal executive and principal financial officers as required by Rule 30a- |
| 2(a) under the Investment Company Act of 1940. (EX-99.CERT) |
| |
| (b) | | Certification of principal executive and principal financial officers as required by |
| Rule 30a-2(b) under the Investment Company Act of 1940. (EX-99.906CERT) |
-6-