 GSI Commerce, Inc. SG Cowen Internet Conference December 8, 2005 GSI Commerce, Inc. SG Cowen Internet Conference December 8, 2005 Exhibit 99.1 |
 2 Safe Harbor Statement Safe Harbor Statement All statements made in this presentation, other than statements of historical fact, are forward- looking statements. The words “anticipate,” “believe,” “estimate,” “expect,” “intend,” “may,” “plan,” “will,” “would,” “should,” “guidance,” “potential,” “continue,” “project,” “forecast,” “confident,” “prospects,” and similar expressions typically are used to identify forward-looking statements. Forward-looking statements are based on the then-current expectations, beliefs, assumptions, estimates and forecasts about the business of GSI Commerce and the industries and markets in which GSI Commerce operates. These statements are not guarantees of future performance and involve risks, uncertainties and assumptions, which are difficult to predict. Therefore, actual outcomes and results may differ materially from what is expressed or implied by these forward-looking statements. Factors which may affect GSI Commerce’s business, financial condition and operating results include the effects of changes in the economy, the impact of FASB 123(R), consumer spending, the financial markets and the industries in which GSI Commerce and its partners operate, changes affecting the Internet and e-commerce, the ability of GSI Commerce to develop and maintain relationships with strategic partners and suppliers and the timing of its establishment, extension or termination of its relationships with strategic partners, the ability of GSI Commerce to timely and successfully develop, maintain and protect its technology and product and service offerings and execute operationally, the ability of GSI Commerce to attract and retain qualified personnel, the ability of GSI Commerce to successfully integrate its acquisitions of other businesses, if any, and the performance of acquired businesses. More information about potential factors that could affect GSI Commerce can be found in its most recent Form 10-K, Form 10-Q and other reports and statements filed by GSI Commerce with the SEC. GSI Commerce expressly disclaims any intent or obligation to update these forward-looking statements, except as otherwise specifically stated by GSI Commerce. |
 3 Non-GAAP Financial Measures Non-GAAP Financial Measures This presentation contains the non-GAAP measures merchandise sales, certain ratios that use merchandise sales and adjusted EBITDA. Merchandise sales represent the retail value of all sales transactions, inclusive of freight charges and net of allowances for returns and discounts, which flow through the GSI Commerce platform, whether or not the company is the seller of the merchandise, or records the full amount of such sales on its financial statements. GSI Commerce uses merchandise sales as a metric for operating its business. Variable costs such as fulfillment and customer service labor expense, order processing costs such as credit card and bank processing fees and business management costs such as department staffing levels for partner services are related to the amount of sales made through GSI Commerce’s platform, whether or not GSI Commerce records the revenue from such sales. GSI Commerce believes that investors will have a more thorough understanding of its historical expenses and expense trends if they have visibility to both GAAP net revenue as well as the non-GAAP financial measure merchandise sales and the percentages that such expenses bear to net revenues and merchandise sales. GSI Commerce also uses adjusted EBITDA, which represents earnings (or losses) before interest income/expense, taxes, depreciation, amortization, and stock-based compensation. GSI Commerce uses adjusted EBITDA as a means to evaluate its performance period to period without taking into account certain expenses, particularly stock-based compensation expense, which may fluctuate materially due to fluctuations in the price of GSI Commerce’s common stock both on a quarterly and annual basis, and does not consistently reflect GSI Commerce’s results from its core business activities. These financial measures should be considered in addition to, and not as a substitute for, or superior to, other measures of financial performance prepared in accordance with GAAP. The non-GAAP financial measures included in this presentation have been reconciled to the nearest GAAP measures as required under Securities and Exchange Commission rules. |
 4 Leading Provider of Outsourced e-Commerce Solutions Leading Provider of Outsourced e-Commerce Solutions • • 50+ major retailers & brands, 7 merchandise categories 50+ major retailers & brands, 7 merchandise categories • • Comprehensive, centralized e-commerce platform Comprehensive, centralized e-commerce platform • • 1,300+ employees 1,300+ employees • • Net revenues – Net revenues – $335 million in FY2004 estimated to $335 million in FY2004 estimated to grow 29% to $432 million in FY2005. grow 29% to $432 million in FY2005. |
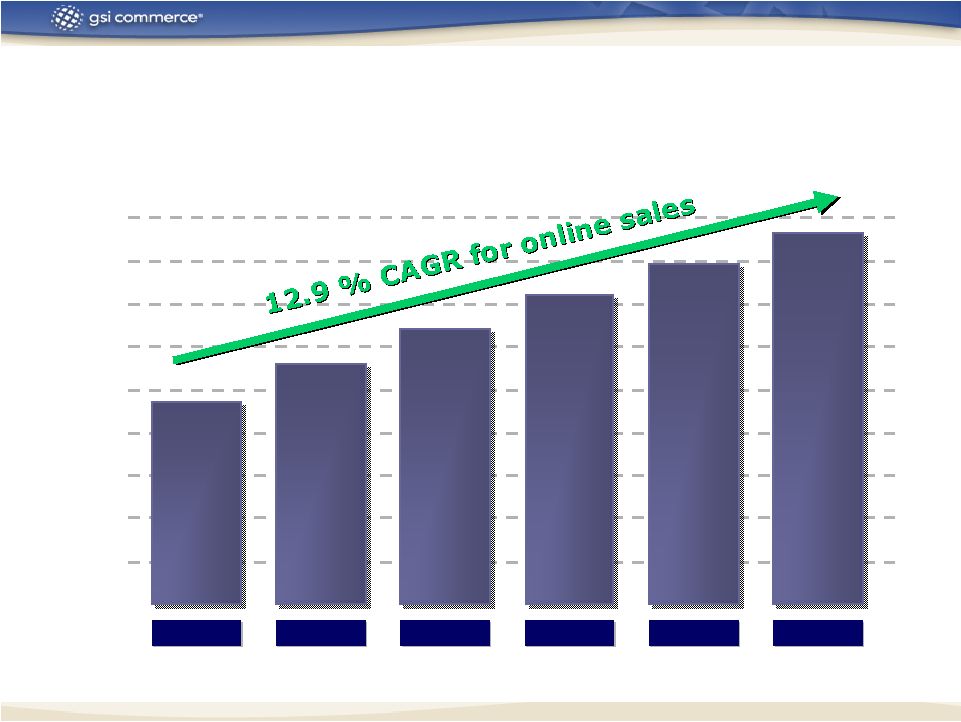             5 The U.S. Online General Merchandise Market * The U.S. Online General Merchandise Market * The U.S. Online General Merchandise Market * $20 $20 $20 $40 $40 $40 $60 $60 $60 $80 $80 $80 $100 $100 $100 $120 $120 $120 $140 $140 $140 $160 $160 $160 $ in billions $ in billions $ in billions Strong Growth Projected for e-Commerce Strong Growth Projected for e-Commerce * GSI Commerce excludes automobiles and parts, food and beverage, and travel from the estimated calculation of the U.S. online general merchandise market. Source: Forrester Research 2005E 2005E $94.5 $94.5 2006E 2006E $111.7 $111.7 2007E 2007E $128.0 $128.0 2008E 2008E $143.9 $143.9 2009E 2009E $158.9 $158.9 2010E 2010E $173.1 $173.1 $180 $180 $180 |
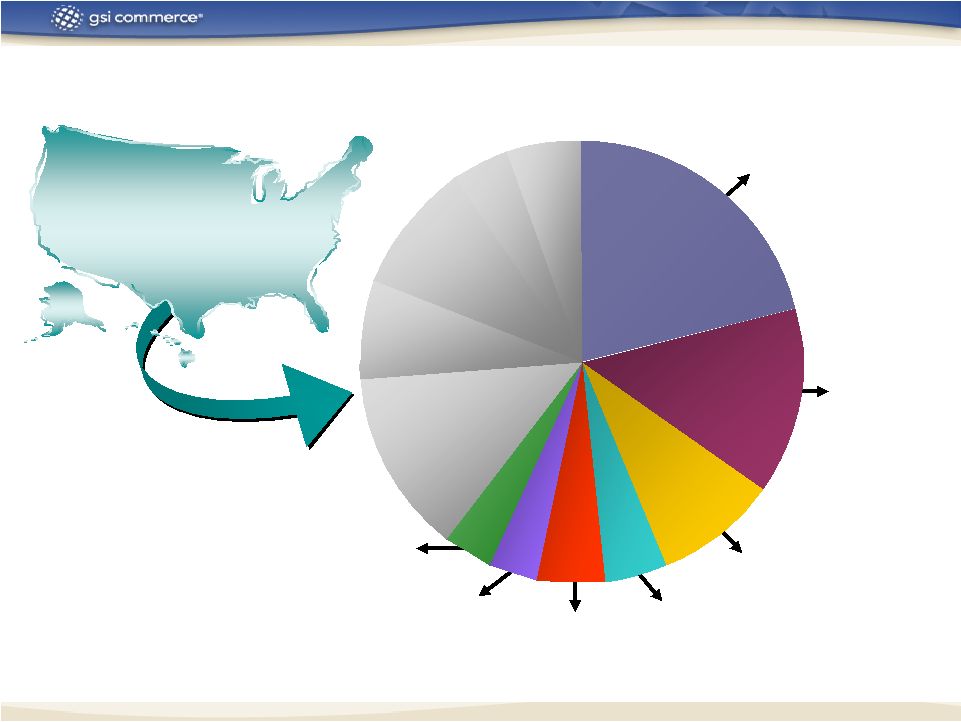 6 Large Addressable Domestic Market for GSI Commerce Large Addressable Domestic Market for GSI Commerce 2006 U.S. Online General 2006 U.S. Online General Merchandise Market * Merchandise Market * $111.7 billion $111.7 billion * GSI Commerce excludes automobiles and parts, food and beverage, and travel from the estimated calculation of the U.S. online general merchandise market. Source: Forrester Research $10.0 $10.0 $4.0 $4.0 $5.4 $5.4 $5.1 $5.1 $4.1 $4.1 $ in billions $ in billions $23.5 $23.5 $15.2 $15.2 2006 Estimated Target Categories Worth $67.3 billion 2006 Estimated Target Categories Worth $67.3 billion Apparel Apparel Home Home Consumer Consumer Electronics Electronics Music & Video Music & Video Sporting Goods Sporting Goods Jewelry & Luxury Goods Jewelry & Luxury Goods Health & Beauty Health & Beauty |
 7 * For GSI Commerce partners, online sales typically are between 2%-3% of total sales. Compelling Reason for Prospects to Outsource Compelling Reason for Prospects to Outsource Online general merchandise sales estimated to be 3.6% of total retail sales in 2004 * Online general merchandise sales estimated to be 3.6% of total retail sales in 2004 * Too large to ignore! Too large to ignore! Most of online retail sales will come from multichannel partners Most of online retail sales will come from multichannel partners However However Multichannel retailers derive vast majority of revenue offline Multichannel retailers derive vast majority of revenue offline Online retail is not a core competency! Online retail is not a core competency! Enable companies to maximize online business in a growing e-commerce market Enable companies to maximize online business in a growing e-commerce market Significant opportunity! Significant opportunity! |
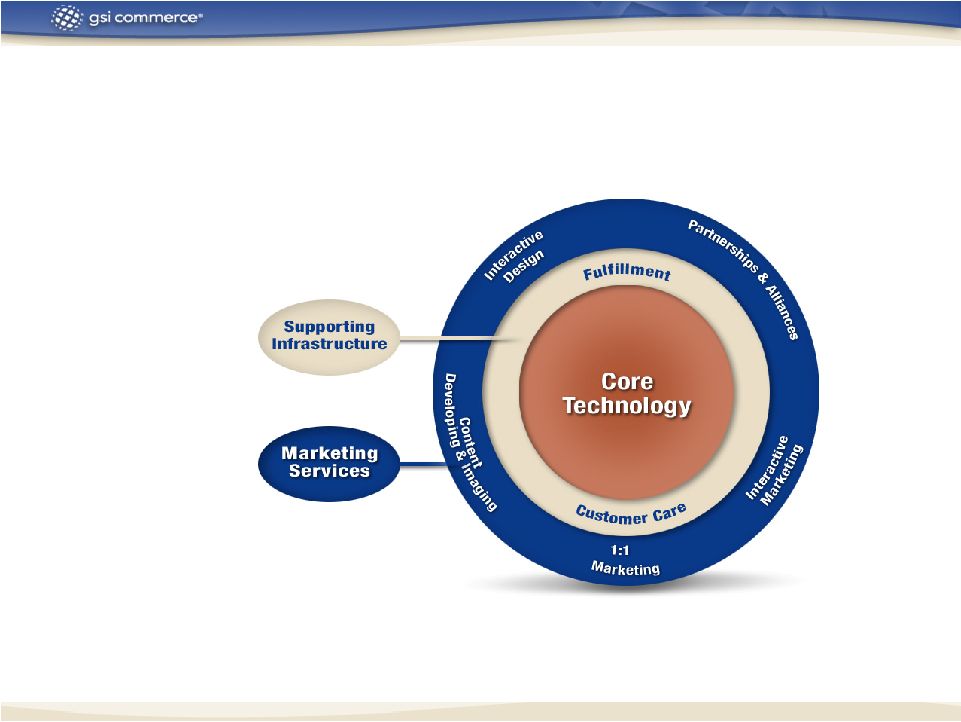
 8 GSI Offers a Strong Value Proposition GSI Offers a Strong Value Proposition • • A Complete Solution A Complete Solution Access to integrated suite of technology, supporting Access to integrated suite of technology, supporting infrastructure and partner services enables partners to infrastructure and partner services enables partners to avoid non-leveragable avoid non-leveragable investments investments • • Partner-centric / Brand-centric Partner-centric / Brand-centric Partners maintain full brand identity with consumers. Partners maintain full brand identity with consumers. GSI Commerce has a transparent role GSI Commerce has a transparent role • • Expertise & High-Quality Components Expertise & High-Quality Components GSI Commerce has a critical mass of expertise in integrated GSI Commerce has a critical mass of expertise in integrated online technology, marketing and retailing online technology, marketing and retailing • • Focus on Reinvestment Focus on Reinvestment Multipartner Multipartner model model scale and operating leverage scale and operating leverage • • Win/Win Economics Win/Win Economics Financial predictability and aligned interests through long- Financial predictability and aligned interests through long- term contracts term contracts |
 9 Partnering with Top Brands Partnering with Top Brands Apparel Apparel Electronics Electronics Health & Beauty Health & Beauty Sporting Goods Sporting Goods Entertainment Entertainment Home Home Jewelry & Luxury Goods Jewelry & Luxury Goods |
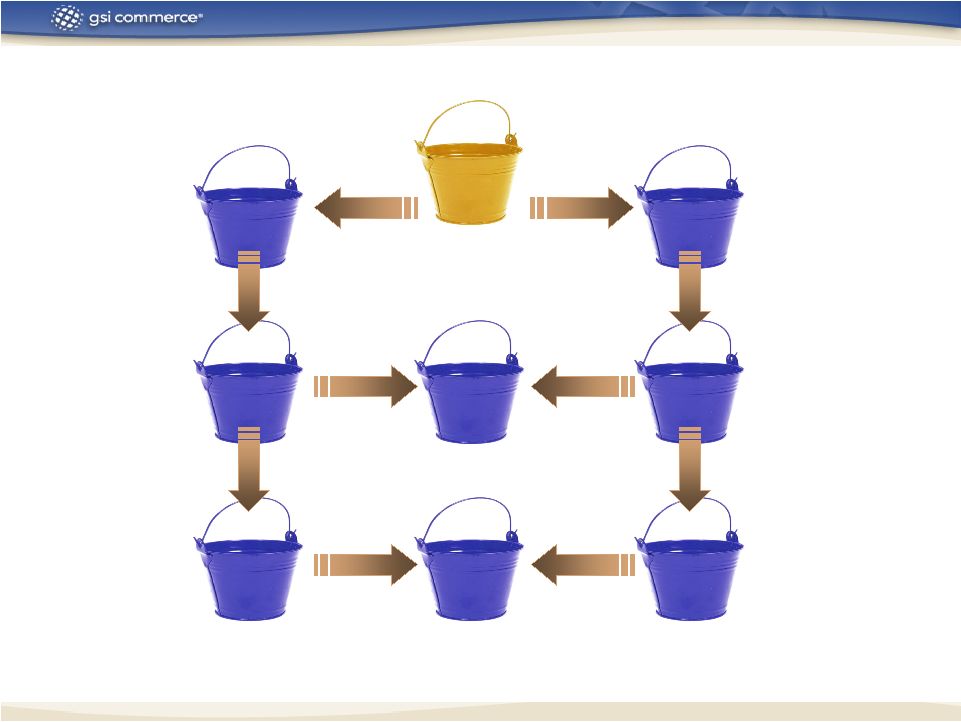
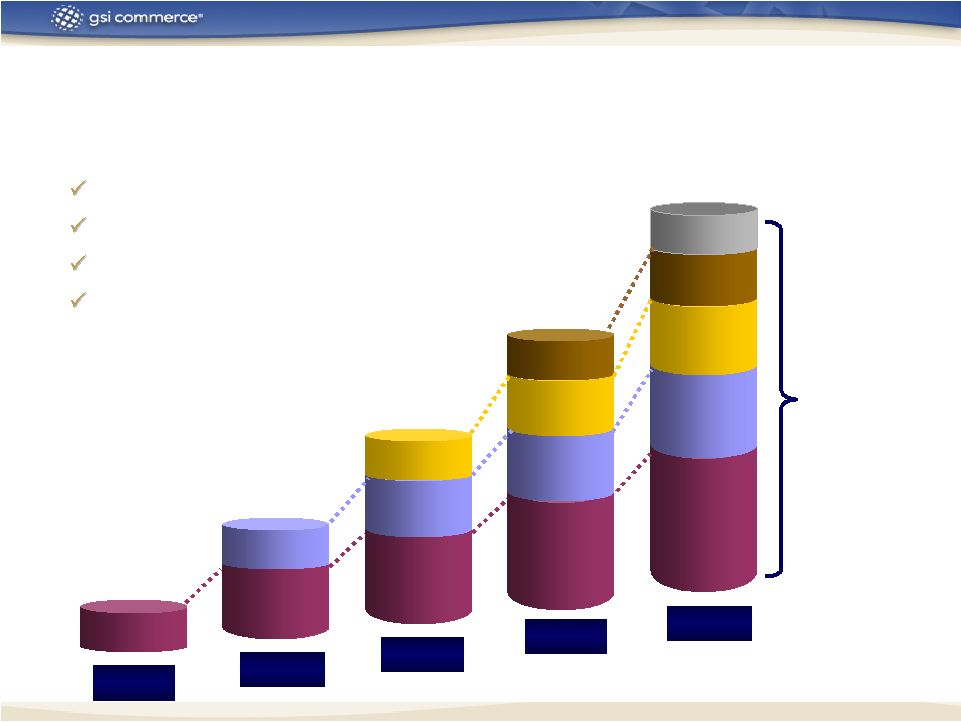 10 Growth Strategy Growth Strategy Compounding effect of long-term agreements 2008 2007 2006 2005 2004 • • Add new partners Add new partners • • Grow revenues from each partner Grow revenues from each partner Secular e-commerce growth Secular e-commerce growth Platform enhancements Platform enhancements Value-added partner services Value-added partner services Scope expansion Scope expansion • • international, multichannel international, multichannel |
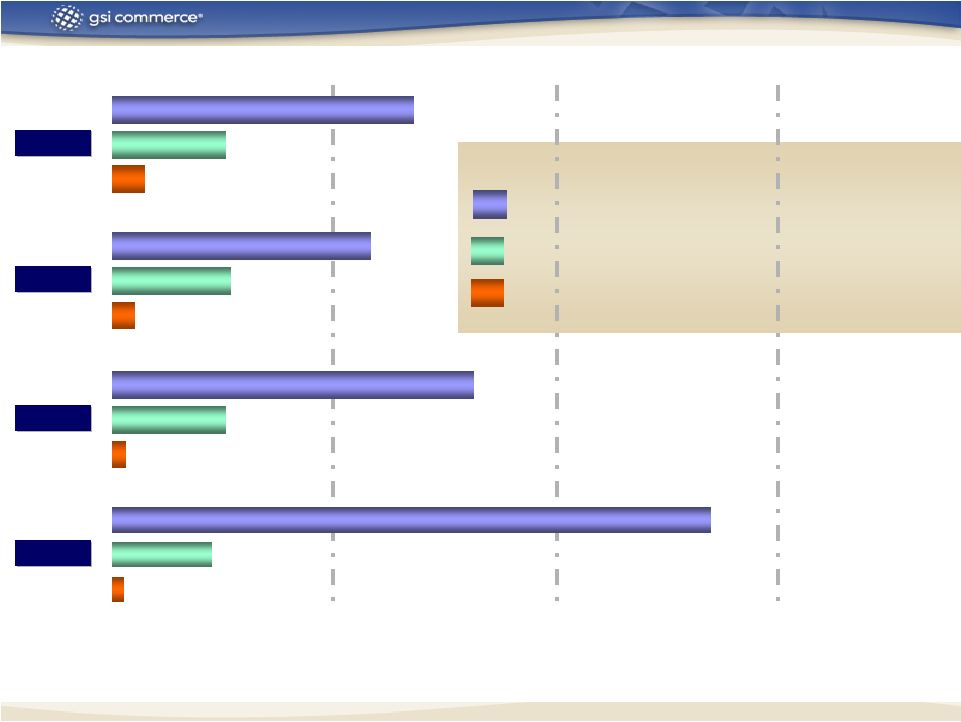 11 Growing Faster than the Industry Growing Faster than the Industry 50.0% 50.0% 100.0% 100.0% 150.0% 150.0% 2001 2001 2002 2002 2003 2003 2004 2004 68% 68% 25.4% 25.4% 7.3% 7.3% 5.3% 5.3% 27.0% 27.0% 58.2% 58.2% 81.4% 81.4% 25.6% 25.6% 3.0% 3.0% 135.2% 135.2% 22.3% 22.3% 2.7% 2.7% GSI Commerce Merchandise Sales ** E-Commerce Sales Total Retail Sales Percent Growth Y/Y * * E-commerce Sales and Total Retail Sales Source: Census Bureau, U.S. Department of Commerce. ** For a reconciliation of non-GAAP financial measures, see Appendices of this presentation and/or see our results for fiscal years 2001 - 2004 at www.gsicommerce.com/news/news.jsp . Prior to 2002, GSI Commerce did not use merchandise sales and so total net total revenue is used in this presentation for fiscal year 2001. |
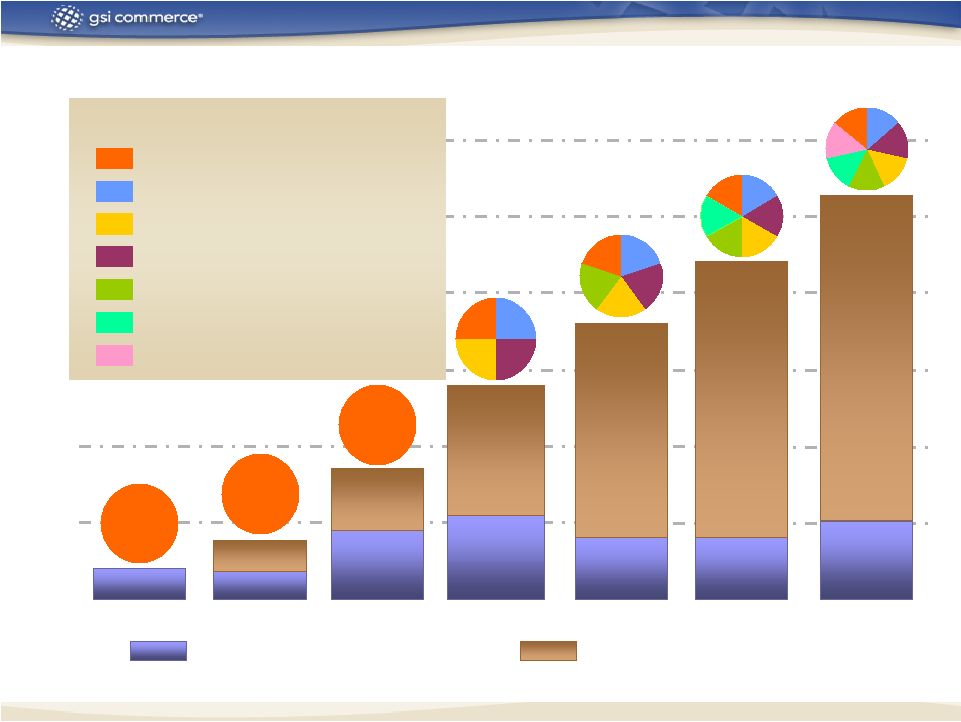 12 Category Expansion & Partner Growth Category Expansion & Partner Growth 1999 1999 2000 2000 2001 2001 2002 2002 2003 2003 2004 2004 2005 2005 10 10 20 20 30 30 40 40 50 50 60 60 4 4 4 4 9 9 11 11 8 8 8 8 10* 10* 8 8 17 17 28 28 36 36 44 44 54* 54* Sports Sports Consumer Electronics Consumer Electronics Health & Beauty Health & Beauty Entertainment Entertainment Home Home Apparel Apparel Jewelry & Luxury Goods Jewelry & Luxury Goods 1 1 1 1 1 1 4 4 5 5 6 6 7 7 Categories Categories Total number of partners Total number of partners New partners signed that year New partners signed that year * As reported through Nov. 16, 2005. * As reported through Nov. 16, 2005. |
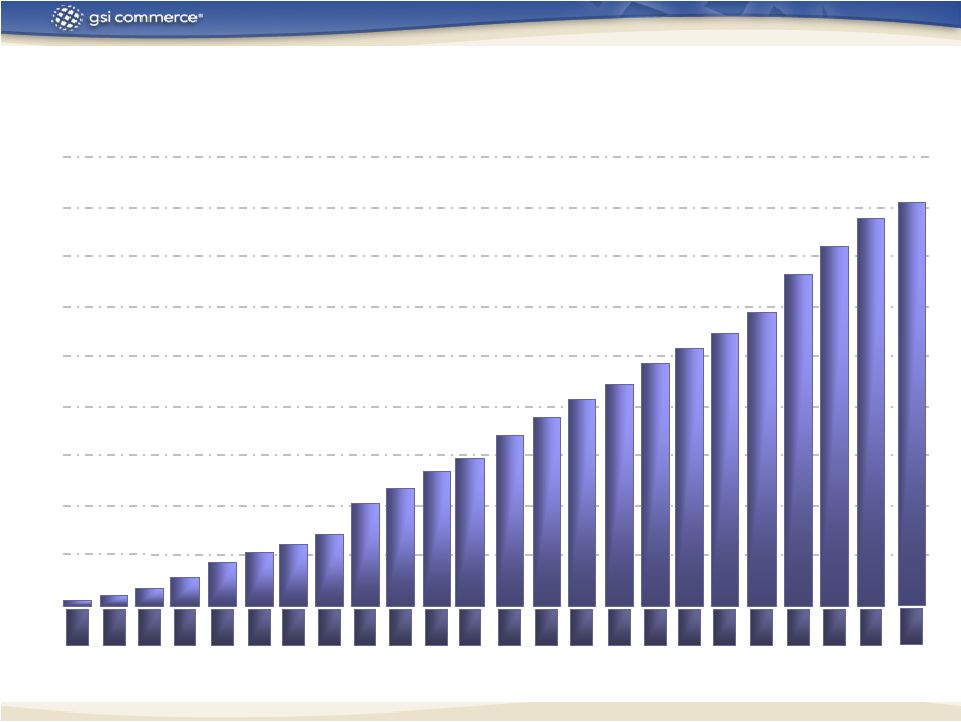 13 Net Revenues – Net Revenues – Trailing Four Quarters Trailing Four Quarters Net Revenue $ in millions Net Revenue $ in millions 3Q 3Q 00 00 3Q 3Q 01 01 3Q 3Q 02 02 3Q 3Q 03 03 3Q 3Q 04 04 4Q 4Q 99 99 4Q 4Q 00 00 4Q 4Q 01 01 4Q 4Q 02 02 4Q 4Q 03 03 4Q 4Q 04 04 2Q 2Q 00 00 2Q 2Q 01 01 2Q 2Q 02 02 2Q 2Q 03 03 2Q 2Q 04 04 2Q 2Q 05 05 1Q 1Q 00 00 1Q 1Q 01 01 1Q 1Q 02 02 1Q 1Q 03 03 1Q 1Q 04 04 1Q 1Q 05 05 $50 $50 $100 $100 $150 $150 $200 $200 $250 $250 $300 $300 $350 $350 $400 $400 $450 $450 5.5 5.5 11.2 11.2 18.9 18.9 27.9 27.9 42.7 42.7 53.2 53.2 62.4 62.4 71.4 71.4 102.5 102.5 118.2 118.2 134.4 134.4 148.6 148.6 172.5 172.5 189.5 189.5 206.7 206.7 222.0 222.0 241.9 241.9 259.3 259.3 273.7 273.7 294.8 294.8 335.1 335.1 360.3 360.3 387.7 387.7 3Q 3Q 05 05 403.8 403.8 |
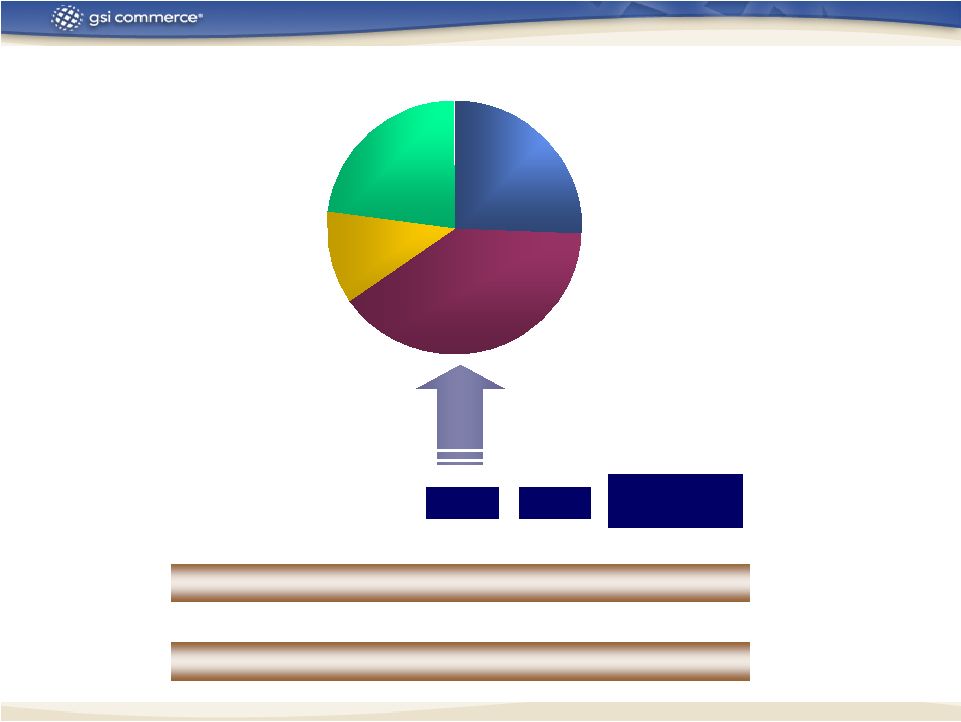
 14 $475 M $475 M Business Models Provide Balanced Gross Profit Contribution Business Models Provide Balanced Gross Profit Contribution Owned Inventory Non-Owned Inventory $275 M $275 M $200 M $200 M $275 M $275 M $60 M $60 M $335 M $335 M Total Net Revenue Net Revenue Owned Inventory (Product Sales) Net Revenue Non-Owned Inventory (Service Fees) $72 M $72 M $60 M $60 M $132 M $132 M Gross Profit Owned Inventory Gross Profit Non-Owned Inventory Total Gross Profit Merchandise Sales in 2004 |
 15 2004 Expense Breakdown 2004 Expense Breakdown $79.2 M $79.2 M Sales & Marketing Sales & Marketing $20.2 M $20.2 M Product Development Product Development $18.8M $18.8M G&A and Other G&A and Other - - Fulfillment Fulfillment - - Credit card processing Credit card processing - - Customer care Customer care - - Revenue share Revenue share - - Business management Business management - - Technology Technology - - HR, legal, finance, business HR, legal, finance, business development, corp. development & development, corp. development & minority interest minority interest $13.6 M $13.6 M Adjusted EBITDA Adjusted EBITDA $132 M $132 M Total Gross Profit Total Gross Profit |
 16 Multiple Drivers of Margin Expansion Multiple Drivers of Margin Expansion +1,880 +1,880 Basis Basis Points Points 430 bp 430 bp 800 bp 800 bp 240 bp 240 bp 410 bp 410 bp Gross Margin Gross Margin Sales & Marketing Sales & Marketing Product Product Development Development G&A and Other G&A and Other Gross Profit Gross Profit 35.2% 39.3% 35.2% 39.3% 410 410 Sales & Marketing Sales & Marketing 31.6% 23.6% 31.6% 23.6% 800 800 Product Develop. Product Develop. 8.4% 6.0% 8.4% 6.0% 240 240 G&A and Other G&A and Other 9.9% 5.6% 9.9% 5.6% 430 430 2001 2001 2004 2004 As a % of net revenues As a % of net revenues Basis Point Basis Point Variance Variance |
 17 Cash * Cash * $75.4 $75.4 $112.2 $112.2 Inventory Inventory $37.8 $37.8 $33.9 $33.9 Net Fixed Assets Net Fixed Assets $74.4 $74.4 $86.0 $86.0 Total Assets Total Assets $231.8 $231.8 $276.2 $276.2 Debt Debt $14.5 $14.5 $71.4 $71.4 A/P & Accrued A/P & Accrued $89.9 $89.9 $57.3 $57.3 Total Liabilities Total Liabilities $113.8 $113.8 $135.0 $135.0 Equity Equity $118.1 $118.1 $141.1 $141.1 * Cash and cash equivalents, short-term investments and marketable securities Strong Balance Sheet Strong Balance Sheet ($ millions) ($ millions) Jan. 1, 2005 Jan. 1, 2005 Oct. 1, 2005 Oct. 1, 2005 |
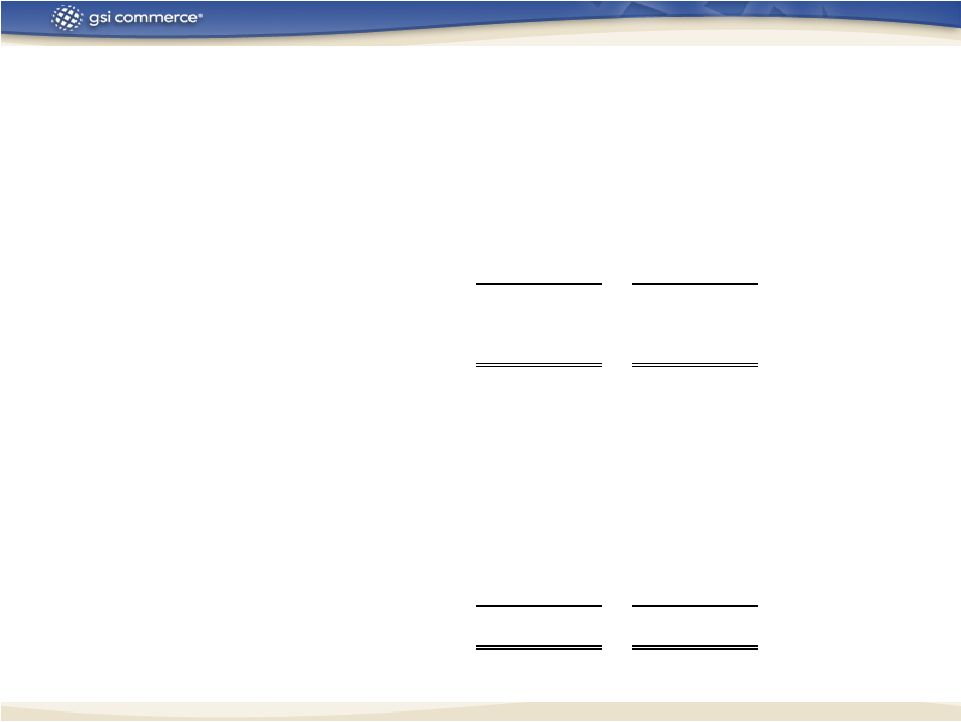 18 Appendix A Appendix A December 29, January 1, 2001 2005 Adjusted EBITDA: Net gain (loss) excluding interest income and expense, taxes and charges for stock-based compensation and depreciation and amortization (15,051) $ 13,559 $ Reconciliation of Adjusted EBITDA to GAAP results: Adjusted EBITDA (15,051) $ 13,559 $ Interest expense 608 538 Interest income (3,049) (1,162) Taxes - - Stock-based compensation 10,282 3,576 Depreciation and amortization 6,662 10,944 Net loss (29,554) $ (337) $ Fiscal Year Ended GSI COMMERCE, INC. AND SUBSIDIARIES ADJUSTED EBITDA AND RECONCILIATION TO GAAP RESULTS (In thousands) (Unaudited) |
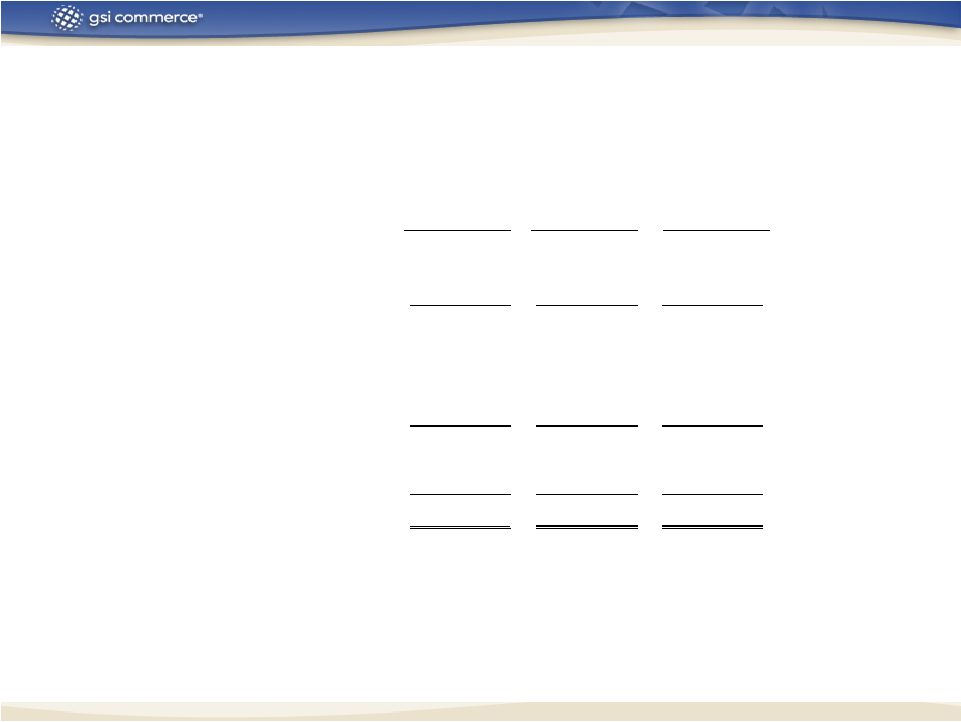
 19 Merchandise sales (1) - (a non-GAAP financial measure): Category: Sporting goods 128,489 $ 200,394 $ Other (2) 153,538 274,586 Total merchandise sales (1) - (a non-GAAP financial measure) 282,027 $ 474,980 $ Net revenues - (GAAP basis): Net revenues from product sales: Category: Sporting goods 128,361 $ 165,380 $ Other (2) 88,149 109,608 Total net revenues from product sales 216,510 274,988 Service fee revenues 25,409 60,116 Total net revenues - (GAAP basis) 241,919 $ 335,104 $ GSI COMMERCE, INC. AND SUBSIDIARIES MERCHANDISE SALES (1) AND RECONCILIATION TO GAAP RESULTS (Dollars in thousands) (Unaudited) Appendix B Appendix B 96,669 $ 81,631 178,300 $ 96,669 $ 58,150 154,819 17,819 172,638 $ Fiscal Year 2004 Fiscal Year 2003 Fiscal Year 2002 |
 20 Appendix B . . . continued Appendix B . . . continued GSI COMMERCE, INC. AND SUBSIDIARIES MERCHANDISE SALES (1) AND RECONCILIATION TO GAAP RESULTS (Dollars in thousands) (Unaudited) Reconciliation of merchandise sales (1) to net revenues: Merchandise sales (1) - (a non-GAAP financial measure): Category: Sporting goods 128,489 $ 200,394 $ Other (2) 153,538 274,586 Total merchandise sales (1) - (a non-GAAP financial measure) 282,027 474,980 Less: Sales by partners (3) : Category: Sporting goods (128) (35,014) Other (65,389) (164,978) Total sales by partners (3) (65,517) (199,992) Add: Service fee revenues 25,409 60,116 Net revenues - (GAAP basis) 241,919 $ 335,104 $ (1) Merchandise sales represents the retail value of all sales transactions, inclusive of freight charges and net of allowances for returns and discounts, which flow through the GSI Commerce platform, whether or not GSI Commerce is the seller of the merchandise or records the full amount of such sales on its financial statements. (2) The "Other" categories of both merchandise sales and net revenues from product sales include $1,034 and $10 for the year ended Fiscal Year 2003 and Fiscal Year 2004, respectively, related to Ashford.com. (3) Represents the retail value of all product sales through the GSI Commerce platform where the inventory is owned by the partner and the partner is the seller of the merchandise. GSI Commerce records service fee revenues on these sales. 96,669 $ 81,631 178,300 -- (23,481) (23,481) 17,819 172,638 $ Fiscal Year 2004 Fiscal Year 2003 Fiscal Year 2002 |