 GSI Commerce, Inc. February 2006 GSI Commerce, Inc. February 2006 Exhibit 99.1 |
 2 Safe Harbor Statement Safe Harbor Statement All statements made in this presentation, other than statements of historical fact, are forward- looking statements. The words “anticipate,” “believe,” “estimate,” “expect,” “intend,” “may,” “plan,” “will,” “would,” “should,” “guidance,” “potential,” “continue,” “project,” “forecast,” “confident,” “prospects,” and similar expressions typically are used to identify forward-looking statements. Forward-looking statements are based on the then-current expectations, beliefs, assumptions, estimates and forecasts about the business of GSI Commerce. These statements are not guarantees of future performance and involve risks, uncertainties and assumptions, which are difficult to predict. Therefore, actual outcomes and results may differ materially from what is expressed or implied by these forward-looking statements. Factors which may affect GSI Commerce’s business, financial condition and operating results include the effects of changes in the economy, consumer spending, the financial markets and the industries in which GSI Commerce and its partners operate, changes affecting the Internet and e-commerce, the ability of GSI Commerce to develop and maintain relationships with strategic partners and suppliers and the timing of its establishment, extension, or termination of its relationships with strategic partners, the ability of GSI Commerce to timely and successfully develop, maintain and protect its technology and product and service offerings and execute operationally, the ability of GSI Commerce to attract and retain qualified personnel, the ability of GSI Commerce to successfully integrate its acquisitions of other businesses, if any, the performance of acquired businesses and the impact of SFAS Statement No. 123(R). More information about potential factors that could affect GSI Commerce can be found in its most recent Form 10-K, Form 10-Q and other reports and statements filed by GSI Commerce with the SEC. GSI Commerce expressly disclaims any intent or obligation to update these forward- looking statements. |
 3 Non-GAAP Financial Measures Non-GAAP Financial Measures This presentation contains the non-GAAP measures merchandise sales, adjusted EBITDA and certain ratios that use those measures. Merchandise sales represent the retail value of all sales transactions, inclusive of freight charges and net of allowances for returns and discounts, which flow through the GSI Commerce platform, whether or not the company is the seller of the merchandise, or records the full amount of such sales on its financial statements. Merchandise sales also include product sales related to Aspherio. GSI Commerce uses merchandise sales as a metric for operating its business. Variable costs such as fulfillment and customer service labor expense, order processing costs such as credit card and bank processing fees and organizational costs such as business management are related to the amount of sales made through GSI Commerce’s platform, whether or not GSI Commerce records the revenue from such sales. GSI Commerce believes that investors will have a more thorough understanding of its historical expenses and expense trends if they have visibility to GAAP net revenue as well as the non-GAAP financial measure merchandise sales and the percentages that such expenses bear to net revenues and merchandise sales. GSI Commerce also uses adjusted EBITDA, which represents earnings (or losses) before interest income/expense, income taxes, depreciation and amortization, and stock-based compensation. GSI Commerce uses adjusted EBITDA as a means to evaluate its performance period to period without taking into account certain expenses, particularly stock-based compensation expense, which may fluctuate materially due to fluctuations in the price of GSI Commerce’s common stock both on a quarterly and annual basis, and does not consistently reflect GSI Commerce’s results from its core business activities. These financial measures should be considered in addition to, and not as a substitute for, or superior to, other measures of financial performance prepared in accordance with GAAP. The non-GAAP financial measures included in this presentation have been reconciled to the nearest GAAP measures as required under Securities and Exchange Commission rules and can be found in the appendices of this presentation. |
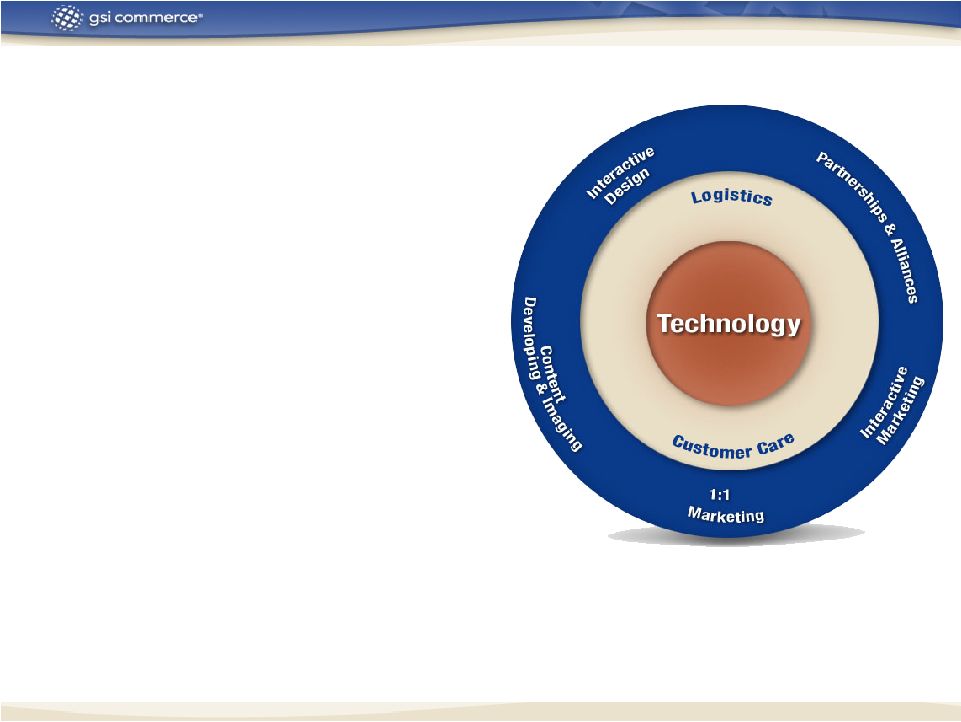 4 Leading Provider of Outsourced e-Commerce Solutions Leading Provider of Outsourced e-Commerce Solutions • • Approx. 50 major retailers & brands, Approx. 50 major retailers & brands, 7 merchandise categories 7 merchandise categories • • Comprehensive, Comprehensive, centralized, centralized, e-commerce platform e-commerce platform including technology, including technology, logistics and customer care, logistics and customer care, and marketing services and marketing services • • $440.4 million FY05 net revenues $440.4 million FY05 net revenues • • Approx. 1,550 employees – Approx. 1,550 employees – Pa., Ky., Fla. Pa., Ky., Fla. and Barcelona, Spain and Barcelona, Spain |
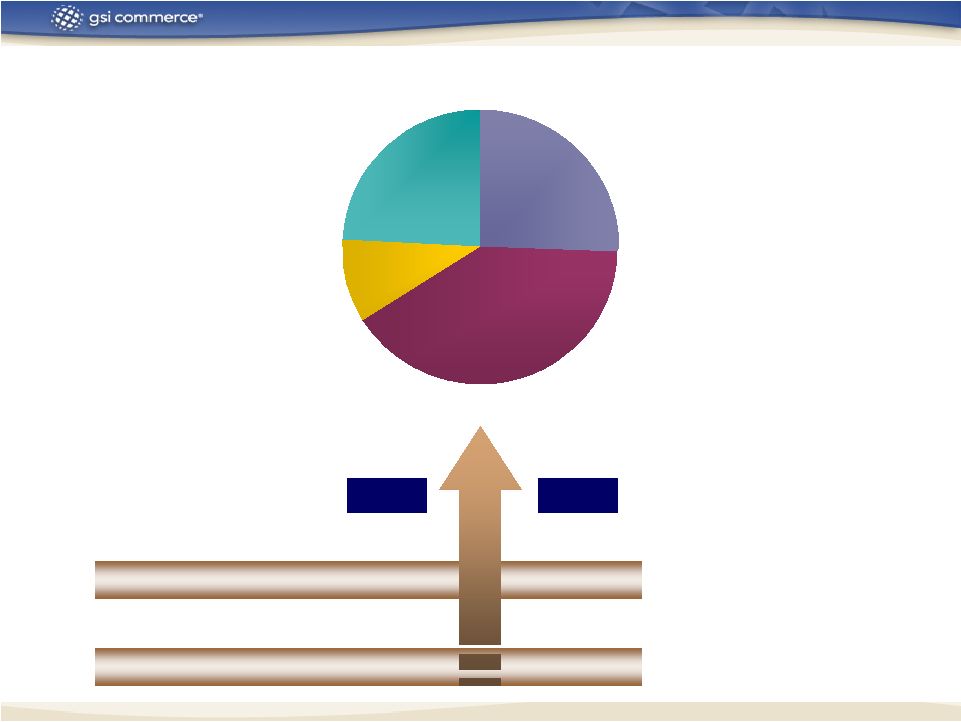
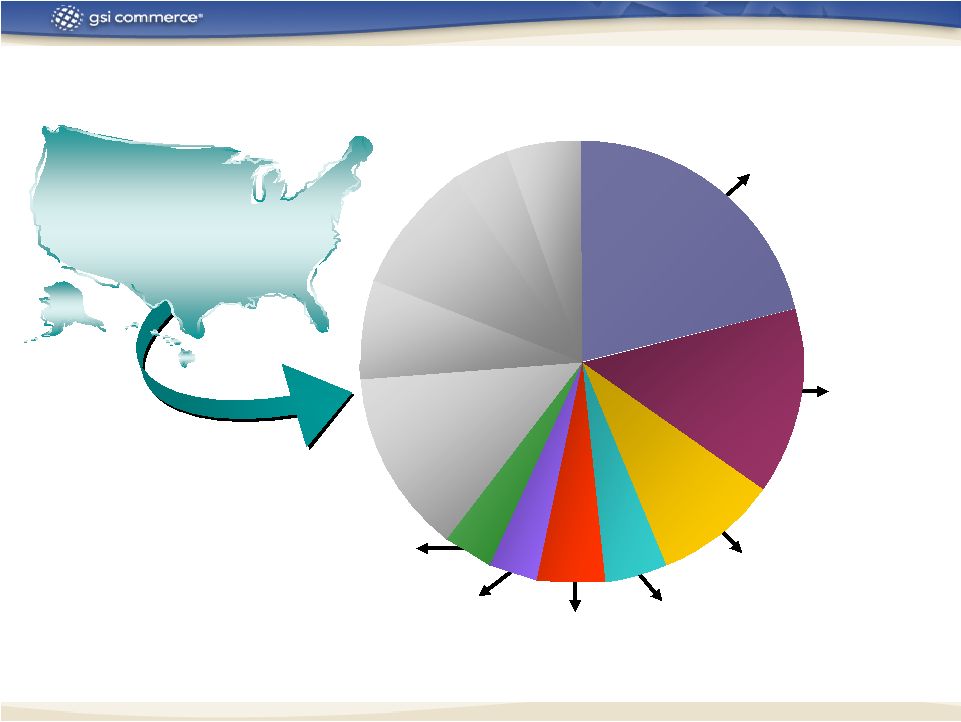 5 Large Addressable Domestic Market for GSI Commerce Large Addressable Domestic Market for GSI Commerce 2006 U.S. Online General 2006 U.S. Online General Merchandise Market * Merchandise Market * $111.7 billion $111.7 billion * GSI Commerce excludes automobiles and parts, food and beverage, and travel from the estimated * GSI Commerce excludes automobiles and parts, food and beverage, and travel from the estimated , and travel from the estimated calculation of the U.S. online general merchandise market. Source: Forrester Research calculation of the U.S. online general merchandise market. Source: Forrester Research e: Forrester Research $10.0 $10.0 $4.0 $4.0 $5.4 $5.4 $5.1 $5.1 $4.1 $4.1 $ in billions $ in billions $23.5 $23.5 $15.2 $15.2 2006 Estimated Target Categories Worth $67.3 billion 2006 Estimated Target Categories Worth $67.3 billion Apparel Apparel Home Home Consumer Consumer Electronics Electronics Music & Video Music & Video Sporting Goods Sporting Goods Jewelry & Luxury Goods Jewelry & Luxury Goods Health & Beauty Health & Beauty |
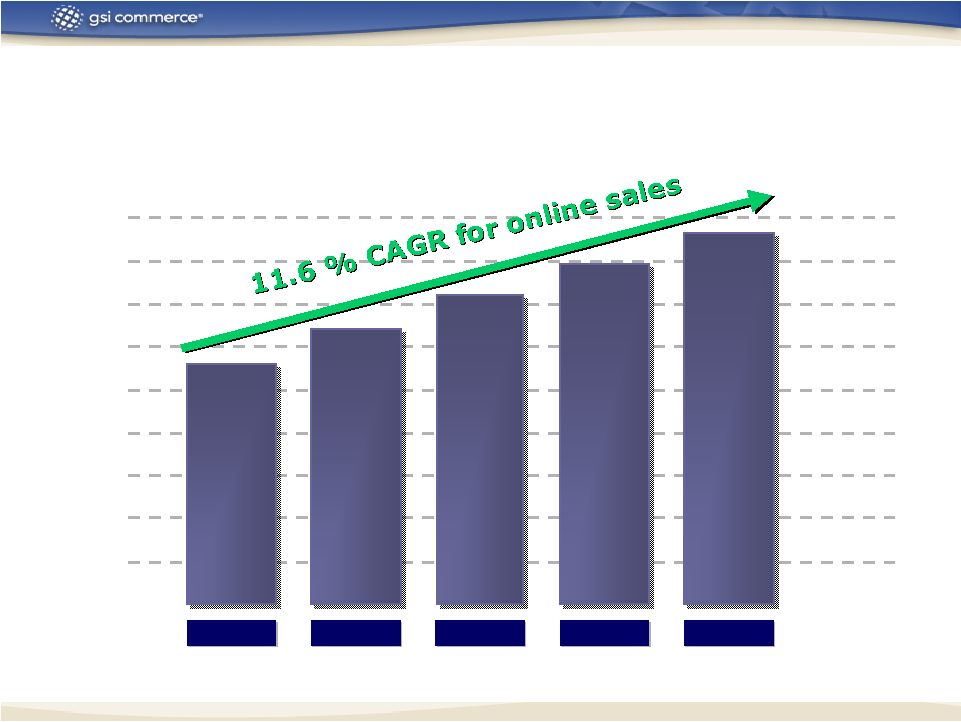           6 The U.S. Online General Merchandise Market * The U.S. Online General Merchandise Market * The U.S. Online General Merchandise Market * $20 $20 $20 $40 $40 $40 $60 $60 $60 $80 $80 $80 $100 $100 $100 $120 $120 $120 $140 $140 $140 $160 $160 $160 $ in billions $ in billions $ in billions Strong Growth Projected for e-Commerce Strong Growth Projected for e-Commerce * GSI Commerce excludes automobiles and parts, food and beverage, and travel from the estimated * GSI Commerce excludes automobiles and parts, food and beverage, and travel from the estimated , and travel from the estimated calculation of the U.S. online general merchandise market. Source: Forrester Research calculation of the U.S. online general merchandise market. Source: Forrester Research ce: Forrester Research 2006E 2006E $111.7 $111.7 2007E 2007E $128.0 $128.0 2008E 2008E $143.9 $143.9 2009E 2009E $158.9 $158.9 2010E 2010E $173.1 $173.1 $180 $180 $180 |
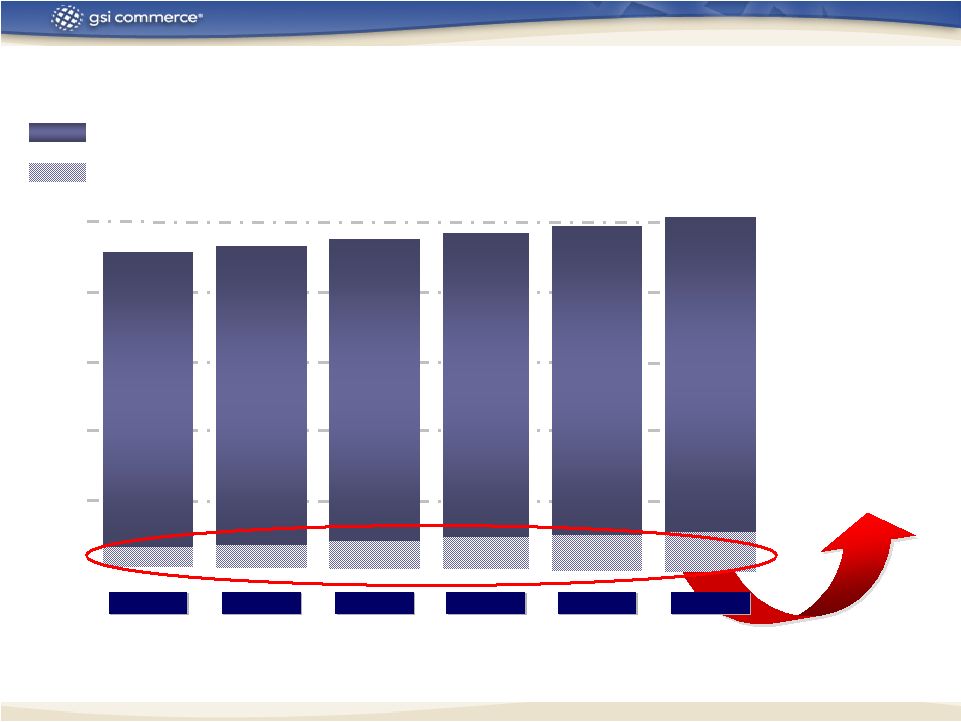 7 Compelling Reason for Prospects to Outsource Compelling Reason for Prospects to Outsource Online business is too large to ignore, but too small to justify the investment required to achieve in-house competency for multichannel e-commerce. Total sales of retail categories* targeted by GSI Commerce Total sales of retail categories* targeted by GSI Commerce Online sales of retail categories targeted by GSI Commerce Online sales of retail categories targeted by GSI Commerce expressed as a % of total sales of the same categories expressed as a % of total sales of the same categories * Target retail categories include home products, apparel, consumer electronics, music & video, jewelry & luxury goods, sporting goods, and health & beauty as defined by Forrester Research. For GSI Commerce partners, online sales generally average 3% to 4% of total sales. $ billions $ billions $200 $200 $400 $400 $600 $600 $800 $800 $1,000 $1,000 2005E 2005E 6.1% 6.1% $894.8 $894.8 2006E 2006E 7.3% 7.3% $917.4 $917.4 2007E 2007E 8.5% 8.5% $939.5 $939.5 2008E 2008E 9.5% 9.5% $962.2 $962.2 2009E 2009E 10.5% 10.5% $985.7 $985.7 2010E 2010E 11.3% 11.3% $1,010 $1,010 |
 8 GSI Offers a Strong Value Proposition GSI Offers a Strong Value Proposition • A Complete Solution Increased efficiency – one vendor Improved integration – built to work together 360° understanding of business • GSI Commerce is Invisible to Consumers Uncompromised Not in conflict with partner’s business • Scale & Operating Leverage with Enterprise Focus Platform expertise Premium quality components • Focus on Growth and Investment International platform Marketing services New/enhanced functionality (parametric search / alternative payments / multivariate testing) • Win/Win Economics Financial predictability and aligned interests through long-term contracts |
 9 Platform Enables E-Commerce for Top Brands Platform Enables E-Commerce for Top Brands Apparel Apparel Electronics Electronics Health & Beauty Health & Beauty Sporting Goods Sporting Goods Entertainment Entertainment Home Home Jewelry & Luxury Goods Jewelry & Luxury Goods |
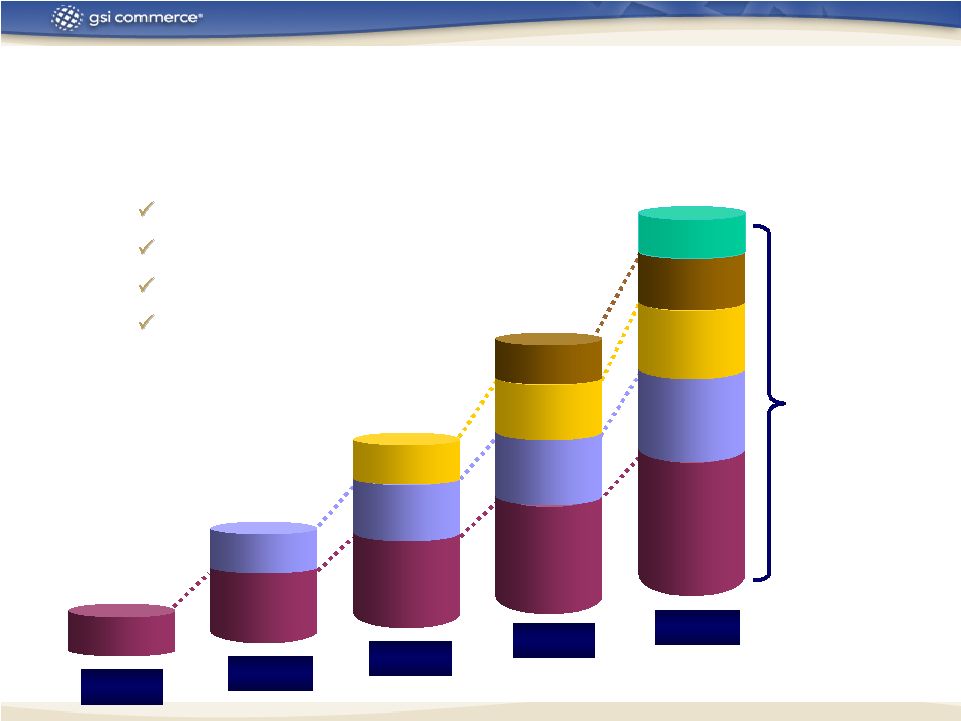 10 Growth Strategy Growth Strategy Compounding effect of long-term agreements Yr. 5 Yr. 4 Yr. 3 Yr. 2 Yr. 1 • • Add new partners Add new partners • • Grow revenues from each partner Grow revenues from each partner Secular e-commerce growth Secular e-commerce growth Platform enhancements Platform enhancements Marketing services Marketing services International International |
 11 Competition Competition • Web Platform IBM, ATG, Microsoft, Amazon Services • Customer/Web Analtyics /CRM Siebel, E.piphany, Omniture, WebSideStory, Coremetrics • Order Processing /Warehouse Mgmt. /Merchandising Systems SAP, JDA, Yantra, Manhattan Assoc. • Drop Ship Commerce Hub, Vcommerce • Call Center West, Convergys, PRC • Fulfillment & Logistics DHL/Exel, UPS • Content RR Donnelly • E-mail Mgmt. Experian/CheetahMail, DoubleClick/Performics, Epsilon Interactive • Online Marketing aQuantive, Digitas, ValueClick, Grey Interactive, LinkShare • Fraud Mgmt. CyberSource, Retail Decisions • Strategic Consulting McKinsey & Co., Boston Consulting Group, Accenture • System Integrator Accenture, IBM, BearingPoint, Sapient • Design aQuantive/Razorfish, AKQA, Blast Radius, Digitas |
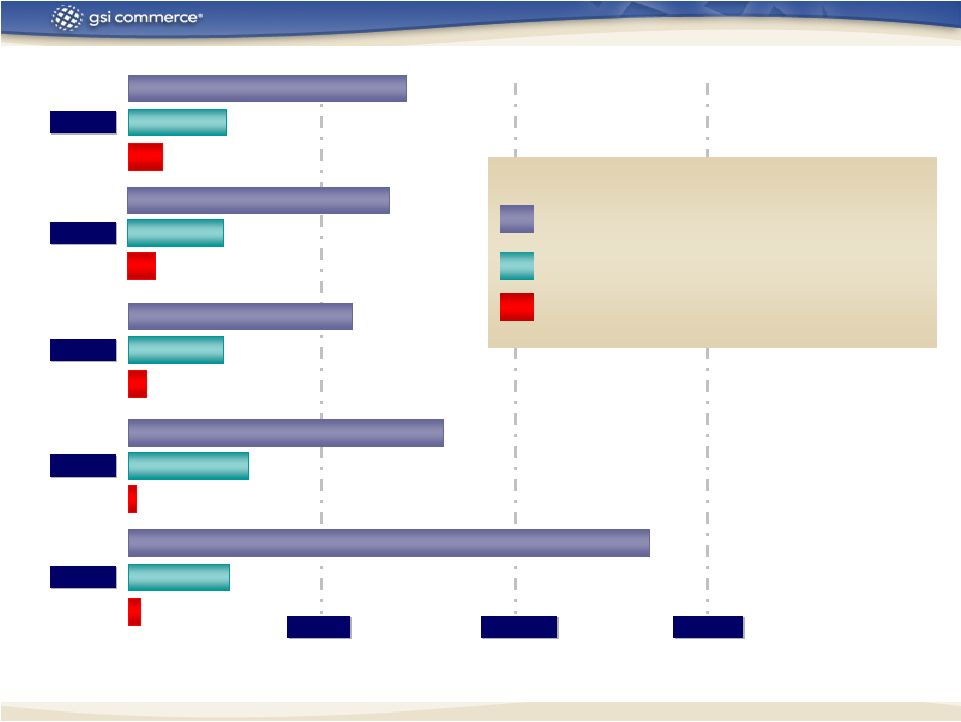 12 Growing Faster than the Industry Growing Faster than the Industry 2001 2001 2002 2002 2003 2003 2004 2004 70.4% -- 9 Months GSI GSI Commerce Merchandise Merchandise Sales Sales ** ** E-Commerce Sales Sales Total Retail Sales Total Retail Sales Percent Growth Y/Y * Percent Growth Y/Y * * E-commerce Sales and Total Retail Sales Source: Census Bureau, U.S. Department of Commerce. ** For a reconciliation of non-GAAP financial measures, see Appendices A thru B-1 and/or see our results for fiscal years 2001 - 2005 at www.gsicommerce.com/news/news.jsp. Prior to 2002, GSI Commerce did not use merchandise sales, so total net total revenue is used in this presentation for fiscal year 2001. 2005 2005 25.3% -- 9 Months 8.2% -- 9 Months 68.0% 24.3% 7.1% 58.2% 24.7% % 4.2% 4.2% 81.4% % 31.0% % 2.3% % 3.0% 3.0% 26.1% 26.1% 135.2% % 50% 50% 100% 100% 150% 150% |
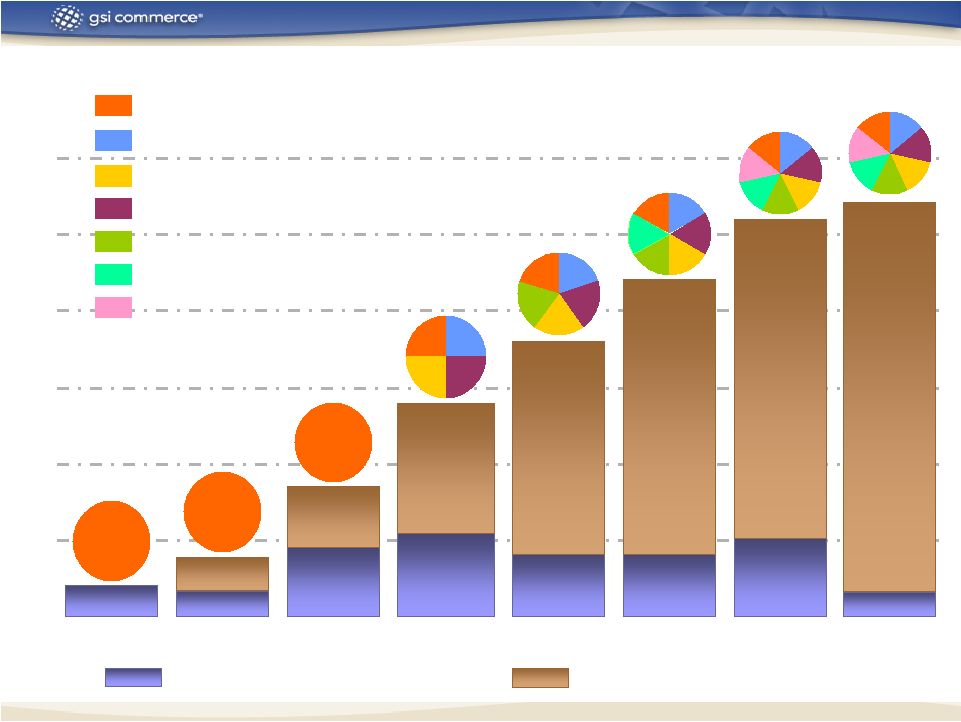 13 Category Expansion & Partner Growth Category Expansion & Partner Growth 10 10 20 20 30 30 40 40 50 50 60 60 1999 1999 4 4 1 1 2000 2000 3 3 7 7 1 1 2001 2001 8 8 15 15 1 1 2002 2002 11 11 26 26 4 4 2003 2003 8 8 34 34 5 5 2004 2004 8 8 42 42 6 6 2005 2005 10 10 52 52 7 7 Sports Sports Consumer Electronics Consumer Electronics Health & Beauty Health & Beauty Entertainment Entertainment Home Home Apparel Apparel Jewelry & Luxury Goods Jewelry & Luxury Goods Categories Categories Total number of partners launched Total number of partners launched Partners launched during the year Partners launched during the year 2006 2006 1 1 53 53 7 7 |
 14 Net Revenues – Net Revenues – Trailing Four Quarters Trailing Four Quarters Net Revenue $ in millions Net Revenue $ in millions 3Q 3Q 00 00 3Q 3Q 01 01 3Q 3Q 02 02 3Q 3Q 03 03 3Q 3Q 04 04 4Q 4Q 99 99 4Q 4Q 00 00 4Q 4Q 01 01 4Q 4Q 02 02 4Q 4Q 03 03 4Q 4Q 04 04 2Q 2Q 00 00 2Q 2Q 01 01 2Q 2Q 02 02 2Q 2Q 03 03 2Q 2Q 04 04 2Q 2Q 05 05 1Q 1Q 00 00 1Q 1Q 01 01 1Q 1Q 02 02 1Q 1Q 03 03 1Q 1Q 04 04 1Q 1Q 05 05 $50 $50 $100 $100 $150 $150 $200 $200 $250 $250 $300 $300 $350 $350 $400 $400 $450 $450 5.5 5.5 11.2 11.2 18.9 18.9 27.9 27.9 42.7 42.7 53.2 53.2 62.4 62.4 71.4 71.4 102.6 102.6 118.3 118.3 134.4 134.4 148.7 148.7 172.6 172.6 189.6 189.6 206.9 206.9 222.0 222.0 241.9 241.9 259.3 259.3 273.6 273.6 294.8 294.8 335.1 335.1 360.2 360.2 387.7 387.7 3Q 3Q 05 05 403.7 403.7 4Q 4Q 05 05 440.4 440.4 |
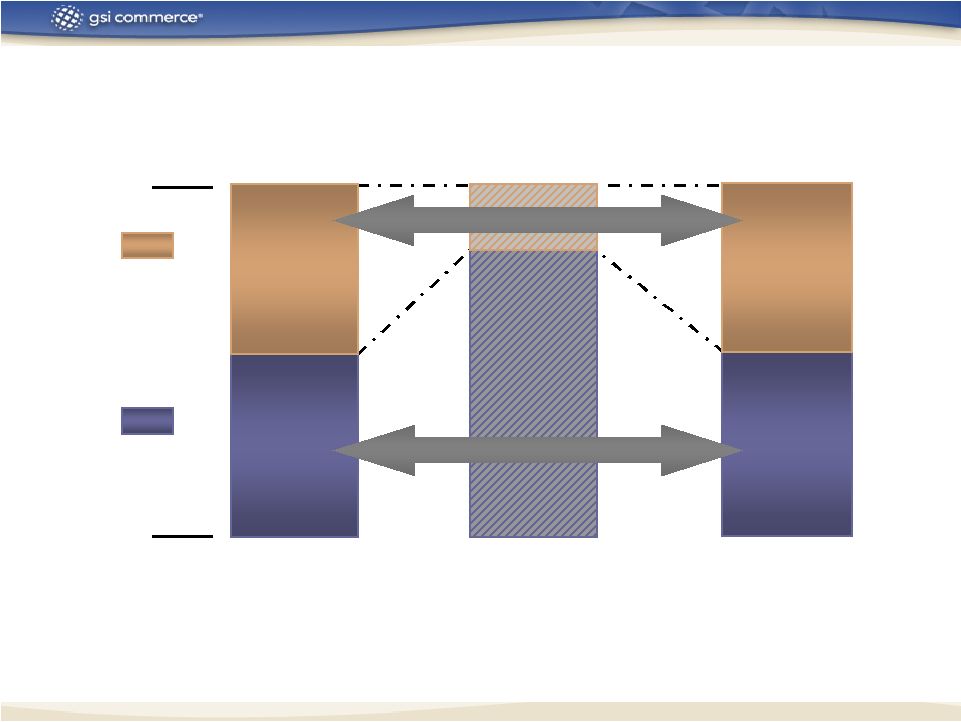 15 Business Models Provide Balanced Gross Profit Contribution Business Models Provide Balanced Gross Profit Contribution Owned Owned Inventory Inventory Non-Owned Inventory 100% 100% 2005 2005 Merchandise Merchandise Sales Sales 0% 0% $682.0 $682.0 48% $326.6 48% $326.6 2005 2005 Gross Gross Profit Profit $176.6 $176.6 48% $85 48% $85 52% $91.6 52% $91.6 2005 2005 Net Net Revenue Revenue $440.4 $440.4 81% $355.4 81% $355.4 $ in millions $ in millions 19% $85 19% $85 52% $355.4 52% $355.4 For a reconciliation of non-GAAP financial measures, see Appendices A thru B-1 and/or see our results for fiscal years 2001 - 2005 at www.gsicommerce.com/news/news.jsp . |
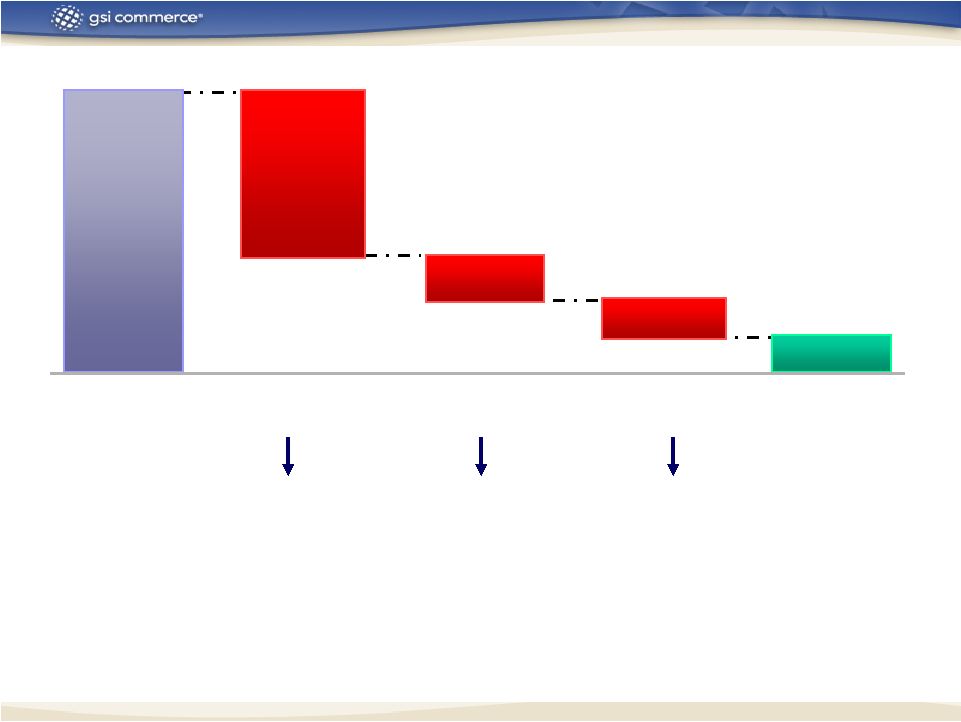 16 $28.4 M $28.4 M $20.7 M $20.7 M $23.2 M $23.2 M Adjusted Adjusted EBITDA EBITDA G&A and G&A and Other Other Gross Gross Profit Profit $176.6 M $176.6 M $104.3 M $104.3 M Sales & Sales & Marketing Marketing Product Product Develop. Develop. 2005 Expense Breakdown 2005 Expense Breakdown - - Fulfillment Fulfillment - - Credit card proc. Credit card proc. - - Customer care Customer care - - Revenue share Revenue share - - Business mgmt. Business mgmt. - - Marketing services Marketing services - - Technology Technology - - HR HR - - Legal Legal - - Finance Finance - - Business develop. Business develop. - - Minority interest Minority interest - - Other Other For a reconciliation of non-GAAP financial measures, see Appendices A thru B-1 and/or see our results for fiscal years 2001 - 2005 at www.gsicommerce.com/news/news.jsp . |
 17 Multiple Drivers of Margin Expansion Multiple Drivers of Margin Expansion Gross Gross Margin Margin Sales & Sales & Marketing Marketing Product Product Development Development G&A and G&A and Other Other Gross Profit Gross Profit 35.2% 35.2% 40.1% 40.1% Sales & Marketing Sales & Marketing 31.6% 31.6% 23.7% 23.7% Product Develop. Product Develop. 8.4% 8.4% 6.5% 6.5% G&A and Other G&A and Other 9.9% 9.9% 5.2% 5.2% 2001 2001 2005 2005 As a % of As a % of net revenues net revenues 790 bp 790 bp 190 bp 190 bp 470 bp 470 bp 490 bp 490 bp +1,940 basis points +1,940 basis points |
 18 Cash * Cash * $75.4 $75.4 $156.7 $156.7 Inventory Inventory $37.8 $37.8 $34.6 $34.6 Net Fixed Assets Net Fixed Assets $74.4 $74.4 $87.9 $87.9 Total Assets Total Assets $231.8 $231.8 $332.6 $332.6 Debt Debt $14.5 $14.5 $71.2 $71.2 A/P & Accrued A/P & Accrued $89.9 $89.9 $101.7 $101.7 Total Liabilities Total Liabilities $113.8 $113.8 $179.5 $179.5 Equity Equity $118.1 $118.1 $153.2 $153.2 * Cash and cash equivalents, short-term investments and marketable securities Strong Balance Sheet Strong Balance Sheet ($ millions) ($ millions) Jan. 1, 2005 Jan. 1, 2005 Dec. 31, 2005 Dec. 31, 2005 |
 19 Appendix A Appendix A GSI COMMERCE, INC. AND SUBSIDIARIES ADJUSTED EBITDA AND RECONCILIATION TO GAAP RESULTS (In thousands) (Unaudited) January 1, December 31, January 1, December 31, 2005 2005 2005 2005 Adjusted EBITDA: Net gain (loss) excluding interest income and expense, income taxes and charges for stock-based compensation and depreciation and amortization 15,466 $ 17,168 $ 13,559 $ 20,736 $ Reconciliation of Adjusted EBITDA to GAAP results: Adjusted EBITDA 15,466 $ 17,168 $ 13,559 $ 20,736 $ Interest expense 240 786 538 2,220 Interest income (205) (1,111) (1,162) (2,944) Income taxes - 321 - 321 Stock-based compensation 2,412 1,231 3,576 3,805 Depreciation and amortization 2,966 4,203 10,944 14,635 Net income (loss) 10,053 $ 11,738 $ (337) $ 2,699 $ Three Months Ended Twelve Months Ended |
 20 January 3, January 1, 2004 2005 Merchandise sales (1) - (a non-GAAP financial measure): Category: Sporting goods 128,489 $ 200,394 $ Other (2) 153,537 274,586 Total merchandise sales (1) - (a non-GAAP financial measure) 282,026 $ 474,980 $ Net revenues - (GAAP basis): Net revenues from product sales: Category: Sporting goods 128,360 $ 164,530 $ Other (2) 88,150 110,458 Total net revenues from product sales 216,510 274,988 Service fee revenues 25,409 60,116 Total net revenues - (GAAP basis) 241,919 $ 335,104 $ GSI COMMERCE, INC. AND SUBSIDIARIES MERCHANDISE SALES (1) AND RECONCILIATION TO GAAP RESULTS (Dollars in thousands) (Unaudited) Appendix B Appendix B December 28, 2002 96,669 $ 81,631 178,300 $ 96,669 $ 58,150 154,819 17,819 172,638 $ Fiscal Year 2004 Fiscal Year 2003 Fiscal Year 2002 Year Ended December 31, 2005 261,568 $ 420,429 681,997 $ 212,932 $ 142,442 355,374 85,018 440,392 $ Fiscal Year 2005 |
 21 Appendix B . . . continued Appendix B . . . continued January 3, January 1, 2004 2005 Year Ended GSI COMMERCE, INC. AND SUBSIDIARIES MERCHANDISE SALES (1) AND RECONCILIATION TO GAAP RESULTS (Dollars in thousands) (Unaudited) Reconciliation of merchandise sales (1) to net revenues: Merchandise sales (1) - (a non-GAAP financial measure): Category: Sporting goods 128,489 $ 200,394 $ Other (2) 153,537 274,586 Total merchandise sales (1) - (a non-GAAP financial measure) 282,026 474,980 Less: Sales by partners (3) : Category: Sporting goods (129) (35,864) Other (65,387) (164,128) Total sales by partners (3) (65,516) (199,992) Add: Service fee revenues 25,409 60,116 Net revenues - (GAAP basis) 241,919 $ 335,104 $ (1) Merchandise sales represents the retail value of all sales transactions, inclusive of freight charges and net of allowances for returns and discounts, which flow through the GSI Commerce platform, whether or not GSI Commerce is the seller of the merchandise or records the full amount of such sales on its financial statements. (2) The "Other" categories of both merchandise sales and net revenues from product sales include $1,034 and $10 for the year ended January 3, 2004 and January 1, 2005, respectively, related to Ashford.com. (3) Represents the retail value of all product sales through the GSI Commerce platform where the inventory is owned by the partner and the partner is the seller of the merchandise. GSI Commerce records service fee revenues on these sales. December 28, 2002 96,669 $ 81,631 178,300 -- (23,481) (23,481) 17,819 172,638 $ Fiscal Year 2004 Fiscal Year 2003 Fiscal Year 2002 December 31, 2005 Fiscal Year 2005 261,568 $ 420,429 681,997 (48,636) (277,987) (326,623) 85,018 440,392 $ |