CERTIFIED SHAREHOLDER REPORT OF REGISTERED MANAGEMENT INVESTMENT COMPANIES
Investment Company Act file number:
(811-05498)
Exact name of registrant as specified in charter:
Putnam Master Intermediate Income Trust
Address of principal executive offices:
One Post Office Square, Boston, Massachusetts 02109
Name and address of agent for service:
Robert T. Burns, Vice President One Post Office Square Boston, Massachusetts 02109
Copy to:
John W. Gerstmayr, Esq. Ropes & Gray LLP 800 Boylston Street Boston, Massachusetts 02199-3600
Registrant’s telephone number, including area code:
(617) 292-1000
Date of fiscal year end:
September 30, 2012
Date of reporting period:
October 1, 2011 – March 31, 2012
Item 1. Report to Stockholders:
The following is a copy of the report transmitted to stockholders pursuant to Rule 30e-1 under the Investment Company Act of 1940:
Putnam Master Intermediate Income Trust
Semiannual report 3 | 31 | 12
Message from the Trustees
1
About the fund
2
Performance snapshot
4
Interview with your fund’s portfolio manager
5
Your fund’s performance
11
Terms and definitions
13
Other information for shareholders
14
Financial statements
15
Shareholder meeting results
98
Consider these risks before investing: International investing involves certain risks, such as currency fluctuations, economic instability, and political developments. Additional risks may be associated with emerging-market securities, including illiquidity and volatility. Lower-rated bonds may offer higher yields in return for more risk. Funds that invest in government securities are not guaranteed. Mortgage-backed securities are subject to prepayment risk. The use of derivatives involves additional risks, such as the potential inability to terminate or sell derivatives positions and the potential failure of the other party to the instrument to meet its obligations. Funds that invest in bonds are subject to certain risks including interest-rate risk, credit risk, and inflation risk. As interest rates rise, the prices of bonds fall. Long-term bonds are more exposed to interest-rate risk than short-term bonds. Lower-rated bonds may offer higher yields in return for more risk. Unlike bonds, bond funds have ongoing fees and expenses. The fund’s shares trade on a stock exchange at market prices, which may be lower than the fund’s net asset value.
Message from the Trustees
Dear Fellow Shareholder:
After a quarter century of trending lower, U.S. Treasury rates have shown some upward movement on signs of an improving economy during the past few months. Greece’s successful debt restructuring and some better-than-expected economic data in the United States have helped to coax investors off the sidelines and back into the markets. While we believe the historic bull market in government debt is likely near its close, fixed-income markets today continue to offer myriad investing opportunities.
Investing in fixed-income markets, however, requires particular expertise and the capacity for deep security-level research. We believe Putnam’s veteran fixed-income team is well suited to that task, and offers a long-term track record of uncovering attractive opportunities across all sectors of the bond markets.
In other news, please join us in welcoming the return of Elizabeth T. Kennan to the Board of Trustees. Dr. Kennan, who served as a Trustee from 1992 until 2010, has rejoined the Board, effective January 1, 2012. Dr. Kennan is a Partner of Cambus-Kenneth Farm (thoroughbred horse breeding and general farming), and is also President Emeritus of Mount Holyoke College.
We would also like to take this opportunity to welcome new shareholders to the fund and to thank all of our investors for your continued confidence in Putnam.
About the fund
Seeking broad diversification across bond markets
When Putnam Master Intermediate Income Trust was launched in 1988, its three-pronged focus on U.S. investment-grade bonds, high-yield corporate bonds, and non-U.S. bonds was considered innovative. Lower-rated, higher-yielding corporate bonds were relatively new, having just been established in the late 1970s. In addition, at the time of the fund’s launch, few investors were venturing outside the United States for fixed-income opportunities.
In the two decades since then, the bond investment landscape has undergone a transformation. New sectors such as mortgage- and asset-backed securities now make up a sizable portion of the U.S. investment-grade market. The high-yield corporate bond sector has also grown significantly. Outside the United States, the introduction of the euro fostered the development of a large market of European government bonds. There are also growing opportunities to invest in the debt of emerging-market countries.
The fund’s managers believe that the fund’s multi-strategy approach is well suited to the expanding opportunities in today’s global bond marketplace. To respond to the market’s increasing complexity, Putnam’s fixed-income group aligns teams of specialists with varied investment opportunities. Working with these teams, the fund managers strive to build a diversified portfolio that carefully balances risk and return.
As different factors drive the performance of the various bond market sectors, the managers use the fund’s flexible strategy to seek opportunities for investors.
How do closed-end funds differ from open-end funds?
More assets at work While open-end funds need to maintain a cash position to meet redemptions, closed-end funds are not subject to redemptions and can keep more of their assets invested in the market.
Traded like stocks Closed-end fund shares are traded on stock exchanges, and their market prices fluctuate in response to supply and demand, among other factors.
Net asset value vs. market price Like an open-end fund’s net asset value (NAV) per share, the NAV of a closed-end fund share is equal to the current value of the fund’s assets, minus its liabilities, divided by the number of shares outstanding. However, when buying or selling closed-end fund shares, the price you pay or receive is the market price. Market price reflects current market supply and demand, and may be higher or lower than the NAV.
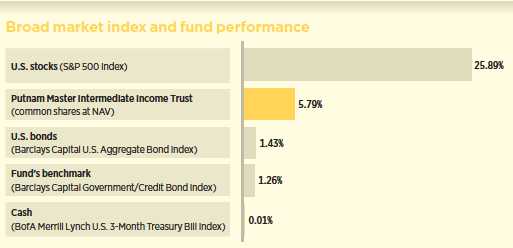
Data are historical. Past performance does not guarantee future results. More recent returns may be less or more than those shown. Investment return and net asset value will fluctuate, and you may have a gain or a loss when you sell your shares. Performance assumes reinvestment of distributions and does not account for taxes. Fund returns in the bar chart are at NAV. See pages 5 and 11–12 for additional performance information, including fund returns at market price. Index and Lipper results should be compared with fund performance at NAV. Lipper calculates performance differently than the closed-end funds it ranks, due to varying methods for determining a fund’s monthly reinvestment NAV.
* Returns for the six-month period are not annualized, but cumulative.
4
Interview with your fund’s portfolio manager
What was the bond market environment like during the six months ended March 31, 2012?
We experienced a significant shift in investor sentiment during the first half of the fund’s fiscal year. In October and November, so-called “risk assets” continued to sell off, as investors worried that the sovereign debt situation in Europe might lead to a wave of defaults in the peripheral European countries or a rapid deleveraging in the banking sector. Meanwhile, economic data in the United States around that time suggested continued challenges ahead, with persistently high unemployment and sluggish growth.
In December, risk assets began to reverse course, led in part by a rally in corporate debt. This trend continued into 2012 as fixed-income markets in general benefited from a change in investors’ risk outlook. Central banks continued to provide liquidity for financial markets, both in Europe through the Long-Term Refinancing Operation [LTRO] and in the United States, where there is speculation that the Federal Reserve [Fed] is considering a third round of quantitative easing. This accommodative policy helped offer some level of support for the bond markets after a challenging fourth quarter in which investors demonstrated little appetite for risk. In the United States, interest rates climbed higher, even on the short end of the yield curve, in part reflecting increasing optimism about the strength of the economic
This comparison shows your fund’s performance in the context of broad market indexes for the six months ended 3/31/12. See pages 4 and 11–12 for additional fund performance information. Index descriptions can be found on pages 13–14.
5
recovery. Recent economic data, while not indicative of a strong recovery, has generally come in stronger than anticipated. In Europe, Greece defaulted in February, but it was an orderly one and appears unlikely to start a wave of restructurings in other peripheral European countries or to force European banks to rapidly delever and raise capital.
The fund posted solid gains during the period. What factors contributed to its performance?
The fund is currently positioned to be less reliant on declining interest rates to drive returns, focusing more on credit, prepayment, and liquidity risks as the main drivers of performance. This approach was relatively successful during the trailing six months, particularly as investors regained some of their appetite for risk.
From a sector positioning standpoint, the fund’s allocations to high-yield and emerging-market debt, non-agency residential mortgage-backed securities [RMBS], and collateralized mortgage obligations [CMOs] all contributed positively to performance.
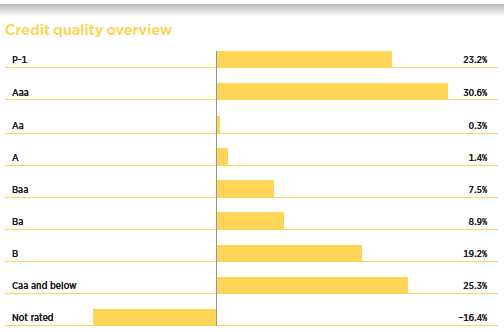
Credit qualities are shown as a percentage of net assets as of 3/31/12. A bond rated Baa or higher (Prime-3 or higher, for short-term debt) is considered investment grade. The chart reflects Moody’s ratings; percentages may include bonds or derivatives not rated by Moody’s but rated by Standard & Poor’s or, if unrated by S&P, by Fitch, and then included in the closest equivalent Moody’s rating. Ratings will vary over time.
Credit quality includes bonds and represents only the fixed-income portion of the portfolio. Derivative instruments, including currency forwards, are only included to the extent of any unrealized gain or loss on such instruments and are shown in the not-rated category. The fund itself has not been rated by an independent rating agency.
A negative percentage could reflect the effect of fund strategies that are designed to enhance performance if certain securities decline in value.
6
What is it about the high-yield market you find attractive?
High yield is one of the largest positions in the portfolio, and we’ve held a positive view on the fundamentals in the corporate debt sector for some time. First, the spread, which measures the difference in yield between Treasuries and high-yield bonds, has historically averaged about 500 basis points. But today, even after the rally that began in late 2011, spreads are still around 600 basis points, which leaves open the possibility for additional tightening. This is particularly true given the fundamental backdrop for high-yield bonds, with record earnings for publicly traded companies and large amounts of cash on corporate balance sheets. Over the long term, the par-weighted default rate for the high-yield universe has been about 4.2%. However, today that rate is under 2%, which is well below the long-term average. We believe this combination of historically low defaults, above-average spreads, and strong fundamentals makes for a very attractive investment opportunity.
You mentioned non-agency RMBS, which performed poorly in the second half of 2011. What led to their strong performance during the more recent period?
As many investors will recall, non-agency RMBS experienced significant declines in 2008 as banks sold their positions to reduce their leverage and raise capital. With that memory still fresh in investors’ minds, there
This table shows the fund’s top holdings across three key sectors and the percentage of the fund’s net assets that each represented as of 3/31/12. Short-term holdings are excluded. Holdings will vary over time.
7
was significant concern in 2011 that a new round of forced selling in the non-agency RMBS market would again lead to price volatility in the sector.
Case in point, earlier in 2011, investors pulled out of the market, prompting the New York Federal Reserve [the Fed] to suspend the auction of its Maiden Lane portfolio. By way of background, “Maiden Lane” is the name of the New York Fed’s non-agency RMBS holdings it took over as a part of the government’s bailout package for the financials sector. The Fed had attempted to sell off the bulk of this portfolio last year, but lackluster demand brought the auctions to a halt, and non-agency RMBS prices suffered.
The Fed resumed auctions in 2012 and was able to complete its sales during the first quarter. Doing so greatly diversified the holders of non-agency RMBS and reduced the likelihood that a single seller could flood the market with excess supply. With this as a backdrop, the fund’s non-agency RMBS performed quite well in the first quarter, and we remain positive on our outlook for the sector.
The fund has a sizable exposure to another segment of the mortgage market in the form of CMOs. How did that position affect performance?
CMOs are securities backed by pools of prime, or “conforming,” residential mortgages, and the bulk of those the fund holds are known as interest-only, or IO, securities. As the name suggests, the cash flow on securities is derived from the interest payments on those pools of mortgages. Essentially, the longer it takes for homeowners to repay the principal on their mortgages, the longer a bondholder will receive interest payments on those loans. And today, with home prices still under pressure and refinancing difficult for many homeowners to obtain, IO securities have been performing quite well.
There had been some pressure on the CMO IO market earlier in the period as the market began to price in modifications to the government’s existing Home Affordable Refinance Program, or HARP. HARP, as you may recall, was launched by the Obama administration in 2009 to help homeowners who owed more on their mortgages than their homes were worth. The program was modified in
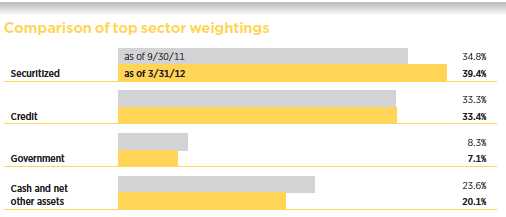
This chart shows how the fund’s top weightings have changed over the past six months. Weightings are shown as a percentage of net assets. Summary information may differ from the portfolio schedule included in the financial statements due to the inclusion of derivative securities and the exclusion of as-of trades, if any. Holdings will vary over time. Cash positions may represent collateral used to cover certain derivative contracts.
8
October 2011 to allow more borrowers to qualify. Despite the modification, refinancing activity generally still has been light, and the fund holds positions less likely to be affected, namely more seasoned loans with lower balances and lower interest rates. In implementing our IO CMO strategy, I should point out that we used interest-rate swaps and options to hedge the duration of these securities [a measure of interest-rate sensitivity] and isolate the prepayment risks, which we believe offers attractive return potential.
How did the fund’s currency exposure affect performance?
Our currency strategy, implemented as long and short positions with currency forward contracts, was one of the few detractors from performance during the first half of the fund’s fiscal year. In terms of positioning, the primary theme has been to overweight the U.S. dollar given our belief that interest rates globally are in the process of converging with those of the United States. We have also been maintaining significant long positions in oil and other commodity-linked currencies like the Australian dollar and Norwegian krone, among others. At the same time, we underweighted the Japanese yen. Japan is a large commodity importer, and rising commodity prices tend to negatively impact the country’s economic performance and weaken the yen relative to other currencies. Our exposure to the Australian dollar and Norwegian krone detracted in the fourth quarter of 2011 as risk-averse investors reduced positions in higher-yielding currencies, and detracted again in March as global growth slowed. Our short position in the Japanese yen proved favorable during the six-month period.
Another theme that detracted from returns recently was our underweight to Europe broadly and the euro specifically. The “relief rally” in the first quarter of 2012 boosted the region’s currencies as investors viewed the sovereign debt developments as positive news. Within emerging markets, Brazil is one of the few developing economies that is actively cutting interest rates — which caught the market somewhat by surprise — and our positioning there detracted slightly from returns.
What is your outlook for the coming months, and how do you plan to position the fund?
We believe 2012 is likely to be a year of sustained economic growth in the United States. In our view, during the first half of the year, growth is likely to be restrained by a recession in Europe and high oil prices, but should develop into an improving trend in the second half.
As for positioning the fund, at period-end, the portfolio’s exposure to interest-rate risk remained limited. With rates across the yield curve near historic lows, we believe the potential rewards from a long-duration stance are minimal. That said, we believe there are opportunities to take tactical positions in the long end of the yield curve — represented by bonds with maturities of 10 years or more — which we believe will continue to be relatively volatile. We plan to maintain the fund’s allocation to credit- and prepayment-sensitive sectors of the market, where we believe the most compelling opportunities exist.
Thanks for bringing us up to date, Bill.
The views expressed in this report are exclusively those of Putnam Management and are subject to change. They are not meant as investment advice.
Please note that the holdings discussed in this report may not have been held by the fund for the entire period. Portfolio composition is subject to review in accordance with the fund’s investment strategy and may vary in the future. Current and future portfolio holdings are subject to risk.
9
Portfolio Manager D. William Kohli is Co-Head of Fixed Income at Putnam. He has an M.B.A. from the Haas School of Business at the University of California, Berkeley, and a B.A. from the University of California, San Diego. Bill joined Putnam in 1994 and has been in the investment industry since 1986.
In addition to Bill, your fund’s portfolio managers are Michael J. Atkin; Kevin F. Murphy; Michael V. Salm; Paul D. Scanlon, CFA; and Raman Srivastava, CFA.
Mr. Srivastava joined the fund in February 2012. A CFA charterholder, he joined Putnam in 1999 and has been in the investment industry since 1997.
A word about derivatives
Derivatives are an increasingly common type of investment instrument, the performance of which is derived from an underlying security, index, currency, or other area of the capital markets. Derivatives employed by the fund’s managers generally serve one of two main purposes: to implement a strategy that may be difficult or more expensive to invest in through traditional securities, or to hedge unwanted risk associated with a particular position.
For example, the fund’s managers might use forward currency contracts to capitalize on an anticipated change in exchange rates between two currencies. This approach would require a significantly smaller outlay of capital than purchasing traditional bonds denominated in the underlying currencies. In another example, the managers may identify a bond that they believe is undervalued relative to its risk of default, but may seek to reduce the interest-rate risk of that bond by using interest-rate swaps, a derivative through which two parties “swap” payments based on the movement of certain rates.
Like any other investment, derivatives may not appreciate in value and may lose money. Derivatives may amplify traditional fixed income risks and may be less liquid than traditional securities. And because derivatives typically represent contractual agreements between two financial institutions, derivatives entail “counterparty risk,” which is the risk that the other party is unable to pay. Putnam monitors the counterparty risks we assume. Putnam also seeks to mitigate the level of ongoing counterparty credit risk by entering into collateral agreements with counterparties in which collateral is posted on a regular basis to cover the developing gain or loss of open swaps and forward contracts.
See pages 90–93 for more information on the types of derivatives used.
10
Your fund’s performance
This section shows your fund’s performance, price, and distribution information for periods ended March 31, 2012, the end of the first half of its current fiscal year. Performance should always be considered in light of a fund’s investment strategy. Data represent past performance. Past performance does not guarantee future results. More recent returns may be less or more than those shown. Investment return, net asset value, and market price will fluctuate, and you may have a gain or a loss when you sell your shares.
Fund performance Total return for periods ended 3/31/12
NAV
Market price
Annual average
Life of fund (since 4/29/88)
7.20%
6.61%
10 years
94.48
97.20
Annual average
6.88
7.03
5 years
27.45
31.21
Annual average
4.97
5.58
3 years
77.97
69.44
Annual average
21.19
19.22
1 year
–2.08
–6.70
6 months
5.79
5.51
Performance assumes reinvestment of distributions and does not account for taxes.
Comparative index returns For periods ended 3/31/12
Lipper Flexible
Barclays Capital
Citigroup Non-U.S.
Income Funds
Government/Credit
World Government
JPMorgan Global
(closed-end)
Bond Index
Bond Index
High Yield Index
category average*
Annual average (life of fund)
7.27%
6.67%
—†
6.85%
10 years
77.68
126.89
151.46%
93.64
Annual average
5.92
8.54
8.38
6.81
5 years
35.44
39.92
49.51
33.83
Annual average
6.26
6.95
9.66
5.94
3 years
22.81
22.27
92.91
67.47
Annual average
7.09
6.93
24.49
18.72
1 year
8.53
3.93
7.41
3.35
6 months
1.26
–0.69
12.68
7.65
Index and Lipper results should be compared with fund performance at net asset value. Lipper calculates performance differently than the closed-end funds it ranks, due to varying methods for determining a fund’s monthly reinvestment net asset value.
* Over the 6-month, 1-year, 3-year, 5-year, 10-year, and life-of-fund periods ended 3/31/12, there were 5, 5, 4, 4, 3, and 2 funds, respectively, in this Lipper category.
† The JPMorgan Global High Yield Index was introduced on 12/31/93, which post-dates the fund’s inception.
11
Fund price and distribution information For the six-month period ended 3/31/12
Distributions
Number
6
Income
$0.174000
Capital gains
—
Total
$0.174000
Share value
NAV
Market price
9/30/11
$5.34
$5.05
3/31/12
5.46
5.15
Current yield (end of period)
NAV
Market price
Current dividend rate*
6.37%
6.76%
The classification of distributions, if any, is an estimate. Final distribution information will appear on your year-end tax forms.
* Most recent distribution, excluding capital gains, annualized and divided by NAV or market price at end of period.
12
Terms and definitions
Important terms
Total return shows how the value of the fund’s shares changed over time, assuming you held the shares through the entire period and reinvested all distributions in the fund.
Net asset value (NAV) is the value of all your fund’s assets, minus any liabilities, divided by the number of outstanding shares.
Market price is the current trading price of one share of the fund. Market prices are set by transactions between buyers and sellers on exchanges such as the New York Stock Exchange.
Fixed-income terms
Current yield is the annual rate of return earned from dividends or interest of an investment. Current yield is expressed as a percentage of the price of a security, fund share, or principal investment.
Mortgage-backed security (MBS), also known as a mortgage “pass-through,” is a type of asset-backed security that is secured by a mortgage or collection of mortgages. The following are types of MBSs:
• Agency “pass-through” has its principal and interest backed by a U.S. government agency, such as the Federal National Mortgage Association (Fannie Mae), Government National Mortgage Association (Ginnie Mae), and Federal Home Loan Mortgage Corporation (Freddie Mac).
• Collateralized mortgage obligation (CMO) represents claims to specific cash flows from pools of home mortgages. The streams of principal and interest payments on the mortgages are distributed to the different classes of CMO interests in “tranches.” Each tranche may have different principal balances, coupon rates, prepayment risks, and maturity dates. A CMO is highly sensitive to changes in interest rates and any resulting change in the rate at which homeowners sell their properties, refinance, or otherwise prepay loans. CMOs are subject to prepayment, market, and liquidity risks.
• Interest-only (IO) security is a type of CMO in which the underlying asset is the interest portion of mortgage, Treasury, or bond payments.
• Non-agency residential mortgage-backed security (RMBS) is an MBS not backed by Fannie Mae, Ginnie Mae, or Freddie Mac. One type of RMBS is an Alt-A mortgage-backed security.
• Commercial mortgage-backed security (CMBS) is secured by the loan on a commercial property.
Yield curve is a graph that plots the yields of bonds with equal credit quality against their differing maturity dates, ranging from shortest to longest. It is used as a benchmark for other debt, such as mortgage or bank lending rates.
Comparative indexes
Barclays Capital Government/Credit Bond Index is an unmanaged index of U.S. Treasuries, agency securities, and investment-grade corporate bonds.
Barclays Capital U.S. Aggregate Bond Index is an unmanaged index of U.S. investment-grade fixed-income securities.
BofA (Bank of America) Merrill Lynch U.S. 3-Month Treasury Bill Index is an unmanaged index that seeks to measure the performance of U.S. Treasury bills available in the marketplace.
Citigroup Non-U.S. World Government Bond Index is an unmanaged index generally considered to be representative of the world bond market excluding the United States.
13
JPMorgan Global High Yield Index is an unmanaged index of global high-yield fixed-income securities.
S&P 500 Index is an unmanaged index of common stock performance.
Indexes assume reinvestment of all distributions and do not account for fees. Securities and performance of a fund and an index will differ. You cannot invest directly in an index.
Lipper is a third-party industry-ranking entity that ranks mutual funds. Its rankings do not reflect sales charges. Lipper rankings are based on total return at net asset value relative to other funds that have similar current investment styles or objectives as determined by Lipper. Lipper may change a fund’s category assignment at its discretion. Lipper category averages reflect performance trends for funds within a category.
Other information for shareholders
Important notice regarding share repurchase program
In September 2011, the Trustees of your fund approved the renewal of a share repurchase program that had been in effect since 2005. This renewal will allow your fund to repurchase, in the 12 months beginning October 8, 2011, up to 10% of the fund’s common shares outstanding as of October 7, 2011.
Important notice regarding delivery of shareholder documents
In accordance with Securities and Exchange Commission (SEC) regulations, Putnam sends a single copy of annual and semiannual shareholder reports, prospectuses, and proxy statements to Putnam shareholders who share the same address, unless a shareholder requests otherwise. If you prefer to receive your own copy of these documents, please call Putnam at 1-800-225-1581, and Putnam will begin sending individual copies within 30 days.
Proxy voting
Putnam is committed to managing our mutual funds in the best interests of our shareholders. The Putnam funds’ proxy voting guidelines and procedures, as well as information regarding how your fund voted proxies relating to portfolio securities during the 12-month period ended June 30, 2011, are available in the Individual Investors section of putnam.com, and on the SEC’s website, www.sec.gov. If you have questions about finding forms on the SEC’s website, you may call the SEC at 1-800-SEC-0330. You may also obtain the Putnam funds’ proxy voting guidelines and procedures at no charge by calling Putnam’s Shareholder Services at 1-800-225-1581.
Fund portfolio holdings
The fund will file a complete schedule of its portfolio holdings with the SEC for the first and third quarters of each fiscal year on Form N-Q. Shareholders may obtain the fund’s Forms N-Q on the SEC’s website at www.sec.gov. In addition, the fund’s Forms N-Q may be reviewed and copied at the SEC’s Public Reference Room in Washington, D.C. You may call the SEC at 1-800-SEC-0330 for information about the SEC’s website or the operation of the Public Reference Room.
Trustee and employee fund ownership
Putnam employees and members of the Board of Trustees place their faith, confidence, and, most importantly, investment dollars in Putnam mutual funds. As of March 31, 2012, Putnam employees had approximately $353,000,000 and the Trustees had approximately $81,000,000 invested in Putnam mutual funds. These amounts include investments by the Trustees’ and employees’ immediate family members as well as investments through retirement and deferred compensation plans.
14
Financial statements
A guide to financial statements
These sections of the report, as well as the accompanying Notes, constitute the fund’s financial statements.
The fund’s portfolio lists all the fund’s investments and their values as of the last day of the reporting period. Holdings are organized by asset type and industry sector, country, or state to show areas of concentration and diversification.
Statement of assets and liabilities shows how the fund’s net assets and share price are determined. All investment and non-investment assets are added together. Any unpaid expenses and other liabilities are subtracted from this total. The result is divided by the number of shares to determine the net asset value per share. (For funds with preferred shares, the amount subtracted from total assets includes the liquidation preference of preferred shares.)
Statement of operations shows the fund’s net investment gain or loss. This is done by first adding up all the fund’s earnings — from dividends and interest income — and subtracting its operating expenses to determine net investment income (or loss). Then, any net gain or loss the fund realized on the sales of its holdings — as well as any unrealized gains or losses over the period — is added to or subtracted from the net investment result to determine the fund’s net gain or loss for the fiscal period.
Statement of changes in net assets shows how the fund’s net assets were affected by the fund’s net investment gain or loss, by distributions to shareholders, and by changes in the number of the fund’s shares. It lists distributions and their sources (net investment income or realized capital gains) over the current reporting period and the most recent fiscal year-end. The distributions listed here may not match the sources listed in the Statement of operations because the distributions are determined on a tax basis and may be paid in a different period from the one in which they were earned. Dividend sources are estimated at the time of declaration. Actual results may vary. Any non-taxable return of capital cannot be determined until final tax calculations are completed after the end of the fund’s fiscal year.
Financial highlights provide an overview of the fund’s investment results, per-share distributions, expense ratios, net investment income ratios, and portfolio turnover in one summary table, reflecting the five most recent reporting periods. In a semiannual report, the highlights table also includes the current reporting period.
15
The fund’s portfolio 3/31/12(Unaudited)
MORTGAGE-BACKED SECURITIES (34.2%)*
Principal amount
Value
American Home Mortgage Investment Trust FRB Ser. 2007-1,
Class GA1A, 0.402s, 2047
$6,473,799
$3,495,850
American Home Mortgage Assets
FRB Ser. 06-6, Class A1A, 0.432s, 2046
3,267,744
1,552,178
FRB Ser. 06-4, Class 1A11, 0.432s, 2046
4,299,636
2,067,694
Banc of America Commercial Mortgage, Inc. 144A
Ser. 01-1, Class J, 6 1/8s, 2036
163,000
122,658
Ser. 01-1, Class K, 6 1/8s, 2036
367,000
58,559
Ser. 07-5, Class XW, IO, 0.416s, 2051
104,593,749
1,594,635
Banc of America Funding Corp. FRB Ser. 07-B, Class A1,
Bear Stearns Asset Backed Securities, Inc. FRB Ser. 04-FR3,
Class M6, 5.117s, 2034
44,609
12,662
Citigroup Mortgage Loan Trust, Inc. Ser. 2005-WF2, Class AF4,
4.964s, 2035
506,748
468,742
Countrywide Asset Backed Certificates
FRB Ser. 06-25, Class 2A2, 0.362s, 2047
649,900
584,910
FRB Ser. 07-1, Class 2A2, 0.342s, 2037
1,875,000
1,621,875
Crest, Ltd. 144A Ser. 03-2A, Class E2, 8s, 2038
495,084
19,803
Granite Mortgages PLC
FRB Ser. 03-2, Class 2C1, 4.13s, 2043
EUR
1,028,000
995,309
FRB Ser. 03-2, Class 3C, 3.52s, 2043
GBP
384,009
446,079
Green Tree Financial Corp.
Ser. 94-6, Class B2, 9s, 2020
$858,870
435,877
Ser. 94-4, Class B2, 8.6s, 2019
302,044
135,800
Ser. 93-1, Class B, 8.45s, 2018
114,586
80,612
GSAA Home Equity Trust FRB Ser. 07-3, Class A4A,
0.462s, 2047 F
1,600,997
680,234
47
ASSET-BACKED SECURITIES (4.6%)* cont.
Principal amount
Value
Guggenheim Structured Real Estate Funding, Ltd. 144A FRB
Ser. 05-2A, Class E, 2.242s, 2030
$402,158
$201,079
Merrill Lynch First Franklin Mortgage Loan Asset Backed
Certificates FRB Ser. 07-1, Class A2B, 0.412s, 2037
887,726
385,051
Merrill Lynch First Franklin Mortgage Loan Trust FRB Ser. 07-3,
Class A2B, 0.372s, 2037
2,814,238
1,651,958
Merrill Lynch Mortgage Investors Trust
FRB Ser. 07-HE1, Class A2D, 0.572s, 2037
1,263,040
410,488
FRB Ser. 06-HE3, Class A3, 0.392s, 2037
3,186,729
1,084,125
FRB Ser. 07-HE1, Class A2A, 0.372s, 2037
3,560,373
1,157,121
FRB Ser. 06-HE5, Class A2B, 0.352s, 2037
1,468,565
807,711
Mid-State Trust Ser. 11, Class B, 8.221s, 2038
93,520
93,469
Morgan Stanley Capital, Inc. FRB Ser. 04-HE8, Class B3,
3.442s, 2034
45,444
12,961
Oakwood Mortgage Investors, Inc.
Ser. 95-B, Class B1, 7.55s, 2021
155,619
118,870
Ser. 01-C, Class A2, 5.92s, 2017
784,773
375,710
Residential Asset Securities Corp. Ser. 01-KS3, Class AII,
0.702s, 2031
1,139,134
845,777
Structured Asset Securities Corp. FRB Ser. 06-BC2, Class A3,
0.392s, 2036
3,710,106
2,114,761
TIAA Real Estate CDO, Ltd. Ser. 03-1A, Class E, 8s, 2038
519,979
62,397
TIAA Real Estate CDO, Ltd. 144A Ser. 02-1A, Class IV, 6.84s, 2037
390,000
195,000
Total asset-backed securities (cost $17,843,689)
$16,662,021
SENIOR LOANS (2.0%)* c
Principal amount
Value
Basic materials (0.1%)
Exopack, LLC bank term loan FRN Ser. B, 6 1/2s, 2017
$89,325
$89,213
INEOS Group Holdings, Ltd. bank term loan FRN Ser. C2,
8.001s, 2014
6,246
6,464
Momentive Performance Materials, Inc. bank term loan FRN
3 3/4s, 2013
157,098
154,611
Nexeo Solutions, LLC bank term loan FRN Ser. B, 5s, 2017
89,100
86,928
337,216
Capital goods (—%)
SRAM Corp. bank term loan FRN 8 1/2s, 2018
60,000
60,375
60,375
Communication services (0.3%)
Charter Communications Operating, LLC bank term loan FRN
Ser. C, 3.83s, 2016
805,023
799,992
Charter Communications Operating, LLC bank term loan FRN
Ser. l, 7 1/4s, 2014
6,165
6,151
Intelsat SA bank term loan FRN 3.242s, 2014 (Luxembourg)
460,000
451,088
Level 3 Financing, Inc. bank term loan FRN 2.729s, 2014
15,000
14,756
1,271,987
Consumer cyclicals (0.9%)
Brickman Group Holdings, Inc. bank term loan FRN Ser. B,
7 1/4s, 2016
76,314
76,568
Burlington Coat Factory Warehouse Corp. bank term loan FRN
Ser. B, 6 1/4s, 2017
47,875
47,992
48
SENIOR LOANS (2.0%)* c cont.
Principal amount
Value
Consumer cyclicals cont.
Caesars Entertainment Operating Co., Inc. bank term loan
FRN Ser. B6, 5.494s, 2018
$344,663
$310,897
CCM Merger, Inc. bank term loan FRN Ser. B, 7s, 2017
241,255
241,657
Cengage Learning Acquisitions, Inc. bank term loan FRN Ser. B,
2.49s, 2014
285,209
262,647
Clear Channel Communications, Inc. bank term loan FRN Ser. B,
3.894s, 2016
429,181
347,315
Compucom Systems, Inc. bank term loan FRN 3 3/4s, 2014
79,332
77,547
GateHouse Media, Inc. bank term loan FRN Ser. B, 2 1/2s, 2014
216,620
64,535
GateHouse Media, Inc. bank term loan FRN Ser. B, 2 1/4s, 2014
184,446
54,950
GateHouse Media, Inc. bank term loan FRN Ser. DD, 2 1/4s, 2014
68,823
20,504
Golden Nugget, Inc. bank term loan FRN Ser. B, 3 1/4s, 2014 ‡‡
101,341
95,134
Golden Nugget, Inc. bank term loan FRN Ser. DD, 3 1/4s, 2014 ‡‡
57,687
54,153
Goodman Global, Inc. bank term loan FRN 9s, 2017
114,545
115,814
Goodman Global, Inc. bank term loan FRN 5 3/4s, 2016
177,585
178,283
National Bedding Company, LLC bank term loan FRN Ser. B,
4 1/8s, 2013
71,794
71,704
Neiman Marcus Group, Inc. (The) bank term loan FRN 4 3/4s, 2018
160,000
159,571
Nortek, Inc. bank term loan FRN Ser. B, 5 1/4s, 2017
40,495
40,360
R.H. Donnelley, Inc. bank term loan FRN Ser. B, 9s, 2014
482,391
212,654
Realogy Corp. bank term loan FRN Ser. B, 4.77s, 2016
422,232
391,855
ServiceMaster Co. (The) bank term loan FRN Ser. B, 2.803s, 2014
123,129
121,572
ServiceMaster Co. (The) bank term loan FRN Ser. DD, 2 3/4s, 2014
12,649
12,489
Tribune Co. bank term loan FRN Ser. B, 5 1/4s, 2014
289,000
189,801
Univision Communications, Inc. bank term loan FRN 4.494s, 2017
171,147
158,571
3,306,573
Consumer staples (0.2%)
Claire’s Stores, Inc. bank term loan FRN 3.086s, 2014
137,072
130,219
Del Monte Corp. bank term loan FRN Ser. B, 4 1/2s, 2018
114,138
113,709
Revlon Consumer Products bank term loan FRN Ser. B,
4 3/4s, 2017
243,775
243,131
Rite Aid Corp. bank term loan FRN Ser. B, 2s, 2014
94,519
92,676
West Corp. bank term loan FRN Ser. B2, 2.658s, 2013
23,026
22,992
West Corp. bank term loan FRN Ser. B5, 4.494s, 2016
55,855
55,925
658,652
Energy (0.1%)
Frac Tech International, LLC bank term loan FRN Ser. B,
6 1/4s, 2016
141,526
140,897
Hercules Offshore, Inc. bank term loan FRN Ser. B, 7 1/2s, 2013
119,361
119,105
260,002
Financials (0.1%)
AGFS Funding Co. bank term loan FRN Ser. B, 5 1/2s, 2017
170,000
156,506
HUB International Holdings, Inc. bank term loan FRN 6 3/4s, 2014
71,175
71,086
227,592
Health care (0.2%)
Ardent Health Services bank term loan FRN Ser. B, 6 1/2s, 2015
222,977
222,419
Emergency Medical Services Corp. bank term loan FRN Ser. B,
5 1/4s, 2018
183,150
183,013
IASIS Healthcare, LLC bank term loan FRN Ser. B, 5s, 2018
267,300
267,300
49
SENIOR LOANS (2.0%)* c cont.
Principal amount
Value
Health care cont.
Multiplan, Inc. bank term loan FRN Ser. B, 4 3/4s, 2017
$132,770
$131,318
Quintiles Transnational Corp. bank term loan FRN 7 1/2s, 2017 ‡‡
60,000
60,050
864,100
Utilities and power (0.1%)
Texas Competitive Electric Holdings Co., LLC bank term loan
FRN 4.743s, 2017
640,516
355,086
355,086
Total senior loans (cost $8,323,056)
$7,341,583
CONVERTIBLE BONDS AND NOTES (0.1%)*
Principal amount
Value
Ford Motor Co. cv. sr. unsec. notes 4 1/4s, 2016
$157,000
$248,845
Steel Dynamics, Inc. cv. sr. notes 5 1/8s, 2014
155,000
175,731
Total convertible bonds and notes (cost $312,000)
$424,576
CONVERTIBLE PREFERRED STOCKS (0.1%)*
Shares
Value
General Motors Co. Ser. B, $2.375 cv. pfd.
3,856
$161,229
Lehman Brothers Holdings, Inc. 7.25% cv. pfd. (Escrow) F
667
7
Lucent Technologies Capital Trust I 7.75% cv. pfd.
176
143,088
Total convertible preferred stocks (cost $365,767)
$304,324
PREFERRED STOCKS (—%)*
Shares
Value
Ally Financial, Inc. 144A 7.00% cum. pfd.
198
$164,953
Total preferred stocks (cost $66,176)
$164,953
WARRANTS (—%)* †
Expiration
Strike
date
price
Warrants
Value
Charter Communications, Inc. Class A
11/30/14
$0.01
20
$411
Smurfit Kappa Group PLC 144A (Ireland) F
10/1/13
EUR
1.00
508
24,050
Total warrants (cost $19,277)
$24,461
COMMON STOCKS (—%)*
Shares
Value
Bohai Bay Litigation, LLC (Escrow) F
991
$3,091
Magellan Health Services, Inc. †
158
7,712
Trump Entertainment Resorts, Inc.
94
94
Vertis Holdings, Inc. F
734
7
Total common stocks (cost $13,036)
$10,904
SHORT-TERM INVESTMENTS (24.4%)*
Principal amount/shares
Value
Putnam Money Market Liquidity Fund 0.11% e
4,316,212
$4,316,212
U.S. Treasury Bills with an effective yield of 0.104%,
December 13, 2012 ##
$5,000,000
4,995,135
U.S. Treasury Bills with effective yields ranging from 0.084%
to 0.102%, November 15, 2012 ##
5,534,000
5,529,468
U.S. Treasury Bills with an effective yield of 0.087%,
October 18, 2012 ## #
27,595,000
27,575,187
U.S. Treasury Bills with effective yields ranging from 0.058%
to 0.096%, August 23, 2012 ##
27,424,000
27,410,946
50
SHORT-TERM INVESTMENTS (24.4%)* cont.
Principal amount/shares
Value
U.S. Treasury Bills with effective yields ranging from 0.059%
to 0.082%, July 26, 2012 ## #
$2,463,000
$2,462,352
U.S. Treasury Bills with effective yields ranging from 0.070%
to 0.070%, June 28, 2012 ## #
3,087,000
3,086,478
U.S. Treasury Bills with an effective yield of 0.079%,
May 3, 2012 ## #
979,000
978,923
U.S. Treasury Bills with an effective yield of 0.073%,
April 5, 2012 ##
500,000
499,994
U.S. Treasury Bills with an effective yield of 0.178%, May 17, 2012
10,500,000
10,497,585
Total short-term investments (cost $87,364,180)
$87,352,280
TOTAL INVESTMENTS
Total investments (cost $497,665,035)
$498,211,749
Key to holding’s currency abbreviations
ARS
Argentine Peso
AUD
Australian Dollar
BRL
Brazilian Real
CAD
Canadian Dollar
CHF
Swiss Franc
CLP
Chilean Peso
EUR
Euro
GBP
British Pound
INR
Indian Rupee
JPY
Japanese Yen
MXN
Mexican Peso
SEK
Swedish Krona
RUB
Russian Ruble
Key to holding’s abbreviations
EMTN
Euro Medium Term Notes
FRB
Floating Rate Bonds: the rate shown is the current interest rate at the close of the reporting period
FRN
Floating Rate Notes: the rate shown is the current interest rate at the close of the reporting period
IFB
Inverse Floating Rate Bonds, which are securities that pay interest rates that vary inversely to changes
in the market interest rates. As interest rates rise, inverse floaters produce less current income. The rate
shown is the current interest rate at the close of the reporting period.
IO
Interest Only
JSC
Joint Stock Company
OAO
Open Joint Stock Company
OJSC
Open Joint Stock Company
PO
Principal Only
TBA
To Be Announced Commitments
Notes to the fund’s portfolio
Unless noted otherwise, the notes to the fund’s portfolio are for the close of the fund’s reporting period, which ran from October 1, 2011 through March 31, 2012 (the reporting period). Within the following notes to the portfolio, references to “ASC 820” represent Accounting Standards Codification ASC 820 Fair Value Measurements and Disclosures.
* Percentages indicated are based on net assets of $358,507,614.
† Non-income-producing security.
51
†† The interest or dividend rate and date shown parenthetically represent the new interest or dividend rate to be paid and the date the fund will begin accruing interest or dividend income at this rate.
‡‡ Income may be received in cash or additional securities at the discretion of the issuer.
# This security, in part or in entirety, was pledged and segregated with the broker to cover margin requirements for futures contracts at the close of the reporting period.
## This security, in part or in entirety, was pledged and segregated with the custodian for collateral on certain derivative contracts at the close of the reporting period.
∆ Forward commitment, in part or in entirety (Note 1).
c Senior loans are exempt from registration under the Securities Act of 1933, as amended, but contain certain restrictions on resale and cannot be sold publicly. These loans pay interest at rates which adjust periodically. The interest rates shown for senior loans are the current interest rates at the close of the reporting period. Senior loans are also subject to mandatory and/or optional prepayment which cannot be predicted. As a result, the remaining maturity may be substantially less than the stated maturity shown (Notes 1 and 7).
e See Note 6 to the financial statements regarding investments in Putnam Money Market Liquidity Fund. The rate quoted in the security description is the annualized 7-day yield of the fund at the close of the reporting period.
F Is valued at fair value following procedures approved by the Trustees. Securities may be classified as Level 2 or Level 3 for ASC 820 based on the securities’ valuation inputs.
i Security purchased with cash or security received, that was pledged to the fund for collateral on certain derivative contracts (Note 1).
R Real Estate Investment Trust.
At the close of the reporting period, the fund maintained liquid assets totaling $113,570,394 to cover certain derivatives contracts.
Debt obligations are considered secured unless otherwise indicated.
144A after the name of an issuer represents securities exempt from registration under Rule 144A under the Securities Act of 1933, as amended. These securities may be resold in transactions exempt from registration, normally to qualified institutional buyers.
See Note 1 to the financial statements regarding TBA’s.
The dates shown on debt obligations are the original maturity dates.
DIVERSIFICATION BY COUNTRY
Distribution of investments by country of risk at the close of the reporting period, excluding collateral received, if any (as a percentage of Portfolio Value):
United States
87.0%
Indonesia
0.7%
Russia
2.4
United Kingdom
0.6
Argentina
1.5
Netherlands
0.6
Venezuela
1.4
Mexico
0.6
Luxembourg
0.9
Other
2.7
Ukraine
0.8
Total
100.0%
Brazil
0.8
FORWARD CURRENCY CONTRACTS at 3/31/12 (aggregate face value $327,142,878) (Unaudited)
Unrealized
Contract
Delivery
Aggregate
appreciation/
Counterparty
Currency
type
date
Value
face value
(depreciation)
Bank of America N.A.
Australian Dollar
Buy
4/18/12
$1,830,963
$1,903,855
$(72,892)
Brazilian Real
Buy
4/18/12
319,426
337,428
(18,002)
Brazilian Real
Sell
4/18/12
319,426
319,571
145
British Pound
Sell
4/18/12
376,486
375,383
(1,103)
52
FORWARD CURRENCY CONTRACTS at 3/31/12 (aggregate face value $327,142,878) (Unaudited) cont.
Unrealized
Contract
Delivery
Aggregate
appreciation/
Counterparty
Currency
type
date
Value
face value
(depreciation
Bank of America N.A. cont.
Canadian Dollar
Buy
4/18/12
$886,882
$890,556
$(3,674)
Canadian Dollar
Sell
4/18/12
886,882
897,314
10,432
Chilean Peso
Buy
4/18/12
50,275
50,588
(313)
Chilean Peso
Sell
4/18/12
50,275
50,829
554
Euro
Buy
4/18/12
1,180,533
1,180,060
473
Japanese Yen
Sell
4/18/12
1,250,408
1,275,448
25,040
Mexican Peso
Sell
4/18/12
115,934
116,130
196
Norwegian Krone
Buy
4/18/12
297,804
295,046
2,758
Norwegian Krone
Sell
4/18/12
297,804
301,856
4,052
Russian Ruble
Buy
4/18/12
4,240
4,245
(5)
South African Rand
Sell
4/18/12
16,220
16,494
274
Swedish Krona
Buy
4/18/12
204,762
210,506
(5,744)
Swiss Franc
Buy
4/18/12
1,434,934
1,433,067
1,867
Turkish Lira
Buy
4/18/12
456,762
447,481
9,281
Turkish Lira
Sell
4/18/12
456,762
461,339
4,577
Barclay’s Bank, PLC
Australian Dollar
Sell
4/18/12
1,764,781
1,795,113
30,332
Brazilian Real
Buy
4/18/12
971,543
1,110,028
(138,485)
British Pound
Sell
4/18/12
2,529,845
2,521,642
(8,203)
Canadian Dollar
Buy
4/18/12
2,693,421
2,718,968
(25,547)
Canadian Dollar
Sell
4/18/12
2,693,420
2,718,577
25,157
Chilean Peso
Buy
4/18/12
802,611
821,122
(18,511)
Czech Koruna
Sell
4/18/12
2,016,178
2,019,545
3,367
Euro
Sell
4/18/12
8,548,359
8,543,188
(5,171)
Hungarian Forint
Buy
4/18/12
803,038
809,679
(6,641)
Hungarian Forint
Sell
4/18/12
803,038
800,084
(2,954)
Indian Rupee
Buy
4/18/12
143,894
146,719
(2,825)
Indian Rupee
Sell
4/18/12
143,894
145,069
1,175
Indonesian Rupiah
Buy
4/18/12
787,094
788,434
(1,340)
Japanese Yen
Sell
4/18/12
1,584,852
1,616,430
31,578
Malaysian Ringgit
Buy
4/18/12
795,285
810,434
(15,149)
Mexican Peso
Buy
4/18/12
449,969
446,784
3,185
New Zealand Dollar
Sell
4/18/12
561,049
558,595
(2,454)
Norwegian Krone
Buy
4/18/12
1,152,344
1,168,682
(16,338)
Polish Zloty
Buy
4/18/12
797,472
797,860
(388)
Singapore Dollar
Sell
4/18/12
1,791,676
1,799,572
7,896
South African Rand
Buy
4/18/12
765,353
796,314
(30,961)
South Korean Won
Buy
4/18/12
773,858
783,616
(9,758)
Swedish Krona
Buy
4/18/12
4,407,138
4,391,930
15,208
Swiss Franc
Sell
4/18/12
1,254,778
1,250,331
(4,447)
Taiwan Dollar
Sell
4/18/12
785,281
787,645
2,364
Turkish Lira
Buy
4/18/12
1,108,784
1,121,236
(12,452)
53
FORWARD CURRENCY CONTRACTS at 3/31/12 (aggregate face value $327,142,878) (Unaudited) cont.
Unrealized
Contract
Delivery
Aggregate
appreciation/
Counterparty
Currency
type
date
Value
face value
(depreciation
Citibank, N.A.
Australian Dollar
Buy
4/18/12
$6,801,325
$7,071,435
$(270,110)
Brazilian Real
Buy
4/18/12
813,550
814,118
(568)
Brazilian Real
Sell
4/18/12
813,550
812,761
(789)
British Pound
Sell
4/18/12
4,333,748
4,307,000
(26,748)
Canadian Dollar
Buy
4/18/12
594,830
597,131
(2,301)
Canadian Dollar
Sell
4/18/12
594,830
601,903
7,073
Chilean Peso
Buy
4/18/12
198,407
200,343
(1,936)
Chilean Peso
Sell
4/18/12
198,407
199,540
1,133
Czech Koruna
Sell
4/18/12
1,224,670
1,218,906
(5,764)
Euro
Buy
4/18/12
385,864
367,075
18,789
Japanese Yen
Sell
4/18/12
4,803,713
4,899,368
95,655
Mexican Peso
Sell
4/18/12
347,616
344,648
(2,968)
New Zealand Dollar
Buy
4/18/12
9,161
9,275
(114)
New Zealand Dollar
Sell
4/18/12
9,161
9,096
(65)
Norwegian Krone
Buy
4/18/12
370,461
375,719
(5,258)
Polish Zloty
Buy
4/18/12
429,647
440,447
(10,800)
Singapore Dollar
Sell
4/18/12
988,437
992,967
4,530
South African Rand
Buy
4/18/12
476,741
505,332
(28,591)
South Korean Won
Buy
4/18/12
788,352
798,471
(10,119)
Swedish Krona
Buy
4/18/12
2,542,556
2,517,598
24,958
Swiss Franc
Buy
4/18/12
1,279,818
1,275,649
4,169
Taiwan Dollar
Sell
4/18/12
784,847
787,205
2,358
Turkish Lira
Buy
4/18/12
711,444
733,375
(21,931)
Credit Suisse AG
Australian Dollar
Buy
4/18/12
4,170,699
4,363,988
(193,289)
Brazilian Real
Buy
4/18/12
1,816,211
1,914,154
(97,943)
Brazilian Real
Sell
4/18/12
1,816,211
1,840,349
24,138
British Pound
Sell
4/18/12
2,425,888
2,401,209
(24,679)
Canadian Dollar
Sell
4/18/12
910,686
934,409
23,723
Chilean Peso
Buy
4/18/12
778,981
786,258
(7,277)
Czech Koruna
Sell
4/18/12
1,632,061
1,618,935
(13,126)
Euro
Sell
4/18/12
3,365,005
3,363,442
(1,563)
Hungarian Forint
Buy
4/18/12
824,610
830,781
(6,171)
Hungarian Forint
Sell
4/18/12
824,611
798,723
(25,888)
Indian Rupee
Buy
4/18/12
138,320
140,867
(2,547)
Indian Rupee
Sell
4/18/12
138,320
139,422
1,102
Japanese Yen
Sell
4/18/12
916,521
935,876
19,355
Mexican Peso
Sell
4/18/12
286,690
303,262
16,572
New Zealand Dollar
Sell
4/18/12
750,410
760,396
9,986
Norwegian Krone
Sell
4/18/12
1,549,340
1,528,764
(20,576)
Polish Zloty
Buy
4/18/12
775,601
773,009
2,592
Singapore Dollar
Sell
4/18/12
988,755
992,668
3,913
South African Rand
Buy
4/18/12
451,948
479,586
(27,638)
South Korean Won
Buy
4/18/12
787,180
807,310
(20,130)
54
FORWARD CURRENCY CONTRACTS at 3/31/12 (aggregate face value $327,142,878) (Unaudited) cont.
Unrealized
Contract
Delivery
Aggregate
appreciation/
Counterparty
Currency
type
date
Value
face value
(depreciation
Credit Suisse AG cont.
Swedish Krona
Buy
4/18/12
$5,419,105
$5,382,168
$36,937
Swiss Franc
Sell
4/18/12
3,537,754
3,525,100
(12,654)
Taiwan Dollar
Buy
4/18/12
1,619,812
1,623,929
(4,117)
Taiwan Dollar
Sell
4/18/12
1,619,812
1,622,075
2,263
Turkish Lira
Buy
4/18/12
1,132,597
1,156,123
(23,526)
Deutsche Bank AG
Australian Dollar
Buy
4/18/12
2,663,820
2,765,928
(102,108)
Brazilian Real
Buy
4/18/12
447,120
525,264
(78,144)
British Pound
Sell
4/18/12
785,759
783,250
(2,509)
Canadian Dollar
Buy
4/18/12
2,029,136
2,052,597
(23,461)
Chilean Peso
Buy
4/18/12
202,808
204,050
(1,242)
Chilean Peso
Sell
4/18/12
202,808
203,058
250
Czech Koruna
Sell
4/18/12
1,626,714
1,617,731
(8,983)
Euro
Sell
4/18/12
2,427,621
2,435,347
7,726
Mexican Peso
Sell
4/18/12
1
53
52
New Zealand Dollar
Buy
4/18/12
30,183
30,569
(386)
New Zealand Dollar
Sell
4/18/12
30,183
29,967
(216)
Norwegian Krone
Buy
4/18/12
89,592
90,836
(1,244)
Norwegian Krone
Sell
4/18/12
89,592
88,770
(822)
Polish Zloty
Buy
4/18/12
790,824
781,641
9,183
Singapore Dollar
Sell
4/18/12
988,755
993,128
4,373
South African Rand
Buy
4/18/12
773,821
806,086
(32,265)
South Korean Won
Buy
4/18/12
792,519
802,118
(9,599)
Swedish Krona
Sell
4/18/12
2,591,726
2,564,559
(27,167)
Swiss Franc
Buy
4/18/12
621,461
619,341
2,120
Turkish Lira
Buy
4/18/12
985,412
993,687
(8,275)
Goldman Sachs International
Australian Dollar
Buy
4/18/12
1,682,054
1,843,253
(161,199)
British Pound
Sell
4/18/12
1,557,763
1,552,800
(4,963)
Canadian Dollar
Buy
4/18/12
3,337,561
3,349,886
(12,325)
Canadian Dollar
Sell
4/18/12
3,337,560
3,377,167
39,607
Chilean Peso
Buy
4/18/12
396,260
397,868
(1,608)
Czech Koruna
Sell
4/18/12
1,620,946
1,605,288
(15,658)
Euro
Sell
4/18/12
3,417,290
3,416,022
(1,268)
Japanese Yen
Sell
4/18/12
1,872,994
1,910,337
37,343
Norwegian Krone
Buy
4/18/12
1,101,660
1,116,659
(14,999)
Singapore Dollar
Sell
4/18/12
790,988
794,855
3,867
South African Rand
Buy
4/18/12
716,614
733,393
(16,779)
South Korean Won
Buy
4/18/12
785,939
796,040
(10,101)
Swedish Krona
Buy
4/18/12
1,629,623
1,612,879
16,744
Swiss Franc
Buy
4/18/12
63,265
63,156
109
Taiwan Dollar
Sell
4/18/12
784,058
787,806
3,748
Turkish Lira
Buy
4/18/12
1,282,578
1,296,088
(13,510)
55
FORWARD CURRENCY CONTRACTS at 3/31/12 (aggregate face value $327,142,878) (Unaudited) cont.
Unrealized
Contract
Delivery
Aggregate
appreciation/
Counterparty
Currency
type
date
Value
face value
(depreciation
HSBC Bank USA, National Association
Australian Dollar
Buy
4/18/12
$1,284,666
$1,333,375
$(48,709)
British Pound
Sell
4/18/12
1,920,247
1,914,519
(5,728)
Canadian Dollar
Buy
4/18/12
43,698
43,866
(168)
Canadian Dollar
Sell
4/18/12
43,698
44,170
472
Czech Koruna
Sell
4/18/12
1,620,957
1,605,315
(15,642)
Euro
Sell
4/18/12
2,835,093
2,831,620
(3,473)
Indian Rupee
Sell
4/18/12
11,034
12,635
1,601
Japanese Yen
Sell
4/18/12
3,026,290
3,000,486
(25,804)
New Zealand Dollar
Buy
4/18/12
12,597
12,751
(154)
New Zealand Dollar
Sell
4/18/12
12,597
12,506
(91)
Norwegian Krone
Sell
4/18/12
1,007,241
1,021,628
14,387
Singapore Dollar
Sell
4/18/12
988,755
992,970
4,215
South Korean Won
Buy
4/18/12
785,704
792,548
(6,844)
Swedish Krona
Buy
4/18/12
21,496
21,275
221
Swedish Krona
Sell
4/18/12
21,496
21,089
(407)
Swiss Franc
Buy
4/18/12
918,509
915,516
2,993
Turkish Lira
Buy
4/18/12
770,139
776,070
(5,931)
JPMorgan Chase Bank NA
Australian Dollar
Buy
4/18/12
2,152,048
2,332,642
(180,594)
Brazilian Real
Buy
4/18/12
340,171
446,526
(106,355)
British Pound
Sell
4/18/12
5,128,143
5,095,916
(32,227)
Canadian Dollar
Buy
4/18/12
212,275
214,843
(2,568)
Canadian Dollar
Sell
4/18/12
212,275
213,095
820
Chilean Peso
Buy
4/18/12
62,078
62,349
(271)
Chilean Peso
Sell
4/18/12
62,078
62,632
554
Czech Koruna
Sell
4/18/12
2,035,143
2,021,050
(14,093)
Euro
Sell
4/18/12
6,893,799
6,901,607
7,808
Japanese Yen
Sell
4/18/12
2,814,274
2,925,707
111,433
Mexican Peso
Sell
4/18/12
1,121,107
1,127,458
6,351
New Zealand Dollar
Buy
4/18/12
30,510
30,903
(393)
New Zealand Dollar
Sell
4/18/12
30,510
30,292
(218)
Norwegian Krone
Buy
4/18/12
3,087,079
3,134,219
(47,140)
Polish Zloty
Buy
4/18/12
809,868
821,273
(11,405)
Russian Ruble
Sell
4/18/12
343,866
343,593
(273)
Singapore Dollar
Sell
4/18/12
2,582,665
2,594,087
11,422
South African Rand
Buy
4/18/12
1,083,128
1,089,637
(6,509)
South Korean Won
Buy
4/18/12
789,005
798,562
(9,557)
Swedish Krona
Sell
4/18/12
1
4,466
4,465
Swiss Franc
Sell
4/18/12
3,742,618
3,729,622
(12,996)
Taiwan Dollar
Sell
4/18/12
790,109
792,874
2,765
Turkish Lira
Buy
4/18/12
1,114,933
1,122,966
(8,033)
Turkish Lira
Sell
4/18/12
1,114,933
1,103,317
(11,616)
56
FORWARD CURRENCY CONTRACTS at 3/31/12 (aggregate face value $327,142,878) (Unaudited) cont.
Unrealized
Contract
Delivery
Aggregate
appreciation/
Counterparty
Currency
type
date
Value
face value
(depreciation
The Royal Bank of Scotland PLC
Australian Dollar
Buy
4/18/12
$4,760,441
$4,943,515
$(183,074)
Brazilian Real
Buy
4/18/12
104,328
198,816
(94,488)
British Pound
Sell
4/18/12
1,613,100
1,590,911
(22,189)
Canadian Dollar
Sell
4/18/12
1,430,197
1,418,440
(11,757)
Chilean Peso
Buy
4/18/12
25,668
25,711
(43)
Chilean Peso
Sell
4/18/12
25,668
25,944
276
Czech Koruna
Sell
4/18/12
2,028,133
2,019,838
(8,295)
Euro
Sell
4/18/12
9,137,225
9,142,485
5,260
Hungarian Forint
Buy
4/18/12
803,039
807,603
(4,564)
Hungarian Forint
Sell
4/18/12
803,038
798,251
(4,787)
Indian Rupee
Buy
4/18/12
68,695
69,328
(633)
Indian Rupee
Sell
4/18/12
68,695
69,946
1,251
Japanese Yen
Sell
4/18/12
91,131
149,754
58,623
Mexican Peso
Sell
4/18/12
516,733
552,078
35,345
New Zealand Dollar
Buy
4/18/12
30,265
30,670
(405)
New Zealand Dollar
Sell
4/18/12
30,265
30,048
(217)
Norwegian Krone
Sell
4/18/12
151,420
90,457
(60,963)
Polish Zloty
Buy
4/18/12
809,162
817,656
(8,494)
Singapore Dollar
Sell
4/18/12
1,593,671
1,600,617
6,946
South African Rand
Buy
4/18/12
137,074
190,688
(53,614)
South Korean Won
Buy
4/18/12
790,437
791,724
(1,287)
Swedish Krona
Buy
4/18/12
3,903,246
3,860,370
42,876
Swiss Franc
Sell
4/18/12
1,790,150
1,784,673
(5,477)
Taiwan Dollar
Buy
4/18/12
59,568
57,877
1,691
Turkish Lira
Buy
4/18/12
1,063,169
1,059,166
4,003
State Street Bank and Trust Company
Australian Dollar
Buy
4/18/12
1,991,661
2,165,337
(173,676)
Brazilian Real
Buy
4/18/12
553,795
697,029
(143,234)
British Pound
Buy
4/18/12
699,074
702,069
(2,995)
Canadian Dollar
Buy
4/18/12
61,337
50,571
10,766
Chilean Peso
Buy
4/18/12
789,496
795,165
(5,669)
Czech Koruna
Sell
4/18/12
2,436,675
2,422,527
(14,148)
Euro
Sell
4/18/12
3,998,820
3,995,754
(3,066)
Hungarian Forint
Buy
4/18/12
704,829
716,184
(11,355)
Japanese Yen
Sell
4/18/12
2,960,438
3,041,828
81,390
Mexican Peso
Sell
4/18/12
365,583
372,938
7,355
New Zealand Dollar
Buy
4/18/12
35,827
36,262
(435)
New Zealand Dollar
Sell
4/18/12
35,827
35,566
(261)
Norwegian Krone
Buy
4/18/12
677,461
724,655
(47,194)
Polish Zloty
Buy
4/18/12
420,783
425,621
(4,838)
Singapore Dollar
Sell
4/18/12
989,949
994,208
4,259
South African Rand
Buy
4/18/12
1,539,083
1,575,553
(36,470)
South Korean Won
Buy
4/18/12
770,446
793,706
(23,260)
Swedish Krona
Buy
4/18/12
5,887,513
5,827,867
59,646
57
FORWARD CURRENCY CONTRACTS at 3/31/12 (aggregate face value $327,142,878) (Unaudited) cont.
Unrealized
Contract
Delivery
Aggregate
appreciation/
Counterparty
Currency
type
date
Value
face value
(depreciation
State Street Bank and Trust Company cont.
Swiss Franc
Sell
4/18/12
$1,250,568
$1,245,943
$(4,625)
Taiwan Dollar
Buy
4/18/12
2,423,672
2,425,104
(1,432)
Taiwan Dollar
Sell
4/18/12
2,423,671
2,427,981
4,310
Turkish Lira
Buy
4/18/12
747,611
786,408
(38,797)
UBS AG
Australian Dollar
Buy
4/18/12
1,973,047
2,051,253
(78,206)
Brazilian Real
Buy
4/18/12
2
98,591
(98,589)
British Pound
Sell
4/18/12
2,944,076
2,867,384
(76,692)
Canadian Dollar
Buy
4/18/12
2,674,679
2,705,649
(30,970)
Czech Koruna
Sell
4/18/12
2,437,676
2,439,730
2,054
Euro
Buy
4/18/12
535,648
537,945
(2,297)
Hungarian Forint
Buy
4/18/12
807,145
804,174
2,971
Indian Rupee
Sell
4/18/12
464,938
474,065
9,127
Japanese Yen
Sell
4/18/12
1,075,736
1,185,670
109,934
Mexican Peso
Buy
4/18/12
2,415,390
2,386,228
29,162
Mexican Peso
Sell
4/18/12
2,415,389
2,431,700
16,311
New Zealand Dollar
Buy
4/18/12
29,365
29,711
(346)
New Zealand Dollar
Sell
4/18/12
29,365
29,155
(210)
Norwegian Krone
Buy
4/18/12
679,497
755,270
(75,773)
Polish Zloty
Buy
4/18/12
809,836
811,972
(2,136)
Singapore Dollar
Sell
4/18/12
989,949
994,724
4,775
South African Rand
Buy
4/18/12
778,673
785,606
(6,933)
South Korean Won
Buy
4/18/12
768,313
788,404
(20,091)
Swedish Krona
Buy
4/18/12
5,931,049
5,870,290
60,759
Swiss Franc
Sell
4/18/12
4,215,390
4,201,193
(14,197)
Taiwan Dollar
Buy
4/18/12
16,752
15,489
1,263
Turkish Lira
Buy
4/18/12
461,681
494,504
(32,823)
Westpac Banking Corporation
Australian Dollar
Buy
4/18/12
895,213
1,030,590
(135,377)
British Pound
Buy
4/18/12
584,241
582,350
1,891
Canadian Dollar
Buy
4/18/12
2,851,674
2,868,117
(16,443)
Canadian Dollar
Sell
4/18/12
2,851,675
2,839,170
(12,505)
Euro
Sell
4/18/12
1,641,489
1,640,757
(732)
Japanese Yen
Sell
4/18/12
1,102,865
1,166,379
63,514
Mexican Peso
Sell
4/18/12
1,600,368
1,617,745
17,377
New Zealand Dollar
Buy
4/18/12
38,690
39,164
(474)
New Zealand Dollar
Sell
4/18/12
38,690
38,413
(277)
Norwegian Krone
Buy
4/18/12
146,963
153,742
(6,779)
Swedish Krona
Buy
4/18/12
1,847,376
1,827,452
19,924
Swiss Franc
Buy
4/18/12
32,685
32,475
210
Swiss Franc
Sell
4/18/12
32,685
32,565
(120)
Total
$(2,525,230)
58
FUTURES CONTRACTS OUTSTANDING at 3/31/12 (Unaudited)
Unrealized
Number of
Expiration
appreciation/
contracts
Value
date
(depreciation)
Australian Government Treasury
Bond 10 yr (Long)
3
$360,733
Jun-12
$(849)
Canadian Government Bond
10 yr (Long)
29
3,815,399
Jun-12
(6,818)
Euro-Bobl 5 yr (Short)
5
827,627
Jun-12
(1,284)
Euro-Bund 10 yr (Long)
11
2,031,745
Jun-12
6,418
Euro-Schatz 2 yr (Long)
18
2,648,768
Jun-12
60
Euro-Swiss Franc 3 Month (Short)
38
10,512,407
Jun-12
(103,604)
Euro-Swiss Franc 3 Month (Short)
38
10,511,355
Dec-12
(139,445)
Japanese Government Bond
10 yr (Short)
13
22,304,337
Jun-12
31,342
Japanese Government Bond
10 yr Mini (Long)
4
686,046
Jun-12
(1,179)
U.K. Gilt 10 yr (Short)
4
732,635
Jun-12
(363)
Total
$(215,722)
WRITTEN OPTIONS OUTSTANDING at 3/31/12 (premiums received $28,777,407) (Unaudited)
Contract
Expiration date/
amount
strike price
Value
Option on an interest rate swap with Bank of America,
N.A. for the obligation to pay a fixed rate of 2.183%
versus the three month USD-LIBOR-BBA maturing
June 2022.
$1,212,000
Jun-12/2.183
$9,526
Option on an interest rate swap with Bank of America,
N.A. for the obligation to pay a fixed rate of 4.28%
versus the three month USD-LIBOR-BBA maturing
August 2026.
11,059,894
Aug-16/4.28
1,174,782
Option on an interest rate swap with Bank of America,
N.A. for the obligation to pay a fixed rate of 4.35%
versus the three month USD-LIBOR-BBA maturing
August 2026.
26,715,351
Aug-16/4.35
2,945,741
Option on an interest rate swap with Bank of America,
N.A. for the obligation to receive a fixed rate of 4.28%
versus the three month USD-LIBOR-BBA maturing
August 2026.
11,059,894
Aug-16/4.28
501,478
Option on an interest rate swap with Barclay’s Bank,
PLC for the obligation to pay a fixed rate of 2.4275%
versus the three month USD-LIBOR-BBA maturing
April 2022.
9,756,000
Apr-12/2.4275
128,682
Option on an interest rate swap with Barclay’s Bank,
PLC for the obligation to pay a fixed rate of 2.73%
versus the three month USD-LIBOR-BBA maturing
August 2022.
5,475,900
Aug-12/2.73
214,765
Option on an interest rate swap with Barclay’s Bank,
PLC for the obligation to pay a fixed rate of 2.111%
versus the three month USD-LIBOR-BBA maturing
April 2022.
1,830,000
Apr-12/2.111
2,544
Option on an interest rate swap with Barclay’s Bank,
PLC for the obligation to pay a fixed rate of 2.183%
versus the three month USD-LIBOR-BBA maturing
June 2022.
1,212,000
Jun-12/2.183
9,526
59
WRITTEN OPTIONS OUTSTANDING at 3/31/12 (premiums received $28,777,407) (Unaudited) cont.
Contract
Expiration date/
amount
strike price
Value
Option on an interest rate swap with Barclay’s Bank,
PLC for the obligation to pay a fixed rate of 4.39%
versus the three month USD-LIBOR-BBA maturing
June 2021.
$547,769
Jun-16/4.39
$40,224
Option on an interest rate swap with Barclay’s Bank,
PLC for the obligation to pay a fixed rate of 4.67%
versus the three month USD-LIBOR-BBA maturing
July 2026.
6,554,860
Jul-16/4.67
847,085
Option on an interest rate swap with Barclay’s Bank,
PLC for the obligation to pay a fixed rate of 4.68%
versus the three month USD-LIBOR-BBA maturing
August 2026.
7,865,832
Aug-16/4.68
1,020,898
Option on an interest rate swap with Barclay’s Bank,
PLC for the obligation to pay a fixed rate of 4.80%
versus the three month USD-LIBOR-BBA maturing
July 2026.
2,621,944
Jul-16/4.80
360,155
Option on an interest rate swap with Barclay’s Bank,
PLC for the obligation to receive a fixed rate of 2.73%
versus the three month USD-LIBOR-BBA maturing
August 2022.
5,475,900
Aug-12/2.73
58,209
Option on an interest rate swap with Barclay’s Bank,
PLC for the obligation to receive a fixed rate of 4.67%
versus the three month USD-LIBOR-BBA maturing
July 2026.
6,554,860
Jul-16/4.67
241,193
Option on an interest rate swap with Barclay’s Bank,
PLC for the obligation to receive a fixed rate of 4.68%
versus the three month USD-LIBOR-BBA maturing
August 2026.
7,865,832
Aug-16/4.68
288,007
Option on an interest rate swap with Barclay’s Bank,
PLC for the obligation to receive a fixed rate of 4.80%
versus the three month USD-LIBOR-BBA maturing
July 2026.
2,621,944
Jul-16/4.80
89,768
Option on an interest rate swap with Barclay’s Bank,
PLC for the obligation to receive a fixed rate of 4.89%
versus the three month USD-LIBOR-BBA maturing
June 2021.
547,769
Jun-16/4.89
8,847
Option on an interest rate swap with Citibank, N.A. for
the obligation to pay a fixed rate of 2.111% versus the
three month USD-LIBOR-BBA maturing April 2022.
1,830,000
Apr-12/2.111
2,544
Option on an interest rate swap with Citibank, N.A. for
the obligation to pay a fixed rate of 2.1714% versus the
three month USD-LIBOR-BBA maturing July 2022.
1,237,000
Jul-12/2.1714
11,294
Option on an interest rate swap with Citibank, N.A. for
the obligation to pay a fixed rate of 2.4275% versus the
three month USD-LIBOR-BBA maturing April 2022.
9,756,000
Apr-12/2.4275
128,682
Option on an interest rate swap with Citibank, N.A. for
the obligation to pay a fixed rate of 2.6075% versus the
three month USD-LIBOR-BBA maturing July 2022.
10,137,000
Jul-12/2.6075
310,091
Option on an interest rate swap with Citibank, N.A. for
the obligation to pay a fixed rate of 4.11% versus the
three month USD-LIBOR-BBA maturing May 2021.
10,072,118
May-16/4.11
645,099
Option on an interest rate swap with Citibank, N.A. for
the obligation to pay a fixed rate of 4.12% versus the
three month USD-LIBOR-BBA maturing June 2021.
556,661
Jun-16/4.12
35,808
60
WRITTEN OPTIONS OUTSTANDING at 3/31/12 (premiums received $28,777,407) (Unaudited) cont.
Contract
Expiration date/
amount
strike price
Value
Option on an interest rate swap with Citibank, N.A. for
the obligation to pay a fixed rate of 4.61% versus the
three month USD-LIBOR-BBA maturing June 2021.
$1,659,222
Jun-16/4.61
$133,606
Option on an interest rate swap with Citibank, N.A. for
the obligation to pay a fixed rate of 4.705% versus the
three month USD-LIBOR-BBA maturing May 2021.
24,507,428
May-16/4.705
2,085,313
Option on an interest rate swap with Citibank, N.A. for
the obligation to pay a fixed rate of 4.86% versus the
three month USD-LIBOR-BBA maturing June 2026.
3,945,779
Jun-16/4.86
559,614
Option on an interest rate swap with Citibank, N.A. for
the obligation to receive a fixed rate of 4.61% versus the
three month USD-LIBOR-BBA maturing June 2021.
1,659,222
Jun-16/4.61
30,999
Option on an interest rate swap with Citibank, N.A. for
the obligation to receive a fixed rate of 4.705% versus
the three month USD-LIBOR-BBA maturing May 2021.
24,507,428
May-16/4.705
421,969
Option on an interest rate swap with Citibank, N.A. for
the obligation to receive a fixed rate of 5.11% versus the
three month USD-LIBOR-BBA maturing May 2021.
10,072,118
May-16/5.11
146,710
Option on an interest rate swap with Citibank, N.A. for
the obligation to receive a fixed rate of 5.12% versus the
three month USD-LIBOR-BBA maturing June 2021.
556,661
Jun-16/5.12
8,112
Option on an interest rate swap with Citibank, N.A. for
the obligation to receive a fixed rate of 5.86% versus the
three month USD-LIBOR-BBA maturing June 2026.
3,945,779
Jun-16/5.86
77,475
Option on an interest rate swap with Credit Suisse
International for the obligation to pay a fixed rate of
2.1714% versus the three month USD-LIBOR-BBA
maturing July 2022.
1,237,000
Jul-12/2.1714
11,294
Option on an interest rate swap with Credit Suisse
International for the obligation to pay a fixed rate
of 2.324% versus the three month USD-LIBOR-BBA
maturing May 2022.
5,156,000
May-12/2.324
53,622
Option on an interest rate swap with Credit Suisse
International for the obligation to pay a fixed rate
of 2.346% versus the three month USD-LIBOR-BBA
maturing June 2022.
5,156,000
Jun-12/2.346
71,256
Option on an interest rate swap with Credit Suisse
International for the obligation to pay a fixed rate
of 2.372% versus the three month USD-LIBOR-BBA
maturing July 2022.
5,156,000
Jul-12/2.372
86,518
Option on an interest rate swap with Credit Suisse
International for the obligation to pay a fixed rate
of 2.394% versus the three month USD-LIBOR-BBA
maturing August 2022.
5,156,000
Aug-12/2.394
98,789
Option on an interest rate swap with Credit Suisse
International for the obligation to pay a fixed rate
of 2.419% versus the three month USD-LIBOR-BBA
maturing September 2022.
5,156,000
Sep-12/2.419
110,029
Option on an interest rate swap with Credit Suisse
International for the obligation to pay a fixed rate of
2.4275% versus the three month USD-LIBOR-BBA
maturing April 2022.
9,756,000
Apr-12/2.4275
128,682
61
WRITTEN OPTIONS OUTSTANDING at 3/31/12 (premiums received $28,777,407) (Unaudited) cont.
Contract
Expiration date/
amount
strike price
Value
Option on an interest rate swap with Credit Suisse
International for the obligation to pay a fixed rate
of 2.443% versus the three month USD-LIBOR-BBA
maturing October 2022.
$5,156,000
Oct-12/2.443
$120,444
Option on an interest rate swap with Credit Suisse
International for the obligation to pay a fixed rate of
2.4475% versus the three month USD-LIBOR-BBA
maturing August 2022.
13,017,000
Aug-12/2.4475
289,889
Option on an interest rate swap with Credit Suisse
International for the obligation to pay a fixed rate of
2.6075% versus the three month USD-LIBOR-BBA
maturing July 2022.
10,137,000
Jul-12/2.6075
310,091
Option on an interest rate swap with Credit Suisse
International for the obligation to pay a fixed rate
of 2.855% versus the three month USD-LIBOR-BBA
maturing August 2022.
26,365,900
Aug-12/2.855
1,268,463
Option on an interest rate swap with Credit Suisse
International for the obligation to receive a fixed rate
of 2.855% versus the three month USD-LIBOR-BBA
maturing August 2022.
26,365,900
Aug-12/2.855
216,728
Option on an interest rate swap with Deutsche Bank AG
for the obligation to pay a fixed rate of 2.111% versus
the three month USD-LIBOR-BBA maturing April 2022.
1,830,000
Apr-12/2.111
2,544
Option on an interest rate swap with Deutsche Bank AG
for the obligation to pay a fixed rate of 2.1714% versus
the three month USD-LIBOR-BBA maturing July 2022.
1,237,000
Jul-12/2.1714
11,294
Option on an interest rate swap with Deutsche Bank AG
for the obligation to pay a fixed rate of 2.183% versus
the three month USD-LIBOR-BBA maturing June 2022.
1,212,000
Jun-12/2.183
9,526
Option on an interest rate swap with Deutsche Bank AG
for the obligation to pay a fixed rate of 2.4275% versus
the three month USD-LIBOR-BBA maturing April 2022.
9,756,000
Apr-12/2.4275
128,682
Option on an interest rate swap with Deutsche Bank AG
for the obligation to pay a fixed rate of 2.498% versus
the three month USD-LIBOR-BBA maturing April 2022.
9,756,000
Apr-12/2.498
184,291
Option on an interest rate swap with Deutsche Bank AG
for the obligation to pay a fixed rate of 4.60% versus the
three month USD-LIBOR-BBA maturing May 2021.
10,187,746
May-16/4.60
823,852
Option on an interest rate swap with Deutsche Bank AG
for the obligation to pay a fixed rate of 4.765% versus
the three month USD-LIBOR-BBA maturing May 2021.
18,914,561
May-16/4.765
1,648,196
Option on an interest rate swap with Deutsche Bank AG
for the obligation to receive a fixed rate of 4.60% versus
the three month USD-LIBOR-BBA maturing May 2021.
10,187,746
May-16/4.60
187,179
Option on an interest rate swap with Deutsche Bank
AG for the obligation to receive a fixed rate of 4.765%
versus the three month USD-LIBOR-BBA maturing
May 2021.
18,914,561
May-16/4.765
318,937
Option on an interest rate swap with Goldman Sachs
International for the obligation to pay a fixed rate
of 2.111% versus the three month USD-LIBOR-BBA
maturing April 2022.
1,830,000
Apr-12/2.111
2,544
62
WRITTEN OPTIONS OUTSTANDING at 3/31/12 (premiums received $28,777,407) (Unaudited) cont.
Contract
Expiration date/
amount
strike price
Value
Option on an interest rate swap with Goldman Sachs
International for the obligation to pay a fixed rate of
2.1714% versus the three month USD-LIBOR-BBA
maturing July 2022.
$1,237,000
Jul-12/2.1714
$11,294
Option on an interest rate swap with Goldman Sachs
International for the obligation to pay a fixed rate
of 2.183% versus the three month USD-LIBOR-BBA
maturing June 2022.
1,212,000
Jun-12/2.183
9,526
Option on an interest rate swap with Goldman Sachs
International for the obligation to pay a fixed rate
of 2.32% versus the three month USD-LIBOR-BBA
maturing November 2022.
1,444,000
Nov-12/2.32
26,728
Option on an interest rate swap with Goldman Sachs
International for the obligation to pay a fixed rate
of 2.335% versus the three month USD-LIBOR-BBA
maturing November 2022.
1,444,000
Nov-12/2.335
27,826
Option on an interest rate swap with Goldman Sachs
International for the obligation to pay a fixed rate
of 2.345% versus the three month USD-LIBOR-BBA
maturing December 2022.
1,444,000
Dec-12/2.345
28,851
Option on an interest rate swap with Goldman Sachs
International for the obligation to pay a fixed rate
of 2.355% versus the three month USD-LIBOR-BBA
maturing December 2022.
1,444,000
Dec-12/2.355
29,847
Option on an interest rate swap with Goldman Sachs
International for the obligation to pay a fixed rate of
2.3625% versus the three month USD-LIBOR-BBA
maturing January 2023.
1,444,000
Jan-13/2.3625
30,425
Option on an interest rate swap with Goldman Sachs
International for the obligation to pay a fixed rate of
2.4275% versus the three month USD-LIBOR-BBA
maturing April 2022.
9,756,000
Apr-12/2.4275
128,682
Option on an interest rate swap with Goldman Sachs
International for the obligation to pay a fixed rate
of 2.498% versus the three month USD-LIBOR-BBA
maturing April 2022.
9,756,000
Apr-12/2.498
184,291
Option on an interest rate swap with Goldman Sachs
International for the obligation to pay a fixed rate
of 2.60% versus the three month USD-LIBOR-BBA
maturing April 2022.
1,979,000
Apr-12/2.60
54,977
Option on an interest rate swap with Goldman Sachs
International for the obligation to pay a fixed rate of
2.61875% versus the three month USD-LIBOR-BBA
maturing July 2022.
10,137,000
Jul-12/2.61875
316,781
Option on an interest rate swap with Goldman Sachs
International for the obligation to pay a fixed rate of
2.6825% versus the three month USD-LIBOR-BBA
maturing July 2022.
1,439,000
Jul-12/2.6825
51,646
Option on an interest rate swap with Goldman Sachs
International for the obligation to pay a fixed rate
of 3.49% versus the three month USD-LIBOR-BBA
maturing September 2026.
526,562
Sep-16/3.49
32,678
63
WRITTEN OPTIONS OUTSTANDING at 3/31/12 (premiums received $28,777,407) (Unaudited) cont.
Contract
Expiration date/
amount
strike price
Value
Option on an interest rate swap with Goldman Sachs
International for the obligation to pay a fixed rate
of 4.36% versus the three month USD-LIBOR-BBA
maturing May 2021.
$10,238,704
May-16/4.36
$741,876
Option on an interest rate swap with Goldman Sachs
International for the obligation to receive a fixed rate
of 3.49% versus the three month USD-LIBOR-BBA
maturing September 2026.
526,562
Sep-16/3.49
36,206
Option on an interest rate swap with Goldman Sachs
International for the obligation to receive a fixed rate
of 4.86% versus the three month USD-LIBOR-BBA
maturing May 2021.
10,238,704
May-16/4.86
166,840
Option on an interest rate swap with JPMorgan Chase
Bank N.A. for the obligation to pay a fixed rate of
2.111% versus the three month USD-LIBOR-BBA
maturing April 2022.
1,830,000
Apr-12/2.111
2,544
Option on an interest rate swap with JPMorgan Chase
Bank N.A. for the obligation to pay a fixed rate of
2.1714% versus the three month USD-LIBOR-BBA
maturing July 2022.
1,237,000
Jul-12/2.1714
11,294
Option on an interest rate swap with JPMorgan Chase
Bank N.A. for the obligation to pay a fixed rate of
2.183% versus the three month USD-LIBOR-BBA
maturing June 2022.
1,212,000
Jun-12/2.183
9,526
Option on an interest rate swap with JPMorgan Chase
Bank N.A. for the obligation to pay a fixed rate of
2.4275% versus the three month USD-LIBOR-BBA
maturing April 2022.
9,756,000
Apr-12/2.4275
128,682
Option on an interest rate swap with JPMorgan Chase
Bank N.A. for the obligation to pay a fixed rate of 4.04%
versus the three month USD-LIBOR-BBA maturing
September 2025.
14,963,000
Sep-15/4.04
1,480,903
Option on an interest rate swap with JPMorgan Chase
Bank N.A. for the obligation to pay a fixed rate of
4.375% versus the three month USD-LIBOR-BBA
maturing August 2045.
5,571,800
Aug-15/4.375
1,308,788
Option on an interest rate swap with JPMorgan Chase
Bank N.A. for the obligation to pay a fixed rate of 4.46%
versus the three month USD-LIBOR-BBA maturing
August 2045.
5,571,800
Aug-15/4.46
1,376,396
Option on an interest rate swap with JPMorgan Chase
Bank N.A. for the obligation to pay a fixed rate of
4.575% versus the three month USD-LIBOR-BBA
maturing June 2021.
544,291
Jun-16/4.575
43,496
Option on an interest rate swap with JPMorgan Chase
Bank N.A. for the obligation to pay a fixed rate of 4.74%
versus the three month USD-LIBOR-BBA maturing
July 2026.
6,572,614
Jul-16/4.74
879,173
Option on an interest rate swap with JPMorgan Chase
Bank N.A. for the obligation to pay a fixed rate of 4.79%
versus the three month USD-LIBOR-BBA maturing
July 2026.
3,686,784
Jul-16/4.79
504,787
64
WRITTEN OPTIONS OUTSTANDING at 3/31/12 (premiums received $28,777,407) (Unaudited) cont.
Contract
Expiration date/
amount
strike price
Value
Option on an interest rate swap with JPMorgan Chase
Bank N.A. for the obligation to pay a fixed rate of
4.8675% versus the three month USD-LIBOR-BBA
maturing April 2022.
$6,409,500
Apr-12/4.8675
$1,506,681
Option on an interest rate swap with JPMorgan Chase
Bank N.A. for the obligation to pay a fixed rate of 5.51%
versus the three month USD-LIBOR-BBA maturing
May 2022.
25,011,500
May-12/5.51
7,270,843
Option on an interest rate swap with JPMorgan Chase
Bank N.A. for the obligation to receive a fixed rate
of 4.04% versus the three month USD-LIBOR-BBA
maturing September 2025.
14,963,000
Sep-15/4.04
612,600
Option on an interest rate swap with JPMorgan Chase
Bank N.A. for the obligation to receive a fixed rate
of 4.375% versus the three month USD-LIBOR-BBA
maturing August 2045.
5,571,800
Aug-15/4.375
349,692
Option on an interest rate swap with JPMorgan Chase
Bank N.A. for the obligation to receive a fixed rate
of 4.46% versus the three month USD-LIBOR-BBA
maturing August 2045.
5,571,800
Aug-15/4.46
327,354
Option on an interest rate swap with JPMorgan Chase
Bank N.A. for the obligation to receive a fixed rate
of 4.575% versus the three month USD-LIBOR-BBA
maturing June 2021.
544,291
Jun-16/4.575
10,165
Option on an interest rate swap with JPMorgan Chase
Bank N.A. for the obligation to receive a fixed rate
of 4.74% versus the three month USD-LIBOR-BBA
maturing July 2026.
6,572,614
Jul-16/4.74
231,257
Option on an interest rate swap with JPMorgan Chase
Bank N.A. for the obligation to receive a fixed rate
of 4.79% versus the three month USD-LIBOR-BBA
maturing July 2026.
3,686,784
Jul-16/4.79
126,645
Option on an interest rate swap with JPMorgan Chase
Bank N.A. for the obligation to receive a fixed rate of
4.8675% versus the three month USD-LIBOR-BBA
maturing April 2022.
6,409,500
Apr-12/4.8675
6
Option on an interest rate swap with JPMorgan Chase
Bank N.A. for the obligation to receive a fixed rate
of 5.51% versus the three month USD-LIBOR-BBA
maturing May 2022.
25,011,500
May-12/5.51
25
Total
$36,680,927
TBA SALE COMMITMENTS OUTSTANDING at 3/31/12 (proceeds receivable $37,976,680) (Unaudited)
Principal
Settlement
Agency
amount
date
Value
Federal National Mortgage Association,
3 1/2s, April 1, 2042
$37,000,000
4/12/12
$37,994,375
Total
$37,994,375
65
INTEREST RATE SWAP CONTRACTS OUTSTANDING at 3/31/12 (Unaudited)
��
Upfront
Payments
Payments
Unrealized
Swap counterparty /
premium
Termination
made by
received by
appreciation/
Notional amount
received (paid)
date
fund per annum
fund per annum
(depreciation)
Bank of America N.A.
$142,217,000
$—
3/23/14
0.643%
3 month USD-
LIBOR-BBA
$(178,390)
37,918,000
—
3/23/17
1.4045%
3 month USD-
LIBOR-BBA
(259,115)
24,818,000
—
3/23/22
3 month USD-
LIBOR-BBA
2.388%
239,050
2,105,000
—
3/23/42
3 month USD-
LIBOR-BBA
3.0995%
22,019
6,550,000
—
3/29/22
2.24312%
3 month USD-
LIBOR-BBA
27,082
CAD
2,668,000
—
3/12/14
1.385%
3 month CAD-
BA-CDOR
376
CAD
10,348,000
—
3/12/17
1.756%
3 month CAD-
BA-CDOR
45,925
CAD
1,142,000
—
3/12/22
2.416%
3 month CAD-
BA-CDOR
14,041
Barclay’s Bank, PLC
$27,505,000
(68,763)
3/23/14
0.52%
3 month USD-
LIBOR-BBA
(35,674)
1,575,000 E
—
4/11/22
2.265%
3 month USD-
LIBOR-BBA
5,072
2,244,000 E
—
4/12/22
3 month USD-
LIBOR-BBA
2.4275%
25,986
7,014,000
—
3/14/14
3 month USD-
LIBOR-BBA
0.57%
(643)
500,000
—
3/14/17
3 month USD-
LIBOR-BBA
1.136%
(2,480)
1,066,000
—
3/14/42
3 month USD-
LIBOR-BBA
2.84%
(40,356)
1,280,000
—
3/14/22
3 month USD-
LIBOR-BBA
2.08%
(21,624)
5,471,000
—
3/14/17
3 month USD-
LIBOR-BBA
1.133%
(27,912)
6,377,000
—
3/14/22
2.078%
3 month USD-
LIBOR-BBA
108,903
587,000
—
3/14/42
2.834%
3 month USD-
LIBOR-BBA
22,937
2,553,000
—
3/14/22
3 month USD-
LIBOR-BBA
2.0975%
(39,026)
7,983,000
—
3/15/22
3 month USD-
LIBOR-BBA
2.145%
(95,719)
5,322,000
—
3/15/14
3 month USD-
LIBOR-BBA
0.595%
1,973
21,101,000
—
3/15/22
3 month USD-
LIBOR-BBA
2.18551%
(174,554)
193,726,000
—
3/15/14
3 month USD-
LIBOR-BBA
0.5965%
77,770
66
INTEREST RATE SWAP CONTRACTS OUTSTANDING at 3/31/12 (Unaudited) cont.
Upfront
Payments
Payments
Unrealized
Swap counterparty /
premium
Termination
made by
received by
appreciation/
Notional amount
received (paid)
date
fund per annum
fund per annum
(depreciation)
Barclay’s Bank, PLC cont.
$10,173,000
$—
3/15/17
3 month USD-
LIBOR-BBA
1.1815%
$(36,506)
3,551,000
—
3/15/42
3 month USD-
LIBOR-BBA
2.8737%
(123,065)
77,163,000
—
3/15/22
3 month USD-
LIBOR-BBA
2.1255%
(1,063,227)
2,291,000
—
3/19/14
3 month USD-
LIBOR-BBA
0.624%
2,101
693,000
—
3/19/17
3 month USD-
LIBOR-BBA
1.324%
2,149
3,276,000
—
3/19/22
2.33%
3 month USD-
LIBOR-BBA
(15,023)
160,000
—
3/19/42
3.083%
3 month USD-
LIBOR-BBA
(1,188)
190,000
—
3/19/19
3 month USD-
LIBOR-BBA
1.835%
868
3,759,000
—
3/20/14
3 month USD-
LIBOR-BBA
0.6362%
4,347
4,260,000
—
3/20/17
1.37%
3 month USD-
LIBOR-BBA
(22,666)
11,221,000
—
3/20/22
3 month USD-
LIBOR-BBA
2.3975%
120,342
8,799,000
—
3/20/14
3 month USD-
LIBOR-BBA
0.642%
11,160
2,854,000
—
3/20/17
3 month USD-
LIBOR-BBA
1.386%
17,397
12,626,000
—
3/20/22
2.405%
3 month USD-
LIBOR-BBA
(144,151)
599,000
—
3/20/42
3.151%
3 month USD-
LIBOR-BBA
(12,648)
1,088,000
—
3/22/22
2.4425%
3 month USD-
LIBOR-BBA
(16,014)
7,551,000
—
3/22/14
0.66125%
3 month USD-
LIBOR-BBA
(12,260)
2,420,000
—
3/22/22
3 month USD-
LIBOR-BBA
2.44125%
35,353
365,000
—
3/23/14
3 month USD-
LIBOR-BBA
0.639%
428
549,000
—
3/26/14
0.6275%
3 month USD-
LIBOR-BBA
(504)
7,065,000
—
3/26/14
0.62625%
3 month USD-
LIBOR-BBA
(6,274)
1,405,000
—
3/26/22
2.355%
3 month USD-
LIBOR-BBA
(8,779)
3,274,000
—
4/02/22
2.2325%
3 month USD-
LIBOR-BBA
18,138
8,293,000
—
4/03/22
3 month USD-
LIBOR-BBA
2.30%
5,059
67
INTEREST RATE SWAP CONTRACTS OUTSTANDING at 3/31/12 (Unaudited) cont.
Upfront
Payments
Payments
Unrealized
Swap counterparty /
premium
Termination
made by
received by
appreciation/
Notional amount
received (paid)
date
fund per annum
fund per annum
(depreciation)
Barclay’s Bank, PLC cont.
AUD
5,514,000
$—
3/20/17
6 month AUD-
BBR-BBSW
4.52%
$33,308
AUD
4,041,000
—
3/20/22
4.82%
6 month AUD-
BBR-BBSW
(17,422)
AUD
5,702,000
—
3/20/14
4.205%
3 month AUD-
BBR-BBSW
(23,138)
AUD
2,342,000
—
3/20/22
4.82%
6 month AUD-
BBR-BBSW
(10,097)
AUD
14,898,000
—
3/20/17
4.52%
6 month AUD-
BBR-BBSW
(89,993)
AUD
5,350,000
—
3/16/17
6 month AUD-
BBR-BBSW
4.71%
79,581
AUD
2,209,000
—
3/16/22
6 month AUD-
BBR-BBSW
5.0175%
45,502
EUR
15,485,000
—
3/23/14
6 month EUR-
EURIBOR-
REUTERS
1.105%
8,982
EUR
15,486,000
—
3/23/17
1.66%
6 month EUR-
EURIBOR-
REUTERS
(80,276)
EUR
6,022,000
—
3/23/22
2.375%
6 month EUR-
EURIBOR-
REUTERS
(58,751)
EUR
1,032,000
—
3/23/42
6 month EUR-
EURIBOR-
REUTERS
2.635%
22,163
EUR
6,106,000
—
3/28/14
1.097%
6 month EUR-
EURIBOR-
REUTERS
(3,249)
EUR
1,792,000
—
3/28/22
6 month EUR-
EURIBOR-
REUTERS
2.375%
17,029
EUR
6,709,000
—
3/28/17
6 month EUR-
EURIBOR-
REUTERS
1.643%
26,525
EUR
508,000
—
3/28/42
2.627%
6 month EUR-
EURIBOR-
REUTERS
(9,700)
GBP
3,460,000
—
1/23/22
2.4275%
6 month GBP-
LIBOR-BBA
(6,519)
GBP
902,000
—
2/17/17
6 month GBP-
LIBOR-BBA
1.6575%
4,778
GBP
463,000
—
2/17/22
6 month GBP-
LIBOR-BBA
2.48%
3,883
GBP
6,110,000
—
8/8/21
2.9785%
6 month GBP-
LIBOR-BBA
(541,598)
GBP
2,735,000
—
8/15/31
3.6%
6 month GBP-
LIBOR-BBA
(361,756)
68
INTEREST RATE SWAP CONTRACTS OUTSTANDING at 3/31/12 (Unaudited) cont.
Upfront
Payments
Payments
Unrealized
Swap counterparty /
premium
Termination
made by
received by
appreciation/
Notional amount
received (paid)
date
fund per annum
fund per annum
(depreciation)
Barclay’s Bank, PLC cont.
GBP
9,240,000 E
$—
2/3/31
6 month GBP-
LIBOR-BBA
4.86%
$857,352
GBP
10,640,000
—
3/20/14
6 month GBP-
LIBOR-BBA
1.2925%
20,077
GBP
820,000
—
3/20/42
6 month GBP-
LIBOR-BBA
3.3325%
26,791
GBP
3,356,000
—
3/26/17
6 month GBP-
LIBOR-BBA
1.7005%
23,874
GBP
10,845,000
—
3/26/14
1.2825%
6 month GBP-
LIBOR-BBA
(17,156)
JPY
1,310,457,000
—
2/13/17
6 month JPY-
LIBOR-BBA
0.48%
3,921
JPY
655,228,500
—
2/16/17
6 month JPY-
LIBOR-BBA
0.4675%
(2,701)
JPY
1,310,457,000
—
2/17/17
6 month JPY-
LIBOR-BBA
0.44125%
(26,074)
JPY
5,127,900,000
—
3/6/14
6 month JPY-
LIBOR-BBA
0.34375%
(4,814)
JPY
2,070,900,000
—
3/6/17
0.4725%
6 month JPY-
LIBOR-BBA
8,653
JPY
3,997,900,000
—
3/30/14
0.3525%
6 month JPY-
LIBOR-BBA
(3,171)
JPY
532,800,000
—
3/30/17
0.4925%
6 month JPY-
LIBOR-BBA
(1,985)
JPY
373,000,000
—
3/30/22
6 month JPY-
LIBOR-BBA
1.04375%
3,915
JPY
206,000,000
—
3/30/42
6 month JPY-
LIBOR-BBA
1.9175%
6,612
Citibank, N.A.
$893,000 E
—
10/7/21
3 month USD-
LIBOR-BBA
3.0625%
(10,002)
2,244,000 E
—
4/12/22
3 month USD-
LIBOR-BBA
2.4275%
25,986
15,812,000
—
3/23/14
3 month USD-
LIBOR-BBA
0.646%
20,793
8,099,000
—
3/23/17
1.4259%
3 month USD-
LIBOR-BBA
(63,807)
8,976,000
—
3/23/22
2.4285%
3 month USD-
LIBOR-BBA
(119,840)
5,000
—
3/23/42
3 month USD-
LIBOR-BBA
3.1348%
88
231,000
—
3/23/14
3 month USD-
LIBOR-BBA
0.643%
290
30,000
—
3/23/17
1.412%
3 month USD-
LIBOR-BBA
(216)
69
INTEREST RATE SWAP CONTRACTS OUTSTANDING at 3/31/12 (Unaudited) cont.
Upfront
Payments
Payments
Unrealized
Swap counterparty /
premium
Termination
made by
received by
appreciation/
Notional amount
received (paid)
date
fund per annum
fund per annum
(depreciation)
Citibank, N.A. cont.
$119,000
$—
3/23/22
2.407%
3 month USD-
LIBOR-BBA
$(1,354)
3,274,000
—
3/30/22
2.248%
3 month USD-
LIBOR-BBA
12,289
Credit Suisse International
2,244,000 E
—
4/12/22
3 month USD-
LIBOR-BBA
2.4275%
25,986
1,119,000 E
—
8/17/22
3 month USD-
LIBOR-BBA
2.4475%
3,032
115,578,000
—
3/19/14
3 month USD-
LIBOR-BBA
0.651%
168,277
10,124,000
—
3/19/17
3 month USD-
LIBOR-BBA
1.377%
57,585
23,452,000
—
3/19/42
3 month USD-
LIBOR-BBA
3.1405%
447,131
20,180,000
—
3/19/22
2.388%
3 month USD-
LIBOR-BBA
(200,084)
1,980,000
—
3/19/42
3.075%
3 month USD-
LIBOR-BBA
(11,512)
6,556,000
—
3/19/22
2.35125%
3 month USD-
LIBOR-BBA
(42,828)
37,579,000
—
3/20/14
3 month USD-
LIBOR-BBA
0.64%
46,135
15,594,000
—
3/20/17
1.38625%
3 month USD-
LIBOR-BBA
(95,212)
4,882,000
—
3/20/22
2.406%
3 month USD-
LIBOR-BBA
(56,179)
2,417,000
—
3/20/42
3 month USD-
LIBOR-BBA
3.14%
45,637
6,556,000
—
3/20/22
2.383%
3 month USD-
LIBOR-BBA
(61,628)
6,054,000
—
3/22/14
3 month USD-
LIBOR-BBA
0.65125%
8,603
3,545,000
—
3/22/17
3 month USD-
LIBOR-BBA
1.4425%
30,979
2,929,000
—
3/22/22
3 month USD-
LIBOR-BBA
2.4425%
43,112
238,000
—
3/22/42
3.17%
3 month USD-
LIBOR-BBA
(5,903)
2,517,000
—
3/22/22
2.47125%
3 month USD-
LIBOR-BBA
(43,685)
7,551,000
—
3/22/14
3 month USD-
LIBOR-BBA
0.6675%
13,178
5,483,000
—
3/27/22
2.311%
3 month USD-
LIBOR-BBA
(12,014)
47,304,000
—
3/28/14
0.6075%
3 month USD-
LIBOR-BBA
(23,563)
70
INTEREST RATE SWAP CONTRACTS OUTSTANDING at 3/31/12 (Unaudited) cont.
Upfront
Payments
Payments
Unrealized
Swap counterparty /
premium
Termination
made by
received by
appreciation/
Notional amount
received (paid)
date
fund per annum
fund per annum
(depreciation)
Credit Suisse International cont.
$5,820,000
$—
3/28/22
3 month USD-
LIBOR-BBA
2.358%
$37,562
8,120,000
—
3/28/17
3 month USD-
LIBOR-BBA
1.356%
33,783
1,810,000
—
3/28/42
3.085%
3 month USD-
LIBOR-BBA
(12,950)
CAD
1,876,000
—
3/12/22
2.416%
3 month CAD-
BA-CDOR
23,066
CAD
3,361,000
—
3/12/17
3 month CAD-
BA-CDOR
1.756%
(14,916)
CAD
4,131,000
—
3/20/17
2.04125%
3 month CAD-
BA-CDOR
(37,156)
CAD
2,822,000
—
3/21/22
3 month CAD-
BA-CDOR
2.695%
34,708
CHF
38,240,000
—
3/14/14
6 month CHF-
LIBOR-BBA
0.17%
(18,905)
CHF
8,121,000
—
3/14/17
6 month CHF-
LIBOR-BBA
0.43%
(23,407)
CHF
10,627,000
—
3/19/14
0.2575%
6 month CHF-
LIBOR-BBA
(14,864)
CHF
5,263,000
—
3/19/17
0.5525%
6 month CHF-
LIBOR-BBA
(19,760)
CHF
4,393,000
—
3/19/22
6 month CHF-
LIBOR-BBA
1.1675%
22,784
CHF
18,631,000
—
3/22/14
6 month CHF-
LIBOR-BBA
0.2275%
12,777
CHF
1,080,000
—
3/22/22
1.2275%
6 month CHF-
LIBOR-BBA
(12,592)
CHF
927,000
—
3/22/17
6 month CHF-
LIBOR-BBA
0.58%
4,814
CHF
5,140,000
—
3/27/22
6 month CHF-
LIBOR-BBA
1.1275%
(783)
CHF
2,588,000
—
3/29/22
6 month CHF-
LIBOR-BBA
1.15%
7,047
GBP
6,112,000
—
8/15/21
6 month GBP-
LIBOR-BBA
2.91%
478,583
GBP
1,842,000
—
3/21/22
2.60%
6 month GBP-
LIBOR-BBA
(42,024)
MXN
33,670,000
—
7/21/20
1 month MXN-
TIIE-BANXICO
6.895%
90,835
SEK
12,630,000
—
1/23/22
2.30%
3 month SEK-
STIBOR-SIDE
55,379
SEK
12,630,000
—
1/25/22
2.4275%
3 month SEK-
STIBOR-SIDE
33,978
SEK
12,630,000
—
2/20/22
3 month SEK-
STIBOR-SIDE
2.38%
(41,564)
SEK
6,484,000
—
2/23/22
2.545%
3 month SEK-
STIBOR-SIDE
7,139
71
INTEREST RATE SWAP CONTRACTS OUTSTANDING at 3/31/12 (Unaudited) cont.
Upfront
Payments
Payments
Unrealized
Swap counterparty /
premium
Termination
made by
received by
appreciation/
Notional amount
received (paid)
date
fund per annum
fund per annum
(depreciation)
Credit Suisse International cont.
SEK
8,432,000
$—
2/24/22
2.5375%
3 month SEK-
STIBOR-SIDE
$10,122
SEK
14,420,000
—
3/1/14
1.9675%
3 month SEK-
STIBOR-SIDE
7,372
SEK
1,470,000
—
3/1/17
2.165%
3 month SEK-
STIBOR-SIDE
1,713
SEK
21,185,000
—
3/6/22
3 month SEK-
STIBOR-SIDE
2.475%
(43,407)
SEK
17,135,000
—
3/13/22
2.43%
3 month SEK-
STIBOR-SIDE
45,159
SEK
30,084,000
—
3/22/14
3 month SEK-
STIBOR-SIDE
2.03%
(9,016)
SEK
11,325,000
—
3/22/17
2.33%
3 month SEK-
STIBOR-SIDE
169
SEK
13,132,000
—
3/22/22
2.72%
3 month SEK-
STIBOR-SIDE
(15,497)
Deutsche Bank AG
$452,000 E
—
10/7/21
3 month USD-
LIBOR-BBA
3.0475%
(5,356)
2,244,000 E
—
4/12/22
3 month USD-
LIBOR-BBA
2.4275%
25,986
1,823,000 E
—
4/13/22
3 month USD-
LIBOR-BBA
2.498%
32,741
9,227,000
—
3/01/14
0.5815%
3 month USD-
LIBOR-BBA
(1,234)
416,839,000
—
3/05/14
0.567%
3 month USD-
LIBOR-BBA
57,222
79,995,000
—
3/05/17
1.1673%
3 month USD-
LIBOR-BBA
301,319
6,507,000
—
3/05/22
2.133%
3 month USD-
LIBOR-BBA
80,422
5,993,000
—
3/05/42
2.856%
3 month USD-
LIBOR-BBA
224,960
1,790,000
—
3/06/22
2.064%
3 month USD-
LIBOR-BBA
33,527
3,234,000
—
3/06/17
3 month USD-
LIBOR-BBA
1.09%
(24,438)
4,485,000
—
3/06/42
2.807%
3 month USD-
LIBOR-BBA
213,146
3,450,000
—
3/07/17
3 month USD-
LIBOR-BBA
1.106%
(23,537)
1,854,000
—
3/07/22
2.061%
3 month USD-
LIBOR-BBA
35,310
4,765,000
—
3/07/42
2.79%
3 month USD-
LIBOR-BBA
243,156
11,037,700
—
3/12/22
3 month USD-
LIBOR-BBA
2.092%
(184,097)
72
INTEREST RATE SWAP CONTRACTS OUTSTANDING at 3/31/12 (Unaudited) cont.
Upfront
Payments
Payments
Unrealized
Swap counterparty /
premium
Termination
made by
received by
appreciation/
Notional amount
received (paid)
date
fund per annum
fund per annum
(depreciation)
Deutsche Bank AG cont.
$13,617,000
$—
3/19/22
2.335%
3 month USD-
LIBOR-BBA
$(68,729)
659,000
—
3/26/22
2.34%
3 month USD-
LIBOR-BBA
(3,207)
2,438,000
—
4/03/17
3 month USD-
LIBOR-BBA
1.291%
1,609
EUR
23,640,000
—
12/23/20
3.325%
6 month EUR-
EURIBOR-
REUTERS
(3,105,488)
MXN
33,670,000
—
7/17/20
1 month MXN-
TIIE-BANXICO
6.95%
101,295
Goldman Sachs International
$7,744,000
(215,089)
3/26/22
2.075%
3 month USD-
LIBOR-BBA
(64,463)
2,244,000 E
—
4/12/22
3 month USD-
LIBOR-BBA
2.4275%
25,986
1,823,000 E
—
4/13/22
3 month USD-
LIBOR-BBA
2.498%
32,741
16,594,900
—
2/22/14
1 month USD-
FEDERAL
FUNDS-H.15
0.1925%
(9,335)
4,472,000
—
2/23/14
0.19625%
1 month USD-
FEDERAL
FUNDS-H.15
2,123
24,860,000
—
3/20/14
3 month USD-
LIBOR-BBA
0.625%
22,873
9,085,000
—
3/20/17
1.365%
3 month USD-
LIBOR-BBA
(46,054)
3,615,000
—
3/20/22
2.3825%
3 month USD-
LIBOR-BBA
(33,801)
5,246,000
—
3/20/42
3 month USD-
LIBOR-BBA
3.1285%
86,864
6,556,000
—
3/21/22
3 month USD-
LIBOR-BBA
2.405%
74,498
58,015,000
—
3/22/14
3 month USD-
LIBOR-BBA
0.6345%
62,013
27,000,000
—
3/22/22
2.413%
3 month USD-
LIBOR-BBA
(324,312)
35,772,000
—
3/22/17
1.4097%
3 month USD-
LIBOR-BBA
(255,438)
11,394,000
—
3/22/42
3.1405%
3 month USD-
LIBOR-BBA
(214,588)
6,549,000
—
3/30/22
3 month USD-
LIBOR-BBA
2.273125%
(9,515)
6,548,000
—
4/03/22
3 month USD-
LIBOR-BBA
2.245%
(29,597)
AUD
2,280,000
—
3/21/22
5.0175%
6 month AUD-
BBR-BBSW
(43,146)
73
INTEREST RATE SWAP CONTRACTS OUTSTANDING at 3/31/12 (Unaudited) cont.
Upfront
Payments
Payments
Unrealized
Swap counterparty /
premium
Termination
made by
received by
appreciation/
Notional amount
received (paid)
date
fund per annum
fund per annum
(depreciation)
Goldman Sachs International cont.
CHF
11,547,000
$—
3/15/14
6 month CHF-
LIBOR-BBA
0.18%
$(3,288)
CHF
8,036,000
—
3/15/22
1.06%
6 month CHF-
LIBOR-BBA
51,072
CHF
4,286,000
—
3/26/17
6 month CHF-
LIBOR-BBA
0.575%
20,366
CHF
2,570,000
—
3/29/17
6 month CHF-
LIBOR-BBA
0.53%
5,545
EUR
23,000,000
—
9/29/12
1.56%
6 month EUR-
EURIBOR-
REUTERS
(303,806)
EUR
5,400,000
—
9/29/13
1.47%
6 month EUR-
EURIBOR-
REUTERS
(99,022)
EUR
20,400,000
—
9/29/15
6 month EUR-
EURIBOR-
REUTERS
1.775%
692,702
EUR
13,100,000
—
9/29/21
6 month EUR-
EURIBOR-
REUTERS
2.54%
677,630
EUR
2,306,000
—
3/23/22
2.385%
6 month EUR-
EURIBOR-
REUTERS
(25,303)
EUR
3,648,000
—
3/26/17
1.6275%
6 month EUR-
EURIBOR-
REUTERS
(10,701)
GBP
5,247,000 E
—
9/22/31
6 month GBP-
LIBOR-BBA
4.06%
30,801
GBP
2,735,000
—
9/23/31
6 month GBP-
LIBOR-BBA
3.1175%
28,009
GBP
4,961,000 E
—
9/23/31
3.99%
6 month GBP-
LIBOR-BBA
7,459
GBP
588,000
—
2/8/22
6 month GBP-
LIBOR-BBA
2.4825%
5,677
GBP
3,804,000
—
2/8/17
1.625%
6 month GBP-
LIBOR-BBA
(12,018)
GBP
1,188,000
—
2/8/42
6 month GBP-
LIBOR-BBA
3.145%
(32,541)
GBP
17,495,000
—
2/8/14
1 month GBP-
WMBA-SONIA-
COMPOUND
0.5175%
(8,230)
GBP
19,103,000
—
2/10/14
1 month GBP-
WMBA-SONIA-
COMPOUND
0.505%
(16,621)
GBP
4,763,000 E
—
8/9/31
4.605%
6 month GBP-
LIBOR-BBA
(302,985)
GBP
4,763,000 E
—
8/10/31
4.5175%
6 month GBP-
LIBOR-BBA
(258,721)
74
INTEREST RATE SWAP CONTRACTS OUTSTANDING at 3/31/12 (Unaudited) cont.
Upfront
Payments
Payments
Unrealized
Swap counterparty /
premium
Termination
made by
received by
appreciation/
Notional amount
received (paid)
date
fund per annum
fund per annum
(depreciation)
Goldman Sachs International cont.
GBP
360,000
$—
2/17/42
3.2075%
6 month GBP-
LIBOR-BBA
$1,710
GBP
7,946,600
—
2/17/14
0.5625%
1 month GBP-
WMBA-SONIA-
COMPOUND
(14,894)
GBP
8,720,000
—
2/21/14
0.558%
1 month GBP-
WMBA-SONIA-
COMPOUND
(6,306)
GBP
1,608,000
—
2/24/17
6 month GBP-
LIBOR-BBA
1.565%
(3,489)
GBP
551,000
—
2/24/22
6 month GBP-
LIBOR-BBA
2.39%
(3,022)
GBP
771,000
—
2/24/42
3.13125%
6 month GBP-
LIBOR-BBA
22,968
GBP
8,676,000
—
2/24/14
0.5125%
1 month GBP-
WMBA-SONIA-
COMPOUND
6,369
GBP
2,042,000
—
3/2/17
6 month GBP-
LIBOR-BBA
1.5475%
(7,886)
GBP
1,455,000
—
3/2/22
6 month GBP-
LIBOR-BBA
2.3975%
(7,230)
GBP
182,000
—
3/2/42
6 month GBP-
LIBOR-BBA
3.135%
(5,297)
GBP
2,473,000
—
3/2/14
1 month GBP-
WMBA-SONIA-
COMPOUND
0.54%
(269)
GBP
322,000
—
3/9/42
3.11%
6 month GBP-
LIBOR-BBA
12,119
GBP
406,000
—
3/14/42
6 month GBP-
LIBOR-BBA
3.2575%
3,733
GBP
2,289,000
—
3/14/17
1.6925%
6 month GBP-
LIBOR-BBA
(16,124)
GBP
16,996,000
—
3/16/14
6 month GBP-
LIBOR-BBA
1.31%
41,092
GBP
3,069,000
—
3/16/17
1.79%
6 month GBP-
LIBOR-BBA
(44,668)
GBP
1,741,000
—
3/16/22
2.67%
6 month GBP-
LIBOR-BBA
(58,458)
GBP
1,037,000
—
3/16/42
6 month GBP-
LIBOR-BBA
3.3875%
52,505
SEK
22,265,000
—
2/13/17
2.15%
3 month SEK-
STIBOR-SIDE
29,378
SEK
22,265,000
—
2/20/17
3 month SEK-
STIBOR-SIDE
1.995%
(52,820)
SEK
71,803,700
—
2/21/14
3 month SEK-
STIBOR-SIDE
1.895%
(52,872)
SEK
15,956,100
—
2/21/22
2.485%
3 month SEK-
STIBOR-SIDE
30,181
75
INTEREST RATE SWAP CONTRACTS OUTSTANDING at 3/31/12 (Unaudited) cont.
Upfront
Payments
Payments
Unrealized
Swap counterparty /
premium
Termination
made by
received by
appreciation/
Notional amount
received (paid)
date
fund per annum
fund per annum
(depreciation)
Goldman Sachs International cont.
SEK
21,688,000
$—
2/23/17
2.1575%
3 month SEK-
STIBOR-SIDE
$26,481
SEK
8,460,000
—
3/1/22
3 month SEK-
STIBOR-SIDE
2.5275%
(11,309)
SEK
17,038,000
—
3/6/17
3 month SEK-
STIBOR-SIDE
2.115%
(26,038)
SEK
17,136,000
—
3/29/22
3 month SEK-
STIBOR-SIDE
2.6325%
(2,623)
JPMorgan Chase Bank NA
$98,000
—
3/23/22
2.39%
3 month USD-
LIBOR-BBA
(962)
2,418,000
—
3/23/14
3 month USD-
LIBOR-BBA
0.639%
2,837
2,117,000
—
3/23/17
1.398%
3 month USD-
LIBOR-BBA
(13,786)
67,898,000
—
3/26/14
0.6275%
3 month USD-
LIBOR-BBA
(62,345)
50,812,000
—
3/26/17
3 month USD-
LIBOR-BBA
1.3425%
180,765
11,541,000
—
3/26/22
2.3245%
3 month USD-
LIBOR-BBA
(39,746)
10,695,000
—
3/26/42
3 month USD-
LIBOR-BBA
3.0525%
7,326
5,657,000
—
3/26/17
1.3575%
3 month USD-
LIBOR-BBA
(24,266)
CAD
30,837,000
—
3/13/14
1.4025%
3 month CAD-
BA-CDOR
(6,044)
CAD
636,000
—
3/13/22
2.43%
3 month CAD-
BA-CDOR
7,038
CAD
1,595,000
—
3/13/17
3 month CAD-
BA-CDOR
1.78%
(5,257)
CAD
3,540,000
—
3/13/17
1.8025%
3 month CAD-
BA-CDOR
7,863
CAD
5,761,000
—
3/22/17
3 month CAD-
BA-CDOR
1.98%
34,438
EUR
2,987,000
—
3/23/14
1 month EUR-
EONIA-OIS-
COMPOUND
0.506%
4,655
EUR
4,900,000
—
3/23/17
1 month EUR-
EONIA-OIS-
COMPOUND
1.147%
41,604
EUR
124,000
—
3/23/42
2.65%
6 month EUR-
EURIBOR-
REUTERS
(3,189)
GBP
1,645,000
—
3/7/17
6 month GBP-
LIBOR-BBA
1.54%
(7,536)
GBP
719,000
—
3/7/22
6 month GBP-
LIBOR-BBA
2.354%
(8,477)
76
INTEREST RATE SWAP CONTRACTS OUTSTANDING at 3/31/12 (Unaudited) cont.
Upfront
Payments
Payments
Unrealized
Swap counterparty /
premium
Termination
made by
received by
appreciation/
Notional amount
received (paid)
date
fund per annum
fund per annum
(depreciation)
JPMorgan Chase Bank NA cont.
JPY
853,120,000
$—
2/20/22
6 month JPY-
LIBOR-BBA
0.965%
$(50,516)
JPY
3,554,300,000
—
3/6/14
6 month JPY-
LIBOR-BBA
0.34375%
(3,337)
JPY
723,200,000
—
3/6/22
1.0175%
6 month JPY-
LIBOR-BBA
4,605
$2,244,000 E
—
4/12/22
3 month USD-
LIBOR-BBA
2.4275%
25,986
CAD
3,470,000
—
9/21/21
2.3911%
3 month CAD-
BA-CDOR
32,820
JPY
2,402,400,000
—
2/19/15
6 month JPY-
LIBOR-BBA
0.705%
290,070
JPY
511,900,000
—
2/19/20
6 month JPY-
LIBOR-BBA
1.3975%
298,158
JPY
358,600,000 E
—
7/28/29
6 month JPY-
LIBOR-BBA
2.67%
92,889
JPY
482,100,000 E
—
7/28/39
2.40%
6 month JPY-
LIBOR-BBA
26,735
MXN
19,054,000
—
9/11/20
6.82%
1 month MXN-
TIIE-BANXICO
(43,065)
MXN
24,639,000
—
9/14/20
6.82%
1 month MXN-
TIIE-BANXICO
(55,278)
MXN
4,810,000
—
7/16/20
1 month MXN-
TIIE-BANXICO
6.99%
15,500
MXN
24,320,000
—
7/30/20
6.3833%
1 month MXN-
TIIE-BANXICO
722
MXN
66,197,000
—
7/30/20
6.3833%
1 month MXN-
TIIE-BANXICO
1,966
MXN
24,320,000
—
8/19/20
1 month MXN-
TIIE-BANXICO
6.615%
28,839
MXN
37,740,000
—
11/4/20
1 month MXN-
TIIE-BANXICO
6.75%
68,867
UBS AG
CHF
28,420,000
—
5/23/13
0.7625%
6 month CHF-
LIBOR-BBA
(413,709)
Total
$(2,786,471)
E See Note 1 to the financial statements regarding extended effective dates.
77
TOTAL RETURN SWAP CONTRACTS OUTSTANDING at 3/31/12 (Unaudited)
Upfront
Fixed payments
Total return
Unrealized
Swap counterparty /
premium
Termination
received (paid) by
received by
appreciation/
Notional amount
received (paid)
date
fund per annum
or paid by fund
(depreciation)
Barclay’s Bank, PLC
$638,221
$—
1/12/40
5.00% (1 month
Synthetic MBX
$1,192
USD-LIBOR)
Index 5.00%
30 year Fannie Mae
pools
1,048,324
—
1/12/41
5.00% (1 month
Synthetic TRS
15,844
USD-LIBOR)
Index 5.00%
30 year Fannie Mae
pools
1,157,201
—
1/12/40
5.00% (1 month
Synthetic MBX
2,162
USD-LIBOR)
Index 5.00%
30 year Fannie Mae
pools
904,023
—
1/12/41
5.00% (1 month
Synthetic MBX
1,687
USD-LIBOR)
Index 5.00%
30 year Fannie Mae
pools
4,617,343
—
1/12/38
(6.50%) 1 month
Synthetic MBX
(7,926)
USD-LIBOR
Index 6.50%
30 year Fannie Mae
pools
4,032,546
—
1/12/38
(6.50%) 1 month
Synthetic MBX
(6,922)
USD-LIBOR
Index 6.50%
30 year Fannie Mae
pools
2,974,931
—
1/12/41
5.00% (1 month
Synthetic MBX
5,552
USD-LIBOR)
Index 5.00%
30 year Fannie Mae
pools
1,169,160
—
1/12/40
4.00% (1 month
Synthetic MBX
(2,995)
USD-LIBOR)
Index 4.00%
30 year Fannie Mae
pools
136,390
—
1/12/40
4.00% (1 month
Synthetic TRS
2,672
USD-LIBOR)
Index 4.00%
30 year Fannie Mae
pools
5,320,000
—
4/7/16
(2.63%)
USA Non Revised
(69,947)
Consumer Price
Index-Urban (CPI-U)
3,025,146
—
1/12/41
4.50% (1 month
Synthetic TRS
44,929
USD-LIBOR)
Index 4.50%
30 year Fannie Mae
pools
2,099,247
—
1/12/41
3.50% (1 month
Synthetic MBX
(7,566)
USD-LIBOR)
Index 3.50%
30 year Fannie Mae
pools
78
TOTAL RETURN SWAP CONTRACTS OUTSTANDING at 3/31/12 (Unaudited) cont.
Upfront
Fixed payments
Total return
Unrealized
Swap counterparty /
premium
Termination
received (paid) by
received by
appreciation/
Notional amount
received (paid)
date
fund per annum
or paid by fund
(depreciation)
Barclay’s Bank, PLC cont.
$974,137
$—
1/12/41
3.50% (1 month
Synthetic MBX
$(3,511)
USD-LIBOR)
Index 3.50%
30 year Fannie Mae
pools
1,540,483
—
1/12/41
4.50% (1 month
Synthetic TRS
22,881
USD-LIBOR)
Index 4.50%
30 year Fannie Mae
pools
2,180,090
—
1/12/41
4.50% (1 month
Synthetic MBX
3,843
USD-LIBOR)
Index 4.50%
30 year Fannie Mae
pools
2,300,690
—
1/12/41
5.00% (1 month
Synthetic MBX
3,932
USD-LIBOR)
Index 5.00%
30 year Ginnie Mae II
pools
2,340,009
—
1/12/41
5.00% (1 month
Synthetic MBX
4,367
USD-LIBOR)
Index 5.00%
30 year Fannie Mae
pools
3,365,009
—
1/12/38
(6.50%) 1 month
Synthetic MBX
(5,776)
USD-LIBOR
Index 6.50%
30 year Fannie Mae
pools
2,917,430
—
1/12/40
4.00% (1 month
Synthetic MBX
(7,472)
USD-LIBOR)
Index 4.00%
30 year Fannie Mae
pools
6,615,513
—
1/12/40
5.00% (1 month
Synthetic TRS
110,339
USD-LIBOR)
Index 5.00%
30 year Fannie Mae
pools
1,702,040
—
1/12/38
(6.50%) 1 month
Synthetic MBX
(2,922)
USD-LIBOR
Index 6.50%
30 year Fannie Mae
pools
1,187,768
(16,889)
1/12/41
4.00% (1 month
Synthetic TRS
2,494
USD-LIBOR)
Index 4.00%
30 year Fannie Mae
pools
4,457,004
—
1/12/40
4.50% (1 month
Synthetic MBX
5,771
USD-LIBOR)
Index 4.50%
30 year Fannie Mae
pools
12,822,469
—
1/12/41
5.00% (1 month
Synthetic MBX
23,931
USD-LIBOR)
Index 5.00%
30 year Fannie Mae
pools
79
TOTAL RETURN SWAP CONTRACTS OUTSTANDING at 3/31/12 (Unaudited) cont.
Upfront
Fixed payments
Total return
Unrealized
Swap counterparty /
premium
Termination
received (paid) by
received by
appreciation/
Notional amount
received (paid)
date
fund per annum
or paid by fund
(depreciation)
Barclay’s Bank, PLC cont.
$898,650
$7,863
1/12/41
3.50% (1 month
Synthetic MBX
$3,813
USD-LIBOR)
Index 3.50%
30 year Fannie Mae
pools
2,799,431
—
1/12/41
5.00% (1 month
Synthetic MBX
5,225
USD-LIBOR)
Index 5.00%
30 year Fannie Mae
pools
559,139
—
1/12/40
5.00% (1 month
Synthetic MBX
1,044
USD-LIBOR)
Index 5.00%
30 year Fannie Mae
pools
1,812,721
—
1/12/40
5.00% (1 month
Synthetic MBX
3,386
USD-LIBOR)
Index 5.00%
30 year Fannie Mae
pools
1,314,130
—
1/12/40
5.00% (1 month
Synthetic MBX
2,455
USD-LIBOR)
Index 5.00%
30 year Fannie Mae
pools
Citibank, N.A.
1,819,747
—
1/12/41
5.00% (1 month
Synthetic MBX
3,396
USD-LIBOR)
Index 5.00%
30 year Fannie Mae
pools
3,900,015
—
1/12/41
5.00% (1 month
Synthetic MBX
7,279
USD-LIBOR)
Index 5.00%
30 year Fannie Mae
pools
3,404,713
—
1/12/41
5.00% (1 month
Synthetic MBX
6,354
USD-LIBOR)
Index 5.00%
30 year Fannie Mae
pools
Credit Suisse International
801,640
—
1/12/41
4.50% (1 month
Synthetic MBX
1,413
USD-LIBOR)
Index 4.50%
30 year Fannie Mae
pools
1,560,006
—
1/12/41
5.00% (1 month
Synthetic MBX
2,912
USD-LIBOR)
Index 5.00%
30 year Fannie Mae
pools
1,296,213
—
1/12/40
5.00% (1 month
Synthetic TRS
21,619
USD-LIBOR)
Index 5.00%
30 year Fannie Mae
pools
2,042,959
—
1/12/38
(6.50%) 1 month
Synthetic MBX
(3,507)
USD-LIBOR
Index 6.50%
30 year Fannie Mae
pools
80
TOTAL RETURN SWAP CONTRACTS OUTSTANDING at 3/31/12 (Unaudited) cont.
Upfront
Fixed payments
Total return
Unrealized
Swap counterparty /
premium
Termination
received (paid) by
received by
appreciation/
Notional amount
received (paid)
date
fund per annum
or paid by fund
(depreciation)
Deutsche Bank AG
$2,042,959
$—
1/12/38
(6.50%) 1 month
Synthetic MBX
$(3,507)
USD-LIBOR
Index 6.50%
30 year Fannie Mae
pools
Goldman Sachs International
3,040,000
—
3/1/16
2.47%
USA Non Revised
9,485
Consumer Price
Index-Urban (CPI-U)
2,280,000
—
3/3/16
2.45%
USA Non Revised
4,854
Consumer Price
Index-Urban (CPI-U)
3,479,634
—
1/12/40
5.00% (1 month
Synthetic TRS
58,036
USD-LIBOR)
Index 5.00%
30 year Fannie Mae
pools
1,752,910
—
1/12/41
4.50% (1 month
Synthetic TRS
26,034
USD-LIBOR)
Index 4.50%
30 year Fannie Mae
pools
1,522,652
—
1/12/41
4.50% (1 month
Synthetic TRS
22,614
USD-LIBOR)
Index 4.50%
30 year Fannie Mae
pools
744,270
—
1/12/41
4.50% (1 month
Synthetic TRS
11,054
USD-LIBOR)
Index 4.50%
30 year Fannie Mae
pools
1,403,768
—
1/12/38
(6.50%) 1 month
Synthetic MBX
(2,410)
USD-LIBOR
Index 6.50%
30 year Fannie Mae
pools
527,339
—
1/12/38
(6.50%) 1 month
Synthetic MBX
(905)
USD-LIBOR
Index 6.50%
30 year Fannie Mae
pools
12,157,888
—
1/12/41
4.00% (1 month
Synthetic TRS
207,753
USD-LIBOR)
Index 4.00%
30 year Fannie Mae
pools
4,526,900
—
1/12/41
4.00% (1 month
Synthetic TRS
77,356
USD-LIBOR)
Index 4.00%
30 year Fannie Mae
pools
1,908,793
—
1/12/41
4.00% (1 month
Synthetic TRS
32,618
USD-LIBOR)
Index 4.00%
30 year Fannie Mae
pools
81
TOTAL RETURN SWAP CONTRACTS OUTSTANDING at 3/31/12 (Unaudited) cont.
Upfront
Fixed payments
Total return
Unrealized
Swap counterparty /
premium
Termination
received (paid) by
received by
appreciation/
Notional amount
received (paid)
date
fund per annum
or paid by fund
(depreciation)
Goldman Sachs International cont.
$4,233,304
$—
1/12/41
4.00% (1 month
Synthetic TRS
$72,339
USD-LIBOR)
Index 4.00%
30 year Fannie Mae
pools
1,922,935
2,404
1/12/38
(6.50%) 1 month
Synthetic MBX
(897)
USD-LIBOR
Index 6.50%
30 year Fannie Mae
pools
371,317
4,583
1/12/40
(5.00%) 1 month
Synthetic TRS
(1,456)
USD-LIBOR
Index 5.00%
30 year Fannie Mae
pools
91,422
(386)
1/12/38
(6.50%) 1 month
Synthetic MBX
(416)
USD-LIBOR
Index 6.50%
30 year Fannie Mae
pools
243,623
(904)
1/12/38
(6.50%) 1 month
Synthetic MBX
(943)
USD-LIBOR
Index 6.50%
30 year Fannie Mae
pools
1,839,906
33,636
1/12/40
(5.00%) 1 month
Synthetic TRS
6,497
USD-LIBOR
Index 5.00%
30 year Fannie Mae
pools
1,824,236
(25,653)
1/12/41
4.50% (1 month
Synthetic TRS
(1,723)
USD-LIBOR)
Index 4.50%
30 year Fannie Mae
pools
3,431,000
—
4/3/17
2.3225%
USA Non Revised
3,440
Consumer Price
Index-Urban (CPI-U)
EUR
5,940,000
—
10/18/13
(1.7775%)
Eurostat Eurozone
(92,848)
HICP excluding
tobacco
GBP
2,141,000
—
3/30/17
(3.0925%)
GBP Non-revised
(12,030)
UK Retail Price
Index
JPMorgan Chase Bank N.A.
EUR
3,178,000
—
4/2/13
(1.98%)
Eurostat Eurozone
(424)
HICP excluding
tobacco
Total
$606,469
82
CREDIT DEFAULT CONTRACTS OUTSTANDING at 3/31/12 (Unaudited)
Upfront
Fixed payments
premium
Termi-
received
Unrealized
Swap counterparty /
received
Notional
nation
(paid) by fund
appreciation/
Referenced debt*
Rating***
(paid)**
amount
date
per annum
(depreciation)
Credit Suisse International
Bonos Y Oblig Del
Estado, 5 1/2%,
7/30/17
—
$(18,605)
$2,090,000
12/20/19
(100 bp)
$378,147
Deutsche Bank AG
Republic of
Argentina, 8.28%,
12/31/33
B3
82,442
705,000
3/20/17
500 bp
(4,212)
Smurfit Kappa
Funding, 7 3/4%,
4/1/15
B1
—
EUR
425,000
9/20/13
715 bp
55,449
Virgin Media
Finance PLC,
8 3/4%, 4/15/14
BB–
—
EUR
400,000
9/20/13
477 bp
29,014
Virgin Media
Finance PLC,
8 3/4%, 4/15/14
BB–
—
EUR
400,000
9/20/13
535 bp
33,654
JPMorgan Chase Bank NA
DJ CDX NA HY Series
18 Index
B+/P
67,777
$2,582,000
6/20/17
500 bp
(6,198)
Morgan Stanley Capital Services LLC
Republic of
Venezuela, 9 1/4%,
9/15/27
B2
—
510,000
10/20/12
339 bp
9,761
Total
$495,615
* Payments related to the referenced debt are made upon a credit default event.
** Upfront premium is based on the difference between the original spread on issue and the market spread on day of execution.
*** Ratings are presented for credit default contracts in which the fund has sold protection on the underlying referenced debt. Ratings for an underlying index represent the average of the ratings of all the securities included in that index. The Moody’s, Standard & Poor’s or Fitch ratings are believed to be the most recent ratings available at March 31, 2012. Securities rated by Putnam are indicated by “/P.” Securities rated by Fitch are indicated by “/F.”
83
ASC 820 establishes a three-level hierarchy for disclosure of fair value measurements. The valuation hierarchy is based upon the transparency of inputs to the valuation of the fund’s investments. The three levels are defined as follows:
Level 1: Valuations based on quoted prices for identical securities in active markets.
Level 2: Valuations based on quoted prices in markets that are not active or for which all significant inputs are observable, either directly or indirectly.
Level 3: Valuations based on inputs that are unobservable and significant to the fair value measurement.
The following is a summary of the inputs used to value the fund’s net assets as of the close of the reporting period:
Valuation inputs
Investments in securities:
Level 1
Level 2
Level 3
Common stocks:
Consumer cyclicals
$—
$94
$7
Energy
—
—
3,091
Health care
7,712
—
—
Total common stocks
7,712
94
3,098
Asset-backed securities
$—
$16,662,021
$—
Convertible bonds and notes
—
424,576
—
Convertible preferred stocks
—
304,317
7
Corporate bonds and notes
—
107,281,709
—
Foreign government bonds and notes
—
26,787,034
—
Mortgage-backed securities
—
122,435,662
—
Preferred stocks
—
164,953
—
Purchased options outstanding
—
34,684,705
—
Senior loans
—
7,341,583
—
U.S. Government and Agency Mortgage Obligations
—
93,298,987
—
U.S. Treasury Obligations
—
1,438,550
—
Warrants
—
411
24,050
Short-term investments
4,316,212
83,036,068
—
Totals by level
$4,323,924
$493,860,670
$27,155
Valuation inputs
Other financial instruments:
Level 1
Level 2
Level 3
Forward currency contracts
$—
$(2,525,230)
$—
Futures contracts
(215,722)
—
—
Written options
—
(36,680,927)
—
TBA sale commitments
—
(37,994,375)
—
Interest rate swap contracts
—
(2,502,619)
—
Total return swap contracts
—
601,815
—
Credit default contracts
—
364,001
—
Totals by level
$(215,722)
$(78,737,335)
$—
At the start and/or close of the reporting period, Level 3 investments in securities were not considered a significant portion of the fund’s portfolio.
The accompanying notes are an integral part of these financial statements.
84
Statement of assets and liabilities 3/31/12 (Unaudited)
ASSETS
Investment in securities, at value, including of securities on loan (Note 1):
Affiliated issuers (identified cost $4,316,212) (Notes 1 and 6)
4,316,212
Cash
106,319
Foreign currency (cost $57,330) (Note 1)
57,357
Dividends, interest and other receivables
4,190,638
Receivable for investments sold
2,696,364
Receivable for sales of delayed delivery securities (Note 1)
38,243,450
Unrealized appreciation on forward currency contracts (Note 1)
1,437,055
Unrealized appreciation on swap contracts (Note 1)
9,783,381
Premium paid on swap contracts (Note 1)
346,289
Total assets
555,072,602
LIABILITIES
Payable for variation margin (Note 1)
10,376
Distributions payable to shareholders
1,909,634
Payable for investments purchased
8,303,796
Payable for purchases of delayed delivery securities (Note 1)
93,609,861
Payable for compensation of Manager (Note 2)
654,996
Payable for investor servicing fees (Note 2)
14,920
Payable for custodian fees (Note 2)
68,709
Payable for Trustee compensation and expenses (Note 2)
133,467
Payable for administrative services (Note 2)
1,419
Unrealized depreciation on forward currency contracts (Note 1)
3,962,285
Unrealized depreciation on swap contracts (Note 1)
11,467,768
Premium received on swap contracts (Note 1)
198,705
Written options outstanding, at value (premiums received $28,777,407) (Notes 1 and 3)
36,680,927
Collateral on certain derivative contracts, at value (Note 1)
1,438,550
TBA sale commitments, at value (proceeds receivable $37,976,680) (Note 1)
37,994,375
Other accrued expenses
115,200
Total liabilities
196,564,988
Net assets
$358,507,614
REPRESENTED BY
Paid-in capital (Unlimited shares authorized) (Notes 1)
$513,314,425
Distributions in excess of net investment income (Note 1)
(6,828,469)
Accumulated net realized loss on investments and foreign currency transactions (Note 1)
(136,168,598)
Net unrealized depreciation of investments and assets and liabilities in foreign currencies
(11,809,744)
Total — Representing net assets applicable to capital shares outstanding
$358,507,614
COMPUTATION OF NET ASSET VALUE
Net asset value per share
($358,507,614 divided by 65,690,624 shares)
$5.46
The accompanying notes are an integral part of these financial statements.
85
Statement of operations Six months ended 3/31/12 (Unaudited)
INVESTMENT INCOME
Interest (net of foreign tax of $6,998) (including interest income of $17,179 from investments
in affiliated issuers) (Note 6)
$11,920,284
Dividends (net of foreign tax of $6,998)
11,331
Total investment income
11,931,615
EXPENSES
Compensation of Manager (Note 2)
1,309,601
Investor servicing fees (Note 2)
87,949
Custodian fees (Note 2)
56,674
Trustee compensation and expenses (Note 2)
15,191
Administrative services (Note 2)
4,381
Other
218,937
Total expenses
1,692,733
Expense reduction (Note 2)
(139)
Net expenses
1,692,594
Net investment income
10,239,021
Net realized loss on investments (Notes 1 and 3)
(13,597,850)
Net realized loss on swap contracts (Note 1)
(27,229,167)
Net realized gain on futures contracts (Note 1)
1,982,670
Net realized loss on written options (Notes 1 and 3)
(1,579,881)
Net realized gain on foreign currency transactions (Note 1)
3,890,765
Net unrealized depreciation of assets and liabilities in foreign currencies during the period
(6,261,504)
Net unrealized appreciation of investments, futures contracts, swap contracts, written options,
and TBA sale commitments during the period
51,465,786
Net gain on investments
8,670,819
Net increase in net assets resulting from operations
$18,909,840
The accompanying notes are an integral part of these financial statements.
86
Statement of changes in net assets
INCREASE (DECREASE) IN NET ASSETS
Six months ended 3/31/12*
Year ended 9/30/11
Operations:
Net investment income
$10,239,021
$22,867,685
Net realized gain (loss) on investments
and foreign currency transactions
(36,533,463)
30,365,452
Net unrealized appreciation (depreciation) of investments
and assets and liabilities in foreign currencies
45,204,282
(55,098,101)
Net increase (decrease) in net assets resulting
from operations
18,909,840
(1,864,964)
Distributions to shareholders (Note 1):
From ordinary income
Net investment income
(11,430,169)
(30,037,712)
Increase in capital share transactions from reinvestment
of distributions
—
1,575,240
Total increase (decrease) in net assets
7,479,671
(30,327,436)
NET ASSETS
Beginning of period
351,027,943
381,355,379
End of period (including distributions in excess
of net investment income of $6,828,469 and $5,637,321,
respectively)
$358,507,614
$351,027,943
NUMBER OF FUND SHARES
Shares outstanding at beginning of period
65,690,624
65,424,306
Shares issued in connection with reinvestment
of distributions
—
266,318
Shares outstanding at end of period
65,690,624
65,690,624
* Unaudited
The accompanying notes are an integral part of these financial statements.
87
Financial highlights (For a common share outstanding throughout the period)
PER-SHARE OPERATING PERFORMANCE
Six months ended**
Year ended
3/31/12
9/30/11
9/30/10
9/30/09
9/30/08
9/30/07
Net asset value,
beginning of period
$5.34
$5.83
$5.94
$5.88
$7.13
$7.08
Investment operations:
Net investment income a
.16
.35
.58
.34
.49 f
.36 f
Net realized and unrealized
gain (loss) on investments
.13
(.38)
.39
.24
(1.28)
.01
Total from
investment operations
.29
(.03)
.97
.58
(.79)
.37
Less distributions:
From net investment income
(.17)
(.46)
(1.08)
(.54)
(.49)
(.36)
Total distributions
(.17)
(.46)
(1.08)
(.54)
(.49)
(.36)
Increase from shares repurchased
—
—
.02
.03
.04
Net asset value,
end of period
$5.46
$5.34
$5.83
$5.94
$5.88
$7.13
Market value,
end of period
$5.15
$5.05
$6.28
$5.99
$5.39
$6.41
Total return at
market value (%) b
5.51 *
(13.01)
25.33
24.66
(8.92)
10.15
RATIOS AND SUPPLEMENTAL DATA
Net assets, end of period
(in thousands)
$358,508
$351,028
$381,355
$383,388
$391,973
$578,811
Ratio of expenses to
average net assets (%) c
.48 *
.94
.94 d
1.02 d
.96 f
.90 f
Ratio of expenses to
average net assets excluding
interest expense (%) c
.48 *
.94
.94
.98
.96 f
.90 f
Ratio of net investment income
to average net assets (%)
2.79 *
5.97
9.82 d
7.05 d
7.29 f
5.01 f
Portfolio turnover (%) e
66 *
171
88
223
159
78
* Not annualized.
** Unaudited.
a Per share net investment income has been determined on the basis of weighted average number of shares outstanding during the period.
b Total return assumes dividend reinvestment.
c Includes amounts paid through expense offset arrangements (Note 2).
d Includes interest accrued in connection with certain terminated derivative contracts, which amounted to less than 0.01% and 0.04% of average net assets as of September 30, 2010 and September 30, 2009, respectively.
e Portfolio turnover excludes TBA roll transactions.
f Reflects waivers of certain fund expenses in connection with investments in Putnam Prime Money Market Fund during the period. As a result of such waivers, the expenses of the fund reflect a reduction of the following amounts:
Percentage of
average net assets
September 30, 2008
0.01%
September 30, 2007
0.02
The accompanying notes are an integral part of these financial statements.
88
Notes to financial statements 3/31/12 (Unaudited)
Within the following Notes to financial statements, references to “State Street” represent State Street Bank and Trust Company, references to “the SEC” represent the Securities and Exchange Commission and references to “Putnam Management” represent Putnam Investment Management, LLC, the fund’s manager, an indirect wholly-owned subsidiary of Putnam Investments, LLC.
Putnam Master Intermediate Income Trust (the fund) is a Massachusetts business trust, which is registered under the Investment Company Act of 1940, as amended, as a closed-end management investment company and is authorized to issue an unlimited number of shares. The investment objective of the fund is to seek, with equal emphasis, high current income and relative stability of net asset value, by allocating its investments among the U.S. investment grade sector, high-yield sector and international sector.
In the normal course of business, the fund enters into contracts that may include agreements to indemnify another party under given circumstances. The fund’s maximum exposure under these arrangements is unknown as this would involve future claims that may be, but have not yet been, made against the fund. However, the fund’s management team expects the risk of material loss to be remote.
Note 1: Significant accounting policies
The following is a summary of significant accounting policies consistently followed by the fund in the preparation of its financial statements. The preparation of financial statements is in conformity with accounting principles generally accepted in the United States of America and requires management to make estimates and assumptions that affect the reported amounts of assets and liabilities in the financial statements and the reported amounts of increases and decreases in net assets from operations. Actual results could differ from those estimates. Subsequent events after the Statement of assets and liabilities date through the date that the financial statements were issued have been evaluated in the preparation of the financial statements. Unless otherwise noted, the “reporting period” represents the period from October 1, 2011 through March 31, 2012.
Security valuation Investments for which market quotations are readily available are valued at the last reported sales price on their principal exchange, or official closing price for certain markets, and are classified as Level 1 securities. If no sales are reported, as in the case of some securities traded over-the-counter, a security is valued at its last reported bid price and is generally categorized as a Level 2 security.
Investments in other open-end investment companies (excluding exchange traded funds), which are classified as Level 1 securities, are based on their net asset value. The net asset value of an investment company equals the total value of its assets less its liabilities and divided by the number of its outstanding shares. Shares are only valued as of the close of regular trading on the New York Stock Exchange each day that the exchange is open.
Market quotations are not considered to be readily available for certain debt obligations and other investments; such investments are valued on the basis of valuations furnished by an independent pricing service approved by the Trustees or dealers selected by Putnam Management. Such services or dealers determine valuations for normal institutional-size trading units of such securities using methods based on market transactions for comparable securities and various relationships, generally recognized by institutional traders, between securities (which considers such factors as security prices, yields, maturities and ratings). These securities will generally be categorized as Level 2.
Many securities markets and exchanges outside the U.S. close prior to the close of the New York Stock Exchange and therefore the closing prices for securities in such markets or on such exchanges may not fully reflect events that occur after such close but before the close of the New York Stock Exchange. Accordingly, on certain days, the fund will fair value foreign equity securities taking into account multiple factors including movements in the U.S. securities markets, currency valuations and comparisons to the valuation of American Depository Receipts, exchange-traded funds and futures contracts. These securities, which will generally represent a transfer from a Level 1 to a Level 2 security, will be classified as Level 2. The number of days on which fair value prices will be used will depend on market activity and it is possible that fair value prices will be used by the fund to a significant extent. Securities quoted in foreign currencies, if any, are translated into U.S. dollars at the current exchange rate.
To the extent a pricing service or dealer is unable to value a security or provides a valuation that Putnam Management does not believe accurately reflects the security’s fair value, the security will be valued at fair value by Putnam Management. Certain investments, including certain restricted and illiquid securities and derivatives, are also valued at fair value following procedures approved by the Trustees. These valuations consider such factors as significant market or specific security events such as interest rate or credit quality changes, various
89
relationships with other securities, discount rates, U.S. Treasury, U.S. swap and credit yields, index levels, convexity exposures and recovery rates. These securities are classified as Level 2 or as Level 3 depending on the priority of the significant inputs.
Such valuations and procedures are reviewed periodically by the Trustees. Certain securities may be valued on the basis of a price provided by a single source. The fair value of securities is generally determined as the amount that the fund could reasonably expect to realize from an orderly disposition of such securities over a reasonable period of time. By its nature, a fair value price is a good faith estimate of the value of a security in a current sale and does not reflect an actual market price, which may be different by a material amount.
Security transactions and related investment income Security transactions are recorded on the trade date (the date the order to buy or sell is executed). Gains or losses on securities sold are determined on the identified cost basis. Interest income is recorded on the accrual basis. Dividend income, net of applicable withholding taxes, is recognized on the ex-dividend date except that certain dividends from foreign securities, if any, are recognized as soon as the fund is informed of the ex-dividend date. Non-cash dividends, if any, are recorded at the fair market value of the securities received. Dividends representing a return of capital or capital gains, if any, are reflected as a reduction of cost and/or as a realized gain. All premiums/discounts are amortized/accreted on a yield-to-maturity basis.
Securities purchased or sold on a delayed delivery basis may be settled a month or more after the trade date; interest income is accrued based on the terms of the securities. Losses may arise due to changes in the market value of the underlying securities or if the counterparty does not perform under the contract.
The fund earned certain fees in connection with its senior loan purchasing activities. These fees are treated as market discount and are amortized into income in the Statement of operations.
Stripped securities The fund may invest in stripped securities which represent a participation in securities that may be structured in classes with rights to receive different portions of the interest and principal. Interest-only securities receive all of the interest and principal-only securities receive all of the principal. If the interest-only securities experience greater than anticipated prepayments of principal, the fund may fail to recoup fully its initial investment in these securities. Conversely, principal-only securities increase in value if prepayments are greater than anticipated and decline if prepayments are slower than anticipated. The market value of these securities is highly sensitive to changes in interest rates.
Foreign currency translation The accounting records of the fund are maintained in U.S. dollars. The market value of foreign securities, currency holdings, and other assets and liabilities is recorded in the books and records of the fund after translation to U.S. dollars based on the exchange rates on that day. The cost of each security is determined using historical exchange rates. Income and withholding taxes are translated at prevailing exchange rates when earned or incurred. The fund does not isolate that portion of realized or unrealized gains or losses resulting from changes in the foreign exchange rate on investments from fluctuations arising from changes in the market prices of the securities. Such gains and losses are included with the net realized and unrealized gain or loss on investments. Net realized gains and losses on foreign currency transactions represent net realized exchange gains or losses on closed forward currency contracts, disposition of foreign currencies, currency gains and losses realized between the trade and settlement dates on securities transactions and the difference between the amount of investment income and foreign withholding taxes recorded on the fund’s books and the U.S. dollar equivalent amounts actually received or paid. Net unrealized appreciation and depreciation of assets and liabilities in foreign currencies arise from changes in the value of open forward currency contracts and assets and liabilities other than investments at the period end, resulting from changes in the exchange rate.
Options contracts The fund uses options contracts to hedge duration and convexity and to isolate prepayment risk.
The potential risk to the fund is that the change in value of options contracts may not correspond to the change in value of the hedged instruments. In addition, losses may arise from changes in the value of the underlying instruments if there is an illiquid secondary market for the contracts, if interest or exchange rates move unexpectedly or if the counterparty to the contract is unable to perform. Realized gains and losses on purchased options are included in realized gains and losses on investment securities. If a written call option is exercised, the premium originally received is recorded as an addition to sales proceeds. If a written put option is exercised, the premium originally received is recorded as a reduction to the cost of investments.
Exchange traded options are valued at the last sale price or, if no sales are reported, the last bid price for purchased options and the last ask price for written options. Options traded over-the-counter are valued using prices supplied by dealers.
90
Written option contracts outstanding at period end, if any, are listed after the fund’s portfolio. See Note 3 for the volume of written options contracts activity for the reporting period. Outstanding contracts on purchased options contracts at the close of the reporting period are indicative of the volume of activity during the reporting period.
Futures contracts The fund uses futures contracts to hedge interest rate risk and to gain exposure to interest rates.
The potential risk to the fund is that the change in value of futures contracts may not correspond to the change in value of the hedged instruments. In addition, losses may arise from changes in the value of the underlying instruments if there is an illiquid secondary market for the contracts, if interest or exchange rates move unexpectedly or if the counterparty to the contract is unable to perform. With futures, there is minimal counterparty credit risk to the fund since futures are exchange traded and the exchange’s clearinghouse, as counterparty to all exchange traded futures, guarantees the futures against default. Risks may exceed amounts recognized on the Statement of assets and liabilities. When the contract is closed, the fund records a realized gain or loss equal to the difference between the value of the contract at the time it was opened and the value at the time it was closed.
Futures contracts are valued at the quoted daily settlement prices established by the exchange on which they trade. The fund and the broker agree to exchange an amount of cash equal to the daily fluctuation in the value of the futures contract. Such receipts or payments are known as “variation margin.”
Futures contracts outstanding at period end, if any, are listed after the fund’s portfolio. The fund had an average of approximately 449 futures contracts outstanding for the reporting period.
Forward currency contracts The fund buys and sells forward currency contracts, which are agreements between two parties to buy and sell currencies at a set price on a future date. These contracts are used to hedge foreign exchange risk and to gain exposure on currency.
The U.S. dollar value of forward currency contracts is determined using current forward currency exchange rates supplied by a quotation service. The market value of the contract will fluctuate with changes in currency exchange rates. The contract is marked to market daily and the change in market value is recorded as an unrealized gain or loss. The fund records a realized gain or loss equal to the difference between the value of the contract at the time it was opened and the value at the time it was closed when the contract matures or by delivery of the currency. The fund could be exposed to risk if the value of the currency changes unfavorably, if the counterparties to the contracts are unable to meet the terms of their contracts or if the fund is unable to enter into a closing position. Risks may exceed amounts recognized on the Statement of assets and liabilities.
Forward currency contracts outstanding at period end, if any, are listed after the fund’s portfolio. The fund had an average contract amount of approximately $247,900,000 on forward currency contracts for the reporting period.
Total return swap contracts The fund entered into total return swap contracts, which are arrangements to exchange a market linked return for a periodic payment, both based on a notional principal amount, to hedge sector exposure, to manage exposure to specific sectors or industries, to gain exposure to specific sectors or industries, to gain exposure to rates of inflation in specific regions or countries and to hedge inflation in specific regions or countries.
To the extent that the total return of the security, index or other financial measure underlying the transaction exceeds or falls short of the offsetting interest rate obligation, the fund will receive a payment from or make a payment to the counterparty. Total return swap contracts are marked to market daily based upon quotations from an independent pricing service or market makers and the change, if any, is recorded as an unrealized gain or loss. Payments received or made are recorded as realized gains or losses. Certain total return swap contracts may include extended effective dates. Payments related to these swap contracts are accrued based on the terms of the contract. The fund could be exposed to credit or market risk due to unfavorable changes in the fluctuation of interest rates or in the price of the underlying security or index, the possibility that there is no liquid market for these agreements or that the counterparty may default on its obligation to perform. The fund’s maximum risk of loss from counterparty risk is the fair value of the contract. This risk may be mitigated by having a master netting arrangement between the fund and the counterparty. Risk of loss may exceed amounts recognized on the Statement of assets and liabilities.
Total return swap contracts outstanding at period end, if any, are listed after the fund’s portfolio. The fund had an average notional amount of approximately $140,000,000 on total return swap contracts for the reporting period.
Interest rate swap contracts The fund entered into interest rate swap contracts, which are arrangements between two parties to exchange cash flows based on a notional principal amount, to hedge interest rate risk, and to gain exposure on interest rates.
91
An interest rate swap can be purchased or sold with an upfront premium. An upfront payment received by the fund is recorded as a liability on the fund’s books. An upfront payment made by the fund is recorded as an asset on the fund’s books. Upfront payments are recorded as realized gains and losses at the closing of the contract. Interest rate swap contracts are marked to market daily based upon quotations from an independent pricing service or market makers and the change, if any, is recorded as an unrealized gain or loss. Payments received or made are recorded as realized gains or losses. Certain interest rate swap contracts may include extended effective dates. Payments related to these swap contracts are accrued based on the terms of the contract. The fund could be exposed to credit or market risk due to unfavorable changes in the fluctuation of interest rates or if the counterparty defaults on its obligation to perform. The fund’s maximum risk of loss from counterparty risk is the fair value of the contract. This risk may be mitigated by having a master netting arrangement between the fund and the counterparty. Risk of loss may exceed amounts recognized on the Statement of assets and liabilities.
Interest rate swap contracts outstanding at period end, if any, are listed after the fund’s portfolio. The fund had an average notional amount of approximately $3,919,400,000 on interest rate swap contracts for the reporting period.
Credit default contracts The fund entered into credit default contracts to hedge credit risk, and to gain exposure on individual names and/or baskets of securities.
In a credit default contract, the protection buyer typically makes an up front payment and a periodic stream of payments to a counterparty, the protection seller, in exchange for the right to receive a contingent payment upon the occurrence of a credit event on the reference obligation or all other equally ranked obligations of the reference entity. Credit events are contract specific but may include bankruptcy, failure to pay, restructuring and obligation acceleration. An upfront payment received by the fund is recorded as a liability on the fund’s books. An upfront payment made by the fund is recorded as an asset on the fund’s books. Periodic payments received or paid by the fund are recorded as realized gains or losses. The credit default contracts are marked to market daily based upon quotations from an independent pricing service or market makers and the change, if any, is recorded as an unrealized gain or loss. Upon the occurrence of a credit event, the difference between the par value and market value of the reference obligation, net of any proportional amount of the upfront payment, is recorded as a realized gain or loss.
In addition to bearing the risk that the credit event will occur, the fund could be exposed to market risk due to unfavorable changes in interest rates or in the price of the underlying security or index or the possibility that the fund may be unable to close out its position at the same time or at the same price as if it had purchased the underlying reference obligations. In certain circumstances, the fund may enter into offsetting credit default contracts which would mitigate its risk of loss. Risks of loss may exceed amounts recognized on the Statement of assets and liabilities. The fund’s maximum risk of loss from counterparty risk, either as the protection seller or as the protection buyer, is the fair value of the contract. This risk may be mitigated by having a master netting arrangement between the fund and the counterparty. Where the fund is a seller of protection, the maximum potential amount of future payments the fund may be required to make is equal to the notional amount of the relevant credit default contract.
Credit default contracts outstanding, including their respective notional amounts at period end, if any, are listed after the fund’s portfolio. The fund had an average notional amount of approximately $13,800,000 on credit default swap contracts for the reporting period.
Master agreements The fund is a party to ISDA (International Swaps and Derivatives Association, Inc.) Master Agreements (Master Agreements) with certain counterparties that govern over-the-counter derivative and foreign exchange contracts entered into from time to time. The Master Agreements may contain provisions regarding, among other things, the parties’ general obligations, representations, agreements, collateral requirements, events of default and early termination. With respect to certain counterparties, in accordance with the terms of the Master Agreements, collateral posted to the fund is held in a segregated account by the fund’s custodian and with respect to those amounts which can be sold or repledged, are presented in the fund’s portfolio. Collateral posted to the fund which cannot be sold or repledged totaled $12,417,163 at the close of the reporting period.
Collateral pledged by the fund is segregated by the fund’s custodian and identified in the fund’s portfolio. Collateral can be in the form of cash or debt securities issued by the U.S. Government or related agencies or other securities as agreed to by the fund and the applicable counterparty. Collateral requirements are determined based on the fund’s net position with each counterparty.
Termination events applicable to the fund may occur upon a decline in the fund’s net assets below a specified threshold over a certain period of time. Termination events applicable to counterparties may occur upon a decline in the counterparty’s long-term and short-term credit ratings below a specified level. In each case, upon occurrence,
92
the other party may elect to terminate early and cause settlement of all derivative and foreign exchange contracts outstanding, including the payment of any losses and costs resulting from such early termination, as reasonably determined by the terminating party. Any decision by one or more of the fund’s counterparties to elect early termination could impact the fund’s future derivative activity.
At the close of the reporting period, the fund had a net liability position of $19,591,729 on derivative contracts subject to the Master Agreements. Collateral posted by the fund totaled $18,934,571.
TBA purchase commitments The fund may enter into TBA (to be announced) commitments to purchase securities for a fixed unit price at a future date beyond customary settlement time. Although the unit price has been established, the principal value has not been finalized. However, it is anticipated that the amount of the commitments will not significantly differ from the principal amount. The fund holds, and maintains until settlement date, cash or high-grade debt obligations in an amount sufficient to meet the purchase price, or the fund may enter into offsetting contracts for the forward sale of other securities it owns. Income on the securities will not be earned until settlement date. TBA purchase commitments may be considered securities themselves, and involve a risk of loss if the value of the security to be purchased declines prior to the settlement date, which risk is in addition to the risk of decline in the value of the fund’s other assets. Unsettled TBA purchase commitments are valued at fair value of the underlying securities, according to the procedures described under “Security valuation” above. The contract is marked to market daily and the change in market value is recorded by the fund as an unrealized gain or loss.
Although the fund will generally enter into TBA purchase commitments with the intention of acquiring securities for its portfolio or for delivery pursuant to options contracts it has entered into, the fund may dispose of a commitment prior to settlement if Putnam Management deems it appropriate to do so.
TBA sale commitments The fund may enter into TBA sale commitments to hedge its portfolio positions or to sell mortgage-backed securities it owns under delayed delivery arrangements. Proceeds of TBA sale commitments are not received until the contractual settlement date. During the time a TBA sale commitment is outstanding, equivalent deliverable securities, or an offsetting TBA purchase commitment deliverable on or before the sale commitment date, are held as “cover” for the transaction.
Unsettled TBA sale commitments are valued at the fair value of the underlying securities, generally according to the procedures described under “Security valuation” above. The contract is marked to market daily and the change in market value is recorded by the fund as an unrealized gain or loss. If the TBA sale commitment is closed through the acquisition of an offsetting TBA purchase commitment, the fund realizes a gain or loss. If the fund delivers securities under the commitment, the fund realizes a gain or a loss from the sale of the securities based upon the unit price established at the date the commitment was entered into. TBA sale commitments outstanding at period end, if any, are listed after the fund’s portfolio.
Interfund lending The fund, along with other Putnam funds, may participate in an interfund lending program pursuant to an exemptive order issued by the SEC. This program allows the fund to lend to other Putnam funds that permit such transactions. Interfund lending transactions are subject to each fund’s investment policies and borrowing and lending limits. Interest earned or paid on the interfund lending transaction will be based on the average of certain current market rates. During the reporting period, the fund did not utilize the program.
Federal taxes It is the policy of the fund to distribute all of its taxable income within the prescribed time period and otherwise comply with the provisions of the Internal Revenue Code of 1986, as amended (the Code), applicable to regulated investment companies. It is also the intention of the fund to distribute an amount sufficient to avoid imposition of any excise tax under Section 4982 of the Code.
The fund is subject to the provisions of Accounting Standards Codification ASC 740 Income Taxes (ASC 740). ASC 740 sets forth a minimum threshold for financial statement recognition of the benefit of a tax position taken or expected to be taken in a tax return. The fund did not have a liability to record for any unrecognized tax benefits in the accompanying financial statements. No provision has been made for federal taxes on income, capital gains or unrealized appreciation on securities held nor for excise tax on income and capital gains. Each of the fund’s federal tax returns for the prior three fiscal years remains subject to examination by the Internal Revenue Service.
The fund may also be subject to taxes imposed by governments of countries in which it invests. Such taxes are generally based on either income or gains earned or repatriated. The fund accrues and applies such taxes to net investment income, net realized gains and net unrealized gains as income and/or capital gains are earned. In some cases, the fund may be entitled to reclaim all or a portion of such taxes, and such reclaim amounts, if any, are reflected as an asset on the fund’s books. In many cases, however, the fund may not receive such amounts for an extended period of time, depending on the country of investment.
93
At September 30, 2011 the fund had a capital loss carryover of $93,118,382 available to the extent allowed by the Code to offset future net capital gain, if any. The amounts of the carryovers and the expiration dates are:
Loss carryover
Short-term
Long-term
Total
Expiration
$7,342,291
$—
$7,342,291
September 30, 2015
11,586,218
—
11,586,218
September 30, 2016
28,970,279
—
28,970,279
September 30, 2017
45,219,594
—
45,219,594
September 30, 2018
Under the recently enacted Regulated Investment Company Modernization Act of 2010, the fund will be permitted to carry forward capital losses incurred in taxable years beginning after December 22, 2010 for an unlimited period. However, any losses incurred during those future years will be required to be utilized prior to the losses incurred in pre-enactment tax years. As a result of this ordering rule, pre-enactment capital loss carryforwards may be more likely to expire unused. Additionally, post-enactment capital losses that are carried forward will retain their character as either short-term or long-term capital losses rather than being considered all short-term as under previous law.
Pursuant to federal income tax regulations applicable to regulated investment companies, the fund has elected to defer $1,974,684 of losses recognized during the period from November 1, 2010 to September 30, 2011 to its fiscal year ending September 30, 2012.
The aggregate identified cost on a tax basis is $504,396,397, resulting in gross unrealized appreciation and depreciation of $14,082,176 and $20,266,824, respectively, or net unrealized depreciation of $6,184,648.
Distributions to shareholders Distributions to shareholders from net investment income are recorded by the fund on the ex-dividend date. Distributions from capital gains, if any, are recorded on the ex-dividend date and paid at least annually. The amount and character of income and gains to be distributed are determined in accordance with income tax regulations, which may differ from generally accepted accounting principles. Dividend sources are estimated at the time of declaration. Actual results may vary. Any non-taxable return of capital cannot be determined until final tax calculations are completed after the end of the fund’s fiscal year. Reclassifications are made to the fund’s capital accounts to reflect income and gains available for distribution (or available capital loss carryovers) under income tax regulations.
Note 2: Management fee, administrative services and other transactions
The fund pays Putnam Management for management and investment advisory services quarterly based on the average net assets (including assets, but excluding liabilities, attributable to leverage for investment purposes) of the fund. The fee is based on the following annual rates:
0.75%
of the first $500 million of average net assets,
0.65%
of the next $500 million of average net assets,
0.60%
of the next $500 million of average net assets,
0.55%
of the next $5 billion of average net assets,
0.525%
of the next $5 billion of average net assets,
0.505%
of the next $5 billion of average net assets,
0.49%
of the next $5 billion of average net assets,
0.48%
of the next $5 billion of average net assets,
0.47%
of the next $5 billion of average net assets,
0.46%
of the next $5 billion of average net assets,
0.45%
of the next $5 billion of average net assets,
0.44%
of the next $5 billion of average net assets,
0.43%
of the next $8.5 billion of average net assets and
0.42%
of any excess thereafter.
94
Putnam Investments Limited (PIL), an affiliate of Putnam Management, is authorized by the Trustees to manage a separate portion of the assets of the fund as determined by Putnam Management from time to time. Putnam Management pays a quarterly sub-management fee to PIL for its services at an annual rate of 0.40% of the average net assets (including assets, but excluding liabilities, attributable to leverage for investment purposes) of the portion of the fund managed by PIL.
The fund reimburses Putnam Management an allocated amount for the compensation and related expenses of certain officers of the fund and their staff who provide administrative services to the fund. The aggregate amount of all such reimbursements is determined annually by the Trustees.
Custodial functions for the fund’s assets are provided by State Street. Custody fees are based on the fund’s asset level, the number of its security holdings and transaction volumes.
Putnam Investor Services, Inc., an affiliate of Putnam Management, provided investor servicing agent functions to the fund. Putnam Investor Services, Inc. was paid a monthly fee for investor servicing at an annual rate of 0.05% of the fund’s average net assets. The amounts incurred for investor servicing agent functions during the reporting period are included in Investor servicing fees in the Statement of operations.
The fund has entered into expense offset arrangements with Putnam Investor Services, Inc. and State Street whereby Putnam Investor Services, Inc. and State Street’s fees are reduced by credits allowed on cash balances. For the reporting period, the fund’s expenses were reduced by $139 under the expense offset arrangements.
Each independent Trustee of the fund receives an annual Trustee fee, of which $266, as a quarterly retainer, has been allocated to the fund, and an additional fee for each Trustees meeting attended. Trustees also are reimbursed for expenses they incur relating to their services as Trustees.
The fund has adopted a Trustee Fee Deferral Plan (the Deferral Plan) which allows the Trustees to defer the receipt of all or a portion of Trustees fees payable on or after July 1, 1995. The deferred fees remain invested in certain Putnam funds until distribution in accordance with the Deferral Plan.
The fund has adopted an unfunded noncontributory defined benefit pension plan (the Pension Plan) covering all Trustees of the fund who have served as a Trustee for at least five years and were first elected prior to 2004. Benefits under the Pension Plan are equal to 50% of the Trustee’s average annual attendance and retainer fees for the three years ended December 31, 2005. The retirement benefit is payable during a Trustee’s lifetime, beginning the year following retirement, for the number of years of service through December 31, 2006. Pension expense for the fund is included in Trustee compensation and expenses in the Statement of operations. Accrued pension liability is included in Payable for Trustee compensation and expenses in the Statement of assets and liabilities. The Trustees have terminated the Pension Plan with respect to any Trustee first elected after 2003.
Note 3: Purchases and sales of securities
During the reporting period, cost of purchases and proceeds from sales of investment securities other than short-term investments aggregated $220,415,389 and $181,464,472, respectively. There were no purchases or proceeds from sales of long-term U.S. government securities.
Written option transactions during the reporting period are summarized as follows:
Written swap option
Written swap option
contract amounts
premiums received
Written options outstanding at the
USD
770,739,002
$36,194,686
beginning of the reporting period
CHF
15,780,000
21,184
Options opened
USD
228,772,000
$6,515,554
Options exercised
USD
(72,146,280)
$(1,164,046)
Options closed
USD
(297,340,033)
$(12,768,787)
CHF
(15,780,000)
(21,184)
Written options outstanding at the
USD
630,024,689
$28,777,407
end of the reporting period
95
Note 4: Summary of derivative activity
The following is a summary of the market values of derivative instruments as of the close of the reporting period:
Market values of derivative instruments as of the close of the reporting period
Asset derivatives
Liability derivatives
Derivatives not
accounted for as
Statement of
Statement of
hedging instruments
assets and
assets and
under ASC 815
liabilities location
Market value
liabilities location
Market value
Credit contracts
Receivables
$524,630
Payables
$160,629
Foreign exchange
contracts
Receivables
1,437,055
Payables
3,962,285
Investments, receivables,
net assets — unrealized
Payables, net assets —
appreciation/
unrealized appreciation/
Equity contracts
(depreciation)
24,461*
(depreciation)
—
Investments, receivables,
net assets — unrealized
Payables, net assets —
appreciation/
unrealized appreciation/
Interest rate contracts
(depreciation)
44,327,565*
(depreciation)
48,440,313*
Total
$46,313,711
$52,563,227
* Includes cumulative appreciation/depreciation of futures contracts as reported in the fund’s portfolio. Only current day’s variation margin is reported within the Statement of assets and liabilities.
The following is a summary of realized and change in unrealized gains or losses of derivative instruments on the Statement of operations for the reporting period (see Note 1):
Amount of realized gain or (loss) on derivatives recognized in net gain or (loss) on investments
Derivatives not accounted
Forward
for as hedging instruments
currency
under ASC 815
Options
Futures
contracts
Swaps
Total
Credit contracts
$—
$—
$—
$(295,919)
$(295,919)
Foreign exchange
contracts
—
—
3,977,948
—
$3,977,948
Interest rate contracts
(9,088,413)
1,982,670
—
(26,933,251)
$(34,038,994)
Total
$(9,088,413)
$1,982,670
$3,977,948
$(27,229,170)
$(30,356,965)
Change in unrealized appreciation or (depreciation) on derivatives recognized in net gain or (loss) on investments
Derivatives not
accounted for as
Forward
hedging instruments
currency
under ASC 815
Options
Warrants*
Futures
contracts
Swaps
Total
Credit contracts
$—
$—
$—
$—
$749,280
$749,280
Foreign exchange
contracts
—
—
—
(6,241,402)
—
$(6,241,402)
Equity contracts
—
8,342
—
—
—
$8,342
Interest rate contracts
(5,803,928)
—
(449,347)
—
36,463,637
$30,210,362
Total
$(5,803,928)
$8,342
$(449,347)
$(6,241,402)
$37,212,917
$24,726,582
* For the reporting period, the transaction volume for warrants was minimal.
96
Note 5: Shares repurchased
In September 2011, the Trustees approved the renewal of the repurchase program to allow the fund to repurchase up to 10% of its outstanding common shares over the 12-month period ending October 7, 2012 (based on shares outstanding as of October 7, 2011). Prior to this renewal, the Trustees had approved a repurchase program to allow the fund to repurchase up to 10% of its outstanding common shares over the 12-month period ending October 7, 2011 (based on shares outstanding as of October 7, 2010). Repurchases are made when the fund’s shares are trading at less than net asset value and in accordance with procedures approved by the fund’s Trustees. For the reporting period, the fund did not repurchase any of its outstanding common shares.
Note 6: Investment in Putnam Money Market Liquidity Fund
The fund invested in Putnam Money Market Liquidity Fund, an open-end management investment company managed by Putnam Management. Investments in Putnam Money Market Liquidity Fund are valued at its closing net asset value each business day. Income distributions earned by the fund are recorded as interest income in the Statement of operations and totaled $17,179 for the reporting period. During the reporting period, cost of purchases and proceeds of sales of investments in Putnam Money Market Liquidity Fund aggregated $103,945,990 and $166,620,810, respectively. Management fees charged to Putnam Money Market Liquidity Fund have been waived by Putnam Management.
Note 7: Senior loan commitments
Senior loans are purchased or sold on a when-issued or delayed delivery basis and may be settled a month or more after the trade date, which from time to time can delay the actual investment of available cash balances; interest income is accrued based on the terms of the securities. Senior loans can be acquired through an agent, by assignment from another holder of the loan, or as a participation interest in another holder’s portion of the loan. When the fund invests in a loan or participation, the fund is subject to the risk that an intermediate participant between the fund and the borrower will fail to meet its obligations to the fund, in addition to the risk that the borrower under the loan may default on its obligations.
Note 8: Market, credit and other risks
In the normal course of business, the fund trades financial instruments and enters into financial transactions where risk of potential loss exists due to changes in the market (market risk) or failure of the contracting party to the transaction to perform (credit risk). The fund may be exposed to additional credit risk that an institution or other entity with which the fund has unsettled or open transactions will default.
Investments in foreign securities involve certain risks, including those related to economic instability, unfavorable political developments, and currency fluctuations, not present with domestic investments.
The fund may invest in higher yielding, lower rated bonds that may have a higher rate of default. The fund may invest a significant portion of its assets in securitized debt instruments, including mortgage-backed and asset-backed investments. The yields and values of these investments are sensitive to changes in interest rates, the rate of principal payments on the underlying assets and the market’s perception of the issuers. The market for these investments may be volatile and limited, which may make them difficult to buy or sell.
Note 9: New accounting pronouncements
In May 2011, the Financial Accounting Standards Board (FASB) issued Accounting Standards Update (ASU) 2011-04 “Fair Value Measurements and Disclosures (Topic 820) — Amendments to Achieve Common Fair Value Measurement and Disclosure Requirements in U.S. GAAP and IFRS”. ASU 2011-04 amends FASB Topic 820 “Fair Value Measurement” and seeks to develop common requirements for measuring fair value and for disclosing information about fair value measurements in accordance with GAAP. ASU 2011-04 is effective for fiscal years and interim periods beginning after December 15, 2011. The application of ASU 2011-04 will not have a material impact on the fund’s financial statements.
In December 2011, the FASB issued ASU No. 2011-11 “Disclosures about Offsetting Assets and Liabilities”. The update creates new disclosure requirements requiring entities to disclose both gross and net information for derivatives and other financial instruments that are either offset in the Statement of assets and liabilities or subject to an enforceable master netting arrangement or similar agreement. The disclosure requirements are effective for annual reporting periods beginning on or after January 1, 2013 and interim periods within those annual periods. Putnam Management is currently evaluating the application of ASU 2011-11 and its impact, if any, on the fund’s financial statements.
97
Shareholder meeting results (Unaudited)
January 26, 2012 meeting
At the meeting, each of the nominees for Trustees was elected, as follows:
Votes for
Votes withheld
Ravi Akhoury
55,803,089
2,625,353
Barbara M. Baumann
55,877,078
2,551,364
Jameson A. Baxter
55,884,677
2,543,765
Charles B. Curtis
55,829,318
2,599,124
Robert J. Darretta
55,873,904
2,554,539
John A. Hill
55,864,724
2,563,719
Paul L. Joskow
55,873,610
2,554,833
Elizabeth T. Kennan
55,727,408
2,701,034
Kenneth R. Leibler
55,882,389
2,546,054
George Putnam, III
55,511,455
2,916,988
Robert E. Patterson
55,883,295
2,545,148
Robert L. Reynolds
55,899,064
2,529,378
W. Thomas Stephens
55,891,592
2,536,851
All tabulations are rounded to the nearest whole number.
98
The Putnam family of funds
The following is a list of Putnam’s open-end mutual funds offered to the public. Investors should carefully consider the investment objective, risks, charges, and expenses of a fund before investing. For a prospectus, or a summary prospectus if available, containing this and other information for any Putnam fund or product, call your financial advisor at 1-800-225-1581 and ask for a prospectus. Please read the prospectus carefully before investing.
Growth
Income
Growth Opportunities Fund
American Government Income Fund
International Growth Fund
Diversified Income Trust
Multi-Cap Growth Fund
Floating Rate Income Fund
Small Cap Growth Fund
Global Income Trust
Voyager Fund
High Yield Advantage Fund
High Yield Trust
Blend
Income Fund
Asia Pacific Equity Fund
Money Market Fund*
Capital Opportunities Fund
Short Duration Income Fund
Capital Spectrum Fund
U.S. Government Income Trust
Emerging Markets Equity Fund
Equity Spectrum Fund
Tax-free income
Europe Equity Fund
AMT-Free Municipal Fund
Global Equity Fund
Tax Exempt Income Fund
International Capital Opportunities Fund
Tax Exempt Money Market Fund*
International Equity Fund
Tax-Free High Yield Fund
Investors Fund
Multi-Cap Core Fund
State tax-free income funds:
Research Fund
Arizona, California, Massachusetts, Michigan,
Minnesota, New Jersey, New York, Ohio,
Value
and Pennsylvania.
Convertible Securities Fund
Equity Income Fund
Absolute Return
George Putnam Balanced Fund
Absolute Return 100 Fund
The Putnam Fund for Growth and Income
Absolute Return 300 Fund
International Value Fund
Absolute Return 500 Fund
Multi-Cap Value Fund
Absolute Return 700 Fund
Small Cap Value Fund
* An investment in a money market fund is not insured or guaranteed by the Federal Deposit Insurance Corporation or any other government agency. Although the fund seeks to preserve the value of your investment at $1.00 per share, it is possible to lose money by investing in the fund.
99
Global Sector
Putnam RetirementReady Funds — portfolios
Global Consumer Fund
with automatically adjusting allocations to
Global Energy Fund
stocks, bonds, and money market instruments,
Global Financials Fund
becoming more conservative over time.
Global Health Care Fund
Global Industrials Fund
RetirementReady 2055 Fund
Global Natural Resources Fund
RetirementReady 2050 Fund
Global Sector Fund
RetirementReady 2045 Fund
Global Technology Fund
RetirementReady 2040 Fund
Global Telecommunications Fund
RetirementReady 2035 Fund
Global Utilities Fund
RetirementReady 2030 Fund
RetirementReady 2025 Fund
Asset Allocation
RetirementReady 2020 Fund
Putnam Global Asset Allocation Funds —
RetirementReady 2015 Fund
portfolios with allocations to stocks, bonds,
and money market instruments that are
Putnam Retirement Income Lifestyle
adjusted dynamically within specified ranges
Funds — portfolios with managed
as market conditions change.
allocations to stocks, bonds, and money
market investments to generate
Dynamic Asset Allocation Balanced Fund
retirement income.
Prior to November 30, 2011, this fund was known as
Putnam Asset Allocation: Balanced Portfolio.
Retirement Income Fund Lifestyle 1
Dynamic Asset Allocation
Prior to June 16, 2011, this fund was known as
Conservative Fund
Putnam RetirementReady Maturity Fund.
Prior to November 30, 2011, this fund was known as
Retirement Income Fund Lifestyle 2
Putnam Asset Allocation: Conservative Portfolio.
Retirement Income Fund Lifestyle 3
Dynamic Asset Allocation Growth Fund
Prior to June 16, 2011, this fund was known as
Prior to November 30, 2011, this fund was known as
Putnam Income Strategies Fund.
Putnam Asset Allocation: Growth Portfolio.
Dynamic Risk Allocation Fund
A short-term trading fee of 1% may apply to redemptions or exchanges from certain funds within the time period specified in the fund's prospectus.
Check your account balances and the most recent month-end performance in the Individual Investors section at putnam.com.
100
Fund information
Founded 75 years ago, Putnam Investments was built around the concept that a balance between risk and reward is the hallmark of a well-rounded financial program. We manage over 100 funds across income, value, blend, growth, asset allocation, absolute return, and global sector categories.
Investment Manager
Elizabeth T. Kennan
Mark C. Trenchard
Putnam Investment
Kenneth R. Leibler
Vice President and
Management, LLC
Robert E. Patterson
BSA Compliance Officer
One Post Office Square
George Putnam, III
Boston, MA 02109
Robert L. Reynolds
Robert T. Burns
W. Thomas Stephens
Vice President and
Investment Sub-Manager
Chief Legal Officer
Putnam Investments Limited
Officers
57–59 St James’s Street
Robert L. Reynolds
James P. Pappas
London, England SW1A 1LD
President
Vice President
Marketing Services
Jonathan S. Horwitz
Judith Cohen
Putnam Retail Management
Executive Vice President,
Vice President, Clerk and
One Post Office Square
Principal Executive
Assistant Treasurer
Boston, MA 02109
Officer, Treasurer and
Compliance Liaison
Michael Higgins
Custodian
Vice President, Senior Associate
State Street Bank
Steven D. Krichmar
Treasurer and Assistant Clerk
and Trust Company
Vice President and
Principal Financial Officer
Nancy E. Florek
Legal Counsel
Vice President, Assistant Clerk,
Ropes & Gray LLP
Janet C. Smith
Assistant Treasurer and
Vice President, Assistant
Proxy Manager
Trustees
Treasurer and Principal
Jameson A. Baxter, Chair
Accounting Officer
Susan G. Malloy
Ravi Akhoury
Vice President and
Barbara M. Baumann
Robert R. Leveille
Assistant Treasurer
Charles B. Curtis
Vice President and
Robert J. Darretta
Chief Compliance Officer
John A. Hill
Paul L. Joskow
Call 1-800-225-1581 Monday through Friday between 8:00 a.m. and 8:00 p.m. Eastern Time, or visit putnam.com anytime for up-to-date information about the fund’s NAV.
Item 2. Code of Ethics:
Not Applicable
Item 3. Audit Committee Financial Expert:
Not Applicable
Item 4. Principal Accountant Fees and Services:
Not Applicable
Item 5. Audit Committee
Not Applicable
Item 6. Schedule of Investments:
The registrant’s schedule of investments in unaffiliated issuers is included in the report to shareholders in Item 1 above.
Item 7. Disclosure of Proxy Voting Policies and Procedures For Closed-End Management Investment Companies:
Not applicable
Item 8. Portfolio Managers of Closed-End Management Investment Companies
(a) Not applicable
(b) During the period, Raman Srivastava was named a Portfolio Manager of the fund.
(a)(1) Portfolio Managers:
Portfolio Managers
Joined Fund
Employer
Positions Over Past Five Years
Raman Srivastava
2012
Putnam Management
1999 – Present
Portfolio Manager,
Previously, Team Leader
Portfolio Construction
(a)(2) Other Accounts Managed by the Fund’s Portfolio Managers.
The following table shows the number and approximate assets of other investment accounts (or portions of investment accounts) that the fund’s Portfolio Managers managed as of the fund’s most recent fiscal year-end. Unless noted, none of the other accounts pays a fee based on the account’s performance.
Portfolio Leader or Member
Other SEC-registered open-end and closed-end funds
Other accounts that pool assets from more than one client
Other accounts (including separate accounts, managed account programs and single-sponsor defined contribution plan offerings)
Number of accounts
Assets
Number of accounts
Assets
Number of accounts
Assets
Raman Srivastava
25*
$10,574,200,000
19#
$6,222,900,000
12
$12,767,000,000
* 4 accounts, with total assets of $1,855,400,000 pay an advisory fee based on account performance.
# 2 accounts, with total assets of $145,800,000 pay an advisory fee based on account performance
Potential conflicts of interest in managing multiple accounts. Like other investment professionals with multiple clients, the fund’s Portfolio Managers may face certain potential conflicts of interest in connection with managing both the fund and the other accounts listed under “Other Accounts Managed by the Fund’s Portfolio Managers” at the same time. The paragraphs below describe some of these potential conflicts, which Putnam Management believes are faced by investment professionals at most major financial firms. As described below, Putnam Management and the Trustees of the Putnam funds have adopted compliance policies and procedures that attempt to address certain of these potential conflicts.
The management of accounts with different advisory fee rates and/or fee structures, including accounts that pay advisory fees based on account performance (“performance fee accounts”), may raise potential conflicts of interest by creating an incentive to favor higher-fee accounts. These potential conflicts may include, among others:
• The most attractive investments could be allocated to higher-fee accounts or performance fee accounts.
• The trading of higher-fee accounts could be favored as to timing and/or execution price. For example, higher-fee accounts could be permitted to sell securities earlier than other accounts when a prompt sale is desirable or to buy securities at an earlier and more opportune time.
• The trading of other accounts could be used to benefit higher-fee accounts (front- running).
• The investment management team could focus their time and efforts primarily on higher-fee accounts due to a personal stake in compensation.
Putnam Management attempts to address these potential conflicts of interest relating to higher-fee accounts through various compliance policies that are generally intended to place all accounts, regardless of fee structure, on the same footing for investment management purposes. For example, under Putnam Management’s policies:
• Performance fee accounts must be included in all standard trading and allocation procedures with all other accounts.
• All accounts must be allocated to a specific category of account and trade in parallel with allocations of similar accounts based on the procedures generally applicable to all accounts in those groups (e.g., based on relative risk budgets of accounts).
• All trading must be effected through Putnam’s trading desks and normal queues and procedures must be followed (i.e., no special treatment is permitted for performance fee accounts or higher-fee accounts based on account fee structure).
• Front running is strictly prohibited.
• The fund’s Portfolio Manager(s) may not be guaranteed or specifically allocated any portion of a performance fee.
As part of these policies, Putnam Management has also implemented trade oversight and review procedures in order to monitor whether particular accounts (including higher-fee accounts or performance fee accounts) are being favored over time.
Potential conflicts of interest may also arise when the Portfolio Manager(s) have personal investments in other accounts that may create an incentive to favor those accounts. As a general matter and subject to limited exceptions, Putnam Management’s investment professionals do not have the opportunity to invest in client accounts, other than the Putnam funds. However, in the ordinary course of business, Putnam Management or related persons may from time to time establish “pilot” or “incubator” funds for the purpose of testing proposed investment strategies and products prior to offering them to clients. These pilot accounts may be in the form of registered investment companies, private funds such as partnerships or separate accounts established by Putnam Management or an affiliate. Putnam Management or an affiliate supplies the funding for these accounts. Putnam employees, including the fund’s Portfolio Manager(s), may also invest in certain pilot accounts. Putnam Management, and to the extent applicable, the Portfolio Manager(s) will benefit from the favorable investment performance of those funds and accounts. Pilot funds and accounts may, and frequently do, invest in the same securities as the client accounts. Putnam Management’s policy is to treat pilot accounts in the same manner as client accounts for purposes of trading allocation – neither favoring nor disfavoring them except as is legally required. For example, pilot accounts are normally included in Putnam Management’s daily block trades to the same extent as client accounts (except that pilot accounts do not participate in initial public offerings).
A potential conflict of interest may arise when the fund and other accounts purchase or sell the same securities. On occasions when the Portfolio Manager(s) consider the purchase or sale of a security to be in the best interests of the fund as well as other accounts, Putnam Management’s trading desk may, to the extent permitted by applicable laws and regulations, aggregate the securities to be sold or purchased in order to obtain the best execution and lower brokerage commissions, if any. Aggregation of trades may create the potential for unfairness to the fund or another account if one account is favored over another in allocating the securities purchased or sold – for example, by allocating a disproportionate amount of a security that is likely to increase in value to a favored account. Putnam Management’s trade allocation policies generally provide that each day’s transactions in securities that are purchased or sold by multiple accounts are, insofar as possible, averaged as to price and allocated between such accounts (including the fund) in a manner which in Putnam Management’s opinion is equitable to each account and in accordance with the amount being purchased or sold by each account. Certain exceptions exist for specialty, regional or sector accounts. Trade allocations are reviewed on a periodic basis as part of Putnam Management’s trade oversight procedures in an attempt to ensure fairness over time across accounts.
“Cross trades,” in which one Putnam account sells a particular security to another account (potentially saving transaction costs for both accounts), may also pose a potential conflict of interest. Cross trades may be seen to involve a potential conflict of interest if, for example, one account is permitted to sell a security to another account at a higher price than an independent third party would pay, or if such trades result in more attractive investments being allocated to higher-fee accounts. Putnam Management and the fund’s Trustees have adopted compliance procedures that provide that any transactions between the fund and another Putnam-advised account are to be made at an independent current market price, as required by law.
Another potential conflict of interest may arise based on the different investment objectives and strategies of the fund and other accounts. For example, another account may have a shorter-term investment horizon or different investment objectives, policies or restrictions than the fund. Depending on another account’s objectives or other factors, the Portfolio Manager(s) may give advice and make decisions that may differ from advice given, or the timing or nature of decisions made, with respect to the fund. In addition, investment decisions are the product of many factors in addition to basic suitability for the particular account involved. Thus, a particular security may be bought or sold for certain accounts even though it could have been bought or sold for other accounts at the same time. More rarely, a particular security may be bought for one or more accounts managed by the Portfolio Manager(s) when one or more other accounts are selling the security (including short sales). There may be circumstances when purchases or sales of portfolio securities for one or more accounts may have an adverse effect on other accounts. As noted above, Putnam Management has implemented trade oversight and review procedures to monitor whether any account is systematically favored over time.
The fund’s Portfolio Manager(s) may also face other potential conflicts of interest in managing the fund, and the description above is not a complete description of every conflict that could be deemed to exist in managing both the fund and other accounts.
(a)(3) Compensation of portfolio managers. Putnam’s goal for our products and investors is to deliver strong performance versus peers or performance ahead of benchmark, depending on the product, over a rolling 3-year period. Portfolio managers are evaluated and compensated, in part, based on their performance relative to this goal across the products they manage. In addition to their individual performance, evaluations take into account the performance of their group and a subjective component.
Each portfolio manager is assigned an industry competitive incentive compensation target consistent with this goal and evaluation framework. Actual incentive compensation may be higher or lower than the target, based on individual, group, and subjective performance, and may also reflect the performance of Putnam as a firm. Typically, performance is measured over the lesser of three years or the length of time a portfolio manager has managed a product.
Incentive compensation includes a cash bonus and may also include grants of deferred cash, stock or options. In addition to incentive compensation, portfolio managers receive fixed annual salaries typically based on level of responsibility and experience.
For this fund, the peer group Putnam compares fund performance against is its broad investment category as determined by Lipper Inc. and identified in the shareholder report included in Item 1.
(a)(4) Fund ownership. The following table shows the dollar ranges of shares of the fund owned by the professionals listed above at the end of the fund’s last two fiscal years, including investments by their immediate family members and amounts invested through retirement and deferred compensation plans.
* Assets in the fund
$0
$10,001–
$50,001–
$100,001–
$500,001–
$1,000,001
Year
$1–$10,000
$50,000
$100,000
$500,000
$1,000,000
and over
Raman Srivastava
2012
*
Item 9. Purchases of Equity Securities by Closed-End Management Investment Companies and Affiliated Purchasers:
Registrant Purchase of Equity Securities
Maximum
Total Number
Number (or
of Shares
Approximate
Purchased
Dollar Value)
as Part
of Shares
of Publicly
that May Yet Be
Total Number
Average
Announced
Purchased
of Shares
Price Paid
Plans or
under the Plans
Period
Purchased
per Share
Programs*
or Programs**
October 1 - October 7, 2011
-
-
-
6,542,431
October 8 - October 31, 2011
-
-
-
6,569,062
November 1 - November 30, 2011
-
-
-
6,569,062
December 1 - December 31, 2011
-
-
-
6,569,062
January 1 - January 31, 2012
-
-
-
6,569,062
February 1 - February 29, 2012
-
-
-
6,569,062
March 1 - March 31, 2012
-
-
-
6,569,062
* In October 2005, the Board of Trustees of the Putnam Funds initiated the closed-end fund share
repurchase program, which, as subsequently amended, authorized the repurchase of up to 10%
of the fund's outstanding common shares over the two-years ending October 5, 2007. The
Trustees subsequently renewed the program on five occasions, to permit the repurchase of an
additional 10% of the fund's outstanding common shares over each of the twelve-month periods
beginning on October 8, 2007, October 8, 2008, October 8, 2009, October 8, 2010 and October 8, 2011.
The October 8, 2008 - October 7, 2009 program, which was announced in September
2008, allowed repurchases up to a total of 6,664,051 shares of the fund. The October 8, 2009
- October 7, 2010 program, which was announced in September 2009, allows repurchases up to
a total of 6,456,512 shares of the fund.
The October 8, 2010 - October 7, 2011 program, which was announced in September 2010, allows repurchases up to
a total of 6,542,431 shares of the fund.
The October 8, 2011 - October 7, 2012 program, which was announced in September 2011, allows repurchases up to
a total of 6,569,062 shares of the fund.
**Information prior to October 7, 2011 is based on the total number of shares eligible for repurchase
under the program, as amended through September 2010. Information from October 8, 2011
forward is based on the total number of shares eligible for repurchase under the program, as
amended through September 2011.
Item 10. Submission of Matters to a Vote of Security Holders:
Not applicable
Item 11. Controls and Procedures:
(a) The registrant's principal executive officer and principal financial officer have concluded, based on their evaluation of the effectiveness of the design and operation of the registrant's disclosure controls and procedures as of a date within 90 days of the filing date of this report, that the design and operation of such procedures are generally effective to provide reasonable assurance that information required to be disclosed by the registrant in this report is recorded, processed, summarized and reported within the time periods specified in the Commission's rules and forms.
(b) Changes in internal control over financial reporting: Not applicable
Item 12. Exhibits:
(a)(1) Not applicable
(a)(2) Separate certifications for the principal executive officer and principal financial officer of the registrant as required by Rule 30a-2(a) under the Investment Company Act of 1940, as amended, are filed herewith.
(b) The certifications required by Rule 30a-2(b) under the Investment Company Act of 1940, as amended, are filed herewith.
SIGNATURES
Pursuant to the requirements of the Securities Exchange Act of 1934 and the Investment Company Act of 1940, the registrant has duly caused this report to be signed on its behalf by the undersigned, thereunto duly authorized.
Putnam Master Intermediate Income Trust
By (Signature and Title):
/s/Janet C. Smith
Janet C. Smith
Principal Accounting Officer
Date: May 29, 2012
Pursuant to the requirements of the Securities Exchange Act of 1934 and the Investment Company Act of 1940, this report has been signed below by the following persons on behalf of the registrant and in the capacities and on the dates indicated.
By (Signature and Title):
/s/Jonathan S. Horwitz
Jonathan S. Horwitz
Principal Executive Officer
Date: May 29, 2012
By (Signature and Title):
/s/Steven D. Krichmar
Steven D. Krichmar
Principal Financial Officer
Date: May 29, 2012
We use cookies on this site to provide a more responsive and personalized service. Continuing to browse, clicking I Agree, or closing this banner indicates agreement. See our Cookie Policy for more information.