UNITED STATES
SECURITIES AND EXCHANGE COMMISSION
Washington, D.C. 20549
FORM N-CSR
CERTIFIED SHAREHOLDER REPORT OF REGISTERED MANAGEMENT
INVESTMENT COMPANIES
Investment Company Act file number 811-05514
Wilmington Funds
(Exact name of registrant as specified in charter)
Wilmington Trust Investment Advisors, Inc.
111 South Calvert Street, 26th Floor
Baltimore, Maryland 21202
(Address of principal executive offices) (Zip code)
Mary Ellen Reilly
Wilmington Trust Investment Advisors, Inc.
Rodney Square North
1100 North Market Street
Wilmington, DE 19890-0001
(Name and address of agent for service)
Registrant’s telephone number, including area code: 410-986-5600
Date of fiscal year end: April 30
Date of reporting period: April 30, 2016
Form N-CSR is to be used by management investment companies to file reports with the Commission not later than 10 days after the transmission to stockholders of any report that is required to be transmitted to stockholders under Rule 30e-1 under the Investment Company Act of 1940 (17 CFR 270.30e-1). The Commission may use the information provided on Form N-CSR in its regulatory, disclosure review, inspection, and policymaking roles.
A registrant is required to disclose the information specified by Form N-CSR, and the Commission will make this information public. A registrant is not required to respond to the collection of information contained in Form N-CSR unless the Form displays a currently valid Office of Management and Budget (“OMB”) control number. Please direct comments concerning the accuracy of the information collection burden estimate and any suggestions for reducing the burden to Secretary, Securities and Exchange Commission, 100 F Street, NE, Washington, DC 20549. The OMB has reviewed this collection of information under the clearance requirements of 44 U.S.C. § 3507.
Item 1. Reports to Stockholders.
The Report to Shareholders is attached herewith.

Wilmington Prime Money Market Fund (“Prime Money Market Fund”) | ||
Wilmington U.S. Government Money Market Fund (“U.S. Government Money Market Fund”) | ||
Wilmington U.S. Treasury Money Market Fund (“U.S. Treasury Money Market Fund”) | ||
Wilmington Tax-Exempt Money Market Fund (“Tax-Exempt Money Market Fund”) | ||

PRESIDENT’S MESSAGE
| ||||
| ||||
| i | |||
WILMINGTON FUNDS ANNUAL REPORT
| ||||
| ||||
| 1 | |||
| Shareholder Expense Example | 4 | |||
| Portfolios of Investments | 6 | |||
| Statements of Assets and Liabilities | 18 | |||
| Statements of Operations | 19 | |||
| Statements of Changes in Net Assets | 20 | |||
| Financial Highlights | 23 | |||
| Notes to Financial Statements | 29 | |||
| Report of Independent Registered Public Accounting Firm | 34 | |||
| Board of Trustees and Trust Officers | 35 | |||
[This Page Intentionally Left Blank]
| i |
I am pleased to present the Annual Report of the Wilmington Funds (the “Trust”), covering the Trust’s fiscal year of May 1, 2015, through April 30, 2016. Inside you will find a comprehensive review of the Trusts’ holdings and financial statements.
The Economy and Financial Markets in Review
Wilmington Funds Management Corporation, the investment advisor to the Trust, and Wilmington Trust Investment Advisors, Inc., the sub-advisor to the Trust, have provided the following review of the economy, bond markets, and stock markets for the Trust’s fiscal year.
The Economy
While the U.S. economy continued to expand, the growth in gross domestic product (“GDP”) turned successively weaker with each quarter. GDP grew a healthy 3.9% in the second quarter of 2015, but the pace of growth slowed to 2.0% in the third quarter, decelerated to a tepid 1.4% gain in the fourth quarter, and nearly came to a standstill with a marginal gain of 0.5% in the first quarter of 2016.i
ihttp://www.bea.gov/national/index.htm#gdp
A strong U.S. dollar, weak global economy, falling oil prices, and sluggish wage growth were contributing factors to this disappointing economic performance.
The unemployment rate declined to 5.0% in April of 2016, down from the 5.5% rate in May of 2015. While the lower unemployment rate is welcome, the overall employment picture remains mixed, as the labor participation rate (62.8%) is stuck at historical lows, while wage growth is muted, increasing just 2.5% in the last 12 months.ii
iihttp://www.bls.gov/news.release/empsit.nr0.htm
The price of oil continued its long slide. West Texas Intermediate (a grade of crude oil used as an oil pricing benchmark) fell from nearly $60 per barrel to just under $46 per barrel, after dipping below $30 per barrel in January.iii This price decline has severely impacted both the oil industry and the banks that have made loans to oil-related companies. The savings to consumers are real, but seem not to have translated into the level of spending that might accelerate economic growth.
iiihttp://www.eia.gov/dnav/pet/hist/LeafHandler.ashx?n=PET&s=RWTC&f=D
The Federal Reserve (the “Fed”) raised the federal funds rate by 25 basis points1 (0.25%) in December 2015, the first such hike since 2006. With the announcement came a statement of intentions regarding the pace of future hikes. As the economy subsequently weakened, however, the Fed moderated its position on future rate increases, communicating that any increases would come only after a careful analysis of U.S. economic health and global stock market stability.
The Bond Markets
Yields fluctuated widely over the course of the Trust’s fiscal year. The 10-year Treasury note began May 2015 with a yield of 2.05%, peaking at 2.50% in June, only to quickly fall as investors rushed to safety amid a global stock market rout in August. Yields eventually turned higher as the prospect of a Fed hike in December grew. By the end of April 2016, however, yields ended lower at 1.83% on expectations that the Fed would put off any additional rate hikes in the near term.iv
ivhttp://www.treasury.gov/resource-center/data-chart-center/interest-rates/Pages/TextView.aspx?data=yieldYear&year=2016
The Barclays U.S. Aggregate Index2 turned in a modestly positive performance, gaining 2.72% over the 12-month period ended in April 2016. The Barclays U.S. Long-Term Treasury Index3 was the top gainer, rising 5.49%.
The high-yield market was buffeted by liquidity concerns toward the end of the calendar year, but managed to stabilize in the months that followed. The Barclays U.S. Corporate High Yield Bond Index4 ended lower, losing 1.12%.
In the tax-exempt market, concerns about a bond default by Puerto Rico were not enough to prevent a strong performance in municipal bonds, as the Barclays Municipal Bond Index5 gained 5.29%.
Global bond markets enjoyed an even stronger performance as central bankers from Europe to Japan pursued monetary easing and even negative interest rates in attempts to jump-start their struggling economies. The Barclays Global Aggregate ex-USD6 jumped 6.55% over the last 12 months ended April 30, 2016.
For the 12-month reporting period May 1, 2015 through April 30, 2016, certain Barclays indices performed as follows7:
| Barclays U.S. Aggregate Bond Index | Barclays U.S. Treasury Bond Index8 |
Barclays | Barclays U.S. Credit Bond Index10 | Barclays Municipal Bond Index | ||||||||
2.72% | 2.83% | 2.56% | 2.77% | 5.29% |
| PRESIDENT’S MESSAGE / April 30, 2016 (unaudited) |
| ii |
The Stock Markets
The U.S. stock market experienced sharp declines and price recoveries, but was unable to break out of the trading range it’s occupied for the last 18 months.
Stocks weathered a number of challenges, beginning the fiscal year with the threat of a Greek bankruptcy and the country’s withdrawal from the European Union. No sooner was that crisis resolved than investors were confronted with an unexpected currency devaluation by China, which led to sharp losses in stock prices in the month of August, a slide that extended into September.
Prices staged a strong recovery in October, recouping most of their previous losses as Europe hinted at monetary stimulus, China cut rates, and the Fed delayed its anticipated interest rate increase.
January turned in nearly a mirror performance of August as oil prices resumed their slide, anxieties grew about China’s economic health, and the world’s economies remained stagnant. Stocks staged yet another recovery in March, sparked by firming oil prices, fresh monetary easing in Europe, and new stimulus steps in China.
After all the market gyrations, stocks ended generally right where they began, with the Russell 3000 Index11, a broad domestic market index, falling just 0.18%, for the year ended April 30, 2016.
U.S. large-cap stocks outperformed mid-cap and small-cap stocks, as indicated by the 1.21% gain in the S&P 500 index12 and the declines in the Russell Midcap Index13 (-2.14%) and the Russell 2000 Index14 (-5.94%).
While growth stocks led performance in the large-cap space—the Russell 1000 Growth Index15 rose 1.07% versus a small loss in the Russell 1000 Value Index16 (-0.40%)—they underperformed value stocks significantly in the mid-cap and small-cap markets.
The best-performing S&P industry sectors were utilities (+14.26%), consumer staples (+10.46%), and telecommunication services (+9.71%). The energy sector turned in the worst performance, sliding 15.18%.
Real estate posted a strong performance, with the FTSE NAREIT Equity REITs Index17 posting a gain of 7.86%.
Overseas markets endured a difficult year, as reflected in the 9.32% decline in the MSCI EAFE (net) Index18. Emerging markets were particularly hard hit, with the MSCI Emerging Markets (net) Index19 losing 17.87%.
For the 12-month reporting period May 1, 2015 through April 30, 2016, certain stock market indices performed as follows:
| S&P 500 Index | Dow Jones Industrial Average20 | NASDAQ Composite Index21 |
MSCI All Country World ex-US (Net) Index22 | |||||||||
1.21% | 2.25% | -2.19% | -11.28% |
The markets this past year have been a reminder that a broadly diversified portfolio and the patience to stay invested through periods of market volatility can be essential to long-term investment success.23 We remain committed to managing your assets with a long-term view and working hard in the year ahead to help you reach your important financial goals.
Sincerely,

Christopher D. Randall
President
May 27, 2016
For more complete information, please download the Funds’ prospectus, which is available on www.wilmingtonfunds.com, or call 1-800-836-2211 for a copy. You should consider the Funds’ investment objectives, risks, charges, and expenses carefully before you invest. Information about these and other important subjects is in the Funds’ prospectus, which you should read carefully before investing.
Past performance is no guarantee of future results. The index performance quoted is for illustrative purposes only and is not representative of any specific investment. Diversification does not ensure a profit nor protect against loss.
All investments involve risk, including the possible loss of principal. Equity securities are subject to price fluctuation and possible loss of principal. Small and mid-cap stocks involve greater risks and volatility than large-cap stocks. International investments are subject to special risks, including currency fluctuations, social, economic, and political uncertainties, which could increase volatility. These risks are magnified in emerging markets.
| April 30, 2016 (unaudited) / PRESIDENT’S MESSAGE |
| iii |
High yield, lower-rated securities generally entail greater market, credit and liquidity risks than investment grade securities and may include higher volatility and higher risk of default.
You could lose money by investing in the money market funds. Although the money market funds seek to preserve the value of your investment at $1.00 per share, they cannot guarantee they will do so. An investment in money market funds is not a deposit of M&T Bank and is not insured or guaranteed by the Federal Deposit Insurance Corporation or any other government agency. The investment advisor has no legal obligation to provide financial support to the Funds, and you should not expect that the investment advisor will provide financial support to the Funds at any time.
| 1. | Basis Points (“BPS”) is a unit that is equal to 1/100th of 1% and is used to denote the change in a financial instrument. The basis point is commonly used for calculating changes in interest rates, equity indices and the yield. |
| 2. | Barclays U.S. Aggregate Bond Index is a widely used benchmark index for the domestic investment-grade bond market composed of securities from the Barclays Government/Corporate Bond Index, Mortgage-Backed Securities Index and Asset-Backed Securities Index. The index typically includes fixed income securities with overall intermediate- to long-term average maturities. The index is unmanaged and investments cannot be made directly in an index. |
| 3. | Barclays U.S. Long-Term Treasury Index is an unmanaged index that includes all publicly issued U.S. Treasury securities that have a remaining maturity of 10 or more years, are rated investment grade, and have $250 million or more of outstanding face value. |
| 4. | Barclays U.S. Corporate High Yield Bond Index measures the USD-denominated, high yield, fixed-rate corporate bond market. Securities are classified as high yield if the middle rating of Moody’s, Fitch, and S&P is Ba1/BB+/BB+ or below. Bonds from issuers with an emerging markets country of risk, based on Barclays EM country definition, are excluded. The U.S. Corporate High Yield Bond Index is a component of the U.S. Universal and Global High Yield Indices. |
| 5. | Barclays Municipal Bond Index tracks the performance of long-term, tax-exempt, investment-grade bond markets. To be included in the index, bonds must have an outstanding par balance of at least $7 million and be issued as part of a transaction of at least $75 million. The index is unmanaged and investments cannot be made directly in an index. |
| 6. | Barclays Global Aggregate ex-USD provides a broad-based measure of the global investment-grade fixed income markets. The three major components of this index are the U.S. Aggregate, the Pan-European Aggregate, and the Asian-Pacific Aggregate indices. The index also includes Eurodollar and Euro-Yen corporate bonds, Canadian government, agency and corporate securities, and USD investment grade 144A securities. An investment cannot be made directly in an index. |
| 7. | Bond prices are sensitive to changes in interest rates and a rise in interest rates can cause a decline in their prices. |
| 8. | Barclays U.S. Treasury Bond Index is a market capitalization weighted index that includes all publicly issued, U.S. Treasury securities that have a remaining maturity of at least one year, are rated investment-grade, and have $250 million or more of outstanding face value. The index is unmanaged and investments cannot be made directly in an index. |
| 9. | Barclays U.S. Mortgage Backed Securities Index is composed of all securities mortgage pools by GNMA, FNMA and the FHLMC, including GNMA graduated Payment Mortgages. The index is unmanaged and investments cannot be made directly in an index. |
| 10. | Barclays U.S. Credit Bond Index tracks the performance of domestic investment-grade corporate bonds and is composed of all publicly issued, fixed-rate, nonconvertible, investment-grade corporate debt. The index is unmanaged and investments cannot be made directly in an index. |
| 11. | The Russell 3000 Index is a capitalization weighted index that seeks to be a benchmark of the entire U.S. stock market. It measures the performance of the 3,000 largest publicly held companies incorporated in the U.S. based on market capitalization. |
| 12. | The S&P 500 Index is a capitalization-weighted index of 500 stocks designed to measure performance of the broad domestic economy through changes in the aggregate market value of 500 stocks representing all major industries. The index is unmanaged and investments cannot be made directly in an index. |
| 13. | Russell Midcap Index measures the performance of the 800 smallest companies in the Russell 1000 Index, which represents approximately 25% of the total market capitalization of the Russell 1000 Index. |
| 14. | Russell 2000 Index measures the performance of the 2,000 smallest companies in the Russell 3000 Index, which represents approximately 8% of the total market capitalization of the Russell 3000 Index. |
| 15. | Russell 1000 Growth Index measures the performance of those Russell 1000 companies with higher price-to-book ratios and higher forecasted growth values. |
| 16. | Russell 1000 Value Index measures the performance of those Russell 1000 companies with lower price-to-book ratios and lower forecasted growth values. |
| 17. | FTSE NAREIT Equity REITs Index is a free float-adjusted, market capitalization-weighted index of U.S. Equity REITs. Constituents of the Index include all tax-qualified REITs with more than 50 percent of total assets in qualifying real estate assets other than mortgages secured by real property. |
| 18. | MSCI EAFE (Net) Index is a free float-adjusted market capitalization index that is designed to measure equity market performance of developed markets, excluding the U.S. & Canada. The index consisted of the following 22 developed market country indices: Australia, Austria, Belgium, Denmark, Finland, France, Germany, Greece, Hong Kong, Ireland, Israel, Italy, Japan, Netherlands, New Zealand, Norway, Portugal, Singapore, Spain, Sweden, Switzerland and the United Kingdom. The index is unmanaged and investments cannot be made directly in an index. The performance of this index is reduced by the taxes on dividends paid by the international securities issuers in the index. |
| 19. | MSCI Emerging Markets (Net) Index is a free float-adjusted market capitalization index that is designed to measure equity market performance of emerging markets. The MSCI Emerging Markets Index consisted of the following 21 emerging market country indices: Brazil, Chile, China, Colombia, Czech Republic, Egypt, Hungary, India, Indonesia, Korea, Malaysia, Mexico, Morocco, Peru, Philippines, Poland, Russia, South Africa, Taiwan, Thailand, and Turkey. The index is unmanaged and investments cannot be made directly in an index. The performance of this index is reduced by the taxes on dividends paid by the international securities issuers in the index. |
| 20. | Dow Jones Industrial Average (“DJIA”) represents share prices of selected blue chip industrial corporations as well as public utility and transportation companies. The DJIA indicates daily changes in the average prices of stocks in any of its categories. It also reports total sales for each group of industries. Because it represents the top corporations of America, the DJIA’s average movements are leading economic indicators for the stock market as a whole. The average is unmanaged and investments cannot be made directly in an average. |
| 21. | NASDAQ Composite Index measures all NASDAQ domestic and non-U.S. based common stocks listed on the NASDAQ Stock Market. The index is unmanaged and investments cannot be made directly in an index. |
| 22. | MSCI All Country World ex-US (Net) Index is a free float-adjusted market capitalization weighted index that is designed to measure the equity market performance of developed and emerging markets excluding the U.S. market. The index consists of 44 countries indices comprising 23 developed and 21 emerging market country indices. The index is unmanaged and investments cannot be made directly in an index. The performance of this index is reduced by the taxes on dividends paid by the international securities issuers in the index. |
| 23. | Diversification does not assure a profit nor protect against loss. |
| PRESIDENT’S MESSAGE / April 30, 2016 (unaudited) |
[This Page Intentionally Left Blank]
| 1 |
WILMINGTON MONEY MARKET FUNDS
Management’s Discussion of Fund Performance
The Federal Reserve (the “Fed”) raised short-term interest rates in December 2015, for the first time since 2006. The Fed acknowledged the continued improvement in the labor market and their expectation for inflation “to rise to its 2% target over the medium term”. The Federal Open Market Committee (the “FOMC”) went on to state that they “expect economic conditions to evolve in a manner that will warrant only gradual increases in the federal funds rate.” The yield curve flattened over the fiscal year as long-term interest rates moved lower in response to weaker inflation as oil declined to a 13-year low price of $26 per barrel in mid-February, and fears of slower global economic growth. The 10-Year U.S. Treasury yield declined by 22 basis points to a yield of 1.83% at the end of April, while the 2-Year Treasury yield increased by 19 basis points over the fiscal year in response to the Fed raising interest rates. Also contributing to the lower interest rate environment were negative interest rate policies by the Bank of Japan and the European Central Bank; the Fed also delivered a more dovish statement and reduced their expectations for raising interest rates in 2016 to only two times from four times at the March 2016 FOMC meeting. The low European yields acted as a “magnet” to pull U.S. treasury yields lower. Economic growth for the 12-month period ended March 31, 2016 slowed to only 2% as measured by the gross domestic product (“GDP”). The consumer continued to pull their weight as evidenced by another year of strong auto sales. The 1st quarter of 2016 was anemic with the economy only growing by a 0.5% rate. We expect economic growth will pick up for the remainder of 2016 as the consumer continues to spend. The labor market continued to improve as companies fired fewer employees, initial jobless claims have fallen to their lowest level since 1973, and the unemployment rate has declined to 5.0%. Oil prices have rebounded from a 13-year low as U.S. producers’ continue to idle rigs; however even with the rebound, prices are lower now than they were a year ago. Inflation has started to move slightly higher. The Consumer Price Index (“CPI”) increased to 1.1% for the past year. The less volatile core CPI, which excludes food and energy, increased by 2.1% for the past year. Wage growth has started to move higher as the unemployment rate falls. For the past year, hourly earnings are up 2.5% which is one of the highest levels since 2009.
Looking forward, we expect economic growth to pick up from the slowdown of the 1st quarter. We also expect inflation to remain benign and the Fed to begin normalizing short-term interest rates by modestly raising short-term interest rates later this year. With respect to interest rates, we do expect them to move higher in anticipation of the Fed raising short-term interest rates later this year.
The change in key interest rates over the last twelve months is presented below.
4/30/15
|
10/31/15
|
4/30/16
| ||||||
Federal Fund Target
| 0.00%-0.25%
| 0.00%-0.25%
| 0.00%-0.25%
| |||||
3-Month LIBOR
| 0.278%
| 0.329%
| 0.637%
| |||||
2-Year Treasury Note
| 0.58%
| 0.75%
| 0.77%
| |||||
10-Year Treasury Note
| 2.05%
| 2.16%
| 1.83%
|
Money Market Reform Update
In July of 2014, the Securities and Exchange Commission (“SEC”) adopted significant amendments to the rules that govern money market mutual funds (“MMF“s). In response, we have carefully evaluated our MMF offerings relative to our clients’ needs and the implications of the SEC’s new amendments.
As a result, on March 15, 2016, the Board of Trustees of the Wilmington Funds approved a plan to merge the Wilmington Prime MMF and the Wilmington Tax-Exempt MMF into the Wilmington U.S. Government MMF.
No action is required of shareholders in any of these Funds at this time. Shareholders in the Wilmington Prime MMF and Wilmington Tax-Exempt MMF will receive further communications as the planned mergers draw near.
A Refresher: What is U.S. Money Market Mutual Fund Reform?
The SEC’s reforms change the way MMFs operate in an attempt to reduce their susceptibility to heavy redemptions during times of stress, and to increase the transparency of MMF risk, without negating the benefits currently afforded by MMFs. Key structural changes to MMFs include.
| • | New distinctions between “retail” and “institutional” prime and tax-exempt MMFs. A “retail” MMF is defined as a MMF that has policies and procedures reasonably designed to limit beneficial owners of the fund to natural persons—i.e., human beings, as opposed to entities. Institutional investors, which are all investors other than “retail” investors, will no longer be permitted to invest in retail prime or retail tax-exempt MMFs. Retail investors may, however, still invest in institutional prime and institutional tax-exempt MMFs if they want exposure to a floating net asset value, as described in the next bullet. |
| • | Imposition of floating net asset value (“NAV”) share pricing on institutional prime and institutional tax-exempt MMFs, which will likely result in the daily share prices of MMFs fluctuating along with changes in the market-based value of the funds’ investments. Institutional prime and institutional tax-exempt MMFs will be required to price and transact their shares at a floating NAV based on the market-based values of their portfolio securities, instead of a stable $1.00 per-share price they have historically used. Retail MMFs will continue to price and transact their shares using a stable, $1.00 share price. |
| • | New rules for liquidity fees and redemption gates, which may impact an investor’s ability to redeem shares, particularly in prime and tax-exempt MMFs. A liquidity fee is a fee that could be imposed on investors for redeeming MMF shares. A redemption gate is a temporary halt on redemptions, which prevents investors from redeeming shares. Prime and tax-exempt MMFs (both retail and institutional) are required to consider and impose liquidity fees and/or redemption gates under certain circumstances. |
| ANNUAL REPORT / April 30, 2016 (unaudited) |
| 2 |
These three reforms go into effect on October 14, 2016. These reforms do not apply to U.S. Government MMFs and U.S. Treasury MMFs.
The Plan for the Wilmington Funds
In response to the reform, we plan to continue to offer the Wilmington U.S. Government MMF and the Wilmington U.S. Treasury MMF, and these funds will not subject themselves to liquidity fees and redemption gates. We plan to merge the Wilmington Prime MMF and the Wilmington Tax-Exempt MMF into the Wilmington U.S. Government MMF.
This plan is reflected in the table below.
Pre-merger Funds
|
Planned post-merger Funds
| |
Wilmington Prime MMF
| ||
Wilmington U.S. Government MMF
| Wilmington U.S. Government MMF
| |
Wilmington Tax-Exempt MMF
| ||
Wilmington U.S. Treasury MMF
| Wilmington U.S. Treasury MMF
|
The planned merger of the Wilmington Prime MMF, which does not require shareholder approval, is expected to close in August of 2016.
The planned merger of the Wilmington Tax-Exempt MMF is subject to approval by shareholders. If the merger is approved, it is expected to close in August of 2016.
Why Have We Adopted this Plan?
After careful consideration, we concluded that the primary objectives of our MMF shareholders are preservation of principal, ready liquidity, and an MMF’s availability for “sweep” accounts (where excess cash in a deposit, trust, custody, or brokerage account is automatically invested, or “swept”, into a MMF investment). The mergers are an efficient and shareholder friendly way of achieving these objectives since the Wilmington U.S. Government MMF offers a stable NAV, will not be subject to liquidity fees and redemption gates, and will be available in sweep accounts.
As a result, on March 15, 2016, the Board of Trustees of the Wilmington Funds approved a plan to merge the Wilmington Prime MMF and the Wilmington Tax-Exempt MMF into the Wilmington U.S. Government MMF.
We will continue to assess the impact of MMF reform and evaluate our MMF offerings as the reforms go into effect and the industry adapts.
The following is a comparison of the performance of the Wilmington Prime Money Market Fund, Wilmington U.S. Government Money Market Fund, Wilmington U.S. Treasury Money Market Fund and Wilmington Tax-Exempt Money Market Fund versus their respective iMoneyNet and Lipper peer group average returns for the fiscal year ended April 30, 2016:
| Wilmington Prime Money Market Fund – Administrative Class | 0.06 | % | ||
| Wilmington Prime Money Market Fund – Institutional Class | 0.06 | % | ||
Wilmington Prime Money Market Fund – Select Class | 0.06 | % | ||
Wilmington Prime Money Market Fund – Service Class | 0.01 | % | ||
| iMoneyNet, Inc. First Tier Institutional Average | 0.12 | % | ||
| Lipper Money Market Funds Average | 0.03 | % | ||
| Wilmington U.S. Government Money Market Fund – Administrative Class | 0.02 | % | ||
| Wilmington U.S. Government Money Market Fund – Institutional Class | 0.02 | % | ||
| Wilmington U.S. Government Money Market Fund – Select Class | 0.02 | % | ||
| Wilmington U.S. Government Money Market Fund – Service Class | 0.01 | % | ||
iMoneyNet, Inc. Government & Agency Institutional Average | 0.05 | % | ||
| Lipper U.S. Government Money Market Funds Average | 0.06 | % | ||
Wilmington U.S. Treasury Money Market Fund – Administrative Class | 0.01 | % | ||
Wilmington U.S. Treasury Money Market Fund – Select Class | 0.01 | % | ||
Wilmington U.S. Treasury Money Market Fund – Service Class | 0.01 | % | ||
| iMoneyNet, Inc. Treasury and Repo Institutional Average | 0.03 | % | ||
| Lipper U.S. Treasury Money Market Funds Average | 0.01 | % | ||
Wilmington Tax-Exempt Money Market Fund – Administrative Class | 0.01 | % | ||
| Wilmington Tax-Exempt Money Market Fund – Select Class | 0.01 | % | ||
| Wilmington Tax-Exempt Money Market Fund – Service Class | 0.01 | % | ||
| iMoneyNet, Inc. Tax-Free Institutional Average | 0.03 | % | ||
| Lipper Tax-Exempt Money Market Funds | 0.03 | % | ||
Source: iMoneyNet, Inc. and Lipper | ||||
| April 30, 2016 (unaudited) / ANNUAL REPORT |
| 3 |
Performance shown represents past performance and does not guarantee future results. Investment return will fluctuate. The total return shown assumes the reinvestment of all distributions and does not reflect the deduction of taxes that a shareholder would pay on Fund distributions. Shares, when redeemed, may be worth more or less than their original cost. Current performance may be lower or higher than that shown here. You should consider the investment objectives, risks, charges and expenses of the Funds carefully before investing. A prospectus with this and other information may be obtained by calling 800-836-2211 or visiting the Funds’ web site at www.wilmingtonfunds.com. The prospectus should be read before investing.
The Funds’ shares are not bank deposits and are not insured by, guaranteed by, endorsed by or obligations of
the Federal Deposit Insurance Corporation, the Federal Reserve Board, any government agency or any bank. Although the Funds seek to preserve the value of your investment at $1.00 per share, it is possible to lose money by investing in the Funds.
During the fiscal year ended April 30, 2016, Wilmington Funds Management Corporation has voluntarily agreed to reduce their advisory fee and/or reimburse certain of the Funds’ operating expenses, and/or certain class-specific fees and expenses, in an effort to maintain the current yield of each share class at or above zero. The fee waiver does not take into consideration acquired fund fees and expenses, taxes or extraordinary items. Any such waiver or expense reimbursement may be modified or discontinued at any time without notice.
| ANNUAL REPORT / April 30, 2016 (unaudited) |
| 4 |
As a shareholder of the Funds, you incur two types of costs: (1) transaction costs, including sales charges (loads) on purchase payments, reinvested dividends, or other distributions; and redemption fees; and (2) ongoing costs, including management fees; distribution and/or service (12b-1) fees; and other Fund expenses. This Example is intended to help you to understand your ongoing costs (in dollars) of investing in the Funds and to compare these costs with the ongoing costs of investing in other mutual funds. It is based on an investment of $1,000 invested at the beginning of the period and held for the entire period from November 1, 2015 to April 30, 2016.
Actual Expenses
This section of the following table provides information about actual account values and actual expenses. You may use the information in this section, together with the amount you invested, to estimate the expenses that you incurred over the period. Simply divide your account value by $1,000 (for example, an $8,600 account value divided by $1,000 = 8.6), then multiply the result by the number in the first section under the heading entitled “Expenses Paid During Period” to estimate the expenses attributable to your investment during this period.
Hypothetical Example for
Comparison Purposes
This section of the following table provides information about hypothetical account values and hypothetical expenses based on the Funds’ actual expense ratios and assumed rates of return of 5% per year before expenses, which are not the Funds’ actual returns. Thus, you should not use the hypothetical account values and expenses to estimate the actual ending account balance or your expenses for the period. Rather, these figures are required to be provided to enable you to compare the ongoing costs of investing in the Funds with other funds. To do so, compare this 5% hypothetical example with the 5% hypothetical examples that appear in the shareholder reports of the other funds.
Please note that the expenses shown in the table are meant to highlight your ongoing costs only. Therefore, the Annualized Net Expense Ratio section of the table is useful in comparing ongoing costs only, and will not help you determine the relative total costs of owning different funds.
Beginning | Ending Account Value 4/30/16 | Expenses Paid During Period1 | Annualized Net Expense Ratio | |||||
WILMINGTON PRIME MONEY MARKET FUND | ||||||||
Actual | ||||||||
Administrative Class | $1,000.00 | $1,000.40 | $1.59 | 0.32% | ||||
Institutional Class | $1,000.00 | $1,000.40 | $1.59 | 0.32% | ||||
Select Class | $1,000.00 | $1,000.40 | $1.59 | 0.32% | ||||
Service Class | $1,000.00 | $1,000.10 | $1.89 | 0.38% | ||||
Hypothetical (assuming a 5% return before expenses) | ||||||||
Administrative Class | $1,000.00 | $1,023.27 | $1.61 | 0.32% | ||||
Institutional Class | $1,000.00 | $1,023.27 | $1.61 | 0.32% | ||||
Select Class | $1,000.00 | $1,023.27 | $1.61 | 0.32% | ||||
Service Class | $1,000.00 | $1,022.97 | $1.91 | 0.38% | ||||
WILMINGTON U.S. GOVERNMENT MONEY MARKET FUND | ||||||||
Actual | ||||||||
Administrative Class | $1,000.00 | $1,000.20 | $1.24 | 0.25% | ||||
Institutional Class | $1,000.00 | $1,000.20 | $1.09 | 0.22% | ||||
Select Class | $1,000.00 | $1,000.20 | $1.24 | 0.25% | ||||
Service Class | $1,000.00 | $1,000.10 | $1.34 | 0.27% | ||||
Hypothetical (assuming a 5% return before expenses) | ||||||||
Administrative Class | $1,000.00 | $1,023.62 | $1.26 | 0.25% | ||||
Institutional Class | $1,000.00 | $1,023.77 | $1.11 | 0.22% | ||||
Select Class | $1,000.00 | $1,023.62 | $1.26 | 0.25% | ||||
Service Class | $1,000.00 | $1,023.52 | $1.36 | 0.27% | ||||
| April 30, 2016 (unaudited) / ANNUAL REPORT |
| 5 |
| Beginning Account Value 11/01/15 | Ending Account Value 4/30/16 | Expenses Paid During Period1 | Annualized Net Expense Ratio | |||||
WILMINGTON U.S. TREASURY MONEY MARKET FUND | ||||||||
Actual | ||||||||
Administrative Class | $1,000.00 | $1,000.10 | $1.14 | 0.23% | ||||
Select Class | $1,000.00 | $1,000.10 | $1.14 | 0.23% | ||||
Service Class | $1,000.00 | $1,000.10 | $1.24 | 0.25% | ||||
Hypothetical (assuming a 5% return before expenses) | ||||||||
Administrative Class | $1,000.00 | $1,023.72 | $1.16 | 0.23% | ||||
Select Class | $1,000.00 | $1,023.72 | $1.16 | 0.23% | ||||
Service Class | $1,000.00 | $1,023.62 | $1.26 | 0.25% | ||||
WILMINGTON TAX-EXEMPT MONEY MARKET FUND | ||||||||
Actual | ||||||||
Administrative Class | $1,000.00 | $1,000.10 | $0.35 | 0.07% | ||||
Select Class | $1,000.00 | $1,000.10 | $0.35 | 0.07% | ||||
Service Class | $1,000.00 | $1,000.10 | $0.35 | 0.07% | ||||
Hypothetical (assuming a 5% return before expenses) | ||||||||
Administrative Class | $1,000.00 | $1,024.52 | $0.35 | 0.07% | ||||
Select Class | $1,000.00 | $1,024.52 | $0.35 | 0.07% | ||||
Service Class | $1,000.00 | $1,024.52 | $0.35 | 0.07% | ||||
| (1) | Expenses are equal to the Funds’ annualized net expense ratios, multiplied by the average account value over the period, multiplied by 182/366 (to reflect the most recent one-half year period). |
| ANNUAL REPORT / April 30, 2016 (unaudited) |
| 6 |
PORTFOLIO OF INVESTMENTS SUMMARY TABLE
Wilmington Prime Money Market Fund
At April 30, 2016, the Fund’s portfolio composition was as follows (unaudited):
| Percentage of Total Net Assets | ||
Other Commercial Paper | 49.0% | |
Financial Company Commercial Paper | 10.4% | |
Certificates of Deposit | 9.2% | |
U.S. Treasury Obligations | 7.7% | |
U.S. Government Agency Obligations | 6.1% | |
Repurchase Agreement | 5.5% | |
Asset-Backed Commercial Paper | 5.2% | |
Money Market Fund | 2.0% | |
Municipal Commercial Paper | 1.5% | |
Other Assets and Liabilities - Net1 | 3.4% | |
TOTAL | 100.0% |
| (1) | Assets, other than investments in securities, less liabilities. See Statement of Assets and Liabilities. |
April 30, 2016
Description | Par Value | Value | ||||||
ASSET-BACKED COMMERCIAL PAPER – 5.2%‡ |
| |||||||
Chariot Funding LLC, | ||||||||
0.67%, 7/21/16W | $ | 50,000,000 | $ | 50,000,000 | ||||
MetLife Short Term Fund LLC | ||||||||
0.56%, 7/18/16 | 25,000,000 | 24,970,208 | ||||||
0.61%, 7/11/16 | 40,000,000 | 39,952,667 | ||||||
0.63%, 5/02/16 | 38,462,000 | 38,461,338 | ||||||
Thunder Bay Funding LLC |
| |||||||
0.72%, 7/18/16 | 34,000,000 | 33,948,433 | ||||||
0.72%, 7/21/16 | 50,000,000 | 49,921,250 | ||||||
|
| |||||||
TOTAL ASSET-BACKED COMMERCIAL PAPER |
| |||||||
| (COST $237,253,896) | $ | 237,253,896 | ||||||
CERTIFICATES OF DEPOSIT – 9.2% |
| |||||||
Bank of America NA, | ||||||||
0.66%, 5/06/16 | 100,000,000 | 100,000,000 | ||||||
Bank Of Montreal, CHI | ||||||||
0.42%, 6/01/16 | 65,000,000 | 65,000,000 | ||||||
0.65%, 7/18/16 | 35,100,000 | 35,099,996 | ||||||
Toronto Dominion Bank, | ||||||||
0.88%, 10/17/16D | 50,000,000 | 50,000,000 | ||||||
Description | Par Value | Value | ||||||
Toronto Dominion Bank, NY, |
| |||||||
YCD, 0.66%, 6/01/16 | $ | 50,000,000 | $ | 50,000,000 | ||||
Wells Fargo Bank, NA, |
| |||||||
0.64%, 5/18/16 | 50,000,000 | 50,000,000 | ||||||
Westpac Banking Corp., NY, | ||||||||
0.57%, 5/27/16 | 66,000,000 | 66,006,550 | ||||||
|
| |||||||
TOTAL CERTIFICATES OF DEPOSIT |
| |||||||
| (COST $416,106,546) | $ | 416,106,546 | ||||||
FINANCIAL COMPANY COMMERCIAL PAPER – 10.4% |
| |||||||
American Honda Finance Corp., | ||||||||
1.01%, 5/26/16D,W | 21,505,000 | 21,512,600 | ||||||
Australia & New Zealand Banking Group Ltd. | ||||||||
0.55%, 7/26/16‡ | 65,000,000 | 64,916,150 | ||||||
0.65%, 5/23/16‡ | 35,000,000 | 35,003,719 | ||||||
Bank Of New York Mellon Corp., | ||||||||
0.29%, 5/02/16‡ | 150,000,000 | 149,998,833 | ||||||
Commonwealth Bank of Australia | ||||||||
0.55%, 5/13/16‡ | 50,000,000 | 49,977,500 | ||||||
0.57%, 5/13/16‡,W | 50,000,000 | 50,000,000 | ||||||
| April 30, 2016 / ANNUAL REPORT |
| PORTFOLIOS OF INVESTMENTS |
| 7 |
Wilmington Prime Money Market Fund (continued)
Description | Par Value | Value | ||||||
Svenska Handelsbanken AB | ||||||||
0.57%, 5/18/16‡ | $ | 25,000,000 | $ | 24,993,389 | ||||
0.63%, 7/05/16‡ | 75,000,000 | 74,922,812 | ||||||
|
| |||||||
| TOTAL FINANCIAL COMPANY COMMERCIAL PAPER | ||||||||
| (COST $471,325,003) | $ | 471,325,003 | ||||||
| MUNICIPAL COMMERCIAL PAPER – 1.5%‡ | ||||||||
Texas Public Finance Authority, |
| |||||||
0.43%, 5/03/16 | 31,774,000 | 31,774,000 | ||||||
University Of California, Revenue Taxable, | ||||||||
0.43%, 5/02/16 | 35,000,000 | 34,999,592 | ||||||
|
| |||||||
| TOTAL MUNICIPAL COMMERCIAL PAPER | ||||||||
| (COST $66,773,592) | $ | 66,773,592 | ||||||
| OTHER COMMERCIAL PAPER – 49.0%‡ | ||||||||
ABB Treasury Center USA |
| |||||||
0.41%, 5/02/16 | 30,000,000 | 29,999,667 | ||||||
0.41%, 5/03/16 | 45,000,000 | 44,999,000 | ||||||
Air Products & Chemicals, | ||||||||
0.42%, 5/04/16 | 25,000,000 | 24,999,146 | ||||||
Apple, Inc., | ||||||||
0.46%, 7/18/16 | 100,000,000 | 99,902,500 | ||||||
Archer-Daniles Midlands-Midland Co. | ||||||||
0.43%, 5/20/16 | 30,000,000 | 29,993,350 | ||||||
0.43%, 5/23/16 | 54,000,000 | 53,986,140 | ||||||
0.44%, 5/27/16 | 41,000,000 | 40,987,267 | ||||||
Army & Air Force Exchange, | ||||||||
0.33%, 5/02/16 | 117,000,000 | 116,998,960 | ||||||
BASF SE, | ||||||||
0.61%, 5/10/16 | 50,000,000 | 49,992,500 | ||||||
BMW US Capital LLC, | ||||||||
0.46%, 6/20/16 | 30,000,000 | 29,981,250 | ||||||
Cargill Global Funding PLC, | ||||||||
0.36%, 5/06/16 | 100,000,000 | 99,995,139 | ||||||
Chevron Corporation, | ||||||||
0.61%, 7/05/16 | 50,000,000 | 49,945,833 | ||||||
CIPPIB Capital, Inc. | ||||||||
0.58%, 6/17/16 | 50,000,000 | 49,962,792 | ||||||
0.58%, 7/01/16 | 50,000,000 | 49,951,708 | ||||||
General Electric Co., | ||||||||
0.33%, 5/06/16 | 100,000,000 | 99,995,556 | ||||||
Glaxosmithkline Financial PLC | ||||||||
0.43%, 5/06/16 | 75,000,000 | 74,995,625 | ||||||
0.59%, 7/27/16 | 25,000,000 | 24,964,958 | ||||||
Hershey Co., | ||||||||
0.41%, 5/04/16 | 30,000,000 | 29,999,000 | ||||||
IBM Corp., | ||||||||
0.45%, 6/21/16 | 45,000,000 | 44,971,631 | ||||||
Nestle Finance International Ltd. | ||||||||
0.56%, 6/20/16 | 50,000,000 | 49,961,806 | ||||||
0.61%, 7/07/16 | 56,000,000 | 55,937,467 | ||||||
Novartis Finance Corp. | ||||||||
0.47%, 6/06/16 | 45,000,000 | 44,979,300 | ||||||
Description | Par Value | Value | ||||||
0.48%, 5/16/16 | $ | 55,000,000 | $ | 54,989,229 | ||||
Ontario Teachers Finance Trust, |
| |||||||
0.67%, 7/08/16 | 20,000,000 | 19,975,067 | ||||||
Pfizer, Inc., | ||||||||
0.50%, 5/10/16 | 30,000,000 | 29,996,325 | ||||||
Philip Morris International, Inc. | ||||||||
0.46%, 5/25/16 | 50,000,000 | 49,985,000 | ||||||
0.46%, 6/02/16 | 50,000,000 | 49,980,000 | ||||||
Province of British Columbia | ||||||||
0.41%, 5/19/16 | 27,400,000 | 27,394,520 | ||||||
0.62%, 7/25/16 | 77,000,000 | 76,889,099 | ||||||
Province of Ontario, | ||||||||
0.43%, 6/21/16 | 50,000,000 | 49,970,250 | ||||||
Province of Quebec, | ||||||||
0.42%, 5/19/16 | 75,000,000 | 74,984,625 | ||||||
Roche Holdings, Inc. | ||||||||
0.50%, 5/06/16 | 59,000,000 | 58,995,985 | ||||||
0.50%, 5/09/16 | 39,390,000 | 39,385,711 | ||||||
San Diego Gas & Electric Co. | ||||||||
0.38%, 5/04/16 | 20,000,000 | 19,999,383 | ||||||
0.38%, 5/05/16 | 25,000,000 | 24,998,972 | ||||||
Siemens Capital Co. LLC, | ||||||||
0.51%, 6/20/16 | 100,000,000 | 99,930,556 | ||||||
Southern California Gas Co. | ||||||||
0.38%, 5/03/16 | 50,000,000 | 49,998,972 | ||||||
0.40%, 5/11/16 | 48,400,000 | 48,394,757 | ||||||
Total Capital Canada Ltd., | ||||||||
0.61%, 7/05/16 | 100,000,000 | 99,891,667 | ||||||
Total Capital SA, | ||||||||
0.34%, 5/02/16 | 50,000,000 | 49,999,542 | ||||||
Toyota Motor Credit Corp. |
| |||||||
0.56%, 7/25/16 | 50,000,000 | 49,935,069 | ||||||
0.63%, 7/05/16 | 50,000,000 | 49,944,028 | ||||||
|
| |||||||
| TOTAL OTHER COMMERCIAL PAPER | ||||||||
(COST $2,223,139,352) |
| $ | 2,223,139,352 | |||||
| U.S. GOVERNMENT AGENCY OBLIGATIONS – 6.1%‡ | ||||||||
Federal Home Loan Bank |
| |||||||
0.28%, 6/17/16 | 74,108,000 | 74,081,877 | ||||||
0.29%, 6/22/16 | 100,000,000 | 99,959,556 | ||||||
0.29%, 6/24/16 | 101,200,000 | 101,157,496 | ||||||
|
| |||||||
| TOTAL U.S. GOVERNMENT AGENCY OBLIGATIONS | ||||||||
| (COST $275,198,929) | $ | 275,198,929 | ||||||
| U.S. TREASURY OBLIGATIONS – 7.7% | ||||||||
U.S. TREASURY NOTES – 7.7% |
| |||||||
0.25%, 5/15/16 | 50,000,000 | 49,996,958 | ||||||
0.50%, 8/31/16 | 100,000,000 | 100,060,563 | ||||||
0.88%, 9/15/16 | 100,000,000 | 100,204,052 | ||||||
| ANNUAL REPORT / April 30, 2016 |
| 8 |
| PORTFOLIOS OF INVESTMENTS |
Wilmington Prime Money Market Fund (concluded)
Description | Par Value | Value | ||||||
1.75%, 5/31/16 | $ | 100,000,000 | $ | 100,111,979 | ||||
|
| |||||||
TOTAL U.S. TREASURY NOTES |
| $ | 350,373,552 | |||||
|
| |||||||
| TOTAL U.S. TREASURY OBLIGATIONS | ||||||||
| (COST $350,373,552) | $ | 350,373,552 | ||||||
| | Number of Shares | | ||||||
| MONEY MARKET FUND – 2.0% | ||||||||
BlackRock Liquidity Funds TempFund | ||||||||
Institutional Shares, 0.40%^ | 88,810,280 | $ | 88,810,280 | |||||
|
| |||||||
| TOTAL MONEY MARKET FUND | ||||||||
| (COST $88,810,280) | $ | 88,810,280 | ||||||
Description | Par Value | Value | ||||||
| REPURCHASE AGREEMENT – 5.5% | ||||||||
Credit Suisse First Boston LLC, 0.28%, dated 4/29/16, due 5/02/16, repurchase price $251,005,857 collateralized by U.S. Treasury Securities 1.38% to 3.63%, maturing 8/15/19 to 3/31/20; total market value of $256,020,369. | $ | 251,000,000 | $ | 251,000,000 | ||||
|
| |||||||
| TOTAL REPURCHASE AGREEMENT | ||||||||
| (COST $251,000,000) | $ | 251,000,000 | ||||||
| TOTAL INVESTMENTS – 96.6% | ||||||||
| (COST $4,379,981,150) | $ | 4,379,981,150 | ||||||
| OTHER ASSETS LESS LIABILITIES – 3.4% | 155,991,284 | |||||||
|
| |||||||
| TOTAL NET ASSETS – 100.0% | $ | 4,535,972,434 | ||||||
|
| |||||||
Cost of investments for Federal income tax purposes is the same as for financial statement purposes.
Various inputs are used in determining the value of the Fund’s investments. These inputs are summarized in the three broad levels listed below.
Level 1 – quoted prices in active markets for identical securities
Level 2 – other significant observable inputs (including quoted prices for similar securities, interest rates, prepayment speeds, credit risk, etc.)
Level 3 – significant unobservable inputs (including the Fund’s own assumptions in determining the fair value of investments)
The following is a summary of the inputs used as of April 30, 2016 in valuing the Fund’s assets carried at fair value:
| Level 1 | Level 2 | Level 3 | Total | |||||||||||||
Investments in Securities | ||||||||||||||||
Asset-Backed Commercial Paper | $ | — | $ | 237,253,896 | $ | — | $ | 237,253,896 | ||||||||
Certificates of Deposit | — | 416,106,546 | — | 416,106,546 | ||||||||||||
Financial Company Commercial Paper | — | 471,325,003 | — | 471,325,003 | ||||||||||||
Municipal Commercial Paper | — | 66,773,592 | — | 66,773,592 | ||||||||||||
Other Commercial Paper | — | 2,223,139,352 | — | 2,223,139,352 | ||||||||||||
U.S. Government Agency Obligations | — | 275,198,929 | — | 275,198,929 | ||||||||||||
U.S. Treasury Obligations | — | 350,373,552 | — | 350,373,552 | ||||||||||||
Money Market Fund | 88,810,280 | — | — | 88,810,280 | ||||||||||||
Repurchase Agreement | — | 251,000,000 | — | 251,000,000 | ||||||||||||
|
|
|
|
|
|
|
| |||||||||
Total | $ | 88,810,280 | $ | 4,291,170,870 | $ | — | $ | 4,379,981,150 | ||||||||
|
|
|
|
|
|
|
|
| D | Floating rate note with current rate and stated maturity date shown. |
| ‡ | The rate shown reflects the effective yield at purchase date. |
| W | Denotes a restricted security that may be resold without restriction to “qualified institutional buyers” as defined in Rule 144A under the Securities Act of 1933 and that the Fund has determined to be liquid under criteria established by the Fund’s Board of Trustees. At April 30, 2016, these liquid restricted securities amounted to $121,512,600, representing 2.7% of net assets. |
| ^ | 7-Day net yield. |
The following acronyms are used throughout this Fund:
CHI - Chicago
LLC - Limited Liability Corporation
NA - North America
NY - New York
PLC - Private Limited Company
See Notes which are an integral part of the Financial Statements
| April 30, 2016 / ANNUAL REPORT |
| 9 |
PORTFOLIO OF INVESTMENTS SUMMARY TABLE
Wilmington U.S. Government Money Market Fund
At April 30, 2016, the Fund’s portfolio composition was as follows (unaudited):
| Percentage of Total Net Assets | ||||
U.S. Government Agency Obligations | 63.5% | |||
Repurchase Agreements | 18.7% | |||
U.S. Treasury Obligations | 10.4% | |||
Other Assets and Liabilities – Net1 | 7.4% | |||
TOTAL | 100.0% | |||
| (1) | Assets, other than investments in securities, less liabilities. See Statement of Assets and Liabilities. |
PORTFOLIO OF INVESTMENTS
April 30, 2016
Description | Par Value | Value | ||||||
| U.S. GOVERNMENT AGENCY OBLIGATIONS – 63.5% | ||||||||
FEDERAL NATIONAL MORTGAGE ASSOCIATION |
| |||||||
0.37%, 5/02/16 | $ 58,055,000 | $ 58,054,419 | ||||||
0.38%, 6/21/16 | 50,000,000 | 49,973,792 | ||||||
0.38%, 7/01/16 | 50,000,000 | 49,968,653 | ||||||
0.52%, 7/13/16 | 50,000,000 | 49,948,799 | ||||||
0.41%, 7/18/16 | 25,000,000 | 24,978,333 | ||||||
TOTAL FEDERAL NATIONAL MORTGAGE ASSOCIATION (FNMA) |
| $ 232,923,996 | ||||||
FEDERAL FARM CREDIT BANK (FFCB) – 18.2% |
| |||||||
0.38%, 6/01/16D | 150,000,000 | 150,000,000 | ||||||
0.43%, 7/15/16‡ | 22,000,000 | 21,980,750 | ||||||
0.42%, 9/22/16D | 97,000,000 | 96,998,068 | ||||||
0.41%, 10/24/16D | 100,000,000 | 99,996,348 | ||||||
0.44%, 10/25/16D | 150,000,000 | 150,000,000 | ||||||
0.38%, 2/15/17D | 100,000,000 | 100,000,000 | ||||||
TOTAL FEDERAL FARM CREDIT BANK (FFCB) |
| $ 618,975,166 | ||||||
FEDERAL HOME LOAN BANK (FHLB) – 30.3%‡ |
| |||||||
0.43%, 5/06/16 | 25,100,000 | 25,098,536 | ||||||
0.31%, 5/10/16 | 22,500,000 | 22,498,313 | ||||||
0.39%, 5/11/16 | 100,000,000 | 99,989,306 | ||||||
0.26%, 5/31/16 | 50,000,000 | 49,989,167 | ||||||
0.39%, 6/01/16 | 26,055,000 | 26,046,474 | ||||||
0.30%, 6/13/16 | 75,000,000 | 74,973,573 | ||||||
0.31%, 6/15/16 | 9,000,000 | 8,996,625 | ||||||
0.34%, 6/29/16 | 89,400,000 | 89,351,650 | ||||||
0.35%, 7/05/16 | 100,000,000 | 99,938,611 | ||||||
Description | Par Value | Value | ||||||
0.31%, 7/06/16 | $ | 23,000,000 | $ 22,987,350 | |||||
0.36%, 7/13/16 | 50,000,000 | 49,964,514 | ||||||
0.57%, 7/15/16 | 175,000,000 | 174,838,854 | ||||||
0.35%, 7/20/16 | 86,000,000 | 85,934,067 | ||||||
0.35%, 7/22/16 | 50,000,000 | 49,961,278 | ||||||
0.41%, 7/25/16 | 50,000,000 | 49,952,778 | ||||||
0.51%, 9/19/16 | 50,000,000 | 49,902,083 | ||||||
0.43%, 9/27/16 | 50,000,000 | 49,913,083 | ||||||
TOTAL FEDERAL HOME LOAN BANK (FHLB) |
| $1,030,336,262 | ||||||
FEDERAL HOME LOAN MORTGAGE CORPORATION (FHLMC) – 8.2%‡ |
| |||||||
0.38%, 7/06/16 | 100,000,000 | 99,932,167 | ||||||
0.33%, 6/23/16 | 27,675,000 | 27,661,962 | ||||||
0.39%, 7/07/16 | 50,000,000 | 49,964,639 | ||||||
0.37%, 9/06/16 | 100,000,000 | 99,872,000 | ||||||
TOTAL FEDERAL HOME LOAN MORTGAGE CORPORATION (FHLMC) |
| $ 277,430,768 | ||||||
| TOTAL U.S. GOVERNMENT AGENCY OBLIGATIONS | ||||||||
| (COST $2,159,666,192) | $2,159,666,192 | |||||||
| U.S. TREASURY OBLIGATIONS – 10.4% | ||||||||
U.S. TREASURY BILLS – 1.5% |
| |||||||
0.31%, 5/12/16‡ | 50,000,000 | 49,995,256 | ||||||
U.S. TREASURY NOTES – 8.9% |
| |||||||
0.25%, 5/15/16 | 50,000,000 | 49,996,958 | ||||||
1.75%, 5/31/16 | 100,000,000 | 100,111,979 | ||||||
0.50%, 6/15/16 | 25,000,000 | 25,003,995 | ||||||
| ANNUAL REPORT / April 30, 2016 |
| 10 |
| PORTFOLIOS OF INVESTMENTS |
Wilmington U.S. Government Money Market Fund (continued)
Description | Par Value | Value | ||||||
0.63%, 8/15/16 | $ | 30,000,000 | $ | 30,013,202 | ||||
0.50%, 8/31/16 | 100,000,000 | 100,060,563 | ||||||
|
| |||||||
TOTAL U.S. TREASURY NOTES |
| $ | 305,186,697 | |||||
|
| |||||||
| TOTAL U.S. TREASURY OBLIGATIONS | ||||||||
| (COST $355,181,953) | $ | 355,181,953 | ||||||
| REPURCHASE AGREEMENTS – 18.7% | ||||||||
Credit Suisse First Boston LLC, 0.28%, dated 4/29/16, due 5/02/16, repurchase price $251,005,857 collateralized by U.S. Treasury Security 3.63%, maturing 8/15/19; total market value of $256,022,456. | 251,000,000 | 251,000,000 | ||||||
Deutsche Bank Securities, Inc., 0.30%, dated 4/29/16, due 5/02/16, repurchase price $30,000,750, collateralized by U.S. Treasury Security 1.63%, maturing 11/30/20; total market value of $30,600,090. | 30,000,000 | 30,000,000 | ||||||
TD Securities, Inc., 0.28%, dated 4/29/16, due 5/02/16, repurchase price $192,004,480, collateralized by U.S. Government Securities 3.00% to 4.50%, maturing 3/01/26 to 9/01/44; total market value of $197,760,000. | 192,000,000 | 192,000,000 | ||||||
Description | Par Value | Value | ||||||
TD Securities, Inc., 0.29%, dated 4/29/16, due 5/02/16, repurchase price $165,003,988, collateralized by U.S. Government Securities 3.50% to 4.00%, maturing 8/01/26 to 1/01/46; total market value of $169,950,001. | $ | 165,000,000 | $ | 165,000,000 | ||||
|
| |||||||
| TOTAL REPURCHASE AGREEMENTS | ||||||||
| (COST $638,000,000) | $ | 638,000,000 | ||||||
|
| |||||||
| TOTAL INVESTMENTS – 92.6% | ||||||||
| (COST $3,152,848,145) | $ | 3,152,848,145 | ||||||
| OTHER ASSETS LESS LIABILITIES – 7.4% | 250,908,841 | |||||||
|
| |||||||
| TOTAL NET ASSETS – 100.0% | $ | 3,403,756,986 | ||||||
|
| |||||||
Cost of investments for Federal income tax purposes is the same as for financial statement purposes.
| April 30, 2016 / ANNUAL REPORT |
| PORTFOLIOS OF INVESTMENTS |
| 11 |
Wilmington U.S. Government Money Market Fund (concluded)
Various inputs are used in determining the value of the Fund’s investments. These inputs are summarized in the three broad levels listed below.
Level 1 – quoted prices in active markets for identical securities
Level 2 – other significant observable inputs (including quoted prices for similar securities, interest rates, prepayment speeds, credit risk, etc.)
Level 3 – significant unobservable inputs (including the Fund’s own assumptions in determining the fair value of investments)
The following is a summary of the inputs used as of April 30, 2016 in valuing the Fund’s assets carried at fair value:
|
Level 1 |
| Level 2 | Level 3 | Total | |||||||||||
Investments in Securities | ||||||||||||||||
U.S. Government Agency Obligations
| $ | — | $ | 2,159,666,192 | $ | — | $ | 2,159,666,192 | ||||||||
U.S. Treasury Obligations | — | 355,181,953 | — | 355,181,953 | ||||||||||||
Repurchase Agreements
| — | 638,000,000 | — | 638,000,000 | ||||||||||||
|
|
|
|
|
|
|
| |||||||||
Total
| $ | — | $ | 3,152,848,145 | $ | — | $ | 3,152,848,145 | ||||||||
|
|
|
|
|
|
|
|
| D | Floating rate note with current rate and stated maturity date shown. |
| ‡ | The rate shown reflects the effective yield at purchase date. |
The following acronyms are used throughout this Fund:
FFCB - Federal Farm Credit Bank
FHLB - Federal Home Loan Bank
FHLMC - Federal Home Loan Mortgage Corporation
FNMA - Federal National Mortgage Association
LLC - Limited Liability Corporation
See Notes which are an integral part of the Financial Statements
| ANNUAL REPORT / April 30, 2016 |
| 12 |
PORTFOLIO OF INVESTMENTS SUMMARY TABLE
Wilmington U.S. Treasury Money Market Fund
At April 30, 2016, the Fund’s portfolio composition was as follows (unaudited):
| Percentage of Total Net Assets | |||||
U.S. Treasury Obligations | 71.4 | % | |||
Repurchase Agreements | 11.5 | % | |||
Other Assets and Liabilities – Net1 | 17.1 | % | |||
|
| ||||
TOTAL | 100.0 | % | |||
|
| ||||
| (1) | Assets, other than investments in securities, less liabilities. See Statement of Assets and Liabilities. |
PORTFOLIO OF INVESTMENTS
April 30, 2016
Description | Par Value | Value | ||||||
U.S. TREASURY OBLIGATIONS – 71.4% |
| |||||||
U.S. TREASURY BILLS – 22.5%‡ |
| |||||||
0.31%, 5/12/16 | $ | 50,000,000 | $ | 49,995,340 | ||||
0.32%, 5/26/16 | 50,000,000 | 49,989,028 | ||||||
0.23%, 7/21/16 | 50,000,000 | 49,974,575 | ||||||
0.25%, 7/28/16 | 50,000,000 | 49,969,811 | ||||||
|
| |||||||
TOTAL U.S. TREASURY BILLS |
| $ | 199,928,754 | |||||
U.S. TREASURY NOTES – 48.9% |
| |||||||
0.50%, 6/15/16 | 50,000,000 | 50,007,990 | ||||||
0.63%, 7/15/16 | 75,000,000 | 75,033,191 | ||||||
0.32%, 7/31/16D | 50,000,000 | 50,001,137 | ||||||
0.63%, 8/15/16 | 70,000,000 | 70,053,334 | ||||||
0.50%, 8/31/16 | 40,000,000 | 40,024,225 | ||||||
0.88%, 9/15/16 | 50,000,000 | 50,102,026 | ||||||
0.30%, 10/31/16D | 100,000,000 | 99,981,407 | ||||||
|
| |||||||
TOTAL U.S. TREASURY NOTES |
| $ | 435,203,310 | |||||
|
| |||||||
TOTAL U.S. TREASURY OBLIGATIONS |
| |||||||
(COST $635,132,064) | $ | 635,132,064 | ||||||
Description | Par Value | Value | ||||||
REPURCHASE AGREEMENTS – 11.5% |
| |||||||
Credit Suisse First Boston LLC, 0.28%, dated 4/29/16, due 5/02/16, repurchase price $82,001,913 collateralized by U.S. Treasury Security 1.63%, maturing 3/31/19;total market value of $83,640,501. | $ | 82,000,000 | $ | 82,000,000 | ||||
Deutsche Bank Securities, Inc., 0.30%,dated 4/29/16, due 5/02/16, repurchase price $20,000,500, collateralized by U.S. Treasury Security 1.63%, maturing 11/30/20; total market value of $20,400,060. | 20,000,000 | 20,000,000 | ||||||
|
| |||||||
TOTAL REPURCHASE AGREEMENTS |
| |||||||
(COST $102,000,000) | $ | 102,000,000 | ||||||
|
| |||||||
TOTAL INVESTMENTS – 82.9% |
| |||||||
(COST $737,132,064) | $ | 737,132,064 | ||||||
| OTHER ASSETS LESS LIABILITIES – 17.1% | 151,839,640 | |||||||
|
| |||||||
TOTAL NET ASSETS – 100.0% |
| $ | 888,971,704 | |||||
|
| |||||||
Cost of investments for Federal income tax purposes is the same as for financial statement purposes.
| April 30, 2016 / ANNUAL REPORT |
| PORTFOLIOS OF INVESTMENTS |
| 13 |
Wilmington U.S. Treasury Money Market Fund (concluded)
Various inputs are used in determining the value of the Fund’s investments. These inputs are summarized in the three broad levels listed below.
Level 1 – quoted prices in active markets for identical securities
Level 2 – other significant observable inputs (including quoted prices for similar securities, interest rates, prepayment speeds, credit risk, etc.)
Level 3 – significant unobservable inputs (including the Fund’s own assumptions in determining the fair value of investments)
The following is a summary of the inputs used as of April 30, 2016 in valuing the Fund’s assets carried at fair value:
|
Level 1 |
| Level 2 | Level 3 | Total | |||||||||||
Investments in Securities | ||||||||||||||||
U.S. Treasury Obligations
| $ | — | $ | 635,132,064 | $ | — | $ | 635,132,064 | ||||||||
Repurchase Agreements | — | 102,000,000 | — | 102,000,000 | ||||||||||||
|
|
|
|
|
|
|
| |||||||||
Total | $ | — | $ | 737,132,064 | $ | — | $ | 737,132,064 | ||||||||
|
|
|
|
|
|
|
|
| D | Floating rate note with current rate and stated maturity date shown. |
| ‡ | The rate shown reflects the effective yield at purchase date. |
The following acronym is used throughout this Fund:
LLC - Limited Liability Corporation
See Notes which are an integral part of the Financial Statements
| ANNUAL REPORT / April 30, 2016 |
| 14 |
PORTFOLIO OF INVESTMENTS SUMMARY TABLE
Wilmington Tax-Exempt Money Market Fund
At April 30, 2016, the Fund’s geographical location classifications were as follows (unaudited):
| Percentage of | ||||
| Total Net Assets | ||||
Texas | 19.6% | |||
Maryland | 9.1% | |||
Massachusetts | 8.0% | |||
Minnesota | 7.8% | |||
Virginia | 7.4% | |||
Delaware | 6.4% | |||
North Carolina | 4.9% | |||
Pennsylvania | 4.7% | |||
Nevada | 4.2% | |||
Illinois | 4.0% | |||
Michigan | 4.0% | |||
Connecticut | 3.9% | |||
Tennessee | 3.8% | |||
Utah | 3.6% | |||
Louisiana | 3.5% | |||
Ohio | 2.2% | |||
Florida | 1.1% | |||
New Hampshire | 0.9% | |||
Oklahoma | 0.7% | |||
New York | 0.2% | |||
Other Assets and Liabilities – Net1 | 0.0%2 | |||
TOTAL | 100.0% | |||
| (1) | Assets, other than investments in securities, less liabilities. See Statement of Assets and Liabilities. |
| (2) | Represent less than 0.05%. |
PORTFOLIO OF INVESTMENTS
April 30, 2016
Description | Par Value | Value | ||||||
| COMMERCIAL PAPER – 64.7% | ||||||||
CONNECTICUT – 3.9% | ||||||||
Connecticut State, Health & Educational | ||||||||
Facility - Yale University, Revenue Bonds | ||||||||
(Series V-1) | ||||||||
0.10%, 5/04/16 | $ 16,290,000 | $ 16,290,000 | ||||||
0.04%, 5/05/16 | 4,000,000 | 4,000,000 | ||||||
TOTAL CONNECTICUT | $ 20,290,000 | |||||||
ILLINOIS – 4.0% | ||||||||
Illinois Educational Facilities Authority, | ||||||||
0.50%, 6/07/16 | 20,793,000 | 20,793,000 | ||||||
TOTAL ILLINOIS | $ 20,793,000 | |||||||
Description | Par Value | Value | ||||||
MARYLAND – 7.8% | ||||||||
Johns Hopkins University |
| |||||||
0.04%, 5/05/16‡ | $ 5,000,000 | $ 5,000,000 | ||||||
0.05%, 5/05/16‡ | 12,000,000 | 12,000,000 | ||||||
0.07%, 5/05/16‡ | 3,000,000 | 3,000,000 | ||||||
Montgomery County, MD, General Obligation | ||||||||
Unlimited Refunding Notes, BANs | ||||||||
0.45%, 5/05/16 | 7,100,000 | 7,100,000 | ||||||
0.46%, 5/05/16 | 8,750,000 | 8,750,000 | ||||||
0.10%, 5/16/16 | 5,000,000 | 5,000,000 | ||||||
TOTAL MARYLAND | $ 40,850,000 | |||||||
MASSACHUSETTS – 8.0% |
| |||||||
Massachusetts Bay Transportation Authority, 0.47%, 5/06/16 | 21,475,000 | 21,475,000 | ||||||
| April 30, 2016 / ANNUAL REPORT |
| PORTFOLIOS OF INVESTMENTS |
| 15 |
Wilmington Tax-Exempt Money Market Fund (continued)
Description | Par Value | Value | ||||||
Massachusetts Health & Educational | ||||||||
Facilities Authority, Revenue Bonds, Harvard University, (Series EE), | ||||||||
0.40%, 5/09/16 | $ 20,403,000 | $ 20,403,000 | ||||||
TOTAL MASSACHUSETTS |
| $ 41,878,000 | ||||||
MICHIGAN – 4.0% |
| |||||||
University of Michigan | ||||||||
0.05%, 5/05/16 | 12,795,000 | 12,795,000 | ||||||
0.47%, 6/17/16 | 8,000,000 | 8,000,000 | ||||||
TOTAL MICHIGAN | $ 20,795,000 | |||||||
MINNESOTA – 6.1% |
| |||||||
City of Rochester, MN, Health Care Facilities, | ||||||||
Revenue Bonds, (Series 2000-C), (Mayo | ||||||||
Clinic, OBG), | ||||||||
0.06%, 5/17/16 | 12,000,000 | 12,000,000 | ||||||
University of Minnesota | ||||||||
0.07%, 5/04/16 | 3,000,000 | 3,000,000 | ||||||
0.10%, 5/04/16 | 17,000,000 | 17,000,000 | ||||||
TOTAL MINNESOTA | $ 32,000,000 | |||||||
NEVADA – 4.2% |
| |||||||
Las Vegas Valley Water District, NV, General | ||||||||
Obligation Notes, (Series 2004-A), | ||||||||
0.50%, 6/07/16 | 22,000,000 | 22,000,000 | ||||||
TOTAL NEVADA | $ 22,000,000 | |||||||
NORTH CAROLINA – 4.3% |
| |||||||
North Carolina Capital Facilities Finance | ||||||||
Agency, Educational Facilities Revenue | ||||||||
Bonds, (Duke University) | ||||||||
0.45%, 6/01/16 | 2,545,000 | 2,545,000 | ||||||
0.48%, 6/08/16 | 4,662,000 | 4,662,000 | ||||||
University of North Carolina | ||||||||
0.25%, 5/12/16 | 5,000,000 | 5,000,000 | ||||||
0.38%, 5/12/16 | 10,000,000 | 10,000,000 | ||||||
TOTAL NORTH CAROLINA |
| $ 22,207,000 | ||||||
OHIO – 2.2% | ||||||||
Ohio Higher Educational Facility | ||||||||
Commission, (Case Western University) | ||||||||
0.09%, 5/24/16 | 8,110,000 | 8,110,000 | ||||||
0.09%, 5/24/16 | 3,500,000 | 3,500,000 | ||||||
TOTAL OHIO | $ 11,610,000 | |||||||
TENNESSEE – 3.8% | ||||||||
State of Tennessee, (Series 00-A), | ||||||||
0.54%, 5/17/16 | 20,000,000 | 20,000,000 | ||||||
TOTAL TENNESSEE | $ 20,000,000 | |||||||
TEXAS – 12.5% | ||||||||
Dallas Area Rapid Transit (Series - I), | ||||||||
0.48%, 6/16/16 | 20,000,000 | 20,000,000 | ||||||
Description | Par Value | Value | ||||||
San Antonio Texas Electric & Gas Systems, | ||||||||
0.53%, 6/02/16 | $ 12,000,000 | $ 12,000,000 | ||||||
Texas Public Finance Authority, | ||||||||
0.48%, 6/06/16 | 10,860,000 | 10,860,000 | ||||||
University of Houston, (Series A), | ||||||||
0.09%, 5/17/16 | 2,600,000 | 2,600,000 | ||||||
University of Texas, | ||||||||
0.48%, 6/09/16 | 20,000,000 | 20,000,000 | ||||||
TOTAL TEXAS | $ 65,460,000 | |||||||
VIRGINIA – 3.9% |
| |||||||
University of Virginia | ||||||||
0.07%, 5/04/16 | 16,400,000 | 16,400,000 | ||||||
0.09%, 5/17/16 | 4,000,000 | 4,000,000 | ||||||
TOTAL VIRGINIA | $ 20,400,000 | |||||||
TOTAL COMMERCIAL PAPER (COST $338,283,000) |
| $ 338,283,000 | ||||||
| MUNICIPAL BONDS – 15.8%¿ | ||||||||
FLORIDA – 0.5% | ||||||||
JEA Electric System Revenue, Refunding | ||||||||
Revenue Bonds, Daily VRDNs, (Series | ||||||||
2001-D), (U.S. Bank, SPA), | 2,800,000 | 2,800,000 | ||||||
TOTAL FLORIDA | $ 2,800,000 | |||||||
LOUISIANA – 1.5% | ||||||||
Louisiana State Public Facilities Authority, | ||||||||
(Air Products & Chemicals), Revenue Bonds, Weekly VRDNs, 0.39%, 5/08/16 | 8,000,000 | 8,000,000 | ||||||
TOTAL LOUISIANA | $ 8,000,000 | |||||||
MARYLAND – 1.3% | ||||||||
Maryland State, Health and Higher Education Facilities Authority, Refunding | ||||||||
Revenue Bonds, Weekly VRDNs, (Series B), | ||||||||
0.40%, 5/08/16 | 6,800,000 | 6,800,000 | ||||||
TOTAL MARYLAND | $ 6,800,000 | |||||||
NEW YORK – 0.2% |
| |||||||
New York City, NY, General Obligation Bonds, (Series H-2), Daily VRDNs, (JP Morgan | ||||||||
Chase Bank N.A., SPA), 0.32%, 5/02/16 | 1,000,000 | 1,000,000 | ||||||
TOTAL NEW YORK | $ 1,000,000 | |||||||
NORTH CAROLINA – 0.6% |
| |||||||
University of North Carolina, Weekly VRDNs, | 3,200,000 | 3,200,000 | ||||||
TOTAL NORTH CAROLINA |
| $ 3,200,000 | ||||||
PENNSYLVANIA – 4.7% |
| |||||||
Geisinger Authority, PA, Revenue Bonds, (Series B), Daily VRDNs, (Healthcare System, OBG), (U.S. Bank, SPA), | 20,000,000 | 20,000,000 | ||||||
ANNUAL REPORT / April 30, 2016 |
| 16 |
| PORTFOLIOS OF INVESTMENTS |
Wilmington Tax-Exempt Money Market Fund (continued)
Description | Par Value | Value | ||||||
Philadelphia, PA, Hospitals and Higher Education Facilities Authority, Hospital Revenue, Refunding Bonds, Daily VRDNs, (Children’s Hospital of Philadelphia), (Wells Fargo Bank, SPA), 0.29%, 5/02/16 | $ 4,500,000 | $ 4,500,000 | ||||||
TOTAL PENNSYLVANIA | $ 24,500,000 | |||||||
TEXAS – 5.1% | ||||||||
City of Houston, TX, Combined Utility System, Weekly VRDNs, (Wells Fargo Bank, SPA), 0.41%, 5/08/16 | 5,000,000 | 5,000,000 | ||||||
Harris County, TX, (The Methodist Hospital), | ||||||||
Daily VRDNs | ||||||||
0.28%, 5/02/16 | 20,200,000 | 20,200,000 | ||||||
0.47%, 5/05/16 | 1,175,000 | 1,175,000 | ||||||
TOTAL TEXAS | $ 26,375,000 | |||||||
UTAH – 1.9% | ||||||||
Utah County Hospital, Refunding Revenue Bonds (Series C), Weekly VRDNs, (IHC Health Services, Inc.), (U.S. Bank, SPA), 0.39%, 5/08/16 | 10,000,000 | 10,000,000 | ||||||
TOTAL UTAH | $ 10,000,000 | |||||||
TOTAL MUNICIPAL BONDS (COST $82,675,000) | $ 82,675,000 | |||||||
| SHORT-TERM MUNICIPAL BONDS – 19.5%¿ | ||||||||
DELAWARE – 6.4% | ||||||||
Delaware State Health Facilities Authority, Refunding Revenue Bonds, (Series A), Daily VRDNs, (Christiana Care Health Services, OBG), 0.28%, 5/02/16 | 13,500,000 | 13,500,000 | ||||||
Delaware State Health Facilities Authority, Refunding Revenue Bonds, (Series A), Weekly VRDNs, (Christiana Care Health Services, OBG), 0.37%, 5/08/16 | 4,000,000 | 4,000,000 | ||||||
University of Delaware, Revenue Bonds, (Series B), Daily VRDNs, (University & College Imps.)/(Bank of America N.A., SPA), 0.29%, 5/02/16 | 4,500,000 | 4,500,000 | ||||||
University of Delaware, Revenue Bonds, Daily VRDNs, (TD Bank N.A., SPA), 0.29%, 5/02/16 | 11,660,000 | 11,660,000 | ||||||
TOTAL DELAWARE | $ 33,660,000 | |||||||
FLORIDA – 0.6% | ||||||||
Orange County Housing Finance Authority, FL, Refunding Revenue Bonds, Weekly VRDNs, (Fannie Mae), 0.39%, 5/08/16 | 3,180,000 | 3,180,000 | ||||||
TOTAL FLORIDA | $ 3,180,000 | |||||||
LOUISIANA – 2.0% | ||||||||
Louisiana State Public Facilities Authority, (Air Products & Chemicals), Daily VRDNs, 0.28%, 5/02/16 | 6,300,000 | 6,300,000 | ||||||
Description | Par Value | Value | ||||||
Louisiana State Public Facilities Authority, (Air Products & Chemicals), Revenue Bonds, (Series C), Daily VRDNs, 0.28%, 5/02/16 | $ 3,900,000 | $ 3,900,000 | ||||||
TOTAL LOUISIANA | $ 10,200,000 | |||||||
MINNESOTA – 1.7% | ||||||||
City of Rochester, MN, Refunding Revenue Bonds, (Series A) Weekly VRDNs, (Mayo Clinic, OBG), 0.39%, 5/08/16 | 8,900,000 | 8,900,000 | ||||||
TOTAL MINNESOTA | $ 8,900,000 | |||||||
NEW HAMPSHIRE – 0.9% |
| |||||||
New Hampshire HEFA, Revenue Bonds, Weekly VRDNs, (Dartmouth College, OBG)/(U.S. Bank N.A., SPA), 0.39%, 5/08/16 | 4,775,000 | 4,775,000 | ||||||
TOTAL NEW HAMPSHIRE |
| $ 4,775,000 | ||||||
OKLAHOMA – 0.7% | ||||||||
Oklahoma State Turnpike Authority, Revenue Bonds, (Series F), Daily VRDNs, (JP Morgan Chase Bank N.A., SPA), 0.30%, 5/02/16 | 3,700,000 | 3,700,000 | ||||||
TOTAL OKLAHOMA | $ 3,700,000 | |||||||
TEXAS – 2.0% | ||||||||
State of Texas, GO Unlimited Notes, (Series B), Weekly VRDNs, (State Street / CalPERS, SPA), 0.40%, 5/08/16 | 10,480,000 | 10,480,000 | ||||||
TOTAL TEXAS | $ 10,480,000 | |||||||
UTAH – 1.7% | ||||||||
City of Murray, UT, Hospital Revenue Bonds, (Series D), Daily VRDNs, (IHC Health Services, Inc., OBG), 0.27%, 5/02/16 | 9,100,000 | 9,100,000 | ||||||
TOTAL UTAH | $ 9,100,000 | |||||||
VIRGINIA – 3.5% | ||||||||
Loudoun County Industrial Development Authority, Revenue Bonds, (Series D), Weekly VDRNs, (Howard Hughes Medical Center), 0.39%, 5/08/16 | 18,000,000 | 18,000,000 | ||||||
TOTAL VIRGINIA | $ 18,000,000 | |||||||
| TOTAL SHORT-TERM MUNICIPAL BONDS | ||||||||
| (COST $101,995,000) | $ 101,995,000 | |||||||
| TOTAL INVESTMENTS – 100.0% | ||||||||
| (COST $522,953,000) | 522,953,000 | |||||||
OTHER ASSETS LESS LIABILITIES – |
| 25,388 | ||||||
| TOTAL NET ASSETS – 100.0% | $ 522,978,388 | |||||||
Cost of investments for Federal income tax purposes is the same as for financial statement purposes.
| April 30, 2016 / ANNUAL REPORT |
| PORTFOLIOS OF INVESTMENTS |
| 17 |
Wilmington Tax-Exempt Money Market Fund (concluded)
Various inputs are used in determining the value of the Fund’s investments. These inputs are summarized in the three broad levels listed below.
Level 1 – quoted prices in active markets for identical securities
Level 2 – other significant observable inputs (including quoted prices for similar securities, interest rates, prepayment speeds, credit risk, etc.)
Level 3 – significant unobservable inputs (including the Fund’s own assumptions in determining the fair value of investments)
The following is a summary of the inputs used as of April 30, 2016 in valuing the Fund’s assets carried at fair value:
|
Level 1 |
| Level 2 | Level 3 | Total | |||||||||||
Investments in Securities | ||||||||||||||||
Commercial Paper | $ | — | $ | 338,283,000 | $ | — | $ | 338,283,000 | ||||||||
Municipal Bonds | — | 82,675,000 | — | 82,675,000 | ||||||||||||
Short-Term Municipal Bonds | — | 101,995,000 | — | 101,995,000 | ||||||||||||
|
|
|
|
|
|
|
| |||||||||
Total | $ | — | $ | 522,953,000 | $ | — | $ | 522,953,000 | ||||||||
|
|
|
|
|
|
|
|
| ¿ | Variable rate demand note with current rate shown. Date shown is the date on which the Fund can unconditionally demand payment. |
| ‡ | The rate shown reflects the effective yield at purchase date. |
| ** | Represents less than 0.05%. |
The following acronyms are used throughout this Fund:
BANs - Bond Anticipation Notes
GO - General Obligation
HEFA - Health and Educational Facilities Authority
MD - Maryland
MN - Minnesota
N.A. - North America
NV - Nevada
NY - New York
OBG - Obligation
PA - Pennsylvania
SPA - Sales and Purchase Agreement
TX - Texas
UT - Utah
VRDNs - Variable Rate Demand Notes
See Notes which are an integral part of the Financial Statements
| ANNUAL REPORT / April 30, 2016 |
| 18 |
April 30, 2016 |
| Wilmington Prime Money Market |
| | Wilmington U.S. Government Money Market Fund | |
| Wilmington U.S. Treasury Money Market Fund |
|
| Wilmington Tax-Exempt Fund |
| ||||||||||||||||||
| ASSETS: | ||||||||||||||||||||||||||||||
Investments, at identified cost | $ | 4,379,981,150 | $ | 3,152,848,145 | $ | 737,132,064 | $ | 522,953,000 | ||||||||||||||||||||||
|
|
|
|
|
|
|
| |||||||||||||||||||||||
Investments in repurchase agreements, at value | $ | 251,000,000 | $ | 638,000,000 | $ | 102,000,000 | $ | — | ||||||||||||||||||||||
Investments in securities, at value | 4,128,981,150 | 2,514,848,145 | 635,132,064 | 522,953,000 | ||||||||||||||||||||||||||
|
|
|
|
|
|
|
| |||||||||||||||||||||||
TOTAL INVESTMENTS | 4,379,981,150 | 3,152,848,145 | 737,132,064 | 522,953,000 | ||||||||||||||||||||||||||
|
|
|
|
|
|
|
|
| ||||||||||||||||||||||
Cash | — | — | 106,618 | — | ||||||||||||||||||||||||||
Interest receivable | 1,374,019 | 1,066,026 | 549,938 | 134,870 | ||||||||||||||||||||||||||
Receivable for shares sold | 6,380,068 | 887,346 | 1,775 | 3,970 | ||||||||||||||||||||||||||
Receivable for investments sold | 150,687,500 | 251,687,500 | 151,250,000 | — | ||||||||||||||||||||||||||
Prepaid assets | 67,432 | 57,661 | 29,721 | 24,359 | ||||||||||||||||||||||||||
|
|
|
|
|
|
|
| |||||||||||||||||||||||
TOTAL ASSETS | 4,538,490,169 | 3,406,546,678 | 889,070,116 | 523,116,199 | ||||||||||||||||||||||||||
|
|
|
|
|
|
|
|
| ||||||||||||||||||||||
LIABILITIES: | ||||||||||||||||||||||||||||||
Payable to custodian | 79,455 | 33,447 | — | 50,822 | ||||||||||||||||||||||||||
Income distribution payable | 353,718 | 123,069 | 27,412 | 13,702 | ||||||||||||||||||||||||||
Payable for shares redeemed | 1,715,667 | 2,428,770 | 2,038 | 6,815 | ||||||||||||||||||||||||||
Payable for Trustees’ fees | 2,005 | 2,005 | 2,005 | 2,005 | ||||||||||||||||||||||||||
Payable for shareholder services fee | 68,466 | 28,870 | 1 | 1,121 | ||||||||||||||||||||||||||
Other accrued expenses | 298,424 | 173,531 | 66,956 | 63,346 | ||||||||||||||||||||||||||
|
|
|
|
|
|
|
| |||||||||||||||||||||||
TOTAL LIABILITIES | 2,517,735 | 2,789,692 | 98,412 | 137,811 | ||||||||||||||||||||||||||
|
|
|
|
|
|
|
|
| ||||||||||||||||||||||
NET ASSETS | $ | 4,535,972,434 | $ | 3,403,756,986 | $ | 888,971,704 | $ | 522,978,388 | ||||||||||||||||||||||
|
|
|
|
|
|
|
|
| ||||||||||||||||||||||
NET ASSETS CONSIST OF: | ||||||||||||||||||||||||||||||
Paid-in capital | $ | 4,535,949,627 | $ | 3,403,763,618 | $ | 889,007,160 | $ | 523,044,003 | ||||||||||||||||||||||
Undistributed (distributions in excess of) net investment income | (1,741 | ) | 647 | (330 | ) | (214 | ) | |||||||||||||||||||||||
Accumulated net realized gain (loss) on investments | 24,548 | (7,279 | ) | (35,126 | ) | (65,401 | ) | |||||||||||||||||||||||
|
|
|
|
|
|
|
| |||||||||||||||||||||||
TOTAL NET ASSETS | $ | 4,535,972,434 | $ | 3,403,756,986 | $ | 888,971,704 | $ | 522,978,388 | ||||||||||||||||||||||
|
|
|
|
|
|
|
|
| ||||||||||||||||||||||
| COMPUTATION OF NET ASSET VALUE AND OFFERING PRICE: | ||||||||||||||||||||||||||||||
Administrative Class | ||||||||||||||||||||||||||||||
Net Assets | $ | 308,837,835 | $ | 1,619,679,332 | $ | 646,348,752 | $ | 52,933,558 | ||||||||||||||||||||||
|
|
|
|
|
|
|
| |||||||||||||||||||||||
Shares outstanding (unlimited shares authorized) | 308,944,720 | 1,619,873,345 | 646,408,152 | 52,936,448 | ||||||||||||||||||||||||||
|
|
|
|
|
|
|
| |||||||||||||||||||||||
Net Asset Value per share | $ | 1.00 | $ | 1.00 | $ | 1.00 | $ | 1.00 | ||||||||||||||||||||||
|
|
|
|
|
|
|
| |||||||||||||||||||||||
Institutional Class | ||||||||||||||||||||||||||||||
Net Assets | $ | 301,156,246 | $ | 12,839,803 | $ | — | $ | — | ||||||||||||||||||||||
|
|
|
|
|
|
|
| |||||||||||||||||||||||
Shares outstanding (unlimited shares authorized) | 301,156,708 | 12,842,087 | — | — | ||||||||||||||||||||||||||
|
|
|
|
|
|
|
| |||||||||||||||||||||||
Net Asset Value per share | $ | 1.00 | $ | 1.00 | $ | — | $ | — | ||||||||||||||||||||||
|
|
|
|
|
|
|
| |||||||||||||||||||||||
Select Class | ||||||||||||||||||||||||||||||
Net Assets | $ | 3,156,334,024 | $ | 976,287,408 | $ | 242,596,748 | $ | 411,810,159 | ||||||||||||||||||||||
|
|
|
|
|
|
|
| |||||||||||||||||||||||
Shares outstanding (unlimited shares authorized) | 3,156,615,797 | 976,417,757 | 242,627,687 | 411,857,156 | ||||||||||||||||||||||||||
|
|
|
|
|
|
|
| |||||||||||||||||||||||
Net Asset Value per share | $ | 1.00 | $ | 1.00 | $ | 1.00 | $ | 1.00 | ||||||||||||||||||||||
|
|
|
|
|
|
|
| |||||||||||||||||||||||
Service Class | ||||||||||||||||||||||||||||||
Net Assets | $ | 769,644,329 | $ | 794,950,443 | $ | 26,204 | $ | 58,234,671 | ||||||||||||||||||||||
|
|
|
|
|
|
|
| |||||||||||||||||||||||
Shares outstanding (unlimited shares authorized) | 769,662,145 | 794,936,924 | 26,203 | 58,282,112 | ||||||||||||||||||||||||||
|
|
|
|
|
|
|
| |||||||||||||||||||||||
Net Asset Value per share | $ | 1.00 | $ | 1.00 | $ | 1.00 | $ | 1.00 | ||||||||||||||||||||||
|
|
|
|
|
|
|
|
|
| |||||||||||||||||||||
See Notes which are an integral part of the Financial Statements
| April 30, 2016 / ANNUAL REPORT |
| 19 |
Year Ended April 30, 2016 | | Wilmington Prime Money Market Fund | | | Wilmington U.S. Government | | | Wilmington U.S. Treasury | | | Wilmington Tax-Exempt | | ||||||||||||||||||
| INVESTMENT INCOME: | ||||||||||||||||||||||||||||||
Interest | $ | 11,519,363 | $ | 7,032,338 | $ | 1,346,597 | $ | 366,223 | ||||||||||||||||||||||
|
|
|
|
|
|
|
| |||||||||||||||||||||||
| TOTAL INVESTMENT INCOME | 11,519,363 | 7,032,338 | 1,346,597 | 366,223 | ||||||||||||||||||||||||||
|
|
|
|
|
|
|
|
| ||||||||||||||||||||||
EXPENSES: | ||||||||||||||||||||||||||||||
Investment advisory fee | 15,159,408 | 14,329,985 | 3,272,435 | 2,050,680 | ||||||||||||||||||||||||||
Administrative personnel and services fees | 1,186,774 | 1,121,520 | 256,130 | 160,555 | ||||||||||||||||||||||||||
Portfolio accounting and administration fees | 1,062,283 | 1,002,782 | 237,592 | 158,991 | ||||||||||||||||||||||||||
Transfer and dividend disbursing agent fees and expenses | 217,576 | 2,217 | 4,541 | 26,855 | ||||||||||||||||||||||||||
Custodian fees | 106,082 | 92,872 | 23,486 | 15,130 | ||||||||||||||||||||||||||
Trustees’ fees | 43,263 | 43,263 | 43,263 | 43,263 | ||||||||||||||||||||||||||
Professional fees | 70,888 | 70,791 | 67,942 | 67,955 | ||||||||||||||||||||||||||
Distribution services fee—Administrative Class | 793,935 | 4,329,815 | 1,434,819 | 130,446 | ||||||||||||||||||||||||||
Distribution services fee—Service Class | 1,850,590 | 2,030,583 | 46 | 177,996 | ||||||||||||||||||||||||||
Shareholder services fee— Administrative Class | 793,935 | 4,329,815 | 1,434,819 | 130,446 | ||||||||||||||||||||||||||
Shareholder services fee— Select Class | 6,156,161 | 2,510,184 | 610,404 | 973,233 | ||||||||||||||||||||||||||
Shareholder services fee— Service Class | 1,850,590 | 2,030,583 | 46 | 177,996 | ||||||||||||||||||||||||||
Share registration costs | 54,812 | 52,897 | 27,383 | 42,092 | ||||||||||||||||||||||||||
Printing and postage | 155,879 | 15,643 | 7,522 | 18,956 | ||||||||||||||||||||||||||
Miscellaneous | 237,049 | 241,629 | 89,309 | 56,670 | ||||||||||||||||||||||||||
|
|
|
|
|
|
|
| |||||||||||||||||||||||
TOTAL EXPENSES | 29,739,225 | 32,204,579 | 7,509,737 | 4,231,264 | ||||||||||||||||||||||||||
|
|
|
|
|
|
|
|
| ||||||||||||||||||||||
WAIVERS AND REIMBURSEMENTS: | ||||||||||||||||||||||||||||||
Waiver/reimbursement by investment advisor | (8,824,039 | ) | (10,628,013 | ) | (2,756,272 | ) | (2,324,990 | ) | ||||||||||||||||||||||
Waiver of distribution services fee—Administrative Class | (793,935 | ) | (4,329,815 | ) | (1,434,819 | ) | (130,446 | ) | ||||||||||||||||||||||
Waiver of distribution services fee—Service Class | (1,850,590 | ) | (2,030,583 | ) | (46 | ) | (177,996 | ) | ||||||||||||||||||||||
Waiver of shareholder services fee—Administrative Class | (793,935 | ) | (4,329,815 | ) | (1,434,819 | ) | (130,446 | ) | ||||||||||||||||||||||
Waiver of shareholder services fee—Select Class | (6,156,161 | ) | (2,510,184 | ) | (610,404 | ) | (973,233 | ) | ||||||||||||||||||||||
Waiver of shareholder services fee—Service Class | (1,567,850 | ) | (1,946,642 | ) | (45 | ) | (176,875 | ) | ||||||||||||||||||||||
Waiver of portfolio accounting and administration fees | (85,207 | ) | (84,302 | ) | (17,993 | ) | (11,636 | ) | ||||||||||||||||||||||
|
|
|
|
|
|
|
| |||||||||||||||||||||||
TOTAL WAIVERS AND REIMBURSEMENTS | (20,071,717 | ) | (25,859,354 | ) | (6,254,398 | ) | (3,925,622 | ) | ||||||||||||||||||||||
|
|
|
|
|
|
|
|
| ||||||||||||||||||||||
Net expenses | 9,667,508 | 6,345,225 | 1,255,339 | 305,642 | ||||||||||||||||||||||||||
|
|
|
|
|
|
|
| |||||||||||||||||||||||
Net investment income | 1,851,855 | 687,113 | 91,258 | 60,581 | ||||||||||||||||||||||||||
|
|
|
|
|
|
|
| |||||||||||||||||||||||
| REALIZED GAIN (LOSS) ON INVESTMENTS: | ||||||||||||||||||||||||||||||
Net realized gain (loss) on investments | 26,384 | 17,283 | 126 | — | ||||||||||||||||||||||||||
|
|
|
|
|
|
|
| |||||||||||||||||||||||
Net realized gain (loss) on investments | 26,384 | 17,283 | 126 | — | ||||||||||||||||||||||||||
|
|
|
|
|
|
|
| |||||||||||||||||||||||
Change in net assets resulting from operations | $ | 1,878,239 | $ | 704,396 | $ | 91,384 | $ | 60,581 | ||||||||||||||||||||||
|
|
|
|
|
|
|
| |||||||||||||||||||||||
See Notes which are an integral part of the Financial Statements
| ANNUAL REPORT / April 30, 2016 |
| 20 |
| Wilmington Prime Money Market Fund | Wilmington U.S. Government Money Market Fund | |||||||||||||||||||||||||||||||||
|
| Year Ended April 30, 2016 |
|
| Year Ended April 30, 2015 |
|
| Year Ended April 30, 2016 |
|
| Year Ended April 30, 2015 |
| |||||||||||||||||||||||
OPERATIONS: | ||||||||||||||||||||||||||||||||||
Net investment income | $ | 1,851,855 | $ | 444,404 | $ | 687,113 | $ | 415,643 | ||||||||||||||||||||||||||
Net realized gain (loss) on investments | 26,384 | 12,180 | 17,283 | 4,315 | ||||||||||||||||||||||||||||||
|
|
|
|
|
|
|
| |||||||||||||||||||||||||||
Change in net assets resulting from operations | 1,878,239 | 456,584 | 704,396 | 419,958 | ||||||||||||||||||||||||||||||
|
|
|
|
|
|
|
| |||||||||||||||||||||||||||
DISTRIBUTIONS TO SHAREHOLDERS: | ||||||||||||||||||||||||||||||||||
Distributions from net investment income | ||||||||||||||||||||||||||||||||||
Administrative Class | (174,346 | ) | (46,265 | ) | (381,356 | ) | (184,789 | ) | ||||||||||||||||||||||||||
Institutional Class | (178,569 | ) | (24,467 | ) | (4,895 | ) | (3,473 | ) | ||||||||||||||||||||||||||
Select Class | (1,393,958 | ) | (295,729 | ) | (218,174 | ) | (101,403 | ) | ||||||||||||||||||||||||||
Service Class | (105,701 | ) | (76,769 | ) | (83,677 | ) | (125,210 | ) | ||||||||||||||||||||||||||
|
|
|
|
|
|
|
| |||||||||||||||||||||||||||
Change in net assets resulting from distributions to shareholders | (1,852,574 | ) | (443,230 | ) | (688,102 | ) | (414,875 | ) | ||||||||||||||||||||||||||
SHARE TRANSACTIONS: | ||||||||||||||||||||||||||||||||||
Proceeds from sale of shares | ||||||||||||||||||||||||||||||||||
Administrative Class | 1,242,901,329 | 995,503,689 | 4,556,771,179 | 3,877,501,399 | ||||||||||||||||||||||||||||||
Institutional Class | 958,675,920 | 1,060,689,984 | 181,731,782 | 37,157,622 | ||||||||||||||||||||||||||||||
Select Class | 4,952,241,588 | 3,974,173,345 | 2,508,685,382 | 1,928,110,623 | ||||||||||||||||||||||||||||||
Service Class | 2,004,667,671 | 2,639,297,327 | 1,571,057,766 | 2,761,898,754 | ||||||||||||||||||||||||||||||
Distributions reinvested | ||||||||||||||||||||||||||||||||||
Administrative Class | 111 | 20 | 2,406 | 5,209 | ||||||||||||||||||||||||||||||
Institutional Class | 7,342 | 1,679 | 872 | 1,161 | ||||||||||||||||||||||||||||||
Select Class | 192,160 | 51,805 | 4,615 | 1,117 | ||||||||||||||||||||||||||||||
Service Class | 59,773 | 40,704 | 10,115 | 7,232 | ||||||||||||||||||||||||||||||
Cost of shares redeemed | ||||||||||||||||||||||||||||||||||
Administrative Class | (1,286,658,369 | ) | (968,605,086 | ) | (4,493,385,278 | ) | (3,994,684,719 | ) | ||||||||||||||||||||||||||
Institutional Class | (895,225,247 | ) | (869,855,406 | ) | (194,972,218 | ) | (94,675,053 | ) | ||||||||||||||||||||||||||
Select Class | (4,235,763,782 | ) | (3,847,371,614 | ) | (2,537,908,763 | ) | (1,811,768,074 | ) | ||||||||||||||||||||||||||
Service Class | (1,924,804,383 | ) | (2,693,246,232 | ) | (2,128,399,325 | ) | (2,781,129,145 | ) | ||||||||||||||||||||||||||
|
|
|
|
|
|
|
| |||||||||||||||||||||||||||
Change in net assets resulting from share transactions | 816,294,113 | 290,680,215 | (536,401,467 | ) | (77,573,874 | ) | ||||||||||||||||||||||||||||
|
|
|
|
|
|
|
| |||||||||||||||||||||||||||
Change in net assets | 816,319,778 | 290,693,569 | (536,385,173 | ) | (77,568,791 | ) | ||||||||||||||||||||||||||||
NET ASSETS: | ||||||||||||||||||||||||||||||||||
Beginning of year | 3,719,652,656 | 3,428,959,087 | 3,940,142,159 | 4,017,710,950 | ||||||||||||||||||||||||||||||
|
|
|
|
|
|
|
| |||||||||||||||||||||||||||
End of year | $ | 4,535,972,434 | $ | 3,719,652,656 | $ | 3,403,756,986 | $ | 3,940,142,159 | ||||||||||||||||||||||||||
|
|
|
|
|
|
|
| |||||||||||||||||||||||||||
Undistributed (distributions in excess of) net investment income included in net assets at end of year | $ | (1,741 | ) | $ | (1,022 | ) | $ | 647 | $ | 1,636 | ||||||||||||||||||||||||
|
|
|
|
|
|
|
| |||||||||||||||||||||||||||
| April 30, 2016 / ANNUAL REPORT |
| STATEMENTS OF CHANGES IN NET ASSETS (continued) |
| 21 |
| Wilmington Prime Money Market Fund | Wilmington U.S. Government Money Market Fund | |||||||||||||||||||||||||||||||
|
| Year Ended April 30, 2016 |
|
| Year Ended April 30, 2015 |
|
| Year Ended April 30, 2016 |
|
| Year Ended April 30, 2015 |
| |||||||||||||||||||||
SHARES OF BENEFICIAL INTEREST: | ||||||||||||||||||||||||||||||||
Shares sold | ||||||||||||||||||||||||||||||||
Administrative Class | 1,242,901,329 | 995,503,689 | 4,556,771,179 | 3,877,501,399 | ||||||||||||||||||||||||||||
Institutional Class | 958,675,920 | 1,060,689,984 | 181,731,782 | 37,157,622 | ||||||||||||||||||||||||||||
Select Class | 4,952,241,588 | 3,974,173,345 | 2,508,685,382 | 1,928,110,623 | ||||||||||||||||||||||||||||
Service Class | 2,004,667,671 | 2,639,297,327 | 1,571,057,766 | 2,761,898,754 | ||||||||||||||||||||||||||||
Distributions reinvested | ||||||||||||||||||||||||||||||||
Administrative Class | 111 | 20 | 2,406 | 5,209 | ||||||||||||||||||||||||||||
Institutional Class | 7,342 | 1,679 | 872 | 1,161 | ||||||||||||||||||||||||||||
Select Class | 192,160 | 51,805 | 4,615 | 1,117 | ||||||||||||||||||||||||||||
Service Class | 59,773 | 40,704 | 10,115 | 7,232 | ||||||||||||||||||||||||||||
Shares redeemed | ||||||||||||||||||||||||||||||||
Administrative Class | (1,286,658,369 | ) | (968,605,086 | ) | (4,493,385,278 | ) | (3,994,684,719 | ) | ||||||||||||||||||||||||
Institutional Class | (895,225,247 | ) | (869,855,406 | ) | (194,972,218 | ) | (94,675,053 | ) | ||||||||||||||||||||||||
Select Class | (4,235,763,782 | ) | (3,847,371,614 | ) | (2,537,908,763 | ) | (1,811,768,074 | ) | ||||||||||||||||||||||||
Service Class | (1,924,804,383 | ) | (2,693,246,232 | ) | (2,128,399,325 | ) | (2,781,129,145 | ) | ||||||||||||||||||||||||
|
|
|
|
|
|
|
| |||||||||||||||||||||||||
Net change in shares outstanding | 816,294,113 | 290,680,215 | (536,401,467 | ) | (77,573,874 | ) | ||||||||||||||||||||||||||
|
|
|
|
|
|
|
| |||||||||||||||||||||||||
See Notes which are an integral part of the Financial Statements
| ANNUAL REPORT / April 30, 2016 |
| 22 STATEMENTS OF CHANGES IN NET ASSETS (concluded) |
| Wilmington U.S. Treasury Money Market Fund | Wilmington Tax-Exempt Money Market Fund | |||||||||||||||||||||||||||||||
|
| Year Ended April 30, 2016 |
|
| Year Ended April 30, 2015 |
|
| Year Ended April 30, 2016 |
|
| Year Ended April 30, 2015 |
| |||||||||||||||||||||
OPERATIONS: | ||||||||||||||||||||||||||||||||
Net investment income | $ | 91,258 | $ | 473 | $ | 60,581 | $ | 50,673 | ||||||||||||||||||||||||
Net realized gain (loss) on investments | 126 | 415 | — | — | ||||||||||||||||||||||||||||
|
|
|
|
|
|
|
| |||||||||||||||||||||||||
Change in net assets resulting from operations | 91,384 | 888 | 60,581 | 50,673 | ||||||||||||||||||||||||||||
|
|
|
|
|
|
|
| |||||||||||||||||||||||||
DISTRIBUTIONS TO SHAREHOLDERS: | ||||||||||||||||||||||||||||||||
Distributions from net investment income | ||||||||||||||||||||||||||||||||
Administrative Class | (64,773 | ) | (845 | ) | (6,322 | ) | (4,262 | ) | ||||||||||||||||||||||||
Select Class | (27,263 | ) | (381 | ) | (46,984 | ) | (39,332 | ) | ||||||||||||||||||||||||
Service Class | (1 | ) | — | (7,230 | ) | (7,329 | ) | |||||||||||||||||||||||||
|
|
|
|
|
|
|
| |||||||||||||||||||||||||
Change in net assets resulting from distributions to shareholders | (92,037 | ) | (1,226 | ) | (60,536 | ) | (50,923 | ) | ||||||||||||||||||||||||
|
|
|
|
|
|
|
| |||||||||||||||||||||||||
SHARE TRANSACTIONS: | ||||||||||||||||||||||||||||||||
Proceeds from sale of shares | ||||||||||||||||||||||||||||||||
Administrative Class | 1,228,266,198 | 1,224,054,650 | 44,018,592 | 45,149,714 | ||||||||||||||||||||||||||||
Select Class | 782,092,004 | 839,334,028 | 511,925,684 | 474,676,458 | ||||||||||||||||||||||||||||
Service Class | 8,000 | 12,201 | 115,275,927 | 135,589,560 | ||||||||||||||||||||||||||||
Distributions reinvested | ||||||||||||||||||||||||||||||||
Administrative Class | 285 | 4 | — | — | ||||||||||||||||||||||||||||
Select Class | 5,252 | 139 | 936 | 666 | ||||||||||||||||||||||||||||
Service Class | 1 | — | 6,185 | 7,453 | ||||||||||||||||||||||||||||
Cost of shares redeemed | ||||||||||||||||||||||||||||||||
Administrative Class | (1,213,389,026 | ) | (1,374,942,422 | ) | (33,768,756 | ) | (42,427,934 | ) | ||||||||||||||||||||||||
Select Class | (804,455,029 | ) | (888,754,034 | ) | (513,808,056 | ) | (482,564,643 | ) | ||||||||||||||||||||||||
Service Class | — | — | (136,363,561 | ) | (130,989,192 | ) | ||||||||||||||||||||||||||
|
|
|
|
|
|
|
| |||||||||||||||||||||||||
Change in net assets resulting from share transactions | (7,472,315 | ) | (200,295,434 | ) | (12,713,049 | ) | (557,918 | ) | ||||||||||||||||||||||||
|
|
|
|
|
|
|
| |||||||||||||||||||||||||
Change in net assets | (7,472,968 | ) | (200,295,772 | ) | (12,713,004 | ) | (558,168 | ) | ||||||||||||||||||||||||
NET ASSETS: | ||||||||||||||||||||||||||||||||
Beginning of year | 896,444,672 | 1,096,740,444 | 535,691,392 | 536,249,560 | ||||||||||||||||||||||||||||
|
|
|
|
|
|
|
| |||||||||||||||||||||||||
End of year | $ | 888,971,704 | $ | 896,444,672 | $ | 522,978,388 | $ | 535,691,392 | ||||||||||||||||||||||||
|
|
|
|
|
|
|
| |||||||||||||||||||||||||
Undistributed (distributions in excess of) net investment income included in net assets at end of year | $ | (330 | ) | $ | 449 | $ | (214 | ) | $ | (259 | ) | |||||||||||||||||||||
|
|
|
|
|
|
|
| |||||||||||||||||||||||||
SHARES OF BENEFICIAL INTEREST: | ||||||||||||||||||||||||||||||||
Shares sold | ||||||||||||||||||||||||||||||||
Administrative Class | 1,228,266,198 | 1,224,054,650 | 44,018,592 | 45,149,714 | ||||||||||||||||||||||||||||
Select Class | 782,092,004 | 839,334,028 | 511,925,684 | 474,676,458 | ||||||||||||||||||||||||||||
Service Class | 8,000 | 12,201 | 115,275,927 | 135,589,560 | ||||||||||||||||||||||||||||
Distributions reinvested | ||||||||||||||||||||||||||||||||
Administrative Class | 285 | 4 | — | — | ||||||||||||||||||||||||||||
Select Class | 5,252 | 139 | 936 | 666 | ||||||||||||||||||||||||||||
Service Class | 1 | — | 6,185 | 7,453 | ||||||||||||||||||||||||||||
Shares redeemed | ||||||||||||||||||||||||||||||||
Administrative Class | (1,213,389,026 | ) | (1,374,942,422 | ) | (33,768,756 | ) | (42,427,934 | ) | ||||||||||||||||||||||||
Select Class | (804,455,029 | ) | (888,754,034 | ) | (513,808,056 | ) | (482,564,643 | ) | ||||||||||||||||||||||||
Service Class | — | (136,363,561 | ) | (130,989,192 | ) | |||||||||||||||||||||||||||
|
|
|
|
|
|
|
| |||||||||||||||||||||||||
Net change in shares outstanding | (7,472,315 | ) | (200,295,434 | ) | (12,713,049 | ) | (557,918 | ) | ||||||||||||||||||||||||
|
|
|
|
|
|
|
| |||||||||||||||||||||||||
See Notes which are an integral part of the Financial Statements
| April 30, 2016 / ANNUAL REPORT |
| 23 |
For a share outstanding throughout each year ended April 30, unless otherwise noted:
| WILMINGTON PRIME MONEY MARKET FUND |
| Year Ended | Year Ended | Year Ended | Year Ended | Year Ended | |||||||||||||||||||||
| ADMINISTRATIVE CLASS | April 30, 2016 | April 30, 2015 | April 30, 2014 | April 30, 2013 | April 30, 2012 | ||||||||||||||||||||
| Net Asset Value, Beginning of Year | $1.000 | $1.000 | $1.000 | $1.000 | $1.000 | ||||||||||||||||||||
| Income (Loss) From Operations: | |||||||||||||||||||||||||
Net Investment Income | 0.001 | 0.000 | (a) | 0.000 | (a) | 0.000 | (a) | 0.000 | (a) | ||||||||||||||||
Net Realized Gain (Loss) on Investments | 0.000 | (a) | 0.000 | (a) | 0.000 | (a) | 0.000 | (a) | 0.000 | (a) | |||||||||||||||
| Total Income (Loss) From Operations | 0.001 | 0.000 | 0.000 | 0.000 | 0.000 | ||||||||||||||||||||
| Less Distributions From: | |||||||||||||||||||||||||
Net Investment Income | (0.001 | ) | (0.000 | )(a) | (0.000 | )(a) | (0.000 | )(a) | (0.000 | )(a) | |||||||||||||||
| Net Asset Value, End of Year | $1.000 | $1.000 | $1.000 | $1.000 | $1.000 | ||||||||||||||||||||
| Total Return(b) | 0.06 | % | 0.01 | % | 0.01 | % | 0.03 | % | 0.03 | % | |||||||||||||||
| Net Assets, End of Year (000’s) | $308,838 | $352,595 | $325,696 | $382,757 | $464,721 | ||||||||||||||||||||
| Ratios to Average Net Assets | |||||||||||||||||||||||||
Gross Expense | 0.98 | % | 0.98 | % | 0.98 | % | 0.97 | % | 0.80 | % | |||||||||||||||
Net Expenses(c) | 0.24 | % | 0.14 | % | 0.13 | % | 0.17 | % | 0.16 | % | |||||||||||||||
Net Investment Income
|
| 0.05
| %
|
| 0.01
| %
|
| 0.01
| %
|
| 0.03
| %
|
| 0.02
| %
| ||||||||||
| Year Ended | Year Ended | Year Ended | Year Ended | Period Ended | |||||||||||||||||||||
| INSTITUTIONAL CLASS | April 30, 2016 | April 30, 2015 | April 30, 2014 | April 30, 2013 | April 30, 2012(d) | ||||||||||||||||||||
| Net Asset Value, Beginning of Year | $1.000 | $1.000 | $1.000 | $1.000 | $1.000 | ||||||||||||||||||||
| Income (Loss) From Operations: | |||||||||||||||||||||||||
Net Investment Income | 0.001 | 0.000 | (a) | 0.000 | (a) | 0.000 | (a) | 0.000 | (a) | ||||||||||||||||
Net Realized Gain (Loss) on Investments | 0.000 | (a) | 0.000 | (a) | 0.000 | (a) | 0.000 | (a) | 0.000 | (a) | |||||||||||||||
| Total Income (Loss) From Operations | 0.001 | 0.000 | 0.000 | 0.000 | 0.000 | ||||||||||||||||||||
| Less Distributions From: | |||||||||||||||||||||||||
Net Investment Income | (0.001 | ) | (0.000 | )(a) | (0.000 | )(a) | (0.000 | )(a) | (0.000 | )(a) | |||||||||||||||
| Net Asset Value, End of Year | $1.000 | $1.000 | $1.000 | $1.000 | $1.000 | ||||||||||||||||||||
| Total Return(b) | 0.06 | % | 0.01 | % | 0.01 | % | 0.03 | % | 0.01 | % | |||||||||||||||
| Net Assets, End of Year (000’s) | $301,156 | $237,698 | $46,861 | $31,056 | $42,072 | ||||||||||||||||||||
| Ratios to Average Net Assets | |||||||||||||||||||||||||
Gross Expense | 0.48 | % | 0.48 | % | 0.48 | % | 0.47 | % | 0.46 | %(e) | |||||||||||||||
Net Expenses(c) | 0.27 | % | 0.14 | % | 0.13 | % | 0.17 | % | 0.16 | %(e) | |||||||||||||||
Net Investment Income
|
| 0.07
| %
|
| 0.01
| %
|
| 0.01
| %
|
| 0.03
| %
|
| 0.04
| %(e)
| ||||||||||
| Year Ended | Year Ended | Year Ended | Year Ended | Year Ended | |||||||||||||||||||||
| SELECT CLASS | April 30, 2016 | April 30, 2015 | April 30, 2014 | April 30, 2013 | April 30, 2012 | ||||||||||||||||||||
| Net Asset Value, Beginning of Year | $1.000 | $1.000 | $1.000 | $1.000 | $1.000 | ||||||||||||||||||||
| Income (Loss) From Operations: | |||||||||||||||||||||||||
Net Investment Income | 0.001 | 0.000 | (a) | 0.000 | (a) | 0.000 | (a) | 0.000 | (a) | ||||||||||||||||
Net Realized Gain (Loss) on Investments | 0.000 | (a) | 0.000 | (a) | 0.000 | (a) | 0.000 | (a) | 0.000 | (a) | |||||||||||||||
| Total Income (Loss) From Operations | 0.001 | 0.000 | 0.000 | 0.000 | 0.000 | ||||||||||||||||||||
| Less Distributions From: | |||||||||||||||||||||||||
Net Investment Income | (0.001 | ) | (0.000 | )(a) | (0.000 | )(a) | (0.000 | )(a) | (0.000 | )(a) | |||||||||||||||
| Net Asset Value, End of Year | $1.000 | $1.000 | $1.000 | $1.000 | $1.000 | ||||||||||||||||||||
| Total Return(b) | 0.06 | % | 0.01 | % | 0.01 | % | 0.03 | % | 0.02 | % | |||||||||||||||
| Net Assets, End of Year (000’s) | $3,156,334 | $2,439,662 | $2,312,800 | $2,528,068 | $2,424,783 | ||||||||||||||||||||
| Ratios to Average Net Assets | |||||||||||||||||||||||||
Gross Expense | 0.73 | % | 0.73 | % | 0.73 | % | 0.72 | % | 0.73 | % | |||||||||||||||
Net Expenses(c) | 0.25 | % | 0.14 | % | 0.13 | % | 0.17 | % | 0.16 | % | |||||||||||||||
Net Investment Income | 0.06 | % | 0.01 | % | 0.01 | % | 0.03 | % | 0.03 | % | |||||||||||||||
| ANNUAL REPORT / April 30, 2016 |
| 24 |
| FINANCIAL HIGHLIGHTS |
WILMINGTON PRIME MONEY MARKET FUND (continued) |
| Year Ended | Year Ended | Year Ended | Year Ended | Year Ended | |||||||||||||||||||||||
| SERVICE CLASS | April 30, 2016 | April 30, 2015 | April 30, 2014 | April 30, 2013 | April 30, 2012 | ||||||||||||||||||||||
| Net Asset Value, Beginning of Year | $1.000 | $1.000 | $1.000 | $1.000 | $1.000 | ||||||||||||||||||||||
| Income (Loss) From Operations: | |||||||||||||||||||||||||||
Net Investment Income | 0.000 | (a) | 0.000 | (a) | 0.000 | (a) | 0.000 | (a) | 0.000 | (a) | |||||||||||||||||
Net Realized Gain (Loss) on Investments | 0.000 | (a) | 0.000 | (a) | 0.000 | (a) | 0.000 | (a) | 0.000 | (a) | |||||||||||||||||
| Total Income (Loss) From Operations | 0.000 | 0.000 | 0.000 | 0.000 | 0.000 | ||||||||||||||||||||||
| Less Distributions From: | |||||||||||||||||||||||||||
Net Investment Income | (0.000 | )(a) | (0.000 | )(a) | (0.000 | )(a) | (0.000 | )(a) | (0.000 | )(a) | |||||||||||||||||
| Net Asset Value, End of Year | $1.000 | $1.000 | $1.000 | $1.000 | $1.000 | ||||||||||||||||||||||
| Total Return(b) | 0.01 | % | 0.01 | % | 0.01 | % | 0.01 | % | 0.01 | % | |||||||||||||||||
| Net Assets, End of Year (000’s) | $769,644 | $689,698 | $743,602 | $829,547 | $779,543 | ||||||||||||||||||||||
| Ratios to Average Net Assets | |||||||||||||||||||||||||||
Gross Expense | 0.98 | % | 0.98 | % | 0.98 | % | 0.96 | % | 0.98 | % | |||||||||||||||||
Net Expenses(c) | 0.28 | % | 0.14 | % | 0.14 | % | 0.19 | % | 0.18 | % | |||||||||||||||||
Net Investment Income | 0.02 | % | 0.01 | % | 0.01 | % | 0.01 | % | 0.01 | % | |||||||||||||||||
(a) Represents less than $0.001.
(b) Total returns for periods of less than one year, if any, are not annualized.
(c) The investment manager and other service providers voluntarily waived a portion of their fees.
(d) Reflects investment operations for the period from March 12, 2012 to April 30, 2012.
(e) Annualized for periods less than one year.
See Notes which are an integral part of the Financial Statements
| April 30, 2016 / ANNUAL REPORT |
| FINANCIAL HIGHLIGHTS |
| 25 |
For a share outstanding throughout each year ended April 30, unless otherwise noted:
WILMINGTON U.S. GOVERNMENT MONEY MARKET FUND |
| Year Ended | Year Ended | Year Ended | Year Ended | Year Ended | |||||||||||||||||||||||
| ADMINISTRATIVE CLASS | April 30, 2016 | April 30, 2015 | April 30, 2014 | April 30, 2013 | April 30, 2012 | ||||||||||||||||||||||
| Net Asset Value, Beginning of Year | $1.000 | $1.000 | $1.000 | $1.000 | $1.000 | ||||||||||||||||||||||
| Income (Loss) From Operations: | |||||||||||||||||||||||||||
Net Investment Income | 0.000 | (a) | 0.000 | (a) | 0.000 | (a) | 0.000 | (a) | 0.000 | (a) | |||||||||||||||||
Net Realized Gain (Loss) on Investments | 0.000 | (a) | 0.000 | (a) | 0.000 | (a) | 0.000 | (a) | 0.000 | (a) | |||||||||||||||||
| Total Income (Loss) From Operations | 0.000 | 0.000 | 0.000 | 0.000 | 0.000 | ||||||||||||||||||||||
| Less Distributions From: | |||||||||||||||||||||||||||
Net Investment Income | (0.000 | )(a) | (0.000 | )(a) | (0.000 | )(a) | (0.000 | )(a) | (0.000 | )(a) | |||||||||||||||||
| Net Asset Value, End of Year | $1.000 | $1.000 | $1.000 | $1.000 | $1.000 | ||||||||||||||||||||||
| Total Return(b) | 0.02 | % | 0.01 | % | 0.01 | % | 0.01 | % | 0.01 | % | |||||||||||||||||
| Net Assets, End of Year (000’s) | $1,619,679 | $1,556,286 | $1,673,462 | $1,885,193 | $1,801,115 | ||||||||||||||||||||||
| Ratios to Average Net Assets | |||||||||||||||||||||||||||
Gross Expense | 0.97 | % | 0.97 | % | 0.97 | % | 0.96 | % | 0.79 | % | |||||||||||||||||
Net Expenses(c) | 0.18 | % | 0.07 | % | 0.08 | % | 0.15 | % | 0.12 | % | |||||||||||||||||
Net Investment Income
|
| 0.02
| %
|
| 0.01
| %
|
| 0.01
| %
|
| 0.01
| %
|
| 0.01
| %
| ||||||||||||
| Year Ended | Year Ended | Year Ended | Year Ended | Period Ended | |||||||||||||||||||||||
| INSTITUTIONAL CLASS | April 30, 2016 | April 30, 2015 | April 30, 2014 | April 30, 2013 | April 30, 2012(d) | ||||||||||||||||||||||
| Net Asset Value, Beginning of Year | $1.000 | $1.000 | $1.000 | $1.000 | $1.000 | ||||||||||||||||||||||
| Income (Loss) From Operations: | |||||||||||||||||||||||||||
Net Investment Income | 0.000 | (a) | 0.000 | (a) | 0.000 | (a) | 0.000 | (a) | 0.000 | (a) | |||||||||||||||||
Net Realized Gain (Loss) on Investments | 0.000 | (a) | 0.000 | (a) | 0.000 | (a) | 0.000 | (a) | 0.000 | (a) | |||||||||||||||||
| Total Income (Loss) From Operations | 0.000 | 0.000 | 0.000 | 0.000 | 0.000 | ||||||||||||||||||||||
| Less Distributions From: | |||||||||||||||||||||||||||
Net Investment Income | (0.000 | )(a) | (0.000 | )(a) | (0.000 | )(a) | (0.000 | )(a) | (0.000 | )(a) | |||||||||||||||||
| Net Asset Value, End of Year | $1.000 | $1.000 | $1.000 | $1.000 | $1.000 | ||||||||||||||||||||||
| Total Return(b) | 0.02 | % | 0.01 | % | 0.01 | % | 0.01 | % | 0.00 | % | |||||||||||||||||
| Net Assets, End of Year (000’s) | $12,840 | $26,079 | $83,595 | $25,683 | $85,322 | ||||||||||||||||||||||
| Ratios to Average Net Assets | |||||||||||||||||||||||||||
Gross Expense | 0.47 | % | 0.47 | % | 0.47 | % | 0.46 | % | 0.46 | %(e) | |||||||||||||||||
Net Expenses(c) | 0.13 | % | 0.07 | % | 0.08 | % | 0.15 | % | 0.13 | %(e) | |||||||||||||||||
Net Investment Income
|
| 0.01
| %
|
| 0.01
| %
|
| 0.01
| %
|
| 0.01
| %
|
| 0.01
| %(e)
| ||||||||||||
| Year Ended | Year Ended | Year Ended | Year Ended | Year Ended | |||||||||||||||||||||||
| SELECT CLASS | April 30, 2016 | April 30, 2015 | April 30, 2014 | April 30, 2013 | April 30, 2012 | ||||||||||||||||||||||
| Net Asset Value, Beginning of Year | $1.000 | $1.000 | $1.000 | $1.000 | $1.000 | ||||||||||||||||||||||
| Income (Loss) From Operations: | |||||||||||||||||||||||||||
Net Investment Income | 0.000 | (a) | 0.000 | (a) | 0.000 | (a) | 0.000 | (a) | 0.000 | (a) | |||||||||||||||||
Net Realized Gain (Loss) on Investments | 0.000 | (a) | 0.000 | (a) | 0.000 | (a) | 0.000 | (a) | 0.000 | (a) | |||||||||||||||||
| Total Income (Loss) From Operations | 0.000 | 0.000 | 0.000 | 0.000 | 0.000 | ||||||||||||||||||||||
| Less Distributions From: | |||||||||||||||||||||||||||
Net Investment Income | (0.000 | )(a) | (0.000 | )(a) | (0.000 | )(a) | (0.000 | )(a) | (0.000 | )(a) | |||||||||||||||||
| Net Asset Value, End of Year | $1.000 | $1.000 | $1.000 | $1.000 | $1.000 | ||||||||||||||||||||||
| Total Return(b) | 0.02 | % | 0.01 | % | 0.01 | % | 0.01 | % | 0.01 | % | |||||||||||||||||
| Net Assets, End of Year (000’s) | $976,287 | $1,005,503 | $889,158 | $1,164,388 | $1,213,146 | ||||||||||||||||||||||
| Ratios to Average Net Assets | |||||||||||||||||||||||||||
Gross Expense | 0.72 | % | 0.72 | % | 0.72 | % | 0.71 | % | 0.72 | % | |||||||||||||||||
Net Expenses(c) | 0.18 | % | 0.07 | % | 0.08 | % | 0.15 | % | 0.12 | % | |||||||||||||||||
Net Investment Income | 0.02 | % | 0.01 | % | 0.01 | % | 0.01 | % | 0.01 | % | |||||||||||||||||
| ANNUAL REPORT / April 30, 2016 |
26
| FINANCIAL HIGHLIGHTS |
WILMINGTON U.S. GOVERNMENT MONEY MARKET FUND (continued) | ||||||||||
| Year Ended | Year Ended | Year Ended | Year Ended | Year Ended | |||||||||||||||||||||||
| SERVICE CLASS | April 30, 2016 | April 30, 2015 | April 30, 2014 | April 30, 2013 | April 30, 2012 | ||||||||||||||||||||||
| Net Asset Value, Beginning of Year | $1.000 | $1.000 | $1.000 | $1.000 | $1.000 | ||||||||||||||||||||||
| Income (Loss) From Operations: | |||||||||||||||||||||||||||
Net Investment Income | 0.000 | (a) | 0.000 | (a) | 0.000 | (a) | 0.000 | (a) | 0.000 | (a) | |||||||||||||||||
Net Realized Gain (Loss) on Investments | 0.000 | (a) | 0.000 | (a) | 0.000 | (a) | 0.000 | (a) | 0.000 | (a) | |||||||||||||||||
| Total Income (Loss) From Operations | 0.000 | 0.000 | 0.000 | 0.000 | 0.000 | ||||||||||||||||||||||
| Less Distributions From: | |||||||||||||||||||||||||||
Net Investment Income | (0.000 | )(a) | (0.000 | )(a) | (0.000 | )(a) | (0.000 | )(a) | (0.000 | )(a) | |||||||||||||||||
| Net Asset Value, End of Year | $1.000 | $1.000 | $1.000 | $1.000 | $1.000 | ||||||||||||||||||||||
| Total Return(b) | 0.01 | % | 0.01 | % | 0.01 | % | 0.01 | % | 0.01 | % | |||||||||||||||||
| Net Assets, End of Year (000’s) | $794,950 | $1,352,274 | $1,371,495 | $1,131,306 | $873,278 | ||||||||||||||||||||||
| Ratios to Average Net Assets | |||||||||||||||||||||||||||
Gross Expense | 0.97 | % | 0.97 | % | 0.97 | % | 0.96 | % | 0.97 | % | |||||||||||||||||
Net Expenses(c) | 0.18 | % | 0.07 | % | 0.08 | % | 0.14 | % | 0.13 | % | |||||||||||||||||
Net Investment Income | 0.01 | % | 0.01 | % | 0.01 | % | 0.01 | % | 0.01 | % | |||||||||||||||||
(a) Represents less than $0.001.
(b) Total returns for periods of less than one year, if any, are not annualized.
| (c) | The investment manager and other service providers voluntarily waived a portion of their fees. |
| (d) | Reflects investment operations for the period from March 12, 2012 to April 30, 2012. |
(e) Annualized for periods less than one year.
See Notes which are an integral part of the Financial Statements
| April 30, 2016 / ANNUAL REPORT |
| FINANCIAL HIGHLIGHTS |
| 27 |
For a share outstanding throughout each year ended April 30, unless otherwise noted:
WILMINGTON U.S. TREASURY MONEY MARKET FUND |
| Year Ended | Year Ended | Year Ended | Year Ended | Year Ended | |||||||||||||||||||||||
| ADMINISTRATIVE CLASS | April 30, 2016 | April 30, 2015 | April 30, 2014 | April 30, 2013 | April 30, 2012 | ||||||||||||||||||||||
| Net Asset Value, Beginning of Year | $1.000 | $1.000 | $1.000 | $1.000 | $1.000 | ||||||||||||||||||||||
| Income (Loss) From Operations: | |||||||||||||||||||||||||||
Net Investment Income | 0.000 | (a) | 0.000 | (a) | 0.000 | (a) | 0.000 | (a) | 0.000 | (a) | |||||||||||||||||
Net Realized Gain (Loss) on Investments | 0.000 | (a) | 0.000 | (a) | 0.000 | (a) | 0.000 | (a) | 0.000 | (a) | |||||||||||||||||
| Total Income (Loss) From Operations | 0.000 | 0.000 | 0.000 | 0.000 | 0.000 | ||||||||||||||||||||||
| Less Distributions From: | |||||||||||||||||||||||||||
Net Investment Income | (0.000 | )(a) | (0.000 | )(a) | (0.000 | )(a) | (0.000 | )(a) | (0.000 | )(a) | |||||||||||||||||
| Net Asset Value, End of Year | $1.000 | $1.000 | $1.000 | $1.000 | $1.000 | ||||||||||||||||||||||
| Total Return(b) | 0.01 | % | 0.00 | %(c) | 0.01 | % | 0.01 | % | 0.01 | % | |||||||||||||||||
| Net Assets, End of Year (000’s) | $646,349 | $631,472 | $782,360 | $827,103 | $909,306 | ||||||||||||||||||||||
| Ratios to Average Net Assets | |||||||||||||||||||||||||||
Gross Expense | 0.99 | % | 0.98 | % | 0.97 | % | 0.97 | % | 0.80 | % | |||||||||||||||||
Net Expenses(d) | 0.15 | % | 0.06 | % | 0.06 | % | 0.14 | % | 0.06 | % | |||||||||||||||||
Net Investment Income
| 0.01 | % | 0.00 | %(c) | 0.01 | % | 0.01 | % | 0.01 | % | |||||||||||||||||
| Year Ended | Year Ended | Year Ended | Year Ended | Year Ended | |||||||||||||||||||||||
| SELECT CLASS | April 30, 2016 | April 30, 2015 | April 30, 2014 | April 30, 2013 | April 30, 2012 | ||||||||||||||||||||||
| Net Asset Value, Beginning of Year | $1.000 | $1.000 | $1.000 | $1.000 | $1.000 | ||||||||||||||||||||||
| Income (Loss) From Operations: | |||||||||||||||||||||||||||
Net Investment Income | 0.000 | (a) | 0.000 | (a) | 0.000 | (a) | 0.000 | (a) | 0.000 | (a) | |||||||||||||||||
Net Realized Gain (Loss) on Investments | 0.000 | (a) | 0.000 | (a) | 0.000 | (a) | 0.000 | (a) | 0.000 | (a) | |||||||||||||||||
| Total Income (Loss) From Operations | 0.000 | 0.000 | 0.000 | 0.000 | 0.000 | ||||||||||||||||||||||
| Less Distributions From: | |||||||||||||||||||||||||||
Net Investment Income | (0.000 | )(a) | (0.000 | )(a) | (0.000 | )(a) | (0.000 | )(a) | (0.000 | )(a) | |||||||||||||||||
| Net Asset Value, End of Year | $1.000 | $1.000 | $1.000 | $1.000 | $1.000 | ||||||||||||||||||||||
| Total Return(b) | 0.01 | % | 0.00 | %(c) | 0.01 | % | 0.01 | % | 0.01 | % | |||||||||||||||||
| Net Assets, End of Year (000’s) | $242,597 | $264,955 | $314,375 | $386,574 | $210,231 | ||||||||||||||||||||||
| Ratios to Average Net Assets | |||||||||||||||||||||||||||
Gross Expense | 0.74 | % | 0.74 | % | 0.72 | % | 0.73 | % | 0.73 | % | |||||||||||||||||
Net Expenses(d) | 0.15 | % | 0.06 | % | 0.06 | % | 0.14 | % | 0.06 | % | |||||||||||||||||
Net Investment Income
|
| 0.01
| %
|
| 0.00
| %(c)
|
| 0.01
| %
|
| 0.01
| %
|
| 0.01
| %
| ||||||||||||
| Year Ended | Year Ended | Year Ended | Year Ended | Year Ended | |||||||||||||||||||||||
| SERVICE CLASS | April 30, 2016 | April 30, 2015 | April 30, 2014 | April 30, 2013 | April 30, 2012 | ||||||||||||||||||||||
| Net Asset Value, Beginning of Year | $1.000 | $1.000 | $1.000 | $1.000 | $1.000 | ||||||||||||||||||||||
| Income (Loss) From Operations: | |||||||||||||||||||||||||||
Net Investment Income | 0.000 | (a) | 0.000 | (a) | 0.000 | (a) | 0.000 | (a) | 0.000 | (a) | |||||||||||||||||
Net Realized Gain (Loss) on Investments | 0.000 | (a) | 0.000 | (a) | 0.000 | (a) | 0.000 | (a) | 0.000 | (a) | |||||||||||||||||
| Total Income (Loss) From Operations | 0.000 | 0.000 | 0.000 | 0.000 | 0.000 | ||||||||||||||||||||||
| Less Distributions From: | |||||||||||||||||||||||||||
Net Investment Income | (0.000 | )(a) | (0.000 | )(a) | (0.000 | )(a) | (0.000 | )(a) | (0.000 | )(a) | |||||||||||||||||
| Net Asset Value, End of Year | $1.000 | $1.000 | $1.000 | $1.000 | $1.000 | ||||||||||||||||||||||
| Total Return(b) | 0.01 | % | 0.00 | %(c) | 0.01 | % | 0.01 | % | 0.01 | % | |||||||||||||||||
| Net Assets, End of Year (000’s) | $26 | $18 | $6 | $10,034 | $8,909 | ||||||||||||||||||||||
| Ratios to Average Net Assets | |||||||||||||||||||||||||||
Gross Expense | 0.97 | % | 0.99 | % | 0.97 | % | 0.97 | % | 0.99 | % | |||||||||||||||||
Net Expenses(d) | 0.17 | % | 0.06 | % | 0.06 | % | 0.14 | % | 0.06 | % | |||||||||||||||||
Net Investment Income | 0.01 | % | 0.00 | %(c) | 0.01 | % | 0.01 | % | 0.01 | % | |||||||||||||||||
(a) Represents less than $0.001.
(b) Total returns for periods of less than one year, if any, are not annualized.
(c) Represents less than 0.01%.
(d) The investment manager and other service providers voluntarily waived a portion of their fees.
See Notes which are an integral part of the Financial Statements
| ANNUAL REPORT / April 30, 2016 |
| 28 |
| FINANCIAL HIGHLIGHTS (concluded) |
For a share outstanding throughout each year ended April 30, unless otherwise noted:
WILMINGTON TAX-EXEMPT MONEY MARKET FUND |
| Year Ended | Year Ended | Year Ended | Year Ended | Year Ended | |||||||||||||||||||||||
| ADMINISTRATIVE CLASS | April 30, 2016 | April 30, 2015 | April 30, 2014 | April 30, 2013 | April 30, 2012 | ||||||||||||||||||||||
| Net Asset Value, Beginning of Year | $1.000 | $1.000 | $1.000 | $1.000 | $1.000 | ||||||||||||||||||||||
| Income (Loss) From Operations: | |||||||||||||||||||||||||||
Net Investment Income | 0.000 | (a) | 0.000 | (a) | 0.000 | (a) | 0.000 | (a) | 0.000 | (a) | |||||||||||||||||
Net Realized Gain (Loss) on Investments | — | — | — | — | 0.000 | (a) | |||||||||||||||||||||
| Total Income (Loss) From Operations | 0.000 | 0.000 | 0.000 | 0.000 | 0.000 | ||||||||||||||||||||||
| Less Distributions From: | |||||||||||||||||||||||||||
Net Investment Income | (0.000 | )(a) | (0.000 | )(a) | (0.000 | )(a) | (0.000 | )(a) | (0.000 | )(a) | |||||||||||||||||
| Net Asset Value, End of Year | $1.000 | $1.000 | $1.000 | $1.000 | $1.000 | ||||||||||||||||||||||
| Total Return(b) | 0.01 | % | 0.01 | % | 0.01 | % | 0.01 | % | 0.01 | % | |||||||||||||||||
| Net Assets, End of Year (000’s) | $52,934 | $42,684 | $39,962 | $38,684 | $41,513 | ||||||||||||||||||||||
| Ratios to Average Net Assets | |||||||||||||||||||||||||||
Gross Expense | 1.02 | % | 1.01 | % | 1.00 | % | 0.99 | % | 0.87 | % | |||||||||||||||||
Net Expenses(c) | 0.06 | % | 0.05 | % | 0.09 | % | 0.16 | % | 0.23 | % | |||||||||||||||||
Net Investment Income
|
| 0.01
| %
|
| 0.01
| %
|
| 0.01
| %
|
| 0.01
| %
|
| 0.01
| %
| ||||||||||||
| Year Ended | Year Ended | Year Ended | Year Ended | Year Ended | |||||||||||||||||||||||
| SELECT CLASS | April 30, 2016 | April 30, 2015 | April 30, 2014 | April 30, 2013 | April 30, 2012 | ||||||||||||||||||||||
| Net Asset Value, Beginning of Year | $1.000 | $1.000 | $1.000 | $1.000 | $1.000 | ||||||||||||||||||||||
| Income (Loss) From Operations: | |||||||||||||||||||||||||||
Net Investment Income | 0.000 | (a) | 0.000 | (a) | 0.000 | (a) | 0.000 | (a) | 0.000 | (a) | |||||||||||||||||
Net Realized Gain (Loss) on Investments | — | — | — | — | 0.000 | (a) | |||||||||||||||||||||
| Total Income (Loss) From Operations | 0.000 | (a) | 0.000 | 0.000 | 0.000 | 0.000 | |||||||||||||||||||||
| Less Distributions From: | |||||||||||||||||||||||||||
Net Investment Income | (0.000 | )(a) | (0.000 | )(a) | (0.000 | )(a) | (0.000 | )(a) | 0.000 | (a) | |||||||||||||||||
| Net Asset Value, End of Year | $1.000 | $1.000 | $1.000 | $1.000 | $1.000 | ||||||||||||||||||||||
| Total Return(b) | 0.01 | % | 0.01 | % | 0.01 | % | 0.01 | % | 0.01 | % | |||||||||||||||||
| Net Assets, End of Year (000’s) | $411,810 | $413,692 | $421,579 | $406,386 | $362,551 | ||||||||||||||||||||||
| Ratios to Average Net Assets | |||||||||||||||||||||||||||
Gross Expense | 0.77 | % | 0.76 | % | 0.75 | % | 0.74 | % | 0.77 | % | |||||||||||||||||
Net Expenses(c) | 0.06 | % | 0.05 | % | 0.09 | % | 0.15 | % | 0.23 | % | |||||||||||||||||
Net Investment Income
|
| 0.01
| %
|
| 0.01
| %
|
| 0.01
| %
|
| 0.01
| %
|
| 0.01
| %
| ||||||||||||
| Year Ended | Year Ended | Year Ended | Year Ended | Year Ended | |||||||||||||||||||||||
| SERVICE CLASS | April 30, 2016 | April 30, 2015 | April 30, 2014 | April 30, 2013 | April 30, 2012 | ||||||||||||||||||||||
| Net Asset Value, Beginning of Year | $1.000 | $1.000 | $1.000 | $1.000 | $1.000 | ||||||||||||||||||||||
| Income (Loss) From Operations: | |||||||||||||||||||||||||||
Net Investment Income | 0.000 | (a) | 0.000 | (a) | 0.000 | (a) | 0.000 | (a) | 0.000 | (a) | |||||||||||||||||
Net Realized Gain (Loss) on Investments | — | — | — | — | 0.000 | (a) | |||||||||||||||||||||
| Total Income (Loss) From Operations | 0.000 | 0.000 | 0.000 | 0.000 | 0.000 | ||||||||||||||||||||||
| Less Distributions From: | |||||||||||||||||||||||||||
Net Investment Income | (0.000 | )(a) | (0.000 | )(a) | (0.000 | )(a) | (0.000 | )(a) | (0.000 | )(a) | |||||||||||||||||
| Net Asset Value, End of Year | $1.000 | $1.000 | $1.000 | $1.000 | $1.000 | ||||||||||||||||||||||
| Total Return(b) | 0.01 | % | 0.01 | % | 0.01 | % | 0.01 | % | 0.01 | % | |||||||||||||||||
| Net Assets, End of Year (000’s) | $58,235 | $79,316 | $74,708 | $57,425 | $57,379 | ||||||||||||||||||||||
| Ratios to Average Net Assets | |||||||||||||||||||||||||||
Gross Expense | 1.01 | % | 1.01 | % | 1.00 | % | 0.99 | % | 1.02 | % | |||||||||||||||||
Net Expenses(c) | 0.06 | % | 0.05 | % | 0.09 | % | 0.16 | % | 0.23 | % | |||||||||||||||||
Net Investment Income | 0.01 | % | 0.01 | % | 0.01 | % | 0.01 | % | 0.01 | % | |||||||||||||||||
(a) Represents less than $0.001.
(b) Total returns for periods of less than one year, if any, are not annualized.
(c) The investment manager and other service providers voluntarily waived a portion of their fees.
See Notes which are an integral part of the Financial Statements
| April 30, 2016 / ANNUAL REPORT |
| 29 |
Wilmington Funds
April 30, 2016
1. ORGANIZATION
Wilmington Funds (the “Trust”) is registered under the Investment Company Act of 1940, as amended (the “Act”), as an open-end management investment company. The Trust consists of 16 portfolios, 4 of which are presented herein (individually referred to as a “Fund” or collectively as the “Funds”). The remaining 12 funds are presented in separate reports.
| Fund | Investment Goal | |
Wilmington Prime Money Market Fund (“Prime Money Market Fund”)(d)
| The Fund seeks to provide current income while maintaining liquidity and stability of principal. | |
Wilmington U.S. Government Money Market Fund (“U.S. Government Money Market Fund”)(d)
| The Fund seeks to provide current income while maintaining liquidity and stability of principal. | |
Wilmington U.S. Treasury Money Market Fund (“U.S. Treasury Money Market Fund”)(d)
| The Fund seeks to provide current income while maintaining liquidity and stability of principal. | |
Wilmington Tax-Exempt Money Market Fund (“Tax-Exempt Money Market Fund”)(d) | The Fund seeks to provide current income that is exempt from federal income taxes while maintaining liquidity and stability of principal. |
(d) Diversified
The Trust offers 6 classes of shares: Class A, Service Class, Select Class, Administrative Class, Class I, and Institutional Class. Class A and Class I are not available for the Funds. All shares of the Trust have equal rights with respect to voting, except on class-specific matters.
The assets of each portfolio are segregated and a shareholder’s interest is limited to the portfolio in which shares are held.
In the normal course of business, the Funds may enter into contracts that provide general indemnifications. The Funds’ maximum exposure under these arrangements is dependent on claims that may be made against the Funds in the future, and, therefore, cannot be estimated; however, based on experience, the risk of material loss from such claims is considered remote.
2. SUMMARY OF SIGNIFICANT ACCOUNTING POLICIES
The following is a summary of significant accounting policies consistently followed by the Funds in the preparation of their financial statements. These policies are in conformity with U.S. generally accepted accounting principles (“GAAP”). The Trust is an investment company and follows accounting and reporting guidance under Financial Accounting Standards Board (“FASB”) Accounting Standard Codification (“ASC”) Topic 946, “Financial Services - Investment Companies.” The preparation of financial statements in conformity with GAAP requires management to make estimates and assumptions that affect the amounts of assets, liabilities, expenses and revenues reported in the financial statements. Actual results could differ from those estimated.
Computation of Net Asset Value – It is each Fund’s policy to maintain a continuous net asset value of $1.00 per share for each class. Each Fund has adopted certain investment, portfolio valuation and dividend and distribution policies to enable it to do so. There is no assurance, however, that each Fund will be able to maintain a stable net asset value of $1.00 per share. The net asset value (‘‘NAV’’) per share for each of the Funds is computed by dividing the total current value of the assets of a Fund, less its liabilities, by the total number of shares outstanding at the time of such computation. Each Fund’s NAV per share is computed as of 4:00 p.m. (Eastern Time), on days when the NYSE is open for regular trading and the Federal Reserve Bank of New York (the ‘‘Fed’’) is open. In addition, the Funds may elect, in their discretion if it is determined to be in shareholders’ best interests, to be open on days when the NYSE is open but the Fed is closed or to be open on days when the Fed is open but the NYSE is closed, except for Good Friday.
Investment Valuation – The Funds use the amortized cost method to value their portfolio securities, when it represents the best estimate of fair value in accordance with Rule 2a-7 under the Act.
The Trust follows the authoritative guidance (GAAP) for fair value measurements. The guidance establishes a framework for measuring fair value and a hierarchy for inputs used in measuring fair value that maximizes the use of observable inputs and minimizes the use of unobservable inputs by requiring that the most observable inputs be used when available. The guidance establishes three tiers of inputs that may be used to measure fair value. The three tiers of inputs are summarized at the end of each Fund’s Portfolio of Investments. The inputs or methodology used for valuing securities are not necessarily an indication of the risk associated with investing in those securities.
The Funds’ policy is to disclose transfers between levels based on valuations at the beginning of the reporting period. Each portfolio may hold securities which are periodically fair valued in accordance with the Funds’ fair value procedures. This may result in movements between Levels 1, 2 and 3 throughout the period. As of April 30, 2016, there were no transfers between Levels 1, 2 and 3 assets and liabilities based on levels assigned to securities at the beginning of the period. Pursuant to the Funds’ fair value procedures noted previously, fixed income securities and money market instruments are generally categorized as Level 2 securities in the fair value hierarchy.
| ANNUAL REPORT / April 30, 2016 |
| 30 |
| NOTES TO FINANCIAL STATEMENTS (continued) |
Repurchase Agreements – Repurchase agreements are transactions in which a Fund buys a security from a dealer or bank and agrees to sell the security back at a mutually agreed upon time and price. The repurchase price exceeds the sale price, reflecting the Fund’s return on the transaction. It is each Fund’s policy to require the counterparty to a repurchase agreement to transfer to the Funds’ custodian or sub-custodian eligible securities or cash with a market value (after transaction costs) at least equal to the repurchase price to be paid under the repurchase agreement. The eligible securities are transferred to accounts with the custodian or sub-custodian in which the Funds hold a “securities entitlement” and exercise “control” as those terms are defined in the Uniform Commercial Code. The Funds have established procedures for monitoring the market value of the transferred securities and requiring the transfer of additional eligible securities if necessary to equal at least the repurchase price. These procedures also allow the counterparty to require securities to be transferred from the account to the extent that their market value exceeds the repurchase price or in exchange for other eligible securities of equivalent market value.
The insolvency of the counterparty or other failure to repurchase the securities may delay the disposition of the underlying securities or cause the Funds to receive less than the full repurchase price.
Repurchase agreements are entered into by the Funds under Master Repurchase Agreements (“MRA”) which permit the Funds, under certain circumstances including an event of default (such as bankruptcy or insolvency), to offset payables and/or receivables under the MRA with collateral held and/or posted to the counterparty and create one single net payment due to or from the Fund.
At April 30, 2016, the open repurchase agreements by counterparty which are subject to a MRA on a net payment basis are as follows:
| Fund/Counterparty | Repurchase Agreements | Fair Value of Non-Cash Collateral Received(1) | Cash Collateral Received(1) | Net Amount(2) | ||||||||||||||||
Prime Money Market Fund | ||||||||||||||||||||
Credit Suisse First Boston LLC | $251,000,000 | $251,000,000 | $— | $— | ||||||||||||||||
U.S. Government Money Market Fund | ||||||||||||||||||||
Credit Suisse First Boston LLC
| 251,000,000 | 251,000,000 | — | — | ||||||||||||||||
Deutsche Bank Securities, Inc. | 30,000,000 | 30,000,000 | — | — | ||||||||||||||||
TD Securities, Inc. | 192,000,000 | 192,000,000 | — | — | ||||||||||||||||
TD Securities, Inc. | 165,000,000 | 165,000,000 | — | — | ||||||||||||||||
| $638,000,000 | $638,000,000 | $— | $— | |||||||||||||||||
U.S. Treasury Money Market Fund | ||||||||||||||||||||
Credit Suisse First Boston LLC | 82,000,000 | 82,000,000 | — | — | ||||||||||||||||
Deutsche Bank Securities, Inc. | 20,000,000 | 20,000,000 | — | — | ||||||||||||||||
| $102,000,000 | $102,000,000 | $— | $— | |||||||||||||||||
(1) The amount of collateral reflected in the table does not include any over-collateralization received by the Fund.
(2) Net amount represents the net amount receivable due from the counterparty in the event of default.
Investment Income, Gains and Losses, Expenses and Distributions – Interest income and expenses are accrued daily. All premiums and discounts on fixed income securities are amortized/accreted for financial statement purposes. Gains and losses realized on principal payment of mortgage-backed securities (paydown gains and losses) are classified as part of investment income. Dividends and distributions to shareholders are recorded on the ex-dividend date. Investment transactions are accounted for on a trade date basis for financial reporting purposes. Realized gains and losses from investment transactions are recorded on an identified cost basis.
Expenses of the Trust, which are directly identifiable to a specific Fund, are applied to that Fund. Expenses which are not identifiable to a specific Fund are allocated in such a manner as deemed equitable, taking into consideration the nature and type of expense.
All Funds offer multiple classes of shares. Investment income, realized gains and losses, and certain fund-level expenses are allocated to each class based on relative daily net assets, except that each class bears certain expenses unique to that class such as distribution and shareholder services fees. Distributions are declared separately for each class. No class has preferential distribution rights; differences in per share distributions rates are generally due to differences in class specific expenses. Distributions from net realized gains, if any, are declared and paid to shareholders annually. Distributions from net investment income are declared daily and paid monthly.
Federal Taxes – It is the Funds’ policy to comply with the Subchapter M provision of the Internal Revenue Code of 1986, as amended (the “Code”), and to distribute to shareholders each year substantially all of their income. Accordingly, no provisions for Federal income tax or excise tax are necessary.
The Funds recognize interest and penalties, if any, related to unrecognized tax benefits as income tax expense on the Statement of Operations. During the year ended April 30, 2016, the Funds did not incur any interest or penalties.
Restricted Securities – Restricted securities are securities that either (a) cannot be offered for public sale without first being registered, or being able to take advantage of an exemption from registration, under the Securities Act of 1933, as amended, or (b) are subject to contractual restrictions on public sales. In some cases, when a security cannot be offered for public sale without first being registered, the issuer of
| April 30, 2016 / ANNUAL REPORT |
| NOTES TO FINANCIAL STATEMENTS (continued) |
| 31 |
the restricted security has agreed to register such securities for resale, at the issuer’s expense, either upon demand by the Fund or in connection with another registered offering of the securities. Many such restricted securities may be resold in the secondary market in transactions exempt from registration. Restricted securities may be determined to be liquid under criteria established by the Trustees. A Fund will not incur any registration costs upon such resales.
3. FEDERAL TAX INFORMATION
As of April 30, 2016, there are no uncertain tax positions that would require financial statement recognition, de-recognition or disclosure. The Funds’ federal tax returns filed for the years ended 2015, 2014 and 2013, as well as the current tax year, remain subject to examination by the Internal Revenue Service.
The timing and character of income and capital gain distributions are determined in accordance with income tax regulations, which may differ from GAAP. These differences are due in part to the tax treatment of expiring capital loss carryforwards. GAAP requires that permanent differences in net investment income and realized gains and losses due to differences between financial reporting and tax reporting be reclassified between various components of net assets and have no effect on the net assets nor the NAV of the Funds.
For the year ended April 30, 2016, permanent differences identified and reclassified among the components of net assets were as follows:
| Increase (Decrease) | Accumulated | ||||||||||||||
| Paid-in | Undistributed Net | Net Realized | |||||||||||||
| Fund | Capital | Investment Income | Gain (Loss) | ||||||||||||
Tax-Exempt Money Market Fund | $ | (6,657 | ) | $ | — | $ | 6,657 | ||||||||
The tax character of distributions for the corresponding fiscal years as reported on the Statements of Changes in Net Assets were as follows:
2016 | 2015 | |||||||||||||||||||||||||||||
| Ordinary | Tax-Exempt | Long-Term | Ordinary | Tax-Exempt | Long-Term | |||||||||||||||||||||||||
| Fund | Income* | Income | Capital Gains | Income* | Income | Capital Gains | ||||||||||||||||||||||||
Prime Money Market Fund | $1,852,574 | $ | — | $— | $443,230 | $ | — | $— | ||||||||||||||||||||||
U.S. Government Money Market Fund | 688,102 | — | — | 414,875 | — | — | ||||||||||||||||||||||||
U.S. Treasury Money Market Fund | 92,037 | — | — | 1,226 | — | — | ||||||||||||||||||||||||
Tax-Exempt Money Market Fund | 1,715 | 58,821 | — | 576 | 50,347 | — | ||||||||||||||||||||||||
* For tax purposes, short-term capital gain distributions are considered ordinary income distributions.
As of April 30, 2016, the components of distributable earnings on a tax basis were as follows:
Undistributed | Other | |||||||||||||||||||||||||||||
| Undistributed | Long-Term | Timing | Unrealized | Capital Loss | Late Year | |||||||||||||||||||||||||
| Fund | Ordinary Income | Capital Gains | Differences | Appreciation | Carryforwards | Deferrals | ||||||||||||||||||||||||
Prime Money Market Fund | $ | 376,528 | $ | — | $ | (353,721 | ) | $ | — | $ | — | $ | — | |||||||||||||||||
U.S. Government Money Market Fund | 123,716 | — | (123,069 | ) | — | (7,279 | ) | — | ||||||||||||||||||||||
U.S. Treasury Money Market Fund | 27,081 | — | (27,411 | ) | — | (35,126 | ) | — | ||||||||||||||||||||||
Tax-Exempt Money Market Fund | 13,488 | — | (13,702 | ) | — | (65,401 | ) | — | ||||||||||||||||||||||
At April 30, 2016, the following Funds had capital loss carryforwards which will reduce each Fund’s taxable income arising from future net realized gain on investments, if any, to the extent permitted by the Code and thus will reduce the amount of distributions to shareholders which would otherwise be necessary to relieve the Fund of any liability for federal income tax. Pursuant to the Code, such capital loss carryforwards will expire as follows:
Short-Term | Long-Term | Total Capital | |||||||||||||||||||||||
| Capital Loss Available Through | Post-Effective | Post-Effective | Loss | ||||||||||||||||||||||
| Fund | 2017 | 2018 | No Expiration | No Expiration | Carryforwards | ||||||||||||||||||||
U.S. Government Money Market Fund | $ — | $ — | $7,279 | $— | $ 7,279 | ||||||||||||||||||||
U.S. Treasury Money Market Fund | — | — | 35,126 | — | 35,126 | ||||||||||||||||||||
Tax-Exempt Money Market Fund | 63,251 | 2,115 | 35 | — | 65,401 | ||||||||||||||||||||
Under current tax regulations, capital losses on securities transactions realized after October 31 may be deferred and treated as occurring on the first day of the following fiscal year. Under the Regulated Investment Company Modernization Act of 2010, the Funds are permitted to defer taxable ordinary income losses incurred after December 31 and treat as occurring on the first day of the following fiscal year. At April 30, 2016, the Funds had no Post-October or Late Year losses to defer.
| ANNUAL REPORT / April 30, 2016 |
| 32 |
| NOTES TO FINANCIAL STATEMENTS (continued) |
The Funds utilized capital loss carryforwards as follows to offset taxable capital gains realized during the year ended April 30, 2016:
Capital Loss | ||||
| Carryforwards | ||||
| Fund | Used | |||
| Prime Money Market Fund | $1,836 | |||
U.S. Government Money Market Fund | 17,283 | |||
U.S. Treasury Money Market Fund | 126 | |||
The Tax-Exempt Money Market Fund had capital loss carryforwards expire in the amount of $6,657.
4. ADVISORY FEES, SERVICING FEES, AND OTHER SERVICE PROVIDERS
Investment Advisor – Wilmington Funds Management Corporation (“WFMC” or the “Advisor”) serves as the Investment Advisor to each of the Funds. Wilmington Trust Investment Advisors, Inc. (“WTIA”) provides sub-advisory services to the Funds. WFMC and WTIA are wholly-owned subsidiaries of M&T Bank Corporation. For its services, the Funds pay WFMC an annual investment advisory fee, accrued and paid daily, based on a percentage of each Fund’s average daily net assets as described below. WFMC, not the Funds, pays WTIA for its services.
Advisory Fee | ||||
| Fund | Annual Rate | |||
Prime Money Market Fund | 0.40% | |||
U.S. Government Money Market Fund | 0.40% | |||
U.S. Treasury Money Market Fund | 0.40% | |||
Tax-Exempt Money Market Fund | 0.40% | |||
WFMC has voluntarily agreed to reduce its advisory fee and/or reimburse each of the Fund’s operating expenses, and/or certain class-specific fees and expenses, in an effort to maintain the current yield for each share class of the Funds at or above 0.00%. The fee waiver does not take into consideration acquired fund fees and expenses, taxes or extraordinary items. Any such waiver or expense reimbursement may be modified or discontinued at any time without notice. WFMC will not recoup previously waived fees/expenses in subsequent years.
Administrative Fees – The Bank of New York Mellon (“BNYM”) provides the Trust with fund administration services. The fees as described in the table below are a component of “Portfolio accounting and administration fees” as disclosed in the Statements of Operations. WFMC, in its role as Co-Administrator, provides the Funds with certain administrative personnel and services necessary to operate the Funds. The fees as described in the table below are disclosed on the Statement of Operations as “Administrative personnel and services fees.”
| Administration | Maximum Fee |
Average Aggregate Daily Net | ||||
WFMC | 0.040% | On the first $5 billion | ||||
|
0.030% |
| On the next $2 billion | |||
|
0.025% |
| On the next $3 billion | |||
|
0.018% |
| On assets in excess of $10 billion | |||
BNYM |
|
0.0285% |
| On the first $500 million | ||
|
0.0280% |
| On the next $500 million | |||
|
0.0275% |
| On assets in excess of $1 billion | |||
BNYM and WFMC may voluntarily choose to waive any portion of their fee and can add, modify or terminate a voluntary wavier at any time at their sole discretion. For the year ended April 30, 2016, BNYM waived amounts identified in the Statement of Operations as “Waiver of portfolio accounting and administration fees” and WFMC did not waive any administrative personnel and services fees.
Distribution Services Fee – The Trust has adopted a Distribution Services Plan (the “Plan”) pursuant to Rule 12b-1 under the Act. The Plan allows the Funds to pay fees to financial intermediaries, which may be paid through ALPS Distributors, Inc. (“ALPS”), the principal distributor, at an annual rate of up to 0.25% of the average daily net assets of the Funds’ Administrative Class and Service Class shares for the sale, distribution, administration, customer servicing and record keeping of these shares.
The Trust may reduce the maximum amount of distribution services fees it pays from time to time at its sole discretion. In addition, a financial intermediary (including ALPS, the Advisor or their affiliates), may voluntarily waive or reduce any fees to which they are entitled.
For the year ended April 30, 2016, no affiliates of the Advisor received these fees.
| April 30, 2016 / ANNUAL REPORT |
| NOTES TO FINANCIAL STATEMENTS (continued) |
| 33 |
Shareholder Services Fee – Pursuant to a Shareholder Services Plan adopted by the Funds and administered by ALPS, the Funds may pay up to 0.25% of the average daily net assets of each Fund’s Administrative Class, Select Class and Service Class shares to financial intermediaries (which may include ALPS, the Advisor or their affiliates) for providing shareholder services and maintaining shareholder accounts. M&T Securities, Inc. and Traders Trust Company (together, “M&T”) affiliates of the Advisor, has entered into a Shareholders Services Agreement with ALPS, under which it is entitled to receive up to 0.25% of the average daily net assets of each Fund’s shares for whom M&T provides shareholder services. The Funds may reduce the maximum amount of shareholder service fees it pays from time to time at its sole discretion. In addition, a financial intermediary (including M&T) may waive or reduce any fees to which they are entitled.
For the year ended April 30, 2016, M&T received a portion of the fees paid by the following Funds which are listed below:
Shareholder Services | ||
| Fund | Fee | |
Prime Money Market Fund | $263,668 | |
US Government Money Market Fund | 81,275 | |
US Treasury Money Market Fund | 1 | |
Tax Exempt Money Market Fund | 859 | |
Other Service Providers – Foreside Management Services, LLC (“FMS”) provides a Principal Executive Officer and Principal Financial Officer to the Trust. FMS has no role in determining the investment policies or which securities are to be sold or purchased by the Trust or its Funds.
BNYM provides custody services to the Trust.
BNY Mellon Investment Servicing (U.S.) Inc. provides fund accounting and transfer agency services to the Trust.
General – Certain Officers of the Trust are also Officers or employees of the above companies that provide services to the Funds, and during their terms of office, receive no compensation from the Funds. The Trust’s Statement of Additional Information includes additional information about the Trustees.
5. LINE OF CREDIT
Effective March 9, 2016, the Trust is participating in a $10,000,000 unsecured, committed revolving line of credit (“LOC”) agreement with BNYM. The LOC is made available for extraordinary or emergency purposes, primarily for financing redemption payments. Borrowings are charged interest at a rate of 1.25% per annum over the greater of the Federal Funds Rate or the overnight LIBOR Rate. The LOC includes a commitment fee of 0.15% per annum on the daily unused portion. The termination date of this LOC is March 7, 2017.
Prior to March 9, 2016, the Trust participated in a $20,000,000 LOC with BNYM. The LOC was made available for extraordinary or emergency purposes, primarily for financing redemption payments. Borrowings were charged interest at a rate of 1.25% per annum over the greater of the Federal Funds Rate or the overnight LIBOR Rate. The LOC included a commitment fee of 0.10% per annum on the daily unused portion.
The Funds did not utilize the LOC for the year ended April 30, 2016.
6. MONEY MARKET REFORM
On July 23, 2014, the U.S. Securities and Exchange Commission adopted amendments to money market fund regulations, which structurally changes the way that certain money market funds will be required to operate. The intent of the increased regulations is to improve transparency and to prevent a run on money market fund assets during times of financial crisis in the markets. Some of the highlights of the changes include mandating that certain money market funds move to a floating NAV, the ability of the funds to impose gates and redemption fees, and the requirement for additional disclosure on money market fund websites. The final date to comply is October 14, 2016.
7. SUBSEQUENT EVENTS
Management has evaluated events and transactions for potential recognition or disclosure in the financial statements through the date the financial statements were issued. Management has determined that, there are no material events that would require recognition or disclosure in the Funds’ financial statements through this date, except as follows:
At a meeting of the Trustees of the Trust on March 15, 2016, WFMC and WTIA recommended and the Trustees approved that each of the Prime Money Market Fund and the Tax-Exempt Money Market Fund (also referred to as “Target Funds”), each a series of the Trust, should be merged into the U.S. Government Money Market Fund (“Acquiring Fund”).
The closing for the Prime Money Market Fund merger is expected to occur on or about August 15, 2016. The closing for the Tax-Exempt Money Market Fund merger is expected to occur on or about August 22, 2016, subject to shareholder approval. Each Target Fund intends to continue to accept purchases from existing shareholders (including through the reinvestment of dividends and capital gains) up to and including the day of its merger.
| ANNUAL REPORT / April 30, 2016 |
| 34 |
REPORT OF INDEPENDENT REGISTERED PUBLIC ACCOUNTING FIRM
TO THE SHAREHOLDERS AND BOARD OF TRUSTEES OF
WILMINGTON FUNDS
We have audited the accompanying statements of assets and liabilities, including the portfolios of investments, of the Wilmington Prime Money Market Fund, Wilmington U.S. Government Money Market Fund, Wilmington U.S. Treasury Money Market Fund and Wilmington Tax-Exempt Money Market Fund (four of the series constituting the Wilmington Funds) (the “Funds”) as of April 30, 2016, and the related statements of operations for the year then ended, the statements of changes in net assets for each of the two years in the period then ended, and the financial highlights for each of the years or periods indicated therein. These financial statements and financial highlights are the responsibility of the Funds’ management. Our responsibility is to express an opinion on these financial statements and financial highlights based on our audits.
We conducted our audits in accordance with standards of the Public Company Accounting Oversight Board (United States). Those standards require that we plan and perform the audit to obtain reasonable assurance about whether the financial statements and financial highlights are free of material misstatement. We were not engaged to perform an audit of the Funds’ internal control over financial reporting. Our audits included consideration of internal control over financial reporting as a basis for designing audit procedures that are appropriate in the circumstances, but not for the purpose of expressing an opinion on the effectiveness of the Funds’ internal control over financial reporting. Accordingly, we express no such opinion. An audit also includes examining, on a test basis, evidence supporting the amounts and disclosures in the financial statements and financial highlights, assessing the accounting principles used and significant estimates made by management, and evaluating the overall financial statement presentation. Our procedures included confirmation of securities owned as of April 30, 2016, by correspondence with the custodian and brokers. We believe that our audits provide a reasonable basis for our opinion.
In our opinion, the financial statements and financial highlights referred to above present fairly, in all material respects, the financial position of the Wilmington Prime Money Market Fund, Wilmington U.S. Government Money Market Fund, Wilmington U.S. Treasury Money Market Fund and Wilmington Tax-Exempt Money Market Fund (four of the series constituting the Wilmington Funds) at April 30, 2016, the results of their operations for the year then ended, the changes in their net assets for each of the two years in the period then ended, and their financial highlights for each of the years or periods indicated therein, in conformity with U.S. generally accepted accounting principles.

Philadelphia, Pennsylvania
June 29, 2016
| April 30, 2016 / ANNUAL REPORT |
| BOARD OF TRUSTEES AND TRUST OFFICERS |
| 35 |
BOARD OF TRUSTEES AND TRUST OFFICERS
The following tables give information about each Trustee and the senior officers of the Trust. The tables separately list Trustee members who are “interested persons” of the Fund (i.e., “Interested” Trustees) and those who are not (i.e., “Independent” Trustees). The Trust is comprised of 16 funds. Unless otherwise noted, the business address of each Trustee and senior officer is 111 South Calvert Street, 26th floor, Baltimore, Maryland 21202. Each Trustee oversees all portfolios of the Trust and serves for an indefinite term. The Trust’s Statement of Additional Information includes additional information about the Trustees and is available, without charge and upon request, by calling 1-800-836-2211.
INTERESTED TRUSTEES BACKGROUND
Name Address Birth Year Position With Trust Date Service Began
| Principal Occupations and Other Directorships Held for Past Five Years
| |
Donald E. Foley* Birth year: 1951 TRUSTEE Began serving: December 2015 |
Principal Occupations: Advisory Member, Trust and Investment Committee, M&T Bank, Wilmington Trust, National Association, and Wilmington Trust Company.
Other Directorships Held: Director, AXA Equitable (variable annuity) (2013-Present); Director, 1290 Mutual Funds (retail funds) (2013-Present); Chairman and Director, Burke Rehabilitation Hospital Foundation (private hospital, research institute) (2005-Present); Director, M&T Bank Corporation (commercial bank) (2011-2012); Chairman and Director, Wilmington Trust Corporation (commercial and trust bank) (2007-2011); Chairman, Director and President’s Council, Union College (private college) (2011-2015).
Previous Positions: Director of M&T Bank Corporation and M&T Bank (2011 to 2012). Chairman and Chief Executive Officer of Wilmington Trust Corporation (2010-2011); Senior Vice President and Treasurer at ITT Corporation (1996-2010); Assistant Treasurer at International Paper (1989-1996).
| |
Christopher D. Randall* Birth year: 1965 TRUSTEE Began serving: September 2015 PRESIDENT Began serving: September 2014 |
Principal Occupations: Chief Operations Officer and a Senior Vice President of Wilmington Trust’s Wealth and Institutional Services Division (WISD); Senior Vice President of M&T Bank.
Other Directorships Held: None.
Previous Positions: President and Chief Executive Officer of Wilmington Trust Investment Advisors, Inc. and President of Wilmington Trust Investment Management, LLC (2014-2015); Senior Vice President, Head of Asset Management and Retirement Services (2012 to 2014); President, Mid-Atlantic Division, Wilmington Trust, N.A. (2011 to 2012); President, M&T Securities, Inc. (2009 to 2011).
|
| * | Christopher D. Randall is “interested” due to the positions he currently holds with the Funds, Wilmington Trust’s Wealth and Institutional Services Division, M&T Bank, the parent of the Fund’s Advisor, and previous positions held with WTIA and WFMC. Donald E. Foley is “interested” due to the positions he previously held with Wilmington Trust Corporation, M&T Bank Corporation and M&T Bank, the parent of the Fund’s Advisor. |
| ANNUAL REPORT / April 30, 2016 (unaudited) |
| 36 |
| BOARD OF TRUSTEES AND TRUST OFFICERS |
INDEPENDENT TRUSTEES BACKGROUND
Name Birth Year Position with Trust Date Service Began
| Principal Occupations and Other Directorships Held for Past Five Years
| |
Nicholas A. Giordano Birth year: 1943 CHAIRMAN and TRUSTEE Began serving: March 2012 |
Principal Occupations: Consultant, financial services organizations (1997 to present).
Other Directorships Held: Kalmar Pooled Investment Trust; The RBB Fund Inc. (19 portfolios) (registered investment companies); Independence Blue Cross; IntriCon Corporation (body-worn medical and electronic products)
Previous Positions: Interim President, LaSalle University (1998 to 1999); President and Chief Executive Officer, Philadelphia Stock Exchange (1981 to 1997).
| |
Robert H. Arnold Birth year: 1944 TRUSTEE Began serving: March 2012 |
Principal Occupations: Managing Director, R.H. Arnold & Co, Inc. (financial management consulting) (6/89 to present).
Other Directorships Held: First Potomac Realty Trust (real estate investment trust).
| |
Joseph J. Castiglia Birth year: 1934 TRUSTEE Began serving: February 1988 |
Principal Occupations: Consultant (not-for-profit) and Private Investor.
Other Directorships Held: Chairman, Trustee and Treasurer, Buffalo Olmsted Parks Conservancy (1/05 to 5/13); Chairman and Trustee, Buffalo Philharmonic Foundation (1/06 to 11/12); Vice Chairman and Trustee, Christ the King Seminary (1/05 to present); Director, Dunn Tire Corporation (1/05 to present); Chairman, Director and Treasurer, Read to Succeed Buffalo (1/08 to present); HCR Corporation (home care) (3/14 to present).
Previous Positions: President, Chief Executive Officer, Vice President, Treasurer and Vice Chairman, Pratt & Lambert United (manufacturer of paints, coatings and adhesives) (12/67- 1/96); Chairman and Director, Catholic Health (hospitals, nursing homes and home care) (1/97 to 5/03); Chairman and Director, Blue Cross Blue Shield of Western New York (5/92 to 5/07); Lead Director and Director, Energy East Corporation (gas and electric utility); Chairman and Director, Federal Reserve Bank of New York, Buffalo Branch; Chairman and Director, Community Foundation for Greater Buffalo; Chairman and Trustee, Canisius College; Chairman and Director, AAA of Western & Central New York.
| |
John S. Cramer Birth year: 1942 TRUSTEE Began serving: December 2000 |
Principal Occupations: Senior Consultant, Yaffe & Co. (health care consulting) (2/06 to present).
Other Directorships Held: Chairman and Director, CI Supply Corp. (medical supplies and equipment) (1/14 to 1/15); Director, Check Med Corp. (medical supplies and equipment) (6/08 to 1/14); Director, Highmark Blue Shield (health insurance) (2/01 to 6/10).
Previous Positions: Consultant, Yaffe & Co. (compensation consultants) (6/02 to 6/12); President and Chief Executive Officer, Pinnacle Health Systems (nonprofit hospital and health care system in Central Pennsylvania).
| |
Daniel R. Gernatt, Jr. Birth year: 1940 TRUSTEE Began serving: February 1988 |
Principal Occupations: President and CEO, Gernatt Asphalt Products, Inc. (asphalt, sand and gravel products) (1979 to present).
Other Directorships Held: Director, Roswell Park Alliance (2008 to present); Trustee, Gernatt Family Foundation.
| |
Richard B. Seidel Birth year: 1941 TRUSTEE Began serving: September 2003 |
Principal Occupations: President, R.B. Seidel & Associates (legal and consulting) (1/14 to present); President, Girard Private (investment) (1/14 to present); Chairman, Girard Capital (broker-dealer) (1/10 to present).
Other Directorships Held: Director, Tristate Capital Bank (1/08 to present).
|
| April 30, 2016 (unaudited) / ANNUAL REPORT |
| BOARD OF TRUSTEES AND TRUST OFFICERS |
| 37 |
OFFICERS
Name Address Birth Year Positions with Trust
| Principal Occupations for Past Five Years and Previous Positions
| |
Michael D. Daniels Birth year: 1967 CHIEF OPERATING OFFICER Began serving: June 2007 |
Principal Occupations: Chief Operating Officer, Wilmington Funds and Wilmington Trust Investment Advisors, Inc.; Administrative Vice President, M&T Bank.
Previous Positions: Senior Vice President, MSD&T and MCA (2006 to 2007); Vice President, Calamos Asset Management (2004 to 2006); Vice President, JP Morgan Chase Bank (2002 to 2004).
| |
Jeffrey M. Seling Birth year: 1970 ASSISTANT TREASURER Began serving: June 2013 VICE PRESIDENT Began serving: June 2007
|
Principal Occupations: Vice President, M&T Bank and Wilmington Trust Investment Advisors, Inc.; Assistant Treasurer, Wilmington Funds.
Previous Positions: Vice President, MSD&T; Assistant Vice President, Wells Fargo Bank; Assistant Vice President, JP Morgan Chase Bank. | |
John C. McDonnell Birth year: 1966 VICE PRESIDENT AND ASSISTANT TREASURER Began serving: June 2013 |
Principal Occupations: Vice President, Wilmington Funds Management Corporation (2005 to present); Vice President, Wilmington Trust Investment Advisors, Inc. (2012 to present).
Previous Positions: Vice President, Wilmington Trust Investment Management, LLC (2005 to 2012); Audit Senior, Deloitte LLP (2004 to 2005); Assistant Vice President, 1838 Investment Advisors, LP (1999 to 2004).
| |
Mary Ellan Reilly Birth year: 1970 CHIEF COMPLIANCE OFFICER and AML COMPLIANCE OFFICER. Began serving: March 2015 |
Principal Occupations: Chief Compliance Officer and Anti-Money Laundering Officer, Wilmington Funds; Administrative Vice President, M&T Bank.
Previous Positions: Administrative Vice President, M&T Bank, and Program Director, Buffalo Promise. Neighborhood (2013-2015); Vice President, M&T Bank, and Product Manager, Wilmington Trust Retirement and Institutional Services Company (2010-2013); Vice President, M&T Bank, and Risk Manager, M&T Investment Group (2006 to 2010).
| |
Eric B. Paul Birth year: 1974 VICE PRESIDENT Began serving: June 2008 |
Principal Occupations: Administrative Vice President, M&T Bank (2003 to present); Director of Proprietary Products, M&T Bank (2008 to present). | |
Ralph V. Partlow, III 25 South Charles Street, 22nd floor Baltimore, MD 21201 Birth year: 1957 VICE PRESIDENT Began serving: June 2010
|
Principal Occupation: Administrative Vice President and Deputy General Counsel, M&T Bank (2003 to present).
Previous Positions: Vice President and Senior Counsel, Allfirst Bank (1995 to 2003). | |
Christopher W. Roleke 10 High Street, Suite 302 Boston, MA 02110 Birth year: 1972 CHIEF FINANCIAL OFFICER AND TREASURER Began serving: July 2013
|
Principal Occupation: Managing Director and Fund Principal Financial Officer, Foreside Management Services, LLC (2011 to present).
Previous Positions: Assistant Vice President, JP Morgan Investor Services Co. (2006 to 2011). |
| ANNUAL REPORT / April 30, 2016 (unaudited) |
| 38 |
| BOARD OF TRUSTEES AND TRUST OFFICERS |
Name Address Birth Year Positions with Trust
| Principal Occupations for Past Five Years and Previous Positions
| |
Lisa R. Grosswirth Atlantic Terminal Office Tower, 2 Hanson Place, 12th Floor Brooklyn, NY 11217 Birth year: 1963 SECRETARY Began serving: September 2007
|
Principal Occupation: Vice President, BNY Mellon Asset Servicing (2004 to present).
Previous Positions: Supervisory Paralegal, The Dreyfus Corporation (1998 to 2004). | |
Richard J. Berthy Three Canal Plaza, Suite 100 Portland, ME 04101 Birth year: 1958 CHIEF EXECUTIVE OFFICER Began serving: September 2007 |
Principal Occupation: Chief Executive Officer, Foreside Financial Group, LLC (2012 to present).
Previous Positions: President, Foreside Financial Group, LLC (2008 to 2012); Chief Administrative Officer, Foreside Financial Group, LLC (2005 to 2008); President and Secretary, Bainbridge Capital Management, LLC (2003 to 2006); Vice President, Bainbridge Capital Management (2002 to 2004).
|
| April 30, 2016 (unaudited) / ANNUAL REPORT |
| 39 |
Shares of the Wilmington Funds are not FDIC insured or otherwise protected by the U.S. government, are not deposits or other obligations of, or guaranteed by, Manufacturers and Traders Trust Company, and are subject to investment risks, including possible loss of the principal amount invested.
VOTING PROXIES ON FUND PORTFOLIO SECURITIES
A description of the policies and procedures that the Funds use to determine how to vote proxies relating to securities held in the Funds’ portfolios is available, without charge and upon request, by calling 1-800-836-2211. A report on how the Funds voted any such proxies during the most recent 12-month period ended June 30 is available through Wilmington Funds’ website. Go to www.wilmingtonfunds.com select “Proxy Voting Record” to access the link. This information is also available from the Edgar database on the SEC’s website at www.sec.gov.
QUARTERLY PORTFOLIO SCHEDULE
The Funds file with the SEC a complete schedule of their portfolio holdings, as of the close of the first and third quarters of their fiscal year, on Form N-Q. These filings are available on the SEC’s website at www.sec.gov and may be reviewed and copied at the SEC’s Public Reference Room in Washington DC. (Call 1-800-SEC-0330 for information on the operation of the Public Reference Room.)
Electronic Delivery
Wilmington Funds encourages you to sign up for electronic delivery of investor materials. By doing so you will receive information faster, help lower shareholder costs, and reduce the impact to the environment. To enroll in electronic delivery:
| 1.) | Go to www.wilmingtonfunds.com and select “Individual Investors” |
| 2.) | Click on the link “Sign up for Electronic Delivery” |
| 3.) | Login to your account or create new user ID |
| 4.) | Select E-Delivery Consent from the available options, and |
| 5.) | Complete the information requested, including providing the email address where you would like to receive notification for electronic documents. |
* If you hold your account through a financial intermediary, please contact your advisor to request electronic delivery of investor materials.
Householding
In an effort to reduce volume of mail you receive, only one copy of the prospectus, annual/semi-annual report, SAI and proxy statements will be sent to shareholders who are part of the same family and share the same address.
If you would like to request additional copies of the prospectus, annual/semi-annual report or SAI, or wish to opt out of householding mailings, please contact Shareholder Services at 1-800-836-2211, or write to Wilmington Funds, P.O. Box 9828, Providence, RI 02940-8025.
| ANNUAL REPORT / April 30, 2016 |
| 40 |
PRIVACY POLICY AND NOTICE
OF THE FUNDS AND THEIR DISTRIBUTOR
June 8, 2012
The Wilmington Funds, their distributor and their agents (referred to as “the Funds”, “we” or “us”) recognize that consumers (referred to as “you” or “your”) expect us to protect both your assets and financial information. We respect your right to privacy and your expectation that all personal information about you or your account will be maintained in a secure manner. We are committed to maintaining the confidentiality, security and integrity of client and shareholder information. We want you to understand the Funds’ policy that governs the handling of your information, how the Funds gather information, how that information is used and how it is kept secure.
Information The Funds Collect:
The Funds collect nonpublic personal information about you from the following sources:
| • | We may receive information from you, or from your financial representative, on account applications, other forms or electronically (such as through the Funds’ website or other electronic trading mechanisms). Examples of this information include your name, address, social security number, assets and income. |
| • | We may receive information from you, or from your financial representative, through transactions with us or others, correspondence and other communications. Examples of this information include specific investments and your account balances. |
| • | We may obtain other personal information from you in connection with providing you a financial product or service. Examples of this information include depository, debit or credit account numbers. |
Information Sharing Policy
The Funds may share nonpublic personal information about you, as described above, with financial or non-financial companies or other entities, including companies that may be affiliated with the Funds and other nonaffiliated third parties, for the following purposes:
| • | We may share information when it is necessary and required to process a transaction or to service a customer relationship. For example, information may be shared with a company that provides account record keeping services or a company that provides proxy services to shareholders. |
| • | We may share information when it is required or permitted by law. For example, information may be shared in response to a subpoena or to protect you against fraud or with someone who has established a legal beneficial interest, such as a power of attorney. |
| • | We may disclose some or all of the information described above to companies that perform marketing or other services on our behalf. For example, we may share information about you with the financial intermediary (bank, investment bank or broker-dealer) through whom you purchased the Funds’ products or services, or with providers of marketing, legal, accounting or other professional services. The Funds will not, however, disclose a consumer’s account number or similar form of access number or access code for credit card, deposit or transaction accounts to any nonaffiliated third party for use in telemarketing, direct mail or other marketing purposes. |
Except as described above, the Funds do not share customer information. We will not rent, sell, trade, or otherwise release or disclose any personal information about you. Any information you provide to us is for the Funds’ use only. If you decide to close your account(s) or become an inactive customer, we will adhere to the privacy policies and practices as described in this notice.
Information Security:
When the Funds share nonpublic customer information with third parties hired to facilitate the delivery of certain products or services to our customers, such information is made available for limited purposes and under controlled circumstances designed to protect our customers’ privacy. We require third parties to comply with our standards regarding security and confidentiality of such information. We do not permit them to use that information for their own or any other purposes, or rent, sell, trade or otherwise release or disclose the information to any other party. These requirements are reflected in written agreements between the Funds and the third party service providers.
The Funds protect your personal information in several ways. We maintain physical, electronic, and procedural safeguards to guard your nonpublic personal information. In addition, the Funds’ Transfer Agent and Shareholder Servicing Agent have procedures in place for the appropriate disposal of nonpublic personal information when they are no longer required to maintain the information.
Each of the following sections explains an aspect of the Funds’ commitment to protecting your personal information and respecting your privacy.
Employee Access to Information:
Our Code of Ethics, which applies to all employees, restricts the use of customer information and requires that it be held in the strictest of confidence. Employee access to customer information is authorized for business purposes only, and the degree of access is based on the sensitivity of the information and on an employee’s or agent’s need to know the information in order to service a customer’s account or comply with legal requirements.
Visiting The Funds’ Website:
The Funds’ website gathers and maintains statistics about the number of visitors as well as what information is viewed most frequently. This information is used to improve the content and level of service we provide to our clients and shareholders.
| April 30, 2016 / ANNUAL REPORT |
| 41 |
| • | Information or data entered into a website will be retained. |
| • | Where registration to a website or re-entering personal information on a website is required, “cookies” are used to improve your online experience. A cookie is a way for websites to recognize whether or not you have visited the site before. It is a small file that is stored on your computer that identifies you each time you re-visit our site so you don’t have to resubmit personal information. Cookies provide faster access into the website. |
| • | We may also collect non-personally identifiable Internet Protocol (“IP”) addresses for all other visitors to monitor the number of visitors to the site. These non-personally identifiable IP addresses are never shared with any third party. |
E-mail:
If you have opted to receive marketing information from the Funds by e-mail, it is our policy to include instructions in all marketing messages on how to unsubscribe from subsequent e-mail programs. Some products or services from the Funds are intended to be delivered and serviced electronically. E-mail communication may be utilized in such cases. If you participate in an employer-sponsored retirement plan administered by the Funds, we may, at your employer’s request, send you e-mail on matters pertaining to the retirement plan.
Please do not provide any account or personal information such as social security numbers, account numbers, or account balances within your e-mail correspondence to us. We cannot use e-mail to execute transaction instructions, provide personal account information, or change account registration. We can, however, use e-mail to provide you with the necessary forms or you may contact customer service toll-free at 1-800-836-2211.
Surveys/Aggregate Data:
Periodically, the Funds may conduct surveys about financial products and services or review elements of customer information in an effort to forecast future business needs. The Funds then generate reports that include aggregate data regarding its customers. Aggregate data classifies customer information in various ways but that does not identify individual customers. These reports may also include information on website traffic patterns and related information. These reports are used for the Funds’ planning, statistical and other corporate purposes. Aggregate data may also be shared with external parties, such as marketing organizations. However, no information is shared by which any individual customer could be identified.
Changes to Our Privacy Statement:
The effective date of this policy is June 8, 2012. We reserve the right to modify this policy at any time. When it is revised or materially changed, we will update the effective date. You can determine whether there have been changes since the last time you reviewed by simply checking the effective date.
Notice will be provided to you in advance of any changes that would affect your rights under this policy statement
| ANNUAL REPORT / April 30, 2016 |
[This Page Intentionally Left Blank]
[This Page Intentionally Left Blank]

| Wilmington Broad Market Bond Fund (“Broad Market Bond Fund”) | ||||
| Wilmington Intermediate-Term Bond Fund (“Intermediate-Term Bond Fund”) | ||||
| Wilmington Short-Term Bond Fund (“Short-Term Bond Fund”) | ||||
| Wilmington Municipal Bond Fund (“Municipal Bond Fund”) | ||||
| Wilmington New York Municipal Bond Fund (“New York Municipal Bond Fund”) | ||||

| PRESIDENT’S MESSAGE | ||||||||
| ||||||||
| President’s Message | i | |||||||
| WILMINGTON FUNDS ANNUAL REPORT | ||||||||
| ||||||||
| Management’s Discussion of Fund Performance | 1 | |||||||
| Shareholder Expense Example | 14 | |||||||
| Portfolios of Investments | 16 | |||||||
| Statements of Assets and Liabilities | 49 | |||||||
| Statements of Operations | 51 | |||||||
| Statements of Changes in Net Assets | 53 | |||||||
| Financial Highlights | 56 | |||||||
| Notes to Financial Statements | 61 | |||||||
| Report of Independent Registered Public Accounting Firm | 70 | |||||||
| Board of Trustees and Trust Officers | 71 | |||||||
[This Page Intentionally Left Blank]
| i |
I am pleased to present the Annual Report of the Wilmington Funds (the “Trust”), covering the Trust’s fiscal year of May 1, 2015, through April 30, 2016. Inside you will find a comprehensive review of the Trusts’ holdings and financial statements.
The Economy and Financial Markets in Review
Wilmington Funds Management Corporation, the investment advisor to the Trust, and Wilmington Trust Investment Advisors, Inc., the sub-advisor to the Trust, have provided the following review of the economy, bond markets, and stock markets for the Trust’s fiscal year.
The Economy
While the U.S. economy continued to expand, the growth in gross domestic product (“GDP”) turned successively weaker with each quarter. GDP grew a healthy 3.9% in the second quarter of 2015, but the pace of growth slowed to 2.0% in the third quarter, decelerated to a tepid 1.4% gain in the fourth quarter, and nearly came to a standstill with a marginal gain of 0.5% in the first quarter of 2016.i
ihttp://www.bea.gov/national/index.htm#gdp
A strong U.S. dollar, weak global economy, falling oil prices, and sluggish wage growth were contributing factors to this disappointing economic performance.
The unemployment rate declined to 5.0% in April of 2016, down from the 5.5% rate in May of 2015. While the lower unemployment rate is welcome, the overall employment picture remains mixed, as the labor participation rate (62.8%) is stuck at historical lows, while wage growth is muted, increasing just 2.5% in the last 12 months.ii
iihttp://www.bls.gov/news.release/empsit.nr0.htm
The price of oil continued its long slide. West Texas Intermediate (a grade of crude oil used as an oil pricing benchmark) fell from nearly $60 per barrel to just under $46 per barrel, after dipping below $30 per barrel in January.iii This price decline has severely impacted both the oil industry and the banks that have made loans to oil-related companies. The savings to consumers are real, but seem not to have translated into the level of spending that might accelerate economic growth.
iiihttp://www.eia.gov/dnav/pet/hist/LeafHandler.ashx?n=PET&s=RWTC&f=D
The Federal Reserve (the “Fed”) raised the federal funds rate by 25 basis points1 (0.25%) in December 2015, the first such hike since 2006. With the announcement came a statement of intentions regarding the pace of future hikes. As the economy subsequently weakened, however, the Fed moderated its position on future rate increases, communicating that any increases would come only after a careful analysis of U.S. economic health and global stock market stability.
The Bond Markets
Yields fluctuated widely over the course of the Trust’s fiscal year. The 10-year Treasury note began May 2015 with a yield of 2.05%, peaking at 2.50% in June, only to quickly fall as investors rushed to safety amid a global stock market rout in August. Yields eventually turned higher as the prospect of a Fed hike in December grew. By the end of April 2016, however, yields ended lower at 1.83% on expectations that the Fed would put off any additional rate hikes in the near term.iv
ivhttp://www.treasury.gov/resource-center/data-chart-center/interest-rates/Pages/TextView.aspx?data=yieldYear&year=2016
The Barclays U.S. Aggregate Index2 turned in a modestly positive performance, gaining 2.72% over the 12-month period ended in April 2016. The Barclays U.S. Long-Term Treasury Index3 was the top gainer, rising 5.49%.
The high-yield market was buffeted by liquidity concerns toward the end of the calendar year, but managed to stabilize in the months that followed. The Barclays U.S. Corporate High Yield Bond Index4 ended lower, losing 1.12%.
In the tax-exempt market, concerns about a bond default by Puerto Rico were not enough to prevent a strong performance in municipal bonds, as the Barclays Municipal Bond Index5 gained 5.29%.
Global bond markets enjoyed an even stronger performance as central bankers from Europe to Japan pursued monetary easing and even negative interest rates in attempts to jump-start their struggling economies. The Barclays Global Aggregate ex-USD6 jumped 6.55% over the last 12 months ended April 30, 2016.
For the 12-month reporting period May 1, 2015 through April 30, 2016, certain Barclays indices performed as follows7:
Barclays U.S. Aggregate Bond Index | Barclays U.S. Treasury Bond Index8 |
Barclays U.S. Mortgage- Backed Securities Index9 | Barclays U.S. Credit Bond Index10 | Barclays Municipal Bond Index | ||||||
2.72% | 2.83% | 2.56% | 2.77% | 5.29% |
| PRESIDENT’S MESSAGE / April 30, 2016(unaudited) |
| ii |
The Stock Markets
The U.S. stock market experienced sharp declines and price recoveries, but was unable to break out of the trading range it’s occupied for the last 18 months.
Stocks weathered a number of challenges, beginning the fiscal year with the threat of a Greek bankruptcy and the country’s withdrawal from the European Union. No sooner was that crisis resolved than investors were confronted with an unexpected currency devaluation by China, which led to sharp losses in stock prices in the month of August, a slide that extended into September.
Prices staged a strong recovery in October, recouping most of their previous losses as Europe hinted at monetary stimulus, China cut rates, and the Fed delayed its anticipated interest rate increase.
January turned in nearly a mirror performance of August as oil prices resumed their slide, anxieties grew about China’s economic health, and the world’s economies remained stagnant. Stocks staged yet another recovery in March, sparked by firming oil prices, fresh monetary easing in Europe, and new stimulus steps in China.
After all the market gyrations, stocks ended generally right where they began, with the Russell 3000 Index11, a broad domestic market index, falling just 0.18%, for the year ended April 30, 2016.
U.S. large-cap stocks outperformed mid-cap and small-cap stocks, as indicated by the 1.21% gain in the S&P 500 index12 and the declines in the Russell Midcap Index13 (-2.14%) and the Russell 2000 Index14 (-5.94%).
While growth stocks led performance in the large-cap space—the Russell 1000 Growth Index15 rose 1.07% versus a small loss in the Russell 1000 Value Index16 (-0.40%)—they underperformed value stocks significantly in the mid-cap and small-cap markets.
The best-performing S&P industry sectors were utilities (+14.26%), consumer staples (+10.46%), and telecommunication services (+9.71%). The energy sector turned in the worst performance, sliding 15.18%.
Real estate posted a strong performance, with the FTSE NAREIT Equity REITs Index17 posting a gain of 7.86%.
Overseas markets endured a difficult year, as reflected in the 9.32% decline in the MSCI EAFE (net) Index18.Emerging markets were particularly hard hit, with the MSCI Emerging Markets (net) Index19 losing 17.87%.
For the 12-month reporting period May 1, 2015 through April 30, 2016, certain stock market indices performed as follows:
S&P 500 Index | Dow Jones Industrial Average20 | NASDAQ Composite Index21 |
MSCI All Country World ex-US (Net) Index22 | |||||
1.21% | 2.25% | -2.19% | -11.28% |
The markets this past year have been a reminder that a broadly diversified portfolio and the patience to stay invested through periods of market volatility can be essential to long-term investment success.23 We remain committed to managing your assets with a long-term view and working hard in the year ahead to help you reach your important financial goals.
Sincerely,

Christopher D. Randall
President
May 27, 2016
For more complete information, please download the Funds’ prospectus, which is available on www.wilmingtonfunds.com, or call 1-800-836-2211 for a copy. You should consider the Funds’ investment objectives, risks, charges, and expenses carefully before you invest. Information about these and other important subjects is in the Funds’ prospectus, which you should read carefully before investing.
Past performance is no guarantee of future results. The index performance quoted is for illustrative purposes only and is not representative of any specific investment. Diversification does not ensure a profit nor protect against loss.
All investments involve risk, including the possible loss of principal. Equity securities are subject to price fluctuation and possible loss of principal. Small and mid-cap stocks involve greater risks and volatility than large-cap stocks. International investments are subject to special risks, including currency fluctuations, social, economic, and political uncertainties, which could increase volatility. These risks are magnified in emerging markets.
| April 30, 2016(unaudited) / PRESIDENT’S MESSAGE |
| iii |
High yield, lower-rated securities generally entail greater market, credit and liquidity risks than investment grade securities and may include higher volatility and higher risk of default.
You could lose money by investing in the money market funds. Although the money market funds seek to preserve the value of your investment at $1.00 per share, they cannot guarantee they will do so. An investment in money market funds is not a deposit of M&T Bank and is not insured or guaranteed by the Federal Deposit Insurance Corporation or any other government agency. The investment advisor has no legal obligation to provide financial support to the Funds, and you should not expect that the investment advisor will provide financial support to the Funds at any time.
| 1. | Basis Points (“BPS”) is a unit that is equal to 1/100th of 1% and is used to denote the change in a financial instrument. The basis point is commonly used for calculating changes in interest rates, equity indices and the yield. |
| 2. | Barclays U.S. Aggregate Bond Index is a widely used benchmark index for the domestic investment-grade bond market composed of securities from the Barclays Government/Corporate Bond Index, Mortgage-Backed Securities Index and Asset-Backed Securities Index. The index typically includes fixed income securities with overall intermediate- to long-term average maturities. The index is unmanaged and investments cannot be made directly in an index. |
| 3. | Barclays U.S. Long-Term Treasury Index is an unmanaged index that includes all publicly issued U.S. Treasury securities that have a remaining maturity of 10 or more years, are rated investment grade, and have $250 million or more of outstanding face value. |
| 4. | Barclays U.S. Corporate High Yield Bond Index measures the USD-denominated, high yield, fixed-rate corporate bond market. Securities are classified as high yield if the middle rating of Moody’s, Fitch, and S&P is Ba1/BB+/BB+ or below. Bonds from issuers with an emerging markets country of risk, based on Barclays EM country definition, are excluded. The U.S. Corporate High Yield Bond Index is a component of the U.S. Universal and Global High Yield Indices. |
| 5. | Barclays Municipal Bond Index tracks the performance of long-term, tax-exempt, investment-grade bond markets. To be included in the index, bonds must have an outstanding par balance of at least $7 million and be issued as part of a transaction of at least $75 million. The index is unmanaged and investments cannot be made directly in an index. |
| 6. | Barclays Global Aggregate ex-USD provides a broad-based measure of the global investment-grade fixed income markets. The three major components of this index are the U.S. Aggregate, the Pan-European Aggregate, and the Asian-Pacific Aggregate indices. The index also includes Eurodollar and Euro-Yen corporate bonds, Canadian government, agency and corporate securities, and USD investment grade 144A securities. An investment cannot be made directly in an index. |
| 7. | Bond prices are sensitive to changes in interest rates and a rise in interest rates can cause a decline in their prices. |
| 8. | Barclays U.S. Treasury Bond Index is a market capitalization weighted index that includes all publicly issued, U.S. Treasury securities that have a remaining maturity of at least one year, are rated investment-grade, and have $250 million or more of outstanding face value. The index is unmanaged and investments cannot be made directly in an index. |
| 9. | Barclays U.S. Mortgage Backed Securities Index is composed of all securities mortgage pools by GNMA, FNMA and the FHLMC, including GNMA graduated Payment Mortgages. The index is unmanaged and investments cannot be made directly in an index. |
| 10. | Barclays U.S. Credit Bond Index tracks the performance of domestic investment-grade corporate bonds and is composed of all publicly issued, fixed-rate, nonconvertible, investment-grade corporate debt. The index is unmanaged and investments cannot be made directly in an index. |
| 11. | The Russell 3000 Index is a capitalization weighted index that seeks to be a benchmark of the entire U.S. stock market. It measures the performance of the 3,000 largest publicly held companies incorporated in the U.S. based on market capitalization. |
| 12. | The S&P 500 Index is a capitalization-weighted index of 500 stocks designed to measure performance of the broad domestic economy through changes in the aggregate market value of 500 stocks representing all major industries. The index is unmanaged and investments cannot be made directly in an index. |
| 13. | Russell Midcap Index measures the performance of the 800 smallest companies in the Russell 1000 Index, which represents approximately 25% of the total market capitalization of the Russell 1000 Index. |
| 14. | Russell 2000 Index measures the performance of the 2,000 smallest companies in the Russell 3000 Index, which represents approximately 8% of the total market capitalization of the Russell 3000 Index. |
| 15. | Russell 1000 Growth Index measures the performance of those Russell 1000 companies with higher price-to-book ratios and higher forecasted growth values. |
| 16. | Russell 1000 Value Index measures the performance of those Russell 1000 companies with lower price-to-book ratios and lower forecasted growth values. |
| 17. | FTSE NAREIT Equity REITs Index is a free float-adjusted, market capitalization-weighted index of U.S. Equity REITs. Constituents of the Index include all tax-qualified REITs with more than 50 percent of total assets in qualifying real estate assets other than mortgages secured by real property. |
| 18. | MSCI EAFE (Net) Index is a free float-adjusted market capitalization index that is designed to measure equity market performance of developed markets, excluding the U.S. & Canada. The index consisted of the following 22 developed market country indices: Australia, Austria, Belgium, Denmark, Finland, France, Germany, Greece, Hong Kong, Ireland, Israel, Italy, Japan, Netherlands, New Zealand, Norway, Portugal, Singapore, Spain, Sweden, Switzerland and the United Kingdom. The index is unmanaged and investments cannot be made directly in an index. The performance of this index is reduced by the taxes on dividends paid by the international securities issuers in the index. |
| 19. | MSCI Emerging Markets (Net) Index is a free float-adjusted market capitalization index that is designed to measure equity market performance of emerging markets. The MSCI Emerging Markets Index consisted of the following 21 emerging market country indices: Brazil, Chile, China, Colombia, Czech Republic, Egypt, Hungary, India, Indonesia, Korea, Malaysia, Mexico, Morocco, Peru, Philippines, Poland, Russia, South Africa, Taiwan, Thailand, and Turkey. The index is unmanaged and investments cannot be made directly in an index. The performance of this index is reduced by the taxes on dividends paid by the international securities issuers in the index. |
| 20. | Dow Jones Industrial Average (“DJIA”) represents share prices of selected blue chip industrial corporations as well as public utility and transportation companies. The DJIA indicates daily changes in the average prices of stocks in any of its categories. It also reports total sales for each group of industries. Because it represents the top corporations of America, the DJIA’s average movements are leading economic indicators for the stock market as a whole. The average is unmanaged and investments cannot be made directly in an average. |
| 21. | NASDAQ Composite Index measures all NASDAQ domestic and non-U.S. based common stocks listed on the NASDAQ Stock Market. The index is unmanaged and investments cannot be made directly in an index. |
| 22. | MSCI All Country World ex-US (Net) Index is a free float-adjusted market capitalization weighted index that is designed to measure the equity market performance of developed and emerging markets excluding the U.S. market. The index consists of 44 countries indices comprising 23 developed and 21 emerging market country indices. The index is unmanaged and investments cannot be made directly in an index. The performance of this index is reduced by the taxes on dividends paid by the international securities issuers in the index. |
| 23. | Diversification does not assure a profit nor protect against loss. |
| PRESIDENT’S MESSAGE / April 30, 2016(unaudited) |
[This Page Intentionally Left Blank]
| 1 |
WILMINGTON BROAD MARKET BOND FUND
Management’s Discussion of Fund Performance
For the fiscal year ended April 30, 2016, the Wilmington Broad Market Bond Fund (the “Fund”) had a total return of 2.03%* for Class A Shares and 2.38%* for Class I Shares, versus its benchmark, the Barclays US Aggregate Bond Index**, which had a total return of 2.72%, and its peer group, the Lipper Corporate A-Rated Debt Funds Average***, which had a total return of 2.00%.
The Federal Reserve (the “Fed”) raised short-term interest rates in December 2015, for the first time since 2006. The Fed acknowledged the continued improvement in the labor market and their expectation for inflation “to rise to its 2% target over the medium term”. The Federal Open Market Committee (the “FOMC”) went on to state that they “expect economic conditions to evolve in a manner that will warrant only gradual increases in the federal funds rate.” The yield curve flattened over the fiscal year as long-term interest rates moved lower in response to weaker inflation as oil declined to a 13-year low price of $26 per barrel in mid-February, and fears of slower global economic growth. The 10-Year U.S. Treasury yield declined by 22 basis points to a yield of 1.83% at the end of April, while the 2-Year Treasury yield increased by 19 basis points over the fiscal year in response to the Fed raising interest rates. Also contributing to the lower interest rate environment were negative interest rate policies by the Bank of Japan and the European Central Bank; the Fed also delivered a more dovish statement and reduced their expectations for raising interest rates in 2016 to only two times from four times at the March 2016 FOMC meeting. The low European yields acted as a “magnet” to pull U.S. treasury yields lower.
The corporate bond market underperformed for the second consecutive year as investors required higher risk premiums to accommodate for another year of record supply. The energy sector continued to severely underperform as investors required higher risk premiums to compensate for the expectations of diminished earnings given the sharp decline in revenues associated with much lower oil prices. For the fiscal year, the corporate sector produced -34 basis points of excess return. The Energy portion of the corporate sector produced -606 basis points of excess return. In contrast, the Finance sector produced 11 basis points of excess return as the banks continue to see asset quality improve and capital levels increase. The average risk premium as measured by the Barclays US Corporate Bond Index increased by 18 basis points to 146 basis points for the average investment grade bond over the past fiscal year.
The Mortgage backed sector outperformed the corporate sector but did not provide any excess returns. The Fed continued to replace maturing mortgages and new supply was manageable given the tepid housing market.
Economic growth for the 12-month period ended March 31, 2016 slowed to only 2% as measured by the gross domestic product (“GDP”). The consumer continued to pull their weight as evidenced by another year of strong auto sales. The 1st quarter of 2016 was anemic with the economy only growing by a 0.5% rate. We anticipate economic growth will pick up for the remainder of 2016 as the consumer continues to spend. The labor market continued to improve as companies fired fewer employees, initial jobless claims have fallen to their lowest level since 1973, and the unemployment rate has declined to 5.0%. Oil prices have rebounded from a 13-year low as
U.S. producers’ continue to idle rigs; however even with the rebound, prices are lower now than they were a year ago. Inflation has started to move slightly higher. The Consumer Price Index (“CPI”) increased to 1.1% for the past year. The less volatile core CPI, which excludes food and energy, increased by 2.1% for the past year. Wage growth has started to move higher as the unemployment rate falls. For the past year, hourly earnings are up 2.5% which is one of the highest levels since 2009.
Looking forward, we anticipate economic growth to pick up from the slowdown of the 1st quarter. We also anticipate inflation to remain benign and the Fed to begin normalizing short-term interest rates by modestly raising short-term interest rates later this year. With respect to interest rates, we do anticipate them to move higher in anticipation of the Fed raising short-term interest rates later this year.
The Fund’s underperformance can be attributed to our decision to remain overweight the corporate sector of the bond market which underperformed. We also maintained an underweight to the mortgage backed sector which detracted from performance as the mortgage backed sector outperformed the corporate sector. Our duration strategy of remaining slightly shorter than the benchmark’s duration had little impact on relative performance as long-term interest rates did not decline by much. Our yield curve strategy to maintain an underweight to the short end of the yield curve aided performance as short-term interest rates moved higher in response to the Fed raising interest rates.
| * | Performance data quoted represents past performance, which is no guarantee of future results. Investment return and principal value will fluctuate so that an investor’s shares, when redeemed, may be worth more or less than their original cost. Mutual Funds are not obligations of or guaranteed by any bank and are not federally insured. The total return shown assumes the reinvestment of all distributions and does not reflect the deduction of taxes that a shareholder would pay on fund distributions or the redemption of shares. The total return for Class A Shares was -2.57%, adjusted for the Fund’s maximum sales charge of 4.50%. Mutual fund performance changes over time and current performance may be lower or higher than what is stated. For the most recent month-end performance, please visit www.wilmingtonfunds.com or call 1-800-836-2211. |
| ** | The Barclays US Aggregate Bond Index is an index measuring both the capital price changes and income provided by the underlying universe of securities, comprised of U.S. Treasury obligations, U.S. investment grade corporate debt and mortgage backed obligations. The index is unmanaged and it is not possible to invest directly in an index. |
| *** | Lipper figures represent the average of the total returns reported by all of the mutual funds designated by Lipper, Inc. as falling into the respective category indicated. These figures do not reflect sales charges. |
Bond prices are sensitive to changes in interest rates and a rise in short-term interest rates could cause a decline in bond prices.
| ANNUAL REPORT / April 30, 2016 (unaudited) |
| 2 |
Gross domestic product (“GDP”) is the monetary value of all the finished goods and services produced within a country’s borders in a specific time period, though GDP is usually calculated on an annual basis. It includes all of private and public consumption, government outlays, investments and exports less imports that occur within a defined territory.
Consumer Price Index (“CPI”) is a measure that examines the weighted average of prices of a basket of consumer goods and services, such as transportation, food and medical care. The CPI is calculated by taking price changes for each item in the predetermined basket of goods and averaging them; the goods are weighted according to their importance. Changes in CPI are used to assess price changes associated with the cost of living.
Duration is a measure of a security’s price sensitivity to changes in interest rates. Securities with longer durations are more sensitive to changes in interest rates than securities of shorter durations.
The Barclays US Corporate Index is a broad-based benchmark that measures the investment grade, U.S. dollar-denominated, fixed-rate, taxable corporate bond market. It includes USD-denominated securities publicly issued by U.S. and non-U.S. industrial, utility, and financial issuers that meet specified maturity, liquidity, and quality requirements.
Basis Points (“BPS”) is a unit that is equal to 1/100th of 1% and is used to denote the change in a financial instrument. The basis point is commonly used for calculating changes in interest rates, equity indices and the yield of a fixed-income security.
| April 30, 2016 (unaudited) / ANNUAL REPORT |
| 3 |
WILMINGTON BROAD MARKET BOND FUND
The graphs below illustrate the hypothetical investment of $10,0001 in the Class A Shares and $1,000,0001 in the Class I Shares of the Wilmington Broad Market Bond Fund; from April 30, 2006 to April 30, 2016, compared to the Barclays US Aggregate Bond Index (“BCAB”).2
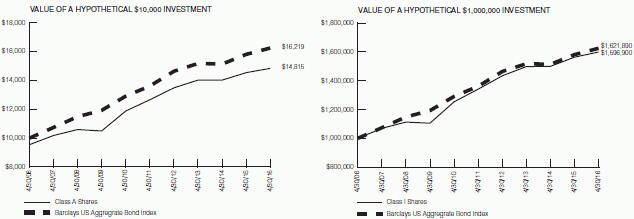
Performance data quoted represents past performance, which is no guarantee of future results. Investment return and principal value will fluctuate so that an investor’s shares, when redeemed, may be worth more or less than their original cost. Mutual Funds are not obligations of or guaranteed by any bank and are not federally insured. The total return shown assumes the reinvestment of all distributions and does not reflect the deduction of taxes that a shareholder would pay on fund distributions or the redemption of shares. The total return for Class A Shares was -2.57%, adjusted for the Fund’s maximum sales charge of 4.50%. Mutual fund performance changes over time and current performance may be lower or higher than what is stated. For the most recent month-end performance, please visit www.wilmingtonfunds.com or call 1-800-836-2211.
| Average Annual Total Returns for the Periods Ended 4/30/16 | ||||||
1 Year
| 5 Years
| 10 Years
| ||||
Class A^
| -2.57% | 2.26% | 4.01% | |||
Class I^
| 2.38% | 3.56% | 4.79% | |||
Barclays US Aggregate Bond Index2
| 2.72% | 3.60% | 4.95% | |||
^Expense Ratios Before Waivers and Expense Ratios After Waivers for Class A are 1.10% and 0.90%, respectively. Expense Ratios Before Waivers and Expense Ratios After Waivers for Class I are 0.85% and 0.55%, respectively. Expense Ratios Before Waiver represent the operating costs borne by the Fund, expressed as a percentage of the Fund’s average net assets, as shown in the Fees and Expenses table in the Fund’s current prospectus (under “Total Annual Fund Operating Expenses”). Current information regarding the Fund’s Operating Expenses can be found in the Fund’s Financial Highlights.
| 1 | Represents a hypothetical investment of $10,000 in Class A of the Fund after deducting the maximum sales charge of 4.50% ($10,000 investment minus $450 sales charge = $9,550) and $1,000,000 in Class I of the Fund and assumes the reinvestment of all dividends and distributions. |
| 2 | The performance for the BCAB assumes the reinvestment of all dividends and distributions but does not reflect the deduction of a sales charge required for the Fund’s performance by the Securities and Exchange Commission. It is not possible to invest directly in an index, and the represented index is unmanaged. |
| ANNUAL REPORT / April 30, 2016 (unaudited) |
| 4 |
WILMINGTON INTERMEDIATE-TERM BOND FUND
Management’s Discussion of Fund Performance
For the fiscal year ended April 30, 2016, the Wilmington Intermediate-Term Bond Fund (the “Fund”) had a total return of 1.62%* for Class A Shares, and 1.94%* for Class I Shares, versus its benchmark, the Barclays Intermediate US Government/Credit Bond Index**, which had a total return of 2.37% and its peer group, the Lipper Short-Intermediate Investment Grade Debt Funds Average***, which had a total return of 1.13%.
The Federal Reserve (the “Fed”) raised short-term interest rates in December 2015, for the first time since 2006. The Fed acknowledged the continued improvement in the labor market and their expectation for inflation “to rise to its 2% target over the medium term”. The Federal Open Market Committee (the “FOMC”) went on to state that they “expect economic conditions to evolve in a manner that will warrant only gradual increases in the federal funds rate.” The yield curve flattened over the fiscal year as long-term interest rates moved lower in response to weaker inflation as oil declined to a 13-year low price of $26 per barrel in mid-February, and fears of slower global economic growth. The 10-Year U.S. Treasury yield declined by 22 basis points to a yield of 1.83% at the end of April, while the 2-Year Treasury yield increased by 19 basis points over the fiscal year in response to the Fed raising interest rates. Also contributing to the lower interest rate environment were negative interest rate policies by the Bank of Japan and the European Central Bank; the Fed also delivered a more dovish statement and reduced their expectations for raising interest rates in 2016 to only two times from four times at the March 2016 FOMC meeting. The low European yields acted as a “magnet” to pull U.S. treasury yields lower.
The corporate bond market underperformed for the second consecutive year as investors required higher risk premiums to accommodate for another year of record supply. The energy sector continued to severely underperform as investors required higher risk premiums to compensate for the expectations of diminished earnings given the sharp decline in revenues associated with much lower oil prices. For the fiscal year, the corporate sector produced -34 basis points of excess return. The Energy portion of the corporate sector produced -606 basis points of excess return. In contrast, the Finance sector produced 11 basis points of excess return as the banks continue to see asset quality improve and capital levels increase. The average risk premium as measured by the Barclays US Corporate Bond Index increased by 18 basis points to 146 basis points for the average investment grade bond over the past fiscal year.
The Mortgage backed sector outperformed the corporate sector but did not provide any excess returns. The Fed continued to replace maturing mortgages and new supply was manageable given the tepid housing market.
Economic growth for the 12-month period ended March 31, 2016 slowed to only 2% as measured by the gross domestic product (“GDP”). The consumer continued to pull their weight as evidenced by another year of strong auto sales. The 1st quarter of 2016 was anemic with the economy only growing by a 0.5% rate. We anticipate economic growth will pick up for the remainder of 2016 as the consumer continues to spend. The labor market continued to improve as companies fired fewer employees, initial jobless claims have fallen to their lowest level since 1973, and the unemployment rate has
declined to 5.0%. Oil prices have rebounded from a 13-year low as U.S. producers’ continue to idle rigs; however even with the rebound, prices are lower now than they were a year ago. Inflation has started to move slightly higher. The Consumer Price Index (“CPI”) increased to 1.1% for the past year. The less volatile core CPI, which excludes food and energy, increased by 2.1% for the past year. Wage growth has started to move higher as the unemployment rate falls. For the past year, hourly earnings are up 2.5% which is one of the highest levels since 2009.
Looking forward, we anticipate economic growth to pick up from the slowdown of the 1st quarter. We also anticipate inflation to remain benign and the Fed to begin normalizing short-term interest rates by modestly raising short-term interest rates later this year. With respect to interest rates, we do anticipate them to move higher in anticipation of the Fed raising short-term interest rates later this year.
The modest underperformance of the Fund relative to the benchmark mostly can be attributed to the Fund’s overweight position in corporate bonds.
| * | Performance data quoted represents past performance, which is no guarantee of future results. Investment return and principal value will fluctuate so that an investor’s shares, when redeemed, may be worth more or less than their original cost. Mutual Funds are not obligations of or guaranteed by any bank and are not federally insured. The total return shown assumes the reinvestment of all distributions and does not reflect the deduction of taxes that a shareholder would pay on fund distributions or the redemption of shares. The total return for Class A Shares was -2.93%, adjusted for the Fund’s maximum sales charge of 4.50%. Mutual fund performance changes over time and current performance may be lower or higher than what is stated. For the most recent month-end performance, please visit www.wilmingtonfunds.com or call 1-800-836-2211. |
| ** | The Barclays Intermediate U.S, Government/Credit Bond Index is a widely recognized, market value weighted index of U.S. Treasury securities, U. S. government agency obligations, corporate debt securities, Yankee bonds and non-convertible corporate debt securities issued by or guaranteed by foreign governments and agencies. The index is unmanaged and it is not possible to invest directly in an index. |
| *** | Lipper figures represent the average of the total returns reported by all of the mutual funds designated by Lipper, Inc. as falling into the respective category indicated. These figures do not reflect sales charges. |
Bond prices are sensitive to changes in interest rates and a rise in short-term interest rates could cause a decline in bond prices.
Gross domestic product (“GDP”) is the monetary value of all the finished goods and services produced within a country’s borders in a specific time period, though GDP is usually calculated on an annual basis. It includes all of private and public consumption, government outlays, investments and exports less imports that occur within a defined territory.
| April 30, 2016 (unaudited) / ANNUAL REPORT |
| 5 |
Consumer Price Index (“CPI”) is a measure that examines the weighted average of prices of a basket of consumer goods and services, such as transportation, food and medical care. The CPI is calculated by taking price changes for each item in the predetermined basket of goods and averaging them; the goods are weighted according to their importance. Changes in CPI are used to assess price changes associated with the cost of living.
Duration is a measure of a security’s price sensitivity to changes in interest rates. Securities with longer durations are more sensitive to changes in interest rates than securities of shorter durations.
The Barclays US Corporate Index is a broad-based benchmark that measures the investment grade, U.S. dollar-denominated, fixed-rate, taxable corporate bond market. It includes USD-denominated securities publicly issued by U.S. and non-U.S. industrial, utility, and financial issuers that meet specified maturity, liquidity, and quality requirements.
Basis Points (“BPS”) is a unit that is equal to 1/100th of 1% and is used to denote the change in a financial instrument. The basis point is commonly used for calculating changes in interest rates, equity indices and the yield of a fixed-income security.
| ANNUAL REPORT / April 30, 2016 (unaudited) |
| 6 |
WILMINGTON INTERMEDIATE-TERM BOND FUND
The graphs below illustrate the hypothetical investment of $10,0001 in the Class A Shares and $1,000,0001 in the Class I Shares of the Wilmington Intermediate-Term Bond Fund from April 30, 2006 to April 30, 2016 compared to the Barclays Intermediate US Government/Credit Bond Index (“BCIGC”).2
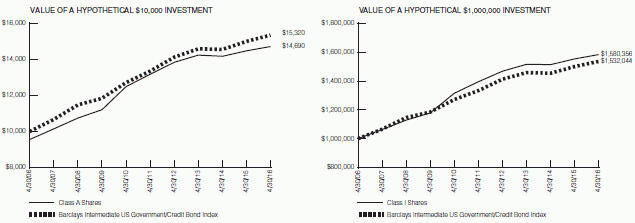
Performance data quoted represents past performance, which is no guarantee of future results. Investment return and principal value will fluctuate so that an investor’s shares, when redeemed, may be worth more or less than their original cost. Mutual Funds are not obligations of or guaranteed by any bank and are not federally insured. The total return shown assumes the reinvestment of all distributions and does not reflect the deduction of taxes that a shareholder would pay on fund distributions or the redemption of shares. The total return for Class A Shares was -2.93%, adjusted for the Fund’s maximum sales charge of 4.50%. Mutual fund performance changes over time and current performance may be lower or higher than what is stated. For the most recent month-end performance, please visit www.wilmingtonfunds.com or call 1-800-836-2211.
| Average Annual Total Returns for the Periods Ended 4/30/16 | ||||||
1 Year
| 5 Years
| 10 Years
| ||||
Class A^
| -2.93% | 1.29% | 3.92% | |||
Class I^
| 1.94% | 2.57% | 4.68% | |||
Barclays Intermediate US Government/Credit Bond Index2
| 2.37% | 2.83% | 4.36% | |||
^Expense Ratios Before Waivers and Expense Ratios After Waivers for Class A are 1.15% and 0.88%, respectively. Expense Ratios Before Waivers and Expense Ratios After Waivers for Class I are 0.90% and 0.53%, respectively. Expense Ratios Before Waiver represent the operating costs borne by the Fund, expressed as a percentage of the Fund’s average net assets, as shown in the Fees and Expenses table in the Fund’s current prospectus (under “Total Annual Fund Operating Expenses”). Current information regarding the Fund’s Operating Expenses can be found in the Fund’s Financial Highlights.
| 1 | Represents a hypothetical investment of $10,000 in Class A of the Fund after deducting the maximum sales charge of 4.50% ($10,000 investment minus $450 sales charge = $9,550) and $1,000,000 in Class I of the Fund and assumes the reinvestment of all dividends and distributions. |
| 2 | The performance for the BCIGC assumes the reinvestment of all dividends and distributions but does not reflect the deduction of a sales charge required for the Fund’s performance by the Securities and Exchange Commission. It is not possible to invest directly in an index and the represented index is unmanaged. |
| April 30, 2016 (unaudited) / ANNUAL REPORT |
| 7 |
WILMINGTON SHORT-TERM BOND FUND
Management’s Discussion of Fund Performance
For the fiscal year ended April 30, 2016, the Wilmington Short-Term Bond Fund (the “Fund”) had a total return of 0.87%* for Class A Shares and 1.12%* for Class I Shares, versus its benchmark, the Barclays 1-3 Year US Government/Credit Bond Index**, which had a total return of 1.10%, and its peer group, the Lipper Short Investment Grade Debt Funds Average***, which had a total return of 0.57%.
The Federal Reserve (the “Fed”) raised short-term interest rates in December 2015, for the first time since 2006. The Fed acknowledged the continued improvement in the labor market and their expectation for inflation “to rise to its 2% target over the medium term”. The Federal Open Market Committee (the “FOMC”) went on to state that they “expect economic conditions to evolve in a manner that will warrant only gradual increases in the federal funds rate.” The yield curve flattened over the fiscal year as long-term interest rates moved lower in response to weaker inflation as oil declined to a 13-year low price of $26 per barrel in mid-February, and fears of slower global economic growth. The 10-Year U.S. Treasury yield declined by 22 basis points to a yield of 1.83% at the end of April, while the 2-Year Treasury yield increased by 19 basis points over the fiscal year in response to the Fed raising interest rates. Also contributing to the lower interest rate environment were negative interest rate policies by the Bank of Japan and the European Central Bank; the Fed also delivered a more dovish statement and reduced their expectations for raising interest rates in 2016 to only two times from four times at the March 2016 FOMC meeting. The low European yields acted as a “magnet” to pull U.S. treasury yields lower.
The corporate bond market underperformed for the second consecutive year as investors required higher risk premiums to accommodate for another year of record supply. The energy sector continued to severely underperform as investors required higher risk premiums to compensate for the expectations of diminished earnings given the sharp decline in revenues associated with much lower oil prices. For the fiscal year, the corporate sector produced -34 basis points of excess return. The Energy portion of the corporate sector produced -606 basis points of excess return. In contrast, the Finance sector produced 11 basis points of excess return as the banks continue to see asset quality improve and capital levels increase. The average risk premium as measured by the Barclays U.S. Corporate Bond Index increased by 18 basis points to 146 basis points for the average investment grade bond over the past fiscal year.
The Mortgage backed sector outperformed the corporate sector but did not provide any excess returns. The Fed continued to replace maturing mortgages and new supply was manageable given the tepid housing market.
Economic growth for the 12-month period ended March 31, 2016 slowed to only 2% as measured by the gross domestic product (“GDP”). The consumer continued to pull their weight as evidenced by another year of strong auto sales. The 1st quarter of 2016 was anemic with the economy only growing by a 0.5% rate. We anticipate economic growth will pick up for the remainder of 2016 as the consumer continues to spend. The labor market continued to improve as companies fired fewer employees, initial jobless claims have fallen to their lowest level since 1973, and the unemployment rate has
declined to 5.0%. Oil prices have rebounded from a 13-year low as U.S. producers’ continue to idle rigs; however even with the rebound, prices are lower now than they were a year ago. Inflation has started to move slightly higher. The Consumer Price Index (“CPI”) increased to 1.1% for the past year. The less volatile core CPI, which excludes food and energy, increased by 2.1% for the past year. Wage growth has started to move higher as the unemployment rate falls. For the past year, hourly earnings are up 2.5% which is one of the highest levels since 2009.
Looking forward, we anticipate economic growth to pick up from the slowdown of the 1st quarter. We also anticipate inflation to remain benign and the Fed to begin normalizing short-term interest rates by modestly raising short-term interest rates later this year. With respect to interest rates, we do anticipate them to move higher in anticipation of the Fed raising short-term interest rates later this year.
The Fund’s overweight in investment grade corporate securities detracted from performance as risk premiums widened for most of the year. However, the Fund did reduce the extent of its overweight to corporate securities. Furthermore, performance was helped by our tactical decision to reduce the Fund’s exposure to the energy sector mid-way through the year. We continued to have an overweight in securities with maturities less than one year as well as greater than four years. This “barbelled” portfolio structure relative to the Fund’s Index added to our relative performance as the yield curve flattened. We also reduced our floating rate note position as the expectations of future federal funds rate hikes was lowered over the course of the year. Moving into fixed rate securities slightly added to the Fund’s performance.
| * | Performance data quoted represents past performance, which is no guarantee of future results. Investment return and principal value will fluctuate so that an investor’s shares, when redeemed, may be worth more or less than their original cost. Mutual Funds are not obligations of or guaranteed by any bank and are not federally insured. Mutual Funds are not obligations of or guaranteed by any bank and are not federally insured. The total return shown assumes the reinvestment of all distributions and does not reflect the deduction of taxes that a shareholder would pay on fund distributions or the redemption of shares. The total return for Class A Shares was -0.90%, adjusted for the Fund’s maximum sales charge of 1.75%. Mutual fund performance changes over time and current performance may be lower or higher than what is stated. For the most recent month-end performance, please visit www.wilmingtonfunds.com or call 1-800-836-2211. |
| ** | The Barclays 1-3 Year US Government/Credit Bond Index is an index that captures funds with exposures to both government and commercial credit. The index is unmanaged and it is not possible to invest directly in an index. |
| ANNUAL REPORT / April 30, 2016 (unaudited) |
| 8 |
| *** | Lipper figures represent the average of the total returns reported by all of the mutual funds designated by Lipper, Inc. as falling into the respective category indicated. These figures do not reflect sales charges. |
Bond prices are sensitive to changes in interest rates and a rise in short-term interest rates could cause a decline in bond prices.
Gross domestic product (“GDP”) is the monetary value of all the finished goods and services produced within a country’s borders in a specific time period, though GDP is usually calculated on an annual basis. It includes all of private and public consumption, government outlays, investments and exports less imports that occur within a defined territory.
Consumer Price Index (“CPI”) is a measure that examines the weighted average of prices of a basket of consumer goods and services, such as transportation, food and medical care. The CPI is calculated by taking price changes for each item in the predetermined basket of goods and averaging them; the goods are weighted according to their importance. Changes in CPI are used to assess price changes associated with the cost of living.
Duration is a measure of a security’s price sensitivity to changes in interest rates. Securities with longer durations are more sensitive to changes in interest rates than securities of shorter durations.
The Barclays U.S. Corporate Index is a broad-based benchmark that measures the investment grade, U.S. dollar-denominated, fixed-rate, taxable corporate bond market. It includes USD-denominated securities publicly issued by U.S. and non-U.S. industrial, utility, and financial issuers that meet specified maturity, liquidity, and quality requirements.
Basis Points (“BPS”) is a unit that is equal to 1/100th of 1% and is used to denote the change in a financial instrument. The basis point is commonly used for calculating changes in interest rates, equity indices and the yield of a fixed-income security.
| April 30, 2016 (unaudited) / ANNUAL REPORT |
| 9 |
WILMINGTON SHORT-TERM BOND FUND
The graphs below illustrate the hypothetical investment of $10,0001 in the Class A Shares and $1,000,0001 in the Class I Shares of the Wilmington Short-Term Bond Fund from April 30, 2006 to April 30, 2016 compared to the Barclays 1-3 Year US Government/Credit Bond Index (“BC1-3GCB”).2
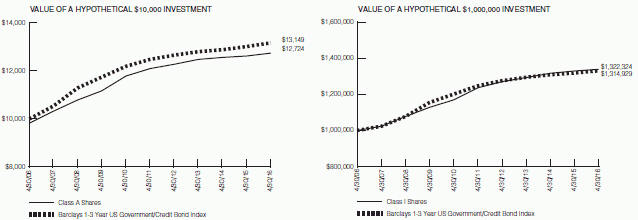
Performance data quoted represents past performance, which is no guarantee of future results. Investment return and principal value will fluctuate so that an investor’s shares, when redeemed, may be worth more or less than their original cost. Mutual Funds are not obligations of or guaranteed by any bank and are not federally insured. The total return shown assumes the reinvestment of all distributions and does not reflect the deduction of taxes that a shareholder would pay on fund distributions or the redemption of shares. The total return for Class A Shares was -0.90%, adjusted for the Fund’s maximum sales charge of 1.75%. Mutual fund performance changes over time and current performance may be lower or higher than what is stated. For the most recent month-end performance, please visit www.wilmingtonfunds.com or call 1-800-836-2211.
| Average Annual Total Returns for the Periods Ended 4/30/16 | ||||||
1 Year
| 5 Years
| 10 Years
| ||||
Class A^
| -0.90% | 0.69% | 2.44% | |||
Class I^
| 1.12% | 1.29% | 2.83% | |||
Barclays 1-3 Year US Government/Credit Bond Index2
| 1.10% | 1.07% | 2.78% | |||
^Expense Ratios Before Waivers and Expense Ratios After Waivers for Class A are 1.15% and 0.73%, respectively. Expense Ratios Before Waivers and Expense Ratios After Waivers for Class I are 0.90% and 0.48%, respectively. Expense Ratios Before Waiver represent the operating costs borne by the Fund, expressed as a percentage of the Fund’s average net assets, as shown in the Fees and Expenses table in the Fund’s current prospectus (under “Total Annual Fund Operating Expenses”). Current information regarding the Fund’s Operating Expenses can be found in the Fund’s Financial Highlights.
| 1 | Represents a hypothetical investment of $10,000 in Class A of the Fund after deducting the maximum sales charge of 1.75% ($10,000 investment minus $175 sales charge = $9,825) and $1,000,000 in Class I of the Fund and assumes the reinvestment of all dividends and distributions. |
| 2 | The performance for the BC1-3GCB assumes the reinvestment of all dividends and distributions but does not reflect the deduction of a sales charge required for the Fund’s performance by the Securities and Exchange Commission. It is not possible to invest directly in an index and the represented index is unmanaged. |
| ANNUAL REPORT / April 30, 2016 (unaudited) |
| 10 |
WILMINGTON MUNICIPAL BOND FUND
Management’s Discussion of Fund Performance
For the fiscal year ended April 30, 2016, the Wilmington Municipal Bond Fund (the “Fund”) had a total return of 4.55%* for Class A Shares and 4.81%* for Class I Shares, versus its benchmark, the S&P Municipal Bond Intermediate Index**, which had a total return of 5.02%, and its peer group, the Lipper Intermediate Municipal Debt Funds Average***, which had a total return of 4.06%.
Last year, and in particular, the second half of last year, witnessed impressive flows into tax-exempt municipal bond funds. As of the end of the fiscal year, our industry had positive weekly inflows for 29 straight weeks, as reported by the Investment Company Institute (“ICI”). Year-to-date, 2016 alone the ICI reported over $18 billion in positive flows. What has driven this interest? We can think of two root causes – a global search for yield and the relative stability of municipal credit. Negative interest rates in many global bond markets drove investors toward the U.S. bond markets, including the tax-exempt municipal market. On the second point, the dramatic swings in taxable credit spreads – driven by volatile energy prices and global uncertainties – were not experienced by the largely idiosyncratic municipal market. These drivers of fund flows can help explain lower overall yields, solid total returns, expensive values relative to Treasury notes, and tighter credit spreads.
For the year ended April 30, 2016, high grade municipal yields fell in every maturity bucket except for the 1-year maturities, where yields only increased 4 basis points. From 3 years on out to 10-years, market yields fell anywhere from 25 to 35 basis points. In the 10-year range, AAA yields ended the fiscal year at 1.61%, a full 33 basis points lower than where they began the year. The strength of municipals surpassed that of the Treasury market, where 10-year yields fell by only 22 basis points to end the fiscal year at 1.83%. From a relative value perspective, the ratio of municipal to Treasury yields fell to 87.7% on April 30, 2016, a nearly 8% decline from the 95.5% ratio at the beginning of the period. We gauge the impact on credit spreads by looking at the yield differential between 10-year BBB and AAA yields. This extra yield pick-up for the added credit risk began the fiscal year at 1.08% (3.20% for a BBB vs. 2.12% for AAA) and ended the year 17 basis points tighter at 0.91% (2.51% vs. 1.61%, respectively).
The Fund underperformed its benchmark, but outperformed its Lipper peer group. While the Fund and peer group performance are net of operating expenses, the benchmark returns reflect gross returns without any expense impact. The Fund’s higher quality positioning detracted from relative performance, given the spread tightening discussed above. Relative over-weights to Healthcare, Higher Education, and Transportation sectors were all supportive of performance as each sector outperformed the overall index.
| * | Performance data quoted represents past performance, which is no guarantee of future results. Investment return and principal value will fluctuate so that an investor’s shares, when redeemed, may be worth more or less than their original cost. Mutual Funds are not obligations of or guaranteed by any bank and are not federally insured. The total return shown assumes the reinvestment of all distributions and does not reflect the deduction of taxes that a shareholder would pay on fund distributions or the redemption of shares. The total return for Class A Shares was -0.14%, adjusted for the Fund’s maximum sales charge of 4.50%. Mutual fund performance changes over time and current performance may be lower or higher than what is stated. For the most recent month-end performance, please visit www.wilmingtonfunds.com or call 1-800-836-2211. |
| ** | Standard & Poor’s (“S&P”) Municipal Bond Intermediate Index consists of bonds in the S&P Municipal Bond Index with a minimum maturity of three years and a maximum maturity of up to, but not including, 15 years as measured from the Rebalancing Date. The S&P Municipal Bond Index is a broad, market value-weighted index that seeks to measure the performance of the U.S. municipal bond market. All bonds in the index are exempt from U.S. federal income taxes or subject to the alternative minimum tax (“AMT”). The indices include general obligation bonds, revenue bonds, insured bonds and pre-refunded bonds. Indices are unmanaged and it is not possible to invest directly in an index. |
| *** | Lipper figures represent the average of the total returns reported by all of the mutual funds designated by Lipper, Inc. as falling into the respective category indicated. These figures do not reflect sales charges. |
Duration is a measure of a security’s price sensitivity to changes in interest rates. Securities with longer durations are more sensitive to changes in interest rates than securities of shorter durations.
High yield, lower-rated securities generally entail greater market, credit and liquidity risks than investment grade securities and may include higher volatility and higher risk of default.
Credit ratings pertain only to the securities in the portfolio and do not protect fund shares against market risk. Bond rating firms, such as Standard & Poor’s, use different designations consisting of upper- and lower-case letters ’A’ and ’B’ to identify a bond’s credit quality ratings. ’AAA’ (high credit quality) and ’BBB’ (medium credit quality) are considered investment grade.
Bond prices are sensitive to changes in interest rates and a rise in short-term interest rates could cause a decline in bond prices.
Basis Points (“BPS”) is a unit that is equal to 1/100th of 1% and is used to denote the change in a financial instrument. The basis point is commonly used for calculating changes in interest rates, equity indices and the yield of a fixed-income security.
Income may be subject to the federal alternative minimum tax.
| April 30, 2016 (unaudited) / ANNUAL REPORT |
| 11 |
WILMINGTON MUNICIPAL BOND FUND
The graphs below illustrate the hypothetical investment of $10,0001 in the Class A Shares and $1,000,0001 in the Class I Shares of the Wilmington Municipal Bond Fund from April 30, 2006 to April 30, 2016 compared to the S&P Municipal Bond Intermediate Index.2
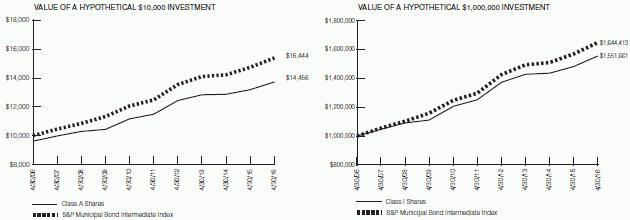
Performance data quoted represents past performance, which is no guarantee of future results. Investment return and principal value will fluctuate so that an investor’s shares, when redeemed, may be worth more or less than their original cost. Mutual Funds are not obligations of or guaranteed by any bank and are not federally insured. The total return shown assumes the reinvestment of all distributions and does not reflect the deduction of taxes that a shareholder would pay on fund distributions or the redemption of shares. The total return for Class A Shares was -0.14%, adjusted for the Fund’s maximum sales charge of 4.50%. Mutual fund performance changes over time and current performance may be lower or higher than what is stated. For the most recent month-end performance, please visit www.wilmingtonfunds.com or call 1-800-836-2211.
| Average Annual Total Returns for the Periods Ended 4/30/16 | ||||||
1 Year
| 5 Years
| 10 Years
| ||||
Class A^
| -0.14% | 3.20% | 3.75% | |||
Class I^
| 4.81% | 4.41% | 4.49% | |||
S&P Municipal Bond Intermediate Index2
| 5.02% | 4.86% | 5.10% | |||
^Expense Ratios Before Waivers and Expense Ratios After Waivers for Class A are 1.10% and 0.74%, respectively. Expense Ratios Before Waivers and Expense Ratios After Waivers for Class I are 0.85% and 0.49%, respectively. Expense Ratios Before Waiver represent the operating costs borne by the Fund, expressed as a percentage of the Fund’s average net assets, as shown in the Fees and Expenses table in the Fund’s current prospectus (under “Total Annual Fund Operating Expenses”). Current information regarding the Fund’s Operating Expenses can be found in the Fund’s Financial Highlights.
| 1 | Represents a hypothetical investment of $10,000 in Class A of the Fund after deducting the maximum sales charge of 4.50% ($10,000 investment minus $450 sales charge = $9,550) and $1,000,000 in Class I of the Fund and assumes the reinvestment of all dividends and distributions. |
| 2 | The performance for the S&P Municipal Bond Intermediate Index assumes the reinvestment of all dividends and distributions but does not reflect the deduction of a sales charge required for the Fund’s performance by the Securities and Exchange Commission. It is not possible to invest directly in an index and the represented index is unmanaged. |
| ANNUAL REPORT / April 30, 2016 (unaudited) |
| 12 |
WILMINGTON NEW YORK MUNICIPAL BOND FUND
Management’s Discussion of Fund Performance
For the fiscal year ended April 30, 2016, the Wilmington New York Municipal Bond Fund (the “Fund”) had a total return of 4.32%* for Class A Shares and 4.58%* for Class I Shares, versus its benchmark, the S&P Municipal Bond Intermediate Index**, which had a total return of 5.02%, and its peer group, the Lipper New York Intermediate Municipal Debt Funds Average***, which had a total return of 3.76%.
Last year, and in particular, the second half of last year, witnessed impressive flows into tax-exempt municipal bond funds. As of the end of the fiscal year, our industry had positive weekly inflows for 29 straight weeks, as reported by the Investment Company Institute (“ICI”). Year-to-date, 2016 alone the ICI reported over $18 billion in positive flows. What has driven this interest? We can think of two root causes – a global search for yield and the relative stability of municipal credit. Negative interest rates in many global bond markets drove investors toward the U.S. bond markets, including the tax-exempt municipal market. On the second point, the dramatic swings in taxable credit spreads – driven by volatile energy prices and global uncertainties – were not experienced by the largely idiosyncratic municipal market. These drivers of fund flows can help explain lower overall yields, solid total returns, expensive values relative to Treasury notes, and tighter credit spreads.
For the year ended April 30, 2016, high grade municipal yields fell in every maturity bucket except for the 1-year maturities, where yields only increased 4 basis points. From 3 years on out to 10-years, market yields fell anywhere from 25 to 35 basis points. In the 10-year range, AAA yields ended the fiscal year at 1.61%, a full 33 basis points lower than where they began the year. The strength of municipals surpassed that of the Treasury market, where 10-year yields fell by only 22 basis points to end the fiscal year at 1.83%. From a relative value perspective, the ratio of municipal to Treasury yields fell to 87.7% on April 30, 2016, a nearly 8% decline from the 95.5% ratio at the beginning of the period. We gauge the impact on credit spreads by looking at the yield differential between 10-year BBB and AAA yields. This extra yield pick-up for the added credit risk began the fiscal year at 1.08% (3.20% for a BBB vs. 2.12% for AAA) and ended the year 17 basis points tighter at 0.91% (2.51% vs. 1.61%, respectively).
The Fund underperformed its benchmark, but outperformed its Lipper peer group. While the Fund and peer group performance are net of operating expenses, the benchmark returns reflect gross returns without any expense impact. The Fund’s higher quality positioning detracted from relative performance, given the spread tightening discussed above. Relative over-weights to Healthcare, Higher Education, and Transportation sectors were all supportive of performance as each sector outperformed the overall index.
| * | Performance data quoted represents past performance, which is no guarantee of future results. Investment return and principal value will fluctuate so that an investor’s shares, when redeemed, may be worth more or less than their original cost. Mutual Funds are not obligations of or guaranteed by any bank and are not federally insured. The total return shown assumes the reinvestment of all distributions and does not reflect the deduction of taxes that a shareholder would pay on fund distributions or the redemption of shares. The total return for Class A Shares was -0.36%, adjusted for the Fund’s maximum sales charge of 4.50%. Mutual fund performance changes over time and current performance may be lower or higher than what is stated. For the most recent month-end performance, please visit www.wilmingtonfunds.com or call 1-800-836-2211. |
| ** | Standard & Poor’s (“S&P”) Municipal Bond Intermediate Index consists of bonds in the S&P Municipal Bond Index with a minimum maturity of three years and a maximum maturity of up to, but not including, 15 years as measured from the Rebalancing Date. The S&P Municipal Bond Index is a broad, market value-weighted index that seeks to measure the performance of the U.S. municipal bond market. All bonds in the index are exempt from U.S. federal income taxes or subject to the alternative minimum tax (“AMT”). The indices include general obligation bonds, revenue bonds, insured bonds and pre-refunded bonds. Indices are unmanaged and it is not possible to invest directly in an index. |
| *** | Lipper figures represent the average of the total returns reported by all of the mutual funds designated by Lipper, Inc. as falling into the respective category indicated. These figures do not reflect sales charges. |
Duration is a measure of a security’s price sensitivity to changes in interest rates. Securities with longer durations are more sensitive to changes in interest rates than securities of shorter durations.
High yield, lower-rated securities generally entail greater market, credit and liquidity risks than investment grade securities and may include higher volatility and higher risk of default.
Credit ratings pertain only to the securities in the portfolio and do not protect fund shares against market risk. Bond rating firms, such as Standard & Poor’s, use different designations consisting of upper- and lower-case letters ’A’ and ’B’ to identify a bond’s credit quality ratings. ’AAA’ (high credit quality) and ’BBB’ (medium credit quality) are considered investment grade.
Bond prices are sensitive to changes in interest rates and a rise in short-term interest rates could cause a decline in bond prices.
Basis Points (“BPS”) is a unit that is equal to 1/100th of 1% and is used to denote the change in a financial instrument. The basis point is commonly used for calculating changes in interest rates, equity indices and the yield of a fixed-income security.
Income may be subject to the federal alternative minimum tax.
| April 30, 2016 (unaudited) / ANNUAL REPORT |
| 13 |
WILMINGTON NEW YORK MUNICIPAL BOND FUND
The graphs below illustrate the hypothetical investment of $10,0001 in the Class A Shares and $1,000,0001 in the Class I Shares of the Wilmington New York Municipal Bond Fund from April 30, 2006 to April 30, 2016 compared to the S&P Municipal Bond Intermediate Index.2
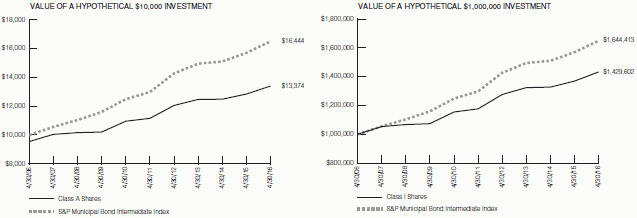
Performance data quoted represents past performance, which is no guarantee of future results. Investment return and principal value will fluctuate so that an investor’s shares, when redeemed, may be worth more or less than their original cost. Mutual Funds are not obligations of or guaranteed by any bank and are not federally insured. The total return shown assumes the reinvestment of all distributions and does not reflect the deduction of taxes that a shareholder would pay on fund distributions or the redemption of shares. The total return for Class A Shares was -0.36%, adjusted for the Fund’s maximum sales charge of 4.50%. Mutual fund performance changes over time and current performance may be lower or higher than what is stated. For the most recent month-end performance, please visit www.wilmingtonfunds.com or call 1-800-836-2211.
| Average Annual Total Returns for the Periods Ended 4/30/16 | ||||||
1 Year
| 5 Years
| 10 Years
| ||||
Class A^
| -0.36% | 2.77% | 2.95% | |||
Class I^
| 4.58% | 3.99% | 3.64% | |||
S&P Municipal Bond Intermediate Index2
| 5.02% | 4.86% | 5.10% | |||
^Expense Ratios Before Waivers and Expense Ratios After Waivers for Class A are 1.19% and 0.84%, respectively. Expense Ratios Before Waivers and Expense Ratios After Waivers for Class I are 0.94% and 0.59%, respectively. Expense Ratios Before Waiver represent the operating costs borne by the Fund, expressed as a percentage of the Fund’s average net assets, as shown in the Fees and Expenses table in the Fund’s current prospectus (under “Total Annual Fund Operating Expenses”). Current information regarding the Fund’s Operating Expenses can be found in the Fund’s Financial Highlights.
| 1 | Represents a hypothetical investment of $10,000 in Class A of the Fund after deducting the maximum sales charge of 4.50% ($10,000 investment minus $450 sales charge = $9,550) and $1,000,000 in Class I of the Fund and assumes the reinvestment of all dividends and distributions. |
| 2 | The performance for the S&P Municipal Bond Intermediate Index assumes the reinvestment of all dividends and distributions but does not reflect the deduction of a sales charge required for the Fund’s performance by the Securities and Exchange Commission. It is not possible to invest directly in an index and the represented index is unmanaged. |
| ANNUAL REPORT / April 30, 2016 (unaudited) |
| 14 |
As a shareholder of the Funds, you incur two types of costs: (1) transaction costs, including sales charges (loads) on purchase payments, reinvested dividends, or other distributions; and redemption fees; and (2) ongoing costs, including management fees; distribution and/or service (12b-1) fees; and other Fund expenses. This Example is intended to help you to understand your ongoing costs (in dollars) of investing in the Funds and to compare these costs with the ongoing costs of investing in other mutual funds. It is based on an investment of $1,000 invested at the beginning of the period and held for the entire period from November 1, 2015 to April 30, 2016.
Actual Expenses
This section of the following table provides information about actual account values and actual expenses. You may use the information in this section, together with the amount you invested, to estimate the expenses that you incurred over the period. Simply divide your account value by $1,000 (for example, an $8,600 account value divided by $1,000 = 8.6), then multiply the result by the number in the first section under the heading entitled “Expenses Paid During Period” to estimate the expenses attributable to your investment during this period.
Hypothetical Example for
Comparison Purposes
This section of the following table provides information about hypothetical account values and hypothetical expenses based on the Funds’ actual expense ratios and assumed rates of return of 5% per year before expenses, which are not the Funds’ actual returns. Thus, you should not use the hypothetical account values and expenses to estimate the actual ending account balance or your expenses for the period. Rather, these figures are required to be provided to enable you to compare the ongoing costs of investing in the Funds with other funds. To do so, compare this 5% hypothetical example with the 5% hypothetical examples that appear in the shareholder reports of the other funds.
Please note that the expenses shown in the table are meant to highlight your ongoing costs only. Therefore, the Annualized Net Expense Ratio section of the table is useful in comparing ongoing costs only, and will not help you determine the relative total costs of owning different funds.
| Beginning Account Value 11/01/15 | Ending Account Value 4/30/16 | Expenses Paid During Period1 | Annualized Net Expense Ratio2 | |||||||||||||||||
| WILMINGTON BROAD MARKET BOND FUND | ||||||||||||||||||||
Actual
| ||||||||||||||||||||
Class A | $1,000.00 | $1,025.90 | $4.43 | 0.88% | ||||||||||||||||
Class I | $1,000.00 | $1,028.90 | $2.77 | 0.55% | ||||||||||||||||
Hypothetical (assuming a 5% return before expense) | ||||||||||||||||||||
Class A | $1,000.00 | $1,020.49 | $4.42 | 0.88% | ||||||||||||||||
Class I | $1,000.00 | $1,022.13 | $2.77 | 0.55% | ||||||||||||||||
| WILMINGTON INTERMEDIATE-TERM BOND FUND | ||||||||||||||||||||
Actual | ||||||||||||||||||||
Class A | $1,000.00 | $1,017.50 | $4.26 | 0.85% | ||||||||||||||||
Class I | $1,000.00 | $1,020.10 | $2.66 | 0.53% | ||||||||||||||||
Hypothetical (assuming a 5% return before expense) | ||||||||||||||||||||
Class A | $1,000.00 | $1,020.64 | $4.27 | 0.85% | ||||||||||||||||
Class I | $1,000.00 | $1,022.23 | $2.66 | 0.53% | ||||||||||||||||
| WILMINGTON SHORT-TERM BOND FUND | ||||||||||||||||||||
Actual | ||||||||||||||||||||
Class A | $1,000.00 | $1,010.00 | $3.65 | 0.73% | ||||||||||||||||
Class I | $1,000.00 | $1,011.30 | $2.40 | 0.48% | ||||||||||||||||
Hypothetical (assuming a 5% return before expense) | ||||||||||||||||||||
Class A | $1,000.00 | $1,021.23 | $3.67 | 0.73% | ||||||||||||||||
Class I | $1,000.00 | $1,022.48 | $2.41 | 0.48% | ||||||||||||||||
| WILMINGTON MUNICIPAL BOND FUND | ||||||||||||||||||||
Actual | ||||||||||||||||||||
Class A | $1,000.00 | $1,029.50 | $3.73 | 0.74% | ||||||||||||||||
Class I | $1,000.00 | $1,031.60 | $2.48 | 0.49% | ||||||||||||||||
Hypothetical (assuming a 5% return before expense) | ||||||||||||||||||||
Class A | $1,000.00 | $1,021.18 | $3.72 | 0.74% | ||||||||||||||||
Class I | $1,000.00 | $1,022.43 | $2.46 | 0.49% | ||||||||||||||||
| April 30, 2016 (unaudited) / ANNUAL REPORT |
| 15 |
| Beginning Account Value 11/01/15 | Ending Account Value 4/30/16 | Expenses Paid During Period1 | Annualized Net Expense Ratio2 | |||||||||||||||||
| WILMINGTON NEW YORK MUNICIPAL BOND FUND | ||||||||||||||||||||
Actual | ||||||||||||||||||||
Class A | $1,000.00 | $1,027.80 | $4.24 | 0.84% | ||||||||||||||||
Class I | $1,000.00 | $1,029.10 | $2.98 | 0.59% | ||||||||||||||||
Hypothetical (assuming a 5% return before expense) | ||||||||||||||||||||
Class A | $1,000.00 | $1,020.69 | $4.22 | 0.84% | ||||||||||||||||
Class I | $1,000.00 | $1,021.93 | $2.97 | 0.59% | ||||||||||||||||
| (1) | Expenses are equal to the Funds’ annualized net expense ratios, multiplied by the average account value over the period, multiplied by 182/366 (to reflect the most recent one-half year period). |
| (2) | Expense ratio does not reflect the indirect expenses of the underlying funds in which it invests. |
| ANNUAL REPORT / April 30, 2016 (unaudited) |
| 16 |
PORTFOLIO OF INVESTMENTS SUMMARY TABLE
Wilmington Broad Market Bond Fund
At April 30, 2016, the Fund’s portfolio composition was as follows (unaudited):
| Percentage of Total Net Assets | ||||
| Corporate Bonds | 43.3% | |||
| U.S. Treasury | 29.2% | |||
| Mortgage-Backed Securities | 23.1% | |||
| Government Agencies | 1.4% | |||
| Collateralized Mortgage Obligations | 1.4% | |||
| Commercial Paper | 1.0% | |||
| Enhanced Equipment Trust Certificates | 0.3% | |||
| Asset-Backed Securities | 0.2% | |||
| Cash Equivalents1 | 1.7% | |||
| Other Assets and Liabilities – Net2 | (1.6)% | |||
| TOTAL | 100.0% | |||
| (1) | Cash Equivalents include investments in a money market fund and repurchase agreements. |
| (2) | Assets, other than investments in securities, less liabilities. See Statements of Assets and Liabilities. |
| (3) | For financial reporting purposes, the Credit Quality Diversification table reflects the lowest rating assigned by either Moody’s Investors Service or Standard and Poor’s if the ratings differ. These rating agencies are independent, nationally recognized statistical rating organizations and are widely used. Investment grade ratings are credit ratings of BBB/Baa or higher. Below investment grade ratings are credit ratings of BB/Ba or lower. Investments designated as “Not Rated” are not rated by either rating agency and do not necessarily indicate low credit quality. Credit quality ratings are subject to change. |
| Credit Quality Diversification3 | Percentage of Total Net Assets | |||
| U.S. Government Agency Securities | 25.5% | |||
| U.S. Treasury | 29.2% | |||
| AAA / Aaa | 0.3% | |||
| AA / Aa | 1.4% | |||
| A / A | 8.6% | |||
| BBB / Baa | 31.3% | |||
| BB / Ba | 2.3% | |||
| B / B | 0.2% | |||
| D | 0.1% | |||
| Not Rated | 2.7% | |||
| Other Assets and Liabilities – Net2 | (1.6)% | |||
| TOTAL | 100.0% | |||
April 30, 2016
Description
|
| Par Value
|
|
| Value
|
| ||
ASSET-BACKED SECURITIES – 0.2% |
| |||||||
FINANCIAL SERVICES – 0.2% |
| |||||||
LA Arena Funding LLC, | $ | 672,349 | $ | 733,965 | ||||
WHOLE LOAN – 0.0%** | ||||||||
SLM Private Education | 25,179 | 25,201 | ||||||
|
| |||||||
| TOTAL ASSET-BACKED SECURITIES (COST $697,528) | $ | 759,166 | ||||||
COLLATERALIZED MORTGAGE OBLIGATIONS – 1.4% |
| |||||||
| COMMERCIAL MORTGAGE-BACKED SECURITIES (CMBS) – 0.1% | ||||||||
JPMorgan Chase Commercial Mortgage Securities Trust, | 523,672 | 530,265 | ||||||
Description | | Par Value | | | Value | | ||
FEDERAL HOME LOAN MORTGAGE CORPORATION (FHLMC) – 0.4% |
| |||||||
3.50%, 5/01/45 | $ | 1,435,611 | $ | 1,504,895 | ||||
FEDERAL NATIONAL MORTGAGE ASSOCIATION (FNMA) – 0.6% |
| |||||||
Series 1988-23, Class C, | 1,205 | 1,294 | ||||||
Series 2005-29, Class WC, | 39,247 | 43,250 | ||||||
Series 2012-114, | 2,070,128 | 2,221,501 | ||||||
|
| |||||||
TOTAL FEDERAL NATIONAL MORTGAGE ASSOCIATION (FNMA) |
| $ | 2,266,045 | |||||
| April 30, 2016 / ANNUAL REPORT |
| PORTFOLIOS OF INVESTMENTS |
| 17 |
Wilmington Broad Market Bond Fund (continued)
Description
| Par Value
| Value
| ||||||
WHOLE LOAN – 0.3% | ||||||||
Banc of America Mortgage Securities, Inc., | $ | 187,765 | $ | 185,020 | ||||
Countrywide Home Loan Mortgage Pass-Through Trust, | 288,386 | 290,406 | ||||||
IndyMac INDA Mortgage Loan Trust, | 415,028 | 380,973 | ||||||
WaMu Mortgage Pass-Through Certificates, | 495,117 | 506,113 | ||||||
|
| |||||||
TOTAL WHOLE LOAN | $ | 1,362,512 | ||||||
|
| |||||||
TOTAL COLLATERALIZED MORTGAGE OBLIGATIONS |
| |||||||
(COST $5,803,348) |
| $ | 5,663,717 | |||||
COMMERCIAL PAPER – 1.0% |
| |||||||
COMMERCIAL PAPER – 1.0% |
| |||||||
Pacific Gas And Electric Co., 0.61%, 5/02/16‡,W | 4,000,000 | 3,999,867 | ||||||
|
| |||||||
TOTAL COMMERCIAL PAPER (COST $3,999,933) |
| $ | 3,999,867 | |||||
CORPORATE BONDS – 43.3% |
| |||||||
AEROSPACE & DEFENSE – 0.9% |
| |||||||
L-3 Communications Corp., Company Guaranteed, 3.95%, 11/15/16 | 1,735,000 | 1,757,798 | ||||||
L-3 Communications Corp., Company Guaranteed, 4.75%, 7/15/20 | 1,000,000 | 1,068,115 | ||||||
Lockheed Martin Corp., | 975,000 | 1,124,472 | ||||||
|
| |||||||
TOTAL AEROSPACE & DEFENSE |
| $ | 3,950,385 | |||||
AUTOMOTIVE – 0.7% |
| |||||||
Daimler Finance North America LLC, Company Guaranteed, 3.88%, 9/15/21W | 250,000 | 269,285 | ||||||
General Motors Co., Inc., | 2,000,000 | 2,250,000 | ||||||
Hyundai Capital America, | 575,000 | 576,136 | ||||||
|
| |||||||
TOTAL AUTOMOTIVE |
| $ | 3,095,421 | |||||
BANKS – 1.0% |
| |||||||
BB&T Corp., | 1,640,000 | 1,678,961 | ||||||
Branch Banking & Trust Co., | 1,000,000 | 1,070,968 | ||||||
Capital One Financial Corp., | 750,000 | 759,618 | ||||||
Capital One NA, | 680,000 | 678,735 | ||||||
|
| |||||||
TOTAL BANKS |
| $ | 4,188,282 | |||||
BEVERAGES – 0.6% |
| |||||||
Anheuser-Busch InBev Finance, Inc., | 1,125,000 | 1,274,364 | ||||||
Dr. Pepper Snapple Group, | 1,000,000 | 1,023,412 | ||||||
|
| |||||||
TOTAL BEVERAGES |
| $ | 2,297,776 | |||||
Description
| Par Value
| Value
| ||||||
BIOTECHNOLOGY – 1.2% | ||||||||
Amgen, Inc., | $ | 1,180,000 | $ | 1,228,292 | ||||
Celgene Corp., | 1,500,000 | 1,523,462 | ||||||
Celgene Corp., | 1,390,000 | 1,434,202 | ||||||
Gilead Sciences, Inc., | 650,000 | 709,859 | ||||||
|
| |||||||
TOTAL BIOTECHNOLOGY | $ | 4,895,815 | ||||||
CAPITAL MARKETS – 1.7% |
| |||||||
BlackRock, Inc., | 250,000 | 280,117 | ||||||
Charles Schwab Corp. (The), | 1,370,000 | 1,387,350 | ||||||
Charles Schwab Corp. (The), | 250,000 | 276,428 | ||||||
Fifth Third Bancorp, Sr. Unsecured, 3.50%, 3/15/22 | 1,250,000 | 1,299,543 | ||||||
Fifth Third Bancorp, Subordinated, 4.30%, 1/16/24 | 530,000 | 559,988 | ||||||
FMR LLC, | 1,000,000 | 1,245,789 | ||||||
Goldman Sachs Group, Inc. (The), | 425,000 | 425,484 | ||||||
Goldman Sachs Group, Inc. (The), | 1,425,000 | 1,420,116 | ||||||
|
| |||||||
TOTAL CAPITAL MARKETS |
| $ | 6,894,815 | |||||
COMMERCIAL BANKS – 3.7% |
| |||||||
Commonwealth Bank of Australia, | 1,000,000 | 995,232 | ||||||
Fifth Third Bank/Cincinnati OH, | 1,000,000 | 1,000,500 | ||||||
KeyBank NA/Cleveland OH, | 1,000,000 | 1,001,262 | ||||||
Keycorp, | 750,000 | 769,111 | ||||||
PNC Bank NA, | 1,500,000 | 1,532,889 | ||||||
PNC Bank NA, | 350,000 | 353,064 | ||||||
PNC Financial Services Group, Inc. (The), Subordinated, 3.90%, 4/29/24 | 1,500,000 | 1,594,565 | ||||||
SunTrust Banks, Inc., | 2,000,000 | 2,035,714 | ||||||
SunTrust Banks, Inc., | 1,475,000 | 1,501,805 | ||||||
US Bancorp/MN, | 2,000,000 | 2,063,792 | ||||||
US Bank NA/Cincinnati OH, | 2,000,000 | 2,035,891 | ||||||
Wells Fargo & Co., | 500,000 | 501,788 | ||||||
|
| |||||||
TOTAL COMMERCIAL BANKS |
| $ | 15,385,613 | |||||
| ANNUAL REPORT / April 30, 2016 |
| 18 |
| PORTFOLIOS OF INVESTMENTS |
Wilmington Broad Market Bond Fund (continued)
Description
| Par Value
| Value
| ||||||
COMMERCIAL FINANCE – 0.1% |
| |||||||
General Electric Capital Corp., | $ | 250,000 | $ | 288,693 | ||||
COMMERCIAL SERVICES & SUPPLIES – 0.5% |
| |||||||
Total System Services, Inc., | 1,900,000 | 1,901,984 | ||||||
COMPUTERS – 0.9% | ||||||||
Apple, Inc., | 1,580,000 | 1,585,773 | ||||||
HP Enterprise Co., | 2,000,000 | 2,023,225 | ||||||
|
| |||||||
TOTAL COMPUTERS | $ | 3,608,998 | ||||||
CONSUMER FINANCE – 0.2% |
| |||||||
American Express Co., | 655,000 | 652,244 | ||||||
John Deere Capital Corp., | 250,000 | 251,563 | ||||||
|
| |||||||
TOTAL CONSUMER FINANCE | $ | 903,807 | ||||||
DIVERSIFIED FINANCIAL SERVICES – 4.1% |
| |||||||
Bank of America Corp., | 1,250,000 | 1,266,969 | ||||||
Bank of America Corp., | 1,275,000 | 1,281,155 | ||||||
Bank of America Corp., | 1,500,000 | 1,508,980 | ||||||
Bank of America Corp., | 1,000,000 | 1,021,097 | ||||||
Citigroup, Inc., | 1,685,000 | 1,687,690 | ||||||
Citigroup, Inc., | 275,000 | 298,162 | ||||||
Citigroup, Inc., | 1,695,000 | 1,764,247 | ||||||
Ford Motor Credit Co. LLC, | 1,200,000 | 1,219,814 | ||||||
Ford Motor Credit Co. LLC, | 250,000 | 266,025 | ||||||
Ford Motor Credit Co. LLC, | 650,000 | 655,977 | ||||||
Ford Motor Credit Co. LLC, | 500,000 | 571,185 | ||||||
Ford Motor Credit Co. LLC, | 450,000 | 484,101 | ||||||
General Motors Financial Co., Inc., | 600,000 | 600,184 | ||||||
General Motors Financial Co., Inc., Company Guaranteed, | 300,000 | 311,813 | ||||||
JPMorgan Chase & Co., | 150,000 | 161,259 | ||||||
Description
| Par Value
| Value
| ||||||
JPMorgan Chase & Co., | $ | 1,600,000 | $ | 1,606,369 | ||||
JPMorgan Chase & Co., | 100,000 | 110,692 | ||||||
JPMorgan Chase Capital XXIII, | 1,000,000 | 692,500 | ||||||
Morgan Stanley, | 505,000 | 522,813 | ||||||
TD Ameritrade Holding Corp., | 847,000 | 871,667 | ||||||
|
| |||||||
TOTAL DIVERSIFIED FINANCIAL SERVICES | $ | 16,902,699 | ||||||
ELECTRIC – 2.9% | ||||||||
Appalachian Power Co., | 1,500,000 | 1,559,162 | ||||||
CMS Energy Corp., | 300,000 | 319,358 | ||||||
Dominion Resources, Inc./VA, | 960,000 | 960,550 | ||||||
Dominion Resources, Inc./VA, | 1,500,000 | 1,525,827 | ||||||
DTE Energy Co., | 305,000 | 324,334 | ||||||
Entergy Arkansas, Inc., | 1,000,000 | 1,040,052 | ||||||
Entergy Corp., | 1,300,000 | 1,433,542 | ||||||
Exelon Generation Co. LLC, | 650,000 | 690,402 | ||||||
FirstEnergy Corp., | 1,285,000 | 1,299,165 | ||||||
FirstEnergy Transmission LLC, | 2,250,000 | 2,388,565 | ||||||
System Energy Resources, Inc., 1st Mortgage, 4.10%, 4/01/23 | 500,000 | 522,593 | ||||||
|
| |||||||
TOTAL ELECTRIC | $ | 12,063,550 | ||||||
ELECTRONICS – 0.3% | ||||||||
Thermo Fisher Scientific, Inc., | 1,100,000 | 1,134,711 | ||||||
ENVIRONMENTAL CONTROL – 1.0% |
| |||||||
Waste Management, Inc., Company Guaranteed, 2.60%, 9/01/16 | 1,465,000 | 1,472,614 | ||||||
Waste Management, Inc., Company Guaranteed, 3.50%, 5/15/24 | 1,255,000 | 1,318,593 | ||||||
Waste Management, Inc., Company Guaranteed, 4.10%, 3/01/45 | 1,520,000 | 1,573,405 | ||||||
|
| |||||||
TOTAL ENVIRONMENTAL CONTROL | $ | 4,364,612 | ||||||
| April 30, 2016 / ANNUAL REPORT |
| PORTFOLIOS OF INVESTMENTS |
| 19 |
Wilmington Broad Market Bond Fund (continued)
Description
| Par Value
| Value
| ||||||
FOOD – 0.8% | ||||||||
Kraft Foods Group, Inc., Company Guaranteed, 2.25%, 6/05/17 | $ | 2,000,000 | $ | 2,019,359 | ||||
Kraft Heinz Foods Co., Company Guaranteed, 1.60%, 6/30/17W | 850,000 | 853,022 | ||||||
Kraft Heinz Foods Co., | ||||||||
Company Guaranteed, 5.20%, 7/15/45W | 500,000 | 577,538 | ||||||
|
| |||||||
TOTAL FOOD |
| $ | 3,449,919 | |||||
FOOD PRODUCTS – 0.8% |
| |||||||
General Mills, Inc., | 2,000,000 | 2,011,322 | ||||||
McCormick & Co., Inc., | 500,000 | 535,674 | ||||||
McCormick & Co., Inc., | 500,000 | 547,020 | ||||||
WM Wrigley Jr. Co., | 125,000 | 125,294 | ||||||
|
| |||||||
TOTAL FOOD PRODUCTS |
| $ | 3,219,310 | |||||
FOOD RETAILING – 0.6% |
| |||||||
Kroger Co., | 1,750,000 | 1,834,568 | ||||||
Kroger Co., | 500,000 | 679,690 | ||||||
|
| |||||||
TOTAL FOOD RETAILING |
| $ | 2,514,258 | |||||
FOREST PRODUCTS & PAPER – 0.4% |
| |||||||
International Paper Co., | 1,665,000 | 1,854,406 | ||||||
HEALTH CARE EQUIPMENT & SUPPLIES – 0.6% |
| |||||||
Becton Dickinson and Co., | 670,000 | 674,165 | ||||||
Zimmer Biomet Holdings, Inc., | 1,685,000 | 1,735,793 | ||||||
|
| |||||||
TOTAL HEALTH CARE EQUIPMENT & SUPPLIES |
| $ | 2,409,958 | |||||
HEALTH CARE PROVIDERS & SERVICES – 0.2% |
| |||||||
UnitedHealth Group, Inc., | 250,000 | 264,435 | ||||||
UnitedHealth Group, Inc., | 450,000 | 452,349 | ||||||
UnitedHealth Group, Inc., | 290,000 | 299,880 | ||||||
|
| |||||||
TOTAL HEALTH CARE PROVIDERS & SERVICES |
| $ | 1,016,664 | |||||
HOME FURNISHINGS – 0.5% |
| |||||||
Whirlpool Corp., | 350,000 | 352,182 | ||||||
Whirlpool Corp., | 1,500,000 | 1,648,834 | ||||||
Whirlpool Corp., | 210,000 | 219,843 | ||||||
|
| |||||||
TOTAL HOME FURNISHINGS |
| $ | 2,220,859 | |||||
Description
| Par Value
| Value
| ||||||
INSURANCE – 2.2% |
| |||||||
Aon PLC, | $ | 1,450,000 | $ | 1,501,070 | ||||
Berkshire Hathaway Finance Corp., | 425,000 | 460,656 | ||||||
CNA Financial Corp., | 1,000,000 | 1,132,521 | ||||||
CNA Financial Corp., | 950,000 | 954,795 | ||||||
Lincoln National Corp., | 1,000,000 | 1,054,944 | ||||||
Principal Financial Group, Inc., | 250,000 | 258,040 | ||||||
Prudential Financial, Inc., | 1,000,000 | 1,000,613 | ||||||
WR Berkley Corp., | 1,000,000 | 1,078,635 | ||||||
WR Berkley Corp., | 1,715,000 | 1,700,174 | ||||||
|
| |||||||
TOTAL INSURANCE |
| $ | 9,141,448 | |||||
MEDIA – 1.8% |
| |||||||
CBS Corp., | 2,000,000 | 2,011,235 | ||||||
CBS Corp., | 1,100,000 | 1,083,411 | ||||||
CCO Safari II LLC, | 1,500,000 | 1,558,938 | ||||||
Time Warner, Inc., | 1,190,000 | 1,284,506 | ||||||
Viacom, Inc., | 1,000,000 | 1,101,946 | ||||||
Walt Disney Co., | 565,000 | 614,410 | ||||||
|
| |||||||
TOTAL MEDIA |
| $ | 7,654,446 | |||||
METALS & MINING – 0.2% |
| |||||||
Barrick Gold Corp., | 1,000,000 | 979,838 | ||||||
MISCELLANEOUS MANUFACTURING – 0.6% |
| |||||||
Ingersoll-Rand Luxembourg Finance SA, Company Guaranteed, 2.63%, 5/01/20 | 1,135,000 | 1,138,230 | ||||||
Textron, Inc., | 480,000 | 492,902 | ||||||
Textron, Inc., | 750,000 | 767,090 | ||||||
|
| |||||||
TOTAL MISCELLANEOUS MANUFACTURING |
| $ | 2,398,222 | |||||
OFFICE/BUSINESS EQUIPMENT – 0.2% |
| |||||||
Xerox Corp., Sr. Unsecured, 2.80%, 5/15/20 | 1,000,000 | 963,698 | ||||||
OIL & GAS – 2.3% |
| |||||||
Anadarko Petroleum Corp., | 225,000 | 229,781 | ||||||
Anadarko Petroleum Corp., | 151,000 | 161,115 | ||||||
ConocoPhillips Co., | 335,000 | 358,392 | ||||||
| ANNUAL REPORT / April 30, 2016 |
| 20 |
| PORTFOLIOS OF INVESTMENTS |
Wilmington Broad Market Bond Fund (continued)
Description
| Par Value
| Value
| ||||||
Exxon Mobil Corp., | $ | 925,000 | $ | 943,508 | ||||
Marathon Petroleum Corp., | 745,000 | 716,908 | ||||||
Murphy Oil Corp., | 1,000,000 | 827,500 | ||||||
Nabors Industries, Inc., | 800,000 | 799,000 | ||||||
Phillips 66, | 1,450,000 | 1,581,957 | ||||||
Schlumberger Holdings Corp., | 1,500,000 | 1,564,172 | ||||||
Sempra Energy, | 500,000 | 502,241 | ||||||
Shell International Finance BV, Company Guaranteed, 3.25%, 5/11/25 | 1,110,000 | 1,148,792 | ||||||
Valero Energy Corp., | 563,000 | 527,110 | ||||||
|
| |||||||
TOTAL OIL & GAS |
| $ | 9,360,476 | |||||
PHARMACEUTICALS – 1.6% |
| |||||||
AbbVie, Inc., | 1,000,000 | 1,006,110 | ||||||
AbbVie, Inc., | 1,485,000 | 1,511,900 | ||||||
AbbVie, Inc., | 460,000 | 477,189 | ||||||
Actavis Funding SCS, | 1,500,000 | 1,496,807 | ||||||
McKesson Corp., | 460,000 | 460,981 | ||||||
Medco Health Solutions, Inc., | 940,000 | 997,713 | ||||||
Medtronic, Inc., | 700,000 | 706,202 | ||||||
|
| |||||||
TOTAL PHARMACEUTICALS |
| $ | 6,656,902 | |||||
PIPELINES – 2.2% |
| |||||||
Energy Transfer Partners LP, | 1,000,000 | 983,698 | ||||||
Energy Transfer Partners LP, | 870,000 | 800,347 | ||||||
Energy Transfer Partners LP, | 1,000,000 | 935,813 | ||||||
Enterprise Products Operating LLC, Company Guaranteed, 4.95%, 10/15/54 | 500,000 | 477,741 | ||||||
Enterprise Products Operating LLC, Series B, Company Guaranteed, 7.03%, 1/15/68 | 2,000,000 | 2,060,000 | ||||||
Kinder Morgan Energy Partners LP, Sr. Unsecured, 5.40%, 9/01/44 | 1,000,000 | 901,638 | ||||||
ONEOK Partners LP, Company Guaranteed, 6.20%, 9/15/43 | 1,000,000 | 961,050 | ||||||
Description
| Par Value
| Value
| ||||||
Plains All American Pipeline LP / PAA Finance Corp., Sr. Unsecured, 3.65%, 6/01/22 | $ | 1,000,000 | $ | 952,358 | ||||
Spectra Energy Partners LP, | 1,125,000 | 1,080,014 | ||||||
|
| |||||||
TOTAL PIPELINES |
| $ | 9,152,659 | |||||
REAL ESTATE INVESTMENT TRUSTS – 4.5% |
| |||||||
American Tower Corp., | 2,000,000 | 2,064,436 | ||||||
American Tower Corp., | 415,000 | 462,104 | ||||||
AvalonBay Communities, Inc., | 1,145,000 | 1,214,356 | ||||||
Digital Realty Trust LP, | 615,000 | 632,788 | ||||||
Digital Realty Trust LP, | 1,100,000 | 1,094,927 | ||||||
HCP, Inc., | 2,000,000 | 2,051,612 | ||||||
HCP, Inc., | 450,000 | 455,939 | ||||||
HCP, Inc., | 500,000 | 509,160 | ||||||
Health Care REIT, Inc., | 2,000,000 | 2,018,655 | ||||||
Health Care REIT, Inc., | 250,000 | 276,265 | ||||||
Healthcare Realty Trust, Inc., | 695,000 | 686,150 | ||||||
Healthcare Realty Trust, Inc., | 915,000 | 896,194 | ||||||
Mack-Cali Realty LP, | 2,215,000 | 2,227,249 | ||||||
Mack-Cali Realty LP, | 250,000 | 281,913 | ||||||
ProLogis LP, | 450,000 | 461,558 | ||||||
ProLogis LP, | 1,245,000 | 1,305,317 | ||||||
Ventas Realty LP, | 2,000,000 | 2,003,399 | ||||||
|
| |||||||
TOTAL REAL ESTATE INVESTMENT TRUSTS |
| $ | 18,642,022 | |||||
RETAIL – 0.0%** |
| |||||||
CVS Caremark Corp., Sr. Unsecured, 5.75%, 6/01/17 | 151,000 | 158,650 | ||||||
SOFTWARE – 0.7% |
| |||||||
Microsoft Corp., | 1,000,000 | 1,146,980 | ||||||
Oracle Corp., | 1,730,000 | 1,849,581 | ||||||
|
| |||||||
TOTAL SOFTWARE | $ | 2,996,561 | ||||||
April 30, 2016 / ANNUAL REPORT |
| PORTFOLIOS OF INVESTMENTS |
| 21 |
Wilmington Broad Market Bond Fund (continued)
Description
| Par Value
| Value
| ||||||
TELECOMMUNICATIONS – 1.4% |
| |||||||
AT&T, Inc., | $ | 1,731,000 | $ | 1,731,560 | ||||
AT&T, Inc., | 845,000 | 851,909 | ||||||
Crown Castle Towers LLC, | 2,000,000 | 2,038,462 | ||||||
Verizon Communications, Inc., | 1,000,000 | 1,001,694 | ||||||
|
| |||||||
TOTAL TELECOMMUNICATIONS |
| $ | 5,623,625 | |||||
TRANSPORTATION – 1.5% |
| |||||||
FedEx Corp., | 685,000 | 690,076 | ||||||
Norfolk Southern Corp., | 250,000 | 279,219 | ||||||
Ryder System, Inc., | 500,000 | 504,826 | ||||||
Ryder System, Inc., | 1,155,000 | 1,170,714 | ||||||
Ryder System, Inc., | 2,450,000 | 2,450,898 | ||||||
Union Pacific Corp., Sr. Unsecured, 4.38%, 11/15/65 | 1,000,000 | 1,018,288 | ||||||
|
| |||||||
TOTAL TRANSPORTATION |
| $ | 6,114,021 | |||||
TRUCKING & LEASING – 0.4% |
| |||||||
GATX Corp., | 857,000 | 861,285 | ||||||
GATX Corp., | 640,000 | 631,996 | ||||||
|
| |||||||
TOTAL TRUCKING & LEASING |
| $ | 1,493,281 | |||||
|
| |||||||
| TOTAL CORPORATE BONDS (COST $175,716,685) | $ | 179,898,384 | ||||||
| ENHANCED EQUIPMENT TRUST CERTIFICATES – 0.3% | ||||||||
AIRLINES – 0.3% |
| |||||||
American Airlines 2011-1, | 318,011 | 340,172 | ||||||
Continental Airlines 2009-2, | 180,130 | 203,659 | ||||||
Delta Air Lines 2009-1, | 235,967 | 266,495 | ||||||
Delta Air Lines, 2007-1, | 277,221 | 319,843 | ||||||
United Air Lines 2009-2A, Pass-Through Certificates, 9.75%, 1/15/17 | 161,593 | 169,370 | ||||||
|
| |||||||
TOTAL AIRLINES |
| $ | 1,299,539 | |||||
|
| |||||||
TOTAL ENHANCED EQUIPMENT TRUST CERTIFICATES (COST $1,172,922) |
| $ | 1,299,539 | |||||
Description
| Par Value
| Value
| ||||||
GOVERNMENT AGENCIES – 1.4% |
| |||||||
FEDERAL HOME LOAN MORTGAGE CORPORATION (FHLMC) – 0.8% |
| |||||||
1.25%, 10/02/19 | $ | 1,300,000 | $ | 1,306,918 | ||||
1.75%, 5/30/19 | 2,000,000 | 2,043,457 | ||||||
2.38%, 1/13/22 | 125,000 | 130,781 | ||||||
|
| |||||||
TOTAL FEDERAL HOME LOAN MORTGAGE CORPORATION (FHLMC) |
| $ | 3,481,156 | |||||
FEDERAL NATIONAL MORTGAGE ASSOCIATION (FNMA) – 0.6% |
| |||||||
4.88%, 12/15/16 | 700,000 | 718,838 | ||||||
6.25%, 5/15/29 | 750,000 | 1,064,720 | ||||||
7.25%, 5/15/30 | 400,000 | 619,183 | ||||||
|
| |||||||
TOTAL FEDERAL NATIONAL MORTGAGE ASSOCIATION |
| $ | 2,402,741 | |||||
|
| |||||||
| TOTAL GOVERNMENT AGENCIES (COST $5,493,884) | $ | 5,883,897 | ||||||
| MORTGAGE-BACKED SECURITIES – 23.1% | ||||||||
FEDERAL HOME LOAN MORTGAGE CORPORATION (FHLMC) – 10.2% |
| |||||||
Pool A13990, 4.50%, 10/01/33 | 48,563 | 53,301 | ||||||
Pool A93415, 4.00%, 8/01/40 | 2,455,688 | 2,637,278 | ||||||
Pool A93505, 4.50%, 8/01/40 | 1,949,791 | 2,129,104 | ||||||
Pool A93996, 4.50%, 9/01/40 | 1,515,062 | 1,654,422 | ||||||
Pool A97047, 4.50%, 2/01/41 | 1,481,532 | 1,617,808 | ||||||
Pool B17616, 5.50%, 1/01/20 | 66,139 | 67,090 | ||||||
Pool C00478, 8.50%, 9/01/26 | 17,170 | 20,208 | ||||||
Pool C01272, 6.00%, 12/01/31 | 35,658 | 40,752 | ||||||
Pool C03750, 3.50%, 2/01/42 | 478,977 | 502,715 | ||||||
Pool C03849, 3.50%, 4/01/42 | 235,513 | 247,200 | ||||||
Pool C04305, 3.00%, 11/01/42 | 3,478,055 | 3,572,869 | ||||||
Pool C04444, 3.00%, 1/01/43 | 125,872 | 129,223 | ||||||
Pool C09020, 3.50%, 11/01/42 | 3,549,528 | 3,725,400 | ||||||
Pool C09044, 3.50%, 7/01/43 | 1,745,682 | 1,831,020 | ||||||
Pool E09010, 2.50%, 9/01/27 | 1,346,946 | 1,393,694 | ||||||
Pool G01625, 5.00%, 11/01/33 | 52,287 | 57,687 | ||||||
Pool G02296, 5.00%, 6/01/36 | 284,203 | 312,455 | ||||||
Pool G02390, 6.00%, 9/01/36 | 9,713 | 11,089 | ||||||
Pool G03703, 5.50%, 12/01/37 | 29,814 | 33,241 | ||||||
Pool G04776, 5.50%, 7/01/38 | 101,685 | 113,251 | ||||||
Pool G05317, 5.00%, 4/01/37 | 1,115,758 | 1,226,665 | ||||||
Pool G05500, 5.00%, 5/01/39 | 973,905 | 1,070,893 | ||||||
Pool G06222, 4.00%, 1/01/41 | 2,620,445 | 2,813,776 | ||||||
Pool G06956, 4.50%, 8/01/41 | 1,422,185 | 1,552,992 | ||||||
Pool G07266, 4.00%, 12/01/42 | 3,469,548 | 3,718,698 | ||||||
Pool G07624, 4.00%, 12/01/43 | 1,524,827 | 1,641,183 | ||||||
Pool G07680, 4.00%, 4/01/44 | 2,451,263 | 2,638,122 | ||||||
Pool G07889, 3.50%, 8/01/43 | 1,524,566 | 1,599,248 | ||||||
Pool G08097, 6.50%, 11/01/35 | 22,185 | 25,772 | ||||||
| ANNUAL REPORT / April 30, 2016 |
| 22 |
| PORTFOLIOS OF INVESTMENTS |
Wilmington Broad Market Bond Fund (continued)
Description
| Par Value
| Value
| ||||||
Pool G08534, 3.00%, 6/01/43 | $ | 736,568 | $ | 756,178 | ||||
Pool G08595, 4.00%, 7/01/44 | 1,602,183 | 1,713,511 | ||||||
Pool G12709, 5.00%, 7/01/22 | 64,961 | 67,437 | ||||||
Pool G18497, 3.00%, 1/01/29 | 172,407 | 181,030 | ||||||
Pool Q08305, 3.50%, 5/01/42 | 1,347,035 | 1,422,297 | ||||||
Pool Q19476, 3.50%, 6/01/43 | 1,448,446 | 1,519,431 | ||||||
Pool Q23891, 4.00%, 12/01/43 | 328,245 | 351,446 | ||||||
|
| |||||||
TOTAL FEDERAL HOME LOAN MORTGAGE CORPORATION (FHLMC) |
| $ | 42,448,486 | |||||
FEDERAL NATIONAL MORTGAGE ASSOCIATION (FNMA) – 12.8% |
| |||||||
Pool 254007, 6.50%, 10/01/31 | 20,615 | 23,927 | ||||||
Pool 254759, 4.50%, 6/01/18 | 39,117 | 39,890 | ||||||
Pool 254833, 4.50%, 8/01/18 | 7,305 | 7,462 | ||||||
Pool 256515, 6.50%, 12/01/36 | 25,581 | 29,557 | ||||||
Pool 256639, 5.00%, 2/01/27 | 20,818 | 23,114 | ||||||
Pool 256752, 6.00%, 6/01/27 | 32,132 | 36,737 | ||||||
Pool 329794, 7.00%, 2/01/26 | 36,005 | 42,034 | ||||||
Pool 402255, 6.50%, 12/01/27 | 1,615 | 1,676 | ||||||
Pool 629603, 5.50%, 2/01/17 | 1,297 | 1,318 | ||||||
Pool 638023, 6.50%, 4/01/32 | 58,193 | 65,191 | ||||||
Pool 642345, 6.50%, 5/01/32 | 64,263 | 75,028 | ||||||
Pool 651292, 6.50%, 7/01/32 | 72,573 | 77,404 | ||||||
Pool 686398, 6.00%, 3/01/33 | 164,240 | 184,805 | ||||||
Pool 695818, 5.00%, 4/01/18 | 39,786 | 40,597 | ||||||
Pool 745412, 5.50%, 12/01/35 | 36,511 | 41,067 | ||||||
Pool 888789, 5.00%, 7/01/36 | 418,127 | 464,670 | ||||||
Pool 890551, 4.50%, 8/01/41 | 136,587 | 149,237 | ||||||
Pool 975207, 5.00%, 3/01/23 | 92,029 | 95,907 | ||||||
Pool AB1796, 3.50%, 11/01/40 | 1,259,099 | 1,328,117 | ||||||
Pool AB7936, 3.00%, 2/01/43 | 2,168,186 | 2,225,971 | ||||||
Pool AB8997, 2.50%, 4/01/28 | 288,149 | 296,641 | ||||||
Pool AE0217, 4.50%, 8/01/40 | 237,493 | 259,470 | ||||||
Pool AE2520, 3.00%, 1/01/26 | 741,071 | 778,414 | ||||||
Pool AH5583, 4.50%, 2/01/41 | 704,165 | 769,437 | ||||||
Pool AK4523, 4.00%, 3/01/42 | 2,297,138 | 2,459,887 | ||||||
Pool AL0658, 4.50%, 8/01/41 | 793,727 | 867,234 | ||||||
Pool AL1319, 4.50%, 10/01/41 | 1,537,772 | 1,681,844 | ||||||
Pool AL2034, 4.50%, 4/01/42 | 336,081 | 367,180 | ||||||
Pool AL5537, 4.50%, 4/01/44 | 639,403 | 698,474 | ||||||
Pool AS0302, 3.00%, 8/01/43 | 5,933,791 | 6,099,369 | ||||||
Pool AS3155, 4.00%, 8/01/44 | 187,939 | 201,099 | ||||||
Pool AS4480, 2.50%, 2/01/30 | 1,730,472 | 1,784,117 | ||||||
Pool AS5136, 4.00%, 6/01/45 | 1,311,504 | 1,402,582 | ||||||
Pool AT7899, 3.50%, 7/01/43 | 4,342,058 | 4,560,190 | ||||||
Pool AU4279, 3.00%, 9/01/43 | 1,177,228 | 1,210,065 | ||||||
Pool AX0833, 3.50%, 9/01/44 | 2,048,978 | 2,158,479 | ||||||
Pool AX5302, 4.00%, 1/01/42 | 2,253,953 | 2,417,590 | ||||||
Description
| Par Value
| Value
| ||||||
Pool G60038, 3.50%, 1/01/44 | $ | 7,541,763 | $ | 7,915,852 | ||||
Pool G60038, 3.50%, 1/01/44 | 3,954,512 | 4,064,773 | ||||||
Pool MA1458, 3.00%, 6/01/43 | 715,034 | 734,931 | ||||||
Pool TBA, 5.00%, 5/15/46 | 6,700,000 | 7,408,734 | ||||||
|
| |||||||
TOTAL FEDERAL NATIONAL MORTGAGE ASSOCIATION |
| $ | 53,090,071 | |||||
GOVERNMENT NATIONAL MORTGAGE ASSOCIATION (GNMA) – 0.1% |
| |||||||
Pool 2077, 7.00%, 9/20/25 | 10,635 | 12,280 | ||||||
Pool 354677, 7.50%, 10/15/23 | 24,387 | 28,660 | ||||||
Pool 354713, 7.50%, 12/15/23 | 16,534 | 19,437 | ||||||
Pool 354765, 7.00%, 2/15/24 | 34,632 | 40,694 | ||||||
Pool 354827, 7.00%, 5/15/24 | 33,996 | 37,902 | ||||||
Pool 360869, 7.50%, 5/15/24 | 23,544 | 24,311 | ||||||
Pool 361843, 7.50%, 10/15/24 | 4,892 | 5,025 | ||||||
Pool 373335, 7.50%, 5/15/22 | 8,896 | 9,180 | ||||||
Pool 385623, 7.00%, 5/15/24 | 38,632 | 44,822 | ||||||
Pool 503405, 6.50%, 4/15/29 | 43,256 | 49,825 | ||||||
|
| |||||||
TOTAL GOVERNMENT NATIONAL MORTGAGE ASSOCIATION |
| $ | 272,136 | |||||
|
| |||||||
TOTAL MORTGAGE-BACKED SECURITIES |
| |||||||
(COST $94,589,428) |
| $ | 95,810,693 | |||||
U.S. TREASURY – 29.2% |
| |||||||
U.S. TREASURY BONDS – 6.0% |
| |||||||
2.50%, 2/15/45 | 2,135,000 | 2,061,798 | ||||||
2.88%, 8/15/45 | 300,000 | 312,828 | ||||||
3.00%, 5/15/42 | 500,000 | 538,248 | ||||||
3.00%, 11/15/44 | 2,000,000 | 2,139,270 | ||||||
3.00%, 5/15/45 | 2,000,000 | 2,138,338 | ||||||
3.00%, 11/15/45 | 765,000 | 818,036 | ||||||
3.13%, 8/15/44 | 7,887,000 | 8,645,734 | ||||||
3.63%, 2/15/44 | 2,106,000 | 2,532,391 | ||||||
3.63%, 8/15/43 | 881,000 | 1,060,608 | ||||||
3.75%, 11/15/43 | 365,000 | 449,395 | ||||||
5.25%, 2/15/29 | 500,000 | 682,747 | ||||||
5.38%, 2/15/31 | 600,000 | 853,549 | ||||||
6.25%, 5/15/30 | 500,000 | 757,384 | ||||||
6.38%, 8/15/27 | 450,000 | 654,049 | ||||||
8.88%, 2/15/19# | 1,130,000 | 1,379,438 | ||||||
|
| |||||||
TOTAL U.S. TREASURY BONDS |
| $ | 25,023,813 | |||||
U.S. TREASURY NOTES – 23.2% |
| |||||||
0.63%, 8/31/17 | 1,810,000 | 1,808,988 | ||||||
0.63%, 9/30/17 | 750,000 | 749,467 | ||||||
0.75%, 12/31/17 | 500,000 | 500,119 | ||||||
1.00%, 5/31/18 | 1,100,000 | 1,104,554 | ||||||
1.13%, 6/15/18 | 1,000,000 | 1,006,954 | ||||||
1.25%, 10/31/18 | 2,085,000 | 2,105,066 | ||||||
1.25%, 1/31/19 | 250,000 | 252,447 | ||||||
| April 30, 2016 / ANNUAL REPORT |
| PORTFOLIOS OF INVESTMENTS |
| 23 |
Wilmington Broad Market Bond Fund (continued)
Description
| Par Value
| Value
| ||||||
1.38%, 3/31/20 | $ | 3,300,000 | $ | 3,330,381 | ||||
1.38%, 6/30/18 | 6,000,000 | 6,074,548 | ||||||
1.38%, 9/30/18 | 1,240,000 | 1,255,805 | ||||||
1.38%, 2/28/19 | 2,500,000 | 2,533,076 | ||||||
1.50%, 12/31/18 | 2,486,000 | 2,527,422 | ||||||
1.50%, 1/31/19 | 9,400,000 | 9,555,183 | ||||||
1.50%, 5/31/19 | 535,000 | 543,922 | ||||||
1.50%, 11/30/19 | 1,145,000 | 1,162,685 | ||||||
1.63%, 3/31/19 | 820,000 | 836,746 | ||||||
1.63%, 11/30/20 | 1,710,000 | 1,739,849 | ||||||
1.63%, 8/15/22 | 6,000,000 | 6,042,150 | ||||||
1.63%, 11/15/22 | 1,928,000 | 1,936,734 | ||||||
1.75%, 9/30/19 | 5,700,000 | 5,838,772 | ||||||
1.75%, 5/15/22 | 380,000 | 385,636 | ||||||
1.75%, 5/15/23 | 2,000,000 | 2,020,333 | ||||||
1.88%, 6/30/20 | 5,845,000 | 6,010,905 | ||||||
2.00%, 11/15/21 | 1,000,000 | 1,031,698 | ||||||
2.00%, 2/15/25 | 4,655,000 | 4,741,780 | ||||||
2.00%, 8/15/25 | 295,000 | 300,042 | ||||||
2.13%, 6/30/22 | 6,615,000 | 6,853,716 | ||||||
2.13%, 5/15/25 | 2,500,000 | 2,570,840 | ||||||
2.13%, 8/15/21 | 3,750,000 | 3,896,972 | ||||||
2.25%, 7/31/18 | 500,000 | 515,824 | ||||||
2.25%, 7/31/21 | 6,600,000 | 6,900,948 | ||||||
2.25%, 11/15/25 | 230,000 | 238,748 | ||||||
2.38%, 8/15/24 | 6,600,000 | 6,931,305 | ||||||
2.50%, 8/15/23 | 200,000 | 212,223 | ||||||
2.63%, 11/15/20 | 500,000 | 530,135 | ||||||
3.13%, 5/15/19 | 750,000 | 799,423 | ||||||
3.63%, 2/15/20 | 750,000 | 820,657 | ||||||
4.00%, 8/15/18 | 500,000 | 537,076 | ||||||
|
| |||||||
TOTAL U.S. TREASURY NOTES |
| $ | 96,203,129 | |||||
|
| |||||||
TOTAL U.S. TREASURY (COST $116,231,361) |
| $ | 121,226,942 | |||||
| | Number of Shares | | ||||||
MONEY MARKET FUND – 1.4% |
| |||||||
Dreyfus Cash | 5,982,777 | $ | 5,982,777 | |||||
|
| |||||||
TOTAL MONEY MARKET FUND (COST $5,982,777) |
| $ | 5,982,777 | |||||
|
| |||||||
TOTAL INVESTMENTS IN SECURITIES – 101.3% (COST $409,687,866) |
| $ | 420,524,982 | |||||
|
| |||||||
Description
| Par Value
| Value
| ||||||
CASH COLLATERAL INVESTED FOR SECURITIES ON LOAN – 0.3% |
| |||||||
REPURCHASE AGREEMENTS – 0.3% |
| |||||||
BNP Paribas Securities Corp., 0.29%, dated 4/29/16, due 5/02/16, repurchase price $271,380, collateralized by U.S. Government & Treasury Securities 0.00% to 7.63%, maturing 5/26/16 to 5/15/45; total market value of $276,801. | $ | 271,373 | $ | 271,373 | ||||
Citigroup Global Markets, Inc., 0.30%, dated 4/29/16, due 5/02/16, repurchase price $271,380, collateralized by U.S. Government & Treasury Securities 0.00% to 9.00%, maturing 6/30/17 to 5/01/46; total market value of $276,801. | 271,373 | 271,373 | ||||||
Daiwa Capital Markets America, 0.32%, dated 4/29/16, due 5/02/16, repurchase price $271,380, collateralized by U.S. Government & Treasury Securities 0.00% to 8.75%, maturing 5/05/16 to 9/09/49; total market value of $276,800. | 271,373 | 271,373 | ||||||
HSBC Securities USA, Inc., 0.27%, dated 4/29/16, due 5/02/16, repurchase price $271,379, collateralized by U.S. Government & Treasury Securities 0.00% to 7.25%, maturing 5/15/16 to 7/15/37; total market value of $276,801. | 271,373 | 271,373 | ||||||
Nomura Securities International, Inc., 0.32%, dated 4/29/16, due 5/02/16, repurchase price $271,380, collateralized by U.S. Government & Treasury Securities 0.00% to 9.50%, maturing 5/15/16 to 3/20/66; total market value of $276,800. | 271,373 | 271,373 | ||||||
RBC Capital Markets LLC, 0.29%, dated 4/29/16, due 5/02/16, repurchase price $71,242, collateralized by U.S. Government Securities 1.75% to 6.00%, maturing 6/01/18 to 6/01/46; total market value of $72,665. | 71,240 | 71,240 | ||||||
|
| |||||||
TOTAL CASH COLLATERAL INVESTED FOR SECURITIES ON LOAN |
| |||||||
| (COST $1,428,105) | $ | 1,428,105 | ||||||
|
| |||||||
| TOTAL INVESTMENTS – 101.6% | ||||||||
| (COST $411,115,971) | $ | 421,953,087 | ||||||
| COLLATERAL FOR SECURITIES ON LOAN – (0.3%) | (1,428,105 | ) | ||||||
OTHER LIABILITIES LESS ASSETS – (1.3%) |
| (5,344,128 | ) | |||||
|
| |||||||
| TOTAL NET ASSETS – 100.0% | $ | 415,180,854 | ||||||
|
| |||||||
Cost of investments for Federal income tax purposes is $411,115,971. The net unrealized appreciation/(depreciation) of investments was $10,837,116. This consists of net unrealized appreciation from investment for those securities having an excess of value over cost of $12,266,397 and net unrealized depreciation from investments for those securities having an excess of cost over value of $1,429,281.
| ANNUAL REPORT / April 30, 2016 |
| 24 |
| PORTFOLIOS OF INVESTMENTS |
Wilmington Broad Market Bond Fund (concluded)
Various inputs are used in determining the value of the Fund’s investments. These inputs are summarized in the three broad levels listed below.
Level 1 – quoted prices in active markets for identical securities
Level 2 – other significant observable inputs (including quoted prices for similar securities, interest rates, prepayment speeds, credit risk, etc.)
Level 3 – significant unobservable inputs (including the Fund’s own assumptions in determining the fair value of investments)
The following is a summary of the inputs used as of April 30, 2016 in valuing the Fund’s assets carried at fair value:
Level 1 | Level 2 | Level 3 | Total | |||||||||||||||||||
Investments in Securities | ||||||||||||||||||||||
Asset-Backed Securities | $ | — | $ | 759,166 | $ | — | $ | 759,166 | ||||||||||||||
Collateralized Mortgage Obligations | — | 5,663,717 | — | 5,663,717 | ||||||||||||||||||
Commercial Paper | — | 3,999,867 | — | 3,999,867 | ||||||||||||||||||
Corporate Bonds | — | 179,898,384 | �� | — | 179,898,384 | |||||||||||||||||
Enhanced Equipment Trust Certificates | — | 1,299,539 | — | 1,299,539 | ||||||||||||||||||
Government Agencies | — | 5,883,897 | — | 5,883,897 | ||||||||||||||||||
Mortgage-Backed Securities | — | 95,810,693 | — | 95,810,693 | ||||||||||||||||||
U.S. Treasury | — | 121,226,942 | — | 121,226,942 | ||||||||||||||||||
Money Market Fund | 5,982,777 | — | — | 5,982,777 | ||||||||||||||||||
Repurchase Agreements | — | 1,428,105 | — | 1,428,105 | ||||||||||||||||||
|
|
|
|
|
|
|
| |||||||||||||||
Total | $ | 5,982,777 | $ | 415,970,310 | $ | — | $ | 421,953,087 | ||||||||||||||
|
|
|
|
|
|
|
| |||||||||||||||
| # | Security, or a portion thereof, is on loan. See Note 2 in Notes to Financial Statements. |
| ^ | 7-Day net yield. |
| D | Floating rate note with current rate and stated maturity date shown. |
| ‡ | Zero Coupon. |
| W | Denotes a restricted security that may be resold without restriction to “qualified institutional buyers” as defined in Rule 144A under the Securities Act of 1933 and that the Fund has determined to be liquid under criteria established by the Fund’s Board of Trustees. At April 30, 2016, these liquid restricted securities amounted to $18,974,691 representing 4.6% of total net assets. |
| ** | Represents less than 0.05% |
The following acronyms are used throughout this Fund:
BKNT - Bank Note
CMBS - Commercial Mortgage-Backed Securities
FHLMC - Federal Home Loan Mortgage Corporation
FNMA - Federal National Mortgage Association
GMTN - Global Medium Term Note |
GNMA - Government National Mortgage Association
LLC - Limited Liability Corporation
LP - Limited Partnership
MTN - Medium Term Note
NA - North America
PLC - Public Limited Company
REIT - Real Estate Investment Trust |
See Notes which are an integral part of the Financial Statements
| April 30, 2016 / ANNUAL REPORT |
| 25 |
PORTFOLIO OF INVESTMENTS SUMMARY TABLE
Wilmington Intermediate-Term Bond Fund
At April 30, 2016, the Fund’s portfolio composition was as follows (unaudited):
| Percentage of Total Net Assets | ||||
Corporate Bonds | 49.0% | |||
U.S. Treasury | 39.1% | |||
Government Agencies | 7.9% | |||
Mortgage-Backed Securities | 1.7% | |||
Asset-Backed Security | 0.0%4 | |||
Cash Equivalents1 | 2.7% | |||
Other Assets and Liabilities – Net2 | (0.4)% | |||
TOTAL |
|
100.0% |
| |
| Credit Quality Diversification3 | Percentage of Total Net Assets | |||
U.S. Government Agency Securities | 9.6% | |||
U.S. Treasury | 39.1% | |||
AA / Aa | 2.6% | |||
A / A | 13.0% | |||
BBB / Baa | 31.4% | |||
BB / Ba | 2.0% | |||
Not Rated | 2.7% | |||
Other Assets and Liabilities – Net2 | (0.4)% | |||
TOTAL |
|
100.0% |
| |
| (1) | Cash Equivalents include investments in a money market fund and repurchase agreements. |
| (2) | Assets, other than investments in securities, less liabilities. See Statements of Assets and Liabilities. |
| (3) | For financial reporting purposes, the Credit Quality Diversification table reflects the lowest rating assigned by either Moody’s Investors Service or Standard and Poor’s if the ratings differ. These rating agencies are independent, nationally recognized statistical rating organizations and are widely used. Investment grade ratings are credit ratings of BBB/Baa or higher. Below investment grade ratings are credit ratings of BB/Ba or lower. Investments designated as “Not Rated” are not rated by either rating agency and do not necessarily indicate low credit quality. Credit quality ratings are subject to change. |
| (4) | Represents less than 0.05%. |
PORTFOLIO OF INVESTMENTS
April 30, 2016
Description | Par Value | Value | ||||||
| ASSET-BACKED SECURITY – 0.0%** | ||||||||
WHOLE LOAN – 0.0%** |
| |||||||
SLM Private Education Loan Trust, |
| |||||||
Series 2011-A, Class A1, | $ | 25,179 | $ | 25,201 | ||||
|
| |||||||
TOTAL ASSET-BACKED SECURITY |
| |||||||
(COST $25,179) | $ | 25,201 | ||||||
CORPORATE BONDS – 49.0% |
| |||||||
AEROSPACE & DEFENSE – 1.5% |
| |||||||
L-3 Communications Corp., | ||||||||
Company Guaranteed, | 250,000 | 253,285 | ||||||
Description | Par Value | Value | ||||||
L-3 Communications Corp., | ||||||||
Company Guaranteed, | $ | 750,000 | $ | 801,086 | ||||
Lockheed Martin Corp., | ||||||||
Sr. Unsecured, | 750,000 | 785,531 | ||||||
|
| |||||||
TOTAL AEROSPACE & DEFENSE |
| $ | 1,839,902 | |||||
AUTO MANUFACTURERS – 0.2% |
| |||||||
General Motors Co., | ||||||||
Sr. Unsecured, | 220,000 | 226,325 | ||||||
AUTO PARTS & EQUIPMENT – 0.2% |
| |||||||
Johnson Controls, Inc., | ||||||||
Sr. Unsecured, | 300,000 | 307,973 | ||||||
AUTOMOTIVE – 1.0% | ||||||||
Daimler Finance North America LLC, |
| |||||||
Company Guaranteed, | 500,000 | 500,182 | ||||||
| ANNUAL REPORT / April 30, 2016 |
| 26 |
| PORTFOLIOS OF INVESTMENTS |
Wilmington Intermediate-Term Bond Fund (continued)
Description | Par Value | Value | ||||||
Hyundai Capital America, | ||||||||
Sr. Unsecured, | $ | 250,000 | $ | 251,203 | ||||
Toyota Motor Credit Corp., | ||||||||
Sr. Unsecured, MTN, | 450,000 | 444,967 | ||||||
|
| |||||||
TOTAL AUTOMOTIVE | $ | 1,196,352 | ||||||
BANKS – 3.7% |
| |||||||
Bank of America Corp., | ||||||||
Sr. Unsecured, MTN, | 160,000 | 161,527 | ||||||
Bank of New York Mellon Corp. (The), |
| |||||||
Sr. Unsecured, MTN, | 300,000 | 301,796 | ||||||
Branch Banking & Trust Co., | ||||||||
Subordinated, | 500,000 | 526,340 | ||||||
Capital One Financial Corp., | ||||||||
Sr. Unsecured, | 100,000 | 101,282 | ||||||
Capital One Financial Corp., | ||||||||
Sr. Unsecured, | 345,000 | 354,627 | ||||||
Capital One NA, | ||||||||
Sr. Unsecured, BKNT, | 250,000 | 249,535 | ||||||
Key Bank NA, | ||||||||
Sr. Unsecured, | 500,000 | 500,529 | ||||||
Morgan Stanley, | ||||||||
Sr. Unsecured, | 325,000 | 330,810 | ||||||
National Australia Bank Ltd./NY, | ||||||||
Sr. Unsecured, MTN, | 300,000 | 304,324 | ||||||
Royal Bank of Canada, | ||||||||
Sr. Unsecured, GMTN, | 275,000 | 275,966 | ||||||
State Street Corp., | ||||||||
Sr. Unsecured, | 225,000 | 232,046 | ||||||
State Street Corp., | ||||||||
Sr. Unsecured, | 500,000 | 545,831 | ||||||
Toronto-Dominion Bank (The), | ||||||||
Sr. Unsecured, MTN, | 370,000 | 370,485 | ||||||
US Bancorp, | ||||||||
Subordinated, MTN, | 300,000 | 302,023 | ||||||
|
| |||||||
TOTAL BANKS | $ | 4,557,121 | ||||||
BEVERAGES – 0.9% | ||||||||
Anheuser-Busch InBev Finance, Inc., |
| |||||||
Company Guaranteed, | 430,000 | 436,306 | ||||||
Anheuser-Busch InBev Finance, Inc., |
| |||||||
Company Guaranteed, | 600,000 | 633,992 | ||||||
|
| |||||||
TOTAL BEVERAGES | $ | 1,070,298 | ||||||
BIOTECHNOLOGY – 0.4% | ||||||||
Amgen, Inc., | ||||||||
Sr. Unsecured, | 500,000 | 504,896 | ||||||
CAPITAL MARKETS – 2.8% | ||||||||
BlackRock, Inc., | ||||||||
Sr. Unsecured, | 500,000 | 533,263 | ||||||
BlackRock, Inc., | ||||||||
Series 2, Sr. Unsecured, | 650,000 | 728,303 | ||||||
Charles Schwab Corp. (The), | ||||||||
Sr. Unsecured, | 650,000 | 653,284 | ||||||
Description | Par Value | Value | ||||||
Fifth Third Bancorp, | ||||||||
Subordinated, | $ | 370,000 | $ | 390,935 | ||||
Goldman Sachs Group, Inc. (The), | ||||||||
Sr. Unsecured, | 655,000 | 695,490 | ||||||
Goldman Sachs Group, Inc. (The), | ||||||||
Sr. Unsecured, | 500,000 | 500,570 | ||||||
|
| |||||||
TOTAL CAPITAL MARKETS | $ | 3,501,845 | ||||||
CHEMICALS – 0.4% | ||||||||
Ecolab, Inc., | ||||||||
Sr. Unsecured, | 450,000 | 455,478 | ||||||
COMMERCIAL BANKS – 2.8% |
| |||||||
HSBC USA, Inc., | ||||||||
Sr. Unsecured, | 220,000 | 221,489 | ||||||
Huntington National Bank (The), | ||||||||
Sr. Unsecured, | 350,000 | 347,954 | ||||||
Keycorp, | ||||||||
Sr. Unsecured, MTN, | 500,000 | 512,741 | ||||||
PNC Financial Services Group, Inc. (The), | ||||||||
Subordinated, | 420,000 | 446,478 | ||||||
SunTrust Banks, Inc., | ||||||||
Sr. Unsecured, | 600,000 | 610,714 | ||||||
Wells Fargo & Co., | ||||||||
Sr. Unsecured, MTN, | 200,000 | 203,673 | ||||||
Westpac Banking Corp., | ||||||||
Sr. Unsecured, | 575,000 | 580,839 | ||||||
Westpac Banking Corp., | ||||||||
Sr. Unsecured, | 500,000 | 553,236 | ||||||
|
| |||||||
TOTAL COMMERCIAL BANKS |
| $ | 3,477,124 | |||||
COMMERCIAL FINANCE – 0.6% |
| |||||||
General Electric Capital Corp., | ||||||||
Sr. Unsecured, MTN, | 750,000 | 761,537 | ||||||
COMMERCIAL SERVICES & SUPPLIES – 0.8% |
| |||||||
Total System Services, Inc., | ||||||||
Sr. Unsecured, | 450,000 | 450,470 | ||||||
Total System Services, Inc., | ||||||||
Sr. Unsecured, | 525,000 | 545,954 | ||||||
|
| |||||||
TOTAL COMMERCIAL SERVICES & |
| $ | 996,424 | |||||
COMPUTERS – 0.6% | ||||||||
HP Enterprise Co., | ||||||||
Company Guaranteed, | 750,000 | 758,709 | ||||||
CONSUMER FINANCE – 1.9% |
| |||||||
American Express Co., | ||||||||
Sr. Unsecured, | 750,000 | 796,932 | ||||||
American Express Co., | ||||||||
Sr. Unsecured, FRN, | 1,080,000 | 1,075,456 | ||||||
John Deere Capital Corp., | ||||||||
Sr. Unsecured, MTN, | 200,000 | 203,428 | ||||||
John Deere Capital Corp., | ||||||||
Sr. Unsecured, MTN, | 275,000 | 281,874 | ||||||
|
| |||||||
TOTAL CONSUMER FINANCE |
| $ | 2,357,690 | |||||
| April 30, 2016 / ANNUAL REPORT |
| PORTFOLIOS OF INVESTMENTS |
| 27 |
Wilmington Intermediate-Term Bond Fund (continued)
Description | Par Value | Value | ||||||
DIVERSIFIED FINANCIAL SERVICES – 4.4% |
| |||||||
Bank of America Corp., | ||||||||
Sr. Unsecured, | $ | 250,000 | $ | 251,207 | ||||
Bank of America Corp., | ||||||||
Sr. Unsecured, MTN, | 250,000 | 265,760 | ||||||
Citigroup, Inc., | ||||||||
Sr. Unsecured, | 600,000 | 600,958 | ||||||
Citigroup, Inc., | ||||||||
Subordinated, | 525,000 | 546,448 | ||||||
Ford Motor Credit Co. LLC, | ||||||||
Sr. Unsecured, | 750,000 | 756,897 | ||||||
Ford Motor Credit Co. LLC, | ||||||||
Sr. Unsecured, FRN, | 1,000,000 | 987,761 | ||||||
General Motors Financial Co., Inc., | ||||||||
Company Guaranteed, | 250,000 | 259,844 | ||||||
JPMorgan Chase & Co., | ||||||||
Sr. Unsecured, | 250,000 | 268,765 | ||||||
JPMorgan Chase & Co., | ||||||||
Sr. Unsecured, | 500,000 | 501,990 | ||||||
JPMorgan Chase & Co., | ||||||||
Sr. Unsecured, | 500,000 | 506,840 | ||||||
TD Ameritrade Holding Corp., | ||||||||
Sr. Unsecured, | 450,000 | 463,105 | ||||||
|
| |||||||
TOTAL DIVERSIFIED FINANCIAL |
| $ | 5,409,575 | |||||
ELECTRIC – 3.8% | ||||||||
CMS Energy Corp., | ||||||||
Sr. Unsecured, | 625,000 | 665,328 | ||||||
Dominion Resources Inc/VA, | ||||||||
Sr. Unsecured, | 470,000 | 494,147 | ||||||
Duke Energy Indiana, Inc., | ||||||||
1st Mortgage, | 670,000 | 721,791 | ||||||
Exelon Corp., | ||||||||
Sr. Unsecured, | 325,000 | 328,513 | ||||||
Exelon Generation Co. LLC, | ||||||||
Sr. Unsecured, | 200,000 | 212,432 | ||||||
FirstEnergy Transmission LLC, | ||||||||
Sr. Unsecured, | 750,000 | 796,188 | ||||||
NextEra Energy Capital Holdings, Inc., | ||||||||
Company Guaranteed, | 100,000 | 103,254 | ||||||
Southern California Edison Co., | ||||||||
Series B, 1st Mortgage, | 900,000 | 919,528 | ||||||
Southern Power Co., | ||||||||
Sr. Unsecured, | 205,000 | 206,453 | ||||||
WEC Energy Group, Inc., | ||||||||
Sr. Unsecured, | 300,000 | 307,482 | ||||||
|
| |||||||
TOTAL ELECTRIC | $ | 4,755,116 | ||||||
ELECTRONIC EQUIPMENT, INSTRUMENTS & COMPONENTS – 0.2% |
| |||||||
Emerson Electric Co., | ||||||||
Sr. Unsecured, | 275,000 | 281,445 | ||||||
FOOD – 0.5% | ||||||||
Kraft Foods Group, Inc., | ||||||||
Company Guaranteed, 2.25%, 6/05/17 | 150,000 | 151,452 | ||||||
Description | Par Value | Value | ||||||
Kroger Co., | ||||||||
Sr. Unsecured, | $ | 250,000 | $ | 255,276 | ||||
Kroger Co., | ||||||||
Sr. Unsecured, | 250,000 | 262,081 | ||||||
|
| |||||||
TOTAL FOOD | $ | 668,809 | ||||||
FOOD PRODUCTS – 0.2% | ||||||||
WM Wrigley Jr. Co., | ||||||||
Sr. Unsecured, | 250,000 | 250,588 | ||||||
FOREST PRODUCTS & PAPER – 0.5% |
| |||||||
International Paper Co., | ||||||||
Sr. Unsecured, | 500,000 | 556,879 | ||||||
HEALTH CARE EQUIPMENT & SUPPLIES – 0.3% |
| |||||||
Zimmer Biomet Holdings, Inc., | ||||||||
Sr. Unsecured, | 415,000 | 427,510 | ||||||
HEALTH CARE PROVIDERS & SERVICES – 0.4% |
| |||||||
Anthem, Inc., | ||||||||
Sr. Unsecured, | 500,000 | 503,678 | ||||||
HOME FURNISHINGS – 0.4% | ||||||||
Whirlpool Corp., | ||||||||
Sr. Unsecured, | 250,000 | 250,814 | ||||||
Whirlpool Corp., | ||||||||
Sr. Unsecured, | 220,000 | 223,993 | ||||||
|
| |||||||
TOTAL HOME FURNISHINGS | $ | 474,807 | ||||||
INSURANCE – 2.4% | ||||||||
American International Group, Inc., | ||||||||
Sr. Unsecured, | 400,000 | 406,330 | ||||||
Aon PLC, | ||||||||
Company Guaranteed, | 240,000 | 242,580 | ||||||
Aon PLC, | ||||||||
Company Guaranteed, | 250,000 | 258,805 | ||||||
Berkshire Hathaway, Inc., | ||||||||
Sr. Unsecured, | 175,000 | 180,513 | ||||||
Hartford Financial Services Group, Inc., | ||||||||
Sr. Unsecured, | 360,000 | 407,339 | ||||||
MetLife, Inc., | ||||||||
Sr. Unsecured, | 750,000 | 788,256 | ||||||
Prudential Financial, Inc., | ||||||||
Sr. Unsecured, MTN, | 650,000 | 693,953 | ||||||
|
| |||||||
TOTAL INSURANCE | $ | 2,977,776 | ||||||
MEDIA – 2.2% | ||||||||
CBS Corp., | ||||||||
Company Guaranteed, | 350,000 | 363,297 | ||||||
CCO Safari II LLC, | ||||||||
Sr. Secured, | 500,000 | 519,646 | ||||||
Comcast, Corp., | ||||||||
Company Guaranteed, | 265,000 | 274,037 | ||||||
Time Warner Cable, Inc., | ||||||||
Company Guaranteed, | 750,000 | 782,307 | ||||||
Viacom, Inc., | ||||||||
Sr. Unsecured, | 750,000 | 762,937 | ||||||
|
| |||||||
TOTAL MEDIA | $ | 2,702,224 | ||||||
| ANNUAL REPORT / April 30, 2016 |
| 28 |
| PORTFOLIOS OF INVESTMENTS |
Wilmington Intermediate-Term Bond Fund (continued)
Description | Par Value | Value | ||||||
MISCELLANEOUS MANUFACTURING – 1.8% |
| |||||||
General Electric Co., | ||||||||
Sr. Unsecured, | $ | 660,000 | $ | 704,819 | ||||
Ingersoll-Rand Global Holding Co. Ltd., | ||||||||
Company Guaranteed, | 330,000 | 358,859 | ||||||
Ingersoll-Rand Luxembourg Finance SA, | ||||||||
Company Guaranteed, 2.63%, 5/01/20 | 250,000 | 250,712 | ||||||
Textron, Inc., | ||||||||
Sr. Unsecured, | 425,000 | 436,423 | ||||||
Textron, Inc., | ||||||||
Sr. Unsecured, | 500,000 | 530,628 | ||||||
|
| |||||||
TOTAL MISCELLANEOUS |
| $ | 2,281,441 | |||||
OFFICE/BUSINESS EQUIPMENT – 0.5% |
| |||||||
Xerox Corp., | ||||||||
Sr. Unsecured, | 600,000 | 578,219 | ||||||
OIL & GAS – 3.2% |
| |||||||
BP Capital Markets PLC, | ||||||||
Company Guaranteed, | 250,000 | 251,240 | ||||||
ConocoPhillips Co., | ||||||||
Company Guaranteed, | 330,000 | 353,043 | ||||||
ConocoPhillips Co., | ||||||||
Company Guaranteed, | 80,000 | 74,604 | ||||||
Marathon Oil Corp., | ||||||||
Sr. Unsecured, | 550,000 | 574,671 | ||||||
Marathon Petroleum Corp., | ||||||||
Sr. Unsecured, | 125,000 | 120,287 | ||||||
Phillips 66, | ||||||||
Company Guaranteed, | 400,000 | 436,402 | ||||||
Schlumberger Holdings Corp., | ||||||||
Sr. Unsecured, | 370,000 | 375,285 | ||||||
Sempra Energy, | ||||||||
Sr. Unsecured, | 800,000 | 806,524 | ||||||
Shell International Finance BV, | ||||||||
Company Guaranteed, | 530,000 | 548,522 | ||||||
Total Capital International SA, | ||||||||
Company Guaranteed, | 450,000 | 439,120 | ||||||
|
| |||||||
TOTAL OIL & GAS | $ | 3,979,698 | ||||||
PHARMACEUTICALS – 1.8% |
| |||||||
AbbVie, Inc., | ||||||||
Sr. Unsecured, | 750,000 | 754,583 | ||||||
AbbVie, Inc., | ||||||||
Sr. Unsecured, | 300,000 | 305,434 | ||||||
Actavis Funding SCS, | ||||||||
Company Guaranteed, | 500,000 | 499,710 | ||||||
Cardinal Health, Inc., | ||||||||
Sr. Unsecured, | 350,000 | 363,985 | ||||||
Medco Health Solutions, Inc., | ||||||||
Company Guaranteed, | 250,000 | 265,349 | ||||||
|
| |||||||
TOTAL PHARMACEUTICALS | $ | 2,189,061 | ||||||
PIPELINES – 1.1% |
| |||||||
Energy Transfer Partners LP, | ||||||||
Sr. Unsecured, 4.15%, 10/01/20 | 500,000 | 496,651 | ||||||
Description | Par Value | Value | ||||||
Enterprise Products Operating LLC, | ||||||||
Company Guaranteed, | $ | 325,000 | $ | 331,317 | ||||
Kinder Morgan, Inc., | ||||||||
Company Guaranteed, | 525,000 | 519,824 | ||||||
|
| |||||||
TOTAL PIPELINES | $ | 1,347,792 | ||||||
REAL ESTATE INVESTMENT TRUSTS – 4.1% |
| |||||||
American Tower Corp., | ||||||||
Sr. Unsecured, 3.45%, 9/15/21 | 250,000 | 258,802 | ||||||
American Tower Corp., | ||||||||
Sr. Unsecured, 5.00%, 2/15/24 | 505,000 | 562,320 | ||||||
Digital Realty Trust LP, | ||||||||
Company Guaranteed, | 100,000 | 102,892 | ||||||
HCP, Inc., | ||||||||
Sr. Unsecured, 4.20%, 3/01/24 | 540,000 | 547,127 | ||||||
Health Care REIT, Inc., | ||||||||
Sr. Unsecured, 2.25%, 3/15/18 | 450,000 | 454,197 | ||||||
Healthcare Realty Trust, Inc., | ||||||||
Sr. Unsecured, 3.75%, 4/15/23 | 200,000 | 197,453 | ||||||
Healthcare Realty Trust, Inc., | ||||||||
Sr. Unsecured, 3.88%, 5/01/25 | 550,000 | 538,696 | ||||||
Mack-Cali Realty LP, | ||||||||
Sr. Unsecured, 2.50%, 12/15/17 | 250,000 | 251,383 | ||||||
ProLogis LP, | ||||||||
Company Guaranteed, | 500,000 | 524,224 | ||||||
Simon Property Group LP, | ||||||||
Sr. Unsecured, 2.15%, 9/15/17 | 500,000 | 505,936 | ||||||
Ventas Realty LP / Ventas Capital Corp., |
| |||||||
Company Guaranteed, | 550,000 | 554,762 | ||||||
Ventas Realty LP / Ventas Capital Corp., |
| |||||||
Company Guaranteed, | 250,000 | 267,185 | ||||||
Welltower, Inc., | ||||||||
Sr. Unsecured, 4.25%, 4/01/26 | 330,000 | 344,603 | ||||||
|
| |||||||
TOTAL REAL ESTATE INVESTMENT TRUSTS |
| $ | 5,109,580 | |||||
RETAIL – 0.5% |
| |||||||
CVS Health Corp., | ||||||||
Sr. Unsecured, 2.75%, 12/01/22 | 415,000 | 424,309 | ||||||
Walgreens Boots Alliance, Inc., | ||||||||
Sr. Unsecured, 3.30%, 11/18/21 | 225,000 | 234,065 | ||||||
|
| |||||||
TOTAL RETAIL | $ | 658,374 | ||||||
TELECOMMUNICATIONS – 1.1% |
| |||||||
AT&T, Inc., | ||||||||
Sr. Unsecured, 1.16%, 6/30/20D | 500,000 | 498,663 | ||||||
Verizon Communications, Inc., | ||||||||
Sr. Unsecured, 4.50%, 9/15/20 | 300,000 | 331,744 | ||||||
Verizon Communications, Inc., | ||||||||
Sr. Unsecured, FRN, | 525,000 | 525,889 | ||||||
|
| |||||||
TOTAL TELECOMMUNICATIONS |
| $ | 1,356,296 | |||||
TRANSPORTATION – 1.0% |
| |||||||
CSX Corp., | ||||||||
Sr. Unsecured, 4.25%, 6/01/21 | 500,000 | 547,297 | ||||||
| April 30, 2016 / ANNUAL REPORT |
| PORTFOLIOS OF INVESTMENTS |
| 29 |
Wilmington Intermediate-Term Bond Fund (continued)
Description | Par Value | Value | ||||||
FedEx Corp., | ||||||||
Company Guaranteed, 3.25%, 4/01/26 | $ | 200,000 | $ | 207,188 | ||||
Ryder System, Inc., | ||||||||
Sr. Unsecured, MTN, 2.50%, 3/01/18 | 500,000 | 506,803 | ||||||
|
| |||||||
TOTAL TRANSPORTATION |
| $ | 1,261,288 | |||||
TRUCKING & LEASING – 0.8% |
| |||||||
GATX Corp., | ||||||||
Sr. Unsecured, | 326,000 | 327,630 | ||||||
GATX Corp., | ||||||||
Sr. Unsecured, | 625,000 | 626,836 | ||||||
|
| |||||||
TOTAL TRUCKING & LEASING |
| $ | 954,466 | |||||
|
| |||||||
TOTAL CORPORATE BONDS |
| |||||||
(COST $59,543,819) | $ | 60,736,296 | ||||||
GOVERNMENT AGENCIES – 7.9% |
| |||||||
FEDERAL HOME LOAN BANK (FHLB) – 2.4% |
| |||||||
Series 1, 4.88%, 5/17/17 | 1,865,000 | 1,946,441 | ||||||
Series 917, 1.00%, 6/21/17 | 1,000,000 | 1,003,600 | ||||||
|
| |||||||
TOTAL FEDERAL HOME LOAN BANK (FHLB) |
| $ | 2,950,041 | |||||
FEDERAL HOME LOAN MORTGAGE CORPORATION (FHLMC) – 4.3% |
| |||||||
1.25%, 5/12/17 | 800,000 | 804,816 | ||||||
1.38%, 5/01/20 | 1,250,000 | 1,257,450 | ||||||
1.75%, 5/30/19 | 805,000 | 822,491 | ||||||
2.38%, 1/13/22 | 1,850,000 | 1,935,551 | ||||||
3.75%, 3/27/19 | 500,000 | 539,115 | ||||||
|
| |||||||
TOTAL FEDERAL HOME LOAN MORTGAGE CORPORATION (FHLMC) |
| $ | 5,359,423 | |||||
FEDERAL NATIONAL MORTGAGE ASSOCIATION (FNMA) – 1.2% |
| |||||||
1.75%, 9/12/19 | 1,475,000 | 1,507,978 | ||||||
|
| |||||||
TOTAL GOVERNMENT AGENCIES |
| |||||||
(COST $9,607,983) | $ | 9,817,442 | ||||||
MORTGAGE-BACKED SECURITIES – 1.7% |
| |||||||
FEDERAL HOME LOAN MORTGAGE CORPORATION (FHLMC) – 0.3% |
| |||||||
Pool A18401, | 68,442 | 78,485 | ||||||
Pool B19228, | 19,423 | 20,038 | ||||||
Pool C90293, | 67,361 | 74,356 | ||||||
Pool C90504, | 26,448 | 29,828 | ||||||
Pool E92817, | 33,794 | 34,329 | ||||||
Pool G01625, | 52,287 | 57,687 | ||||||
Pool G02390, | 16,998 | 19,406 | ||||||
Pool G08097, | 35,901 | 41,706 | ||||||
Pool G08193, | 53,143 | 60,645 | ||||||
Pool G11311, | 17,748 | 17,983 | ||||||
|
| |||||||
TOTAL FEDERAL HOME LOAN MORTGAGE CORPORATION (FHLMC) |
| $ | 434,463 | |||||
Description | Par Value | Value | ||||||
FEDERAL NATIONAL MORTGAGE ASSOCIATION (FNMA) – 1.1% |
| |||||||
Pool 254240, | $ | 61,535 | $ | 71,303 | ||||
Pool 254833, | 9,740 | 9,949 | ||||||
Pool 256639, | 41,637 | 46,228 | ||||||
Pool 256752, | 40,165 | 45,921 | ||||||
Pool 257007, | 71,067 | 81,239 | ||||||
Pool 612514, | 45,159 | 47,381 | ||||||
Pool 619054, | 7,370 | 7,456 | ||||||
Pool 629603, | 2,161 | 2,196 | ||||||
Pool 688996, | 9,578 | 9,965 | ||||||
Pool 745412, | 36,804 | 41,395 | ||||||
Pool 839291, | 3,584 | 3,710 | ||||||
Pool AE2520, | 940,048 | 987,417 | ||||||
|
| |||||||
TOTAL FEDERAL NATIONAL MORTGAGE ASSOCIATION (FNMA) |
| $ | 1,354,160 | |||||
GOVERNMENT NATIONAL MORTGAGE ASSOCIATION (GNMA) – 0.3% |
| |||||||
Pool 2616, | 52,104 | 59,782 | ||||||
Pool 2701, | 96,289 | 109,301 | ||||||
Pool 426727, | 7,638 | 8,117 | ||||||
Pool 780825, | 81,847 | 94,109 | ||||||
Pool 781231, | 45,000 | 52,487 | ||||||
|
| |||||||
TOTAL GOVERNMENT NATIONAL MORTGAGE ASSOCIATION (GNMA) |
| $ | 323,796 | |||||
|
| |||||||
TOTAL MORTGAGE-BACKED SECURITIES |
| |||||||
(COST $1,951,447) | $ | 2,112,419 | ||||||
U.S. TREASURY – 39.1% | ||||||||
U.S. TREASURY NOTES – 39.1% |
| |||||||
0.88%, 11/15/17 | 640,000 | 641,649 | ||||||
0.88%, 1/31/18 | 750,000 | 751,706 | ||||||
0.88%, 7/15/18 | 440,000 | 440,586 | ||||||
0.88%, 1/31/17 | 250,000 | 250,634 | ||||||
1.00%, 5/31/18 | 500,000 | 502,070 | ||||||
1.00%, 6/30/19 | 250,000 | 250,342 | ||||||
1.00%, 9/30/19 | 1,000,000 | 999,344 | ||||||
1.25%, 11/30/18 | 640,000 | 646,261 | ||||||
1.25%, 1/31/19 | 1,450,000 | 1,464,195 | ||||||
1.25%, 2/29/20 | 1,500,000 | 1,507,711 | ||||||
1.38%, 6/30/18 | 1,230,000 | 1,245,282 | ||||||
1.38%, 5/31/20 | 3,250,000 | 3,277,238 | ||||||
1.38%, 8/31/20 | 1,400,000 | 1,409,773 | ||||||
1.38%, 1/31/21 | 500,000 | 502,401 | ||||||
1.50%, 8/31/18 | 1,000,000 | 1,015,712 | ||||||
1.50%, 11/30/19 | 700,000 | 710,812 | ||||||
1.63%, 2/15/26 | 75,000 | 73,669 | ||||||
1.63%, 8/15/22 | 2,920,000 | 2,940,513 | ||||||
1.75%, 5/15/23 | 1,000,000 | 1,010,167 | ||||||
| ANNUAL REPORT / April 30, 2016 |
| 30 |
| PORTFOLIOS OF INVESTMENTS |
Wilmington Intermediate-Term Bond Fund (continued)
Description | Par Value | Value | ||||||
2.00%, 7/31/20 | $ | 1,500,000 | $ | 1,549,377 | ||||
2.00%, 11/15/21 | 455,000 | 469,422 | ||||||
2.00%, 2/15/22 | 500,000 | 515,695 | ||||||
2.00%, 2/15/23 | 2,000,000 | 2,054,388 | ||||||
2.00%, 2/15/25 | 1,003,000 | 1,021,698 | ||||||
2.00%, 8/15/25 | 1,700,000 | 1,729,053 | ||||||
2.13%, 1/31/21 | 1,500,000 | 1,558,535 | ||||||
2.13%, 6/30/21 | 625,000 | 649,786 | ||||||
2.13%, 9/30/21 | 1,000,000 | 1,038,570 | ||||||
2.13%, 6/30/22 | 1,900,000 | 1,968,565 | ||||||
2.13%, 5/15/25 | 1,425,000 | 1,465,379 | ||||||
2.13%, 8/15/21 | 825,000 | 857,334 | ||||||
2.25%, 11/15/25 | 1,035,000 | 1,074,366 | ||||||
2.38%, 8/15/24 | 750,000 | 787,648 | ||||||
2.50%, 8/15/23 | 1,200,000 | 1,273,338 | ||||||
2.50%, 5/15/24 | 1,000,000 | 1,060,506 | ||||||
2.63%, 8/15/20 | 1,500,000 | 1,588,287 | ||||||
2.63%, 11/15/20 | 1,200,000 | 1,272,324 | ||||||
2.75%, 2/15/19 | 1,500,000 | 1,577,269 | ||||||
2.75%, 11/15/23 | 2,000,000 | 2,158,181 | ||||||
3.13%, 5/15/21 | 550,000 | 598,539 | ||||||
3.63%, 2/15/20 | 500,000 | 547,104 | ||||||
4.00%, 8/15/18 | 1,000,000 | 1,074,151 | ||||||
4.25%, 11/15/17 | 500,000 | 526,915 | ||||||
4.75%, 8/15/17 | 400,000 | 420,902 | ||||||
|
| |||||||
TOTAL U.S. TREASURY NOTES |
| $ | 48,477,397 | |||||
|
| |||||||
TOTAL U.S. TREASURY | ||||||||
(COST $47,294,021) | $ | 48,477,397 | ||||||
|
Number of |
| ||||||
MONEY MARKET FUND – 1.9% |
| |||||||
Dreyfus Cash Management Fund, Institutional Shares, 0.27%^ | 2,266,481 | $ | 2,266,481 | |||||
|
| |||||||
TOTAL MONEY MARKET FUND |
| |||||||
(COST $2,266,481) | $ | 2,266,481 | ||||||
TOTAL INVESTMENTS IN SECURITIES – 99.6% |
| |||||||
(COST $120,688,930) | $ | 123,435,236 | ||||||
| Par Value | ||||||||
CASH COLLATERAL INVESTED FOR SECURITIES ON LOAN – 0.8% |
| |||||||
REPURCHASE AGREEMENTS – 0.8% |
| |||||||
BNP Paribas Securities Corp., 0.29%, dated 4/29/16, due 5/02/16, repurchase price $195,325, collateralized by U.S. Government & Treasury Securities 0.00% to 7.63%, maturing 5/26/16 to 5/15/45; total market value of $199,226. | $ | 195,320 | $ | 195,320 | ||||
Description | Par Value | Value | ||||||
Citigroup Global Markets, Inc., 0.30%, dated 4/29/16, due 5/02/16, repurchase price $195,325, collateralized by U.S. Government & Treasury Securities 0.00% to 9.00%, maturing 6/30/17 to 5/01/46; total market value of $199,227. | $ | 195,320 | $ | 195,320 | ||||
Daiwa Capital Markets America, 0.32%, dated 4/29/16, due 5/02/16, repurchase price $195,325, collateralized by U.S. Government & Treasury Securities 0.00% to 8.75%, maturing 5/05/16 to 9/09/49; total market value of $199,226. | 195,320 | 195,320 | ||||||
HSBC Securities USA, Inc., 0.27%, dated 4/29/16, due 5/02/16, repurchase price $195,324, collateralized by U.S. Government & Treasury Securities 0.00% to 7.25%, maturing 5/15/16 to 7/15/37; total market value of $199,227. | 195,320 | 195,320 | ||||||
Nomura Securities International, Inc., 0.32%, dated 4/29/16, due 5/02/16, repurchase price $195,325, collateralized by U.S. Government & Treasury Securities 0.00% to 9.50%, maturing 5/15/16 to 3/20/66; total market value of $199,226. | 195,320 | 195,320 | ||||||
TD Securities (USA) LLC 0.30% dated 4/29/16 due 5/02/16 repurchase price $51,394, collateralized by U.S. Government & Treasury Securities 1.38% to 4.50%, maturing 11/30/18 to 4/01/46; total market value of $52,421. | 51,393 | 51,393 | ||||||
|
| |||||||
TOTAL CASH COLLATERAL INVESTED FOR SECURITIES ON LOAN |
| |||||||
(COST $1,027,993) |
| $ | 1,027,993 | |||||
|
| |||||||
TOTAL INVESTMENTS – 100.4% |
| |||||||
(COST $121,716,923) |
| $ | 124,463,229 | |||||
COLLATERAL FOR SECURITIES ON |
| (1,027,993 | ) | |||||
OTHER ASSETS LESS LIABILITIES – 0.4% |
| 480,039 | ||||||
|
| |||||||
TOTAL NET ASSETS – 100.0% | $ | 123,915,275 | ||||||
|
| |||||||
| April 30, 2016 / ANNUAL REPORT |
| PORTFOLIOS OF INVESTMENTS |
| 31 |
Wilmington Intermediate-Term Bond Fund (concluded)
Cost of investments for Federal income tax purposes is $121,717,821. The net unrealized appreciation/(depreciation) of investments was $2,745,408. This consists of net unrealized appreciation from investment for those securities having an excess of value over cost of $2,866,868 and net unrealized depreciation from investments for those securities having an excess of cost over value of $121,460.
Various inputs are used in determining the value of the Fund’s investments. These inputs are summarized in the three broad levels listed below.
Level 1 – quoted prices in active markets for identical securities
Level 2 – other significant observable inputs (including quoted prices for similar securities, interest rates, prepayment speeds, credit risk, etc.)
Level 3 – significant unobservable inputs (including the Fund’s own assumptions in determining the fair value of investments)
The following is a summary of the inputs used as of April 30, 2016 in valuing the Fund’s assets carried at fair value:
|
| Level 1
|
|
| Level 2
|
|
| Level 3
|
|
| Total
|
| |||||
Investments in Securities | ||||||||||||||||
Asset-Backed Security | $ | — | $ | 25,201 | $ | — | $ | 25,201 | ||||||||
Corporate Bonds | — | 60,736,296 | — | 60,736,296 | ||||||||||||
Government Agencies | — | 9,817,442 | — | 9,817,442 | ||||||||||||
Mortgage-Backed Securities | — | 2,112,419 | — | 2,112,419 | ||||||||||||
U.S. Treasury | — | 48,477,397 | — | 48,477,397 | ||||||||||||
Money Market Fund | 2,266,481 | — | — | 2,266,481 | ||||||||||||
Repurchase Agreements | — | 1,027,993 | — | 1,027,993 | ||||||||||||
|
|
|
|
|
|
|
| |||||||||
Total | $ | 2,266,481 | $ | 122,196,748 | $ | — | $ | 124,463,229 | ||||||||
|
|
|
|
|
|
|
| |||||||||
| # | Security, or a portion thereof, is on loan. See Note 2 in Notes to Financial Statements. |
| ^ | 7-Day net yield. |
| D | Floating rate note with current rate and stated maturity date shown. |
| W | Denotes a restricted security that may be resold without restriction to “qualified institutional buyers” as defined in Rule 144A under the Securities Act of 1933 and that the Fund has determined to be liquid under criteria established by the Fund’s Board of Trustees. At April 30, 2016, these liquid restricted securities amounted to $3,477,002 representing 2.8% of total net assets. |
| ** | Represents less than 0.05%. |
The following acronyms are used throughout this Fund:
FHLB - Federal Home Loan Bank
FHLMC - Federal Home Loan Mortgage Corporation
FNMA - Federal National Mortgage Association
FRN - Floating Rate Note
GMTN - Global Medium Term Note
GNMA - Government National Mortgage Association
LLC - Limited Liability Corporation
LP - Limited Partnership
MTN - Medium Term Note
PLC - Public Limited Company
REIT - Real Estate Investment Trust
See Notes which are an integral part of the Financial Statements
| ANNUAL REPORT / April 30, 2016 |
| 32 |
PORTFOLIO OF INVESTMENTS SUMMARY TABLE
Wilmington Short-Term Bond Fund
At April 30, 2016, the Fund’s portfolio classifications were as follows (unaudited):
| Percentage of Total Net Assets | ||||
U.S. Treasury
| 19.2% | |||
Commercial Paper
| 12.4% | |||
Federal National Mortgage Association (FNMA)
| 6.6% | |||
Diversified Financial Services
| 5.9% | |||
Electric
| 4.9% | |||
Oil & Gas
| 4.9% | |||
Capital Markets
| 3.9% | |||
Commercial Banks
| 3.9% | |||
Federal Home Loan Mortgage Corporation (FHLMC)
| 3.1% | |||
Insurance
| 3.1% | |||
Media
| 2.8% | |||
Retail
| 2.5% | |||
Aerospace & Defense
| 2.3% | |||
Food Products
| 2.2% | |||
Consumer Finance
| 2.1% | |||
Automotive
| 1.8% | |||
Banks
| 1.6% | |||
Health Care Equipment & Supplies
| 1.3% | |||
Health Care Providers & Services
| 1.3% | |||
Pharmaceuticals
| 1.3% | |||
Biotechnology
| 1.2% | |||
Electronics
| 1.2% | |||
Utilities
| 1.2% | |||
Miscellaneous Manufacturing
| 1.2% | |||
Commercial Services & Supplies
| 1.1% | |||
Telecommunications
| 0.8% | |||
Electronic Equipment, Instruments & Components
| 0.6% | |||
Environmental Control
| 0.7% | |||
Government National Mortgage Association (GNMA)
| 0.6% | |||
Whole Loan
| 0.6% | |||
Beverages
| 0.6% | |||
Computers
| 0.6% | |||
Real Estate Investment Trusts
| 0.6% | |||
| Trucking & Leasing | 0.6% | |||
| Percentage of Total Net Assets | ||||
Auto Parts & Equipment
| 0.6% | |||
Home Furnishings
| 0.4% | |||
Commercial Mortgage-Backed Securities (CMBS)
| 0.3% | |||
Development
| 0.1% | |||
Cash Equivalents1
| 8.0% | |||
Other Assets and Liabilities – Net2
|
| (8.1 )%
|
| |
TOTAL | 100.0% | |||
| Credit Quality Diversification3 | Percentage of Total Net Assets | |||
U.S. Government Agency Securities
| 10.3% | |||
U.S. Treasury
| 19.2% | |||
AA / Aa
| 4.9% | |||
A / A
| 21.0% | |||
BBB / Baa
| 31.0% | |||
BB / Ba
| 0.9% | |||
D
| 0.4% | |||
Not Rated
| 20.4% | |||
Other Assets and Liabilities – Net2
|
| (8.1 )%
|
| |
TOTAL | 100.0% | |||
| (1) | Cash Equivalents include investments in a money market fund and repurchase agreements. |
| (2) | Assets, other than investments in securities, less liabilities. See Statements of Assets and Liabilities. |
| (3) | For financial reporting purposes, the Credit Quality Diversification table reflects the lowest rating assigned by either Moody’s Investors Service or Standard and Poor’s if the ratings differ. These rating agencies are independent, nationally recognized statistical rating organizations and are widely used. Investment grade ratings are credit ratings of BBB/Baa or higher. Below investment grade ratings are credit ratings of BB/Ba or lower. Investments designated as “Not Rated” are not rated by either rating agency and do not necessarily indicate low credit quality. Credit quality ratings are subject to change. |
PORTFOLIO OF INVESTMENTS
April 30, 2016
Description | Par Value | Value | ||||||
| ADJUSTABLE RATE MORTGAGE – 0.0%** | ||||||||
FEDERAL NATIONAL MORTGAGE ASSOCIATION (FNMA) – 0.0%** |
| |||||||
Pool 399251, 2.32%, 9/01/27D | $ | 50 | $ | 52 | ||||
|
| |||||||
TOTAL ADJUSTABLE RATE MORTGAGE |
| |||||||
(COST $50) | $ | 52 | ||||||
Description | Par Value | Value | ||||||
| ASSET-BACKED SECURITY – 0.0%** | ||||||||
WHOLE LOAN – 0.0%** |
| |||||||
SLM Private Education Loan Trust, |
| |||||||
Series 2011-A, Class A1, 1.43%, 10/15/24D | $ | 33,571 | $ | 33,601 | ||||
TOTAL ASSET-BACKED SECURITY |
| |||||||
(COST $33,571) | $ | 33,601 | ||||||
| April 30, 2016 / ANNUAL REPORT |
| PORTFOLIOS OF INVESTMENTS |
| 33 |
Wilmington Short-Term Bond Fund (continued)
Description | Par Value | Value | ||||||
COLLATERALIZED MORTGAGE OBLIGATIONS – 5.6% |
| |||||||
COMMERCIAL MORTGAGE-BACKED SECURITIES (CMBS) – 0.3% |
| |||||||
JPMorgan Chase Commercial Mortgage | ||||||||
Securities Trust, | ||||||||
Series 2007-CIBC18, Class A4, 5.44%, 6/12/47 | $ | 522,781 | 529,363 | |||||
FEDERAL HOME LOAN MORTGAGE CORPORATION |
| |||||||
Series 1988-6, Class C, 9.05%, 6/15/19 | 1,647 | 1,710 | ||||||
Series 1989-112, Class I, 6.50%, 1/15/21 | 951 | 1,007 | ||||||
Series 1990-136, Class E, 6.00%, 4/15/21 | 2,501 | 2,654 | ||||||
Series 1990-141, Class D, 5.00%, 5/15/21 | 1,025 | 1,069 | ||||||
Series 1993-1577, Class PK, 6.50%, 9/15/23 | 33,083 | 36,321 | ||||||
Series 1993-1644, Class K, 6.75%, 12/15/23 | 27,257 | 29,992 | ||||||
Series 1994-1686, Class PJ, 5.00%, 2/15/24 | 3,340 | 3,542 | ||||||
Series 2003-2649, Class KA, 4.50%, 7/15/18 | 40,349 | 41,517 | ||||||
Series 2011-3799, Class GK, 2.75%, 1/15/21 | 140,226 | 143,300 | ||||||
Series 2012-K710, Class A1, 1.44%, 1/25/19 | 1,452,333 | 1,458,484 | ||||||
Series 3893, Class DJ, 2.00%, 10/15/20 | 1,104,622 | 1,109,927 | ||||||
|
| |||||||
TOTAL FEDERAL HOME LOAN MORTGAGE CORPORATION (FHLMC) |
| $ | 2,829,523 | |||||
FEDERAL NATIONAL MORTGAGE ASSOCIATION (FNMA) – 2.6% |
| |||||||
Series 1993-113, Class PK, 6.50%, 7/25/23 | 31,806 | 35,754 | ||||||
Series 1993-127, Class H, 6.50%, 7/25/23 | 28,562 | 31,532 | ||||||
Series 1993-202, Class J, 6.50%, 11/25/23 | 16,561 | 18,336 | ||||||
Series 1994-3, Class PL, 5.50%, 1/25/24 | 32,838 | 36,189 | ||||||
Series 1994-55, Class H, 7.00%, 3/25/24 | 35,745 | 40,270 | ||||||
Series 2002-52, Class QA, 6.00%, 7/18/32 | 10,238 | 10,614 | ||||||
Series 2002-94, Class HQ, 4.50%, 1/25/18 | 289,377 | 295,328 | ||||||
Series 2003-3, Class BC, 5.00%, 2/25/18 | 230,183 | 236,742 | ||||||
Series 2009-70, Class NM, 3.25%, 8/25/19 | 585,475 | 596,354 | ||||||
Series 2011-66, Class QE, 2.00%, 7/25/21 | 496,709 | 500,574 | ||||||
Series 2011-71, Class DJ, 3.00%, 3/25/25 | 496,930 | 503,047 | ||||||
Series 2011-81, Class PA, 3.50%, 8/25/26 | 1,938,264 | 2,020,918 | ||||||
|
| |||||||
TOTAL FEDERAL NATIONAL MORTGAGE ASSOCIATION (FNMA) |
| $ | 4,325,658 | |||||
GOVERNMENT NATIONAL MORTGAGE ASSOCIATION (GNMA) – 0.4% |
| |||||||
Series 2005-44, Class PC, 5.00%, 12/20/33 | 254,461 | 258,176 | ||||||
Series 2010-17, Class K, 4.00%, 3/16/22 | 491,173 | 494,199 | ||||||
|
| |||||||
TOTAL GOVERNMENT NATIONAL MORTGAGE ASSOCIATION (GNMA) |
| $ | 752,375 | |||||
WHOLE LOAN – 0.6% |
| |||||||
Banc of America Mortgage Securities, Inc., |
| |||||||
Series 2004-A, Class 2A1, 2.78%, 2/25/34D | 201,274 | 198,331 | ||||||
Description | Par Value | Value | ||||||
Banc of America Mortgage Securities, Inc., | ||||||||
Series 2004-B, Class 2A1, 2.67%, 3/25/34D | $ | 135,891 | $ | 135,154 | ||||
IndyMac INDA Mortgage Loan Trust, | ||||||||
Series 2005-AR1, Class 2A1, | ||||||||
2.90%, 11/25/35D | 691,713 | 634,955 | ||||||
|
| |||||||
TOTAL WHOLE LOAN | $ | 968,440 | ||||||
|
| |||||||
TOTAL COLLATERALIZED MORTGAGE OBLIGATIONS |
| |||||||
(COST $9,647,610) | 9,405,359 | |||||||
COMMERCIAL PAPER – 12.4%¿ |
| |||||||
COMMERCIAL PAPER – 12.4% |
| |||||||
Alcoa, Inc., 1.00%, 5/02/16 | 1,000,000 | 999,946 | ||||||
Alcoa, Inc., 1.00%, 5/04/16 | 1,500,000 | 1,499,837 | ||||||
Alcoa, Inc., 1.00%, 5/05/16 | 3,000,000 | 2,999,592 | ||||||
Canadian Nalt Resources, 1.15%, 5/06/16 | 2,450,000 | 2,449,543 | ||||||
Canadian Natl Resources, 1.05%, 5/03/16 | 2,070,000 | 2,069,822 | ||||||
Entergy Corp., 0.87%, 5/02/16 | 2,930,000 | 2,929,862 | ||||||
Scana4, 1.03%, 5/09/16 | 2,000,000 | 1,999,495 | ||||||
Sempra Energy Global Ent., 0.87%, 5/04/16 | 3,000,000 | 2,999,717 | ||||||
SO, 0.77%, 5/04/16 | 1,935,000 | 1,934,839 | ||||||
Viacom, Inc., 1.07%, 5/11/16 | 1,000,000 | 999,679 | ||||||
|
| |||||||
TOTAL COMMERCIAL PAPER | $ | 20,882,332 | ||||||
|
| |||||||
TOTAL COMMERCIAL PAPER | ||||||||
(COST $20,882,880) | $ | 20,882,332 | ||||||
CORPORATE BONDS – 57.2% | ||||||||
AEROSPACE & DEFENSE – 2.3% |
| |||||||
L-3 Communications Corp., | ||||||||
Company Guaranteed, 3.95%, 11/15/16 | 1,746,000 | 1,768,942 | ||||||
Lockheed Martin Corp., Sr. Unsecured, 1.85%, 11/23/18 | 2,000,000 | 2,029,105 | ||||||
|
| |||||||
TOTAL AEROSPACE & DEFENSE | $ | 3,798,047 | ||||||
AUTO PARTS & EQUIPMENT – 0.6% |
| |||||||
Johnson Controls, Inc., Sr. Unsecured, 1.40%, 11/02/17 | 1,000,000 | 1,002,233 | ||||||
AUTOMOTIVE – 1.8% | ||||||||
Daimler Finance North America LLC, | ||||||||
Company Guaranteed, 1.38%, 8/01/17W | 2,000,000 | 2,000,726 | ||||||
Hyundai Capital America, Sr. Unsecured, 1.88%, 8/09/16W | 400,000 | 400,790 | ||||||
Toyota Motor Credit Corp., Sr. Unsecured, MTN, 0.87%, 3/12/20D | 693,000 | 685,249 | ||||||
|
| |||||||
TOTAL AUTOMOTIVE | $ | 3,086,765 | ||||||
| ANNUAL REPORT / April 30, 2016 |
| 34 |
| PORTFOLIOS OF INVESTMENT |
Wilmington Short-Term Bond Fund (continued)
Description | Par Value | Value | ||||||
BANKS – 1.6% | ||||||||
Branch Banking & Trust Co., | ||||||||
Sr. Unsecured, BKNT, 1.00%, 4/03/17 | $ | 1,500,000 | $ | 1,500,844 | ||||
Capital One NA, | ||||||||
Sr. Unsecured, BKNT, 1.50%, 9/05/17 | 1,200,000 | 1,197,343 | ||||||
|
| |||||||
TOTAL BANKS | $ | 2,698,187 | ||||||
BEVERAGES – 0.6% | ||||||||
Anheuser-Busch InBev Finance, Inc., | ||||||||
Company Guaranteed, 1.90%, 2/01/19 | 1,000,000 | 1,014,665 | ||||||
BIOTECHNOLOGY – 1.2% |
| |||||||
Celgene Corp., | ||||||||
Sr. Unsecured, 2.13%, 8/15/18 | 1,225,000 | 1,244,060 | ||||||
Gilead Sciences, Inc., | ||||||||
Sr. Unsecured, 1.85%, 9/04/18 | 785,000 | 800,001 | ||||||
|
| |||||||
TOTAL BIOTECHNOLOGY | $ | 2,044,061 | ||||||
CAPITAL MARKETS – 3.9% |
| |||||||
Caterpillar Financial Services Corp., | 1,000,000 | 1,009,439 | ||||||
Charles Schwab Corp. (The), | ||||||||
Sr. Unsecured, 1.50%, 3/10/18 | 1,975,000 | 1,984,977 | ||||||
Fifth Third Bancorp, | ||||||||
Subordinated, 5.45%, 1/15/17 | 2,500,000 | 2,567,686 | ||||||
Goldman Sachs Group, Inc. (The), | ||||||||
Sr. Unsecured, 2.63%, 4/25/21 | 1,000,000 | 1,005,444 | ||||||
|
| |||||||
TOTAL CAPITAL MARKETS | $ | 6,567,546 | ||||||
COMMERCIAL BANKS – 3.9% |
| |||||||
Huntington National Bank (The), | ||||||||
Sr. Unsecured, 1.38%, 4/24/17 | 2,000,000 | 2,003,801 | ||||||
KeyBank N.A./Cleveland OH, | ||||||||
Subordinated, BKNT, 5.70%, 11/01/17 | 900,000 | 953,589 | ||||||
KeyBank NA/Cleveland OH, | ||||||||
Sr. Unsecured, BKNT, 2.35%, 3/08/19 | 1,650,000 | 1,670,522 | ||||||
PNC Bank NA, | ||||||||
Sr. Unsecured, BKNT, 1.95%, 3/04/19 | 700,000 | 707,857 | ||||||
US Bank NA/Cincinnati OH, | ||||||||
Sr. Unsecured, BKNT, 1.40%, 4/26/19 | 1,150,000 | 1,150,890 | ||||||
|
| |||||||
TOTAL COMMERCIAL BANKS |
| $ | 6,486,659 | |||||
COMMERCIAL SERVICES & SUPPLIES – 1.1% |
| |||||||
Total System Services, Inc., | ||||||||
Sr. Unsecured, 2.38%, 6/01/18 | 1,900,000 | 1,901,984 | ||||||
COMPUTERS – 0.6% | ||||||||
HP Enterprise Co., | ||||||||
Sr. Unsecured, 2.45%, 10/05/17W | 1,000,000 | 1,011,612 | ||||||
CONSUMER FINANCE – 2.1% |
| |||||||
John Deere Capital Corp., | ||||||||
Sr. Unsecured, MTN, 1.05%, 12/15/16 | 2,500,000 | 2,504,530 | ||||||
John Deere Capital Corp., | ||||||||
Sr. Unsecured, MTN, 1.95%, 1/08/19# | 950,000 | 966,282 | ||||||
|
| |||||||
TOTAL CONSUMER FINANCE |
| $ | 3,470,812 | |||||
Description | Par Value | Value | ||||||
DIVERSIFIED FINANCIAL SERVICES – 5.9% |
| |||||||
American Express Credit Corp., | ||||||||
Sr. Unsecured, 1.08%, 3/18/19D | $ | 800,000 | $ | 791,472 | ||||
Bank of New York Mellon Corp., | ||||||||
Sr. Unsecured, MTN, 2.45%, 11/27/20 | 2,000,000 | 2,048,048 | ||||||
Citigroup, Inc., | ||||||||
Sr. Unsecured, 2.15%, 7/30/18 | 915,000 | 922,132 | ||||||
Citigroup, Inc., | ||||||||
Sr. Unsecured, 2.05%, 12/07/18 | 2,000,000 | 2,014,228 | ||||||
Ford Motor Credit Co. LLC, | ||||||||
Sr. Unsecured, FRN, 1.33%, 3/12/19D | 1,000,000 | 987,761 | ||||||
General Motors Financial Co., Inc., | ||||||||
Company Guaranteed, 4.75%, 8/15/17 | 1,000,000 | 1,039,375 | ||||||
JPMorgan Chase & Co., | ||||||||
Sr. Unsecured, FRN, 1.25%, 1/28/19D | 1,000,000 | 996,714 | ||||||
Morgan Stanley, | ||||||||
Sr. Unsecured, GMTN, 2.45%, 2/01/19 | 1,100,000 | 1,117,421 | ||||||
|
| |||||||
TOTAL DIVERSIFIED FINANCIAL SERVICES |
| $ | 9,917,151 | |||||
ELECTRIC – 4.9% | ||||||||
Appalachian Power Co., | ||||||||
Sr. Unsecured, K, 5.00%, 6/01/17 | 1,000,000 | 1,039,441 | ||||||
Entergy Corp., | ||||||||
Sr. Unsecured, 4.70%, 1/15/17 | 2,000,000 | 2,034,728 | ||||||
Exelon Generation Co. LLC, | ||||||||
Sr. Unsecured, 6.20%, 10/01/17 | 1,505,000 | 1,598,547 | ||||||
Georgia Power Co., | ||||||||
Sr. Unsecured, 1.95%, 12/01/18 | 2,000,000 | 2,022,588 | ||||||
NextEra Energy Capital Holdings, Inc., | ||||||||
Company Guaranteed, 2.30%, 4/01/19 | 600,000 | 607,634 | ||||||
Southern Power Co., | ||||||||
Sr. Unsecured, 1.85%, 12/01/17 | 1,000,000 | 1,007,090 | ||||||
|
| |||||||
TOTAL ELECTRIC | $ | 8,310,028 | ||||||
ELECTRONIC EQUIPMENT, INSTRUMENTS & COMPONENTS – 0.6% |
| |||||||
Emerson Electric Co., | ||||||||
Sr. Unsecured, 5.25%, 10/15/18 | 1,000,000 | 1,095,375 | ||||||
ELECTRONICS – 1.2% |
| |||||||
Thermo Fisher Scientific, Inc., | ||||||||
Sr. Unsecured, 1.30%, 2/01/17 | 2,000,000 | 1,999,852 | ||||||
ENVIRONMENTAL CONTROL – 0.7% |
| |||||||
Waste Management, Inc., | ||||||||
Company Guaranteed, 2.60%, 9/01/16 | 1,100,000 | 1,105,717 | ||||||
FOOD PRODUCTS – 2.2% |
| |||||||
Hershey Co. (The), | ||||||||
Sr. Unsecured, 1.60%, 8/21/18 | 1,000,000 | 1,012,701 | ||||||
Kroger Co., | ||||||||
Sr. Unsecured, 1.20%, 10/17/16 | 2,600,000 | 2,604,646 | ||||||
WM Wrigley Jr. Co., | ||||||||
Sr. Unsecured, 1.40%, 10/21/16W | 160,000 | 160,376 | ||||||
|
| |||||||
TOTAL FOOD PRODUCTS | $ | 3,777,723 | ||||||
| April 30, 2016 / ANNUAL REPORT |
| PORTFOLIOS OF INVESTMENT |
| 35 |
Wilmington Short-Term Bond Fund (continued)
Description | Par Value | Value | ||||||
HEALTH CARE EQUIPMENT & SUPPLIES – 1.3% |
| |||||||
Becton Dickinson and Co., | ||||||||
Sr. Unsecured, 1.45%, 5/15/17 | $ | 1,000,000 | $ | 1,002,359 | ||||
Zimmer Holdings, Inc., | ||||||||
Sr. Unsecured, 1.45%, 4/01/17 | 1,135,000 | 1,136,338 | ||||||
|
| |||||||
TOTAL HEALTH CARE EQUIPMENT & SUPPLIES |
| $ | 2,138,697 | |||||
HEALTH CARE PROVIDERS & SERVICES – 1.3% |
| |||||||
Anthem, Inc., | ||||||||
Sr. Unsecured, 2.38%, 2/15/17 | 1,000,000 | 1,007,356 | ||||||
UnitedHealth Group, Inc., | ||||||||
Sr. Unsecured, 1.90%, 7/16/18 | 1,110,000 | 1,130,637 | ||||||
|
| |||||||
TOTAL HEALTH CARE PROVIDERS & SERVICES |
| $ | 2,137,993 | |||||
HOME FURNISHINGS – 0.4% |
| |||||||
Whirlpool Corp., | ||||||||
Sr. Unsecured, 6.50%, 6/15/16 | 750,000 | 754,675 | ||||||
INSURANCE – 3.1% |
| |||||||
American International Group, Inc., | ||||||||
Sr. Unsecured, 3.30%, 3/01/21 | 1,160,000 | 1,196,543 | ||||||
Berkshire Hathaway Finance Corp., | ||||||||
Company Guaranteed, 1.60%, 5/15/17 | 2,000,000 | 2,018,084 | ||||||
Metropolitan Life Global Funding I, | ||||||||
Sr. Secured, 1.95%, 12/03/18W | 1,000,000 | 1,010,876 | ||||||
Principal Financial Group, Inc., | ||||||||
Company Guaranteed, 1.85%, 11/15/17 | 1,074,000 | 1,075,892 | ||||||
|
| |||||||
TOTAL INSURANCE | $ | 5,301,395 | ||||||
MEDIA – 2.8% |
| |||||||
CBS Corp., | ||||||||
Company Guaranteed, 4.63%, 5/15/18 | 1,000,000 | 1,055,889 | ||||||
Comcast Corp., | ||||||||
Company Guaranteed, 5.70%, 7/01/19 | 2,500,000 | 2,832,736 | ||||||
Walt Disney Co., | ||||||||
Sr. Unsecured, 1.65%, 1/08/19# | 750,000 | 762,622 | ||||||
|
| |||||||
TOTAL MEDIA | $ | 4,651,247 | ||||||
MISCELLANEOUS MANUFACTURING – 1.2% |
| |||||||
General Electric Co., | ||||||||
Sr. Unsecured, 1.51%, 3/15/23D | 2,000,000 | 1,999,170 | ||||||
OIL & GAS – 4.9% |
| |||||||
Anadarko Petroleum Corp., | ||||||||
Sr. Unsecured, 6.38%, 9/15/17 | 190,000 | 202,727 | ||||||
BP Capital Markets PLC, | ||||||||
Company Guaranteed, 1.68%, 5/03/19 | 950,000 | 952,213 | ||||||
Chevron Corp., | ||||||||
Sr. Unsecured, 1.34%, 11/09/17 | 1,500,000 | 1,517,176 | ||||||
ConocoPhillips, | ||||||||
Company Guaranteed, 5.75%, 2/01/19 | 1,000,000 | 1,104,713 | ||||||
Exxon Mobil Corp., | ||||||||
Sr. Unsecured, 1.71%, 3/01/19 | 1,155,000 | 1,169,927 | ||||||
Husky Oil Ltd., | ||||||||
Sr. Unsecured, 7.55%, 11/15/16 | 221,000 | 224,519 | ||||||
Phillips 66, | ||||||||
Company Guaranteed, 2.95%, 5/01/17 | 1,000,000 | 1,020,207 | ||||||
Description | Par Value | Value | ||||||
Schlumberger Holdings Corp., | ||||||||
Sr. Unsecured, 1.90%, 12/21/17W | $ | 1,000,000 | $ | 997,976 | ||||
Schlumberger Holdings Corp., | ||||||||
Sr. Unsecured, 2.35%, 12/21/18W | 1,000,000 | 1,014,284 | ||||||
|
| |||||||
TOTAL OIL & GAS | $ | 8,203,742 | ||||||
PHARMACEUTICALS – 1.3% |
| |||||||
AbbVie, Inc., | ||||||||
Sr. Unsecured, 1.75%, 11/06/17 | 1,000,000 | 1,006,110 | ||||||
Pfizer, Inc., | ||||||||
Sr. Unsecured, 6.20%, 3/15/19 | 1,000,000 | 1,134,468 | ||||||
|
| |||||||
TOTAL PHARMACEUTICALS | $ | 2,140,578 | ||||||
REAL ESTATE INVESTMENT TRUSTS – 0.6% |
| |||||||
Ventas Realty LP, | ||||||||
Company Guaranteed, 1.55%, 9/26/16 | 1,000,000 | 1,001,700 | ||||||
RETAIL – 2.5% |
| |||||||
CVS Health Corp., | ||||||||
Sr. Unsecured, 1.20%, 12/05/16 | 2,200,000 | 2,205,001 | ||||||
CVS Health Corp., | ||||||||
Sr. Unsecured, 1.90%, 7/20/18 | 1,000,000 | 1,014,152 | ||||||
McDonald’s Corp., | ||||||||
Sr. Unsecured, 2.75%, 12/09/20# | 1,000,000 | 1,037,414 | ||||||
|
| |||||||
TOTAL RETAIL | $ | 4,256,567 | ||||||
TELECOMMUNICATIONS – 0.8% |
| |||||||
AT&T, Inc., | ||||||||
Sr. Unsecured, 1.53%, 6/30/20D | 900,000 | 897,593 | ||||||
Cisco Systems, Inc., | ||||||||
Sr. Unsecured, 1.10%, 3/03/17 | 490,000 | 491,645 | ||||||
|
| |||||||
TOTAL TELECOMMUNICATIONS |
| $ | 1,389,238 | |||||
TRUCKING & LEASING – 0.6% |
| |||||||
GATX Corp., | ||||||||
Sr. Unsecured, 2.38%, 7/30/18 | 1,000,000 | 1,002,938 | ||||||
UTILITIES – 1.2% |
| |||||||
WEC Energy Group, Inc., | ||||||||
Sr. Unsecured, 2.45%, 6/15/20 | 2,050,000 | 2,101,125 | ||||||
|
| |||||||
TOTAL CORPORATE BONDS |
| |||||||
(COST $95,740,282) | $ | 96,367,482 | ||||||
GOVERNMENT AGENCIES – 0.0%** |
| |||||||
SMALL BUSINESS ADMINISTRATION – 0.0%** |
| |||||||
Small Business Administration Participation | ||||||||
Certificates, U.S. Government Guaranteed, | ||||||||
Series 1996-K, 6.95%, 11/01/16 | 23,903 | 24,412 | ||||||
Small Business Administration Participation | ||||||||
Certificates, U.S. Government Guaranteed, | ||||||||
Series 1996-L, 6.70%, 12/01/16 | 14,724 | 14,897 | ||||||
Small Business Administration Participation | ||||||||
Certificates, U.S. Government Guaranteed, | ||||||||
Series 1997-E, 7.30%, 5/01/17 | 575 | 592 | ||||||
ANNUAL REPORT / April 30, 2016 |
| 36 |
| PORTFOLIOS OF INVESTMENT |
Wilmington Short-Term Bond Fund (continued)
Description | Par Value | Value | ||||||
Small Business Administration Participation | ||||||||
Certificates, U.S. Government Guaranteed, | ||||||||
Series 1999-I, 7.30%, 9/01/19 | $ | 2,747 | $ | 2,948 | ||||
|
| |||||||
TOTAL SMALL BUSINESS ADMINISTRATION | $ | 42,849 | ||||||
|
| |||||||
TOTAL GOVERNMENT AGENCIES |
| |||||||
(COST $42,332) | $ | 42,849 | ||||||
MORTGAGE-BACKED SECURITIES – 5.6% |
| |||||||
FEDERAL HOME LOAN MORTGAGE CORPORATION (FHLMC) – 1.4% |
| |||||||
Pool 287773, | 175 | 180 | ||||||
Pool 538733, | 190 | 196 | ||||||
Pool A18401, | 564,041 | 646,812 | ||||||
Pool C78010, | 736,994 | 832,669 | ||||||
Pool C80328, | 25,895 | 30,265 | ||||||
Pool G01425, | 61,859 | 72,493 | ||||||
Pool G01831, | 130,180 | 148,730 | ||||||
Pool G12709, | 99,117 | 102,895 | ||||||
Pool G14695, | 474,727 | 491,599 | ||||||
|
| |||||||
TOTAL FEDERAL HOME LOAN MORTGAGE CORPORATION (FHLMC) |
| $ | 2,325,839 | |||||
FEDERAL NATIONAL MORTGAGE ASSOCIATION (FNMA) – 4.0% |
| |||||||
Pool 202957, | 1,284 | 1,341 | ||||||
Pool 252439, | 24,010 | 27,733 | ||||||
Pool 255933, | 123,221 | 138,667 | ||||||
Pool 323419, | 48,205 | 55,145 | ||||||
Pool 334593, | 51,859 | 60,073 | ||||||
Pool 39862, | 2,221 | 2,327 | ||||||
Pool 436746, | 24,049 | 25,351 | ||||||
Pool 440401, | 137,132 | 158,640 | ||||||
Pool 485678, | 28,882 | 31,203 | ||||||
Pool 494375, 6.50%, 4/01/29 | 2,057 | 2,122 | ||||||
Pool 545051, | 69,177 | 79,174 | ||||||
Pool 725418, | 122,183 | 141,148 | ||||||
Pool 833143, | 615,670 | 691,760 | ||||||
Pool 843323, | 60,665 | 68,143 | ||||||
Pool AE2520, | 313,349 | 329,139 | ||||||
Pool MA0909, | 556,114 | 583,936 | ||||||
Pool MA0921, | 4,054,432 | 4,257,217 | ||||||
|
| |||||||
TOTAL FEDERAL NATIONAL MORTGAGE ASSOCIATION (FNMA) |
| $ | 6,653,119 | |||||
GOVERNMENT NATIONAL MORTGAGE ASSOCIATION (GNMA) – 0.2% |
| |||||||
Pool 1061, | 12,383 | 12,884 | ||||||
Pool 1886, | 241 | 250 | ||||||
Pool 188603, | 1,135 | 1,160 | ||||||
Pool 208196, | 2,121 | 2,169 | ||||||
Pool 306066, | 2,770 | 3,222 | ||||||
Pool 307983, | 12,296 | 12,678 | ||||||
Pool 341948, | 2,395 | 2,462 | ||||||
Description | Par Value | Value | ||||||
Pool 346572, | $ | 6,061 | $ | 6,434 | ||||
Pool 484269, | 23,548 | 24,863 | ||||||
Pool 581522, | 137,550 | 146,865 | ||||||
Pool 592505, | 142,094 | 152,749 | ||||||
Pool 780440, | 212 | 218 | ||||||
|
| |||||||
TOTAL GOVERNMENT NATIONAL MORTGAGE ASSOCIATION (GNMA) |
| $ | 365,954 | |||||
|
| |||||||
TOTAL MORTGAGE-BACKED SECURITIES |
| |||||||
(COST $8,982,827) | $ | 9,344,912 | ||||||
MUNICIPAL BOND – 0.1% | ||||||||
DEVELOPMENT – 0.1% | ||||||||
City of Miami, FL, Rent Revenue, | ||||||||
Series 1998, 8.65%, 7/01/19 | 100,000 | 111,832 | ||||||
|
| |||||||
TOTAL MUNICIPAL BOND | ||||||||
(COST $105,268) | $ | 111,832 | ||||||
U.S. TREASURY – 19.2% | ||||||||
U.S. TREASURY NOTES – 19.2% |
| |||||||
0.88%, 4/15/19 | 2,640,000 | 2,636,575 | ||||||
1.00%, 5/15/18 | 5,880,000 | 5,904,333 | ||||||
1.00%, 3/15/19# | 7,625,000 | 7,644,872 | ||||||
1.13%, 6/15/18 | 8,430,000 | 8,488,623 | ||||||
1.13%, 2/28/21 | 2,285,000 | 2,270,271 | ||||||
1.25%, 3/31/21# | 4,000,000 | 3,994,224 | ||||||
1.38%, 6/30/18 | 1,300,000 | 1,316,152 | ||||||
|
| |||||||
TOTAL U.S. TREASURY NOTES |
| $ | 32,255,050 | |||||
|
| |||||||
TOTAL U.S. TREASURY | ||||||||
(COST $32,166,958)
| $
| 32,255,050
|
| |||||
|
| Number of Shares |
| ||||||
MONEY MARKET FUND – 0.0%** |
| |||||||
Dreyfus Cash Management Fund, Institutional Shares, 0.27%^ | 6,641 | $ | 6,641 | |||||
|
| |||||||
TOTAL MONEY MARKET FUND | ||||||||
(COST $6,641) | $ | 6,641 | ||||||
|
| |||||||
TOTAL INVESTMENTS IN SECURITIES – 100.1% |
| |||||||
(COST $167,608,419) | $ | 168,450,110 | ||||||
| April 30, 2016 / ANNUAL REPORT |
| PORTFOLIOS OF INVESTMENT |
| 37 |
Wilmington Short-Term Bond Fund (continued)
Description | Par Value | Value | ||||||
| CASH COLLATERAL INVESTED FOR SECURITIES ON LOAN – 8.0% | ||||||||
REPURCHASE AGREEMENTS – 8.0% |
| |||||||
BNP Paribas Securities Corp., 0.29%, dated 4/29/16, due 5/02/16, repurchase price $2,556,460, collateralized by U.S. Government & Treasury Securities 0.00% to 7.63%, maturing 5/26/16 to 5/15/45; total market value of $2,607,526. | $ | 2,556,398 | $ | 2,556,398 | ||||
Citigroup Global Markets, Inc., 0.30%, dated | ||||||||
4/29/16, due 5/02/16, repurchase price | ||||||||
$2,556,462, collateralized by U.S. Government & Treasury Securities 0.00% to 9.00%, maturing 6/30/17 to 5/01/46; total market value of $2,607,526. | 2,556,398 | 2,556,398 | ||||||
Daiwa Capital Markets America, 0.32%,dated 4/29/16, due 5/02/16, repurchase price $2,556,466, collateralized by U.S. Government & Treasury Securities 0.00% to 8.75%, maturing 5/05/16 to 9/09/49; total market value of $2,607,526. | 2,556,398 | 2,556,398 | ||||||
HSBC Securities USA, Inc., 0.27%, dated | ||||||||
4/29/16, due 5/02/16, repurchase price | ||||||||
$2,556,456, collateralized by U.S. Government & Treasury Securities 0.00% to 7.25%, maturing 5/15/16 to 7/15/37; total market value of $2,607,532. | 2,556,398 | 2,556,398 | ||||||
Nomura Securities International, Inc., | ||||||||
0.32%, dated 4/29/16, due 5/02/16,repurchase price $2,556,466, collateralized by U.S. Government & Treasury Securities | ||||||||
0.00% to 9.50%, maturing 5/15/16 to 3/20/66; total market value of $2,607,526. | 2,556,398 | 2,556,398 | ||||||
TD Securities (USA) LLC, 0.30%, dated | ||||||||
4/29/16, due 5/02/16, repurchase price | ||||||||
$672,652, collateralized by U.S. Government & Treasury Securities 1.38% to 4.50%, maturing 11/30/18 to 4/01/46; total market value of $686,088. | 672,635 | 672,635 | ||||||
|
| |||||||
| TOTAL CASH COLLATERAL INVESTED FOR SECURITIES ON LOAN | ||||||||
(COST $13,454,625) | $ | 13,454,625 | ||||||
|
| |||||||
TOTAL INVESTMENTS – 108.1% |
| |||||||
(COST $181,063,044) | $ | 181,904,735 | ||||||
| COLLATERAL FOR SECURITIES ON LOAN – (8.0%) | (13,454,625 | ) | ||||||
| OTHER LIABILITIES LESS ASSETS – (0.1%) | (113,204 | ) | ||||||
|
| |||||||
TOTAL NET ASSETS – 100.0% |
| $ | 168,336,906 | |||||
|
| |||||||
Cost of investments for Federal income tax purposes is $181,065,139. The net unrealized appreciation/(depreciation) of investments was $839,596. This consists of net unrealized appreciation from investment for those securities having an excess of value over cost of $1,228,776 and net unrealized depreciation from investments for those securities having an excess of cost over value of $389,180.
ANNUAL REPORT / April 30, 2016 |
| 38 |
| PORTFOLIOS OF INVESTMENTS |
Wilmington Short-Term Bond Fund (concluded)
Various inputs are used in determining the value of the Fund’s investments. These inputs are summarized in the three broad levels listed below.
Level 1 – quoted prices in active markets for identical securities
Level 2 – other significant observable inputs (including quoted prices for similar securities, interest rates, prepayment speeds, credit risk, etc.)
Level 3 – significant unobservable inputs (including the Fund’s own assumptions in determining the fair value of investments)
The following is a summary of the inputs used as of April 30, 2016 in valuing the Fund’s assets carried at fair value:
|
| Level 1
|
|
| Level 2
|
|
| Level 3
|
|
| Total
|
| |||||
Investments in Securities | ||||||||||||||||
Adjustable Rate Mortgage | $ | — | $ | 52 | $ | — | $ | 52 | ||||||||
Asset-Backed Security | — | 33,601 | — | 33,601 | ||||||||||||
Collateralized Mortgage Obligations | — | 9,405,359 | — | 9,405,359 | ||||||||||||
Commercial Paper | — | 20,882,332 | — | 20,882,332 | ||||||||||||
Corporate Bonds | — | 96,367,482 | — | 96,367,482 | ||||||||||||
Government Agencies | — | 42,849 | — | 42,849 | ||||||||||||
Mortgage-Backed Securities | — | 9,344,912 | — | 9,344,912 | ||||||||||||
Municipal Bond | — | 111,832 | — | 111,832 | ||||||||||||
U.S. Treasury | — | 32,255,050 | — | 32,255,050 | ||||||||||||
Money Market Fund | 6,641 | — | — | 6,641 | ||||||||||||
Repurchase Agreements | — | 13,454,625 | — | 13,454,625 | ||||||||||||
|
|
|
|
|
|
|
| |||||||||
Total | $ | 6,641 | $ | 181,898,094 | $ | — | $ | 181,904,735 | ||||||||
|
|
|
|
|
|
|
| |||||||||
| # | Security, or a portion thereof, is on loan. See Note 2 in Notes to Financial Statements. |
| ^ | 7-Day net yield. |
| D | Floating rate note with current rate and stated maturity date shown. |
| W | Denotes a restricted security that may be resold without restriction to “qualified institutional buyers” as defined in Rule 144A under the Securities Act of 1933 and that the Fund has determined to be liquid under criteria established by the Fund’s Board of Trustees. At April 30, 2016, these liquid restricted securities amounted to $6,596,640 representing 3.9% of total net assets. |
| ** | Represents less than 0.05%. |
| ¿The rate shown reflects the effective yield at purchase date. |
The following acronyms are used throughout this Fund:
BKNT - Bank Note
CMBS - Commercial Mortgage-Backed Securities
FHLMC - Federal Home Loan Mortgage Corporation
FNMA - Federal National Mortgage Association
FRN - Floating Rate Note
GNMA - Government National Mortgage Association
LLC - Limited Liability Corporation
LP - Limited Partnership
MTN - Medium Term Note
NA - North America
PLC - Public Limited Company
See Notes which are an integral part of the Financial Statements
| April 30, 2016 / ANNUAL REPORT |
| 39 |
PORTFOLIO OF INVESTMENTS SUMMARY TABLE
Wilmington Municipal Bond Fund
At April 30, 2016, the Fund’s portfolio composition was as follows (unaudited):
| Percentage of Total Net Assets | |||||
General Obligations | 19.0 | % | |||
Transportation | 15.0 | % | |||
School District | 11.9 | % | |||
Medical | 10.7 | % | |||
Dedicated Tax | 10.4 | % | |||
Lease | 5.8 | % | |||
Higher Education | 5.5 | % | |||
Water & Sewer | 4.2 | % | |||
Pre-Refunded/Escrow | 4.0 | % | |||
Utilities | 2.4 | % | |||
Electric | 2.3 | % | |||
Airport | 1.8 | % | |||
Water | 1.5 | % | |||
General | 1.1 | % | |||
Facilities | 0.7 | % | |||
Power | 0.4 | % | |||
Cash Equivalents1 | 2.7 | % | |||
Other Assets and Liabilities – Net2 | 0.6 | % | |||
|
| ||||
TOTAL | 100.0 | % | |||
|
| ||||
| (1) | Cash Equivalents include investments in a money market fund. |
| (2) | Assets, other than investments in securities, less liabilities. See Statements of Assets and Liabilities. |
| (3) | For financial reporting purposes, the Credit Quality Diversification table reflects the lowest rating assigned by either Moody’s Investors Service or Standard and Poor’s if the ratings differ. These rating agencies are independent, nationally recognized statistical rating organizations and are widely used. Investment grade ratings are credit ratings of BBB/Baa or higher. Below investment grade ratings are credit ratings of BB/Ba or lower. Investments designated as “Not Rated” are not rated by either rating agency and do not necessarily indicate low credit quality. Credit quality ratings are subject to change. |
| Credit Quality Diversification3 | Percentage of Total Net Assets | ||||
AAA / Aaa | 14.4 | % | |||
AA / Aa | 57.4 | % | |||
A / A | 23.0 | % | |||
Not Rated | 4.6 | % | |||
Other Assets and Liabilities – Net2 | 0.6 | % | |||
|
| ||||
TOTAL | 100.0 | % | |||
|
| ||||
PORTFOLIO OF INVESTMENTS
April 30, 2016
Description | Par Value | Value | ||||||
MUNICIPAL BONDS – 96.7% |
| |||||||
ALABAMA – 0.8% |
| |||||||
HIGHER EDUCATION – 0.5% |
| |||||||
Auburn University, AL, Advance Refunding Revenue Bonds, | $ | 1,200,000 | $ | 1,427,268 | ||||
MEDICAL – 0.3% |
| |||||||
The University of Alabama, AL, Refunding Revenue Bonds, | 1,000,000 | 1,113,220 | ||||||
|
| |||||||
TOTAL ALABAMA |
| $ | 2,540,488 | |||||
Description | Par Value | Value | ||||||
ARIZONA – 1.7% |
| |||||||
SCHOOL DISTRICT – 0.8% |
| |||||||
Maricopa County Unified School District No 80 Chandler, AZ, GO Limited, Economic Defeasance, 5.00%, 7/01/21 | $ | 2,000,000 | $ | 2,378,900 | ||||
WATER & SEWER – 0.9% |
| |||||||
City of Tucson, AZ, Refunding Revenue Bonds, (Water Revenue), 5.00%, 7/01/30 | 2,255,000 | 2,773,627 | ||||||
|
| |||||||
TOTAL ARIZONA |
| $ | 5,152,527 | |||||
| ANNUAL REPORT / April 30, 2016 |
| 40 |
| PORTFOLIOS OF INVESTMENTS |
Wilmington Municipal Bond Fund (continued)
Description | Par Value | Value | ||||||
CALIFORNIA – 8.3% | ||||||||
GENERAL OBLIGATIONS – 0.8% |
| |||||||
Grossmont Healthcare District, CA, GO Unlimited, (Series C), (Health, Hospital & Nursing Home Improvements), 5.00%, 7/15/23 | $ | 2,000,000 | $ | 2,504,080 | ||||
LEASE – 1.7% | ||||||||
Los Angeles Unified School District, CA, Certificate Participation Refunding Bonds, (Series B), (Headquarters Building), 5.00%, 10/01/27 | 4,300,000 | 5,177,974 | ||||||
MEDICAL – 1.9% | ||||||||
California Statewide Communities Development Authority, CA, Revenue Bonds, (Health, Hospital, Nursing Home Revenue), 5.00%, 4/01/19 | 5,140,000 | 5,771,809 | ||||||
TRANSPORTATION – 2.0% | ||||||||
Bay Area Toll Authority, CA, Refunding Revenue Bonds, (San Francisco Bay Area), 5.00%, 4/01/26 | 5,000,000 | 6,052,000 | ||||||
WATER & SEWER – 1.9% | ||||||||
City of San Francisco Public Utilities Commission Water Revenue, CA, Refunding Revenue Bonds, (Series C), (Water Revenue), 5.00%, 11/01/27 | 5,000,000 | 6,048,350 | ||||||
|
| |||||||
TOTAL CALIFORNIA | $ | 25,554,213 | ||||||
COLORADO – 0.8% | ||||||||
AIRPORT – 0.8% | ||||||||
City & County of Denver Airport System Revenue, CO, Refunding Revenue Bonds, (Series B), 5.00%, 11/15/25 | 2,000,000 | 2,438,800 | ||||||
|
| |||||||
TOTAL COLORADO | $ | 2,438,800 | ||||||
FLORIDA – 3.2% | ||||||||
GENERAL OBLIGATIONS – 0.7% |
| |||||||
State of Florida, FL, GO, | 2,000,000 | 2,263,920 | ||||||
LEASE – 1.9% | ||||||||
Broward County School Board, FL, Certificate Participation Refunding Bonds,, (Series A), 5.00%, 7/01/21 | 3,000,000 | 3,551,790 | ||||||
St. Johns County School Board, FL, Certificate Participation Refunding Bonds, 5.00%, 7/01/20 | 2,000,000 | 2,310,560 | ||||||
|
| |||||||
TOTAL LEASE | $ | 5,862,350 | ||||||
TRANSPORTATION – 0.6% | ||||||||
FL Turnpike Authority-A-Ref 5, FL, Revenue Bonds, Highway Revenue Tolls, 5.00%, 7/01/20 | 1,500,000 | 1,744,560 | ||||||
|
| |||||||
TOTAL FLORIDA | $ | 9,870,830 | ||||||
Description | Par Value | Value | ||||||
GEORGIA – 3.6% | ||||||||
GENERAL OBLIGATIONS – 2.4% |
| |||||||
State of Georgia, GA, GO Unlimited, (Series A-1), (Public Improvements), 5.00%, 2/01/22 | $ | 6,000,000 | $ | 7,312,320 | ||||
SCHOOL DISTRICT – 1.2% |
| |||||||
Valdosta Board of Education, GA, (Ad Valorem Property Tax) | ||||||||
5.00%, 2/01/20 | 1,250,000 | 1,435,900 | ||||||
5.00%, 2/01/21 | 1,000,000 | 1,181,030 | ||||||
5.00%, 2/01/19 | 1,025,000 | 1,141,235 | ||||||
|
| |||||||
TOTAL SCHOOL DISTRICT |
| $ | 3,758,165 | |||||
|
| |||||||
TOTAL GEORGIA | $ | 11,070,485 | ||||||
ILLINOIS – 10.4% | ||||||||
DEDICATED TAX – 2.0% | ||||||||
State of Illinois, IL, Revenue Bond, (Sales Tax Revenue), 6.00%, 6/15/27 | 2,000,000 | 2,715,360 | ||||||
State of Illinois, IL, Revenue Bonds, Public Improvements, (National Reinsurance FGIC), 6.00%, 6/15/26 | 2,500,000 | 3,352,600 | ||||||
|
| |||||||
TOTAL DEDICATED TAX |
| $ | 6,067,960 | |||||
GENERAL OBLIGATIONS – 5.0% |
| |||||||
Chicago Park District, IL, (Ad Valorem Property Tax) | ||||||||
5.00%, 1/01/26 | 1,250,000 | 1,422,900 | ||||||
5.00%, 1/01/27 | 3,455,000 | 3,897,516 | ||||||
Cook Kane Lake & McHenry Counties Community College District No 512, IL, (Ad Valorem Property Tax), 5.00%, 12/01/18 | 2,350,000 | 2,598,841 | ||||||
Metropolitan Water Reclamation District of Greater Chicago, IL, GO Limited, (Series C-Green Bond), (Water Utility & Sewer Improvements), 5.00%, 12/01/28 | 5,990,000 | 7,397,111 | ||||||
|
| |||||||
TOTAL GENERAL OBLIGATIONS |
| $ | 15,316,368 | |||||
MEDICAL – 0.4% | ||||||||
Illinois State Finance Authority, IL, Refunding Revenue Bonds, | 1,000,000 | 1,201,690 | ||||||
SCHOOL DISTRICT – 1.0% |
| |||||||
Du Page & Will Counties, IL, Community School District No 204 Indian Prairie, GO Unlimited, Advance Refunding, (Series A), 5.00%, 12/30/19 | 2,785,000 | 3,170,249 | ||||||
TRANSPORTATION – 2.0% |
| |||||||
Illinois State Toll Highway Authority, IL, Refunding Revenue Bonds, | 5,000,000 | 6,194,200 | ||||||
|
| |||||||
TOTAL ILLINOIS | $ | 31,950,467 | ||||||
| April 30, 2016 / ANNUAL REPORT |
| PORTFOLIOS OF INVESTMENTS |
| 41 |
Wilmington Municipal Bond Fund (continued)
Description | Par Value | Value | ||||||
INDIANA – 1.2% | ||||||||
GENERAL OBLIGATIONS – 0.5% |
| |||||||
Indianapolis-Marion County Public Library, IN, GO Unlimited, Refunding Revenue Bonds, (State Intercept Program), 5.00%, 1/01/19 | $ | 1,270,000 | $ | 1,408,227 | ||||
MEDICAL – 0.7% | ||||||||
Indiana Finance Authority, IN, Refunding Revenue Bonds, (Series C), (Franciscan Alliance Inc., OBG), 5.00%, 11/01/21 | 2,000,000 | 2,204,540 | ||||||
|
| |||||||
TOTAL INDIANA | $ | 3,612,767 | ||||||
KANSAS – 1.6% | ||||||||
TRANSPORTATION – 1.6% | ||||||||
State of Kansas Department of Transportation, KS, Revenue Bonds, (Fuel Sales Tax Revenue), 5.00%, 9/01/23 | 4,000,000 | 5,021,000 | ||||||
|
| |||||||
TOTAL KANSAS | $ | 5,021,000 | ||||||
MARYLAND – 5.1% | ||||||||
DEDICATED TAX – 0.5% | ||||||||
Maryland State Department of Transportation, MD, Revenue Bonds, Transit Improvements, 5.00%, 2/15/28 | 1,375,000 | 1,612,009 | ||||||
GENERAL OBLIGATIONS – 2.2% |
| |||||||
Baltimore County, MD, GO Unlimited, Refunding Notes, (Public Improvements), 5.00%, 2/01/28 | 1,000,000 | 1,200,070 | ||||||
Cecil County, MD, GO Unlimited, Refunding Bonds, (County Commissioners- Consolidated Public Improvements), 5.00%, 11/01/23 | 2,590,000 | 3,188,937 | ||||||
Montgomery County, MD, GO Unlimited, Refunding Bonds, (Series A), 5.00%, 7/01/21 | 2,000,000 | 2,400,020 | ||||||
|
| |||||||
TOTAL GENERAL OBLIGATIONS |
| $ | 6,789,027 | |||||
LEASE – 0.4% | ||||||||
Maryland Economic Development Corp., MD, Revenue Bonds, General Improvements, (Public Health Laboratory), 5.00%, 6/01/19 | 1,000,000 | 1,125,870 | ||||||
MEDICAL – 1.6% | ||||||||
Maryland Health & Higher Educational Facilities Authority, MD, Refunding Revenue Bonds, (Anne Arundel Health Systems) | ||||||||
5.00%, 7/01/22 | 1,000,000 | 1,215,790 | ||||||
5.00%, 7/01/25 | 1,000,000 | 1,175,910 | ||||||
5.00%, 7/01/26 | 1,100,000 | 1,284,789 | ||||||
Maryland Health & Higher Educational Facilities Authority, MD, Revenue Bonds, (Johns Hopkins Health System), 5.00%, 7/01/19 | 1,000,000 | 1,132,300 | ||||||
|
| |||||||
TOTAL MEDICAL | $ | 4,808,789 | ||||||
Description | Par Value | Value | ||||||
TRANSPORTATION – 0.4% | ||||||||
Maryland State Transportation Authority, MD, Refunding Revenue Bonds, 5.00%, 7/01/25 | $ | 1,000,000 | $ | 1,221,740 | ||||
|
| |||||||
TOTAL MARYLAND | $ | 15,557,435 | ||||||
MASSACHUSETTS – 0.8% | ||||||||
WATER – 0.8% | ||||||||
Massachusetts Clean Water Trust/The, MA, Revenue Bonds, (Miscellaneous Revenue), 5.00%, 2/01/20 | 2,000,000 | 2,306,380 | ||||||
|
| |||||||
TOTAL MASSACHUSETTS | $ | 2,306,380 | ||||||
MICHIGAN – 7.2% | ||||||||
DEDICATED TAX – 2.1% | ||||||||
Michigan Finance Authority, MI, Revenue Bonds, Repayment of Bank Loan, (Series H-1), 5.00%, 10/01/25 | 5,215,000 | 6,338,624 | ||||||
GENERAL – 0.7% | ||||||||
Michigan Finance Authority, MI, Revenue Bond, (Income Tax Revenue), 4.00%, 10/01/24 | 2,000,000 | 2,196,240 | ||||||
MEDICAL – 0.5% | ||||||||
Royal Oak Hospital Finance Authority, MI, Refunding Revenue Bonds, (Series D), | ||||||||
(William Beaumont Hospital), | ||||||||
5.00%, 9/01/20 | 1,200,000 | 1,387,332 | ||||||
SCHOOL DISTRICT – 2.8% | ||||||||
Grand Ledge Public Schools, MI, GO Unlimited, Current Refunding, (Q-SBLF) | ||||||||
5.00%, 5/01/22 | 1,195,000 | 1,432,351 | ||||||
5.00%, 5/01/24 | 2,810,000 | 3,469,001 | ||||||
Huron Valley School District, MI, GO Unlimited, Current Refunding, (Q-SBLF), 5.00%, 5/01/20 | 1,000,000 | 1,147,480 | ||||||
Troy School District, MI, GO Unlimited, Advance Refunding, (Q-SBLF), 5.00%, 5/01/20 | 2,085,000 | 2,405,444 | ||||||
|
| |||||||
TOTAL SCHOOL DISTRICT | $ | 8,454,276 | ||||||
UTILITIES – 1.1% | ||||||||
Lansing Board of Water & Light, MI, Revenue Bonds, (Series A), 5.00%, 7/01/29 | 3,000,000 | 3,516,510 | ||||||
|
| |||||||
TOTAL MICHIGAN | $ | 21,892,982 | ||||||
MISSOURI – 1.0% | ||||||||
MEDICAL – 1.0% | ||||||||
Missouri State Health & Educational Facilities Authority, MO, Refunding Revenue Bonds, (Series A), (SSM Health Care) | ||||||||
5.00%, 6/01/20 | 1,000,000 | 1,155,580 | ||||||
5.00%, 6/01/28 | 1,500,000 | 1,795,005 | ||||||
|
| |||||||
TOTAL MEDICAL | $ | 2,950,585 | ||||||
|
| |||||||
TOTAL MISSOURI | $ | 2,950,585 | ||||||
| ANNUAL REPORT / April 30, 2016 |
| 42 |
| PORTFOLIOS OF INVESTMENTS |
Wilmington Municipal Bond Fund (continued)
Description | Par Value | Value | ||||||
NEBRASKA – 2.3% | ||||||||
ELECTRIC – 2.3% | ||||||||
Lincoln Nebraska Electric System, NE, Revenue Bond, 5.00%, 9/01/20 | $ | 6,000,000 | $ | 7,014,540 | ||||
|
| |||||||
TOTAL NEBRASKA | $ | 7,014,540 | ||||||
NEVADA – 2.5% | ||||||||
DEDICATED TAX – 2.5% | ||||||||
County of Clark, NV, Refunding Revenue Bonds, (Fuel Tax and Subordinated Motor), 5.00%, 7/01/30 | 4,505,000 | 5,486,820 | ||||||
County of Clark, NV, Refunding Revenue Bonds, (Motor Vehicle Fuel Tax), 5.00%, 7/01/18 | 2,000,000 | 2,182,320 | ||||||
|
| |||||||
TOTAL DEDICATED TAX | $ | 7,669,140 | ||||||
|
| |||||||
TOTAL NEVADA | $ | 7,669,140 | ||||||
NEW JERSEY – 3.5% | ||||||||
GENERAL OBLIGATIONS – 0.7% |
| |||||||
County of Essex, NJ, GO Unlimited, (Series A), | 1,870,000 | 2,117,438 | ||||||
HIGHER EDUCATION – 1.6% |
| |||||||
Gloucester County Improvement Authority, NJ, Advance Refunding Revenue Bonds, (Series A), (Rowan University Project), 5.00%, 7/01/28 | 1,030,000 | 1,236,134 | ||||||
Gloucester County Improvement Authority, NJ, Advance Refunding Revenue Bonds, (Series B), (Rowan University Project), 5.00%, 7/01/27 | 3,000,000 | 3,623,610 | ||||||
|
| |||||||
TOTAL HIGHER EDUCATION |
| $ | 4,859,744 | |||||
SCHOOL DISTRICT – 0.6% | ||||||||
Egg Harbor Township NJ School District, GO Unlimited, Refunding School Bond, 5.00%, 9/15/23 | 1,520,000 | 1,846,192 | ||||||
TRANSPORTATION – 0.6% | ||||||||
New Jersey State Turnpike Authority, NJ, Revenue Bonds, (Series A), (Highway Improvement), 5.00%, 1/01/27 | 1,645,000 | 2,015,322 | ||||||
|
| |||||||
TOTAL NEW JERSEY | $ | 10,838,696 | ||||||
NEW YORK – 9.5% | ||||||||
DEDICATED TAX – 2.4% | ||||||||
Nassau County Interim Finance Authority, | ||||||||
NY, Refunding Revenue Bonds, (Series A), | ||||||||
(Sales Tax), 5.00%, 11/15/21 | 1,960,000 | 2,379,185 | ||||||
New York City, Transitional Finance Authority, | ||||||||
NY, Refunding Revenue Bonds, (Sub-series E), | 4,125,000 | 4,923,394 | ||||||
|
| |||||||
TOTAL DEDICATED TAX | $ | 7,302,579 | ||||||
Description | Par Value | Value | ||||||
GENERAL – 0.4% | ||||||||
New York City Transitional Finance Authority Future Tax Secured Revenue, NY, Revenue Bonds, (Public Improvement), (Sub-Series | $ | 1,115,000 | $ | 1,362,363 | ||||
GENERAL OBLIGATIONS – 1.0% |
| |||||||
County of Nassau NY, GO Limited, (Series B), 5.00%, 10/01/28 | 2,400,000 | 2,980,440 | ||||||
LEASE – 0.3% | ||||||||
Erie County Industrial Development Agency School, NY, Refunding Revenue Bonds, (State Aid Withholding), 5.00%, 5/01/18 | 1,000,000 | 1,085,350 | ||||||
TRANSPORTATION – 5.4% | ||||||||
Metropolitan Transportation Authority, NY, Revenue Bonds, (Fuel Sales Tax Revenue), 5.00%, 11/15/22 | 3,000,000 | 3,703,770 | ||||||
Metropolitan Transportation Authority, NY, Revenue Bonds, (Series B), (Transit Improvements), 5.00%, 11/15/29 | 3,000,000 | 3,619,890 | ||||||
New York State Thruway Authority, NY, Refunding Revenue Bonds, 5.00%, 1/01/30 | 5,500,000 | 6,642,075 | ||||||
Port Authority of New York & New Jersey, NY, Refunding Revenue Bonds, (175th Series), (Port, Airport & Marina Improvements), 5.00%, 12/01/23 | 2,000,000 | 2,455,640 | ||||||
|
| |||||||
TOTAL TRANSPORTATION | $ | 16,421,375 | ||||||
|
| |||||||
TOTAL NEW YORK | $ | 29,152,107 | ||||||
OHIO – 0.8% | ||||||||
GENERAL OBLIGATIONS – 0.8% |
| |||||||
Akron-Summit County Public Library, OH, GO Unlimited, Refunding Revenue Bonds, 5.00%, 12/01/20 | 1,960,000 | 2,298,551 | ||||||
|
| |||||||
TOTAL OHIO | $ | 2,298,551 | ||||||
PENNSYLVANIA – 8.5% | ||||||||
FACILITIES – 0.7% | ||||||||
Pittsburgh Public Parking Authority, PA, Revenue Bond, (Auto Parking Revenue), 5.00%, 12/01/26 | 1,755,000 | 2,126,762 | ||||||
HIGHER EDUCATION – 1.6% | ||||||||
Pennsylvania Higher Educational Facilities Authority, PA, Current Refunding Revenue Bonds, (Series A), (University of Sciences, Philadelphia), 5.00%, 11/01/28 | 2,330,000 | 2,794,625 | ||||||
Pennsylvania State University, PA, Refunding Revenue Bonds, (Series B), 5.25%, 8/15/22 | 1,865,000 | 2,301,708 | ||||||
|
| |||||||
TOTAL HIGHER EDUCATION | $ | 5,096,333 | ||||||
MEDICAL – 0.6% | ||||||||
Allegheny County Hospital Development Authority, PA, Revenue Bonds, (Series A), (UPMC, OBG), 5.00%, 10/15/22 | 1,605,000 | 1,939,049 | ||||||
| April 30, 2016 / ANNUAL REPORT |
| PORTFOLIOS OF INVESTMENTS |
| 43 |
Wilmington Municipal Bond Fund (continued)
Description | Par Value | Value | ||||||
PRE-REFUNDED/ESCROW – 4.0% |
| |||||||
Bucks County Industrial Development Authority, PA, IDA, Revenue Bonds, ETM, (Senior Lifestyles, Inc., OBG), 10.00%, 5/15/19 | $ | 4,775,000 | $ | 6,086,979 | ||||
Lancaster County Hospital Authority, PA, Refunding Revenue Bonds, (Series B), (Lancaster General Hospital, OBG) | ||||||||
5.00%, 3/15/19 | 1,485,000 | 1,541,846 | ||||||
5.00%, 3/15/23 | 1,770,000 | 1,837,756 | ||||||
Pennsylvania Convention Center Authority, PA, Revenue Bonds, ETM, (Series A), (FGIC), 6.00%, 9/01/19 | 2,410,000 | 2,692,789 | ||||||
|
| |||||||
TOTAL PRE-REFUNDED/ESCROW |
| $ | 12,159,370 | |||||
SCHOOL DISTRICT – 0.7% |
| |||||||
Pittsburgh Public Schools, PA, GO Unlimited, Refunding Revenue Bonds, (Series A), (AGM State Aid Withholding), 5.00%, 9/01/21 | 1,775,000 | 2,040,877 | ||||||
TRANSPORTATION – 0.9% |
| |||||||
Pennsylvania State Turnpike Commission, PA, Refunding Revenue Bonds, (Series B), 5.00%, 12/01/21 | 1,400,000 | 1,596,434 | ||||||
Pennsylvania Turnpike Commission, PA, Revenue Bond, (Highway Revenue Toll), 5.00%, 12/01/30 | 1,000,000 | 1,193,060 | ||||||
|
| |||||||
TOTAL TRANSPORTATION |
| $ | 2,789,494 | |||||
|
| |||||||
TOTAL PENNSYLVANIA |
| $ | 26,151,885 | |||||
RHODE ISLAND – 0.7% | ||||||||
WATER – 0.7% | ||||||||
Narragansett Bay Commission, RI, Revenue Bonds, (Sewer Revenue), 5.00%, 2/01/31 | 1,815,000 | 2,179,234 | ||||||
|
| |||||||
TOTAL RHODE ISLAND |
| $ | 2,179,234 | |||||
TEXAS – 15.3% | ||||||||
AIRPORT – 1.0% | ||||||||
Dallas/Fort Worth International Airport, TX, Refunding Revenue Bonds, (Series D), 5.25%, 11/01/23 | 2,500,000 | 3,024,750 | ||||||
GENERAL OBLIGATIONS – 3.1% |
| |||||||
County of Harris, TX, Refunding Notes, (Ad Valorem Property Tax), 5.00%, 10/01/20 | 3,315,000 | 3,887,965 | ||||||
County of Travis, TX, GO Limited, Refunding Revenue Bonds, 5.00%, 3/01/19 | 1,270,000 | 1,416,380 | ||||||
State of Texas, TX, GO Unlimited, Highway Improvements, (Transportation Commission), 5.00%, 4/01/21 | 3,440,000 | 4,090,194 | ||||||
|
| |||||||
TOTAL GENERAL OBLIGATIONS |
| $ | 9,394,539 | |||||
HIGHER EDUCATION – 1.8% |
| |||||||
Harris County Cultural Education Facilities Finance Corp., TX, Refunding Revenue Bonds, (Series A), (Baylor College of Medicine, OBG) 5.00%, 11/15/18 | 1,690,000 | 1,863,462 | ||||||
Description | Par Value | Value | ||||||
5.00%, 11/15/19 | $ | 3,105,000 | $ | 3,529,454 | ||||
|
| |||||||
TOTAL HIGHER EDUCATION | $ | 5,392,916 | ||||||
MEDICAL – 2.8% | ||||||||
North Central Texas Health Facility Development Corp., TX, Refunding Revenue Bonds, (Children’s Medical Center of Dallas Project, OBG), 5.00%, 8/15/18 | 1,000,000 | 1,095,230 | ||||||
Tarrant County Cultural Education Facilities Finance Corp., TX, Revenue Bonds, (Methodist Hospital of Dallas, OBG), 5.00%, 10/01/25 | 6,110,000 | 7,413,019 | ||||||
|
| |||||||
TOTAL MEDICAL | $ | 8,508,249 | ||||||
SCHOOL DISTRICT – 3.0% |
| |||||||
Edinburg Consolidated Independent School District, TX, GO Unlimited, Refunding Revenue Bonds, (Series 2016), (PSF-GTD), 5.00%, 2/15/30 | 4,160,000 | 5,181,155 | ||||||
Mesquite Independent School District, TX, GO Unlimited, Refunding Revenue Bonds, (Series B), (PSF-GTD), 5.00%, 8/15/19 | 2,165,000 | 2,456,084 | ||||||
Point Isabel Independent School District, TX, Current Refunding, (Ad Valorem Property Tax), 5.00%, 2/01/22 | 1,375,000 | 1,580,040 | ||||||
|
| |||||||
TOTAL SCHOOL DISTRICT |
| $ | 9,217,279 | |||||
TRANSPORTATION – 0.9% |
| |||||||
County of Harris, TX, Refunding Revenue Bonds, (Series C), (Senior Lien-Toll Road), 5.00%, 8/15/26 | 2,420,000 | 2,913,244 | ||||||
UTILITIES – 1.3% |
| |||||||
City of Houston Utility System, TX, Refunding Revenue Bonds, (Series C), (Comb-First Lien) | ||||||||
5.00%, 5/15/21 | 1,250,000 | 1,482,550 | ||||||
5.00%, 5/15/23 | 2,000,000 | 2,469,220 | ||||||
|
| |||||||
TOTAL UTILITIES |
| $ | 3,951,770 | |||||
WATER & SEWER – 1.4% |
| |||||||
City of Austin Water & Wastewater System, TX, Refunding Revenue Bonds, 5.00%, 5/15/20 | 3,810,000 | 4,408,132 | ||||||
|
| |||||||
TOTAL TEXAS |
| $ | 46,810,879 | |||||
UTAH – 0.9% |
| |||||||
MEDICAL – 0.9% |
| |||||||
County of Utah, UT, Revenue Bonds, (IHC Health Services Inc., OBG) | ||||||||
5.00%, 5/15/25 | 1,165,000 | 1,377,496 | ||||||
5.00%, 5/15/26 | 1,200,000 | 1,410,528 | ||||||
|
| |||||||
TOTAL MEDICAL | $ | 2,788,024 | ||||||
|
| |||||||
TOTAL UTAH | $ | 2,788,024 | ||||||
| ANNUAL REPORT / April 30, 2016 |
| 44 |
| PORTFOLIOS OF INVESTMENTS |
Wilmington Municipal Bond Fund (continued)
Description | Par Value | Value | ||||||
VIRGINIA – 1.5% | ||||||||
LEASE – 1.5% | ||||||||
Virginia, College Building Authority, VA, | ||||||||
Revenue Bonds, University & College | ||||||||
Improvements, (Series A), (Public Higher | ||||||||
Education Financing, OBG), 5.00%, 9/01/19 | $ | 4,000,000 | $ | 4,544,280 | ||||
|
| |||||||
TOTAL VIRGINIA | $ | 4,544,280 | ||||||
WASHINGTON – 4.9% |
| |||||||
DEDICATED TAX – 0.9% |
| |||||||
Central Puget Sound Regional Transit | ||||||||
Authority, WA, Revenue Bonds, Transit | ||||||||
Improvements, (National Reinsurance FGIC), | ||||||||
5.25%, 2/01/21 | 2,300,000 | 2,698,268 | ||||||
GENERAL OBLIGATIONS – 1.8% |
| |||||||
State of Washington, WA, GO Unlimited, | ||||||||
Refunding Revenue Bonds, (Series R-C), | ||||||||
5.00%, 7/01/24 | 4,500,000 | 5,613,930 | ||||||
POWER – 0.4% | ||||||||
County of Lewis Public Utility District No. 1, | ||||||||
WA, Current Refunding Revenue Bonds, | ||||||||
5.25%, 10/01/28 | 1,000,000 | 1,246,740 | ||||||
SCHOOL DISTRICT – 1.8% |
| |||||||
Clark County School District No 114 | ||||||||
Evergreen, WA, Current Refunding, (Ad | ||||||||
Valorem Property Tax), 5.00%, 12/01/18 | 4,855,000 | 5,382,302 | ||||||
|
| |||||||
TOTAL WASHINGTON | $ | 14,941,240 | ||||||
WISCONSIN – 0.6% |
| |||||||
TRANSPORTATION – 0.6% |
| |||||||
Wisconsin Department of Transportation, WI, | ||||||||
Refunding Revenue Bonds, (Series 2), | ||||||||
5.00%, 7/01/19 | 1,500,000 | 1,696,425 | ||||||
|
| |||||||
TOTAL WISCONSIN | $ | 1,696,425 | ||||||
|
| |||||||
TOTAL MUNICIPAL BONDS |
| |||||||
(COST $281,275,613)
| $
| 296,003,960
|
| |||||
|
Number of |
| ||||||
MONEY MARKET FUND – 2.7% |
| |||||||
Dreyfus Tax Exempt Cash Management | ||||||||
Fund, Institutional Shares, 0.17%^ | 8,113,351 | $ | 8,113,351 | |||||
|
| |||||||
TOTAL MONEY MARKET FUND (COST $8,113,351) |
| $ | 8,113,351 | |||||
|
| |||||||
TOTAL INVESTMENTS – 99.4% (COST $289,388,964) |
| $ | 304,117,311 | |||||
OTHER ASSETS LESS LIABILITIES – 0.6% |
| 1,928,070 | ||||||
|
| |||||||
TOTAL NET ASSETS – 100.0% |
| $ | 306,045,381 | |||||
|
| |||||||
Cost of investments for Federal income tax purposes is $289,388,964. The net unrealized appreciation/(depreciation) of investments was $14,728,347. This consists of net unrealized appreciation from investment for those securities having an excess of value over cost of $14,728,347 and net unrealized depreciation from investments for those securities having an excess of cost over value of $0.
| April 30, 2016 / ANNUAL REPORT |
| PORTFOLIOS OF INVESTMENTS |
| 45 |
Wilmington Municipal Bond Fund (concluded)
Various inputs are used in determining the value of the Fund’s investments. These inputs are summarized in the three broad levels listed below.
Level 1 – quoted prices in active markets for identical securities
Level 2 – other significant observable inputs (including quoted prices for similar securities, interest rates, prepayment speeds, credit risk, etc.)
Level 3 – significant unobservable inputs (including the Fund’s own assumptions in determining the fair value of investments)
The following is a summary of the inputs used as of April 30, 2016 in valuing the Fund’s assets carried at fair value:
|
| Level 1
|
|
| Level 2
|
|
| Level 3
|
|
| Total
|
| |||||
Investments in Securities | ||||||||||||||||
Municipal Bonds | $ | — | $ | 296,003,960 | $ | — | $ | 296,003,960 | ||||||||
Money Market Fund | 8,113,351 | — | — | 8,113,351 | ||||||||||||
|
|
|
|
|
|
|
| |||||||||
Total | $ | 8,113,351 | $ | 296,003,960 | $ | — | $ | 304,117,311 | ||||||||
|
|
|
|
|
|
|
| |||||||||
| ^ | 7-Day net yield. |
| D | Floating rate note with current rate and stated maturity date shown. |
The following acronyms are used throughout this Fund:
AGM - Assured Guaranty Municipal
ETM - Escrowed to Maturity
FGIC - Financial Guarantee Insurance Company
GO - General Obligation
GTD - Guaranteed
IDA - Industrial Development Authority/Agency
OBG - Obligation
PSF - Permanent School Fund
Q-SBLF - Qualified School Bond Loan Fund
UPMC - University of Pittsburgh Medical Center
See Notes which are an integral part of the Financial Statements
| ANNUAL REPORT / April 30, 2016 |
| 46 |
PORTFOLIO OF INVESTMENTS SUMMARY TABLE
Wilmington New York Municipal Bond Fund
At April 30, 2016, the Fund’s portfolio classifications were as follows (unaudited):
| Percentage of Total Net Assets | |||||
General Obligations | 23.8 | % | |||
Dedicated Tax | 18.2 | % | |||
Transportation | 15.1 | % | |||
Medical | 8.1 | % | |||
Lease | 7.9 | % | |||
Water & Sewer | 7.0 | % | |||
Pre-Refunded/Escrow | 4.9 | % | |||
Power | 3.8 | % | |||
Higher Education | 3.5 | % | |||
School District | 2.7 | % | |||
Cash Equivalents1 | 3.7 | % | |||
Other Assets and Liabilities – Net2 | 1.3 | % | |||
|
| ||||
TOTAL | 100.0 | % | |||
|
| ||||
| (1) | Cash Equivalents include investments in a money market fund. |
| (2) | Assets, other than investments in securities, less liabilities. See Statements of Assets and Liabilities. |
| (3) | For financial reporting purposes, the Credit Quality Diversification table reflects the lowest rating assigned by either Moody’s Investors Service or Standard and Poor’s if the ratings differ. These rating agencies are independent, nationally recognized statistical rating organizations and are widely used. Investment grade ratings are credit ratings of BBB/Baa or higher. Below investment grade ratings are credit ratings of BB/Ba or lower. Investments designated as “Not Rated” are not rated by either rating agency and do not necessarily indicate low credit quality. Credit quality ratings are subject to change. |
| Percentage of | |||||
| Credit Quality Diversification3 | Total Net Assets | ||||
AAA / Aaa | 5.6 | % | |||
AA / Aa | 64.2 | % | |||
A / A | 25.2 | % | |||
Not Rated | 3.7 | % | |||
Other Assets and Liabilities – Net2 | 1.3 | % | |||
|
| ||||
TOTAL | 100.0 | % | |||
|
| ||||
PORTFOLIO OF INVESTMENTS
April 30, 2016
Description | Par Value | Value | ||||||
MUNICIPAL BONDS – 95.0% |
| |||||||
NEW YORK – 95.0% |
| |||||||
DEDICATED TAX – 18.2% |
| |||||||
Nassau County Interim Finance Authority, NY, Refunding Revenue Bonds, (Series A), 5.00%, 11/15/21 | $ | 1,000,000 | $ | 1,213,870 | ||||
New York City, NY, Transitional Finance Authority, Revenue Bonds, Public Improvements, (Sub-Series E-1), 5.00%, 2/01/31 | 1,260,000 | 1,539,531 | ||||||
New York Local Government Assistance Corp., NY, Refunding Revenue Notes, | 3,000,000 | 3,479,880 | ||||||
Description | Par Value | Value | ||||||
New York State Dormitory Authority, NY, Refunding Revenue Bonds, (Series A), 5.00%, 3/15/29 | $ | 2,200,000 | $ | 2,720,652 | ||||
New York State Dormitory Authority, NY, Revenue Bonds, University & College Improvements, (Series A), 5.00%, 3/15/25 | 5,100,000 | 6,303,549 | ||||||
|
| |||||||
TOTAL DEDICATED TAX |
| $ | 15,257,482 | |||||
GENERAL OBLIGATIONS – 23.8% |
| |||||||
County of Albany, NY, GO, Refunding Bonds, AD Velorem Property Tax, 5.00%, 9/15/20 | 2,595,000 | 3,042,248 | ||||||
Nassau County Sewer & Storm Water Finance Authority, NY, Refunding Revenue Bonds, 5.00%, 10/01/26 | 1,500,000 | 1,882,530 | ||||||
Nassau County, NY, AD Velorem Property Tax, GO, Public Improvements, (Series B), 5.00%, 10/01/29 | 2,875,000 | 3,557,611 | ||||||
| April 30, 2016 / ANNUAL REPORT |
| PORTFOLIOS OF INVESTMENTS |
| 47 |
Wilmington New York Municipal Bond Fund (continued)
Description | Par Value | Value | ||||||
New York State, NY, GO Unlimited, Highway Improvements, (Series E), (State Aid Withholding), 5.00%, 12/15/21 | $ | 2,090,000 | $ | 2,542,025 | ||||
Rochester, NY, AD Velorem Property Tax, GO, Refunding Notes, (Series I), 5.00%, 8/01/19 | 3,000,000 | 3,392,490 | ||||||
Town of Islip, NY, GO, Refunding Bonds, AD Valorem Property Tax, 5.00%, 2/01/19 | 1,795,000 | 2,000,815 | ||||||
West Seneca, NY, AD Valorem Property Tax, GO, Public Improvements, 5.00%, 7/15/21 | 1,040,000 | 1,247,459 | ||||||
West Seneca, NY, AD Valorem Property Tax, GO, Refunding Notes, 5.00%, 7/15/20 | 990,000 | 1,154,429 | ||||||
White Plains, NY, AD Velorem Property Tax, GO, Refunding Bonds, Economic Defeasance, (Series 2016), 5.00%, 4/01/20 | 960,000 | 1,113,562 | ||||||
|
| |||||||
TOTAL GENERAL OBLIGATIONS |
| $ | 19,933,169 | |||||
HIGHER EDUCATION – 3.5% |
| |||||||
New York State Dormitory Authority, NY, Revenue Bonds, University College Improvements, (Series A), 5.00%, 7/01/21 | 1,000,000 | 1,190,280 | ||||||
New York State Dormitory Authority, NY, University & College Improvements, (Series A), (NATL-RE), 6.00%, 7/01/19 | 1,500,000 | 1,731,030 | ||||||
|
| |||||||
TOTAL HIGHER EDUCATION |
| $ | 2,921,310 | |||||
LEASE – 7.9% | ||||||||
Erie County, NY, IDA, Revenue Bonds, School Improvements, (Series A), (School District Buffalo Project)/(State Aid Withholding), 5.00%, 5/01/23 | 3,000,000 | 3,563,730 | ||||||
New York City, NY, Transitional Finance Authority, Building Aid, Revenue Refunding Bonds, School Improvements, (Series S-5), (State Aid Withholding), 5.00%, 1/15/27 | 2,770,000 | 3,082,622 | ||||||
|
| |||||||
TOTAL LEASE | $ | 6,646,352 | ||||||
MEDICAL – 8.1% | ||||||||
New York State Dormitory Authority, NY, Refunding Revenue Bonds, Health, Hospital, Nursing Home Revenue (NYU Hospitals Center), 5.00%, 7/01/27 | 4,650,000 | 5,642,171 | ||||||
New York State Dormitory Authority, NY, Revenue Refunding Bonds, (Series C), (Memorial Sloan Kettering Cancer Center)/(National Reinsurance), 5.75%, 7/01/19 | 1,010,000 | 1,160,096 | ||||||
|
| |||||||
TOTAL MEDICAL | $ | 6,802,267 | ||||||
POWER – 3.8% | ||||||||
New York Power Authority (The), NY, Revenue Refunding Bonds, (Series A), (GO of Authority), 5.00%, 11/15/22 | 2,575,000 | 3,173,378 | ||||||
PRE-REFUNDED/ESCROW – 4.9% |
| |||||||
Triborough Bridge & Tunnel Authority, NY, Refunding Revenue Bonds, (Series Y), (CAPMAC - ITC GO of Authority), 6.13%, 1/01/21 | 3,500,000 | 4,077,885 | ||||||
Description | Par Value | Value | ||||||
SCHOOL DISTRICT – 2.7% |
| |||||||
Commack Union Free School District, NY, Refunding Bonds, (GO, State Aid Withholding), 4.00%, 11/15/21 | $ | 1,000,000 | $ | 1,155,420 | ||||
Union Free School District of The Tarrytowns, NY, Refunding Bonds, Economic Defeasance, (Series A), (State Aid Withholding), 5.00%, 1/15/19 | 1,000,000 | 1,114,320 | ||||||
|
| |||||||
TOTAL SCHOOL DISTRICT |
| $ | 2,269,740 | |||||
TRANSPORTATION – 15.1% |
| |||||||
Metropolitan Transportation Authority, NY, Revenue Bonds, Transit Improvements, (Series B), 5.00%, 11/15/22 | 1,000,000 | 1,064,260 | ||||||
Metropolitan Transportation Authority, NY, Revenue, Revenue Refunding Bonds, Transit Improvements, (Series B), 5.00%, 11/15/29 | 2,000,000 | 2,413,260 | ||||||
Metropolitan Transportation Authority, NY, Revenue, Revenue Refunding Bonds, Transit Improvements, (Series E), 5.00%, 11/15/28 | 2,000,000 | 2,439,540 | ||||||
Port Authority of New York & New Jersey, NY, Refunding Revenue Bonds, Port, Airport & Marina Improvements, (175th Series), 5.00%, 12/01/23 | 3,000,000 | 3,683,460 | ||||||
Port Authority of New York & New Jersey, NY, Revenue Bonds, Airport & Marina Improvements, (194th Series), 5.00%, 10/15/30 | 1,000,000 | 1,250,570 | ||||||
Triborough Bridge & Tunnel Authority, NY, Refunding Revenue Bonds, (Series B), 5.00%, 11/15/28 | 1,500,000 | 1,839,270 | ||||||
|
| |||||||
TOTAL TRANSPORTATION |
| $ | 12,690,360 | |||||
WATER & SEWER – 7.0% |
| |||||||
Buffalo, NY, Municipal Water Finance Authority, Current Refunding, Municipal Water Finance, 5.00%, 7/01/29 | 1,170,000 | 1,415,864 | ||||||
New York City Water & Sewer System, NY, Refunding Revenue Bonds, (Series EE), 5.00%, 6/15/28 | 3,595,000 | 4,474,265 | ||||||
|
| |||||||
TOTAL WATER & SEWER |
| $ | 5,890,129 | |||||
|
| |||||||
TOTAL NEW YORK | $ | 79,662,072 | ||||||
|
| |||||||
TOTAL MUNICIPAL BONDS (COST $74,986,971)
|
| $
| 79,662,072
|
| ||||
|
Number of |
| ||||||
MONEY MARKET FUND – 3.7% |
| |||||||
Dreyfus Tax Exempt Cash Management Fund, Institutional Shares, 0.17%^ | 3,113,448 | $ | 3,113,448 | |||||
|
| |||||||
TOTAL MONEY MARKET FUND (COST $3,113,448) |
| $ | 3,113,448 | |||||
|
| |||||||
| ANNUAL REPORT / April 30, 2016 |
| 48 |
| PORTFOLIOS OF INVESTMENTS |
Wilmington New York Municipal Bond Fund (concluded)
Description | Value | |||
TOTAL INVESTMENTS – 98.7% | ||||
| (COST $78,100,419) | $ | 82,775,520 | ||
| OTHER ASSETS LESS LIABILITIES – 1.3% | 1,125,482 | |||
|
| |||
| TOTAL NET ASSETS – 100.0% | $ 83,901,002 | |||
|
| |||
Cost of investments for Federal income tax purposes is $78,100,419. The net unrealized appreciation/(depreciation) of investments was $4,675,101. This consists of net unrealized appreciation from investment for those securities having an excess of value over cost of $4,679,096 and net unrealized depreciation from investments for those securities having an excess of cost over value of $3,995.
Various inputs are used in determining the value of the Fund’s investments. These inputs are summarized in the three broad levels listed below.
Level 1 – quoted prices in active markets for identical securities
Level 2 – other significant observable inputs (including quoted prices for similar securities, interest rates, prepayment speeds, credit risk, etc.)
Level 3 – significant unobservable inputs (including the Fund’s own assumptions in determining the fair value of investments)
The following is a summary of the inputs used as of April 30, 2016 in valuing the Fund’s assets carried at fair value:
Level 1 | Level 2 | Level 3 | Total | |||||||||||||||||||
Investments in Securities | ||||||||||||||||||||||
Municipal Bonds | $ | — | $ | 79,662,072 | $ | — | $ | 79,662,072 | ||||||||||||||
Money Market Fund | 3,113,448 | — | — | 3,113,448 | ||||||||||||||||||
|
|
|
|
|
|
|
| |||||||||||||||
Total | $ | 3,113,448 | $ | 79,662,072 | $ | — | $ | 82,775,520 | ||||||||||||||
|
|
|
|
|
|
|
| |||||||||||||||
| ^ | 7-Day net yield. |
The following acronyms are used throughout this Fund:
CAPMAC - Capital Markets Assurance Corporation
ITC - Insured Trust Certificate
GO - General Obligation
IDA - Industrial Development Authority/Agency
NATL-RE - National Public Finance Guarantee Corporation
See Notes which are an integral part of the Financial Statements
| April 30, 2016 / ANNUAL REPORT |
| 49 |
| April 30, 2016 | Wilmington Bond Fund | Wilmington Intermediate-Term Bond Fund | Wilmington Fund | |||||||||||||||||||||||
ASSETS: | ||||||||||||||||||||||||||
Investments, at identified cost | $ | 411,115,971 | $ | 121,716,923 | $ | 181,063,044 | ||||||||||||||||||||
|
|
|
|
|
| |||||||||||||||||||||
Investments in securities, at value (Including $1,379,438, $988,959, and $13,162,118 of securities on loan, respectively) (Note 2) | $ | 421,953,087 | $ | 124,463,229 | $ | 181,904,735 | ||||||||||||||||||||
Income receivable | 2,629,336 | 807,725 | 799,088 | |||||||||||||||||||||||
Receivable for shares sold | 1,067,874 | 569,352 | 480,167 | |||||||||||||||||||||||
Receivable for investments sold | — | — | 298 | |||||||||||||||||||||||
Prepaid assets | 20,512 | 19,103 | 18,688 | |||||||||||||||||||||||
|
|
|
|
|
| |||||||||||||||||||||
TOTAL ASSETS | 425,670,809 | 125,859,409 | 183,202,976 | |||||||||||||||||||||||
|
|
|
|
|
|
| ||||||||||||||||||||
| LIABILITIES: | ||||||||||||||||||||||||||
Payable for investments purchased | 7,403,500 | 549,408 | 950,000 | |||||||||||||||||||||||
Collateral for securities on loan | 1,428,105 | 1,027,993 | 13,454,625 | |||||||||||||||||||||||
Income distribution payable | 790,229 | 169,454 | 174,941 | |||||||||||||||||||||||
Payable for shares redeemed | 748,352 | 144,086 | 216,061 | |||||||||||||||||||||||
Payable for Trustees’ fees | 2,005 | 2,005 | 2,005 | |||||||||||||||||||||||
Payable for distribution services fee | 1,065 | 721 | 1,620 | |||||||||||||||||||||||
Payable for shareholder services fee | 426 | 289 | — | |||||||||||||||||||||||
Other accrued expenses | 116,273 | 50,178 | 66,818 | |||||||||||||||||||||||
|
|
|
|
|
| |||||||||||||||||||||
TOTAL LIABILITIES | 10,489,955 | 1,944,134 | 14,866,070 | |||||||||||||||||||||||
| �� |
|
|
|
|
|
| |||||||||||||||||||
NET ASSETS | $ | 415,180,854 | $ | 123,915,275 | $ | 168,336,906 | ||||||||||||||||||||
|
|
|
|
|
|
| ||||||||||||||||||||
NET ASSETS CONSIST OF: | ||||||||||||||||||||||||||
| ||||||||||||||||||||||||||
Paid-in capital | $ | 404,888,507 | $ | 121,255,465 | $ | 168,713,037 | ||||||||||||||||||||
Undistributed (distributions in excess of) net investment income | 10,762 | 670 | 13,478 | |||||||||||||||||||||||
Accumulated net realized gain (loss) on investments | (555,531 | ) | (87,166 | ) | (1,231,300 | ) | ||||||||||||||||||||
Net unrealized appreciation (depreciation) of investments | 10,837,116 | 2,746,306 | 841,691 | |||||||||||||||||||||||
|
|
|
|
|
| |||||||||||||||||||||
TOTAL NET ASSETS | $ | 415,180,854 | $ | 123,915,275 | $ | 168,336,906 | ||||||||||||||||||||
|
|
|
|
|
|
| ||||||||||||||||||||
| COMPUTATION OF NET ASSET VALUE AND OFFERING PRICE: | ||||||||||||||||||||||||||
Class A | ||||||||||||||||||||||||||
Net Assets | $ | 5,206,232 | $ | 3,508,931 | $ | 7,795,652 | ||||||||||||||||||||
|
|
|
|
|
| |||||||||||||||||||||
Shares outstanding (unlimited shares authorized) | 523,533 | 350,400 | 774,455 | |||||||||||||||||||||||
|
|
|
|
|
| |||||||||||||||||||||
Net Asset Value per share | $ | 9.94 | $ | 10.01 | $ | 10.07 | ||||||||||||||||||||
|
|
|
|
|
| |||||||||||||||||||||
Offering price per share* | $ | 10.41 | *** | $ | 10.48 | *** | $ | 10.25 | ** | |||||||||||||||||
|
|
|
|
|
| |||||||||||||||||||||
Class I | ||||||||||||||||||||||||||
Net Assets | $ | 409,974,622 | $ | 120,406,344 | $ | 160,541,254 | ||||||||||||||||||||
|
|
|
|
|
| |||||||||||||||||||||
Shares outstanding (unlimited shares authorized) | 41,930,148 | 12,017,606 | 15,945,238 | |||||||||||||||||||||||
|
|
|
|
|
| |||||||||||||||||||||
Net Asset Value per share | $ | 9.78 | $ | 10.02 | $ | 10.07 | ||||||||||||||||||||
|
|
|
|
|
| |||||||||||||||||||||
| * | See “What Do Shares Cost?” in the Prospectus. |
| ** | Computation of offering price per share 100/98.25 of net asset value. |
| *** | Computation of offering price per share 100/95.50 of net asset value. |
See Notes which are an integral part of the Financial Statements
| ANNUAL REPORT / April 30, 2016 |
| 50 |
| STATEMENTS OF ASSETS AND LIABILITIES (concluded) |
| April 30, 2016 | Wilmington Bond Fund | Wilmington New York Municipal Bond Fund | ||||||||||||||||
ASSETS: | ||||||||||||||||||
Investments, at identified cost | $ | 289,388,964 | $ | 78,100,419 | ||||||||||||||
|
|
|
| |||||||||||||||
Investments in securities, at value | $ | 304,117,311 | $ | 82,775,520 | ||||||||||||||
Interest receivable | 3,830,606 | 1,056,730 | ||||||||||||||||
Receivable for shares sold | 531,650 | 279,766 | ||||||||||||||||
Prepaid assets | 23,840 | 12,487 | ||||||||||||||||
|
|
|
| |||||||||||||||
TOTAL ASSETS | 308,503,407 | 84,124,503 | ||||||||||||||||
|
|
|
|
| ||||||||||||||
| LIABILITIES: | ||||||||||||||||||
Payable for investments purchased | 1,846,192 | — | ||||||||||||||||
Income distribution payable | 451,393 | 120,818 | ||||||||||||||||
Payable for shares redeemed | 80,254 | 46,939 | ||||||||||||||||
Payable for Trustees’ fees | 2,005 | 2,005 | ||||||||||||||||
Payable for distribution services fee | 7,825 | 4,182 | ||||||||||||||||
Other accrued expenses | 70,357 | 49,557 | ||||||||||||||||
|
|
|
| |||||||||||||||
TOTAL LIABILITIES | 2,458,026 | 223,501 | ||||||||||||||||
|
|
|
|
| ||||||||||||||
NET ASSETS | $ | 306,045,381 | $ | 83,901,002 | ||||||||||||||
|
|
|
|
| ||||||||||||||
NET ASSETS CONSIST OF: | ||||||||||||||||||
| ||||||||||||||||||
Paid-in capital | $ | 290,824,230 | $ | 78,791,348 | ||||||||||||||
Undistributed (distributions in excess of) net investment income | 46 | 21 | ||||||||||||||||
Accumulated net realized gain (loss) on investments | 492,758 | 434,532 | ||||||||||||||||
Net unrealized appreciation (depreciation) of investments | 14,728,347 | 4,675,101 | ||||||||||||||||
|
|
|
| |||||||||||||||
TOTAL NET ASSETS | $ | 306,045,381 | $ | 83,901,002 | ||||||||||||||
|
|
|
|
|
| |||||||||||||
| COMPUTATION OF NET ASSET VALUE AND OFFERING PRICE: | ||||||||||||||||||
Class A | ||||||||||||||||||
Net Assets | $ | 38,181,621 | $ | 20,196,663 | ||||||||||||||
|
|
|
| |||||||||||||||
Shares outstanding (unlimited shares authorized) | 2,819,656 | 1,850,546 | ||||||||||||||||
|
|
|
| |||||||||||||||
Net Asset Value per share | $ | 13.54 | $ | 10.91 | ||||||||||||||
|
|
|
| |||||||||||||||
Offering price per share* | $ | 14.18 | *** | $ | 11.42 | *** | ||||||||||||
|
|
|
| |||||||||||||||
Class I | ||||||||||||||||||
Net Assets | $ | 267,863,760 | $ | 63,704,339 | ||||||||||||||
|
|
|
| |||||||||||||||
Shares outstanding (unlimited shares authorized) | 19,773,563 | 5,834,208 | ||||||||||||||||
|
|
|
| |||||||||||||||
Net Asset Value per share | $ | 13.55 | $ | 10.92 | ||||||||||||||
|
|
|
| |||||||||||||||
| * | See “How are Shares Priced?” in the Prospectus. |
| *** | Computation of offering price per share 100/95.50 of net asset value. |
See Notes which are an integral part of the Financial Statements
| April 30, 2016 / ANNUAL REPORT |
| 51 |
| Year Ended April 30, 2016 | Wilmington Broad Market Bond Fund | Wilmington Intermediate-Term Bond Fund | Wilmington Short-Term Bond Fund | |||||||||||||||||||||||
INVESTMENT INCOME: | ||||||||||||||||||||||||||
Dividends | $ | 5,875 | $ | 1,653 | $ | 1,474 | ||||||||||||||||||||
Interest | 11,302,173 | 2,692,141 | 2,321,521 | |||||||||||||||||||||||
Securities lending income | 6,045 | 5,668 | 10,066 | |||||||||||||||||||||||
|
|
|
|
|
| |||||||||||||||||||||
TOTAL INVESTMENT INCOME | 11,314,093 | 2,699,462 | 2,333,061 | |||||||||||||||||||||||
|
|
|
|
|
|
| ||||||||||||||||||||
| EXPENSES: | ||||||||||||||||||||||||||
Investment advisory fee | 1,883,705 | 553,699 | 642,007 | |||||||||||||||||||||||
Administrative personnel and services fees | 131,089 | 38,529 | 50,248 | |||||||||||||||||||||||
Portfolio accounting and administration fees | 140,580 | 53,056 | 63,196 | |||||||||||||||||||||||
Transfer and dividend disbursing agent fees and expenses | 131,886 | 10,552 | 44,481 | |||||||||||||||||||||||
Trustees’ fees | 43,263 | 43,263 | 43,263 | |||||||||||||||||||||||
Professional fees | 65,477 | 62,212 | 60,747 | |||||||||||||||||||||||
Distribution services fee—Class A | 13,372 | 9,982 | 23,477 | |||||||||||||||||||||||
Shareholder services fee—Class A | 13,372 | 9,982 | 23,477 | |||||||||||||||||||||||
Shareholder services fee— Class I | 1,033,130 | 297,628 | 377,776 | |||||||||||||||||||||||
Share registration costs | 31,443 | 27,584 | 34,250 | |||||||||||||||||||||||
Printing and postage | 34,076 | 5,846 | 5,718 | |||||||||||||||||||||||
Custodian fees | 15,312 | 6,914 | 9,120 | |||||||||||||||||||||||
Miscellaneous | 51,339 | 30,132 | 32,493 | |||||||||||||||||||||||
|
|
|
|
|
| |||||||||||||||||||||
TOTAL EXPENSES | 3,588,044 | 1,149,379 | 1,410,253 | |||||||||||||||||||||||
|
|
|
|
|
|
| ||||||||||||||||||||
| WAIVERS AND REIMBURSEMENTS: | ||||||||||||||||||||||||||
Waiver/reimbursement by investment advisor | (215,903 | ) | (176,871 | ) | (211,234 | ) | ||||||||||||||||||||
Waiver of shareholder services fee—Class A | (8,813 | ) | (7,215 | ) | (23,477 | ) | ||||||||||||||||||||
Waiver of shareholder services fee—Class I | (1,033,130 | ) | (297,628 | ) | (377,776 | ) | ||||||||||||||||||||
Waiver of portfolio accounting and administration fees | (9,961 | ) | (2,782 | ) | (3,880 | ) | ||||||||||||||||||||
|
|
|
|
|
| |||||||||||||||||||||
TOTAL WAIVERS AND REIMBURSEMENTS | (1,267,807 | ) | (484,496 | ) | (616,367 | ) | ||||||||||||||||||||
|
|
|
|
|
|
| ||||||||||||||||||||
Net expenses | 2,320,237 | 664,883 | 793,886 | |||||||||||||||||||||||
|
|
|
|
|
| |||||||||||||||||||||
Net investment income (loss) | 8,993,856 | 2,034,579 | 1,539,175 | |||||||||||||||||||||||
|
|
|
|
|
| |||||||||||||||||||||
REALIZED AND UNREALIZED GAIN (LOSS) ON INVESTMENTS: | ||||||||||||||||||||||||||
Net realized gain (loss) on investments | 361,143 | 198,850 | 149,886 | |||||||||||||||||||||||
Net change in unrealized appreciation (depreciation) of investments | 403,274 | 95,539 | (171,835 | ) | ||||||||||||||||||||||
|
|
|
|
|
| |||||||||||||||||||||
Net realized and unrealized gain (loss) on investments | 764,417 | 294,389 | (21,949 | ) | ||||||||||||||||||||||
|
|
|
|
|
| |||||||||||||||||||||
Change in net assets resulting from operations | $ | 9,758,273 | $ | 2,328,968 | $ | 1,517,226 | ||||||||||||||||||||
|
|
|
|
|
| |||||||||||||||||||||
See Notes which are an integral part of the Financial Statements
| ANNUAL REPORT / April 30, 2016 |
| 52 |
| STATEMENTS OF OPERATIONS (concluded) |
| Year Ended April 30, 2016 | Wilmington Municipal Bond Fund | Wilmington New York Municipal Bond Fund | ||||||||||||||||
INVESTMENT INCOME: | ||||||||||||||||||
Dividends | $ | 1,443 | $ | 408 | ||||||||||||||
Interest | 7,208,905 | 2,170,262 | ||||||||||||||||
|
|
|
| |||||||||||||||
| TOTAL INVESTMENT INCOME | 7,210,348 | 2,170,670 | ||||||||||||||||
|
|
|
|
| ||||||||||||||
| EXPENSES: | ||||||||||||||||||
Investment advisory fee | 1,333,400 | 376,044 | ||||||||||||||||
Administrative personnel and services fees | 92,792 | 26,169 | ||||||||||||||||
Portfolio accounting and administration fees | 106,173 | 34,929 | ||||||||||||||||
Transfer and dividend disbursing agent fees and expenses | 28,539 | 18,450 | ||||||||||||||||
Trustees’ fees | 43,263 | 43,263 | ||||||||||||||||
Professional fees | 59,676 | 60,384 | ||||||||||||||||
Distribution services fee—Class A | 98,431 | 52,949 | ||||||||||||||||
Shareholder services fee—Class A | 98,431 | 52,949 | ||||||||||||||||
Shareholder services fee— Class I | 642,347 | 155,965 | ||||||||||||||||
Share registration costs | 32,472 | 9,984 | ||||||||||||||||
Printing and postage | 7,003 | 7,863 | ||||||||||||||||
Custodian fees | 7,376 | 1,987 | ||||||||||||||||
Miscellaneous | 42,071 | 27,217 | ||||||||||||||||
|
|
|
| |||||||||||||||
| TOTAL EXPENSES | 2,591,974 | 868,153 | ||||||||||||||||
|
|
|
|
| ||||||||||||||
Waiver/reimbursement by investment advisor | (293,990 | ) | (111,287 | ) | ||||||||||||||
Waiver of shareholder services fee—Class A | (98,431 | ) | (52,949 | ) | ||||||||||||||
Waiver of shareholder services fee—Class I | (642,347 | ) | (155,965 | ) | ||||||||||||||
Waiver of portfolio accounting and administration fees | (6,879 | ) | (1,968 | ) | ||||||||||||||
|
|
|
| |||||||||||||||
| TOTAL WAIVERS AND REIMBURSEMENTS | (1,041,647 | ) | (322,169 | ) | ||||||||||||||
|
|
|
|
| ||||||||||||||
Net expenses | 1,550,327 | 545,984 | ||||||||||||||||
|
|
|
| |||||||||||||||
Net investment income (loss) | 5,660,021 | 1,624,686 | ||||||||||||||||
|
|
|
| |||||||||||||||
| REALIZED AND UNREALIZED GAIN (LOSS) ON INVESTMENTS: | ||||||||||||||||||
Net realized gain (loss) on investments | 2,362,715 | 1,485,048 | ||||||||||||||||
Net change in unrealized appreciation (depreciation) of investments | 5,817,885 | 602,434 | ||||||||||||||||
|
|
|
| |||||||||||||||
Net realized and unrealized gain (loss) on investments | 8,180,600 | 2,087,482 | ||||||||||||||||
|
|
|
| |||||||||||||||
Change in net assets resulting from operations | $ | 13,840,621 | $ | 3,712,168 | ||||||||||||||
|
|
|
| |||||||||||||||
See Notes which are an integral part of the Financial Statements
| April 30, 2016 / ANNUAL REPORT |
| 53 |
Wilmington Broad Market Bond Fund | Wilmington Intermediate-Term Bond Fund | |||||||||||||||||||||||||||||
Year Ended | Year Ended April 30, 2015 | Year Ended April 30, 2016 | Year Ended April 30, 2015 | |||||||||||||||||||||||||||
OPERATIONS: | ||||||||||||||||||||||||||||||
Net investment income (loss) | $ | 8,993,856 | $ | 7,005,793 | $ | 2,034,579 | $ | 2,085,486 | ||||||||||||||||||||||
Net realized gain (loss) on investments | 361,143 | 1,180,857 | 198,850 | 1,055,386 | ||||||||||||||||||||||||||
Net change in unrealized appreciation (depreciation) of investments | 403,274 | 4,734,634 | 95,539 | 147,780 | ||||||||||||||||||||||||||
|
|
|
|
|
|
|
| |||||||||||||||||||||||
Change in net assets resulting from operations | 9,758,273 | 12,921,284 | 2,328,968 | 3,288,652 | ||||||||||||||||||||||||||
|
|
|
|
|
|
|
| |||||||||||||||||||||||
| DISTRIBUTIONS TO SHAREHOLDERS: | ||||||||||||||||||||||||||||||
Distributions from net investment income | ||||||||||||||||||||||||||||||
Class A | (106,726 | ) | (111,927 | ) | (53,913 | ) | (61,884 | ) | ||||||||||||||||||||||
Class I | (9,641,032 | ) | (7,422,566 | ) | (1,988,439 | ) | (2,043,707 | ) | ||||||||||||||||||||||
Distributions from net realized gain on investments | ||||||||||||||||||||||||||||||
Class A | (6,169 | ) | (12,666 | ) | (14,272 | ) | (77,971 | ) | ||||||||||||||||||||||
Class I | (498,655 | ) | (826,640 | ) | (426,026 | ) | (2,037,153 | ) | ||||||||||||||||||||||
|
|
|
|
|
|
|
| |||||||||||||||||||||||
Change in net assets resulting from distributions to shareholders | (10,252,582 | ) | (8,373,799 | ) | (2,482,650 | ) | (4,220,715 | ) | ||||||||||||||||||||||
|
|
|
|
|
|
|
| |||||||||||||||||||||||
| SHARE TRANSACTIONS: | ||||||||||||||||||||||||||||||
Proceeds from sale of shares | ||||||||||||||||||||||||||||||
Class A | 180,484 | 281,884 | 81,897 | 283,137 | ||||||||||||||||||||||||||
Class I | 87,413,650 | 225,471,169 | 34,788,277 | 28,291,499 | ||||||||||||||||||||||||||
Distributions reinvested | ||||||||||||||||||||||||||||||
Class A | 84,360 | 96,494 | 58,580 | 123,207 | ||||||||||||||||||||||||||
Class I | 6,268,503 | 5,137,468 | 1,330,825 | 2,935,015 | ||||||||||||||||||||||||||
Cost of shares redeemed | ||||||||||||||||||||||||||||||
Class A | (772,335 | ) | (729,595 | ) | (1,008,812 | ) | (1,261,266 | ) | ||||||||||||||||||||||
Class I | (96,535,411 | ) | (68,277,128 | ) | (42,144,440 | ) | (40,271,354 | ) | ||||||||||||||||||||||
|
|
|
|
|
|
|
| |||||||||||||||||||||||
Change in net assets resulting from share transactions | (3,360,749 | ) | 161,980,292 | (6,893,673 | ) | (9,899,762 | ) | |||||||||||||||||||||||
|
|
|
|
|
|
|
| |||||||||||||||||||||||
Change in net assets | (3,855,058 | ) | 166,527,777 | (7,047,355 | ) | (10,831,825 | ) | |||||||||||||||||||||||
NET ASSETS: | ||||||||||||||||||||||||||||||
Beginning of year | 419,035,912 | 252,508,135 | 130,962,630 | 141,794,455 | ||||||||||||||||||||||||||
|
|
|
|
|
|
|
| |||||||||||||||||||||||
End of year | $ | 415,180,854 | $ | 419,035,912 | $ | 123,915,275 | $ | 130,962,630 | ||||||||||||||||||||||
|
|
|
|
|
|
|
| |||||||||||||||||||||||
Undistributed (distributions in excess of) net investment income included in net assets at end of year | $ | 10,762 | $ | (138,104 | ) | $ | 670 | $ | 3,913 | |||||||||||||||||||||
|
|
|
|
|
|
|
| |||||||||||||||||||||||
| SHARES OF BENEFICIAL INTEREST: | ||||||||||||||||||||||||||||||
Shares sold | ||||||||||||||||||||||||||||||
Class A | 18,427 | 28,602 | 8,265 | 28,185 | ||||||||||||||||||||||||||
Class I | 9,055,846 | 23,117,542 | 3,504,541 | 2,818,657 | ||||||||||||||||||||||||||
Distributions reinvested | ||||||||||||||||||||||||||||||
Class A | 8,602 | 9,727 | 5,907 | 12,296 | ||||||||||||||||||||||||||
Class I | 650,104 | 526,065 | 134,190 | 292,860 | ||||||||||||||||||||||||||
Shares redeemed | ||||||||||||||||||||||||||||||
Class A | (78,814 | ) | (73,684 | ) | (101,688 | ) | (125,261 | ) | ||||||||||||||||||||||
Class I | (10,011,080 | ) | (6,998,032 | ) | (4,243,380 | ) | (3,999,979 | ) | ||||||||||||||||||||||
|
|
|
|
|
|
|
| |||||||||||||||||||||||
Net change in shares outstanding | (356,915 | ) | 16,610,220 | (692,165 | ) | (973,242 | ) | |||||||||||||||||||||||
|
|
|
|
|
|
|
| |||||||||||||||||||||||
See Notes which are an integral part of the Financial Statements
| ANNUAL REPORT / April 30, 2016 |
| 54 |
| STATEMENTS OF CHANGES IN NET ASSETS (continued) |
Wilmington Short-Term Bond Fund | Wilmington | |||||||||||||||||||||||||||||
Year Ended 2016 | Year Ended 2015 | Year Ended 2016 | Year Ended 2015 | |||||||||||||||||||||||||||
OPERATIONS: | ||||||||||||||||||||||||||||||
Net investment income (loss) | $ | 1,539,175 | $ | 1,168,640 | $ | 5,660,021 | $ | 4,896,829 | ||||||||||||||||||||||
Net realized gain (loss) on investments | 149,886 | 1,039,742 | 2,362,715 | 4,741,241 | ||||||||||||||||||||||||||
Net change in unrealized appreciation (depreciation) of investments | (171,835 | ) | (1,132,613 | ) | 5,817,885 | (4,378,999 | ) | |||||||||||||||||||||||
|
|
|
|
|
|
|
| |||||||||||||||||||||||
Change in net assets resulting from operations | 1,517,226 | 1,075,769 | 13,840,621 | 5,259,071 | ||||||||||||||||||||||||||
|
|
|
|
|
|
|
| |||||||||||||||||||||||
DISTRIBUTIONS TO SHAREHOLDERS: | ||||||||||||||||||||||||||||||
Distributions from net investment income | ||||||||||||||||||||||||||||||
Class A | (91,081 | ) | (39,082 | ) | (666,853 | ) | (427,862 | ) | ||||||||||||||||||||||
Class I | (1,847,872 | ) | (1,231,142 | ) | (4,993,131 | ) | (4,468,958 | ) | ||||||||||||||||||||||
Distributions from net realized gain on investments | ||||||||||||||||||||||||||||||
Class A | (17,296 | ) | (43,075 | ) | (691,939 | ) | (139,702 | ) | ||||||||||||||||||||||
Class I | (269,842 | ) | (1,101,622 | ) | (4,530,680 | ) | (1,659,743 | ) | ||||||||||||||||||||||
|
|
|
|
|
|
|
| |||||||||||||||||||||||
Change in net assets resulting from distributions to shareholders | (2,226,091 | ) | (2,414,921 | ) | (10,882,603 | ) | (6,696,265 | ) | ||||||||||||||||||||||
|
|
|
|
|
|
|
| |||||||||||||||||||||||
SHARE TRANSACTIONS: | ||||||||||||||||||||||||||||||
Proceeds from sale of shares | ||||||||||||||||||||||||||||||
Class A | 561,708 | 1,774,216 | 480,079 | 491,276 | ||||||||||||||||||||||||||
Class I | 47,593,284 | 28,313,830 | 40,442,272 | 40,701,052 | ||||||||||||||||||||||||||
Proceeds from merger (Note 8) | ||||||||||||||||||||||||||||||
Class A | — | �� | 7,021,999 | — | 27,966,651 | |||||||||||||||||||||||||
Class I | — | 80,458,298 | — | 60,097,517 | ||||||||||||||||||||||||||
Distributions reinvested | ||||||||||||||||||||||||||||||
Class A | 70,383 | 48,598 | 1,043,704 | 412,194 | ||||||||||||||||||||||||||
Class I | 1,089,915 | 1,328,578 | 4,988,667 | 2,439,629 | ||||||||||||||||||||||||||
Cost of shares redeemed | ||||||||||||||||||||||||||||||
Class A | (3,285,355 | ) | (1,077,901 | ) | (5,319,845 | ) | (3,919,924 | ) | ||||||||||||||||||||||
Class I | (54,418,111 | ) | (106,936,255 | ) | (40,057,981 | ) | (41,871,708 | ) | ||||||||||||||||||||||
|
|
|
|
|
|
|
| |||||||||||||||||||||||
Change in net assets resulting from share transactions | (8,388,176 | ) | 10,931,363 | 1,576,896 | 86,316,687 | |||||||||||||||||||||||||
|
|
|
|
|
|
|
| |||||||||||||||||||||||
Change in net assets | (9,097,041 | ) | 9,592,211 | 4,534,914 | 84,879,493 | |||||||||||||||||||||||||
NET ASSETS: | ||||||||||||||||||||||||||||||
Beginning of year | 177,433,947 | 167,841,736 | 301,510,467 | 216,630,974 | ||||||||||||||||||||||||||
|
|
|
|
|
|
|
| |||||||||||||||||||||||
End of year | $ | 168,336,906 | $ | 177,433,947 | $ | 306,045,381 | $ | 301,510,467 | ||||||||||||||||||||||
|
|
|
|
|
|
|
| |||||||||||||||||||||||
Undistributed (distributions in excess of) net investment income included in net assets at end of year | $ | 13,478 | $ | (116,113 | ) | $ | 46 | $ | 9 | |||||||||||||||||||||
|
|
|
|
|
|
|
| |||||||||||||||||||||||
| SHARES OF BENEFICIAL INTEREST: | ||||||||||||||||||||||||||||||
Shares sold | ||||||||||||||||||||||||||||||
Class A | 55,801 | 174,101 | 35,795 | 36,432 | ||||||||||||||||||||||||||
Class I | 4,736,557 | 2,785,307 | 3,010,966 | 3,006,490 | ||||||||||||||||||||||||||
Shares issued in fund merger (Note 8) | ||||||||||||||||||||||||||||||
Class A | — | 694,098 | — | 2,047,329 | ||||||||||||||||||||||||||
Class I | — | 7,950,847 | — | 4,397,825 | ||||||||||||||||||||||||||
Distributions reinvested | ||||||||||||||||||||||||||||||
Class A | 7,016 | 4,808 | 78,231 | 30,537 | ||||||||||||||||||||||||||
Class I | 108,632 | 131,229 | 374,967 | 180,783 | ||||||||||||||||||||||||||
Shares redeemed | ||||||||||||||||||||||||||||||
Class A | (327,314 | ) | (106,396 | ) | (396,970 | ) | (290,087 | ) | ||||||||||||||||||||||
Class I | (5,421,880 | ) | (10,482,747 | ) | (2,986,163 | ) | (3,095,411 | ) | ||||||||||||||||||||||
|
|
|
|
|
|
|
| |||||||||||||||||||||||
Net change in shares outstanding | (841,188 | ) | 1,151,247 | 116,826 | 6,313,898 | |||||||||||||||||||||||||
|
|
|
|
|
|
|
| |||||||||||||||||||||||
See Notes which are an integral part of the Financial Statements
| April 30, 2016 / ANNUAL REPORT |
| STATEMENTS OF CHANGES IN NET ASSETS (concluded) |
| 55 |
Wilmington New York Municipal Bond Fund | ||||||||||
Year Ended 2016 |
Year Ended 2015 | |||||||||
OPERATIONS: | ||||||||||
Net investment income (loss) | $ | 1,624,686 | $ | 1,898,930 | ||||||
Net realized gain (loss) on investments | 1,485,048 | 1,153,442 | ||||||||
Net change in unrealized appreciation (depreciation) of investments | 602,434 | (261,875 | ) | |||||||
|
|
|
| |||||||
Change in net assets resulting from operations | 3,712,168 | 2,790,497 | ||||||||
|
|
|
| |||||||
DISTRIBUTIONS TO SHAREHOLDERS: | ||||||||||
Distributions from net investment income | ||||||||||
Class A | (372,578 | ) | (453,609 | ) | ||||||
Class I | (1,252,099 | ) | (1,445,312 | ) | ||||||
Distributions from net realized gain on investments | ||||||||||
Class A | (33,214 | ) | — | |||||||
Class I | (100,441 | ) | — | |||||||
|
|
|
| |||||||
Change in net assets resulting from distributions to shareholders | (1,758,332 | ) | (1,898,921 | ) | ||||||
|
|
|
| |||||||
SHARE TRANSACTIONS: | ||||||||||
Proceeds from sale of shares | ||||||||||
Class A | 122,601 | 102,135 | ||||||||
Class I | 11,578,776 | 12,661,038 | ||||||||
Distributions reinvested | ||||||||||
Class A | 261,885 | 291,257 | ||||||||
Class I | 773,587 | 763,540 | ||||||||
Cost of shares redeemed | ||||||||||
Class A | (3,358,153 | ) | (2,230,641 | ) | ||||||
Class I | (13,824,734 | ) | (19,712,017 | ) | ||||||
|
|
|
| |||||||
Change in net assets resulting from share transactions | (4,446,038 | ) | (8,124,688 | ) | ||||||
|
|
|
| |||||||
Change in net assets | (2,492,202 | ) | (7,233,112 | ) | ||||||
NET ASSETS: | ||||||||||
Beginning of year | 86,393,204 | 93,626,316 | ||||||||
|
|
|
| |||||||
End of year | $ | 83,901,002 | $ | 86,393,204 | ||||||
|
|
|
| |||||||
Undistributed (distributions in excess of) net investment income included in net assets at end | $ | 21 | $ | 12 | ||||||
|
|
|
| |||||||
| SHARES OF BENEFICIAL INTEREST: | ||||||||||
Shares sold | ||||||||||
Class A | 11,337 | 9,595 | ||||||||
Class I | 1,076,403 | 1,185,490 | ||||||||
Distributions reinvested | ||||||||||
Class A | 24,434 | 27,290 | ||||||||
Class I | 72,112 | 71,480 | ||||||||
Shares redeemed | ||||||||||
Class A | (313,812 | ) | (209,544 | ) | ||||||
Class I | (1,286,932 | ) | (1,846,064 | ) | ||||||
|
|
|
| |||||||
Net change in shares outstanding | (416,458 | ) | (761,753 | ) | ||||||
|
|
|
| |||||||
See Notes which are an integral part of the Financial Statements
| ANNUAL REPORT / April 30, 2016 |
| 56 |
For a share outstanding throughout each year ended April 30, unless otherwise noted:
| WILMINGTON BROAD MARKET BOND FUND |
| CLASS A | Year Ended April 30, 2016 | Year Ended April 30, 2015 | Year Ended April 30, 2014 | Year Ended April 30, 2013 | Year Ended April 30, 2012 | |||||||||||||||||
| Net Asset Value, Beginning of Year | $9.95 | $9.80 | $10.19 | $10.23 | $10.16 | |||||||||||||||||
| Income (Loss) From Operations: | ||||||||||||||||||||||
Net Investment Income (Loss)(a) | 0.18 | 0.17 | 0.20 | 0.23 | 0.32 | |||||||||||||||||
Net Realized and Unrealized Gain (Loss)on Investments | 0.02 | 0.19 | (0.21 | ) | 0.17 | 0.33 | ||||||||||||||||
| Total Income (Loss) From Operations | 0.20 | 0.36 | (0.01 | ) | 0.40 | 0.65 | ||||||||||||||||
| Less Distributions From: | ||||||||||||||||||||||
Net Investment Income | (0.20 | ) | (0.19 | ) | (0.23 | ) | (0.25 | ) | (0.33 | ) | ||||||||||||
Net Realized Gains | (0.01 | ) | (0.02 | ) | (0.15 | ) | (0.19 | ) | (0.25 | ) | ||||||||||||
| Total Distributions | (0.21 | ) | (0.21 | ) | (0.38 | ) | (0.44 | ) | (0.58 | ) | ||||||||||||
| Net Asset Value, End of Year | $9.94 | $9.95 | $9.80 | $10.19 | $10.23 | |||||||||||||||||
| Total Return(b) | 2.03 | % | 3.69 | % | (0.03 | )% | 3.93 | % | 6.54 | % | ||||||||||||
| Net Assets, End of Year (000’s) | $5,206 | $5,726 | $5,983 | $6,951 | $8,431 | |||||||||||||||||
| Ratios to Average Net Assets | ||||||||||||||||||||||
Gross Expense | 1.10 | % | 1.12 | % | 1.15 | % | 1.17 | % | 1.25 | % | ||||||||||||
Net Expenses(c) | 0.88 | % | 0.94 | % | 0.98 | % | 0.99 | % | 1.00 | % | ||||||||||||
Net Investment Income (Loss) | 1.85 | % | 1.74 | % | 2.09 | % | 2.23 | % | 3.12 | % | ||||||||||||
| Portfolio Turnover Rate | 44 | % | 45 | % | 113 | % | 106 | % | 93 | % | ||||||||||||
| CLASS I | Year Ended April 30, 2016 | Year Ended April 30, 2015 | Year Ended April 30, 2014 | Year Ended April 30, 2013 | Year Ended April 30, 2012 | |||||||||||||||||
| Net Asset Value, Beginning of Year | $9.79 | $9.63 | $10.03 | $10.07 | $10.01 | |||||||||||||||||
| Income (Loss) From Operations: | ||||||||||||||||||||||
Net Investment Income (Loss)(a) | 0.21 | 0.20 | 0.23 | 0.26 | 0.35 | |||||||||||||||||
Net Realized and Unrealized Gain (Loss)on Investments | 0.02 | 0.20 | (0.22 | ) | 0.17 | 0.32 | ||||||||||||||||
| Total Income (Loss) From Operations | 0.23 | 0.40 | 0.01 | 0.43 | 0.67 | |||||||||||||||||
| Less Distributions From: | ||||||||||||||||||||||
Net Investment Income | (0.23 | ) | (0.22 | ) | (0.26 | ) | (0.28 | ) | (0.36 | ) | ||||||||||||
Net Realized Gains | (0.01 | ) | (0.02 | ) | (0.15 | ) | (0.19 | ) | (0.25 | ) | ||||||||||||
| Total Distributions | (0.24 | ) | (0.24 | ) | (0.41 | ) | (0.47 | ) | (0.61 | ) | ||||||||||||
| Net Asset Value, End of Year | $9.78 | $9.79 | $9.63 | $10.03 | $10.07 | |||||||||||||||||
| Total Return(b) | 2.38 | % | 4.19 | % | 0.16 | % | 4.32 | % | 6.90 | % | ||||||||||||
| Net Assets, End of Year (000’s) | $409,975 | $413,310 | $246,525 | $275,173 | $291,976 | |||||||||||||||||
| Ratios to Average Net Assets | ||||||||||||||||||||||
Gross Expense | 0.85 | % | 0.88 | % | 0.92 | % | 0.92 | % | 1.00 | % | ||||||||||||
Net Expenses(c) | 0.55 | % | 0.60 | % | 0.65 | % | 0.64 | % | 0.66 | % | ||||||||||||
Net Investment Income (Loss) | 2.15 | % | 2.07 | % | 2.41 | % | 2.57 | % | 3.47 | % | ||||||||||||
| Portfolio Turnover Rate | 44 | % | 45 | % | 113 | % | 106 | % | 93 | % | ||||||||||||
| (a) | Per share numbers have been calculated using the average shares method. |
| (b) | Based on net asset value, which does not reflect the sales charge or contingent deferred sales charge, if applicable. Total returns for periods of less than one year, if any, are not annualized. |
| (c) | The investment advisor and other service providers waived or reimbursed a portion of their fees. |
See Notes which are an integral part of the Financial Statements
| April 30, 2016 / ANNUAL REPORT |
| FINANCIAL HIGHLIGHTS (continued) |
| 57 |
For a share outstanding throughout each year ended April 30, unless otherwise noted:
| WILMINGTON INTERMEDIATE-TERM BOND FUND |
| CLASS A | Year Ended April 30, 2016 | Year Ended April 30, 2015 | Year Ended April 30, 2014 | Year Ended April 30, 2013 | Year Ended April 30, 2012 | |||||||||||||||||
| Net Asset Value, Beginning of Year | $10.02 | $10.10 | $10.60 | $10.64 | $10.76 | |||||||||||||||||
| Income (Loss) From Operations: | ||||||||||||||||||||||
Net Investment Income (Loss)(a) | 0.13 | 0.13 | 0.14 | 0.18 | 0.24 | |||||||||||||||||
Net Realized and Unrealized Gain (Loss)on Investments | 0.03 | 0.09 | (0.19 | ) | 0.13 | 0.28 | ||||||||||||||||
|
| |||||||||||||||||||||
| Total Income (Loss) From Operations | 0.16 | 0.22 | (0.05 | ) | 0.31 | 0.52 | ||||||||||||||||
|
| |||||||||||||||||||||
| Less Distributions From: | ||||||||||||||||||||||
Net Investment Income | (0.13 | ) | (0.13 | ) | (0.15 | ) | (0.19 | ) | (0.25 | ) | ||||||||||||
Net Realized Gains | (0.04 | ) | (0.17 | ) | (0.30 | ) | (0.16 | ) | (0.39 | ) | ||||||||||||
|
| |||||||||||||||||||||
| Total Distributions | (0.17 | ) | (0.30 | ) | (0.45 | ) | (0.35 | ) | (0.64 | ) | ||||||||||||
|
| |||||||||||||||||||||
| Net Asset Value, End of Year | $10.01 | $10.02 | $10.10 | $10.60 | $10.64 | |||||||||||||||||
|
| |||||||||||||||||||||
| Total Return(b) | 1.62 | % | 2.14 | % | (0.40 | )% | 2.90 | % | 4.96 | % | ||||||||||||
| Net Assets, End of Year (000’s) | $3,509 | $4,389 | $5,279 | $9,730 | $12,961 | |||||||||||||||||
| Ratios to Average Net Assets | ||||||||||||||||||||||
Gross Expense | 1.18 | % | 1.15 | % | 1.12 | % | 1.14 | % | 1.35 | % | ||||||||||||
Net Expenses(c) | 0.85 | % | 0.89 | % | 0.91 | % | 0.94 | % | 1.00 | % | ||||||||||||
Net Investment Income (Loss) | 1.34 | % | 1.25 | % | 1.38 | % | 1.69 | % | 2.22 | % | ||||||||||||
Portfolio Turnover Rate
|
| 32
| %
|
| 45
| %
|
| 43
| %
|
| 52
| %
|
| 253
| %
| |||||||
| CLASS I | Year Ended April 30, 2016 | Year Ended April 30, 2015 | Year Ended April 30, 2014 | Year Ended April 30, 2013 | Year Ended April 30, 2012 | |||||||||||||||||
| Net Asset Value, Beginning of Year | $10.03 | $10.10 | $10.60 | $10.65 | $10.77 | |||||||||||||||||
| Income (Loss) From Operations: | ||||||||||||||||||||||
Net Investment Income (Loss)(a) | 0.17 | 0.16 | 0.17 | 0.22 | 0.28 | |||||||||||||||||
Net Realized and Unrealized Gain (Loss)on Investments | 0.03 | 0.10 | (0.18 | ) | 0.11 | 0.27 | ||||||||||||||||
|
| |||||||||||||||||||||
| Total Income (Loss) From Operations | 0.20 | 0.26 | (0.01 | ) | 0.33 | 0.55 | ||||||||||||||||
|
| |||||||||||||||||||||
| Less Distributions From: | ||||||||||||||||||||||
Net Investment Income | (0.17 | ) | (0.16 | ) | (0.19 | ) | (0.22 | ) | (0.28 | ) | ||||||||||||
Net Realized Gains | (0.04 | ) | (0.17 | ) | (0.30 | ) | (0.16 | ) | (0.39 | ) | ||||||||||||
|
| |||||||||||||||||||||
| Total Distributions | (0.21 | ) | (0.33 | ) | (0.49 | ) | (0.38 | ) | (0.67 | ) | ||||||||||||
|
| |||||||||||||||||||||
| Net Asset Value, End of Year | $10.02 | $10.03 | $10.10 | $10.60 | $10.65 | |||||||||||||||||
|
| |||||||||||||||||||||
| Total Return(b) | 1.94 | % | 2.57 | % | (0.09 | )% | 3.15 | % | 5.33 | % | ||||||||||||
| Net Assets, End of Year (000’s) | $120,406 | $126,574 | $136,516 | $201,572 | $253,419 | |||||||||||||||||
| Ratios to Average Net Assets | ||||||||||||||||||||||
Gross Expense | 0.93 | % | 0.93 | % | 0.91 | % | 0.89 | % | 1.09 | % | ||||||||||||
Net Expenses(c) | 0.53 | % | 0.57 | % | 0.60 | % | 0.60 | % | 0.64 | % | ||||||||||||
Net Investment Income (Loss) | 1.66 | % | 1.57 | % | 1.69 | % | 2.03 | % | 2.58 | % | ||||||||||||
| Portfolio Turnover Rate | 32 | % | 45 | % | 43 | % | 52 | % | 253 | % | ||||||||||||
| (a) | Per share numbers have been calculated using the average shares method. |
| (b) | Based on net asset value, which does not reflect the sales charge or contingent deferred sales charge, if applicable. Total returns for periods of less than one year, if any, are not annualized. |
| (c) | The investment advisor and other service providers waived or reimbursed a portion of their fees. |
See Notes which are an integral part of the Financial Statements
| ANNUAL REPORT / April 30, 2016 |
| 58 |
| FINANCIAL HIGHLIGHTS (continued) |
For a share outstanding throughout each year ended April 30, unless otherwise noted:
| WILMINGTON SHORT-TERM BOND FUND |
| CLASS A | Year Ended April 30, 2016 | Year Ended April 30, 2015 | Year Ended April 30, 2014 | Year Ended April 30, 2013 | Year Ended April 30, 2012 | |||||||||||||||||
| Net Asset Value, Beginning of Year | $10.10 | $10.23 | $10.33 | $10.28 | $10.29 | |||||||||||||||||
| Income (Loss) From Operations: | ||||||||||||||||||||||
Net Investment Income (Loss)(a) | 0.07 | 0.07 | 0.07 | 0.09 | 0.12 | |||||||||||||||||
Net Realized and Unrealized Gain (Loss)on Investments | 0.02 | (0.02 | ) | 0.00 | (b) | 0.08 | 0.03 | |||||||||||||||
|
| |||||||||||||||||||||
| Total Income (Loss) From Operations | 0.09 | 0.05 | 0.07 | 0.17 | 0.15 | |||||||||||||||||
|
| |||||||||||||||||||||
| Less Distributions From: | ||||||||||||||||||||||
Net Investment Income | (0.10 | ) | (0.06 | ) | (0.08 | ) | (0.09 | ) | (0.12 | ) | ||||||||||||
Net Realized Gains | (0.02 | ) | (0.12 | ) | (0.09 | ) | (0.03 | ) | (0.04 | ) | ||||||||||||
|
| |||||||||||||||||||||
| Total Distributions | (0.12 | ) | (0.18 | ) | (0.17 | ) | (0.12 | ) | (0.16 | ) | ||||||||||||
|
| |||||||||||||||||||||
| Net Asset Value, End of Year | $10.07 | $10.10 | $10.23 | $10.33 | $10.28 | |||||||||||||||||
|
| |||||||||||||||||||||
| Total Return(c) | 0.87 | % | 0.51 | % | 0.68 | % | 1.66 | % | 1.48 | % | ||||||||||||
| Net Assets, End of Year (000’s) | $7,796 | $10,495 | $2,785 | $3,129 | $8,912 | |||||||||||||||||
| Ratios to Average Net Assets | ||||||||||||||||||||||
Gross Expense | 1.11 | % | 1.17 | % | 1.19 | % | 1.20 | % | 1.37 | % | ||||||||||||
Net Expenses(d) | 0.73 | % | 0.78 | % | 0.83 | % | 0.86 | % | 0.86 | % | ||||||||||||
Net Investment Income (Loss) | 0.71 | % | 0.71 | % | 0.64 | % | 0.89 | % | 1.16 | % | ||||||||||||
Portfolio Turnover Rate
|
| 104
| %
|
| 138
| %
|
| 196
| %
|
| 110
| %
|
| 73
| %
| |||||||
| CLASS I | Year Ended April 30, 2016 | Year Ended April 30, 2015 | Year Ended April 30, 2014 | Year Ended April 30, 2013 | Year Ended April 30, 2012 | |||||||||||||||||
| Net Asset Value, Beginning of Year | $10.10 | $10.23 | $10.33 | $10.28 | $10.29 | |||||||||||||||||
| Income (Loss) From Operations: | ||||||||||||||||||||||
Net Investment Income (Loss)(a) | 0.10 | 0.08 | 0.09 | 0.12 | 0.15 | |||||||||||||||||
Net Realized and Unrealized Gain (Loss)on Investments | 0.01 | 0.00 | (b) | 0.00 | (b) | 0.08 | 0.03 | |||||||||||||||
|
| |||||||||||||||||||||
| Total Income (Loss) From Operations | 0.11 | 0.08 | 0.09 | 0.20 | 0.18 | |||||||||||||||||
|
| |||||||||||||||||||||
| Less Distributions From: | ||||||||||||||||||||||
Net Investment Income | (0.12 | ) | (0.09 | ) | (0.10 | ) | (0.12 | ) | (0.15 | ) | ||||||||||||
Net Realized Gains | (0.02 | ) | (0.12 | ) | (0.09 | ) | (0.03 | ) | (0.04 | ) | ||||||||||||
|
| |||||||||||||||||||||
| Total Distributions | (0.14 | ) | (0.21 | ) | (0.19 | ) | (0.15 | ) | (0.19 | ) | ||||||||||||
|
| |||||||||||||||||||||
| Net Asset Value, End of Year | $10.07 | $10.10 | $10.23 | $10.33 | $10.28 | |||||||||||||||||
|
| |||||||||||||||||||||
| Total Return(c) | 1.12 | % | 0.76 | % | 0.90 | % | 1.91 | % | 1.74 | % | ||||||||||||
| Net Assets, End of Year (000’s) | $160,541 | $166,939 | $165,057 | $182,588 | $189,176 | |||||||||||||||||
| Ratios to Average Net Assets | ||||||||||||||||||||||
Gross Expense | 0.86 | % | 0.96 | % | 0.97 | % | 0.96 | % | 1.11 | % | ||||||||||||
Net Expenses(d) | 0.48 | % | 0.56 | % | 0.61 | % | 0.61 | % | 0.61 | % | ||||||||||||
Net Investment Income (Loss) | 0.97 | % | 0.81 | % | 0.86 | % | 1.12 | % | 1.42 | % | ||||||||||||
| Portfolio Turnover Rate | 104 | % | 138 | % | 196 | % | 110 | % | 73 | % | ||||||||||||
| (a) | Per share numbers have been calculated using the average shares method. |
| (b) | Represents less than $0.005. |
| (c) | Based on net asset value, which does not reflect the sales charge or contingent deferred sales charge, if applicable. Total returns for periods of less than one year, if any, are not annualized. |
| (d) | The investment advisor and other service providers waived or reimbursed a portion of their fees. |
See Notes which are an integral part of the Financial Statements
| April 30, 2016 / ANNUAL REPORT |
| FINANCIAL HIGHLIGHTS (continued) |
| 59 |
For a share outstanding throughout each period:
| WILMINGTON MUNICIPAL BOND FUND† |
| CLASS A | Year Ended April 30, 2016 | Year Ended April 30, 2015 | Year Ended April 30, 2014 | Year Ended April 30, 2013 | For the Period April 30, 2012* | Year Ended June 30, 2011 | |||||||||||||||||||||||||||||
| Net Asset Value, Beginning of Year | $13.41 | $13.40 | $13.75 | $13.79 | $13.18 | $13.22 | |||||||||||||||||||||||||||||
| Income (Loss) From Operations: | |||||||||||||||||||||||||||||||||||
Net Investment Income (Loss)(a) | 0.23 | 0.25 | 0.27 | 0.24 | 0.29 | 0.42 | |||||||||||||||||||||||||||||
Net Realized and Unrealized Gain (Loss)on Investments | 0.37 | 0.13 | (0.23 | ) | 0.27 | 0.78 | 0.04 | ||||||||||||||||||||||||||||
|
| ||||||||||||||||||||||||||||||||||
| Total Income (Loss) From Operations | 0.60 | 0.38 | 0.04 | 0.51 | 1.07 | 0.46 | |||||||||||||||||||||||||||||
|
| ||||||||||||||||||||||||||||||||||
| Less Distributions From: | |||||||||||||||||||||||||||||||||||
Net Investment Income | (0.23 | ) | (0.25 | ) | (0.27 | ) | (0.24 | ) | (0.29 | ) | (0.42 | ) | |||||||||||||||||||||||
Net Realized Gains | (0.24 | ) | (0.12 | ) | (0.12 | ) | (0.31 | ) | (0.17 | ) | (0.08 | ) | |||||||||||||||||||||||
|
| ||||||||||||||||||||||||||||||||||
| Total Distributions | (0.47 | ) | (0.37 | ) | (0.39 | ) | (0.55 | ) | (0.46 | ) | (0.50 | ) | |||||||||||||||||||||||
|
| ||||||||||||||||||||||||||||||||||
| Net Asset Value, End of Year | $13.54 | $13.41 | $13.40 | $13.75 | $13.79 | $13.18 | |||||||||||||||||||||||||||||
|
| ||||||||||||||||||||||||||||||||||
| Total Return(b) | 4.55 | % | 2.83 | % | 0.37 | % | 3.74 | % | 8.18 | % | 3.56 | % | |||||||||||||||||||||||
| Net Assets, End of Year (000’s) | $38,182 | $41,607 | $17,128 | $21,435 | $708 | $758 | |||||||||||||||||||||||||||||
| Ratios to Average Net Assets | |||||||||||||||||||||||||||||||||||
Gross Expense | 1.09 | % | 1.12 | % | 1.14 | % | 1.13 | % | 0.92 | %(c) | 0.86 | % | |||||||||||||||||||||||
Net Expenses(d) | 0.74 | % | 0.79 | % | 0.86 | % | 0.86 | % | 0.87 | %(c) | 0.86 | % | |||||||||||||||||||||||
Net Investment Income (Loss) | 1.69 | % | 1.84 | % | 2.00 | % | 1.74 | % | 2.56 | %(c) | 3.20 | % | |||||||||||||||||||||||
Portfolio Turnover Rate
|
| 32
| %
|
| 50
| %
|
| 38
| %
|
| 38
| %
|
| 52
| %
|
| 30
| %
| |||||||||||||||||
| CLASS I | Year Ended April 30, 2016 | Year Ended April 30, 2015 | Year Ended April 30, 2014 | Year Ended April 30, 2013 | For the Period April 30, 2012* | Year Ended June 30, 2011 | |||||||||||||||||||||||||||||
| Net Asset Value, Beginning of Year | $13.42 | $13.40 | $13.76 | $13.79 | $13.19 | $13.22 | |||||||||||||||||||||||||||||
| Income (Loss) From Operations: | |||||||||||||||||||||||||||||||||||
Net Investment Income (Loss)(a) | 0.26 | 0.28 | 0.30 | 0.28 | 0.32 | 0.45 | |||||||||||||||||||||||||||||
Net Realized and Unrealized Gain (Loss)on Investments | 0.37 | 0.15 | (0.24 | ) | 0.28 | 0.77 | 0.05 | ||||||||||||||||||||||||||||
|
| ||||||||||||||||||||||||||||||||||
| Total Income (Loss) From Operations | 0.63 | 0.43 | 0.06 | 0.56 | 1.09 | 0.50 | |||||||||||||||||||||||||||||
|
| ||||||||||||||||||||||||||||||||||
| Less Distributions From: | |||||||||||||||||||||||||||||||||||
Net Investment Income | (0.26 | ) | (0.29 | ) | (0.30 | ) | (0.28 | ) | (0.32 | ) | (0.45 | ) | |||||||||||||||||||||||
Net Realized Gains | (0.24 | ) | (0.12 | ) | (0.12 | ) | (0.31 | ) | (0.17 | ) | (0.08 | ) | |||||||||||||||||||||||
|
| ||||||||||||||||||||||||||||||||||
| Total Distributions | (0.50 | ) | (0.41 | ) | (0.42 | ) | (0.59 | ) | (0.49 | ) | (0.53 | ) | |||||||||||||||||||||||
|
| ||||||||||||||||||||||||||||||||||
| Net Asset Value, End of Year | $13.55 | $13.42 | $13.40 | $13.76 | $13.79 | $13.19 | |||||||||||||||||||||||||||||
|
| ||||||||||||||||||||||||||||||||||
| Total Return(b) | 4.81 | % | 3.17 | % | 0.55 | % | 4.06 | % | 8.33 | % | 3.90 | % | |||||||||||||||||||||||
| Net Assets, End of Year (000’s) | $267,864 | $259,904 | $199,503 | $247,914 | $146,009 | $141,519 | |||||||||||||||||||||||||||||
| Ratios to Average Net Assets | |||||||||||||||||||||||||||||||||||
Gross Expense | 0.84 | % | 0.88 | % | 0.89 | % | 0.90 | % | 0.68 | %(c) | 0.61 | % | |||||||||||||||||||||||
Net Expenses(d) | 0.49 | % | 0.55 | % | 0.61 | % | 0.61 | % | 0.62 | %(c) | 0.61 | % | |||||||||||||||||||||||
Net Investment Income (Loss) | 1.94 | % | 2.11 | % | 2.25 | % | 2.01 | % | 2.80 | %(c) | 3.44 | % | |||||||||||||||||||||||
| Portfolio Turnover Rate | 32 | % | 50 | % | 38 | % | 38 | % | 52 | % | 30 | % | |||||||||||||||||||||||
| (a) | Per share numbers have been calculated using the average shares method. |
| (b) | Based on net asset value, which does not reflect the sales charge or contingent deferred sales charge, if applicable. Total returns for periods of less than one year, if any, are not annualized. |
| (c) | Annualized for periods less than one year. |
| (d) | The investment advisor and other service providers waived or reimbursed a portion of their fees. |
| * | Year end changed from June 30 to April 30. |
| † | Effective March 9, 2012, the Fund acquired all of the assets and liabilities of the Wilmington Municipal Bond Fund, a series of WT Mutual Fund (the “WT Fund”). The financial highlights for the periods prior to that date reflect the performance of the WT Fund. |
See Notes which are an integral part of the Financial Statements.
| ANNUAL REPORT / April 30, 2016 |
| 60 |
| FINANCIAL HIGHLIGHTS (concluded) |
For a share outstanding throughout each year ended April 30, unless otherwise noted:
| WILMINGTON NEW YORK MUNICIPAL BOND FUND |
| CLASS A | Year Ended April 30, 2016 | Year Ended April 30, 2015 | Year Ended April 30, 2014 | Year Ended April 30, 2013 | Year Ended April 30, 2012 | |||||||||||||||||
| Net Asset Value, Beginning of Year | $10.66 | $10.56 | $10.75 | $10.59 | $10.08 | |||||||||||||||||
| Income (Loss) From Operations: | ||||||||||||||||||||||
Net Investment Income (Loss)(a) | 0.19 | 0.21 | 0.19 | 0.21 | 0.28 | |||||||||||||||||
Net Realized and Unrealized Gain (Loss)on Investments | 0.27 | 0.10 | (0.19 | ) | 0.16 | 0.51 | ||||||||||||||||
|
| |||||||||||||||||||||
| Total Income (Loss) From Operations | 0.46 | 0.31 | 0.00 | 0.37 | 0.79 | |||||||||||||||||
|
| |||||||||||||||||||||
| Less Distributions From: | ||||||||||||||||||||||
Net Investment Income | (0.19 | ) | (0.21 | ) | (0.19 | ) | (0.21 | ) | (0.28 | ) | ||||||||||||
Net Realized Gains | (0.02 | ) | — | — | — | — | ||||||||||||||||
|
| |||||||||||||||||||||
| Total Distributions | (0.21 | ) | (0.21 | ) | (0.19 | ) | (0.21 | ) | (0.28 | ) | ||||||||||||
|
| |||||||||||||||||||||
| Net Asset Value, End of Year | $10.91 | $10.66 | $10.56 | $10.75 | $10.59 | |||||||||||||||||
|
| |||||||||||||||||||||
| Total Return(b) | 4.32 | % | 2.91 | % | 0.04 | % | 3.48 | % | 7.99 | % | ||||||||||||
| Net Assets, End of Year (000’s) | $20,197 | $22,691 | $24,301 | $31,239 | $35,099 | |||||||||||||||||
| Ratios to Average Net Assets | ||||||||||||||||||||||
Gross Expense | 1.22 | % | 1.22 | % | 1.21 | % | 1.20 | % | 1.36 | % | ||||||||||||
Net Expenses(c) | 0.84 | % | 0.84 | % | 0.84 | % | 0.84 | % | 0.84 | % | ||||||||||||
Net Investment Income (Loss) | 1.76 | % | 1.93 | % | 1.79 | % | 1.94 | % | 2.73 | % | ||||||||||||
Portfolio Turnover Rate
|
| 24
| %
|
| 31
| %
|
| 34
| %
|
| 41
| %
|
| 87
| %
| |||||||
| CLASS I | Year Ended April 30, 2016 | Year Ended April 30, 2015 | Year Ended April 30, 2014 | Year Ended April 30, 2013 | Year Ended April 30, 2012 | |||||||||||||||||
| Net Asset Value, Beginning of Year | $10.67 | $10.57 | $10.76 | $10.60 | $10.08 | |||||||||||||||||
| Income (Loss) From Operations: | ||||||||||||||||||||||
Net Investment Income (Loss)(a) | 0.22 | 0.23 | 0.21 | 0.23 | 0.31 | |||||||||||||||||
Net Realized and Unrealized Gain (Loss)on Investments | 0.27 | 0.10 | (0.18 | ) | 0.16 | 0.52 | ||||||||||||||||
|
| |||||||||||||||||||||
| Total Income (Loss) From Operations | 0.49 | 0.33 | 0.03 | 0.39 | 0.83 | |||||||||||||||||
|
| |||||||||||||||||||||
| Less Distributions From: | ||||||||||||||||||||||
Net Investment Income | (0.22 | ) | (0.23 | ) | (0.22 | ) | (0.23 | ) | (0.31 | ) | ||||||||||||
Net Realized Gains | (0.02 | ) | — | — | — | — | ||||||||||||||||
|
| |||||||||||||||||||||
| Total Distributions | (0.24 | ) | (0.23 | ) | (0.22 | ) | (0.23 | ) | (0.31 | ) | ||||||||||||
|
| |||||||||||||||||||||
| Net Asset Value, End of Year | $10.92 | $10.67 | $10.57 | $10.76 | $10.60 | |||||||||||||||||
|
| |||||||||||||||||||||
| Total Return(b) | 4.58 | % | 3.17 | % | 0.30 | % | 3.74 | % | 8.33 | % | ||||||||||||
| Net Assets, End of Year (000’s) | $63,704 | $63,702 | $69,325 | $78,471 | $74,913 | |||||||||||||||||
| Ratios to Average Net Assets | ||||||||||||||||||||||
Gross Expense | 0.98 | % | 0.97 | % | 0.96 | % | 0.95 | % | 1.11 | % | ||||||||||||
Net Expenses(c) | 0.59 | % | 0.59 | % | 0.59 | % | 0.59 | % | 0.59 | % | ||||||||||||
Net Investment Income (Loss) | 2.01 | % | 2.18 | % | 2.05 | % | 2.18 | % | 2.99 | % | ||||||||||||
| Portfolio Turnover Rate | 24 | % | 31 | % | 34 | % | 41 | % | 87 | % | ||||||||||||
(a) Per share numbers have been calculated using the average shares method.
| (b) | Based on net asset value, which does not reflect the sales charge or contingent deferred sales charge, if applicable. Total returns for periods of less than one year, if any, are not annualized. |
| (c) | The investment advisor and other service providers waived or reimbursed a portion of their fees. |
See Notes which are an integral part of the Financial Statements
| April 30, 2016 / ANNUAL REPORT |
| 61 |
Wilmington Funds
April 30, 2016
1. ORGANIZATION
Wilmington Funds (the “Trust”) is registered under the Investment Company Act of 1940, as amended (the “Act”), as an open-end management investment company. The Trust consists of 16 portfolios, 5 of which are presented herein (individually referred to as a “Fund” or collectively as the “Funds”). The remaining 11 funds are presented in separate reports.
| Fund |
Investment Goal | |
Wilmington Broad Market Bond Fund (“Broad Market Bond Fund”)(d) | The Fund seeks to provide current income and secondarily, capital growth. | |
Wilmington Intermediate-Term Bond Fund (“Intermediate-Term Bond Fund”)(d) | The Fund seeks to provide current income and secondarily, capital growth. | |
Wilmington Short-Term Bond Fund Formerly known as Wilmington Short-Term Corporate Bond Fund (“Short-Term Bond Fund”)(d) | The Fund seeks to provide current income. | |
Wilmington Municipal Bond Fund (“Municipal Bond Fund”)(d) | The Fund seeks a high level of income exempt from federal income tax, consistent with the preservation of capital. | |
Wilmington New York Municipal Bond Fund (“New York Municipal Bond Fund”)(n) | The Fund seeks to provide current income that is exempt from both federal and New York personal income taxes. | |
(d) Diversified
(n) Non-diversified
The Trust offers 6 classes of shares: Class A, Service Class, Select Class, Administrative Class, Class I and Institutional Class. Service Class, Select Class, Administrative Class and Institutional Class are not available for the Funds. All shares of the Trust have equal rights with respect to voting, except on class-specific matters.
The assets of each portfolio are segregated and a shareholder’s interest is limited to the portfolio in which shares are held.
In the normal course of business, the Funds may enter into contracts that provide general indemnifications. The Funds’ maximum exposure under these arrangements is dependent on claims that may be made against the Funds in the future and therefore, cannot be estimated; however, based on experience, the risk of material loss from such claims is considered remote.
2. SUMMARY OF SIGNIFICANT ACCOUNTING POLICIES
The following is a summary of significant accounting policies consistently followed by the Funds in the preparation of their financial statements. These policies are in conformity with U.S. generally accepted accounting principles (“GAAP”). The Trust is an investment company and follows accounting and reporting guidance under Financial Accounting Standards Board (“FASB”) Accounting Standards Codification (“ASC”) Topic 946, “Financial Services - Investment Companies.” The preparation of financial statements in conformity with GAAP requires management to make estimates and assumptions that affect the amounts of assets, liabilities, expenses and revenues reported in the financial statements. Actual results could differ from those estimated.
Investment Valuation – Fair value of the Funds’ portfolio securities are determined as follows:
| • | investments in open-end regulated investment companies are valued at net asset value (“NAV”); |
| • | for fixed income securities, according to prices as furnished by an independent pricing service, except that fixed income securities with remaining maturities of less than 60 days at the time of purchase are valued at amortized cost provided such amount approximates fair value; and |
| • | for all other securities at fair value as determined in accordance with procedures established by and under the general supervision of the Board of Trustees (“Trustees”). |
The Trust follows the authoritative guidance (GAAP) for fair value measurements. The guidance establishes a framework for measuring fair value and a hierarchy for inputs used in measuring fair value that maximizes the use of observable inputs and minimizes the use of unobservable inputs by requiring that the most observable inputs be used when available. The guidance establishes three tiers of inputs that may be used to measure fair value. The three tiers of inputs are summarized at the end of each Fund’s Portfolio of Investments. The inputs or methodology used for valuing securities are not necessarily an indication of the risk associated with investing in those securities.
The Funds’ policy is to disclose transfers between levels based on valuations at the beginning of the reporting period. Each portfolio may hold securities which are periodically fair valued in accordance with the Funds’ fair value procedures. This may result in movements between Levels 1, 2 and 3 throughout the period. As of April 30, 2016, there were no transfers between Levels 1, 2 and 3 assets and liabilities, based on levels assigned to securities at the beginning of the period. Pursuant to the Funds’ fair value procedures noted previously, fixed income securities and money market instruments are generally categorized as Level 2 securities in the fair value hierarchy.
| ANNUAL REPORT / April 30, 2016 |
| 62 |
| NOTES TO FINANCIAL STATEMENTS (continued) |
Investments for which there are no such quotations, or for which quotations do not appear reliable, are valued at fair value in accordance with procedures approved by the Trustees. These valuations are typically categorized as Level 2 or Level 3 securities in the fair value hierarchy.
Repurchase Agreements – Repurchase agreements are transactions in which a Fund buys a security from a dealer or bank and agrees to sell the security back at a mutually agreed upon time and price. The repurchase price exceeds the sale price, reflecting the Fund’s return on the transaction. It is each Fund’s policy to require the counterparty to a repurchase agreement to transfer to the Funds’ custodian or sub-custodian eligible securities or cash with a market value (after transaction costs) at least equal to the repurchase price to be paid under the repurchase agreement. The eligible securities are transferred to accounts with the custodian or sub-custodian in which the Funds hold a “securities entitlement” and exercise “control” as those terms are defined in the Uniform Commercial Code. The Funds have established procedures for monitoring the market value of the transferred securities and requiring the transfer of additional eligible securities if necessary to equal at least the repurchase price. These procedures also allow the counterparty to require securities to be transferred from the account to the extent that their market value exceeds the repurchase price or in exchange for other eligible securities of equivalent market value.
The insolvency of the counterparty or other failure to repurchase the securities may delay the disposition of the underlying securities or cause the Funds to receive less than the full repurchase price.
Repurchase agreements are entered into by the Funds under Master Repurchase Agreements (“MRA”) which permit the Funds, under certain circumstances including an event of default (such as bankruptcy or insolvency), to offset payables and/or receivables under the MRA with collateral held and/or posted to the counterparty and create one single net payment due to or from the Fund.
At April 30, 2016, the open repurchase agreements by counterparty which are subject to a MRA on a net payment basis are as follows:
| Fund/Counterparty | Repurchase Agreements |
Fair Value of | Cash Collateral Received(1) | Net Amount(2) | ||||||||||||||||
Broad Market Bond Fund | ||||||||||||||||||||
BNP Paribas Securities Corp. | $ 271,373 | $ 271,373 | $— | $— | ||||||||||||||||
Citigroup Global Markets, Inc. | 271,373 | 271,373 | — | — | ||||||||||||||||
Daiwa Capital Markets America | 271,373 | 271,373 | — | — | ||||||||||||||||
HSBC Securities USA, Inc. | 271,373 | 271,373 | — | — | ||||||||||||||||
Nomura Securities International, Inc. | 271,373 | 271,373 | — | — | ||||||||||||||||
RBC Capital Markets LLC |
| 71,240
|
| 71,240 | — | — | ||||||||||||||
|
| $ 1,428,105
|
| $ 1,428,105 | $— | $— | |||||||||||||||
Intermediate-Term Bond Fund | ||||||||||||||||||||
BNP Paribas Securities Corp. | 195,320 | 195,320 | — | — | ||||||||||||||||
Citigroup Global Markets, Inc. | 195,320 | 195,320 | — | — | ||||||||||||||||
Daiwa Capital Markets America | 195,320 | 195,320 | — | — | ||||||||||||||||
HSBC Securities USA, Inc. | 195,320 | 195,320 | — | — | ||||||||||||||||
Nomura Securities International, Inc. | 195,320 | 195,320 | — | — | ||||||||||||||||
TD Securities (USA) LLC |
| 51,393
|
| 51,393 | — | — | ||||||||||||||
|
| $ 1,027,993
|
| $ 1,027,993 | $— | $— | |||||||||||||||
Short-Term Bond Fund | ||||||||||||||||||||
BNP Paribas Securities Corp. | 2,556,398 | 2,556,398 | — | — | ||||||||||||||||
Citigroup Global Markets, Inc. | 2,556,398 | 2,556,398 | — | — | ||||||||||||||||
Daiwa Capital Markets America | 2,556,398 | 2,556,398 | — | — | ||||||||||||||||
HSBC Securities USA, Inc. | 2,556,398 | 2,556,398 | — | — | ||||||||||||||||
Nomura Securities International, Inc. | 2,556,398 | 2,556,398 | — | — | ||||||||||||||||
TD Securities (USA) LLC | 672,635 | 672,635 | — | — | ||||||||||||||||
| $ 13,454,625 | $ 13,454,625 | $— | $— | |||||||||||||||||
(1)The amount of collateral reflected in the table does not include any over-collateralization received by the Fund.
(2)Net amount represents the net amount receivable due from the counterparty in the event of default.
| April 30, 2016 / ANNUAL REPORT |
| NOTES TO FINANCIAL STATEMENTS (continued) |
| 63 |
Investment Income, Gains and Losses, Expenses and Distributions – Interest income and expenses are accrued daily. All premiums and discounts on fixed income securities are amortized/accreted for financial statement purposes. Gains and losses realized on principal payment of mortgage-backed securities (paydown gains and losses) are classified as part of investment income. Dividends and distributions to shareholders are recorded on the ex-dividend date. Non-cash dividends included in dividend income, if any, are recorded at fair value. Foreign dividends are recorded on the ex-dividend date or when the Funds are informed of the ex-dividend date. Investment transactions are accounted for on a trade date basis for financial reporting purposes. Realized gains and losses from investment transactions are recorded on an identified cost basis.
Expenses of the Trust, which are directly identifiable to a specific Fund, are applied to that Fund. Expenses which are not identifiable to a specific Fund are allocated in such a manner as deemed equitable, taking into consideration the nature and type of expense.
All Funds offer multiple classes of shares. Investment income, realized and unrealized gains and losses, and certain fund-level expenses are allocated to each class based on relative daily net assets, except that each class bears certain expenses unique to that class such as distribution and shareholder services fees. Distributions are declared separately for each class. No class has preferential distribution rights; differences in per share distributions rates are generally due to differences in class specific expenses. Distributions from net realized gains, if any, are declared and paid to shareholders annually. Distributions from net investment income are declared daily and paid monthly.
Federal Taxes – It is the Funds’ policy to comply with the Subchapter M provision of the Internal Revenue Code of 1986, as amended (the “Code”), and to distribute to shareholders each year substantially all of their income. Accordingly, no provisions for Federal income tax or excise tax are necessary.
Withholding taxes and where appropriate, deferred withholding taxes, on foreign interest, dividends and capital gains have been provided for in accordance with the applicable country’s tax rules and rates.
The Funds recognize interest and penalties, if any, related to unrecognized tax benefits as income tax expense on the Statement of Operations. During the year ended April 30, 2016, the Funds did not incur any interest or penalties.
When-Issued and Delayed Delivery Transactions – The Funds may engage in when-issued or delayed delivery transactions. The Funds record when-issued securities on the trade date and maintain security positions such that sufficient liquid assets will be available to make payment for the securities purchased. Securities purchased on a when-issued or delayed delivery basis are marked to market daily and begin earning interest on the settlement date. Losses may occur on these transactions due to changes in market conditions or the failure of counterparties to perform under the contract.
The Funds may transact in “To Be Announced Securities” (“TBAs”). As with other delayed delivery transactions, a seller agrees to issue TBAs at a future date. However, the seller does not specify the particular securities to be delivered. Instead, the Funds agree to accept any security that meets specified criteria. For example, in a TBA mortgage transaction, the Fund and seller would agree upon the issuer, interest rate and terms of the underlying mortgages. The Funds record TBAs on the trade date utilizing information associated with the specified terms of the transactions as opposed to the specific mortgages. TBAs are marked to market daily and begin earning interest of the settlement date. Losses may occur due to the fact the actual underlying mortgages received may be less favorable than those anticipated by the Funds.
Restricted Securities – Restricted securities are securities that either (a) cannot be offered for public sale without first being registered, or being able to take advantage of an exemption from registration, under the Securities Act of 1933, as amended, or (b) are subject to contractual restrictions on public sales. In some cases, when a security cannot be offered for public sale without first being registered, the issuer of the restricted security has agreed to register such securities for resale, at the issuer’s expense, either upon demand by the Fund or in connection with another registered offering of the securities. Many such restricted securities may be resold in the secondary market in transactions exempt from registration. Restricted securities may be determined to be liquid under criteria established by the Trustees. A Fund will not incur any registration costs upon such resales. The Fund’s restricted securities are valued at the price provided by dealers in the secondary market or, if no market prices are available, at the fair value as determined in accordance with procedures established by and under the general supervision of the Trustees.
Dollar Roll Transactions – The Intermediate-Term Bond Fund and Broad Market Bond Fund may enter into dollar roll transactions, with respect to mortgage securities issued by GNMA, FNMA, and FHLMC, in which the Funds sell mortgage securities to financial institutions and simultaneously agree to accept substantially similar (same type, coupon, maturity) securities at a later date at an agreed upon price. Dollar roll transactions, which are treated as purchases and sales, will not exceed 12 months. There were no dollar roll transactions outstanding during the year ended April 30, 2016.
Lending of Portfolio Securities – The Trust has entered into an agreement with its custodian whereby the custodian may lend securities owned by the Funds to brokers, dealers and other financial organizations. Any increase or decrease in the fair value of securities loaned and any interest or dividends earned on those securities during the term of the loan would be for the account of the Fund. In exchange for lending securities under the terms of the agreement with their custodian, the Funds receive a lender’s fee. Fees earned by the Funds on securities lending are recorded as income. Loans of securities by the Funds are collateralized by cash, U.S. government securities or money market instruments that are maintained at all times in an amount at least equal to the current market value of the loaned securities plus a margin which varies depending on the type of securities owned. The custodian establishes and maintains the collateral in a segregated account. The Funds have the right under the lending agreement to recover the securities from the borrower on demand. The market value of the loaned securities is determined at the close of business of the Fund and any additional required collateral is delivered to the Fund on the next business day.
| ANNUAL REPORT / April 30, 2016 |
| 64 |
| NOTES TO FINANCIAL STATEMENTS (continued) |
Investments purchased with cash collateral are presented on the portfolios of investments under the caption “Cash Collateral Invested for Securities on Loan.”
The Funds maintain the risk of any loss on the securities on loan as well as the potential loss on investments purchased with cash collateral received from securities lending.
Securities lending transactions are entered into by the Funds under Master Securities Lending Agreements (“MSLA”) which permit the Funds, under certain circumstances including an event of default (such as bankruptcy or insolvency), to offset amounts payable by the Fund to the same counterparty against amounts to be received and create one single net payment due to or from the Fund. Utilization of acquired capital loss carryforwards from Short-Term Corporate Bond Fund’s acquisition of Short Duration Government Bond Fund and Municipal Bond Fund’s acquisition of Maryland Municipal Bond Fund may be subject to annual limitations.
At April 30, 2016, the securities loaned which are subject to a MSLA on a net payment basis are as follows:
| Fund | Value of Securities on Loan |
Cash Collateral Received(1) | Net Amount(2) | |||||||||
Broad Market Bond Fund | $1,379,438 | $1,379,438 | $— | |||||||||
Intermediate-Term Bond Fund | 988,959 | 988,959 | — | |||||||||
Short-Term Bond Fund | 13,162,118 | 13,162,118 | — | |||||||||
(1) Collateral with a value of $1,428,105, $1,027,993 and $13,454,625, respectively, has been received in connection with securities lending transactions. (2) Net amount represents the net amount receivable due from the counterparty in the event of default. | ||||||||||||
3. FEDERAL TAX INFORMATION
As of April 30, 2016, there are no uncertain tax positions that would require financial statement recognition, de-recognition or disclosure. The Funds’ federal tax returns filed for the periods ended 2015, 2014, and 2013, as well as the current tax year, remain subject to examination by the Internal Revenue Service.
The timing and character of income and capital gain distributions are determined in accordance with income tax regulations, which may differ from GAAP. These differences are due in part to the tax treatment of reclassifications of distributions, discount accretion/premium amortization on debt securities and capital gain or loss as a result of paydown activity. GAAP requires that permanent differences in net investment income and realized gains and losses due to differences between financial reporting and tax reporting be reclassified between various components of net assets and have no effect on the net assets nor the NAV of the Funds.
For the year ended April 30, 2016, permanent differences identified and reclassified among the components of net assets were as follows:
| Fund | Paid-in Capital | Increase (Decrease) Undistributed Net Investment Income | Accumulated Net Realized Gain (Loss) | |||||||||
Broad Market Bond Fund | $ | — | $902,768 | $ | (902,768) | |||||||
Intermediate-Term Bond Fund | — | 4,530 | (4,530) | |||||||||
Short-Term Bond Fund | — | 529,369 | (529,369) | |||||||||
The tax character of distributions for the corresponding fiscal years as reported on the Statements of Changes in Net Assets were as follows:
| Fund | Ordinary Income* |
2016 Tax Exempt | Long-Term Capital Gains | Ordinary Income* | 2015 Tax Exempt | Long-Term Capital Gains | ||||||||||||||||||
Broad Market Bond Fund | $9,747,956 | $ | — | $ | 504,626 | $7,699,108 | $ | — | $ | 674,691 | ||||||||||||||
Intermediate-Term Bond Fund | 2,090,943 | — | 391,707 | 2,248,626 | — | 1,972,089 | ||||||||||||||||||
Short-Term Bond Fund | 1,939,029 | — | 287,062 | 1,606,528 | — | 808,393 | ||||||||||||||||||
Municipal Bond Fund | 245,967 | 5,658,718 | 4,977,918 | 46,207 | 4,887,359 | 1,762,699 | ||||||||||||||||||
New York Municipal Bond Fund | — | 1,624,677 | 133,655 | — | 1,898,921 | — | ||||||||||||||||||
| * | For tax purposes, short-term capital gain distributions are considered ordinary income distributions. |
| April 30, 2016 / ANNUAL REPORT |
| NOTES TO FINANCIAL STATEMENTS (continued) |
| 65 |
As of April 30, 2016, the components of distributable earnings on a tax basis were as follows:
| Fund | Undistributed Ordinary Income | Undistributed Tax-Exempt Income |
Undistributed | Other Timing Differences | Unrealized Appreciation/ (Depreciation) | Capital Loss Carryforwards | Late Year Deferrals | |||||||||||||||||||||
Broad Market Bond Fund | $800,991 | $ — | $ — | $(790,229) | $10,837,116 | $ (555,531) | $ — | |||||||||||||||||||||
Intermediate-Term Bond Fund | 170,124 | — | — | (169,454) | 2,745,408 | — | (86,268) | |||||||||||||||||||||
Short-Term Bond Fund | 188,419 | — | — | (174,941) | 839,596 | (1,229,205) | — | |||||||||||||||||||||
Municipal Bond Fund | 151,991 | 451,439 | 340,766 | (451,392) | 14,728,347 | — | — | |||||||||||||||||||||
New York Municipal Bond Fund | — | 120,839 | 434,535 | (120,821) | 4,675,101 | — | — | |||||||||||||||||||||
At April 30, 2016, the following Funds had capital loss carryforwards which will reduce each Fund’s taxable income arising from future net realized gain on investments, if any, to the extent permitted by the Code and thus will reduce the amount of distributions to shareholders which would otherwise be necessary to relieve the Fund of any liability for federal income tax. Pursuant to the Code, such capital loss carryforwards will expire as follows:
| Capital Loss Available Through | Short-Term |
Long-Term | Total Capital Loss | |||||
| Fund | 2018 | No Expiration | No Expiration | Carryforwards | ||||
Broad Market Bond Fund | $ — | $354,793 | $200,738 | $555,531 | ||||
Short-Term Bond Fund | 108,426 | 779,126 | 341,653 | 1,229,205 |
The Funds utilized capital loss carryforwards as follows to offset taxable capital gains realized during the year ended April 30, 2016:
| Fund |
Capital Loss | |
New York Municipal Bond Fund | $916,858 |
Under current tax regulations, capital losses on securities transactions realized after October 31 may be deferred and treated as occurring on the first day of the following fiscal year. Under the Regulated Investment Company Modernization Act of 2010, the Funds are permitted to defer taxable ordinary income losses incurred after December 31 and treat as occurring on the first day of the following fiscal year. Post-October, Post-December and Late Year losses deferred to May 1, 2016 are as follows:
| Fund | Ordinary Post-December Losses |
Short-Term Capital Losses | Long-Term Losses | |||
Intermediate-Term Bond Fund | $— | $6,688 | $79,580 |
4. ADVISORY FEES, SERVICING FEES, AND OTHER SERVICE PROVIDERS
Investment Advisor – Wilmington Funds Management Corporation (“WFMC” or the “Advisor”) serves as the Investment Advisor to each of the Funds. Wilmington Trust Investment Advisors, Inc. (“WTIA”) provides sub-advisory services to the Funds. WFMC and WTIA are wholly-owned subsidiaries of M&T Bank Corporation. For its services, the Funds pay WFMC an annual investment advisory fee, accrued and paid daily, based on a percentage of each Fund’s average daily net assets as described below. WFMC, not the Funds, pays WTIA for it services.
| Fund |
Advisory Fee Annual Rate | |
Broad Market Bond Fund | 0.45% | |
Intermediate-Term Bond Fund | 0.45% | |
Short-Term Bond Fund | 0.40% | |
Municipal Bond Fund | 0.45% | |
New York Municipal Bond Fund | 0.45% |
| ANNUAL REPORT / April 30, 2016 |
| 66 |
| NOTES TO FINANCIAL STATEMENTS (continued) |
WFMC and the Funds’ distributor and shareholder service providers have contractually agreed to waive their fees and/or reimburse expenses through August 31, 2017, so that total annual fund operating expenses paid by the Funds (not including the effects of dividends or interest on short positions, acquired fund fees and expenses, taxes, or other extraordinary expenses expressed as an annualized percentage of average daily net assets), will not exceed the expense limitations set forth below. Neither WFMC nor the Funds’ distributor will recoup previously waived fees / expenses in subsequent years.
Contractual Expense Limitations | ||||||||
| Fund |
Class A | Class I | ||||||
Broad Market Bond Fund | 0.90% | 0.55% | ||||||
Intermediate-Term Bond Fund | 0.88% | 0.53% | ||||||
Short-Term Bond Fund | 0.73% | 0.48% | ||||||
Municipal Bond Fund | 0.74% | 0.49% | ||||||
New York Municipal Bond Fund | 0.84% | 0.59% | ||||||
Administrative Fees – The Bank of New York Mellon (“BNYM”) provides the Trust with fund administration services. The fees as described in the table below are a component of “Portfolio accounting and administration fees” as disclosed in the Statements of Operations. WFMC, in its role as Co-Administrator, provides the Funds with certain administrative personnel and services necessary to operate the Funds. The fees as described in the table below are accrued and paid daily and are disclosed on the Statement of Operations as “Administrative personnel and services fees.
| Administrator | Maximum Fee |
Average Aggregate Daily Net | ||||
WFMC | 0.040% | on the first $5 billion | ||||
| 0.030% | on the next $2 billion | |||||
| 0.025% | on the next $3 billion | |||||
| 0.018% | on assets in excess of $10 billion | |||||
BNYM | 0.0285% | on the first $500 million | ||||
| 0.0280% | on the next $500 million | |||||
| 0.0275% | on assets in excess of $1 billion | |||||
BNYM and WFMC may voluntarily choose to waive any portion of their fee and can add, modify or terminate a voluntary wavier at any time at their sole discretion. For the year ended April 30, 2016, BNYM waived amounts identified in the Statement of Operations as “Waiver of portfolio accounting and administration fees” and WFMC did not waive any administrative personnel and services fees.
Distribution Services Fee – The Trust has adopted a Distribution Services Plan (the “Plan”) pursuant to Rule 12b-1 under the Act. The Plan allows the Funds to pay fees to financial intermediaries, which may be paid through ALPS Distributors, Inc. (“ALPS”), the principal distributor, at an annual rate of up to 0.25% of the average daily net assets of the Funds’ Class A shares for the sale, distribution, administration, customer servicing and recordkeeping of these shares.
The Trust may reduce the maximum amount of distribution services fees it pays from time to time at its sole discretion. In addition, a financial intermediary (including ALPS, the Advisor or their affiliates), may voluntarily waive or reduce any fees to which they are entitled.
For the year ended April 30, 2016, M&T Securities, Inc. and Manufacturers and Traders Trust Company (together “M&T”), affiliates of the Advisor, received all or a portion of the fees paid by the Funds which are listed below:
| Fund | Distribution Fees | |||
Broad Market Bond Fund | $ | 9,438 | ||
Intermediate-Term Bond Fund | 4,768 | |||
Short-Term Bond Fund | 13,173 | |||
Municipal Bond Fund | 82,474 | |||
New York Municipal Bond Fund | 46,489 | |||
Sales Charges – The Class A shares of all the Funds bear front-end sales charges.
For the year ended April 30, 2016, M&T received the amounts listed below from sales charges on the sale of Class A shares.
| Fund |
Sales Charges | ||||
Broad Market Bond Fund | $ | 500 | |||
Intermediate-Term Bond Fund | 45 | ||||
Short-Term Bond Fund | 443 | ||||
Municipal Bond Fund | 11,581 | ||||
New York Municipal Bond Fund | 4,907 | ||||
| April 30, 2016 / ANNUAL REPORT |
| NOTES TO FINANCIAL STATEMENTS (continued) |
| 67 |
Shareholder Services Fee – Pursuant to a Shareholder Services Plan adopted by the Funds and administered by ALPS, the Funds may pay up to 0.25% of the average daily net assets of each Fund’s Class A and Class I shares to financial intermediaries (which may include ALPS, the Advisor or their affiliates) for providing shareholder services and maintaining shareholder accounts. M&T has entered into a Shareholders Services Agreement with ALPS, under which it is entitled to receive up to 0.25% of the average daily net assets of each Fund’s shares for whom M&T provides shareholder services. The Funds may reduce the maximum amount of shareholder service fees it pays from time to time at its sole discretion. In addition, a financial intermediary (including M&T) may waive or reduce any fees to which they are entitled.
For the year ended April 30, 2016, M&T received a portion of the fees paid by the following Funds which are listed below:
| Fund |
Shareholder Services Fee | |
Broad Market Bond Fund | $3,246 | |
Intermediate-Term Bond Fund | 1,599 |
Other Service Providers – Foreside Management Services, LLC (“FMS”) provides a Principal Executive Officer and Principal Financial Officer to the Trust. FMS has no role in determining the investment policies or which securities are to be sold or purchased by the Trust or its Funds.
BNYM provides custody services to the Trust.
BNY Mellon Investment Servicing (U.S.) Inc. provides fund accounting and transfer agency services to the Trust.
General – Certain Officers of the Trust are also Officers or employees of the above companies that provide services to the Funds, and during their terms of office, receive no compensation from the Funds. The Trust’s Statement of Additional Information includes additional information about the Trustees.
5. INVESTMENT TRANSACTIONS
Purchases and sales of investments, excluding short-term obligations, U.S. Government Securities and in-kind transactions, for the year ended April 30, 2016 were as follows:
Investments
| ||||||||
| Fund | Purchases | Sales | ||||||
Broad Market Bond Fund | $147,449,359 | $152,457,199 | ||||||
Intermediate-Term Bond Fund | 22,415,384 | 35,060,265 | ||||||
Short-Term Bond Fund | 63,650,001 | 112,283,244 | ||||||
Municipal Bond Fund | 92,988,715 | 97,669,306 | ||||||
New York Municipal Bond Fund | 19,490,938 | 25,284,780 | ||||||
Purchases and sales of investments of U.S. Government Securities for the year ended April 30, 2016 were as follows:
U.S. Government Securities
| ||||||||
| Fund | Purchases | Sales | ||||||
Broad Market Bond Fund | $ 41,511,413 | $31,633,297 | ||||||
Intermediate-Term Bond Fund | 16,577,003 | 11,522,772 | ||||||
Short-Term Bond Fund | 97,963,791 | 74,952,902 | ||||||
6. CONCENTRATION OF RISK
Since New York Municipal Bond Fund invests a substantial portion of its assets in issuers located in one state, it will be more susceptible to factors adversely affecting issuers of that state than would be a comparable tax-exempt mutual fund that invests nationally. In order to reduce the credit risk associated with such factors, at April 30, 2016, 19.9% of New York Municipal Bond Fund’s total market value of the securities in the portfolio of investments are backed by bond insurance of various financial institutions and financial guaranty assurance agencies.
7. LINE OF CREDIT
Effective March 9, 2016, the Trust is participating in a $10,000,000 unsecured, committed revolving line of credit (“LOC”) agreement with BNYM. The LOC is available for extraordinary or emergency purposes, primarily for financing redemption payments. Borrowings are charged interest at a rate of 1.25% per annum over the greater of the Federal Funds Rate or the overnight LIBOR Rate. The LOC includes a commitment fee of 0.15% per annum on the daily unused portion. The termination date of this LOC is March 7, 2017.
| ANNUAL REPORT / April 30, 2016 |
| 68 |
| NOTES TO FINANCIAL STATEMENTS (continued) |
Prior to March 9, 2016, the Trust participated in a $20,000,000 LOC with BNYM. The LOC was made available for extraordinary or emergency purposes, primarily for financing redemption payments. Borrowings were charged interest at a rate of 1.25% per annum over the greater of the Federal Funds Rate or the overnight LIBOR Rate. The LOC included a commitment fee of 0.10% per annum on the daily unused portion.
The Funds did not utilize the LOC for the year ended April 30, 2016.
| 8. | REORGANIZATION |
On September 18, 2014, the Board approved an Agreement and Plans of Reorganization (the “Reorganizations”) which provided for the transfer of all the assets of the Short Duration Government Bond Fund and the Maryland Municipal Bond Fund, each a series of the Trust (the “Acquired Funds”), for shares of the Short-Term Corporate Bond Fund and the Municipal Bond Fund (the “Acquiring Funds”), respectively. Shareholders approved the Reorganizations at a meeting held on January 15, 2015 and the Reorganizations closed on January 30, 2015 based on net asset values determined as of close of business on January 30, 2015. The acquisitions were accomplished through tax-free exchanges of assets and shares.
The purpose of this transaction was to combine the Funds with the same Investment Manager and with substantially similar investment objectives, policies, and restrictions. Due to the small size of the Acquired Funds and the comparatively better prospects for asset growth of the Acquiring Funds, it was believed that the shareholders’ best interest would be served by reorganizing the Acquired Funds into the Acquiring Funds.
In addition, the Short-Term Corporate Bond Fund (as one of the Acquiring Funds) experienced the following changes. First, the name of the Acquiring Fund was changed to the “Wilmington Short-Term Bond Fund”. Second, the Principal Investment Strategies of the Acquiring Fund was revised to remove the 80% limitation related to investment in corporate debt securities to allow the Fund to invest primarily in U.S. investment grade corporate and government fixed income securities.
For financial reporting purposes, each of the Acquiring Funds was deemed to be the accounting survivor.
| Value of Shares |
Acquired Fund Shares Prior to Reorganization | Shares Issued by Acquiring Fund | Net Assets | ||||||||||||||||||||
Acquiring Fund | |||||||||||||||||||||||
Wilmington Short-Term Bond Fund | $93,759,730 | ||||||||||||||||||||||
Acquired Fund | |||||||||||||||||||||||
Wilmington Short Duration Government Bond Fund | 87,480,297 | ||||||||||||||||||||||
Class A shares in exchange for Class A | $7,021,999 | 745,255 | 694,098 | ||||||||||||||||||||
Class I shares in exchange for Class I | 80,458,298 | 8,522,359 | 7,950,847 | ||||||||||||||||||||
| $181,240,027 | |||||||||||||||||||||||
| Value of Shares |
Acquired Fund Shares Prior to | Shares Issued by Acquiring Fund | Net Assets | ||||||||||||||||||||
Acquiring Fund | |||||||||||||||||||||||
Wilmington Municipal Bond Fund | $219,313,878 | ||||||||||||||||||||||
Acquired Fund | |||||||||||||||||||||||
Wilmington Maryland Municipal Bond Fund | 88,064,168 | ||||||||||||||||||||||
Class A shares in exchange for Class A | $27,966,651 | 2,729,770 | 2,047,329 | ||||||||||||||||||||
Class I shares in exchange for Class I | 60,097,517 | 5,856,789 | 4,397,825 | ||||||||||||||||||||
| $307,378,046 | |||||||||||||||||||||||
The net assets of the Acquired Funds included net unrealized appreciation on investments of $1,165,527 and $4,651,902 and accumulated net realized gains (losses) of $(313,681) and $435,174 for the Short Duration Government Bond Fund and Maryland Municipal Bond Fund, respectively.
The financial statements of the Funds reflect the operations of the Acquiring Funds for the period prior to the Reorganizations and the combined fund for the period subsequent to the Reorganizations. Because each of the combined investment portfolios have been managed as a single integrated portfolio since the Reorganizations were completed, it is not practicable to separate the amounts of revenue and earnings of each Acquired Fund that have been included in each combined Fund’s Statement of Operations since the Reorganizations were completed. For every Class A Share and Class I Share exchanged, a shareholder of Short Duration Government Bond Fund received approximately 0.93 Class A Shares and Class I Shares, respectively of Short-Term Bond Fund. For every Class A Share and Class I Share exchanged, a shareholder of Maryland Municipal Bond Fund received approximately 0.75 Class A Shares and Class I Shares, respectively of Municipal Bond Fund. Assuming the Reorganizations had been completed on May 1, 2014, the pro forma net investment income, net realized and unrealized
| April 30, 2016 / ANNUAL REPORT |
| NOTES TO FINANCIAL STATEMENTS (continued) |
| 69 |
gain/(loss) on investments and net increase in net assets from operations for the fiscal year ended April 30, 2015 would have been $2,202,814, $(545,502) and $1,657,312, for the Short Duration Government Bond Fund and $5,940,465, $3,103,054 and $9,043,519, for the Maryland Municipal Bond Fund, respectively.
| 9. | SUBSEQUENT EVENTS |
Management has evaluated events and transactions for potential recognition or disclosure in the financial statements through the date the financial statements were issued. Management has determined that, there are no material events that would require recognition or disclosure in the Funds’ financial statements through this date.
| ANNUAL REPORT / April 30, 2016 |
| 70 |
REPORT OF INDEPENDENT REGISTERED PUBLIC ACCOUNTING FIRM
TO THE SHAREHOLDERS AND BOARD OF TRUSTEES OF
WILMINGTON FUNDS
We have audited the accompanying statements of assets and liabilities, including the portfolios of investments, of the Wilmington Broad Market Bond Fund, Wilmington Intermediate-Term Bond Fund, Wilmington Short-Term Bond Fund, Wilmington Municipal Bond Fund and Wilmington New York Municipal Bond Fund (five of the series constituting the Wilmington Funds) (the “Funds”) as of April 30, 2016, and the related statements of operations for the year then ended, the statements of changes in net assets for each of the two years in the period then ended, and the financial highlights for each of the years or periods indicated therein. These financial statements and financial highlights are the responsibility of the Funds’ management. Our responsibility is to express an opinion on these financial statements and financial highlights based on our audits.
We conducted our audits in accordance with standards of the Public Company Accounting Oversight Board (United States). Those standards require that we plan and perform the audit to obtain reasonable assurance about whether the financial statements and financial highlights are free of material misstatement. We were not engaged to perform an audit of the Funds’ internal control over financial reporting. Our audits included consideration of internal control over financial reporting as a basis for designing audit procedures that are appropriate in the circumstances, but not for the purpose of expressing an opinion on the effectiveness of the Funds’ internal control over financial reporting. Accordingly, we express no such opinion. An audit also includes examining, on a test basis, evidence supporting the amounts and disclosures in the financial statements and financial highlights, assessing the accounting principles used and significant estimates made by management, and evaluating the overall financial statement presentation. Our procedures included confirmation of securities owned as of April 30, 2016, by correspondence with the custodian and brokers, or by other appropriate auditing procedures where replies from the brokers were not received. We believe that our audits provide a reasonable basis for our opinion.
In our opinion, the financial statements and financial highlights referred to above present fairly, in all material respects, the financial position of the Wilmington Broad Market Bond Fund, Wilmington Intermediate-Term Bond Fund, Wilmington Short-Term Bond Fund, Wilmington Municipal Bond Fund and Wilmington New York Municipal Bond Fund (five of the series constituting the Wilmington Funds) at April 30, 2016, the results of their operations for the year then ended, the changes in their net assets for each of the two years in the period then ended, and their financial highlights for each of the years or periods indicated therein, in conformity with U.S. generally accepted accounting principles.

Philadelphia, Pennsylvania
June 29, 2016
| April 30, 2016 / ANNUAL REPORT |
| BOARD OF TRUSTEES AND TRUST OFFICERS |
| 71 |
BOARD OF TRUSTEES AND TRUST OFFICERS
The following tables give information about each Trustee and the senior officers of the Trust. The tables separately list Trustee members who are “interested persons” of the Fund (i.e., “Interested” Trustees) and those who are not (i.e., “Independent” Trustees). The Trust is comprised of 16 funds. Unless otherwise noted, the business address of each Trustee and senior officer is 111 South Calvert Street, 26th floor, Baltimore, Maryland 21202. Each Trustee oversees all portfolios of the Trust and serves for an indefinite term. The Trust’s Statement of Additional Information includes additional information about the Trustees and is available, without charge and upon request, by calling 1-800-836-2211.
INTERESTED TRUSTEES BACKGROUND
Name Address Birth Year Position With Trust Date Service Began
| Principal Occupations and Other Directorships Held for Past Five Years
| |
Donald E. Foley* Birth year: 1951 TRUSTEE Began serving: December 2015 | Principal Occupations: Advisory Member, Trust and Investment Committee, M&T Bank, Wilmington Trust, National Association, and Wilmington Trust Company.
Other Directorships Held: Director, AXA Equitable (variable annuity) (2013-Present); Director, 1290 Mutual Funds (retail funds) (2013-Present); Chairman and Director, Burke Rehabilitation Hospital Foundation (private hospital, research institute) (2005-Present); Director, M&T Bank Corporation (commercial bank) (2011-2012); Chairman and Director, Wilmington Trust Corporation (commercial and trust bank) (2007-2011); Chairman, Director and President’s Council, Union College (private college) (2011-2015).
Previous Positions: Director of M&T Bank Corporation and M&T Bank (2011 to 2012). Chairman and Chief Executive Officer of Wilmington Trust Corporation (2010-2011); Senior Vice President and Treasurer at ITT Corporation (1996-2010); Assistant Treasurer at International Paper (1989-1996).
| |
| ||
Christopher D. Randall* Birth year: 1965 TRUSTEE Began serving: September 2015 PRESIDENT Began serving: September 2014 | Principal Occupations: Chief Operations Officer and a Senior Vice President of Wilmington Trust’s Wealth and Institutional Services Division (WISD); Senior Vice President of M&T Bank.
Other Directorships Held: None.
Previous Positions: President and Chief Executive Officer of Wilmington Trust Investment Advisors, Inc. and President of Wilmington Trust Investment Management, LLC (2014-2015); Senior Vice President, Head of Asset Management and Retirement Services (2012 to 2014); President, Mid-Atlantic Division, Wilmington Trust, N.A. (2011 to 2012); President, M&T Securities, Inc. (2009 to 2011).
| |
| ||
| * | Christopher D. Randall is “interested” due to the positions he currently holds with the Funds, Wilmington Trust’s Wealth and Institutional Services Division, M&T Bank, the parent of the Fund’s Advisor, and previous positions held with WTIA and WFMC. Donald E. Foley is “interested” due to the positions he previously held with Wilmington Trust Corporation, M&T Bank Corporation and M&T Bank, the parent of the Fund’s Advisor. |
| ANNUAL REPORT / April 30, 2016 (unaudited) |
| 72 |
| BOARD OF TRUSTEES AND TRUST OFFICERS |
INDEPENDENT TRUSTEES BACKGROUND
Name Birth Year Position with Trust Date Service Began
| Principal Occupations and Other Directorships Held for Past Five Years
| |
Nicholas A. Giordano Birth year: 1943 CHAIRMAN and TRUSTEE Began serving: March 2012 | Principal Occupations: Consultant, financial services organizations (1997 to present).
Other Directorships Held: Kalmar Pooled Investment Trust; The RBB Fund Inc. (19 portfolios) (registered investment companies); Independence Blue Cross; IntriCon Corporation (body-worn medical and electronic products)
Previous Positions: Interim President, LaSalle University (1998 to 1999); President and Chief Executive Officer, Philadelphia Stock Exchange (1981 to 1997).
| |
| ||
Robert H. Arnold Birth year: 1944 TRUSTEE Began serving: March 2012 | Principal Occupations: Managing Director, R.H. Arnold & Co, Inc. (financial management consulting) (6/89 to present).
Other Directorships Held: Trustee, First Potomac Realty Trust (real estate investment trust) (5/01 to present); Director, Treasury Strategies, Inc. (private treasury consulting services) (6/01 to present).
| |
| ||
Joseph J. Castiglia Birth year: 1934 TRUSTEE Began serving: February 1988 | Principal Occupations: Consultant (not-for-profit) and Private Investor.
Other Directorships Held: Chairman, Trustee and Treasurer, Buffalo Olmsted Parks Conservancy (1/05 to 5/13); Chairman and Trustee, Buffalo Philharmonic Foundation (1/06 to 11/12); Vice Chairman and Trustee, Christ the King Seminary (1/05 to present); Director, Dunn Tire Corporation (1/05 to present); Chairman, Director and Treasurer, Read to Succeed Buffalo (1/08 to present); HCR Corporation (home care) (3/14 to present).
Previous Positions: President, Chief Executive Officer, Vice President, Treasurer and Vice Chairman, Pratt & Lambert United (manufacturer of paints, coatings and adhesives) (12/67- 1/96); Chairman and Director, Catholic Health (hospitals, nursing homes and home care) (1/97 to 5/03); Chairman and Director, Blue Cross Blue Shield of Western New York (5/92 to 5/07); Lead Director and Director, Energy East Corporation (gas and electric utility); Chairman and Director, Federal Reserve Bank of New York, Buffalo Branch; Chairman and Director, Community Foundation for Greater Buffalo; Chairman and Trustee, Canisius College; Chairman and Director, AAA of Western & Central New York.
| |
| ||
John S. Cramer Birth year: 1942 TRUSTEE Began serving: December 2000 | Principal Occupations: Senior Consultant, Yaffe & Co. (health care consulting) (2/06 to present).
Other Directorships Held: Chairman and Director, CI Supply Corp. (medical supplies and equipment) (1/14 to 1/15); Director, Check Med Corp. (medical supplies and equipment) (6/08 to 1/14); Director, Highmark Blue Shield (health insurance) (2/01 to 6/10).
Previous Positions: Consultant, Yaffe & Co. (compensation consultants) (6/02 to 6/12); President and Chief Executive Officer, Pinnacle Health Systems (nonprofit hospital and health care system in Central Pennsylvania).
| |
| ||
Daniel R. Gernatt, Jr. Birth year: 1940 TRUSTEE Began serving: February 1988 | Principal Occupations: President and CEO, Gernatt Asphalt Products, Inc. (asphalt, sand and gravel products) (1979 to present).
Other Directorships Held: Director, Roswell Park Alliance (2008 to present); Trustee, Gernatt Family Foundation.
| |
| ||
Richard B. Seidel Birth year: 1941 TRUSTEE Began serving: September 2003 | Principal Occupations: President, R.B. Seidel & Associates (legal and consulting) (1/14 to present); President, Girard Private (investment) (1/14 to present); Chairman, Girard Capital (broker-dealer) (1/10 to present).
Other Directorships Held: Director, Tristate Capital Bank (1/08 to present).
| |
| ||
| April 30, 2016 (unaudited) / ANNUAL REPORT |
| BOARD OF TRUSTEES AND TRUST OFFICERS |
| 73 |
OFFICERS
Name Address Birth Year Positions with Trust
| Principal Occupations for Past Five Years and Previous Positions
| |
Michael D. Daniels Birth year: 1967 CHIEF OPERATING OFFICER Began serving: June 2007 | Principal Occupations: Chief Operating Officer, Wilmington Funds and Wilmington Trust Investment Advisors, Inc.; Administrative Vice President, M&T Bank.
Previous Positions: Senior Vice President, MSD&T and MCA (2006 to 2007); Vice President, Calamos Asset Management (2004 to 2006); Vice President, JP Morgan Chase Bank (2002 to 2004).
| |
| ||
Jeffrey M. Seling Birth year: 1970 ASSISTANT TREASURER Began serving: June 2013 VICE PRESIDENT Began serving: June 2007
| Principal Occupations: Vice President, M&T Bank and Wilmington Trust Investment Advisors, Inc.; Assistant Treasurer, Wilmington Funds.
Previous Positions: Vice President, MSD&T; Assistant Vice President, Wells Fargo Bank; Assistant Vice President, JP Morgan Chase Bank. | |
| ||
John C. McDonnell Birth year: 1966 VICE PRESIDENT AND ASSISTANT TREASURER Began serving: June 2013 | Principal Occupations: Vice President, Wilmington Funds Management Corporation (2005 to present); Vice President, Wilmington Trust Investment Advisors, Inc. (2012 to present).
Previous Positions: Vice President, Wilmington Trust Investment Management, LLC (2005 to 2012); Audit Senior, Deloitte LLP (2004 to 2005); Assistant Vice President, 1838 Investment Advisors, LP (1999 to 2004).
| |
| ||
Mary Ellan Reilly Birth year: 1970 CHIEF COMPLIANCE OFFICER and AML COMPLIANCE OFFICER. Began serving: March 2015 | Principal Occupations: Chief Compliance Officer and Anti-Money Laundering Officer, Wilmington Funds; Administrative Vice President, M&T Bank.
Previous Positions: Administrative Vice President, M&T Bank, and Program Director, Buffalo Promise. Neighborhood (2013-2015); Vice President, M&T Bank, and Product Manager, Wilmington Trust Retirement and Institutional Services Company (2010-2013); Vice President, M&T Bank, and Risk Manager, M&T Investment Group (2006 to 2010).
| |
| ||
Eric B. Paul Birth year: 1974 VICE PRESIDENT Began serving: June 2008
| Principal Occupations: Administrative Vice President, M&T Bank (2003 to present); Director of Proprietary Products, M&T Bank (2008 to present). | |
| ||
Ralph V. Partlow, III 25 South Charles Street, 22nd floor Baltimore, MD 21201 Birth year: 1957 VICE PRESIDENT Began serving: June 2010
| Principal Occupation: Administrative Vice President and Deputy General Counsel, M&T Bank (2003 to present).
Previous Positions: Vice President and Senior Counsel, Allfirst Bank (1995 to 2003). | |
| ||
Christopher W. Roleke 10 High Street, Suite 302 Boston, MA 02110 Birth year: 1972 CHIEF FINANCIAL OFFICER AND TREASURER Began serving: July 2013
| Principal Occupation: Managing Director and Fund Principal Financial Officer, Foreside Management Services, LLC (2011 to present).
Previous Positions: Assistant Vice President, JP Morgan Investor Services Co. (2006 to 2011). | |
| ||
| ANNUAL REPORT / April 30, 2016 (unaudited) |
| 74 |
| BOARD OF TRUSTEES AND TRUST OFFICERS |
Name Address Birth Year Positions with Trust
| Principal Occupations for Past Five Years and Previous Positions
| |
Lisa R. Grosswirth Atlantic Terminal Office Tower, 2 Hanson Place, 12th Floor Brooklyn, NY 11217 Birth year: 1963 SECRETARY Began serving: September 2007
| Principal Occupation: Vice President, BNY Mellon Asset Servicing (2004 to present).
Previous Positions: Supervisory Paralegal, The Dreyfus Corporation (1998 to 2004). | |
| ||
Richard J. Berthy Three Canal Plaza, Suite 100 Portland, ME 04101 Birth year: 1958 CHIEF EXECUTIVE OFFICER Began serving: September 2007 | Principal Occupation: Chief Executive Officer, Foreside Financial Group, LLC (2012 to present).
Previous Positions: President, Foreside Financial Group, LLC (2008 to 2012); Chief Administrative Officer, Foreside Financial Group, LLC (2005 to 2008); President and Secretary, Bainbridge Capital Management, LLC (2003 to 2006); Vice President, Bainbridge Capital Management (2002 to 2004).
| |
| ||
| April 30, 2016 (unaudited) / ANNUAL REPORT |
| 75 |
Shares of the Wilmington Funds are not FDIC insured or otherwise protected by the U.S. government, are not deposits or other obligations of, or guaranteed by, Manufacturers and Traders Trust Company, and are subject to investment risks, including possible loss of the principal amount invested.
VOTING PROXIES ON FUND PORTFOLIO SECURITIES
A description of the policies and procedures that the Funds use to determine how to vote proxies relating to securities held in the Funds’ portfolios is available, without charge and upon request, by calling 1-800-836-2211. A report on how the Funds voted any such proxies during the most recent 12-month period ended June 30 is available through Wilmington Funds’ website. Go to www.wilmingtonfunds.com select “Proxy Voting Record” to access the link. This information is also available from the Edgar database on the SEC’s website at www.sec.gov.
QUARTERLY PORTFOLIO SCHEDULE
The Funds file with the SEC a complete schedule of their portfolio holdings, as of the close of the first and third quarters of their fiscal year, on Form N-Q. These filings are available on the SEC’s website at www.sec.gov and may be reviewed and copied at the SEC’s Public Reference Room in Washington DC. (Call 1-800-SEC-0330 for information on the operation of the Public Reference Room.)
Electronic Delivery
Wilmington Funds encourages you to sign up for electronic delivery of investor materials. By doing so you will receive information faster, help lower shareholder costs, and reduce the impact to the environment. To enroll in electronic delivery:
| 1.) | Go to www.wilmingtonfunds.com and select “Individual Investors” |
| 2.) | Click on the link “Sign up for Electronic Delivery” |
| 3.) | Login to your account or create new user ID |
| 4.) | Select E-Delivery Consent from the available options, and |
| 5.) | Complete the information requested, including providing the email address where you would like to receive notification for electronic documents. |
| * | If you hold your account through a financial intermediary, please contact your advisor to request electronic delivery of investor materials. |
Householding
In an effort to reduce volume of mail you receive, only one copy of the prospectus, annual/semi-annual report, SAI and proxy statements will be sent to shareholders who are part of the same family and share the same address.
If you would like to request additional copies of the prospectus, annual/semi-annual report or SAI, or wish to opt out of householding mailings, please contact Shareholder Services at 1-800-836-2211, or write to Wilmington Funds, P.O. Box 9828, Providence, RI 02940-8025.
| SEMI-ANNUAL REPORT / April 30, 2016 |
| 76 |
PRIVACY POLICY AND NOTICE
OF THE FUNDS AND THEIR DISTRIBUTOR
June 8, 2012
The Wilmington Funds, their distributor and their agents (referred to as “the Funds”, “we” or “us”) recognize that consumers (referred to as “you” or “your”) expect us to protect both your assets and financial information. We respect your right to privacy and your expectation that all personal information about you or your account will be maintained in a secure manner. We are committed to maintaining the confidentiality, security and integrity of client and shareholder information. We want you to understand the Funds’ policy that governs the handling of your information, how the Funds gather information, how that information is used and how it is kept secure.
Information The Funds Collect:
The Funds collect nonpublic personal information about you from the following sources:
| • | We may receive information from you, or from your financial representative, on account applications, other forms or electronically (such as through the Funds’ website or other electronic trading mechanisms). Examples of this information include your name, address, social security number, assets and income. |
| • | We may receive information from you, or from your financial representative, through transactions with us or others, correspondence and other communications. Examples of this information include specific investments and your account balances. |
| • | We may obtain other personal information from you in connection with providing you a financial product or service. Examples of this information include depository, debit or credit account numbers. |
Information Sharing Policy
The Funds may share nonpublic personal information about you, as described above, with financial or non-financial companies or other entities, including companies that may be affiliated with the Funds and other nonaffiliated third parties, for the following purposes:
| • | We may share information when it is necessary and required to process a transaction or to service a customer relationship. For example, information may be shared with a company that provides account record keeping services or a company that provides proxy services to shareholders. |
| • | We may share information when it is required or permitted by law. For example, information may be shared in response to a subpoena or to protect you against fraud or with someone who has established a legal beneficial interest, such as a power of attorney. |
| • | We may disclose some or all of the information described above to companies that perform marketing or other services on our behalf. For example, we may share information about you with the financial intermediary (bank, investment bank or broker-dealer) through whom you purchased the Funds’ products or services, or with providers of marketing, legal, accounting or other professional services. The Funds will not, however, disclose a consumer’s account number or similar form of access number or access code for credit card, deposit or transaction accounts to any nonaffiliated third party for use in telemarketing, direct mail or other marketing purposes. |
Except as described above, the Funds do not share customer information. We will not rent, sell, trade, or otherwise release or disclose any personal information about you. Any information you provide to us is for the Funds’ use only. If you decide to close your account(s) or become an inactive customer, we will adhere to the privacy policies and practices as described in this notice.
Information Security:
When the Funds share nonpublic customer information with third parties hired to facilitate the delivery of certain products or services to our customers, such information is made available for limited purposes and under controlled circumstances designed to protect our customers’ privacy. We require third parties to comply with our standards regarding security and confidentiality of such information. We do not permit them to use that information for their own or any other purposes, or rent, sell, trade or otherwise release or disclose the information to any other party. These requirements are reflected in written agreements between the Funds and the third party service providers.
The Funds protect your personal information in several ways. We maintain physical, electronic, and procedural safeguards to guard your nonpublic personal information. In addition, the Funds’ Transfer Agent and Shareholder Servicing Agent have procedures in place for the appropriate disposal of nonpublic personal information when they are no longer required to maintain the information.
Each of the following sections explains an aspect of the Funds’ commitment to protecting your personal information and respecting your privacy.
Employee Access to Information:
Our Code of Ethics, which applies to all employees, restricts the use of customer information and requires that it be held in the strictest of confidence. Employee access to customer information is authorized for business purposes only, and the degree of access is based on the sensitivity of the information and on an employee’s or agent’s need to know the information in order to service a customer’s account or comply with legal requirements.
Visiting The Funds’ Website:
The Funds’ website gathers and maintains statistics about the number of visitors as well as what information is viewed most frequently. This information is used to improve the content and level of service we provide to our clients and shareholders.
| April 30, 2016 / SEMI-ANNUAL REPORT |
| 77 |
| • | Information or data entered into a website will be retained. |
| • | Where registration to a website or re-entering personal information on a website is required, “cookies” are used to improve your online experience. A cookie is a way for websites to recognize whether or not you have visited the site before. It is a small file that is stored on your computer that identifies you each time you re-visit our site so you don’t have to resubmit personal information. Cookies provide faster access into the website. |
| • | We may also collect non-personally identifiable Internet Protocol (“IP”) addresses for all other visitors to monitor the number of visitors to the site. These non-personally identifiable IP addresses are never shared with any third party. |
E-mail:
If you have opted to receive marketing information from the Funds by e-mail, it is our policy to include instructions in all marketing messages on how to unsubscribe from subsequent e-mail programs. Some products or services from the Funds are intended to be delivered and serviced electronically. E-mail communication may be utilized in such cases. If you participate in an employer-sponsored retirement plan administered by the Funds, we may, at your employer’s request, send you e-mail on matters pertaining to the retirement plan.
Please do not provide any account or personal information such as social security numbers, account numbers, or account balances within your e-mail correspondence to us. We cannot use e-mail to execute transaction instructions, provide personal account information, or change account registration. We can, however, use e-mail to provide you with the necessary forms or you may contact customer service toll-free at 1-800-836-2211.
Surveys/Aggregate Data:
Periodically, the Funds may conduct surveys about financial products and services or review elements of customer information in an effort to forecast future business needs. The Funds then generate reports that include aggregate data regarding its customers. Aggregate data classifies customer information in various ways but that does not identify individual customers. These reports may also include information on website traffic patterns and related information. These reports are used for the Funds’ planning, statistical and other corporate purposes. Aggregate data may also be shared with external parties, such as marketing organizations. However, no information is shared by which any individual customer could be identified.
Changes to Our Privacy Statement:
The effective date of this policy is June 8, 2012. We reserve the right to modify this policy at any time. When it is revised or materially changed, we will update the effective date. You can determine whether there have been changes since the last time you reviewed by simply checking the effective date.
Notice will be provided to you in advance of any changes that would affect your rights under this policy statement
| SEMI-ANNUAL REPORT / April 30, 2016 |
[This Page Intentionally Left Blank]
[This Page Intentionally Left Blank]

Wilmington Large-Cap Strategy Fund (“Large-Cap Strategy Fund”)

PRESIDENT’S MESSAGE |
| |||
| i | ||||
WILMINGTON FUNDS ANNUAL REPORT |
| |||
| 1 | ||||
| 3 | ||||
| 4 | ||||
| 19 | ||||
| 20 | ||||
| 21 | ||||
| 22 | ||||
| 23 | ||||
| 29 | ||||
| 30 | ||||
[This Page Intentionally Left Blank]
| i |
I am pleased to present the Annual Report of the Wilmington Funds (the “Trust”), covering the Trust’s fiscal year of May 1, 2015, through April 30, 2016. Inside you will find a comprehensive review of the Trusts’ holdings and financial statements.
The Economy and Financial Markets in Review
Wilmington Funds Management Corporation, the investment advisor to the Trust, and Wilmington Trust Investment Advisors, Inc., the sub-advisor to the Trust, have provided the following review of the economy, bond markets, and stock markets for the Trust’s fiscal year.
The Economy
While the U.S. economy continued to expand, the growth in gross domestic product (“GDP”) turned successively weaker with each quarter. GDP grew a healthy 3.9% in the second quarter of 2015, but the pace of growth slowed to 2.0% in the third quarter, decelerated to a tepid 1.4% gain in the fourth quarter, and nearly came to a standstill with a marginal gain of 0.5% in the first quarter of 2016.i
ihttp://www.bea.gov/national/index.htm#gdp
A strong U.S. dollar, weak global economy, falling oil prices, and sluggish wage growth were contributing factors to this disappointing economic performance.
The unemployment rate declined to 5.0% in April of 2016, down from the 5.5% rate in May of 2015. While the lower unemployment rate is welcome, the overall employment picture remains mixed, as the labor participation rate (62.8%) is stuck at historical lows, while wage growth is muted, increasing just 2.5% in the last 12 months.ii
iihttp://www.bls.gov/news.release/empsit.nr0.htm
The price of oil continued its long slide. West Texas Intermediate (a grade of crude oil used as an oil pricing benchmark) fell from nearly $60 per barrel to just under $46 per barrel, after dipping below $30 per barrel in January.iii This price decline has severely impacted both the oil industry and the banks that have made loans to oil-related companies. The savings to consumers are real, but seem not to have translated into the level of spending that might accelerate economic growth.
iiihttp://www.eia.gov/dnav/pet/hist/LeafHandler.ashx?n=PET&s=RWTC&f=D
The Federal Reserve (the “Fed”) raised the federal funds rate by 25 basis points1 (0.25%) in December 2015, the first such hike since 2006. With the announcement came a statement of intentions regarding the pace of future hikes. As the economy subsequently weakened, however, the Fed moderated its position on future rate increases, communicating that any increases would come only after a careful analysis of U.S. economic health and global stock market stability.
The Bond Markets
Yields fluctuated widely over the course of the Trust’s fiscal year. The 10-year Treasury note began May 2015 with a yield of 2.05%, peaking at 2.50% in June, only to quickly fall as investors rushed to safety amid a global stock market rout in August. Yields eventually turned higher as the prospect of a Fed hike in December grew. By the end of April 2016, however, yields ended lower at 1.83% on expectations that the Fed would put off any additional rate hikes in the near term.iv
ivhttp://www.treasury.gov/resource-center/data-chart-center/interest-rates/Pages/TextView.aspx?data=yieldYear&year=2016
The Barclays U.S. Aggregate Index2 turned in a modestly positive performance, gaining 2.72% over the 12-month period ended in April 2016. The Barclays U.S. Long-Term Treasury Index3 was the top gainer, rising 5.49%.
The high-yield market was buffeted by liquidity concerns toward the end of the calendar year, but managed to stabilize in the months that followed. The Barclays U.S. Corporate High Yield Bond Index4 ended lower, losing 1.12%.
In the tax-exempt market, concerns about a bond default by Puerto Rico were not enough to prevent a strong performance in municipal bonds, as the Barclays Municipal Bond Index5 gained 5.29%.
Global bond markets enjoyed an even stronger performance as central bankers from Europe to Japan pursued monetary easing and even negative interest rates in attempts to jump-start their struggling economies. The Barclays Global Aggregate ex-USD6 jumped 6.55% over the last 12 months ended April 30, 2016.
For the 12-month reporting period May 1, 2015 through April 30, 2016, certain Barclays indices performed as follows7:
Barclays U.S. Aggregate Bond Index | Barclays U.S. Treasury Bond Index8 | Barclays U.S. Mortgage- Backed Securities Index9 | Barclays U.S. Credit Bond Index10 | Barclays Municipal Bond | ||||||||||
| 2.72% | 2.83% | 2.56% | 2.77% | 5.29% | ||||||||||
PRESIDENT’S MESSAGE / April 30, 2016 (unaudited)
| ii |
The Stock Markets
The U.S. stock market experienced sharp declines and price recoveries, but was unable to break out of the trading range it’s occupied for the last 18 months.
Stocks weathered a number of challenges, beginning the fiscal year with the threat of a Greek bankruptcy and the country’s withdrawal from the European Union. No sooner was that crisis resolved than investors were confronted with an unexpected currency devaluation by China, which led to sharp losses in stock prices in the month of August, a slide that extended into September.
Prices staged a strong recovery in October, recouping most of their previous losses as Europe hinted at monetary stimulus, China cut rates, and the Fed delayed its anticipated interest rate increase.
January turned in nearly a mirror performance of August as oil prices resumed their slide, anxieties grew about China’s economic health, and the world’s economies remained stagnant. Stocks staged yet another recovery in March, sparked by firming oil prices, fresh monetary easing in Europe, and new stimulus steps in China.
After all the market gyrations, stocks ended generally right where they began, with the Russell 3000 Index11, a broad domestic market index, falling just 0.18%, for the year ended April 30, 2016.
U.S. large-cap stocks outperformed mid-cap and small-cap stocks, as indicated by the 1.21% gain in the S&P 500 index12 and the declines in the Russell Midcap Index13 (-2.14%) and the Russell 2000 Index14 (-5.94%).
While growth stocks led performance in the large-cap space—the Russell 1000 Growth Index15 rose 1.07% versus a small loss in the Russell 1000 Value Index16 (-0.40%)—they underperformed value stocks significantly in the mid-cap and small-cap markets.
The best-performing S&P industry sectors were utilities (+14.26%), consumer staples (+10.46%), and telecommunication services (+9.71%). The energy sector turned in the worst performance, sliding 15.18%.
Real estate posted a strong performance, with the FTSE NAREIT Equity REITs Index17 posting a gain of 7.86%.
Overseas markets endured a difficult year, as reflected in the 9.32% decline in the MSCI EAFE (net) Index18. Emerging markets were particularly hard hit, with the MSCI Emerging Markets (net) Index19 losing 17.87%.
For the 12-month reporting period May 1, 2015 through April 30, 2016, certain stock market indices performed as follows:
| S&P 500 Index | Dow Jones Industrial Average20 | NASDAQ Composite Index21 | MSCI All Country World ex-US (Net) | |||||||
| 1.21% | 2.25% | -2.19% | -11.28% | |||||||
The markets this past year have been a reminder that a broadly diversified portfolio and the patience to stay invested through periods of market volatility can be essential to long-term investment success.23 We remain committed to managing your assets with a long-term view and working hard in the year ahead to help you reach your important financial goals.
Sincerely,

Christopher D. Randall
President
May 27, 2016
For more complete information, please download the Funds’ prospectus, which is available on www.wilmingtonfunds.com, or call 1-800-836-2211 for a copy. You should consider the Funds’ investment objectives, risks, charges, and expenses carefully before you invest. Information about these and other important subjects is in the Funds’ prospectus, which you should read carefully before investing.
Past performance is no guarantee of future results. The index performance quoted is for illustrative purposes only and is not representative of any specific investment. Diversification does not ensure a profit nor protect against loss.
All investments involve risk, including the possible loss of principal. Equity securities are subject to price fluctuation and possible loss of principal. Small and mid-cap stocks involve greater risks and volatility than large-cap stocks. International investments are subject to special risks, including currency fluctuations, social, economic, and political uncertainties, which could increase volatility. These risks are magnified in emerging markets.
April 30, 2016 (unaudited) / PRESIDENT’S MESSAGE
| iii |
High yield, lower-rated securities generally entail greater market, credit and liquidity risks than investment grade securities and may include higher volatility and higher risk of default.
You could lose money by investing in the money market funds. Although the money market funds seek to preserve the value of your investment at $1.00 per share, they cannot guarantee they will do so. An investment in money market funds is not a deposit of M&T Bank and is not insured or guaranteed by the Federal Deposit Insurance Corporation or any other government agency. The investment advisor has no legal obligation to provide financial support to the Funds, and you should not expect that the investment advisor will provide financial support to the Funds at any time.
| 1. | Basis Points (“BPS”) is a unit that is equal to 1/100th of 1% and is used to denote the change in a financial instrument. The basis point is commonly used for calculating changes in interest rates, equity indices and the yield. |
| 2. | Barclays U.S. Aggregate Bond Index is a widely used benchmark index for the domestic investment-grade bond market composed of securities from the Barclays Government/Corporate Bond Index, Mortgage-Backed Securities Index and Asset-Backed Securities Index. The index typically includes fixed income securities with overall intermediate- to long-term average maturities. The index is unmanaged and investments cannot be made directly in an index. |
| 3. | Barclays U.S. Long-Term Treasury Index is an unmanaged index that includes all publicly issued U.S. Treasury securities that have a remaining maturity of 10 or more years, are rated investment grade, and have $250 million or more of outstanding face value. |
| 4. | Barclays U.S. Corporate High Yield Bond Index measures the USD-denominated, high yield, fixed-rate corporate bond market. Securities are classified as high yield if the middle rating of Moody’s, Fitch, and S&P is Ba1/BB+/BB+ or below. Bonds from issuers with an emerging markets country of risk, based on Barclays EM country definition, are excluded. The U.S. Corporate High Yield Bond Index is a component of the U.S. Universal and Global High Yield Indices. |
| 5. | Barclays Municipal Bond Index tracks the performance of long-term, tax-exempt, investment-grade bond markets. To be included in the index, bonds must have an outstanding par balance of at least $7 million and be issued as part of a transaction of at least $75 million. The index is unmanaged and investments cannot be made directly in an index. |
| 6. | Barclays Global Aggregate ex-USD provides a broad-based measure of the global investment-grade fixed income markets. The three major components of this index are the U.S. Aggregate, the Pan-European Aggregate, and the Asian-Pacific Aggregate indices. The index also includes Eurodollar and Euro-Yen corporate bonds, Canadian government, agency and corporate securities, and USD investment grade 144A securities. An investment cannot be made directly in an index. |
| 7. | Bond prices are sensitive to changes in interest rates and a rise in interest rates can cause a decline in their prices. |
| 8. | Barclays U.S. Treasury Bond Index is a market capitalization weighted index that includes all publicly issued, U.S. Treasury securities that have a remaining maturity of at least one year, are rated investment-grade, and have $250 million or more of outstanding face value. The index is unmanaged and investments cannot be made directly in an index. |
| 9. | Barclays U.S. Mortgage Backed Securities Index is composed of all securities mortgage pools by GNMA, FNMA and the FHLMC, including GNMA graduated Payment Mortgages. The index is unmanaged and investments cannot be made directly in an index. |
| 10. | Barclays U.S. Credit Bond Index tracks the performance of domestic investment-grade corporate bonds and is composed of all publicly issued, fixed-rate, nonconvertible, investment-grade corporate debt. The index is unmanaged and investments cannot be made directly in an index. |
| 11. | The Russell 3000 Index is a capitalization weighted index that seeks to be a benchmark of the entire U.S. stock market. It measures the performance of the 3,000 largest publicly held companies incorporated in the U.S. based on market capitalization. |
| 12. | The S&P 500 Index is a capitalization-weighted index of 500 stocks designed to measure performance of the broad domestic economy through changes in the aggregate market value of 500 stocks representing all major industries. The index is unmanaged and investments cannot be made directly in an index. |
| 13. | Russell Midcap Index measures the performance of the 800 smallest companies in the Russell 1000 Index, which represents approximately 25% of the total market capitalization of the Russell 1000 Index. |
| 14. | Russell 2000 Index measures the performance of the 2,000 smallest companies in the Russell 3000 Index, which represents approximately 8% of the total market capitalization of the Russell 3000 Index. |
| 15. | Russell 1000 Growth Index measures the performance of those Russell 1000 companies with higher price-to-book ratios and higher forecasted growth values. |
| 16. | Russell 1000 Value Index measures the performance of those Russell 1000 companies with lower price-to-book ratios and lower forecasted growth values. |
| 17. | FTSE NAREIT Equity REITs Index is a free float-adjusted, market capitalization-weighted index of U.S. Equity REITs. Constituents of the Index include all tax-qualified REITs with more than 50 percent of total assets in qualifying real estate assets other than mortgages secured by real property. |
| 18. | MSCI EAFE (Net) Index is a free float-adjusted market capitalization index that is designed to measure equity market performance of developed markets, excluding the U.S. & Canada. The index consisted of the following 22 developed market country indices: Australia, Austria, Belgium, Denmark, Finland, France, Germany, Greece, Hong Kong, Ireland, Israel, Italy, Japan, Netherlands, New Zealand, Norway, Portugal, Singapore, Spain, Sweden, Switzerland and the United Kingdom. The index is unmanaged and investments cannot be made directly in an index. The performance of this index is reduced by the taxes on dividends paid by the international securities issuers in the index. |
| 19. | MSCI Emerging Markets (Net) Index is a free float-adjusted market capitalization index that is designed to measure equity market performance of emerging markets. The MSCI Emerging Markets Index consisted of the following 21 emerging market country indices: Brazil, Chile, China, Colombia, Czech Republic, Egypt, Hungary, India, Indonesia, Korea, Malaysia, Mexico, Morocco, Peru, Philippines, Poland, Russia, South Africa, Taiwan, Thailand, and Turkey. The index is unmanaged and investments cannot be made directly in an index. The performance of this index is reduced by the taxes on dividends paid by the international securities issuers in the index. |
| 20. | Dow Jones Industrial Average (“DJIA”) represents share prices of selected blue chip industrial corporations as well as public utility and transportation companies. The DJIA indicates daily changes in the average prices of stocks in any of its categories. It also reports total sales for each group of industries. Because it represents the top corporations of America, the DJIA’s average movements are leading economic indicators for the stock market as a whole. The average is unmanaged and investments cannot be made directly in an average. |
| 21. | NASDAQ Composite Index measures all NASDAQ domestic and non-U.S. based common stocks listed on the NASDAQ Stock Market. The index is unmanaged and investments cannot be made directly in an index. |
| 22. | MSCI All Country World ex-US (Net) Index is a free float-adjusted market capitalization weighted index that is designed to measure the equity market performance of developed and emerging markets excluding the U.S. market. The index consists of 44 countries indices comprising 23 developed and 21 emerging market country indices. The index is unmanaged and investments cannot be made directly in an index. The performance of this index is reduced by the taxes on dividends paid by the international securities issuers in the index. |
| 23. | Diversification does not assure a profit nor protect against loss. |
PRESIDENT’S MESSAGE / April 30, 2016 (unaudited)
[This Page Intentionally Left Blank]
1
WILMINGTON LARGE-CAP STRATEGY FUND
Management’s Discussion of Fund Performance
For the fiscal year ended April 30, 2016, the Wilmington Large-Cap Strategy Fund (the “Fund”) had a total return of -0.87%* for Class I shares, versus its benchmark, the Russell 1000 Index**, which had a total return of 0.34%.
Prior to July 31, 2015, the Fund attempted to outperform the Rus-sell 1000 Index by adjusting weights of mega-cap vs. mid-cap, growth vs. value component companies based on recommendations from the Wilmington Trust Investment Advisors, Inc. Investment Committee (“IC”). The Russell 1000 Index can be divided into the Russell Top 200 Index of mega-cap stocks and the Russell Midcap Index which represent the remaining 800 mid-cap companies. The weight of the Russell Midcap Index has been approximately 31% of the Russell 1000 Index. Over the period from April 30, 2015 to July 31, 2015, the Russell Top 200 Index returned 1.9%, and the Russell Midcap Index returned 0.1%. The tactical overweight to mid-cap had a -0.7% impact on relative performance during this period.
At the March 2014 meeting, the IC recommended a tilt toward growth companies and maintained the capitalization tilt toward mid-sized companies. The Fund was rebalanced to track a custom index incorporating both recommendations. For the period April 30, 2015 to July 31, 2015, the Russell 1000 Growth Index returned 3.0%, the Russell 1000 Value Index returned -0.4%, and the Fund had a gross return of 2.2% vs. the Russell 1000 Index return of 1.3%.
At the July 2015 meeting, the IC recommended a shift toward weighting sectors rather than the market cap and growth/value tilts used prior to this meeting. The Fund was rebalanced to track a custom index incorporating the sector overweight/underweight recommendations which produced a return of -2.7% for the Fund vs. -1.0% for the Russell 1000 Index from July 31, 2015 until April 30, 2016. The majority of the underperformance occurred during the sell-off in the markets at the beginning of the calendar year 2016 when the Fund’s sector weights were underweighted defensive consumer staples and utilities along with an overweighted to health care sector position which did not act defensively in the market sell-off.
The IC and Investment Research Team are researching additional tactics to improve the risk adjusted return of the portfolio.
| * | Performance data quoted represents past performance, which is no guarantee of future results. Investment return and principal value will fluctuate so that an investor’s shares, when redeemed, may be worth more or less than their original cost. Mutual Funds are not obligations of or guaranteed by any bank and are not federally insured. The total return shown assumes the reinvestment of all distributions and does not reflect the deduction of taxes that a shareholder would pay on fund distributions or the redemption of shares. Mutual fund performance changes over time and current performance may be lower or higher than what is stated. For the most recent month-end performance. |
| ** | The Russell 1000 Index measures the performance of the large-cap segment of the U.S. equity universe. It is subset of the Russell 3000 Index and includes approximately 1,000 of the largest securities based on a combination of their market cap and current index membership. The Index represents approximately 92% of the U.S. market and is constructed to provide a comprehensive and unbiased barometer for the large-cap segment and is completely reconstituted annually to ensure new and growing equities are reflected. The Russell 3000 Index measures the performance of the largest 3,000 U.S. companies representing approximately 98% of the investable U.S. equity market. Russell 1000 Growth Index measures the performance of those Russell 1000 companies with higher price-to-book ratios and higher forecasted growth values. Russell 1000 Value Index measures the performance of those Russell 1000 companies with lower price-to-book ratios and lower forecasted growth values. |
The Russell Top 200 Index measures the performance of the largest cap segment of the U.S. equity universe. The Russell Top 200 Index is a subset of the Russell 3000 Index. It includes approximately 200 of the largest securities based on a combination of their market cap and current index membership and represents approximately 68% of the U.S. market. The Russell Top 200 Index is constructed to provide a comprehensive and unbiased barometer for this very large cap segment and is completely reconstituted annually to ensure new and growing equities are reflected.
The Russell Midcap Index measures the performance of the mid-cap segment of the U.S. equity universe. The Russell Midcap Index is a subset of the Russell 1000 Index. It includes approximately 800 of the smallest securities based on a combination of their market cap and current index membership. The Russell Midcap Index represents approximately 31% of the total market capitalization of the Russell 1000 companies. The Russell Midcap Index is constructed to provide a comprehensive and unbiased barometer for the mid-cap segment. The Index is completely reconstituted annually to ensure larger stocks do not distort the performance and characteristics of the true mid-cap opportunity set.
ANNUAL REPORT / April 30, 2016 (unaudited)
2
WILMINGTON LARGE-CAP
STRATEGY FUND
The graph below illustrates the hypothetical investment of $1,000,0001 in the Class I Shares of the Wilmington Large-Cap Strategy Fund from April 30, 2006 to April 30, 2016, compared to the Russell 1000 Index.2
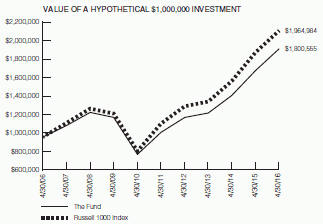
Performance data quoted represents past performance which is no guarantee of future results. Returns shown do not reflect the deduction of taxes that a shareholder would pay on Fund distributions or the redemption of Fund shares. Investment return and principal value will fluctuate so that an investor’s shares, when redeemed, may be worth more or less than their original cost. Mutual Funds are not obligations of or guaranteed by any bank and are not federally insured. Mutual funds are not obligations of or guaranteed by any bank and are not federally insured. Mutual fund performance changes over time and current performance may be lower or higher than what is stated. For current to the most recent month end performance, visit www.wilmingtonfunds.com or call 1-800-836-2211.
| Average Annual Total Returns for the Periods Ended 4/30/16 | ||||||||||||
| 1 Year | 5 Years | 10 Years | ||||||||||
Class I^
|
| -0.87%
|
|
| 10.59%
|
|
| 6.06%
|
| |||
Russell 1000 Index
|
| 0.34%
|
|
| 10.81%
|
|
| 6.99%
|
| |||
^Expense Ratios Before Waivers and Expense Ratios After Waivers for Class I are 0.86% and 0.25%, respectively. Expense Ratios Before Waiver represent the operating costs borne by the Fund, expressed as a percentage of the Fund’s average net assets, as shown in the Fees and Expenses table in the Fund’s current prospectus (under “Total Annual Fund Operating Expenses”). Current information regarding the Fund’s Operating Expenses can be found in the Fund’s Financial Highlights.
| 1 | Represents a hypothetical investment of $1,000,000 in Class I and assumes the reinvestment of all dividends and distributions. |
| 2 | The performance shown for the Russell 1000 Index assumes the reinvestment of all dividends and distributions. It is not possible to invest directly in an index, and the represented index is unmanaged. |
April 30, 2016 (unaudited) / ANNUAL REPORT
3
As a shareholder of the Funds, you incur two types of costs: (1) transaction costs, including sales charges (loads) on purchase payments, reinvested dividends, or other distributions; and redemption fees; and (2) ongoing costs, including management fees; distribution and/or service (12b-1) fees; and other Fund expenses. This Example is intended to help you to understand your ongoing costs (in dollars) of investing in the Fund and to compare these costs with the ongoing costs of investing in other mutual funds. It is based on an investment of $1,000 invested at the beginning of the period and held for the entire period from November 1, 2015 to April 30, 2016.
Actual Expenses
This section of the following table provides information about actual account values and actual expenses. You may use the information in this section, together with the amount you invested, to estimate the expenses that you incurred over the period. Simply divide your account value by $1,000 (for example, an $8,600 account value divided by $1,000 = 8.6), then multiply the result by the number in the first section under the heading entitled “Expenses Paid During Period” to estimate the expenses attributable to your investment during this period.
Hypothetical Example for
Comparison Purposes
This section of the following table provides information about hypothetical account values and hypothetical expenses based on the Fund’s actual expense ratios and assumed rates of return of 5% per year before expenses, which are not the Fund’s actual returns. Thus, you should not use the hypothetical account values and expenses to estimate the actual ending account balance or your expenses for the period. Rather, these figures are required to be provided to enable you to compare the ongoing costs of investing in the Fund with other funds. To do so, compare this 5% hypothetical example with the 5% hypothetical examples that appear in the shareholder reports of the other funds.
Please note that the expenses shown in the table are meant to highlight your ongoing costs only. Therefore, the Annualized Net Expense Ratio section of the table is useful in comparing ongoing costs only, and will not help you determine the relative total costs of owning different funds.
| Beginning Account Value 11/01/15 | Ending Account Value 4/30/16 | Expenses Paid During Period1 | Annualized Net Expense Ratio2 | |||||||||||||
WILMINGTON LARGE-CAP STRATEGY FUND | ||||||||||||||||
Actual | ||||||||||||||||
Class I | $ | 1,000.00 | $ | 987.00 | $ | 1.24 | 0.25% | |||||||||
Hypothetical (assuming a 5% return before expense) | ||||||||||||||||
Class I | $ | 1,000.00 | $ | 1,023.62 | $ | 1.26 | 0.25% | |||||||||
| (1) | Expenses are equal to the Fund’s annualized net expense ratios, multiplied by the average account value over the period, multiplied by 182/366 (to reflect the most recent one-half year period). |
| (2) | Expense ratio does not reflect the indirect expenses of the underlying funds in which it invests. |
ANNUAL REPORT / April 30, 2016 (unaudited)
4
PORTFOLIO OF INVESTMENTS SUMMARY TABLE
Wilmington Large-Cap Strategy Fund
At April 30, 2016, the Fund’s sector classifications were as follows (unaudited):
| Percentage of Total Net Assets |
| Common Stocks | ||||
Information Technology | 21.1 | % | ||
Financials | 18.8 | % | ||
Health Care | 16.7 | % | ||
Consumer Discretionary | 12.4 | % | ||
Industrials | 10.8 | % | ||
Energy | 7.1 | % | ||
Consumer Staples | 6.0 | % | ||
Materials | 2.9 | % | ||
Telecommunication Services | 2.5 | % | ||
Utilities | 1.5 | % | ||
| Investment Companies | 0.2 | % | ||
| Rights | 0.0 | %3 | ||
| Warrants | 0.0 | %3 | ||
| Cash Equivalents1 | 2.5 | % | ||
| Other Assets and Liabilities – Net2 | (2.5 | )% | ||
|
| |||
| TOTAL | 100.0 | % | ||
|
| |||
| (1) | Cash Equivalents include investments in repurchase agreements. |
| (2) | Assets, other than investments in securities, less liabilities. See Statements of Assets and Liabilities. |
| (3) | Represent less than 0.05%. |
April 30, 2016
Description
| Number of
| Value
| ||||||
| COMMON STOCKS – 99.8% | ||||||||
CONSUMER DISCRETIONARY – 12.4% |
| |||||||
AUTO COMPONENTS – 0.3% | ||||||||
BorgWarner, Inc. | 6,180 | $ | 221,986 | |||||
Delphi Automotive PLC | 6,250 | 460,188 | ||||||
Gentex Corp. | 9,180 | 147,247 | ||||||
Goodyear Tire & Rubber Co. (The) | 7,350 | 212,929 | ||||||
Johnson Controls, Inc. | 17,430 | 721,602 | ||||||
Lear Corp. | 2,500 | 287,825 | ||||||
Visteon Corp. | 1,500 | 119,505 | ||||||
|
| |||||||
| $ | 2,171,282 | |||||||
AUTOMOBILES – 0.6% | ||||||||
Ford Motor Co. | 100,500 | 1,362,780 | ||||||
General Motors Co. | 43,200 | 1,373,760 | ||||||
Harley-Davidson, Inc. | 5,370 | 256,847 | ||||||
Description
| Number of
| Value
| ||||||
Tesla Motors, Inc.#, * | 2,650 | $ | 638,014 | |||||
Thor Industries, Inc. | 1,380 | 88,348 | ||||||
|
| |||||||
| $ | 3,719,749 | |||||||
DISTRIBUTORS – 0.1% | ||||||||
Genuine Parts Co. | 4,620 | 443,381 | ||||||
LKQ Corp.* | 7,780 | 249,349 | ||||||
|
| |||||||
| $ | 692,730 | |||||||
DIVERSIFIED CONSUMER SERVICES – 0.1% |
| |||||||
Graham Holdings Co., Class B | 140 | 66,716 | ||||||
H&R Block, Inc. | 6,660 | 134,798 | ||||||
Service Corp. International | 4,170 | 111,214 | ||||||
ServiceMaster Global Holdings, Inc.* | 2,280 | 87,370 | ||||||
|
| |||||||
| $ | 400,098 | |||||||
HOTELS, RESTAURANTS & LEISURE – 1.9% |
| |||||||
Aramark | 5,800 | 194,358 | ||||||
April 30, 2016 / ANNUAL REPORT
PORTFOLIO OF INVESTMENTS 5
Wilmington Large-Cap Strategy Fund (continued)
Description
| Number of
| Value
| ||||||
Brinker International, Inc. | 520 | $ | 24,086 | |||||
Carnival Corp. | 10,020 | 491,481 | ||||||
Chipotle Mexican Grill, Inc.* | 850 | 357,824 | ||||||
Choice Hotels International, Inc. | 1,610 | 81,563 | ||||||
Darden Restaurants, Inc. | 3,140 | 195,465 | ||||||
Domino’s Pizza, Inc. | 2,200 | 265,936 | ||||||
Dunkin’ Brands Group, Inc. | 3,900 | 181,350 | ||||||
Hilton Worldwide Holdings, Inc. | 10,860 | 239,463 | ||||||
Hyatt Hotels Corp., Class A#,* | 2,800 | 134,064 | ||||||
International Game Technology | 1,273 | 22,074 | ||||||
Las Vegas Sands Corp. | 9,720 | 438,858 | ||||||
Marriott International, Inc., Class A# | 4,372 | 306,433 | ||||||
McDonald’s Corp. | 27,349 | 3,459,375 | ||||||
MGM Resorts International* | 12,310 | 262,203 | ||||||
Norwegian Cruise Line Holdings* | 2,160 | 105,602 | ||||||
Panera Bread Co., Class A* | 845 | 181,244 | ||||||
Restaurant Brands International LP | 47 | 2,023 | ||||||
Royal Caribbean Cruises Ltd. | 7,680 | 594,432 | ||||||
Six Flags Entertainment Corp. | 3,100 | 186,155 | ||||||
Starbucks Corp. | 39,390 | 2,214,900 | ||||||
Starwood Hotels & Resorts Worldwide, Inc. | 4,330 | 354,540 | ||||||
Wendy’s Co. (The) | 200 | 2,172 | ||||||
Wyndham Worldwide Corp. | 3,360 | 238,392 | ||||||
Wynn Resorts Ltd. | 2,200 | 194,260 | ||||||
Yum! Brands, Inc. | 10,850 | 863,226 | ||||||
|
| |||||||
| $ | 11,591,479 | |||||||
HOUSEHOLD DURABLES – 0.5% | ||||||||
DR Horton, Inc. | 8,970 | 269,638 | ||||||
Garmin Ltd. | 1,690 | 72,045 | ||||||
Harman International Industries, Inc. | 1,920 | 147,379 | ||||||
Leggett & Platt, Inc. | 3,670 | 180,894 | ||||||
Lennar Corp., Class A | 4,610 | 208,879 | ||||||
Lennar Corp., Class B | 1,600 | 57,536 | ||||||
Mohawk Industries, Inc.* | 1,900 | 365,997 | ||||||
Newell Rubbermaid, Inc. | 12,569 | 572,392 | ||||||
NVR, Inc.* | 130 | 215,968 | ||||||
PulteGroup, Inc. | 10,090 | 185,555 | ||||||
Tempur Sealy International, Inc.#,* | 2,500 | 151,675 | ||||||
Toll Brothers, Inc.* | 3,750 | 102,375 | ||||||
Tupperware Brands Corp. | 1,000 | 58,070 | ||||||
Whirlpool Corp. | 2,350 | 409,229 | ||||||
|
| |||||||
| $ | 2,997,632 | |||||||
INTERNET & CATALOG RETAIL – 1.8% |
| |||||||
Amazon.com, Inc.* | 10,360 | 6,833,352 | ||||||
Expedia, Inc. | 2,852 | 330,176 | ||||||
Groupon, Inc.#,* | 22,850 | 82,717 | ||||||
Description
| Number of
| Value
| ||||||
Liberty Interactive Corp., QVC Group, | 10,550 | $ | 276,410 | |||||
Liberty Ventures, Series A* | 4,102 | 164,080 | ||||||
Netflix, Inc.* | 11,400 | 1,026,342 | ||||||
Priceline.com, Inc. (The)* | 1,330 | 1,787,068 | ||||||
TripAdvisor, Inc.* | 3,100 | 200,229 | ||||||
|
| |||||||
| $ | 10,700,374 | |||||||
LEISURE EQUIPMENT & PRODUCTS – 0.2% |
| |||||||
Brunswick Corp. | 2,490 | 119,595 | ||||||
Hasbro, Inc. | 3,490 | 295,394 | ||||||
Mattel, Inc. | 12,250 | 380,853 | ||||||
Polaris Industries, Inc.# | 1,900 | 185,972 | ||||||
Vista Outdoor, Inc.* | 340 | 16,313 | ||||||
|
| |||||||
| $ | 998,127 | |||||||
MEDIA – 3.1% | ||||||||
AMC Networks, Inc., Class A* | 1,685 | 109,913 | ||||||
Cable One, Inc. | 140 | 64,254 | ||||||
Cablevision Systems Corp., Class A | 6,540 | 218,371 | ||||||
CBS Corp., Non-Voting | 13,830 | 773,235 | ||||||
Charter Communications, Inc., Class A#,* | 2,100 | 445,704 | ||||||
Cinemark Holdings, Inc. | 500 | 17,325 | ||||||
Clear Channel Outdoor Holdings, Inc., Class A | 29,500 | 150,745 | ||||||
Comcast Corp., Class A | 69,000 | 4,192,440 | ||||||
Discovery Communications, Inc., Class A* | 9,780 | 264,442 | ||||||
DISH Network Corp., Class A* | 5,980 | 294,754 | ||||||
Gannett Co., Inc. | 1,645 | 27,718 | ||||||
Interpublic Group of Cos., Inc. (The) | 10,120 | 232,153 | ||||||
John Wiley & Sons, Inc., Class A | 2,100 | 104,139 | ||||||
Liberty Braves Group, Class A#,* | 84 | 1,314 | ||||||
Liberty Braves Group, Class C#,* | 608 | 9,071 | ||||||
Liberty Broadband Corp., Class A* | 706 | 40,435 | ||||||
Liberty Media Group, Class C* | 1,731 | 31,221 | ||||||
Liberty SiriusXM Group, Class A* | 843 | 27,625 | ||||||
Liberty SiriusXM Group, Class C* | 6,086 | 194,874 | ||||||
Lions Gate Entertainment Corp. | 2,060 | 45,732 | ||||||
Live Nation Entertainment, Inc.* | 4,370 | 93,868 | ||||||
Madison Square Garden Co., Class A (The)* | 729 | 114,438 | ||||||
Morningstar, Inc. | 1,100 | 91,520 | ||||||
MSG Networks, Inc., Class A* | 2,187 | 37,376 | ||||||
News Corp., Class A | 11,457 | 142,458 | ||||||
Omnicom Group, Inc. | 5,490 | 455,505 | ||||||
Regal Entertainment Group, Class A | 770 | 16,055 | ||||||
Scripps Networks Interactive, Inc., Class A | 1,380 | 86,043 | ||||||
Sirius XM Holdings, Inc.#,* | 63,640 | 251,378 | ||||||
Starz, Class A* | 1,943 | 52,869 | ||||||
TEGNA, Inc. | 5,640 | 131,750 | ||||||
ANNUAL REPORT / April 30, 2016
6 PORTFOLIO OF INVESTMENTS
Wilmington Large-Cap Strategy Fund (continued)
Description
| Number of Shares
| Value
| ||||||
Thomson Reuters Corp. | 8,050 | $ | 331,097 | |||||
Time Warner Cable, Inc. | 7,574 | 1,606,521 | ||||||
Time Warner, Inc. | 22,116 | 1,661,796 | ||||||
Tribune Media Co., Class A | 2,650 | 102,158 | ||||||
Twenty-First Century Fox, Inc., Class A | 43,110 | 1,303,532 | ||||||
Viacom, Inc., Class A | 8,350 | 341,970 | ||||||
Walt Disney Co. (The) | 46,146 | 4,765,036 | ||||||
|
| |||||||
| $ | 18,830,835 | |||||||
MULTILINE RETAIL – 0.6% |
| |||||||
Dillard’s, Inc., Class A | 1,400 | 98,630 | ||||||
Dollar General Corp. | 9,100 | 745,381 | ||||||
Dollar Tree, Inc.* | 6,962 | 554,941 | ||||||
JC Penney Co., Inc.#,* | 11,030 | 102,358 | ||||||
Kohl’s Corp. | 3,810 | 168,783 | ||||||
Macy’s, Inc. | 9,180 | 363,436 | ||||||
Nordstrom, Inc.# | 3,780 | 193,271 | ||||||
Sears Holdings Corp.* | 70 | 1,146 | ||||||
Target Corp. | 16,960 | 1,348,320 | ||||||
|
| |||||||
| $ | 3,576,266 | |||||||
SPECIALTY RETAIL – 2.4% |
| |||||||
Aaron’s, Inc. | 1,300 | 34,073 | ||||||
Advance Auto Parts, Inc. | 2,250 | 351,225 | ||||||
AutoNation, Inc.#,* | 1,780 | 90,157 | ||||||
AutoZone, Inc.* | 960 | 734,621 | ||||||
Bed, Bath & Beyond, Inc.* | 4,410 | 208,240 | ||||||
Best Buy Co., Inc. | 8,980 | 288,078 | ||||||
Cabela’s, Inc.* | 900 | 46,935 | ||||||
CarMax, Inc.#,* | 6,500 | 344,175 | ||||||
CST Brands, Inc. | 1,718 | 64,889 | ||||||
Dick’s Sporting Goods, Inc. | 3,280 | 151,995 | ||||||
DSW, Inc., Class A | 1,900 | 46,683 | ||||||
Foot Locker, Inc. | 3,610 | 221,798 | ||||||
GameStop Corp., Class A | 2,820 | 92,496 | ||||||
Gap, Inc. (The)# | 8,450 | 195,871 | ||||||
GNC Holdings, Inc., Class A | 3,800 | 92,568 | ||||||
Home Depot, Inc. (The) | 35,250 | 4,719,622 | ||||||
L Brands, Inc. | 6,110 | 478,352 | ||||||
Lowe’s Cos., Inc. | 25,600 | 1,946,112 | ||||||
Michaels Cos, Inc. (The)* | 1,700 | 48,331 | ||||||
Murphy USA, Inc.* | 1,387 | 79,642 | ||||||
Office Depot, Inc.* | 12,960 | 76,205 | ||||||
O’Reilly Automotive, Inc.* | 2,700 | 709,236 | ||||||
Penske Automotive Group, Inc. | 600 | 23,478 | ||||||
Ross Stores, Inc. | 11,540 | 655,241 | ||||||
Sally Beauty Holdings, Inc.* | 2,500 | 78,500 | ||||||
Signet Jewelers Ltd. | 1,720 | 186,723 | ||||||
Staples, Inc. | 10,960 | 111,792 | ||||||
Description
| Number of
| Value
| ||||||
Tiffany & Co. | 2,650 | $ | 189,078 | |||||
TJX Cos., Inc. (The) | 19,240 | 1,458,777 | ||||||
Tractor Supply Co. | 3,700 | 350,242 | ||||||
Ulta Salon Cosmetics & Fragrance, Inc.* | 2,000 | 416,560 | ||||||
Urban Outfitters, Inc.* | 3,460 | 104,907 | ||||||
Williams-Sonoma, Inc. | 1,140 | 67,009 | ||||||
|
| |||||||
| $ | 14,663,611 | |||||||
TEXTILES, APPAREL & LUXURY GOODS – 0.8% |
| |||||||
Carter’s, Inc. | 1,400 | 149,338 | ||||||
Coach, Inc. | 8,010 | 322,563 | ||||||
Fossil Group, Inc.#,* | 1,950 | 78,975 | ||||||
Hanesbrands, Inc. | 10,800 | 313,524 | ||||||
Kate Spade & Co.* | 4,400 | 113,212 | ||||||
Lululemon Athletica, Inc.#,* | 2,700 | 176,985 | ||||||
Michael Kors Holdings Ltd.* | 4,300 | 222,138 | ||||||
NIKE, Inc., Class B | 37,140 | 2,189,032 | ||||||
PVH Corp. | 2,480 | 237,088 | ||||||
Ralph Lauren Corp. | 900 | 83,889 | ||||||
Skechers U.S.A., Inc., | 3,300 | 109,065 | ||||||
Under Armour, Inc., | 4,800 | 210,912 | ||||||
Under Armour, Inc., | 4,800 | 195,840 | ||||||
VF Corp. | 8,250 | 520,163 | ||||||
|
| |||||||
| $ | 4,922,724 | |||||||
|
| |||||||
TOTAL CONSUMER DISCRETIONARY |
| $ | 75,264,907 | |||||
CONSUMER STAPLES – 6.0% |
| |||||||
BEVERAGES – 1.3% |
| |||||||
Brown-Forman Corp., | 1,600 | 165,936 | ||||||
Coca-Cola Co. (The) | 75,700 | 3,391,360 | ||||||
Coca-Cola Enterprises, Inc. | 3,800 | 199,424 | ||||||
Constellation Brands, Inc., | 2,700 | 421,362 | ||||||
Dr. Pepper Snapple Group, Inc. | 600 | 54,546 | ||||||
Molson Coors Brewing Co., Class B | 1,900 | 181,697 | ||||||
Monster Beverage Corp.* | 4,900 | 706,678 | ||||||
PepsiCo, Inc. | 28,300 | 2,913,768 | ||||||
|
| |||||||
| $ | 8,034,771 | |||||||
FOOD & STAPLES RETAILING – 1.4% |
| |||||||
Costco Wholesale Corp. | 8,400 | 1,244,292 | ||||||
CVS Health Corp. | 21,300 | 2,140,650 | ||||||
Kroger Co. (The) | 18,600 | 658,254 | ||||||
Rite Aid Corp.* | 18,600 | 149,730 | ||||||
Sprouts Farmers Market, Inc.* | 3,900 | 109,473 | ||||||
Sysco Corp. | 11,800 | 543,626 | ||||||
Walgreens Boots Alliance, Inc. | 19,200 | 1,522,176 | ||||||
Wal-Mart Stores, Inc. | 29,900 | 1,999,413 | ||||||
Whole Foods Market, Inc.# | 6,900 | 200,652 | ||||||
|
| |||||||
| $ | 8,568,266 | |||||||
April 30, 2016 / ANNUAL REPORT
PORTFOLIO OF INVESTMENTS 7
Wilmington Large-Cap Strategy Fund (continued)
Description
| Number of
| Value
| ||||||
FOOD PRODUCTS – 1.1% |
| |||||||
Archer-Daniels-Midland Co. | 12,200 | $ | 487,268 | |||||
Blue Buffalo Pet Products, Inc.#,* | 6,100 | 151,036 | ||||||
Bunge Ltd. | 8,200 | 512,500 | ||||||
Campbell Soup Co. | 1,800 | 111,078 | ||||||
ConAgra Foods, Inc. | 8,400 | 374,304 | ||||||
General Mills, Inc. | 8,700 | 533,658 | ||||||
Hain Celestial Group, Inc. (The)* | 3,000 | 125,580 | ||||||
Hershey Co. (The) | 4,100 | 381,751 | ||||||
Hormel Foods Corp. | 4,000 | 154,200 | ||||||
Ingredion, Inc. | 500 | 57,545 | ||||||
JM Smucker Co. (The) | 1,200 | 152,376 | ||||||
Kellogg Co. | 3,000 | 230,430 | ||||||
Kraft Heinz Co. (The) | 12,900 | 1,007,103 | ||||||
McCormick & Co., Inc. | 600 | 56,268 | ||||||
Mead Johnson Nutrition Co. | 3,600 | 313,740 | ||||||
Mondelez International, Inc., Class A | 32,600 | 1,400,496 | ||||||
Pilgrim’s Pride Corp.# | 700 | 18,837 | ||||||
Tyson Foods, Inc., Class A | 5,400 | 355,428 | ||||||
WhiteWave Foods Co. (The)* | 3,600 | 144,756 | ||||||
|
| |||||||
| $ | 6,568,354 | |||||||
HOUSEHOLD PRODUCTS – 1.1% |
| |||||||
Church & Dwight Co., Inc. | 1,300 | 120,510 | ||||||
Clorox Co. (The) | 2,300 | 288,029 | ||||||
Colgate-Palmolive Co. | 14,800 | 1,049,616 | ||||||
Energizer Holdings, Inc. | 2,900 | 126,121 | ||||||
Kimberly-Clark Corp. | 5,900 | 738,621 | ||||||
Procter & Gamble Co. (The) | 51,600 | 4,134,192 | ||||||
|
| |||||||
| $ | 6,457,089 | |||||||
PERSONAL PRODUCTS – 0.1% |
| |||||||
Avon Products, Inc. | 12,800 | 60,288 | ||||||
Edgewell Personal Care Co. | 1,500 | 123,105 | ||||||
Estee Lauder Cos., Inc. Class A (The) | 3,200 | 306,784 | ||||||
Herbalife Ltd.#,* | 1,900 | 110,105 | ||||||
Nu Skin Enterprises, Inc., Class A# | 3,600 | 146,772 | ||||||
|
| |||||||
| $ | 747,054 | |||||||
TOBACCO – 1.0% |
| |||||||
Altria Group, Inc. | 38,700 | 2,426,877 | ||||||
Philip Morris International, Inc. | 29,600 | 2,904,352 | ||||||
Reynolds American, Inc. | 14,500 | 719,200 | ||||||
|
| |||||||
| $ | 6,050,429 | |||||||
|
| |||||||
TOTAL CONSUMER STAPLES |
| $ | 36,425,963 | |||||
ENERGY – 7.1% |
| |||||||
ENERGY EQUIPMENT & SERVICES – 1.2% |
| |||||||
Baker Hughes, Inc. | 13,900 | 672,204 | ||||||
Description
| Number of
| Value
| ||||||
Diamond Offshore Drilling, Inc.# | 1,600 | $ | 38,816 | |||||
Dril-Quip, Inc.* | 660 | 42,781 | ||||||
Ensco PLC, Class A | 5,050 | 60,398 | ||||||
FMC Technologies, Inc.* | 7,860 | 239,651 | ||||||
Frank’s International NV# | 2,050 | 34,133 | ||||||
Halliburton Co. | 25,390 | 1,048,861 | ||||||
Helmerich & Payne, Inc.# | 2,960 | 195,715 | ||||||
Nabors Industries Ltd. | 8,630 | 84,574 | ||||||
National Oilwell Varco, Inc. | 9,905 | 356,976 | ||||||
Noble Corp. PLC# | 4,500 | 50,535 | ||||||
Oceaneering International, Inc. | 3,780 | 138,537 | ||||||
Patterson-UTI Energy, Inc. | 4,800 | 94,800 | ||||||
Rowan Cos. PLC, Class A | 340 | 6,395 | ||||||
RPC, Inc.# | 3,450 | 52,164 | ||||||
Schlumberger Ltd. | 41,195 | 3,309,606 | ||||||
Seadrill Ltd.#,* | 10,000 | 47,800 | ||||||
Superior Energy Services, Inc. | 4,550 | 76,713 | ||||||
Targa Resources Corp.# | 4,300 | 173,978 | ||||||
Weatherford International PLC* | 39,050 | 317,477 | ||||||
|
| |||||||
| $ | 7,042,114 | |||||||
OIL & GAS FIELD SERVICES – 0.1% |
| |||||||
Columbia Pipeline Group, Inc. | 27,100 | 694,302 | ||||||
OIL, GAS & CONSUMABLE FUELS – 5.8% |
| |||||||
Anadarko Petroleum Corp. | 14,750 | 778,210 | ||||||
Antero Resources Corp.* | 2,050 | 58,015 | ||||||
Apache Corp. | 10,840 | 589,696 | ||||||
Cabot Oil & Gas Corp. | 12,500 | 292,500 | ||||||
California Resources Corp. | 13,127 | 28,879 | ||||||
Cheniere Energy, Inc.#,* | 7,330 | 284,990 | ||||||
Chesapeake Energy Corp.#,* | 25,000 | 171,750 | ||||||
Chevron Corp. | 56,120 | 5,734,342 | ||||||
Cimarex Energy Co. | 2,900 | 315,752 | ||||||
Cobalt International Energy, Inc.* | 17,900 | 57,817 | ||||||
Concho Resources, Inc.* | 3,460 | 401,948 | ||||||
ConocoPhillips | 35,960 | 1,718,528 | ||||||
CONSOL Energy, Inc.# | 10,300 | 155,015 | ||||||
Continental Resources, Inc.* | 3,820 | 142,333 | ||||||
CVR Energy, Inc. | 100 | 2,428 | ||||||
Denbury Resources, Inc.# | 25,900 | 99,974 | ||||||
Devon Energy Corp. | 12,880 | 446,678 | ||||||
Diamondback Energy, Inc.* | 1,900 | 164,502 | ||||||
Energen Corp. | 4,380 | 186,106 | ||||||
EOG Resources, Inc. | 16,180 | 1,336,792 | ||||||
EP Energy Corp., Class A* | 500 | 2,455 | ||||||
EQT Corp. | 4,830 | 338,583 | ||||||
Exxon Mobil Corp. | 122,693 | 10,846,061 | ||||||
ANNUAL REPORT / April 30, 2016
8 PORTFOLIO OF INVESTMENTS
Wilmington Large-Cap Strategy Fund (continued)
Description
| Number of
| Value
| ||||||
Golar LNG Ltd.# | 6,850 | $ | 113,573 | |||||
Gulfport Energy Corp.* | 2,750 | 86,075 | ||||||
Hess Corp. | 8,190 | 488,288 | ||||||
HollyFrontier Corp. | 4,140 | 147,384 | ||||||
Kinder Morgan, Inc. | 50,655 | 899,633 | ||||||
Kosmos Energy Ltd.* | 3,050 | 19,764 | ||||||
Laredo Petroleum, Inc.#,* | 8,700 | 105,966 | ||||||
Marathon Oil Corp. | 23,230 | 327,311 | ||||||
Marathon Petroleum Corp. | 15,730 | 614,728 | ||||||
Memorial Resource Development Corp.* | 4,650 | 60,822 | ||||||
Murphy Oil Corp.# | 7,100 | 253,754 | ||||||
Newfield Exploration Co.* | 4,310 | 156,238 | ||||||
Noble Energy, Inc. | 14,320 | 517,095 | ||||||
Occidental Petroleum Corp. | 22,500 | 1,724,625 | ||||||
ONEOK, Inc. | 8,960 | 323,904 | ||||||
PBF Energy, Inc., Class A | 3,000 | 96,540 | ||||||
Phillips 66 | 18,390 | 1,510,003 | ||||||
Pioneer Natural Resources Co. | 4,750 | 788,975 | ||||||
QEP Resources, Inc. | 5,800 | 103,994 | ||||||
Range Resources Corp.# | 4,530 | 199,818 | ||||||
Rice Energy, Inc.* | 800 | 13,848 | ||||||
SM Energy Co.# | 2,450 | 76,342 | ||||||
Southwestern Energy Co.#,* | 10,700 | 143,701 | ||||||
Spectra Energy Corp. | 19,850 | 620,710 | ||||||
Teekay Corp.# | 520 | 5,824 | ||||||
Tesoro Corp. | 3,340 | 266,165 | ||||||
Valero Energy Corp. | 14,220 | 837,131 | ||||||
Whiting Petroleum Corp.#,* | 9,450 | 113,400 | ||||||
Williams Cos., Inc. (The) | 19,970 | 387,218 | ||||||
World Fuel Services Corp. | 2,100 | 98,133 | ||||||
WPX Energy, Inc.* | 3,817 | 36,872 | ||||||
|
| |||||||
| $ | 35,291,188 | |||||||
|
| |||||||
TOTAL ENERGY | $ | 43,027,604 | ||||||
FINANCIALS – 18.8% | ||||||||
CAPITAL MARKETS – 2.2% | ||||||||
Affiliated Managers Group, Inc.* | 2,270 | 386,626 | ||||||
Ameriprise Financial, Inc. | 7,440 | 713,496 | ||||||
Artisan Partners Asset Management, Inc., Class A | 2,150 | 69,466 | ||||||
Bank of New York Mellon Corp. (The) | 33,720 | 1,356,893 | ||||||
BlackRock, Inc. | 4,160 | 1,482,333 | ||||||
Charles Schwab Corp. (The) | 36,650 | 1,041,227 | ||||||
E*TRADE Financial Corp.* | 10,200 | 256,836 | ||||||
Eaton Vance Corp. | 4,970 | 171,614 | ||||||
Federated Investors, Inc., | 4,970 | 157,052 | ||||||
Franklin Resources, Inc. | 9,720 | 362,945 | ||||||
Goldman Sachs Group, Inc. (The) | 13,740 | 2,254,871 | ||||||
Description
| Number of
| Value
| ||||||
Interactive Brokers Group, Inc., Class A | 1,700 | $ | 64,600 | |||||
Invesco Ltd. | 12,320 | 382,043 | ||||||
Lazard Ltd., Class A | 3,650 | 131,583 | ||||||
Legg Mason, Inc. | 3,710 | 119,128 | ||||||
LPL Financial Holdings, Inc.# | 3,600 | 95,040 | ||||||
Morgan Stanley | 50,946 | 1,378,599 | ||||||
Northern Trust Corp. | 7,180 | 510,354 | ||||||
NorthStar Asset Management Group, Inc. | 5,800 | 72,152 | ||||||
Raymond James Financial, Inc. | 4,510 | 235,287 | ||||||
SEI Investments Co. | 4,940 | 237,515 | ||||||
State Street Corp. | 13,970 | 870,331 | ||||||
T. Rowe Price Group, Inc. | 6,680 | 502,937 | ||||||
TD Ameritrade Holding Corp. | 7,650 | 228,200 | ||||||
Waddell & Reed Financial, Inc., Class A | 2,740 | 55,732 | ||||||
|
| |||||||
| $ | 13,136,860 | |||||||
COMMERCIAL BANKS – 5.1% | ||||||||
Associated Banc-Corp. | 8,385 | 152,942 | ||||||
Bank of America Corp. | 348,550 | 5,074,888 | ||||||
Bank of Hawaii Corp.# | 2,470 | 168,973 | ||||||
BankUnited, Inc. | 2,700 | 93,150 | ||||||
BB&T Corp. | 25,290 | 894,760 | ||||||
BOK Financial Corp. | 2,020 | 121,564 | ||||||
CIT Group, Inc. | 5,800 | 200,506 | ||||||
Citizens Financial Group, Inc. | 9,150 | 209,077 | ||||||
Comerica, Inc. | 5,030 | 223,332 | ||||||
Commerce Bancshares, Inc. | 1,642 | 76,878 | ||||||
Cullen/Frost Bankers, Inc.# | 1,440 | 92,146 | ||||||
East West Bancorp, Inc. | 2,600 | 97,474 | ||||||
Fifth Third Bancorp | 28,350 | 519,088 | ||||||
First Horizon National Corp. | 8,934 | 125,791 | ||||||
First Niagara Financial Group, Inc. | 10,550 | 111,408 | ||||||
First Republic Bank | 5,000 | 351,600 | ||||||
Huntington Bancshares, Inc. | 31,541 | 317,302 | ||||||
JPMorgan Chase & Co. | 123,620 | 7,812,784 | ||||||
KeyCorp | 22,770 | 279,843 | ||||||
M&T Bank Corp.§ | 1,610 | 190,495 | ||||||
PacWest Bancorp. | 3,239 | 129,495 | ||||||
PNC Financial Services Group, Inc. (The) | 17,560 | 1,541,417 | ||||||
Popular, Inc. | 3,900 | 115,908 | ||||||
Regions Financial Corp. | 43,656 | 409,493 | ||||||
Signature Bank* | 1,500 | 206,745 | ||||||
SunTrust Banks, Inc. | 15,280 | 637,787 | ||||||
SVB Financial Group* | 1,800 | 187,704 | ||||||
Synovus Financial Corp. | 5,594 | 174,309 | ||||||
TCF Financial Corp. | 8,210 | 111,984 | ||||||
U.S. Bancorp | 54,470 | 2,325,324 | ||||||
Wells Fargo & Co. | 155,775 | 7,785,635 | ||||||
April 30, 2016 / ANNUAL REPORT
PORTFOLIO OF INVESTMENTS 9
Wilmington Large-Cap Strategy Fund (continued)
Description
| Number of
| Value
| ||||||
Zions Bancorporation | 7,890 | $ | 217,133 | |||||
|
| |||||||
| $ | 30,956,935 | |||||||
CONSUMER FINANCE – 0.9% |
| |||||||
Ally Financial, Inc.* | 14,400 | 256,464 | ||||||
American Express Co. | 28,540 | 1,867,372 | ||||||
Capital One Financial Corp. | 18,300 | 1,324,737 | ||||||
Credit Acceptance Corp.* | 250 | 49,067 | ||||||
Discover Financial Services | 14,980 | 842,925 | ||||||
Lendingclub Corp.* | 3,020 | 23,858 | ||||||
Navient Corp. | 12,160 | 166,227 | ||||||
Santander Consumer USA Holdings, Inc.* | 3,700 | 48,729 | ||||||
SLM Corp.* | 18,260 | 123,620 | ||||||
Synchrony Financial* | 27,800 | 849,846 | ||||||
|
| |||||||
| $ | 5,552,845 | |||||||
DIVERSIFIED FINANCIAL SERVICES – 3.0% |
| |||||||
Berkshire Hathaway, Inc., | 61,696 | 8,975,534 | ||||||
CBOE Holdings, Inc. | 3,000 | 185,880 | ||||||
Citigroup, Inc. | 100,582 | 4,654,935 | ||||||
CME Group, Inc. | 10,000 | 919,100 | ||||||
Intercontinental Exchange, Inc. | 3,918 | 940,438 | ||||||
Leucadia National Corp. | 7,710 | 128,603 | ||||||
Moody’s Corp. | 5,940 | 568,577 | ||||||
MSCI, Inc. | 5,120 | 388,813 | ||||||
Nasdaq, Inc. | 4,530 | 279,546 | ||||||
OneMain Holdings, Inc.* | 500 | 15,910 | ||||||
S&P Global, Inc. | 10,390 | 1,110,172 | ||||||
Voya Financial, Inc. | 2,000 | 64,940 | ||||||
|
| |||||||
| $ | 18,232,448 | |||||||
INSURANCE – 3.3% |
| |||||||
Aflac, Inc. | 15,000 | 1,034,550 | ||||||
Alleghany Corp.* | 256 | 133,448 | ||||||
Allied World Assurance Co. Holdings AG | 3,890 | 138,406 | ||||||
Allstate Corp. (The) | 13,580 | 883,379 | ||||||
American Financial Group, Inc. | 1,600 | 110,576 | ||||||
American International Group, Inc. | 40,580 | 2,265,176 | ||||||
American National Insurance Co. | 600 | 69,672 | ||||||
Amtrust Financial Services, Inc. | 3,400 | 84,490 | ||||||
Aon PLC | 10,100 | 1,061,712 | ||||||
Arch Capital Group Ltd.* | 2,590 | 182,569 | ||||||
Arthur J Gallagher & Co. | 6,580 | 302,943 | ||||||
Aspen Insurance Holdings Ltd. | 4,665 | 216,223 | ||||||
Assurant, Inc. | 3,230 | 273,161 | ||||||
Assured Guaranty Ltd. | 3,550 | 91,839 | ||||||
Axis Capital Holdings Ltd. | 3,280 | 174,726 | ||||||
Brown & Brown, Inc. | 5,570 | 195,563 | ||||||
Chubb Ltd. | 17,147 | 2,020,945 | ||||||
Description
| Number of
| Value
| ||||||
Cincinnati Financial Corp. | 7,406 | $ | 488,870 | |||||
CNA Financial Corp. | 1,050 | 33,180 | ||||||
Endurance Specialty Holdings Ltd. | 2,000 | 127,960 | ||||||
Erie Indemnity Co., Class A | 670 | 63,241 | ||||||
Everest Re Group Ltd. | 1,170 | 216,333 | ||||||
FNF Group | 11,641 | 371,348 | ||||||
Genworth Financial, Inc., | 21,500 | 73,745 | ||||||
Hanover Insurance Group, Inc. (The) | 1,100 | 94,336 | ||||||
Hartford Financial Services Group, Inc. (The) | 13,990 | 620,876 | ||||||
Lincoln National Corp. | 7,670 | 333,261 | ||||||
Loews Corp. | 11,850 | 470,208 | ||||||
Markel Corp.* | 280 | 251,751 | ||||||
Marsh & McLennan Cos., Inc. | 18,890 | 1,192,904 | ||||||
Mercury General Corp. | 2,370 | 125,373 | ||||||
MetLife, Inc. | 30,451 | 1,373,340 | ||||||
Old Republic International Corp. | 13,500 | 249,615 | ||||||
Principal Financial Group, Inc. | 6,990 | 298,333 | ||||||
ProAssurance Corp. | 3,000 | 143,190 | ||||||
Progressive Corp. (The) | 24,930 | 812,718 | ||||||
Prudential Financial, Inc. | 15,230 | 1,182,457 | ||||||
Reinsurance Group of America, Inc. | 1,690 | 160,922 | ||||||
RenaissanceRe Holdings Ltd. | 1,120 | 124,219 | ||||||
Torchmark Corp. | 1,695 | 98,124 | ||||||
Travelers Cos., Inc. (The) | 11,380 | 1,250,662 | ||||||
Unum Group | 5,610 | 191,918 | ||||||
Validus Holdings Ltd. | 170 | 7,835 | ||||||
White Mountains Insurance Group Ltd.# | 160 | 132,800 | ||||||
WR Berkley Corp. | 3,580 | 200,480 | ||||||
XL Group PLC | 7,270 | 237,947 | ||||||
|
| |||||||
| $ | 20,167,324 | |||||||
REAL ESTATE INVESTMENT TRUSTS – 4.1% |
| |||||||
Alexandria Real Estate Equities, Inc. | 2,915 | 270,949 | ||||||
American Campus Communities, Inc. | 4,700 | 210,325 | ||||||
American Capital Agency Corp. | 4,030 | 74,031 | ||||||
American Homes 4 Rent, Class A | 1,650 | 26,103 | ||||||
American Tower Corp. | 13,160 | 1,380,221 | ||||||
Annaly Capital Management, Inc. | 37,380 | 389,500 | ||||||
Apartment Investment & Management Co., Class A | 3,970 | 159,038 | ||||||
Apple Hospitality REIT, Inc.# | 6,500 | 123,045 | ||||||
AvalonBay Communities, Inc. | 5,122 | 905,518 | ||||||
Boston Properties, Inc. | 4,550 | 586,313 | ||||||
Brandywine Realty Trust | 4,680 | 69,966 | ||||||
Brixmor Property Group, Inc. | 6,250 | 157,812 | ||||||
Camden Property Trust | 2,670 | 215,549 | ||||||
Care Capital Properties, Inc. | 796 | 21,229 | ||||||
CBL & Associates Properties, Inc. | 5,600 | 65,408 | ||||||
ANNUAL REPORT / April 30, 2016
10 PORTFOLIO OF INVESTMENTS
Wilmington Large-Cap Strategy Fund (continued)
Description
| Number of
| Value
| ||||||
Chimera Investment Corp. | 6,740 | $ | 95,708 | |||||
Columbia Property Trust, Inc. | 3,700 | 82,510 | ||||||
Communications Sales & Leasing, Inc. | 3,350 | 77,820 | ||||||
Corporate Office Properties Trust | 4,700 | 120,696 | ||||||
Corrections Corp. of America | 3,867 | 117,634 | ||||||
Crown Castle International Corp. | 13,440 | 1,167,667 | ||||||
DDR Corp. | 9,900 | 173,250 | ||||||
Digital Realty Trust, Inc. | 6,110 | 537,558 | ||||||
Douglas Emmett, Inc. | 4,410 | 143,104 | ||||||
Duke Realty Corp. | 12,010 | 262,659 | ||||||
Empire State Realty Trust, Inc., Class A | 1,600 | 29,616 | ||||||
Equinix, Inc. | 1,781 | 588,353 | ||||||
Equity Commonwealth* | 4,992 | 139,327 | ||||||
Equity Lifestyle Properties, Inc. | 3,400 | 232,866 | ||||||
Equity Residential | 14,350 | 976,804 | ||||||
Essex Property Trust, Inc. | 2,073 | 456,993 | ||||||
Extra Space Storage, Inc. | 3,100 | 263,345 | ||||||
Federal Realty Investment Trust | 1,970 | 299,598 | ||||||
Forest City Realty Trust, Inc., Class A | 6,100 | 126,758 | ||||||
Gaming and Leisure Properties, Inc.# | 2,904 | 95,222 | ||||||
General Growth Properties, Inc. | 20,643 | 578,623 | ||||||
HCP, Inc. | 12,330 | 417,124 | ||||||
Healthcare Trust of America, Inc., Class A | 8,800 | 254,232 | ||||||
Hospitality Properties Trust | 6,800 | 174,012 | ||||||
Host Hotels & Resorts, Inc. | 21,940 | 347,091 | ||||||
Iron Mountain, Inc. | 8,803 | 321,574 | ||||||
Kilroy Realty Corp. | 5,525 | 358,075 | ||||||
Kimco Realty Corp. | 15,180 | 426,862 | ||||||
Lamar Advertising Co., Class A | 2,400 | 148,896 | ||||||
Liberty Property Trust | 4,040 | 140,996 | ||||||
Macerich Co. (The) | 5,660 | 430,613 | ||||||
MFA Financial, Inc. | 12,150 | 83,956 | ||||||
Mid-America Apartment Communities, Inc. | 3,200 | 306,272 | ||||||
National Retail Properties, Inc. | 2,500 | 109,400 | ||||||
NorthStar Realty Europe Corp. | 1,433 | 17,096 | ||||||
NorthStar Realty Finance Corp. | 5,200 | 66,508 | ||||||
Omega Healthcare Investors, Inc.# | 2,850 | 96,245 | ||||||
Outfront Media, Inc. | 1,300 | 28,197 | ||||||
Paramount Group, Inc. | 4,575 | 76,403 | ||||||
Piedmont Office Realty Trust, Inc., Class A | 4,950 | 98,555 | ||||||
Post Properties, Inc. | 100 | 5,736 | ||||||
Prologis, Inc. | 14,590 | 662,532 | ||||||
Public Storage | 5,460 | 1,336,663 | ||||||
Rayonier, Inc. | 5,615 | 138,578 | ||||||
Realty Income Corp.# | 11,510 | 681,392 | ||||||
Regency Centers Corp.# | 3,435 | 253,160 | ||||||
Retail Properties of America, Inc., Class A | 7,400 | 118,326 | ||||||
Senior Housing Properties Trust | 7,000 | 123,060 | ||||||
Description
| Number of
| Value
| ||||||
Simon Property Group, Inc. | 10,993 | $ | 2,211,462 | |||||
SL Green Realty Corp. | 2,090 | 219,617 | ||||||
Spirit Realty Capital, Inc. | 18,900 | 216,027 | ||||||
Starwood Property Trust, Inc. | 4,170 | 80,731 | ||||||
Tanger Factory Outlet Centers, Inc. | 3,100 | 108,748 | ||||||
Taubman Centers, Inc. | 2,480 | 172,236 | ||||||
Two Harbors Investment Corp. | 10,400 | 81,432 | ||||||
UDR, Inc. | 8,580 | 299,614 | ||||||
Ventas, Inc. | 8,286 | 514,726 | ||||||
VEREIT, Inc. | 13,000 | 115,440 | ||||||
Vornado Realty Trust | 5,673 | 543,076 | ||||||
Weingarten Realty Investors | 3,560 | 131,435 | ||||||
Welltower, Inc. | 8,970 | 622,697 | ||||||
Weyerhaeuser Co. | 29,942 | 961,737 | ||||||
WP Carey, Inc. | 1,400 | 85,526 | ||||||
WP GLIMCHER, Inc. | 6,176 | 64,786 | ||||||
|
| |||||||
| $ | 24,871,962 | |||||||
REAL ESTATE MANAGEMENT & DEVELOPMENT – 0.1% |
| |||||||
CBRE Group, Inc., Class A* | 11,310 | 335,115 | ||||||
Four Corners Property Trust, Inc. | 1,976 | 35,074 | ||||||
Howard Hughes Corp. | 1,458 | 153,338 | ||||||
Jones Lang LaSalle, Inc. | 1,550 | 178,513 | ||||||
Realogy Holdings Corp.* | 5,400 | 192,996 | ||||||
|
| |||||||
| $ | 895,036 | |||||||
THRIFTS & MORTGAGE FINANCE – 0.1% |
| |||||||
New York Community Bancorp, Inc. | 13,790 | 207,264 | ||||||
People’s United Financial, Inc.# | 11,200 | 173,600 | ||||||
TFS Financial Corp. | 1,050 | 18,795 | ||||||
|
| |||||||
| $ | 399,659 | |||||||
|
| |||||||
TOTAL FINANCIALS |
| $ | 114,213,069 | |||||
HEALTH CARE – 16.7% | ||||||||
BIOTECHNOLOGY – 3.1% | ||||||||
Agios Pharmaceuticals, Inc.#,* | 1,700 | 83,215 | ||||||
Alexion Pharmaceuticals, Inc.* | 7,190 | 1,001,423 | ||||||
Alkermes PLC* | 1,000 | 39,750 | ||||||
Alnylam Pharmaceuticals, Inc.* | 2,500 | 167,600 | ||||||
Amgen, Inc. | 25,964 | 4,110,101 | ||||||
Baxalta, Inc. | 24,500 | 1,027,775 | ||||||
Biogen, Inc.* | 7,700 | 2,117,423 | ||||||
BioMarin Pharmaceutical, Inc.* | 4,900 | 414,932 | ||||||
Bluebird Bio, Inc.* | 1,600 | 70,960 | ||||||
Celgene Corp.* | 26,866 | 2,778,213 | ||||||
Gilead Sciences, Inc. | 49,044 | 4,326,171 | ||||||
Incyte Corp.* | 4,860 | 351,232 | ||||||
Intercept Pharmaceuticals, Inc.#,* | 800 | 120,592 | ||||||
April 30, 2016 / ANNUAL REPORT
PORTFOLIO OF INVESTMENTS 11
Wilmington Large-Cap Strategy Fund (continued)
Description
| Number of
| Value
| ||||||
Intrexon Corp.#,* | 1,860 | $ | 49,718 | |||||
Ionis Pharmaceuticals, Inc.#,* | 3,500 | 143,395 | ||||||
Juno Therapeutics, Inc.#,* | 1,700 | 71,553 | ||||||
Medivation, Inc.* | 4,900 | 283,220 | ||||||
Opko Health, Inc.#,* | 8,400 | 90,300 | ||||||
Puma Biotechnology, Inc.#,* | 1,220 | 37,442 | ||||||
Regeneron Pharmaceuticals, Inc.* | 2,600 | 979,446 | ||||||
Seattle Genetics, Inc.#,* | 1,500 | 53,220 | ||||||
United Therapeutics Corp.* | 1,240 | 130,448 | ||||||
Vertex Pharmaceuticals, Inc.* | 7,743 | 653,045 | ||||||
|
| |||||||
| $ | 19,101,174 | |||||||
HEALTH CARE EQUIPMENT & SUPPLIES – 3.0% |
| |||||||
Abbott Laboratories | 49,309 | 1,918,120 | ||||||
Alere, Inc.* | 3,550 | 138,450 | ||||||
Align Technology, Inc.* | 3,560 | 256,996 | ||||||
Baxter International, Inc.# | 20,930 | 925,525 | ||||||
Becton Dickinson & Co. | 8,680 | 1,399,737 | ||||||
Boston Scientific Corp.* | 41,200 | 903,104 | ||||||
Cooper Cos., Inc. (The) | 1,850 | 283,198 | ||||||
CR Bard, Inc. | 3,780 | 802,003 | ||||||
DENTSPLY SIRONA, Inc. | 10,379 | 618,588 | ||||||
DexCom, Inc.* | 1,940 | 124,897 | ||||||
Edwards Lifesciences Corp.* | 10,172 | 1,080,368 | ||||||
Hill-Rom Holdings, Inc. | 2,260 | 109,271 | ||||||
Hologic, Inc.* | 8,540 | 286,859 | ||||||
IDEXX Laboratories, Inc.* | 3,880 | 327,278 | ||||||
Intuitive Surgical, Inc.* | 1,600 | 1,002,176 | ||||||
Medtronic PLC | 52,526 | 4,157,433 | ||||||
ResMed, Inc. | 8,120 | 453,096 | ||||||
St. Jude Medical, Inc. | 8,770 | 668,274 | ||||||
Stryker Corp. | 11,100 | 1,210,011 | ||||||
Teleflex, Inc. | 2,060 | 320,907 | ||||||
Varian Medical Systems, Inc.* | 4,750 | 385,605 | ||||||
Zimmer Biomet Holdings, Inc. | 5,810 | 672,624 | ||||||
|
| |||||||
| $ | 18,044,520 | |||||||
HEALTH CARE PROVIDERS & SERVICES – 3.0% |
| |||||||
Acadia Healthcare Co., Inc.#,* | 1,220 | 77,092 | ||||||
Aetna, Inc. | 12,031 | 1,350,720 | ||||||
AmerisourceBergen Corp. | 7,870 | 669,737 | ||||||
Anthem, Inc. | 10,610 | 1,493,570 | ||||||
Brookdale Senior Living, Inc.* | 3,970 | 73,286 | ||||||
Cardinal Health, Inc. | 9,820 | 770,477 | ||||||
Centene Corp.* | 6,232 | 386,135 | ||||||
Cigna Corp. | 8,430 | 1,167,892 | ||||||
Community Health Systems, Inc.* | 6,246 | 119,174 | ||||||
DaVita HealthCare Partners, Inc.* | 5,188 | 383,393 | ||||||
Envision Healthcare Holdings, Inc.* | 8,300 | 187,829 | ||||||
Description
| Number of
| Value
| ||||||
Express Scripts Holding Co.* | 22,362 | $ | 1,648,750 | |||||
HCA Holdings, Inc.* | 11,100 | 894,882 | ||||||
Henry Schein, Inc.* | 3,760 | 634,312 | ||||||
Humana, Inc. | 5,030 | 890,662 | ||||||
Laboratory Corp. of America Holdings* | 2,857 | 358,039 | ||||||
LifePoint Hospitals, Inc.* | 1,730 | 116,879 | ||||||
McKesson Corp. | 7,500 | 1,258,650 | ||||||
MEDNAX, Inc.* | 3,740 | 266,625 | ||||||
Patterson Cos., Inc. | 970 | 42,050 | ||||||
Premier, Inc., Class A* | 1,300 | 43,953 | ||||||
Quest Diagnostics, Inc. | 4,350 | 326,990 | ||||||
Tenet Healthcare Corp.#,* | 2,425 | 76,848 | ||||||
UnitedHealth Group, Inc. | 32,920 | 4,334,906 | ||||||
Universal Health Services, Inc., Class B | 3,480 | 465,206 | ||||||
VCA, Inc.* | 2,070 | 130,348 | ||||||
|
| |||||||
| $ | 18,168,405 | |||||||
HEALTH CARE TECHNOLOGY – 0.2% |
| |||||||
Allscripts Healthcare Solutions, Inc.* | 8,100 | 108,540 | ||||||
athenahealth, Inc.#,* | 1,300 | 173,290 | ||||||
Cerner Corp.* | 9,140 | 513,120 | ||||||
IMS Health Holdings, Inc.* | 4,800 | 127,872 | ||||||
Inovalon Holdings, Inc., Class A#,* | 1,300 | 22,230 | ||||||
Veeva Systems, Inc., Class A* | 4,720 | 129,847 | ||||||
|
| |||||||
| $ | 1,074,899 | |||||||
LIFE SCIENCES TOOLS & SERVICES – 0.9% |
| |||||||
Agilent Technologies, Inc. | 7,490 | 306,491 | ||||||
Bio-Rad Laboratories, Inc., Class A* | 890 | 126,246 | ||||||
Bio-Techne Corp. | 500 | 46,590 | ||||||
Bruker Corp. | 7,400 | 209,420 | ||||||
Charles River Laboratories International, Inc.* | 3,420 | 271,103 | ||||||
Illumina, Inc.* | 5,840 | 788,342 | ||||||
Mettler-Toledo International, Inc.* | 1,520 | 544,084 | ||||||
PerkinElmer, Inc. | 4,070 | 205,209 | ||||||
QIAGEN N.V.* | 3,620 | 81,305 | ||||||
Quintiles Transnational Holdings, Inc.* | 5,780 | 399,225 | ||||||
Thermo Fisher Scientific, Inc. | 13,620 | 1,964,685 | ||||||
VWR Corp.* | 6,000 | 159,840 | ||||||
Waters Corp.* | 3,810 | 495,910 | ||||||
|
| |||||||
| $ | 5,598,450 | |||||||
PHARMACEUTICALS – 6.5% |
| |||||||
AbbVie, Inc. | 56,478 | 3,445,158 | ||||||
Akorn, Inc.* | 3,960 | 100,782 | ||||||
Allergan PLC* | 14,185 | 3,071,904 | ||||||
Bristol-Myers Squibb Co. | 56,660 | 4,089,719 | ||||||
Eli Lilly & Co. | 32,430 | 2,449,438 | ||||||
ANNUAL REPORT / April 30, 2016
12 PORTFOLIO OF INVESTMENTS
Wilmington Large-Cap Strategy Fund (continued)
Description
| Number of
| Value
| ||||||
Endo International PLC* | 7,170 | $ | 193,590 | |||||
Jazz Pharmaceuticals PLC* | 1,400 | 210,980 | ||||||
Johnson & Johnson | 97,900 | 10,972,632 | ||||||
Mallinckrodt PLC* | 2,710 | 169,429 | ||||||
Merck & Co., Inc. | 101,366 | 5,558,911 | ||||||
Mylan NV* | 19,930 | 831,280 | ||||||
Perrigo Co. PLC | 5,140 | 496,884 | ||||||
Pfizer, Inc. | 218,203 | 7,137,420 | ||||||
Zoetis, Inc. | 15,781 | 742,180 | ||||||
|
| |||||||
| $ | 39,470,307 | |||||||
|
| |||||||
TOTAL HEALTH CARE | $ | 101,457,755 | ||||||
INDUSTRIALS – 10.8% | ||||||||
AEROSPACE & DEFENSE – 2.5% |
| |||||||
B/E Aerospace, Inc. | 3,000 | 145,890 | ||||||
Boeing Co. (The) | 19,940 | 2,687,912 | ||||||
BWX Technologies, Inc. | 2,940 | 98,167 | ||||||
General Dynamics Corp. | 8,230 | 1,156,480 | ||||||
Hexcel Corp. | 3,600 | 162,972 | ||||||
Honeywell International, Inc. | 22,670 | 2,590,501 | ||||||
Huntington Ingalls Industries, Inc. | 1,645 | 238,147 | ||||||
L-3 Communications Holdings, Inc. | 2,010 | 264,375 | ||||||
Lockheed Martin Corp. | 7,650 | 1,777,707 | ||||||
Northrop Grumman Corp. | 5,770 | 1,190,120 | ||||||
Orbital ATK, Inc. | 2,120 | 184,440 | ||||||
Raytheon Co. | 8,620 | 1,089,137 | ||||||
Rockwell Collins, Inc. | 2,870 | 253,105 | ||||||
Spirit Aerosystems Holdings, Inc., Class A* | 4,540 | 214,061 | ||||||
Textron, Inc. | 7,270 | 281,204 | ||||||
TransDigm Group, Inc.* | 1,490 | 339,526 | ||||||
United Technologies Corp. | 25,100 | 2,619,687 | ||||||
|
| |||||||
| $ | 15,293,431 | |||||||
AIR FREIGHT & LOGISTICS – 0.7% |
| |||||||
C.H. Robinson Worldwide, Inc. | 4,084 | 289,841 | ||||||
Expeditors International of Washington, Inc. | 7,280 | 361,161 | ||||||
FedEx Corp. | 8,460 | 1,396,831 | ||||||
United Parcel Service, Inc., Class B | 20,430 | 2,146,580 | ||||||
|
| |||||||
| $ | 4,194,413 | |||||||
AIRLINES – 0.6% | ||||||||
Alaska Air Group, Inc. | 4,400 | 309,892 | ||||||
American Airlines Group, Inc. | 18,100 | 627,889 | ||||||
Copa Holdings SA, Class A# | 2,050 | 130,688 | ||||||
Delta Air Lines, Inc. | 23,590 | 982,995 | ||||||
JetBlue Airways Corp.* | 6,500 | 128,635 | ||||||
Southwest Airlines Co. | 19,230 | 857,850 | ||||||
Spirit Airlines, Inc.* | 1,600 | 70,288 | ||||||
| Description | Number of Shares | Value | ||||||
United Continental Holdings, Inc.* | 11,083 | $ | 507,712 | |||||
|
| |||||||
| $ | 3,615,949 | |||||||
BUILDING PRODUCTS – 0.2% |
| |||||||
Allegion PLC | 2,233 | 146,150 | ||||||
Armstrong Flooring, Inc.* | 310 | 4,514 | ||||||
Armstrong World Industries, Inc.* | 620 | 25,302 | ||||||
Fortune Brands Home & Security, Inc. | 4,760 | 263,752 | ||||||
Lennox International, Inc. | 1,490 | 201,075 | ||||||
Masco Corp. | 10,930 | 335,660 | ||||||
Owens Corning | 2,290 | 105,500 | ||||||
Smith (A.O.) Corp. | 2,500 | 193,050 | ||||||
USG Corp.#,* | 2,660 | 71,847 | ||||||
|
| |||||||
| $ | 1,346,850 | |||||||
COMMERCIAL SERVICES & SUPPLIES – 0.6% |
| |||||||
ADT Corp. (The) | 4,800 | 201,504 | ||||||
Cintas Corp. | 3,520 | 316,026 | ||||||
Clean Harbors, Inc.* | 1,300 | 64,220 | ||||||
Copart, Inc.* | 1,900 | 81,396 | ||||||
Covanta Holding Corp.# | 4,900 | 79,674 | ||||||
KAR Auction Services, Inc. | 4,100 | 154,160 | ||||||
Pitney Bowes, Inc. | 8,400 | 176,148 | ||||||
Republic Services, Inc. | 8,740 | 411,392 | ||||||
Rollins, Inc. | 4,000 | 107,480 | ||||||
RR Donnelley & Sons Co. | 6,970 | 121,278 | ||||||
Stericycle, Inc.* | 2,552 | 243,869 | ||||||
Tyco International PLC | 9,170 | 353,228 | ||||||
Waste Connections, Inc. | 5,695 | 383,160 | ||||||
Waste Management, Inc. | 15,840 | 931,234 | ||||||
|
| |||||||
| $ | 3,624,769 | |||||||
CONSTRUCTION & ENGINEERING – 0.1% |
| |||||||
AECOM* | 3,191 | 103,676 | ||||||
Chicago Bridge & Iron Co. NV# | 1,482 | 59,650 | ||||||
Fluor Corp. | 3,750 | 204,975 | ||||||
Jacobs Engineering Group, Inc.* | 4,150 | 185,007 | ||||||
KBR, Inc. | 4,450 | 69,242 | ||||||
Quanta Services, Inc.* | 2,760 | 65,467 | ||||||
Topbuild Corp.* | 1,736 | 54,198 | ||||||
|
| |||||||
| $ | 742,215 | |||||||
ELECTRICAL EQUIPMENT – 0.6% |
| |||||||
Acuity Brands, Inc. | 1,300 | 317,057 | ||||||
AMETEK, Inc. | 5,660 | 272,189 | ||||||
Babcock & Wilcox Enterprises, Inc.* | 1,470 | 33,589 | ||||||
Eaton Corp. PLC | 18,278 | 1,156,449 | ||||||
Emerson Electric Co. | 21,040 | 1,149,415 | ||||||
Hubbell, Inc. | 1,290 | 136,430 | ||||||
Regal-Beloit Corp. | 600 | 38,652 | ||||||
April 30, 2016 / ANNUAL REPORT
PORTFOLIO OF INVESTMENTS 13
Wilmington Large-Cap Strategy Fund (continued)
Description
| Number of
| Value
| ||||||
Rockwell Automation, Inc. | 3,620 | $ | 410,761 | |||||
SolarCity Corp.#,* | 3,220 | 97,630 | ||||||
|
| |||||||
| $ | 3,612,172 | |||||||
ELECTRONIC EQUIPMENT, INSTRUMENTS & COMPONENTS – 0.0%** |
| |||||||
GoPro, Inc., Class A#,* | 1,700 | 21,488 | ||||||
INDUSTRIAL CONGLOMERATES – 2.4% |
| |||||||
3M Co. | 18,760 | 3,140,049 | ||||||
Carlisle Cos., Inc. | 1,290 | 131,451 | ||||||
Danaher Corp. | 18,380 | 1,778,265 | ||||||
General Electric Co. | 278,620 | 8,567,565 | ||||||
Roper Technologies, Inc. | 3,000 | 528,270 | ||||||
|
| |||||||
| $ | 14,145,600 | |||||||
MACHINERY – 1.7% | ||||||||
AGCO Corp.# | 1,260 | 67,372 | ||||||
Allison Transmission Holdings, Inc. | 4,800 | 138,288 | ||||||
Caterpillar, Inc. | 19,000 | 1,476,680 | ||||||
Colfax Corp.* | 2,900 | 94,047 | ||||||
Crane Co. | 1,200 | 66,684 | ||||||
Cummins, Inc. | 6,080 | 711,542 | ||||||
Deere & Co.# | 8,990 | 756,149 | ||||||
Donaldson Co., Inc. | 4,010 | 131,047 | ||||||
Dover Corp. | 4,160 | 273,312 | ||||||
Flowserve Corp.# | 3,000 | 146,430 | ||||||
Graco, Inc. | 2,140 | 167,755 | ||||||
IDEX Corp. | 2,120 | 173,628 | ||||||
Illinois Tool Works, Inc. | 8,000 | 836,160 | ||||||
Ingersoll-Rand PLC | 12,550 | 822,527 | ||||||
ITT Corp. | 2,535 | 97,268 | ||||||
Joy Global, Inc.# | 6,200 | 132,060 | ||||||
Kennametal, Inc. | 450 | 10,521 | ||||||
Lincoln Electric Holdings, Inc. | 2,600 | 162,942 | ||||||
Manitowoc Co., Inc. (The)# | 3,910 | 22,287 | ||||||
Manitowoc Foodservice, Inc.* | 3,910 | 58,689 | ||||||
Middleby Corp. (The)* | 1,600 | 175,424 | ||||||
Nordson Corp. | 2,000 | 153,460 | ||||||
Oshkosh Corp. | 1,790 | 87,442 | ||||||
PACCAR, Inc. | 11,090 | 653,312 | ||||||
Parker Hannifin Corp. | 2,960 | 343,419 | ||||||
Pentair PLC | 3,816 | 221,633 | ||||||
Snap-On, Inc. | 1,280 | 203,878 | ||||||
SPX Corp. | 330 | 5,313 | ||||||
Spx Flow, Inc.* | 1,230 | 36,851 | ||||||
Stanley Black & Decker, Inc. | 4,220 | 472,302 | ||||||
Terex Corp. | 3,730 | 89,110 | ||||||
Timken Co. (The) | 600 | 21,378 | ||||||
Toro Co. (The) | 2,340 | 202,293 | ||||||
Description
| Number of
| Value
| ||||||
Trinity Industries, Inc.# | 2,400 | $ | 46,824 | |||||
Valmont Industries, Inc. | 1,060 | 148,803 | ||||||
WABCO Holdings, Inc.* | 2,050 | 229,928 | ||||||
Wabtec Corp. | 3,320 | 275,328 | ||||||
Xylem, Inc. | 5,010 | 209,318 | ||||||
|
| |||||||
| $ | 9,921,404 | |||||||
MARINE – 0.0%** | ||||||||
Kirby Corp.* | 2,000 | 127,640 | ||||||
PROFESSIONAL SERVICES – 0.3% |
| |||||||
Dun & Bradstreet Corp. (The) | 930 | 102,681 | ||||||
Equifax, Inc. | 4,060 | 488,215 | ||||||
IHS, Inc., Class A* | 1,640 | 202,015 | ||||||
ManpowerGroup, Inc. | 1,860 | 143,276 | ||||||
Nielsen Holdings PLC | 7,550 | 393,657 | ||||||
Robert Half International, Inc. | 3,560 | 136,384 | ||||||
TransUnion* | 4,100 | 122,795 | ||||||
Verisk Analytics, Inc.* | 4,800 | 372,384 | ||||||
|
| |||||||
| $ | 1,961,407 | |||||||
ROAD & RAIL – 0.9% | ||||||||
AMERCO | 300 | 105,600 | ||||||
Avis Budget Group, Inc.* | 3,080 | 77,308 | ||||||
CSX Corp. | 32,400 | 883,548 | ||||||
Genesee & Wyoming, Inc., | 2,100 | 136,731 | ||||||
Hertz Global Holdings, Inc.* | 7,100 | 65,746 | ||||||
JB Hunt Transport Services, Inc. | 2,980 | 246,982 | ||||||
Kansas City Southern | 2,980 | 282,355 | ||||||
Landstar System, Inc. | 1,590 | 104,224 | ||||||
Norfolk Southern Corp. | 9,660 | 870,463 | ||||||
Old Dominion Freight Line, Inc.* | 2,800 | 184,940 | ||||||
Ryder System, Inc. | 1,840 | 126,813 | ||||||
Union Pacific Corp. | 24,870 | 2,169,410 | ||||||
|
| |||||||
| $ | 5,254,120 | |||||||
TRADING COMPANIES & DISTRIBUTORS – 0.2% |
| |||||||
Air Lease Corp. | 1,200 | 36,576 | ||||||
Fastenal Co.# | 8,020 | 375,256 | ||||||
GATX Corp.# | 690 | 31,699 | ||||||
HD Supply Holdings, Inc.* | 6,400 | 219,392 | ||||||
MSC Industrial Direct Co., Inc., Class A | 1,390 | 107,725 | ||||||
NOW, Inc.#,* | 1,663 | 30,034 | ||||||
United Rentals, Inc.* | 3,520 | 235,594 | ||||||
Watsco, Inc. | 100 | 13,447 | ||||||
WW Grainger, Inc.# | 1,440 | 337,709 | ||||||
|
| |||||||
| $ | 1,387,432 | |||||||
TRANSPORTATION INFRASTRUCTURE – 0.0%** |
| |||||||
Macquarie Infrastructure Corp. | 1,500 | 105,585 | ||||||
|
| |||||||
TOTAL INDUSTRIALS | $ | 65,354,475 | ||||||
ANNUAL REPORT / April 30, 2016
14 PORTFOLIO OF INVESTMENTS
Wilmington Large-Cap Strategy Fund (continued)
Description
| Number of
| Value
| ||||||
INFORMATION TECHNOLOGY – 21.1% |
| |||||||
COMMERCIAL SERVICES & SUPPLIES – 0.0%** |
| |||||||
Sabre Corp. | 3,620 | $ | 104,799 | |||||
COMMUNICATIONS EQUIPMENT – 1.4% |
| |||||||
ARRIS International PLC* | 1,880 | 42,808 | ||||||
Brocade Communications Systems, Inc. | 15,290 | 146,937 | ||||||
Cisco Systems, Inc. | 163,050 | 4,482,244 | ||||||
EchoStar Corp., Class A* | 2,370 | 96,980 | ||||||
F5 Networks, Inc.* | 1,990 | 208,452 | ||||||
Harris Corp. | 2,859 | 228,749 | ||||||
Juniper Networks, Inc. | 10,390 | 243,126 | ||||||
Lumentum Holdings, Inc.* | 3,110 | 78,683 | ||||||
Motorola Solutions, Inc. | 6,030 | 453,396 | ||||||
Palo Alto Networks, Inc.* | 1,790 | 270,057 | ||||||
QUALCOMM, Inc. | 47,180 | 2,383,534 | ||||||
Viavi Solutions, Inc.* | 5,890 | 38,344 | ||||||
|
| |||||||
| $ | 8,673,310 | |||||||
COMPUTERS & PERIPHERALS – 3.5% |
| |||||||
3D Systems Corp.#,* | 7,000 | 123,830 | ||||||
Apple, Inc. | 185,360 | 17,375,646 | ||||||
EMC Corp. | 56,370 | 1,471,821 | ||||||
HP, Inc. | 49,690 | 609,696 | ||||||
Lexmark International, Inc., Class A | 3,030 | 116,958 | ||||||
NCR Corp.* | 2,220 | 64,580 | ||||||
NetApp, Inc. | 7,153 | 169,097 | ||||||
SanDisk Corp. | 9,650 | 725,005 | ||||||
Western Digital Corp. | 6,580 | 268,892 | ||||||
|
| |||||||
| $ | 20,925,525 | |||||||
ELECTRONIC EQUIPMENT, INSTRUMENTS & COMPONENTS – 0.5% |
| |||||||
Amphenol Corp., Class A | 13,200 | 736,956 | ||||||
Arrow Electronics, Inc.* | 2,940 | 182,574 | ||||||
Avnet, Inc. | 4,660 | 191,619 | ||||||
CDW Corp. | 4,990 | 192,115 | ||||||
Cognex Corp. | 3,200 | 113,696 | ||||||
Corning, Inc. | 32,770 | 611,816 | ||||||
Dolby Laboratories, Inc., Class A | 150 | 7,141 | ||||||
Fitbit, Inc., Class A#,* | 1,400 | 25,550 | ||||||
FLIR Systems, Inc. | 2,090 | 63,139 | ||||||
Ingram Micro, Inc., Class A | 4,800 | 167,760 | ||||||
IPG Photonics Corp.* | 2,000 | 173,340 | ||||||
Jabil Circuit, Inc. | 6,140 | 106,590 | ||||||
Keysight Technologies, Inc.* | 3,645 | 95,062 | ||||||
National Instruments Corp. | 4,030 | 111,107 | ||||||
Trimble Navigation Ltd.* | 12,480 | 298,896 | ||||||
|
| |||||||
| $ | 3,077,361 | |||||||
Description
| Number of
| Value | ||||||
INTERNET SOFTWARE & SERVICES – 4.2% |
| |||||||
Akamai Technologies, Inc.* | 5,850 | $ | 298,291 | |||||
Alphabet, Inc., Class A* | 9,195 | 6,508,957 | ||||||
Alphabet, Inc., Class C* | 9,629 | 6,672,993 | ||||||
CoStar Group, Inc.* | 1,300 | 256,503 | ||||||
eBay, Inc.* | 35,990 | 879,236 | ||||||
Facebook, Inc., Class A* | 70,680 | 8,310,554 | ||||||
GoDaddy, Inc., Class A#,* | 750 | 22,777 | ||||||
IAC/InterActiveCorp | 1,300 | 60,242 | ||||||
LinkedIn Corp., Class A* | 3,170 | 397,233 | ||||||
Match Group, Inc.#,* | 2,400 | 27,360 | ||||||
Pandora Media, Inc.#,* | 6,900 | 68,517 | ||||||
Rackspace Hosting, Inc.* | 5,080 | 116,180 | ||||||
Twitter, Inc.* | 15,310 | 223,832 | ||||||
VeriSign, Inc.#,* | 3,950 | 341,280 | ||||||
Yahoo!, Inc.* | 28,030 | 1,025,898 | ||||||
Yelp, Inc.#,* | 3,600 | 75,600 | ||||||
Zillow Group, Inc., Class A#,* | 3,600 | 87,720 | ||||||
|
| |||||||
| $ | 25,373,173 | |||||||
IT SERVICES – 4.5% | ||||||||
Accenture PLC, Class A | 21,400 | 2,416,488 | ||||||
Alliance Data Systems Corp.* | 1,590 | 323,263 | ||||||
Amdocs Ltd. | 2,620 | 148,135 | ||||||
Automatic Data Processing, Inc. | 17,930 | 1,585,729 | ||||||
Black Knight Financial Services, Inc., Class A#,* | 400 | 12,792 | ||||||
Booz Allen Hamilton Holding Corp. | 3,460 | 95,392 | ||||||
Broadridge Financial Solutions, Inc. | 3,630 | 217,219 | ||||||
Cognizant Technology Solutions Corp., Class A* | 19,210 | 1,121,288 | ||||||
Computer Sciences Corp. | 3,800 | 125,894 | ||||||
CoreLogic, Inc.* | 2,980 | 105,730 | ||||||
CSRA, Inc. | 5,500 | 142,780 | ||||||
DST Systems, Inc. | 1,670 | 201,536 | ||||||
Fidelity National Information Services, Inc. | 7,243 | 476,589 | ||||||
First Data Corp., Class A* | 4,800 | 54,672 | ||||||
Fiserv, Inc.* | 9,560 | 934,203 | ||||||
FleetCor Technologies, Inc.* | 2,600 | 402,168 | ||||||
Gartner, Inc.* | 3,500 | 305,095 | ||||||
Genpact Ltd.* | 11,200 | 312,368 | ||||||
Global Payments, Inc. | 5,800 | 418,644 | ||||||
Hewlett Packard Enterprise Co. | 52,790 | 879,481 | ||||||
International Business Machines Corp. | 29,160 | 4,255,610 | ||||||
Jack Henry & Associates, Inc. | 1,900 | 153,957 | ||||||
Leidos Holdings, Inc. | 2,200 | 109,142 | ||||||
MasterCard, Inc., Class A | 31,020 | 3,008,630 | ||||||
Paychex, Inc. | 14,770 | 769,812 | ||||||
April 30, 2016 / ANNUAL REPORT
PORTFOLIO OF INVESTMENTS 15
Wilmington Large-Cap Strategy Fund (continued)
Description
| Number of
| Value
| ||||||
Paypal Holdings, Inc.* | 43,865 | $ | 1,718,631 | |||||
Square, Inc., Class A#,* | 2,800 | 41,692 | ||||||
Teradata Corp.* | 6,070 | 153,571 | ||||||
Total System Services, Inc. | 4,920 | 251,609 | ||||||
Vantiv, Inc., Class A* | 8,100 | 441,774 | ||||||
VeriFone Systems, Inc.* | 4,000 | 113,840 | ||||||
Visa, Inc., Class A | 64,620 | 4,991,249 | ||||||
Western Union Co. (The) | 18,640 | 372,800 | ||||||
Xerox Corp. | 28,310 | 271,776 | ||||||
|
| |||||||
| $ | 26,933,559 | |||||||
SEMICONDUCTORS & SEMICONDUCTOR |
| |||||||
Analog Devices, Inc. | 9,220 | 519,270 | ||||||
Applied Materials, Inc. | 46,080 | 943,258 | ||||||
Broadcom Ltd. | 13,233 | 1,928,710 | ||||||
Cree, Inc.#,* | 5,210 | 127,697 | ||||||
Cypress Semiconductor Corp.# | 12,000 | 108,360 | ||||||
First Solar, Inc.* | 3,500 | 195,440 | ||||||
Intel Corp. | 158,570 | 4,801,500 | ||||||
KLA-Tencor Corp. | 5,850 | 409,149 | ||||||
Lam Research Corp. | 5,780 | 441,592 | ||||||
Linear Technology Corp. | 5,310 | 236,189 | ||||||
Marvell Technology Group Ltd. | 11,490 | 114,670 | ||||||
Maxim Integrated Products, Inc. | 10,220 | 365,058 | ||||||
Microchip Technology, Inc.# | 7,039 | 342,025 | ||||||
Micron Technology, Inc.* | 29,600 | 318,200 | ||||||
NVIDIA Corp. | 22,780 | 809,373 | ||||||
ON Semiconductor Corp.* | 4,320 | 40,910 | ||||||
Qorvo, Inc.* | 5,250 | 236,408 | ||||||
Skyworks Solutions, Inc. | 6,000 | 400,920 | ||||||
SunEdison, Inc.* | 17,500 | 4,148 | ||||||
SunPower Corp.#,* | 900 | 18,126 | ||||||
Teradyne, Inc. | 7,450 | 140,880 | ||||||
Texas Instruments, Inc. | 37,900 | 2,161,816 | ||||||
Xilinx, Inc. | 12,400 | 534,192 | ||||||
|
| |||||||
| $ | 15,197,891 | |||||||
SOFTWARE – 4.5% |
| |||||||
Activision Blizzard, Inc. | 19,470 | 671,131 | ||||||
Adobe Systems, Inc.* | 18,460 | 1,739,301 | ||||||
ANSYS, Inc.* | 1,380 | 125,263 | ||||||
Atlassian Corp. PLC, Class A* | 13,600 | 315,112 | ||||||
Autodesk, Inc.* | 6,730 | 402,589 | ||||||
CA, Inc. | 10,480 | 310,837 | ||||||
Cadence Design Systems, Inc.* | 11,710 | 271,555 | ||||||
CDK Global, Inc. | 4,676 | 222,437 | ||||||
Citrix Systems, Inc.* | 4,990 | 408,382 | ||||||
Electronic Arts, Inc.* | 10,310 | 637,673 | ||||||
FactSet Research Systems, Inc. | 1,540 | 232,155 | ||||||
Description
| Number of
| Value | ||||||
FireEye, Inc.#,* | 4,500 | $ | 78,075 | |||||
Fortinet, Inc.* | 2,400 | 78,024 | ||||||
Intuit, Inc. | 10,700 | 1,079,523 | ||||||
Microsoft Corp. | 260,099 | 12,971,137 | ||||||
NetSuite, Inc.#,* | 1,600 | 129,664 | ||||||
Nuance Communications, Inc.* | 9,100 | 156,338 | ||||||
Oracle Corp. | 100,410 | 4,002,343 | ||||||
PTC, Inc.* | 2,100 | 76,566 | ||||||
Red Hat, Inc.* | 5,130 | 376,388 | ||||||
salesforce.com, Inc.* | 20,430 | 1,548,594 | ||||||
ServiceNow, Inc.* | 4,500 | 321,660 | ||||||
Splunk, Inc.* | 2,400 | 124,752 | ||||||
SS&C Technologies Holdings, Inc. | 1,600 | 97,840 | ||||||
Symantec Corp. | 16,920 | 281,633 | ||||||
Synopsys, Inc.* | 2,600 | 123,552 | ||||||
Tableau Software, Inc., | 2,100 | 108,570 | ||||||
Ultimate Software Group, Inc.* | 540 | 106,159 | ||||||
VMware, Inc., Class A#,* | 1,910 | 108,698 | ||||||
Workday, Inc., Class A#,* | 2,350 | 176,203 | ||||||
Zynga, Inc., Class A* | 19,850 | 47,243 | ||||||
|
| |||||||
| $ | 27,329,397 | |||||||
TELECOMMUNICATIONS – 0.0%** |
| |||||||
Arista Networks, Inc.#,* | 200 | 13,324 | ||||||
CommScope Holding Co, Inc.* | 3,900 | 118,599 | ||||||
Zayo Group Holdings, Inc.* | 200 | 5,192 | ||||||
|
| |||||||
| $ | 137,115 | |||||||
|
| |||||||
TOTAL INFORMATION TECHNOLOGY |
| $ | 127,752,130 | |||||
MATERIALS – 2.9% | ||||||||
CHEMICALS – 2.0% | ||||||||
Air Products & Chemicals, Inc. | 5,200 | 758,628 | ||||||
Airgas, Inc. | 1,800 | 256,392 | ||||||
Albemarle Corp. | 2,000 | 132,320 | ||||||
Ashland, Inc. | 1,200 | 133,920 | ||||||
Axalta Coating Systems Ltd.* | 4,300 | 122,421 | ||||||
Cabot Corp. | 2,500 | 121,975 | ||||||
Celanese Corp. | 3,500 | 247,450 | ||||||
CF Industries Holdings, Inc. | 7,100 | 234,797 | ||||||
Chemours Co. (The) | 20,600 | 187,872 | ||||||
Dow Chemical Co. (The) | 30,800 | 1,620,388 | ||||||
E.I. du Pont de Nemours & Co. | 24,300 | 1,601,613 | ||||||
Eastman Chemical Co. | 4,000 | 305,520 | ||||||
Ecolab, Inc. | 5,900 | 678,382 | ||||||
FMC Corp. | 3,900 | 168,714 | ||||||
GCP Applied Technologies, Inc.* | 2,900 | 64,177 | ||||||
Huntsman Corp. | 9,900 | 155,826 | ||||||
International Flavors & Fragrances, Inc. | 1,000 | 119,470 | ||||||
ANNUAL REPORT / April 30, 2016
16 PORTFOLIO OF INVESTMENTS
Wilmington Large-Cap Strategy Fund (continued)
| Description | Number of Shares | Value | ||||||
LyondellBasell Industries NV, Class A | 12,600 | $ | 1,041,642 | |||||
Monsanto Co. | 11,100 | 1,039,848 | ||||||
Mosaic Co. (The) | 9,900 | 277,101 | ||||||
PPG Industries, Inc. | 6,300 | 695,457 | ||||||
Praxair, Inc. | 7,100 | 833,966 | ||||||
RPM International, Inc. | 2,700 | 136,431 | ||||||
Scotts Miracle-Gro Co., Class A (The) | 1,500 | 106,170 | ||||||
Sherwin-Williams Co. (The) | 1,800 | 517,158 | ||||||
Valspar Corp. (The) | 1,300 | 138,697 | ||||||
Westlake Chemical Corp. | 1,300 | 65,247 | ||||||
WR Grace & Co.* | 1,700 | 130,356 | ||||||
|
| |||||||
| $ | 11,891,938 | |||||||
CONSTRUCTION MATERIALS – 0.1% |
| |||||||
Eagle Materials, Inc. | 1,000 | 74,120 | ||||||
Martin Marietta Materials, Inc. | 1,400 | 236,922 | ||||||
Vulcan Materials Co. | 3,400 | 365,942 | ||||||
|
| |||||||
| $ | 676,984 | |||||||
CONTAINERS & PACKAGING – 0.3% |
| |||||||
Avery Dennison Corp. | 900 | 65,349 | ||||||
Ball Corp. | 1,100 | 78,518 | ||||||
Bemis Co., Inc. | 2,600 | 130,468 | ||||||
Graphic Packaging Holding Co. | 9,100 | 120,848 | ||||||
Owens-Illinois, Inc.* | 8,700 | 160,602 | ||||||
Packaging Corp. of America | 2,200 | 142,736 | ||||||
Sealed Air Corp. | 3,100 | 146,816 | ||||||
Silgan Holdings, Inc. | 2,200 | 111,628 | ||||||
WestRock Co. | 14,400 | 602,640 | ||||||
|
| |||||||
| $ | 1,559,605 | |||||||
METALS & MINING – 0.4% |
| |||||||
Alcoa, Inc.# | 36,800 | 411,056 | ||||||
Freeport-McMoRan, Inc. | 33,700 | 471,800 | ||||||
Newmont Mining Corp. | 15,100 | 528,047 | ||||||
Nucor Corp. | 10,900 | 542,602 | ||||||
Reliance Steel & Aluminum Co. | 1,800 | 133,146 | ||||||
Royal Gold, Inc.# | 1,100 | 68,882 | ||||||
Southern Copper Corp.# | 4,600 | 136,482 | ||||||
Steel Dynamics, Inc. | 6,200 | 156,302 | ||||||
Tahoe Resources, Inc. | 6,000 | 84,780 | ||||||
United States Steel Corp. | 12,100 | 231,231 | ||||||
|
| |||||||
| $ | 2,764,328 | |||||||
PAPER & FOREST PRODUCTS – 0.1% |
| |||||||
Domtar Corp. | 3,100 | 119,784 | ||||||
International Paper Co. | 13,800 | 597,126 | ||||||
|
| |||||||
| $ | 716,910 | |||||||
|
| |||||||
TOTAL MATERIALS | $ | 17,609,765 | ||||||
TELECOMMUNICATION SERVICES – 2.5% |
| |||||||
| Description | Number of Shares | Value | ||||||
DIVERSIFIED TELECOMMUNICATION SERVICES – 2.4% |
| |||||||
AT&T, Inc. | 186,400 | $ | 7,236,048 | |||||
CenturyLink, Inc. | 16,300 | 504,485 | ||||||
Frontier Communications Corp.# | 37,700 | 209,612 | ||||||
Level 3 Communications, Inc.* | 8,400 | 438,984 | ||||||
Verizon Communications, Inc. | 120,600 | 6,143,364 | ||||||
|
| |||||||
| $ | 14,532,493 | |||||||
WIRELESS TELECOMMUNICATION SERVICES – 0.1% |
| |||||||
SBA Communications Corp., Class A* | 4,050 | 417,312 | ||||||
Sprint Corp.#, * | 36,350 | 124,681 | ||||||
Telephone & Data Systems, Inc. | 2,000 | 59,140 | ||||||
T-Mobile US, Inc.* | 7,600 | 298,528 | ||||||
|
| |||||||
| $ | 899,661 | |||||||
|
| |||||||
TOTAL TELECOMMUNICATION SERVICES |
| $ | 15,432,154 | |||||
UTILITIES – 1.5% |
| |||||||
ELECTRIC UTILITIES – 0.8% |
| |||||||
American Electric Power Co., Inc. | 4,100 | 260,350 | ||||||
Avangrid, Inc. | 2,900 | 116,290 | ||||||
Duke Energy Corp. | 12,200 | 961,116 | ||||||
Edison International | 2,500 | 176,775 | ||||||
Entergy Corp. | 4,700 | 353,346 | ||||||
Eversource Energy | 6,800 | 383,792 | ||||||
Exelon Corp. | 16,000 | 561,440 | ||||||
FirstEnergy Corp. | 9,600 | 312,864 | ||||||
NextEra Energy, Inc. | 4,400 | 517,352 | ||||||
PPL Corp. | 12,500 | 470,500 | ||||||
Southern Co. (The) | 17,300 | 866,730 | ||||||
|
| |||||||
| $ | 4,980,555 | |||||||
GAS UTILITIES – 0.0%** |
| |||||||
AGL Resources, Inc. | 1,800 | 118,548 | ||||||
Atmos Energy Corp. | 800 | 58,040 | ||||||
UGI Corp. | 1,400 | 56,336 | ||||||
|
| |||||||
| $ | 232,924 | |||||||
INDEPENDENT POWER PRODUCERS & ENERGY TRADERS – 0.1% |
| |||||||
AES Corp. | 15,300 | 170,748 | ||||||
Calpine Corp.* | 8,800 | 138,864 | ||||||
NRG Energy, Inc. | 10,000 | 151,000 | ||||||
|
| |||||||
| $ | 460,612 | |||||||
MULTI-UTILITIES – 0.5% |
| |||||||
CenterPoint Energy, Inc. | 10,500 | 225,225 | ||||||
CMS Energy Corp. | 6,200 | 252,216 | ||||||
Consolidated Edison, Inc. | 5,300 | 395,380 | ||||||
Dominion Resources, Inc. | 9,300 | 664,671 | ||||||
OGE Energy Corp. | 5,900 | 174,581 | ||||||
April 30, 2016 / ANNUAL REPORT
PORTFOLIO OF INVESTMENTS 17
Wilmington Large-Cap Strategy Fund (continued)
Description
| Number of Shares
| Value
| ||||||
PG&E Corp. | 5,300 | $ | 308,460 | |||||
Public Service Enterprise Group, Inc. | 5,000 | 230,650 | ||||||
Sempra Energy | 1,900 | 196,365 | ||||||
Vectren Corp. | 1,100 | 53,735 | ||||||
WEC Energy Group, Inc. | 1,900 | 110,599 | ||||||
Xcel Energy, Inc. | 9,900 | 396,297 | ||||||
|
| |||||||
| $ | 3,008,179 | |||||||
WATER UTILITIES – 0.1% | ||||||||
American Water Works Co., Inc. | 1,800 | 130,968 | ||||||
Aqua America, Inc. | 3,600 | 113,976 | ||||||
|
| |||||||
| $ | 244,944 | |||||||
|
| |||||||
TOTAL UTILITIES | $ | 8,927,214 | ||||||
|
| |||||||
| TOTAL COMMON STOCKS | ||||||||
| (COST $460,090,568) | $ | 605,465,036 | ||||||
| INVESTMENT COMPANIES – 0.2% | ||||||||
EQUITY FUNDS – 0.2% | ||||||||
iShares Russell 1000 ETF | 6,360 | 729,301 | ||||||
iShares Russell 1000 Growth ETF | 2,500 | 247,125 | ||||||
iShares Russell 1000 Value ETF | 2,500 | 252,225 | ||||||
|
| |||||||
TOTAL EQUITY FUNDS | $ | 1,228,651 | ||||||
|
| |||||||
| TOTAL INVESTMENT COMPANIES | ||||||||
| (COST $1,225,092) | $ | 1,228,651 | ||||||
| RIGHTS – 0.0%** | ||||||||
Celgene Corp.* | 89 | 100 | ||||||
Community Health Systems, Inc.* | 3,700 | 22 | ||||||
|
| |||||||
| TOTAL RIGHTS | ||||||||
| (COST $142) | $ | 122 | ||||||
| WARRANTS – 0.0%** | ||||||||
American International Group, Inc. CW21, Expire 1/19/21* | 2,055 | 38,593 | ||||||
Kinder Morgan, Inc., Expire 5/25/17* | 16,345 | 572 | ||||||
| TOTAL WARRANTS | ||||||||
| (COST $48,690) | $ | 39,165 | ||||||
|
| |||||||
| TOTAL INVESTMENTS IN SECURITIES – 100.0% | ||||||||
| (COST $461,364,492) | $ | 606,732,974 | ||||||
Par Value | ||||||||
| CASH COLLATERAL INVESTED FOR SECURITIES ON LOAN – 2.5% | ||||||||
REPURCHASE AGREEMENTS – 2.5% |
| |||||||
BNP Paribas Securities Corp., 0.29%, dated 4/29/16, due 5/02/16, repurchase price $2,887,457, collateralized by U.S. Government & Treasury Securities 0.00% to 7.63%, maturing 5/26/16 to 5/15/45; total market value of $2,945,135. | $ | 2,887,387 | 2,887,387 | |||||
Description
| Par Value
| Value
| ||||||
Daiwa Capital Markets America, 0.32%,dated 4/29/16, due 5/02/16, repurchase price $2,887,464, collateralized by U.S. Government & Treasury Securities 0.00% to 8.75%, maturing 5/05/16 to 9/09/49; total market value of $2,945,134. | $ | 2,887,387 | $ | 2,887,387 | ||||
HSBC Securities USA, Inc., 0.27%, dated 4/29/16, due 5/02/16, repurchase price $2,887,452, collateralized by U.S. Government & Treasury Securities 0.00% to 7.25%, maturing 5/15/16 to 7/15/37; total market value of $2,945,142. | 2,887,387 | 2,887,387 | ||||||
Mizuho Securities USA, Inc., 0.32%, dated 4/29/16, due 5/02/16, repurchase price $2,887,464, collateralized by U.S. Government Securities 2.00% to 8.00%,maturing 6/01/24 to 8/20/45; total market value of $2,945,135. | 2,887,387 | 2,887,387 | ||||||
Nomura Securities International, Inc., 0.32%, dated 4/29/16, due 5/02/16,repurchase price $2,887,464, collateralized by U.S. Government & Treasury Securities 0.00% to 9.50%, maturing 5/15/16 to 3/20/66; total market value of $2,945,135. | 2,887,387 | 2,887,387 | ||||||
TD Securities (USA) LLC, 0.30%, dated 4/29/16, due 5/02/16, repurchase price $759,745, collateralized by U.S. Government & Treasury Securities 1.38% to 4.50%, maturing 11/30/18 to 4/01/46; total market value of $774,920. | 759,726 | 759,726 | ||||||
|
| |||||||
TOTAL CASH COLLATERAL INVESTED FOR SECURITIES ON LOAN |
| |||||||
| (COST $15,196,661) | $ | 15,196,661 | ||||||
|
| |||||||
| TOTAL INVESTMENTS – 102.5% | ||||||||
| (COST $476,561,153) | $ | 621,929,635 | ||||||
COLLATERAL FOR SECURITIES ON LOAN – (2.5%) |
| (15,196,661 | ) | |||||
| OTHER ASSETS LESS LIABILITIES – 0.0%** | 175,267 | |||||||
|
| |||||||
| TOTAL NET ASSETS – 100.0% | $ | 606,908,241 | ||||||
|
| |||||||
ANNUAL REPORT / April 30, 2016
18 PORTFOLIO OF INVESTMENTS
Wilmington Large-Cap Strategy Fund (concluded)
Cost of investments for Federal income tax purposes is $490,261,660. The net unrealized appreciation/(depreciation) of investments was $131,667,975. This consists of net unrealized appreciation from investment for those securities having an excess of value over cost of $158,777,593 and net unrealized depreciation from investments for those securities having an excess of cost over value of $27,109,618.
Various inputs are used in determining the value of the Fund’s investments. These inputs are summarized in the three broad levels listed below.
Level 1 – quoted prices in active markets for identical securities
Level 2 – other significant observable inputs (including quoted prices for similar securities, interest rates, prepayment speeds, credit risk, etc.)
Level 3 – significant unobservable inputs (including the Fund’s own assumptions in determining the fair value of investments)
The following is a summary of the inputs used as of April 30, 2016 in valuing the Fund’s assets carried at fair value:
| Level 1 | Level 2 | Level 3 | Total | |||||||||||||
Investments in Securities | ||||||||||||||||
Common Stocks | $605,465,036 | $ — | $ — | $605,465,036 | ||||||||||||
Investment Companies | 1,228,651 | — | — | 1,228,651 | ||||||||||||
Rights | 122 | — | — | 122 | ||||||||||||
Warrants | 39,165 | — | — | 39,165 | ||||||||||||
Repurchase Agreements | — | 15,196,661 | — | 15,196,661 | ||||||||||||
|
|
|
|
|
|
|
| |||||||||
Total | $606,732,974 | $15,196,661 | $ — | $621,929,635 | ||||||||||||
|
|
|
|
|
|
|
| |||||||||
| # | Security, or a portion thereof, is on loan. See Note 2 in Notes to Financial Statements. |
| * | Non-income producing security. |
| ** | Represents less than 0.05%. |
| § | Affiliated company. See Note 4 in Notes to Financial Statements. |
The following acronyms are used throughout this Fund:
LP - Limited Partnership
PLC - Public Limited Company
REIT - Real Estate Investment Trust
See Notes which are an integral part of the Financial Statements
April 30, 2016 / ANNUAL REPORT
| STATEMENT OF ASSETS AND LIABILITIES | 19 |
| April 30, 2016 | Wilmington Large-Cap Strategy Fund | |||||||
ASSETS: | ||||||||
Investments, at identified cost | $ | 476,561,153 | (a) | |||||
|
| |||||||
Investments in repurchase agreements, at value | $ | 15,196,661 | ||||||
Investments in securities, at value (Including $14,735,050 of securities on loan) (Note 2) | 606,732,974 | (b) | ||||||
|
| |||||||
TOTAL INVESTMENTS IN SECURITIES AND REPURCHASE AGREEMENTS | 621,929,635 | |||||||
|
|
| ||||||
Income receivable | 587,673 | |||||||
Receivable for shares sold | 284,447 | |||||||
Receivable for investments sold | 141,408 | |||||||
Prepaid assets | 18,627 | |||||||
|
| |||||||
TOTAL ASSETS | 622,961,790 | |||||||
|
|
| ||||||
LIABILITIES: | ||||||||
Payable to custodian | 580,637 | |||||||
Collateral for securities on loan | 15,196,661 | |||||||
Payable for shares redeemed | 157,982 | |||||||
Payable for Trustees’ fees | 2,005 | |||||||
Pending Litigation (See Note 7) | — | |||||||
Other accrued expenses | 116,264 | |||||||
|
| |||||||
TOTAL LIABILITIES | 16,053,549 | |||||||
|
|
| ||||||
NET ASSETS | $ | 606,908,241 | ||||||
|
|
| ||||||
NET ASSETS CONSIST OF: | ||||||||
| ||||||||
Paid-in capital | $ | 495,362,769 | ||||||
Undistributed (accumulated) net investment income (loss) | 894,107 | |||||||
Accumulated net realized gain (loss) on investments | (34,717,117) | |||||||
Net unrealized appreciation (depreciation) of investments | 145,368,482 | |||||||
|
| |||||||
TOTAL NET ASSETS | $ | 606,908,241 | ||||||
|
|
| ||||||
COMPUTATION OF NET ASSET VALUE AND OFFERING PRICE: | ||||||||
Class I | ||||||||
Net Assets | $ | 606,908,241 | ||||||
|
| |||||||
Shares outstanding (unlimited shares authorized) | 35,886,797 | |||||||
|
| |||||||
Net Asset Value per share | $ | 16.91 | ||||||
|
| |||||||
| (a) | Includes $127,292 of investments in affiliated issuers. |
| (b) | Includes $190,495 of investments in affiliated issuers. |
See Notes which are an integral part of the Financial Statements
ANNUAL REPORT / April 30, 2016
| 20 | STATEMENT OF OPERATIONS |
| Year Ended April 30, 2016 | Wilmington Large-Cap Strategy | |||||||
| INVESTMENT INCOME: | ||||||||
Dividends | $11,250,593(a)(b) | |||||||
Securities lending income | 118,011 | |||||||
|
| |||||||
| TOTAL INVESTMENT INCOME | 11,368,604 | |||||||
|
|
| ||||||
| EXPENSES: | ||||||||
Investment advisory fee | 2,943,940 | |||||||
Administrative personnel and services fees | 184,490 | |||||||
Portfolio accounting and administration fees | 189,106 | |||||||
Custodian fees | 51,696 | |||||||
Transfer and dividend disbursing agent fees and expenses | 107,293 | |||||||
Trustees’ fees | 43,263 | |||||||
Professional fees | 73,331 | |||||||
Shareholder services fee—Class I | 1,471,970 | |||||||
Share registration costs | 19,734 | |||||||
Printing and postage | 32,356 | |||||||
Miscellaneous | 122,015 | |||||||
|
| |||||||
| TOTAL EXPENSES | 5,239,194 | |||||||
|
|
| ||||||
| WAIVERS AND REIMBURSEMENTS: | ||||||||
Waiver/reimbursement by investment advisor | (2,281,988) | |||||||
Waiver of shareholder services fee—Class I | (1,471,970) | |||||||
Waiver of portfolio accounting and administration fees | (13,266) | |||||||
|
| |||||||
| TOTAL WAIVERS AND REIMBURSEMENTS | (3,767,224) | |||||||
|
|
| ||||||
Net expenses | 1,471,970 | |||||||
|
| |||||||
Net investment income (loss) | 9,896,634 | |||||||
|
| |||||||
| REALIZED AND UNREALIZED GAIN (LOSS) ON INVESTMENTS: | ||||||||
Net realized gain (loss) on investments | 3,894,999 | |||||||
Net change in unrealized appreciation (depreciation) of investments | (32,021,505) | |||||||
|
| |||||||
Net realized and unrealized gain (loss) on investments | (28,126,506) | |||||||
|
| |||||||
Change in net assets resulting from operations | $ (18,229,872) | |||||||
|
| |||||||
| (a) | Net of foreign withholding taxes withheld of $2,627. |
| (b) | Includes $4,508 received from affiliated issuers. |
See Notes which are an integral part of the Financial Statements
April 30, 2016 / ANNUAL REPORT
| STATEMENTS OF CHANGES IN NET ASSETS | 21 |
| Wilmington Large-Cap Strategy Fund | |||||||||
| Year Ended April 30, 2016 | Year Ended April 30, 2015 | |||||||||
| OPERATIONS: | ||||||||||
Net investment income (loss) | $ | 9,896,634 | $ | 6,790,674 | ||||||
Net realized gain (loss) on investments | 3,894,999 | 21,054,159 | ||||||||
Net change in unrealized appreciation (depreciation) of investments | (32,021,505) | 33,516,495 | ||||||||
|
|
|
| |||||||
Change in net assets resulting from operations | (18,229,872) | 61,361,328 | ||||||||
|
|
|
| |||||||
| DISTRIBUTIONS TO SHAREHOLDERS: | ||||||||||
Distributions from net investment income | ||||||||||
Class I | (9,665,314) | (6,747,267) | ||||||||
Distributions from net realized gain on investments | ||||||||||
Class I | (43,348,922) | (24,762,981) | ||||||||
|
|
|
| |||||||
Change in net assets resulting from distributions to shareholders | (53,014,236) | (31,510,248) | ||||||||
|
|
|
| |||||||
| SHARE TRANSACTIONS: | ||||||||||
Proceeds from sale of shares | ||||||||||
Class I | 449,044,771 | 60,761,127 | ||||||||
Distributions reinvested | ||||||||||
Class I | 40,639,425 | 25,089,595 | ||||||||
Cost of shares redeemed | ||||||||||
Class I | (280,509,480) | (44,130,686) | ||||||||
|
|
|
| |||||||
Change in net assets resulting from share transactions | 209,174,716 | 41,720,036 | ||||||||
|
|
|
| |||||||
Change in net assets | 137,930,608 | 71,571,116 | ||||||||
| NET ASSETS: | ||||||||||
Beginning of year | 468,977,633 | 397,406,517 | ||||||||
|
|
|
| |||||||
End of year | $ | 606,908,241 | $ | 468,977,633 | ||||||
|
|
|
| |||||||
Undistributed (accumulated) net investment income (loss) included in net assets at end of year | $ | 894,107 | $ | 508,024 | ||||||
|
|
|
| |||||||
| SHARES OF BENEFICIAL INTEREST: | ||||||||||
Shares sold | ||||||||||
Class I | 25,238,721 | 3,448,351 | ||||||||
Distributions reinvested | ||||||||||
Class I | 2,328,850 | 1,383,832 | ||||||||
Shares redeemed | ||||||||||
Class I | (17,083,773) | (2,435,973) | ||||||||
|
|
|
| |||||||
Net change resulting from share transactions | 10,483,798 | 2,396,210 | ||||||||
|
|
|
| |||||||
See Notes which are an integral part of the Financial Statements
ANNUAL REPORT / April 30, 2016
| 22 | FINANCIAL HIGHLIGHTS |
For a share outstanding throughout each period:
|
| |||||||||||||||||||||||
WILMINGTON LARGE-CAP STRATEGY FUND† | ||||||||||||||||||||||||
CLASS I | Year Ended April 30, 2016 | Year Ended April 30, 2015 | Year Ended April 30, 2014 | Year Ended April 30, 2013 | For the Period July 1, 2011 through April 30, 2012* | Year Ended June 30, 2011 | ||||||||||||||||||
| Net Asset Value, Beginning of Year | $18.46 | $17.27 | $14.63 | $12.84 | $12.13 | $9.39 | ||||||||||||||||||
| Income (Loss) From Operations: | ||||||||||||||||||||||||
Net Investment Income (Loss)(a) | 0.29 | 0.28 | 0.27 | 0.26 | 0.16 | 0.20 | ||||||||||||||||||
Net Realized and Unrealized Gain (Loss) on Investments | (0.42 | ) | 2.19 | 2.65 | 1.79 | 0.71 | 2.72 | |||||||||||||||||
| Total Income (Loss) From Operations | (0.13 | ) | 2.47 | 2.92 | 2.05 | 0.87 | 2.92 | |||||||||||||||||
| Less Distributions From: | ||||||||||||||||||||||||
Net Investment Income | (0.28 | ) | (0.27 | ) | (0.28 | ) | (0.26 | ) | (0.16 | ) | (0.18 | ) | ||||||||||||
Net Realized Gains | (1.14 | ) | (1.01 | ) | — | — | — | — | ||||||||||||||||
| Total Distributions | (1.42 | ) | (1.28 | ) | (0.28 | ) | (0.26 | ) | (0.16 | ) | (0.18 | ) | ||||||||||||
| Net Asset Value, End of Year | $16.91 | $18.46 | $17.27 | $14.63 | $12.84 | $12.13 | ||||||||||||||||||
| Total Return(b) | (0.87 | )% | 14.52 | % | 20.12 | % | 16.25 | % | 7.32 | % | 31.24 | % | ||||||||||||
| Net Assets, End of Year (000’s) | $606,908 | $468,978 | $397,407 | $399,710 | $374,903 | $429,467 | ||||||||||||||||||
| Ratios to Average Net Assets | ||||||||||||||||||||||||
Gross Expense | 0.89 | % | 0.86 | % | 0.87 | % | 0.88 | % | 0.74 | %(c) | 0.69 | % | ||||||||||||
Net Expenses(d) | 0.25 | % | 0.25 | % | 0.25 | % | 0.25 | % | 0.25 | %(c) | 0.25 | % | ||||||||||||
Net Investment Income (Loss) | 1.68 | % | 1.52 | % | 1.71 | % | 1.99 | % | 1.70 | %(c) | 1.72 | % | ||||||||||||
| Portfolio Turnover Rate | 81 | % | 15 | % | 29 | % | 24 | % | 19 | % | 39 | % | ||||||||||||
| (a) | Per share numbers have been calculated using the average shares method. |
| (b) | Total returns for periods of less than one year, if any, are not annualized. |
| (c) | Annualized for periods less than one year. |
| (d) | The investment advisor and other service providers waived or reimbursed a portion of their fees. |
| † | Effective March 9, 2012, the Fund acquired all of the assets and liabilities of the Wilmington Large-Cap Strategy Fund, a series of WT Mutual Fund (the “WT Fund”). The financial highlights for the periods prior to that date reflect the performance of the WT Fund. |
| * | Year end changed from June 30 to April 30. |
See Notes which are an integral part of the Financial Statements
April 30, 2016 / ANNUAL REPORT
| NOTES TO FINANCIAL STATEMENTS | 23 |
Wilmington Funds
April 30, 2016
| 1. | ORGANIZATION |
Wilmington Funds (the “Trust”) is registered under the Investment Company Act of 1940, as amended (the “Act”), as an open-end management investment company. The Trust consists of 16 portfolios, 1 of which is presented herein (referred to as the “Fund”). The remaining 15 funds are presented in separate reports.
| Fund | Investment Goal | |
Wilmington Large-Cap Strategy Fund (“Large-Cap Strategy Fund”)(d) | The Fund seeks to achieve long-term capital appreciation.
|
(d) Diversified
The Trust offers 6 classes of shares: Class A, Service Class, Select Class, Administrative Class, Class I and Institutional Class. Class A, Service Class, Select Class, Administrative Class and Institutional Class are not available for the Fund. All shares of the Trust have equal rights with respect to voting, except on class-specific matters.
The assets of each portfolio are segregated and a shareholder’s interest is limited to the portfolio in which shares are held.
In the normal course of business, the Fund may enter into contracts that provide general indemnifications. The Fund’s maximum exposure under these arrangements is dependent on claims that may be made against the Fund in the future, and, therefore, cannot be estimated; however, based on experience, the risk of material loss from such claims is considered remote.
On June 18, 2015, Wilmington Funds Management Corporation (“WFMC” or the “Advisor”) and Wilmington Trust Investment Advisors, Inc. (“WTIA”), recommended, and the Board of Trustees (“Trustees”) approved, the liquidation of the Mid-Cap Growth Fund, Small-Cap Growth Fund and the Small-Cap Strategy Fund (the “Liquidating Funds”). Effective upon the close of business of the New York Stock Exchange on June 22, 2015, the Liquidating Funds no longer accepted purchase orders of any kind. The liquidation date was July 20, 2015 for the Small-Cap Growth Fund and August 3, 2015 for the Mid-Cap Growth Fund and Small-Cap Strategy Fund. On the liquidation date, each Liquidating Fund made a liquidating distribution to its remaining shareholders equal to each shareholder’s proportionate share of the net assets of the respective Fund in a complete redemption and cancellation of each Fund’s shares held by each remaining shareholder, and the Fund dissolved.
| 2. | SUMMARY OF SIGNIFICANT ACCOUNTING POLICIES |
The following is a summary of significant accounting policies consistently followed by the Fund in the preparation of its financial statements. These policies are in conformity with U.S. generally accepted accounting principles (“GAAP”). The Trust is an investment company and follows accounting and reporting guidance under Financial Accounting Standards Board (“FASB”) Accounting Standards Codification (“ASC”) Topic 946, “Financial Services - Investment Companies.” The preparation of financial statements in conformity with GAAP requires management to make estimates and assumptions that affect the amounts
of assets, liabilities, expenses and revenues reported in the financial statements. Actual results could differ from those estimated.
Investment Valuation – Fair value of the Fund’s portfolio securities are determined as follows:
| • | for equity securities, according to the last sale price or official closing price reported in the market in which they are primarily traded (either a national securities exchange or the over-the-counter market), if available; |
| • | in the absence of recorded sales for equity securities, according to the mean between the last closing bid and asked prices; |
| • | investments in open-end regulated investment companies are valued at net asset value (“NAV”); |
| • | for fixed income securities, according to prices as furnished by an independent pricing service, except that fixed income securities with remaining maturities of less than 60 days at the time of purchase are valued at amortized cost provided such amount approximates fair value; and |
| • | for all other securities at fair value as determined in accordance with procedures established by and under the general supervision of the Trustees. |
Trading in foreign securities may be completed at times which vary from the closing of the New York Stock Exchange (“NYSE”). In computing its NAV, the Fund values foreign securities using the latest closing price on the primary exchange on which they are traded immediately prior to the closing of the NYSE. Certain foreign currency exchange rates are generally determined at the latest rate prior to the closing of the NYSE. Foreign securities quoted in foreign currencies are translated into U.S. dollars at current rates. Events that affect these values and exchange rates may occur between the times at which they are determined and the closing of the NYSE. If such events materially affect the value of portfolio securities, these securities may be valued at their fair value as determined in good faith by the Trustees, although the actual calculation may be done by others. An event is considered material if there is both an affirmative expectation that the security’s value will change in response to the event and a reasonable basis for quantifying the resulting change in value.
ANNUAL REPORT / April 30, 2016
| 24 | NOTES TO FINANCIAL STATEMENTS (continued) |
The Trust follows the authoritative guidance (GAAP) for fair value measurements. The guidance establishes a framework for measuring fair value and a hierarchy for inputs used in measuring fair value that maximizes the use of observable inputs and minimizes the use of unobservable inputs by requiring that the most observable inputs be used when available. The guidance establishes three tiers of inputs that may be used to measure fair value. The three tiers of inputs are summarized at the end of the Fund’s Portfolio of Investments. The inputs or methodology used for valuing securities are not necessarily an indication of the risk associated with investing in those securities.
The policy of the Fund is to disclose transfers between levels based on valuations at the beginning of the reporting period. The portfolio may hold securities which are periodically fair valued in accordance with the Fund’s fair value procedures. This may result in movements between Levels 1, 2 and 3 throughout the period. For the year ended April 30, 2016, there were no transfers between Levels 1, 2 and 3 assets and liabilities, based on levels assigned to securities at the beginning of the period. Pursuant to the Fund’s fair value procedures noted previously, equity securities (including exchange traded securities and other open-end regulated investment companies) are generally categorized as Level 1 securities in the fair value hierarchy. Fixed income securities and money market instruments are generally categorized as Level 2 securities in the fair value hierarchy.
Investments for which there are no such quotations, or for which quotations do not appear reliable, are valued at fair value as determined in accordance with procedures established by and under the general supervision of the Trustees. These valuations are typically categorized as Level 2 or Level 3 securities in the fair value hierarchy.
Repurchase Agreements – Repurchase agreements are transactions in which a Fund buys a security from a dealer or bank and agrees to sell the security back at a mutually agreed upon time and price. The repurchase price exceeds the sale price, reflecting the Fund’s return on the transaction. It is the Fund’s policy to require the counterparty to a repurchase agreement to transfer to the Fund’s custodian or sub-custodian eligible securities or cash with a market value (after transaction costs) at least equal to the repurchase price to be paid under the repurchase agreement. The eligible securities are transferred to accounts with the custodian or sub-custodian in which the Fund holds a “securities entitlement” and exercise “control” as those terms are defined in the Uniform Commercial Code. The Fund has established procedures for monitoring the market value of the transferred securities and requiring the transfer of additional eligible securities if necessary to equal at least the repurchase price. These procedures also allow the counterparty to require securities to be transferred from the account to the extent that their market value exceeds the repurchase price or in exchange for other eligible securities of equivalent market value.
The insolvency of the counterparty or other failure to repurchase the securities may delay the disposition of the underlying securities or cause the Fund to receive less than the full repurchase price.
Repurchase agreements are entered into by the Fund under Master Repurchase Agreements (“MRA”) which permits the Fund, under certain circumstances including an event of default (such as bankruptcy or insolvency), to offset payables and/or receivables under the MRA with collateral held and/or posted to the counterparty and create one single net payment due to or from the Fund.
At April 30, 2016, the open repurchase agreements by counterparty which are subject to a MRA on a net payment basis are as follows:
| Fund/Counterparty | Repurchase
|
Fair Value of
| Cash
| Net Amount(2)
| ||||||||
| Large-Cap Strategy Fund | ||||||||||||
| BNP Paribas Securities Corp. | $ 2,887,387 | $ 2,887,387 | $— | $— | ||||||||
| Daiwa Capital Markets America | 2,887,387 | 2,887,387 | — | — | ||||||||
| HSBC Securities USA, Inc. | 2,887,387 | 2,887,387 | — | — | ||||||||
| Mizuho Securities USA, Inc. | 2,887,387 | 2,887,387 | — | — | ||||||||
| Nomura Securities International, Inc. | 2,887,387 | 2,887,387 | — | — | ||||||||
| TD Securities (USA) LLC | 759,726 | 759,726 | — | — | ||||||||
| $ 15,196,661 | $ 15,196,661 | $— | $— | |||||||||
(1) The amount of collateral reflected in the table does not include any over-collateralization received by the Fund.
(2) Net amount represents the net amount receivable due from the counterparty in the event of default.
Investment Income, Gains and Losses, Expenses and Distributions – Interest income and expenses are accrued daily. Dividends and distributions to shareholders are recorded on the ex-dividend date. Non-cash dividends included in dividend income, if any, are recorded at fair value. Foreign dividends are recorded on the ex-dividend date or when the Fund is informed of the ex-dividend date. Investment transactions are accounted for on a trade date basis for financial reporting purposes. Realized gains and losses from investment transactions are recorded on an identified cost basis.
Expenses of the Trust, which are directly identifiable to a specific Fund, are applied to that Fund. Expenses which are not identifiable to a specific Fund are allocated in such a manner as deemed equitable, taking into consideration the nature and type of expense.
Distributions from net realized gains, if any, are declared and paid to shareholders annually. Distributions from net investment income, if any, are declared and paid quarterly.
April 30, 2016 / ANNUAL REPORT
| NOTES TO FINANCIAL STATEMENTS (continued) | 25 |
Real Estate Investment Trusts – The Fund may invest in real estate investment trusts (“REITs”) that involve risks not associated with investing in stocks. Risks include declines in the value of real estate, general and economic conditions, changes in the value of the underlying property and defaults by borrowers. The value of assets in the real estate industry may go through cycles of relative underperformance and outperformance in comparison to equity securities markets in general. Dividend income is recorded using management’s estimate of the income included in distributions received from REIT investments. The actual amounts of income, return of capital and capital gains are only determined by each REIT after its fiscal year-end and may differ from the estimated amount. Estimates of income are adjusted in the Fund to the actual amounts when the amounts are determined.
Federal Taxes – It is the Fund’s policy to comply with the Subchapter M provision of the Internal Revenue Code of 1986, as amended (the “Code”), and to distribute to shareholders each year substantially all of its income. Accordingly, no provisions for Federal income or excise tax are necessary.
Withholding taxes and where appropriate, deferred withholding taxes, on foreign interest, dividends and capital gains have been provided for in accordance with the applicable country’s tax rules and rates.
The Fund recognizes interest and penalties, if any, related to unrecognized tax benefits as income tax expense on the Statements of Operations. During the year ended April 30, 2016, the Fund did not incur any interest or penalties.
Warrants and Rights – The Fund may hold warrants and rights acquired either through a direct purchase, including as part of private placement, or pursuant to corporate actions. Warrants and rights entitle the holder to buy a proportionate amount of common stock at a specific price and time through the expiration dates. Such warrants and rights are held as long positions by the Fund until exercised, sold or expired. Equity-linked warrants are purchased in order to own local exposure to certain countries in which the Fund is not locally registered. Warrants and rights are valued at fair value in accordance with the Trustees’ approved fair value procedures.
Lending of Portfolio Securities – The Trust has entered into an agreement with their custodian whereby the custodian may lend securities owned by the Fund to brokers, dealers and other financial organizations. Any increase or decrease in the fair value of securities loaned and any interest or dividends earned on those securities during the term of the loan would be for the account of the Fund. In exchange for lending securities under the terms of the agreement with their custodian, the Fund receives a lender’s fee. Fees earned by the Fund on securities lending are recorded as income. Loans of securities by the Fund are collateralized by cash, U.S. government securities or money market instruments that are maintained at all times in an amount at least equal to the current market value of the loaned securities plus a margin which varies depending on the type of securities owned. The custodian establishes and maintains the collateral in a segregated account. The Fund has the right under the lending agreement to recover the securities from the borrower on demand. The market value of the loaned securities is determined at the close of business of the Fund and any additional required collateral is delivered to the Fund on the next business day.
Investments purchased with cash collateral are presented on the portfolio of investments under the caption “Cash Collateral Invested for Securities on Loan.”
The Fund maintains the risk of any loss on the securities on loan as well as the potential loss on investments purchased with cash collateral received from securities lending.
Securities lending transactions are entered into by the Fund under Master Securities Lending Agreements (“MSLA”) which permits the Fund, under certain circumstances including an event of default (such as bankruptcy or insolvency), to offset amounts payable by the Fund to the same counterparty against amounts received and create one single net payment due to or from the Fund.
At April 30, 2016, the securities loaned which are subject to a MSLA on a net payment basis are as follows:
| Fund |
Value of |
Cash Collateral Received(1) |
Net Amount(2) | |||||||||||
| Large-Cap Strategy Fund | $14,735,050 | $14,735,050 | $— | |||||||||||
(1) Collateral with a value of $15,196,661 has been received in connection with securities lending transactions.
(2) Net amount represents the net amount receivable due from the counterparty in the event of default.
| 3. | FEDERAL TAX INFORMATION |
As of April 30, 2016, there are no uncertain tax positions that would require financial statement recognition, de-recognition or disclosure. The Fund’s federal tax returns filed for the periods ended 2015, 2014 and 2013, as well as the current year, remain subject to examination by the Internal Revenue Service.
The timing and character of income and capital gain distributions are determined in accordance with income tax regulations, which may differ from GAAP. These differences are due in part to the “mark-to-market” of passive foreign investment companies and losses deferred due to wash sales. GAAP requires that permanent differences in net investment income and realized gains and losses due to differences between financial reporting and tax reporting be reclassified between various components of net assets and have no effect on the net assets nor the NAV of the Fund.
For the year ended April 30, 2016, permanent differences identified and reclassified among the components of net assets were as follows:
ANNUAL REPORT / April 30, 2016
| 26 | NOTES TO FINANCIAL STATEMENTS (continued) |
| Fund | Paid-in Capital | Increase (Decrease) Undistributed Net Investment Income | Accumulated Net Realized Gain (Loss) | |||
| Large-Cap Strategy Fund | $— | $154,763 | $(154,763) | |||
The tax character of distributions for the corresponding fiscal years as reported on the Statements of Changes in Net Assets were as follows:
2016 | 2015 | |||||||||||||||
| Ordinary | Long-Term | Ordinary | Long-Term | |||||||||||||
| Fund | Income* | Capital Gains | Income* | Capital Gains | ||||||||||||
| Large-Cap Strategy Fund | $ | 10,084,312 | $ | 42,929,924 | $ | 6,747,267 | $ | 24,762,981 | ||||||||
* For tax purposes, short-term capital gain distributions are considered ordinary income distributions.
As of April 30, 2016, the components of distributable earnings on a tax basis were as follows:
| Fund | Undistributed Ordinary Income | Undistributed Long-Term Capital Gains | Other Timing Differences | Unrealized Appreciation/ (Depreciation) | Capital Loss Carryforwards | Late Year Deferrals | ||||||
Large-Cap Strategy Fund | $891,438 | $— | $— | $131,667,975 | $— | $(21,013,941) |
Under current tax regulations, capital losses on securities transactions realized after October 31 may be deferred and treated as occurring on the first day of the following fiscal year. Under the Regulated Investment Company Modernization Act of 2010, the Funds are permitted to defer taxable ordinary income losses incurred after December 31 and treat as occurring on the first day of the following fiscal year. Post-October, Post-December and Late Year losses deferred to May 1, 2016 are as follows:
| Fund | Ordinary Post-December Losses |
Short-Term | Long-Term Post-October/ Late Year Gains | |||
| Large-Cap Strategy Fund | $— | $21,569,511 | $(555,570) |
| 4. | ADVISORY FEES, SERVICING FEES, AND OTHER SERVICE PROVIDERS |
Investment Advisor – WFMC serves as the Investment Advisor to the Fund. WTIA provides sub-advisory services to the Fund. WFMC and WTIA are wholly-owned subsidiaries of M&T Bank Corporation. For its services, the Fund pays WFMC an annual investment advisory fee, accrued and paid daily, based on a percentage of the Fund’s average daily net assets as described below. WFMC, not the Fund, pays WTIA for its services.
| Fund |
Advisory Fee | |
| Large-Cap Strategy Fund | 0.50% |
WFMC and the Fund’s shareholder service providers have contractually agreed to waive their fees and/or reimburse expenses through August 31, 2016, so that total annual fund operating expenses paid by the Fund (not including the effects of dividends or interest on short positions, acquired fund fees and expenses, taxes, or other extraordinary expenses expressed as an annualized percentage of average daily net assets), will not exceed 0.25% for the Fund’s Class I Shares. WFMC will not recoup previously waived fees/expenses in subsequent years.
Administrative Fees – The Bank of New York Mellon (“BNYM”) provides the Trust with fund administration services. The fees as described in the table below are a component of “Portfolio accounting and administration fees” as disclosed in the Statements of Operations. WFMC, in its role as Co-Administrator, provides the Fund with certain administrative personnel and services necessary to operate the Fund. The fees as described in the table below are accrued and paid daily and are disclosed on the Statement of Operations as “Administrative personnel and services fees.”
| Administrator |
Maximum |
Average Aggregate Daily Net | ||||
| WFMC | 0.040 | % | on the first $5 billion | |||
| 0.030 | % | on the next $2 billion | ||||
| 0.025 | % | on the next $3 billion | ||||
| 0.018 | % | on assets in excess of $10 billion | ||||
| BNYM | 0.0285 | % | on the first $500 million | |||
| 0.0280 | % | on the next $500 million | ||||
| 0.0275 | % | on assets in excess of $1 billion | ||||
April 30, 2016 / ANNUAL REPORT
| NOTES TO FINANCIAL STATEMENTS (continued) | 27 |
BNYM and WFMC may voluntarily choose to waive any portion of their fee and can add, modify or terminate a voluntary waiver at any time at their sole discretion. For the year ended April 30, 2016, BNYM waived amounts identified in the Statement of Operations as “Waiver of portfolio accounting and administration fees” and WFMC did not waive any administrative personnel and services fees.
Shareholder Services Fee – Pursuant to a Shareholder Services Plan adopted by the Fund and administered by ALPS, the Fund may pay up to 0.25% of the average daily net assets of the Fund’s Class I shares to financial intermediaries (which may include ALPS, the Advisor or their affiliates) for providing shareholder services and maintaining shareholder accounts. M&T has entered into a Shareholders Services Agreement with ALPS, under which it is entitled to receive up to 0.25% of the average daily net assets of the Fund’s shares for whom M&T provides shareholder services. The Fund may reduce the maximum amount of shareholder service fees it pays from time to time at its sole discretion. In addition, a financial intermediary (including M&T) may waive or reduce any fees to which they are entitled. For year ended April 30, 2016, no affiliates of the Advisor received these fees.
Other Service Providers – Foreside Management Services, LLC (“FMS”) provides a Principal Executive Officer and Principal Financial Officer to the Trust. FMS has no role in determining the investment policies or which securities are to be sold or purchased by the Trust or the Fund.
BNYM provides custody services to the Trust.
BNY Mellon Investment Servicing (U.S.) Inc. provides fund accounting and transfer agency services to the Trust.
General – Certain Officers of the Trust are also Officers or employees of the above companies that provide services to the Fund, and during their terms of office, receive no compensation from the Fund. The Trust’s Statement of Additional Information includes additional information about the Trustees.
Other Affiliated Parties and Transactions – Affiliated holdings are securities which are managed by the Advisor or an affiliate of the Advisor or which are distributed by an affiliate of the Fund’s distributor. Transactions with affiliated companies during year ended April 30, 2016 are as follows:
| Balance of |
Balance of | |||||||||||||
| Shares Held | Purchases/ | Sales/ | Shares Held | Value at | Dividend | Realized | ||||||||
| Fund/Affiliated Security Name | 4/30/2015 | Additions | Reductions | 4/30/16 | 4/30/16 | Income | Gain/(Loss) | |||||||
| Large-Cap Strategy Fund: | ||||||||||||||
| M&T Bank Corp. | 1,610 | — | — | 1,610 | $190,495 | $4,508 | $— |
The Fund may execute trades for security purchase and sale transactions through brokers that are affiliates of the Advisor or sub-advisors. Commissions paid on those trades for year ended April 30, 2016 were as follows:
| Fund |
Commissions | |||
| Large-Cap Strategy Fund | $221,287 | |||
| 5. | INVESTMENT TRANSACTIONS |
Purchases and sales of securities for the Fund (excluding U.S. Government and agency securities, and short-term securities) during the year ended April 30, 2016 were $637,138,719 and $469,662,870, respectively.
The Fund is permitted to purchase or sell securities from or to certain affiliated funds under specified conditions outlined in procedures adopted by the Trustees. The procedures have been designed to ensure that any purchase or sale of securities by a Fund from or to another fund or portfolio that is or could be considered an affiliate by virtue of having a common investment adviser, common Trustees and/or common officers complies with rule 17a-7of the Act. Further, as defined under these procedures, each transaction is effected at the current market price to save costs, where permissible. For the year ended April 30, 2016, the Fund engaged in purchases and sales of securities pursuant to Rule 17a-7of the Act as follows:
| Fund/Affiliated Fund Name | Purchases | Sales | Received Gain (Loss) | |||||||||
| Large-Cap Strategy Fund: | ||||||||||||
| Small-Cap Strategy Fund(a) | $ | 2,476,586 | $ | 154,262 | $ | (160,490 | ) | |||||
(a) The liquidation date was August 3, 2015.
| 6. | LINE OF CREDIT |
Effective March 9, 2016, the Trust is participating in a $10,000,000 unsecured, committed revolving line of credit (“LOC”) agreement with BNYM. The LOC is available for extraordinary or emergency purposes, primarily for financing redemption payments. Borrowings are charged interest at a rate of 1.25% per annum over the greater of the Federal Funds Rate or the overnight LIBOR Rate. The LOC includes a commitment fee of 0.15% per annum on the daily unused portion. The termination date of this LOC is March 8, 2017.
ANNUAL REPORT / April 30, 2016
| 28 | NOTES TO FINANCIAL STATEMENTS (continued) |
Prior to March 9, 2016, the Trust participated in a $20,000,000 LOC with BNYM. The LOC was made available for extraordinary or emergency purposes, primarily for financing redemption payments. Borrowings were charged interest at a rate of 1.25% per annum over the greater of the Federal Funds Rate or the overnight LIBOR Rate. The LOC included a commitment fee of 0.10% per annum on the daily unused portion.
The Fund did not utilize the LOC for the year ended April 30, 2016.
| 7. | LEGAL PROCEEDINGS |
The Fund is subject to claims and suits that arise from time to time in the ordinary course of business. For example, certain creditors of Tribune Co., which has recently emerged from bankruptcy, have filed actions against former Tribune shareholders, (collectively, the “Lawsuits”) who tendered their shares when Tribune went private in 2007 as part of a leveraged buyout (“LBO”). These creditor plaintiffs seek the return of all proceeds received by the former Tribune shareholders. These cases are consolidated in a Multi-District Litigation (“MDL”) in the U.S. District Court for the Southern District of New York. One of the cases remains pending before the trial court, while the others were dismissed by the trial court on a motion to dismiss. The U.S. Court of Appeals for the Second Circuit affirmed the trial court’s dismissal of the other cases in March 2016. There are thousands of defendants in the MDL, including the Large-Cap Strategy Fund (the “Fund”). The suits all seek the same thing: disgorgement of the amounts received by the former Tribune shareholders as part of the LBO, but by different legal theories. Although management currently believes that the resolution of the claims against the Fund, individually or in the aggregate, will not have a materially adverse impact on the Fund’s financial positions, results of operations, or cash flows, these matters are subject to inherent uncertainties and management’s view of these matters could change in the future.
Litigation counsel to the Fund in the Lawsuits does not believe that it is possible, at this stage in the proceedings, to predict with any reasonable certainty the probable outcome of the Lawsuits or quantify the ultimate exposure to the Fund arising from the Lawsuits. Until the Fund can do so, no reduction of its net asset value will be made relating to the Lawsuits. However, even if the plaintiffs in the lawsuits were to obtain the full recovery they seek, the amount would be less than 0.05% of the Fund’s net asset value as of April 30, 2016. The Fund can’t predict what its size might be at the time that the cost of the Lawsuits might be quantifiable and thus potentially deducted from its net asset value. Therefore, at this time, those buying or redeeming shares of the Fund will pay or receive, as the case may be, a price based on net asset value of the Fund, with no adjustment relating to the Lawsuits. The attorneys’ fees and costs relating to the Lawsuits will be taken as expenses by the Fund as incurred and in a manner similar to any other expense incurred by the Fund.
| 8. | SUBSEQUENT EVENTS |
Management has evaluated events and transactions for potential recognition or disclosure in the financial statements through the date the financial statements were issued. Management has determined that, there are no material events that would require recognition or disclosure in the Fund’s financial statements through this date.
| 9. | FEDERAL TAX INFORMATION (UNAUDITED) |
Complete information regarding the tax status of distributions will be reported on Forms 1099.
Of the ordinary income (including short-term capital gain) distributions made by the Fund during the fiscal year ended April 30, 2016, the Fund designates the following percentage, or such greater percentage that constitute the maximum amount allowable pursuant to Code Sections Section 243 and 854(b)(2), as qualifying for the corporate dividends received deduction:
| Fund | ||||
| Large-Cap Strategy Fund | 94.96% | |||
For the fiscal year ended April 30, 2016, the Fund designates the following percentage of the ordinary income dividends, or such greater percentage that constitute the maximum amount allowable pursuant to Code Sections 1(h)(11) and 854(b)(2), as qualified dividend income which may be subject to a maximum rate of federal income tax of 15%:
| Fund | ||||
| Large-Cap Strategy Fund | 100.00% | |||
If the Fund meets the requirements of Section 853 of the Code, the Fund will pass through to shareholders credits of foreign taxes paid.
April 30, 2016 / ANNUAL REPORT
29
REPORT OF INDEPENDENT REGISTERED PUBLIC ACCOUNTING FIRM
TO THE SHAREHOLDERS AND BOARD OF TRUSTEES OF
WILMINGTON FUNDS
We have audited the accompanying statement of assets and liabilities, including the portfolio of investments, of the Wilmington Large-Cap Strategy Fund (one of the series constituting the Wilmington Funds) (the “Fund”) as of April 30, 2016, and the related statement of operations for the year then ended, the statements of changes in net assets for each of the two years in the period then ended, and the financial highlights for each of the years or periods indicated therein. These financial statements and financial highlights are the responsibility of the Fund’s management. Our responsibility is to express an opinion on these financial statements and financial highlights based on our audits.
We conducted our audits in accordance with the standards of the Public Company Accounting Oversight Board (United States). Those standards require that we plan and perform the audit to obtain reasonable assurance about whether the financial statements and financial highlights are free of material misstatement. We were not engaged to perform an audit of the Fund’s internal control over financial reporting. Our audits included consideration of internal control over financial reporting as a basis for designing audit procedures that are appropriate in the circumstances, but not for the purpose of expressing an opinion on the effectiveness of the Fund’s internal control over financial reporting. Accordingly, we express no such opinion. An audit also includes examining, on a test basis, evidence supporting the amounts and disclosures in the financial statements and financial highlights, assessing the accounting principles used and significant estimates made by management, and evaluating the overall financial statement presentation. Our procedures included confirmation of securities owned as of April 30, 2016, by correspondence with the custodian and brokers. We believe that our audits provide a reasonable basis for our opinion.
In our opinion, the financial statements and financial highlights referred to above present fairly, in all material respects, the financial position of the Wilmington Large-Cap Strategy Fund (one of the series constituting the Wilmington Funds) at April 30, 2016, the results of its operations for the year then ended, the changes in its net assets for each of the two years in the period then ended, and the financial highlights for each of the years or periods indicated therein, in conformity with U.S. generally accepted accounting principles.
Philadelphia, Pennsylvania
June 29, 2016
ANNUAL REPORT / April 30, 2016
| 30 | BOARD OF TRUSTEES AND TRUST OFFICERS |
BOARD OF TRUSTEES AND TRUST OFFICERS
The following tables give information about each Trustee and the senior officers of the Trust. The tables separately list Trustee members who are “interested persons” of the Fund (i.e., “Interested” Trustees) and those who are not (i.e., “Independent” Trustees). The Trust is comprised of 16 funds. Unless otherwise noted, the business address of each Trustee and senior officer is 111 South Calvert Street, 26th floor, Baltimore, Maryland 21202. Each Trustee oversees all portfolios of the Trust and serves for an indefinite term. The Trust’s Statement of Additional Information includes additional information about the Trustees and is available, without charge and upon request, by calling 1-800-836-2211.
INTERESTED TRUSTEES BACKGROUND
Name Address Birth Year Position With Trust Date Service Began
| Principal Occupations and Other Directorships Held for Past Five Years
| |||
Donald E. Foley* Birth year: 1951 TRUSTEE Began serving: December 2015 | Principal Occupations: Advisory Member, Trust and Investment Committee, M&T Bank, Wilmington Trust, National Association, and Wilmington Trust Company.
Other Directorships Held: Director, AXA Equitable (variable annuity) (2013-Present); Director, 1290 Mutual Funds (retail funds) (2013-Present); Chairman and Director, Burke Rehabilitation Hospital Foundation (private hospital, research institute) (2005-Present); Director, M&T Bank Corporation (commercial bank) (2011-2012); Chairman and Director, Wilmington Trust Corporation (commercial and trust bank) (2007-2011); Chairman, Director and President’s Council, Union College (private college) (2011-2015).
Previous Positions: Director of M&T Bank Corporation and M&T Bank (2011 to 2012). Chairman and Chief Executive Officer of Wilmington Trust Corporation (2010-2011); Senior Vice President and Treasurer at ITT Corporation (1996-2010); Assistant Treasurer at International Paper (1989-1996).
| |||
Christopher D. Randall* Birth year: 1965 TRUSTEE Began serving: September 2015 PRESIDENT Began serving: September 2014 |
Principal Occupations: Chief Operations Officer and a Senior Vice President of Wilmington Trust’s Wealth and Institutional Services Division (WISD); Senior Vice President of M&T Bank.
Other Directorships Held: None.
Previous Positions: President and Chief Executive Officer of Wilmington Trust Investment Advisors, Inc. and President of Wilmington Trust Investment Management, LLC (2014-2015); Senior Vice President, Head of Asset Management and Retirement Services (2012 to 2014); President, Mid-Atlantic Division, Wilmington Trust, N.A. (2011 to 2012); President, M&T Securities, Inc. (2009 to 2011).
| |||
| * | Christopher D. Randall is “interested” due to the positions he currently holds with the Funds, Wilmington Trust’s Wealth and Institutional Services Division, M&T Bank, the parent of the Fund’s Advisor, and previous positions held with WTIA and WFMC. Donald E. Foley is “interested” due to the positions he previously held with Wilmington Trust Corporation, M&T Bank Corporation and M&T Bank, the parent of the Fund’s Advisor. |
April 30, 2016 / ANNUAL REPORT
| BOARD OF TRUSTEES AND TRUST OFFICERS | 31 |
INDEPENDENT TRUSTEES BACKGROUND
Name Birth Year Position with Trust Date Service Began
| Principal Occupations and Other Directorships Held for Past Five Years
| |||
Nicholas A. Giordano Birth year: 1943 CHAIRMAN and TRUSTEE Began serving: March 2012 | Principal Occupations: Consultant, financial services organizations (1997 to present).
Other Directorships Held: Kalmar Pooled Investment Trust; The RBB Fund Inc. (19 portfolios) (registered investment companies); Independence Blue Cross; IntriCon Corporation (body-worn medical and electronic products) | |||
Previous Positions: Interim President, LaSalle University (1998 to 1999); President and Chief Executive Officer, Philadelphia Stock Exchange (1981 to 1997).
| ||||
Robert H. Arnold Birth year: 1944 TRUSTEE Began serving: March 2012 |
Principal Occupations: Managing Director, R.H. Arnold & Co, Inc. (financial management consulting) (6/89 to present).
Other Directorships Held: Trustee, First Potomac Realty Trust (real estate investment trust) (5/01 to present); Director, Treasury Strategies, Inc. (private treasury consulting services) (6/01 to present).
| |||
Joseph J. Castiglia Birth year: 1934 TRUSTEE Began serving: February 1988 |
Principal Occupations: Consultant (not-for-profit) and Private Investor.
Other Directorships Held: Chairman, Trustee and Treasurer, Buffalo Olmsted Parks Conservancy (1/05 to 5/13); Chairman and Trustee, Buffalo Philharmonic Foundation (1/06 to 11/12); Vice Chairman and Trustee, Christ the King Seminary (1/05 to present); Director, Dunn Tire Corporation (1/05 to present); Chairman, Director and Treasurer, Read to Succeed Buffalo (1/08 to present); HCR Corporation (home care) (3/14 to present). | |||
Previous Positions: President, Chief Executive Officer, Vice President, Treasurer and Vice Chairman, Pratt & Lambert United (manufacturer of paints, coatings and adhesives) (12/67- 1/96); Chairman and Director, Catholic Health (hospitals, nursing homes and home care) (1/97 to 5/03); Chairman and Director, Blue Cross Blue Shield of Western New York (5/92 to 5/07); Lead Director and Director, Energy East Corporation (gas and electric utility); Chairman and Director, Federal Reserve Bank of New York, Buffalo Branch; Chairman and Director, Community Foundation for Greater Buffalo; Chairman and Trustee, Canisius College; Chairman and Director, AAA of Western & Central New York.
| ||||
John S. Cramer Birth year: 1942 TRUSTEE Began serving: December 2000 |
Principal Occupations: Senior Consultant, Yaffe & Co. (health care consulting) (2/06 to present).
Other Directorships Held: Chairman and Director, CI Supply Corp. (medical supplies and equipment) (1/14 to 1/15); Director, Check Med Corp. (medical supplies and equipment) (6/08 to 1/14); Director, Highmark Blue Shield (health insurance) (2/01 to 6/10). | |||
Previous Positions: Consultant, Yaffe & Co. (compensation consultants) (6/02 to 6/12); President and Chief Executive Officer, Pinnacle Health Systems (nonprofit hospital and health care system in Central Pennsylvania).
| ||||
Daniel R. Gernatt, Jr. Birth year: 1940 TRUSTEE Began serving: February 1988
|
Principal Occupations: President and CEO, Gernatt Asphalt Products, Inc. (asphalt, sand and gravel products) (1979 to present).
Other Directorships Held: Director, Roswell Park Alliance (2008 to present); Trustee, Gernatt Family Foundation.
| |||
Richard B. Seidel Birth year: 1941 TRUSTEE Began serving: September 2003
| Principal Occupations: President, R.B. Seidel & Associates (legal and consulting) (1/14 to present); President, Girard Private (investment) (1/14 to present); Chairman, Girard Capital (broker-dealer) (1/10 to present).
Other Directorships Held: Director, Tristate Capital Bank (1/08 to present).
| |||
ANNUAL REPORT / April 30, 2016
| 32 | BOARD OF TRUSTEES AND TRUST OFFICERS |
OFFICERS
Name Address Birth Year Positions with Trust
| Principal Occupations for Past Five Years and Previous Positions
| |
Michael D. Daniels Birth year: 1967 CHIEF OPERATING OFFICER Began serving: June 2007 | Principal Occupations: Chief Operating Officer, Wilmington Funds and Wilmington Trust Investment Advisors, Inc.; Administrative Vice President, M&T Bank.
Previous Positions: Senior Vice President, MSD&T and MCA (2006 to 2007); Vice President, Calamos Asset Management (2004 to 2006); Vice President, JP Morgan Chase Bank (2002 to 2004).
| |
Jeffrey M. Seling Birth year: 1970 ASSISTANT TREASURER Began serving: June 2013 VICE PRESIDENT Began serving: June 2007
|
Principal Occupations: Vice President, M&T Bank and Wilmington Trust Investment Advisors, Inc.; Assistant Treasurer, Wilmington Funds.
Previous Positions: Vice President, MSD&T; Assistant Vice President, Wells Fargo Bank; Assistant Vice President, JP Morgan Chase Bank.
| |
John C. McDonnell Birth year: 1966 VICE PRESIDENT AND ASSISTANT TREASURER Began serving: June 2013 | Principal Occupations: Vice President, Wilmington Funds Management Corporation (2005 to present); Vice President, Wilmington Trust Investment Advisors, Inc. (2012 to present).
Previous Positions: Vice President, Wilmington Trust Investment Management, LLC (2005 to 2012); Audit Senior, Deloitte LLP (2004 to 2005); Assistant Vice President, 1838 Investment Advisors, LP (1999 to 2004).
| |
Mary Ellan Reilly Birth year: 1970 CHIEF COMPLIANCE OFFICER and AML COMPLIANCE OFFICER. Began serving: March 2015 | Principal Occupations: Chief Compliance Officer and Anti-Money Laundering Officer, Wilmington Funds; Administrative Vice President, M&T Bank.
Previous Positions: Administrative Vice President, M&T Bank, and Program Director, Buffalo Promise. Neighborhood (2013-2015); Vice President, M&T Bank, and Product Manager, Wilmington Trust Retirement and Institutional Services Company (2010-2013); Vice President, M&T Bank, and Risk Manager, M&T Investment Group (2006 to 2010).
| |
Eric B. Paul Birth year: 1974 VICE PRESIDENT Began serving: June 2008
| Principal Occupations: Administrative Vice President, M&T Bank (2003 to present); Director of Proprietary Products, M&T Bank (2008 to present). | |
Ralph V. Partlow, III 25 South Charles Street, 22nd floor Baltimore, MD 21201 Birth year: 1957 VICE PRESIDENT Began serving: June 2010
|
Principal Occupation: Administrative Vice President and Deputy General Counsel, M&T Bank (2003 to present).
Previous Positions: Vice President and Senior Counsel, Allfirst Bank (1995 to 2003).
| |
Christopher W. Roleke 10 High Street, Suite 302 Boston, MA 02110 Birth year: 1972 CHIEF FINANCIAL OFFICER AND TREASURER Began serving: July 2013
|
Principal Occupation: Managing Director and Fund Principal Financial Officer, Foreside Management Services, LLC (2011 to present).
Previous Positions: Assistant Vice President, JP Morgan Investor Services Co. (2006 to 2011).
| |
April 30, 2016 / ANNUAL REPORT
| BOARD OF TRUSTEES AND TRUST OFFICERS | 33 |
Name Address Birth Year Positions with Trust
| Principal Occupations for Past Five Years and Previous Positions
| |
Lisa R. Grosswirth Atlantic Terminal Office Tower, 2 Hanson Place, 12th Floor Brooklyn, NY 11217 Birth year: 1963 SECRETARY Began serving: September 2007
| Principal Occupation: Vice President, BNY Mellon Asset Servicing (2004 to present).
Previous Positions: Supervisory Paralegal, The Dreyfus Corporation (1998 to 2004). | |
Richard J. Berthy Three Canal Plaza, Suite 100 Portland, ME 04101 Birth year: 1958 CHIEF EXECUTIVE OFFICER Began serving: September 2007 | Principal Occupation: Chief Executive Officer, Foreside Financial Group, LLC (2012 to present).
Previous Positions: President, Foreside Financial Group, LLC (2008 to 2012); Chief Administrative Officer, Foreside Financial Group, LLC (2005 to 2008); President and Secretary, Bainbridge Capital Management, LLC (2003 to 2006); Vice President, Bainbridge Capital Management (2002 to 2004).
| |
ANNUAL REPORT / April 30, 2016
34
Shares of the Wilmington Funds are not FDIC insured or otherwise protected by the U.S. government, are not deposits or other obligations of, or guaranteed by, Manufacturers and Traders Trust Company, and are subject to investment risks, including possible loss of the principal amount invested.
VOTING PROXIES ON FUND PORTFOLIO SECURITIES
A description of the policies and procedures that the Funds use to determine how to vote proxies relating to securities held in the Funds’ portfolios is available, without charge and upon request, by calling 1-800-836-2211. A report on how the Funds voted any such proxies during the most recent 12-month period ended June 30 is available through Wilmington Funds’ website. Go to www.wilmingtonfunds.com select “Proxy Voting Record” to access the link. This information is also available from the Edgar database on the SEC’s website at www.sec.gov.
QUARTERLY PORTFOLIO SCHEDULE
The Funds file with the SEC a complete schedule of their portfolio holdings, as of the close of the first and third quarters of their fiscal year, on Form N-Q. These filings are available on the SEC’s website at www.sec.gov and may be reviewed and copied at the SEC’s Public Reference Room in Washington DC. (Call 1-800-SEC-0330 for information on the operation of the Public Reference Room.)
Electronic Delivery
Wilmington Funds encourages you to sign up for electronic delivery of investor materials. By doing so you will receive information faster, help lower shareholder costs, and reduce the impact to the environment. To enroll in electronic delivery:
| 1.) | Go to www.wilmingtonfunds.com and select “Individual Investors” |
| 2.) | Click on the link “Sign up for Electronic Delivery” |
| 3.) | Login to your account or create new user ID |
| 4.) | Select E-Delivery Consent from the available options, and |
| 5.) | Complete the information requested, including providing the email address where you would like to receive notification for electronic documents. |
* If you hold your account through a financial intermediary, please contact your advisor to request electronic delivery of investor materials.
Householding
In an effort to reduce volume of mail you receive, only one copy of the prospectus, annual/semi-annual report, SAI and proxy statements will be sent to shareholders who are part of the same family and share the same address.
If you would like to request additional copies of the prospectus, annual/semi-annual report or SAI, or wish to opt out of householding mailings, please contact Shareholder Services at 1-800-836-2211, or write to Wilmington Funds, P.O. Box 9828, Providence, RI 02940-8025.
April 30, 2016 / ANNUAL REPORT
| 35 |
PRIVACY POLICY AND NOTICE
OF THE FUNDS AND THEIR DISTRIBUTOR
June 8, 2012
The Wilmington Funds, their distributor and their agents (referred to as “the Funds”, “we” or “us”) recognize that consumers (referred to as “you” or “your”) expect us to protect both your assets and financial information. We respect your right to privacy and your expectation that all personal information about you or your account will be maintained in a secure manner. We are committed to maintaining the confidentiality, security and integrity of client and shareholder information. We want you to understand the Funds’ policy that governs the handling of your information, how the Funds gather information, how that information is used and how it is kept secure.
Information The Funds Collect:
The Funds collect nonpublic personal information about you from the following sources:
| • | We may receive information from you, or from your financial representative, on account applications, other forms or electronically (such as through the Funds’ website or other electronic trading mechanisms). Examples of this information include your name, address, social security number, assets and income. |
| • | We may receive information from you, or from your financial representative, through transactions with us or others, correspondence and other communications. Examples of this information include specific investments and your account balances. |
| • | We may obtain other personal information from you in connection with providing you a financial product or service. Examples of this information include depository, debit or credit account numbers. |
Information Sharing Policy
The Funds may share nonpublic personal information about you, as described above, with financial or non-financial companies or other entities, including companies that may be affiliated with the Funds and other nonaffiliated third parties, for the following purposes:
| • | We may share information when it is necessary and required to process a transaction or to service a customer relationship. For example, information may be shared with a company that provides account record keeping services or a company that provides proxy services to shareholders. |
| • | We may share information when it is required or permitted by law. For example, information may be shared in response to a subpoena or to protect you against fraud or with someone who has established a legal beneficial interest, such as a power of attorney. |
| • | We may disclose some or all of the information described above to companies that perform marketing or other services on our behalf. For example, we may share information about you with the financial intermediary (bank, investment bank or broker-dealer) through whom you purchased the Funds’ products or services, or with providers of marketing, legal, accounting or other professional services. The Funds will not, however, disclose a consumer’s account number or similar form of access number or access code for credit card, deposit or transaction accounts to any nonaffiliated third party for use in telemarketing, direct mail or other marketing purposes. |
Except as described above, the Funds do not share customer information. We will not rent, sell, trade, or otherwise release or disclose any personal information about you. Any information you provide to us is for the Funds’ use only. If you decide to close your account(s) or become an inactive customer, we will adhere to the privacy policies and practices as described in this notice.
Information Security:
When the Funds share nonpublic customer information with third parties hired to facilitate the delivery of certain products or services to our customers, such information is made available for limited purposes and under controlled circumstances designed to protect our customers’ privacy. We require third parties to comply with our standards regarding security and confidentiality of such information. We do not permit them to use that information for their own or any other purposes, or rent, sell, trade or otherwise release or disclose the information to any other party. These requirements are reflected in written agreements between the Funds and the third party service providers.
The Funds protect your personal information in several ways. We maintain physical, electronic, and procedural safeguards to guard your nonpublic personal information. In addition, the Funds’ Transfer Agent and Shareholder Servicing Agent have procedures in place for the appropriate disposal of nonpublic personal information when they are no longer required to maintain the information.
Each of the following sections explains an aspect of the Funds’ commitment to protecting your personal information and respecting your privacy.
Employee Access to Information:
Our Code of Ethics, which applies to all employees, restricts the use of customer information and requires that it be held in the strictest of confidence. Employee access to customer information is authorized for business purposes only, and the degree of access is based on the sensitivity of the information and on an employee’s or agent’s need to know the information in order to service a customer’s account or comply with legal requirements.
Visiting The Funds’ Website:
The Funds’ website gathers and maintains statistics about the number of visitors as well as what information is viewed most frequently. This information is used to improve the content and level of service we provide to our clients and shareholders.
ANNUAL REPORT / April 30, 2016
| 36 |
| • | Information or data entered into a website will be retained. |
| • | Where registration to a website or re-entering personal information on a website is required, “cookies” are used to improve your online experience. A cookie is a way for websites to recognize whether or not you have visited the site before. It is a small file that is stored on your computer that identifies you each time you re-visit our site so you don’t have to resubmit personal information. Cookies provide faster access into the website. |
| • | We may also collect non-personally identifiable Internet Protocol (“IP”) addresses for all other visitors to monitor the number of visitors to the site. These non-personally identifiable IP addresses are never shared with any third party. |
E-mail:
If you have opted to receive marketing information from the Funds by e-mail, it is our policy to include instructions in all marketing messages on how to unsubscribe from subsequent e-mail programs. Some products or services from the Funds are intended to be delivered and serviced electronically. E-mail communication may be utilized in such cases. If you participate in an employer-sponsored retirement plan administered by the Funds, we may, at your employer’s request, send you e-mail on matters pertaining to the retirement plan.
Please do not provide any account or personal information such as social security numbers, account numbers, or account balances within your e-mail correspondence to us. We cannot use e-mail to execute transaction instructions, provide personal account information, or change account registration. We can, however, use e-mail to provide you with the necessary forms or you may contact customer service toll-free at 1-800-836-2211.
Surveys/Aggregate Data:
Periodically, the Funds may conduct surveys about financial products and services or review elements of customer information in an effort to forecast future business needs. The Funds then generate reports that include aggregate data regarding its customers. Aggregate data classifies customer information in various ways but that does not identify individual customers. These reports may also include information on website traffic patterns and related information. These reports are used for the Funds’ planning, statistical and other corporate purposes. Aggregate data may also be shared with external parties, such as marketing organizations. However, no information is shared by which any individual customer could be identified.
Changes to Our Privacy Statement:
The effective date of this policy is June 8, 2012. We reserve the right to modify this policy at any time. When it is revised or materially changed, we will update the effective date. You can determine whether there have been changes since the last time you reviewed by simply checking the effective date.
Notice will be provided to you in advance of any changes that would affect your rights under this policy statement.
April 30, 2016 / ANNUAL REPORT
[This Page Intentionally Left Blank]
[This Page Intentionally Left Blank]
[This Page Intentionally Left Blank]


Wilmington Multi-Manager International Fund (“International Fund”)
Wilmington Multi-Manager Alternatives Fund (“Alternatives Fund”)
Wilmington Multi-Manager Real Asset Fund (“Real Asset Fund”)
Wilmington Strategic Allocation Conservative Fund (“Strategic Allocation Conservative Fund”)
Wilmington Strategic Allocation Moderate Fund (“Strategic Allocation Moderate Fund”)
Wilmington Strategic Allocation Aggressive Fund (“Strategic Allocation Aggressive Fund”)

PRESIDENT’S MESSAGE |
| |||
| i | ||||
WILMINGTON FUNDS ANNUAL REPORT |
| |||
| 1 | ||||
| 17 | ||||
| 19 | ||||
| 81 | ||||
| 83 | ||||
| 85 | ||||
| 88 | ||||
| 95 | ||||
| 115 | ||||
| 116 | ||||
[This Page Intentionally Left Blank]
i
I am pleased to present the Annual Report of the Wilmington Funds (the “Trust”), covering the Trust’s fiscal year of May 1, 2015, through April 30, 2016. Inside you will find a comprehensive review of the Trusts’ holdings and financial statements.
The Economy and Financial Markets in Review
Wilmington Funds Management Corporation, the investment advisor to the Trust, and Wilmington Trust Investment Advisors, Inc., the sub-advisor to the Trust, have provided the following review of the economy, bond markets, and stock markets for the Trust’s fiscal year.
The Economy
While the U.S. economy continued to expand, the growth in gross domestic product (“GDP”) turned successively weaker with each quarter. GDP grew a healthy 3.9% in the second quarter of 2015, but the pace of growth slowed to 2.0% in the third quarter, decelerated to a tepid 1.4% gain in the fourth quarter, and nearly came to a standstill with a marginal gain of 0.5% in the first quarter of 2016.i
ihttp://www.bea.gov/national/index.htm#gdp
A strong U.S. dollar, weak global economy, falling oil prices, and sluggish wage growth were contributing factors to this disappointing economic performance.
The unemployment rate declined to 5.0% in April of 2016, down from the 5.5% rate in May of 2015. While the lower unemployment rate is welcome, the overall employment picture remains mixed, as the labor participation rate (62.8%) is stuck at historical lows, while wage growth is muted, increasing just 2.5% in the last 12 months.ii
iihttp://www.bls.gov/news. release/empsit.nr0.htm
The price of oil continued its long slide. West Texas Intermediate (a grade of crude oil used as an oil pricing benchmark) fell from nearly $60 per barrel to just under $46 per barrel, after dipping below $30 per barrel in January.iii This price decline has severely impacted both the oil industry and the banks that have made loans to oil-related companies. The savings to consumers are real, but seem not to have translated into the level of spending that might accelerate economic growth.
iiihttp://www.eia.gov/dnav/pet/hist/LeafHandler.ashx?n=PET&s=RWTC&f=D
The Federal Reserve (the “Fed”) raised the federal funds rate by 25 basis points1 (0.25%) in December 2015, the first such hike since 2006. With the announcement came a statement of intentions regarding the pace of future hikes. As the economy subsequently weakened, however, the Fed moderated its position on future rate increases, communicating that any increases would come only after a careful analysis of U.S. economic health and global stock market stability.
The Bond Markets
Yields fluctuated widely over the course of the Trust’s fiscal year. The 10-year Treasury note began May 2015 with a yield of 2.05%, peaking at 2.50% in June, only to quickly fall as investors rushed to safety amid a global stock market rout in August. Yields eventually turned higher as the prospect of a Fed hike in December grew. By the end of April 2016, however, yields ended lower at 1.83% on expectations that the Fed would put off any additional rate hikes in the near term.iv
ivhttp://www.treasury.gov/resource-center/data-chart-center/interest-rates/Pages/TextView.aspx?data=yieldYear&year=2016
The Barclays U.S. Aggregate Index2 turned in a modestly positive performance, gaining 2.72% over the 12-month period ended in April 2016. The Barclays U.S. Long-Term Treasury Index3 was the top gainer, rising 5.49%.
The high-yield market was buffeted by liquidity concerns toward the end of the calendar year, but managed to stabilize in the months that followed. The Barclays U.S. Corporate High Yield Bond Index4 ended lower, losing 1.12%.
In the tax-exempt market, concerns about a bond default by Puerto Rico were not enough to prevent a strong performance in municipal bonds, as the Barclays Municipal Bond Index5 gained 5.29%.
Global bond markets enjoyed an even stronger performance as central bankers from Europe to Japan pursued monetary easing and even negative interest rates in attempts to jump-start their struggling economies. The Barclays Global Aggregate ex-USD6 jumped 6.55% over the last 12 months ended April 30, 2016.
For the 12-month reporting period May 1, 2015 through April 30, 2016, certain Barclays indices performed as follows7:
| Barclays U.S. Aggregate Bond Index | Barclays U.S. Treasury Bond |
Barclays U.S. Index9 | Barclays U.S. Credit Bond Index10 | Barclays Municipal Bond Index | ||||
| 2.72% | 2.83% | 2.56% | 2.77% | 5.29% |
PRESIDENT’S MESSAGE / April 30, 2016 (unaudited)
ii
The Stock Markets
The U.S. stock market experienced sharp declines and price recoveries, but was unable to break out of the trading range it’s occupied for the last 18 months.
Stocks weathered a number of challenges, beginning the fiscal year with the threat of a Greek bankruptcy and the country’s withdrawal from the European Union. No sooner was that crisis resolved than investors were confronted with an unexpected currency devaluation by China, which led to sharp losses in stock prices in the month of August, a slide that extended into September.
Prices staged a strong recovery in October, recouping most of their previous losses as Europe hinted at monetary stimulus, China cut rates, and the Fed delayed its anticipated interest rate increase.
January turned in nearly a mirror performance of August as oil prices resumed their slide, anxieties grew about China’s economic health, and the world’s economies remained stagnant. Stocks staged yet another recovery in March, sparked by firming oil prices, fresh monetary easing in Europe, and new stimulus steps in China.
After all the market gyrations, stocks ended generally right where they began, with the Russell 3000 Index11, a broad domestic market index, falling just 0.18%, for the year ended April 30, 2016.
U.S. large-cap stocks outperformed mid-cap and small-cap stocks, as indicated by the 1.21% gain in the S&P 500 index12 and the declines in the Russell Midcap Index13 (-2.14%) and the Russell 2000 Index14 (-5.94%).
While growth stocks led performance in the large-cap space – the Russell 1000 Growth Index15 rose 1.07% versus a small loss in the Russell 1000 Value Index16 (-0.40%) – they underperformed value stocks significantly in the mid-cap and small-cap markets.
The best-performing S&P industry sectors were utilities (+14.26%), consumer staples (+10.46%), and telecommunication services (+9.71%). The energy sector turned in the worst performance, sliding 15.18%.
Real estate posted a strong performance, with the FTSE NAREIT Equity REITs Index17 posting a gain of 7.86%.
Overseas markets endured a difficult year, as reflected in the 9.32% decline in the MSCI EAFE (net) Index18. Emerging markets were particularly hard hit, with the MSCI Emerging Markets (net) Index19 losing 17.87%.
For the 12-month reporting period May 1, 2015 through April 30, 2016, certain stock market indices performed as follows:
| S&P 500 Index | Dow Jones Industrial Average20 | NASDAQ Composite Index21 |
MSCI All Country | |||
| 1.21% | 2.25% | -2.19% | -11.28% |
The markets this past year have been a reminder that a broadly diversified portfolio and the patience to stay invested through periods of market volatility can be essential to long-term investment success.23 We remain committed to managing your assets with a long-term view and working hard in the year ahead to help you reach your important financial goals.
Sincerely,

Christopher D. Randall
President
May 27, 2016
For more complete information, please download the Funds’ prospectus, which is available on www.wilmingtonfunds.com, or call 1-800-836-2211 for a copy. You should consider the Funds’ investment objectives, risks, charges, and expenses carefully before you invest. Information about these and other important subjects is in the Funds’ prospectus, which you should read carefully before investing.
Past performance is no guarantee of future results. The index performance quoted is for illustrative purposes only and is not representative of any specific investment. Diversification does not ensure a profit nor protect against loss.
All investments involve risk, including the possible loss of principal. Equity securities are subject to price fluctuation and possible loss of principal. Small and mid-cap stocks involve greater risks and volatility than large-cap stocks. International investments are subject to special risks, including currency fluctuations, social, economic, and political uncertainties, which could increase volatility. These risks are magnified in emerging markets.
April 30, 2016 (unaudited) / PRESIDENT’S MESSAGE
iii
High yield, lower-rated securities generally entail greater market, credit and liquidity risks than investment grade securities and may include higher volatility and higher risk of default.
You could lose money by investing in the money market funds. Although the money market funds seek to preserve the value of your investment at $1.00 per share, they cannot guarantee they will do so. An investment in money market funds is not a deposit of M&T Bank and is not insured or guaranteed by the Federal Deposit Insurance Corporation or any other government agency. The investment advisor has no legal obligation to provide financial support to the Funds, and you should not expect that the investment advisor will provide financial support to the Funds at any time.
| 1. | Basis Points (“BPS”) is a unit that is equal to 1/100th of 1% and is used to denote the change in a financial instrument. The basis point is commonly used for calculating changes in interest rates, equity indices and the yield. |
| 2. | Barclays U.S. Aggregate Bond Index is a widely used benchmark index for the domestic investment-grade bond market composed of securities from the Barclays Government/Corporate Bond Index, Mortgage-Backed Securities Index and Asset-Backed Securities Index. The index typically includes fixed income securities with overall intermediate- to long-term average maturities. The index is unmanaged and investments cannot be made directly in an index. |
| 3. | Barclays U.S. Long-Term Treasury Index is an unmanaged index that includes all publicly issued U.S. Treasury securities that have a remaining maturity of 10 or more years, are rated investment grade, and have $250 million or more of outstanding face value. |
| 4. | Barclays U.S. Corporate High Yield Bond Index measures the USD-denominated, high yield, fixed-rate corporate bond market. Securities are classified as high yield if the middle rating of Moody’s, Fitch, and S&P is Ba1/BB+/BB+ or below. Bonds from issuers with an emerging markets country of risk, based on Barclays EM country definition, are excluded. The U.S. Corporate High Yield Bond Index is a component of the U.S. Universal and Global High Yield Indices. |
| 5. | Barclays Municipal Bond Index tracks the performance of long-term, tax-exempt, investment-grade bond markets. To be included in the index, bonds must have an outstanding par balance of at least $7 million and be issued as part of a transaction of at least $75 million. The index is unmanaged and investments cannot be made directly in an index. |
| 6. | Barclays Global Aggregate ex-USD provides a broad-based measure of the global investment-grade fixed income markets. The three major components of this index are the U.S. Aggregate, the Pan-European Aggregate, and the Asian-Pacific Aggregate indices. The index also includes Eurodollar and Euro-Yen corporate bonds, Canadian government, agency and corporate securities, and USD investment grade 144A securities. An investment cannot be made directly in an index. |
| 7. | Bond prices are sensitive to changes in interest rates and a rise in interest rates can cause a decline in their prices. |
| 8. | Barclays U.S. Treasury Bond Index is a market capitalization weighted index that includes all publicly issued, U.S. Treasury securities that have a remaining maturity of at least one year, are rated investment-grade, and have $250 million or more of outstanding face value. The index is unmanaged and investments cannot be made directly in an index. |
| 9. | Barclays U.S. Mortgage Backed Securities Index is composed of all securities mortgage pools by GNMA, FNMA and the FHLMC, including GNMA graduated Payment Mortgages. The index is unmanaged and investments cannot be made directly in an index. |
| 10. | Barclays U.S. Credit Bond Index tracks the performance of domestic investment-grade corporate bonds and is composed of all publicly issued, fixed-rate, nonconvertible, investment-grade corporate debt. The index is unmanaged and investments cannot be made directly in an index. |
| 11. | The Russell 3000 Index is a capitalization weighted index that seeks to be a benchmark of the entire U.S. stock market. It measures the performance of the 3,000 largest publicly held companies incorporated in the U.S. based on market capitalization. |
| 12. | The S&P 500 Index is a capitalization-weighted index of 500 stocks designed to measure performance of the broad domestic economy through changes in the aggregate market value of 500 stocks representing all major industries. The index is unmanaged and investments cannot be made directly in an index. |
| 13. | Russell Midcap Index measures the performance of the 800 smallest companies in the Russell 1000 Index, which represents approximately 25% of the total market capitalization of the Russell 1000 Index. |
| 14. | Russell 2000 Index measures the performance of the 2,000 smallest companies in the Russell 3000 Index, which represents approximately 8% of the total market capitalization of the Russell 3000 Index. |
| 15. | Russell 1000 Growth Index measures the performance of those Russell 1000 companies with higher price-to-book ratios and higher forecasted growth values. |
| 16. | Russell 1000 Value Index measures the performance of those Russell 1000 companies with lower price-to-book ratios and lower forecasted growth values. |
| 17. | FTSE NAREIT Equity REITs Index is a free float-adjusted, market capitalization-weighted index of U.S. Equity REITs. Constituents of the Index include all tax-qualified REITs with more than 50 percent of total assets in qualifying real estate assets other than mortgages secured by real property. |
| 18. | MSCI EAFE (Net) Index is a free float-adjusted market capitalization index that is designed to measure equity market performance of developed markets, excluding the U.S. & Canada. The index consisted of the following 22 developed market country indices: Australia, Austria, Belgium, Denmark, Finland, France, Germany, Greece, Hong Kong, Ireland, Israel, Italy, Japan, Netherlands, New Zealand, Norway, Portugal, Singapore, Spain, Sweden, Switzerland and the United Kingdom. The index is unmanaged and investments cannot be made directly in an index. The performance of this index is reduced by the taxes on dividends paid by the international securities issuers in the index. |
| 19. | MSCI Emerging Markets (Net) Index is a free float-adjusted market capitalization index that is designed to measure equity market performance of emerging markets. The MSCI Emerging Markets Index consisted of the following 21 emerging market country indices: Brazil, Chile, China, Colombia, Czech Republic, Egypt, Hungary, India, Indonesia, Korea, Malaysia, Mexico, Morocco, Peru, Philippines, Poland, Russia, South Africa, Taiwan, Thailand, and Turkey. The index is unmanaged and investments cannot be made directly in an index. The performance of this index is reduced by the taxes on dividends paid by the international securities issuers in the index. |
| 20. | Dow Jones Industrial Average (“DJIA”) represents share prices of selected blue chip industrial corporations as well as public utility and transportation companies. The DJIA indicates daily changes in the average prices of stocks in any of its categories. It also reports total sales for each group of industries. Because it represents the top corporations of America, the DJIA’s average movements are leading economic indicators for the stock market as a whole. The average is unmanaged and investments cannot be made directly in an average. |
| 21. | NASDAQ Composite Index measures all NASDAQ domestic and non-U.S. based common stocks listed on the NASDAQ Stock Market. The index is unmanaged and investments cannot be made directly in an index. |
| 22. | MSCI All Country World ex-US (Net) Index is a free float-adjusted market capitalization weighted index that is designed to measure the equity market performance of developed and emerging markets excluding the U.S. market. The index consists of 44 countries indices comprising 23 developed and 21 emerging market country indices. The index is unmanaged and investments cannot be made directly in an index. The performance of this index is reduced by the taxes on dividends paid by the international securities issuers in the index. |
| 23. | Diversification does not assure a profit nor protect against loss. |
PRESIDENT’S MESSAGE / April 30, 2016 (unaudited)
[This Page Intentionally Left Blank]
1
WILMINGTON MULTI-MANAGER INTERNATIONAL FUND
Management’s Discussion of Fund Performance
For the fiscal year ended April 30, 2016, Wilmington Multi-Manager International Fund (the “Fund”) had a total return of -10.82% for Class A Shares and -10.70% for Class I Shares, versus its benchmark, the Morgan Stanley Capital International – All Country World ex-US Index (Net, USD) (“MSCI ACWI ex-US”)** which had a total return of -11.28%. The MSCI ACWI ex-US is a free float-adjusted market capitalization index that is designed to measure developed and emerging market equity performance, excluding the United States.
During the reporting period, banking was the worst performing industry within the benchmark, detracting 3.17% from the benchmark return. Consequently, the Fund’s 6.02% underweight to banks contributed 0.80% to excess return – the largest contribution by any industry. The Fund’s combined 0.73% underweight to three major Chinese state banks contributed an aggregate 0.30% to excess return. Additionally, 0.74% and 0.25% underweights to struggling HSBC and Barclays contributed 0.24% and 0.12% to excess return.
Metals and mining contributed 0.51% to excess return – the second largest contribution by any industry. A 0.36% overweight to Franco-Nevada Corporation and a 0.84% overweight to gold producer Newcrest Mining contributed 0.28% and 0.25%, respectively. A 1.02% underweight to the global insurance industry, adversely impacted by poor returns on investment portfolios, provided the third largest contribution, 0.48%. In particular, a 0.43% underweight to three large Chinese insurers, which were especially hard-hit by the collapse in Chinese equities, contributed 0.21%. A 0.99% overweight to the chemical sector provided the fourth largest contribution, 0.37%. Finally, a 2.31% underweight to oil and gas, which was still adversely impacted by weak oil prices, contributed 0.30%.
A 2.24% overweight to the machinery industry detracted -0.43% from the Fund’s excess return. Within machinery, a 1.07% overweight to Japanese robotics manufacturer Fanuc detracted -0.45%. The automobile industry detracted -0.39%. Overweights of 0.18% and 0.13% to China’s Great Wall Motor and Volkswagen detracted -0.51% and -0.18% from return. The semiconductor industry detracted -0.34%. Overweights of 0.12%, 0.43%, and 0.08% to Inotera Memories, NXP Semiconductors, and SK Hynix detracted -0.29%, -0.21%, and -0.12%, respectively. The global semiconductor industry lagged on China’s announcement that it intended to become fully self-sufficient in semiconductors.
Viewed from the perspective of country equity markets, a 2.07% underweight to Chinese equity market provided the Fund’s greatest contribution to return, 0.51%. The benchmark index for Hong-Kong traded Chinese stocks dropped 28.24% during the reporting year. A 2.14% overweight to German stocks provided the second greatest contribution, at 0.47%. A 0.28% overweight to Adidas was singularly responsible for a 0.23% return. A 3.07% underweight to Canadian stocks contributed 0.46%.
A 7.36% overweight to the U.S. equity market detracted -0.88% from return. The detractors were U.S. pharmaceutical companies which, after tax inversions, established international domicile. Obviously, the negative contributions of the U.S. equities to the Fund reflect the prospects of particular pharmaceutical stocks, not of the general U.S. equity market. A 0.86% overweight to Ireland-based
Shire, another pharmaceutical, detracted -0.20% of Ireland’s -0.25% negative contribution.
From a currency standpoint, underweights of 3.57%, 4.08%, 2.08%, and 3.56% to the Canadian dollar, Hong Kong dollar, Australian dollar, the pound sterling contributed 0.86%, 0.67%, 0.51%, and 0.26%, respectively. The Canadian dollar and Australian dollar continued to depreciate with commodity weakness. Pound sterling depreciated as concerns mounted over whether the UK would leave the European Union. The Hong Kong dollar is fixed against the U.S. dollar; however, the Chinese currencies in both our Fund and in the benchmark are denominated in dollars, and their returns were negative in the quarter. Underweights of 1.89% and 2.22% to the Taiwan dollar and Korean won detracted -0.12% and -0.11%, respectively, reflective more of underlying stocks than of currency moves.
As of April 30, 2016, our sub-advisor line-up consisted of the following asset managers: JO Hambro Capital Management (“Hambro”), Dimensional Fund Advisors LP (“DFA”), LSV Asset Management (“LSV”), Northern Cross LLC, Oberweis Asset Management, Parametric Portfolio Associates LLC (“Parametric”), and Wilmington Trust Investment Advisors, Inc. (“WTIA”). Hambro invests primarily in developed-country growth stocks. Northern Cross invests primarily in developed-country core stocks. DFA and LSV invest primarily in developed-country value stocks. Oberweis invests in developed-country small-cap stocks. Parametric invests in emerging markets.
| * | Performance data quoted represents past performance, which is no guarantee of future results. Investment return and principal value will fluctuate so that an investor’s shares, when redeemed, may be worth more or less than their original cost. Mutual Funds are not obligations of or guaranteed by any bank and are not federally insured. The total return shown assumes the reinvestment of all distributions and does not reflect the deduction of taxes that a shareholder would pay on fund distributions or the redemption of shares. The total return for Class A Shares was -15.75%, adjusted for the Fund’s maximum sales charge of 5.50%. Mutual fund performance changes over time and current performance may be lower or higher than what is stated. For the most recent month-end performance, please visit www.wilmingtonfunds.com or call 1-800-836-2211. |
| ** | The MSCI All Country World ex-US Index (Net, USD) (“MSCI ACWI ex-US”) is a free float-adjusted market capitalization weighted index that is designed to measure the equity market performance of developed and emerging markets, excluding the United States. The MSCI ACWI ex-US consists of 45 country indices comprising 22 developed and 23 emerging market country indices. The developed market country indices included are: Australia, Austria, Belgium, Canada, Denmark, Finland, France, Germany, Greece, Hong Kong, Ireland, Italy, Japan, Netherlands, New Zealand, Norway, Portugal, Singapore, Spain, Sweden, Switzerland, and the United Kingdom. The emerging market country indices included are: Argentina, Brazil, Chile, China, Colombia, Czech Republic, Egypt, Hungary, India, Indonesia, Israel, Korea, Malaysia, Mexico, Morocco, Peru, Philippines, Poland, Russia, South Africa, Taiwan, Thailand, and Turkey. The performance of this index is reduced by the taxes on dividends paid by the international securities issuers in the index. The index is unmanaged and it is not possible to invest directly in an index. |
ANNUAL REPORT / April 30, 2016 (unaudited)
2
WILMINGTON MULTI-MANAGER INTERNATIONAL FUND
The graphs below illustrate the hypothetical investment of $10,0001 in the Class A Shares and $1,000,0001 in the Class I Shares of Wilmington Multi-Manager International Fund from April 30, 2006 to April 30, 2016, compared to the MSCI ACWI ex-US Index (Net, USD).2
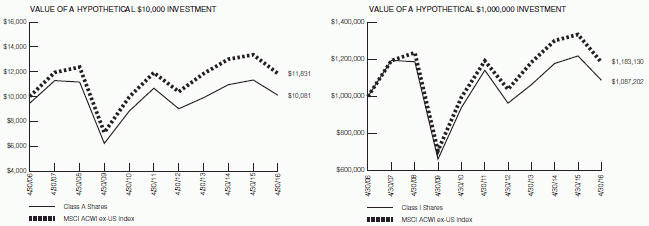
Performance data quoted represents past performance, which is no guarantee of future results. Investment return and principal value will fluctuate so that an investor’s shares, when redeemed, may be worth more or less than their original cost. Mutual Funds are not obligations of or guaranteed by any bank and are not federally insured. The total return shown assumes the reinvestment of all distributions and does not reflect the deduction of taxes that a shareholder would pay on fund distributions or the redemption of shares. The total return for Class A Shares was -15.75%, adjusted for the Fund’s maximum sales charge of 5.50%. Mutual fund performance changes over time and current performance may be lower or higher than what is stated. For the most recent month-end performance, please visit www.wilmingtonfunds.com or call 1-800-836-2211.
| Average Annual Total Returns for the Periods Ended 4/30/16 | ||||||||||||
1 Year
| 5 Years
| 10 Years
| ||||||||||
Class A^
|
| -15.75%
|
|
| -2.23%
|
|
| 0.08%
|
| |||
Class I^
|
| -10.70%
|
|
| -0.95%
|
|
| 0.84%
|
| |||
MSCI ACWI ex-US Index (Net, USD)2
|
| -11.28%
|
|
| -0.13%
|
|
| 1.70%
|
| |||
^Expense Ratios Before Waivers and Expense Ratios After Waivers for Class A are 1.73% and 1.32%, respectively. Expense Ratios Before Waivers and Expense Ratios After Waivers for Class I are 1.48% and 1.19%, respectively. Expense Ratios Before Waiver represent the operating costs borne by the Fund, expressed as a percentage of the Fund’s average net assets, as shown in the Fees and Expenses table in the Fund’s current prospectus (under “Total Annual Fund Operating Expenses”). Current information regarding the Fund’s Operating Expenses can be found in the Fund’s Financial Highlights.
| 1 | Represents a hypothetical investment of $10,000 in Class A of the Fund after deducting the maximum sales charge of 5.50% ($10,000 investment minus $550 sales charge = $9,450) and a hypothetical investment of $1,000,000 in Class I of the Fund and assumes the reinvestment of all dividends and distributions. |
| 2 | The performance for the MSCI ACWI ex-US Index (Net, USD) assumes the reinvestment of all dividends and distributions but does not reflect the deduction of a sales charge required for the Fund’s performance by the Securities and Exchange Commission. The performance of this index is reduced by the taxes on dividends paid by the international securities issuers in the index. It is not possible to invest directly in an index and the represented index is unmanaged. |
April 30, 2016 (unaudited) / ANNUAL REPORT
3
WILMINGTON MULTI-MANAGER ALTERNATIVES FUND
Management’s Discussion of Fund Performance
For the fiscal year ended April 30, 2016, the Wilmington Multi-Manager Alternatives Fund (the “Fund”) had a total return of -7.48%* for Class A Shares and -7.22%* for Class I Shares, versus its benchmark, the HFRX Global Hedge Fund Index**, which had a total return of -7.18%.
Fund Highlights
The Fund experienced a challenging year along with many of its peers. Manager cross correlation remained low, but losses were experienced in most strategies. The Fund’s annualized volatility for the fiscal year was 6.10%, the realized beta against the S&P 500 was 0.30, and the realized correlation to the Barclays US Aggregate was -0.26.
Performance by Strategy
Long/Short Equity was the largest negative contributor to the Fund. Losses were concentrated in the Fund’s healthcare sleeve, which is managed by Highland Capital Healthcare Advisors, L.P., as the sector saw a severe drawdown relative to the wider equity market starting late in the summer. The Fund had a significant biotech exposure on high growth rates and reasonable valuations. This sub-sector, as measured by the NASDAQ Biotechnology Index, fell 20% on worries of government induced price controls. While we retain conviction in the healthcare manager, the speed and magnitude of the selloff led to a reduction in our allocation. Late in the year we added Analytic Investors, LLC, a Los Angeles based firm founded in the 1970’s with over $15 billion in assets. They take a systematic approach in global large cap equities exploiting the low volatility factor. They go long on companies with low risk and high expected return based on their models and short stocks with higher risk and lower expected returns. During the year, the Fund parted ways with Calamos Advisors, LLC, after the manager experienced a heightened level of turnover on their investment team.
The global macro strategy that is managed by PE/Global LLC maintained a long dollar position throughout the year based on the manager’s quantitative model. After paying off handsomely as the dollar rose dramatically from July 2014 through April of 2015, the position has been largely range bound with the US Dollar/Euro exchange rate oscillating between a high of 1.17 and a low of 1.06 during the fiscal year. Ultimately, the strategy proved unprofitable during the fiscal year, though it retained its diversification properties.
Our event driven strategy, accessed through the Arbitrage Fund, posted modest gains for the period. After seeing some losses on broken deals late last summer, the Arbitrage Fund grounded out low volatility positive performance the remainder of the year.
Our corporate credit strategies were down moderately for the period. Well over 100% of the losses occurred from November all the way through January as fears of contagion in the high yield market caused spreads to widen to levels last seen during the U.S. debt downgrade episode in 2011. Since mid-February 2016, spreads have tightened rapidly leading to strong performance in the current calendar year-to-date period.
Options arbitrage, managed by Parametric Risk Advisers, saw slight losses and remained negatively correlated to the other strategies.
The strategy made money during the first 10 months of the fiscal year in a generally range bound market, but lost money during March 2016 as the strong equity market rally led to index levels expiring well above strike prices.
Commentary & Outlook
It was a difficult year, but management is encouraged by the opportunities available across the financial markets in which our sub-advisors participate. Despite the market turmoil in early 2016, most global growth is still slowly improving and we believe risk of a near term recession is low. We do not expect dramatic increases in equity markets, but fundamentals still support gains and there are hopeful signs that stock dispersion is rising. In high yield credit markets, spreads have tightened dramatically since early 2016, but remain 150 basis points higher than last year. While many participants expect defaults to tick up, especially among energy issuers, overall corporate health is strong. Volatility within currency markets has risen sharply and looks to remain elevated as the Fed does or doesn’t move towards additional rate hikes. Lastly, merger activity continues to be robust with deal volume continuing to increase year over year.
The Fund uses derivatives, which primarily consists of equity index options and currency futures, to enhance the returns of the Fund. During the fiscal year, the use of equity index options had a positive impact but the use of the currency futures had negative impact relative to the Fund’s benchmark.
| * | Performance data quoted represents past performance, which is no guarantee of future results. Investment return and principal value will fluctuate so that an investor’s shares, when redeemed, may be worth more or less than their original cost. Mutual Funds are not obligations of or guaranteed by any bank and are not federally insured. The total return shown assumes the reinvestment of all distributions and does not reflect the deduction of taxes that a shareholder would pay on fund distributions or the redemption of shares. The total return for Class A Shares was -12.55%, adjusted for the Fund’s maximum sales charge of 5.50%. Mutual fund performance changes over time and current performance may be lower or higher than what is stated. For the most recent month-end performance, please visit www.wilmingtonfunds.com or call 1-800-836-2211. |
| ** | The HFRX Global Hedge Fund Index is designed to be representative of the overall composition of the hedge fund universe and is composed of active private funds with assets under management of a least $50 million reporting to Hedge Fund Research, Inc. (“HFRX”). The performance results reported by HFRX are asset weighted. The index is unmanaged and it is not possible to invest directly in an index. |
Alpha is a measure of performance on a risk-adjusted basis. The excess return of the fund relative to the return of the benchmark index is a fund’s alpha. |
Beta is a coefficient which measures the volatility of the stock’s returns relative to a given market index. |
ANNUAL REPORT / April 30, 2016 (unaudited)
4
The NASDAQ Biotechnology Index is a stock market index made up of securities of NASDAQ-listed companies classified according to the Industry Classification Benchmark as either Biotechnology or Pharmaceuticals. |
Valuation is the process of determining the current worth of an asset or company. There are many techniques that can be used to determine value, some are subjective and others are objective. |
Correlation is a statistical measure of how two securities move in relation to each other. |
Investing involves risk and you may incur a profit or a loss. Investments such as mutual funds which focus on alternative strategies are subject to increased risk and loss of principal and are not suitable for all investors. Diversification does not ensure a profit or guarantee against a loss. There is no assurance that any investment strategy will be successful. Any investment in the Fund should be part of an overall investment program rather than, in itself, a complete program. Because the Fund invests in underlying mutual funds or other managed strategies, an investor in the Fund will bear the management fees and operating expenses of the “Underlying Strategies” in which the Fund invests. The total expenses borne by an investor in the Fund will be higher than if the investor invested directly in the Underlying Strategies, and the returns may therefore be lower. |
The Fund, the Sub-Advisers, and the Underlying Strategies may use aggressive investment strategies, which are riskier than those used by typical mutual funds. If the Fund and Sub-Advisers are unsuccessful in applying these investment strategies, the Fund and you may lose more money than if you had invested in another fund that did not invest aggressively. The Fund is subject to risks associated with the Sub-Advisers making trading decisions independently, investing in other investment companies, using a particular style or set of styles, basing investment decisions on historical relationships and correlations, trading frequently, using leverage, making short sales, being non-diversified, and investing in securities with low correlation to the market. The use of leverage may magnify losses. |
The Fund is also subject to risks associated with investments in foreign markets, emerging market securities, small cap companies, debt securities, derivatives, commodity-linked instruments, illiquid securities, asset-backed securities, and collateralized mortgage obligations. Please see the prospectus and summary prospectus for information on these as well as other risk considerations. |
April 30, 2016 (unaudited) / ANNUAL REPORT
5
WILMINGTON MULTI-MANAGER ALTERNATIVES FUND
The graphs below illustrate the hypothetical investment of $10,0001 in the Class A Shares and $1,000,0001 in the Class I Shares of the Wilmington Multi-Manager Alternatives Fund from January 12, 2012 (start of performance) to April 30, 2016 compared to the HFRX Global Hedge Fund Index.2
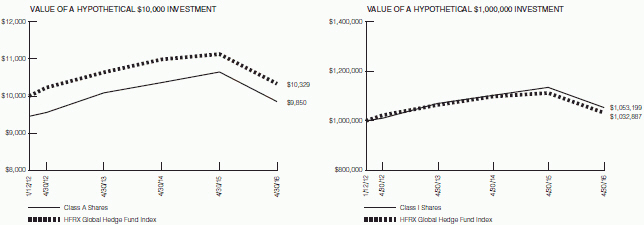
Performance data quoted represents past performance, which is no guarantee of future results. Investment return and principal value will fluctuate so that an investor’s shares, when redeemed, may be worth more or less than their original cost. Mutual Funds are not obligations of or guaranteed by any bank and are not federally insured. The total return shown assumes the reinvestment of all distributions and does not reflect the deduction of taxes that a shareholder would pay on fund distributions or the redemption of shares. The total return for Class A Shares was -12.55%, adjusted for the Fund’s maximum sales charge of 5.50%. Mutual fund performance changes over time and current performance may be lower or higher than what is stated. For the most recent month-end performance, please visit www.wilmingtonfunds.com or call 1-800-836-2211.
| Average Annual Total Returns for the Periods Ended 4/30/16 | ||||||||
1 Year
| Start of Performance (1/12/2012)
| |||||||
Class A^
|
| -12.55%
|
|
| -0.35%
|
| ||
Class I^
|
| -7.22%
|
|
| 1.21%
|
| ||
HFRX Global Hedge Fund Index2
|
| -7.18%
|
|
| 0.76%
|
| ||
^Expense Ratios Before Waivers and Expense Ratios After Waivers for Class A are 3.36% and 2.89%, respectively. Expense Ratios Before Waivers and Expense Ratios After Waivers for Class I are 3.11% and 2.64%, respectively. Expense Ratios Before Waiver represent the operating costs borne by the Fund, expressed as a percentage of the Fund’s average net assets, as shown in the Fees and Expenses table in the Fund’s current prospectus (under “Total Annual Fund Operating Expenses”). Current information regarding the Fund’s Operating Expenses can be found in the Fund’s Financial Highlights.
| 1 | Represents a hypothetical investment of $10,000 in Class A of the Fund after deducting the maximum sales charge of 5.50% ($10,000 investment minus $550 sales charge = $9,450) and a hypothetical investment of $1,000,000 in Class I of the Fund and assumes the reinvestment of all dividends and distributions. |
| 2 | The performance for the HFRX Global Hedge Fund Index assumes the reinvestment of all dividends and distributions but does not reflect the deduction of a sales charge required for the Fund’s performance by the Securities and Exchange Commission. It is not possible to invest directly in an index and the represented index is unmanaged. |
ANNUAL REPORT / April 30, 2016 (unaudited)
6
WILMINGTON MULTI-MANAGER REAL ASSET FUND
Management’s Discussion of Fund Performance
For the fiscal year ended April 30, 2016, Wilmington Multi-Manager Real Asset Fund (the “Fund”) had a total return of -3.09%* for Class A Shares and -2.89%* for Class I Shares, versus its benchmarks, the Barclays World Government Inflation Linked Bond Index (hedged, USD) (“Barclays World GILB Index”) ** and its Blended Index which had total returns of 0.07% and -1.50%, respectively.
The Blended Index is currently a mix of 50% Barclays World GILB Index, 35% S&P Developed Property Index**, and 15% Bloomberg Commodity Index**. During this period, the Fund’s relative underperformance was largely due to the underlying managers lagging their respective benchmarks. Though tactical asset allocation decisions at the Fund level produced positive contributions, specifically our underweight to diversified commodities and overweight to real-estate related securities, these tailwinds could not offset the manager drag during the recent fiscal year.
The Fund much of the year allocated a 5% overweight to public real-estate securities at the expense of global inflation linked bonds (“ILB’s”). However, at the start of 2016, driven by muted prospects of aggressive interest rate policies, global growth and the attractiveness of U.S. breakeven valuations, our team repositioned the portfolio to tactically eliminate international inflation linked bonds, commodities and elevate global real-estate exposures.
Real yields on ILB’s generally declined during the year as softness in the Chinese economy and an accommodative central bank, reduced the likelihood of accelerating near-term inflation. Energy prices began a slow climb after the turn of the year from the lows witnessed in 2015. Despite the firming energy prices, break-even inflation declined and inflation linked notes trailed nominal bonds. Global ILB’s, ex-U.S. Treasury Inflation-Protected Securities (“TIPS”), were down -2.16% during the fiscal year with the majority of negative performance coming from commodity heavy countries such as Canada, Australia and New Zealand. U.S. TIPS and Japanese linkers were the bright spots during the fiscal year with Japanese issuance up close to 9% on the back of Prime Minister Shinz Abe’s movement to enforce policies designed to overcome their persistent deflation. The Fund’s overall ILB allocation underperformed its index by approximately 100 basis points as the active managers transitioned from a global mandate to a U.S. TIPS only allocation. The preponderance of the underperformance was reflective of an out-of-benchmark allocation to emerging market linkers, particularly Brazil, and optimistic positioning on U.S. breakeven inflation appreciation.
Global real-estate securities, as measured by the S&P Developed Property Index, were up during the fiscal year as real-estate markets benefited from steady interest rates, reasonable valuations and investor’s thirst for yield. Foreign real-estate, as a group, was negative during the fiscal year largely due to the implications of a potential British exit (“Brexit”) harming U.K. REITS and pronounced depreciation in Hong Kong REITS driven by Chinese economic weakness. Positive REIT results were seen in the U.S., continental Europe and Australia, which was a result of attractive growth and yield dynamics along with increased mergers and acquisitions activity at premium pricing. Weak manager performance was a result of poor stock selection by CBRE Clarion Securities.
Commodities proved to be the worst performer among the three asset classes for the fiscal year ending -16.9% as measured by the Bloomberg Commodity Index. Energy prices, though in an upward trajectory at fiscal year-end, declined dramatically from the previous year-end as global growth, a glut of oil aided by increasingly efficient extraction methods and Saudi Arabia’s drive to recapture lost market share conspired to negatively pressure pricing. A scarcity of factors that would accelerate global demand kept broad commodities, ex-energy, weakened with no obvious catalyst in sight. Our teams continued tactical underweight to commodities became a complete position elimination going into 2016 as we contended that the pick-up in marginal return from commodities would not overcome the pronounced volatility we would experience.
The Fund uses derivatives, which include interest rate/inflation options, interest rate futures, interest rate/inflation swaps, and credit default swaps, to enhance returns of the Fund and to hedge (or protect) against adverse movements in interest rates and movements in the bond markets. During the fiscal year, the Fund’s use of derivatives had a neutral impact on the relative performance of the Fund verses its benchmark.
| * | Performance data quoted represents past performance, which is no guarantee of future results. Investment return and principal value will fluctuate so that an investor’s shares, when redeemed, may be worth more or less than their original cost. Mutual Funds are not obligations of or guaranteed by any bank and are not federally insured. The total return shown assumes the reinvestment of all distributions and does not reflect the deduction of taxes that a shareholder would pay on fund distributions or the redemption of shares. The total return for Class A Shares was -8.42%, adjusted for the Fund’s maximum sales charge of 5.50%. Mutual fund performance changes over time and current performance may be lower or higher than what is stated. For the most recent month-end performance, please visit www.wilmingtonfunds.com or call 1-800-836-2211. |
| ** | Barclays World Government Inflation-Linked Bond Index measures the performance of the major government inflation-linked bond markets. The index is designed to include only those markets in which a global government linker fund is likely to invest. |
S&P Developed Property Index defines and measures the investable universe of publicly traded property companies in developed global markets. |
Bloomberg Commodity Index Total Return is designed to be a diversified benchmark for commodities as an asset class, and reflects the returns that are potentially available through an unleveraged investment in the futures contracts on physical commodities comprising the Index plus the rate of interest that could be earned on cash collateral invested in specified Treasury Bills. The Index is currently composed of futures contracts on 20 physical commodities. |
International investing involves special risks including currency risks, increased volatility of foreign securities, political risks and differences in auditing and other financial standards. |
April 30, 2016 (unaudited) / ANNUAL REPORT
7
WILMINGTON MULTI-MANAGER REAL ASSET FUND
The graphs below illustrate the hypothetical investment of $10,0001 in the Class A Shares and $1,000,0001 in the Class I Shares of the Wilmington Multi-Manager Real Asset Fund from April 30, 2006 to April 30, 2016 compared to the Barclays World Government Inflation-Linked Bond Index2 (“Barclays World GILB Index”) and the Real Asset Blended Index.2,3
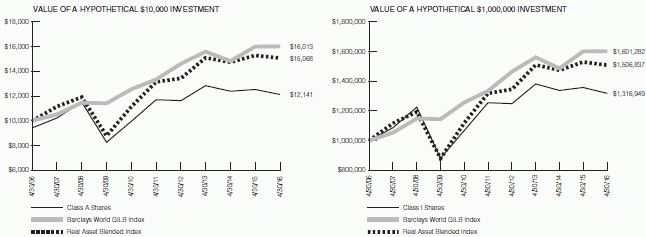
Performance data quoted represents past performance, which is no guarantee of future results. Investment return and principal value will fluctuate so that an investor’s shares, when redeemed, may be worth more or less than their original cost. Mutual Funds are not obligations of or guaranteed by any bank and are not federally insured. The total return shown assumes the reinvestment of all distributions and does not reflect the deduction of taxes that a shareholder would pay on fund distributions or the redemption of shares. The total return for Class A Shares was -8.42%, adjusted for the Fund’s maximum sales charge of 5.50%. Mutual fund performance changes over time and current performance may be lower or higher than what is stated. For the most recent month-end performance, please visit www.wilmingtonfunds.com or call 1-800-836-2211.
| Average Annual Total Returns for the Periods Ended 4/30/16 | ||||||||||||
1 Year
| 5 Years
| 10 Years
| ||||||||||
Class A^
|
| -8.42%
|
|
| -0.40%
|
|
| 1.97%
|
| |||
Class I^
|
| -2.89%
|
|
| 0.98%
|
|
| 2.79%
|
| |||
Barclays World Government Inflation-Linked Bond Index2
|
| 0.07%
|
|
| 3.72%
|
|
| 4.82%
|
| |||
Real Asset Blended Index2,3
|
| -1.50%
|
|
| 2.73%
|
|
| 4.19%
|
| |||
^Expense Ratios Before Waivers and Expense Ratios After Waivers for Class A are 1.57% and 1.34%, respectively. Expense Ratios Before Waivers and Expense Ratios After Waivers for Class I are 1.32% and 1.09%, respectively. Expense Ratios Before Waiver represent the operating costs borne by the Fund, expressed as a percentage of the Fund’s average net assets, as shown in the Fees and Expenses table in the Fund’s current prospectus (under “Total Annual Fund Operating Expenses”). Current information regarding the Fund’s Operating Expenses can be found in the Fund’s Financial Highlights.
| 1 | Represents a hypothetical investment of $10,000 in Class A of the Fund after deducting the maximum sales charge of 5.50% ($10,000 investment minus $550 sales charge = $9,450) and a hypothetical investment of $1,000,000 in Class I of the Fund from and assumes the reinvestment of all dividends and distributions. |
| 2 | The performance for the Barclays World GILB Index and the Real Asset Blended Index assumes the reinvestment of all dividends and distributions but does not reflect the deduction of a sales charge required for the Fund’s performance by the Securities and Exchange Commission. It is not possible to invest directly in an index and the represented indices are unmanaged. |
| 3 | The Real Asset Blended Index is calculated by the investment advisor and is currently based on a weighting of the following indices: 50% Barclays World GILB Index, 35% S&P Developed Property Index and 15% Bloomberg Commodity Index. |
ANNUAL REPORT / April 30, 2016 (unaudited)
8
WILMINGTON STRATEGIC ALLOCATION CONSERVATIVE FUND
Management’s Discussion of Fund Performance
For the fiscal year ended April 30, 2016, Wilmington Strategic Allocation Conservative Fund (the “Fund”) returned -1.50%* for Class A Shares and -1.24%* for Class I Shares, versus its benchmarks, the Barclays US Aggregate Bond Index and the Conservative Blended Index**, which returned 2.72% and 0.83%, respectively.
The Wilmington Strategic Allocation Conservative Fund is managed by first replicating tactical asset allocation decisions made by the Wilmington Trust Investment Advisors, Inc. Investment Committee and then overlaying upon the asset allocation framework, active and passive managers that are closely benchmarked against the tactical asset allocations. The portfolio managers seek to add value through the combination of tactical asset allocation and manager selection. The primary focus of the portfolio managers is in beating the Conservative Blended Index.
Over the past year, the Class I Shares underperformed the Conservative Blended Index by 2.07%. During the period, tactical decisions contributed to relative performance, while underlying manager performance and fees caused the Fund to lag the benchmark. During the fiscal year, markets expressed tumult in reaction to the opaque path of U.S. interest rate hikes, a weakening Chinese economy and dramatic price reductions in energy. The Eurozone continued to face the threat of deflation despite a modicum of economic stability in key member countries and its persistent application of Quantitative Easing.
The Conservative Fund, irrespective of the macro malaise and global uncertainty, found value in tactical rotation amongst perceived undervalued assets. Positive relative performance was largely relegated to having no position in the faltering energy and commodity space, carving out an international small cap position from our ACWI Ex-US exposure and U.S. equity growth style decisions. Allocation performance detractors featured once additive positions such as a zero weight to international debt and a fixed income allocation to floating rate bank loans.
Performance of the active managers utilized by the Fund was negative for the year, driven primarily by positions in large cap growth managers Morgan Stanley and T. Rowe Price, which were each negatively affected by a sell-off in large technology names.
| * | Performance data quoted represents past performance, which is no guarantee of future results. Investment return and principal value will fluctuate so that an investor’s shares, when redeemed, may be worth more or less than their original cost. Mutual Funds are not obligations of or guaranteed by any bank and are not federally insured. The total return shown assumes the reinvestment of all distributions and does not reflect the deduction of taxes that a shareholder would pay on fund distributions or the redemption of shares. The total return for Class I Shares was -6.93%, adjusted for the Fund’s maximum sales charge of 5.50%. Mutual fund performance changes over time and current performance may be lower or higher than what is stated. For the most recent month-end performance, please visit www.wilmingtonfunds.com or call 1-800-836-2211. |
| ** | The Barclays US Aggregate Bond Index is an index measuring both the capital price changes and income provided by the underlying universe of securities, comprised of U.S. Treasury obligations, U.S. investment grade corporate debt and mortgage backed obligations. The Conservative Blended Index is calculated by the investment advisor and as of April 1, 2016 represents the weighted returns for the following indices: 14.2% Russell 1000 Index; 2.1% Russell 2000 Index; 5.2% MSCI EAFE Index; 1.0% MSCI Emerging Markets Index; 15.0% HFRI Fund of Funds Composite Index; 54.5% Barclays US Aggregate Bond Index; 2.0% Barclays US Corporate High Yield Bond Index; 2.5% Dow Jones Global ex-US Select Real Estate Securities Index; 0.75% S&P US REIT Index; 0.75% Barclays US Government Inflation-Linked Bond Index; and 2.0% Ibbotson Associates SBBI 30-Day US T-Bill Index. Prior to April 1, 2016, the Conservative Blended Index represented the weighted returns for the following indices: 53% Barclays US Aggregate Bond Index; 7.5% HFRX Absolute Index; 7.5% HFRX Global Index; 7.2% Russell 3000 Index; 7% Barclays Global Aggregate ex-US (unhedged)Index; 5% Barclays World Government Inflation-Linked Bond Index (hedged USD); 4.8% MSCI All Country World ex-US Investable Market Index (Net, USD); 3.5% S&P Global Developed Property Index; 1.5% Bloomberg Commodity Index; and 3% Citigroup 3-Month T-Bill Index. The indices are unmanaged and it is not possible to invest directly in an index. |
Quantitative Easing (“QE”) is government monetary policy occasionally used to increase the money supply by buying government securities or other securities from the market. Quantitative easing increases the money supply by flooding the financial institutions with capital, in an effort to promote increased lending and liquidity. |
International investing involves special risks including currency risk, political risks, increased volatility of foreign securities, and differences in auditing and other financial standards. |
Bond prices are sensitive to changes in interest rates and a rise in short-term interest rates could cause a decline in bond prices. |
Due to its strategy of investing in other mutual funds, this Fund may incur certain additional expenses and tax results that would not be present with a direct investment in the underlying funds. |
April 30, 2016 (unaudited) / ANNUAL REPORT
9
WILMINGTON STRATEGIC ALLOCATION CONSERVATIVE FUND
The graphs below illustrate the hypothetical investment of $10,0001 in the Class A Shares and $1,000,0001 in the Class I Shares of the Wilmington Strategic Allocation Conservative Fund from April 30, 2006 to April 30, 2016, compared to the Barclays US Aggregate Bond Index2 and the Conservative Blended Index.2,3,4
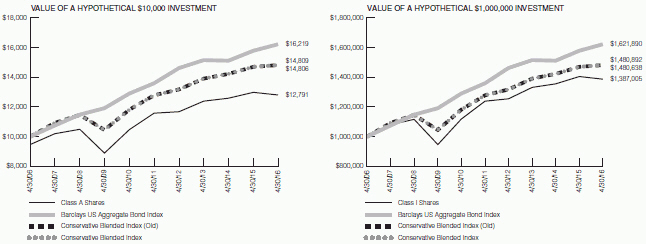
Performance data quoted represents past performance, which is no guarantee of future results. Investment return and principal value will fluctuate so that an investor’s shares, when redeemed, may be worth more or less than their original cost. Mutual Funds are not obligations of or guaranteed by any bank and are not federally insured. The total return shown assumes the reinvestment of all distributions and does not reflect the deduction of taxes that a shareholder would pay on fund distributions or the redemption of shares. The total return for Class I Shares was -6.93%, adjusted for the Fund’s maximum sales charge of 5.50%. Mutual fund performance changes over time and current performance may be lower or higher than what is stated. For the most recent month-end performance, please visit www.wilmingtonfunds.com or call 1-800-836-2211.
| Average Annual Total Returns for the Periods Ended 4/30/16 | ||||||||||||
|
| 1 Year
|
|
| 5 Years
|
|
| 10 Years
|
| ||||
Class A^
|
|
-6.93%
|
|
|
0.87%
|
|
|
2.49%
|
| |||
Class I^
|
|
-1.24%
|
|
|
2.29%
|
|
|
3.33%
|
| |||
Barclays US Aggregate Bond Index2
|
|
2.72%
|
|
|
3.60%
|
|
|
4.95%
|
| |||
Conservative Blended Index (Old)2,3
|
|
0.81%
|
|
|
3.00%
|
|
|
4.00%
|
| |||
Conservative Blended Index2,4
|
|
0.83%
|
|
|
3.00%
|
|
|
4.00%
|
| |||
^Expense Ratios Before Waivers and Expense Ratios After Waivers for Class A are 2.04% and 1.44%, respectively. Expense Ratios Before Waivers and Expense Ratios After Waivers for Class I are 1.79% and 1.19%, respectively. Expense Ratios Before Waiver represent the operating costs borne by the Fund, expressed as a percentage of the Fund’s average net assets, as shown in the Fees and Expenses table in the Fund’s current prospectus (under “Total Annual Fund Operating Expenses”). Current information regarding the Fund’s Operating Expenses can be found in the Fund’s Financial Highlights.
| 1 | Represents a hypothetical investment of $10,000 in Class A of the Fund after deducting the maximum sales charge of 5.50% ($10,000 investment minus $550 sales charge = $9,450) and a hypothetical investment of $1,000,000 in Class I of the Fund and assumes the reinvestment of all dividends and distributions. |
| 2 | The performance for the Barclays US Aggregate Bond Index and the Conservative Blended Index assumes the reinvestment of all dividends and distributions but does not reflect the deduction of a sales charge required for the Fund’s performance by the Securities and Exchange Commission. It is not possible to invest directly in an index and the represented indices are unmanaged. |
| 3 | The Conservative Blended Index (Old) was based on a weighting of the following indices: 53% Barclays US Aggregate Bond Index; 7.5% HFRX Absolute Index; 7.5% HFRX Global Index; 7.2% Russell 3000 Index; 7% Barclays Global Aggregate ex-US (unhedged) Index; 5% Barclays World Government Inflation-Linked Bond Index (hedged USD); 4.8% MSCI All Country World ex-US Investable Market Index (Net, USD); 3.5% S&P Global Developed Property Index; 1.5% Bloomberg Commodity Index; and 3% Citigroup 3-Month T-Bill Index. |
ANNUAL REPORT / April 30, 2016 (unaudited)
10
| 4 | The Conservative Blended Index is based on the weightings of the following indices: 14.2% Russell 1000 Index; 2.1% Russell 2000 Index; 5.2% MSCI EAFE Index; 1.0% MSCI Emerging Markets Index; 15.0% HFRI Fund of Funds Composite Index; 54.5% Barclays US Aggregate Bond Index; 2.0% Barclays US Corporate High Yield Bond Index; 2.5% Dow Jones Global ex-US Select Real Estate Securities Index; 0.75% S&P US REIT Index; 0.75% Barclays US Government Inflation-Linked Bond Index; and 2.0% Ibbotson Associates SBBI 30-Day US T-Bill Index. Prior to April 1, 2016, the Conservative Blended Index used the performance history of the Conservative Blended Index (Old). |
April 30, 2016 (unaudited) / ANNUAL REPORT
11
WILMINGTON STRATEGIC ALLOCATION MODERATE FUND
Management’s Discussion of Fund Performance
For the fiscal year ended April 30, 2016, the Wilmington Strategic Allocation Moderate Fund (the “Fund”) had a total return of -3.70%* for Class A Shares and -3.42%* for Class I Shares, versus its current benchmarks, the Russell 3000 Index, Barclays US Aggregate Bond Index, and the Moderate Blended Index**, which had total returns of -0.18%, 2.72%, and -1.48%, respectively.
The Fund is managed by first replicating tactical asset allocation decisions made by the Wilmington Trust Investment Advisors, Inc. Investment Committee and then overlaying upon the asset allocation framework, active and passive managers that are closely benchmarked against the tactical asset allocations. The portfolio managers seek to add value through the combination of tactical asset allocation and manager selection. The primary focus of the portfolio managers is in beating the Moderate Blended Index.
Over the past year, the Class I Shares underperformed the Moderate Blended Index by 1.94%. During the period, tactical decisions contributed to relative performance, while underlying manager performance and fees caused the Fund to lag the benchmark. During the fiscal year, markets expressed tumult in reaction to the opaque path of U.S. interest rate hikes, a weakening Chinese economy and dramatic price reductions in energy. The Eurozone continued to face the threat of deflation despite a modicum of economic stability in key member countries and its persistent application of Quantitative Easing.
Performance of the active managers utilized by the Fund was negative for the year, driven primarily by positions in large cap growth managers Morgan Stanley and T. Rowe Price, which were each negatively affected by a sell-off in large technology names.
| * | Performance data quoted represents past performance, which is no guarantee of future results. Investment return and principal value will fluctuate so that an investor’s shares, when redeemed, may be worth more or less than their original cost. Mutual Funds are not obligations of or guaranteed by any bank and are not federally insured. The total return shown assumes the reinvestment of all distributions and does not reflect the deduction of taxes that a shareholder would pay on fund distributions or the redemption of shares. The total return for Class A Shares was -9.00%, adjusted for the Fund’s maximum sales charge of 5.50%. Mutual fund performance changes over time and current performance may be lower or higher than what is stated. For the most recent month-end performance, please visit www.wilmingtonfunds.com or call 1-800-836-2211. |
| ** | The Russell 3000 Index measures the performance of the largest 3,000 U.S. companies representing approximately 98% of the investable U.S. equity market. Barclays US Aggregate Bond Index is an index measuring both the capital price changes and income provided by the underlying universe of securities, comprised of U.S. Treasury obligations, U.S. investment grade corporate debt and mortgage backed obligations. The Moderate Blended Index is calculated by the investment advisor and as of April 1, 2016 represents the weighted returns for the following indices: 27.0% Russell 1000 Index; 6.7% Russell 2000 Index; 12.5% MSCI EAFE Index; 4.4% MSCI Emerging Markets Index; 12.5% HFRI Fund of Funds Composite Index; 28.9% Barclays US Aggregate Bond Index; 2.0% Barclays US Corporate High Yield Bond Index; 2.5% Dow Jones Global ex-US Select Real Estate Securities Index; 0.75% S&P US REIT Index; 0.75% Barclays US Government Inflation-Linked Bond Index; and 2.0% Ibbotson Associates SBBI 30-Day US T-Bill Index. Prior to April 1, 2016, the Moderate Blended Index represented the weighted returns for the following indices: 27% Russell 3000 Index; 20% Barclays US Aggregate Bond Index; 18% MSCI All Country World ex-US Investable Market Index (Net, USD); 7.5% HFRX Absolute Index; 7.5% HFRX Global Index; 7% Barclays Global Aggregate ex-US (unhedged) Index; 5% Barclays World Government Inflation-Linked Bond Index (hedged USD); 3.5% S&P Global Developed Property Index; 1.5% Bloomberg Commodity Index; and 3% Citigroup 3-Month T-Bill Index. The performance of the MSCIACWI ex-US Investable Market Index (Net, USD) is reduced by the taxes on dividends paid by the international securities issuers in the index. The indices are unmanaged and it is not possible to invest directly in an index. |
Quantitative Easing (“QE”) is government monetary policy occasionally used to increase the money supply by buying government securities or other securities from the market. Quantitative easing increases the money supply by flooding the financial institutions with capital, in an effort to promote increased lending and liquidity. |
International investing involves special risks including currency risk, political risks, increased volatility of foreign securities, and differences in auditing and other financial standards. |
Bond prices are sensitive to changes in interest rates and a rise in short-term interest rates could cause a decline in bond prices. |
Due to its strategy of investing in other mutual funds, this Fund may incur certain additional expenses and tax results that would not be present with a direct investment in the underlying funds. |
ANNUAL REPORT / April 30, 2016 (unaudited)
12
WILMINGTON STRATEGIC ALLOCATION MODERATE FUND
The graphs below illustrate the hypothetical investment of $10,0001 in the Class A Shares and $1,000,0001 in the Class I Shares of the Wilmington Strategic Allocation Moderate Fund from April 30, 2006 to April 30, 2016 and June 11, 2010 (start of performance) to April 30, 2016, respectively, compared to the Russell 3000 Index2, the Barclays US Aggregate Bond Index2 and the Moderate Blended Index.2,3,4
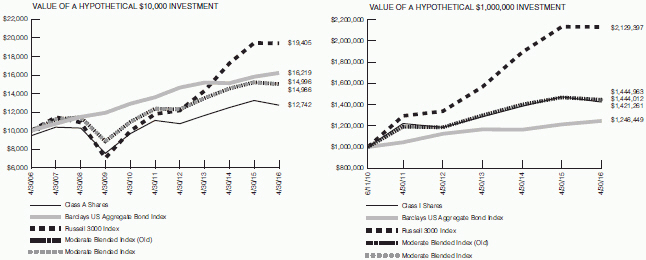
Performance data quoted represents past performance, which is no guarantee of future results. Investment return and principal value will fluctuate so that an investor’s shares, when redeemed, may be worth more or less than their original cost. Mutual Funds are not obligations of or guaranteed by any bank and are not federally insured. The total return shown assumes the reinvestment of all distributions and does not reflect the deduction of taxes that a shareholder would pay on fund distributions or the redemption of shares. The total return for Class A Shares was -9.00%, adjusted for the Fund’s maximum sales charge of 5.50%. Mutual fund performance changes over time and current performance may be lower or higher than what is stated. For the most recent month-end performance, please visit www.wilmingtonfunds.com or call 1-800-836-2211.
| Average Annual Total Returns for the Periods Ended 4/30/16 | ||||||||||||
|
| 1 Year
|
|
| 5 Years
|
|
| 10 Years
|
| ||||
Class A^
|
| -9.00%
|
|
| 1.66%
|
|
| 2.45%5
|
| |||
Class I^
|
|
-3.42%
|
|
|
3.09%
|
|
|
6.16%5
|
| |||
Barclays US Aggregate Bond Index2
|
|
2.72%
|
|
|
3.60%
|
|
|
4.95%
|
| |||
Russell 3000 Index2
|
|
-0.18%
|
|
|
10.50%
|
|
|
6.85%
|
| |||
Moderate Blended Index (Old)2,3
|
|
-1.42%
|
|
|
3.97%
|
|
|
4.14%
|
| |||
Moderate Blended Index2,4
|
|
-1.48%
|
|
|
3.96%
|
|
|
4.13%
|
| |||
^Expense Ratios Before Waivers and Expense Ratios After Waivers for Class A are 2.04% and 1.38%, respectively. Expense Ratios Before Waivers and Expense Ratios After Waivers for Class I are 1.79% and 1.13%, respectively. Expense Ratios Before Waiver represent the operating costs borne by the Fund, expressed as a percentage of the Fund’s average net assets, as shown in the Fees and Expenses table in the Fund’s current prospectus (under “Total Annual Fund Operating Expenses”). Current information regarding the Fund’s Operating Expenses can be found in the Fund’s Financial Highlights.
| 1 | Represents a hypothetical investment of $10,000 in Class A of the Fund after deducting the maximum sales charge of 5.50% ($10,000 investment minus $550 sales charge = $9,450) and a hypothetical investment of $1,000,000 in Class I of the Fund and assumes the reinvestment of all dividends and distributions. |
| 2 | The performance for the Russell 3000 Index, the Barclays US Aggregate Bond Index and the Moderate Blended Index assumes the reinvestment of all dividends and distributions but does not reflect the deduction of a sales charge required for the Fund’s performance by the Securities and Exchange Commission. It is not possible to invest directly in an index and the represented indices are unmanaged. |
| 3 | The Moderate Blended Index (Old) was based on a weighting of the following indices: 27% Russell 3000 Index; 20% Barclays U.S. |
April 30, 2016 (unaudited) / ANNUAL REPORT
13
| Aggregate Bond Index; 18% MSCI All Country World ex-US Investable Market Index (Net, USD); 7.5% HFRX Absolute Index; 7.5% HFRX Global Index; 7% Barclays Global Aggregate ex-US (unhedged) Index; 5% Barclays World Government Inflation-Linked Bond Index (hedged USD); 3.5% S&P Global Developed Property Index; 1.5% Bloomberg Commodity Index; and 3% Citigroup 3-Month T-Bill Index. |
| 4 | The Moderate Blended Index is based on the weighted returns of the following indices: 27.0% Russell 1000 Index; 6.7% Russell 2000 Index; 12.5% MSCI EAFE Index; 4.4% MSCI Emerging Markets Index (Net, USD); 12.5% HFRI Fund of Funds Composite Index; 28.9% Barclays US Aggregate Bond Index; 2.0% Barclays US Corporate High Yield Bond Index; 2.5% Dow Jones Global ex-US Select Real Estate Securities Index; 0.75% S&P US REIT Index; 0.75% Barclays US Government Inflation-Linked Bond Index; and 2.0% Ibbotson Associates SBBI 30-Day US T-Bill Index. Prior to April 1, 2016, the Moderate Blended Index used the performance history of the Moderate Blended Index (Old). |
| 5 | Represents the average total return for Class A Shares and Class I Shares from April 30, 2006 to April 30, 2016 and June 11, 2010 (start of performance) to April 30, 2016, respectively. |
ANNUAL REPORT / April 30, 2016 (unaudited)
14
WILMINGTON STRATEGIC ALLOCATION AGGRESSIVE FUND
Management’s Discussion of Fund Performance
For the fiscal year ended April 30, 2016, the Wilmington Strategic Allocation Aggressive Fund (the “Fund”) had a total return of -5.32%* for Class A Shares and -5.01%* for Class I Shares, versus its benchmarks, the Russell 3000 Index**, MSCI All Country World ex-US Investable Market Index**, and the Aggressive Blended Index**, which returned -0.18%, -10.28%, and -4.04%, respectively.
The Wilmington Strategic Allocation Aggressive Fund is managed by first replicating tactical asset allocation decisions made by the Wilmington Trust Investment Advisors, Inc. Investment Committee and then overlaying upon the asset allocation framework, active and passive managers that are closely benchmarked against the tactical asset allocations. The portfolio managers seek to add value through the combination of tactical asset allocation and manager selection. The primary focus of the portfolio managers is in beating the Aggressive Blended Index.
Over the past year, the Class I Shares underperformed the Aggressive Blended Index by 0.97%. During the period, tactical decisions contributed to relative performance, while underlying manager performance and fees caused the Fund to lag the benchmark. During the fiscal year, markets expressed tumult in reaction to the opaque path of U.S. interest rate hikes, a weakening Chinese economy and dramatic price reductions in energy. The Eurozone continued to face the threat of deflation despite a modicum of economic stability in key member countries and its persistent application of Quantitative Easing.
The Aggressive Fund, irrespective of the macro malaise and global uncertainty, found value in tactical rotation amongst perceived undervalued assets. Positive relative performance was largely relegated to having no position in the faltering energy and commodity space, carving out an international small-cap position from our ACWI Ex-US exposure and U.S. equity growth style decisions.
Performance of the active managers utilized by the Fund was negative for the year, driven primarily by positions in large-cap growth managers Morgan Stanley and T. Rowe Price, which were each negatively affected by a sell-off in large technology names.
| * | Performance data quoted represents past performance, which is no guarantee of future results. Investment return and principal value will fluctuate so that an investor’s shares, when redeemed, may be worth more or less than their original cost. Mutual Funds are not obligations of or guaranteed by any bank and are not federally insured. The total return shown assumes the reinvestment of all distributions and does not reflect the deduction of taxes that a shareholder would pay on fund distributions or the redemption of shares. The total return for Class A Shares was |
| ** | The Russell 3000 Index measures the performance of the largest 3,000 U.S. companies representing approximately 98% of the investable U.S. equity market. MSCI All Country World ex-US Index (ACWI ex-US) is a free float-adjusted market capitalization weighted index that is designed to measure the large-cap and mid-cap equity market performance of developed and emerging markets excluding the U.S. market. The MSCI All Country World ex-US Investable Market Index (ACWI IMI ex-US) is designed to also include the small-cap equity market performance which is not included in the ACWI ex-US. The ACWI ex-US and ACWI IMI ex-US Indices consisted of 45 country indices comprising 22 developed and 23 emerging market country indices. The Aggressive Blended Index is calculated by the investment advisor and as of April 1, 2016 represents the weighted returns for the following indices: 37.0% Russell 1000 Index; 14.8% Russell 2000 Index; 23.1% MSCI EAFE Index; 11.6% MSCI Emerging Markets Index; 7.5% HFRI Fund of Funds Composite Index; 2.5% Dow Jones Global ex-US Select Real Estate Securities Index; 0.75% S&P US REIT Index; 0.75% Barclays US Government Inflation-Linked Bond Index; and 2.0% Ibbotson Associates SBBI 30-Day US T-Bill Index. Prior to April 1, 2016 the Aggressive Blended Index represented the weighted returns for the following indices: 48% Russell 3000 Index; 32% MSCI All Country World ex-US Investable Market Index; 7% HFRX Global Index; 5% Barclays World Government Inflation-Linked Bond Index (hedged USD); 3.5% S&P Global Developed Property Index; 1.5% Bloomberg Commodity Index; and 3% Citigroup 3-Month T-Bill Index. The performance of the MSCI ACWI ex-US Investable Market Index (Net, USD) is reduced by the taxes on dividends paid by the international securities issuers in the index. The indices are unmanaged and it is not possible to invest directly in an index. |
International investing involves special risks including currency risk, political risks, increased volatility of foreign securities, and differences in auditing and other financial standards. |
Quantitative Easing (“QE”) is government monetary policy occasionally used to increase the money supply by buying government securities or other securities from the market. Quantitative easing increases the money supply by flooding the financial institutions with capital, in an effort to promote increased lending and liquidity. |
Bond prices are sensitive to changes in interest rates and a rise in short-term interest rates could cause a decline in bond prices. |
Due to its strategy of investing in other mutual funds, this Fund may incur certain additional expenses and tax results that would not be present with a direct investment in the underlying funds. |
April 30, 2016 (unaudited) / ANNUAL REPORT
15
WILMINGTON STRATEGIC ALLOCATION AGGRESSIVE FUND
The graphs below illustrate the hypothetical investment of $10,0001 in the Class A Shares and $1,000,0001 in the Class I Shares of the Wilmington Strategic Allocation Aggressive Fund from April 30, 2006 to April 30, 2016, compared to the Russell 3000 Index2, MSCI All Country World ex-US Investable Market Index (Net, USD)2 and the Aggressive Blended Index.2,3,4
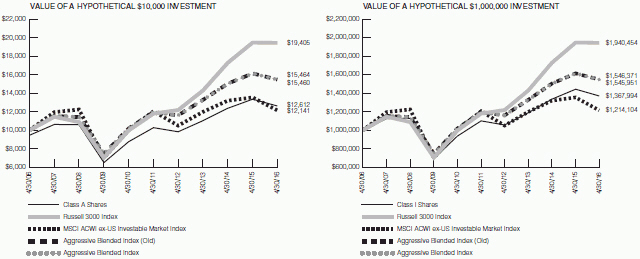
Performance data quoted represents past performance, which is no guarantee of future results. Investment return and principal value will fluctuate so that an investor’s shares, when redeemed, may be worth more or less than their original cost. Mutual Funds are not obligations of or guaranteed by any bank and are not federally insured. The total return shown assumes the reinvestment of all distributions and does not reflect the deduction of taxes that a shareholder would pay on fund distributions or the redemption of shares. The total return for Class A Shares was -10.54%, adjusted for the Fund’s maximum sales charge of 5.50%. Mutual fund performance changes over time and current performance may be lower or higher than what is stated. For the most recent month-end performance, please visit www.wilmingtonfunds.com or call 1-800-836-2211.
| Average Annual Total Returns for the Periods Ended 4/30/16 | ||||||||||||
|
| 1 Year
|
|
| 5 Years
|
|
| 10 Years
|
| ||||
Class A^
|
|
-10.54%
|
|
|
3.03%
|
|
|
2.35%
|
| |||
Class I^
|
|
-5.01%
|
|
|
4.48%
|
|
|
3.18%
|
| |||
Russell 3000 Index2
|
|
-0.18%
|
|
|
10.50%
|
|
|
6.85%
|
| |||
MSCI ACWI ex-US Investable Market Index (Net, USD)2
|
|
-10.28%
|
|
|
0.15%
|
|
|
1.96%
|
| |||
Aggressive Blended Index (Old)2,3
|
|
-4.01%
|
|
|
5.32%
|
|
|
4.46%
|
| |||
Aggressive Blended Index2,4
|
|
-4.04%
|
|
|
5.31%
|
|
|
4.45%
|
| |||
^Expense Ratios Before Waivers and Expense Ratios After Waivers for Class A are 2.22% and 1.67%, respectively. Expense Ratios Before Waivers and Expense Ratios After Waivers for Class I are 1.97% and 1.42%, respectively. Expense Ratios Before Waiver represent the operating costs borne by the Fund, expressed as a percentage of the Fund’s average net assets, as shown in the Fees and Expenses table in the Fund’s current prospectus (under “Total Annual Fund Operating Expenses”). Current information regarding the Fund’s Operating Expenses can be found in the Fund’s Financial Highlights.
| 1 | Represents a hypothetical investment of $10,000 in Class A of the Fund after deducting the maximum sales charge of 5.50% ($10,000 investment minus $550 sales charge = $9,450) and a hypothetical investment of $1,000,000 in Class I of the Fund and assumes the reinvestment of all dividends and distributions. |
| 2 | The performance for the Russell 3000 Index, MSCI All Country World ex-US Investable Market Index and the Aggressive Blended Index assumes the reinvestment of all dividends and distributions but does not reflect the deduction of a sales charge required for the Fund’s performance by the Securities and Exchange Commission. The performance of the MSCI ACWI ex-US Investable Market Index (Net, USD) is reduced by the taxes on dividends paid by the international securities issuers in the index. It is not possible to invest directly in an index and the represented indices are unmanaged. |
ANNUAL REPORT / April 30, 2016 (unaudited)
16
| 3 | The Aggressive Blended Index (Old) was based on a weighting of the following indices: 48% Russell 3000 Index; 32% MSCI All Country World ex-US Investable Market Index (Net, USD); 7% HFRX Global Index; 5% Barclays World Government Inflation-Linked Bond Index (hedged USD); 3.5% S&P Global Developed Property Index; 1.5% Bloomberg Commodity Index; and 3% Citigroup 3-Month T-Bill Index. |
| 4 | The Aggressive Blended Index is based on the weighted returns of the following indices: 37.0% Russell 1000 Index; 14.8% Russell 2000 Index; 23.1% MSCI EAFE Index; 11.6% MSCI Emerging Markets Index; 7.5% HFRI Fund of Funds Composite Index; 2.5% Dow Jones Global ex-US Select Real Estate Securities Index; 0.75% S&P US REIT Index; 0.75% Barclays US Government Inflation-Linked Bond Index; and 2.0% Ibbotson Associates SBBI 30-Day US T-Bill Index. Prior to April 1, 2016, the Aggressive Blended Index used the performance history of the Aggressive Blended Index (Old). |
April 30, 2016 (unaudited) / ANNUAL REPORT
17
As a shareholder of the Funds, you incur two types of costs: (1) transaction costs, including sales charges (loads) on purchase payments, reinvested dividends, or other distributions; and redemption fees; and (2) ongoing costs, including management fees; distribution and/or service (12b-1) fees; and other Fund expenses. This Example is intended to help you to understand your ongoing costs (in dollars) of investing in the Funds and to compare these costs with the ongoing costs of investing in other mutual funds. It is based on an investment of $1,000 invested at the beginning of the period and held for the entire period from November 1, 2015 to April 30, 2016.
Actual Expenses
This section of the following table provides information about actual account values and actual expenses. You may use the information in this section, together with the amount you invested, to estimate the expenses that you incurred over the period. Simply divide your account value by $1,000 (for example, an $8,600 account value divided by $1,000 = 8.6), then multiply the result by the number in the first section under the heading entitled “Expenses Paid During Period” to estimate the expenses attributable to your investment during this period.
Hypothetical Example for
Comparison Purposes
This section of the following table provides information about hypothetical account values and hypothetical expenses based on the Funds’ actual expense ratios and assumed rates of return of 5% per year before expenses, which is not the Funds’ actual returns. Thus, you should not use the hypothetical account values and expenses to estimate the actual ending account balance or your expenses for the period. Rather, these figures are required to be provided to enable you to compare the ongoing costs of investing in the Funds with other funds. To do so, compare this 5% hypothetical example with the 5% hypothetical examples that appear in the shareholder reports of the other funds.
Please note that the expenses shown in the table are meant to highlight your ongoing costs only. Therefore, the Annualized Net Expense Ratio section of the table is useful in comparing ongoing costs only, and will not help you determine the relative total costs of owning different funds.
| Beginning Account Value 11/01/15 | Ending Account Value 4/30/16 | Expenses Paid During Period1 | Annualized Net Expense Ratio2 | |||||
WILMINGTON MULTI-MANAGER INTERNATIONAL FUND | ||||||||
Actual | ||||||||
Class A | $1,000.00 | $ 990.20 | $ 6.48 | 1.31% | ||||
Class I | $1,000.00 | $ 990.30 | $ 5.84 | 1.18% | ||||
Hypothetical (assuming a 5% return before expense) | ||||||||
Class A | $1,000.00 | $1,018.35 | $ 6.57 | 1.31% | ||||
Class I | $1,000.00 | $1,019.00 | $ 5.92 | 1.18% | ||||
WILMINGTON MULTI-MANAGER ALTERNATIVES FUND3 | ||||||||
Actual | ||||||||
Class A | $1,000.00 | $ 945.20 | $11.99 | 2.48% | ||||
Class I | $1,000.00 | $ 946.00 | $10.84 | 2.24% | ||||
Hypothetical (assuming a 5% return before expense) | ||||||||
Class A | $1,000.00 | $1,012.53 | $12.41 | 2.48% | ||||
Class I | $1,000.00 | $1,013.72 | $11.22 | 2.24% | ||||
WILMINGTON MULTI-MANAGER REAL ASSET FUND | ||||||||
Actual | ||||||||
Class A | $1,000.00 | $1,016.30 | $ 6.22 | 1.24% | ||||
Class I | $1,000.00 | $1,018.30 | $ 4.92 | 0.98% | ||||
Hypothetical (assuming a 5% return before expense) | ||||||||
Class A | $1,000.00 | $1,018.70 | $ 6.22 | 1.24% | ||||
Class I | $1,000.00 | $1,019.99 | $ 4.92 | 0.98% | ||||
| WILMINGTON STRATEGIC ALLOCATION CONSERVATIVE FUND | ||||||||
Actual | ||||||||
Class A | $1,000.00 | $1,004.80 | $ 3.89 | 0.78% | ||||
Class I | $1,000.00 | $1,006.10 | $ 2.64 | 0.53% | ||||
Hypothetical (assuming a 5% return before expense) | ||||||||
Class A | $1,000.00 | $1,020.98 | $ 3.92 | 0.78% | ||||
Class I | $1,000.00 | $1,022.23 | $ 2.66 | 0.53% | ||||
ANNUAL REPORT / April 30, 2016 (unaudited)
18
| Beginning Account Value 11/01/15 | Ending Account Value 4/30/16 | Expenses Paid During Period1 | Annualized Net Expense Ratio2 | |||||
| WILMINGTON STRATEGIC ALLOCATION MODERATE FUND | ||||||||
Actual | ||||||||
Class A | $1,000.00 | $ 992.80 | $3.67 | 0.74% | ||||
Class I | $1,000.00 | $ 993.50 | $2.43 | 0.49% | ||||
Hypothetical (assuming a 5% return before expense) | ||||||||
Class A | $1,000.00 | $1,021.18 | $3.72 | 0.74% | ||||
Class I | $1,000.00 | $1,022.43 | $2.46 | 0.49% | ||||
| WILMINGTON STRATEGIC ALLOCATION AGGRESSIVE FUND | ||||||||
Actual | ||||||||
Class A | $1,000.00 | $ 984.40 | $4.29 | 0.87% | ||||
Class I | $1,000.00 | $ 986.00 | $3.06 | 0.62% | ||||
Hypothetical (assuming a 5% return before expense) | ||||||||
Class A | $1,000.00 | $1,020.54 | $4.37 | 0.87% | ||||
Class I | $1,000.00 | $1,021.78 | $3.12 | 0.62% | ||||
| (1) | Expenses are equal to the Funds’ annualized net expense ratios, multiplied by the average account value over the period, multiplied by 182/366 (to reflect the most recent one-half year period). |
| (2) | Expense ratio does not reflect the indirect expenses of the underlying funds it invests in. |
| (3) | For Multi-Manager Alternatives Fund, the expense ratio includes the impact of the dividend expense on securities sold short. |
April 30, 2016 (unaudited) / ANNUAL REPORT
19
PORTFOLIO OF INVESTMENTS SUMMARY TABLE
Wilmington Multi-Manager International Fund
At April 30, 2016, the Fund’s sector classifications and country allocations were as follows (unaudited):
| Common Stocks | Percentage of Total Net Assets | ||||
Financials | 15.5 | % | |||
Consumer Discretionary | 11.5 | % | |||
Industrials | 11.2 | % | |||
Consumer Staples | 10.9 | % | |||
Materials | 10.8 | % | |||
Health Care | 8.8 | % | |||
Information Technology | 6.8 | % | |||
Energy | 6.1 | % | |||
Telecommunication Services | 5.4 | % | |||
Utilities | 2.1 | % | |||
Real Estate Development | 0.2 | % | |||
Retail | 0.1 | % | |||
Entertainment | 0.1 | % | |||
Commercial Services & Supplies | 0.1 | % | |||
Diversified Financial Services | 0.0 | %3 | |||
Transportation | 0.0 | %3 | |||
| Real Estate Investment Trusts | 0.8 | % | |||
| Preferred Stocks | 0.4 | % | |||
| Certificates | 0.1 | % | |||
| Investment Companies | 0.0 | %3 | |||
| Rights | 0.0 | %3 | |||
| Cash Equivalents1 | 9.1 | % | |||
| Other Assets and Liabilities – Net2 | 0.0 | %3 | |||
|
| ||||
| TOTAL | 100.0 | % | |||
|
| ||||
| (1) | Cash Equivalents include investments in a money market fund and repurchase agreements. |
| (2) | Assets, other than investments in securities, less liabilities. See Statements of Assets and Liabilities. |
| (3) | Represents less than 0.05%. |
| Country Allocation | Percentage of Total Net Assets | ||||
Common Stocks | |||||
Japan | 15.6 | % | |||
United Kingdom | 12.3 | % | |||
France | 8.6 | % | |||
Germany | 8.5 | % | |||
Switzerland | 6.4 | % | |||
Australia | 4.9 | % | |||
Spain | 3.9 | % | |||
Canada | 3.4 | % | |||
United States | 2.6 | % | |||
China | 2.2 | % | |||
Netherlands | 2.1 | % | |||
Belgium | 1.9 | % | |||
Sweden | 1.8 | % | |||
Denmark | 1.4 | % | |||
Hong Kong | 1.4 | % | |||
Finland | 1.0 | % | |||
Norway | 1.0 | % | |||
All other countries less than 1.0% | 10.6 | % | |||
Real Estate Investment Trusts | 0.8 | % | |||
| Preferred Stocks | 0.4 | % | |||
| Certificates | 0.1 | % | |||
| Investment Companies | 0.0 | %3 | |||
| Rights | 0.0 | %3 | |||
| Cash Equivalents1 | 9.1 | % | |||
| Other Assets and Liabilities – Net2 | 0.0 | %3 | |||
|
| ||||
| TOTAL | 100.0 | % | |||
|
| ||||
April 30, 2016
| Description | Number of Shares | Value | ||||||
| COMMON STOCKS – 89.6% | ||||||||
AUSTRALIA – 4.9% | ||||||||
a2 Milk Co Ltd#, * | 81,200 | $ | 100,354 | |||||
Arrium Ltd.* | 532,800 | 8,913 | ||||||
Asaleo Care Ltd. | 179,000 | 268,123 | ||||||
Asciano Ltd. | 22,614 | 151,828 | ||||||
Aurizon Holdings Ltd. | 17,958 | 58,304 | ||||||
Australia & New Zealand Banking Group Ltd. | 29,469 | 543,813 | ||||||
Bank of Queensland Ltd. | 2,985 | 25,534 | ||||||
| Description | Number of Shares | Value | ||||||
Bendigo & Adelaide Bank Ltd. | 27,500 | $ | 194,878 | |||||
BHP Billiton Ltd. | 201,114 | 3,162,334 | ||||||
BHP Billiton PLC ADR# | 3,397 | 93,655 | ||||||
BlueScope Steel Ltd. | 217,600 | 1,070,479 | ||||||
Boart Longyear Ltd.* | 48,400 | 3,459 | ||||||
Boral Ltd. | 5,293 | 25,918 | ||||||
Caltex Australia Ltd. | 111,687 | 2,759,947 | ||||||
Challenger Ltd. | 44,000 | 299,761 | ||||||
Cochlear Ltd. | 4,800 | 394,276 | ||||||
CYBG PLC* | 3,161 | 10,335 | ||||||
ANNUAL REPORT / April 30, 2016
20 PORTFOLIOS OF INVESTMENTS
Wilmington Multi-Manager International Fund (continued)
| Description | Number of Shares | Value | ||||||
Domino’s Pizza Enterprises L | 13,000 | $ | 612,943 | |||||
Downer EDI Ltd. | 40,700 | 115,120 | ||||||
Evolution Mining Ltd. | 167,400 | 249,475 | ||||||
Fortescue Metals Group Ltd.# | 27,753 | 71,958 | ||||||
Incitec Pivot Ltd. | 20,781 | 50,879 | ||||||
LendLease Group | 27,700 | 267,484 | ||||||
Macquarie Group Ltd. | 7,525 | 363,325 | ||||||
McMillan Shakespeare Ltd. | 23,900 | 223,157 | ||||||
Metcash Ltd.#, * | 42,500 | 56,874 | ||||||
Mineral Resources Ltd. | 24,300 | 136,911 | ||||||
National Australia Bank Ltd. | 12,646 | 261,443 | ||||||
Newcrest Mining Ltd.* | 198,124 | 2,857,717 | ||||||
Orica Ltd. | 12,966 | 150,839 | ||||||
Origin Energy Ltd. | 20,242 | 84,497 | ||||||
Premier Investments Ltd. | 11,500 | 139,030 | ||||||
Primary Health Care Ltd. | 44,600 | 117,674 | ||||||
Programmed Maintenance Services Ltd. | 36,190 | 40,313 | ||||||
Qantas Airways Ltd.* | 115,600 | 283,027 | ||||||
QBE Insurance Group Ltd. | 8,135 | 68,968 | ||||||
Rio Tinto Ltd. | 7,974 | 312,550 | ||||||
Santos Ltd. | 25,826 | 94,257 | ||||||
South32 Ltd.* | 2,610,962 | 3,295,516 | ||||||
Star Entertainment Grp Ltd. (The) | 5,359 | 23,022 | ||||||
Suncorp Group Ltd. | 11,386 | 108,217 | ||||||
Treasury Wine Estates Ltd. | 77,664 | 550,365 | ||||||
Vocus Communications Ltd. | 53,300 | 349,746 | ||||||
Wesfarmers Ltd. | 4,300 | 139,837 | ||||||
Woodside Petroleum Ltd. | 9,974 | 214,924 | ||||||
|
| |||||||
TOTAL AUSTRALIA | $ | 20,411,979 | ||||||
AUSTRIA – 0.5% | ||||||||
Erste Group Bank AG* | 44,121 | 1,269,088 | ||||||
OMV AG | 7,100 | 213,085 | ||||||
Raiffeisen Bank International AG#,* | 5,800 | 92,680 | ||||||
voestalpine AG | 9,400 | 338,836 | ||||||
|
| |||||||
TOTAL AUSTRIA | $ | 1,913,689 | ||||||
BELGIUM – 1.9% | ||||||||
Ageas | 2,798 | 109,764 | ||||||
Anheuser-Busch InBev SA/NV | 17,385 | 2,151,924 | ||||||
Bekaert SA | 12,300 | 541,044 | ||||||
bpost SA | 11,500 | 324,397 | ||||||
Delhaize Group SA | 37,551 | 3,935,606 | ||||||
Delhaize Group SA ADR# | 7,850 | 205,513 | ||||||
Ion Beam Applications | 4,600 | 189,358 | ||||||
KBC Groep NV | 1,954 | 109,702 | ||||||
Proximus SADP# | 1,433 | 48,200 | ||||||
Solvay SA | 1,232 | 124,509 | ||||||
UCB SA# | 458 | 34,272 | ||||||
| Description | Number of Shares | Value | ||||||
Umicore SA# | 1,295 | $ | 64,541 | |||||
|
| |||||||
TOTAL BELGIUM | $ | 7,838,830 | ||||||
BRAZIL – 0.4% | ||||||||
Ambev SA | 48,575 | 271,175 | ||||||
Ambev SA-ADR | 23,868 | 133,422 | ||||||
Banco Santander Brasil SA ADR# | 3,700 | 19,906 | ||||||
BB Seguridade Participacoes SA | 2,800 | 24,359 | ||||||
BM&FBovespa SA | 6,807 | 33,884 | ||||||
BRF SA | 4,256 | 60,550 | ||||||
CCR SA | 18,000 | 83,896 | ||||||
Centrais Eletricas Brasileiras SA* | 9,500 | 21,490 | ||||||
Cia de Saneamento Basico do Estado de Sao Paulo | 5,300 | 40,545 | ||||||
Cia Energetica de Minas Gerais | 2,768 | 5,722 | ||||||
Cielo SA | 26,278 | 254,815 | ||||||
CPFL Energia SA | 9,289 | 53,883 | ||||||
Cyrela Brazil Realty SA Empreendimentos e Participacoes | 6,300 | 18,996 | ||||||
Embraer SA | 13,100 | 76,065 | ||||||
Equatorial Energia SA | 4,000 | 49,174 | ||||||
Estacio Participacoes SA | 3,800 | 13,215 | ||||||
Fibria Celulose SA | 1,500 | 13,215 | ||||||
Gafisa SA | 28,700 | 19,443 | ||||||
Klabin SA – Unit | 8,000 | 40,893 | ||||||
Kroton Educacional SA | 20,200 | 75,297 | ||||||
Localiza Rent a Car SA | 4,440 | 43,287 | ||||||
Lojas Renner SA | 9,100 | 54,638 | ||||||
Marfrig Global Foods SA* | 14,350 | 26,787 | ||||||
Natura Cosmeticos SA | 3,600 | 26,692 | ||||||
Odontoprev SA | 13,200 | 40,645 | ||||||
Qualicorp SA | 8,500 | 36,948 | ||||||
Tim Participacoes SA | 36,006 | 80,403 | ||||||
Totvs SA | 2,900 | 23,703 | ||||||
Tractebel Energia SA | 3,500 | 38,702 | ||||||
Ultrapar Participacoes SA | 4,300 | 90,732 | ||||||
Weg SA | 14,840 | 65,586 | ||||||
|
| |||||||
TOTAL BRAZIL | $ | 1,838,068 | ||||||
BULGARIA – 0.0%** | ||||||||
Olovno Tzinkov Komplex AD*,†† | 900 | — | ||||||
Petrol AD* | 14,543 | 3,081 | ||||||
|
| |||||||
TOTAL BULGARIA | $ | 3,081 | ||||||
CANADA – 3.4% | ||||||||
Agnico Eagle Mines Ltd. | 1,400 | 66,094 | ||||||
Air Canada* | 35,800 | 266,210 | ||||||
Bank of Montreal ADR# | 7,051 | 459,443 | ||||||
Barrick Gold Corp. | 29,112 | 563,900 | ||||||
BlackBerry Ltd.#, * | 9,312 | 65,743 | ||||||
April 30, 2016 / ANNUAL REPORT
PORTFOLIOS OF INVESTMENTS 21
Wilmington Multi-Manager International Fund (continued)
| Description | Number of Shares | Value | ||||||
Cameco Corp. | 4,406 | $ | 55,119 | |||||
Canadian Imperial Bank of Commerce | 7,600 | 613,839 | ||||||
Canadian Natural Resources Ltd. | 13,733 | 412,265 | ||||||
Canadian Tire Corp. Ltd. Class A# | 4,800 | 522,847 | ||||||
CCL Industries, Inc. Class B | 4,365 | 799,282 | ||||||
Cenovus Energy, Inc. | 6,453 | 102,216 | ||||||
Colliers International Group, Inc. | 1,600 | 66,183 | ||||||
Cott Corp. | 26,600 | 352,716 | ||||||
Crescent Point Energy Corp. | 6,912 | 116,260 | ||||||
Dollarama, Inc. | 7,700 | 555,146 | ||||||
Dorel Industries, Inc. Class B | 8,700 | 193,595 | ||||||
Eldorado Gold Corp. | 6,710 | 28,285 | ||||||
Empire Co. Ltd. | 20,202 | 335,707 | ||||||
Encana Corp. | 10,236 | 78,408 | ||||||
Fairfax Financial Holdings Ltd. | 192 | 102,909 | ||||||
Finning International, Inc. | 1,200 | 21,328 | ||||||
First Quantum Minerals Ltd. | 7,072 | 60,253 | ||||||
FirstService Corp. | 5,500 | 247,143 | ||||||
Franco-Nevada Corp. | 37,330 | 2,621,163 | ||||||
Goldcorp, Inc. | 4,283 | 86,302 | ||||||
Husky Energy, Inc. | 7,226 | 91,052 | ||||||
Industrial Alliance Insurance & Financial Services, Inc. | 1,794 | 59,624 | ||||||
Keyera Corp. | 10,500 | 338,172 | ||||||
Kinross Gold Corp.* | 20,413 | 116,325 | ||||||
Laurentian Bank of Canada | 5,700 | 226,146 | ||||||
Loblaw Cos. Ltd. | 6,200 | 342,095 | ||||||
Lundin Mining Corp.* | 15,100 | 59,331 | ||||||
Magna International, Inc. | 12,200 | 512,425 | ||||||
Manulife Financial Corp. | 20,595 | 303,664 | ||||||
Martinrea International, Inc. | 4,600 | 34,792 | ||||||
Metro, Inc. | 1,100 | 36,813 | ||||||
National Bank of Canada | 13,100 | 468,163 | ||||||
Parex Resources, Inc.* | 51,900 | 519,951 | ||||||
RONA, Inc. | 15,600 | 296,906 | ||||||
Shaw Communications, Inc.# | 12,500 | 231,330 | ||||||
Silver Wheaton Corp. | 3,812 | 79,861 | ||||||
Sun Life Financial, Inc. | 2,583 | 88,104 | ||||||
Suncor Energy, Inc. | 17,876 | 524,726 | ||||||
Superior Plus Corp.# | 29,000 | 252,395 | ||||||
Teck Resources Ltd. Class B# | 8,809 | 107,910 | ||||||
Tourmaline Oil Corp.* | 3,300 | 76,115 | ||||||
Transcontinental, Inc. Class A | 12,000 | 188,603 | ||||||
Turquoise Hill Resources Ltd.* | 5,300 | 15,840 | ||||||
WestJet Airlines Ltd. | 12,000 | 200,845 | ||||||
Yamana Gold, Inc. | 8,144 | 40,373 | ||||||
|
| |||||||
TOTAL CANADA | $ | 14,003,917 | ||||||
| Description | Number of Shares | Value | ||||||
CHILE – 0.3% | ||||||||
AES Gener SA | 48,884 | $ | 24,501 | |||||
Aguas Andinas SA | 57,100 | 33,083 | ||||||
Antarchile SA | 2,964 | 30,843 | ||||||
Banco de Chile | 610,760 | 66,958 | ||||||
Banco de Credito e Inversiones | 401 | 17,243 | ||||||
Banco Santander Chile ADR | 1,292 | 25,065 | ||||||
Banmedica SA | 16,849 | 28,563 | ||||||
Cencosud SA | 26,598 | 71,488 | ||||||
Cia Cervecerias Unidas SA ADR | 1,200 | 26,904 | ||||||
Empresa Nacional de Electricidad SA ADR | 1,210 | 33,699 | ||||||
Empresa Nacional de Telecomunicaciones SA | 6,474 | 56,477 | ||||||
Empresas CMPC SA | 40,536 | 90,591 | ||||||
Empresas COPEC SA | 15,435 | 154,181 | ||||||
Endesa Americas SA ADR* | 1,210 | 17,097 | ||||||
Enersis Americas SA | 136,816 | 23,247 | ||||||
Enersis Chile SA* | 136,816 | 16,755 | ||||||
Itau CorpBanca | 1,842,402 | 16,746 | ||||||
Latam Airlines Group SA* | 10,941 | 78,120 | ||||||
Parque Arauco SA | 10,596 | 20,519 | ||||||
Quinenco SA | 10,102 | 19,878 | ||||||
SACI Falabella | 21,026 | 162,725 | ||||||
Sigdo Koppers SA | 19,571 | 27,354 | ||||||
Sonda SA | 31,307 | 62,517 | ||||||
Vina Concha y Toro SA | 21,305 | 35,775 | ||||||
|
| |||||||
TOTAL CHILE | $ | 1,140,329 | ||||||
CHINA – 2.2% | ||||||||
3sBio, Inc.*,W | 27,000 | 32,684 | ||||||
Agricultural Bank of China Ltd. | 51,000 | 18,475 | ||||||
Alibaba Group Holding Ltd. ADR* | 33,243 | 2,557,716 | ||||||
Aluminum Corp. of China Ltd.#, * | 88,000 | 29,496 | ||||||
Anhui Conch Cement Co. Ltd.# | 24,000 | 63,582 | ||||||
Baidu, Inc. ADR* | 270 | 52,461 | ||||||
Bank of China Ltd. | 68,000 | 27,789 | ||||||
Bank of Communications Co. Ltd. | 27,800 | 17,597 | ||||||
Beijing Enterprises Clean Enenergy Group Ltd.* | 580,000 | 35,143 | ||||||
Beijing Enterprises Water Group Ltd.# | 32,000 | 19,183 | ||||||
Belle International Holdings Ltd. | 44,000 | 27,000 | ||||||
Brilliance China Automotive Holdings Ltd. | 28,000 | 27,759 | ||||||
BYD Co. Ltd.#, * | 6,000 | 35,349 | ||||||
Cgn Power Co. Ltd.-HW | 144,000 | 46,225 | ||||||
China Agri-Industries Holdings Ltd.* | 74,000 | 25,472 | ||||||
China Biologic Products, Inc.* | 300 | 35,100 | ||||||
China CITIC Bank Corp. Ltd.* | 42,000 | 26,423 | ||||||
ANNUAL REPORT / April 30, 2016
22 PORTFOLIOS OF INVESTMENTS
Wilmington Multi-Manager International Fund (continued)
| Description | Number of Shares | Value | ||||||
China Communications Construction Co. Ltd. | 25,000 | $ | 30,167 | |||||
China Construction Bank Corp. | 130,810 | 84,150 | ||||||
China COSCO Holdings Co. Ltd.#, * | 135,500 | 53,104 | ||||||
China Eastern Airlines Corp. Ltd.* | 36,000 | 19,771 | ||||||
China Gas Holdings Ltd.# | 24,000 | 34,715 | ||||||
China Huishan Dairy Holdings Co. Ltd.# | 93,000 | 34,769 | ||||||
China Life Insurance Co. Ltd. | 8,000 | 18,626 | ||||||
China Longyuan Power Group Corp. Ltd. | 37,000 | 25,710 | ||||||
China Maple Leaf Educational Systems Ltd. | 628,000 | 498,715 | ||||||
China Mengniu Dairy Co. Ltd.# | 41,000 | 69,664 | ||||||
China Merchants Bank Co. Ltd. | 8,052 | 17,709 | ||||||
China Merchants Holdings International Co. Ltd. | 14,000 | 41,692 | ||||||
China Minsheng Banking Corp. Ltd.# | 21,000 | 19,790 | ||||||
China Mobile Ltd. | 25,000 | 286,680 | ||||||
China National Building Material Co. Ltd. | 78,000 | 40,423 | ||||||
China Overseas Land & Investment Ltd. | 12,000 | 38,288 | ||||||
China Petroleum & Chemical Corp. | 141,800 | 101,091 | ||||||
China Railway Construction Corp. Ltd.# | 29,900 | 38,238 | ||||||
China Resources Beer Holdings Co. Ltd. | 18,000 | 39,634 | ||||||
China Resources Power Holdings Co. Ltd. | 39,600 | 67,081 | ||||||
China Shenhua Energy Co. Ltd. | 27,000 | 45,668 | ||||||
China Southern Airlines Co. Ltd. (The) | 31,000 | 19,503 | ||||||
China Telecom Corp. Ltd. | 68,000 | 33,838 | ||||||
China Unicom Hong Kong Ltd. | 26,652 | 31,473 | ||||||
China Yurun Food Group Ltd.#, * | 106,000 | 18,175 | ||||||
CNOOC Ltd. | 88,000 | 109,590 | ||||||
COSCO Pacific Ltd. | 38,000 | 40,465 | ||||||
CRRC Corp. Ltd.# | 39,000 | 38,060 | ||||||
CSPC Pharmaceutical Group Ltd. | 44,000 | 39,196 | ||||||
Ctrip.com International Ltd. ADR* | 1,000 | 43,610 | ||||||
Datang International Power | ||||||||
Generation Co. Ltd. | 132,000 | 37,608 | ||||||
Dongfeng Motor Group Co. Ltd. | 26,000 | 28,558 | ||||||
Great Wall Motor Co. Ltd. | 30,000 | 22,741 | ||||||
Guangzhou Automobile Group Co. Ltd. | 20,974 | 24,416 | ||||||
Hengan International Group Co. Ltd.# | 6,500 | 58,490 | ||||||
Industrial & Commercial Bank of China Ltd. | 71,000 | 38,535 | ||||||
JD.com, Inc. ADR#, * | 2,900 | 74,124 | ||||||
Jiangxi Copper Co. Ltd. | 32,000 | 39,150 | ||||||
Kingboard Chemical Holdings Ltd. | 120,600 | 232,590 | ||||||
Kunlun Energy Co. Ltd. | 28,000 | 24,402 | ||||||
Lenovo Group Ltd.# | 24,000 | 19,090 | ||||||
NetEase, Inc. ADR | 130 | 18,291 | ||||||
New Oriental Education & Technology Group, Inc. ADR | 1,100 | 43,076 | ||||||
Nine Dragons Paper Holdings Ltd. | 48,000 | 34,591 | ||||||
| Description | Number of Shares | Value | ||||||
PetroChina Co. Ltd. | 118,000 | $ | 86,862 | |||||
Ping An Insurance Group Co. of China Ltd. | 9,500 | 44,886 | ||||||
Qihoo 360 Technology Co. Ltd. ADR* | 300 | 22,782 | ||||||
Shandong Weigao Group Medical Polymer Co. Ltd. | 64,000 | 38,531 | ||||||
Shanghai Electric Group Co. Ltd.# | 38,000 | 15,970 | ||||||
SINA Corp.#, * | 500 | 25,045 | ||||||
Sinopec Shanghai Petrochemical Co. Ltd.* | 81,000 | 39,890 | ||||||
Sinopharm Group Co Ltd. | 28,400 | 121,920 | ||||||
Sohu.com, Inc.* | 400 | 17,972 | ||||||
Sunny Optical Technology Group Co. Ltd. | 148,000 | 457,915 | ||||||
Tencent Holdings Ltd. | 122,133 | 2,501,893 | ||||||
Tingyi Cayman Islands Holding Corp. | 14,000 | 16,370 | ||||||
Vipshop Holdings Ltd. ADR* | 2,200 | 30,008 | ||||||
Want Want China Holdings Ltd.# | 65,000 | 50,110 | ||||||
Yantai Changyu Pioneer Wine Co. Ltd. | 9,100 | 28,836 | ||||||
Zijin Mining Group Co. Ltd.# | 138,000 | 45,722 | ||||||
ZTE Corp. | 13,728 | 21,450 | ||||||
|
| |||||||
TOTAL CHINA | $ | 9,318,873 | ||||||
COLOMBIA – 0.9% | ||||||||
Almacenes Exito SA | 5,987 | 33,669 | ||||||
Banco de Bogota SA | 1,103 | 24,386 | ||||||
Bancolombia SA ADR# | 39,886 | 1,451,000 | ||||||
Cementos Argos SA | 212,013 | 861,838 | ||||||
Corp. Financiera Colombiana SA* | 1,769 | 23,957 | ||||||
Ecopetrol SA ADR# | 10,200 | 101,388 | ||||||
Empresa de Energia de Bogota SA ESP | 39,263 | 25,498 | ||||||
Grupo Argos SA | 50,138 | 330,887 | ||||||
Grupo Aval Acciones y Valore SA ADR | 25,847 | 209,102 | ||||||
Grupo Aval Acciones y Valores SA | 57,900 | 24,593 | ||||||
Grupo de Inversiones Suramericana SA | 42,310 | 571,819 | ||||||
Grupo Nutresa SA | 5,878 | 53,649 | ||||||
Grupo Odinsa SA* | 3,016 | 8,682 | ||||||
Interconexion Electrica SA ESP | 8,448 | 25,801 | ||||||
Isagen SA ESP | 27,702 | 39,919 | ||||||
|
| |||||||
TOTAL COLOMBIA | $ | 3,786,188 | ||||||
CZECH REPUBLIC – 0.1% | ||||||||
CEZ AS | 6,233 | 121,762 | ||||||
Komercni Banka AS | 585 | 120,348 | ||||||
Pegas Nonwovens SA | 1,790 | 62,902 | ||||||
Philip Morris CR AS | 82 | 43,015 | ||||||
|
| |||||||
TOTAL CZECH REPUBLIC | $ | 348,027 | ||||||
DENMARK – 1.4% | ||||||||
AP Moeller - Maersk A/S Class A | 95 | 133,591 | ||||||
AP Moeller - Maersk A/S Class B | 54 | 73,527 | ||||||
Carlsberg A/S | 746 | 72,652 | ||||||
| April 30, 2016 / ANNUAL REPORT |
PORTFOLIOS OF INVESTMENTS 23
Wilmington Multi-Manager International Fund (continued)
| Description | Number of Shares | Value | ||||||
Danske Bank A/S | 3,364 | $ | 95,128 | |||||
DPds A/S | 3,600 | 143,730 | ||||||
DSV A/S | 1,032 | 43,425 | ||||||
Genmab A/S* | 4,312 | 638,869 | ||||||
H Lundbeck A/S* | 16,000 | 534,425 | ||||||
Iss A/S | 1,804 | 68,500 | ||||||
Novo Nordisk A/S Class B | 57,260 | 3,197,017 | ||||||
Royal Unibrew A/S | 6,255 | 282,547 | ||||||
SimCorp. | 3,300 | 148,355 | ||||||
TDC A/S | 47,700 | 244,089 | ||||||
Vestas Wind Systems A/S | 2,500 | 178,854 | ||||||
|
| |||||||
TOTAL DENMARK | $ | 5,854,709 | ||||||
EGYPT – 0.1% | ||||||||
Commercial International Bank Egypt SAE | 24,568 | 124,999 | ||||||
Eastern Tobacco | 2,191 | 44,385 | ||||||
Egyptian Financial Group-Hermes Holding Co.* | 34,798 | 39,501 | ||||||
ElSewedy Electric Co. | 5,430 | 28,459 | ||||||
EZZ Steel* | 27,000 | 26,909 | ||||||
Global Telecom Holding SAE* | 272,255 | 90,752 | ||||||
Juhayna Food Industries | 61,900 | 50,189 | ||||||
Orascom Telecom Media And Technology Holding SAE* | 224,975 | 18,748 | ||||||
Oriental Weavers | 40,500 | 30,102 | ||||||
Sidi Kerir Petrochemicals Co. | 30,650 | 44,698 | ||||||
Six of October Development & Investment* | 8,300 | 10,057 | ||||||
Talaat Moustafa Group | 63,935 | 48,024 | ||||||
|
| |||||||
TOTAL EGYPT | $ | 556,823 | ||||||
FINLAND – 1.0% | ||||||||
Fortum OYJ | 5,226 | 78,750 | ||||||
Huhtamaki OYJ | 11,500 | 451,667 | ||||||
Neste Oil OYJ# | 10,477 | 335,189 | ||||||
Nokia OYJ | 478,475 | 2,821,585 | ||||||
Stora Enso OYJ Class R | 8,109 | 70,754 | ||||||
UPM-Kymmene OYJ | 21,751 | 415,434 | ||||||
|
| |||||||
TOTAL FINLAND | $ | 4,173,379 | ||||||
FRANCE – 8.6% | ||||||||
Air Liquide SA | 7,147 | 810,188 | ||||||
Alstom SA#,* | 9,000 | 230,019 | ||||||
Arkema SA | 1,700 | 135,639 | ||||||
AXA SA | 95,441 | 2,405,915 | ||||||
BNP Paribas SA | 11,805 | 625,043 | ||||||
Bollore SA | 4,502 | 17,836 | ||||||
Bouygues SA | 3,409 | 113,670 | ||||||
Casino Guichard Perrachon SA | 745 | 44,325 | ||||||
Cellectis SA#, * | 6,200 | 171,946 | ||||||
| Description | Number of Shares | Value | ||||||
Cie de St-Gobain# | 7,105 | $ | 325,384 | |||||
Cie Generale des Etablissements Michelin | 18,910 | 1,973,671 | ||||||
CNP Assurances | 32,306 | 549,888 | ||||||
Credit Agricole SA | 31,042 | 343,327 | ||||||
Danone SA | 37,916 | 2,655,752 | ||||||
Electricite de France SA | 27,803 | 399,383 | ||||||
Essilor International SA | 18,054 | 2,337,064 | ||||||
GDF Suez | 29,958 | 493,972 | ||||||
Hermes International | 381 | 135,679 | ||||||
IPSOS | 2,400 | 71,451 | ||||||
JCDecaux SA | 18,103 | 799,619 | ||||||
L’Oreal SA | 24,575 | 4,458,742 | ||||||
LVMH Moet Hennessy Louis Vuitton SA | 8,211 | 1,364,238 | ||||||
Natixis SA | 15,536 | 85,692 | ||||||
Nexity SA | 7,900 | 423,621 | ||||||
Orange SA | 186,441 | 3,091,268 | ||||||
Pernod Ricard SA | 17,571 | 1,896,892 | ||||||
Peugeot SA* | 7,129 | 114,732 | ||||||
Renault SA | 2,975 | 287,103 | ||||||
Saft Groupe SA | 6,100 | 189,569 | ||||||
Sanofi | 11,900 | 982,583 | ||||||
Schneider Electric SA | 27,667 | 1,800,706 | ||||||
SCOR SE | 7,560 | 257,405 | ||||||
SEB SA | 3,500 | 392,233 | ||||||
Societe Generale SA | 13,321 | 522,425 | ||||||
STMicroelectronics NV | 5,537 | 34,009 | ||||||
Teleperformance | 5,200 | 466,816 | ||||||
Thales SA | 2,500 | 216,129 | ||||||
Total SA | 82,355 | 4,142,646 | ||||||
Valeo SA | 1,200 | 190,240 | ||||||
Vivendi SA | 1,852 | 35,542 | ||||||
|
| |||||||
TOTAL FRANCE | $ | 35,592,362 | ||||||
GERMANY – 8.5% | ||||||||
adidas AG | 20,958 | 2,702,183 | ||||||
Allianz SE | 17,111 | 2,904,668 | ||||||
AURELIUS SE & Co KGaA | 4,300 | 257,118 | ||||||
BASF SE | 8,200 | 677,449 | ||||||
Bayer AG | 6,000 | 692,186 | ||||||
Bayerische Motoren Werke AG | 9,484 | 874,207 | ||||||
Commerzbank AG | 6,856 | 64,060 | ||||||
Daimler AG | 29,317 | 2,037,339 | ||||||
Deutsche Bank AG# | 19,710 | 371,712 | ||||||
Deutsche Boerse AG | 35,369 | 2,903,407 | ||||||
Deutsche Lufthansa AG# | 3,764 | 58,443 | ||||||
Deutsche Wohnen AG | 17,700 | 542,054 | ||||||
E.ON AG | 31,003 | 319,821 | ||||||
ANNUAL REPORT / April 30, 2016
24 PORTFOLIOS OF INVESTMENTS
Wilmington Multi-Manager International Fund (continued)
| Description | Number of Shares | Value | ||||||
Fresenius Medical Care AG & Co. KGaA | 10,133 | $ | 878,916 | |||||
Fresenius SE & Co. KGaA | 19,457 | 1,415,184 | ||||||
GEA Group AG | 65,646 | 3,043,565 | ||||||
Hannover Rueck SE | 406 | 46,294 | ||||||
HeidelbergCement AG | 1,655 | 147,038 | ||||||
Henkel AG & Co. KGaA | 24,274 | 2,466,258 | ||||||
HOCHTIEF AG | 5,800 | 743,496 | ||||||
KION Group AG | 6,900 | 375,924 | ||||||
Linde AG | 11,142 | 1,701,945 | ||||||
Metro AG# | 11,163 | 354,708 | ||||||
Muenchener Rueckversicherungs AG | 2,689 | 498,653 | ||||||
Rheinmetall AG | 10,600 | 829,241 | ||||||
RWE AG* | 4,651 | 69,473 | ||||||
SAP AG | 58,348 | 4,564,576 | ||||||
Siemens AG | 25,885 | 2,700,775 | ||||||
Sixt SE | 2,000 | 115,765 | ||||||
STADA Arzneimittel AG | 5,400 | 229,091 | ||||||
Talanx AG | 928 | 30,789 | ||||||
Telefonica Deutschland Holding AG | 7,716 | 39,176 | ||||||
Volkswagen AG | 2,666 | 422,344 | ||||||
Wincor Nixdorf AG* | 7,300 | 399,221 | ||||||
|
| |||||||
TOTAL GERMANY | $ | 35,477,079 | ||||||
GHANA – 0.0%** | ||||||||
Produce Buying Co. Ltd.* | 288,000 | 5,293 | ||||||
GREECE – 0.1% | ||||||||
Aegean Airlines SA | 3,533 | 32,404 | ||||||
Aegean Marine Petroleum Network, Inc. | 2,300 | 18,492 | ||||||
Alpha Bank AE* | 8,769 | 19,178 | ||||||
Athens Water Supply & Sewage Co. SA (The) | 5,272 | 28,071 | ||||||
Costamare, Inc. | 1,300 | 12,610 | ||||||
Diana Shipping, Inc.* | 3,211 | 11,110 | ||||||
Ellaktor SA* | 8,300 | 12,070 | ||||||
Eurobank Ergasias SA* | 19,841 | 16,812 | ||||||
FF Group* | 800 | 16,489 | ||||||
GasLog Ltd.# | 1,300 | 16,653 | ||||||
GEK Terna Holding Real Estate Construction SA* | 7,360 | 14,411 | ||||||
Hellenic Exchanges - Athens Stock Exchange SA | 3,700 | 21,099 | ||||||
Hellenic Telecommunications Organization SA | 9,065 | 87,918 | ||||||
Jumbo SA* | 1,915 | 25,151 | ||||||
Motor Oil Hellas Corinth Refineries SA | 3,379 | 38,537 | ||||||
Mytilineos Holdings SA* | 7,202 | 28,863 | ||||||
National Bank of Greece SA* | 113,916 | 33,914 | ||||||
OPAP SA | 5,892 | 44,528 | ||||||
Public Power Corp. SA | 17,116 | 57,424 | ||||||
| Description | Number of Shares | Value | ||||||
Titan Cement Co. SA | 3,017 | $ | 68,747 | |||||
Tsakos Energy Naviagation Ltd. | 2,100 | 13,356 | ||||||
|
| |||||||
TOTAL GREECE | $ | 617,837 | ||||||
HONG KONG – 1.4% | ||||||||
Bank of East Asia Ltd. (The) | 7,000 | 25,493 | ||||||
Cathay Pacific Airways Ltd. | 30,000 | 47,957 | ||||||
Cheung Kong Property Holdings Ltd. | 10,000 | 68,649 | ||||||
China Medical System Holdings Ltd. | 27,000 | 35,156 | ||||||
China Resources Gas Group Ltd. | 12,000 | 34,034 | ||||||
CITIC Ltd.# | 42,000 | 61,509 | ||||||
CK Hutchison Holdings Ltd. | 10,873 | 130,360 | ||||||
Dah Sing Financial Holdings Ltd. | 49,044 | 336,048 | ||||||
Guangdong Investment Ltd. | 32,000 | 45,379 | ||||||
Hang Lung Group Ltd. | 15,000 | 46,120 | ||||||
Hang Lung Properties Ltd. | 27,000 | 53,882 | ||||||
Henderson Land Development Co. Ltd. | 5,000 | 31,263 | ||||||
Hong Kong Exchanges and Clearing Ltd. | 100,781 | 2,550,415 | ||||||
Huabao International Holdings Ltd.* | 409,000 | 161,345 | ||||||
Huaneng Power International, Inc. | 50,000 | 35,904 | ||||||
Hutchison Port Holdings Trust | 96,300 | 42,854 | ||||||
Kerry Properties Ltd. | 9,500 | 25,903 | ||||||
Lee & Man Paper Manufacturing Ltd. | 400,500 | 262,804 | ||||||
MGM China Holdings Ltd. | 28,800 | 40,470 | ||||||
New World Development Co. Ltd. | 108,235 | 107,999 | ||||||
NWS Holdings Ltd. | 155,000 | 236,189 | ||||||
Orient Overseas International Ltd. | 500 | 1,905 | ||||||
PCCW Ltd. | 302,000 | 204,788 | ||||||
Shangri-La Asia Ltd. | 28,857 | 35,304 | ||||||
Sino Biopharmaceutical Ltd. | 70,000 | 49,814 | ||||||
Sino Land Co. Ltd. | 34,000 | 53,563 | ||||||
Skyworth Digital Holdings Ltd. | 486,000 | 318,282 | ||||||
SmarTone Telecommunications Holdings Ltd. | 128,500 | 212,706 | ||||||
Sun Hung Kai Properties Ltd. | 16,165 | 204,331 | ||||||
Swire Pacific Ltd. Class A | 8,000 | 86,994 | ||||||
Swire Pacific Ltd. Class B | 10,000 | 19,518 | ||||||
Television Broadcasts Ltd. | 16,200 | 60,565 | ||||||
WH Group Ltd.*,W | 56,000 | 45,338 | ||||||
Wharf Holdings Ltd. (The) | 11,000 | 59,702 | ||||||
Wheelock & Co. Ltd. | 14,703 | 68,237 | ||||||
|
| |||||||
TOTAL HONG KONG | $ | 5,800,780 | ||||||
HUNGARY – 0.1% | ||||||||
Magyar Telekom Telecommunications PLC* | 33,310 | 57,831 | ||||||
MOL Hungarian Oil & Gas PLC | 3,093 | 189,025 | ||||||
OTP Bank PLC | 7,640 | 202,328 | ||||||
Richter Gedeon Nyrt | 8,050 | 159,970 | ||||||
|
| |||||||
TOTAL HUNGARY | $ | 609,154 | ||||||
| April 30, 2016 / ANNUAL REPORT |
PORTFOLIOS OF INVESTMENTS 25
Wilmington Multi-Manager International Fund (continued)
| Description | Number of Shares | Value | ||||||
INDIA – 0.5% | ||||||||
Ambuja Cement Ltd. GDR - Reg S | 7,649 | $ | 25,448 | |||||
Apollo Hospitals Enterprise Ltd. GDR | 2,413 | 47,693 | ||||||
Axis Bank Ltd. GDR - Reg S | 1,250 | 44,750 | ||||||
CESC Ltd. GDR | 8,905 | 72,295 | ||||||
Cipla Ltd. GDR - Reg S | 10,736 | 86,822 | ||||||
Cox & Kings Ltd. GDR - Reg S | 14,973 | 42,104 | ||||||
Dr Reddy’s Laboratories Ltd. ADR# | 1,900 | 86,640 | ||||||
GAIL India Ltd. GDR | 3,212 | 103,105 | ||||||
Grasim Industries Ltd. GDR - Reg S | 598 | 36,657 | ||||||
Great Eastern Shipping Co Ltd. (The) - Reg S | 2,055 | 50,892 | ||||||
Hindalco Industries Ltd. GDR | 44,300 | 64,350 | ||||||
ICICI Bank Ltd. ADR | 7,300 | 51,465 | ||||||
Indiabulls Housing Finance Ltd. GDR | 2,633 | 27,396 | ||||||
Infosys Ltd. ADR | 8,400 | 157,920 | ||||||
Jain Irrigation Systems Ltd. | 80,831 | 37,231 | ||||||
Larsen & Toubro Ltd. GDR - Reg S | 3,719 | 70,343 | ||||||
LIC Housing Finance Ltd. GDR - Reg S | 2,559 | 35,634 | ||||||
Mahindra & Mahindra Ltd. GDR | 4,330 | 85,734 | ||||||
NCC Ltd. GDR - Reg S | 56,791 | 67,695 | ||||||
Reliance Capital Ltd. GDR - Reg S | 6,655 | 40,476 | ||||||
Reliance Communication Ltd. GDR*,W | 281,600 | 238,600 | ||||||
Reliance Communications Ltd. GDR* | 26,829 | 22,724 | ||||||
Reliance Industries Ltd. GDRW | 5,800 | 171,680 | ||||||
Reliance Infrastructure GDR | 3,004 | 73,171 | ||||||
State Bank of India GDR - Reg S | 1,700 | 47,940 | ||||||
Suzlon Energy Ltd. GDR - Reg S* | 69,317 | 62,496 | ||||||
Tata Global Beverages Ltd. GDR - Reg S | 26,570 | 47,985 | ||||||
Tata Motors Ltd. ADR#, * | 2,990 | 90,836 | ||||||
Tata Steel Ltd. GDR - Reg S | 14,143 | 74,862 | ||||||
United Spirits Ltd. GDR* | 2,759 | 49,331 | ||||||
Vedanta Ltd. ADR | 4,300 | 27,004 | ||||||
Videocon d2h Ltd. ADR* | 4,800 | 37,392 | ||||||
Wipro Ltd. ADR# | 2,200 | 26,730 | ||||||
WNS Holdings Ltd. ADR* | 1,800 | 57,042 | ||||||
|
| |||||||
TOTAL INDIA | $ | 2,262,443 | ||||||
INDONESIA – 0.3% | ||||||||
Adaro Energy Tbk PT | 907,300 | 50,222 | ||||||
AKR Corporindo Tbk PT | 81,500 | 40,169 | ||||||
Astra International Tbk PT | 185,900 | 94,797 | ||||||
Bank Central Asia Tbk PT | 53,500 | 52,940 | ||||||
Bank Mandiri Persero Tbk PT | 29,100 | 21,293 | ||||||
Bank Negara Indonesia Persero Tbk PT | 54,200 | 18,843 | ||||||
Bank Rakyat Indonesia Persero Tbk PT | 54,400 | 42,693 | ||||||
Charoen Pokphand Indonesia Tbk PT | 67,200 | 18,930 | ||||||
Gudang Garam Tbk PT | 6,700 | 35,182 | ||||||
| Description | Number of Shares | Value | ||||||
Hanson International Tbk PT* | 375,000 | $ | 23,032 | |||||
Indo Tambangraya Megah Tbk PT | 50,100 | 29,631 | ||||||
Indocement Tunggal Prakarsa Tbk PT | 34,600 | 51,750 | ||||||
Indofood Sukses Makmur Tbk PT | 54,400 | 29,390 | ||||||
Indosat Tbk PT* | 36,100 | 18,340 | ||||||
Jasa Marga Persero Tbk PT | 96,800 | 40,003 | ||||||
Kalbe Farma Tbk PT | 995,800 | 103,824 | ||||||
Matahari Department Store Tbk PT | 33,900 | 48,840 | ||||||
Perusahaan Gas Negara Persero Tbk PT | 342,300 | 68,003 | ||||||
Semen Indonesia Persero Tbk PT | 82,900 | 62,232 | ||||||
Surya Semesta Internusa Tbk PT | 410,000 | 21,451 | ||||||
Tambang Batubara Bukit Asam Persero Tbk PT | 66,300 | 35,442 | ||||||
Telekomunikasi Indonesia Persero Tbk PT | 509,900 | 137,257 | ||||||
Unilever Indonesia Tbk PT | 14,800 | 47,779 | ||||||
United Tractors Tbk PT | 30,500 | 34,691 | ||||||
|
| |||||||
TOTAL INDONESIA | $ | 1,126,734 | ||||||
IRELAND – 0.4% | ||||||||
Bank of Ireland* | 301,826 | 91,586 | ||||||
CRH PLC ADR | 908 | 26,432 | ||||||
DCC PLC | 6,600 | 584,404 | ||||||
Icon PLC* | 4,600 | 310,868 | ||||||
Origin Enterprises PLC | 26,900 | 189,494 | ||||||
Paddy Power Betfair PLC | 3,721 | 497,482 | ||||||
|
| |||||||
TOTAL IRELAND | $ | 1,700,266 | ||||||
ISRAEL – 0.9% | ||||||||
Bank Hapoalim BM | 18,881 | 97,122 | ||||||
Bank Leumi Le-Israel BM* | 13,094 | 48,221 | ||||||
Check Point Software Technologies Ltd.#,* | 31,967 | 2,649,105 | ||||||
Israel Chemicals Ltd. | 5,089 | 25,251 | ||||||
Mizrahi Tefahot Bank Ltd. | 2,704 | 31,335 | ||||||
Teva Pharmaceutical Industries Ltd. | 14,200 | 798,464 | ||||||
|
| |||||||
TOTAL ISRAEL | $ | 3,649,498 | ||||||
ITALY – 0.5% | ||||||||
Astaldi SpA | 17,900 | 87,766 | ||||||
Brembo-SpA | 16,300 | 875,547 | ||||||
Enel SpA | 104,200 | 472,248 | ||||||
Eni SpA | 12,627 | 205,312 | ||||||
Mediobanca SpA | 38,048 | 312,594 | ||||||
UniCredit SpA | 46,605 | 180,055 | ||||||
UnipolSai SpA | 1,475 | 3,442 | ||||||
|
| |||||||
TOTAL ITALY | $ | 2,136,964 | ||||||
JAPAN – 15.6% | ||||||||
Adastria Co. Ltd. | 14,600 | 504,962 | ||||||
Aeon Co. Ltd. | 8,400 | 129,750 | ||||||
Aisin Seiki Co. Ltd.# | 2,400 | 97,669 | ||||||
| ANNUAL REPORT / April 30, 2016 |
26 PORTFOLIOS OF INVESTMENTS
Wilmington Multi-Manager International Fund (continued)
| Description | Number of Shares | Value | ||||||
Amada Holdings Co. Ltd. | 3,600 | $ | 37,658 | |||||
Asahi Glass Co. Ltd.# | 11,000 | 67,096 | ||||||
Asahi Intecc Co. Ltd. | 8,600 | 429,192 | ||||||
Asahi Kasei Corp. | 19,000 | 135,661 | ||||||
Bank of Kyoto Ltd. (The) | 4,000 | 28,120 | ||||||
Brother Industries Ltd. | 23,200 | 278,443 | ||||||
Canon Marketing Japan, Inc. | 1,600 | 29,684 | ||||||
Central Glass Co. Ltd. | 82,000 | 475,508 | ||||||
Chiba Bank Ltd. (The) | 8,000 | 42,406 | ||||||
Chugoku Bank Ltd. (The) | 1,500 | 16,184 | ||||||
Coca-Cola East Japan Co. Ltd. | 2,500 | 47,415 | ||||||
Coca-Cola West Co. Ltd. | 1,400 | 39,342 | ||||||
Concordia Financial Group Ltd.* | 13,000 | 62,605 | ||||||
CyberAgent Inc.# | 56,047 | 2,739,139 | ||||||
Dai Nippon Printing Co. Ltd.# | 4,000 | 39,135 | ||||||
Daifuku Co. Ltd. | 21,800 | 408,545 | ||||||
Daihatsu Motor Co. Ltd. | 5,300 | 74,718 | ||||||
Dai-ichi Life Insurance Co. Ltd. (The) | 5,700 | 73,339 | ||||||
Daiichi Sankyo Co. Ltd. | 103,504 | 2,530,206 | ||||||
DCM Holdings Co. Ltd.# | 28,600 | 221,220 | ||||||
Denka Co. Ltd. | 8,000 | 35,038 | ||||||
Dentsu, Inc. | 24,165 | 1,287,740 | ||||||
DIC Corp. | 15,000 | 36,231 | ||||||
Ebara Corp. | 7,000 | 33,224 | ||||||
Eizo Nanao Corp. | 9,500 | 246,607 | ||||||
Ezaki Glico Co. Ltd. | 2,600 | 136,598 | ||||||
FANUC Corp. | 8,596 | 1,333,430 | ||||||
Fuji Electric Co. Ltd. | 4,000 | 17,857 | ||||||
FUJIFILM Holdings Corp. | 2,557 | 109,802 | ||||||
Fujikura Ltd. | 48,000 | 244,962 | ||||||
Fujitsu Ltd. | 20,000 | 73,459 | ||||||
Fukuoka Financial Group, Inc. | 8,690 | 30,872 | ||||||
Geo Holdings Corp. | 8,600 | 146,944 | ||||||
Glory Ltd. | 1,200 | 40,940 | ||||||
Gunma Bank Ltd. (The) | 3,000 | 12,378 | ||||||
H2O Retailing Corp. | 1,000 | 17,115 | ||||||
Hachijuni Bank Ltd. (The) | 2,000 | 9,117 | ||||||
Heiwa Corp. | 19,100 | 413,774 | ||||||
Hino Motors Ltd. | 15,100 | 153,555 | ||||||
Hiroshima Bank Ltd. (The) | 6,000 | 22,669 | ||||||
Hitachi Chemical Co. Ltd. | 2,200 | 38,789 | ||||||
Hitachi Construction Machinery Co. Ltd. | 2,200 | 36,556 | ||||||
Hitachi High-Technologies Corp. | 1,100 | 31,222 | ||||||
Hitachi Ltd. | 77,400 | 375,070 | ||||||
Hitachi Metals Ltd.# | 3,900 | 41,786 | ||||||
Honda Motor Co. Ltd.# | 13,900 | 390,938 | ||||||
Hoya Corp. | 13,700 | 548,644 | ||||||
Ibiden Co. Ltd. | 2,300 | 30,133 | ||||||
| Description | Number of Shares | Value | ||||||
Idemitsu Kosan Co. Ltd. | 1,200 | $ | 26,571 | |||||
Iida Group Holdings Co. Ltd. | 18,000 | 353,741 | ||||||
Inpex Corp.# | 3,016 | 25,177 | ||||||
Isetan Mitsukoshi Holdings Ltd. | 1,400 | 15,579 | ||||||
Isuzu Motors Ltd. | 19,700 | 221,347 | ||||||
ITOCHU Corp. | 44,100 | 586,481 | ||||||
Iyo Bank Ltd. (The) | 3,000 | 20,639 | ||||||
J Front Retailing Co. Ltd. | 3,500 | 44,112 | ||||||
Japan Exchange Group, Inc. | 181,941 | 2,865,913 | ||||||
Japan Lifeline Co. Ltd. | 14,600 | 329,323 | ||||||
Japan Tobacco, Inc. | 36,610 | 1,558,678 | ||||||
JFE Holdings, Inc. | 7,298 | 108,338 | ||||||
Joyo Bank Ltd. (The) | 9,000 | 32,735 | ||||||
JSR Corp. | 900 | 12,866 | ||||||
JTEKT Corp. | 3,100 | 41,693 | ||||||
JX Holdings, Inc. | 16,582 | 73,341 | ||||||
Kajima Corp. | 52,000 | 334,774 | ||||||
Kamigumi Co. Ltd. | 4,000 | 37,519 | ||||||
Kaneka Corp. | 51,000 | 446,729 | ||||||
Kao Corp. | 56,474 | 3,246,194 | ||||||
KDDI Corp. | 104,462 | 3,111,279 | ||||||
Kobe Steel Ltd. | 26,000 | 26,391 | ||||||
Koito Manufacturing Co. Ltd. | 9,000 | 409,399 | ||||||
Komatsu Ltd. | 5,000 | 89,591 | ||||||
Konica Minolta, Inc. | 5,900 | 53,677 | ||||||
K’s Holdings Corp.# | 800 | 27,782 | ||||||
Kuraray Co. Ltd. | 4,500 | 59,464 | ||||||
Kusuri No Aoki Co. Ltd. | 5,200 | 285,902 | ||||||
KYB Corp. | 76,000 | 265,714 | ||||||
Kyocera Corp. ADR | 1,474 | 75,292 | ||||||
Kyowa Exeo Corp. | 16,100 | 189,447 | ||||||
LIXIL Group Corp. | 2,800 | 60,579 | ||||||
Marubeni Corp.# | 78,300 | 431,312 | ||||||
Mazda Motor Corp. | 4,700 | 77,060 | ||||||
Medipal Holdings Corp. | 2,200 | 36,370 | ||||||
Megmilk Snow Brand Co. Ltd. | 12,900 | 308,072 | ||||||
Miraca Holdings, Inc. | 2,800 | 123,816 | ||||||
MISUMI Group, Inc.# | 26,300 | 384,118 | ||||||
Mitsubishi Chemical Holdings Corp. | 19,900 | 108,814 | ||||||
Mitsubishi Corp. | 13,510 | 236,552 | ||||||
Mitsubishi Gas Chemical Co., Inc. | 72,000 | 410,752 | ||||||
Mitsubishi Heavy Industries Ltd. | 30,000 | 112,077 | ||||||
Mitsubishi Materials Corp. | 20,000 | 66,353 | ||||||
Mitsubishi UFJ Financial Group, Inc.# | 173,194 | 846,599 | ||||||
Mitsubishi UFJ Lease & Finance Co. Ltd. | 4,500 | 20,555 | ||||||
Mitsui & Co. Ltd. | 5,937 | 74,854 | ||||||
Mitsui Chemicals, Inc. | 18,000 | 62,932 | ||||||
Mitsui OSK Lines Ltd.# | 16,000 | 35,639 | ||||||
| April 30, 2016 / ANNUAL REPORT |
PORTFOLIOS OF INVESTMENTS 27
Wilmington Multi-Manager International Fund (continued)
| Description | Number of Shares | Value | ||||||
Mizuho Financial Group, Inc. | 400,700 | $ | 631,931 | |||||
Morinaga & Co Ltd/Japan | 33,000 | 163,449 | ||||||
MS&AD Insurance Group Holdings, Inc. | 2,082 | 58,087 | ||||||
NEC Corp. | 37,000 | 93,891 | ||||||
Nexon Co. Ltd. | 33,700 | 527,038 | ||||||
NHK Spring Co. Ltd. | 4,600 | 42,628 | ||||||
Nichirei Corp. | 53,000 | 478,195 | ||||||
Nihon Trim Co. Ltd. | 2,200 | 154,248 | ||||||
Nikon Corp.# | 3,000 | 45,423 | ||||||
Nippo Corp. | 2,000 | 33,910 | ||||||
Nippon Electric Glass Co. Ltd. | 3,000 | 16,494 | ||||||
Nippon Express Co. Ltd. | 14,000 | 66,974 | ||||||
Nippon Paper Industries Co. Ltd. | 2,200 | 43,545 | ||||||
Nippon Shokubai Co. Ltd. | 200 | 10,883 | ||||||
Nippon Steel & Sumitomo Metal Corp. | 122,220 | 2,686,773 | ||||||
Nippon Telegraph & Telephone Corp. | 84,580 | 3,866,515 | ||||||
Nippon Yusen KK | 29,000 | 59,145 | ||||||
Nishi-Nippon Railroad Co. Ltd. | 33,000 | 206,870 | ||||||
Nissan Motor Co. Ltd. | 76,500 | 718,985 | ||||||
Nisshinbo Holdings, Inc. | 3,000 | 33,976 | ||||||
NOK Corp. | 2,200 | 38,583 | ||||||
Nomura Holdings, Inc. | 20,100 | 90,469 | ||||||
NTT DOCOMO, Inc. | 120,578 | 2,943,055 | ||||||
Obayashi Corp. | 29,400 | 298,697 | ||||||
Oji Holdings Corp. | 17,000 | 72,378 | ||||||
Omron Corp. | 11,000 | 368,045 | ||||||
Open House Co. Ltd. | 19,800 | 446,617 | ||||||
Paltac Corp. | 14,200 | 261,846 | ||||||
Paramount Bed Holdings Co. Ltd.# | 5,600 | 216,316 | ||||||
Prima Meat Packers Ltd. | 73,000 | 207,885 | ||||||
Recruit Holdings Co Ltd. | 97,300 | 3,122,928 | ||||||
Resona Holdings, Inc. | 111,550 | 412,232 | ||||||
Ricoh Co. Ltd. | 39,500 | 420,987 | ||||||
Rohm Co. Ltd. | 500 | 23,026 | ||||||
Sankyu, Inc. | 34,000 | 165,207 | ||||||
Sawai Pharmaceutical Co. Ltd. | 3,500 | 232,895 | ||||||
SBI Holdings, Inc. | 3,500 | 38,224 | ||||||
Sega Sammy Holdings, Inc. | 2,000 | 22,594 | ||||||
Sekisui House Ltd. | 5,700 | 103,473 | ||||||
Shimadzu Corp. | 11,700 | 186,276 | ||||||
Shimamura Co. Ltd. | 3,500 | 487,829 | ||||||
Shinko Electric Industries Co. Ltd. | 32,700 | 191,160 | ||||||
Shinsei Bank Ltd.# | 18,000 | 26,391 | ||||||
Shizuoka Bank Ltd. (The) | 2,000 | 15,508 | ||||||
Showa Shell Sekiyu KK | 5,000 | 53,947 | ||||||
SKY Perfect JSAT Holdings, Inc. | 41,200 | 226,523 | ||||||
SMC Corp. | 4,287 | 1,101,767 | ||||||
Sony Corp. | 2,200 | 57,440 | ||||||
| Description | Number of Shares | Value | ||||||
Sumitomo Chemical Co. Ltd.# | 26,000 | $ | 123,647 | |||||
Sumitomo Corp. | 28,507 | 313,470 | ||||||
Sumitomo Electric Industries Ltd. | 10,900 | 137,787 | ||||||
Sumitomo Heavy Industries Ltd.# | 8,000 | 35,564 | ||||||
Sumitomo Metal Mining Co. Ltd.# | 18,798 | 221,195 | ||||||
Sumitomo Mitsui Financial Group, Inc. | 24,100 | 773,058 | ||||||
Sumitomo Mitsui Trust Holdings, Inc. | 28,000 | 90,684 | ||||||
Sumitomo Rubber Industries Ltd. | 2,800 | 44,737 | ||||||
T&D Holdings, Inc. | 7,900 | 80,299 | ||||||
Takashimaya Co. Ltd. | 5,000 | 37,923 | ||||||
Takeda Pharmaceutical Co. Ltd. | 61,000 | 3,016,748 | ||||||
TDK Corp. | 1,900 | 117,500 | ||||||
TechnoPro Holdings, Inc. | 9,100 | 262,566 | ||||||
Teijin Ltd.# | 12,000 | 44,774 | ||||||
Temp Holdings Co. Ltd. | 18,800 | 295,075 | ||||||
THK Co. Ltd.# | 1,100 | 22,651 | ||||||
Toho Holdings Co. Ltd. | 8,500 | 204,431 | ||||||
Tokai Rika Co. Ltd. | 900 | 17,586 | ||||||
Tokio Marine Holdings, Inc. | 54,705 | 1,896,680 | ||||||
Toppan Printing Co. Ltd.# | 6,000 | 53,402 | ||||||
Tosoh Corp. | 6,000 | 28,759 | ||||||
Toyo Seikan Group Holdings Ltd. | 1,900 | 39,196 | ||||||
Toyo Tire & Rubber Co. Ltd. | 11,100 | 175,367 | ||||||
Toyoda Gosei Co. Ltd. | 19,900 | 383,598 | ||||||
Toyota Motor Corp. | 600 | 31,883 | ||||||
Toyota Tsusho Corp. | 3,200 | 75,789 | ||||||
Tsuruha Holdings, Inc. | 4,500 | 446,617 | ||||||
Ube Industries Ltd. | 15,000 | 29,605 | ||||||
Ulvac, Inc. | 16,100 | 522,039 | ||||||
UNY Group Holdings Co. Ltd. | 6,000 | 45,113 | ||||||
W-Scope Corp.# | 5,400 | 289,286 | ||||||
Yamada Denki Co. Ltd.# | 6,000 | 31,015 | ||||||
Yamaha Motor Co. Ltd. | 13,000 | 226,156 | ||||||
Yokohama Rubber Co. Ltd. (The) | 21,050 | 371,936 | ||||||
|
| |||||||
TOTAL JAPAN | $ | 65,032,983 | ||||||
KUWAIT – 0.0%** | ||||||||
National Gulf Holdings†† | 5,304 | — | ||||||
LITHUANIA – 0.0%** | ||||||||
Invalda Privatus Kapitalas AB*,†† | 7,855 | — | ||||||
LUXEMBOURG – 0.1% | ||||||||
Grand City Properties SA | 12,300 | 271,684 | ||||||
MALAYSIA – 0.4% | ||||||||
Astro Malaysia Holdings Bhd | 55,800 | 39,566 | ||||||
Axiata Group Bhd | 21,500 | 31,096 | ||||||
British American Tobacco Malaysia Bhd | 1,800 | 21,140 | ||||||
Bumi Armada Bhd | 102,000 | 20,627 | ||||||
CIMB Group Holdings Bhd | 15,000 | 17,932 | ||||||
ANNUAL REPORT / April 30, 2016
28 PORTFOLIOS OF INVESTMENTS
Wilmington Multi-Manager International Fund (continued)
| Description | Number of Shares | Value | ||||||
Dialog Group Bhd | 33,220 | $ | 13,521 | |||||
DiGi.Com Bhd | 15,200 | 17,120 | ||||||
Gamuda Bhd | 22,400 | 27,237 | ||||||
Genting Bhd | 186,208 | 421,369 | ||||||
Genting Malaysia Bhd | 28,700 | 32,840 | ||||||
Hartalega Holdings Bhd | 25,200 | 27,674 | ||||||
Hong Leong Bank Bhd | 6,400 | 22,051 | ||||||
IHH Healthcare Bhd | 39,000 | 65,391 | ||||||
IJM Corp. Bhd | 33,720 | 29,780 | ||||||
Inari Amertron Bhd | 39,600 | 27,674 | ||||||
IOI Corp. Bhd | 19,080 | 21,588 | ||||||
Kuala Lumpur Kepong Bhd | 5,700 | 34,902 | ||||||
Lafarge Malayan Cement Bhd | 9,400 | 21,079 | ||||||
Malayan Banking Bhd | 10,190 | 23,294 | ||||||
Maxis Bhd | 10,900 | 15,625 | ||||||
My EG Services Bhd | 68,900 | 35,451 | ||||||
Petronas Chemicals Group Bhd | 59,200 | 101,685 | ||||||
Petronas Dagangan Bhd | 8,300 | 50,652 | ||||||
Petronas Gas Bhd | 3,200 | 18,005 | ||||||
PPB Group Bhd | 8,100 | 33,549 | ||||||
Public Bank Bhd | 4,800 | 22,977 | ||||||
RHB Capital Bhd | 18,000 | 28,199 | ||||||
SapuraKencana Petroleum Bhd | 97,417 | 41,146 | ||||||
Sime Darby Bhd | 14,246 | 28,080 | ||||||
Telekom Malaysia Bhd | 22,900 | 38,982 | ||||||
Tenaga Nasional Bhd | 24,625 | 90,520 | ||||||
Top Glove Corp. Bhd | 22,600 | 28,695 | ||||||
UMW Holdings Bhd | 7,100 | 11,923 | ||||||
WCT Holdings Bhd | 42,020 | 17,641 | ||||||
YTL Corp. Bhd | 57,476 | 22,952 | ||||||
|
| |||||||
TOTAL MALAYSIA | $ | 1,501,963 | ||||||
MALTA – 0.1% | ||||||||
Unibet Group PLC SDR | 37,400 | 421,949 | ||||||
MEXICO – 0.6% | ||||||||
Alfa SAB de CV | 61,900 | 116,427 | ||||||
Alsea SAB de CV | 11,200 | 42,933 | ||||||
America Movil SAB de CV | 484,224 | 342,805 | ||||||
Cemex SAB de CV* | 204,956 | 152,246 | ||||||
Coca-Cola Femsa SAB de CV | 3,700 | 32,257 | ||||||
Compartamos SAB de CV | 38,500 | 76,397 | ||||||
Controladora Vuela Cia de Aviacion SAB de CV* | 16,400 | 34,288 | ||||||
El Puerto de Liverpool SAB de CV | 3,895 | 44,264 | ||||||
Fomento Economico Mexicano SAB de CV | 15,900 | 148,218 | ||||||
Genomma Lab Internacional SAB de CV* | 48,000 | 52,730 | ||||||
Gruma SAB de CV | 1,800 | 26,237 | ||||||
| Description | Number of Shares | Value | ||||||
Grupo Aeroportuario del Centro Norte SAB de CV | 5,400 | $ | 31,312 | |||||
Grupo Aeroportuario del Pacifico SAB de CV | 6,800 | 64,207 | ||||||
Grupo Aeroportuario del Sureste SAB de CV | 4,105 | 63,219 | ||||||
Grupo Bimbo SAB de CV | 9,200 | 28,015 | ||||||
Grupo Carso SAB de CV | 5,400 | 26,010 | ||||||
Grupo Elektra SA de CV | 1,460 | 27,452 | ||||||
Grupo Financiero Banorte SAB de CV | 26,000 | 147,827 | ||||||
Grupo Financiero Inbursa SAB de CV | 40,800 | 79,965 | ||||||
Grupo Mexico SAB de CV | 63,021 | 160,294 | ||||||
Grupo Televisa SAB | 39,200 | 228,529 | ||||||
Impulsora del Desarrollo y el Empleo en | ||||||||
America Latina SAB de CV* | 16,695 | 22,998 | ||||||
Industrias CH SAB de CV* | 7,500 | 31,239 | ||||||
Industrias Penoles SAB de CV | 3,930 | 61,399 | ||||||
Infraestructura Energetica Nova SAB de CV# | 10,500 | 40,957 | ||||||
Kimberly-Clark de Mexico SAB de CV Class A | 10,300 | 24,486 | ||||||
Mexichem SAB de CV | 11,505 | 29,062 | ||||||
Nemak SAB de CVW | 45,600 | 65,174 | ||||||
Organizacion Soriana SAB de CV* | 10,800 | 25,995 | ||||||
Promotora y Operadora de Infraestructura SAB de CV | 3,200 | 40,568 | ||||||
Telesites SAB de CV* | 18,461 | 11,374 | ||||||
TV Azteca SAB de CV | 95,000 | 13,087 | ||||||
Wal-Mart de Mexico SAB de CV | 38,500 | 95,150 | ||||||
|
| |||||||
TOTAL MEXICO | $ | 2,387,121 | ||||||
NETHERLANDS – 2.1% | ||||||||
Aegon NV | 50,296 | 288,650 | ||||||
ArcelorMittal, NY Reg Shares* | 15,899 | 89,511 | ||||||
ASML Holding NV | 9,790 | 946,132 | ||||||
BE Semiconductor Industries NV | 2,700 | 81,341 | ||||||
Boskalis Westminster | 1,712 | 71,366 | ||||||
Heineken NV | 24,909 | 2,334,541 | ||||||
ING Groep NV | 48,154 | 589,712 | ||||||
Koninklijke Ahold NV | 11,600 | 252,370 | ||||||
Koninklijke DSM NV | 2,897 | 177,671 | ||||||
Koninklijke Philips NV, NY Reg Shares | 16,942 | 465,893 | ||||||
NN Group NV | 1,672 | 57,934 | ||||||
PostNL NV* | 37,000 | 161,842 | ||||||
Steinhoff International Holdings NV# | 8,131 | 50,835 | ||||||
TNT Express NV* | 1,322 | 12,000 | ||||||
USG People NV | 159,152 | 3,172,762 | ||||||
|
| |||||||
TOTAL NETHERLANDS | $ | 8,752,560 | ||||||
NEW ZEALAND – 0.1% | ||||||||
Fletcher Building Ltd. | 44,933 | 261,664 | ||||||
NIGERIA – 0.0%** | ||||||||
Ecobank Transnational, Inc.* | 327,197 | 24,631 | ||||||
April 30, 2016 / ANNUAL REPORT
PORTFOLIOS OF INVESTMENTS 29
Wilmington Multi-Manager International Fund (continued)
| Description | Number of Shares | Value | ||||||
Forte Oil PLC | 18,204 | $ | 19,609 | |||||
|
| |||||||
TOTAL NIGERIA | $ | 44,240 | ||||||
NORWAY – 1.0% | ||||||||
DNB ASA# | 8,891 | 113,845 | ||||||
Norsk Hydro ASA# | 657,756 | 2,861,602 | ||||||
Salmar ASA# | 18,800 | 466,973 | ||||||
Statoil ASA# | 19,052 | 336,705 | ||||||
Storebrand ASA* | 3,766 | 15,945 | ||||||
Subsea 7 SA#, * | 2,902 | 26,707 | ||||||
Yara International ASA | 8,200 | 328,332 | ||||||
|
| |||||||
TOTAL NORWAY | $ | 4,150,109 | ||||||
PERU – 0.2% | ||||||||
Alicorp SA | 42,333 | 80,275 | ||||||
Cia de Minas Buenaventura SA ADR* | 7,400 | 75,110 | ||||||
Credicorp Ltd. | 1,410 | 205,042 | ||||||
Engie Energia Peru SA | 10,600 | 28,231 | ||||||
Ferreycorp SAA | 60,958 | 31,913 | ||||||
Grana y Montero SA | 15,912 | 22,182 | ||||||
InRetail Peru Corp.*,W | 1,288 | 21,896 | ||||||
Intercorp Financial Services, Inc. | 879 | 25,052 | ||||||
Luz del Sur SAA | 6,400 | 21,039 | ||||||
Sociedad Minera Cerro Verde SAA* | 1,400 | 27,734 | ||||||
Southern Copper Corp.# | 4,659 | 138,233 | ||||||
|
| |||||||
TOTAL PERU | $ | 676,707 | ||||||
PHILIPPINES – 0.3% | ||||||||
Aboitiz Equity Ventures, Inc. | 34,880 | 49,396 | ||||||
Aboitiz Power Corp. | 66,400 | 63,585 | ||||||
Alliance Global Group, Inc. | 57,000 | 17,627 | ||||||
Ayala Corp. | 4,030 | 66,268 | ||||||
Ayala Land, Inc. | 48,200 | 35,620 | ||||||
Bank of the Philippine Islands | 13,143 | 25,368 | ||||||
BDO Unibank, Inc. | 20,042 | 42,745 | ||||||
Bloomberry Resorts Corp.* | 158,600 | 14,410 | ||||||
D&L Industries, Inc. | 93,200 | 17,890 | ||||||
Energy Development Corp. | 215,400 | 27,059 | ||||||
First Gen Corp. | 40,500 | 17,491 | ||||||
Globe Telecom, Inc. | 745 | 34,861 | ||||||
GT Capital Holdings, Inc. | 780 | 22,741 | ||||||
JG Summit Holdings, Inc. | 33,750 | 58,664 | ||||||
Jollibee Foods Corp. | 16,600 | 81,287 | ||||||
LT Group, Inc. | 54,700 | 17,966 | ||||||
Manila Electric Co. | 8,080 | 59,108 | ||||||
Megaworld Corp. | 163,000 | 13,106 | ||||||
Metro Pacific Investments Corp. | 190,000 | 23,503 | ||||||
Metropolitan Bank & Trust Co. | 10,934 | 18,947 | ||||||
Philex Mining Corp.* | 106,450 | 13,418 | ||||||
| Description | Number of Shares | Value | ||||||
Philex Petroleum Corp.* | 18,097 | $ | 888 | |||||
Philippine Long Distance Telephone Co. | 2,610 | 95,577 | ||||||
Puregold Price Club, Inc. | 49,000 | 42,011 | ||||||
Robinsons Retail Holdings, Inc. | 20,320 | 33,370 | ||||||
Semirara Mining & Power Corp. | 9,100 | 24,648 | ||||||
SM Investments Corp. | 3,372 | 67,889 | ||||||
SM Prime Holdings, Inc. | 135,000 | 65,215 | ||||||
Universal Robina Corp. | 22,780 | 101,250 | ||||||
|
| |||||||
TOTAL PHILIPPINES | $ | 1,151,908 | ||||||
POLAND – 0.3% | ||||||||
AmRest Holdings SE* | 437 | 25,588 | ||||||
Asseco Poland SA | 3,456 | 52,425 | ||||||
Bank Pekao SA | 1,927 | 78,378 | ||||||
Bank Zachodni WBK SA | 330 | 22,954 | ||||||
BRE Bank SA* | 390 | 33,023 | ||||||
Budimex SA | 730 | 37,294 | ||||||
CCC SA | 978 | 43,558 | ||||||
Cyfrowy Polsat SA* | 6,760 | 43,001 | ||||||
Enea SA | 9,318 | 28,806 | ||||||
Energa SA | 7,095 | 23,124 | ||||||
Eurocash SA | 3,343 | 47,733 | ||||||
Grupa Azoty SA* | 1,421 | 32,352 | ||||||
Grupa Kety SA | 385 | 33,185 | ||||||
Grupa Lotos SA* | 2,600 | 20,217 | ||||||
ING Bank Slaski SA | 630 | 20,120 | ||||||
KGHM Polska Miedz SA | 3,711 | 72,296 | ||||||
Kruk SA | 437 | 21,810 | ||||||
LPP SA | 35 | 51,629 | ||||||
Netia SA | 12,067 | 15,965 | ||||||
Orange Polska SA# | 35,032 | 57,087 | ||||||
PGE SA | 23,451 | 80,977 | ||||||
Polski Koncern Naftowy Orlen SA | 5,529 | 99,587 | ||||||
Polskie Gornictwo Naftowe i Gazownictwo SA | 33,469 | 44,544 | ||||||
Powszechna Kasa Oszczednosci Bank Polski SA* | 12,038 | 77,143 | ||||||
Powszechny Zaklad Ubezpieczen SA | 7,930 | 71,718 | ||||||
Synthos SA | 18,649 | 19,885 | ||||||
Tauron Polska Energia SA | 26,391 | 20,466 | ||||||
|
| |||||||
TOTAL POLAND | $ | 1,174,865 | ||||||
PORTUGAL – 0.0%** | ||||||||
Banco Espirito Santo SA*,†† | 15,937 | — | ||||||
EDP Renovaveis SA | 5,470 | 42,654 | ||||||
|
| |||||||
TOTAL PORTUGAL | $ | 42,654 | ||||||
QATAR – 0.1% | ||||||||
Aamal Co.* | 11,600 | 41,685 | ||||||
ANNUAL REPORT / April 30, 2016
30 PORTFOLIOS OF INVESTMENTS
Wilmington Multi-Manager International Fund (continued)
| Description | Number of Shares | Value | ||||||
Al Meera Consumer Goods Co. QSC | 304 | $ | 17,305 | |||||
Barwa Real Estate Co. | 1,849 | 17,170 | ||||||
Commercial Bank QSC (The) | 2,530 | 26,621 | ||||||
Doha Bank QSC | 2,800 | 28,347 | ||||||
Gulf International Services QSC | 1,269 | 12,115 | ||||||
Industries Qatar QSC | 1,336 | 38,540 | ||||||
Masraf Al Rayan QSC | 2,896 | 27,210 | ||||||
Ooredoo QSC | 2,600 | 65,502 | ||||||
Qatar Electricity & Water Co. QSC | 983 | 56,389 | ||||||
Qatar Gas Transport Co. Nakilat | 5,973 | 37,989 | ||||||
Qatar Insurance Co. SAQ | 1,500 | 32,927 | ||||||
Qatar Islamic Bank SAQ | 675 | 18,211 | ||||||
Qatar National Bank SAQ | 2,250 | 89,013 | ||||||
Qatar National Cement Co. QSC | 858 | 20,696 | ||||||
Qatar Navigation QSC | 783 | 19,468 | ||||||
Vodafone Qatar QSC | 11,500 | 37,913 | ||||||
|
| |||||||
TOTAL QATAR | $ | 587,101 | ||||||
RUSSIA – 0.6% | ||||||||
CTC Media, Inc.* | 16,400 | 32,308 | ||||||
Gazprom OAO ADR | 62,326 | 323,472 | ||||||
Globaltrans Investment PLC GDR - Reg S | 5,480 | 20,906 | ||||||
Lenta Ltd. - Reg S* | 8,809 | 56,818 | ||||||
LSR Group PJSC GDR - Reg S | 17,440 | 39,240 | ||||||
Lukoil PJSC ADR | 4,792 | 203,882 | ||||||
Magnit OJSC GDR - Reg S | 5,267 | 182,238 | ||||||
Mail.Ru Group Ltd. GDR - Reg S* | 3,104 | 62,856 | ||||||
MegaFon OAO GDR - Reg S | 3,802 | 43,723 | ||||||
MMC Norilsk Nickel PJSC ADR | 10,443 | 154,034 | ||||||
Mobile TeleSystems PJSC ADR | 9,500 | 87,970 | ||||||
NLMK PJSC GDR - Reg S | 7,200 | 97,560 | ||||||
Novatek OAO GDR - Reg S | 862 | 82,752 | ||||||
OTCPharm PJSC* | 3,313 | 10,039 | ||||||
PhosAgro OAO GDR - Reg S | 2,564 | 37,499 | ||||||
Polymetal International PLC | 3,626 | 37,564 | ||||||
QIWI PLC ADR | 1,600 | 19,568 | ||||||
Rosneft OAO GDR - Reg S | 13,425 | 73,301 | ||||||
Rostelecom OJSC ADR | 6,038 | 54,221 | ||||||
RusHydro PJSC ADR | 63,960 | 68,252 | ||||||
Sberbank of Russia PJSC ADR | 32,617 | 261,588 | ||||||
Severstal OAO GDR - Reg S | 4,127 | 47,956 | ||||||
Sistema JSFC GDR - Reg S | 6,997 | 51,428 | ||||||
Tatneft PAO ADR | 2,779 | 87,122 | ||||||
VimpelCom Ltd. ADR | 8,900 | 33,909 | ||||||
VTB Bank PJSC GDR - Reg S | 29,850 | 63,939 | ||||||
X5 Retail Group NV GDR - Reg S* | 3,327 | 65,875 | ||||||
Yandex NV* | 5,900 | 120,773 | ||||||
|
| |||||||
TOTAL RUSSIA | $ | 2,420,793 | ||||||
| Description | Number of Shares | Value | ||||||
SINGAPORE – 0.3% | ||||||||
CapitaLand Ltd. | 23,005 | $ | 53,200 | |||||
City Developments Ltd. | 7,000 | 43,410 | ||||||
DBS Group Holdings Ltd. | 53,000 | 602,178 | ||||||
Golden Agri-Resources Ltd. | 126,000 | 37,476 | ||||||
Keppel Corp. Ltd. | 12,500 | 50,191 | ||||||
Oversea-Chinese Banking Corp. Ltd. | 6,400 | 41,736 | ||||||
Sembcorp Industries Ltd. | 300 | 645 | ||||||
Silverlake Axis Ltd. | 75,500 | 31,719 | ||||||
Singapore Airlines Ltd. | 7,500 | 64,134 | ||||||
United Overseas Bank Ltd. | 4,200 | 58,088 | ||||||
UOL Group Ltd. | 4,000 | 18,262 | ||||||
Wilmar International Ltd. | 146,200 | 403,318 | ||||||
|
| |||||||
TOTAL SINGAPORE | $ | 1,404,357 | ||||||
SOUTH AFRICA – 0.6% | ||||||||
African Bank Investments Ltd.#, *,†† | 36,266 | — | ||||||
Anglo American Platinum Ltd.* | 800 | 23,108 | ||||||
AngloGold Ashanti Ltd.* | 7,633 | 121,182 | ||||||
Aspen Pharmacare Holdings Ltd.* | 5,308 | 125,093 | ||||||
AVI Ltd. | 5,800 | 35,969 | ||||||
Barclays Africa Group Ltd. | 1,569 | 15,905 | ||||||
Barloworld Ltd. | 7,124 | 41,197 | ||||||
Bidvest Group Ltd. (The)# | 7,248 | 183,949 | ||||||
Clicks Group Ltd. | 7,500 | 54,778 | ||||||
Discovery Ltd. | 1,805 | 16,131 | ||||||
EOH Holdings Ltd. | 5,343 | 52,003 | ||||||
Exxaro Resources Ltd. | 4,427 | 27,911 | ||||||
FirstRand Ltd. | 17,628 | 56,654 | ||||||
Gold Fields Ltd. | 15,890 | 72,199 | ||||||
Grindrod Ltd.# | 17,500 | 17,592 | ||||||
Impala Platinum Holdings Ltd.* | 7,674 | 31,806 | ||||||
Life Healthcare Group Holdings Ltd. | 23,300 | 61,199 | ||||||
Mediclinic International PLC | 3,430 | 45,287 | ||||||
MMI Holdings Ltd. | 11,271 | 18,741 | ||||||
Mondi Ltd. | 2,200 | 42,265 | ||||||
Mr Price Group Ltd. | 1,281 | 16,273 | ||||||
MTN Group Ltd. | 20,937 | 219,235 | ||||||
Murray & Roberts Holdings Ltd. | 26,380 | 27,334 | ||||||
Naspers Ltd. | 1,402 | 192,369 | ||||||
Nedbank Group Ltd. | 1,119 | 14,314 | ||||||
Netcare Ltd. | 30,420 | 77,486 | ||||||
Pick n Pay Stores Ltd. | 8,300 | 43,071 | ||||||
PPC Ltd. | 10,921 | 11,508 | ||||||
Rand Merchant Investment Holdings Ltd. | 6,261 | 18,732 | ||||||
Remgro Ltd. | 1,196 | 21,475 | ||||||
Reunert Ltd. | 3,450 | 17,338 | ||||||
| April 30, 2016 / ANNUAL REPORT |
PORTFOLIOS OF INVESTMENTS 31
Wilmington Multi-Manager International Fund (continued)
| Description | Number of Shares | Value | ||||||
RMB Holdings Ltd. | 8,315 | $ | 33,931 | |||||
Sanlam Ltd.# | 4,426 | 21,453 | ||||||
Sasol Ltd. | 8,191 | 267,217 | ||||||
Shoprite Holdings Ltd. | 6,160 | 74,096 | ||||||
Sibanye Gold Ltd. | 14,690 | 55,312 | ||||||
SPAR Group Ltd. (The) | 3,100 | 46,330 | ||||||
Standard Bank Group Ltd. | 5,778 | 51,841 | ||||||
Steinhoff International Holdings NV # | 3,900 | 24,372 | ||||||
Tiger Brands Ltd. | 2,590 | 64,071 | ||||||
Vodacom Group Ltd. | 7,206 | 83,777 | ||||||
Wilson Bayly Holmes-Ovcon Ltd. | 2,700 | 23,045 | ||||||
Woolworths Holdings Ltd. | 2,704 | 17,401 | ||||||
|
| |||||||
TOTAL SOUTH AFRICA | $ | 2,464,950 | ||||||
SOUTH KOREA – 0.6% | ||||||||
AMOREPACIFIC Group | 533 | 109,488 | ||||||
Celltrion, Inc.* | 785 | 69,309 | ||||||
CJ Corp. | 160 | 30,051 | ||||||
Coway Co. Ltd. | 460 | 39,807 | ||||||
Daewoo Engineering & Construction Co. Ltd.* | 4,364 | 24,321 | ||||||
E-Mart Co. Ltd. | 260 | 41,873 | ||||||
Green Cross Corp. | 148 | 22,471 | ||||||
Green Cross Holdings Corp. | 622 | 19,216 | ||||||
GS Holdings | 600 | 29,121 | ||||||
Hana Financial Group, Inc. | 1,827 | 41,129 | ||||||
Hanmi Pharm Co. Ltd. | 50 | 26,198 | ||||||
Hanmi Science Co. Ltd. | 246 | 29,363 | ||||||
Hyosung Corp. | 300 | 32,254 | ||||||
Hyundai Department Store Co. Ltd. | 230 | 29,774 | ||||||
Hyundai Engineering & Construction Co. Ltd. | 900 | 31,754 | ||||||
Hyundai Glovis Co. Ltd. | 170 | 28,348 | ||||||
Hyundai Heavy Industries Co. Ltd.* | 297 | 30,237 | ||||||
Hyundai Mobis Co. Ltd. | 188 | 42,982 | ||||||
Hyundai Motor Co. | 471 | 59,319 | ||||||
Hyundai Steel Co. | 690 | 38,091 | ||||||
Industrial Bank of Korea | 3,500 | 37,322 | ||||||
Kangwon Land, Inc. | 1,000 | 37,432 | ||||||
KB Financial Group, Inc. | 881 | 26,908 | ||||||
Kia Motors Corp. | 755 | 31,740 | ||||||
Korea Aerospace Industries Ltd. | 510 | 30,348 | ||||||
Korea Electric Power Corp. | 3,730 | 202,312 | ||||||
Korea Zinc Co. Ltd. | 90 | 39,139 | ||||||
KT Corp. | 1,531 | 41,050 | ||||||
KT&G Corp. | 523 | 56,459 | ||||||
LG Chem Ltd. | 196 | 51,090 | ||||||
LG Corp. | 430 | 25,700 | ||||||
| Description | Number of Shares | Value | ||||||
LG Electronics, Inc. | 470 | $ | 24,007 | |||||
LG Household & Health Care Ltd. | 50 | 44,190 | ||||||
LG Uplus Corp. | 5,200 | 51,115 | ||||||
Lotte Chemical Corp. | 141 | 36,197 | ||||||
Medy-Tox, Inc. | 62 | 23,017 | ||||||
NAVER Corp. | 36 | 21,390 | ||||||
NH Investment & Securities Co. Ltd. | 2,868 | 25,045 | ||||||
Orion Corp. | 44 | 35,914 | ||||||
POSCO | 320 | 67,544 | ||||||
Samsung C&T Corp. | 297 | 34,147 | ||||||
Samsung Card Co. Ltd. | 1,000 | 34,053 | ||||||
Samsung Electronics Co. Ltd. GDR | 158 | 172,644 | ||||||
Samsung Fire & Marine Insurance Co. Ltd. | 88 | 22,745 | ||||||
Samsung Life Insurance Co. Ltd. | 231 | 22,200 | ||||||
Samsung SDI Co. Ltd. | 230 | 23,012 | ||||||
Samsung SDS Co. Ltd. | 226 | 33,819 | ||||||
Shinhan Financial Group Co. Ltd. | 1,792 | 65,741 | ||||||
SK Holdings Co. Ltd. | 135 | 26,540 | ||||||
SK Hynix, Inc. | 669 | 16,528 | ||||||
SK Innovation Co. Ltd. | 810 | 110,190 | ||||||
SK Telecom Co. Ltd. | 385 | 69,607 | ||||||
S-Oil Corp. | 640 | 48,924 | ||||||
ViroMed Co. Ltd.* | 202 | 24,997 | ||||||
Yuhan Corp. | 111 | 28,447 | ||||||
|
| |||||||
TOTAL SOUTH KOREA | $ | 2,416,619 | ||||||
SPAIN – 3.9% | ||||||||
Amadeus IT Holding SA | 63,141 | 2,873,200 | ||||||
Banco Bilbao Vizcaya Argentaria SA†† | 5,668 | 38,831 | ||||||
Banco Bilbao Vizcaya Argentaria SA | 260,732 | 1,786,241 | ||||||
Banco de Sabadell SA# | 25,776 | 49,260 | ||||||
Banco de Sabadell SA†† | 749 | 1,431 | ||||||
Banco Popular Espanol SA | 15,582 | 42,375 | ||||||
Banco Santander SA# | 134,620 | 681,486 | ||||||
CaixaBank SA | 19,415 | 58,446 | ||||||
Cemex Latam Holdings SA | 4,828 | 22,134 | ||||||
Distribuidora Internacional de Alimentacion SA | 10,900 | 60,483 | ||||||
Gamesa Corp. Tecnologica SA | 177,417 | 3,493,204 | ||||||
Gas Natural SDG SA | 16,400 | 341,119 | ||||||
Grifols SA | 105,969 | 2,304,861 | ||||||
Iberdrola SA | 528,158 | 3,751,995 | ||||||
Mapfre SA | 146,300 | 371,060 | ||||||
Repsol SA# | 26,815 | 351,415 | ||||||
|
| |||||||
TOTAL SPAIN | $ | 16,227,541 | ||||||
ANNUAL REPORT / April 30, 2016
32 PORTFOLIOS OF INVESTMENTS
Wilmington Multi-Manager International Fund (continued)
| Description | Number of Shares | Value | ||||||
SWEDEN – 1.8% | ||||||||
Atlas Copco AB Class A | 73,847 | $ | 1,910,902 | |||||
Boliden AB | 16,120 | 281,031 | ||||||
Evolution Gaming Group ABW | 11,300 | 405,257 | ||||||
Granges AB | 23,400 | 172,649 | ||||||
Hexpol AB | 13,700 | 141,599 | ||||||
Investor AB | 39,596 | 1,453,087 | ||||||
Meda AB | 2,882 | 53,151 | ||||||
Millicom International Cellular SA SDR | 280 | 16,178 | ||||||
Mycronic AB# | 22,700 | 177,378 | ||||||
Nordea Bank AB | 34,229 | 332,254 | ||||||
Saab AB | 3,600 | 123,146 | ||||||
Securitas AB Class B | 17,400 | 274,744 | ||||||
Skandinaviska Enskilda Banken AB | 39,183 | 374,243 | ||||||
Svenska Cellulosa AB SCA | 5,313 | 167,320 | ||||||
Svenska Handelsbanken Class A | 2,981 | 39,683 | ||||||
Swedbank AB | 3,758 | 81,052 | ||||||
Swedish Orphan Biovitrum AB#, * | 27,400 | 399,547 | ||||||
Tele2 AB | 3,497 | 33,357 | ||||||
Telefonaktiebolaget LM Ericsson Class B | 22,433 | 181,577 | ||||||
TeliaSonera AB | 106,174 | 507,041 | ||||||
Volvo AB | 35,800 | 419,055 | ||||||
|
| |||||||
TOTAL SWEDEN | $ | 7,544,251 | ||||||
SWITZERLAND – 6.4% | ||||||||
ABB Ltd.* | 18,110 | 382,853 | ||||||
Actelion Ltd.* | 15,878 | 2,565,506 | ||||||
Adecco SA | 2,017 | 129,834 | ||||||
Aryzta AG* | 1,900 | 73,778 | ||||||
Baloise Holding AG | 3,648 | 451,390 | ||||||
Bucher Industries AG | 1,000 | 239,654 | ||||||
Cembra Money Bank AG* | 5,100 | 349,552 | ||||||
Cie Financiere Richemont SA | 27,483 | 1,827,807 | ||||||
Clariant AG* | 5,021 | 94,998 | ||||||
Credit Suisse Group AG* | 40,200 | 610,564 | ||||||
Dufry AG* | 297 | 39,072 | ||||||
Givaudan SA | 1,224 | 2,411,508 | ||||||
Helvetia Holding AG | 600 | 322,735 | ||||||
Julius Baer Group Ltd.* | 1,070 | 45,742 | ||||||
LafargeHolcim Ltd.* | 26,295 | 1,330,403 | ||||||
Luxoft Holding, Inc.* | 600 | 34,686 | ||||||
Nestle SA | 29,498 | 2,198,590 | ||||||
Novartis AG | 37,234 | 2,841,164 | ||||||
OC Oerlikon Corp. AG* | 3,448 | 33,283 | ||||||
Rieter Holding AG* | 1,400 | 289,836 | ||||||
Roche Holding AG | 12,021 | 3,038,770 | ||||||
Swatch Group AG (The)# | 4,535 | 1,301,487 | ||||||
Swiss Life Holding AG* | 4,207 | 1,061,728 | ||||||
| Description | Number of Shares | Value | ||||||
Swiss Re AG | 9,998 | $ | 886,928 | |||||
Temenos Group AG* | 7,700 | 399,328 | ||||||
UBS Group AG | 160,720 | 2,781,145 | ||||||
Zurich Financial Services AG* | 4,233 | 947,383 | ||||||
|
| |||||||
TOTAL SWITZERLAND | $ | 26,689,724 | ||||||
TAIWAN – 0.5% | ||||||||
Advanced Semiconductor Engineering, Inc. | 18,804 | 17,695 | ||||||
Asia Cement Corp. | 50,000 | 44,570 | ||||||
Asustek Computer, Inc. | 2,700 | 23,733 | ||||||
AU Optronics Corp. | 63,126 | 18,398 | ||||||
Catcher Technology Co. Ltd. | 2,438 | 17,159 | ||||||
Cathay Financial Holding Co. Ltd. | 21,479 | 24,141 | ||||||
Cheng Shin Rubber Industry Co. Ltd. | 17,358 | 36,112 | ||||||
China Airlines Ltd.* | 158,000 | 51,682 | ||||||
China Development Financial Holding Corp. | 150,000 | 38,276 | ||||||
China Steel Corp. | 59,232 | 41,596 | ||||||
Chunghwa Telecom Co. Ltd. | 35,024 | 118,365 | ||||||
Compal Electronics, Inc. | 30,736 | 18,106 | ||||||
CTBC Financial Holding Co. Ltd. | 43,146 | 21,939 | ||||||
Delta Electronics, Inc. | 5,144 | 23,923 | ||||||
E.Sun Financial Holding Co. Ltd. | 33,250 | 18,453 | ||||||
Eclat Textile Co. Ltd. | 3,000 | 34,276 | ||||||
Eva Airways Corp.* | 31,000 | 15,378 | ||||||
Far Eastern Department Stores Co. Ltd. | 40,264 | 21,597 | ||||||
Far Eastern New Century Corp. | 36,475 | 27,311 | ||||||
Far EasTone Telecommunications Co. Ltd. | 11,000 | 24,829 | ||||||
Feng TAY Enterprise Co. Ltd. | 5,000 | 21,548 | ||||||
First Financial Holding Co. Ltd. | 41,858 | 20,505 | ||||||
Formosa Chemicals & Fibre Corp. | 26,198 | 66,931 | ||||||
Formosa Petrochemical Corp. | 11,990 | 34,089 | ||||||
Formosa Plastics Corp. | 22,601 | 56,270 | ||||||
Fubon Financial Holding Co. Ltd. | 18,314 | 22,287 | ||||||
Giant Manufacturing Co. Ltd. | 3,000 | 18,045 | ||||||
Hiwin Technologies Corp. | 7,000 | 30,819 | ||||||
Hon Hai Precision Industry Co. Ltd. | 45,958 | 109,861 | ||||||
Hotai Motor Co. Ltd. | 4,000 | 39,562 | ||||||
Hua Nan Financial Holdings Co. Ltd. | 42,541 | 20,642 | ||||||
Largan Precision Co. Ltd. | 1,000 | 70,381 | ||||||
Lite-On Technology Corp. | 18,573 | 22,631 | ||||||
MediaTek, Inc. | 7,082 | 50,503 | ||||||
Mega Financial Holding Co. Ltd. | 30,462 | 21,628 | ||||||
Nan Ya Plastics Corp. | 25,597 | 50,158 | ||||||
Novatek Microelectronics Corp. | 5,145 | 18,026 | ||||||
OBI Pharma, Inc.* | 4,000 | 47,189 | ||||||
Pou Chen Corp. | 26,157 | 33,007 | ||||||
President Chain Store Corp. | 7,496 | 53,106 | ||||||
Quanta Computer, Inc. | 16,571 | 26,717 | ||||||
April 30, 2016 / ANNUAL REPORT
PORTFOLIOS OF INVESTMENTS 33
Wilmington Multi-Manager International Fund (continued)
| Description | Number of Shares | Value | ||||||
Realtek Semiconductor Corp. | 5,515 | $ | 15,458 | |||||
Siliconware Precision Industries Co. Ltd. | 15,000 | 22,277 | ||||||
SinoPac Financial Holdings Co. Ltd. | 99,958 | 29,628 | ||||||
Tainan Spinning Co. Ltd. | 70,805 | 28,649 | ||||||
Taishin Financial Holding Co. Ltd. | 100,000 | 37,826 | ||||||
Taiwan Cement Corp. | 19,057 | 19,439 | ||||||
Taiwan Cooperative Financial Holding Co. Ltd. | 48,334 | 21,355 | ||||||
Taiwan Mobile Co. Ltd. | 12,874 | 42,510 | ||||||
Taiwan Semiconductor Manufacturing Co. Ltd. | 49,911 | 232,123 | ||||||
Tatung Co. Ltd.* | 116,916 | 18,270 | ||||||
Teco Electric and Machinery Co. Ltd. | 50,000 | 39,531 | ||||||
TTY Biopharm Co. Ltd. | 6,000 | 19,626 | ||||||
Tung Ho Steel Enterprise Corp. | 37,476 | 24,052 | ||||||
Uni-President Enterprises Corp. | 52,614 | 94,941 | ||||||
United Microelectronics Corp. | 59,000 | 21,951 | ||||||
Walsin Lihwa Corp.* | 120,000 | 31,439 | ||||||
Wistron Corp. | 35,348 | 20,933 | ||||||
Yuanta Financial Holding Co. Ltd. | 48,576 | 16,040 | ||||||
Yulon Motor Co. Ltd. | 27,640 | 24,338 | ||||||
|
| |||||||
TOTAL TAIWAN | $ | 2,231,830 | ||||||
THAILAND – 0.3% | ||||||||
Advanced Info Service PCL | 14,400 | 64,311 | ||||||
Airports of Thailand PCL | 4,400 | 49,379 | ||||||
Bangkok Bank PCL | 3,500 | 16,633 | ||||||
Bangkok Dusit Medical Services PCL | 89,000 | 60,641 | ||||||
Bangkok Expressway & Metro PCL | 96,074 | 16,365 | ||||||
BEC World PCL | 18,000 | 13,398 | ||||||
Berli Jucker PCL | 12,400 | 13,312 | ||||||
Big C Supercenter PCL | 2,700 | 19,324 | ||||||
BTS Group Holdings PCL | 75,000 | 19,754 | ||||||
Bumrungrad Hospital PCL | 7,100 | 41,263 | ||||||
Central Pattana PCL | 23,700 | 35,791 | ||||||
Charoen Pokphand Foods PCL | 34,200 | 23,303 | ||||||
CP ALL PCL | 41,400 | 54,224 | ||||||
Delta Electronics Thai-Foreign | 17,100 | 35,248 | ||||||
Electricity Generating PCL | 8,600 | 43,702 | ||||||
Glow Energy PCL | 19,500 | 49,406 | ||||||
Hana Microelectronics PCL | 80,200 | 76,343 | ||||||
Home Product Center PCL | 186,000 | 42,866 | ||||||
Indorama Ventures PCL | 27,800 | 22,683 | ||||||
Intouch Holdings PCL Class F | 9,300 | 14,045 | ||||||
IRPC PCL | 136,600 | 19,944 | ||||||
Kasikornbank PCL | 3,100 | 14,821 | ||||||
Krung Thai Bank PCL | 29,250 | 14,654 | ||||||
Minor International PCL | 32,200 | 34,339 | ||||||
PTT Exploration & Production PCL | 12,009 | 25,871 | ||||||
| Description | Number of Shares | Value | ||||||
PTT Global Chemical PCL | 18,681 | $ | 33,426 | |||||
PTT PCL | 7,500 | 65,273 | ||||||
Ratchaburi Electricity | ||||||||
Generating Holding PCL | 19,500 | 28,192 | ||||||
Robinson Department Store PCL | 26,000 | 38,334 | ||||||
Siam Cement PCL (The) | 5,050 | 70,842 | ||||||
Siam Commercial Bank PCL (The) | 4,200 | 16,052 | ||||||
Thai Beverage PCL | 44,669 | 24,745 | ||||||
Thai Oil PCL | 7,200 | 13,604 | ||||||
TMB Bank PCL | 272,000 | 17,754 | ||||||
Total Access Communication PCL | 9,500 | 9,179 | ||||||
True Corp. PCL | 76,353 | 16,285 | ||||||
|
| |||||||
TOTAL THAILAND | $ | 1,155,306 | ||||||
TURKEY – 0.3% | ||||||||
Akbank TAS | 18,056 | 55,497 | ||||||
Akenerji Elektrik Uretim AS* | 1 | — | ||||||
Aksa Akrilik Kimya Sanayii AS | 10,400 | 36,240 | ||||||
Anadolu Efes Biracilik Ve Malt Sanayii AS | 4,363 | 34,305 | ||||||
Arcelik AS | 7,125 | 47,848 | ||||||
Aygaz AS | 6,800 | 28,021 | ||||||
BIM Birlesik Magazalar AS | 4,817 | 106,050 | ||||||
Enka Insaat ve Sanayi AS | 11,299 | 19,625 | ||||||
Eregli Demir ve Celik Fabrikalari TAS | 49,990 | 83,436 | ||||||
Ford Otomotiv Sanayi A.S. | 2,640 | 35,477 | ||||||
Haci Omer Sabanci Holding AS | 14,053 | 50,727 | ||||||
Kardemir Karabuk Demir Celik Sanayi ve Ticaret AS Class D | 49,273 | 26,063 | ||||||
KOC Holding AS | 7,937 | 41,499 | ||||||
Koza Altin Isletmeleri AS* | 2,800 | 18,313 | ||||||
Petkim Petrokimya Holding AS* | 24,777 | 36,394 | ||||||
TAV Havalimanlari Holding AS | 7,050 | 41,096 | ||||||
Tekfen Holding AS | 18,500 | 39,539 | ||||||
Tofas Turk Otomobil Fabrikasi AS | 4,425 | 35,014 | ||||||
Tupras Turkiye Petrol Rafinerileri AS | 4,336 | 114,444 | ||||||
Turk Hava Yollari AO* | 6,597 | 16,269 | ||||||
Turk Telekomunikasyon AS | 14,990 | 36,216 | ||||||
Turkcell Iletisim Hizmetleri AS | 27,233 | 117,770 | ||||||
Turkiye Garanti Bankasi AS | 27,000 | 83,181 | ||||||
Turkiye Halk Bankasi AS | 5,652 | 21,715 | ||||||
Turkiye Is Bankasi | 13,285 | 23,313 | ||||||
Turkiye Vakiflar Bankasi Tao | 12,640 | 22,317 | ||||||
Ulker Biskuvi Sanayi AS | 2,822 | 22,471 | ||||||
Yapi ve Kredi Bankasi AS* | 18,065 | 27,633 | ||||||
|
| |||||||
TOTAL TURKEY | $ | 1,220,473 | ||||||
UNITED ARAB EMIRATES – 0.1% |
| |||||||
Abu Dhabi Commercial Bank PJSC | 17,059 | 30,654 | ||||||
ANNUAL REPORT / April 30, 2016
34 PORTFOLIOS OF INVESTMENTS
Wilmington Multi-Manager International Fund (continued)
| Description | Number of Shares | Value | ||||||
Abu Dhabi National Hotels | 32,000 | $ | 23,524 | |||||
Air Arabia PJSC | 52,120 | 17,596 | ||||||
Aldar Properties PJSC | 73,140 | 54,165 | ||||||
Arabtec Holding PJSC* | 50,342 | 22,341 | ||||||
Dana Gas PJSC* | 197,244 | 30,610 | ||||||
DP World Ltd. | 3,596 | 67,964 | ||||||
Dubai Financial Market PJSC | 56,800 | 23,661 | ||||||
Emaar Properties PJSC | 35,499 | 65,723 | ||||||
Emirates Telecommunications Group Co PJSC | 23,500 | 120,926 | ||||||
First Gulf Bank PJSC | 12,315 | 43,421 | ||||||
National Bank of Abu Dhabi PJSC | 13,958 | 33,746 | ||||||
Ras Al Khaimah Ceramics | 22,100 | 20,157 | ||||||
Union National Bank PJSC | 19,982 | 19,422 | ||||||
|
| |||||||
TOTAL UNITED ARAB EMIRATES | $ | 573,910 | ||||||
UNITED KINGDOM – 12.3% | ||||||||
3i Group PLC | 48,000 | 332,161 | ||||||
888 Holdings PLC | 65,700 | 207,355 | ||||||
Admiral Group PLC | 29,800 | 808,583 | ||||||
Aggreko PLC | 24,200 | 384,363 | ||||||
Anglo American PLC | 21,467 | 239,453 | ||||||
Antofagasta PLC# | 5,325 | 37,596 | ||||||
AstraZeneca PLC | 7,000 | 401,759 | ||||||
Aviva PLC | 25,700 | 162,373 | ||||||
BAE Systems PLC | 110,400 | 769,940 | ||||||
Barclays PLC ADR | 106,839 | 421,166 | ||||||
Barratt Developments PLC | 42,827 | 333,222 | ||||||
Berkeley Group Holdings PLC | 7,700 | 336,964 | ||||||
BP PLC# | 163,568 | 2,104,282 | ||||||
BT Group PLC | 29,000 | 187,799 | ||||||
Cairn Energy PLC* | 90,800 | 297,055 | ||||||
Carnival PLC ADR# | 1,057 | 53,431 | ||||||
Centrica PLC | 127,600 | 444,481 | ||||||
Chemring Group PLC | 67,744 | 141,548 | ||||||
Computacenter PLC | 14,558 | 177,830 | ||||||
Crest Nicholson Holdings PLC | 23,000 | 175,090 | ||||||
Debenhams PLC | 148,800 | 170,457 | ||||||
Diageo PLC | 90,545 | 2,442,264 | ||||||
Direct Line Insurance Group PLC | 42,350 | 223,943 | ||||||
Domino’s Pizza Group PLC | 14,600 | 195,942 | ||||||
Galliford Try PLC | 8,800 | 164,070 | ||||||
GlaxoSmithKline PLC | 20,500 | 437,024 | ||||||
Glencore Xstrata PLC | 252,549 | 601,123 | ||||||
HSBC Holdings PLC# | 105,420 | 1,356,255 | ||||||
IG Group Holdings PLC | 35,900 | 405,481 | ||||||
Indivior PLC | 172,436 | 405,145 | ||||||
ITC Ltd. GDR | 28,698 | 139,558 | ||||||
| Description | Number of Shares | Value | ||||||
ITV PLC | 813,909 | $ | 2,678,185 | |||||
J Sainsbury PLC# | 102,163 | 431,259 | ||||||
JD Sports Fashion PLC | 24,100 | 439,821 | ||||||
Kingfisher PLC | 25,125 | 133,593 | ||||||
Liberty Global PLC, Class A* | 10,764 | 406,126 | ||||||
Liberty Global PLC, Class C* | 13,327 | 487,768 | ||||||
Lloyds Banking Group PLC | 2,362,115 | 2,314,865 | ||||||
Lloyds Banking Group PLC ADR# | 8,042 | 32,088 | ||||||
London Stock Exchange Group PLC | 65,625 | 2,601,450 | ||||||
Meggitt PLC | 35,000 | 210,034 | ||||||
Micro Focus International PLC | 28,100 | 627,784 | ||||||
Mitchells & Butlers PLC | 47,200 | 185,313 | ||||||
Mitie Group PLC | 44,100 | 174,817 | ||||||
Mondi PLC | 7,900 | 150,984 | ||||||
Old Mutual PLC | 105,300 | 285,410 | ||||||
Paysafe Group PLC* | 70,100 | 390,452 | ||||||
Premier Foods PLC* | 201,280 | 114,700 | ||||||
Reckitt Benckiser Group PLC | 45,513 | 4,425,013 | ||||||
Rexam PLC | 3,747 | 34,218 | ||||||
Rightmove PLC | 3,200 | 180,388 | ||||||
Rio Tinto PLC | 81,738 | 2,747,531 | ||||||
Rolls Royce Holdings*,†† | 14,669,168 | 21,434 | ||||||
Rolls-Royce Holdings PLC* | 206,608 | 2,021,129 | ||||||
Royal Bank of Scotland Group PLC* | 15,326 | 63,908 | ||||||
Royal Dutch Shell PLC ADR# | 34,027 | 1,640,474 | ||||||
Royal Dutch Shell PLC Class B | 132,399 | 3,455,115 | ||||||
Royal Mail PLC | 8,714 | 61,995 | ||||||
Shire PLC | 46,658 | 2,904,919 | ||||||
Smiths Group PLC | 17,400 | 281,699 | ||||||
Standard Chartered PLC | 236,651 | 1,909,072 | ||||||
Vesuvius PLC | 33,100 | 155,394 | ||||||
Vodafone Group PLC ADR | 1,280,607 | 4,127,972 | ||||||
Weir Group PLC (The) | 28,463 | 499,067 | ||||||
WM Morrison Supermarkets PLC# | 113,863 | 317,936 | ||||||
|
| |||||||
TOTAL UNITED KINGDOM | $ | 51,069,626 | ||||||
UNITED STATES – 2.6% | ||||||||
Freeport-McMoRan, Inc. | 58,692 | 821,688 | ||||||
Las Vegas Sands Corp. | 90,492 | 4,085,714 | ||||||
Schlumberger Ltd.# | 34,720 | 2,789,405 | ||||||
Wynn Resorts Ltd.# | 34,296 | 3,028,337 | ||||||
|
| |||||||
TOTAL UNITED STATES | $ | 10,725,144 | ||||||
|
| |||||||
| TOTAL COMMON STOCKS (COST $354,491,778) | $ | 372,768,334 | ||||||
| INVESTMENT COMPANY – 0.0%** | ||||||||
DFA International Small Cap Value Portfolio | 307 | 5,862 | ||||||
|
| |||||||
| TOTAL INVESTMENT COMPANY (COST $6,633) | $ | 5,862 | ||||||
April 30, 2016 / ANNUAL REPORT
PORTFOLIOS OF INVESTMENTS 35
Wilmington Multi-Manager International Fund (continued)
| Description | Number of Shares | Value | ||||||
| PREFERRED STOCKS – 0.4% | ||||||||
BRAZIL – 0.3% | ||||||||
Alpargatas SA 2.82% | 10,197 | $ | 27,662 | |||||
Banco Bradesco SA 0.87% | 13,259 | 100,120 | ||||||
Braskem SA 2.31% | 3,300 | 23,614 | ||||||
Cia Energetica de Minas Gerais 7.09% | 12,676 | 25,173 | ||||||
Cia Energetica de Sao Paulo 18.70% | 7,200 | 29,958 | ||||||
Gerdau SA 1.62% | 13,300 | 30,357 | ||||||
Itau Unibanco Holding SA 0.62% | 6,486 | 62,045 | ||||||
Itausa - Investimentos Itau SA 0.77% | 12,510 | 31,318 | ||||||
Lojas Americanas SA 0.27% | 8,552 | 39,785 | ||||||
Petroleo Brasileiro SA 9.96%* | 88,659 | 263,199 | ||||||
Suzano Papel e Celulose SA 2.79% | 8,300 | 31,783 | ||||||
Telefonica Brasil SA 0.51% | 14,710 | 181,520 | ||||||
Usinas Siderurgicas de Minas Gerais SA 1.79% | 19,100 | 13,995 | ||||||
Vale SA 7.74% | 37,441 | 171,678 | ||||||
|
| |||||||
TOTAL BRAZIL | $ | 1,032,207 | ||||||
CHILE – 0.0%** | ||||||||
Embotelladora Andina SA 2.46% | 5,300 | 17,925 | ||||||
Sociedad Quimica y Minera de Chile SA 2.85% | 2,440 | 52,137 | ||||||
|
| |||||||
TOTAL CHILE | $ | 70,062 | ||||||
COLOMBIA – 0.0%** | ||||||||
Avianca Holdings SA 11.92% | 23,964 | 17,582 | ||||||
Grupo Argos SA 1.60% | 6,000 | 36,859 | ||||||
Grupo Aval Acciones y Valores 5.65% | 56,400 | 23,560 | ||||||
Grupo de Inversiones Suramericana SA 1.15% | 3,598 | 47,995 | ||||||
|
| |||||||
TOTAL COLOMBIA | $ | 125,996 | ||||||
GERMANY – 0.1% | ||||||||
Bayerische Motoren Werke AG 3.90% | 335 | 26,602 | ||||||
Porsche Automobil Holding SE 4.08% | 1,094 | 61,044 | ||||||
Volkswagen AG 3.69% | 1,532 | 221,822 | ||||||
|
| |||||||
TOTAL GERMANY | $ | 309,468 | ||||||
PHILIPPINES – 0.0%** | ||||||||
Ayala Land Voting 1.23%†† | 178,200 | 380 | ||||||
RUSSIA – 0.0%** | ||||||||
Surgutneftegas OAO ADR 20.17% | 17,580 | 98,235 | ||||||
|
| |||||||
TOTAL PREFERRED STOCKS (COST $1,985,827) | $ | 1,636,348 | ||||||
| MONEY MARKET FUND – 4.3% | ||||||||
Dreyfus Cash Management Fund, Institutional Shares, 0.27%^ | 17,955,299 | 17,955,299 | ||||||
|
| |||||||
TOTAL MONEY MARKET FUND (COST $17,955,299) | $ | 17,955,299 | ||||||
| Description | Number of Shares | Value | ||||||
| RIGHTS – 0.0%** | ||||||||
BRAZIL – 0.0%** | ||||||||
usinas siderurgicas*,†† | $ | 3,868 | — | |||||
THAILAND – 0.0%** | ||||||||
True Corp. PCL*,†† | 25,652 | 220 | ||||||
TUNISIA – 0.0%** | ||||||||
Societe D’Articles Hygieniques SA*,†† | 2,800 | 14 | ||||||
|
| |||||||
TOTAL RIGHTS (COST $0) | $ | 234 | ||||||
| CERTIFICATES – 0.1% | ||||||||
Citigroup Global Markets - | ||||||||
Citi Agility, Expire 4/24/18 | 227,608 | 326,828 | ||||||
HSBC Bank PLC – | ||||||||
Aditya Birla Nuvo Ltd., Expire 6/30/16 | 880 | 11,351 | ||||||
Kuwait Finance House, Expire 2/03/17 | 25,890 | 56,393 | ||||||
National Industries Group Holdings, Expire 9/04/18 | 84,800 | 23,863 | ||||||
|
| |||||||
TOTAL CERTIFICATES (COST $440,913) | $ | 418,435 | ||||||
| REAL ESTATE INVESTMENT TRUSTS – 0.8% | ||||||||
FRANCE – 0.7% | ||||||||
Unibail-Rodamco SE | 10,867 | 2,911,737 | ||||||
JAPAN – 0.1% | ||||||||
Invincible Investment Corp. | 452 | 349,195 | ||||||
MEXICO – 0.0%** | ||||||||
Fibra Uno Administracion SA de CV | 24,000 | 57,012 | ||||||
NIGERIA – 0.0%** | ||||||||
Afriland Properties PLC*,†† | 24,606 | — | ||||||
SOUTH AFRICA – 0.0%** | ||||||||
Growthpoint Properties Ltd. | 20,000 | 35,335 | ||||||
TURKEY – 0.0%** | ||||||||
Emlak Konut Gayrimenkul Yatirim Ortakligi AS | 38,700 | 41,632 | ||||||
UNITED KINGDOM – 0.0%** | ||||||||
British Land Co. PLC (The) | 6,005 | 63,087 | ||||||
Great Portland Estates PLC | 1,515 | 16,779 | ||||||
Land Securities Group PLC | 3,954 | 65,400 | ||||||
|
| |||||||
TOTAL UNITED KINGDOM | $ | 145,266 | ||||||
|
| |||||||
TOTAL REAL ESTATE INVESTMENT TRUSTS (COST $3,154,339) |
| $ | 3,540,177 | |||||
|
| |||||||
TOTAL INVESTMENTS IN SECURITIES – 95.2% (COST $378,034,789) |
| $ | 396,324,689 | |||||
ANNUAL REPORT / April 30, 2016
| 36 | PORTFOLIOS OF INVESTMENTS |
Wilmington Multi-Manager International Fund (continued)
Description |
Par Value |
Value | ||||||
| CASH COLLATERAL INVESTED FOR SECURITIES ON LOAN – 4.8% | ||||||||
REPURCHASE AGREEMENTS – 4.8% |
| |||||||
BNP Paribas Securities Corp., 0.29%, dated 4/29/16, due 5/02/16, repurchase price $3,791,982, collateralized by U.S. Government & Treasury Securities 0.00% to 7.63%, maturing 5/26/16 to 5/15/45; total market value of $3,867,728. | $ | 3,791,890 | $ | 3,791,890 | ||||
Citigroup Global Markets, Inc., 0.30%, dated 4/29/16, due 5/02/16, repurchase price $3,791,985, collateralized by U.S. Government & Treasury Securities 0.00% to 9.00%, maturing 6/30/17 to 5/01/46; total market value of $3,867,728. | 3,791,890 | 3,791,890 | ||||||
Daiwa Capital Markets America, 0.32%, dated 4/29/16, due 5/02/16, repurchase price $3,791,991, collateralized by U.S. Government & Treasury Securities 0.00% to 8.75%, maturing 5/05/16 to 9/09/49; total market value of $3,867,728. | 3,791,890 | 3,791,890 | ||||||
HSBC Securities USA, Inc., 0.27%, dated 4/29/16, due 5/02/16, repurchase price $3,791,975, collateralized by U.S. Government & Treasury Securities 0.00% to 7.25%, maturing 5/15/16 to 7/15/37; total market value of $3,867,737. | 3,791,890 | 3,791,890 | ||||||
Nomura Securities International, Inc., 0.32%, dated 4/29/16, due 5/02/16, repurchase price $3,791,991, collateralized by U.S. Government & Treasury Securities 0.00% to 9.50%, maturing 5/15/16 to 3/20/66; total market value of $3,867,728. | 3,791,890 | 3,791,890 | ||||||
TD Securities (USA) LLC, 0.30%, dated 4/29/16, due 5/02/16, repurchase price $997,737, collateralized by U.S. Government & Treasury Securities 1.38% to 4.50%, maturing 11/30/18 to 4/01/46; total market value of $1,017,666. | 997,712 | 997,712 | ||||||
|
| |||||||
TOTAL CASH COLLATERAL INVESTED FOR SECURITIES ON LOAN (COST $19,957,162) |
| $ | 19,957,162 | |||||
|
| |||||||
TOTAL INVESTMENTS – 100.0% (COST $397,991,951) |
| $ | 416,281,851 | |||||
| COLLATERAL FOR SECURITIES ON LOAN – (4.8%) | (19,957,162 | ) | ||||||
| OTHER ASSETS LESS LIABILITIES – 4.8% | 19,842,183 | |||||||
|
| |||||||
| TOTAL NET ASSETS – 100.0% | $ | 416,166,872 | ||||||
|
| |||||||
Cost of investments for Federal income tax purposes is $403,882,485. The net unrealized appreciation/(depreciation) of investments was $12,399,366. This consists of net unrealized appreciation from investment for those securities having an excess of value over cost of $46,086,883 and net unrealized depreciation from investments for those securities having an excess of cost over value of $33,687,517.
Various inputs are used in determining the value of the Fund’s investments. These inputs are summarized in the three broad levels listed below.
Level 1 – quoted prices in active markets for identical securities
Level 2 – other significant observable inputs (including quoted prices for similar securities, interest rates, prepayment speeds, credit risk, etc.)
Level 3 – significant unobservable inputs (including the Fund’s own assumptions in determining the fair value of investments)
April 30, 2016 / ANNUAL REPORT
PORTFOLIOS OF INVESTMENTS 37
Wilmington Multi-Manager International Fund (continued)
The following is a summary of the inputs used as of April 30, 2016 in valuing the Fund’s assets carried at fair value:
Level 1
| Level 2
| Level 3
| Total
| |||||||||||||
Assets | ||||||||||||||||
Investments in Securities | ||||||||||||||||
Common Stocks | ||||||||||||||||
Australia | $ | 20,411,979 | $ | — | $ | — | $ | 20,411,979 | ||||||||
Austria | 1,913,689 | — | — | 1,913,689 | ||||||||||||
Belgium | 7,838,830 | — | — | 7,838,830 | ||||||||||||
Brazil | 1,838,068 | — | — | 1,838,068 | ||||||||||||
Bulgaria | 3,081 | — | — | 3,081 | ||||||||||||
Canada | 14,003,917 | — | — | 14,003,917 | ||||||||||||
Chile | 1,140,329 | — | — | 1,140,329 | ||||||||||||
China | 9,318,873 | — | — | 9,318,873 | ||||||||||||
Colombia | 3,786,188 | — | — | 3,786,188 | ||||||||||||
Czech Republic | 348,027 | — | — | 348,027 | ||||||||||||
Denmark | 5,854,709 | — | — | 5,854,709 | ||||||||||||
Egypt | 556,823 | — | — | 556,823 | ||||||||||||
Finland | 4,173,379 | — | — | 4,173,379 | ||||||||||||
France | 35,592,362 | — | — | 35,592,362 | ||||||||||||
Germany | 35,477,079 | — | — | 35,477,079 | ||||||||||||
Ghana | 5,293 | — | — | 5,293 | ||||||||||||
Greece | 617,837 | — | — | 617,837 | ||||||||||||
Hong Kong | 5,800,780 | — | — | 5,800,780 | ||||||||||||
Hungary | 609,154 | — | — | 609,154 | ||||||||||||
India | 2,262,443 | — | — | 2,262,443 | ||||||||||||
Indonesia | 1,126,734 | — | — | 1,126,734 | ||||||||||||
Ireland | 1,700,266 | — | — | 1,700,266 | ||||||||||||
Israel | 3,649,498 | — | — | 3,649,498 | ||||||||||||
Italy | 2,136,964 | — | — | 2,136,964 | ||||||||||||
Japan | 64,999,073 | 33,910 | — | 65,032,983 | ||||||||||||
Kuwait | — | — | — | — | ||||||||||||
Lithuania | — | — | — | — | ||||||||||||
Luxembourg | 271,684 | — | — | 271,684 | ||||||||||||
Malaysia | 1,501,963 | — | — | 1,501,963 | ||||||||||||
Malta | 421,949 | — | — | 421,949 | ||||||||||||
Mexico | 2,387,121 | — | — | 2,387,121 | ||||||||||||
Netherlands | 8,752,560 | — | — | 8,752,560 | ||||||||||||
New Zealand | 261,664 | — | — | 261,664 | ||||||||||||
Nigeria | 44,240 | — | — | 44,240 | ||||||||||||
Norway | 4,150,109 | — | — | 4,150,109 | ||||||||||||
Peru | 676,707 | — | — | 676,707 | ||||||||||||
Philippines | 1,151,908 | — | — | 1,151,908 | ||||||||||||
Poland | 1,174,865 | — | — | 1,174,865 | ||||||||||||
Portugal | 42,654 | — | — | 42,654 | ||||||||||||
Qatar | 587,101 | — | — | 587,101 | ||||||||||||
Russia | 2,206,872 | 213,921 | — | 2,420,793 | ||||||||||||
Singapore | 1,404,357 | — | — | 1,404,357 | ||||||||||||
South Africa | 2,464,950 | — | — | 2,464,950 | ||||||||||||
South Korea | 2,416,619 | — | — | 2,416,619 | ||||||||||||
Spain | 16,187,279 | 40,262 | — | 16,227,541 | ||||||||||||
Sweden | 7,544,251 | — | — | 7,544,251 | ||||||||||||
Switzerland | 26,689,724 | — | — | 26,689,724 | ||||||||||||
Taiwan | 2,231,830 | — | — | 2,231,830 | ||||||||||||
ANNUAL REPORT / April 30, 2016
38 PORTFOLIOS OF INVESTMENTS
Wilmington Multi-Manager International Fund (continued)
Level 1
| Level 2
| Level 3
| Total
| |||||||||||||
Thailand | $ | 1,155,306 | $ | — | $ | — | $ | 1,155,306 | ||||||||
Turkey | 1,220,473 | — | — | 1,220,473 | ||||||||||||
United Arab Emirates | 573,910 | — | — | 573,910 | ||||||||||||
United Kingdom | 51,048,192 | 21,434 | — | 51,069,626 | ||||||||||||
United States | 10,725,144 | — | — | 10,725,144 | ||||||||||||
| Investment Company | 5,862 | — | — | 5,862 | ||||||||||||
| Preferred Stocks | ||||||||||||||||
Brazil | 1,032,207 | — | — | 1,032,207 | ||||||||||||
Chile | 70,062 | — | — | 70,062 | ||||||||||||
Colombia | 125,996 | — | — | 125,996 | ||||||||||||
Germany | 309,468 | — | — | 309,468 | ||||||||||||
Philippines | — | 380 | — | 380 | ||||||||||||
Russia | 98,235 | — | — | 98,235 | ||||||||||||
| Money Market Fund | 17,955,299 | — | — | 17,955,299 | ||||||||||||
| Rights | ||||||||||||||||
Brazil | — | — | — | — | ||||||||||||
Thailand | — | 220 | — | 220 | ||||||||||||
Tunisia | — | 14 | — | 14 | ||||||||||||
| Certificates | 326,828 | 91,607 | — | 418,435 | ||||||||||||
| Real Estate Investment Trusts | ||||||||||||||||
France | 2,911,737 | — | — | 2,911,737 | ||||||||||||
Japan | 349,195 | — | — | 349,195 | ||||||||||||
Mexico | 57,012 | — | — | 57,012 | ||||||||||||
Nigeria | — | — | — | — | ||||||||||||
South Africa | 35,335 | — | — | 35,335 | ||||||||||||
Turkey | 41,632 | — | — | 41,632 | ||||||||||||
United Kingdom | 145,266 | — | — | 145,266 | ||||||||||||
| Repurchase Agreements | — | 19,957,162 | — | 19,957,162 | ||||||||||||
|
|
|
|
|
|
|
| |||||||||
| Total Investments in Securities | 395,922,941 | 20,358,910 | — | 416,281,851 | ||||||||||||
|
|
|
|
|
|
|
| |||||||||
| Other Financial Instruments! | ||||||||||||||||
| Forward Foreign Currency Contracts | $ | — | $ | 43,856 | $ | — | $ | 43,856 | ||||||||
|
|
|
|
|
|
|
| |||||||||
| Total Assets | $ | 395,922,941 | $ | 20,402,766 | $ | — | $ | 416,325,707 | ||||||||
|
|
|
|
|
|
|
| |||||||||
| Liabilities | ||||||||||||||||
| Other Financial Instruments! | ||||||||||||||||
| Forward Foreign Currency Contracts | $ | — | $ | (5,644 | ) | $ | — | $ | (5,644 | ) | ||||||
|
|
|
|
|
|
|
| |||||||||
| Total Liabilities | $ | — | $ | (5,644 | ) | $ | — | $ | (5,644 | ) | ||||||
|
|
|
|
|
|
|
| |||||||||
| ! | Other financial instruments are derivative instruments not reflected in the value of total investments in securities in the Portfolio of Investments such as forward foreign currency contracts, which are valued at the unrealized appreciation (depreciation) on the instrument. |
| # | Security, or a portion thereof, is on loan. See Note 2 in Notes to Financial Statements. |
| * | Non-income producing security. |
| ^ | 7-Day net yield. |
| †† | Security is fair valued in accordance with procedures adopted by the Board of Trustees. See Note 2 in Notes to Financial Statements. At April 30, 2016, the value of these securities amounted to $62,310 representing 0.01% of total net assets. |
| W | Denotes a restricted security that may be resold without restriction to “qualified institutional buyers” as defined in Rule 144A under the Securities Act of 1933 and that the Fund has determined to be liquid under criteria established by the Fund’s Board of Trustees. At April 30, 2016, these liquid restricted securities amounted to $1,026,854 representing 0.2% of total net assets. |
| ** | Represents less than 0.05%. |
April 30, 2016 / ANNUAL REPORT
PORTFOLIOS OF INVESTMENTS 39
Wilmington Multi-Manager International Fund (continued)
The following acronyms are used throughout this Fund:
ADR - American Depositary Receipt
ETF - Exchange Traded Fund
GDR - Global Depositary Receipt
LLC - Limited Liability Corporation
MTN - Medium Term Note
PCL - Public Company Limited
PLC - Public Limited Company
REIT - Real Estate Investment Trust
At April 30, 2016, the International Fund had the following outstanding forward foreign currency contracts, which contractually obligates the Fund to deliver or receive currencies at specified future dates. The open contracts were as follows:
Settlement Date
| Counterparty
| Contracts to Deliver/Receive
| Contract
| Contracts at
| Unrealized
| |||||||||||
| CONTRACTS PURCHASED | ||||||||||||||||
| 5/2/2016 | RBC Investor Services BA | 32,971,178 Japanese Yen | $ | 296,658 | $ | 309,879 | $13,221 | |||||||||
| 5/2/2016 | Citigroup Global Markets | 31,278,194 Japanese Yen | 280,773 | 293,968 | 13,195 | |||||||||||
| 5/2/2016 | RBC Investor Services BA | 28,117,326 Japanese Yen | 253,941 | 264,261 | 10,320 | |||||||||||
| 5/2/2016 | Bank of New York | 6,068,757 Japanese Yen | 54,571 | 57,037 | 2,466 | |||||||||||
| 5/2/2016 | Citigroup Global Markets | 688,026 Swedish Krona | 85,307 | 85,677 | 370 | |||||||||||
| 5/2/2016 | Citigroup Global Markets | 53,197 Australian Dollar | 40,645 | 40,449 | (196) | |||||||||||
| 5/2/2016 | Bank of New York | 44,348 Euro | 50,312 | 50,781 | 469 | |||||||||||
| 5/2/2016 | Citigroup Global Markets | 37,899 Canadian Dollar | 30,228 | 30,206 | (22) | |||||||||||
| 5/2/2016 | Barclays Bank International | 25,248 Danish Krone | 3,853 | 3,885 | 32 | |||||||||||
| 5/2/2016 | WestPac Bank | 4,479 Euro | 5,068 | 5,128 | 60 | |||||||||||
| 5/3/2016 | Bank of New York | 160,088 Euro | 183,267 | 183,309 | 42 | |||||||||||
| 5/3/2016 | Deutsche Bank | 144,877 Hong Kong Dollar | 18,678 | 18,678 | — | |||||||||||
| 5/3/2016 | Bank of New York | 103,411 Pound Sterling | 151,126 | 151,100 | (26) | |||||||||||
| 5/3/2016 | Citigroup Global Markets | 96,578 Australian Dollar | 73,478 | 73,433 | (45) | |||||||||||
| 5/3/2016 | Citigroup Global Markets | 52,552 Canadian Dollar | 41,851 | 41,884 | 33 | |||||||||||
| 5/3/2016 | Barclays Bank International | 6,127 Pound Sterling | 8,951 | 8,952 | 1 | |||||||||||
| 5/4/2016 | Bank of New York | 93,186 Pound Sterling | 136,335 | 136,160 | (175) | |||||||||||
| 5/4/2016 | Deutsche Bank | 37,316 Hong Kong Dollar | 4,811 | 4,811 | — | |||||||||||
| 5/4/2016 | Bank of New York | 35,770 Pound Sterling | 52,249 | 52,266 | 17 | |||||||||||
| 5/4/2016 | Barclays Bank International | 2,179 Pound Sterling | 3,184 | 3,184 | — | |||||||||||
| 5/6/2016 | Bank of New York | 5,732,710 Japanese Yen | 51,481 | 53,886 | 2,405 | |||||||||||
| 5/6/2016 | Bank of New York | 1,194,302 Japanese Yen | 10,726 | 11,226 | 500 | |||||||||||
| 5/9/2016 | Bank of New York | 4,720,821 Japanese Yen | 43,674 | 44,378 | 704 | |||||||||||
| CONTRACTS SOLD | ||||||||||||||||
| 5/2/2016 | Citigroup Global Markets | 619,234 Danish Krone | 94,372 | 95,271 | (899) | |||||||||||
| 5/2/2016 | Bank of New York | 155,044 Swiss Franc | 160,385 | 161,622 | (1,237) | |||||||||||
| 5/2/2016 | Bank of New York | 44,440 Euro | 50,462 | 50,886 | (424) | |||||||||||
| 5/2/2016 | Bank of New York | 12,000 Swiss Franc | 12,512 | 12,509 | 3 | |||||||||||
| 5/2/2016 | WestPac Bank | 6,409 Canadian Dollar | 5,068 | 5,108 | (40) | |||||||||||
| 5/2/2016 | Barclays Bank International | 4,824 Canadian Dollar | 3,853 | 3,845 | 8 | |||||||||||
| 5/3/2016 | Citigroup Global Markets | 1,784,578 Danish Krone | 274,475 | 274,563 | (88) | |||||||||||
| 5/3/2016 | Citigroup Global Markets | 519,328 Swedish Krona | 64,618 | 64,670 | (52) | |||||||||||
| 5/3/2016 | Bank of New York | 144,093 Swiss Franc | 150,152 | 150,207 | (55) | |||||||||||
| 5/3/2016 | Bank of New York | 30,515 Euro | 34,940 | 34,941 | (1) | |||||||||||
| 5/3/2016 | Bank of New York | 29,794 Malaysian Ringgit | 7,615 | 7,627 | (12) | |||||||||||
| 5/3/2016 | Barclays Bank International | 11,218 Canadian Dollar | 8,951 | 8,941 | 10 | |||||||||||
| 5/3/2016 | Bank of New York | 3,732 Pound Sterling | 5,451 | 5,453 | (2) | |||||||||||
| 5/4/2016 | Bank of New York | 32,876 Danish Krone | 5,030 | 5,058 | (28) | |||||||||||
| 5/4/2016 | Bank of New York | 13,770 Swiss Franc | 14,265 | 14,357 | (92) | |||||||||||
ANNUAL REPORT / April 30, 2016
| 40 | PORTFOLIOS OF INVESTMENTS |
Wilmington Multi-Manager International Fund (concluded)
| Settlement Date | Counterparty | Contracts to Deliver/Receive | Contract Amount | Contracts at Value | Unrealized Appreciation (Depreciation) | |||||||||||
| CONTRACTS SOLD (continued) | ||||||||||||||||
| 5/4/2016 | Bank of New York | 8,066 Malaysian Ringgit | $ 2,062 | $ 2,064 | $ (2) | |||||||||||
| 5/4/2016 | Bank of New York | 5,527 Swiss Franc | 5,725 | 5,762 | (37 | ) | ||||||||||
| 5/4/2016 | Bank of New York | 5,313 Euro | 6,052 | 6,084 | (32) | |||||||||||
| 5/4/2016 | Barclays Bank International | 3,053 Swiss Franc | 3,184 | 3,184 | — | |||||||||||
| 5/9/2016 | Bank of New York | 11,340,753 Japanese Yen | 104,429 | 106,608 | (2,179) | |||||||||||
| NET UNREALIZED APPRECIATION (DEPRECIATION) ON FORWARD FOREIGN CURRENCY CONTRACTS | $ | 38,212 | ||||||||||||||
See Notes which are an integral part of the Financial Statements
April 30, 2016 / ANNUAL REPORT
41
PORTFOLIO OF INVESTMENTS SUMMARY TABLE
Wilmington Multi-Manager Alternatives Fund
At April 30, 2016, the Fund’s portfolio composition was as follows (unaudited):
| Percentage of Total Net Assets | |||||
Common Stocks | 39.6 | % | |||
Corporate Bonds | 20.5 | % | |||
Investment Companies | 13.3 | % | |||
U.S. Government Obligations | 1.9 | % | |||
Purchased Options | 0.0 | %3 | |||
Cash Equivalents1 | 24.6 | % | |||
Securities Sold Short | (20.4 | )% | |||
Written Options | (0.1 | )% | |||
Other Assets and Liabilities – Net2 | 20.6 | % | |||
|
| ||||
TOTAL | 100.0 | % | |||
|
| ||||
| (1) | Cash Equivalent includes investment in a money market fund. |
| (2) | Assets, other than investments in securities, less liabilities. See Statements of Assets and Liabilities. |
| (3) | Represents less than 0.05%. |
PORTFOLIO OF INVESTMENTS
April 30, 2016
Description | Number of Shares | Value | ||||||
| COMMON STOCKS – 39.6% | ||||||||
AEROSPACE & DEFENSE – 0.4% |
| |||||||
Northrop Grumman Corp.Ö | 2,732 | $ | 563,502 | |||||
AIRLINES – 0.6% |
| |||||||
International Consolidated Airlines Group SA | 47,642 | 366,322 | ||||||
Japan Airlines Co. Ltd. | 5,900 | 219,198 | ||||||
Qantas Airways Ltd.* | 168,853 | 413,409 | ||||||
|
| |||||||
TOTAL AIRLINES | $ | 998,929 | ||||||
AUTO COMPONENTS – 0.2% |
| |||||||
Magna International, Inc. | 7,000 | 294,014 | ||||||
BANKS – 0.6% |
| |||||||
CIT Group, Inc. | 17,600 | 608,432 | ||||||
Intesa Sanpaolo | 120,783 | 317,544 | ||||||
|
| |||||||
TOTAL BANKS | $ | 925,976 | ||||||
BIOTECHNOLOGY – 2.8% |
| |||||||
ACADIA Pharmaceuticals, Inc.* | 8,918 | 288,051 | ||||||
Actelion Ltd.* | 3,355 | 542,088 | ||||||
Alder Biopharmaceuticals, Inc.*,Ö | 13,000 | 345,150 | ||||||
Alexion Pharmaceuticals, Inc.* | 800 | 111,424 | ||||||
Amgen, Inc.Ö | 3,762 | 595,525 | ||||||
| Description | Number of Shares | Value | ||||||
Avexis, Inc.* | 4,597 | $ | 114,925 | |||||
Celgene Corp.*,Ö | 1,197 | 123,782 | ||||||
EPIRUS Biopharmaceuticals, Inc.* | 8,966 | 26,001 | ||||||
Gilead Sciences, Inc.Ö | 4,901 | 432,317 | ||||||
Minerva Neurosciences, Inc.* | 10,000 | 64,300 | ||||||
Neurocrine Biosciences, Inc.*,Ö | 6,698 | 305,295 | ||||||
Ophthotech Corp.*,Ö | 9,430 | 440,758 | ||||||
Otonomy, Inc.* | 4,672 | 66,623 | ||||||
ProQR Therapeutics NV* | 9,233 | 51,059 | ||||||
Radius Health, Inc.* | 4,600 | 163,760 | ||||||
Regeneron Pharmaceuticals, Inc.*,Ö | 835 | 314,553 | ||||||
Seattle Genetics, Inc.* | 4,422 | 156,893 | ||||||
United Therapeutics Corp.*,Ö | 2,933 | 308,552 | ||||||
|
| |||||||
TOTAL BIOTECHNOLOGY | $ | 4,451,056 | ||||||
BUILDING PRODUCTS – 0.2% |
| |||||||
Masco Corp.Ö | 12,016 | 369,011 | ||||||
CHEMICALS – 0.4% |
| |||||||
LyondellBasell Industries NV, Class AÖ | 2,092 | 172,946 | ||||||
Mitsubishi Chemical Holdings Corp. | 88,200 | 482,282 | ||||||
|
| |||||||
TOTAL CHEMICALS | $ | 655,228 | ||||||
ANNUAL REPORT / April 30, 2016
| 42 | PORTFOLIOS OF INVESTMENTS |
Wilmington Multi-Manager Alternatives Fund (continued)
| Description | Number of Shares | Value | ||||||
COMMERCIAL BANKS – 0.3% |
| |||||||
Chiba Bank Ltd. (The) | 77,000 | $ | 408,158 | |||||
COMMERCIAL SERVICES & SUPPLIES – 1.1% |
| |||||||
Sabre Corp.Ö | 59,500 | 1,722,525 | ||||||
COMMUNICATIONS EQUIPMENT – 0.3% |
| |||||||
Cisco Systems, Inc.Ö | 17,061 | 469,007 | ||||||
CONSTRUCTION MATERIALS – 0.7% |
| |||||||
Fletcher Building Ltd. | 1,134 | 6,604 | ||||||
Vulcan Materials Co.Ö | 9,746 | 1,048,962 | ||||||
|
| |||||||
TOTAL CONSTRUCTION MATERIALS |
| $ | 1,055,566 | |||||
CONTAINERS & PACKAGING – 0.3% |
| |||||||
CCL Industries, Inc. | 2,500 | 457,779 | ||||||
DIVERSIFIED CONSUMER SERVICES – 0.0%** |
| |||||||
Service Corp. International | 2,500 | 66,675 | ||||||
ELECTRIC UTILITIES – 0.0%** |
| |||||||
Fortis, Inc. | 100 | 3,172 | ||||||
FOOD & STAPLES RETAILING – 0.1% |
| |||||||
CVS Health Corp. | 2,200 | 221,100 | ||||||
FOOD PRODUCTS – 0.9% |
| |||||||
Archer-Daniels-Midland Co.Ö | 4,144 | 165,511 | ||||||
Pinnacle Foods, Inc. | 30,000 | 1,277,700 | ||||||
|
| |||||||
TOTAL FOOD PRODUCTS | $ | 1,443,211 | ||||||
HEALTH CARE EQUIPMENT & SUPPLIES – 2.9% |
| |||||||
ABIOMED, Inc.*,Ö | 3,597 | 349,413 | ||||||
Boston Scientific Corp.*,Ö | 20,454 | 448,352 | ||||||
Cooper Cos., Inc. (The) | 1,100 | 168,388 | ||||||
Edwards Lifesciences Corp.*,Ö | 2,675 | 284,112 | ||||||
Intuitive Surgical, Inc.* | 173 | 108,360 | ||||||
K2M Group Holdings, Inc.* | 11,990 | 194,957 | ||||||
LDR Holding Corp.*,Ö | 26,545 | 715,388 | ||||||
Medtronic PLC | 4,000 | 316,600 | ||||||
Neovasc, Inc.*,Ö | 34,239 | 109,907 | ||||||
Nevro Corp.*,Ö | 12,086 | 812,784 | ||||||
NuVasive, Inc.*,Ö | 8,184 | 433,261 | ||||||
STERIS PLCÖ | 5,000 | 353,350 | ||||||
Zeltiq Aesthetics, Inc.* | 13,271 | 396,803 | ||||||
|
| |||||||
TOTAL HEALTH CARE EQUIPMENT & SUPPLIES | $ | 4,691,675 | ||||||
HEALTH CARE PROVIDERS & |
| |||||||
AAC Holdings, Inc.*,Ö | 17,377 | 357,792 | ||||||
Amedisys, Inc.*,Ö | 11,804 | 607,788 | ||||||
AMN Healthcare Services, Inc.* | 4,227 | 150,101 | ||||||
Amsurg Corp.*,Ö | 4,221 | 341,817 | ||||||
Anthem, Inc. | 865 | 121,766 | ||||||
Brookdale Senior Living, Inc.* | 17,867 | 329,825 | ||||||
Centene Corp.*,Ö | 11,129 | 689,552 | ||||||
| Description | Number of Shares | Value | ||||||
Envision Healthcare Holdings, Inc.*,Ö | 31,279 | $ | 707,844 | |||||
HCA Holdings, Inc.*,Ö | 2,479 | 199,857 | ||||||
Henry Schein, Inc.* | 957 | 161,446 | ||||||
Laboratory Corp. of America Holdings*,Ö | 4,000 | 501,280 | ||||||
LHC Group, Inc.* | 1,815 | 73,217 | ||||||
Quest Diagnostics, Inc. | 2,937 | 220,774 | ||||||
Surgical Care Affiliates, Inc.*,Ö | 6,059 | 292,953 | ||||||
Tenet Healthcare Corp.*,Ö | 9,830 | 311,513 | ||||||
UnitedHealth Group, Inc. | 2,211 | 291,144 | ||||||
VCA, Inc.* | 1,730 | 108,938 | ||||||
|
| |||||||
TOTAL HEALTH CARE PROVIDERS & SERVICES |
| $ | 5,467,607 | |||||
HEALTH CARE TECHNOLOGY – 0.2% |
| |||||||
HMS Holdings Corp.* | 14,523 | 245,293 | ||||||
HOTELS, RESTAURANTS & LEISURE – 1.4% |
| |||||||
Carnival Corp.Ö | 7,746 | 379,941 | ||||||
Darden Restaurants, Inc.Ö | 6,248 | 388,938 | ||||||
Flight Centre Travel Group Ltd. | 15,694 | 469,085 | ||||||
McDonald’s Corp.Ö | 4,860 | 614,741 | ||||||
Starbucks Corp.Ö | 7,742 | 435,333 | ||||||
Tabcorp Holdings Ltd. | 4,147 | 13,969 | ||||||
|
| |||||||
TOTAL HOTELS, RESTAURANTS & LEISURE |
| $ | 2,302,007 | |||||
HOUSEHOLD DURABLES – 0.6% |
| |||||||
Berkeley Group Holdings PLC | 13,590 | 594,720 | ||||||
Iida Group Holdings Co. Ltd. | 8,600 | 169,009 | ||||||
Persimmon PLC | 9,087 | 263,824 | ||||||
|
| |||||||
TOTAL HOUSEHOLD DURABLES |
| $ | 1,027,553 | |||||
INDUSTRIAL CONGLOMERATES – 0.2% |
| |||||||
NWS Holdings Ltd. | 166,000 | 252,952 | ||||||
INSURANCE – 0.6% |
| |||||||
Dai-ichi Life Insurance Co. Ltd. (The) | 41,000 | 527,528 | ||||||
T&D Holdings, Inc. | 35,800 | 363,888 | ||||||
|
| |||||||
TOTAL INSURANCE | $ | 891,416 | ||||||
INTERNET & CATALOG RETAIL – 0.5% |
| |||||||
Amazon.com, Inc.*,Ö | 597 | 393,775 | ||||||
Expedia, Inc.Ö | 1,621 | 187,663 | ||||||
Liberty Interactive Corp., QVC Group, Class A*,Ö | 6,381 | 167,182 | ||||||
|
| |||||||
TOTAL INTERNET & CATALOG RETAIL |
| $ | 748,620 | |||||
INTERNET SOFTWARE & SERVICES – 2.7% |
| |||||||
Akamai Technologies, Inc.*,Ö | 4,288 | 218,645 | ||||||
Alphabet, Inc., Class A*,Ö | 688 | 487,021 | ||||||
Alphabet, Inc., Class C* | 355 | 246,019 | ||||||
eBay, Inc.*,Ö | 15,899 | 388,413 | ||||||
Facebook, Inc., Class A*,Ö | 18,320 | 2,154,066 | ||||||
April 30, 2016 / ANNUAL REPORT
| PORTFOLIOS OF INVESTMENTS | 43 |
Wilmington Multi-Manager Alternatives Fund (continued)
| Description | Number of Shares | Value | ||||||
Mixi, Inc. | 11,400 | $ | 405,000 | |||||
VeriSign, Inc.*,Ö | 5,153 | 445,219 | ||||||
|
| |||||||
TOTAL INTERNET SOFTWARE & SERVICES |
| $ | 4,344,383 | |||||
IT SERVICES – 0.9% |
| |||||||
Paychex, Inc.Ö | 10,225 | 532,927 | ||||||
Total System Services, Inc.Ö | 61 | 3,120 | ||||||
Visa, Inc., Class AÖ | 11,960 | 923,790 | ||||||
|
| |||||||
TOTAL IT SERVICES | $ | 1,459,837 | ||||||
LIFE SCIENCES TOOLS & SERVICES – 0.1% |
| |||||||
Thermo Fisher Scientific, Inc.Ö | 1,600 | 230,800 | ||||||
MACHINERY – 0.1% |
| |||||||
Yangzijiang Shipbuilding Holdings Ltd. | 215,200 | 158,418 | ||||||
MEDIA – 1.2% |
| |||||||
LKQ Corp.* | 55,400 | 1,775,570 | ||||||
TEGNA, Inc.Ö | 4,490 | 104,886 | ||||||
|
| |||||||
TOTAL MEDIA | $ | 1,880,456 | ||||||
MULTILINE RETAIL – 0.7% |
| |||||||
Dollar General Corp. | 13,000 | 1,064,830 | ||||||
OIL & GAS FIELD SERVICES – 0.0%** |
| |||||||
Columbia Pipeline Group, Inc.Ö | 162 | 4,150 | ||||||
OIL, GAS & CONSUMABLE FUELS – 1.9% |
| |||||||
Inpex Corp. | 42,800 | 357,283 | ||||||
Marathon Petroleum Corp.Ö | 8,496 | 332,024 | ||||||
Pioneer Natural Resources Co.Ö | 5,988 | 994,607 | ||||||
Tesoro Corp.Ö | 2,081 | 165,835 | ||||||
TonenGeneral Sekiyu K.K. | 61,000 | 600,254 | ||||||
Valero Energy Corp.Ö | 3,292 | 193,800 | ||||||
Veresen, Inc. | 16,600 | 120,131 | ||||||
Woodside Petroleum Ltd. | 15,900 | 342,619 | ||||||
|
| |||||||
TOTAL OIL, GAS & CONSUMABLE FUELS |
| $ | 3,106,553 | |||||
PERSONAL PRODUCTS – 0.2% |
| |||||||
Kose Corp. | 3,000 | 289,286 | ||||||
PHARMACEUTICALS – 1.3% |
| |||||||
AbbVie, Inc. | 5,770 | 351,970 | ||||||
Collegium Pharmaceutical, Inc.* | 13,870 | 264,362 | ||||||
Endocyte, Inc.* | 23,233 | 90,609 | ||||||
GW Pharmaceuticals PLC ADR* | 1,456 | 117,965 | ||||||
Merck KGaA | 1,845 | 173,383 | ||||||
Pacira Pharmaceuticals, Inc.* | 4,750 | 257,023 | ||||||
Shire PLC ADR | 700 | 131,194 | ||||||
Taro Pharmaceutical Industries Ltd.*,Ö | 3,126 | 436,827 | ||||||
Teva Pharmaceutical Industries Ltd. ADR | 4,604 | 250,688 | ||||||
|
| |||||||
TOTAL PHARMACEUTICALS | $ | 2,074,021 | ||||||
PROFESSIONAL SERVICES – 0.2% |
| |||||||
ManpowerGroup, Inc.Ö | 4,325 | 333,155 | ||||||
| Description | Number of Shares | Value | ||||||
REAL ESTATE INVESTMENT TRUSTS – 1.0% |
| |||||||
British Land Co. PLC (The) | 41,316 | $ | 434,054 | |||||
Extra Space Storage, Inc.Ö | 11,200 | 951,440 | ||||||
RioCan Real Estate Investment Trust | 10,700 | 232,642 | ||||||
|
| |||||||
TOTAL REAL ESTATE INVESTMENT TRUSTS |
| $ | 1,618,136 | |||||
REAL ESTATE MANAGEMENT & DEVELOPMENT – 0.4% |
| |||||||
Kerry Properties Ltd. | 182,000 | 496,242 | ||||||
Sino Land Co. Ltd. | 28,000 | 44,110 | ||||||
Swire Pacific Ltd. | 5,000 | 54,371 | ||||||
|
| |||||||
TOTAL REAL ESTATE MANAGEMENT & DEVELOPMENT |
| $ | 594,723 | |||||
ROAD & RAIL – 1.2% |
| |||||||
AMERCOÖ | 919 | 323,488 | ||||||
Kansas City SouthernÖ | 17,150 | 1,624,962 | ||||||
|
| |||||||
TOTAL ROAD & RAIL | $ | 1,948,450 | ||||||
SEMICONDUCTORS & SEMICONDUCTOR EQUIPMENT – 2.0% |
| |||||||
Broadcom Ltd.Ö | 4,430 | 645,673 | ||||||
Intel Corp.Ö | 7,238 | 219,167 | ||||||
Linear Technology Corp.Ö | 13,543 | 602,393 | ||||||
Maxim Integrated Products, Inc.Ö | 7,563 | 270,150 | ||||||
NVIDIA Corp.Ö | 9,141 | 324,780 | ||||||
NXP Semiconductors NV* | 8,000 | 682,240 | ||||||
Xilinx, Inc.Ö | 9,595 | 413,353 | ||||||
|
| |||||||
TOTAL SEMICONDUCTORS & SEMICONDUCTOR EQUIPMENT |
| $ | 3,157,756 | |||||
SOFTWARE – 3.2% |
| |||||||
Activision Blizzard, Inc.Ö | 11,619 | 400,507 | ||||||
CA, Inc.Ö | 15,249 | 452,285 | ||||||
CDK Global, Inc.Ö | 32,116 | 1,527,758 | ||||||
Constellation Software, Inc. | 1,000 | 390,803 | ||||||
Electronic Arts, Inc.*,Ö | 4,698 | 290,571 | ||||||
Intuit, Inc.Ö | 1,285 | 129,644 | ||||||
Nuance Communications, Inc.*,Ö | 22,369 | 384,299 | ||||||
salesforce.com, Inc.* | 13,420 | 1,017,236 | ||||||
Synopsys, Inc.*,Ö | 3,608 | 171,452 | ||||||
VMware, Inc., Class A*,Ö | 6,514 | 370,712 | ||||||
|
| |||||||
TOTAL SOFTWARE | $ | 5,135,267 | ||||||
SPECIALTY RETAIL – 2.9% |
| |||||||
AutoZone, Inc.* | 1,373 | 1,050,661 | ||||||
Foot Locker, Inc.Ö | 4,656 | 286,065 | ||||||
GameStop Corp.Ö | 9,412 | 308,714 | ||||||
Lowe’s Cos., Inc.Ö | 19,077 | 1,450,231 | ||||||
O’Reilly Automotive, Inc.*,Ö | 1,477 | 387,978 | ||||||
Sally Beauty Holdings, Inc.*,Ö | 37,835 | 1,188,019 | ||||||
|
| |||||||
TOTAL SPECIALTY RETAIL | $ | 4,671,668 | ||||||
TECHNOLOGY HARDWARE, STORAGE & PERIPHERALS – 0.2% |
| |||||||
HP, Inc.Ö | 24,639 | 302,321 | ||||||
ANNUAL REPORT / April 30, 2016
| 44 | PORTFOLIOS OF INVESTMENTS |
Wilmington Multi-Manager Alternatives Fund (continued)
Description | Number of Shares | Value | ||||||
Western Digital Corp.Ö | 80 | $ | 3,269 | |||||
|
| |||||||
TOTAL TECHNOLOGY HARDWARE, STORAGE & PERIPHERALS |
| $ | 305,590 | |||||
TOBACCO – 0.1% |
| |||||||
Altria Group, Inc.Ö | 1,566 | 98,204 | ||||||
TRANSPORTATION – 0.0%** |
| |||||||
Aurizon Holdings Ltd. | 1,668 | 5,415 | ||||||
TRANSPORTATION INFRASTRUCTURE – 0.0%** |
| |||||||
Hutchison Port Holdings TrustÖ | 46,000 | 21,160 | ||||||
WIRELESS TELECOMMUNICATION SERVICES – 0.6% |
| |||||||
KDDI Corp. | 14,300 | 425,909 | ||||||
NTT DOCOMO, Inc. | 21,800 | 532,092 | ||||||
|
| |||||||
TOTAL WIRELESS TELECOMMUNICATION SERVICES |
| $ | 958,001 | |||||
|
| |||||||
TOTAL COMMON STOCKS (COST $61,074,982) |
| $ | 63,192,291 | |||||
| INVESTMENT COMPANIES – 13.3% | ||||||||
ALTERNATIVE INVESTMENT FUNDS – 8.4% |
| |||||||
AQR Style Premia Alternative Fund* | 993,049 | 10,069,513 | ||||||
Arbitrage Fund, Class I | 261,476 | 3,412,266 | ||||||
|
| |||||||
TOTAL ALTERNATIVE INVESTMENT FUNDS |
| $ | 13,481,779 | |||||
DEBT FUND – 2.9% |
| |||||||
Professionally Managed Portfolios – The | ||||||||
Osterweis Strategic Income Fund, Class I | 424,644 | 4,594,646 | ||||||
EQUITY FUND – 2.0% |
| |||||||
Boston Partners Long/Short Research Fund | 212,311 | 3,146,443 | ||||||
|
| |||||||
TOTAL INVESTMENT COMPANIES (COST $21,615,102) |
| $ | 21,222,868 | |||||
| ||||||||
| Par Value | ||||||||
| CORPORATE BONDS – 20.5% | ||||||||
CONSUMER DISCRETIONARY – 9.1% |
| |||||||
Altice Luxembourg SA, | $ | 2,500,000 | $ | 2,425,000 | ||||
Boyd Gaming Corp., | 1,750,000 | 1,824,375 | ||||||
Cablevision Systems Corp., | 2,000,000 | 2,095,000 | ||||||
CHS/Community Health Systems, Inc., | 3,000,000 | 2,745,000 | ||||||
Frontier Communications Corp., Sr. Unsecured, 11.00%, 9/15/25W | 2,000,000 | 2,035,000 | ||||||
Univision Communications, Inc., | 2,350,000 | 2,464,563 | ||||||
West Corp., | 1,000,000 | 908,750 | ||||||
|
| |||||||
TOTAL CONSUMER DISCRETIONARY |
| $ | 14,497,688 | |||||
Description | Par Value | Value | ||||||
CONSUMER STAPLES – 1.6% |
| |||||||
Albertson’s Holdings LLC/Safeway, Inc., | ||||||||
Sr. Secured, 7.75%, 10/15/22W | $ | 2,376,000 | $ | 2,554,200 | ||||
DIVERSIFIED – 1.3% |
| |||||||
Argos Merger Sub, Inc., | ||||||||
Sr. Unsecured, 7.13%, 3/15/23W | 2,000,000 | 2,052,500 | ||||||
HEALTH CARE – 2.3% |
| |||||||
Concordia Healthcare Corp., | ||||||||
Sr. Unsecured, 7.00%, 4/15/23W | 2,400,000 | 2,244,000 | ||||||
Kinetics Concepts, Inc./KCI USA, Inc., | ||||||||
Multiple Guarantors, 12.50%, 11/01/19 | 1,450,000 | 1,402,875 | ||||||
|
| |||||||
TOTAL HEALTH CARE |
| $ | 3,646,875 | |||||
INDUSTRIALS – 2.6% |
| |||||||
Advanced Disposal/Services, Inc., | ||||||||
Company Guaranteed, 8.25%, 10/01/20 | 2,000,000 | 2,090,000 | ||||||
United Rentals North America, Inc., | ||||||||
Company Guaranteed, 7.38%, 5/15/20 | 2,000,000 | 2,090,000 | ||||||
|
| |||||||
TOTAL INDUSTRIALS |
| $ | 4,180,000 | |||||
INFORMATION TECHNOLOGY – 2.5% |
| |||||||
First Data Corp., | ||||||||
Sr. Unsecured, 7.00%, 12/01/23W | 1,500,000 | 1,546,874 | ||||||
Western Digital Corp., | ||||||||
Company Guaranteed, 10.50%, 4/01/24W | 2,500,000 | 2,443,750 | ||||||
|
| |||||||
TOTAL INFORMATION TECHNOLOGY |
| $ | 3,990,624 | |||||
TELECOMMUNICATION SERVICES – 1.1% |
| |||||||
Wind Acquisition Finance SA, | ||||||||
Company Guaranteed, 7.38%, 4/23/21W | 2,000,000 | 1,785,000 | ||||||
|
| |||||||
TOTAL CORPORATE BONDS (COST $32,951,748) |
| $ | 32,706,887 | |||||
| U.S. GOVERNMENT OBLIGATIONS – 1.9% | ||||||||
U.S. TREASURY BILL – 1.9% |
| |||||||
0.25%, 7/28/16Ö,‡ | 3,000,000 | 2,998,550 | ||||||
|
| |||||||
TOTAL U.S. GOVERNMENT OBLIGATION (COST $2,998,369) |
| $ | 2,998,550 | |||||
| Number of Shares | ||||||||
| MONEY MARKET FUND – 24.6% | ||||||||
Dreyfus Cash Management Fund, | 39,231,320 | $ | 39,231,320 | |||||
|
| |||||||
TOTAL MONEY MARKET FUND (COST $39,231,320) |
| $ | 39,231,320 | |||||
April 30, 2016 / ANNUAL REPORT
| PORTFOLIOS OF INVESTMENTS | 45 |
Wilmington Multi-Manager Alternatives Fund (continued)
| Description | Contracts | Value | ||||||
| PURCHASED OPTIONS – 0.0%** | ||||||||
CALL OPTIONS – 0.0%** | ||||||||
S&P 500 Index, Strike Price $2,195.00, Expiring 5/09/2016 | 16 | $ | 7 | |||||
S&P 500 Index, Strike Price $2,200.00, Expiring 5/04/2016 | 17 | — | ||||||
S&P 500 Index, Strike Price $2,200.00, Expiring 5/06/2016 | 16 | 48 | ||||||
S&P 500 Index, Strike Price $2,210.00, Expiring 5/02/2016 | 16 | — | ||||||
S&P 500 Index, Strike Price $2,220.00, Expiring 5/11/2016 | 16 | 9 | ||||||
S&P 500 Index, Strike Price $2,220.00, Expiring 5/23/2016 | 12 | 163 | ||||||
S&P 500 Index, Strike Price $2,225.00, Expiring 5/13/2016 | 16 | 80 | ||||||
S&P 500 Index, Strike Price $2,230.00, Expiring 5/16/2016 | 16 | 57 | ||||||
S&P 500 Index, Strike Price $2,230.00, Expiring 5/20/2016 | 12 | 120 | ||||||
S&P 500 Index, Strike Price $2,235.00, Expiring 5/25/2016 | 12 | 136 | ||||||
S&P 500 Index, Strike Price $2,250.00, Expiring 5/18/2016 | 12 | 55 | ||||||
|
| |||||||
TOTAL CALL OPTIONS | $ | 675 | ||||||
PUT OPTIONS – 0.0%** | ||||||||
S&P 500 Index, Strike Price $1,850.00, Expiring 5/04/2016 | 17 | 1 | ||||||
S&P 500 Index, Strike Price $1,850.00, Expiring 5/09/2016 | 16 | 125 | ||||||
S&P 500 Index, Strike Price $1,865.00, Expiring 5/06/2016 | 16 | 800 | ||||||
S&P 500 Index, Strike Price $1,880.00, Expiring 5/02/2016 | 16 | — | ||||||
S&P 500 Index, Strike Price $1,880.00, Expiring 5/11/2016 | 16 | 559 | ||||||
S&P 500 Index, Strike Price $1,885.00, Expiring 5/20/2016 | 12 | 2,400 | ||||||
S&P 500 Index, Strike Price $1,890.00, Expiring 5/13/2016 | 16 | 2,000 | ||||||
S&P 500 Index, Strike Price $1,890.00, Expiring 5/23/2016 | 12 | 3,262 | ||||||
S&P 500 Index, Strike Price $1,900.00, Expiring 5/16/2016 | 16 | 2,470 | ||||||
S&P 500 Index, Strike Price $1,900.00, Expiring 5/25/2016 | 12 | 4,352 | ||||||
S&P 500 Index, Strike Price $1,915.00, Expiring 5/18/2016 | 12 | 3,077 | ||||||
|
| |||||||
TOTAL PUT OPTIONS | $ | 19,046 | ||||||
|
| |||||||
| TOTAL PURCHASED OPTIONS | ||||||||
(COST $39,615) | $ | 19,721 | ||||||
|
| |||||||
| TOTAL INVESTMENTS IN SECURITIES – 99.9% | ||||||||
(COST $157,911,136) | $ | 159,371,637 | ||||||
| Description | Number of Shares | Value | ||||||
| SECURITIES SOLD SHORT – (20.4%) | ||||||||
CONSUMER DISCRETIONARY – (0.9%) |
| |||||||
AUTOMOBILES – (0.1%) | ||||||||
Porsche Automobil Holding SE 4.08% |
| |||||||
Preference | (3,808 | ) | $ | (212,481 | ) | |||
HOTELS, RESTAURANTS & LEISURE – (0.1%) |
| |||||||
Starbucks Corp. | (2,150 | ) | (120,895 | ) | ||||
MEDIA – (0.1%) | ||||||||
Altice NV – A* | (16,153 | ) | (245,073 | ) | ||||
Charter Communications, Inc.* | (19 | ) | (4,033 | ) | ||||
|
| |||||||
TOTAL MEDIA | $ | (249,106 | ) | |||||
MULTILINE RETAIL – (0.4%) |
| |||||||
Dollar Tree, Inc.* | (4,497 | ) | (358,456 | ) | ||||
Don Quijote Holdings Co., Ltd. | (6,600 | ) | (246,570 | ) | ||||
|
| |||||||
TOTAL MULTILINE RETAIL |
| $ | (605,026 | ) | ||||
SPECIALTY RETAIL – (0.2%) |
| |||||||
Advance Auto Parts, Inc. | (1,724 | ) | (269,116 | ) | ||||
|
| |||||||
TOTAL CONSUMER DISCRETIONARY |
| $ | (1,456,624) | |||||
CONSUMER STAPLES – (0.1%) |
| |||||||
FOOD & STAPLES RETAILING – (0.1%) |
| |||||||
Tesco PLC* | (73,042 | ) | (183,675 | ) | ||||
ENERGY – (2.3%) |
| |||||||
ENERGY EQUIPMENT & SERVICES – (0.5%) |
| |||||||
Halliburton Co. | (8,985 | ) | (371,170 | ) | ||||
National Oilwell Varco, Inc. | (4,813 | ) | (173,461 | ) | ||||
Tenaris SA | (14,889 | ) | (200,834 | ) | ||||
|
| |||||||
TOTAL ENERGY EQUIPMENT & SERVICES |
| $ | (745,465 | ) | ||||
OIL, GAS & CONSUMABLE FUELS – (1.8%) |
| |||||||
Apache Corp. | (4,416 | ) | (240,230 | ) | ||||
Cabot Oil & Gas Corp. | (11,477 | ) | (268,562 | ) | ||||
California Resources Corp.* | (440 | ) | (968 | ) | ||||
Cheniere Energy, Inc.* | (6,790 | ) | (263,995 | ) | ||||
Cimarex Energy Co. | (1,495 | ) | (162,776 | ) | ||||
Continental Resources, Inc.* | (4,035 | ) | (150,344 | ) | ||||
EOG Resources, Inc. | (3,528 | ) | (291,483 | ) | ||||
EQT Corp. | (625 | ) | (43,813 | ) | ||||
Lundin Petroleum AB* | (19,659 | ) | (368,188 | ) | ||||
Noble Energy, Inc. | (9,112 | ) | (329,034 | ) | ||||
Occidental Petroleum Corp. | (4,533 | ) | (347,454 | ) | ||||
ANNUAL REPORT / April 30, 2016
| 46 | PORTFOLIOS OF INVESTMENTS |
Wilmington Multi-Manager Alternatives Fund (continued)
| Description | Number of Shares | Value | ||||||
Pioneer Natural Resources Co. | (2,039 | ) | $ | (338,678 | ) | |||
Whiting Petroleum Corp.* | (6,805 | ) | (81,660 | ) | ||||
|
| |||||||
TOTAL OIL, GAS & CONSUMABLE FUELS | $ | (2,887,185 | ) | |||||
|
| |||||||
TOTAL ENERGY | $ | (3,632,650 | ) | |||||
FINANCIALS – (3.3%) | ||||||||
BANKS – (0.8%) |
| |||||||
Banco de Sabadell SA | (3,655 | ) | (6,985 | ) | ||||
Banco de Sabadell SA | (125,783 | ) | (240,384 | ) | ||||
Banco Popular Espanol | (41,683 | ) | (113,357 | ) | ||||
Bank Of The Ozarks, Inc. | (6,450 | ) | (266,385 | ) | ||||
Lloyds Banking Group PLC | (220,358 | ) | (215,950 | ) | ||||
Royal Bank Of Scotland Group PLC* | (122,529 | ) | (411,778 | ) | ||||
Seven Bank Ltd. | (1,400 | ) | (6,197 | ) | ||||
|
| |||||||
TOTAL BANKS | $ | (1,261,036) | ||||||
CAPITAL MARKETS – (0.2%) |
| |||||||
BlackRock, Inc. | (500 | ) | (178,165 | ) | ||||
Deutsche Bank AG | (8,597 | ) | (162,131 | ) | ||||
E*TRADE Financial Corp.* | (722 | ) | (18,180 | ) | ||||
|
| |||||||
TOTAL CAPITAL MARKETS | $ | (358,476 | ) | |||||
COMMERCIAL BANKS – (0.3%) |
| |||||||
Standard Chartered PLC | (48,023 | ) | (387,403 | ) | ||||
CONSUMER FINANCE – (0.1%) |
| |||||||
Acom Co., Ltd* | (24,100 | ) | (131,825 | ) | ||||
DIVERSIFIED FINANCIAL SERVICES – (0.2%) |
| |||||||
FactSet Research Systems, Inc. | (1,700 | ) | (256,275 | ) | ||||
Moody’s Corp. | (1,160 | ) | (111,035 | ) | ||||
|
| |||||||
TOTAL DIVERSIFIED FINANCIAL SERVICES | $ | (367,310 | ) | |||||
INSURANCE – (0.1%) |
| |||||||
St James Place Capital | (4,898 | ) | (62,049 | ) | ||||
REAL ESTATE INVESTMENT TRUSTS – (0.8%) |
| |||||||
American Tower Corp. | (4,585 | ) | (480,875 | ) | ||||
HCP, Inc. | (11,068 | ) | (374,430 | ) | ||||
Klepierre | (847 | ) | (39,837 | ) | ||||
Omega Healthcare Investors, Inc. | (3,880 | ) | (131,028 | ) | ||||
Welltower, Inc. | (3,951 | ) | (274,278 | ) | ||||
|
| |||||||
TOTAL REAL ESTATE INVESTMENT TRUSTS | $ | (1,300,448 | ) | |||||
REAL ESTATE MANAGEMENT & |
| |||||||
Hulic Co., Ltd. | (47,100 | ) | (486,936 | ) | ||||
Mitsubishi Estate Co., Ltd. | (16,000 | ) | (318,947 | ) | ||||
NTT Urban Development Corp. | (37,800 | ) | (370,895 | ) | ||||
| Description | Number of Shares | Value | ||||||
Tokyo Tatemono Co., Ltd. | (8,300 | ) | $ | (113,735 | ) | |||
|
| |||||||
TOTAL REAL ESTATE MANAGEMENT & DEVELOPMENT |
| $ | (1,290,513 | ) | ||||
|
| |||||||
TOTAL FINANCIALS | $ | (5,159,060 | ) | |||||
HEALTH CARE – (6.1%) | ||||||||
BIOTECHNOLOGY – (1.9%) |
| |||||||
Adamas Pharmaceuticals, Inc.* | (4,601 | ) | (77,665 | ) | ||||
Agios Pharmaceuticals, Inc.* | (3,922 | ) | (191,982 | ) | ||||
Alnylam Pharmaceuticals, Inc.* | (3,926 | ) | (263,199 | ) | ||||
AMAG Pharmaceuticals, Inc.* | (7,293 | ) | (193,410 | ) | ||||
Axovant Sciences Ltd.* | (3,711 | ) | (48,243 | ) | ||||
BioMarin Pharmaceutical, Inc.* | (2,440 | ) | (206,619 | ) | ||||
Celgene Corp. | (4,550 | ) | (470,516 | ) | ||||
Editas Medicine, Inc.* | (8,133 | ) | (268,796 | ) | ||||
Emergent BioSolutions, Inc.* | (5,629 | ) | (216,829 | ) | ||||
Gilead Sciences, Inc. | (3,480 | ) | (306,971 | ) | ||||
Halozyme Therapeutics, Inc.* | (7,993 | ) | (84,326 | ) | ||||
ImmunoGen, Inc.* | (6,260 | ) | (42,881 | ) | ||||
Intrexon Corp.* | (2,815 | ) | (75,245 | ) | ||||
Ironwood Pharmaceuticals, Inc.* | (5,372 | ) | (56,137 | ) | ||||
Kite Pharma, Inc.* | (232 | ) | (10,737 | ) | ||||
MediciNova, Inc.* | (10,432 | ) | (71,772 | ) | ||||
Regeneron Pharmaceuticals* | (904 | ) | (340,546 | ) | ||||
Spark Therapeutics, Inc.* | (1,976 | ) | (70,919 | ) | ||||
|
| |||||||
TOTAL BIOTECHNOLOGY | $ | (2,996,793) | ||||||
HEALTH CARE EQUIPMENT & |
| |||||||
Neogen Corp.* | (5,599 | ) | (264,497 | ) | ||||
Stryker Corp. | (4,201 | ) | (457,951 | ) | ||||
Zimmer Holdings, Inc. | (2,830 | ) | (327,629 | ) | ||||
|
| |||||||
TOTAL HEALTH CARE EQUIPMENT & SUPPLIES | $ | (1,050,077 | ) | |||||
HEALTH CARE PROVIDERS & |
| |||||||
Amerisourcebergen Corp. | (4,279 | ) | (364,143 | ) | ||||
Cardinal Health, Inc. | (2,171 | ) | (170,337 | ) | ||||
Cigna Corp. | (2,000 | ) | (277,080 | ) | ||||
Express Scripts Holding Co.* | (6,491 | ) | (478,581 | ) | ||||
Humana, Inc. | (1,453 | ) | (257,283 | ) | ||||
McKesson Corp. | (2,302 | ) | (386,322 | ) | ||||
MEDNAX, Inc.* | (7,080 | ) | (504,733 | ) | ||||
Select Medical Holdings Corp.* | (14,000 | ) | (187,320 | ) | ||||
Team Health Holdings, Inc.* | (1,927 | ) | (80,606 | ) | ||||
|
| |||||||
TOTAL HEALTH CARE PROVIDERS & SERVICES | $ | (2,706,405 | ) | |||||
HEALTH CARE TECHNOLOGY – (0.5%) |
| |||||||
Computer Programs & Systems | (5,201 | ) | (266,967 | ) | ||||
April 30, 2016 / ANNUAL REPORT
| PORTFOLIOS OF INVESTMENTS | 47 |
Wilmington Multi-Manager Alternatives Fund (continued)
| Description | Number of Shares | Value | ||||||
M3, Inc. | (14,400 | ) | $ | (407,368 | ) | |||
Veeva Systems, Inc.* | (3,382 | ) | (93,039 | ) | ||||
|
| |||||||
TOTAL HEALTH CARE TECHNOLOGY |
| $ | (767,374 | ) | ||||
LIFE SCIENCES TOOLS & SERVICES – (0.6%) |
| |||||||
Cambrex Corp.* | (5,040 | ) | (243,130 | ) | ||||
Luminex Corp.* | (16,160 | ) | (324,816 | ) | ||||
Quintiles Transnational Hold* | (4,768 | ) | (329,326 | ) | ||||
|
| |||||||
TOTAL LIFE SCIENCES TOOLS & SERVICES |
| $ | (897,272 | ) | ||||
PHARMACEUTICALS – (0.8%) |
| |||||||
Allergan PLC* | (2,592 | ) | (561,324 | ) | ||||
Merck & Co., Inc. | (5,220 | ) | (286,265 | ) | ||||
Perrigo Co. PLC | (2,500 | ) | (241,675 | ) | ||||
Sagent Pharmaceuticals, Inc.* | (10,503 | ) | (122,255 | ) | ||||
Valeant Pharmaceuticals International, Inc.* | (3,982 | ) | (132,840 | ) | ||||
|
| |||||||
TOTAL PHARMACEUTICALS | $ | (1,344,359) | ||||||
|
| |||||||
TOTAL HEALTH CARE | $ | (9,762,280 | ) | |||||
INDUSTRIALS – (0.4%) | ||||||||
AIR FREIGHT & LOGISTICS – (0.2%) |
| |||||||
Expeditors International of Washington, Inc. | (5,740 | ) | (284,761 | ) | ||||
BUILDING PRODUCTS – (0.1%) |
| |||||||
AO Smith Corp. | (1,808 | ) | (139,614 | ) | ||||
TRADING COMPANIES & |
| |||||||
United Rentals, Inc.* | (2,567 | ) | (171,809 | ) | ||||
TRANSPORTATION |
| |||||||
Transurban Group | (10,001 | ) | (88,058 | ) | ||||
|
| |||||||
TOTAL INDUSTRIALS | $ | (684,242 | ) | |||||
INFORMATION TECHNOLOGY – (1.1%) |
| |||||||
COMMUNICATIONS EQUIPMENT – (0.3%) |
| |||||||
Nokia OYJ | (39,975 | ) | (235,734 | ) | ||||
Palo Alto Networks, Inc.* | (1,700 | ) | (256,479 | ) | ||||
|
| |||||||
TOTAL COMMUNICATIONS EQUIPMENT |
| $ | (492,213 | ) | ||||
INTERNET SOFTWARE & SERVICES – (0.5%) |
| |||||||
GoDaddy, Inc.* | (8,611 | ) | (261,516 | ) | ||||
Twitter, Inc.* | (14,614 | ) | (213,657 | ) | ||||
Yahoo!, Inc.* | (9,066 | ) | (331,816 | ) | ||||
|
| |||||||
TOTAL INTERNET SOFTWARE & SERVICES |
| $ | (806,989 | ) | ||||
SEMICONDUCTORS & SEMICONDUCTOR |
| |||||||
ARM Holdings PLC | (3,340 | ) | (137,575 | ) | ||||
Marvell Technology Group Ltd. | (11,369 | ) | (113,463 | ) | ||||
Micron Technology, Inc.* | (14,930 | ) | (160,498 | ) | ||||
|
| |||||||
TOTAL SEMICONDUCTORS & SEMICONDUCTOR EQUIPMENT | $ | (411,536 | ) | |||||
SOFTWARE – (0.1%) |
| |||||||
| Description | Number of Shares | Value | ||||||
Workday, Inc.* | (1,285 | ) | $ | (96,349 | ) | |||
|
| |||||||
TOTAL INFORMATION TECHNOLOGY | $ | (1,807,087) | ||||||
INVESTMENT COMPANIES – (3.6%) |
| |||||||
EQUITY FUNDS – (3.6%) |
| |||||||
Consumer Discretionary Select Sector SPDR Fund | (4,534 | ) | (358,866 | ) | ||||
Energy Select Sector SPDR Fund | (2,900 | ) | (195,779 | ) | ||||
First Trust Dow Jones Internet Index Fund* | (4,000 | ) | (277,840 | ) | ||||
Market Vectors Semiconductor ETF | (10,010 | ) | (525,125 | ) | ||||
SPDR S&P 500 ETF Trust, Series T | (11,530 | ) | (2,378,636 | ) | ||||
SPDR S&P 500 Retail ETF | (23,000 | ) | (1,016,600 | ) | ||||
Technology Select Sector SPDR Fund | (24,370 | ) | (1,026,708 | ) | ||||
|
| |||||||
TOTAL EQUITY FUNDS | $ | (5,779,554 | ) | |||||
|
| |||||||
TOTAL INVESTMENT COMPANIES | $ | (5,779,554 | ) | |||||
MATERIALS – (2.0%) | ||||||||
CHEMICALS – (0.5%) |
| |||||||
Albemarle Corp. | (5,115 | ) | (338,408 | ) | ||||
FMC Corp. | (8,645 | ) | (373,983 | ) | ||||
WR Grace & Co.* | (93 | ) | (7,131 | ) | ||||
|
| |||||||
TOTAL CHEMICALS | $ | (719,522 | ) | |||||
CONSTRUCTION MATERIALS – (0.3%) |
| |||||||
Lafargeholcim Ltd.-Reg | (6,504 | ) | (329,302 | ) | ||||
Martin Marietta Materials, Inc. | (1,090 | ) | (184,461 | ) | ||||
|
| |||||||
TOTAL CONSTRUCTION MATERIALS | $ | (513,763 | ) | |||||
METALS & MINING – (1.2%) |
| |||||||
Alcoa, Inc. | (25,129 | ) | (280,691 | ) | ||||
Barrick Gold Corp. | (11,200 | ) | (216,823 | ) | ||||
First Quantum Minerals Ltd. | (32,700 | ) | (278,603 | ) | ||||
Fresnillo PLC | (25,148 | ) | (408,973 | ) | ||||
Glencore PLC | (117,844 | ) | (280,495 | ) | ||||
Goldcorp, Inc. | (7,200 | ) | (145,067 | ) | ||||
South32 Ltd.* | (183,789 | ) | (231,976 | ) | ||||
Thyssenkrupp AG | (4,271 | ) | (99,327 | ) | ||||
|
| |||||||
TOTAL METALS & MINING | $ | (1,941,955 | ) | |||||
|
| |||||||
TOTAL MATERIALS | $ | (3,175,240 | ) | |||||
TELECOMMUNICATION SERVICES – (0.3%) |
| |||||||
DIVERSIFIED TELECOMMUNICATION |
| |||||||
Iliad SA | (808 | ) | (176,575 | ) | ||||
ANNUAL REPORT / April 30, 2016
| 48 | PORTFOLIOS OF INVESTMENTS |
Wilmington Multi-Manager Alternatives Fund (continued)
| Description | Number of Shares | Value | ||||||
Level 3 Communications, Inc.* | (5,815 | ) | $ | (303,892 | ) | |||
|
| |||||||
TOTAL DIVERSIFIED TELECOMMUNICATION SERVICES | $ | (480,467 | ) | |||||
|
| |||||||
TOTAL TELECOMMUNICATION SERVICES | $ | (480,467 | ) | |||||
UTILITIES – (0.3%) | ||||||||
INDEPENDENT POWER PRODUCERS & ENERGY TRADERS – (0.3%) | ||||||||
Calpine Corp.* | (19,688 | ) | (310,677 | ) | ||||
NRG Energy, Inc. | (8,233 | ) | (124,318 | ) | ||||
|
| |||||||
TOTAL INDEPENDENT POWER PRODUCERS & ENERGY TRADERS | $ | (434,995 | ) | |||||
|
| |||||||
TOTAL UTILITIES | $ | (434,995 | ) | |||||
|
| |||||||
TOTAL SECURITIES SOLD SHORT (PROCEEDS $(31,103,337))
| $
| (32,555,874
| )
| |||||
| Contracts | ||||||||
| WRITTEN OPTIONS – (0.1%) | ||||||||
CALL OPTIONS – 0.0%** | ||||||||
S&P 500 Index, Strike Price $2,095.00, Expiring 5/09/2016 | (16 | ) | $ | (9,388 | ) | |||
S&P 500 Index, Strike Price $2,100.00, Expiring 5/04/2016 | (17 | ) | (2,972 | ) | ||||
S&P 500 Index, Strike Price $2,100.00, Expiring 5/06/2016 | (16 | ) | (3,520 | ) | ||||
S&P 500 Index, Strike Price $2,110.00, Expiring 5/02/2016 | (16 | ) | (315 | ) | ||||
S&P 500 Index, Strike Price $2,120.00, Expiring 5/11/2016 | (16 | ) | (3,369 | ) | ||||
S&P 500 Index, Strike Price $2,120.00, Expiring 5/23/2016 | (12 | ) | (6,964 | ) | ||||
S&P 500 Index, Strike Price $2,125.00, Expiring 5/13/2016 | (16 | ) | (2,560 | ) | ||||
S&P 500 Index, Strike Price $2,130.00, Expiring 5/16/2016 | (16 | ) | (3,685 | ) | ||||
S&P 500 Index, Strike Price $2,130.00, Expiring 5/20/2016 | (12 | ) | (3,000 | ) | ||||
S&P 500 Index, Strike Price $2,135.00, Expiring 5/25/2016 | (12 | ) | (4,448 | ) | ||||
S&P 500 Index, Strike Price $2,145.00, Expiring 5/18/2016 | (12 | ) | (1,580 | ) | ||||
|
| |||||||
TOTAL CALL OPTIONS | $ | (41,801 | ) | |||||
PUT OPTIONS – (0.1%) | ||||||||
S&P 500 Index, Strike Price $1,950.00, Expiring 5/04/2016 | (17 | ) | (144 | ) | ||||
S&P 500 Index, Strike Price $1,950.00, Expiring 5/09/2016 | (16 | ) | (1,572 | ) | ||||
S&P 500 Index, Strike Price $1,965.00, Expiring 5/06/2016 | (16 | ) | (1,600 | ) | ||||
| Description | Contracts | Value | ||||||
S&P 500 Index, Strike Price $1,980.00, Expiring 5/02/2016 | (16 | ) | $ | (76 | ) | |||
S&P 500 Index, Strike Price $1,980.00, Expiring 5/11/2016 | (16 | ) | (4,957 | ) | ||||
S&P 500 Index, Strike Price $1,985.00, Expiring 5/20/2016 | (12 | ) | (10,020 | ) | ||||
S&P 500 Index, Strike Price $1,990.00, Expiring 5/13/2016 | (16 | ) | (8,320 | ) | ||||
S&P 500 Index, Strike Price $1,990.00, Expiring 5/23/2016 | (12 | ) | (12,459 | ) | ||||
S&P 500 Index, Strike Price $2,000.00, Expiring 5/16/2016 | (16 | ) | (12,859 | ) | ||||
S&P 500 Index, Strike Price $2,000.00, Expiring 5/25/2016 | (12 | ) | (15,972 | ) | ||||
S&P 500 Index, Strike Price $2,020.00, Expiring 5/18/2016 | (12 | ) | (15,401 | ) | ||||
|
| |||||||
TOTAL PUT OPTIONS | $ | (83,380 | ) | |||||
|
| |||||||
| TOTAL WRITTEN OPTIONS | ||||||||
| (PREMIUMS RECEIVED $(236,654)) | $ | (125,181 | ) | |||||
|
| |||||||
| TOTAL INVESTMENTS NET OF SECURITIES SOLD SHORT AND WRITTEN OPTIONS – 79.4% | ||||||||
| $ | 126,690,582 | |||||||
| OTHER ASSETS LESS LIABILITIES – 20.6% | 32,799,690 | |||||||
|
| |||||||
| TOTAL NET ASSETS – 100.0% | $ | 159,490,272 | ||||||
|
| |||||||
April 30, 2016 / ANNUAL REPORT
PORTFOLIOS OF INVESTMENTS 49
Wilmington Multi-Manager Alternatives Fund (continued)
Cost of investments for Federal income tax purposes is $160,581,047. The net unrealized appreciation/(depreciation) of investments was $(1,209,410). This consists of net unrealized appreciation from investment for those securities having an excess of value over cost of $5,016,178 and net unrealized depreciation from investments for those securities having an excess of cost over value of $6,225,588.
Various inputs are used in determining the value of the Fund’s investments. These inputs are summarized in the three broad levels listed below.
Level 1 – quoted prices in active markets for identical securities
Level 2 – other significant observable inputs (including quoted prices for similar securities, interest rates, prepayment speeds, credit risk, etc.)
Level 3 – significant unobservable inputs (including the Fund’s own assumptions in determining the fair value of investments)
The following is a summary of the inputs used as of April 30, 2016 in valuing the Fund’s assets carried at fair value:
Level 1
| Level 2
| Level 3
| Total
| |||||||||||||
Assets | ||||||||||||||||
Investments in Securities | ||||||||||||||||
Common Stocks | ||||||||||||||||
Aerospace & Defense | $ | 563,502 | $ | — | $ | — | $ | 563,502 | ||||||||
Airlines | 998,929 | — | — | 998,929 | ||||||||||||
Auto Components | 294,014 | — | — | 294,014 | ||||||||||||
Banks | 925,976 | — | — | 925,976 | ||||||||||||
Biotechnology | 4,451,056 | — | — | 4,451,056 | ||||||||||||
Building Products | 369,011 | — | — | 369,011 | ||||||||||||
Chemicals | 655,228 | — | — | 655,228 | ||||||||||||
Commercial Banks | 408,158 | — | — | 408,158 | ||||||||||||
Commercial Services & Supplies | 1,722,525 | — | — | 1,722,525 | ||||||||||||
Communications Equipment | 469,007 | — | — | 469,007 | ||||||||||||
Construction Materials | 1,055,566 | — | — | 1,055,566 | ||||||||||||
Containers & Packaging | 457,779 | — | — | 457,779 | ||||||||||||
Diversified Consumer Services | 66,675 | — | — | 66,675 | ||||||||||||
Electric Utilities | 3,172 | — | — | 3,172 | ||||||||||||
Food & Staples Retailing | 221,100 | — | — | 221,100 | ||||||||||||
Food Products | 1,443,211 | — | — | 1,443,211 | ||||||||||||
Health Care Equipment & Supplies | 4,691,675 | — | — | 4,691,675 | ||||||||||||
Health Care Providers & Services | 5,467,607 | — | — | 5,467,607 | ||||||||||||
Health Care Technology | 245,293 | — | — | 245,293 | ||||||||||||
Hotels, Restaurants & Leisure | 2,302,007 | — | — | 2,302,007 | ||||||||||||
Household Durables | 1,027,553 | — | — | 1,027,553 | ||||||||||||
Industrial Conglomerates | 252,952 | — | — | 252,952 | ||||||||||||
Insurance | 891,416 | — | — | 891,416 | ||||||||||||
Internet & Catalog Retail | 748,620 | — | — | 748,620 | ||||||||||||
Internet Software & Services | 4,344,383 | — | — | 4,344,383 | ||||||||||||
IT Services | 1,459,837 | — | — | 1,459,837 | ||||||||||||
Life Sciences Tools & Services | 230,800 | — | — | 230,800 | ||||||||||||
Machinery | 158,418 | — | — | 158,418 | ||||||||||||
Media | 1,880,456 | — | — | 1,880,456 | ||||||||||||
Multiline Retail | 1,064,830 | — | — | 1,064,830 | ||||||||||||
Oil & Gas Field Services | 4,150 | — | — | 4,150 | ||||||||||||
Oil, Gas & Consumable Fuels | 3,106,553 | — | — | 3,106,553 | ||||||||||||
Personal Products | 289,286 | — | — | 289,286 | ||||||||||||
Pharmaceuticals | 2,074,021 | — | — | 2,074,021 | ||||||||||||
Professional Services | 333,155 | — | — | 333,155 | ||||||||||||
Real Estate Investment Trusts | 1,618,136 | — | — | 1,618,136 | ||||||||||||
Real Estate Management & Development | 594,723 | — | — | 594,723 | ||||||||||||
Road & Rail | 1,948,450 | — | — | 1,948,450 | ||||||||||||
Semiconductors & Semiconductor Equipment | 3,157,756 | — | — | 3,157,756 | ||||||||||||
ANNUAL REPORT / April 30, 2016
| 50 | PORTFOLIOS OF INVESTMENTS |
Wilmington Multi-Manager Alternatives Fund (continued)
Level 1
| Level 2
| Level 3
| Total
| |||||||||||||
Software | $ | 5,135,267 | $ | — | $ | — | $ | 5,135,267 | ||||||||
Specialty Retail | 4,671,668 | — | — | 4,671,668 | ||||||||||||
Technology Hardware, Storage & Peripherals | 305,590 | — | — | 305,590 | ||||||||||||
Tobacco | 98,204 | — | — | 98,204 | ||||||||||||
Transportation | 5,415 | — | — | 5,415 | ||||||||||||
Transportation Infrastructure | 21,160 | — | — | 21,160 | ||||||||||||
Wireless Telecommunication Services | 958,001 | — | — | 958,001 | ||||||||||||
Investment Companies | 21,222,868 | — | — | 21,222,868 | ||||||||||||
Corporate Bonds | — | 32,706,887 | — | 32,706,887 | ||||||||||||
U.S. Government Obligations | — | 2,998,550 | — | 2,998,550 | ||||||||||||
Money Market Fund | 39,231,320 | — | — | 39,231,320 | ||||||||||||
Purchased Options | — | 19,721 | — | 19,721 | ||||||||||||
|
|
|
|
|
|
|
| |||||||||
Total Investments in Securities | 123,646,479 | 35,725,158 | — | 159,371,637 | ||||||||||||
|
|
|
|
|
|
|
| |||||||||
Other Financial Instruments! | ||||||||||||||||
Financial Futures Contracts | 12,256 | — | — | 12,256 | ||||||||||||
|
|
|
|
|
|
|
| |||||||||
Total Assets | $ | 123,658,735 | $ | 35,725,158 | $ | — | $ | 159,383,893 | ||||||||
|
|
|
|
|
|
|
| |||||||||
Liabilities | ||||||||||||||||
Other Financial Instruments! | ||||||||||||||||
Forward Foreign Currency Contracts | $ | — | $ | (9 | ) | $ | — | $ | (9 | ) | ||||||
Financial Futures Contracts | (1,051,885 | ) | — | — | (1,051,885 | ) | ||||||||||
Securities Sold Short | (32,548,889 | ) | (6,985 | ) | — | (32,555,874 | ) | |||||||||
Written Options | — | (125,181 | ) | — | (125,181 | ) | ||||||||||
|
|
|
|
|
|
|
| |||||||||
Total Liabilities | $ | (33,600,774 | ) | $ | (132,175 | ) | $ | — | $ | (33,732,949 | ) | |||||
|
|
|
|
|
|
|
| |||||||||
| ! | Other financial instruments are derivative instruments not reflected in the value of total investments in securities in the Portfolio of Investments such as forward foreign currency contracts and financial futures contracts which are valued at the unrealized appreciation (depreciation) on the instrument. Securities Sold Short and Written options are reported at their market value at period end. |
April 30, 2016 / ANNUAL REPORT
PORTFOLIOS OF INVESTMENTS 51
Wilmington Multi-Manager Alternatives Fund (continued)
| * | Non-income producing security. |
| ^ | 7-Day net yield. |
| ü | All or a portion of this security is segregated as collateral in connection with the fund’s short positions and written options carried by the Funds. The total value of all securities segregated at April 30, 2016 amounted to $ 32,010,890 representing 20.1% of total net assets. |
| W | Denotes a restricted security that may be resold without restriction to “qualified institutional buyers” as defined in Rule 144A under the Securities Act of 1933 and that the Fund has determined to be liquid under criteria established by the Fund’s Board of Trustees. At April 30, 2016, these liquid restricted amounted to $20,459,637 representing 12.8% of total net assets. |
| ‡ | Zero coupon security. The rate shown reflects the effective yield at purchase date. |
| ** | Represents less than 0.05%. |
The following acronyms are used throughout this Fund:
ADR - American Depositary Receipt
ETF - Exchange Traded Fund
LLC - Limited Liability Corporation
PLC - Public Limited Company
SPDR - Standard & Poor’s Depository Receipts
ANNUAL REPORT / April 30, 2016
| 52 | PORTFOLIOS OF INVESTMENTS |
Wilmington Multi-Manager Alternatives Fund (concluded)
At April 30, 2016, the Alternatives Fund had the following outstanding forward foreign currency contracts, which contractually obligates the Fund to deliver or receive currencies at specified future dates. The open contracts were as follows:
| Settlement Date | Counterparty | Contracts to Deliver/Receive | Contract Amount | Contract at Value | Unrealized Appreciation (Depreciation) | |||||||||||||||
| CONTRACTS SOLD | ||||||||||||||||||||
| 5/4/2016 | Bank of New York | 1,426 Euro | $ | 1,625 | $ | 1,634 | $ | (9) | ||||||||||||
| NET UNREALIZED APPRECIATION (DEPRECIATION) ON FORWARD FOREIGN CURRENCY CONTRACTS | $ | (9) | ||||||||||||||||||
At April 30, 2016, the Alternatives Fund had open financial futures contracts as follows:
| Underlying Contracts to Buy/Sell | Expiration Date | Number of Contracts | Contract Amount | Contract at Value | Unrealized Appreciation (Depreciation) | |||||||||||||||||
| LONG POSITIONS: | ||||||||||||||||||||||
| Czech Koruna Futures | June 2016 | 1 | $ | 99,924 | $ | 99,355 | $ | (569 | ) | |||||||||||||
| Norwegian Krone Futures | June 2016 | 1 | 100,308 | 96,582 | (3,726 | ) | ||||||||||||||||
| Swedish Krona Futures | June 2016 | 1 | 99,956 | 98,533 | (1,423 | ) | ||||||||||||||||
| SHORT POSITIONS: | ||||||||||||||||||||||
| Australian Dollar Futures | June 2016 | 2 | 150,345 | 151,740 | (1,395 | ) | ||||||||||||||||
| British Pound Futures | June 2016 | 4 | 354,611 | 365,325 | (10,714 | ) | ||||||||||||||||
| Canadian Dollar Futures | June 2016 | 2 | 152,102 | 159,480 | (7,378 | ) | ||||||||||||||||
| Euro Futures | June 2016 | 173 | 23,871,439 | 24,793,063 | (921,624 | ) | ||||||||||||||||
| Japanese Yen Futures | June 2016 | 32 | 3,657,358 | 3,751,200 | (93,842 | ) | ||||||||||||||||
| Mexican Peso Futures | June 2016 | 4 | 112,790 | 115,700 | (2,910 | ) | ||||||||||||||||
| New Zealand Dollar Futures | June 2016 | 2 | 134,925 | 139,280 | (4,355 | ) | ||||||||||||||||
| Polish Zloty Futures | June 2016 | 1 | 133,753 | 130,790 | 2,963 | |||||||||||||||||
| South African Rand Futures | June 2016 | 2 | 65,751 | 69,700 | (3,949 | ) | ||||||||||||||||
| Swiss Franc Futures | June 2016 | 17 | 2,228,643 | 2,219,350 | 9,293 | |||||||||||||||||
| NET UNREALIZED APPRECIATION (DEPRECIATION) ON FINANCIAL FUTURES CONTRACTS | $ | (1,039,629 | ) | |||||||||||||||||||
See Notes which are an integral part of the Financial Statements
April 30, 2016 / ANNUAL REPORT
53
PORTFOLIO OF INVESTMENTS SUMMARY TABLE
Wilmington Multi-Manager Real Asset Fund
At April 30, 2016, the Fund’s portfolio composition was as follows (unaudited):
| Percentage of Total Net Assets | ||||
| Inflation-Linked & Fixed Income Securities: | ||||||
U.S. Government Inflation-Linked Securities | 40.6 | % | ||||
Investment Companies | 8.2 | % | ||||
Corporate Bonds | 3.7 | % | ||||
Foreign Government Securities | 2.9 | % | ||||
Foreign Government Inflation-Linked Securities | 2.2 | % | ||||
U.S. Government Agency Obligations | 1.6 | % | ||||
Asset-Backed Securities | 1.3 | % | ||||
U.S. Treasury | 0.7 | % | ||||
Mortgage-Backed Securities | 0.6 | % | ||||
| Real Estate Related Securities: | ||||||
Real Estate Investment Trusts | 37.6 | % | ||||
Common Stocks | 12.4 | % | ||||
Investment Companies | 0.1 | % | ||||
Preferred Stocks | 0.0 | %3 | ||||
Rights | 0.0 | %3 | ||||
| Purchased Options | 0.1 | % | ||||
| Written Options | (0.1 | )% | ||||
| Short-Term Investments | ||||||
| Cash Equivalents1 | 3.5 | % | ||||
| Other Assets and Liabilities – Net2 | (15.4 | )% | ||||
|
|
| ||||
| TOTAL | 100.0 | % | ||||
|
|
| ||||
| (1) | Cash Equivalents include investments in a money market fund and repurchase agreements. |
| (2) | Assets, other than investments in securities, less liabilities. See Statements of Assets and Liabilities. |
| (3) | Represents less than 0.05%. |
PORTFOLIO OF INVESTMENTS
April 30, 2016
| Description | Par Value | Value | ||||||
| INFLATION-LINKED & FIXED INCOME SECURITIES – 61.8% | ||||||||
ASSET-BACKED SECURITIES – 1.3% |
| |||||||
COLLATERALIZED LOAN OBLIGATION – 0.5% |
| |||||||
CIFC Funding 2011-I Ltd., Series 2011-1AR, Class A1R, 1.92%, 1/19/23D,W | $ | 315,340 | $ | 315,365 | ||||
Cordatus CLO I PLC, 2006-1X A2, 0.97%, 1/30/24D | 57,859GBP | 82,564 | ||||||
Cordatus CLO II PLC, 2007-1X A1F, 0.16%, 7/25/24D | 76,302EUR | 86,235 | ||||||
| Description | Par Value | Value | ||||||
Doral CLO II Ltd., Series 2012-2A, Class A1R, 1.66%, 5/26/23D,W | $ | 731,586 | $ | 731,218 | ||||
Eaton Vance CDO VII PLC, 1-X A2, | ||||||||
0.88%, 3/25/26D | 105,149 | 102,998 | ||||||
0.96%, 3/25/26D | 193,165 | 189,069 | ||||||
Symphony CLO VIII LP, Series 2012-8AR, Class AR, 1.72%, 1/09/23D,W | 477,991 | 475,773 | ||||||
Venture VII CDO Ltd., Series 2006-7A, Class A1A, 0.85%, 1/20/22D,W | 261,988 | 256,625 | ||||||
|
| |||||||
TOTAL COLLATERALIZED LOAN OBLIGATION | $ | 2,239,847 | ||||||
ANNUAL REPORT / April 30, 2016
| 54 | PORTFOLIOS OF INVESTMENTS |
Wilmington Multi-Manager Real Asset Fund (continued)
| Par Value
| Value
| ||||||
DIVERSIFIED FINANCIAL SERVICES – 0.3% |
| |||||||
Ameriquest Mortgage Securities Trust, Series 2006-R1, Class M1, 0.82%, 3/25/36D | 300,000 | $ | 264,743 | |||||
Bear Stearns Asset Backed Securities I Trust, Series 2005-TC1, Class M2, 1.08%, 5/25/35D | 545,623 | 451,285 | ||||||
Bear Stearns Asset Backed Securities Trust, Series 2005-1, Class M2, 2.53%, 3/25/35D | 476,912 | 443,723 | ||||||
Countrywide Asset-Backed Certificates, Series 2006-6, Class 2A2, 0.61%, 9/25/36D | 124,359 | 124,100 | ||||||
|
| |||||||
TOTAL DIVERSIFIED FINANCIAL SERVICES |
| $ | 1,283,851 | |||||
WHOLE LOAN – 0.5% |
| |||||||
Asset Backed Securities Corp. Home Equity Loan Trust, Series OOMC 2006-HE3, Class A1, 0.60%, 3/25/36D | 120,467 | 113,437 | ||||||
Citigroup Mortgage Loan Trust, Inc., Series 2006-WFH2, Class A3, 0.65%, 8/25/36D | 1,200,000 | 1,045,095 | ||||||
Credit-Based Asset Servicing and Securitization LLC, Series 2005-CB2, Class M2, 1.37%, 4/25/36D | 241,321 | 208,979 | ||||||
JP Morgan Mortgage Acquisition Trust 2006-NC1, Series 2006-NC1, Class A4, 0.59%, 4/25/36D | 780,887 | 777,362 | ||||||
Nomura Home Equity Loan, Inc. Home Equity Loan Trust, Series 2006-WF1, Class M2, 0.72%, 3/25/36D | 200,000 | 164,896 | ||||||
Saxon Asset Securities Trust, Series 2005-1, Class M2, 1.14%, 5/25/35D | 208,458 | 135,171 | ||||||
|
| |||||||
TOTAL WHOLE LOAN |
| $ | 2,444,940 | |||||
|
| |||||||
TOTAL ASSET-BACKED SECURITIES |
| |||||||
(COST $5,917,167) |
| $ | 5,968,638 | |||||
CORPORATE BONDS – 3.7% |
| |||||||
COMPUTERS – 0.0%** | ||||||||
HP Enterprise Co., Sr. Unsecured, 2.45%, 10/05/17W | 250,000 | 252,903 | ||||||
ENERGY – 0.1% |
| |||||||
Petrobras Global Finance BV, Company Guaranteed, 3.41%, 3/17/20D | 100,000 | 82,095 | ||||||
Sabine Pass LNG LP, Sr. Secured, 7.50%, 11/30/16 | 400,000 | 410,000 | ||||||
|
| |||||||
TOTAL ENERGY |
| $ | 492,095 | |||||
FINANCIALS – 3.2% |
| |||||||
Ally Financial, Inc., Company Guaranteed, 5.50%, 2/15/17 | 569,000 | 582,514 | ||||||
Bank of America Corp., Sr. Unsecured, | ||||||||
4.10%, 7/24/23 | 300,000 | 321,756 | ||||||
4.06%, 10/21/25D | 12,000,000 | MXN | 770,722 | |||||
4.13%, 1/22/24 | 800,000 | 850,433 | ||||||
BPCE SA, Subordinated, 4.63%, 7/11/24D | 700,000 | 693,553 | ||||||
CIT Group, Inc., Sr. Unsecured, 4.25%, 8/15/17 | 594,000 | 603,652 | ||||||
| Par Value
| Value
| ||||||
Citigroup, Inc., Sr. Unsecured, 2.65%, 10/26/20 | $ | 100,000 | $ | 101,064 | ||||
Credit Suisse Group Funding Guernsey Ltd., Company Guaranteed, | ||||||||
3.75%, 3/26/25 | 1,000,000 | 977,569 | ||||||
3.80%, 9/15/22 | 250,000 | 253,854 | ||||||
4.88%, 5/15/45 | 1,000,000 | 1,017,053 | ||||||
Eksportfinans ASA, Sr. Unsecured, 5.50%, 6/26/17 | 1,000,000 | 1,040,390 | ||||||
Ford Motor Credit Co. LLC, Sr. Unsecured, 6.63%, 8/15/17 | 900,000 | 957,691 | ||||||
Goldman Sachs Group, Inc. (The), Sr. Unsecured, | ||||||||
1.71%, 9/15/20D | 800,000 | 797,258 | ||||||
3.50%, 1/23/25 | 900,000 | 911,385 | ||||||
Intesa Sanpaolo SpA, Sr. Unsecured, 6.50%, 2/24/21W | 300,000 | 343,583 | ||||||
JPMorgan Chase & Co., Sr. Unsecured, 3.90%, 7/15/45 | 800,000 | 847,480 | ||||||
KBC Bank NV, Subordinated, 8.00%, 1/25/23D | 1,600,000 | 1,742,200 | ||||||
Lloyds Bank PLC, Company Guaranteed, 1.75%, 5/14/25 | 400,000 | 400,388 | ||||||
Novo Banco SA, Sr. Unsecured, 5.00%, 4/23/19 | 150,000 | EUR | 111,237 | |||||
Realkredit Danmark A/S, 2.00%, 4/01/17 | 700,000 | DKK | 109,751 | |||||
UBS Group Funding Jersey Ltd, Company | ||||||||
Guaranteed, 2.95%, 9/24/20W | 1,000,000 | 1,009,886 | ||||||
|
| |||||||
TOTAL FINANCIALS |
| $ | 14,443,419 | |||||
PHARMACEUTICALS – 0.3% |
| |||||||
AbbVie, Inc., Sr. Unsecured, | ||||||||
1.80%, 5/14/18 | 500,000 | 503,897 | ||||||
2.50%, 5/14/20 | 200,000 | 203,623 | ||||||
3.20%, 11/06/22 | 100,000 | 103,332 | ||||||
Actavis Funding SCS, Company Guaranteed, | ||||||||
3.45%, 3/15/22 | 100,000 | 102,714 | ||||||
3.80%, 3/15/25 | 300,000 | 308,166 | ||||||
|
| |||||||
TOTAL PHARMACEUTICALS |
| $ | 1,221,732 | |||||
UTILITIES – 0.1% |
| |||||||
Dynegy, Inc., Company Guaranteed, 6.75%, 11/01/19 | 300,000 | 305,250 | ||||||
|
| |||||||
TOTAL CORPORATE BONDS (COST $16,795,145) |
| $ | 16,715,399 | |||||
April 30, 2016 / ANNUAL REPORT
| PORTFOLIOS OF INVESTMENTS | 55 |
Wilmington Multi-Manager Real Asset Fund (continued)
| Description | Par Value | Value | ||||||
FOREIGN GOVERNMENT INFLATION-LINKED SECURITIES – 2.2% |
| |||||||
GOVERNMENT – 2.2% |
| |||||||
Denmark Inflation Linked Government Bond, 0.10%, 11/15/23 | 14,577,080DKK | $ | 2,357,965 | |||||
Italy Buoni Poliennali Del Tesoro, Sr. Unsecured, 2.35%, 9/15/24W | 1,270,000EUR | 1,663,975 | ||||||
Mexican Udibonos, 4.50%, 11/22/35 | 21,355,387MXN | 1,432,300 | ||||||
New Zealand Government Bond, Sr. Unsecured, | ||||||||
2.00%, 9/20/25 | 4,950,000NZD | 3,626,663 | ||||||
3.00%, 9/20/30 | 625,000NZD | 503,505 | ||||||
Sweden Inflation Linked Bond, 1.00%, 6/01/25 | 3,100,000SEK | 460,145 | ||||||
|
| |||||||
TOTAL GOVERNMENT | $ | 10,044,553 | ||||||
|
| |||||||
TOTAL FOREIGN GOVERNMENT INFLATION-LINKED SECURITIES (COST $10,338,711) |
| $ | 10,044,553 | |||||
FOREIGN GOVERNMENT SECURITIES – 2.9% |
| |||||||
GOVERNMENT – 2.9% | ||||||||
Athens Urban Transportation Organisation, Government Guaranteed, 4.85%, 9/19/16 | 100,000EUR | 110,002 | ||||||
Autonomous Community of Catalonia, Sr. Unsecured, 4.75%, 6/04/18 | 100,000EUR | 117,731 | ||||||
Brazil Letra Tesouro Nacional, 14.43%, 7/01/16‡ | 4,300,000BRL | 1,222,044 | ||||||
Brazil Letras do Tesouro Nacional, | ||||||||
13.72%, 1/01/17‡ | 16,300,000BRL | 4,346,968 | ||||||
14.30%, 10/01/16‡ | 13,800,000BRL | 3,793,071 | ||||||
Corp. Andina de Fomento, | 4,524,215MXN | 265,700 | ||||||
Credit Agricole SA, Subordinated, 8.13%, 9/19/33D | 900,000 | 990,940 | ||||||
Hellenic Republic Government International Bond, | 30,000,000JPY | 251,645 | ||||||
Mexican Bonos de Proteccion al Ahorro, 3.52%, 4/01/18D | 15,500,000MXN | 900,773 | ||||||
Mexican Udibonos, 4.50%, 12/04/25 | 19,467,209MXN | 1,278,313 | ||||||
|
| |||||||
TOTAL GOVERNMENT |
| $ | 13,277,187 | |||||
|
| |||||||
TOTAL FOREIGN GOVERNMENT SECURITIES |
| $ | 13,277,187 | |||||
| Description | Number of Shares | Value | ||||||
INVESTMENT COMPANIES – 8.2% |
| |||||||
INFLATION-PROTECTED SECURITIES FUNDS – 8.2% |
| |||||||
Vanguard Inflation-Protected Securities Fund, Institutional Shares | 3,495,381 | $ | 37,610,300 | |||||
|
| |||||||
TOTAL INVESTMENT COMPANIES (COST $37,000,000) |
| $ | 37,610,300 | |||||
| Par Value | ||||||||
MORTGAGE-BACKED SECURITIES – 0.6% |
| |||||||
WHOLE LOAN – 0.6% |
| |||||||
Alternative Loan Trust, Series 2004-18BC, Class 4A1, 5.50%, 9/25/34 | $ | 445,589 | $ | 456,343 | ||||
BCAP LLC Trust, Series 2009-RR6-I, Class 3A1, 2.90%, 12/26/37D,W | 48,826 | 47,801 | ||||||
Grifonas Finance PLC, Class A, 0.32%, 8/28/39D | 570,951EUR | 457,805 | ||||||
JP Morgan Resecuritization Trust, Series 2009-7, Class 13A1, 2.50%, 6/27/37D,W | 47,745 | 46,105 | ||||||
Marche Mutui 4 Srl, Class A, 0.34%, 2/25/55D | 43,126EUR | 48,673 | ||||||
Marche Mutui Srl, Series 6, Class A1, 2.10%, 1/27/64D | 72,068EUR | 83,417 | ||||||
Rise Ltd., 2014-1, Class A, 4.75%, 2/15/39D | 259,375 | 257,725 | ||||||
Trinity Square 2015-1A PLC, 1.79%, 7/15/51D,W | 566,099GBP | 820,034 | ||||||
WAMU Mortgage Pass-Through Certificates, Series 2006-AR14, Class 1A4, | ||||||||
2.18%, 11/25/36D | 318,970 | 274,181 | ||||||
2.43%, 3/25/37D | 127,170 | 115,954 | ||||||
|
| |||||||
TOTAL WHOLE LOAN |
| $ | 2,608,038 | |||||
|
| |||||||
TOTAL MORTGAGE-BACKED SECURITIES |
| $ | 2,608,038 | |||||
U.S. GOVERNMENT AGENCY OBLIGATIONS – 1.6% |
| |||||||
FEDERAL HOME LOAN BANK (FHLB) – 0.2% |
| |||||||
Federal Home Loan Bank Discount Notes, | ||||||||
0.03%, 5/20/16‡ | 600,000 | 599,915 | ||||||
0.25%, 5/25/16‡ | 200,000 | 199,965 | ||||||
0.31%, 6/08/16‡ | 200,000 | 199,935 | ||||||
|
| |||||||
TOTAL FEDERAL HOME LOAN BANK (FHLB) |
| $ | 999,815 | |||||
FEDERAL NATIONAL MORTGAGE ASSOCIATION (FNMA) – 1.4% |
| |||||||
Fannie Mae TBA, 3.00%, 6/13/46 | 6,000,000 | 6,139,219 | ||||||
|
| |||||||
TOTAL U.S. GOVERNMENT AGENCY OBLIGATIONS (COST $7,144,198) |
| $ | 7,139,034 | |||||
ANNUAL REPORT / April 30, 2016
| 56 | PORTFOLIOS OF INVESTMENTS |
Wilmington Multi-Manager Real Asset Fund (continued)
| Description | Par Value | Value | ||||||
U.S. GOVERNMENT INFLATION-LINKED |
| |||||||
U.S. TREASURY INFLATION INDEXED BONDS – 35.3% |
| |||||||
U.S. Treasury Inflation Indexed Bond, |
| |||||||
0.13%, 4/15/18 | $ | 11,050,000 | $ | 11,526,806 | ||||
0.13%, 4/15/19 | 19,000,000 | 19,631,018 | ||||||
0.13%, 4/15/20 | 6,700,000 | 6,921,579 | ||||||
0.13%, 1/15/23 | 12,900,000 | 13,390,944 | ||||||
0.13%, 7/15/24 | 22,100,000 | 22,221,649 | ||||||
0.38%, 7/15/23 | 14,900,000 | 15,660,887 | ||||||
0.63%, 1/15/24 | 6,300,000 | 6,687,411 | ||||||
0.75%, 2/15/42 | 5,140,000 | 5,249,394 | ||||||
0.75%, 2/15/45 | 10,000 | 9,770 | ||||||
1.00%, 2/15/46# | 400,000 | 418,365 | ||||||
1.38%, 2/15/44 | 10,200,000 | 11,647,150 | ||||||
1.75%, 1/15/28 | 3,300,000 | 4,344,237 | ||||||
1.88%, 7/15/19 | 800,000 | 964,027 | ||||||
2.00%, 1/15/26 | 878,000 | 1,231,261 | ||||||
2.13%, 2/15/41 | 600,000 | 838,962 | ||||||
2.38%, 1/15/25 | 413,000 | 619,805 | ||||||
2.38%, 1/15/27 | 6,220,000 | 8,956,368 | ||||||
2.50%, 7/15/16 | 120,000 | 142,853 | ||||||
2.50%, 1/15/29 | 4,860,000 | 6,764,671 | ||||||
3.63%, 4/15/28 | 8,670,000 | 17,544,562 | ||||||
3.88%, 4/15/29 | 2,800,000 | 5,797,518 | ||||||
|
| |||||||
TOTAL U.S. TREASURY INFLATION INDEXED BONDS |
| $ | 160,569,237 | |||||
U.S. TREASURY INFLATION INDEXED NOTES – 5.3% |
| |||||||
U.S. Treasury Inflation Indexed Note, | ||||||||
0.13%, 4/15/17 | 200,000 | 210,723 | ||||||
0.13%, 1/15/22 | 5,250,000 | 5,586,684 | ||||||
0.13%, 7/15/22 | 5,320,000 | 5,589,622 | ||||||
0.63%, 7/15/21 | 6,310,000 | 6,973,464 | ||||||
1.25%, 7/15/20 | 5,000,000 | 5,836,022 | ||||||
|
| |||||||
TOTAL U.S. TREASURY INFLATION INDEXED NOTES |
| $ | 24,196,515 | |||||
|
| |||||||
TOTAL U.S. GOVERNMENT INFLATION-LINKED SECURITIES (COST $181,357,768) |
| $ | 184,765,752 | |||||
U.S. TREASURY – 0.7% |
| |||||||
U.S. TREASURY BONDS – 0.6% |
| |||||||
U.S. Treasury Bond, | ||||||||
2.50%, 2/15/46 | 2,530,000 | 2,442,082 | ||||||
3.00%, 11/15/45 | 100,000 | 106,933 | ||||||
|
| |||||||
TOTAL U.S. TREASURY BONDS |
| $ | 2,549,015 | |||||
| Description | Par Value | Value | ||||||
U.S. TREASURY NOTE – 0.1% |
| |||||||
U.S. Treasury Note, | $ | 700,000 | $ | 687,577 | ||||
|
| |||||||
TOTAL U.S. TREASURY (COST $3,295,044) | $ | 3,236,592 | ||||||
|
| |||||||
| TOTAL INFLATION-LINKED & FIXED INCOME SECURITIES (COST $277,549,847) | $ | 281,365,493 | ||||||
| Number of Shares | ||||||||
| REAL ESTATE RELATED SECURITIES – 50.1% | ||||||||
COMMON STOCKS – 12.4% |
| |||||||
DIVERSIFIED – 0.1% |
| |||||||
Kiwi Property Group Ltd. | 166,361 | $ | 171,919 | |||||
Stride Property Ltd. | 43,396 | 67,269 | ||||||
|
| |||||||
TOTAL DIVERSIFIED | $ | 239,188 | ||||||
DIVERSIFIED REAL ESTATE ACTIVITIES – 6.6% |
| |||||||
Airport City Ltd.* | 6,387 | 62,922 | ||||||
Alexander & Baldwin, Inc. | 4,178 | 159,767 | ||||||
Allreal Holding AG* | 2,064 | 287,665 | ||||||
Alrov Properties & Lodgings Ltd. | 1 | 15 | ||||||
Argosy Property Ltd. | 98,676 | 81,992 | ||||||
CapitaLand Ltd. | 318,300 | 736,077 | ||||||
City Developments Ltd. | 60,100 | 372,706 | ||||||
Consolidated-Tomoka Land Co. | 629 | 31,010 | ||||||
D Carnegie & Co. AB* | 3,408 | 32,890 | ||||||
Daito Trust Construction Co. Ltd. | 12,500 | 1,820,371 | ||||||
Daiwa House Industry Co. Ltd. | 99,106 | 2,759,878 | ||||||
DIC Asset AG | 9,282 | 85,537 | ||||||
DREAM Unlimited Corp., Class A* | 14,796 | 90,094 | ||||||
Far East Consortium International Ltd. | 146,000 | 48,749 | ||||||
Gateway Lifestyle | 29,725 | 63,510 | ||||||
Goldin Properties Holdings Ltd.* | 164,000 | 68,079 | ||||||
Grand City Properties SA | 12,691 | 280,320 | ||||||
Great Eagle Holdings Ltd. | 44,000 | 178,680 | ||||||
Hang Lung Properties Ltd. | 269,000 | 536,828 | ||||||
Heiwa Real Estate Co. Ltd. | 3,000 | 38,825 | ||||||
Henderson Land Development Co. Ltd. | 200,400 | 1,253,001 | ||||||
HKR International Ltd. | 60,800 | 25,004 | ||||||
K Wah International Holdings Ltd. | 151,000 | 73,194 | ||||||
Kerry Properties Ltd. | 79,000 | 215,402 | ||||||
LendLease Group | 67,341 | 650,277 | ||||||
Leopalace21 Corp. | 32,500 | 203,736 | ||||||
Mitsubishi Estate Co. Ltd. | 285,210 | 5,685,437 | ||||||
Mitsui Fudosan Co. Ltd. | 194,589 | 4,983,600 | ||||||
Mobimo Holding AG* | 783 | 179,324 | ||||||
Nippon Commercial Development Co. Ltd. | 1,533 | 32,202 | ||||||
Nomura Real Estate Holdings, Inc. | 15,500 | 294,850 | ||||||
April 30, 2016 / ANNUAL REPORT
| PORTFOLIOS OF INVESTMENTS | 57 |
Wilmington Multi-Manager Real Asset Fund (continued)
| Description | Number of Shares | Value | ||||||
Patrizia Immobilien AG* | 4,133 | $ | 95,739 | |||||
Realia Business SA* | 31,207 | 39,486 | ||||||
Shinoken Group Co. Ltd. | 2,800 | 59,526 | ||||||
Soundwill Holdings Ltd. | 54,000 | 70,729 | ||||||
Sumitomo Realty & Development Co. Ltd. | 89,498 | 2,729,521 | ||||||
Sun Hung Kai Properties Ltd. | 302,900 | 3,828,764 | ||||||
Takara Leben Co. Ltd. | 8,800 | 58,887 | ||||||
Tejon Ranch Co.* | 1,252 | 28,195 | ||||||
Tokyo Tatemono Co. Ltd. | 27,500 | 376,833 | ||||||
Tokyu Fudosan Holdings Corp. | 65,000 | 463,064 | ||||||
U & I Group PLC | 18,118 | 52,616 | ||||||
United Industrial Corp. Ltd. | 35,000 | 75,473 | ||||||
UOL Group Ltd. | 83,700 | 382,138 | ||||||
Wheelock & Co. Ltd. | 103,000 | 478,026 | ||||||
|
| |||||||
TOTAL DIVERSIFIED REAL ESTATE ACTIVITIES |
| $ | 30,070,939 | |||||
FINANCIALS – 0.1% |
| |||||||
Chinese Estates Holdings Ltd. | 9,000 | 22,370 | ||||||
Inmobiliaria Colonial SA* | 252,434 | 193,664 | ||||||
Nam Tai Property, Inc. | 8,138 | 49,642 | ||||||
Vib Vermoegen AG | 3,224 | 67,022 | ||||||
|
| |||||||
TOTAL FINANCIALS |
| $ | 332,698 | |||||
INDUSTRIALS – 0.0%** |
| |||||||
Property For Industry Ltd. | 30,878 | 35,683 | ||||||
OFFICE – 0.0%** |
| |||||||
Precinct Properties New Zealand Ltd. | 142,074 | 126,484 | ||||||
REAL ESTATE DEVELOPMENT – 1.5% |
| |||||||
ADLER Real Estate AG* | 2,370 | 31,385 | ||||||
Aveo Group | 43,613 | 113,411 | ||||||
Cheung Kong Property Holdings Ltd. | 593,634 | 4,075,212 | ||||||
Conwert Immobilien Invest SE* | 7,784 | 123,268 | ||||||
Daikyo, Inc. | 33,000 | 54,586 | ||||||
Forestar Group, Inc.* | 8,144 | 109,944 | ||||||
Frasers Centrepoint Ltd. | 85,200 | 105,799 | ||||||
Goldcrest Co. Ltd. | 1,800 | 26,797 | ||||||
Greenland Hong Kong Holdings Ltd.* | 128,000 | 45,379 | ||||||
Helical Bar PLC | 12,786 | 71,693 | ||||||
Howard Hughes Corp. (The)* | 2,931 | 308,253 | ||||||
Nexity SA | 4,124 | 221,141 | ||||||
Peet Ltd. | 82,658 | 59,392 | ||||||
RMR Group, Inc. | 1,625 | 40,495 | ||||||
Road King Infrastructure Ltd. | 44,000 | 36,473 | ||||||
Selvaag Bolig ASA | 11,740 | 38,201 | ||||||
Sino Land Co. Ltd. | 630,000 | 992,484 | ||||||
St. Modwen Properties PLC | 26,112 | 116,903 | ||||||
Tag Immobilien AG | 15,653 | 207,824 | ||||||
| Description | Number of Shares | Value | ||||||
Villa World Ltd. | 19,108 | $ | 30,946 | |||||
Wing Tai Holdings Ltd. | 64,200 | 89,508 | ||||||
|
| |||||||
TOTAL REAL ESTATE DEVELOPMENT |
| $ | 6,899,094 | |||||
REAL ESTATE MANAGEMENT & DEVELOPMENT – 0.0%** |
| |||||||
Big Shopping Centers Ltd. | 550 | 32,840 | ||||||
Brack Capital Properties NV | 460 | 34,804 | ||||||
Farmland Partners, Inc.# | 2,936 | 31,679 | ||||||
Norwegian Property ASA | 29,950 | 33,440 | ||||||
|
| |||||||
TOTAL REAL ESTATE MANAGEMENT & DEVELOPMENT |
| $ | 132,763 | |||||
REAL ESTATE OPERATING COMPANIES – 4.1% |
| |||||||
Ado Properties SA*,W | 2,220 | 73,083 | ||||||
Aeon Mall Co. Ltd. | 15,800 | 227,348 | ||||||
Airport Facilities Co. Ltd. | 5,100 | 23,295 | ||||||
Alony Hetz Properties & Investments Ltd. | 9,740 | 80,053 | ||||||
Amot Investments Ltd. | 9,612 | 35,012 | ||||||
Ascendas India Trust | 120,800 | 85,782 | ||||||
Atrium European Real Estate Ltd.* | 27,546 | 116,704 | ||||||
Atrium Ljungberg AB, Class B | 9,081 | 144,180 | ||||||
Azrieli Group | 3,773 | 149,852 | ||||||
Blue Square Real Estate Ltd. | 1,827 | 64,348 | ||||||
Buwog AG* | 6,438 | 135,495 | ||||||
CA Immobilien Anlagen AG* | 9,382 | 179,192 | ||||||
Capital & Counties Properties PLC | 94,383 | 487,506 | ||||||
Castellum AB | 21,838 | 349,443 | ||||||
Citycon OYJ | 50,863 | 128,945 | ||||||
Croesus Retail Trust | 118,300 | 73,451 | ||||||
Daejan Holdings PLC | 1,422 | 116,770 | ||||||
Daibiru Corp. | 6,200 | 56,406 | ||||||
Deutsche Euroshop AG | 5,386 | 250,977 | ||||||
Deutsche Wohnen AG | 51,014 | 1,562,279 | ||||||
Dios Fastigheter AB | 4,707 | 34,436 | ||||||
Entra ASA*,W | 8,709 | 82,203 | ||||||
Fabege AB | 17,852 | 297,887 | ||||||
Fastighets AB Balder* | 9,511 | 242,440 | ||||||
First Capital Realty, Inc. | 12,125 | 196,269 | ||||||
Fonciere de Paris SIIC | 1,069 | 177,293 | ||||||
Gazit-Globe Ltd. | 12,392 | 115,183 | ||||||
Global Logistic Properties Ltd. | 385,400 | 548,791 | ||||||
Grainger PLC | 54,318 | 176,671 | ||||||
Hang Lung Group Ltd. | 109,000 | 335,140 | ||||||
Hemfosa Fastigheter AB | 16,692 | 174,082 | ||||||
Hispania Activos Inmobiliarios SA* | 19,767 | 289,719 | ||||||
Hongkong Land Holdings Ltd. | 149,400 | 948,690 | ||||||
Hufvudstaden AB | 36,719 | 568,815 | ||||||
Hulic Co. Ltd. | 57,300 | 592,387 | ||||||
Hysan Development Co. Ltd. | 79,000 | 349,837 | ||||||
Immofinanz AG* | 108,066 | 254,784 | ||||||
ANNUAL REPORT / April 30, 2016
| 58 | PORTFOLIOS OF INVESTMENTS |
Wilmington Multi-Manager Real Asset Fund (continued)
| Description | Number of Shares | Value | ||||||
Intershop Holding AG | 211 | $ | 98,978 | |||||
Japan Property Management Center Co. Ltd. | 1,800 | 27,152 | ||||||
Jerusalem Oil Exploration* | 978 | 40,518 | ||||||
Keihanshin Building Co. Ltd. | 11,300 | 62,872 | ||||||
Klovern AB-B Shares | 67,714 | 79,600 | ||||||
Kungsleden AB | 19,873 | 136,727 | ||||||
Langham Hospitality Investments & | ||||||||
Langham Hospitality Investments Ltd. | 206,000 | 68,783 | ||||||
LEG Immobilien AG* | 24,718 | 2,287,205 | ||||||
Melisron Ltd. | 1,928 | 75,129 | ||||||
Norstar Holdings, Inc. | 2,510 | 41,394 | ||||||
NTT Urban Development Corp. | 41,900 | 411,124 | ||||||
Olav Thon Eiendomsselskap ASA | 5,280 | 91,149 | ||||||
Perennial Real Estate Holdings Ltd.* | 35,647 | 24,253 | ||||||
Platzer Fastigheter Holding, Class B* | 7,280 | 40,613 | ||||||
PSP Swiss Property AG | 5,151 | 496,146 | ||||||
S Immo AG | 10,793 | 105,913 | ||||||
Sagax AB, Class B | 9,716 | 83,785 | ||||||
Sponda OYJ | 33,377 | 145,307 | ||||||
Swire Properties Ltd. | 145,400 | 378,641 | ||||||
Swiss Prime Site AG* | 8,843 | 774,788 | ||||||
Technopolis OYJ | 7,802 | 33,680 | ||||||
Tlg Immobilien AG* | 7,353 | 155,468 | ||||||
Toc Co. Ltd. | 12,100 | 100,985 | ||||||
Unite Group PLC (The) | 28,166 | 260,305 | ||||||
Unizo Holdings Co. Ltd. | 1,500 | 66,541 | ||||||
Victoria Park AB | 16,321 | 38,615 | ||||||
Vonovia SE | 66,063 | 2,222,852 | ||||||
Wallenstam AB, Class B | 28,122 | 236,380 | ||||||
WCM Beteiligungs & Grundbesitz-AG* | 10,309 | 33,560 | ||||||
Wihlborgs Fastigheter AB | 8,854 | 179,716 | ||||||
|
| |||||||
TOTAL REAL ESTATE OPERATING COMPANIES |
| $ | 18,522,927 | |||||
|
| |||||||
TOTAL COMMON STOCKS (COST $51,203,129) | $ | 56,359,776 | ||||||
INVESTMENT COMPANIES – 0.1% |
| |||||||
DIVERSIFIED REAL ESTATE ACTIVITIES – 0.0%** |
| |||||||
U.K. Commercial Property Trust Ltd. | 116,481 | 141,178 | ||||||
REAL ESTATE OPERATING COMPANIES – 0.1% |
| |||||||
F&C Commercial Property Trust Ltd. | 112,622 | 219,192 | ||||||
|
| |||||||
TOTAL INVESTMENT COMPANIES (COST $363,160) | $ | 360,370 | ||||||
PREFERRED STOCK – 0.0%** |
| |||||||
CONSUMER FINANCE – 0.0%** |
| |||||||
Navient Corp. 3.068%D | 3,000 | 72,105 | ||||||
|
| |||||||
TOTAL PREFERRED STOCK (COST $71,100) | $ | 72,105 | ||||||
REAL ESTATE INVESTMENT TRUSTS – 37.6% |
| |||||||
| Description | Number of Shares | Value | ||||||
| DIVERSIFIED – 5.3% | ||||||||
Abacus Property Group | 43,103 | $ | 103,892 | |||||
Activia Properties, Inc. | 70 | 380,263 | ||||||
American Assets Trust, Inc. | 4,691 | 186,092 | ||||||
ANF Immobilier | 3,061 | 84,646 | ||||||
Armada Hoffler Properties, Inc. | 3,286 | 38,446 | ||||||
Artis Real Estate Investment Trust | 6,798 | 72,602 | ||||||
Astro Japan Property Group | 7,569 | 36,257 | ||||||
British Land Co. PLC (The) | 150,872 | 1,585,017 | ||||||
Canadian Real Estate Investment Trust | 4,566 | 161,176 | ||||||
Charter Hall Group | 42,279 | 153,984 | ||||||
Cominar Real Estate Investment Trust | 10,509 | 144,732 | ||||||
Cousins Properties, Inc. | 16,472 | 170,485 | ||||||
Daiwa House Real Estate Investment Corp. | 39 | 211,494 | ||||||
Daiwa House Residential Investment Corp. | 89 | 220,994 | ||||||
Dream Global Real Estate Investment Trust | 16,351 | 114,680 | ||||||
Duke Realty Corp. | 28,363 | 620,299 | ||||||
Fonciere Des Regions | 5,524 | 522,722 | ||||||
Forest City Realty Trust, Inc. | 17,782 | 369,510 | ||||||
Gecina SA | 11,642 | 1,683,672 | ||||||
Gladstone Commercial Corp. | 1,641 | 27,618 | ||||||
Global Net Lease, Inc. | 17,570 | 148,818 | ||||||
Goodman Property Trust | 131,446 | 122,988 | ||||||
GPT Group | 467,354 | 1,787,429 | ||||||
Green Real Estate Investment Trust PLC | 80,118 | 132,288 | ||||||
Growthpoint Properties Australia Ltd. | 49,458 | 121,466 | ||||||
H&R Real Estate Investment Trust | 16,542 | 288,994 | ||||||
Hamborner Real Estate Investment Trust AG | 9,068 | 100,968 | ||||||
Hankyu Real Estate Investment Trust, Inc. | 64 | 82,165 | ||||||
Heiwa Real Estate Investment Trust, Inc. | 110 | 93,148 | ||||||
Hibernia Real Estate Investment Trust PLC | 73,301 | 108,191 | ||||||
Hulic Real Estate Investment Trust, Inc. | 109 | 190,648 | ||||||
Investors Real Estate Trust | 13,684 | 82,378 | ||||||
Kenedix Office Investment Corp. | 162 | 966,823 | ||||||
Land Securities Group PLC | 214,353 | 3,545,457 | ||||||
Lexington Realty Trust | 18,108 | 158,988 | ||||||
Liberty Property Trust | 12,423 | 433,563 | ||||||
Londonmetric Property PLC | 80,777 | 187,074 | ||||||
Mapletree Greater China Commercial Trust | 231,700 | 177,455 | ||||||
Mirvac Group | 1,076,869 | 1,531,155 | ||||||
Morguard Real Estate Investment Trust | 3,453 | 41,996 | ||||||
Nieuwe Steen Investments NV | 77,062 | 365,756 | ||||||
NIPPON Real Estate Investment Trust | ||||||||
Investment Corp. | 42 | 112,263 | ||||||
Nomura Real Estate Master Fund, Inc. | 472 | 753,692 | ||||||
One Liberty Properties, Inc. | 1,381 | 32,343 | ||||||
PS Business Parks, Inc. | 1,823 | 174,570 | ||||||
April 30, 2016 / ANNUAL REPORT
| PORTFOLIOS OF INVESTMENTS | 59 |
Wilmington Multi-Manager Real Asset Fund (continued)
| Description | Number of Shares | Value | ||||||
Redefine International PLC/Isle of Man | 156,931 | $ | 108,161 | |||||
Reit 1 Ltd. | 11,700 | 34,351 | ||||||
Sekisui House Real Estate Investment Trust, Inc. | 104 | 123,353 | ||||||
Sekisui House Si Residential Investment Corp. | 115 | 124,403 | ||||||
Shaftesbury PLC | 35,279 | 469,088 | ||||||
Soilbuild Business Space Real Estate Investment Trust | 124,200 | 64,647 | ||||||
Spirit Realty Capital, Inc. | 124,263 | 1,420,326 | ||||||
Stockland | 301,889 | 1,003,098 | ||||||
Sunlight Real Estate Investment Trust | 177,000 | 93,327 | ||||||
Suntec Real Estate Investment Trust | 320,800 | 401,939 | ||||||
Tokyu Real Estate Investment Trust, Inc. | 112 | 164,000 | ||||||
Top Real Estate Investment Trust, Inc. | 20 | 76,504 | ||||||
United Urban Investment Corp. | 350 | 615,461 | ||||||
Washington Real Estate Investment Trust | 4,991 | 143,092 | ||||||
Wereldhave NV | 5,114 | 263,453 | ||||||
Whitestone Real Estate Investment Trust | 1,951 | 26,202 | ||||||
Yuexiu Real Estate Investment Trust | 231,000 | 128,054 | ||||||
|
| |||||||
TOTAL DIVERSIFIED | $ | 23,888,656 | ||||||
DIVERSIFIED REAL ESTATE ACTIVITIES – 0.1% |
| |||||||
Ascendas Hospitality Trust | 89,000 | 46,325 | ||||||
Hoshino Resorts Real Estate Investment Trust, Inc. | 8 | 98,797 | ||||||
Merlin Properties Socimi SA | 38,963 | 452,840 | ||||||
OUE Hospitality Trust | 144,800 | 74,831 | ||||||
|
| |||||||
TOTAL DIVERSIFIED REAL ESTATE ACTIVITIES | $ | 672,793 | ||||||
FINANCIALS – 0.7% |
| |||||||
Alstria Office Real Estate Investment Trust AG* | 13,402 | 187,989 | ||||||
Bluerock Residential Growth Real Estate Investment Trust, Inc. | 2,866 | 31,354 | ||||||
City Office Real Estate Investment Trust, Inc. | 2,823 | 31,702 | ||||||
Colony Starwood Homes# | 4,028 | 98,162 | ||||||
Crombie Real Estate Investment Trust | 2,904 | 32,357 | ||||||
Easterly Government Properties, Inc. | 1,697 | 31,310 | ||||||
Ichigo Hotel Real Estate Investment Trust Investment Corp. | 19 | 31,696 | ||||||
Independence Realty Trust, Inc. | 3,871 | 27,755 | ||||||
MGM Growth Properties LLC, Class A* | 12,125 | 267,599 | ||||||
National Storage Affiliates Trust | 1,546 | 30,178 | ||||||
NorthStar Realty Europe Corp. | 5,459 | 65,126 | ||||||
NorthStar Realty Finance Corp. | 15,497 | 198,207 | ||||||
Northview Apartment Real Estate Investment Trust | 6,017 | 94,377 | ||||||
Primary Health Properties PLC | 49,681 | 77,492 | ||||||
Select Income Real Estate Investment Trust | 5,131 | 118,783 | ||||||
| Description | Number of Shares | Value | ||||||
Sella Capital Real Estate Ltd. | 73,191 | $ | 114,377 | |||||
STORE Capital Corp. | 9,569 | 245,636 | ||||||
Vicinity Centres | 659,739 | 1,665,425 | ||||||
Winthrop Realty Trust* | 2,989 | 38,020 | ||||||
|
| |||||||
TOTAL FINANCIALS | $ | 3,387,545 | ||||||
INDUSTRIALS – 2.6% |
| |||||||
AIMS AMP Capital Industrial Real Estate Investment Trust | 105,800 | 109,745 | ||||||
Ascendas Real Estate Investment Trust | 287,500 | 525,895 | ||||||
BWP Trust | 75,742 | 201,567 | ||||||
Cache Logistics Trust | 90,200 | 58,016 | ||||||
Cambridge Industrial Trust | 183,600 | 74,404 | ||||||
DCT Industrial Trust, Inc. | 25,005 | 1,009,452 | ||||||
EastGroup Properties, Inc. | 3,668 | 219,163 | ||||||
First Industrial Realty Trust, Inc. | 9,049 | 207,584 | ||||||
GLP J-Real Estate Investment Trust* | 662 | 817,545 | ||||||
Goodman Group | 200,047 | 1,048,012 | ||||||
Granite Real Estate Investment Trust | 3,100 | 92,355 | ||||||
Hansteen Holdings PLC | 91,418 | 138,652 | ||||||
Industria Real Estate Investment Trust | 37,595 | 59,744 | ||||||
Industrial & Infrastructure Fund Investment Corp. | 44 | 225,376 | ||||||
Japan Logistics Fund, Inc. | 111 | 249,437 | ||||||
LaSalle Logiport Real Estate Investment Trust* | 114 | 108,857 | ||||||
Mapletree Industrial Trust | 153,200 | 182,835 | ||||||
Mapletree Logistics Trust | 200,500 | 161,014 | ||||||
Monmouth Real Estate Investment Corp. | 6,676 | 76,774 | ||||||
Nippon Prologis Real Estate Investment Trust, Inc. | 649 | 1,589,562 | ||||||
Prologis, Inc. | 76,190 | 3,459,788 | ||||||
Pure Industrial Real Estate Trust | 20,600 | 82,091 | ||||||
Rexford Industrial Realty, Inc. | 4,240 | 79,585 | ||||||
Sabana Shari’ah Compliant Industrial Real Estate Investment Trust | 130,300 | 59,586 | ||||||
Segro PLC | 94,222 | 575,060 | ||||||
STAG Industrial, Inc. | 5,598 | 111,736 | ||||||
Terreno Realty Corp. | 3,822 | 87,027 | ||||||
Tritax Big Box Real Estate Investment Trust PLC | 103,770 | 205,754 | ||||||
Warehouses De Pauw CVA | 1,793 | 163,220 | ||||||
|
| |||||||
TOTAL INDUSTRIALS | $ | 11,979,836 | ||||||
OFFICE – 7.2% |
| |||||||
Alexandria Real Estate Equities, Inc. | 14,917 | 1,386,535 | ||||||
Allied Properties Real Estate Investment Trust | 4,881 | 137,518 | ||||||
Axiare Patrimonio SOCIMI SA | 7,323 | 111,524 | ||||||
Befimmo SA | 2,636 | 176,122 | ||||||
Beni Stabili SpA SIIQ | 114,626 | 84,921 | ||||||
ANNUAL REPORT / April 30, 2016
| 60 | PORTFOLIOS OF INVESTMENTS |
Wilmington Multi-Manager Real Asset Fund (continued)
| Description | Number of Shares | Value | ||||||
Boston Properties, Inc. | 18,064 | $ | 2,327,727 | |||||
Brandywine Realty Trust | 13,995 | 209,225 | ||||||
Brookfield Canada Office Properties | 1,563 | 34,369 | ||||||
CapitaLand Commercial Trust | 255,300 | 271,464 | ||||||
Champion Real Estate Investment Trust | 308,000 | 165,179 | ||||||
Cofinimmo SA | 2,435 | 302,521 | ||||||
Columbia Property Trust, Inc. | 10,597 | 236,313 | ||||||
Coresite Realty Corp. | 2,143 | 160,575 | ||||||
Corporate Office Properties Trust | 7,659 | 196,683 | ||||||
Cromwell Property Group | 176,561 | 136,934 | ||||||
CyrusOne, Inc. | 5,324 | 234,948 | ||||||
Daiwa Office Investment Corp. | 41 | 267,425 | ||||||
Derwent London PLC | 23,051 | 1,106,087 | ||||||
Dexus Property Group | 121,912 | 780,501 | ||||||
Digital Realty Trust, Inc. | 25,689 | 2,260,118 | ||||||
Douglas Emmett, Inc. | 10,974 | 356,106 | ||||||
Dream Office Real Estate Investment Trust | 6,713 | 112,035 | ||||||
DuPont Fabros Technology, Inc. | 7,917 | 315,255 | ||||||
Empire State Realty Trust, Inc., Class A | 12,558 | 232,449 | ||||||
Equity Commonwealth* | 10,144 | 283,119 | ||||||
First Potomac Realty Trust | 4,414 | 37,122 | ||||||
Franklin Street Properties Corp. | 9,236 | 98,086 | ||||||
Frasers Commercial Trust | 92,900 | 89,456 | ||||||
GDI Property Group | 97,742 | 64,285 | ||||||
Global One Real Estate Investment Corp. | 19 | 80,179 | ||||||
Government Properties Income Trust# | 9,510 | 179,929 | ||||||
Gramercy Property Trust | 34,463 | 291,902 | ||||||
Great Portland Estates PLC | 90,937 | 1,007,178 | ||||||
Highwoods Properties, Inc. | 18,881 | 882,309 | ||||||
Hudson Pacific Properties, Inc. | 6,017 | 175,997 | ||||||
ICADE | 9,027 | 710,629 | ||||||
Intervest Offices & Warehouses NV* | 1,173 | 33,552 | ||||||
Invesco Office J-Reit, Inc. | 127 | 118,287 | ||||||
Investa Office Fund | 89,767 | 284,622 | ||||||
Japan Excellent, Inc. | 157 | 226,056 | ||||||
Japan Prime Realty Investment Corp. | 111 | 499,187 | ||||||
Japan Real Estate Investment Corp. | 190 | 1,203,572 | ||||||
Keppel Real Estate Investment Trust | 227,400 | 177,544 | ||||||
Kilroy Realty Corp. | 24,760 | 1,604,696 | ||||||
Lar Espana Real Estate Socimi SA | 6,433 | 66,163 | ||||||
Mack-Cali Realty Corp. | 9,666 | 247,063 | ||||||
MCUBS MidCity Investment Corp. | 31 | 106,053 | ||||||
Mori Hills Real Estate Investment Trust Investment Corp. | 499 | 757,880 | ||||||
| Description | Number of Shares | Value | ||||||
Mori Trust Sogo Real Estate Investment Trust, Inc. | 135 | 268,224 | ||||||
New York Real Estate Investment Trust, Inc. | 12,191 | 119,838 | ||||||
Nippon Building Fund, Inc. | 203 | 1,308,815 | ||||||
Orix JREIT, Inc. | 764 | $ | 1,295,353 | |||||
Paramount Group, Inc. | 30,200 | 504,340 | ||||||
Parkway Properties, Inc. | 8,992 | 147,918 | ||||||
Piedmont Office Realty Trust, Inc., Class A | 11,569 | 230,339 | ||||||
Premier Investment Corp. | 145 | 188,064 | ||||||
Prosperity Real Estate Investment Trust | 177,000 | 68,912 | ||||||
QTS Realty Trust, Inc., Class A | 2,805 | 135,818 | ||||||
SIA Real Estate Investment Trust, Inc. | 7 | 27,862 | ||||||
SL Green Realty Corp. | 21,803 | 2,291,059 | ||||||
Spring Real Estate Investment Trust | 239,000 | 104,142 | ||||||
VEREIT, Inc. | 200,007 | 1,776,062 | ||||||
Vornado Realty Trust | 32,331 | 3,095,047 | ||||||
Workspace Group PLC | 16,961 | 206,935 | ||||||
|
| |||||||
TOTAL OFFICE | $ | 32,596,128 | ||||||
REAL ESTATE OPERATING COMPANIES – 0.0%** |
| |||||||
Hersha Hospitality Trust | 3,610 | 69,637 | ||||||
Picton Property Income Ltd. | 63,920 | 67,946 | ||||||
Schroder Real Estate Investment Trust Ltd. | 71,756 | 61,335 | ||||||
|
| |||||||
TOTAL REAL ESTATE OPERATING COMPANIES | $ | 198,918 | ||||||
RESIDENTIAL – 4.2% |
| |||||||
Advance Residence Investment Corp. | 166 | 455,252 | ||||||
Aedifica SA | 1,928 | 136,081 | ||||||
American Campus Communities, Inc. | 10,685 | 478,154 | ||||||
American Homes 4 Rent, Class A | 15,677 | 248,010 | ||||||
Apartment Investment & Management Co., Class A | 12,841 | 514,410 | ||||||
Ascott Residence Trust | 110,100 | 92,920 | ||||||
AvalonBay Communities, Inc. | 22,168 | 3,919,081 | ||||||
Boardwalk Real Estate Investment Trust | 2,626 | 112,390 | ||||||
Camden Property Trust | 7,061 | 570,035 | ||||||
Canadian Apartment Properties Real Estate Investment Trust | 7,852 | 186,678 | ||||||
Comforia Residential Real Estate Investment Trust, Inc. | 64 | 146,827 | ||||||
Education Realty Trust, Inc. | 5,025 | 199,844 | ||||||
Empiric Student Property PLC | 57,542 | 94,377 | ||||||
Equity Lifestyle Properties, Inc. | 6,813 | 466,622 | ||||||
Equity Residential | 64,365 | 4,381,326 | ||||||
Essex Property Trust, Inc. | 6,953 | 1,532,789 | ||||||
Ichigo Office Real Estate Investment Trust Investment | 190 | 148,929 | ||||||
Ingenia Communities Group | 15,219 | 31,822 | ||||||
InterRent Real Estate Investment Trust | 6,334 | 37,963 | ||||||
Invincible Investment Corp. | 503 | 388,596 | ||||||
Irish Residential Properties Real Estate Investment Trust PLC* | 48,633 | 62,370 | ||||||
Japan Rental Housing Investments, Inc. | 216 | 171,947 | ||||||
Kenedix Residential Investment Corp. | 44 | 124,887 | ||||||
April 30, 2016 / ANNUAL REPORT
PORTFOLIOS OF INVESTMENTS 61
Wilmington Multi-Manager Real Asset Fund (continued)
| Description | Number of Shares | Value | ||||||
Killam Apartment Real Estate Investment Trust | 6,336 | $ | 59,436 | |||||
Mid-America Apartment Communities, Inc. | 5,971 | 571,484 | ||||||
Milestone Apartments Real Estate Investment Trust | 2,900 | 39,130 | ||||||
Monogram Residential Trust, Inc.# | 13,147 | 133,179 | ||||||
NexPoint Residential Trust, Inc.# | 4,363 | 61,344 | ||||||
Nippon Accommodations Fund, Inc. | 61 | 263,149 | ||||||
Post Properties, Inc. | 4,096 | 234,947 | ||||||
Preferred Apartment Communities, Inc.# | 3,500 | 43,190 | ||||||
Silver Bay Realty Trust Corp. | 4,617 | 67,408 | ||||||
Starts Proceed Investment Corp. | 17 | 26,986 | ||||||
Sun Communities, Inc. | 17,730 | 1,203,335 | ||||||
UDR, Inc. | 52,823 | 1,844,579 | ||||||
UMH Properties, Inc.# | 3,172 | 31,086 | ||||||
|
| |||||||
TOTAL RESIDENTIAL | $ | 19,080,563 | ||||||
RETAIL – 11.3% |
| |||||||
Acadia Realty Trust | 5,779 | 194,752 | ||||||
AEON Real Estate Investment Trust Investment Corp. | 143 | 181,035 | ||||||
Agree Realty Corp. | 998 | 38,702 | ||||||
Alexander’s, Inc. | 247 | 94,519 | ||||||
Altarea SCA | 454 | 94,094 | ||||||
Brixmor Property Group, Inc. | 13,950 | 352,237 | ||||||
CapitaLand Mall Trust | 337,400 | 519,328 | ||||||
CapitaLand Retail China Trust Management Ltd. | 106,300 | 116,587 | ||||||
CBL & Associates Properties, Inc. | 15,254 | 178,167 | ||||||
Cedar Realty Trust, Inc. | 4,681 | 32,393 | ||||||
Charter Hall Retail Real Estate Investment Trust | 35,501 | 128,488 | ||||||
Choice Properties Real Estate Investment Trust | 3,565 | 36,909 | ||||||
CT Real Estate Investment Trust | 5,378 | 61,894 | ||||||
DDR Corp. | 80,844 | 1,414,770 | ||||||
Equity One, Inc. | 7,174 | 203,024 | ||||||
Eurocommercial Properties NV | 13,860 | 647,833 | ||||||
Federal Realty Investment Trust | 5,713 | 868,833 | ||||||
Fortune Real Estate Investment Trust | 142,000 | 157,251 | ||||||
Fortune Real Estate Investment Trust | 64,000 | 70,296 | ||||||
Frasers Centrepoint Trust | 100,000 | 144,998 | ||||||
Frontier Real Estate Investment Corp. | 62 | 316,992 | ||||||
Fukuoka Real Investment Trust Corp. | 92 | 170,511 | ||||||
General Growth Properties, Inc. | 117,564 | 3,295,319 | ||||||
Getty Realty Corp. | 5,416 | 106,587 | ||||||
Hammerson PLC | 140,955 | 1,203,819 | ||||||
Immobiliare Grande Distribuzione SIIQ SpA | 41,447 | 37,635 | ||||||
Intu Properties PLC | 103,734 | 461,232 | ||||||
| Description | Number of Shares | Value | ||||||
Japan Retail Fund Investment Corp. | 1,061 | $ | 2,653,497 | |||||
Kenedix Retail Real Estate Investment Trust Corp.* | 70 | 187,829 | ||||||
Kimco Realty Corp. | 99,554 | 2,799,459 | ||||||
Kite Realty Group Trust | 6,126 | 166,811 | ||||||
Klepierre | 65,613 | 3,085,987 | ||||||
Link Real Estate Investment Trust | 524,000 | 3,185,113 | ||||||
Macerich Co. (The) | 10,576 | 804,622 | ||||||
Mapletree Commercial Trust | 172,600 | 192,512 | ||||||
Mercialys SA | 5,059 | 112,700 | ||||||
National Retail Properties, Inc. | 11,566 | 506,128 | ||||||
OneREIT | 18,100 | 48,326 | ||||||
Pennsylvania Real Estate Investment Trust | 5,171 | 118,623 | ||||||
Plaza Retail Real Estate Investment Trust | 17,012 | 63,726 | ||||||
Ramco-Gershenson Properties Trust | 6,768 | 119,861 | ||||||
Realty Income Corp.# | 20,533 | 1,215,554 | ||||||
Regency Centers Corp.# | 18,304 | 1,349,005 | ||||||
Retail Estates NV | 616 | 55,229 | ||||||
Retail Opportunity Investments Corp. | 8,569 | 168,552 | ||||||
Retail Properties of America, Inc. | 23,153 | 370,216 | ||||||
RioCan Real Estate Investment Trust | 20,027 | 435,432 | ||||||
Rouse Properties, Inc. | 2,250 | 41,557 | ||||||
Saul Centers, Inc. | 2,445 | 130,025 | ||||||
Scentre Group | 851,615 | 3,036,903 | ||||||
Seritage Growth Properties, Class A | 1,349 | 71,996 | ||||||
Shopping Centres Australasia Property Group | 91,238 | 162,333 | ||||||
Simon Property Group, Inc. | 44,007 | 8,852,888 | ||||||
Smart Real Estate Investment Trust | 7,151 | 191,955 | ||||||
SPH Real Estate Investment Trust | 174,000 | 123,560 | ||||||
Starhill Global Real Estate Investment Trust | 199,400 | 115,650 | ||||||
Tanger Factory Outlet Centers, Inc. | 7,218 | 253,207 | ||||||
Taubman Centers, Inc. | 4,721 | 327,873 | ||||||
Unibail-Rodamco SE | 20,116 | 5,389,942 | ||||||
Urban Edge Properties | 7,736 | 200,672 | ||||||
Urstadt Biddle Properties, Inc., Class A | 1,937 | 39,825 | ||||||
Vastned Retail NV | 2,651 | 116,717 | ||||||
Weingarten Realty Investors | 9,203 | 339,775 | ||||||
Wereldhave Belgium NV | 322 | 42,106 | ||||||
Westfield Corp. | 372,680 | 2,862,018 | ||||||
WP GLIMCHER, Inc. | 15,193 | 159,375 | ||||||
|
| |||||||
TOTAL RETAIL | $ | 51,225,764 | ||||||
SPECIALIZED – 6.2% |
| |||||||
ALE Property Group | 22,174 | 71,655 | ||||||
Apple Hospitality REIT, Inc.# | 12,942 | 244,992 | ||||||
Arena Real Estate Investment Trust | 24,787 | 36,469 | ||||||
Ashford Hospitality Prime, Inc. | 8,237 | 92,172 | ||||||
Ashford Hospitality Trust, Inc. | 4,355 | 24,344 | ||||||
ANNUAL REPORT / April 30, 2016
| 62 | PORTFOLIOS OF INVESTMENTS |
Wilmington Multi-Manager Real Asset Fund (continued)
| Description | Number of Shares | Value | ||||||
Assura PLC | 215,458 | $ | 178,344 | |||||
Big Yellow Group PLC | 18,842 | 221,901 | ||||||
Care Capital Properties, Inc. | 6,872 | 183,276 | ||||||
CareTrust Real Estate Investment Trust, Inc. | 4,804 | 61,107 | ||||||
CDL Hospitality Trusts | 113,800 | 118,044 | ||||||
Chatham Lodging Trust | 3,458 | 73,690 | ||||||
Chesapeake Lodging Trust | 4,775 | 117,608 | ||||||
Corrections Corp. of America | 9,656 | 293,736 | ||||||
CubeSmart | 29,168 | 863,664 | ||||||
DiamondRock Hospitality Co.# | 14,595 | 130,041 | ||||||
EPR Properties | 5,070 | 334,012 | ||||||
Extra Space Storage, Inc. | 10,254 | 871,077 | ||||||
FelCor Lodging Trust, Inc. | 8,425 | 60,323 | ||||||
First Real Estate Investment Trust | 92,000 | 85,511 | ||||||
Folkestone Education Trust | 34,756 | 65,538 | ||||||
Four Corners Property Trust, Inc. | 3,714 | 65,923 | ||||||
Gaming and Leisure Properties, Inc.# | 23,200 | 760,728 | ||||||
Geo Group, Inc. (The) | 6,360 | 203,711 | ||||||
HCP, Inc.# | 38,173 | 1,291,393 | ||||||
Healthcare Realty Trust, Inc. | 26,519 | 802,995 | ||||||
Healthcare Trust of America, Inc., Class A | 31,235 | 902,379 | ||||||
Hospitality Properties Trust | 11,737 | 300,350 | ||||||
Host Hotels & Resorts, Inc. | 129,398 | 2,047,076 | ||||||
Hotel Property Investments | 16,887 | 35,310 | ||||||
InnVest Real Estate Investment Trust | 11,769 | 51,214 | ||||||
Iron Mountain, Inc. | 15,782 | 576,516 | ||||||
Japan Hotel REIT Investment Corp. | 421 | 387,763 | ||||||
Keppel DC Real Estate Investment Trust | 94,900 | 77,269 | ||||||
LaSalle Hotel Properties | 9,113 | 217,801 | ||||||
LTC Properties, Inc. | 3,245 | 150,536 | ||||||
Medical Properties Trust, Inc. | 19,502 | 259,572 | ||||||
National Health Investors, Inc. | 2,804 | 190,924 | ||||||
National Storage Real Estate Investment Trust | 28,164 | 36,833 | ||||||
New Senior Investment Group, Inc. | 11,114 | 120,031 | ||||||
NorthWest Healthcare Properties Real Estate Investment Trust | 7,900 | 60,760 | ||||||
Omega Healthcare Investors, Inc. | 13,575 | 458,428 | ||||||
Parkway Life Real Estate Investment Trust | 54,000 | 98,375 | ||||||
Pebblebrook Hotel Trust | 28,295 | 782,074 | ||||||
Physicians Realty Trust | 7,858 | 142,466 | ||||||
Public Storage | 21,396 | 5,237,955 | ||||||
Regal Real Estate Investment Trust | 106,000 | 27,194 | ||||||
RLJ Lodging Trust | 9,851 | 207,561 | ||||||
Ryman Hospitality Properties, Inc. | 4,403 | 226,887 | ||||||
Sabra Health Care Real Estate Investment Trust, Inc. | 4,628 | 97,605 | ||||||
| Description | Number of Shares | Value | ||||||
Safestore Holdings PLC | 65,638 | $ | 324,742 | |||||
Senior Housing Properties Trust | 19,470 | 342,283 | ||||||
Sovran Self Storage, Inc. | 3,230 | 343,091 | ||||||
Summit Hotel Properties, Inc. | 6,545 | 74,613 | ||||||
Sunstone Hotel Investors, Inc. | 61,773 | 791,312 | ||||||
Universal Health Realty Income Trust | 969 | 52,907 | ||||||
Ventas, Inc. | 27,556 | 1,711,779 | ||||||
Vital Healthcare Property Trust | 25,389 | 36,697 | ||||||
Welltower, Inc. | 61,020 | 4,236,008 | ||||||
Xenia Hotels & Resorts, Inc. | 9,913 | 152,462 | ||||||
|
| |||||||
TOTAL SPECIALIZED | $ | 28,011,027 | ||||||
|
| |||||||
TOTAL REAL ESTATE INVESTMENT TRUSTS (COST $144,498,619) |
| $ | 171,041,230 | |||||
RIGHTS – 0.0%** |
| |||||||
FINANCIALS – 0.0%** |
| |||||||
Hemfosa Fastigheter AB, Expire 5/30/2016* | 16,692 | 6,028 | ||||||
|
| |||||||
TOTAL RIGHTS (COST $0) |
| $ | 6,028 | |||||
|
| |||||||
TOTAL REAL ESTATE RELATED SECURITIES (COST $196,136,008) |
| $ | 227,839,509 | |||||
| Contracts/ Notional Value | ||||||||
PURCHASED OPTIONS – 0.1% |
| |||||||
PUT OPTIONS – 0.1% |
| |||||||
3M GBP Libor Option, Strike Price $0.99, Expiring 6/21/2017 | 19 | $ | 1,301 | |||||
ICE A PUT UK 90 DAY LIBOR, Strike Price $0.99, Expiring 12/21/2016 | 191 | — | ||||||
IRO USD 1Y BOA, Strike Price $0.01, Expiring 6/20/2016 | 7,400,000 | 1,922 | ||||||
IRO USD 1Y CBK, Strike Price $1.50, Expiring 7/05/2016 | 29,900,000 | 23 | ||||||
IRO USD 1Y Dub, Strike Price $1.25, Expiring 7/05/2016 | 55,000,000 | 674 | ||||||
IRO USD 1Y GLM, Strike Price $0.01, Expiring 7/05/2016 | 21,500,000 | 786 | ||||||
IRO USD 1Y GLM, Strike Price $1.50, Expiring 7/11/2016 | 32,400,000 | 52 | ||||||
IRO USD 1Y MYC, Strike Price $0.01, Expiring 6/23/2016 | 15,000,000 | 1,470 | ||||||
IRO USD 1Y MYC, Strike Price $0.01, Expiring 6/24/2016 | 14,900,000 | 1,536 | ||||||
IRO USD 1Y MYC, Strike Price $0.01, Expiring 7/05/2016 | 27,300,000 | 334 | ||||||
IRO USD 1Y RYL, Strike Price $0.01, Expiring 6/20/2016 | 2,000,000 | 520 | ||||||
April 30, 2016 / ANNUAL REPORT
PORTFOLIOS OF INVESTMENTS 63
Wilmington Multi-Manager Real Asset Fund (continued)
| Description | Contracts/ Notional Value | Value | ||||||
IRO USD 30Y DUB, Strike Price $0.03, Expiring 10/23/2018 | 1,500,000 | $ | 79,348 | |||||
IRO USD 30Y MYC, Strike Price $0.03, Expiring 12/10/2018 | 300,000 | 4,478 | ||||||
IRO USD 30Y MYC, Strike Price $0.03, Expiring 3/29/2019 | 900,000 | 74,168 | ||||||
IRO USD 30Y MYC, Strike Price $0.03, Expiring 10/17/2018 | 1,000,000 | 73,024 | ||||||
IRO USD 30Y MYC, Strike Price $0.03, Expiring 11/15/2018 | 300,000 | 22,344 | ||||||
IRO USD 5Y5Y FBF, Strike Price $3.40, Expiring 12/05/2016 | 3,800,000 | 3,307 | ||||||
|
| |||||||
TOTAL PUT OPTIONS | $ | 265,287 | ||||||
|
| |||||||
TOTAL PURCHASED OPTIONS (COST $499,604) |
| $ | 265,287 | |||||
| Number of Shares | ||||||||
| SHORT-TERM INVESTMENTS – 2.5% | ||||||||
MONEY MARKET FUND – 2.5% |
| |||||||
Dreyfus Cash Management Fund, Institutional | 11,512,752 | $ | 11,512,752 | |||||
|
| |||||||
TOTAL SHORT-TERM INVESTMENTS (COST $11,512,752) |
| $ | 11,512,752 | |||||
| Description | Par Value | Value | ||||||
CASH COLLATERAL INVESTED FOR SECURITIES ON |
| |||||||
REPURCHASE AGREEMENT – 1.0% |
| |||||||
BNP Paribas Securities Corp., 0.29%, dated 4/29/16, due 5/02/16, repurchase price $865,793, collateralized by U.S. Government & Treasury Securities 0.00% to 7.63%, maturing 5/26/16 to 5/15/45; total market value of $883,087. | $ | 865,772 | $ | 865,772 | ||||
Citigroup Global Markets, Inc., 0.30%, dated 4/29/16, due 5/02/16, repurchase price $865,794, collateralized by U.S. Government & Treasury Securities 0.00% to 9.00%, maturing 6/30/17 to 5/01/46; total market value of $883,087. | 865,772 | 865,772 | ||||||
Daiwa Capital Markets America, 0.32%,dated 4/29/16, due 5/02/16, repurchase price $865,795, collateralized by U.S. Government & Treasury Securities 0.00% to 8.75%, maturing 5/05/16 to 9/09/49; total market value of $883,088. | 865,772 | 865,772 | ||||||
HSBC Securities USA, Inc., 0.27%, dated 4/29/16, due 5/02/16, repurchase price $865,791, collateralized by U.S. Government & Treasury Securities 0.00% to 7.25%, maturing 5/15/16 to 7/15/37; total market value of $883,090. | 865,772 | 865,772 | ||||||
Nomura Securities International, Inc., 0.32%, dated 4/29/16, due 5/02/16,repurchase price $865,795, collateralized by U.S. Government & Treasury Securities 0.00% to 9.50%, maturing 5/15/16 to 3/20/66; total market value of $883,087. | 865,772 | 865,772 | ||||||
TD Securities (USA) LLC, 0.30%, dated 4/29/16, due 5/02/16, repurchase price $227,810, collateralized by U.S. Government & Treasury Securities 1.38% to 4.50%, maturing 11/30/18 to 4/01/46; total market value of $232,360. | 227,804 | 227,804 | ||||||
|
| |||||||
TOTAL CASH COLLATERAL (COST $4,556,664) |
| $ | 4,556,664 | |||||
|
| |||||||
TOTAL INVESTMENTS IN (COST $490,254,875) |
| $ | 525,539,705 | |||||
| Contracts/ Notional Value | ||||||||
WRITTEN OPTIONS – (0.1%) |
| |||||||
CALL OPTIONS – 0.0%** |
| |||||||
INF CAP Fwd EUR 20Y GLM, Strike Price $0.03, Expiring 6/22/2035 | (600,000 | ) | $ | (5,967 | ) | |||
INF CAP U.S. 1Y DUB, Strike Price $0.03, Expiring 6/01/2016 | (600,000 | ) | — | |||||
INF CAP U.S. YOY, Strike Price $0.03, Expiring 4/10/2020 | (8,300,000 | ) | 36,261 | |||||
ANNUAL REPORT / April 30, 2016
| 64 | PORTFOLIOS OF INVESTMENTS |
Wilmington Multi-Manager Real Asset Fund (continued)
| Description | Contracts/ Notional Value | Value | ||||||
IRO USD 3Y2Y FBF, Strike Price $0.02, Expiring 6/23/2016 | (11,700,000 | ) | $ | (17,807 | ) | |||
IRO USD 5Y5Y FBF, Strike Price $2.40, Expiring 12/05/2016 | (3,800,000 | ) | (59,444 | ) | ||||
IRO USD 5Y5Y GLM, Strike Price $0.02, Expiring 7/18/2016 | (3,600,000 | ) | (7,265 | ) | ||||
IRO USD 5Y5Y MYC, Strike Price $0.02, Expiring 7/25/2016 | (2,300,000 | ) | (8,704 | ) | ||||
ITRAXX EUR 25 5Y BRC, Strike Price $0.01, Expiring 6/15/2016 | (1,000,000 | ) | (366 | ) | ||||
|
| |||||||
TOTAL CALL OPTIONS | $ | (63,292 | ) | |||||
PUT OPTIONS – (0.1%) | ||||||||
3M GBP Libor Option, Strike Price $0.98, Expiring 6/21/2017 | (19 | ) | (260 | ) | ||||
CDX IG25 5Y V1 BOA, Strike Price $0.02, Expiring 5/18/2016 | (300,000 | ) | — | |||||
CDX IG25 5Y V1 BRC, Strike Price $0.02, Expiring 5/18/2016 | (400,000 | ) | — | |||||
CDX IG25 5Y V1 CBK, Strike Price $0.02, Expiring 5/18/2016 | (400,000 | ) | — | |||||
CDX O IG26 5Y V1 JPM, Strike Price $0.01, Expiring 7/20/2016 | (4,300,000 | ) | (6,916 | ) | ||||
Euro Bund Option, Strike Price $1.59, Expiring 6/24/2016 | (11 | ) | (7,809 | ) | ||||
ICE A PUT UK 90 DAY LIBOR, Strike Price $0.98, Expiring 12/21/2016 | (191 | ) | — | |||||
INF FLOOR U.S. YOY, Strike Price $0.00, Expiring 4/10/2020 | (8,300,000 | ) | 2,957 | |||||
IRO USD 30Y MYC, Strike Price $0.02, Expiring 10/17/2018 | (4,600,000 | ) | (67,999 | ) | ||||
IRO USD 3Y2Y FBF, Strike Price $0.02, Expiring 6/23/2016 | (11,700,000 | ) | (2,594 | ) | ||||
IRO USD 5Y DUB, Strike Price $0.03, Expiring 10/23/2018 | (7,500,000 | ) | (84,191 | ) | ||||
IRO USD 5Y MYC, Strike Price $0.02, Expiring 11/15/2018 | (1,400,000 | ) | (21,638 | ) | ||||
IRO USD 5Y MYC, Strike Price $0.02, Expiring 12/10/2018 | (1,400,000 | ) | (22,370 | ) | ||||
| Description | Contracts/ Notional Value | Value | ||||||
IRO USD 5Y MYC, Strike Price $0.02, Expiring 3/29/2019 | (4,300,000 | ) | $ | (75,358 | ) | |||
IRO USD 5Y5Y MYC, Strike Price $0.03, Expiring 7/25/2016 | (2,300,000 | ) | (5,801 | ) | ||||
ITRAXX EUR 25 5Y BRC, Strike Price $0.01, Expiring 6/15/2016 | (1,000,000 | ) | (900 | ) | ||||
OTC Eput AUD vs NZD JPM, Strike Price $0.01, Expiring 7/20/2016 | (420,000 | ) | (4,736 | ) | ||||
OTC Eput EUR vs USD JPM, Strike Price $0.01, Expiring 5/03/2016 | (1,020,000 | ) | — | |||||
|
| |||||||
TOTAL PUT OPTIONS | $ | (297,615 | ) | |||||
PUT SWAPTIONS – 0.0%** |
| |||||||
INF CAP U.S. 10Y JPM, Strike Price $0.04, Expiring 4/22/2024 | (1,300,000 | ) | (626 | ) | ||||
INF CAP U.S. 10Y JPM, Strike Price $0.04, Expiring 5/16/2024 | (100,000 | ) | (52 | ) | ||||
INF FLOOR U.S. YOY JPM, Strike Price $0.02, Expiring 3/24/2020 | (2,300,000 | ) | (22,066 | ) | ||||
INF FLOOR USD, Strike Price $2.17, Expiring 4/07/2020 | (2,600,000 | ) | (708 | ) | ||||
|
| |||||||
TOTAL PUT SWAPTIONS | $ | (23,452 | ) | |||||
|
| |||||||
TOTAL WRITTEN OPTIONS (PREMIUMS RECEIVED $(554,951)) |
| $ | (384,359 | ) | ||||
| TOTAL INVESTMENTS NET OF WRITTEN OPTIONS – 115.4% | $ | 525,155,346 | ||||||
| COLLATERAL FOR SECURITIES ON LOAN – (1.0%) | (4,556,664 | ) | ||||||
| OTHER LIABILITIES LESS ASSETS – (14.4%) | (65,665,548 | ) | ||||||
|
| |||||||
| TOTAL NET ASSETS – 100.0% | $ | 454,933,134 | ||||||
|
| |||||||
Cost of investments for Federal income tax purposes is $503,382,767. The net unrealized appreciation/(depreciation) of investments was $22,156,938. This consists of net unrealized appreciation from investment for those securities having an excess of value over cost of $29,540,254 and net unrealized depreciation from investments for those securities having an excess of cost over value of $7,383,316.
April 30, 2016 / ANNUAL REPORT
PORTFOLIOS OF INVESTMENTS 65
Wilmington Multi-Manager Real Asset Fund (continued)
Various inputs are used in determining the value of the Fund’s investments. These inputs are summarized in the three broad levels listed below.
Level 1 | – | quoted prices in active markets for identical securities | ||
Level 2 | – | other significant observable inputs (including quoted prices for similar securities, interest rates, prepayment speeds, credit risk, etc.) | ||
Level 3 | – | significant unobservable inputs (including the Fund’s own assumptions in determining the fair value of investments) |
The following is a summary of the inputs used as of April 30, 2016 in valuing the Fund’s assets carried at fair value:
Level 1 |
Level 2 |
Level 3 |
Total | |||||||||||||
Assets | ||||||||||||||||
Investments in Securities | ||||||||||||||||
Inflation-Linked & Fixed Income Securities | ||||||||||||||||
Asset-Backed Securities | $ | — | $ | 5,968,638 | $ | — | $ | 5,968,638 | ||||||||
Corporate Bonds | — | 16,715,399 | — | 16,715,399 | ||||||||||||
Foreign Government Inflation-Linked Securities | — | 10,044,553 | — | 10,044,553 | ||||||||||||
Foreign Government Securities | — | 13,277,187 | — | 13,277,187 | ||||||||||||
Investment Companies | 37,610,300 | — | — | 37,610,300 | ||||||||||||
Mortgage-Backed Securities | — | 2,608,038 | — | 2,608,038 | ||||||||||||
U.S. Government Agency Obligations | — | 7,139,034 | — | 7,139,034 | ||||||||||||
U.S. Government Inflation-Linked Securities | — | 184,765,752 | — | 184,765,752 | ||||||||||||
U.S. Treasury | — | 3,236,592 | — | 3,236,592 | ||||||||||||
Real Estate Related Securities | ||||||||||||||||
Common Stocks | 56,359,776 | — | — | 56,359,776 | ||||||||||||
Investment Companies | 360,370 | — | — | 360,370 | ||||||||||||
Preferred Stock | 72,105 | — | — | 72,105 | ||||||||||||
Real Estate Investment Trusts | 171,041,230 | — | — | 171,041,230 | ||||||||||||
Rights | 6,028 | — | — | 6,028 | ||||||||||||
Purchased Options | — | 265,287 | — | 265,287 | ||||||||||||
Short-Term Investments | ||||||||||||||||
Money Market Fund | 11,512,752 | — | — | 11,512,752 | ||||||||||||
Repurchase Agreements | — | 4,556,664 | — | 4,556,664 | ||||||||||||
|
|
|
|
|
|
|
| |||||||||
Total Investments in Securities | 276,962,561 | 248,577,144 | — | 525,539,705 | ||||||||||||
|
|
|
|
|
|
|
| |||||||||
Other Financial Instruments! | ||||||||||||||||
Forward Foreign Currency Contracts | $ | — | $ | 852,311 | $ | — | $ | 852,311 | ||||||||
Financial Futures Contracts | 123,197 | — | — | 123,197 | ||||||||||||
Credit Default Swaps | — | 14,852 | — | 14,852 | ||||||||||||
Interest Rate Swaps | — | 398,847 | — | 398,847 | ||||||||||||
|
|
|
|
|
|
|
| |||||||||
Total Assets | 277,085,758 | 249,843,154 | — | 526,928,912 | ||||||||||||
|
|
|
|
|
|
|
| |||||||||
Liabilities | ||||||||||||||||
Other Financial Instruments! | ||||||||||||||||
Written Options | $ | — | $ | (384,359 | ) | $ | — | $ | (384,359 | ) | ||||||
Forward Foreign Currency Contracts | — | (2,166,098 | ) | — | (2,166,098 | ) | ||||||||||
Financial Futures Contracts | (1,849 | ) | — | — | (1,849 | ) | ||||||||||
Credit Default Swaps | — | (23,520 | ) | — | (23,520 | ) | ||||||||||
Interest Rate Swaps | — | (1,411,327 | ) | — | (1,411,327 | ) | ||||||||||
|
|
|
|
|
|
|
| |||||||||
Total Liabilities | $ | (1,849 | ) | $ | (3,985,304 | ) | $ | — | $ | (3,987,153 | ) | |||||
|
|
|
|
|
|
|
| |||||||||
| ! | Other financial instruments are derivative instruments not reflected in the value of total investments in securities in the Portfolio of Investments. Financial futures contracts, credit default swaps, interest rate swaps and forward foreign currency contracts are valued at the unrealized appreciation (depreciation) on the instrument and written options are reported at their market value at period end. |
|
ANNUAL REPORT / April 30, 2016
| 66 | PORTFOLIOS OF INVESTMENTS |
Wilmington Multi-Manager Real Asset Fund (continued)
| # | Security, or a portion thereof, is on loan. See Note 2 in Notes to Financial Statements. |
| D | Floating rate note with current rate and stated maturity date shown. |
| ‡ | Zero coupon security. The rate shown reflects the effective yield at purchase date. |
| ^ | 7-Day net yield. |
| * | Non-income producing security. |
| W | Denotes a restricted security that may be resold without restriction to “qualified institutional buyers” as defined in Rule 144A under the Securities Act of 1933 and that the Fund has determined to be liquid under criteria established by the Fund’s Board of Trustees. At April 30, 2016, these liquid restricted securities amounted to $6,812,107 representing 1.50% of total net assets. |
| ** | Represents less than 0.05%. |
The following acronyms are used throughout this Fund:
| ||
| CDX - Markit CDX.NA.IG | ||
| INF - Inflation | ||
| IRO - Interest Rate Option | ||
| LLC - Limited Liability Corporation | ||
| LP - Limited Partnership | ||
| OTC - Over The Counter | ||
| PLC - Public Limited Company | ||
| REIT - Real Estate Investment Trust | ||
The following Counter Parties acronyms are used throughout this Fund:
| ||
| BOA - Bank of America NA | ||
| CBK - Citibank NA | ||
| DUB - Deutsche Bank AG | ||
| FBF - Credit Suisse International | ||
| GLM - Goldman Sachs Bank USA | ||
| ICE - Intercontinental Exchange, Inc. | ||
| JPM - JP Morgan Chase Bank, N.A. | ||
| MYC - Morgan Stanley Capital Services Inc. | ||
| RYL - Royal Bank of Scotland PLC |
| Currency Code | Currency | |
| ||
BRL | Brazilian Real | |
CAD | Canadian Dollar | |
DKK | Danish Krone | |
EUR | Euro | |
GBP | Pound Sterling | |
JPY | Japanese Yen | |
MXN | Mexican Peso | |
NZD | New Zealand Dollar | |
SEK | Swedish Krona | |
At April 30, 2016, the Real Asset Fund had the following outstanding forward foreign currency contracts, which contractually obligates the Fund to deliver or receive currencies at specified future dates. The open contracts were as follows:
| Settlement Date | Counterparty | Contracts to Deliver/Receive | Contract Amount | Contract at Value | Unrealized Appreciation (Depreciation) | |||||||||||
| CONTRACTS PURCHASED | ||||||||||||||||
| 5/2/2016 | JP Morgan Securities | 296,200,000 Japanese Yen | $ | 2,641,982 | $ | 2,783,834 | $ | 141,852 | ||||||||
| 5/2/2016 | Citigroup Global Markets | 28,700,000 Japanese Yen | 258,698 | 269,736 | 11,038 | |||||||||||
| 5/3/2016 | Goldman Sachs & Company | 15,325,000 Danish Krone | 2,349,397 | 2,357,801 | 8,404 | |||||||||||
| 5/3/2016 | Goldman Sachs & Company | 15,230,000 Danish Krone | 2,314,548 | 2,343,394 | 28,846 | |||||||||||
| 5/3/2016 | Banc of America Securities | 5,715,841 New Zealand Dollar | 3,912,776 | 3,990,434 | 77,658 | |||||||||||
| 5/3/2016 | Banc of America Securities | 2,513,000 Euro | 2,868,590 | 2,877,525 | 8,935 | |||||||||||
| 5/3/2016 | Goldman Sachs & Company | 1,775,000 Euro | 2,010,647 | 2,032,653 | 22,006 | |||||||||||
| 5/3/2016 | HSBC Securities, Inc. | 994,747 Brazilian Real | 274,065 | 288,941 | 14,876 | |||||||||||
| 5/3/2016 | Deutsche Bank | 994,747 Brazilian Real | 288,266 | 288,941 | 675 | |||||||||||
| 5/3/2016 | Citigroup Global Markets | 751,000 Euro | 845,987 | 860,013 | 14,026 | |||||||||||
| 5/3/2016 | Goldman Sachs & Company | 392,000 Euro | 441,563 | 448,901 | 7,338 | |||||||||||
| 5/3/2016 | Goldman Sachs & Company | 239,000 Pound Sterling | 343,710 | 349,219 | 5,509 | |||||||||||
| 5/3/2016 | Citigroup Global Markets | 80,000 Euro | 90,479 | 91,613 | 1,134 | |||||||||||
| 5/12/2016 | JP Morgan Securities | 37,891,887 South African Rand | 2,605,149 | 2,654,777 | 49,628 | |||||||||||
| 5/18/2016 | JP Morgan Securities | 36,176,000 South African Rand | 2,312,748 | 2,531,189 | 218,441 | |||||||||||
| 5/20/2016 | Barclays Bank International | 4,118,000 Mexican Peso | 234,898 | 238,866 | 3,968 | |||||||||||
| 5/24/2016 | Barclays Bank International | 860,655,600 South Korean Won | 714,000 | 755,094 | 41,094 | |||||||||||
| 5/24/2016 | HSBC Securities, Inc. | 540,865,400 South Korean Won | 449,000 | 474,527 | 25,527 | |||||||||||
| 5/24/2016 | JP Morgan Securities | 305,790,600 South Korean Won | 254,000 | 268,284 | 14,284 | |||||||||||
April 30, 2016 / ANNUAL REPORT
| PORTFOLIOS OF INVESTMENTS | 67 |
Wilmington Multi-Manager Real Asset Fund (continued)
| Settlement Date | Counterparty | Contracts to Deliver/Receive | Contract Amount | Contract at Value | Unrealized Appreciation (Depreciation) | |||||||||||||||
| CONTRACTS PURCHASED (continued) | ||||||||||||||||||||
| 5/24/2016 | HSBC Securities, Inc. | 194,536,300 South Korean Won | $ | 161,000 | $ | 170,676 | $ | 9,676 | ||||||||||||
| 5/24/2016 | Citigroup Global Markets | 178,488,000 South Korean Won | 148,000 | 156,596 | 8,596 | |||||||||||||||
| 5/24/2016 | Citigroup Global Markets | 149,907,928 Indian Rupee | 2,199,353 | 2,249,262 | 49,909 | |||||||||||||||
| 5/24/2016 | Credit Suisse | 36,192,000 South Korean Won | 30,000 | 31,753 | 1,753 | |||||||||||||||
| 5/24/2016 | JP Morgan Securities | 34,158,671 Thai Baht | 956,156 | 977,325 | 21,169 | |||||||||||||||
| 5/24/2016 | Goldman Sachs & Company | 29,242,500 Taiwan Dollar | 875,000 | 906,874 | 31,874 | |||||||||||||||
| 5/24/2016 | JP Morgan Securities | 8,418,060 Taiwan Dollar | 252,000 | 261,062 | 9,062 | |||||||||||||||
| 5/24/2016 | Banc of America Securities | 5,486,620 Taiwan Dollar | 164,000 | 170,152 | 6,152 | |||||||||||||||
| 5/24/2016 | HSBC Securities, Inc. | 1,484,120 Taiwan Dollar | 44,000 | 46,026 | 2,026 | |||||||||||||||
| 5/24/2016 | JP Morgan Securities | 1,415,610 Taiwan Dollar | 42,000 | 43,901 | 1,901 | |||||||||||||||
| 5/24/2016 | Goldman Sachs & Company | 1,206,100 South Korean Won | 1,000 | 1,058 | 58 | |||||||||||||||
| 6/2/2016 | Deutsche Bank | 994,747 Brazilian Real | 273,230 | 286,033 | 12,803 | |||||||||||||||
| 6/3/2016 | Banc of America Securities | 62,528,298 Colombian Peso | 21,140 | 21,834 | 694 | |||||||||||||||
| CONTRACTS SOLD | ||||||||||||||||||||
| 5/2/2016 | HSBC Securities, Inc. | 324,900,000 Japanese Yen | 2,888,580 | 3,053,571 | (164,991) | |||||||||||||||
| 5/3/2016 | Banc of America Securities | 30,555,000 Danish Krone | 4,641,910 | 4,701,406 | (59,496) | |||||||||||||||
| 5/3/2016 | Banc of America Securities | 5,715,841 New Zealand Dollar | 3,952,093 | 3,990,435 | (38,342) | |||||||||||||||
| 5/3/2016 | Citigroup Global Markets | 3,725,000 Swedish Krona | 459,905 | 463,910 | (4,005) | |||||||||||||||
| 5/3/2016 | Citigroup Global Markets | 3,296,000 Euro | 3,746,467 | 3,774,436 | (27,969) | |||||||||||||||
| 5/3/2016 | HSBC Securities, Inc. | 1,804,000 Euro | 2,054,040 | 2,065,863 | (11,823) | |||||||||||||||
| 5/3/2016 | HSBC Securities, Inc. | 994,747 Brazilian Real | 288,266 | 288,941 | (675) | |||||||||||||||
| 5/3/2016 | Deutsche Bank | 994,747 Brazilian Real | 275,782 | 288,941 | (13,159) | |||||||||||||||
| 5/3/2016 | Citigroup Global Markets | 850,000 Pound Sterling | 1,215,671 | 1,241,991 | (26,320) | |||||||||||||||
| 5/3/2016 | JP Morgan Securities | 411,000 Euro | 467,463 | 470,659 | (3,196) | |||||||||||||||
| 5/3/2016 | JP Morgan Securities | 255,000 Australian Dollar | 195,264 | 193,865 | 1,399 | |||||||||||||||
| 5/4/2016 | Bank of New York | 2,978 Pound Sterling | 4,332 | 4,351 | (19) | |||||||||||||||
| 5/4/2016 | Bank of New York | 2,382 Pound Sterling | 3,466 | 3,481 | (15) | |||||||||||||||
| 5/12/2016 | Banc of America Securities | 35,691,706 South African Rand | 2,412,580 | 2,500,628 | (88,048) | |||||||||||||||
| 5/12/2016 | JP Morgan Securities | 2,200,181 South African Rand | 148,125 | 154,149 | (6,024) | |||||||||||||||
| 5/18/2016 | JP Morgan Securities | 37,891,887 South African Rand | 2,602,018 | 2,651,247 | (49,229) | |||||||||||||||
| 5/20/2016 | Barclays Bank International | 67,682,224 Mexican Peso | 3,797,188 | 3,925,925 | (128,737) | |||||||||||||||
| 5/20/2016 | Citigroup Global Markets | 15,842,000 Mexican Peso | 899,740 | 918,919 | (19,179) | |||||||||||||||
| 5/24/2016 | JP Morgan Securities | 2,109,119,300 South Korean Won | 1,752,852 | 1,850,429 | (97,577) | |||||||||||||||
| 5/24/2016 | Citigroup Global Markets | 87,908,070 Indian Rupee | 1,269,981 | 1,318,998 | (49,017) | |||||||||||||||
| 5/24/2016 | JP Morgan Securities | 45,665,600 Taiwan Dollar | 1,382,131 | 1,416,190 | (34,059) | |||||||||||||||
| 5/24/2016 | Deutsche Bank | 34,158,671 Thai Baht | 958,974 | 977,325 | (18,351) | |||||||||||||||
| 5/24/2016 | Banc of America Securities | 27,429,435 Indian Rupee | 393,000 | 411,559 | (18,559) | |||||||||||||||
| 5/24/2016 | JP Morgan Securities | 20,250,700 Indian Rupee | 290,000 | 303,847 | (13,847) | |||||||||||||||
| 5/24/2016 | JP Morgan Securities | 13,873,285 Indian Rupee | 199,000 | 208,159 | (9,159) | |||||||||||||||
| 5/24/2016 | Banc of America Securities | 10,687,820 Chinese Yuan Renminbi | 1,628,000 | 1,646,515 | (18,515) | |||||||||||||||
| 5/24/2016 | Deutsche Bank | 10,114,720 Chinese Yuan Renminbi | 1,540,000 | 1,558,226 | (18,226) | |||||||||||||||
| 5/24/2016 | Banc of America Securities | 1,842,292 Chinese Yuan Renminbi | 276,000 | 283,816 | (7,816) | |||||||||||||||
| 6/2/2016 | Citigroup Global Markets | 28,700,000 Japanese Yen | 258,914 | 269,955 | (11,041) | |||||||||||||||
| 6/2/2016 | Goldman Sachs & Company | 15,325,000 Danish Krone | 2,351,316 | 2,360,150 | (8,834) | |||||||||||||||
| 6/2/2016 | Banc of America Securities | 5,715,841 New Zealand Dollar | 3,906,766 | 3,983,873 | (77,107) | |||||||||||||||
| 6/2/2016 | Banc of America Securities | 2,513,000 Euro | 2,871,032 | 2,880,368 | (9,336) | |||||||||||||||
| 6/3/2016 | Goldman Sachs & Company | 448,161,353 Colombian Peso | 132,867 | 156,489 | (23,622) | |||||||||||||||
| 7/5/2016 | JP Morgan Securities | 3,900,000 Brazilian Real | 1,041,806 | 1,109,666 | (67,860) | |||||||||||||||
| 7/5/2016 | HSBC Securities, Inc. | 400,000 Brazilian Real | 106,829 | 113,812 | (6,983) | |||||||||||||||
ANNUAL REPORT / April 30, 2016
| 68 | PORTFOLIOS OF INVESTMENTS |
Wilmington Multi-Manager Real Asset Fund (continued)
| Settlement Date | Counterparty | Contracts to Deliver/Receive | Contract Amount | Contract at Value | Unrealized Appreciation (Depreciation) | |||||||||||||||
| CONTRACTS SOLD (continued) | ||||||||||||||||||||
| 10/4/2016 | Goldman Sachs & Company | 4,600,000 Brazilian Real | $ | 1,147,132 | $ | 1,273,654 | $ | (126,522) | ||||||||||||
| 10/4/2016 | JP Morgan Securities | 4,400,000 Brazilian Real | 1,038,961 | 1,218,278 | (179,317) | |||||||||||||||
| 10/4/2016 | Banc of America Securities | 1,600,000 Brazilian Real | 405,988 | 443,010 | (37,022) | |||||||||||||||
| 10/4/2016 | JP Morgan Securities | 1,500,000 Brazilian Real | 378,979 | 415,322 | (36,343) | |||||||||||||||
| 10/4/2016 | JP Morgan Securities | 1,000,000 Brazilian Real | 241,546 | 276,880 | (35,334) | |||||||||||||||
| 10/4/2016 | Citigroup Global Markets | 700,000 Brazilian Real | 169,598 | 193,817 | (24,219) | |||||||||||||||
| 1/4/2017 | JP Morgan Securities | 6,800,000 Brazilian Real | 1,599,624 | 1,838,669 | (239,045) | |||||||||||||||
| 1/4/2017 | Goldman Sachs & Company | 6,800,000 Brazilian Real | 1,590,867 | 1,838,669 | (247,802) | |||||||||||||||
| 1/4/2017 | Deutsche Bank | 2,200,000 Brazilian Real | 505,481 | 594,864 | (89,383) | |||||||||||||||
| 1/4/2017 | Deutsche Bank | 500,000 Brazilian Real | 118,546 | 135,196 | (16,650) | |||||||||||||||
| 4/3/2017 | Banc of America Securities | 715,300 Danish Krone | 108,297 | 111,622 | (3,325) | |||||||||||||||
NET UNREALIZED APPRECIATION (DEPRECIATION) ON FORWARD FOREIGN CURRENCY CONTRACTS |
| $(1,313,787) | ||||||||||||||||||
At April 30, 2016, the Real Asset Fund had open financial futures contracts as follows:
Underlying Contracts to Buy/Sell | Expiration Date | Number of Contracts | Contract Amount | Contract at Value | Unrealized Appreciation (Depreciation) | |||||||||||
LONG POSITIONS: | ||||||||||||||||
10 – Year U.S. Treasury Note Futures | June 2016 | 9 | $ 1,169,676 | $ 1,170,562 | $ | 886 | ||||||||||
5 – Year U.S. Treasury Note Futures | June 2016 | 31 | 3,729,882 | 3,748,336 | 18,454 | |||||||||||
90 – Day EURO Dollar Futures | December 2016 | 63 | 15,615,611 | 15,613,762 | (1,849) | |||||||||||
SHORT POSITIONS: | ||||||||||||||||
90 – Day EURO Dollar Futures | December 2017 | 63 | $15,577,857 | $15,574,388 | $ | 3,469 | ||||||||||
Euro – Bund Futures | June 2016 | 42 | 7,468,924 | 7,388,069 | 80,855 | |||||||||||
Euro – BTP Italian Government Bond Futures | June 2016 | 7 | 1,053,500 | 1,049,094 | 4,406 | |||||||||||
U.S. Treasury Long Bond Futures | June 2016 | 10 | 1,648,252 | 1,633,125 | 15,127 | |||||||||||
NET UNREALIZED APPRECIATION (DEPRECIATION) ON FINANCIAL FUTURES CONTRACTS | $ | 121,348 | ||||||||||||||
April 30, 2016 / ANNUAL REPORT
| PORTFOLIOS OF INVESTMENTS | 69 |
Wilmington Multi-Manager Real Asset Fund (continued)
At April 30, 2016, the Real Asset Fund had open interest rate swap contracts as follows:
Counterparty
| Termination
| Notional
| Fixed
| Floating Rate
| Fair Value
| Upfront
| Unrealized
| |||||||||||||||||||
CENTRALLY CLEARED | ||||||||||||||||||||||||||
Chicago Mercantile Exchange# | 4/17/18 | $ | 3,800,000 | 0.90% | 3 Month CAD CDOR | $ | (4,964 | ) | $ | 1,191 | $ | (6,155 | ) | |||||||||||||
Chicago Mercantile Exchange# | 12/16/17 | 7,100,000 | 1.50% | 3 Month USD LIBOR | (73,287 | ) | (70,645 | ) | (2,642 | ) | ||||||||||||||||
Chicago Mercantile Exchange# | 4/05/18 | 2,900,000 | 1.00% | 3 Month USD LIBOR | 1,030 | — | 1,030 | |||||||||||||||||||
Chicago Mercantile Exchange# | 6/15/18 | 6,400,000 | 1.25% | 3 Month USD LIBOR | 38,346 | (3,642 | ) | 41,988 | ||||||||||||||||||
Chicago Mercantile Exchange# | 12/16/20 | 2,000,000 | 2.00% | 3 Month USD LIBOR | (70,459 | ) | (48,929 | ) | (21,530 | ) | ||||||||||||||||
Chicago Mercantile Exchange# | 12/16/22 | 700,000 | 2.25% | 3 Month USD LIBOR | 36,386 | 4,860 | 31,526 | |||||||||||||||||||
Chicago Mercantile Exchange# | 9/16/25 | 500,000 | 2.22% | 3 Month USD LIBOR | (24,200 | ) | — | (24,200 | ) | |||||||||||||||||
Chicago Mercantile Exchange# | 10/02/25 | 3,900,000 | 2.35% | 3 Month USD LIBOR | (232,183 | ) | — | (232,183 | ) | |||||||||||||||||
Chicago Mercantile Exchange# | 10/28/25 | 12,600,000 | 2.80% | 3 Month USD LIBOR | (374,769 | ) | (76,336 | ) | (298,433 | ) | ||||||||||||||||
Chicago Mercantile Exchange# | 2/22/26 | 7,200,000 | 2.50% | 3 Month USD LIBOR | (99,808 | ) | — | (99,808 | ) | |||||||||||||||||
Chicago Mercantile Exchange# | 3/16/26 | 4,250,000 | 2.40% | 3 Month USD LIBOR | (37,909 | ) | — | (37,909 | ) | |||||||||||||||||
Chicago Mercantile Exchange# | 4/21/26 | 2,300,000 | 2.30% | 3 Month USD LIBOR | (8,677 | ) | — | (8,677 | ) | |||||||||||||||||
Chicago Mercantile Exchange# | 4/27/26 | 2,800,000 | 2.30% | 3 Month USD LIBOR | (10,296 | ) | — | (10,296 | ) | |||||||||||||||||
London Clearing House# | 6/15/26 | 12,900,000 | 2.25% | 3 Month USD LIBOR | (641,700 | ) | (535,708 | ) | (105,992 | ) | ||||||||||||||||
Chicago Mercantile Exchange# | 6/15/46 | 300,000 | 2.50% | 3 Month USD LIBOR | 18,269 | 11,311 | 6,958 | |||||||||||||||||||
London Clearing House# | 6/15/46 | 300,000 | 2.50% | 3 Month USD LIBOR | (20,553 | ) | (26,910 | ) | 6,357 | |||||||||||||||||
Chicago Mercantile Exchange# | 9/21/18 | 100,000 | 1.00% | 6 Month GBP LIBOR | (166 | ) | (223 | ) | 57 | |||||||||||||||||
Chicago Mercantile Exchange# | 9/18/23 | 140,000,000 | 1.00% | 6 Month JPY LIBOR | (93,833 | ) | (9,264 | ) | (84,569 | ) | ||||||||||||||||
Chicago Mercantile Exchange# | 9/18/23 | 120,000,000 | 1.00% | 6 Month JPY LIBOR | (80,429 | ) | (6,099 | ) | (74,330 | ) | ||||||||||||||||
Chicago Mercantile Exchange# | 3/20/24 | 60,000,000 | 1.00% | 6 Month JPY LIBOR | (41,975 | ) | (21,678 | ) | (20,297 | ) | ||||||||||||||||
| $ | (1,721,177 | ) | $ | (782,072 | ) | $ | (939,105 | ) | ||||||||||||||||||
OVER THE COUNTER | ||||||||||||||||||||||||||
JP Morgan Bank* | 10/15/17 | 600,000 | 0.58% | Eurostat Eurozone HICP Ex Tobacco | (5,179 | ) | — | (5,179 | ) | |||||||||||||||||
Deutsche Bank AG* | 10/15/17 | 400,000 | 0.58% | Eurostat Eurozone HICP Ex Tobacco | (3,453 | ) | (35 | ) | (3,418 | ) | ||||||||||||||||
Deutsche Bank AG* | 10/15/17 | 200,000 | 0.57% | Eurostat Eurozone HICP Ex Tobacco | (1,680 | ) | — | (1,680 | ) | |||||||||||||||||
Citibank NA* | 8/15/18 | 400,000 | 6.56% | Eurostat Eurozone HICP Ex Tobacco | (4,033 | ) | (415 | ) | (3,618 | ) | ||||||||||||||||
Citibank NA* | 10/15/18 | 600,000 | 0.65% | Eurostat Eurozone HICP Ex Tobacco | (5,232 | ) | — | (5,232 | ) | |||||||||||||||||
Societe General Securities* | 10/15/18 | 600,000 | 0.68% | Eurostat Eurozone HICP Ex Tobacco | (5,873 | ) | 203 | (6,076 | ) | |||||||||||||||||
Goldman Sachs Group, Inc.# | 4/15/30 | 1,100,000 | 3.20% | UK RPI All Items NSA | 72,780 | — | 72,780 | |||||||||||||||||||
Goldman Sachs Group, Inc.# | 5/15/30 | 350,000 | 3.32% | UK RPI All Items NSA | 33,876 | — | 33,876 | |||||||||||||||||||
Bank of America NA# | 4/08/35 | 600,000 | 3.31% | UK RPI All Items NSA | 52,026 | — | 52,026 | |||||||||||||||||||
Credit Suisse International# | 4/15/35 | 700,000 | 3.34% | UK RPI All Items NSA | 69,384 | 354 | 69,030 | |||||||||||||||||||
Deutsche Bank AG* | 2/10/17 | 6,200,000 | 1.93% | US Urban Consumers NSA | (176,780 | ) | — | (176,780 | ) | |||||||||||||||||
Goldman Sachs Group, Inc.* | 2/12/17 | 500,000 | 2.42% | US Urban Consumers NSA | (27,955 | ) | — | (27,955 | ) | |||||||||||||||||
Bank of America NA* | 4/15/17 | 190,000 | 1.72% | US Urban Consumers NSA | (159 | ) | — | (159 | ) | |||||||||||||||||
Societe General Securities* | 4/15/17 | 10,000 | 1.70% | US Urban Consumers NSA | (7 | ) | — | (7 | ) | |||||||||||||||||
RBS Securities, Inc.* | 7/15/17 | 2,400,000 | 2.25% | US Urban Consumers NSA | (142,273 | ) | 61 | (142,334 | ) | |||||||||||||||||
Citibank NA* | 7/17/17 | 200,000 | 2.25% | US Urban Consumers NSA | (11,856 | ) | 12 | (11,868 | ) | |||||||||||||||||
Bank of America NA* | 10/16/17 | 200,000 | 1.01% | US Urban Consumers NSA | 658 | — | 658 | |||||||||||||||||||
Bank of America NA* | 11/23/20 | 2,400,000 | 1.57% | US Urban Consumers NSA | 3,558 | — | 3,558 | |||||||||||||||||||
Deutsche Bank AG# | 5/12/25 | 2,800,000 | 2.06% | US Urban Consumers NSA | 74,371 | — | 74,371 | |||||||||||||||||||
Bank of America NA* | 8/26/25 | 1,000,000 | 1.73% | US Urban Consumers NSA | 4,632 | — | 4,632 | |||||||||||||||||||
| $ | (73,195 | ) | $ | 180 | $ | (73,375 | ) | |||||||||||||||||||
NET UNREALIZED (DEPRECIATION) ON INTEREST RATE SWAP CONTRACTS |
| $ | (1,794,372 | ) | $ | (781,892 | ) | $ | (1,012,480 | ) | ||||||||||||||||
ANNUAL REPORT / April 30, 2016
| 70 | PORTFOLIOS OF INVESTMENTS |
Wilmington Multi-Manager Real Asset Fund (concluded)
At April 30, 2016, the Real Asset Fund had open credit default swap contracts as follows:
Counterparty
| Termination
| Notional
| Fixed
| Reference Equity
| Implied Credit
| Fair Value(c)
| Upfront
| Unrealized
| ||||||||||||||||||||
| CENTRALLY CLEARED | ||||||||||||||||||||||||||||
Morgan Stanley### | 12/20/20 | $ | 1,200,000 | 1.00% | CDX IG25 5Y ICE | 0.82% | $ | (9,679 | ) | $ | (4,008 | ) | $ | (5,671 | ) | |||||||||||||
Morgan Stanley### | 6/20/21 | 26,100,000 | 1.00% | CDX IG26 5Y ICE | 0.77% | (288,791 | ) | (270,942 | ) | (17,849 | ) | |||||||||||||||||
| $ | (298,470 | ) | $ | (274,950 | ) | $ | (23,520 | ) | ||||||||||||||||||||
| OVER THE COUNTER | ||||||||||||||||||||||||||||
Goldman Sachs Group, Inc.## | 10/17/57 | $ | 400,000 | 0.50% | CMBX NA AAA 8 SP | 1.17% | $ | (16,132 | ) | $ | (26,007 | ) | $ | 9,875 | ||||||||||||||
Deutsche Bank AG## | 10/17/57 | 400,000 | 0.50% | CMBX NA AAA 8 SP | 1.18% | (16,132 | ) | (20,781 | ) | 4,649 | ||||||||||||||||||
Bank of America NA## | 12/20/16 | 30,000 | 1.00% | VOLKSWAGEN INTL SNR SP BOA | 1.72% | 179 | (149 | ) | 328 | |||||||||||||||||||
| $ | (32,085 | ) | $ | (46,937 | ) | $ | 14,852 | |||||||||||||||||||||
NET UNREALIZED APPRECIATION (DEPRECIATION) ON CREDIT DEFAULT SWAP CONTRACTS |
| $ | (330,555 | ) | $ | (321,887 | ) | $ | (8,668 | ) | ||||||||||||||||||
* Portfolio pays the fixed rate and receives the floating rate.
# Portfolio pays the floating rate and receives the fixed rate.
## The Portfolio is a seller of protection, it receives the fixed rate. When a credit event occurs, as defined under the terms of that particular swap agreement, the Portfolio will either (i) pay to the buyer of protection an amount equal to the notional amount of the swap and take delivery of the referenced obligation or underlying securities comprising the referenced index or (ii) pay a net settlement amount in the form of cash or securities equal to the notional amount of the swap less the recovery value of the referenced obligation or underlying securities comprising the referenced index.
### The Portfolio is a buyer of protection, it pays the fixed rate. When a credit event occurs, as defined under the terms of that particular swap agreement, the Portfolio will either (i) receive from the seller of protection an amount equal to the notional amount of the swap and make delivery of the referenced obligation or underlying securities comprising the referenced index or (ii) receive a net settlement amount in the form of cash or securities equal to the notional amount of the swap less the recovery value of the referenced obligation or underlying securities comprising the referenced index.
(a) “Notional amount” represents the maximum potential amount the Portfolio could be required to pay as a seller of credit protection or receive as a buyer of credit protection if a credit event occurs as defined under the terms of that particular swap agreement.
(b) “Implied credit spreads”, represented in absolute terms, are utilized in determining the fair value of credit default swap agreements on corporate issues or sovereign issues of an emerging country as of reporting date. Implied credit spreads serve as an indicator of the current status of the payment/performance risk and represent the likelihood of risk of default for the credit derivative. The implied credit spread of a particular referenced entity reflects the cost of buying/selling protection and may include up-front payments required to be made to enter into the agreement. Wider credit spreads represent a deterioration of the referenced entity’s credit soundness and a greater likelihood of risk of default or other credit event occurring as defined under the terms of the agreement.
(c) “Fair value” of credit default swap agreements on asset-backed securities and credit indices serves as an indicator of the current status of the payment/performance risk and represents the likelihood of an expected liability (or profit) for the credit derivative should the notional amount of the swap agreement be closed/sold as of the reporting date. Increasing fair value in absolute terms, represents a deterioration of the referenced entity’s credit soundness and a greater likelihood of risk of default or other credit event occurring as defined under the terms of the agreement.
See Notes which are an integral part of the Financial Statements
April 30, 2016 / ANNUAL REPORT
| 71 |
PORTFOLIO OF INVESTMENTS SUMMARY TABLE
Wilmington Strategic Allocation Conservative Fund
At April 30, 2016, the Fund’s portfolio composition was as follows (unaudited):
| Investment Companies: | Percentage of Total Net Assets | ||||
Debt Funds | 60.2 | % | |||
Equity Funds | 21.6 | % | |||
Exchange-Traded Funds | 8.6 | % | |||
Alternative Investment Funds | 7.3 | % | |||
Money Market Fund | 2.4 | % | |||
Other Assets and Liabilities – Net1 | (0.1 | )% | |||
|
| ||||
TOTAL | 100.0 | % | |||
|
| ||||
| (1) | Assets, other than investments in securities, less liabilities. See Statements of Assets and Liabilities. |
PORTFOLIO OF INVESTMENTS
April 30, 2016
| Description | Number of Shares | Value | ||||||
| INVESTMENT COMPANIES – 97.7% | ||||||||
ALTERNATIVE INVESTMENT FUNDS – 7.3% |
| |||||||
AQR Managed Futures Strategy Fund, Class I | 145,746 | $ | 1,476,403 | |||||
Blackstone Alt Multi-Strategy, Class Y | 53,725 | 530,802 | ||||||
Legg Mason BW Absolute Return Opportunities Fund, Class I | 45,395 | 529,303 | ||||||
|
| |||||||
TOTAL ALTERNATIVE INVESTMENT FUNDS | $ | 2,536,508 | ||||||
DEBT FUNDS – 60.2% |
| |||||||
Fidelity Focused High Income | 214,932 | 1,766,745 | ||||||
FPA New Income, Inc. | 166,169 | 1,661,687 | ||||||
Wilmington Broad Market Bond Fund, Class I§ | 699,293 | 6,839,087 | ||||||
Wilmington Intermediate-Term Bond Fund, Class I§ | 1,048,923 | 10,510,213 | ||||||
|
| |||||||
TOTAL DEBT FUNDS | $ | 20,777,732 | ||||||
EQUITY FUNDS – 21.6% |
| |||||||
Diamond Hill Large Cap Fund, Class Y | 28,596 | 629,965 | ||||||
Federated International Strategic Value Dividend Fund, Class I | 96,265 | 355,216 | ||||||
Highland Long/Short Equity Fund, Class Z | 46,166 | 524,906 | ||||||
Janus Enterprise Fund, Class I | 6,307 | 562,709 | ||||||
LSV Value Equity Fund, Class I | 27,196 | 629,327 | ||||||
Morgan Stanley Institutional Fund, Inc. - Growth Portfolio, Class I | 14,762 | 562,446 | ||||||
T Rowe Price Institutional Large-Cap Growth Fund, Class I | 20,551 | 558,990 | ||||||
| Description | Number of Shares | Value | ||||||
Touchstone Small Cap Growth Fund, Class Y | 31,004 | $ | 170,830 | |||||
Victory Integrity Small-Cap Value Fund, Class Y | 5,536 | 173,830 | ||||||
Wilmington Large-Cap Strategy Fund, Class I§ | 128,434 | 2,171,823 | ||||||
Wilmington Multi-Manager International Fund, Class I§ | 156,172 | 1,113,509 | ||||||
|
| |||||||
TOTAL EQUITY FUNDS | $ | 7,453,551 | ||||||
EXCHANGE-TRADED FUNDS – 8.6% |
| |||||||
iShares Cohen & Steers REIT ETF | 5,145 | 514,860 | ||||||
iShares Currency Hedged MSCI Eurozone ETF | 4,225 | 104,864 | ||||||
iShares Russell Mid-Cap Value ETF | 5,875 | 425,467 | ||||||
iShares TIPS ETF | 10,697 | 1,228,871 | ||||||
SPDR Dow Jones International Real Estate ETF | 16,760 | 709,954 | ||||||
|
| |||||||
TOTAL EXCHANGE-TRADED FUNDS | $ | 2,984,016 | ||||||
|
| |||||||
TOTAL INVESTMENT COMPANIES | $ | 33,751,807 | ||||||
ANNUAL REPORT / April 30, 2016
72 PORTFOLIOS OF INVESTMENTS
Wilmington Strategic Allocation Conservative Fund (concluded)
| Description | Number of Shares | Value | ||||||
| MONEY MARKET FUND – 2.4% | ||||||||
Dreyfus Cash Management Fund, Institutional Shares, 0.27%^ | 810,027 | $ | 810,027 | |||||
|
| |||||||
| TOTAL MONEY MARKET FUND (COST $810,027) | $ | 810,027 | ||||||
| Description | Value | |||||
| TOTAL INVESTMENTS – 100.1% (COST $33,771,536) | $ | 34,561,834 | ||||
| OTHER LIABILITIES LESS ASSETS – (0.1%) | (17,926 | ) | ||||
|
| |||||
| TOTAL NET ASSETS – 100.0% | $ | 34,543,908 | ||||
|
| |||||
Cost of investments for Federal income tax purposes is $34,138,715. The net unrealized appreciation/(depreciation) of investments was $423,119. This consists of net unrealized appreciation from investment for those securities having an excess of value over cost of $717,811 and net unrealized depreciation from investments for those securities having an excess of cost over value of $294,692.
Various inputs are used in determining the value of the Fund’s investments. These inputs are summarized in the three broad levels listed below.
Level 1 – quoted prices in active markets for identical securities
Level 2 – other significant observable inputs (including quoted prices for similar securities, interest rates, prepayment speeds, credit risk, etc.)
Level 3 – significant unobservable inputs (including the Fund’s own assumptions in determining the fair value of investments)
The following is a summary of the inputs used as of April 30, 2016 in valuing the Fund’s assets carried at fair value:
| Level 1 | Level 2 | Level 3 | Total | |||||||||||||
Investments in Securities | ||||||||||||||||
Investment Companies | $ | 33,751,807 | $ | — | $ | — | $ | 33,751,807 | ||||||||
Money Market Fund | 810,027 | — | — | 810,027 | ||||||||||||
|
|
|
|
|
|
|
| |||||||||
Total | $ | 34,561,834 | $ | — | $ | — | $ | 34,561,834 | ||||||||
|
|
|
|
|
|
|
| |||||||||
|
| ^ | 7-Day net yield. |
| § | Affiliated company. See Note 5 in Notes to Financial Statements. |
The following acronyms are used throughout this Fund:
ETF - Exchange Traded Fund
MSCI - Morgan Stanley Capital International
REIT - Real Estate Investment Trust
SPDR - Standard & Poor’s Depository Receipts
TIPS - Treasury Inflation Protected Security
See Notes which are an integral part of the Financial Statements
|
April 30, 2016 / ANNUAL REPORT
| 73 |
PORTFOLIO OF INVESTMENTS SUMMARY TABLE
Wilmington Strategic Allocation Moderate Fund
At April 30, 2016, the Fund’s portfolio composition was as follows (unaudited):
| Investment Companies: | Percentage of Total Net Assets | ||||
Equity Funds | 49.3 | % | |||
Exchange-Traded Funds | 13.1 | % | |||
Debt Funds | 9.1 | % | |||
Alternative Investment Funds | 8.0 | % | |||
| Corporate Bonds | 6.8 | % | |||
| U.S. Treasury | 6.0 | % | |||
| Mortgage-Backed Securities | 4.7 | % | |||
| Collateralized Mortgage Obligations | 0.5 | % | |||
| Enhanced Equipment Trust Certificates | 0.3 | % | |||
| Cash Equivalents1 | 2.5 | % | |||
| Other Assets and Liabilities – Net2 | (0.3 | )% | |||
|
| ||||
| TOTAL | 100.0 | % | |||
|
| ||||
| (1) | Cash Equivalents include investments in a money market fund and repurchase agreements. |
| (2) | Assets, other than investments in securities, less liabilities. See Statements of Assets and Liabilities. |
PORTFOLIO OF INVESTMENTS
April 30, 2016
| Description | Number of Shares | Value | ||||||
INVESTMENT COMPANIES – 79.5% |
| |||||||
ALTERNATIVE INVESTMENT FUNDS – 8.0% |
| |||||||
AQR Managed Futures Strategy Fund, Class I | 221,942 | $ | 2,248,269 | |||||
Blackstone Alt Multi-Strategy, Class Y | 71,250 | 703,953 | ||||||
Legg Mason BW Absolute Return Opportunities Fund, Class I | 60,133 | 701,145 | ||||||
|
| |||||||
TOTAL ALTERNATIVE INVESTMENT FUNDS | $ | 3,653,367 | ||||||
DEBT FUNDS – 9.1% |
| |||||||
Fidelity Focused High Income | 284,792 | 2,340,989 | ||||||
FPA New Income, Inc. | 183,278 | 1,832,778 | ||||||
|
| |||||||
TOTAL DEBT FUNDS | $ | 4,173,767 | ||||||
EQUITY FUNDS – 49.3% |
| |||||||
Diamond Hill Large Cap Fund, Class Y | 79,816 | 1,758,345 | ||||||
Federated International Strategic Value Dividend Fund, Class I | 254,851 | 940,399 | ||||||
Highland Long/Short Equity Fund, Class Z | 61,161 | 695,395 | ||||||
Janus Enterprise Fund, Class I | 17,870 | 1,594,335 | ||||||
LSV Value Equity Fund, Class I | 75,706 | 1,751,842 | ||||||
| Description | Number of Shares | Value | ||||||
Morgan Stanley Institutional Fund, Inc. - Growth Portfolio, Class I | 40,500 | $ | 1,543,036 | |||||
T Rowe Price Institutional Large-Cap Growth Fund, Class I | 56,156 | 1,527,443 | ||||||
Touchstone Small Cap Growth Fund, Class Y | 139,427 | 768,240 | ||||||
Victory Integrity Small-Cap Value Fund, Class Y | 24,896 | 781,734 | ||||||
Wilmington Large-Cap Strategy Fund, Class I§ | 332,487 | 5,622,354 | ||||||
Wilmington Multi-Manager International Fund, Class I§ | 781,155 | 5,569,632 | ||||||
|
| |||||||
TOTAL EQUITY FUNDS | $ | 22,552,755 | ||||||
EXCHANGE-TRADED FUNDS – 13.1% |
| |||||||
iShares Cohen & Steers REIT ETF | 6,725 | 672,971 | ||||||
iShares Currency Hedged MSCI Eurozone ETF# | 15,700 | 389,674 | ||||||
iShares Russell Mid-Cap Value ETF | 15,550 | 1,126,131 | ||||||
iShares TIPS ETF | 17,300 | 1,987,424 | ||||||
SPDR Dow Jones International Real Estate ETF | 22,200 | 940,392 | ||||||
ANNUAL REPORT / April 30, 2016
74 PORTFOLIOS OF INVESTMENTS
Wilmington Strategic Allocation Moderate Fund (continued)
| Description |
Number of | Value | ||||||
Vanguard Small-Cap ETF | 7,500 | $ | 850,950 | |||||
|
| |||||||
TOTAL EXCHANGE-TRADED FUNDS |
| $ | 5,967,542 | |||||
|
| |||||||
| TOTAL INVESTMENT COMPANIES | ||||||||
| (COST $34,683,110) | $ | 36,347,431 | ||||||
| Par Value | ||||||||
| COLLATERALIZED MORTGAGE OBLIGATIONS – 0.5% | ||||||||
FEDERAL NATIONAL MORTGAGE ASSOCIATION |
| |||||||
Series 1988-23, Class C, 9.75%, 9/25/18 | $ | 401 | $ | 431 | ||||
Series 2012-114, Class VM, | 153,343 | 164,556 | ||||||
|
| |||||||
TOTAL FEDERAL NATIONAL MORTGAGE ASSOCIATION (FNMA) |
| $ | 164,987 | |||||
WHOLE LOAN – 0.1% | ||||||||
Banc of America Mortgage Securities, Inc., Series 2004-A, Class 2A1, 2.78%, 2/25/34D | 37,823 | 37,270 | ||||||
IndyMac INDA Mortgage Loan Trust, Series 2005-AR1, Class 2A1, 2.90%, 11/25/35D | 20,752 | 19,049 | ||||||
|
| |||||||
TOTAL WHOLE LOAN | $ | 56,319 | ||||||
|
| |||||||
TOTAL COLLATERALIZED MORTGAGE OBLIGATIONS (COST $230,059) |
| $ | 221,306 | |||||
| CORPORATE BONDS – 6.8% | ||||||||
AEROSPACE & DEFENSE – 0.2% |
| |||||||
L-3 Communications Corp., Company Guaranteed, 3.95%, 11/15/16 | 85,000 | 86,117 | ||||||
AUTOMOTIVE – 0.0% | ||||||||
Hyundai Capital America, 1.88%, 8/09/16W | 25,000 | 25,049 | ||||||
BANKS – 0.2% | ||||||||
BB&T Corp., | 30,000 | 30,713 | ||||||
Citigroup, Inc., | 35,000 | 35,056 | ||||||
Morgan Stanley, | 10,000 | 10,353 | ||||||
|
| |||||||
TOTAL BANKS | $ | 76,122 | ||||||
BEVERAGES – 0.4% | ||||||||
Anheuser-Busch Cos. LLC, Company Guaranteed, 5.05%, 10/15/16 | 130,000 | 132,569 | ||||||
Anheuser-Busch InBev Finance, Inc., Company Guaranteed, | 20,000 | 22,655 | ||||||
Dr. Pepper Snapple Group, Inc., Company Guaranteed, | 10,000 | 10,021 | ||||||
Dr. Pepper Snapple Group, Inc., Company Guaranteed, | 40,000 | 40,320 | ||||||
|
| |||||||
TOTAL BEVERAGES | $ | 205,565 | ||||||
BIOTECHNOLOGY – 0.1% |
| |||||||
Amgen, Inc., | 25,000 | 26,023 | ||||||
| Description | Value | |||||||
| Par Value | ||||||||
Celgene Corp., | $ | 40,000 | $ | 41,272 | ||||
|
| |||||||
TOTAL BIOTECHNOLOGY | $ | 67,295 | ||||||
CAPITAL MARKETS – 0.2% | ||||||||
BlackRock, Inc., | 38,000 | 40,805 | ||||||
Charles Schwab Corp. (The), | 15,000 | 15,190 | ||||||
Fifth Third Bancorp, | 20,000 | 21,132 | ||||||
|
| |||||||
TOTAL CAPITAL MARKETS | $ | 77,127 | ||||||
COMMERCIAL BANKS – 0.2% |
| |||||||
HSBC USA, Inc., | 40,000 | 40,798 | ||||||
SunTrust Banks, Inc., | 30,000 | 30,545 | ||||||
Wells Fargo & Co., | 35,000 | 35,902 | ||||||
|
| |||||||
TOTAL COMMERCIAL BANKS | $ | 107,245 | ||||||
COMMERCIAL FINANCE – 0.2% |
| |||||||
General Electric Capital Corp., | 70,000 | 71,077 | ||||||
COMPUTERS – 0.1% | ||||||||
Apple, Inc., | 45,000 | 45,164 | ||||||
CONSUMER FINANCE – 0.1% | ||||||||
American Express Co., | 30,000 | 29,874 | ||||||
DIVERSIFIED FINANCIAL SERVICES – 0.7% |
| |||||||
Bank of America Corp., | 50,000 | 50,241 | ||||||
Citigroup, Inc., | 100,000 | 105,700 | ||||||
Citigroup, Inc., | 35,000 | 36,430 | ||||||
FMR LLC, | 100,000 | 124,579 | ||||||
TD Ameritrade Holding Corp., | 18,000 | 18,524 | ||||||
|
| |||||||
TOTAL DIVERSIFIED FINANCIAL SERVICES | $ | 335,474 | ||||||
ELECTRIC – 0.4% |
| |||||||
Appalachian Power Co., | 35,000 | 36,380 | ||||||
DTE Energy Co., | 10,000 | 10,634 | ||||||
Entergy Corp., | 90,000 | 99,245 | ||||||
Pacific Gas & Electric Co., | 20,000 | 21,652 | ||||||
|
| |||||||
TOTAL ELECTRIC | $ | 167,911 | ||||||
April 30, 2016 / ANNUAL REPORT
PORTFOLIOS OF INVESTMENTS 75
Wilmington Strategic Allocation Moderate Fund (continued)
| Description | Par Value | Value | ||||||
ELECTRONICS – 0.0%** | ||||||||
Thermo Fisher Scientific, Inc., | $ | 20,000 | $ | 20,631 | ||||
ENVIRONMENTAL CONTROL – 0.3% |
| |||||||
Waste Management, Inc., | 60,000 | 60,312 | ||||||
Waste Management, Inc., | 35,000 | 36,774 | ||||||
Waste Management, Inc., | 25,000 | 25,878 | ||||||
|
| |||||||
TOTAL ENVIRONMENTAL CONTROL | $ | 122,964 | ||||||
FOREST PRODUCTS & PAPER – 0.1% |
| |||||||
International Paper Co., | 35,000 | 38,981 | ||||||
HEALTH CARE EQUIPMENT & SUPPLIES – 0.1% |
| |||||||
Zimmer Biomet Holdings, Inc., | 35,000 | 36,055 | ||||||
HEALTH CARE PROVIDERS & SERVICES – 0.1% |
| |||||||
UnitedHealth Group, Inc., | 25,000 | 25,307 | ||||||
HOME FURNISHINGS – 0.2% |
| |||||||
Whirlpool Corp., | 65,000 | 71,449 | ||||||
Whirlpool Corp., | 10,000 | 10,469 | ||||||
|
| |||||||
TOTAL HOME FURNISHINGS | $ | 81,918 | ||||||
HOUSEHOLD PRODUCTS – 0.1% |
| |||||||
Tupperware Brands Corp., Company Guaranteed, 4.75%, 6/01/21# | 60,000 | 63,613 | ||||||
INSURANCE – 0.4% | ||||||||
Aon PLC, Company Guaranteed, 4.00%, 11/27/23 | 40,000 | 41,409 | ||||||
CNA Financial Corp., | 35,000 | 35,177 | ||||||
WR Berkley Corp., | 60,000 | 64,718 | ||||||
WR Berkley Corp., | 45,000 | 44,611 | ||||||
|
| |||||||
TOTAL INSURANCE | $ | 185,915 | ||||||
MEDIA – 0.3% | ||||||||
CBS Corp., Company Guaranteed, 4.60%, 1/15/45 | 25,000 | 24,623 | ||||||
Time Warner, Inc., Company Guaranteed, 4.85%, 7/15/45 | 25,000 | 26,985 | ||||||
Viacom, Inc., | 60,000 | 60,318 | ||||||
Walt Disney Co., | 10,000 | 10,874 | ||||||
|
| |||||||
TOTAL MEDIA | $ | 122,800 | ||||||
| Description | Par Value | Value | ||||||
METALS & MINING-0.2% | ||||||||
Rio Tinto Finance USA Ltd., | $ | 60,000 | $ | 72,013 | ||||
MISCELLANEOUS MANUFACTURING – 0.1% |
| |||||||
Illinois Tool Works, Inc., | 45,000 | 48,808 | ||||||
Textron, Inc., | 20,000 | 20,538 | ||||||
|
| |||||||
TOTAL MISCELLANEOUS MANUFACTURING | $ | 69,346 | ||||||
OFFICE/BUSINESS EQUIPMENT – 0.1% |
| |||||||
Xerox Corp., | 30,000 | 29,943 | ||||||
OIL & GAS – 0.3% | ||||||||
BP Capital Markets PLC, | 50,000 | 49,755 | ||||||
Exxon Mobil Corp., | 30,000 | 30,600 | ||||||
Marathon Petroleum Corp., | 20,000 | 19,246 | ||||||
Phillips 66, Company Guaranteed, 4.30%, 4/01/22 | 20,000 | 21,820 | ||||||
Shell International Finance BV, | 25,000 | 25,874 | ||||||
Valero Energy Corp., | 10,000 | 9,363 | ||||||
|
| |||||||
TOTAL OIL & GAS | $ | 156,658 | ||||||
PHARMACEUTICALS – 0.2% | ||||||||
Abbvie, Inc., | 30,000 | 30,543 | ||||||
AbbVie, Inc., | 20,000 | 20,747 | ||||||
Medco Health Solutions, Inc., | 20,000 | 21,228 | ||||||
|
| |||||||
TOTAL PHARMACEUTICALS | $ | 72,518 | ||||||
PIPELINES – 0.2% | ||||||||
Energy Transfer Partners LP, | 35,000 | 32,198 | ||||||
ONEOK Partners LP, | 45,000 | 43,247 | ||||||
Spectra Energy Partners LP, | 25,000 | 24,000 | ||||||
|
| |||||||
TOTAL PIPELINES | $ | 99,445 | ||||||
REAL ESTATE INVESTMENT TRUSTS – 0.7% |
| |||||||
American Tower Corp., | 15,000 | 16,703 | ||||||
Digital Realty Trust LP, | 100,000 | 111,453 | ||||||
HCP, Inc., | 15,000 | 15,198 | ||||||
ANNUAL REPORT / April 30, 2016
76 PORTFOLIOS OF INVESTMENTS
Wilmington Strategic Allocation Moderate Fund (continued)
| Description | Par Value | Value | ||||||
Health Care REIT, Inc., | $ | 100,000 | $ | 103,917 | ||||
Healthcare Realty Trust, Inc., | 40,000 | 39,491 | ||||||
Healthcare Realty Trust, Inc., | 15,000 | 14,692 | ||||||
ProLogis LP, | 35,000 | 36,696 | ||||||
|
| |||||||
TOTAL REAL ESTATE INVESTMENT TRUSTS |
| $ | 338,150 | |||||
RETAIL – 0.1% |
| |||||||
CVS Caremark Corp., | 30,000 | 31,520 | ||||||
SEMICONDUCTORS – 0.1% |
| |||||||
Intel Corp., | 35,000 | 36,299 | ||||||
TELECOMMUNICATIONS – 0.2% |
| |||||||
AT&T, Inc., | 35,000 | 35,011 | ||||||
AT&T, Inc., | 15,000 | 15,123 | ||||||
AT&T, Inc., | 55,000 | 55,175 | ||||||
|
| |||||||
TOTAL TELECOMMUNICATIONS | $ | 105,309 | ||||||
TRANSPORTATION – 0.2% |
| |||||||
FedEx Corp., | 30,000 | 28,476 | ||||||
FedEx Corp., | 15,000 | 15,111 | ||||||
Ryder System, Inc., | 55,000 | 55,748 | ||||||
|
| |||||||
TOTAL TRANSPORTATION | $ | 99,335 | ||||||
TRUCKING & LEASING – 0.0%** |
| |||||||
GATX Corp., | 20,000 | 19,750 | ||||||
|
| |||||||
TOTAL CORPORATE BONDS (COST $3,018,246) | $ | 3,122,490 | ||||||
| ENHANCED EQUIPMENT TRUST CERTIFICATES – 0.3% | ||||||||
AIRLINES – 0.3% |
| |||||||
Continental Airlines 2009-2, Series A, Pass-Through Certificates, 7.25%, 11/10/19 | 57,642 | 65,171 | ||||||
Delta Air Lines, 2007-1, Series A, Pass-Through Certificates, 6.82%, 8/10/22 | 44,355 | 51,175 | ||||||
|
| |||||||
TOTAL AIRLINES | $ | 116,346 | ||||||
|
| |||||||
| TOTAL ENHANCED EQUIPMENT TRUST CERTIFICATES (COST $101,356) | $ | 116,346 | ||||||
| Description | Par Value | Value | ||||||
| MORTGAGE-BACKED SECURITIES – 4.7% | ||||||||
FEDERAL HOME LOAN MORTGAGE CORPORATION |
| |||||||
Pool A15865, 5.50%, 11/01/33 | $ | 50,865 | $ | 56,679 | ||||
Pool A19412, 5.00%, 3/01/34 | 136,574 | 152,784 | ||||||
Pool C00478, 8.50%, 9/01/26 | 1,908 | 2,245 | ||||||
Pool C03517, 4.50%, 9/01/40 | 38,283 | 41,800 | ||||||
Pool C03849, 3.50%, 4/01/42 | 58,878 | 61,800 | ||||||
Pool C04305, 3.00%, 11/01/42 | 197,407 | 202,789 | ||||||
Pool C09020, 3.50%, 11/01/42 | 187,670 | 196,969 | ||||||
Pool G05774, 5.00%, 1/01/40 | 284,147 | 314,404 | ||||||
Pool G07889, 3.50%, 8/01/43 | 44,206 | 46,371 | ||||||
Pool Q23891, 4.00%, 12/01/43 | 65,649 | 70,289 | ||||||
|
| |||||||
TOTAL FEDERAL HOME LOAN MORTGAGE CORPORATION (FHLMC) |
| $ | 1,146,130 | |||||
FEDERAL NATIONAL MORTGAGE ASSOCIATION |
| |||||||
Pool 326445, 0.88%, 5/21/18 | 165,000 | 165,146 | ||||||
Pool 533246, 7.50%, 4/01/30 | 4,743 | 4,898 | ||||||
Pool 580676, 1.63%, 11/27/18 | 165,000 | 167,859 | ||||||
Pool AB4089, 3.00%, 12/01/26 | 38,362 | 40,292 | ||||||
Pool AJ4050, 4.00%, 10/01/41 | 124,153 | 133,177 | ||||||
Pool AL6325, 3.00%, 10/01/44 | 78,026 | 80,202 | ||||||
Pool AS0302, 3.00%, 8/01/43 | 82,484 | 84,786 | ||||||
Pool AT7899, 3.50%, 7/01/43 | 83,863 | 88,076 | ||||||
Pool AX5302, 4.00%, 1/01/42 | 37,257 | 39,962 | ||||||
Pool G60038, 3.50%, 1/01/44 | 148,305 | 155,662 | ||||||
|
| |||||||
TOTAL FEDERAL NATIONAL MORTGAGE ASSOCIATION (FNMA) |
| $ | 960,060 | |||||
GOVERNMENT NATIONAL MORTGAGE ASSOCIATION |
| |||||||
Pool 354677, 7.50%, 10/15/23 | 15,333 | 18,020 | ||||||
Pool 354765, 7.00%, 2/15/24 | 19,764 | 23,223 | ||||||
Pool 354827, 7.00%, 5/15/24 | 20,398 | 22,742 | ||||||
|
| |||||||
TOTAL GOVERNMENT NATIONAL MORTGAGE ASSOCIATION (GNMA) |
| $ | 63,985 | |||||
|
| |||||||
| TOTAL MORTGAGE-BACKED SECURITIES (COST $2,121,219) | $ | 2,170,175 | ||||||
| U.S. TREASURY – 6.0% | ||||||||
U.S. TREASURY BONDS – 1.2% |
| |||||||
2.50%, 2/15/46 | 30,000 | 28,957 | ||||||
3.00%, 11/15/44 | 53,000 | 56,691 | ||||||
3.00%, 11/15/45 | 8,000 | 8,555 | ||||||
3.13%, 8/15/44 | 11,000 | 12,058 | ||||||
3.38%, 5/15/44 | 139,000 | 159,670 | ||||||
3.63%, 2/15/44 | 87,000 | 104,614 | ||||||
4.38%, 5/15/40 | 120,000 | 160,439 | ||||||
4.75%, 2/15/37 | 21,000 | 29,455 | ||||||
|
| |||||||
TOTAL U.S. TREASURY BONDS |
| $ | 560,439 | |||||
April 30, 2016 / ANNUAL REPORT
PORTFOLIOS OF INVESTMENTS 77
Wilmington Strategic Allocation Moderate Fund (continued)
| Description | Par Value | Value | ||||||
U.S. TREASURY NOTES – 4.8% |
| |||||||
0.63%, 9/30/17 | $ | 40,000 | $ | 39,972 | ||||
0.88%, 10/15/17 | 360,000 | 360,982 | ||||||
1.13%, 2/28/21 | 250,000 | 248,388 | ||||||
1.50%, 12/31/18 | 87,000 | 88,450 | ||||||
1.50%, 3/31/19 | 100,000 | 101,698 | ||||||
1.50%, 11/30/19 | 40,000 | 40,618 | ||||||
1.63%, 11/15/22 | 96,000 | 96,435 | ||||||
2.00%, 10/31/21 | 165,000 | 170,217 | ||||||
2.00%, 2/15/25 | 115,000 | 117,144 | ||||||
2.00%, 8/15/25 | 35,000 | 35,598 | ||||||
2.13%, 6/30/22 | 175,000 | 181,315 | ||||||
2.13%, 5/15/25 | 140,000 | 143,967 | ||||||
2.13%, 8/31/20 | 115,000 | 119,397 | ||||||
2.25%, 11/15/24 | 80,000 | 83,191 | ||||||
2.25%, 11/15/25 | 5,000 | 5,190 | ||||||
2.38%, 8/15/24 | 140,000 | 147,028 | ||||||
3.50%, 5/15/20 | 100,000 | 109,198 | ||||||
4.50%, 5/15/17 | 100,000 | 103,974 | ||||||
|
| |||||||
TOTAL U.S. TREASURY NOTES |
| $ | 2,192,762 | |||||
|
| |||||||
TOTAL U.S. TREASURY (COST $2,632,581) | $ | 2,753,201 | ||||||
| Number of Shares | ||||||||
| MONEY MARKET FUND – 2.2% | ||||||||
Dreyfus Cash Management Fund, Institutional Shares, 0.27%^ | 1,018,582 | $ | 1,018,582 | |||||
|
| |||||||
TOTAL MONEY MARKET FUND (COST $1,018,582) |
| $ | 1,018,582 | |||||
|
| |||||||
TOTAL INVESTMENTS IN SECURITIES – 100.0% (COST $43,805,153) |
| $ | 45,749,531 | |||||
| Description | Par Value | |||||||
| CASH COLLATERAL INVESTED FOR SECURITIES ON LOAN – 0.3% | ||||||||
REPURCHASE AGREEMENTS – 0.3% |
| |||||||
BNP Paribas Securities Corp., 0.29%, dated 4/29/16, due 5/02/16, repurchase price $25,323, collateralized by U.S. Government & Treasury Securities 0.00% to 7.63%, maturing 5/26/16 to 5/15/45; total market value of $25,828. | $ | 25,322 | $ | 25,322 | ||||
| Description | Par Value | Value | ||||||
Citigroup Global Markets, Inc., 0.30%, dated 4/29/16, due 5/02/16, repurchase price $25,323, collateralized by U.S. Government & Treasury Securities 0.00% to 9.00%, maturing 6/30/17 to 5/01/46; total market value of $25,828. | $ | 25,322 | $ | 25,322 | ||||
Daiwa Capital Markets America, 0.32%, dated 4/29/16, due 5/02/16, repurchase price $25,323, collateralized by U.S. Government & Treasury Securities 0.00% to 8.75%, maturing 5/05/16 to 9/09/49; total market value of $25,828. | 25,322 | 25,322 | ||||||
HSBC Securities USA, Inc., 0.27%, dated 4/29/16, due 05/02/16, repurchase price $25,323, collateralized by U.S. Government & Treasury Securities 0.00% to 7.25%, maturing 5/15/16 to 7/15/37; total market value of $25,828. | 25,322 | 25,322 | ||||||
Nomura Securities International, Inc., 0.32%, dated 4/29/16, due 5/02/16, repurchase price $25,323, collateralized by U.S. Government & Treasury Securities 0.00% to 9.50%, maturing 5/15/16 to 3/20/66; total market value of $25,828. | 25,322 | 25,322 | ||||||
RBC Capital Markets LLC, 0.29%, dated 4/29/16, due 5/02/16, repurchase price $6,665, collateralized by U.S. Government Securities 1.75% to 6.00%, maturing 6/01/18 to 6/01/46; total market value of $6,798. | 6,665 | 6,665 | ||||||
|
| |||||||
TOTAL REPURCHASE AGREEMENTS |
| $ | 133,275 | |||||
|
| |||||||
TOTAL CASH COLLATERAL INVESTED FOR SECURITIES ON LOAN (COST $133,275) |
| $ | 133,275 | |||||
|
| |||||||
| TOTAL INVESTMENTS – 100.3% (COST $43,938,428) | $ | 45,882,806 | ||||||
| COLLATERAL FOR SECURITIES ON LOAN – (0.3%) | (133,275 | ) | ||||||
| OTHER LIABILITIES LESS ASSETS – 0.0%** | (13,813 | ) | ||||||
|
| |||||||
| TOTAL NET ASSETS – 100.0% | $ | 45,735,718 | ||||||
|
| |||||||
ANNUAL REPORT / April 30, 2016
78 PORTFOLIOS OF INVESTMENTS
Wilmington Strategic Allocation Moderate Fund (concluded)
Cost of investments for Federal income tax purposes is $44,576,089. The net unrealized appreciation/(depreciation) of investments was $1,306,717. This consists of net unrealized appreciation from investment for those securities having an excess of value over cost of $1,968,095 and net unrealized depreciation from investments for those securities having an excess of cost over value of $661,378.
Various inputs are used in determining the value of the Fund’s investments. These inputs are summarized in the three broad levels listed below.
Level 1 | – | quoted prices in active markets for identical securities | ||
Level 2 | – | other significant observable inputs (including quoted prices for similar securities, interest rates, prepayment speeds, credit risk, etc.) | ||
Level 3 | – | significant unobservable inputs (including the Fund’s own assumptions in determining the fair value of investments) |
The following is a summary of the inputs used as of April 30, 2016 in valuing the Fund’s assets carried at fair value:
Level 1 |
Level 2 |
Level 3 |
Total | |||||||||||||
Investments in Securities | ||||||||||||||||
Investment Companies | $ | 36,347,431 | $ | — | $ | — | $ | 36,347,431 | ||||||||
Collateralized Mortgage Obligations | — | 221,306 | — | 221,306 | ||||||||||||
Corporate Bonds | — | 3,122,490 | — | 3,122,490 | ||||||||||||
Enhanced Equipment Trust Certificates | — | 116,346 | — | 116,346 | ||||||||||||
Mortgage-Backed Securities | — | 2,170,175 | — | 2,170,175 | ||||||||||||
U.S. Treasury | — | 2,753,201 | — | 2,753,201 | ||||||||||||
Money Market Fund | 1,018,582 | — | — | 1,018,582 | ||||||||||||
Repurchase Agreements | — | 133,275 | — | 133,275 | ||||||||||||
|
|
|
|
|
|
|
| |||||||||
Total | $ | 37,366,013 | $ | 8,516,793 | $ | — | $ | 45,882,806 | ||||||||
|
|
|
|
|
|
|
| |||||||||
| # | Security, or a portion thereof, is on loan. See Note 2 in Notes to Financial Statements. |
| ^ | 7-Day net yield. |
| D | Floating rate note with current rate and stated maturity date shown. |
| § | Affiliated company. See Note 5 in Notes to Financial Statements. |
| W | Denotes a restricted security that may be resold without restriction to “qualified institutional buyers” as defined in Rule 144A under the Securities Act of 1933 and that the Fund has determined to be liquid under criteria established by the Fund’s Board of Trustees. At April 30, 2016, these liquid restricted securities amounted to $149,628 representing 0.3% of total net assets. |
| ** | Represents less than 0.05%. |
The following acronyms are used throughout this Fund:
ETF - Exchange Traded Fund
FHLMC - Federal Home Loan Mortgage Corporation
FNMA - Federal National Mortgage Association
FRN - Floating Rate Note
GMTN - Global Medium Term Note
GNMA - Government National Mortgage Association
LLC - Limited Liability Corporation
LP - Limited Partnership
MSCI - Morgan Stanley Capital International
MTN - Medium Term Note
PLC - Public Limited Company
REIT - Real Estate Investment Trust
SPDR - Standard & Poor’s Depository Receipts
TIPS - Treasury Inflation Protected Security
See Notes which are an integral part of the Financial Statements
April 30, 2016 / ANNUAL REPORT
| 79 |
PORTFOLIO OF INVESTMENTS SUMMARY TABLE
Wilmington Strategic Allocation Aggressive Fund
At April 30, 2016, the Fund’s portfolio composition was as follows (unaudited):
| Investment Companies | Percentage of Total Net Assets | ||||
| Equity Funds | 80.5 | % | |||
| Exchange-Traded Funds | 11.6 | % | |||
| Alternative Investment Funds | 7.9 | % | |||
| Money Market Fund | 0.0 | %2 | |||
| Other Assets and Liabilities – Net1 | 0.0 | %2 | |||
|
| ||||
| TOTAL | 100.0 | % | |||
|
| ||||
| (1) | Assets, other than investments in securities, less liabilities. See Statements of Assets and Liabilities. |
| (2) | Represents less than 0.05%. |
PORTFOLIO OF INVESTMENTS
April 30, 2016
Description
|
|
Number of
|
|
| Value
|
| ||
| INVESTMENT COMPANIES – 100.0% | ||||||||
ALTERNATIVE INVESTMENT FUNDS – 7.9% | ||||||||
AQR Managed Futures Strategy Fund, Class I | 135,814 | $ | 1,375,792 | |||||
Highland Long/Short Equity Fund, Class Z | 75,422 | 857,548 | ||||||
|
| |||||||
TOTAL ALTERNATIVE INVESTMENT FUNDS | $ | 2,233,340 | ||||||
EQUITY FUNDS – 80.5% | ||||||||
Diamond Hill Large Cap Fund, Class Y | 70,791 | 1,559,520 | ||||||
Federated International Strategic Value Dividend Fund, Class I | 206,718 | 762,791 | ||||||
iShares Currency Hedged MSCI Eurozone ETF | 15,300 | 379,746 | ||||||
Janus Enterprise Fund, Class I | 17,378 | 1,550,425 | ||||||
LSV Value Equity Fund, Class I | 79,665 | 1,843,449 | ||||||
Morgan Stanley Institutional Fund, Inc. - Growth Portfolio, Class I | 38,305 | 1,459,425 | ||||||
T Rowe Price Institutional Large-Cap Growth Fund, Class I | 53,089 | 1,444,033 | ||||||
Touchstone Small Cap Growth Fund, Class Y | 102,330 | 563,837 | ||||||
Victory Integrity Small-Cap Value Fund, Class Y | 18,272 | 573,741 | ||||||
Wilmington Large-Cap Strategy Fund, Class I§ | 320,626 | 5,421,782 | ||||||
Wilmington Multi-Manager International Fund, Class I§ | 993,879 | 7,086,355 | ||||||
|
| |||||||
TOTAL EQUITY FUNDS | $ | 22,645,104 | ||||||
Description
|
|
Number of
|
|
| Value
|
| ||
EXCHANGE-TRADED FUNDS – 11.6% |
| |||||||
iShares Cohen & Steers REIT ETF | 3,171 | $ | 317,322 | |||||
iShares Russell Mid-Cap Value ETF | 15,725 | 1,138,804 | ||||||
iShares TIPS ETF | 7,562 | 868,722 | ||||||
SPDR Dow Jones International Real Estate ETF | 7,890 | 334,220 | ||||||
Vanguard Small-Cap ETF | 5,200 | 589,992 | ||||||
|
| |||||||
TOTAL EXCHANGE-TRADED FUNDS | $ | 3,249,060 | ||||||
|
| |||||||
TOTAL INVESTMENT COMPANIES (COST $25,234,745) |
| $ | 28,127,504 | |||||
| MONEY MARKET FUND – 0.0%** | ||||||||
Dreyfus Cash Management Fund, Institutional Shares, 0.27%^ | 14,008 | 14,008 | ||||||
TOTAL MONEY MARKET FUND (COST $14,008) | $ | 14,008 | ||||||
|
| |||||||
| TOTAL INVESTMENTS – 100.0% | ||||||||
| (COST $25,248,753) | $ | 28,141,512 | ||||||
| OTHER LIABILITIES LESS ASSETS – 0.0%** | (5,114 | ) | ||||||
|
| |||||||
| TOTAL NET ASSETS – 100.0% | $ | 28,136,398 | ||||||
|
| |||||||
ANNUAL REPORT / April 30, 2016
80 PORTFOLIOS OF INVESTMENTS
Wilmington Strategic Allocation Aggressive Fund (concluded)
Cost of investments for Federal income tax purposes is $28,885,602. The net unrealized appreciation/(depreciation) of investments was $(744,090).This consists of net unrealized appreciation from investment for those securities having an excess of value over cost of $0 and net unrealized depreciation from investments for those securities having an excess of cost over value of $744,090.
Various inputs are used in determining the value of the Fund’s investments. These inputs are summarized in the three broad levels listed below.
Level 1 – quoted prices in active markets for identical securities
Level 2 – other significant observable inputs (including quoted prices for similar securities, interest rates, prepayment speeds, credit risk, etc.)
Level 3 – significant unobservable inputs (including the Fund’s own assumptions in determining the fair value of investments)
The following is a summary of the inputs used as of April 30, 2016 in valuing the Fund’s assets carried at fair value:
| Level 1 | Level 2 | Level 3 | Total | |||||||||||||
| Investments in Securities | ||||||||||||||||
| Investment Companies | $ | 28,127,504 | $ | — | $ | — | $ | 28,127,504 | ||||||||
| Money Market Fund | 14,008 | — | — | 14,008 | ||||||||||||
|
|
|
|
|
|
|
| |||||||||
| Total | $ | 28,141,512 | $ | — | $ | — | $ | 28,141,512 | ||||||||
|
|
|
|
|
|
|
| |||||||||
| ^ | 7-Day net yield. |
| § | Affiliated company. See Note 5 in Notes to Financial Statements. |
| ** | Represents less than 0.05%. |
The following acronyms are used throughout this Fund:
ETF - Exchange Traded Fund
MSCI - Morgan Stanley Capital International
REIT - Real Estate Investment Trust
SPDR - Standard & Poor’s Depository Receipts
TIPS - Treasury Inflation Protected Security
See Notes which are an integral part of the Financial Statements
April 30, 2016 / ANNUAL REPORT
| STATEMENTS OF ASSETS AND LIABILITIES | 81 |
| April 30, 2016 | Wilmington Fund | Wilmington Multi-Manager Alternatives Fund | Wilmington Multi-Manager Real Asset Fund | ||||||||||||||
ASSETS: | |||||||||||||||||
Investments, at identified cost | $ | 397,991,951 | $ | 157,911,136 | $ | 490,254,875 | |||||||||||
|
|
|
|
|
| ||||||||||||
Investments in securities, at value (Including $19,220,667, $0, and $4,442,047 of securities on loan, respectively) (Note 2) | $ | 416,281,851 | $ | 159,371,637 | $ | 525,539,705 | |||||||||||
|
|
|
|
|
| ||||||||||||
Cash | — | 2,025,050 | 21,420 | ||||||||||||||
Deposits for futures contracts | — | — | 290,947 | ||||||||||||||
Deposits for securities sold short | — | 30,695,658 | — | ||||||||||||||
Deposits for swaps | — | — | 1,849,193 | ||||||||||||||
Cash denominated in foreign currencies | 540,592 | (a) | — | 263,703 | (a) | ||||||||||||
Variation margin receivable for centrally cleared swap agreements | — | — | 18,622 | ||||||||||||||
Variation margin receivable for financial futures contracts | — | — | 50,347 | ||||||||||||||
Income receivable | 2,379,954 | 648,583 | 1,152,943 | ||||||||||||||
Receivable for shares sold | 197,159 | 331,720 | 765,539 | ||||||||||||||
Over the counter swap agreements, at value (Including net upfront payments paid of $205) | — | — | 311,464 | ||||||||||||||
Unrealized appreciation on foreign currency exchange contracts | 43,856 | — | 852,311 | ||||||||||||||
Receivable for investments sold | 19,608,426 | 9,506,230 | 20,177,302 | ||||||||||||||
Receivable for foreign currencies sold | 153,917 | — | — | ||||||||||||||
Prepaid assets | 22,184 | 30,268 | 26,301 | ||||||||||||||
|
|
|
|
|
| ||||||||||||
TOTAL ASSETS | 439,227,939 | 202,609,146 | 551,319,797 | ||||||||||||||
|
|
|
|
|
|
| |||||||||||
| LIABILITIES: | |||||||||||||||||
Overdraft due to custodian | — | 13,455 | (a) | — | |||||||||||||
Options written, at value | — | 125,181 | (b) | 384,359 | (b) | ||||||||||||
Deferred capital gains tax payable | 53,805 | — | — | ||||||||||||||
Variation margin payable for centrally cleared swap agreements | — | — | 28,667 | ||||||||||||||
Variation margin payable for financial futures contracts | — | — | 63,419 | ||||||||||||||
Payable for securities sold short | — | 32,555,874 | (c) | — | |||||||||||||
Payable for investments purchased | 2,485,738 | 6,042,708 | 87,995,578 | ||||||||||||||
Collateral for securities on loan | 19,957,162 | — | 4,556,664 | ||||||||||||||
Due to broker for swap agreements | — | — | 90,000 | ||||||||||||||
Due to prime broker for securities sold short | — | 3,849,198 | — | ||||||||||||||
Over the counter swap agreements, at value (Including net upfront payments received of $46,962) | — | — | 416,744 | ||||||||||||||
Unrealized depreciation on foreign currency exchange contracts | 5,644 | 9 | 2,166,098 | ||||||||||||||
Payable for shares redeemed | 123,067 | 285,556 | 397,781 | ||||||||||||||
Payable to sub-advisors | 195,901 | 108,391 | 98,331 | ||||||||||||||
Payable for Trustees’ fees | 2,005 | 2,005 | 2,005 | ||||||||||||||
Payable for distribution services fee | 968 | 266 | 353 | ||||||||||||||
Payable for shareholder services fee | 39,477 | — | — | ||||||||||||||
Other accrued expenses | 197,300 | 136,231 | 186,664 | ||||||||||||||
|
|
|
|
|
| ||||||||||||
TOTAL LIABILITIES | 23,061,067 | 43,118,874 | 96,386,663 | ||||||||||||||
|
|
|
|
|
|
| |||||||||||
NET ASSETS | $ | 416,166,872 | $ | 159,490,272 | $ | 454,933,134 | |||||||||||
|
|
|
|
|
|
| |||||||||||
| NET ASSETS CONSIST OF: | |||||||||||||||||
| |||||||||||||||||
Paid-in capital | $ | 679,061,044 | $ | 171,869,849 | $ | 570,575,682 | |||||||||||
Undistributed (distributions in excess of) net investment income | 640,558 | (36,074) | (14,365,036) | ||||||||||||||
Accumulated net realized gain (loss) on investments and foreign currency transactions | (281,899,509) | (11,416,993) | (134,777,749) | ||||||||||||||
Net unrealized appreciation (depreciation) of investments and foreign currencies | 18,364,779 | (926,510) | 33,500,237 | ||||||||||||||
|
|
|
|
|
| ||||||||||||
TOTAL NET ASSETS | $ | 416,166,872 | $ | 159,490,272 | $ | 454,933,134 | |||||||||||
|
|
|
|
|
|
| |||||||||||
| COMPUTATION OF NET ASSET VALUE AND OFFERING PRICE: | |||||||||||||||||
Class A | |||||||||||||||||
Net Assets | $ | 4,809,871 | $ | 1,289,894 | $ | 1,762,488 | |||||||||||
|
|
|
|
|
| ||||||||||||
Shares outstanding (unlimited shares authorized) | 679,020 | 131,348 | 129,300 | ||||||||||||||
|
|
|
|
|
| ||||||||||||
Net Asset Value per share | $ | 7.08 | $ | 9.82 | $ | 13.63 | |||||||||||
|
|
|
|
|
| ||||||||||||
Offering price per share* | $ | 7.49 | ** | $ | 10.39 | ** | $ | 14.42 | ** | ||||||||
|
|
|
|
|
| ||||||||||||
Class I | |||||||||||||||||
Net Assets | $ | 411,357,001 | $ | 158,200,378 | $ | 453,170,646 | |||||||||||
|
|
|
|
|
| ||||||||||||
Shares outstanding (unlimited shares authorized) | 57,671,473 | 16,044,495 | 33,013,553 | ||||||||||||||
|
|
|
|
|
| ||||||||||||
Net Asset Value per share | $ | 7.13 | $ | 9.86 | $ | 13.73 | |||||||||||
|
|
|
|
|
| ||||||||||||
| (a) | Cost of cash (overdraft) denominated in foreign currencies was $610,664, $13,111 and $249,381, respectively. |
| (b) | Premiums received for options written were $236,654 and $554,951, respectively. |
| (c) | Proceeds received for securities sold short were $31,103,337. |
| * | See “What Do Shares Cost?” in the Prospectus. |
| ** | Computation of offering price per share 100/94.50 of net asset value. |
See Notes which are an integral part of the Financial Statements
ANNUAL REPORT / April 30, 2016
| 82 | STATEMENTS OF ASSETS AND LIABILITIES (concluded) |
| April 30, 2016 | Wilmington Strategic Allocation Conservative Fund | Wilmington Strategic Allocation Moderate Fund | Wilmington Strategic Allocation Aggressive Fund | ||||||||||||||||
| ASSETS: | |||||||||||||||||||
Investments, at identified cost | $ | 33,771,536 | (a) | $ | 43,938,428 | (a) | $ | 25,248,753 | (a) | ||||||||||
|
|
|
|
|
| ||||||||||||||
Investments in securities, at value (Including $0, $128,509, and $0 of securities on loan, respectively) (Note 2) | 34,561,834 | (b) | 45,882,806 | (b) | 28,141,512 | (b) | |||||||||||||
Income receivable | 36,019 | 76,386 | 3,479 | ||||||||||||||||
Due from advisor | 5,539 | 9,002 | 5,864 | ||||||||||||||||
Receivable for shares sold | — | 965 | 12,094 | ||||||||||||||||
Prepaid assets | 21,153 | 14,100 | 21,356 | ||||||||||||||||
|
|
|
|
|
| ||||||||||||||
TOTAL ASSETS | 34,624,545 | 45,983,259 | 28,184,305 | ||||||||||||||||
|
|
|
|
|
|
| |||||||||||||
| LIABILITIES: | |||||||||||||||||||
Payable for investments purchased | 35,774 | 12,930 | 3,334 | ||||||||||||||||
Collateral for securities on loan | — | 133,275 | — | ||||||||||||||||
Payable for shares redeemed | 2,498 | 16,765 | 2,191 | ||||||||||||||||
Payable for Trustees’ fees | 2,005 | 2,005 | 2,005 | ||||||||||||||||
Payable for distribution services fee | 655 | 9,172 | 503 | ||||||||||||||||
Other accrued expenses | 39,705 | 73,394 | 39,874 | ||||||||||||||||
|
|
|
|
|
| ||||||||||||||
TOTAL LIABILITIES | 80,637 | 247,541 | 47,907 | ||||||||||||||||
|
|
|
|
|
|
| |||||||||||||
NET ASSETS | $ | 34,543,908 | $ | 45,735,718 | $ | 28,136,398 | |||||||||||||
|
|
|
|
|
|
| |||||||||||||
NET ASSETS CONSIST OF: | |||||||||||||||||||
| |||||||||||||||||||
Paid-in capital | $ | 34,040,516 | $ | 48,368,237 | $ | 28,489,433 | |||||||||||||
Undistributed (distributions in excess of) net investment income | 46,336 | 50,278 | — | ||||||||||||||||
Accumulated net realized gain (loss) on investments | (333,242) | (4,627,175) | (3,245,794) | ||||||||||||||||
Net unrealized appreciation (depreciation) of investments and foreign currencies | 790,298 | 1,944,378 | 2,892,759 | ||||||||||||||||
|
|
|
|
|
| ||||||||||||||
TOTAL NET ASSETS | $ | 34,543,908 | $ | 45,735,718 | $ | 28,136,398 | |||||||||||||
|
|
|
|
|
|
| |||||||||||||
| COMPUTATION OF NET ASSET VALUE AND OFFERING PRICE: | |||||||||||||||||||
Class A | |||||||||||||||||||
Net Assets | $ | 3,196,856 | $ | 44,606,668 | $ | 2,438,534 | |||||||||||||
|
|
|
|
|
| ||||||||||||||
Shares outstanding (unlimited shares authorized) | 305,263 | 4,288,547 | 219,509 | ||||||||||||||||
|
|
|
|
|
| ||||||||||||||
Net Asset Value per share | $ | 10.47 | $ | 10.40 | $ | 11.11 | |||||||||||||
|
|
|
|
|
| ||||||||||||||
Offering price per share* | $ | 11.08 | ** | $ | 11.01 | ** | $ | 11.76 | ** | ||||||||||
|
|
|
|
|
| ||||||||||||||
Class I | |||||||||||||||||||
Net Assets | $ | 31,347,052 | $ | 1,129,050 | $ | 25,697,864 | |||||||||||||
|
|
|
|
|
| ||||||||||||||
Shares outstanding (unlimited shares authorized) | 2,986,686 | 108,458 | 2,299,391 | ||||||||||||||||
|
|
|
|
|
| ||||||||||||||
Net Asset Value per share | $ | 10.50 | $ | 10.41 | $ | 11.18 | |||||||||||||
|
|
|
|
|
| ||||||||||||||
| (a) | Includes $19,901,446, $10,450,769 and $10,461,583 of investments in affiliated issuers, respectively. |
| (b) | Includes $20,634,632, $11,191,986 and $12,508,137 of investments in affiliated issuers, respectively. |
| * | See “What Do Shares Cost?” in the Prospectus. |
| ** | Computation of offering price per share 100/94.50 of net asset value. |
See Notes which are an integral part of the Financial Statements
April 30, 2016 / ANNUAL REPORT
| STATEMENTS OF OPERATIONS | 83 |
| Year Ended April 30, 2016 | Wilmington Multi-Manager International Fund | Wilmington Multi-Manager Alternatives Fund | Wilmington Multi-Manager Real Asset Fund | |||||||||||
| INVESTMENT INCOME: | ||||||||||||||
Dividends | $ | 10,931,672 | (a) | $ | 940,515 | (a) | $ | 6,030,754 | (a) | |||||
Interest | 1,321 | 2,620,451 | 5,402,674 | (a) | ||||||||||
Securities lending income | 189,926 | — | 10,571 | |||||||||||
|
|
|
|
|
| |||||||||
| TOTAL INVESTMENT INCOME | 11,122,919 | 3,560,966 | 11,443,999 | |||||||||||
|
|
|
|
|
|
| ||||||||
| EXPENSES: | ||||||||||||||
Investment advisory fee | 4,728,384 | 3,068,239 | 3,071,763 | |||||||||||
Administrative personnel and services fee | 141,405 | 54,500 | 131,661 | |||||||||||
Portfolio accounting and administration fees | 338,814 | 83,534 | 258,326 | |||||||||||
Custodian fees | 496,667 | 35,351 | 224,925 | |||||||||||
Transfer and dividend disbursing agent fees and expenses | 150,112 | 137,606 | 159,573 | |||||||||||
Trustees’ fees | 43,263 | 43,263 | 43,263 | |||||||||||
Professional fees | 199,352 | 107,719 | 115,131 | |||||||||||
Distribution services fee—Class A | 12,804 | 4,538 | 4,938 | |||||||||||
Shareholder services fee—Class A | 12,804 | 4,538 | 4,938 | |||||||||||
Shareholder services fee—Class I | 1,116,735 | 430,710 | 1,046,346 | |||||||||||
Share registration costs | 26,304 | 30,489 | 30,975 | |||||||||||
Printing and postage | 19,705 | 33,558 | 24,151 | |||||||||||
Dividend expense on securities sold short | — | 328,011 | — | |||||||||||
Prime broker interest expense | — | 211,881 | — | |||||||||||
Interest expense on reverse repurchase agreements | — | — | 1,234 | |||||||||||
Miscellaneous | 63,259 | 34,495 | 55,594 | |||||||||||
|
|
|
|
|
| |||||||||
| TOTAL EXPENSES | 7,349,608 | 4,608,432 | 5,172,818 | |||||||||||
|
|
|
|
|
|
| ||||||||
| WAIVERS AND REIMBURSEMENTS: | ||||||||||||||
Waiver/reimbursement by investment advisor/subadvisors | (1,406,943) | (316,538) | (6,904) | |||||||||||
Waiver of shareholder services fee—Class A | (12,804) | (4,538) | (4,938) | |||||||||||
Waiver of shareholder services fee—Class I | (583,175) | (430,710) | (1,046,346) | |||||||||||
Waiver of portfolio accounting and administration fees | (11,078) | (4,336) | (10,290) | |||||||||||
|
|
|
|
|
| |||||||||
| TOTAL WAIVERS AND REIMBURSEMENTS | (2,014,000) | (756,122) | (1,068,478) | |||||||||||
|
|
|
|
|
|
| ||||||||
Net expenses | 5,335,608 | 3,852,310 | 4,104,340 | |||||||||||
|
|
|
|
|
| |||||||||
Net investment income (loss) | 5,787,311 | (291,344) | 7,339,659 | |||||||||||
|
|
|
|
|
| |||||||||
| REALIZED AND UNREALIZED GAIN (LOSS) ON INVESTMENTS: | ||||||||||||||
Net realized gain (loss) on investments | (10,291,764) | (10,922,052) | (42,864,627) | |||||||||||
Net realized gain (loss) on foreign currency transactions | (517,193) | 57,291 | 3,879,134 | |||||||||||
Net realized gain (loss) on futures contracts | — | (1,450,280) | (1,356,689) | |||||||||||
Net realized gain (loss) on swap agreements | — | — | (2,549,515) | |||||||||||
Net realized gain (loss) on options purchased | — | (1,645,986) | (263,986) | |||||||||||
Net realized gain (loss) on options written | — | 1,318,244 | 370,230 | |||||||||||
Net realized gain (loss) on securities sold short | — | 1,172,069 | — | |||||||||||
Net realized gain (loss) on TBA Sales Commitments | — | — | 90,657 | |||||||||||
Net change in unrealized appreciation (depreciation) on investments | (52,604,562) | 483,237 | 17,315,252 | |||||||||||
Net change in unrealized appreciation (depreciation) on foreign currency transactions | 17,567 | 1,208 | 3,645,215 | |||||||||||
Net change in unrealized appreciation (depreciation) on futures contracts | — | 327,429 | 422,930 | |||||||||||
Net change in unrealized appreciation (depreciation) on swap agreements | — | — | (296,338) | |||||||||||
Net change in unrealized appreciation (depreciation) on options purchased | — | (193,171) | (200,769) | |||||||||||
Net change in unrealized appreciation (depreciation) on options written | — | 91,213 | 474,086 | |||||||||||
Net change in unrealized appreciation (depreciation) on securities sold short | — | (1,612,825) | — | |||||||||||
Net change in unrealized appreciation (depreciation) on TBA Sales Commitments | — | — | (18,758) | |||||||||||
|
|
|
|
|
| |||||||||
Net realized and unrealized gain (loss) on investments | (63,395,952) | (12,373,623) | (21,353,178) | |||||||||||
|
|
|
|
|
| |||||||||
Change in net assets resulting from operations | $ | (57,608,641) | $ | (12,664,967) | $ | (14,013,519) | ||||||||
|
|
|
|
|
| |||||||||
| (a) | Net of foreign withholding taxes withheld of $1,049,775, $6,336 and $310,650, respectively. |
See Notes which are an integral part of the Financial Statements
ANNUAL REPORT / April 30, 2016
| 84 | STATEMENTS OF OPERATIONS (concluded) |
| Year Ended April 30, 2016 | Wilmington Strategic Allocation Conservative Fund | Wilmington Strategic Allocation Moderate Fund | Wilmington Strategic Allocation Aggressive Fund | ||||||||||||||
| INVESTMENT INCOME: | |||||||||||||||||
Dividends | $ | 292,316 | $ | 531,294 | $ | 238,898 | |||||||||||
Dividends received from affiliated issuers | 392,253 | 140,367 | 170,558 | ||||||||||||||
Interest | — | 243,600 | — | ||||||||||||||
Securities lending income | — | 13,758 | — | ||||||||||||||
|
|
|
|
|
| ||||||||||||
TOTAL INVESTMENT INCOME | 684,569 | 929,019 | 409,456 | ||||||||||||||
|
|
|
|
|
|
| |||||||||||
| EXPENSES: | |||||||||||||||||
Investment advisory fee | 143,132 | 197,843 | 120,486 | ||||||||||||||
Administrative personnel and services fee | 11,204 | 15,484 | 9,430 | ||||||||||||||
Portfolio accounting and administration fees | 32,839 | 27,026 | 32,747 | ||||||||||||||
Custodian fees | 175 | 2,826 | 197 | ||||||||||||||
Transfer and dividend disbursing agent fees and expenses | 4,244 | 86,329 | 5,066 | ||||||||||||||
Trustees’ fees | 43,263 | 43,263 | 43,263 | ||||||||||||||
Professional fees | 59,158 | 65,654 | 59,152 | ||||||||||||||
Distribution services fee—Class A | 8,449 | 120,701 | 6,546 | ||||||||||||||
Shareholder services fee—Class A | 8,449 | 120,701 | 6,546 | ||||||||||||||
Shareholder services fee—Class I | 81,008 | 2,951 | 68,758 | ||||||||||||||
Share registration costs | 26,664 | 18,299 | 26,917 | ||||||||||||||
Printing and postage | 5,476 | 21,384 | 6,212 | ||||||||||||||
Miscellaneous | 23,330 | 24,746 | 22,974 | ||||||||||||||
|
|
|
|
|
| ||||||||||||
TOTAL EXPENSES | 447,391 | 747,207 | 408,294 | ||||||||||||||
|
|
|
|
|
|
| |||||||||||
| WAIVERS AND REIMBURSEMENTS: | |||||||||||||||||
Waiver/reimbursement by investment advisor | (159,835) | (259,285) | (139,691) | ||||||||||||||
Waiver of shareholder services fee—Class A | (8,449) | (120,701) | (6,546) | ||||||||||||||
Waiver of shareholder services fee—Class I | (81,008) | (2,951) | (68,758) | ||||||||||||||
Waiver of portfolio accounting and administration fees | — | (1,211) | — | ||||||||||||||
|
|
|
|
|
| ||||||||||||
TOTAL WAIVERS AND REIMBURSEMENTS | (249,292) | (384,148) | (214,995) | ||||||||||||||
|
|
|
|
|
|
| |||||||||||
Net expenses | 198,099 | 363,059 | 193,299 | ||||||||||||||
|
|
|
|
|
| ||||||||||||
Net investment income | 486,470 | 565,960 | 216,157 | ||||||||||||||
|
|
|
|
|
| ||||||||||||
| REALIZED AND UNREALIZED GAIN (LOSS) ON INVESTMENTS: | |||||||||||||||||
Net realized gain (loss) on investments | (387,457) | (607,517) | (337,908) | ||||||||||||||
Net realized gain (loss) on affiliated investment companies | 177,709 | 267,241 | 468,465 | ||||||||||||||
Realized gain on distributions received from investment companies | 218,105 | 711,076 | 500,016 | ||||||||||||||
Realized gain on distributions received from affiliated investment companies | 162,861 | 459,918 | 434,433 | ||||||||||||||
Net change in unrealized appreciation (depreciation) of investments | (1,171,139) | (3,451,110) | (2,943,318) | ||||||||||||||
|
|
|
|
|
| ||||||||||||
Net realized and unrealized gain (loss) on investments | (999,921) | (2,620,392) | (1,878,312) | ||||||||||||||
|
|
|
|
|
| ||||||||||||
Change in net assets resulting from operations | $ | (513,451) | $ | (2,054,432) | $ | (1,662,155) | |||||||||||
|
|
|
|
|
| ||||||||||||
See Notes which are an integral part of the Financial Statements
April 30, 2016 / ANNUAL REPORT
| STATEMENTS OF CHANGES IN NET ASSETS | 85 |
| Wilmington Multi-Manager International Fund | Wilmington Multi-Manager Alternatives Fund | ||||||||||||||||
| Year Ended April 30, 2016 | Year Ended April 30, 2015 | Year Ended April 30, 2016 | Year Ended April 30, 2015 | |||||||||||||||
| OPERATIONS: | ||||||||||||||||||
Net investment income (loss) | $ | 5,787,311 | $ | 6,962,913 | $ | (291,344) | $ | (589,792) | ||||||||||
Net realized gain (loss) on investments | (10,808,957) | 27,519,975 | (11,470,714) | 6,563,400 | ||||||||||||||
Net change in unrealized appreciation (depreciation) of investments | (52,586,995) | (16,685,480) | (902,909) | 573,052 | ||||||||||||||
|
|
|
|
|
|
|
| |||||||||||
Change in net assets resulting from operations | (57,608,641) | 17,797,408 | (12,664,967) | 6,546,660 | ||||||||||||||
|
|
|
|
|
|
|
| |||||||||||
| DISTRIBUTIONS TO SHAREHOLDERS: | ||||||||||||||||||
Distributions from net investment income | ||||||||||||||||||
Class A | (67,333) | (91,190) | (34,136) | — | ||||||||||||||
Class I | (6,200,624) | (8,394,062) | (3,829,874) | — | ||||||||||||||
Distributions from net realized gain on investments | ||||||||||||||||||
Class A | — | — | — | (73,584) | ||||||||||||||
Class I | — | — | — | (3,345,957) | ||||||||||||||
|
|
|
|
|
|
|
| |||||||||||
Change in net assets resulting from distributions to shareholders | (6,267,957) | (8,485,252) | (3,864,010) | (3,419,541) | ||||||||||||||
|
|
|
|
|
|
|
| |||||||||||
| SHARE TRANSACTIONS: | ||||||||||||||||||
Class A | 351,433 | 205,894 | 393,012 | 2,785,459 | ||||||||||||||
Class I | 57,572,702 | 53,749,158 | 30,547,196 | 47,952,089 | ||||||||||||||
Distributions reinvested | ||||||||||||||||||
Class A | 60,844 | 84,082 | 29,357 | 57,566 | ||||||||||||||
Class I | 3,701,965 | 5,106,382 | 2,704,451 | 3,193,804 | ||||||||||||||
Cost of shares redeemed | ||||||||||||||||||
Class A | (799,243) | (577,668) | (1,702,665) | (4,347,017) | ||||||||||||||
Class I | (122,199,388) | (59,505,440) | (52,313,966) | (68,093,175) | ||||||||||||||
|
|
|
|
|
|
|
| |||||||||||
Change in net assets resulting from share transactions | (61,311,687) | (937,592) | (20,342,615) | (18,451,274) | ||||||||||||||
|
|
|
|
|
|
|
| |||||||||||
Change in net assets | (125,188,285) | 8,374,564 | (36,871,592) | (15,324,155) | ||||||||||||||
| NET ASSETS: | ||||||||||||||||||
Beginning of year | 541,355,157 | 532,980,593 | 196,361,864 | 211,686,019 | ||||||||||||||
|
|
|
|
|
|
|
| |||||||||||
End of year | $ | 416,166,872 | $ | 541,355,157 | $ | 159,490,272 | $ | 196,361,864 | ||||||||||
|
|
|
|
|
|
|
| |||||||||||
Undistributed (distributions in excess of) net investment income included in net assets at end of year | $ | 640,558 | $ | 695,062 | $ | (36,074) | $ | 4,184,371 | ||||||||||
|
|
|
|
|
|
|
| |||||||||||
| SHARES OF BENEFICIAL INTEREST: | . | |||||||||||||||||
Shares sold | ||||||||||||||||||
Class A | 47,244 | 26,464 | 36,602 | 258,540 | ||||||||||||||
Class I | 8,226,926 | 6,935,843 | 2,971,611 | 4,470,296 | ||||||||||||||
Distributions reinvested | ||||||||||||||||||
Class A | 8,215 | 10,418 | 2,886 | 5,410 | ||||||||||||||
Class I | 496,430 | 629,900 | 265,142 | 299,887 | ||||||||||||||
Shares redeemed | ||||||||||||||||||
Class A | (111,776) | (74,672) | (158,847) | (400,212) | ||||||||||||||
Class I | (17,268,127) | (7,686,723) | (4,982,168) | (6,306,107) | ||||||||||||||
|
|
|
|
|
|
|
| |||||||||||
Net change resulting from share transactions | (8,601,088) | (158,770) | (1,864,774) | (1,672,186) | ||||||||||||||
|
|
|
|
|
|
|
| |||||||||||
See Notes which are an integral part of the Financial Statements
ANNUAL REPORT / April 30, 2016
| 86 | STATEMENTS OF CHANGES IN NET ASSETS (continued) |
| Wilmington Multi-Manager Real Asset Fund | Wilmington Strategic Allocation Conservative Fund | ||||||||||||||||||||
| Year Ended April 30, 2016 | Year Ended April 30, 2015 | Year Ended April 30, 2016 | Year Ended April 30, 2015 | |||||||||||||||||||
| OPERATIONS: | ||||||||||||||||||||||
Net investment income (loss) | $ | 7,339,659 | $ | 5,243,892 | $ | 486,470 | $ | 417,776 | ||||||||||||||
Net realized gain (loss) on investments | (42,694,796) | 27,770,944 | 171,218 | 702,599 | ||||||||||||||||||
Net change in unrealized appreciation (depreciation) of investments | 21,341,618 | (26,772,615) | (1,171,139) | 289,745 | ||||||||||||||||||
|
|
|
|
|
|
|
| |||||||||||||||
Change in net assets resulting from operations | (14,013,519) | 6,242,221 | (513,451) | 1,410,120 | ||||||||||||||||||
|
|
|
|
|
|
|
| |||||||||||||||
| DISTRIBUTIONS TO SHAREHOLDERS: | ||||||||||||||||||||||
Distributions from net investment income | ||||||||||||||||||||||
Class A | (100,231) | (37,226) | (44,041) | (43,427) | ||||||||||||||||||
Class I | (21,533,735) | (6,962,928) | (502,213) | (475,323) | ||||||||||||||||||
Distributions from net realized gain on investments | ||||||||||||||||||||||
Class A | — | — | (60,335) | (76,046) | ||||||||||||||||||
Class I | — | — | (580,572) | (682,529) | ||||||||||||||||||
|
|
|
|
|
|
|
| |||||||||||||||
Return of Capital | ||||||||||||||||||||||
Change in net assets resulting from distributions to shareholders | (21,633,966) | (7,000,154) | (1,187,161) | (1,277,325) | ||||||||||||||||||
|
|
|
|
|
|
|
| |||||||||||||||
| SHARE TRANSACTIONS: | ||||||||||||||||||||||
Proceeds from sale of shares | ||||||||||||||||||||||
Class A | 390,108 | 920,159 | 58,854 | 53,499 | ||||||||||||||||||
Class I | 111,341,836 | 68,766,495 | 798,734 | 979,730 | ||||||||||||||||||
Distributions reinvested | ||||||||||||||||||||||
Class A | 70,793 | 28,746 | 96,211 | 110,130 | ||||||||||||||||||
Class I | 10,809,455 | 2,294,912 | 1,059,315 | 1,129,671 | ||||||||||||||||||
Cost of shares redeemed | ||||||||||||||||||||||
Class A | (754,086) | (1,296,786) | (411,136) | (1,173,984) | ||||||||||||||||||
Class I | (96,894,994) | (59,856,239) | (3,591,037) | (5,259,373) | ||||||||||||||||||
|
|
|
|
|
|
|
| |||||||||||||||
Change in net assets resulting from share transactions | 24,963,112 | 10,857,287 | (1,989,059) | (4,160,327) | ||||||||||||||||||
|
|
|
|
|
|
|
| |||||||||||||||
Change in net assets | (10,684,373) | 10,099,354 | (3,689,671) | (4,027,532) | ||||||||||||||||||
| NET ASSETS: | ||||||||||||||||||||||
Beginning of year | 465,617,507 | 455,518,153 | 38,233,579 | 42,261,111 | ||||||||||||||||||
|
|
|
|
|
|
|
| |||||||||||||||
End of year | $ | 454,933,134 | $ | 465,617,507 | $ | 34,543,908 | $ | 38,233,579 | ||||||||||||||
|
|
|
|
|
|
|
| |||||||||||||||
Undistributed (distributions in excess of) net investment income included in net assets at end of year | $ | (14,365,036) | $ | 16,133,626 | $ | 46,336 | $ | 38,134 | ||||||||||||||
|
|
|
|
|
|
|
| |||||||||||||||
| SHARES OF BENEFICIAL INTEREST: | ||||||||||||||||||||||
Shares sold | ||||||||||||||||||||||
Class A | 28,843 | 61,539 | 5,463 | 4,865 | ||||||||||||||||||
Class I | 8,257,608 | 4,599,175 | 75,347 | 89,278 | ||||||||||||||||||
Distributions reinvested | ||||||||||||||||||||||
Class A | 5,219 | 1,974 | 9,193 | 10,119 | ||||||||||||||||||
Class I | 793,039 | 156,785 | 100,902 | 103,574 | ||||||||||||||||||
Shares redeemed | ||||||||||||||||||||||
Class A | (56,589) | (87,612) | (38,770) | (106,588) | ||||||||||||||||||
Class I | (7,222,474) | (4,006,614) | (337,298) | (477,557) | ||||||||||||||||||
|
|
|
|
|
|
|
| |||||||||||||||
Net change resulting from share transactions | 1,805,646 | 725,247 | (185,163) | (376,309) | ||||||||||||||||||
|
|
|
|
|
|
|
| |||||||||||||||
See Notes which are an integral part of the Financial Statements
April 30, 2016 / ANNUAL REPORT
| STATEMENTS OF CHANGES IN NET ASSETS (concluded) | 87 |
| Wilmington Strategic Allocation Moderate Fund | Wilmington Strategic Allocation Aggressive Fund | ||||||||||||||||||||
| Year Ended April 30, 2016 | Year Ended April 30, 2015 | Year Ended April 30, 2016 | Year Ended April 30, 2015 | |||||||||||||||||||
| OPERATIONS: | ||||||||||||||||||||||
Net investment income (loss) | $ | 565,960 | $ | 508,505 | $ | 216,157 | $ | 157,510 | ||||||||||||||
Net realized gain (loss) on investments | 830,718 | 3,035,252 | 1,065,006 | 2,592,069 | ||||||||||||||||||
Net change in unrealized appreciation (depreciation) of investments | (3,451,110) | (237,912) | (2,943,318) | 23,235 | ||||||||||||||||||
|
|
|
|
|
|
|
| |||||||||||||||
Change in net assets resulting from operations | (2,054,432) | 3,305,845 | (1,662,155) | 2,772,814 | ||||||||||||||||||
|
|
|
|
|
|
|
| |||||||||||||||
| DISTRIBUTIONS TO SHAREHOLDERS: | ||||||||||||||||||||||
Distributions from net investment income | ||||||||||||||||||||||
Class A | (704,866) | (633,887) | (22,866) | (19,456) | ||||||||||||||||||
Class I | (19,318) | (15,500) | (270,232) | (266,723) | ||||||||||||||||||
Distributions from net realized gain on investments | ||||||||||||||||||||||
Class A | (91,486) | — | (71,500) | — | ||||||||||||||||||
Class I | (2,187) | — | (731,588) | — | ||||||||||||||||||
|
|
|
|
|
|
|
| |||||||||||||||
Change in net assets resulting from distributions to shareholders | (817,857) | (649,387) | (1,096,186) | (286,179) | ||||||||||||||||||
|
|
|
|
|
|
|
| |||||||||||||||
| SHARE TRANSACTIONS: | ||||||||||||||||||||||
Proceeds from sale of shares | ||||||||||||||||||||||
Class A | 1,574,207 | 1,893,349 | 434,898 | 146,794 | ||||||||||||||||||
Class I | 69,670 | 323,478 | 1,503,393 | 1,817,410 | ||||||||||||||||||
Distributions reinvested | ||||||||||||||||||||||
Class A | 746,484 | 600,598 | 92,297 | 19,021 | ||||||||||||||||||
Class I | 3,257 | 1,400 | 779,862 | 83,891 | ||||||||||||||||||
Cost of shares redeemed | ||||||||||||||||||||||
Class A | (7,765,695) | (9,553,638) | (563,519) | (609,143) | ||||||||||||||||||
Class I | (202,703) | (27,237) | (4,545,161) | (9,117,673) | ||||||||||||||||||
|
|
|
|
|
|
|
| |||||||||||||||
Change in net assets resulting from share transactions | (5,574,780) | (6,762,050) | (2,298,230) | (7,659,700) | ||||||||||||||||||
|
|
|
|
|
|
|
| |||||||||||||||
Change in net assets | (8,447,069) | (4,105,592) | (5,056,571) | (5,173,065) | ||||||||||||||||||
| NET ASSETS: | ||||||||||||||||||||||
Beginning of year | 54,182,787 | 58,288,379 | 33,192,969 | 38,366,034 | ||||||||||||||||||
|
|
|
|
|
|
|
| |||||||||||||||
End of year | $ | 45,735,718 | $ | 54,182,787 | $ | 28,136,398 | $ | 33,192,969 | ||||||||||||||
|
|
|
|
|
|
|
| |||||||||||||||
Undistributed (distributions in excess of) net investment income included in net assets at end of year | $ | 50,278 | $ | 69,282 | $ | — | $ | — | ||||||||||||||
|
|
|
|
|
|
|
| |||||||||||||||
| SHARES OF BENEFICIAL INTEREST: | ||||||||||||||||||||||
Shares sold | ||||||||||||||||||||||
Class A | 147,792 | 176,588 | 36,090 | 12,480 | ||||||||||||||||||
Class I | 6,507 | 30,095 | 132,660 | 155,596 | ||||||||||||||||||
Distributions reinvested | ||||||||||||||||||||||
Class A | 71,453 | 56,397 | 8,133 | 1,636 | ||||||||||||||||||
Class I | 309 | 131 | 68,133 | 7,191 | ||||||||||||||||||
Shares redeemed | ||||||||||||||||||||||
Class A | (746,129) | (893,932) | (49,347) | (51,503) | ||||||||||||||||||
Class I | (18,836) | (2,511) | (396,392) | (776,431) | ||||||||||||||||||
|
|
|
|
|
|
|
| |||||||||||||||
Net change resulting from share transactions | (538,904) | (633,232) | (200,723) | (651,031) | ||||||||||||||||||
|
|
|
|
|
|
|
| |||||||||||||||
See Notes which are an integral part of the Financial Statements
ANNUAL REPORT / April 30, 2016
| 88 | FINANCIAL HIGHLIGHTS |
For a share outstanding throughout each period.
WILMINGTON MULTI-MANAGER INTERNATIONAL FUND†
| ||||||||||||||||||||||||||||||||||||||||||
| ||||||||||||||||||||||||||||||||||||||||||
CLASS A
| Year Ended
| Year Ended
| Year Ended
| Year Ended
| For the Period
| Year Ended
| ||||||||||||||||||||||||||||||||||||
| Net Asset Value, Beginning of Year | $8.04 | $7.90 | $7.27 | $6.72 | $7.63 | $5.95 | ||||||||||||||||||||||||||||||||||||
| Income (Loss) From Operations: | ||||||||||||||||||||||||||||||||||||||||||
Net Investment Income (Loss)(a) | 0.08 | 0.09 | 0.12 | 0.09 | 0.16 | 0.12 | ||||||||||||||||||||||||||||||||||||
Net Realized and Unrealized Gain (Loss) on Investments and Foreign Currency | (0.95 | ) | 0.17 | 0.63 | 0.57 | (1.05 | ) | 1.64 | ||||||||||||||||||||||||||||||||||
|
| |||||||||||||||||||||||||||||||||||||||||
| Total Income (Loss) From Operations | (0.87 | ) | 0.26 | 0.75 | 0.66 | (0.89 | ) | 1.76 | ||||||||||||||||||||||||||||||||||
|
| |||||||||||||||||||||||||||||||||||||||||
| Less Distributions From: | ||||||||||||||||||||||||||||||||||||||||||
Net Investment Income | (0.09 | ) | (0.12 | ) | (0.12 | ) | (0.11 | ) | (0.02 | ) | (0.08 | ) | ||||||||||||||||||||||||||||||
|
| |||||||||||||||||||||||||||||||||||||||||
| Total Distributions | (0.09 | ) | (0.12 | ) | (0.12 | ) | (0.11 | ) | (0.02 | ) | (0.08 | ) | ||||||||||||||||||||||||||||||
|
| |||||||||||||||||||||||||||||||||||||||||
| Net Asset Value, End of Year | $7.08 | $8.04 | $7.90 | $7.27 | $6.72 | $7.63 | ||||||||||||||||||||||||||||||||||||
|
| |||||||||||||||||||||||||||||||||||||||||
| Total Return(b) | (10.82 | )% | 3.29 | % | 10.53 | % | 10.17 | % | (11.65 | )% | 29.57 | % | ||||||||||||||||||||||||||||||
| Net Assets, End of Year (000’s) | $4,810 | $5,909 | $6,107 | $6,301 | $6,682 | $571 | ||||||||||||||||||||||||||||||||||||
| Ratios to Average Net Assets | ||||||||||||||||||||||||||||||||||||||||||
Gross Expense | 1.87 | % | 1.84 | % | 1.78 | % | 1.78 | % | 1.62 | %(c) | 1.59 | % | ||||||||||||||||||||||||||||||
Net Expenses(d) | 1.31 | % | 1.42 | % | 1.49 | % | 1.48 | % | 1.42 | %(c) | 1.58 | % | ||||||||||||||||||||||||||||||
Net Investment Income (Loss) | 1.15 | % | 1.20 | % | 1.64 | % | 1.38 | % | 2.77 | %(c) | 1.61 | % | ||||||||||||||||||||||||||||||
| Portfolio Turnover Rate | 71 | % | 78 | % | 49 | % | 72 | % | 85 | % | 98 | % | ||||||||||||||||||||||||||||||
CLASS I
| Year Ended
| Year Ended
| Year Ended
| Year Ended
| For the Period
| Year Ended
| ||||||||||||||||||||||||||||||||||||
| Net Asset Value, Beginning of Year | $8.09 | $7.94 | $7.30 | $6.75 | $7.66 | $5.97 | ||||||||||||||||||||||||||||||||||||
| Income (Loss) From Operations: | ||||||||||||||||||||||||||||||||||||||||||
Net Investment Income (Loss)(a) | 0.09 | 0.10 | 0.13 | 0.10 | 0.06 | 0.10 | ||||||||||||||||||||||||||||||||||||
Net Realized and Unrealized Gain (Loss) on Investments and Foreign Currency | (0.95 | ) | 0.18 | 0.64 | 0.57 | (0.94 | ) | 1.67 | ||||||||||||||||||||||||||||||||||
|
| |||||||||||||||||||||||||||||||||||||||||
| Total Income (Loss) From Operations | (0.86 | ) | 0.28 | 0.77 | 0.67 | (0.88 | ) | 1.77 | ||||||||||||||||||||||||||||||||||
|
| |||||||||||||||||||||||||||||||||||||||||
| Less Distributions From: | ||||||||||||||||||||||||||||||||||||||||||
Net Investment Income | (0.10 | ) | (0.13 | ) | (0.13 | ) | (0.12 | ) | (0.03 | ) | (0.08 | ) | ||||||||||||||||||||||||||||||
|
| |||||||||||||||||||||||||||||||||||||||||
| Total Distributions | (0.10 | ) | (0.13 | ) | (0.13 | ) | (0.12 | ) | (0.03 | ) | (0.08 | ) | ||||||||||||||||||||||||||||||
|
| |||||||||||||||||||||||||||||||||||||||||
| Net Asset Value, End of Year | $7.13 | $8.09 | $7.94 | $7.30 | $6.75 | $7.66 | ||||||||||||||||||||||||||||||||||||
|
| |||||||||||||||||||||||||||||||||||||||||
| Total Return(b) | (10.70 | )% | 3.46 | % | 10.73 | % | 10.22 | % | (11.45 | )% | 29.78 | % | ||||||||||||||||||||||||||||||
| Net Assets, End of Year (000’s) | $411,357 | $535,446 | $526,874 | $512,889 | $395,690 | $373,798 | ||||||||||||||||||||||||||||||||||||
| Ratios to Average Net Assets | ||||||||||||||||||||||||||||||||||||||||||
Gross Expense | 1.62 | % | 1.59 | % | 1.53 | % | 1.54 | % | 1.42 | %(c) | 1.43 | % | ||||||||||||||||||||||||||||||
Net Expenses(d) | 1.18 | % | 1.29 | % | 1.36 | % | 1.35 | % | 1.38 | %(c) | 1.41 | % | ||||||||||||||||||||||||||||||
Net Investment Income (Loss) | 1.28 | % | 1.32 | % | 1.75 | % | 1.47 | % | 1.17 | %(c) | 1.38 | % | ||||||||||||||||||||||||||||||
| Portfolio Turnover Rate | 71 | % | 78 | % | 49 | % | 72 | % | 85 | % | 98 | % | ||||||||||||||||||||||||||||||
| (a) | Per share numbers have been calculated using the average shares method. |
| (b) | Based on net asset value, which does not reflect the sales charge or contingent deferred sales charge, if applicable. Total returns for periods of less than one year, if any, are not annualized. |
| (c) | Annualized for periods less than one year. |
| (d) | The investment advisor and other service providers waived or reimbursed a portion of their fees. |
| † | Effective March 9, 2012, the Fund acquired all the assets and liabilities of the Wilmington Multi-Manager International Fund, a series of WT Mutual Fund (the “WT Fund”). The financial highlights for the period prior to this date reflect the performance of the WT Fund. |
| * | Year end changed from June 30 to April 30. |
See Notes which are an integral part of the Financial Statements
April 30, 2016 / ANNUAL REPORT
| FINANCIAL HIGHLIGHTS (continued) | 89 |
For a share outstanding throughout each period.
WILMINGTON MULTI-MANAGER ALTERNATIVES FUND
| |||||||||||||||||||||||||||||||
CLASS A
| Year Ended
| Year Ended
| Year Ended
| Year Ended
| For the Period
| ||||||||||||||||||||||||||
| Net Asset Value, Beginning of Year | $10.86 | $10.74 | $10.58 | $10.11 | $10.00 | ||||||||||||||||||||||||||
| Income (Loss) From Operations: | |||||||||||||||||||||||||||||||
Net Investment Income (Loss)(a) | (0.05 | ) | (0.06 | ) | (0.04 | ) | 0.00 | %(b) | 0.03 | ||||||||||||||||||||||
Net Realized and Unrealized Gain (Loss) on Investments and Foreign Currency | (0.75 | ) | 0.35 | 0.34 | 0.56 | 0.08 | |||||||||||||||||||||||||
|
| ||||||||||||||||||||||||||||||
| Total Income (Loss) From Operations | (0.80 | ) | 0.29 | 0.30 | 0.56 | 0.11 | |||||||||||||||||||||||||
|
| ||||||||||||||||||||||||||||||
| Less Distributions From: | |||||||||||||||||||||||||||||||
Net Investment Income | (0.24 | ) | — | (0.01 | ) | (0.03 | ) | — | |||||||||||||||||||||||
Net Realized Gains | — | (0.17 | ) | (0.13 | ) | (0.06 | ) | — | |||||||||||||||||||||||
|
| ||||||||||||||||||||||||||||||
| Total Distributions | (0.24 | ) | (0.17 | ) | (0.14 | ) | (0.09 | ) | — | ||||||||||||||||||||||
|
| ||||||||||||||||||||||||||||||
| Net Asset Value, End of Year | $9.82 | $10.86 | $10.74 | $10.58 | $10.11 | ||||||||||||||||||||||||||
|
| ||||||||||||||||||||||||||||||
| Total Return(c) | (7.48 | )% | 2.73 | % | 2.74 | % | 5.56 | % | 1.10 | % | |||||||||||||||||||||
| Net Assets, End of Year (000’s) | $1,290 | $2,723 | $4,156 | $2,397 | $121 | ||||||||||||||||||||||||||
| Ratios to Average Net Assets | |||||||||||||||||||||||||||||||
Gross Expense | 2.89 | % | 3.04 | % | 3.30 | % | 3.98 | % | 4.66 | %(d)(e) | |||||||||||||||||||||
Net Expenses(f)(g) | 2.46 | % | 2.68 | % | 2.71 | % | 2.84 | % | 2.89 | %(d)(e) | |||||||||||||||||||||
Net Investment Income (Loss) | (0.44 | )% | (0.52 | )% | (0.33 | )% | 0.00 | %(h) | 0.88 | %(d) | |||||||||||||||||||||
| Portfolio Turnover Rate | 387 | % | 434 | % | 403 | % | 367 | % | 8 | % | |||||||||||||||||||||
CLASS I
| Year Ended
| Year Ended
| Year Ended
| Year Ended
| For the Period
| ||||||||||||||||||||||||||
| Net Asset Value, Beginning of Year | $10.88 | $10.74 | $10.56 | $10.08 | $10.00 | ||||||||||||||||||||||||||
| Income (Loss) From Operations: | |||||||||||||||||||||||||||||||
Net Investment Income (Loss)(a) | (0.02 | ) | (0.03 | ) | 0.00 | (b) | 0.03 | 0.06 | |||||||||||||||||||||||
Net Realized and Unrealized Gain (Loss) on Investments and Foreign Currency | (0.76 | ) | 0.34 | 0.32 | 0.56 | 0.05 | |||||||||||||||||||||||||
|
| ||||||||||||||||||||||||||||||
| Total Income (Loss) From Operations | (0.78 | ) | 0.31 | 0.32 | 0.59 | 0.11 | |||||||||||||||||||||||||
|
| ||||||||||||||||||||||||||||||
| Less Distributions From: | |||||||||||||||||||||||||||||||
Net Investment Income | (0.24 | ) | — | (0.01 | ) | (0.05 | ) | (0.03 | ) | ||||||||||||||||||||||
Net Realized Gains | — | (0.17 | ) | (0.13 | ) | (0.06 | ) | — | |||||||||||||||||||||||
|
| ||||||||||||||||||||||||||||||
| Total Distributions | (0.24 | ) | (0.17 | ) | (0.14 | ) | (0.11 | ) | (0.03 | ) | |||||||||||||||||||||
|
| ||||||||||||||||||||||||||||||
| Net Asset Value, End of Year | $9.86 | $10.88 | $10.74 | $10.56 | $10.08 | ||||||||||||||||||||||||||
|
| ||||||||||||||||||||||||||||||
| Total Return(c) | (7.22 | )% | 2.91 | % | 3.01 | % | 5.91 | % | 1.10 | % | |||||||||||||||||||||
| Net Assets, End of Year (000’s) | $158,200 | $193,639 | $207,530 | $44,660 | $24,935 | ||||||||||||||||||||||||||
| Ratios to Average Net Assets | |||||||||||||||||||||||||||||||
Gross Expense | 2.64 | % | 2.78 | % | 2.95 | % | 3.77 | % | 4.33 | %(d)(e) | |||||||||||||||||||||
Net Expenses(f)(g) | 2.21 | % | 2.41 | % | 2.43 | % | 2.65 | % | 2.39 | %(d)(e) | |||||||||||||||||||||
Net Investment Income (Loss) | (0.16 | )% | (0.27 | )% | (0.04 | )% | 0.29 | % | 2.11 | %(d) | |||||||||||||||||||||
| Portfolio Turnover Rate | 387 | % | 434 | % | 403 | % | 367 | % | 8 | % | |||||||||||||||||||||
ANNUAL REPORT / April 30, 2016
| 90 | FINANCIAL HIGHLIGHTS (continued) |
| (a) | Per share numbers have been calculated using the average shares method. |
| (b) | Represents less than $0.005. |
| (c) | Based on net asset value, which does not reflect the sales charge or contingent deferred sales charge, if applicable. Total returns for periods of less than one year, if any, are not annualized. |
| (d) | Annualized for periods less than one year. |
| (e) | Ratio of expenses to average net assets was increased by 0.41% to include dividend and interest expenses related to securities sold short. |
| (f) | The investment advisor and other service providers waived or reimbursed a portion of their fees. |
| (g) | Expense ratio includes dividend and interest expense related to securities sold short. Excluding such dividend and interest expense, the ratio of expenses to average net assets for the years and the periods presented would be: |
| Class A | Class I | |||||||||
April 30, 2016 | 2.15% | 1.90% | ||||||||
April 30, 2015 | 2.19% | 1.95% | ||||||||
April 30, 2014 | 2.23% | 1.98% | ||||||||
April 30, 2013 | 2.24% | 1.98% | ||||||||
April 30, 2012 | 2.48% | 1.98% | ||||||||
| (h) | Represents less than 0.005%. |
| * | Commencement of operations. |
See Notes which are an integral part of the Financial Statements
April 30, 2016 / ANNUAL REPORT
| FINANCIAL HIGHLIGHTS (continued) | 91 |
For a share outstanding throughout each period.
| WILMINGTON MULTI-MANAGER REAL ASSET FUND† |
| CLASS A | Year Ended April 30, 2016 | Year Ended April 30, 2015 | Year Ended April 30, 2014 | Year Ended April 30, 2013 | For the Period April 30, | Year Ended June 30, 2011 | ||||||||||||||||||||||||||||||||||
| Net Asset Value, Beginning of Year | $14.77 | $14.81 | $15.55 | $14.28 | $14.00 | $12.10 | ||||||||||||||||||||||||||||||||||
| Income (Loss) From Operations: | ||||||||||||||||||||||||||||||||||||||||
Net Investment Income (Loss)(a) | 0.21 | 0.13 | 0.10 | 0.18 | (0.21 | ) | 0.63 | |||||||||||||||||||||||||||||||||
Net Realized and Unrealized Gain (Loss) on Investments and Foreign Currency | (0.68 | ) | 0.04 | (0.65 | ) | 1.28 | 0.50 | 1.91 | ||||||||||||||||||||||||||||||||
|
| |||||||||||||||||||||||||||||||||||||||
| Total Income (Loss) From Operations | (0.47 | ) | 0.17 | (0.55 | ) | 1.46 | 0.29 | 2.54 | ||||||||||||||||||||||||||||||||
|
| |||||||||||||||||||||||||||||||||||||||
| Less Distributions From: | ||||||||||||||||||||||||||||||||||||||||
Net Investment Income | (0.67 | ) | (0.21 | ) | (0.19 | ) | (0.19 | ) | (0.01 | ) | (0.64 | ) | ||||||||||||||||||||||||||||
|
| |||||||||||||||||||||||||||||||||||||||
Net Realized Gains | — | — | — | — | — | — | ||||||||||||||||||||||||||||||||||
|
| |||||||||||||||||||||||||||||||||||||||
| Total Distributions | (0.67 | ) | (0.21 | ) | (0.19 | ) | (0.19 | ) | (0.01 | ) | (0.64 | ) | ||||||||||||||||||||||||||||
|
| |||||||||||||||||||||||||||||||||||||||
| Net Asset Value, End of Year | $13.63 | $14.77 | $14.81 | $15.55 | $14.28 | $14.00 | ||||||||||||||||||||||||||||||||||
|
| |||||||||||||||||||||||||||||||||||||||
| Total Return(b) | (3.09 | )% | 1.14 | % | (3.46 | )% | 10.33 | % | 2.04 | % | 21.45 | % | ||||||||||||||||||||||||||||
| Net Assets, End of Year (000’s) | $1,762 | $2,242 | $2,606 | $6,337 | $7,038 | $13,773 | ||||||||||||||||||||||||||||||||||
| Ratios to Average Net Assets | ||||||||||||||||||||||||||||||||||||||||
Gross Expense | 1.48 | % | 1.49 | % | 1.54 | % | 1.55 | % | 1.33 | %(c) | 1.25 | % | ||||||||||||||||||||||||||||
Net Expenses(d) | 1.23 | % | 1.23 | % | 1.28 | % | 1.27 | % | 1.28 | %(c) | 1.25 | % | ||||||||||||||||||||||||||||
Net Investment Income (Loss) | 1.53 | % | 0.89 | % | 0.72 | % | 1.13 | % | (1.86 | )%(c) | 4.64 | % | ||||||||||||||||||||||||||||
Portfolio Turnover Rate
|
| 418
| %
|
| 242
| %
|
| 149
| %
|
| 131
| %
|
| 180
| %
|
| 199
| %
| ||||||||||||||||||||||
| CLASS I | Year Ended April 30, 2016 | Year Ended April 30, 2015 | Year Ended April 30, 2014 | Year Ended April 30, 2013 | For the Period through April 30, | Year Ended June 30, 2011 | ||||||||||||||||||||||||||||||||||
| Net Asset Value, Beginning of Year | $14.86 | $14.88 | $15.61 | $14.33 | $14.02 | $12.11 | ||||||||||||||||||||||||||||||||||
| Income (Loss) From Operations: | ||||||||||||||||||||||||||||||||||||||||
Net Investment Income (Loss)(a) | 0.24 | 0.17 | 0.13 | 0.20 | (0.09 | ) | 0.65 | |||||||||||||||||||||||||||||||||
Net Realized and Unrealized Gain (Loss) on Investments and Foreign Currency | (0.67 | ) | 0.03 | (0.64 | ) | 1.30 | 0.41 | 1.94 | ||||||||||||||||||||||||||||||||
|
| |||||||||||||||||||||||||||||||||||||||
| Total Income (Loss) From Operations | (0.43 | ) | 0.20 | (0.51 | ) | 1.50 | 0.32 | 2.59 | ||||||||||||||||||||||||||||||||
|
| |||||||||||||||||||||||||||||||||||||||
| Less Distributions From: | ||||||||||||||||||||||||||||||||||||||||
Net Investment Income | (0.70 | ) | (0.22 | ) | (0.22 | ) | (0.22 | ) | (0.01 | ) | (0.68 | ) | ||||||||||||||||||||||||||||
|
| |||||||||||||||||||||||||||||||||||||||
| Total Distributions | (0.70 | ) | (0.22 | ) | (0.22 | ) | (0.22 | ) | (0.01 | ) | (0.68 | ) | ||||||||||||||||||||||||||||
|
| |||||||||||||||||||||||||||||||||||||||
| Net Asset Value, End of Year | $13.73 | $14.86 | $14.88 | $15.61 | $14.33 | $14.02 | ||||||||||||||||||||||||||||||||||
|
| |||||||||||||||||||||||||||||||||||||||
| Total Return(b) | (2.89 | )% | 1.40 | % | (3.20 | )% | 10.58 | % | 2.31 | % | 21.70 | % | ||||||||||||||||||||||||||||
| Net Assets, End of Year (000’s) | $453,171 | $463,375 | $452,913 | $440,999 | $344,650 | $252,497 | ||||||||||||||||||||||||||||||||||
| Ratios to Average Net Assets | ||||||||||||||||||||||||||||||||||||||||
Gross Expense | 1.23 | % | 1.24 | % | 1.29 | % | 1.31 | % | 1.08 | %(c) | 1.00 | % | ||||||||||||||||||||||||||||
Net Expenses(d) | 0.98 | % | 0.98 | % | 1.03 | % | 1.02 | % | 1.02 | %(c) | 1.00 | % | ||||||||||||||||||||||||||||
Net Investment Income (Loss) | 1.75 | % | 1.13 | % | 0.93 | % | 1.39 | % | (0.74 | )%(c) | 4.82 | % | ||||||||||||||||||||||||||||
| Portfolio Turnover Rate | 418 | % | 242 | % | 149 | % | 131 | % | 180 | % | 199 | % | ||||||||||||||||||||||||||||
| (a) | Per share numbers have been calculated using the average shares method. |
| (b) | Based on net asset value, which does not reflect the sales charge or contingent deferred sales charge, if applicable. Total returns for periods of less than one year, if any, are not annualized. |
| (c) | Annualized for periods less than one year. |
| (d) | The investment advisor and other service providers waived or reimbursed a portion of their fees. |
| † | Effective March 9, 2012, the Fund acquired all of the assets and liabilities of the Wilmington Multi-Manager Real Asset Fund, a series of WT Mutual Fund (the ”WT Fund”). The financial highlights for the periods prior to that date reflect the performance of the WT Fund. |
| * | Year end changed from June 30 to April 30. |
See Notes which are an integral part of the Financial Statements
ANNUAL REPORT / April 30, 2016
| 92 | FINANCIAL HIGHLIGHTS (continued) |
For a share outstanding throughout each period.
| WILMINGTON STRATEGIC ALLOCATION CONSERVATIVE FUND† |
| CLASS A | Year Ended April 30, 2016 | Year Ended April 30, 2015 | Year Ended April 30, 2014 | Year Ended April 30, 2013 | For the Period April 30, | Year Ended June 30, 2011 | ||||||||||||||||||||||||||
| Net Asset Value, Beginning of Year | $10.97 | $10.95 | $11.03 | $10.61 | $10.60 | $9.66 | ||||||||||||||||||||||||||
| Income (Loss) From Operations: | ||||||||||||||||||||||||||||||||
Net Investment Income (Loss)(a) | 0.12 | 0.09 | 0.12 | 0.18 | 0.17 | 0.26 | ||||||||||||||||||||||||||
Net Realized and Unrealized Gain (Loss) on Investments | (0.29 | ) | 0.27 | 0.05 | 0.45 | 0.05 | 0.95 | |||||||||||||||||||||||||
| Total Income (Loss) From Operations | (0.17 | ) | 0.36 | 0.17 | 0.63 | 0.22 | 1.21 | |||||||||||||||||||||||||
| Less Distributions From: | ||||||||||||||||||||||||||||||||
Net Investment Income | (0.14 | ) | (0.12 | ) | (0.17 | ) | (0.21 | ) | (0.21 | ) | (0.27 | ) | ||||||||||||||||||||
Net Realized Gains | (0.19 | ) | (0.22 | ) | (0.08 | ) | — | — | — | |||||||||||||||||||||||
| Total Distributions | (0.33 | ) | (0.34 | ) | (0.25 | ) | (0.21 | ) | (0.21 | ) | (0.27 | ) | ||||||||||||||||||||
| Net Asset Value, End of Year | $10.47 | $10.97 | $10.95 | $11.03 | $10.61 | $10.60 | ||||||||||||||||||||||||||
| Total Return(b) | (1.50 | )% | 3.28 | % | 1.60 | % | 5.97 | % | 2.15 | % | 12.58 | % | ||||||||||||||||||||
| Net Assets, End of Year (000’s) | $3,197 | $3,615 | $4,608 | $6,016 | $7,003 | $8,003 | ||||||||||||||||||||||||||
| Ratios to Average Net Assets | ||||||||||||||||||||||||||||||||
Gross Expense(c) | 1.48 | % | 1.44 | % | 1.41 | % | 1.35 | % | 0.77 | %(d) | 0.60 | % | ||||||||||||||||||||
Net Expenses(c)(e) | 0.78 | % | 0.85 | % | 0.75 | % | 0.72 | % | 0.63 | %(d) | 0.60 | % | ||||||||||||||||||||
Net Investment Income (Loss) | 1.13 | % | 0.83 | % | 1.10 | % | 1.71 | % | 1.95 | %(d) | 2.54 | % | ||||||||||||||||||||
Portfolio Turnover Rate
|
| 33
| %
|
| 24
| %
|
| 33
| %
|
| 29
| %
|
| 37
| %
|
| 26
| %
| ||||||||||||||
CLASS I | Year Ended April 30, 2016 | Year Ended April 30, 2015 | Year Ended April 30, 2014 | Year Ended April 30, 2013 | For the Period April 30, | Year Ended June 30, 2011 | ||||||||||||||||||||||||||
| Net Asset Value, Beginning of Year | $11.00 | $10.97 | $11.05 | $10.64 | $10.62 | $9.67 | ||||||||||||||||||||||||||
| Income (Loss) From Operations: | ||||||||||||||||||||||||||||||||
Net Investment Income (Loss)(a) | 0.15 | 0.12 | 0.15 | 0.21 | 0.19 | 0.29 | ||||||||||||||||||||||||||
Net Realized and Unrealized Gain (Loss) on Investments | (0.29 | ) | 0.28 | 0.05 | 0.43 | 0.06 | 0.95 | |||||||||||||||||||||||||
| Total Income (Loss) From Operations | (0.14 | ) | 0.40 | 0.20 | 0.64 | 0.25 | 1.24 | |||||||||||||||||||||||||
| Less Distributions From: | ||||||||||||||||||||||||||||||||
Net Investment Income | (0.17 | ) | (0.15 | ) | (0.20 | ) | (0.23 | ) | (0.23 | ) | (0.29 | ) | ||||||||||||||||||||
Net Realized Gains | (0.19 | ) | (0.22 | ) | (0.08 | ) | — | — | — | |||||||||||||||||||||||
| Total Distributions | (0.36 | ) | (0.37 | ) | (0.28 | ) | (0.23 | ) | (0.23 | ) | (0.29 | ) | ||||||||||||||||||||
| Net Asset Value, End of Year | $10.50 | $11.00 | $10.97 | $11.05 | $10.64 | $10.62 | ||||||||||||||||||||||||||
| Total Return(b) | (1.24 | )% | 3.63 | % | 1.85 | % | 6.13 | % | 2.44 | % | 12.96 | % | ||||||||||||||||||||
| Net Assets, End of Year (000’s) | $31,347 | $34,619 | $37,653 | $41,918 | $45,299 | $55,226 | ||||||||||||||||||||||||||
| Ratios to Average Net Assets | ||||||||||||||||||||||||||||||||
Gross Expense(c) | 1.23 | % | 1.19 | % | 1.16 | % | 1.10 | % | 0.52 | %(d) | 0.35 | % | ||||||||||||||||||||
Net Expenses(c)(e) | 0.53 | % | 0.60 | % | 0.50 | % | 0.47 | % | 0.38 | %(d) | 0.35 | % | ||||||||||||||||||||
Net Investment Income (Loss) | 1.38 | % | 1.07 | % | 1.34 | % | 1.95 | % | 2.20 | %(d) | 2.81 | % | ||||||||||||||||||||
| Portfolio Turnover Rate | 33 | % | 24 | % | 33 | % | 29 | % | 37 | % | 26 | % | ||||||||||||||||||||
| (a) | Per share numbers have been calculated using the average shares method. |
| (b) | Based on net asset value, which does not reflect the sales charge or contingent deferred sales charge, if applicable. Total returns for periods of less than one year, if any, are not annualized. |
| (c) | The Fund invests in other underlying funds and indirectly bears its proportionate share of fees and expenses incurred by the underlying funds in which the Fund is invested. This ratio does not include these indirect fees and expenses. |
| (d) | Annualized for periods less than one year. |
| (e) | The investment advisor and other service providers waived or reimbursed a portion of their fees. |
| † | Effective March 9, 2012, the Fund acquired all of the assets and liabilities of the Wilmington Conservative Asset Allocation Fund, a series of WT Mutual Fund (the “WT Fund”). The financial highlights for the periods prior to that date reflect the performance of the WT Fund. |
| * | Year end changed from June 30 to April 30. |
See Notes which are an integral part of the Financial Statements
April 30, 2016 / ANNUAL REPORT
| FINANCIAL HIGHLIGHTS (continued) | 93 |
For a share outstanding throughout each year ended April 30, unless otherwise noted:
| WILMINGTON STRATEGIC ALLOCATION MODERATE FUND |
| CLASS A | Year Ended April 30, 2016 | Year Ended April 30, 2015 | Year Ended April 30, 2014 | Year Ended April 30, 2013 | Year Ended April 30, 2012 | ||||||||||||||||||||||
| Net Asset Value, Beginning of Year | $10.98 | $10.47 | $9.86 | $9.26 | $9.70 | ||||||||||||||||||||||
| Income (Loss) From Operations: | |||||||||||||||||||||||||||
Net Investment Income (Loss)(a) | 0.12 | 0.10 | 0.10 | 0.13 | 0.11 | ||||||||||||||||||||||
Net Realized and Unrealized Gain (Loss) on Investments | (0.53 | ) | 0.53 | 0.62 | 0.61 | (0.42 | ) | ||||||||||||||||||||
| Total Income (Loss) From Operations | (0.41 | ) | 0.63 | 0.72 | 0.74 | (0.31 | ) | ||||||||||||||||||||
| Less Distributions From: | |||||||||||||||||||||||||||
Net Investment Income | (0.15 | ) | (0.12 | ) | (0.11 | ) | (0.14 | ) | (0.12 | ) | |||||||||||||||||
Net Realized Gains | (0.02 | ) | — | — | — | (0.01 | ) | ||||||||||||||||||||
| Total Distributions | (0.17 | ) | (0.12 | ) | (0.11 | ) | (0.14 | ) | (0.13 | ) | |||||||||||||||||
| Net Asset Value, End of Year | $10.40 | $10.98 | $10.47 | $9.86 | $9.26 | ||||||||||||||||||||||
| Total Return(b) | (3.70 | )% | 6.09 | % | 7.34 | % | 8.12 | % | (3.13 | )% | |||||||||||||||||
| Net Assets, End of Year (000’s) | $44,607 | $52,860 | $57,317 | $60,640 | $65,285 | ||||||||||||||||||||||
| Ratios to Average Net Assets | |||||||||||||||||||||||||||
Gross Expense(c) | 1.52 | % | 1.46 | % | 1.45 | % | 1.45 | % | 1.64 | % | |||||||||||||||||
Net Expenses(c)(d) | 0.74 | % | 0.80 | % | 0.84 | % | 0.84 | % | 0.79 | % | |||||||||||||||||
Net Investment Income (Loss) | 1.14 | % | 0.90 | % | 0.94 | % | 1.36 | % | 1.26 | % | |||||||||||||||||
Portfolio Turnover Rate
|
| 52
| %
|
| 23
| %
|
| 54
| %
|
| 32
| %
|
| 41
| %
| ||||||||||||
| CLASS I | Year Ended April 30, 2016 | Year Ended April 30, 2015 | Year Ended April 30, 2014 | Year Ended April 30, 2013 | Year Ended April 30, 2012 | ||||||||||||||||||||||
| Net Asset Value, Beginning of Year | $10.98 | $10.47 | $9.84 | $9.25 | $9.70 | ||||||||||||||||||||||
| Income (Loss) From Operations: | |||||||||||||||||||||||||||
Net Investment Income (Loss)(a) | 0.15 | 0.12 | 0.13 | 0.15 | 0.14 | ||||||||||||||||||||||
Net Realized and Unrealized Gain (Loss) on Investments | (0.53 | ) | 0.54 | 0.63 | 0.61 | (0.43 | ) | ||||||||||||||||||||
| Total Income (Loss) From Operations | (0.38 | ) | 0.66 | 0.76 | 0.76 | (0.29 | ) | ||||||||||||||||||||
| Less Distributions From: | |||||||||||||||||||||||||||
Net Investment Income | (0.17 | ) | (0.15 | ) | (0.13 | ) | (0.17 | ) | (0.15 | ) | |||||||||||||||||
Net Realized Gains | (0.02 | ) | — | — | — | (0.01 | ) | ||||||||||||||||||||
| Total Distributions | (0.19 | ) | (0.15 | ) | (0.13 | ) | (0.17 | ) | (0.16 | ) | |||||||||||||||||
| Net Asset Value, End of Year | $10.41 | $10.98 | $10.47 | $9.84 | $9.25 | ||||||||||||||||||||||
| Total Return(b) | (3.42 | )% | 6.35 | % | 7.76 | % | 8.29 | % | (2.87 | )% | |||||||||||||||||
| Net Assets, End of Year (000’s) | $1,129 | $1,323 | $971 | $2,753 | $3,108 | ||||||||||||||||||||||
| Ratios to Average Net Assets | |||||||||||||||||||||||||||
Gross Expense(c) | 1.27 | % | 1.21 | % | 1.19 | % | 1.20 | % | 1.39 | % | |||||||||||||||||
Net Expenses(c)(d) | 0.49 | % | 0.55 | % | 0.59 | % | 0.59 | % | 0.51 | % | |||||||||||||||||
Net Investment Income (Loss) | 1.39 | % | 1.16 | % | 1.33 | % | 1.59 | % | 1.53 | % | |||||||||||||||||
| Portfolio Turnover Rate | 52 | % | 23 | % | 54 | % | 32 | % | 41 | % | |||||||||||||||||
| (a) | Per share numbers have been calculated using the average shares method. |
| (b) | Based on net asset value, which does not reflect the sales charge or contingent deferred sales charge, if applicable. Total returns for periods of less than one year, if any, are not annualized. |
| (c) | The Fund invests in other underlying funds and indirectly bears its proportionate share of fees and expenses incurred by the underlying funds in which the Fund is invested. This ratio does not include these indirect fees and expenses. |
| (d) | The investment advisor and other service providers waived or reimbursed a portion of their fees. |
See Notes which are an integral part of the Financial Statements
ANNUAL REPORT / April 30, 2016
| 94 | FINANCIAL HIGHLIGHTS (concluded) |
For a share outstanding throughout each period.
| WILMINGTON STRATEGIC ALLOCATION AGGRESSIVE FUND† |
| CLASS A | Year Ended April 30, 2016 | Year Ended April 30, 2015 | Year Ended April 30, 2014 | Year Ended April 30, 2013 | For the Period July 1, 2011 April 30, 2012* | Year Ended June 30, 2011 | ||||||||||||||||||||||||||||||||||
| Net Asset Value, Beginning of Year | $12.16 | $11.35 | $10.21 | $9.20 | $9.33 | $7.49 | ||||||||||||||||||||||||||||||||||
| Income (Loss) From Operations: | ||||||||||||||||||||||||||||||||||||||||
Net Investment Income (Loss)(a) | 0.06 | 0.02 | 0.04 | 0.10 | 0.05 | 0.14 | ||||||||||||||||||||||||||||||||||
Net Realized and Unrealized Gain (Loss) on Investments | (0.70 | ) | 0.87 | 1.17 | 1.02 | (0.13 | ) | 1.85 | ||||||||||||||||||||||||||||||||
|
| |||||||||||||||||||||||||||||||||||||||
| Total Income (Loss) From Operations | (0.64 | ) | 0.89 | 1.21 | 1.12 | (0.08 | ) | 1.99 | ||||||||||||||||||||||||||||||||
|
| |||||||||||||||||||||||||||||||||||||||
| Less Distributions From: | ||||||||||||||||||||||||||||||||||||||||
Net Investment Income | (0.10 | ) | (0.08 | ) | (0.07 | ) | (0.11 | ) | (0.05 | ) | (0.15 | ) | ||||||||||||||||||||||||||||
Net Realized Gains | (0.31 | ) | — | — | — | — | — | |||||||||||||||||||||||||||||||||
|
| |||||||||||||||||||||||||||||||||||||||
| Total Distributions | (0.41 | ) | (0.08 | ) | (0.07 | ) | (0.11 | ) | (0.05 | ) | (0.15 | ) | ||||||||||||||||||||||||||||
|
| |||||||||||||||||||||||||||||||||||||||
| Net Asset Value, End of Year | $11.11 | $12.16 | $11.35 | $10.21 | $9.20 | $9.33 | ||||||||||||||||||||||||||||||||||
|
| |||||||||||||||||||||||||||||||||||||||
| Total Return(b) | (5.32 | )% | 7.89 | % | 11.84 | % | 12.26 | % | (0.75 | )% | 26.66 | % | ||||||||||||||||||||||||||||
| Net Assets, End of Year (000’s) | $2,439 | $2,731 | $2,974 | $3,205 | $3,074 | $3,502 | ||||||||||||||||||||||||||||||||||
| Ratios to Average Net Assets | ||||||||||||||||||||||||||||||||||||||||
Gross Expense(c) | 1.59 | % | 1.48 | % | 1.50 | % | 1.46 | % | 0.88 | %(d) | 0.67 | % | ||||||||||||||||||||||||||||
Net Expenses(c)(e) | 0.87 | % | 0.97 | % | 0.95 | % | 0.87 | % | 0.73 | %(d) | 0.67 | % | ||||||||||||||||||||||||||||
Net Investment Income (Loss) | 0.48 | % | 0.19 | % | 0.34 | % | 1.10 | % | 0.75 | %(d) | 1.64 | % | ||||||||||||||||||||||||||||
Portfolio Turnover Rate
|
| 51
| %
|
| 20
| %
|
| 72
| %
|
| 43
| %
|
| 17
| %
|
| 34
| %
| ||||||||||||||||||||||
| CLASS I | Year Ended April 30, 2016 | Year Ended April 30, 2015 | Year Ended April 30, 2014 | Year Ended April 30, 2013 | For the Period April 30, 2012* | Year Ended June 30, 2011 | ||||||||||||||||||||||||||||||||||
| Net Asset Value, Beginning of Year | $12.21 | �� | $11.39 | $10.24 | $9.22 | $9.35 | $7.51 | |||||||||||||||||||||||||||||||||
| Income (Loss) From Operations: | ||||||||||||||||||||||||||||||||||||||||
Net Investment Income (Loss)(a) | 0.08 | 0.05 | 0.06 | 0.13 | 0.07 | 0.17 | ||||||||||||||||||||||||||||||||||
Net Realized and Unrealized Gain (Loss) on Investments | (0.69 | ) | 0.87 | 1.18 | 1.02 | (0.13 | ) | 1.84 | ||||||||||||||||||||||||||||||||
|
| |||||||||||||||||||||||||||||||||||||||
| Total Income (Loss) From Operations | (0.61 | ) | 0.92 | 1.24 | 1.15 | (0.06 | ) | 2.01 | ||||||||||||||||||||||||||||||||
|
| |||||||||||||||||||||||||||||||||||||||
| Less Distributions From: | ||||||||||||||||||||||||||||||||||||||||
Net Investment Income | (0.11 | ) | (0.10 | ) | (0.09 | ) | (0.13 | ) | (0.07 | ) | (0.17 | ) | ||||||||||||||||||||||||||||
Net Realized Gains | (0.31 | ) | — | — | — | — | — | |||||||||||||||||||||||||||||||||
|
| |||||||||||||||||||||||||||||||||||||||
| Total Distributions | (0.42 | ) | (0.10 | ) | (0.09 | ) | (0.13 | ) | (0.07 | ) | (0.17 | ) | ||||||||||||||||||||||||||||
|
| |||||||||||||||||||||||||||||||||||||||
| Net Asset Value, End of Year | $11.18 | $12.21 | $11.39 | $10.24 | $9.22 | $9.35 | ||||||||||||||||||||||||||||||||||
|
| |||||||||||||||||||||||||||||||||||||||
| Total Return(b) | (5.01 | )% | 8.08 | % | 12.11 | % | 12.62 | % | (0.62 | )% | 26.91 | % | ||||||||||||||||||||||||||||
| Net Assets, End of Year (000’s) | $25,698 | $30,462 | $35,392 | $35,826 | $39,257 | $51,887 | ||||||||||||||||||||||||||||||||||
| Ratios to Average Net Assets | ||||||||||||||||||||||||||||||||||||||||
Gross Expense(c) | 1.34 | % | 1.23 | % | 1.25 | % | 1.21 | % | 0.61 | %(d) | 0.42 | % | ||||||||||||||||||||||||||||
Net Expenses(c)(e) | 0.62 | % | 0.72 | % | 0.70 | % | 0.62 | % | 0.48 | %(d) | 0.42 | % | ||||||||||||||||||||||||||||
Net Investment Income (Loss) | 0.74 | % | 0.46 | % | 0.58 | % | 1.38 | % | 1.02 | %(d) | 1.89 | % | ||||||||||||||||||||||||||||
| Portfolio Turnover Rate | 51 | % | 20 | % | 72 | % | 43 | % | 17 | % | 34 | % | ||||||||||||||||||||||||||||
| (a) | Per share numbers have been calculated using the average shares method. |
| (b) | Based on net asset value, which does not reflect the sales charge or contingent deferred sales charge, if applicable. Total returns for periods of less than one year, if any, are not annualized. |
| (c) | The Fund invests in other underlying funds and indirectly bears its proportionate share of fees and expenses incurred by the underlying funds in which the Fund is invested. This ratio does not include these indirect fees and expenses. |
| (d) | Annualized for periods less than one year. |
| (e) | The investment advisor and other service providers waived or reimbursed a portion of their fees. |
| † | Effective March 9, 2012, the Fund acquired all of the assets and liabilities of the Wilmington Aggressive Asset Allocation Fund, a series of WT Mutual Fund (the “WT Fund”). The financial highlights for the periods prior to that date reflect the performance of the WT Fund. |
| * | Year end changed from June 30 to April 30. |
See Notes which are an integral part of the Financial Statements
April 30, 2016 / ANNUAL REPORT
| NOTES TO FINANCIAL STATEMENTS | 95 |
Wilmington Funds
April 30, 2016
| 1. | ORGANIZATION |
Wilmington Funds (the “Trust”) is registered under the Investment Company Act of 1940, as amended (the “Act”), as an open-end management investment company. The Trust consists of 16 portfolios, 6 of which are presented herein (individually referred to as a “Fund” or collectively as the “Funds”). The remaining 10 funds are presented in separate reports.
| Fund | Investment Goal | |
Wilmington Multi-Manager International Fund (“International Fund”)(d) | The Fund seeks to provide long-term capital appreciation primarily through a diversified portfolio of non-U.S. equity securities.
| |
Wilmington Multi-Manager Alternatives Fund (“Alternatives Fund”)(d) | The Fund seeks to achieve long-term growth of capital through consistent returns from investments that have a low correlation to traditional asset classes.
| |
Wilmington Multi-Manager Real Asset Fund (“Real Asset Fund”)(d) | The Fund seeks to achieve long-term preservation of capital with current income.
| |
Wilmington Strategic Allocation Conservative Fund (“Strategic Allocation Conservative Fund”)(d) | The Fund seeks a high level of total return consistent with a conservative level of risk relative to other Wilmington Strategic Allocation Funds.
| |
Wilmington Strategic Allocation Moderate Fund (“Strategic Allocation Moderate Fund”)(d) | The Fund seeks a high level of total return consistent with a moderate level of risk relative to the other Wilmington Strategic Allocation Funds.
| |
Wilmington Strategic Allocation Aggressive Fund (“Strategic Allocation Aggressive Fund”)(d) | The Fund seeks a high level of total return consistent with an aggressive level of risk relative to other Wilmington Strategic Allocation Funds.
| |
| (d) | Diversified |
As of April 30, 2016, the Strategic Allocation Conservative Fund’s investment in the Intermediate-Term Bond Fund was 30.4% of the Fund’s total net assets. The Strategic Allocation Aggressive Fund’s investment in the Multi-Manager International Fund was 25.2% of the Fund’s total net assets. The financial statements of the Intermediate-Term Bond Fund, including the Portfolio of Investments, should be read in conjunction with the Strategic Allocation Conservative Fund’s financial statements. The financial statements of the Intermediate-Term Bond Fund are available, without charge, upon request by calling 1-800-836-2211, or on the SEC’s website at http://www.sec.gov.
The Trust offers 6 classes of shares: Class A, Service Class, Select Class, Administrative Class, Class I and Institutional Class. Service Class, Select Class, Administrative Class and Institutional Class are not available for the Funds. All shares of the Trust have equal rights with respect to voting, except on class-specific matters.
The assets of each portfolio are segregated and a shareholder’s interest is limited to the portfolio in which shares are held.
In the normal course of business, the Funds may enter into contracts that provide general indemnifications. The Funds’ maximum exposure under these arrangements is dependent on claims that may be made against the Funds in the future, and, therefore, cannot be estimated; however, based on experience, the risk of material loss from such claims is considered remote.
| 2. | SUMMARY OF SIGNIFICANT ACCOUNTING POLICIES |
The following is a summary of significant accounting policies consistently followed by the Funds in the preparation of their financial statements. These policies are in conformity with U.S. generally accepted accounting principles (“GAAP”). The Trust is an investment company and follows accounting and reporting guidance under Financial Accounting Standards Board (“FASB”) Accounting Standards Codification (“ASC”) Topic 946, “Financial Services - Investment Companies.” The preparation of financial statements in conformity with GAAP requires management to make estimates and assumptions that affect the amounts of assets, liabilities, expenses and revenues reported in the financial statements. Actual results could differ from those estimated.
Investment Valuation – Fair value of the Funds’ portfolio securities are determined as follows:
| • | for equity securities, according to the last sale price or official closing price reported in the market in which they are primarily traded (either a national securities exchange or the over-the-counter market), if available; |
| • | in the absence of recorded sales for equity securities, according to the mean between the last closing bid and asked prices; |
| • | futures contracts and options are generally valued at market values established by the exchanges on which they are traded at the close of trading on such exchanges. Options traded in the over-the-counter market are generally valued according to the mean between the last bid and the last asked price for the option as provided by an investment dealer or other financial institution that deals in the option. The Board of Trustees (“Trustees”) may determine in good faith that another method of valuing such investments is necessary to appraise their fair value; |
| • | forward foreign currency contracts are valued at the mean between the last bid and asked prices; |
| • | investments in open-end regulated investment companies are valued at net asset value (“NAV”) |
| • | price information on listed securities, including underlying Exchange Traded Funds (“ETFs”) and Exchange Traded Notes (“ETNs”), is taken from the exchange where the security is primarily traded; |
ANNUAL REPORT / April 30, 2016
| 96 | NOTES TO FINANCIAL STATEMENTS (continued) |
| • | for fixed income securities, according to prices as furnished by an independent pricing service, except that fixed income securities with remaining maturities of less than 60 days at the time of purchase are valued at amortized cost, provided such amount approximates fair value; and |
| • | for all other securities at fair value as determined in accordance with procedures established by and under the general supervision of the Trustees. |
Trading in foreign securities may be completed at times which vary from the closing of the New York Stock Exchange (“NYSE”). In computing their NAV, the Funds value foreign securities using the latest closing price on the primary exchange on which they are traded immediately prior to the closing of the NYSE. Certain foreign currency exchange rates are generally determined at the latest rate prior to the closing of the NYSE. Foreign securities quoted in foreign currencies are translated into U.S. dollars at current rates. Events that affect these values and exchange rates may occur between the times at which they are determined and the closing of the NYSE. If such events materially affect the value of portfolio securities, these securities may be valued at their fair value as determined in good faith by the Trustees, although the actual calculation may be done by others. An event is considered material if there is both an affirmative expectation that the security’s value will change in response to the event and a reasonable basis for quantifying the resulting change in value.
The Trust follows the authoritative guidance (GAAP) for fair value measurements. The guidance establishes a framework for measuring fair value and a hierarchy for inputs used in measuring fair value that maximizes the use of observable inputs and minimizes the use of unobservable inputs by requiring that the most observable inputs be used when available. The guidance establishes three tiers of inputs that may be used to measure fair value. The three tiers of inputs are summarized at the end of each Fund’s Portfolio of Investments. The inputs or methodology used for valuing securities are not necessarily an indication of the risk associated with investing in those securities.
The Funds’ policy is to disclose transfers between levels based on valuations at the beginning of the reporting period. Each portfolio may hold securities which are periodically fair valued in accordance with the Funds’ fair value procedures. This may result in movements between Levels 1, 2 and 3 throughout the period. As of April 30, 2016, there were no transfers between Levels 1, 2 and 3 assets and liabilities, based on levels assigned to securities at the beginning of the period. This does not include transfers between Level 1 and Level 2 due to the International Fund, Alternatives Fund and the Real Asset Fund utilizing international fair value pricing during the period. Pursuant to the Funds’ fair value procedures noted previously, equity securities (including exchange traded securities and other open-end regulated investment companies) and exchange traded derivatives are generally categorized as Level 1 securities in the fair value hierarchy. Fixed income securities, non-exchange traded derivatives and money market instruments are generally categorized as Level 2 securities in the fair value hierarchy.
Investments for which there are no such quotations, or for which quotations do not appear reliable, are valued at fair value as determined in accordance with procedures established by and under the general supervision of the Trustees. These valuations are typically categorized as Level 2 or Level 3 securities in the fair value hierarchy.
Repurchase Agreements – Repurchase agreements are transactions in which a Fund buys a security from a dealer or bank and agrees to sell the security back at a mutually agreed upon time and price. The repurchase price exceeds the sale price, reflecting the Fund’s return on the transaction. It is each Fund’s policy to require the counterparty to a repurchase agreement to transfer to the Funds’ custodian or sub-custodian eligible securities or cash with a market value (after transaction costs) at least equal to the repurchase price to be paid under the repurchase agreement. The eligible securities are transferred to accounts with the custodian or sub-custodian in which the Funds hold a “securities entitlement” and exercise “control” as those terms are defined in the Uniform Commercial Code. The Funds have established procedures for monitoring the market value of the transferred securities and requiring the transfer of additional eligible securities if necessary to equal at least the repurchase price. These procedures also allow the counterparty to require securities to be transferred from the account to the extent that their market value exceeds the repurchase price or in exchange for other eligible securities of equivalent market value.
The insolvency of the counterparty or other failure to repurchase the securities may delay the disposition of the underlying securities or cause the Funds to receive less than the full repurchase price.
Repurchase agreements are entered into by the Funds under Master Repurchase Agreements (“MRA”) which permit the Funds, under certain circumstances including an event of default (such as bankruptcy or insolvency), to offset payables and/or receivables under the MRA with collateral held and/or posted to the counterparty and create one single net payment due to or from the Fund.
At April 30, 2016, the open repurchase agreements by counterparty which are subject to a MRA on a net payment basis are as follows:
| Fund/Counterparty | Repurchase Agreements |
Fair Value of | Cash Collateral Received(1) | Net Amount(2) | ||||||||||||
International Fund | ||||||||||||||||
BNP Paribas Securities Corp. | $ | 3,791,890 | $ | 3,791,890 | $ | — | $ | — | ||||||||
Citigroup Global Markets, Inc. | 3,791,890 | 3,791,890 | — | — | ||||||||||||
Daiwa Capital Markets America | 3,791,890 | 3,791,890 | — | — | ||||||||||||
HSBC Securities USA, Inc. | 3,791,890 | 3,791,890 | — | — | ||||||||||||
Nomura Securities International, Inc. | 3,791,890 | 3,791,890 | — | — | ||||||||||||
TD Securities (USA) LLC | 997,712 | 997,712 | — | — | ||||||||||||
|
|
|
|
|
|
|
| |||||||||
| $ | 19,957,162 | $ | 19,957,162 | $ | — | $ | — | |||||||||
|
|
|
|
|
|
|
| |||||||||
April 30, 2016 / ANNUAL REPORT
| NOTES TO FINANCIAL STATEMENTS (continued) | 97 |
| Fund/Counterparty | Repurchase Agreements |
Fair Value of | Cash Collateral Received(1) | Net Amount(2) | ||||||||||||
Real Asset Fund | ||||||||||||||||
BNP Paribas Securities Corp. | $ | 865,772 | $ | 865,772 | $ | — | $ | — | ||||||||
Citigroup Global Markets, Inc. | 865,772 | 865,772 | — | — | ||||||||||||
Daiwa Capital Markets America | 865,772 | 865,772 | — | — | ||||||||||||
HSBC Securities USA, Inc. | 865,772 | 865,772 | — | — | ||||||||||||
Nomura Securities International, Inc. | 865,772 | 865,772 | — | — | ||||||||||||
TD Securities (USA) LLC | 227,804 | 227,804 | — | — | ||||||||||||
|
|
|
|
|
|
|
| |||||||||
| $ | 4,556,664 | $ | 4,556,664 | $ | — | $ | — | |||||||||
|
|
|
|
|
|
|
| |||||||||
Strategic Allocation Moderate Fund | ||||||||||||||||
BNP Paribas Securities Corp. | 25,322 | 25,322 | — | — | ||||||||||||
Citigroup Global Markets, Inc. | 25,322 | 25,322 | — | — | ||||||||||||
Daiwa Capital Markets America | 25,322 | 25,322 | — | — | ||||||||||||
HSBC Securities USA, Inc. | 25,322 | 25,322 | — | — | ||||||||||||
Nomura Securities International, Inc. | 25,322 | 25,322 | — | — | ||||||||||||
RBC Capital Markets LLC | 6,665 | 6,665 | — | — | ||||||||||||
|
|
|
|
|
|
|
| |||||||||
| $ | 133,275 | $ | 133,275 | $ | — | $ | — | |||||||||
|
|
|
|
|
|
|
| |||||||||
(1)The amount of collateral reflected in the table does not include any over-collateralization received by the Fund.
(2)Net amount represents the net amount receivable due from the counterparty in the event of default.
Reverse Repurchase Agreements – Reverse repurchase agreements are repurchase agreements in which a Fund is the seller (rather than the buyer) of the security, and agrees to repurchase the security at an agreed upon time and price. A reverse repurchase agreement may be viewed as a type of borrowing by a Fund. Reverse repurchase agreements are subject to credit risks. In addition, reverse repurchase agreements create leverage risks because a Fund must repurchase the underlying security at a higher price, regardless of the market value of the security at the time of repurchase.
For the year ended April 30, 2016, the Real Asset Fund had reverse repurchase agreement activity as follows:
| Average Daily Balance* | Days Outstanding | Daily Weighted Average Interest Rate* | Interest Rate Range | |||||||
$6,347,250 | 7 | 1.00 | % | 1.00% – 1.00% | ||||||
*Average based on the number of days the Fund had reverse repurchase agreement outstanding. The interest rates shown are annualized.
Investment Income, Gains and Losses, Expenses and Distributions – Interest income and expenses are accrued daily. All premiums and discounts on fixed income securities are amortized/accreted for financial statement purposes. Gains and losses realized on principal payment of mortgage-backed securities (paydown gains and losses) are classified as part of investment income. Dividends and distributions to shareholders are recorded on the ex-dividend date. Non-cash dividends included in dividend income, if any, are recorded at fair value. Foreign dividends are recorded on the ex-dividend date or when the Funds are informed of the ex-dividend date. Investment transactions are accounted for on a trade date basis for financial reporting purposes. Realized gains and losses from investment transactions are recorded on an identified cost basis.
Expenses of the Trust, which are directly identifiable to a specific Fund, are applied to that Fund. Expenses which are not identifiable to a specific Fund are allocated in such a manner as deemed equitable, taking into consideration the nature and type of expense.
All Funds offer multiple classes of shares. Investment income, realized and unrealized gains and losses, and certain fund-level expenses are allocated to each class based on relative daily net assets, except that each class bears certain expenses unique to that class such as distribution and shareholder services fees. Distributions are declared separately for each class. No class has preferential distribution rights; differences in per share distributions rates are generally due to differences in class specific expenses. Distributions from net realized gains, if any, are declared and paid to shareholders annually. Distributions from net investment income are declared and paid quarterly.
Real Estate Investment Trusts – The Funds may invest in real estate investment trusts (“REITs”) that involve risks not associated with investing in stocks. Risks include declines in the value of real estate, general and economic conditions, changes in the value of the underlying property and defaults by borrowers. The value of assets in the real estate industry may go through cycles of relative underperformance and out performance in comparison to equity securities markets in general. Dividend income is recorded using management’s estimate of the income included in distributions received from REIT investments. The actual amounts of income, return of capital and capital gains are only determined by each REIT after its fiscal year-end and may differ from the estimated amount. Estimates of income are adjusted to the actual amounts when the amounts are determined.
ANNUAL REPORT / April 30, 2016
| 98 | NOTES TO FINANCIAL STATEMENTS (continued) |
Federal Taxes – It is the Funds’ policy to comply with the Subchapter M provision of the Internal Revenue Code of 1986, as amended (the “Code”), and to distribute to shareholders each year substantially all of their income. Accordingly, no provisions for Federal income tax or excise tax are necessary.
Withholding taxes and where appropriate, deferred withholding taxes, on foreign interest, dividends and capital gains have been provided for in accordance with the applicable country’s tax rules and rates.
The Funds recognize interest and penalties, if any, related to unrecognized tax benefits as income tax expense on the Statement of Operations. During the year ended April 30, 2016, the Funds did not incur any interest or penalties.
Warrants and Rights – Certain Funds hold warrants and rights acquired either through a direct purchase, including as part of private placement, or pursuant to corporate actions. Warrants and rights entitle the holder to buy a proportionate amount of common stock at a specific price and time through the expiration dates. Such warrants and rights are held as long positions by the Funds until exercised, sold or expired. Equity-linked warrants are purchased in order to own local exposure to certain countries in which the Funds are not locally registered. Warrants and rights are valued at fair value in accordance with the Trustees’ approved fair value procedures.
Foreign Currency Translation – The accounting records of the Funds are maintained in U.S. dollars. All assets and liabilities denominated in foreign currencies (“FCs”) are translated into U.S. dollars based on the rates of exchange of such currencies against U.S. dollars on the date of valuation. Purchases and sales of securities, income and expenses are translated at the rate of exchange quoted on the respective date that such transactions are recorded. The Funds do not isolate that portion of results of operations resulting from changes in foreign exchange rates on investments from fluctuations arising from changes in the net realized and unrealized gain or loss on investments.
Reported net realized foreign exchange gains or losses arise from sales of portfolio securities, sales and maturities of short-term securities, sales of FCs, currency gains or losses realized between the trade and settlement dates on securities transactions, the difference between the amounts of dividends, interest, and foreign withholding taxes recorded on the Funds’ books and the U.S. dollar equivalent of the amounts actually received or paid. Net unrealized foreign exchange gains and losses arise from changes in the value of assets and liabilities other than investments in securities at period end, resulting from changes in the exchange rate.
Restricted Securities – Restricted securities are securities that either (a) cannot be offered for public sale without first being registered, or being able to take advantage of an exemption from registration, under the Securities Act of 1933, as amended, or (b) are subject to contractual restrictions on public sales. In some cases, when a security cannot be offered for public sale without first being registered, the issuer of the restricted security has agreed to register such securities for resale, at the issuer’s expense, either upon demand by the Funds or in connection with another registered offering of the securities. Many such restricted securities may be resold in the secondary market in transactions exempt from registration. Restricted securities may be determined to be liquid under criteria established by the Trustees. A Fund will not incur any registration costs upon such resales. The Funds’ restricted securities are valued at the price provided by dealers in the secondary market or, if no market prices are available, at the fair value as determined in accordance with procedures established by and under the general supervision of the Trustees.
Securities Sold Short – Certain Funds may sell securities short. A short sale is a transaction in which the Fund sells a security it does not own in anticipation of a decline in market price. To sell a security short, the Fund must borrow the security. The Fund’s obligation to replace the security borrowed and sold short will be fully collateralized at all times by the proceeds from the short sale retained by the broker and by cash and securities deposited in a segregated account with the Fund’s custodian. If the price of the security sold short increases between the time of the short sale and the time the Fund replaces the borrowed security, the Fund will realize a loss, and if the price declines during the period, the Fund will realize a gain. Any realized gain will be decreased, and any realized loss increased, by the amount of transaction costs. The Funds are required to pay the lender any dividends declared on short positions. Such amounts are recorded on the ex-dividend date as dividends expense on securities sold short on the Statement of Operations.
In accordance with the terms of its prime brokerage agreement, the Funds may be charged a fee on borrowed securities. Such fees are calculated on a daily basis based upon the market value of each borrowed security and a variable rate that is dependent upon the availability of such security. The Funds are required to maintain margin cash balances at the prime broker sufficiently to satisfy their short sales positions on a daily basis. The Funds are charged interest expense at the Fed Funds open rate plus 50 basis points on the amount of any shortfall in the required cash margin. The Funds record these prime broker charges on a net basis as Prime Broker interest expense on securities sold short on the Statement of Operations.
As of April 30, 2016, the Alternatives Fund had borrowings of $3,849,198. Interest expense on securities sold short for the year ended April 30, 2016 totaled $10,256, and is included in the prime broker interest expense on the Statement of Operations.
April 30, 2016 / ANNUAL REPORT
| NOTES TO FINANCIAL STATEMENTS (continued) | 99 |
The Alternatives Fund had the following borrowings for the year ended April 30, 2016:
| Currency | Average Daily Balance* | Days Outstanding |
Daily Weighted | Interest Rate Range | ||||||||||||||
United States Dollar | USD | 1,167,075 | 341 | 0.71 | % | 0.55% – 0.88% | ||||||||||||
Australian Dollar | AUD | 206,814 | 48 | 2.75 | % | 2.75% – 2.75% | ||||||||||||
Canadian Dollar | CAD | 72,167 | 106 | 1.43 | % | 1.25% – 1.50% | ||||||||||||
Euro | EUR | 216,395 | 108 | 0.75 | % | 0.75% – 0.75% | ||||||||||||
Pound Sterling | GBP | 230,056 | 112 | 1.26 | % | 1.25% – 1.26% | ||||||||||||
Japanese Yen | JPY | 53,996,204 | 43 | 0.77 | % | 0.75% – 0.80% | ||||||||||||
Norwegian Krone | NOK | 820,130 | 33 | 1.82 | % | 1.70% – 1.96% | ||||||||||||
Swedish Krona | SEK | 258,378 | 112 | 0.75 | % | 0.75% – 0.75% | ||||||||||||
*Average based on the number of days the Fund had borrowings outstanding. The interest rates shown are annualized.
Lending of Portfolio Securities – The Trust has entered into an agreement with its custodian whereby the custodian may lend securities owned by the Funds to brokers, dealers and other financial organizations. Any increase or decrease in the fair value of securities loaned and any interest or dividends earned on those securities during the term of the loan would be for the account of the Fund. In exchange for lending securities under the terms of the agreement with their custodian, the Funds receive a lender’s fee. Fees earned by the Funds on securities lending are recorded as income. Loans of securities by the Funds are collateralized by cash, U.S. government securities or money market instruments that are maintained at all times in an amount at least equal to the current market value of the loaned securities plus a margin which varies depending on the type of securities owned. The custodian establishes and maintains the collateral in a segregated account. The Funds have the right under the lending agreement to recover the securities from the borrower on demand. The market value of the loaned securities is determined at the close of business of the Fund and any additional required collateral is delivered to the Fund on the next business day.
Investments purchased with cash collateral are presented on the portfolios of investments under the caption “Cash Collateral Invested for Securities on Loan.”
The Funds maintain the risk of any loss on the securities on loan as well as the potential loss on investments purchased with cash collateral received from securities lending.
Securities lending transactions are entered into by the Funds under Master Securities Lending Agreements (“MSLA”) which permit the Funds, under certain circumstances including an event of default (such as bankruptcy or insolvency), to offset amounts payable by the Fund to the same counterparty against amounts to be received and create one single net payment due to or from the Fund.
At April 30, 2016, the securities loaned which are subject to a MSLA on a net payment basis are as follows:
| Fund |
Value of | Cash Collateral Received(1) | Net Amount(2) | |||||||
International Fund | $ | 19,220,667 | $ | 19,220,667 | $— | |||||
Real Asset Fund | 4,442,047 | 4,442,047 | — | |||||||
Strategic Allocation Moderate Fund | 128,509 | 128,509 | — | |||||||
(1)Collateral with a value of $19,957,162, $4,556,664 and $133,275, respectively, has been received in connection with securities lending transactions. | ||||||||||
(2)Net amount represents the net amount receivable due from the counterparty in the event of default. | ||||||||||
TBA Commitments – “TBA” (to be announced) commitments are commitments to purchase or sell mortgage-backed securities for a fixed price at a future date, typically not exceeding 45 days. TBAs may be considered securities in themselves and involve a risk of loss if the value of the TBA changes relative to our “basis” in the position prior to the settlement date. Unsettled TBAs are valued according to the procedures described in the section entitled “Investment Valuation.”
3. DERIVATIVE FINANCIAL INSTRUMENTS
Disclosures about derivative instruments and hedging activities are intended to improve financial reporting for derivative instruments by requiring enhanced disclosures that enables investors to understand how and why an entity uses derivatives, how derivatives are accounted for, and how derivative instruments affect and entity’s results of operations and financial position. Risk of loss on derivatives, including written options, forward currency contracts, futures and swaps, may exceed amounts recognized on the statements of assets and liabilities.
Options – Certain Funds may either purchase or write options in order to hedge against adverse market movements or fluctuations in value caused by changes in prevailing interest rates, value of equities or foreign exchange rates, with respect to securities which the Fund currently owns or intends to purchase. A Fund’s principal reason for writing options is to realize, through receipt of premiums, a greater current return than would be realized on the underlying security alone. When a Fund purchases an option, it pays a premium and an amount equal to that premium is recorded as an asset. When a Fund writes an option, it receives a premium and an amount equal to that premium is recorded as a liability. The asset or liability is adjusted daily to reflect the current market value of the option. If an option expires unexercised, a Fund
ANNUAL REPORT / April 30, 2016
| 100 | NOTES TO FINANCIAL STATEMENTS (continued) |
realizes a gain or loss to the extent of the premium received or paid. If an option is exercised, the premium received or paid is recorded as an adjustment to the proceeds from the sale or the cost of the purchase in determining whether a Fund has realized a gain or loss. The difference between the premium and the amount received or paid on effecting a closing purchase or sale transaction is also treated as a realized gain or loss. Gain or loss on purchased options is included in net realized gain or loss on investment transactions. Gain or loss on written options is presented separately as net realized gain or loss on options written. A Fund, as writer of options, may have no control over whether the underlying securities may be sold (called) or purchased (put). As a result, a Fund bears the market risk of an unfavorable change in the price of the security underlying the written option. A Fund, as purchaser of over-the-counter options, bears the risk of the potential inability of the counterparties to meet the terms of their contracts.
The Alternatives Fund had transactions in options written during the year ended April 30, 2016 as follows:
Number of |
Premiums | |||||||
Outstanding options at April 30, 2015 | 1,234 | $ | 543,340 | |||||
Option closed |
|
(1,757) |
|
|
(437,438) |
| ||
Options written |
|
7,711 |
|
|
5,749,082 |
| ||
Options expired |
|
(5,747) |
|
|
(4,630,755) |
| ||
Options exercised |
|
(1,119) |
|
|
(987,575) |
| ||
|
|
|
| |||||
Options outstanding at April 30, 2016 |
|
322 |
|
$ |
236,654 |
| ||
|
|
|
| |||||
The Real Asset Fund had transactions in options written during the year ended April 30, 2016 as follows:
Notional |
Number of |
Premiums | ||||||||||
Options outstanding at April 30, 2015 | $ | 41,816,000 | 315 | $ | 355,320 | |||||||
Options closed | (73,096,000) | (309) | (565,427) | |||||||||
Options written | 195,109,000 | 410 | 1,201,535 | |||||||||
Options expired | (34,401,000) | (83) | (194,152) | |||||||||
Options exercised | (41,888,000) | (112) | (242,325) | |||||||||
|
|
|
|
|
| |||||||
Options outstanding at April 30, 2016 | $ | 87,540,000 | 221 | $ | 554,951 | |||||||
|
|
|
|
|
| |||||||
*Reflects notional amount of Written Options. |
| |||||||||||
The Real Asset Fund used interest rate options and options on swaps to enhance returns, manage interest rate risk, inflation risk, credit risk and volatility exposures. The Real Asset Fund used foreign currency options as a short or long hedge against possible variations in foreign exchange rates or as a means to gain exposure to foreign currencies. The Alternatives Fund used equity index options in an option absolute return strategy to generate premium income in a risk-managed fashion.
Forward Foreign Currency Contracts – Certain Funds may enter into foreign currency commitments or foreign currency exchange transactions. A Fund may enter into foreign currency contract transactions to protect assets against adverse changes in foreign currency exchange rates or exchange control regulations. Purchased contracts are used to acquire exposure to foreign currencies; whereas, contracts to sell are used to hedge a Fund’s securities against currency fluctuations. Risks may arise upon entering into these transactions from the potential inability of counterparties to meet the terms of their commitments and from unanticipated movements in security prices or foreign exchange rates. The foreign currency transactions are adjusted by the daily exchange rate of the underlying currency and any gains or losses are recorded for financial statement purposes as unrealized until the settlement date. The International Fund entered into forward foreign currency contracts in connection with settling planned purchases or sales of securities. The Real Asset Fund entered into forward foreign currency contracts in connection with settling planned purchases or sales of securities, to hedge the currency exposure associated with some or all of the portfolio’s securities or as a means to express a view on the direction of a currency’s value as a part of the broader investment strategy.
Futures Contracts – The Funds may invest in financial futures contracts to hedge their existing portfolios, manage cash flows, enhance yield and to potentially reduce transaction costs. Upon entering into a futures contract with a broker, the Fund is required to deposit in a segregated account a specified amount of cash or U.S. government securities. Futures contracts are valued daily and unrealized gains or losses are recorded in a “variation margin” account. Daily, and prior to computing its NAV, the Fund receives from or pays to the broker a specified amount of cash based upon changes in the variation margin account. When a contract is closed, the Fund recognizes a realized gain or loss. Futures contracts have market risks, including the risk that the change in the value of the contract may not correlate with the changes in the value of the underlying securities. The Alternatives Fund used foreign exchange futures contracts to gain exposure to the foreign currency markets both on a long and short strategy. The Real Asset Fund used futures contracts to manage interest rate exposure, adjust duration and curve exposure and to gain exposure to foreign inter- est rates. The Real Asset Fund also used money market futures during the period in order to adjust the portfolio’s interest rate exposure on the front-end of the yield curve and to adjust the overall duration positioning of the portfolio.
April 30, 2016 / ANNUAL REPORT
| NOTES TO FINANCIAL STATEMENTS (continued) | 101 |
Swap Agreements – Certain Funds may enter into credit default, interest rate, total return and other forms of swap agreements. A swap agreement is an agreement to exchange the return generated by one instrument for the return generated by another instrument. The swap
agreements are valued daily at current market value and any change in value is included in the net unrealized appreciation or depreciation on investments. Payments received or paid by the Fund are recorded as realized gains or losses upon termination or maturity of the swap. Swap agreements outstanding at period end, if any, are listed on the Portfolio of Investments.
Centrally cleared swap agreements are agreements executed through a broker but are cleared through a central counterparty (the “CCP”) and a Fund’s counterparty on the swap becomes the CCP. The Fund is required to interface with the CCP through a broker and upon entering into a centrally cleared swap is required to deposit initial margin with the broker in the form of cash or securities in an amount that varies depending on the size and risk profile of a particular swap. Centrally cleared swaps are subject to general market risks and to liquidity risk. Pursuant to the swap agreement, the Fund agrees to pay to or receive from the counterparty an amount of cash equal to the daily fluctuation in the value of the swap (“variation margin”). Such payments are recorded by the Fund as unrealized gains or losses until the contract is closed or settled at which point the gain or loss is realized.
The Fund may utilize swap agreements in an attempt to gain exposure to the securities in a market without actually purchasing those securities, or to hedge a position.
Interest rate swaps – Interest rate swaps represent an agreement between counterparties to exchange cash flows based on the difference between two interest rates, applied to a notional principal amount for a specified period. The Fund is subject to interest rate risk exposure in the normal course of pursuing its investment objectives. The Fund may use interest rate swaps to either maintain its ability to generate steady cash flow by receiving a stream of fixed rate payments or to increase exposure to prevailing market rates by receiving floating rate payments using interest rate swap contracts. The Fund’s maximum risk of loss from counterparty credit risk is the discounted net value of the cash flows to be received from the counterparty over the contract’s remaining life. This risk may be mitigated by having a master netting arrangement between the Fund and the counterparty which may permit the Fund to offset amounts payable by the Fund to the same counterparty against amounts to be received; and by the receipt of collateral from the counterparty by the Fund, to cover the Fund’s exposure to the counterparty. However, there is no assurance that such mitigating factors are easily enforceable. The Real Asset Fund is subject to interest rate risk exposure in the normal course of pursuing its investment objectives. Because the portfolio holds fixed rate bonds, the value of these bonds may decrease if interest rates rise. To help hedge against this risk and to maintain its ability to generate income at prevailing market rates, the portfolio entered into interest rate swap agreements. Additionally, the portfolio invested in interest rate swaps as a risk-neutral substitute for physical securities, to obtain exposure in markets where no physical securities were available, and to refine the risk exposure in the portfolio (i.e. duration, inflation, credit, maturity mix, etc.).
Credit default swap agreements – Credit default swap agreements involve one party making a stream of payments (referred to as the buyer of protection) to another party (the seller of protection) in exchange for the right to receive a specified return in the event of a default or other credit event for the referenced entity, obligation or index. As a seller of protection on credit default swap agreements, a Fund will generally receive from the buyer of protection a fixed rate of income throughout the term of the swap provided that there is no credit event. As the seller, a Fund would effectively add leverage to its portfolio because, in addition to its total net assets, a Fund would be subject to investment exposure on the notional amount of the swap.
If a Fund is a seller of protection and a credit event occurs, as defined under the terms of that particular swap agreement, a Fund will either (i) pay to the buyer of protection an amount equal to the notional amount of the swap and take delivery of the referenced obligation, other deliverable obligations or underlying securities comprising the referenced index or (ii) pay a net settlement amount in the form of cash or securities equal to the notional amount of the swap less the recovery value of the referenced obligation or underlying securities comprising the referenced index. If a Fund is a buyer of protection and a credit event occurs, as defined under the terms of that particular swap agreement, a Fund will either (i) receive from the seller of protection an amount equal to the notional amount of the swap and deliver the referenced obligation, other deliverable obligations or underlying securities comprising the referenced index or (ii) receive a net settlement amount in the form of cash or securities equal to the notional amount of the swap less the recovery value of the referenced obligation or underlying securities comprising the referenced index. Recovery values are estimated by market makers considering either industry standard recovery rates or entity specific factors and considerations until a credit event occurs. If a credit event has occurred, the recovery value is determined by a facilitated auction whereby a minimum number of allowable broker bids, together with a specified valuation method, are used to calculate the settlement value.
Credit default swap agreements on corporate issues, sovereign issues of an emerging country or U.S. municipal issues involve one party making a stream of payments to another party in exchange for the right to receive a specified return in the event of a default or other credit event. If a credit event occurs and cash settlement is not elected, a variety of other deliverable obligations may be delivered in lieu of the specific referenced obligation. The ability to deliver other obligations may result in a cheapest-to deliver option (the buyer of protection’s right to choose the deliverable obligation with the lowest value following a credit event). A Fund may use credit default swaps on corporate issues, sovereign issues of an emerging country or U.S. municipal issues to provide a measure of protection against defaults of the issuers (i.e., to reduce risk where a Fund owns or has exposure to the referenced obligation) or to take an active long or short position with respect to the likelihood of a particular issuer’s default.
Credit default swap agreements on credit indices involve one party making a stream of payments to another party in exchange for the right to receive a specified return in the event of a write-down, principal shortfall, interest shortfall or default of all or part of the referenced entities comprising the credit index. A credit index is a basket of credit instruments or exposures designed to be representative of some part of
ANNUAL REPORT / April 30, 2016
| 102 | NOTES TO FINANCIAL STATEMENTS (continued) |
the credit market as a whole. These indices are made up of reference credits that are judged by a poll of dealers to be the most liquid entities in the credit default swap market based on the sector of the index. Components of the indices may include, but are not limited to, investment grade securities, high yield securities, asset-backed securities, emerging markets, and/or various credit ratings within each sector. Credit indices are traded using credit default swaps with standardized terms including a fixed spread and standard maturity dates. An index credit default swap references all the names in the index, and if there is a default, the credit event is settled based on that name’s weight in the index. The composition of the indices changes periodically, usually every six months, and for most indices, each name has an equal weight in the index. A Fund may use credit default swaps on credit indices to hedge a portfolio of credit default swaps or bonds, which is less expensive than it would be to buy many credit default swaps to achieve a similar effect. Credit default swaps on indices are benchmarks for protecting investors owning bonds against default, and traders use them to speculate on changes in credit quality. Implied credit spreads, represented in absolute terms, utilized in determining the market value of credit default swap agreements on corporate issues, sovereign issues of an emerging country or U.S. municipal issues as of period end are disclosed in the footnotes to the Portfolios of Investments and serve as an indicator of the current status of the payment/performance risk and represent the likelihood or risk of default for the credit derivative. The implied credit spread of a particular referenced entity reflects the cost of buying/ selling protection and may include upfront payments required to be made to enter into the agreement. For credit default swap agreements on credit indices, the quoted market prices and resulting values serve as the indicator of the current status of the payment/ performance risk. Wider credit spreads represent a deterioration of the referenced entity’s credit soundness and a greater likelihood or risk of default or other credit event occurring as defined under the terms of the agreement. The maximum potential amount of future payments (undiscounted) that a Fund as a seller of protection could be required to make under a credit default swap agreement would be an amount equal to the notional amount of the agreement. The Real Asset Fund uses credit default swaps on corporate and sovereign issues to take an active long position with respect to the likelihood of a particular issuer’s default. The portfolio used credit default swaps on credit indices to adjust the portfolio’s overall credit exposure.
April 30, 2016 / ANNUAL REPORT
| NOTES TO FINANCIAL STATEMENTS (continued) | 103 |
The following is a summary of the location of derivatives on the Funds’ Statements of Assets and Liabilities as of April 30, 2016.
Location on the Statement of Assets and Liabilities
| ||||
| Derivative Type | Asset Derivatives | Liability Derivatives | ||
Credit Contracts |
Variation margin receivable for centrally cleared swap agreements.* |
Options written, at value. Variation margin payable for centrally cleared swap agreements.* | ||
Over the counter swap agreements, at value.** |
Over the counter swap agreements, at value.** | |||
Interest rate contracts |
Investments in securities, at value. Variation margin receivable for centrally cleared swap agreements.* |
Options written, at value. Variation margin payable for centrally cleared swap agreements.* | ||
Variation margin receivable for financial futures contracts.* |
Variation margin payable for financial futures contracts.* | |||
Over the counter swap agreements, at value.** |
Over the counter swap agreements, at value.** | |||
Currency contracts |
Unrealized depreciation on forward foreign currency exchange contracts.** | |||
Variation margin receivable for financial futures contracts.* | ||||
Unrealized appreciation on forward foreign currency exchange contracts.** |
Options written, at value. Variation margin payable for financial futures contracts.* | |||
Equity contracts |
Investments in securities, at value. |
Options written, at value. | ||
*The variation margin shown on the Statements of Assets and Liabilities is the daily change in the unrealized appreciation (depreciation) for centrally cleared swap and financial futures contracts. The variation margin presented below is the cumulative change in unrealized appreciation (depreciation) from the date the contract was opened until April 30, 2016.
**The amounts shown represent the unrealized appreciation (depreciation) from the date the contract was open.
Asset Derivative Fair Value
| ||||||||||||||||||||
| Fund | Total Value | Equity Contracts | Currency Contracts | Interest Rate Contracts | Credit Contracts | |||||||||||||||
International Fund | ||||||||||||||||||||
Forward Foreign Currency Contracts | $ | 43,856 | $ | — | $ | 43,856 | $ | — | $ | — | ||||||||||
|
|
|
|
|
|
|
|
|
| |||||||||||
Alternatives Fund | ||||||||||||||||||||
Financial Futures Contracts | $ | 12,256 | $ | — | $ | 12,256 | $ | — | $ | — | ||||||||||
Purchased Options | 19,721 | 19,721 | — | — | — | |||||||||||||||
|
|
|
|
|
|
|
|
|
| |||||||||||
Totals | $ | 31,977 | $ | 19,721 | $ | 12,256 | $ | — | $ | — | ||||||||||
|
|
|
|
|
|
|
|
|
| |||||||||||
Real Asset Fund | ||||||||||||||||||||
Financial Futures Contracts | $ | 123,197 | $ | — | $ | — | $ | 123,197 | $ | — | ||||||||||
Forward Foreign Currency Contracts | 852,311 | — | 852,311 | — | — | |||||||||||||||
Purchased Options | 265,287 | — | — | 265,287 | — | |||||||||||||||
Swap Contracts | 413,699 | — | — | 398,847 | 14,852 | |||||||||||||||
|
|
|
|
|
|
|
|
|
| |||||||||||
Totals | $ | 1,654,494 | $ | — | $ | 852,311 | $ | 787,331 | $ | 14,852 | ||||||||||
|
|
|
|
|
|
|
|
|
| |||||||||||
Liability Derivative Fair Value
| ||||||||||||||||||||
| Fund | Total Value | Equity Contracts | Currency Contracts | Interest Rate Contracts | Credit Contracts | |||||||||||||||
International Fund | ||||||||||||||||||||
Forward Foreign Currency Contracts | $ | 5,644 | $ | — | $ | 5,644 | $ | — | $ | — | ||||||||||
|
|
|
|
|
|
|
|
|
| |||||||||||
Alternatives Fund | ||||||||||||||||||||
Financial Futures Contracts | $ | 1,051,885 | $ | — | $ | 1,051,885 | $ | — | $ | — | ||||||||||
Forward Foreign Currency Contracts | 9 | — | 9 | — | — | |||||||||||||||
Written Options | 125,181 | 125,181 | — | — | — | |||||||||||||||
|
|
|
|
|
|
|
|
|
| |||||||||||
Totals | $ | 1,177,075 | $ | 125,181 | $ | 1,051,894 | $ | — | $ | — | ||||||||||
|
|
|
|
|
|
|
|
|
| |||||||||||
Real Asset Fund | ||||||||||||||||||||
Financial Futures Contracts | $ | 1,849 | $ | — | $ | — | $ | 1,849 | $ | — | ||||||||||
Forward Foreign Currency Contracts | 2,166,098 | — | 2,166,098 | — | — | |||||||||||||||
Written Options | 384,359 | — | 4,736 | 371,441 | 8,182 | |||||||||||||||
Swap Contracts | 1,434,847 | — | — | 1,411,327 | 23,520 | |||||||||||||||
|
|
|
|
|
|
|
|
|
| |||||||||||
Totals | $ | 3,987,153 | $ | — | $ | 2,170,834 | $ | 1,784,617 | $ | 31,702 | ||||||||||
|
|
|
|
|
|
|
|
|
| |||||||||||
ANNUAL REPORT / April 30, 2016
| 104 | NOTES TO FINANCIAL STATEMENTS (continued) |
The effect of derivative instruments on the Statements of Operations for the year ended April 30, 2016 are as follows:
| Derivative Type |
Location on the Statement of Operations | |
Equity contracts |
Net realized gain (loss) on futures contracts, options purchased and options written. | |
| Net change in unrealized appreciation (depreciation) futures contracts, options purchased and options written. | ||
Credit contracts |
Net realized gain (loss) on swap agreements and options written. | |
| Net change in unrealized appreciation (depreciation) on swap agreements and options written. | ||
Interest rate contracts |
Net realized gain (loss) on futures contracts, swap agreements, options purchased and options written. | |
| Net change in unrealized appreciation (depreciation) on futures contracts, swap agreements options purchased and options written. | ||
Foreign exchange contracts |
Net realized gain (loss) on foreign currency transactions, futures contracts and options written. | |
| Net change in unrealized appreciation (depreciation) on foreign currency transactions, futures contracts and options written. |
Total Realized Gain (Loss) on Derivatives Recognized in Results
| ||||||||||||||||||||
| Fund | Total | Equity Contracts | Foreign Exchange Contracts | Interest Rate Contracts | Credit Contracts | |||||||||||||||
International Fund | ||||||||||||||||||||
Forward Foreign Currency Contracts | $ | (124,514) | $ | — | $ | (124,514) | $ | — | $ | — | ||||||||||
|
|
|
|
|
|
|
|
|
| |||||||||||
Alternatives Fund | ||||||||||||||||||||
Financial Futures Contracts | $ | (1,450,280) | $ | — | $ | (1,450,280) | $ | — | $ | — | ||||||||||
Forward Foreign Currency Contracts | 78,851 | — | 78,851 | — | — | |||||||||||||||
Purchased Option | (1,645,986) | (1,645,986) | — | — | — | |||||||||||||||
Written Options | 1,318,244 | 1,318,244 | — | — | — | |||||||||||||||
|
|
|
|
|
|
|
|
|
| |||||||||||
Totals | $ | (1,699,171) | $ | (327,742) | $ | (1,371,429) | $ | — | $ | — | ||||||||||
|
|
|
|
|
|
|
|
|
| |||||||||||
Real Asset Fund | ||||||||||||||||||||
Financial Futures Contracts | $ | (1,356,689) | $ | — | $ | — | $ | (1,356,689) | $ | — | ||||||||||
Forward Foreign Currency Contracts | 3,946,883 | — | 3,946,883 | — | — | |||||||||||||||
Purchased Options | (263,986) | — | — | (263,986) | — | |||||||||||||||
Written Options | 370,230 | — | 133,069 | 211,360 | 25,801 | |||||||||||||||
Swap Contracts | (2,549,515) | — | — | (2,215,839) | (333,676) | |||||||||||||||
|
|
|
|
|
|
|
|
|
| |||||||||||
Totals | $ | 146,923 | $ | — | $ | 4,079,952 | $ | (3,625,154) | $ | (307,875) | ||||||||||
|
|
|
|
|
|
|
|
|
| |||||||||||
Change in Unrealized Appreciation (Depreciation) on Derivatives Recognized in Results from Operations
| ||||||||||||||||||||
| Fund | Total | Equity Contracts | Foreign Exchange Contracts | Interest Rate Contracts | Credit Contracts | |||||||||||||||
International Fund | ||||||||||||||||||||
Forward Foreign Currency Contracts | $ | 39,640 | $ | — | $ | 39,640 | $ | — | $ | — | ||||||||||
|
|
|
|
|
|
|
|
|
| |||||||||||
Alternatives Fund | ||||||||||||||||||||
Financial Futures Contracts | $ | 327,429 | $ | — | $ | 327,429 | $ | — | $ | — | ||||||||||
Forward Foreign Currency Contracts | (9) | — | (9) | — | — | |||||||||||||||
Purchased Options | (193,171) | (193,171) | — | — | — | |||||||||||||||
Written Options | 91,213 | 91,213 | — | — | — | |||||||||||||||
|
|
|
|
|
|
|
|
|
| |||||||||||
Totals | $ | 225,462 | $ | (101,958) | $ | 327,420 | $ | — | $ | — | ||||||||||
|
|
|
|
|
|
|
|
|
| |||||||||||
Real Asset Fund | ||||||||||||||||||||
Financial Futures Contracts | $ | 422,930 | $ | — | $ | — | $ | 422,930 | $ | — | ||||||||||
Forward Foreign Currency Contracts | 3,368,359 | — | 3,368,359 | — | — | |||||||||||||||
Purchased Options | (200,769) | — | — | (200,769) | — | |||||||||||||||
Written Options | 474,086 | — | 211,211 | 259,301 | 3,574 | |||||||||||||||
Swap Contracts | (296,338) | — | — | (382,236) | 85,898 | |||||||||||||||
|
|
|
|
|
|
|
|
|
| |||||||||||
Totals | $ | 3,768,268 | $ | — | $ | 3,579,570 | $ | 99,226 | $ | 89,472 | ||||||||||
|
|
|
|
|
|
|
|
|
| |||||||||||
April 30, 2016 / ANNUAL REPORT
| NOTES TO FINANCIAL STATEMENTS (continued) | 105 |
The average volume of derivative activities for the year ended April 30, 2016 are as follows.
Asset Derivative Volume
| ||||||||||||
| Fund | Purchased Options1 | Futures2 | Forward Currency Contracts2 | |||||||||
International Fund | $ | — | $ | — | $ | 2,290,197 | ||||||
Alternatives Fund | 164,155 | 951,076 | — | |||||||||
Real Asset Fund | 310,014 | 7,199,631 | 126,738,837 | |||||||||
Liability Derivative Volume
| ||||||||||||
| Fund | Written Options3 | Futures2 | Forward Currency | |||||||||
International Fund | $ | — | $ | — | $ | 1,211,203 | ||||||
Alternatives Fund | 417,060 | 40,024,107 | 325 | |||||||||
Real Asset Fund | 421,622 | 64,942,768 | 238,043,103 | |||||||||
| Fund | Interest Rate Swaps4 | Swap Volume Credit Default Swaps (purchase protection)4 | Credit Default Swaps (sell protection)4 | |||||||||
Real Asset Fund | $ | 484,522,000 | $ | 1,074,600 | $ | 6,418,000 | ||||||
| 1 | Cost. |
| 2 | Contract Value. |
| 3 | Premiums Received. |
| 4 | Notional Amount. |
Certain Funds are parties to International Swap and Derivatives Association, Inc. (“ISDA”) Master Agreements (“MA”) with various counterparties that govern over-the-counter derivative and foreign exchange contracts entered into from time to time. The ISDA MA may contain provisions regarding, among other things, the parties’ general obligations, representations, agreements, collateral requirements, events of default and early termination. With respect to certain counterparties, in accordance with the terms of the ISDA MA, collateral posted to the Fund is held in a segregated account by the Fund’s custodian and with respect to those amounts which can be sold or repledged, are presented in the Fund’s portfolio or Statements of Assets and Liabilities.
At April 30, 2016, derivative assets and liabilities (by type) held by the Funds are as follows:
Fund | Assets | Liabilities | ||||||
International Fund | ||||||||
Derivative Financial Instruments: | ||||||||
Forward foreign currency contracts | $ | 43,856 | $ | 5,644 | ||||
|
|
|
| |||||
Total derivative assets and liabilities in the | ||||||||
Statements of Assets and Liabilities | 43,856 | 5,644 | ||||||
Derivatives not subject to a MA or similar agreement | — | — | ||||||
|
|
|
| |||||
Total assets and liabilities subject to a MA | $ | 43,856 | $ | 5,644 | ||||
|
|
|
| |||||
Alternatives Fund | ||||||||
Derivative Financial Instruments: | ||||||||
Forward foreign currency contracts | $ | — | $ | 9 | ||||
Options | 19,721 | 125,181 | ||||||
|
|
|
| |||||
Total derivative assets and liabilities in the | ||||||||
Statements of Assets and Liabilities | 19,721 | 125,190 | ||||||
Derivatives not subject to a MA or similar agreement | — | — | ||||||
|
|
|
| |||||
Total assets and liabilities subject to a MA | $ | 19,721 | $ | 125,190 | ||||
|
|
|
| |||||
ANNUAL REPORT / April 30, 2016
| 106 | NOTES TO FINANCIAL STATEMENTS (continued) |
Fund | Assets | Liabilities | ||||||
Real Asset Fund | ||||||||
Derivative Financial Instruments: | ||||||||
Financial futures contracts | $ | 50,347 | $ | 63,419 | ||||
Forward foreign currency contracts | 852,311 | 2,166,098 | ||||||
Options | 265,287 | 384,359 | ||||||
Swaps | 330,086 | 445,411 | ||||||
|
|
|
| |||||
Total derivative assets and liabilities in the | ||||||||
Statements of Assets and Liabilities | 1,498,031 | 3,059,287 | ||||||
Derivatives not subject to a MA or similar agreement | 70,270 | 100,155 | ||||||
|
|
|
| |||||
Total assets and liabilities subject to a MA | $ | 1,427,761 | $ | 2,959,132 | ||||
|
|
|
| |||||
At April 30, 2016, derivative assets and liabilities by counterparty net of amounts available for offset under a MA and net of the related collateral received by each Fund are as follows:
| Fund/Counterparty |
Derivative a MA | Derivatives Available for Offset | Non-Cash Collateral Received(1) | Cash Collateral Received(1) | Net Amount of Derivative Assets(2) | ||||||||||||||||||||
International Fund | |||||||||||||||||||||||||
Bank of New York | $ | 6,606 | $ | (4,302) | $ | — | $ | — | | $ | 2,304 | ||||||||||||||
Citigroup Global Markets | 13,598 | (1,302) | — | — | 12,296 | ||||||||||||||||||||
Barclays Bank International | 51 | — | — | — | 51 | ||||||||||||||||||||
WestPac Bank | 60 | (40) | — | — | 20 | ||||||||||||||||||||
RBC Investor Services BA | 23,541 | — | — | — | 23,541 | ||||||||||||||||||||
|
|
|
|
|
|
|
|
|
| ||||||||||||||||
Total Derivative Assets | $ | 43,856 | $ | (5,644) | $ | — | $ | — | $ | 38,212 | |||||||||||||||
|
|
|
|
|
|
|
|
|
| ||||||||||||||||
Derivative | Derivatives Available for Offset | Non-Cash Collateral Pledged(3) | Cash Collateral Pledged(3) | Net Amount of Derivative Liabilities(4) | |||||||||||||||||||||
Bank of New York | $ | (4,302) | $ | 4,302 | $ | — | $ | — | $ | — | |||||||||||||||
Citigroup Global Markets | (1,302) | 1,302 | — | — | — | ||||||||||||||||||||
WestPac Bank | (40) | 40 | — | — | — | ||||||||||||||||||||
|
|
|
|
|
|
|
|
|
| ||||||||||||||||
Total Derivative Liabilities | $ | (5,644) | $ | 5,644 | $ | — | $ | — | $ | — | |||||||||||||||
|
|
|
|
|
|
|
|
|
| ||||||||||||||||
Derivative Assets Subject to a MA | Derivatives Available for Offset | Non-Cash Collateral Received(1) | Cash Collateral Received(1) | Net Amount of Derivative Assets(2) | |||||||||||||||||||||
Alternatives Fund | |||||||||||||||||||||||||
CIBC World Markets Corp. | $ | 2,527 | $ | (2,527) | $ | — | $ | — | $ | — | |||||||||||||||
CitiBank, N.A. | 4,488 | (4,488) | — | — | — | ||||||||||||||||||||
Deutsche Bank Securities Inc. | 132 | (132) | — | — | — | ||||||||||||||||||||
Merrill Lynch, Pierce, Fenner & Smith, Inc. | 9,442 | (9,442) | — | — | — | ||||||||||||||||||||
Wells Fargo Securities, LLC | 3,132 | (3,132) | — | — | — | ||||||||||||||||||||
|
|
|
|
|
|
|
|
|
| ||||||||||||||||
Total Derivative Assets | $ | 19,721 | $ | (19,721) | $ | — | $ | — | $ | — | |||||||||||||||
|
|
|
|
|
|
|
|
|
| ||||||||||||||||
Derivative Liabilities Subject to | Derivatives Available for Offset | Non-Cash Collateral Pledged(3) | Cash Collateral Pledged(3) | Net Amount of Derivative Liabilities(4) | |||||||||||||||||||||
Bank of New York | $ | (9) | $ | — | $ | — | $ | — | $ | (9) | |||||||||||||||
CIBC World Markets Corp. | (16,544) | 2,527 | 14,017 | — | — | ||||||||||||||||||||
CitiBank, N.A. | (20,811) | 4,488 | 16,323 | — | — | ||||||||||||||||||||
Deutsche Bank Securities Inc. | (10,960) | 132 | 10,828 | — | — | ||||||||||||||||||||
Merrill Lynch, Pierce, Fenner & Smith, Inc. | (59,885) | 9,442 | 50,443 | — | — | ||||||||||||||||||||
Wells Fargo Securities, LLC | (16,981) | 3,132 | 13,849 | — | — | ||||||||||||||||||||
|
|
|
|
|
|
|
|
|
| ||||||||||||||||
Total Derivative Liabilities | $ | (125,190) | $ | 19,721 | $ | 105,460 | $ | — | $ | (9) | |||||||||||||||
|
|
|
|
|
|
|
|
|
| ||||||||||||||||
April 30, 2016 / ANNUAL REPORT
| NOTES TO FINANCIAL STATEMENTS (continued) | 107 |
| Fund/Counterparty |
Derivative a MA | Derivatives Available for Offset | Non-Cash Collateral Received(1) | Cash Collateral Received(1) | Net Amount of Derivative Assets(2) | ||||||||||||||||||||
Real Asset Fund | |||||||||||||||||||||||||
Banc of America Securities | $ | 156,414 | $ | (156,414) | $ | — | $ | — | $ | — | |||||||||||||||
Barclays Bank International | 45,062 | (45,062) | — | — | — | ||||||||||||||||||||
Citigroup Global Markets | 84,726 | (84,726) | — | — | — | ||||||||||||||||||||
Credit Suisse | 74,444 | (74,444) | — | — | — | ||||||||||||||||||||
Deutsche Bank | 167,871 | (167,871) | — | — | — | ||||||||||||||||||||
Goldman Sachs & Co. | 211,529 | (211,529) | — | — | — | ||||||||||||||||||||
HSBC Securities, Inc. | 52,105 | (52,105) | — | — | — | ||||||||||||||||||||
JP Morgan Securities | 457,736 | (457,736) | — | — | — | ||||||||||||||||||||
Morgan Stanley | 177,354 | (177,354) | — | — | — | ||||||||||||||||||||
Royal Bank of Scotland PLC | 520 | — | — | — | 520 | ||||||||||||||||||||
|
|
|
|
|
|
|
|
|
| ||||||||||||||||
Total Derivative Assets | $ | 1,427,761 | $ | (1,427,241) | $ | — | $ | — | $ | 520 | |||||||||||||||
|
|
|
|
|
|
|
|
|
| ||||||||||||||||
Derivative | Derivatives Available for Offset | Non-Cash Collateral Pledged(3) | Cash Collateral Pledged(3) | Net Amount of Derivative Liabilities(4) | |||||||||||||||||||||
Banc of America Securities | $ | (357,725) | $ | 156,414 | $ | — | $ | — | $ | (201,311) | |||||||||||||||
Bank of New York | (34) | — | — | — | (34) | ||||||||||||||||||||
Barclays Bank International | (130,003) | 45,062 | — | — | (84,941) | ||||||||||||||||||||
Citigroup Global Markets | (183,579) | 84,726 | — | — | (98,853) | ||||||||||||||||||||
Credit Suisse | (79,845) | 74,444 | — | 5,401 | — | ||||||||||||||||||||
Deutsche Bank | (438,005) | 167,871 | — | — | (270,134) | ||||||||||||||||||||
Goldman Sachs & Co. | (464,099) | 211,529 | — | — | (252,570) | ||||||||||||||||||||
HSBC Securities, Inc. | (184,472) | 52,105 | — | — | (132,367) | ||||||||||||||||||||
JP Morgan Securities | (771,347) | 457,736 | — | — | (313,611) | ||||||||||||||||||||
Morgan Stanley | (201,870) | 177,354 | — | 24,516 | — | ||||||||||||||||||||
RBS Securities, Inc. | (142,273) | — | — | — | (142,273) | ||||||||||||||||||||
Societe General Securities | (5,880) | — | — | — | (5,880) | ||||||||||||||||||||
|
|
|
|
|
|
|
|
|
| ||||||||||||||||
Total Derivative Liabilities | $ | (2,959,132) | $ | 1,427,241 | $ | — | $ | 29,917 | $ | (1,501,974) | |||||||||||||||
|
|
|
|
|
|
|
|
|
| ||||||||||||||||
| (1) | Excess of collateral received is not shown for financial reporting purposes. |
| (2) | Net amount represents the net amount receivable in the event of default. |
| (3) | Excess of collateral pledged is not shown for financial reporting purposes. |
| (4) | Net amount represents the net amount payable due in the event of default. |
ANNUAL REPORT / April 30, 2016
| 108 | NOTES TO FINANCIAL STATEMENTS (continued) |
4. FEDERAL TAX INFORMATION
As of April 30, 2016, there are no uncertain tax positions that would require financial statement recognition, de-recognition or disclosure. The Funds’ federal tax returns filed for the periods ended 2015, 2014 and 2013, as well as the current tax year, remain subject to examination by the Internal Revenue Service.
The timing and character of income and capital gain distributions are determined in accordance with income tax regulations, which may differ from GAAP. These differences are due in part to the tax treatment of reclassifications of distributions, discount accretion/premium amortization on debt securities, capital gain or loss as a result of paydown activity, mark to market of passive foreign investment companies and losses deferred due to wash sales. GAAP requires that permanent differences in net investment income and realized gains and losses due to differences between financial reporting and tax reporting be reclassified between various components of net assets and have no effect on the net assets nor the NAV of the Funds.
For the year ended April 30, 2016, permanent differences identified and reclassified among the components of net assets were as follows:
| Fund | Paid-in Capital |
Increase (Decrease) | Accumulated Net Realized Gain (Loss) | ||||||||||||
International Fund | $ | (61,207,956) | $ | 426,142 | $ | 60,781,814 | |||||||||
Alternatives Fund | 317,388 | (65,091) | (252,297) | ||||||||||||
Real Asset Fund | 48,055 | (16,204,355) | 16,156,300 | ||||||||||||
Strategic Allocation Conservative Fund | — | 67,986 | (67,986) | ||||||||||||
Strategic Allocation Moderate Fund | — | 139,220 | (139,220) | ||||||||||||
Strategic Allocation Aggressive Fund | — | 76,941 | (76,941) | ||||||||||||
The tax character of distributions for the corresponding years as reported on the Statements of Changes in the Net Asset were as follows:
2016 | 2015 | |||||||||||||||||||
| Fund | Ordinary Income* | Long-Term Capital Gains | Ordinary Income* | Long-Term Capital Gains | ||||||||||||||||
International Fund | $ | 6,267,957 | $ | — | $ | 8,485,252 | $ | — | ||||||||||||
Alternatives Fund | 3,864,010 | — | 1,957,694 | 1,461,848 | ||||||||||||||||
Real Asset Fund | 21,633,966 | — | 7,000,154 | — | ||||||||||||||||
Strategic Allocation Conservative Fund | 551,402 | 635,759 | 537,025 | 740,300 | ||||||||||||||||
Strategic Allocation Moderate Fund | 724,184 | 93,673 | 649,387 | — | ||||||||||||||||
Strategic Allocation Aggressive Fund | 263,237 | 832,949 | 286,179 | — | ||||||||||||||||
| * | For tax purposes, short-term capital gain distributions are considered ordinary income distributions. |
As of April 30, 2016, the components of distributable earnings on a tax basis were as follows:
| Fund |
Undistributed | Undistributed Long-Term Capital Gains | Other Timing Differences | Unrealized Appreciation/ (Depreciation) | Capital Loss Carryforwards | Late Year Deferrals | ||||||||||||||||||
International Fund | $ 1,989,555 | $ — | $ — | $12,373,039 | $(264,709,445) | $(12,547,321) | ||||||||||||||||||
Alternatives Fund | 11,676 | — | (175,366) | (2,683,582) | (9,532,305) | — | ||||||||||||||||||
Real Asset Fund | — | — | (1,270,126) | 21,569,615 | (128,731,467) | (7,210,570) | ||||||||||||||||||
Strategic Allocation | ||||||||||||||||||||||||
Conservative Fund | 46,336 | 33,937 | — | 423,119 | — | — | ||||||||||||||||||
Strategic Allocation | ||||||||||||||||||||||||
Moderate Fund | 50,276 | — | — | 1,306,718 | (3,751,410) | (238,103) | ||||||||||||||||||
Strategic Allocation | ||||||||||||||||||||||||
Aggressive Fund | — | 391,055 | — | (744,090) | — | — | ||||||||||||||||||
At April 30, 2016, the following Funds had capital loss carryforwards which will reduce each Fund’s taxable income arising from future net realized gain on investments, if any, to the extent permitted by the (“Code”) and thus will reduce the amount of distributions to shareholders which would otherwise be necessary to relieve the Fund of any liability for federal income tax. Pursuant to the Code, such capital loss carryforwards will expire as follows:
| Capital Loss Available Through | Short-Term | Long-Term No Expiration |
Total Capital | |||||||||||||||||
| Loss | ||||||||||||||||||||
| Fund | 2017 | 2018 | No Expiration | Carryforwards | ||||||||||||||||
International Fund | $236,603,604 | $28,105,841 | $ — | $ — | $264,709,445 | |||||||||||||||
Alternatives Fund | — | — | 8,499,880 | 1,032,425 | 9,532,305 | |||||||||||||||
Real Asset Fund | — | 93,032,464 | 8,648,017 | 27,050,986 | 128,731,467 | |||||||||||||||
Strategic Allocation Moderate Fund | 2,904,644 | 846,766 | — | — | 3,751,410 | |||||||||||||||
April 30, 2016 / ANNUAL REPORT
| NOTES TO FINANCIAL STATEMENTS (continued) | 109 |
The Funds utilized capital loss carryforwards as follows to offset taxable capital gains realized during the year ended April 30, 2016:
| Fund |
Capital Loss | |||
International Fund | $ 574,239 | |||
Strategic Allocation Moderate Fund | 882,869 | |||
The following Funds had capital loss carryforwards expire during the year ended April 30, 2016:
| Fund |
Capital Loss | |||
International Fund | $61,207,956 | |||
Under current tax regulations, capital losses on securities transactions realized after October 31 may be deferred and treated as occurring on the first day of the following fiscal year. Under the Regulated Investment Company Modernization Act of 2010, the Funds are permitted to defer taxable ordinary income losses incurred after December 31 and treat as occurring on the first day of the following fiscal year. Post-October, Post-December and Late Year losses deferred to May 1, 2016 are as follows:
| Fund | Ordinary Post-December Losses | Short-Term Post-October/ Late Year Capital Losses | Long-Term Post-October/ Late Year Capital Losses | |||||||||
International Fund | $ — | $7,497,667 | $5,049,654 | |||||||||
Real Asset Fund | 7,210,570 | — | — | |||||||||
Strategic Allocation | ||||||||||||
Moderate Fund | — | 238,103 | — | |||||||||
5. ADVISORY FEES, SERVICING FEES, AND OTHER SERVICE PROVIDERS
Investment Advisor – Wilmington Funds Management Corporation (“WFMC” or the “Advisor”) serves as the Investment Advisor to each of the Funds. Wilmington Trust Investment Advisors, Inc. (“WTIA”) provides sub-advisory services to the Funds. WFMC and WTIA are wholly-owned subsidiaries of M&T Bank Corporation. For its services, the Funds pay WFMC an annual investment advisory fee, accrued and paid daily, based on a percentage of each Fund’s average daily net assets as described below. WFMC, not the Funds, pays WTIA for its services.
The International Fund, Alternatives Fund and Real Asset Fund, utilize a multi-manager strategy, whereby WFMC allocates all or a portion of the Funds’ assets among a number of sub-advisors. For their services, the Funds pay each sub-advisor fees, accrued daily and paid monthly, as described below. Certain sub-advisors have entered into an agreement with WFMC to waive their fees to the extent that the fee calculation determined by taking into account similarly managed assets in the accounts of clients of WFMC or its affiliates, results in a fee that is less than the fee calculation under the sub-advisory agreement.
| Fund |
Current Advisory Fee | |||
International Fund | 0.45% | |||
Alternatives Fund | 0.95% | |||
Real Asset Fund | 0.45% | |||
Strategic Allocation Conservative Fund | 0.40% | |||
Strategic Allocation Moderate Fund | 0.40% | |||
Strategic Allocation Aggressive Fund | 0.40% |
WFMC and the Funds’ shareholder service providers have contractually agreed to waive their fees and/or reimburse expenses through August 31, 2016, so that total annual fund operating expenses paid by the Funds (not including the effects of dividends or interest on short positions, acquired fund fees and expenses, taxes, or other extraordinary expenses expressed as an annualized percentage of average daily net assets), will not exceed the expense limitations set forth below. Neither WFMC nor the Funds’ distributor will recoup previously waived fees/expenses in subsequent years.
ANNUAL REPORT / April 30, 2016
| 110 | NOTES TO FINANCIAL STATEMENTS (continued) |
| Current Contractual Expense Limitations | ||||
| Fund | Class A | Class I | ||
International Fund | 1.31% | 1.18% | ||
Alternatives Fund | 2.15% | 1.90% | ||
Real Asset Fund | 1.23% | 0.98% | ||
Strategic Allocation Conservative Fund | 0.78% | 0.53% | ||
Strategic Allocation Moderate Fund | 0.74% | 0.49% | ||
Strategic Allocation Aggressive Fund | 0.87% | 0.62% | ||
| Fund | Gross Fees | Fees Waived |
Current Fee as a % of average net asset | |||||||
International Fund | ||||||||||
WFMC | $2,033,171 | $(1,381,855) | 0.45% | |||||||
Sub-advisors: | ||||||||||
Dimensional Fund Advisors LP | 224,614 | (25,088) | 0.45% on the first $50 million in assets; and | |||||||
| 0.30% on assets in excess of $50 million | ||||||||||
J O Hambro Capital Management Limited | 874,781 | — | 0.70% | |||||||
LSV Asset Management | 282,513 | — | 0.49% | |||||||
Northern Cross LLC | 638,611 | — | 0.55% on the first $1 billion in assets; and | |||||||
| 0.50% on assets in excess $1 billion | ||||||||||
Oberweis Asset Management, Inc. | 348,158 | — | 1.00% on the first $50 million; | |||||||
| 0.90% on the next $50 million; and | ||||||||||
| 0.80% on assets in excess of $100 million | ||||||||||
Parametric Portfolio Associates LLC | 8,533 | — | 0.275% on the first $50 million in assets; and | |||||||
(Developed Country Index Replication Strategy) | 0.20% on assets in excess of $50 million | |||||||||
Parametric Portfolio Associates LLC* | 318,003 | — | 0.60% on the first $100 million in assets | |||||||
(Emerging Markets Strategy) | and 0.55% on assets in excess of $100 million | |||||||||
|
|
|
| |||||||
Total(a) | 4,728,384 | (1,406,943) | ||||||||
|
|
|
| |||||||
Alternatives Fund | ||||||||||
WFMC | 1,653,940 | (316,538) | 0.95% | |||||||
Sub-advisors: | ||||||||||
Acuity Capital Management, LLC | 357,137 | — | 1.00% | |||||||
Analytic Investors, LLC (Effective 10/20/15) | 60,588 | — | 0.75% of the first $20 million of assets; and 0.70% of the next $80 million of assets; and 0.625% of assets in excess of $100 million | |||||||
Calamos Advisors, LLC (terminated 10/23/2015) | 53,921 | — | 0.95% | |||||||
Highland Capital Healthcare Advisors, LP | 236,201 | — | 1.00% | |||||||
Highland Capital Management Fund Advisors, LP | 270,298 | — | 0.90% | |||||||
Parametric Risk Advisers** | 204,385 | 0.90% of the first $20 million of assets; and 0.75% of the next $20 million of assets; and 0.60% of the next $20 million of assets; and 0.525% of the next $40 million of assets; and 0.45% of assets in excess of $100 million. | ||||||||
P\E Global LLC | 231,769 | — | 1.00% | |||||||
|
|
|
| |||||||
Total(b) | 3,068,239 | (316,538) | ||||||||
|
|
|
| |||||||
Real Asset Fund | ||||||||||
WFMC | 1,892,312 | — | 0.45% on all Assets except assets allocated to the inflation- protected and fixed-income securities (“TIPS”) strategy or the Enhanced Cash Strategy. The fee for assets allocated to the TIPS strategy: 0.52% of the first $25 million; 0.49% of the next $25 million; and 0.47% of Assets over $50 million. The fee for assets allocated to the Enhanced Cash strategy is 0.53% on the assets. | |||||||
Sub-advisors: | ||||||||||
CBRE Clarion Securities LLC | 436,008 | (2,830) | 0.65% on the first $50 million in assets; | |||||||
| 0.55% of the next $50 million in assets; and | ||||||||||
| 0.45% of assets in excess of $100 million | ||||||||||
Pacific Investment Management Company, LLC | 548,601 | — | 0.2875% | |||||||
Parametric Portfolio Associates LLC | 194,842 | (4,074) | 0.25% on the first $20 million in assets; | |||||||
| 0.20% of the next $20 million in assets; and | ||||||||||
| 0.15% of assets in excess of $40 million | ||||||||||
|
|
|
| |||||||
Total(c) | 3,071,763 | (6,904) | ||||||||
|
|
|
| |||||||
April 30, 2016 / ANNUAL REPORT
| NOTES TO FINANCIAL STATEMENTS (continued) | 111 |
| Fund | Gross Fees | Fees Waived |
Current Fee as a % of average net asset | |||||||
Strategic Allocation Conservative Fund | $ | 143,132 | $ | (159,835) | 0.40% | |||||
Strategic Allocation Moderate Fund | 197,843 | (259,285) | 0.40% | |||||||
Strategic Allocation Aggressive Fund | 120,486 | (139,691) | 0.40% | |||||||
*Fees effective December 1, 2015. Prior to December 1, 2015, Parametric Risk Advisers Fees were 0.80% on the first $100 million in asset; and 0.75% on assets in excess of $100 million.
**Fees effective October 1, 2015. Prior to October 1, 2015, Parametric Risk Advisers Fees were 0.90% per annum.
(a) The total gross advisory and sub-advisory fees during the period were 1.05% for the International Fund
(b) The total gross advisory and sub-advisory fees during the period were 1.76% for the Alternatives Fund
(c) The total gross advisory and sub-advisory fees during the period were 0.73% for the Real Asset Fund
Administrative Fees – The Bank of New York Mellon (“BNYM”) provides the Trust with fund administration services. The fees as described in the table below are a component of “Portfolio accounting and administration fees” as disclosed in the Statements of Operations. WFMC, in its role as Co-Administrator, provides the Funds with certain administrative personnel and services necessary to operate the Funds. The fees as described in the table below are accrued and paid daily and are disclosed on the Statement of Operations as “Administrative personnel and services fees.”
| Administrator | Maximum Fee |
Average Aggregate Daily Net | ||||
WFMC |
| 0.040
| %
| on the first $5 billion
| ||
|
| 0.030
| %
| on the next $2 billion
| |||
|
| 0.025
| %
| on the next $3 billion
| |||
|
| 0.018
| %
| on assets in excess of $10 billion
| |||
BNYM |
| 0.0285
| %
| on the first $500 million
| ||
|
| 0.0280
| %
| on the next $500 million
| |||
| 0.0275 | % | on assets in excess of $1 billion | ||||
BNYM and WFMC may voluntarily choose to waive any portion of their fee and can add, modify or terminate a voluntary wavier at any time at their sole discretion. For the year ended April 30, 2016, BNYM waived amounts identified in the Statement of Operations as “Waiver of portfolio accounting and administration fees” and WFMC did not waive any administrative personnel and services fees.
Distribution Services Fee – The Trust has adopted a Distribution Services Plan (the “Plan”) pursuant to Rule 12b-1 under the Act. The Plan allows the Funds to pay fees to financial intermediaries, which may be paid through ALPS Distributors, Inc. (“ALPS”), the principal distributor, at an annual rate of up to 0.25% of the average daily net assets of the Funds’ Class A shares, for the sale, distribution, administration, customer servicing and record keeping of these shares.
The Trust may reduce the maximum amount of distribution services fees it pays from time to time at its sole discretion. In addition, a financial intermediary (including ALPS, the Advisor or their affiliates), may voluntarily waive or reduce any fees to which they are entitled.
For the year ended April 30, 2016, M&T Securities, Inc. and Manufacturers and Traders Trust Company (together “M&T”), affiliates of the Advisor, received a portion of the fees paid by the Funds which are listed below:
| Fund |
Distribution | |
International Fund | $ 4,552 | |
Alternatives Fund | 84 | |
Real Asset Fund | 1,886 | |
Strategic Allocation Conservative Fund | 8,240 | |
Strategic Allocation Moderate Fund | 106,527 | |
Strategic Allocation Aggressive Fund | 6,027 |
ANNUAL REPORT / April 30, 2016
| 112 | NOTES TO FINANCIAL STATEMENTS (continued) |
Sales Charges – The Class A shares of all the Funds bear front-end sales charges.
For the year ended April 30, 2016, M&T received the amounts listed below from sales charges on the sale of Class A shares.
| Fund |
Sales Charges | |
International Fund | $ 3,529 | |
Alternatives Fund | 143 | |
Real Asset Fund | 1,790 | |
Strategic Allocation Conservative Fund | 1,439 | |
Strategic Allocation Moderate Fund | 38,838 | |
Strategic Allocation Aggressive Fund | 2,778 |
Shareholder Services Fee – Pursuant to a Shareholder Services Plan adopted by the Funds and administered by ALPS, the Funds may pay up to 0.25% of the average daily net assets of each Fund’s Class A and Class I shares to financial intermediaries (which may include ALPS, the Advisor or their affiliates) for providing shareholder services and maintaining shareholder accounts. M&T has entered into a Shareholders Services Agreement with ALPS, under which it is entitled to receive up to 0.25% of the average daily net assets of each Fund’s shares for whom M&T provides shareholder services. The Funds may reduce the maximum amount of shareholder service fees it pays from time to time at its sole discretion. In addition, a financial intermediary (including M&T) may waive or reduce any fees to which they are entitled.
For the year ended April 30, 2016, M&T received a portion of the fees paid by the following Fund which is listed below:
| Fund |
Shareholder Fee | |
International Fund | $508,935 |
Other Service Providers – Foreside Management Services, LLC (“FMS”) provides a Principal Executive Officer and Principal Financial Officer to the Trust. FMS has no role in determining the investment policies or which securities are to be sold or purchased by the Trust or its Funds.
BNYM provides custody services to the Trust.
BNY Mellon Investment Servicing (U.S.) Inc. provides fund accounting and transfer agency services to the Trust.
General – Certain Officers of the Trust are also Officers or employees of the above companies that provide services to the Funds, and during their terms of office, receive no compensation from the Funds. The Trust’s Statement of Additional Information includes additional information about the Trustees.
Other Affiliated Parties and Transactions – Affiliated holdings are securities and mutual funds which are managed by the Advisor or an affiliate of the Advisor or which are distributed by an affiliate of the Funds’ distributor. Transactions with affiliated companies during the year ended April 30, 2016 are as follows:
| Fund/Affiliated Fund Name |
Balance of | Purchases/ Additions | Sales/ Reductions | Balance of Shares Held 4/30/16 | Value at 4/30/16 | Dividend Income(a) | Realized Gain/(Loss)(b) | |||||||||||||||||||||
Strategic Allocation Conservative Fund: | ||||||||||||||||||||||||||||
Wilmington Mid-Cap Growth Fund (c) | 21,195 | 1,046 | 22,241 | — | $ | — | $ | — | $ | (1,730 | ) | |||||||||||||||||
Wilmington Large-Cap Strategy Fund | 40,999 | 87,435 | — | 128,434 | 2,171,823 | 19,497 | 86,056 | |||||||||||||||||||||
Wilmington Small-Cap Strategy Fund (c) | 17,811 | 700 | 18,511 | — | — | 460 | 163,439 | |||||||||||||||||||||
Wilmington Intermediate-Term Bond Fund | 1,315,335 | 26,173 | 292,585 | 1,048,923 | 10,510,213 | 202,023 | 33,186 | |||||||||||||||||||||
Wilmington Multi-Manager International Fund | 377,220 | 4,566 | 225,614 | 156,172 | 1,113,509 | 34,252 | 57,108 | |||||||||||||||||||||
Wilmington Broad Market Bond Fund | 604,943 | 130,695 | 36,345 | 699,293 | 6,839,087 | 136,021 | 2,511 | |||||||||||||||||||||
|
|
|
|
|
|
|
|
|
| |||||||||||||||||||
TOTAL | 250,615 | 595,296 | $ | 20,634,632 | $ | 392,253 | $ | 340,570 | ||||||||||||||||||||
|
|
|
|
|
|
|
|
|
| |||||||||||||||||||
April 30, 2016 / ANNUAL REPORT
| NOTES TO FINANCIAL STATEMENTS (continued) | 113 |
| Fund/Affiliated Fund Name |
Balance of | Purchases/ Additions | Sales/ Reductions | Balance of Shares Held 4/30/16 | Value at 4/30/16 | Dividend Income(a) | Realized Gain/(Loss)(b) | |||||||||||||||||||||
Strategic Allocation Moderate Fund: | ||||||||||||||||||||||||||||
Wilmington Large Cap Strategy Fund | — | 339,229 | 6,742 | 332,487 | $ | 5,622,354 | $ | 69,197 | $ | 350,743 | ||||||||||||||||||
Wilmington Mid-Cap Growth Fund (c) | 104,716 | 4,980 | 109,696 | — | — | — | 271,534 | |||||||||||||||||||||
Wilmington Multi-Manager International Fund | 752,693 | 64,935 | 36,473 | 781,155 | $ | 5,569,632 | $ | 70,476 | $ | 52,157 | ||||||||||||||||||
Wilmington Small-Cap Strategy Fund (c) | 26,897 | — | 26,897 | — | — | 694 | 52,725 | |||||||||||||||||||||
|
|
|
|
|
|
|
|
|
| |||||||||||||||||||
TOTAL | 409,144 | 179,808 | $ | 11,191,986 | $ | 140,367 | $ | 727,159 | ||||||||||||||||||||
|
|
|
|
|
|
|
|
|
| |||||||||||||||||||
Strategic Allocation Aggressive Fund: | ||||||||||||||||||||||||||||
Wilmington Mid-Cap Growth Fund (c) | 86,738 | 4,278 | 91,016 | — | $ | — | $ | — | $ | (7,196 | ) | |||||||||||||||||
Wilmington Large-Cap Strategy Fund | 10,541 | 323,489 | 13,404 | 320,626 | 5,421,782 | 66,726 | 393,999 | |||||||||||||||||||||
Wilmington Small-Cap Strategy Fund (c) | 40,727 | 1,291 | 42,018 | — | — | 847 | 365,633 | |||||||||||||||||||||
Wilmington Multi-Manager International Fund | 1,093,649 | 13,793 | 113,563 | 993,879 | 7,086,355 | 102,985 | 150,462 | |||||||||||||||||||||
|
|
|
|
|
|
|
|
|
| |||||||||||||||||||
TOTAL | 342,851 | 260,001 | $ | 12,508,137 | $ | 170,558 | $ | 902,898 | ||||||||||||||||||||
|
|
|
|
|
|
|
|
|
| |||||||||||||||||||
| (a) | Dividend Income may include distributions from net investment income and return of capital paid by the affiliated fund to the Fund. |
| (b) | Realized Gain/(Loss) includes realized capital gain distributions paid by the affiliated fund and gain/(loss) on sales of the affiliated fund. |
| (c) | The liquidation date was August 3, 2015. |
6. INVESTMENT TRANSACTIONS
Purchases and sales of investments, excluding short-term obligations, U.S. Government Securities for the year ended April 30, 2016 were as follows:
Investments | ||||||||
| Fund | Purchases | Sales | ||||||
International Fund | $ | 309,233,256 | $ | 392,324,272 | ||||
Alternatives Fund | 529,325,245 | 528,055,525 | ||||||
Real Asset Fund | 391,584,841 | 455,045,005 | ||||||
Strategic Allocation Conservative Fund | 11,297,434 | 11,588,158 | ||||||
Strategic Allocation Moderate Fund | 24,044,820 | 28,219,104 | ||||||
Strategic Allocation Aggressive Fund | 14,938,830 | 17,018,874 | ||||||
Purchases and sales of investments of U.S. Government Securities for the year ended April 30, 2016 were as follows:
U.S. Government Securities | ||||||||
| Fund | Purchases | Sales | ||||||
Real Asset Fund | $ | 1,703,203,372 | $ | 1,623,976,385 | ||||
Strategic Allocation Moderate Fund | 893,122 | 166,025 | ||||||
ANNUAL REPORT / April 30, 2016
| 114 | NOTES TO FINANCIAL STATEMENTS (continued) |
7. LINE OF CREDIT
Effective March 9, 2016, the Trust is participating in a $10,000,000 unsecured, committed revolving line of credit (“LOC”) agreement with BNYM. The LOC is available for extraordinary or emergency purposes, primarily for financing redemption payments. Borrowings are charged interest at a rate of 1.25% per annum over the greater of the Federal Funds Rate or the overnight LIBOR Rate. The LOC includes a commitment fee of 0.15% per annum on the daily unused portion. The termination date of this LOC is March 8, 2017.
Prior to March 9, 2016, the Trust participated in a $20,000,000 LOC with BNYM. The LOC was made available for extraordinary or emergency purposes, primarily for financing redemption payments. Borrowings were charged interest at a rate of 1.25% per annum over the greater of the Federal Funds Rate or the overnight LIBOR Rate. The LOC included a commitment fee of 0.10% per annum on the daily unused portion.
The Funds did not utilize the LOC for the year ended April 30, 2016.
8. SUBSEQUENT EVENTS
Management has evaluated events and transactions for potential recognition or disclosure in the financial statements through the date the financial statements were issued. Management has determined that there are no additional material events that would require recognition or disclosure in the Funds’ financial statements through this date.
9. FEDERAL TAX INFORMATION (UNAUDITED)
Complete information regarding the tax status of distributions will be reported on Forms 1099.
Of the ordinary income (including short-term capital gain) distributions made by the Funds during the fiscal year ended April 30, 2016, the Funds designate the following percentages, or such greater percentages that constitute the maximum amount allowable pursuant to Code Sections Section 243 and 854(b)(2), as qualifying for the corporate dividends received deduction:
Fund | ||
International Fund | 0.00% | |
Alternatives Fund | 10.24% | |
Real Asset Fund | 0.60% | |
Strategic Allocation Conservative Fund | 10.03% | |
Strategic Allocation Moderate Fund | 26.41% | |
Strategic Allocation Aggressive Fund | 64.52% | |
For the fiscal year ended April 30, 2016, the Funds designate the following percentages of the ordinary income dividends, or such greater percentages that constitute the maximum amount allowable pursuant to Code Sections 1(h)(11) and 854(b)(2), as qualified dividend income which may be subject to a maximum rate of federal income tax of 15%:
Fund | ||
International Fund | 100.00% | |
Alternatives Fund | 21.59% | |
Real Asset Fund | 13.69% | |
Strategic Allocation Conservative Fund | 18.75% | |
Strategic Allocation Moderate Fund | 50.91% | |
Strategic Allocation Aggressive Fund | 100.00% | |
If the Funds meet the requirements of Section 853 of the Code, the Funds will pass through to shareholders credits of foreign taxes paid.
April 30, 2016 / ANNUAL REPORT
| 115 |
REPORT OF INDEPENDENT REGISTERED PUBLIC ACCOUNTING FIRM
TO THE SHAREHOLDERS AND BOARD OF TRUSTEES OF
WILMINGTON FUNDS
We have audited the accompanying statements of assets and liabilities, including the portfolios of investments, of the Wilmington Multi-Manager International Fund, Wilmington Multi-Manager Alternatives Fund, Wilmington Multi-Manager Real Asset Fund, Wilmington Strategic Allocation Conservative Fund, Wilmington Strategic Allocation Moderate Fund and Wilmington Strategic Allocation Aggressive Fund (six of the series constituting the Wilmington Funds) (the “Funds”) as of April 30, 2016, and the related statements of operations for the year then ended, the statements of changes in net assets for each of the two years in the period then ended, and the financial highlights for each of years or periods indicated therein. These financial statements and financial highlights are the responsibility of the Funds’ management. Our responsibility is to express an opinion on these financial statements and financial highlights based on our audits.
We conducted our audits in accordance with standards of the Public Company Accounting Oversight Board (United States). Those standards require that we plan and perform the audit to obtain reasonable assurance about whether the financial statements and financial highlights are free of material misstatement. We were not engaged to perform an audit of the Funds’ internal control over financial reporting. Our audits included consideration of internal control over financial reporting as a basis for designing audit procedures that are appropriate in the circumstances, but not for the purpose of expressing an opinion on the effectiveness of the Funds’ internal control over financial reporting. Accordingly, we express no such opinion. An audit also includes examining, on a test basis, evidence supporting the amounts and disclosures in the financial statements and financial highlights, assessing the accounting principles used and significant estimates made by management, and evaluating the overall financial statement presentation. Our procedures included confirmation of securities owned as of April 30, 2016, by correspondence with the custodian and brokers, or by other appropriate auditing procedures where replies from the brokers were not received. We believe that our audits provide a reasonable basis for our opinion.
In our opinion, the financial statements and financial highlights referred to above present fairly, in all material respects, the financial position of the Wilmington Multi-Manager International Fund, Wilmington Multi-Manager Alternatives Fund, Wilmington Multi-Manager Real Asset Fund, Wilmington Strategic Allocation Conservative Fund, Wilmington Strategic Allocation Moderate Fund and Wilmington Strategic Allocation Aggressive Fund (six of the series constituting the Wilmington Funds) at April 30, 2016, the results of their operations for the year then ended, the changes in their net assets for each of the two years in the period then ended, and their financial highlights for each of the years or periods indicated therein, in conformity with U.S. generally accepted accounting principles.
Philadelphia, Pennsylvania
June 29, 2016
ANNUAL REPORT / April 30, 2016
| 116 | BOARD OF TRUSTEES AND TRUST OFFICERS |
BOARD OF TRUSTEES AND TRUST OFFICERS
The following tables give information about each Trustee and the senior officers of the Trust. The tables separately list Trustee members who are “interested persons” of the Fund (i.e., “Interested” Trustees) and those who are not (i.e., “Independent” Trustees). The Trust is comprised of 16 funds. Unless otherwise noted, the business address of each Trustee and senior officer is 111 South Calvert Street, 26th floor, Baltimore, Maryland 21202. Each Trustee oversees all portfolios of the Trust and serves for an indefinite term. The Trust’s Statement of Additional Information includes additional information about the Trustees and is available, without charge and upon request, by calling 1-800-836-2211.
INTERESTED TRUSTEES BACKGROUND
Name Address Birth Year Position With Trust Date Service Began
| Principal Occupations and Other Directorships Held for Past Five Years
| |||
Donald E. Foley* Birth year: 1951 TRUSTEE Began serving: December 2015 | Principal Occupations: Advisory Member, Trust and Investment Committee, M&T Bank, Wilmington Trust, National Association, and Wilmington Trust Company.
Other Directorships Held: Director, AXA Equitable (variable annuity) (2013-Present); Director, 1290 Mutual Funds (retail funds) (2013-Present); Chairman and Director, Burke Rehabilitation Hospital Foundation (private hospital, research institute) (2005-Present); Director, M&T Bank Corporation (commercial bank) (2011-2012); Chairman and Director, Wilmington Trust Corporation (commercial and trust bank) (2007-2011); Chairman, Director and President’s Council, Union College (private college) (2011-2015).
| |||
Previous Positions: Director of M&T Bank Corporation and M&T Bank (2011 to 2012). Chairman and Chief Executive Officer of Wilmington Trust Corporation (2010-2011); Senior Vice President and Treasurer at ITT Corporation (1996-2010); Assistant Treasurer at International Paper (1989-1996).
| ||||
Christopher D. Randall* Birth year: 1965 TRUSTEE Began serving: September 2015 PRESIDENT Began serving: September 2014 | Principal Occupations: Chief Operations Officer and a Senior Vice President of Wilmington Trust’s Wealth and Institutional Services Division (WISD); Senior Vice President of M&T Bank.
Other Directorships Held: None.
Previous Positions: President and Chief Executive Officer of Wilmington Trust Investment Advisors, Inc. and President of Wilmington Trust Investment Management, LLC (2014-2015); Senior Vice President, Head of Asset Management and Retirement Services (2012 to 2014); President, Mid-Atlantic Division, Wilmington Trust, N.A. (2011 to 2012); President, M&T Securities, Inc. (2009 to 2011). | |||
| * | Christopher D. Randall is “interested” due to the positions he currently holds with the Funds, Wilmington Trust’s Wealth and Institutional Services Division, M&T Bank, the parent of the Fund’s Advisor, and previous positions held with WTIA and WFMC. Donald E. Foley is “interested” due to the positions he previously held with Wilmington Trust Corporation, M&T Bank Corporation and M&T Bank, the parent of the Fund’s Advisor. |
April 30, 2016 (unaudited) / ANNUAL REPORT
| BOARD OF TRUSTEES AND TRUST OFFICERS | 117 |
INDEPENDENT TRUSTEES BACKGROUND
Name Birth Year Position with Trust Date Service Began
| Principal Occupations and Other Directorships Held for Past Five Years
| |
Nicholas A. Giordano Birth year: 1943 CHAIRMAN and TRUSTEE Began serving: March 2012 | Principal Occupations: Consultant, financial services organizations (1997 to present).
Other Directorships Held: Kalmar Pooled Investment Trust; The RBB Fund Inc. (19 portfolios) (registered investment companies); Independence Blue Cross; IntriCon Corporation (body-worn medical and electronic products)
Previous Positions: Interim President, LaSalle University (1998 to 1999); President and Chief Executive Officer, Philadelphia Stock Exchange (1981 to 1997).
| |
Robert H. Arnold Birth year: 1944 TRUSTEE Began serving: March 2012 | Principal Occupations: Managing Director, R.H. Arnold & Co, Inc. (financial management consulting) (6/89 to present).
Other Directorships Held: Trustee, First Potomac Realty Trust (real estate investment trust) (5/01 to present); Director, Treasury Strategies, Inc. (private treasury consulting services) (6/01 to present).
| |
Joseph J. Castiglia Birth year: 1934 TRUSTEE Began serving: February 1988 | Principal Occupations: Consultant (not-for-profit) and Private Investor.
Other Directorships Held: Chairman, Trustee and Treasurer, Buffalo Olmsted Parks Conservancy (1/05 to 5/13); Chairman and Trustee, Buffalo Philharmonic Foundation (1/06 to 11/12); Vice Chairman and Trustee, Christ the King Seminary (1/05 to present); Director, Dunn Tire Corporation (1/05 to present); Chairman, Director and Treasurer, Read to Succeed Buffalo (1/08 to present); HCR Corporation (home care) (3/14 to present).
Previous Positions: President, Chief Executive Officer, Vice President, Treasurer and Vice Chairman, Pratt & Lambert United (manufacturer of paints, coatings and adhesives) (12/67- 1/96); Chairman and Director, Catholic Health (hospitals, nursing homes and home care) (1/97 to 5/03); Chairman and Director, Blue Cross Blue Shield of Western New York (5/92 to 5/07); Lead Director and Director, Energy East Corporation (gas and electric utility); Chairman and Director, Federal Reserve Bank of New York, Buffalo Branch; Chairman and Director, Community Foundation for Greater Buffalo; Chairman and Trustee, Canisius College; Chairman and Director, AAA of Western & Central New York.
| |
John S. Cramer Birth year: 1942 TRUSTEE Began serving: December 2000 | Principal Occupations: Senior Consultant, Yaffe & Co. (health care consulting) (2/06 to present).
Other Directorships Held: Chairman and Director, CI Supply Corp. (medical supplies and equipment) (1/14 to 1/15); Director, Check Med Corp. (medical supplies and equipment) (6/08 to 1/14); Director, Highmark Blue Shield (health insurance) (2/01 to 6/10).
Previous Positions: Consultant, Yaffe & Co. (compensation consultants) (6/02 to 6/12); President and Chief Executive Officer, Pinnacle Health Systems (nonprofit hospital and health care system in Central Pennsylvania).
| |
Daniel R. Gernatt, Jr. Birth year: 1940 TRUSTEE Began serving: February 1988 | Principal Occupations: President and CEO, Gernatt Asphalt Products, Inc. (asphalt, sand and gravel products) (1979 to present).
Other Directorships Held: Director, Roswell Park Alliance (2008 to present); Trustee, Gernatt Family Foundation.
| |
Richard B. Seidel Birth year: 1941 TRUSTEE Began serving: September 2003 | Principal Occupations: President, R.B. Seidel & Associates (legal and consulting) (1/14 to present); President, Girard Private (investment) (1/14 to present); Chairman, Girard Capital (broker-dealer) (1/10 to present).
Other Directorships Held: Director, Tristate Capital Bank (1/08 to present).
| |
ANNUAL REPORT / April 30, 2016 (unaudited)
| 118 | BOARD OF TRUSTEES AND TRUST OFFICERS |
OFFICERS
Name Address Birth Year Positions with Trust
| Principal Occupations for Past Five Years and Previous Positions
| |
Michael D. Daniels Birth year: 1967 CHIEF OPERATING OFFICER Began serving: June 2007 | Principal Occupations: Chief Operating Officer, Wilmington Funds and Wilmington Trust Investment Advisors, Inc.; Administrative Vice President, M&T Bank.
Previous Positions: Senior Vice President, MSD&T and MCA (2006 to 2007); Vice President, Calamos Asset Management (2004 to 2006); Vice President, JP Morgan Chase Bank (2002 to 2004).
| |
Jeffrey M. Seling Birth year: 1970 ASSISTANT TREASURER Began serving: June 2013 VICE PRESIDENT Began serving: June 2007
| Principal Occupations: Vice President, M&T Bank and Wilmington Trust Investment Advisors, Inc.; Assistant Treasurer, Wilmington Funds.
Previous Positions: Vice President, MSD&T; Assistant Vice President, Wells Fargo Bank; Assistant Vice President, JP Morgan Chase Bank.
| |
John C. McDonnell Birth year: 1966 VICE PRESIDENT AND ASSISTANT Began serving: June 2013 | Principal Occupations: Vice President, Wilmington Funds Management Corporation (2005 to present); Vice President, Wilmington Trust Investment Advisors, Inc. (2012 to present).
Previous Positions: Vice President, Wilmington Trust Investment Management, LLC (2005 to 2012); Audit Senior, Deloitte LLP (2004 to 2005); Assistant Vice President, 1838 Investment Advisors, LP (1999 to 2004).
| |
Mary Ellan Reilly Birth year: 1970 CHIEF COMPLIANCE OFFICER and AML COMPLIANCE OFFICER. Began serving: March 2015 | Principal Occupations: Chief Compliance Officer and Anti-Money Laundering Officer, Wilmington Funds; Administrative Vice President, M&T Bank.
Previous Positions: Administrative Vice President, M&T Bank, and Program Director, Buffalo Promise. Neighborhood (2013-2015); Vice President, M&T Bank, and Product Manager, Wilmington Trust Retirement and Institutional Services Company (2010-2013); Vice President, M&T Bank, and Risk Manager, M&T Investment Group (2006 to 2010).
| |
Eric B. Paul Birth year: 1974 VICE PRESIDENT Began serving: June 2008
| Principal Occupations: Administrative Vice President, M&T Bank (2003 to present); Director of Proprietary Products, M&T Bank (2008 to present).
| |
Ralph V. Partlow, III 25 South Charles Street, 22nd floor Baltimore, MD 21201 Birth year: 1957 VICE PRESIDENT Began serving: June 2010
| Principal Occupation: Administrative Vice President and Deputy General Counsel, M&T Bank (2003 to present).
Previous Positions: Vice President and Senior Counsel, Allfirst Bank (1995 to 2003).
| |
Christopher W. Roleke 10 High Street, Suite 302 Boston, MA 02110 Birth year: 1972 CHIEF FINANCIAL OFFICER AND TREASURER Began serving: July 2013
| Principal Occupation: Managing Director and Fund Principal Financial Officer, Foreside Management Services, LLC (2011 to present).
Previous Positions: Assistant Vice President, JP Morgan Investor Services Co. (2006 to 2011).
| |
April 30, 2016 (unaudited) / ANNUAL REPORT
| BOARD OF TRUSTEES AND TRUST OFFICERS | 119 |
Name Address Birth Year Positions with Trust
| Principal Occupations for Past Five Years and Previous Positions
| |
Lisa R. Grosswirth Atlantic Terminal Office Tower, 2 Hanson Place, 12th Floor Brooklyn, NY 11217 Birth year: 1963 SECRETARY Began serving: September 2007
| Principal Occupation: Vice President, BNY Mellon Asset Servicing (2004 to present).
Previous Positions: Supervisory Paralegal, The Dreyfus Corporation (1998 to 2004). | |
Richard J. Berthy Three Canal Plaza, Suite 100 Portland, ME 04101 Birth year: 1958 CHIEF EXECUTIVE OFFICER Began serving: September 2007 | Principal Occupation: Chief Executive Officer, Foreside Financial Group, LLC (2012 to present).
Previous Positions: President, Foreside Financial Group, LLC (2008 to 2012); Chief Administrative Officer, Foreside Financial Group, LLC (2005 to 2008); President and Secretary, Bainbridge Capital Management, LLC (2003 to 2006); Vice President, Bainbridge Capital Management (2002 to 2004).
| |
ANNUAL REPORT / April 30, 2016 (unaudited)
| 120 |
Shares of the Wilmington Funds are not FDIC insured or otherwise protected by the U.S. government, are not deposits or other obligations of, or guaranteed by, Manufacturers and Traders Trust Company, and are subject to investment risks, including possible loss of the principal amount invested.
VOTING PROXIES ON FUND PORTFOLIO SECURITIES
A description of the policies and procedures that the Funds use to determine how to vote proxies relating to securities held in the Funds’ portfolios is available, without charge and upon request, by calling 1-800-836-2211. A report on how the Funds voted any such proxies during the most recent 12-month period ended June 30 is available through Wilmington Funds’ website. Go to www.wilmingtonfunds.com select “Proxy Voting Record” to access the link. This information is also available from the Edgar database on the SEC’s website at www.sec.gov.
QUARTERLY PORTFOLIO SCHEDULE
The Funds file with the SEC a complete schedule of their portfolio holdings, as of the close of the first and third quarters of their fiscal year, on Form N-Q. These filings are available on the SEC’s website at www.sec.gov and may be reviewed and copied at the SEC’s Public Reference Room in Washington DC. (Call 1-800-SEC-0330 for information on the operation of the Public Reference Room.)
Electronic Delivery
Wilmington Funds encourages you to sign up for electronic delivery of investor materials. By doing so you will receive information faster, help lower shareholder costs, and reduce the impact to the environment. To enroll in electronic delivery:
| 1.) | Go to www.wilmingtonfunds.com and select “Individual Investors” |
| 2.) | Click on the link “Sign up for Electronic Delivery” |
| 3.) | Login to your account or create new user ID |
| 4.) | Select E-Delivery Consent from the available options, and |
| 5.) | Complete the information requested, including providing the email address where you would like to receive notification for electronic documents. |
| * | If you hold your account through a financial intermediary, please contact your advisor to request electronic delivery of investor materials. |
Householding
In an effort to reduce volume of mail you receive, only one copy of the prospectus, annual/semi-annual report, SAI and proxy statements will be sent to shareholders who are part of the same family and share the same address.
If you would like to request additional copies of the prospectus, annual/semi-annual report or SAI, or wish to opt out of householding mailings, please contact Shareholder Services at 1-800-836-2211, or write to Wilmington Funds, P.O. Box 9828, Providence, RI 02940-8025.
April 30, 2016 / SEMI-ANNUAL REPORT
| 121 |
PRIVACY POLICY AND NOTICE
OF THE FUNDS AND THEIR DISTRIBUTOR
June 8, 2012
The Wilmington Funds, their distributor and their agents (referred to as “the Funds”, “we” or “us”) recognize that consumers (referred to as “you” or “your”) expect us to protect both your assets and financial information. We respect your right to privacy and your expectation that all personal information about you or your account will be maintained in a secure manner. We are committed to maintaining the confidentiality, security and integrity of client and shareholder information. We want you to understand the Funds’ policy that governs the handling of your information, how the Funds gather information, how that information is used and how it is kept secure.
Information The Funds Collect:
The Funds collect nonpublic personal information about you from the following sources:
| • | We may receive information from you, or from your financial representative, on account applications, other forms or electronically (such as through the Funds’ website or other electronic trading mechanisms). Examples of this information include your name, address, social security number, assets and income. |
| • | We may receive information from you, or from your financial representative, through transactions with us or others, correspondence and other communications. Examples of this information include specific investments and your account balances. |
| • | We may obtain other personal information from you in connection with providing you a financial product or service. Examples of this information include depository, debit or credit account numbers. |
Information Sharing Policy
The Funds may share nonpublic personal information about you, as described above, with financial or non-financial companies or other entities, including companies that may be affiliated with the Funds and other nonaffiliated third parties, for the following purposes:
| • | We may share information when it is necessary and required to process a transaction or to service a customer relationship. For example, information may be shared with a company that provides account record keeping services or a company that provides proxy services to shareholders. |
| • | We may share information when it is required or permitted by law. For example, information may be shared in response to a subpoena or to protect you against fraud or with someone who has established a legal beneficial interest, such as a power of attorney. |
| • | We may disclose some or all of the information described above to companies that perform marketing or other services on our behalf. For example, we may share information about you with the financial intermediary (bank, investment bank or broker-dealer) through whom you purchased the Funds’ products or services, or with providers of marketing, legal, accounting or other professional services. The Funds will not, however, disclose a consumer’s account number or similar form of access number or access code for credit card, deposit or transaction accounts to any nonaffiliated third party for use in telemarketing, direct mail or other marketing purposes. |
Except as described above, the Funds do not share customer information. We will not rent, sell, trade, or otherwise release or disclose any personal information about you. Any information you provide to us is for the Funds’ use only. If you decide to close your account(s) or become an inactive customer, we will adhere to the privacy policies and practices as described in this notice.
Information Security:
When the Funds share nonpublic customer information with third parties hired to facilitate the delivery of certain products or services to our customers, such information is made available for limited purposes and under controlled circumstances designed to protect our customers’ privacy. We require third parties to comply with our standards regarding security and confidentiality of such information. We do not permit them to use that information for their own or any other purposes, or rent, sell, trade or otherwise release or disclose the information to any other party. These requirements are reflected in written agreements between the Funds and the third party service providers.
The Funds protect your personal information in several ways. We maintain physical, electronic, and procedural safeguards to guard your nonpublic personal information. In addition, the Funds’ Transfer Agent and Shareholder Servicing Agent have procedures in place for the appropriate disposal of nonpublic personal information when they are no longer required to maintain the information.
Each of the following sections explains an aspect of the Funds’ commitment to protecting your personal information and respecting your privacy.
Employee Access to Information:
Our Code of Ethics, which applies to all employees, restricts the use of customer information and requires that it be held in the strictest of confidence. Employee access to customer information is authorized for business purposes only, and the degree of access is based on the sensitivity of the information and on an employee’s or agent’s need to know the information in order to service a customer’s account or comply with legal requirements.
Visiting The Funds’ Website:
The Funds’ website gathers and maintains statistics about the number of visitors as well as what information is viewed most frequently. This information is used to improve the content and level of service we provide to our clients and shareholders.
ANNUAL REPORT / April 30, 2016
| 122 |
| • | Information or data entered into a website will be retained. |
| • | Where registration to a website or re-entering personal information on a website is required, “cookies” are used to improve your online experience. A cookie is a way for websites to recognize whether or not you have visited the site before. It is a small file that is stored on your computer that identifies you each time you re-visit our site so you don’t have to resubmit personal information. Cookies provide faster access into the website. |
| • | We may also collect non-personally identifiable Internet Protocol (“IP”) addresses for all other visitors to monitor the number of visitors to the site. These non-personally identifiable IP addresses are never shared with any third party. |
E-mail:
If you have opted to receive marketing information from the Funds by e-mail, it is our policy to include instructions in all marketing messages on how to unsubscribe from subsequent e-mail programs. Some products or services from the Funds are intended to be delivered and serviced electronically. E-mail communication may be utilized in such cases. If you participate in an employer-sponsored retirement plan administered by the Funds, we may, at your employer’s request, send you e-mail on matters pertaining to the retirement plan.
Please do not provide any account or personal information such as social security numbers, account numbers, or account balances within your e-mail correspondence to us. We cannot use e-mail to execute transaction instructions, provide personal account information, or change account registration. We can, however, use e-mail to provide you with the necessary forms or you may contact customer service toll-free at 1-800-836-2211.
Surveys/Aggregate Data:
Periodically, the Funds may conduct surveys about financial products and services or review elements of customer information in an effort to forecast future business needs. The Funds then generate reports that include aggregate data regarding its customers. Aggregate data classifies customer information in various ways but that does not identify individual customers. These reports may also include information on website traffic patterns and related information. These reports are used for the Funds’ planning, statistical and other corporate purposes. Aggregate data may also be shared with external parties, such as marketing organizations. However, no information is shared by which any individual customer could be identified.
Changes to Our Privacy Statement:
The effective date of this policy is June 8, 2012. We reserve the right to modify this policy at any time. When it is revised or materially changed, we will update the effective date. You can determine whether there have been changes since the last time you reviewed by simply checking the effective date.
Notice will be provided to you in advance of any changes that would affect your rights under this policy statement
April 30, 2016 / ANNUAL REPORT
[This Page Intentionally Left Blank]
Item 2. Code of Ethics.
| (a) | As of the end of the period covered by this report, the registrant has adopted a code of ethics (the “Section 406 Standards for Investment Companies - Ethical Standards for Principal Executive and Financial Officers”) that applies to the registrant’s Principal Executive Officer and Principal Financial Officer; the registrant’s Principal Financial Officer also serves as the Principal Accounting Officer |
| (b) | There have been no amendments to the registrant’s code of ethics that apply to its Principal Executive Officer or Principal Financial Officer. |
| (c) | There have been no amendments to the Funds’ code of ethics during the reporting period for this Form N-CSR. |
| (d) | The registrant has not granted any waivers, including an implicit waiver, from any provisions of its code of ethics during the reporting period for this Form N-CSR. |
| (e) | Not Applicable |
| (f)(3) | The registrant hereby undertakes to provide any person, without charge, upon request, a copy of the code of ethics. To request a copy of the code of ethics, contact the registrant at 1-800-836-2211, and ask for a copy of the Section 406 Standards for Investment Companies - Ethical Standards for Principal Executive and Financial Officers. |
Item 3. Audit Committee Financial Expert.
The registrant’s Board has determined that each member of the Board’s Audit Committee is an “audit committee financial expert,” and that each such member is “independent,” for purposes of this Item. The Audit Committee consists of the following Board members: Nicholas A. Giordano, Joseph J. Castiglia, and John S. Cramer.
Item 4. Principal Accountant Fees and Services.
| (a) | The Audit Fees. The aggregate fees billed for each of the last two fiscal years for professional services rendered by the principal accountant for the audit of the Registrant’s annual financial statements or services that are normally provided by the accountant in connection with statutory and regulatory filings or engagements were as follows: |
Fiscal year ended 2016 - $444,940
Fiscal year ended 2015 - $473,490
| (b) | Audit-Related Fees. The aggregate fees billed for each of the last two fiscal years for professional services rendered by the principal accountant for assurance and related services by the principal accountant that are reasonably related to the performance of the audit of the Registrant’s financial statements and are not reported above in Item 4(a) were as follows: |
Fiscal year ended 2016 - $0
Fiscal year ended 2015 - $0
Amount requiring approval of the registrant’s audit committee pursuant to paragraph (c)(7)(ii) of Rule 2-01 of Regulation S-X, $0 and $0 respectively.
| (c) | Tax Fees. The aggregate fees billed for each of the last two fiscal years for professional services rendered by the principal accountant for tax compliance, tax advice and tax planning were as follows: |
Fiscal year ended 2016 - $173,825
Fiscal year ended 2015 - $186,920
These tax services included review of federal and state income tax returns, federal excise returns, review of estimated excise distributions calculations and PFIC analyzer services.
Amount requiring approval of the registrant’s audit committee pursuant to paragraph (c)(7)(ii) of Rule 2-01 of Regulation S-X, $173,825 and $186,920 respectively.
| (d) | All Other Fees. The aggregate fees billed in each of the last two fiscal years for products and services provided by the principal accountant, other than the services reported in paragraphs (a) and (c) of this Item were as follows: |
Fiscal year ended 2016 - $0
Fiscal year ended 2015 - $0
Amount requiring approval of the registrant’s audit committee pursuant to paragraph (c)(7)(ii) of Rule 2-01 of Regulation S-X, $0 and $0 respectively.
(e)(1) Audit Committee Policies regarding Pre-approval of Services.
The Audit Committee is required to pre-approve audit and non-audit services performed by the independent auditor in order to assure that the provision of such services do not impair the auditor’s
independence. Unless a type of service to be provided by the independent auditor has received general pre-approval, it will require specific pre-approval by the Audit Committee. Any proposed services exceeding pre-approved cost levels will require specific pre- approval by the Audit Committee.
Certain services have the general pre-approval of the Audit Committee. The term of the general pre-approval is 12 months from the date of pre-approval, unless the Audit Committee specifically provides for a different period. The Audit Committee will annually review the services that may be provided by the independent auditor without obtaining specific pre-approval from the Audit Committee and may grant general pre-approval for such services. The Audit Committee will revise the list of general pre-approved services from time to time, based on subsequent determinations. The Audit Committee will not delegate its responsibilities to pre-approve services performed by the independent auditor to management.
The Audit Committee has delegated pre-approval authority to its Chairman. The Chairman will report any pre-approval decisions to the Audit Committee at its next scheduled meeting. The Committee will designate another member with such pre-approval authority when the Chairman is unavailable.
AUDIT SERVICES
The annual Audit services engagement terms and fees will be subject to the specific pre-approval of the Audit Committee. The Audit Committee must approve any changes in terms, conditions and fees resulting from changes in audit scope, registered investment company (RIC) structure or other matters.
In addition to the annual Audit services engagement specifically approved by the Audit Committee, the Audit Committee may grant general pre-approval for other Audit Services, which are those services that only the independent auditor reasonably can provide. The Audit Committee has pre-approved certain Audit services, all other Audit services must be specifically pre-approved by the Audit Committee.
AUDIT-RELATED SERVICES
Audit-related services are assurance and related services that are reasonably related to the performance of the audit or review of the Company’s financial statements or that are traditionally performed by the independent auditor. The Audit Committee believes that the provision of Audit-related services does not impair the independence of the auditor, and has pre-approved certain Audit-related services, all other Audit-related services must be specifically pre-approved by the Audit Committee.
TAX SERVICES
The Audit Committee believes that the independent auditor can provide Tax services to the Company such as tax compliance, tax planning and tax advice without impairing the auditor’s independence. However, the Audit Committee will not permit the retention of the independent auditor in connection with a transaction initially recommended by the independent auditor, the purpose of which may be tax avoidance and the tax treatment of which may not be supported in the Internal Revenue Code and related regulations. The Audit Committee has pre-approved certain Tax services, all Tax services involving large and complex transactions must be specifically pre-approved by the Audit Committee.
ALL OTHER SERVICES
With respect to the provision of services other than audit, review or attest services the pre-approval requirement is waived if:
| (1) | The aggregate amount of all such services provided constitutes no more than five percent of the total amount of revenues paid by the registrant, the registrant’s adviser (not including any sub-adviser whose role is primarily portfolio management and is subcontracted with or overseen by another investment adviser), and any entity controlling, controlled by, or under common control with the investment adviser that provides ongoing services to the registrant or to its accountant during the fiscal year in which the services are provided; |
| (2) | Such services were not recognized by the registrant, the registrant’s adviser (not including any sub-adviser whose role is primarily portfolio management and is subcontracted with or overseen by another investment adviser), and any entity controlling, controlled by, or under common control with the investment adviser that provides ongoing services to the registrant at the time of the engagement to be non-audit services; and |
| (3) | Such services are promptly brought to the attention of the Audit Committee of the issuer and approved prior to the completion of the audit by the Audit Committee or by one or more members of the Audit Committee who are members of the board of directors to whom authority to grant such approvals has been delegated by the Audit Committee. |
The Audit Committee may grant general pre-approval to those permissible non-audit services classified as All Other services that it believes are routine and recurring services, and would not impair the independence of the auditor.
The SEC’s rules and relevant guidance should be consulted to determine the precise definitions of prohibited non-audit services and the applicability of exceptions to certain of the prohibitions.
PRE-APPROVAL FEE LEVELS
Pre-approval fee levels for all services to be provided by the independent auditor will be established annually by the Audit Committee. Any proposed services exceeding these levels will require specific pre-approval by the Audit Committee.
PROCEDURES
Requests or applications to provide services that require specific approval by the Audit Committee will be submitted to the Audit Committee by both the independent auditor and the Principal Accounting Officer and/or Internal Auditor, and must include a joint statement as to whether, in their view, the request or application is consistent with the SEC’s rules on auditor independence.
(e)(2) | Percentage of services identified in items 4(b) through 4(d) that were approved by the registrants audit committee pursuant to paragraph (c)(7)(i)(C) of Rule 2-01 of Regulation S-X: |
4(b)
Fiscal year ended 2016 – 0%
Fiscal year ended 2015 – 0%
Percentage of services provided to the registrant’s investment adviser and any entity controlling, controlled by, or under common control with the investment adviser that provides ongoing services to the registrant that were approved by the registrant’s audit committee pursuant to paragraph (c)(7)(i)(C) of Rule 2-01 of Regulation S-X, 0% and 0% respectively.
4(c)
Fiscal year ended 2016 – 0%
Fiscal year ended 2015 – 0 %
Percentage of services provided to the registrant’s investment adviser and any entity controlling, controlled by, or under common control with the investment adviser that provides ongoing services to the registrant that were approved by the registrant’s audit committee pursuant to paragraph (c)(7)(i)(C) of Rule 2-01 of Regulation S-X, 0% and 0% respectively.
4(d)
Fiscal year ended 2016 – 0%
Fiscal year ended 2015 – 0%
Percentage of services provided to the registrant’s investment adviser and any entity controlling, controlled by, or under common control with the investment adviser that provides ongoing services to the registrant that were approved by the registrant’s audit committee pursuant to paragraph (c)(7)(i)(C) of Rule 2-01 of Regulation S-X, 0% and 0% respectively.
| (f) | Not Applicable |
| (g) | Non-Audit Fees billed to the registrant, the registrant’s investment adviser, and certain entities controlling, controlled by or under common control with the investment adviser that provide ongoing services to the registrant: |
Fiscal year ended 2016 – $173,825
Fiscal year ended 2015 – $841,920
| (h) | The registrant’s Audit Committee has considered that the provision of non-audit services that were rendered to the registrant’s adviser (not including any sub-adviser whose role is primarily portfolio management and is subcontracted with or overseen by another investment adviser), and any entity controlling, controlled by, or under common control with the investment adviser that provides ongoing services to the registrant that were not pre-approved pursuant to paragraph (c)(7)(ii) of Rule 2-01 of Regulation S-X is compatible with maintaining the principal accountant’s independence. |
Item 5. Audit Committee of Listed Registrants.
Not applicable.
| Item 6. | Investments. |
| (a) | Schedule of Investments in securities of unaffiliated issuers as of the close of the reporting period is included as part of the report to shareholders filed under Item 1 of this form. |
| (b) | Not applicable. |
| Item 7. | Disclosure of Proxy Voting Policies and Procedures for Closed-End Management Investment Companies. |
Not applicable.
| Item 8. | Portfolio Managers of Closed-End Management Investment Companies. |
Not applicable.
| Item 9. | Purchases of Equity Securities by Closed-End Management Investment Company and Affiliated Purchasers. |
Not applicable.
Item 10. Submission of Matters to a Vote of Security Holders.
No changes to report.
| Item 11. | Controls and Procedures. |
| (a) | The registrant’s principal executive and principal financial officers, or persons performing similar functions, have concluded that the registrant’s disclosure controls and procedures (as defined in Rule 30a-3(c) under the Investment Company Act of 1940, as amended (the “1940 Act”) (17 CFR 270.30a-3(c))) are effective, as of a date within 90 days of the filing date of the report that includes the disclosure required by this paragraph, based on their evaluation of these controls and procedures required by Rule 30a-3(b) under the 1940 Act (17 CFR 270.30a-3(b)) and Rules 13a-15(b) or 15d-15(b) under the Securities Exchange Act of 1934, as amended (17 CFR 240.13a-15(b) or 240.15d-15(b)). |
| (b) | There were no changes in the registrant’s internal control over financial reporting (as defined in Rule 30a-3(d) under the 1940 Act (17 CFR 270.30a-3(d))) that occurred during the registrant’s second fiscal quarter of the period covered by this report that has materially affected, or is reasonably likely to materially affect, the registrant’s internal control over financial reporting. |
| Item 12. | Exhibits. |
| (a)(1) | Not applicable |
| (a)(2) | Certifications pursuant to Rule 30a-2(a) under the 1940 Act and Section 302 of the Sarbanes-Oxley Act of 2002 are attached hereto. |
| (a)(3) | Not applicable. |
| (b) | Certifications pursuant to Rule 30a-2(b) under the 1940 Act and Section 906 of the Sarbanes-Oxley Act of 2002 are attached hereto. |
(12.other) Not applicable.
SIGNATURES
Pursuant to the requirements of the Securities Exchange Act of 1934 and the Investment Company Act of 1940, the registrant has duly caused this report to be signed on its behalf by the undersigned, thereunto duly authorized.
(Registrant) Wilmington Funds | ||
| By (Signature and Title)* /s/ Richard J. Berthy | ||
Richard J. Berthy | ||
(Principal Executive Officer) | ||
| Date July 6, 2016 | ||
Pursuant to the requirements of the Securities Exchange Act of 1934 and the Investment Company Act of 1940, this report has been signed below by the following persons on behalf of the registrant and in the capacities and on the dates indicated.
| By (Signature and Title)* /s/ Richard J. Berthy | ||
| Richard J. Berthy | ||
| (Principal Executive Officer) | ||
| Date July 6, 2016 | ||
By (Signature and Title)* /s/ Christopher W. Roleke | ||
Christopher W. Roleke | ||
(Principal Financial Officer) | ||
| Date July 6, 2016 | ||
| * | Print the name and title of each signing officer under his or her signature. |